Embed Size (px)
Citation preview
UNIT IV- STORAGE AND DISPLAY DEVICES
OBJECTIVES:
We shall learn
� Classification Of Recorders
� Magnetic disk and tape Recorders,
� digital plotters and printers
Introduction:
It is usually required to have a permanent record of any quantity being analyzed. In many industrial applications, it is oftenly required to monitor continuously the process variable mainly voltage, current, electrical power, temperature, pressure, now etc. So the main utility of a record electrical as well as non-electrical quantity as a function of time. Thus, a recorder is a measuring instrument which records time varying quantity, even after the quantity or variable to be measured has stopped.
In today’s life, automation is of great importance. So the instruments which are continuously recording the quantities have greatest utility in the central monitoring and control stations. These instruments provide continuous records of the changing quantities being measured. These records are then studied and analyzed to get complete knowledge of control of process as well as quantity being measured.
The electrical quantities such as voltage and current are measured directly. The non-electrical quantities are recorded using indirect methods. The non-electrical quantities are first converted to their equivalent voltages or currents, using various transducers.
Electronic recorders may be classified as:
1. Analog Recorders 2. Digital Recorders
Analog Recorders dealing with analog systems can be classified as.
1. Graphic Recorders 2. Oscillographic Recorders 3. Magnetic Tape Recorders
Digital recorders dealing with digital output can be classified as.
1. Incremental Digital Recorders 2. Synchronous Digital Recorders.
Graphic Recorders:
The graphic recorders are the devices which display and store the record of physical quantity being measured. Graphic recorders use basic elements as chart paper for displaying and storing the physical quantity and pen (which is also called as stylus) for marking the variation in physical quantity. There are three types of graphic recorders:
1. Strip Chart Recorder 2. Circular Chart Recorder 3. X-Y Recorder.
X-Y Recorder:
The galvanometer type recorder and mull type recorder records the variations of quantity to be recorder as a function of time. But in many applications, it is required to study the behavior of one variable with respect to another variable instead of recording them separately as a function of time. To achieve this, X-Y recorder is used, in which one variable is plotted with respect to variation of another variable. There are two types of X-Y recorders namely.
1. Analog X-Y Recorders.
2. Digital X-Y Recorders.
Principle of Operation:
In X-Y Recorder, one variable is plotted against another variable. In this recorder, pen is moved in either X or Y direction on a fixed graph paper. The writing assembly movement is controlled by using either servo feedback system or self balancing potentiometer. The writing assembly consists one or two pens depending on the application.
In practice, X-Y recorder plots one voltage as a function of other voltage. Many times X-Y recorder is used to record non-electrical physical quantity such as displacement, pressure, strain etc. as a function of another non-electrical physical quantity.
Construction:
The block diagram of X-Y recorder is as shown in fig.
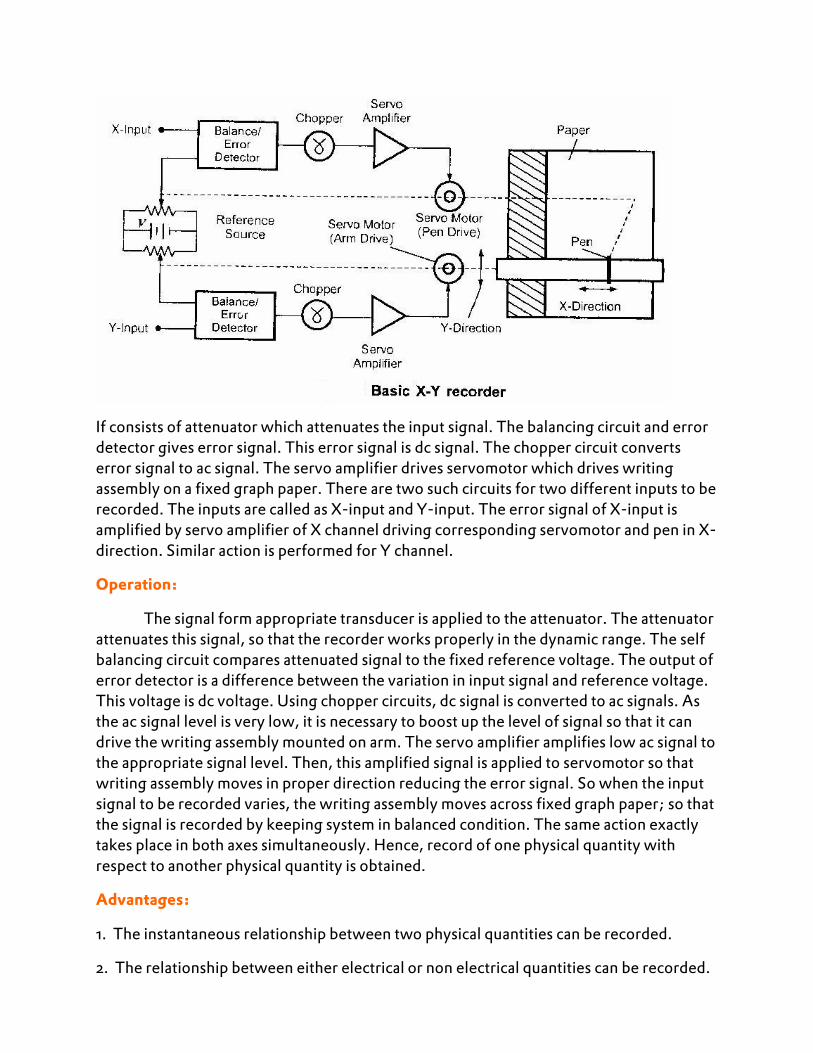
If consists of attenuator which attenuates the input signal. The balancing circuit and error detector gives error signal. This error signal is dc signal. The chopper circuit converts error signal to ac signal. The servo amplifier drives servomotor which drives writing assembly on a fixed graph paper. There are two such circuits for two different inputs to be recorded. The inputs are called as X-input and Y-input. The error signal of X-input is amplified by servo amplifier of X channel driving corresponding servomotor and pen in X-direction. Similar action is performed for Y channel.
Operation:
The signal form appropriate transducer is applied to the attenuator. The attenuator attenuates this signal, so that the recorder works properly in the dynamic range. The self balancing circuit compares attenuated signal to the fixed reference voltage. The output of error detector is a difference between the variation in input signal and reference voltage. This voltage is dc voltage. Using chopper circuits, dc signal is converted to ac signals. As the ac signal level is very low, it is necessary to boost up the level of signal so that it can drive the writing assembly mounted on arm. The servo amplifier amplifies low ac signal to the appropriate signal level. Then, this amplified signal is applied to servomotor so that writing assembly moves in proper direction reducing the error signal. So when the input signal to be recorded varies, the writing assembly moves across fixed graph paper; so that the signal is recorded by keeping system in balanced condition. The same action exactly takes place in both axes simultaneously. Hence, record of one physical quantity with respect to another physical quantity is obtained.
Advantages:
1. The instantaneous relationship between two physical quantities can be recorded.
2. The relationship between either electrical or non electrical quantities can be recorded.
3. In modern types, zero offset adjustments are available.
Applications of X-Y Recorder:
The X-Y Recorders, used in laboratories, greatly simplifies many measurements and tests. They are extensively used to measure following:
1. Speed torque characteristics of motors. 2. Regulating curves of power supply. 3. Plotting strain-stress characteristics, hysteresis curves, etc. 4. Plotting characteristics of active devices such as diodes, zener diodes, transistors,
etc. 5. Plotting electrical characteristics of various materials such as resistance versus
temperature. 6. Lift drag wind tunnel tests.
Specifications of X-Y Recorder:
1. The input signal range is 0 to 5 mV for working in dynamic range of the recorder. 2. High speed X-Y recorder is capable of recording signal upto 10Hz with maximum
amplitude of 2cm peak to peak. 3. The slewing rate is about 97cm/s and peak acceleration is 7620cm/s for high
speed recorder. 4. The Sensitivity is about 10µV/mm 5. Standard slewing rate 1.5m/s with accuracy about ± 0.3% 6. The frequency response is of about 6Hz for both the axis. 7. The standard chart size is about 250 x 180mm 8. X-Y Recorders provide continuously varying X and Y input ranges, between
0.25mV/cm and 10 V/cm. 9. In modern X-Y Recorders, zero offset adjustments are provided.
Digital X-Y Recorder:
In modern days, the analog X-Y Recorders are replaced by digital X-Y recorders. As a result of the development in digital electronics, the digital X-Y recorders are having good performance over analog X-Y recorders. The advanced techniques used in digital X-Y recorders increase the measurement capabilities of the recorder. Also the output of this recorder is far superior than that of analog X-Y recorder because of development in writing mechanisms.
In the digital X-Y recorders, the stepper motor is used in place of the servo motor which is used in analog recorder. These recorders can record number of inputs simultaneously with different colours. The communication with such devices is achieved using standard interfaces such as RS 232 or IEE 488, etc. By using proper software and hardware utilities, the recorders can draw grids and annotate charts.
Advantages:
1. Simultaneous storage of number of input signals is possible.
2. The data can be plotted using multi-pen plotting system.
3. The recorder can record or draw grids, axis.
4. The hardware and software interface provides better capabilities.
Magnetic Tape Recorder:
The recorders discussed earlier are having very poor higher frequency response. They are mostly used for low frequency operation. The magnetic tape recorders are used for high frequency signal recording. In these recorders, the data is recorded in a way that it can be reproduced in electrical form any time. Also main advantage of these recorders is that the recorded data can be replayed for almost infinite times. Because of good higher frequency response, these are used in instrumentation systems extensively.
Basic Components of Tape Recorder:
Following are the basic components of magnetic tape recorder:
1. Recording Head 2. Magnetic Tape 3. Reproducing head 4. Tape Transport Mechanism 5. Conditioning Devices.
Recording Head:
The construction of the recording head is as shown in fig.
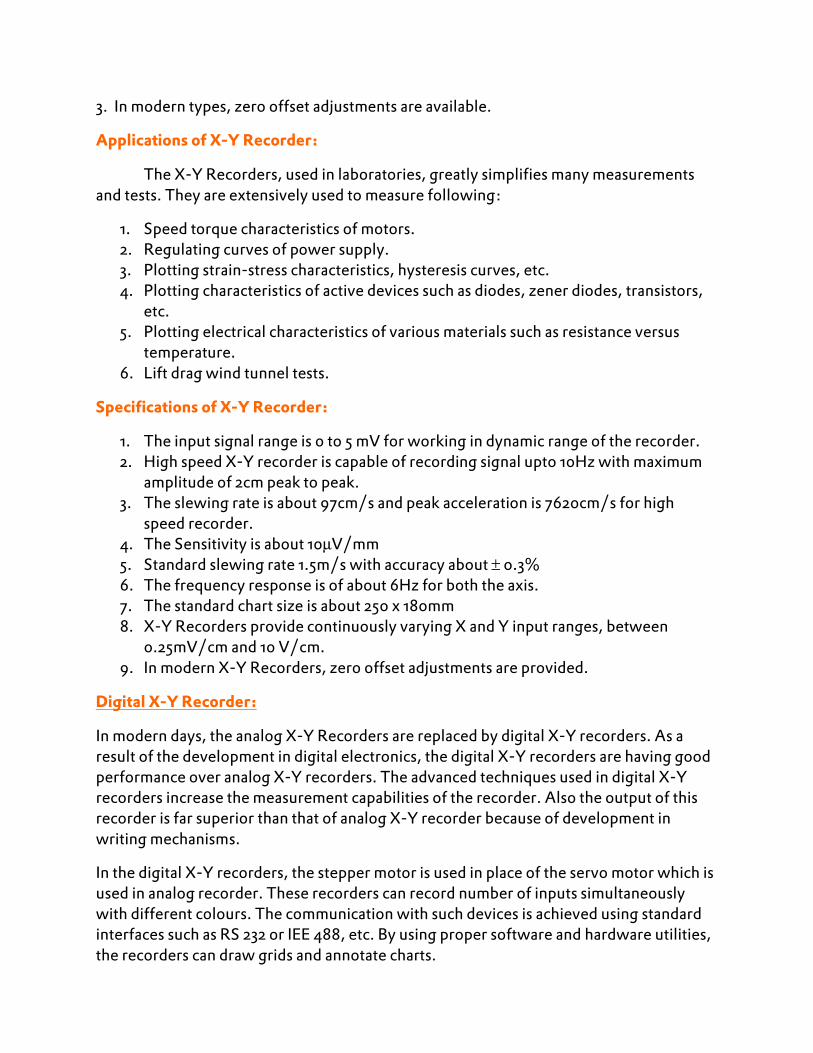
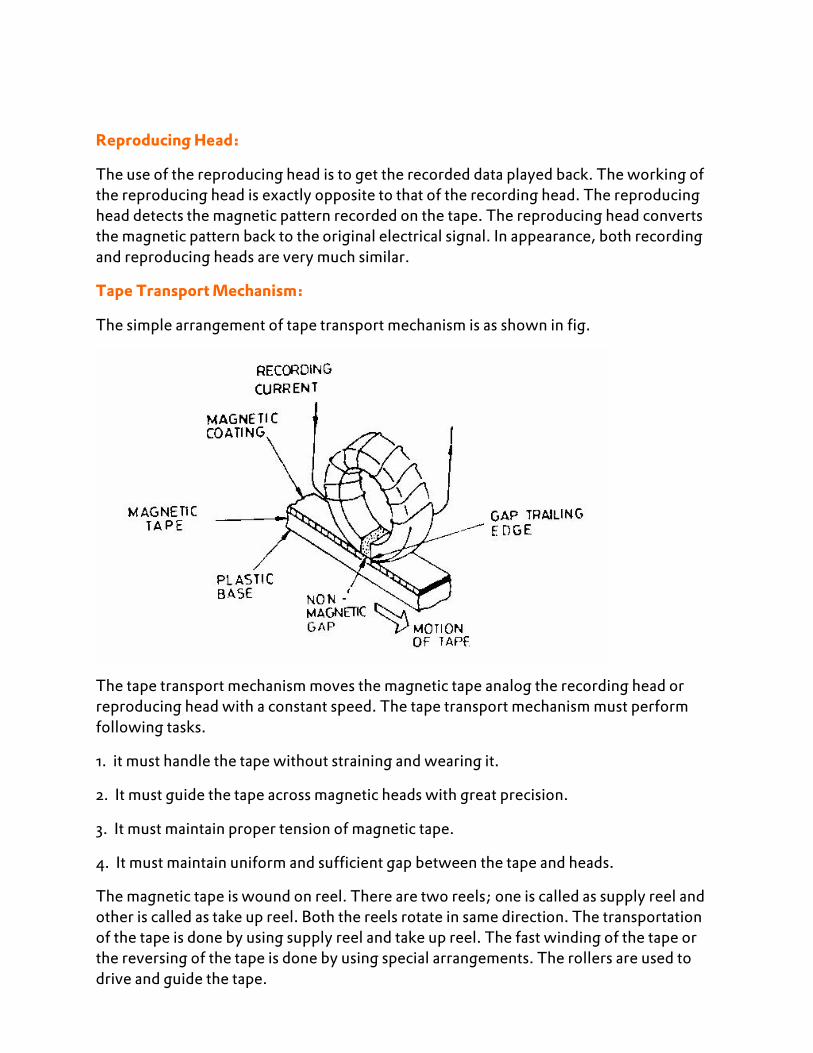
The construction of the magnetic recording head is very much similar to the construction of a transformer having a toroidal core with coil. There is a uniform fine air gap of 5µm to 15µm between the head and the magnetic tape. When the current used for recording is passed through coil wound around magnetic core, it produces magnetic flux. The magnetic tape is having iron oxide particles. When the magnetic tape is passing the head, the flux produced due to recording current gets linked with iron oxide particles on the magnetic tape and these particles get magnetized. This magnetization of particles remains as it is, even though the magnetic tape leaves the gap.
The actual recording takes place at the trailing edge of the air gap. Any signal is recorded in the form of the patterns. These magnetic patterns are dispersed anywhere along the length of magnetic tape in accordance with the variation in recording current with respect to time.
Magnetic Tape:
The magnetic tape is made up of thin sheet of tough and dimensionally stable plastic ribbon. One side of this plastic ribbon is coated by powdered iron oxide particles (Fe2O3). A typical tape is 12.7mm wide and 24.4µm thick. The magnetic tape is wound around a reel. This tape is transferred from one reel to another. As seen earlier, when the tape passes across air gap the magnetic pattern is created in accordance with variation of recording current. To reproduce this pattern, the same tape with some recorded pattern is passed across another magnetic head in which voltage is induced. This voltage induced is in accordance with the magnetic pattern.
Reproducing Head:
The use of the reproducing head is to get the recorded data played back. The working of the reproducing head is exactly opposite to that of the recording head. The reproducing head detects the magnetic pattern recorded on the tape. The reproducing head converts the magnetic pattern back to the original electrical signal. In appearance, both recording and reproducing heads are very much similar.
Tape Transport Mechanism:
The simple arrangement of tape transport mechanism is as shown in fig.
The tape transport mechanism moves the magnetic tape analog the recording head or reproducing head with a constant speed. The tape transport mechanism must perform following tasks.
1. it must handle the tape without straining and wearing it.
2. It must guide the tape across magnetic heads with great precision.
3. It must maintain proper tension of magnetic tape.
4. It must maintain uniform and sufficient gap between the tape and heads.
The magnetic tape is wound on reel. There are two reels; one is called as supply reel and other is called as take up reel. Both the reels rotate in same direction. The transportation of the tape is done by using supply reel and take up reel. The fast winding of the tape or the reversing of the tape is done by using special arrangements. The rollers are used to drive and guide the tape.
Conditioning Devices:
These devices consist of amplifiers and fitters to modify signal to be recorded. The conditioning devices allow the signals to be recorded on the magnetic tape with proper format. Amplifiers allow amplification of signal to be recorded and filters removes unwanted ripple quantities.
Principle of Tape Recorders:
The principle of the magnetic tape recording is as follows. When a magnetic tape is passed through a recording head, the signal to be recorded appears as some magnetic pattern on the tape. This magnetic pattern is in accordance with the variations of original recording current. The recorded signal can be reproduced back by passing the same tape through a reproducing head where the voltage is induced corresponding to the magnetic pattern on the tape.
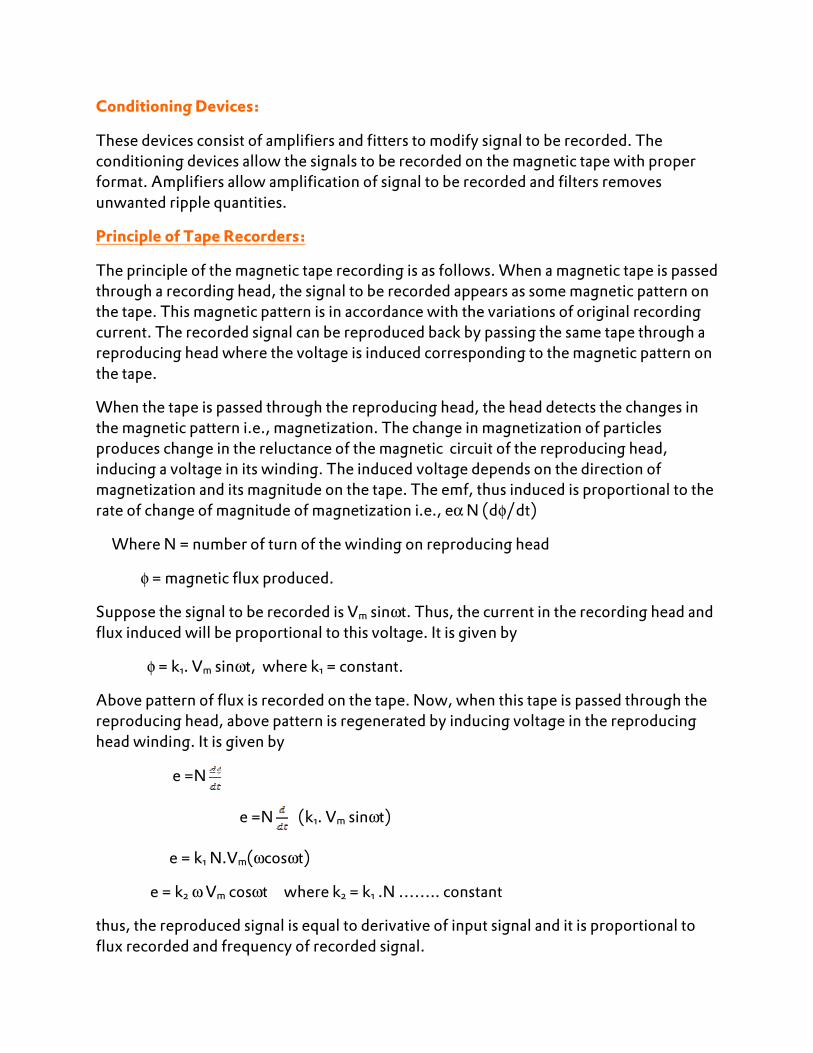
When the tape is passed through the reproducing head, the head detects the changes in the magnetic pattern i.e., magnetization. The change in magnetization of particles produces change in the reluctance of the magnetic circuit of the reproducing head, inducing a voltage in its winding. The induced voltage depends on the direction of magnetization and its magnitude on the tape. The emf, thus induced is proportional to the rate of change of magnitude of magnetization i.e., eα N (dφ/dt)
Where N = number of turn of the winding on reproducing head
φ = magnetic flux produced.
Suppose the signal to be recorded is Vm sinωt. Thus, the current in the recording head and flux induced will be proportional to this voltage. It is given by
φ = k1. Vm sinωt, where k1 = constant.
Above pattern of flux is recorded on the tape. Now, when this tape is passed through the reproducing head, above pattern is regenerated by inducing voltage in the reproducing head winding. It is given by
e =N
e =N (k1. Vm sinωt)
e = k1 N.Vm(ωcosωt)
e = k2 ω Vm cosωt where k2 = k1 .N …….. constant
thus, the reproduced signal is equal to derivative of input signal and it is proportional to flux recorded and frequency of recorded signal.
Methods of Recording:
The methods used for magnetic tape recording used for instrumentation purposes are as follows:
1. Direct Recording
2. Frequency modulation Recording
3. Pulse Duration Modulation Recording.
For instrumentation purposes mostly frequency modulation recording is used. The pulse duration modulation recording is generally used in the systems for special applications where large numbers of slowly changing variables have to be recorded simultaneously.
Direct Recording:
This method of recording is the simplest one. This method usually requires one tape track for each channel. The input signal to be recorded is simplified and mixed with high frequency bias. This signal is then fed to recording head as recording current.
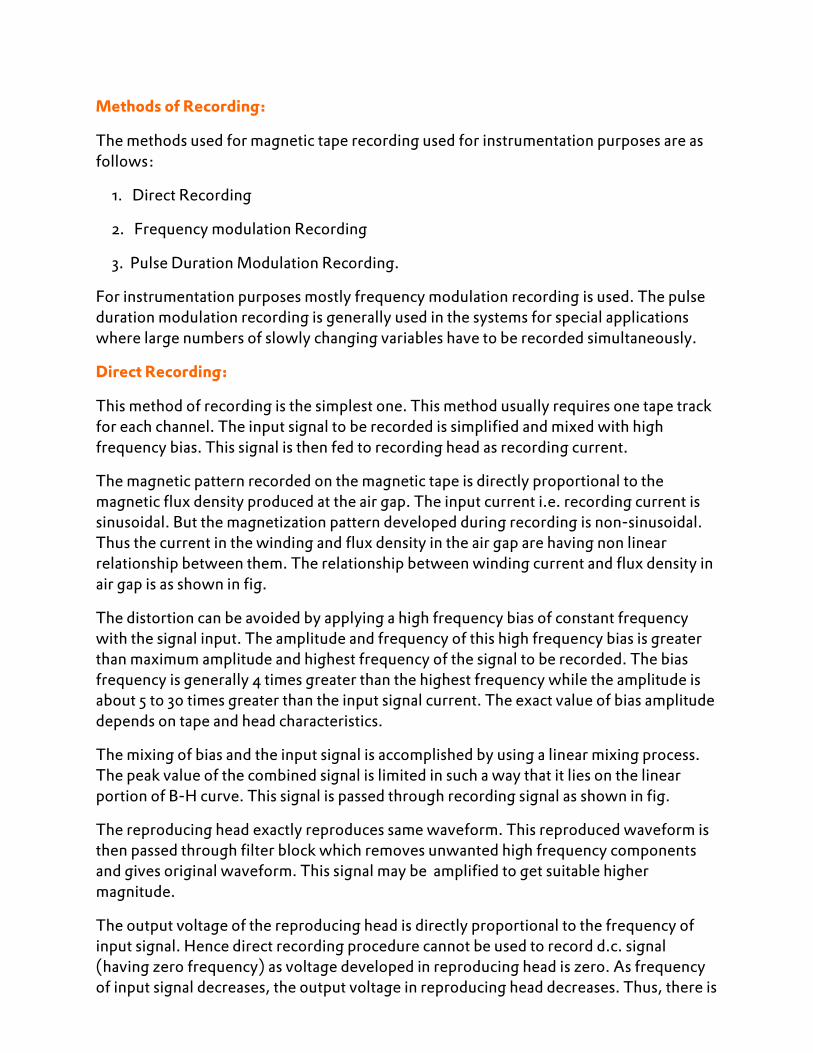
The magnetic pattern recorded on the magnetic tape is directly proportional to the magnetic flux density produced at the air gap. The input current i.e. recording current is sinusoidal. But the magnetization pattern developed during recording is non-sinusoidal. Thus the current in the winding and flux density in the air gap are having non linear relationship between them. The relationship between winding current and flux density in air gap is as shown in fig.
The distortion can be avoided by applying a high frequency bias of constant frequency with the signal input. The amplitude and frequency of this high frequency bias is greater than maximum amplitude and highest frequency of the signal to be recorded. The bias frequency is generally 4 times greater than the highest frequency while the amplitude is about 5 to 30 times greater than the input signal current. The exact value of bias amplitude depends on tape and head characteristics.
The mixing of bias and the input signal is accomplished by using a linear mixing process. The peak value of the combined signal is limited in such a way that it lies on the linear portion of B-H curve. This signal is passed through recording signal as shown in fig.
The reproducing head exactly reproduces same waveform. This reproduced waveform is then passed through filter block which removes unwanted high frequency components and gives original waveform. This signal may be amplified to get suitable higher magnitude.
The output voltage of the reproducing head is directly proportional to the frequency of input signal. Hence direct recording procedure cannot be used to record d.c. signal (having zero frequency) as voltage developed in reproducing head is zero. As frequency of input signal decreases, the output voltage in reproducing head decreases. Thus, there is
a limitation on lower operating frequency. Below certain limit of frequency, voltage in reproducing head will be equal to noise in the system. If the signal with frequency less than this frequency is used, signal will be completely overcome by the noise.
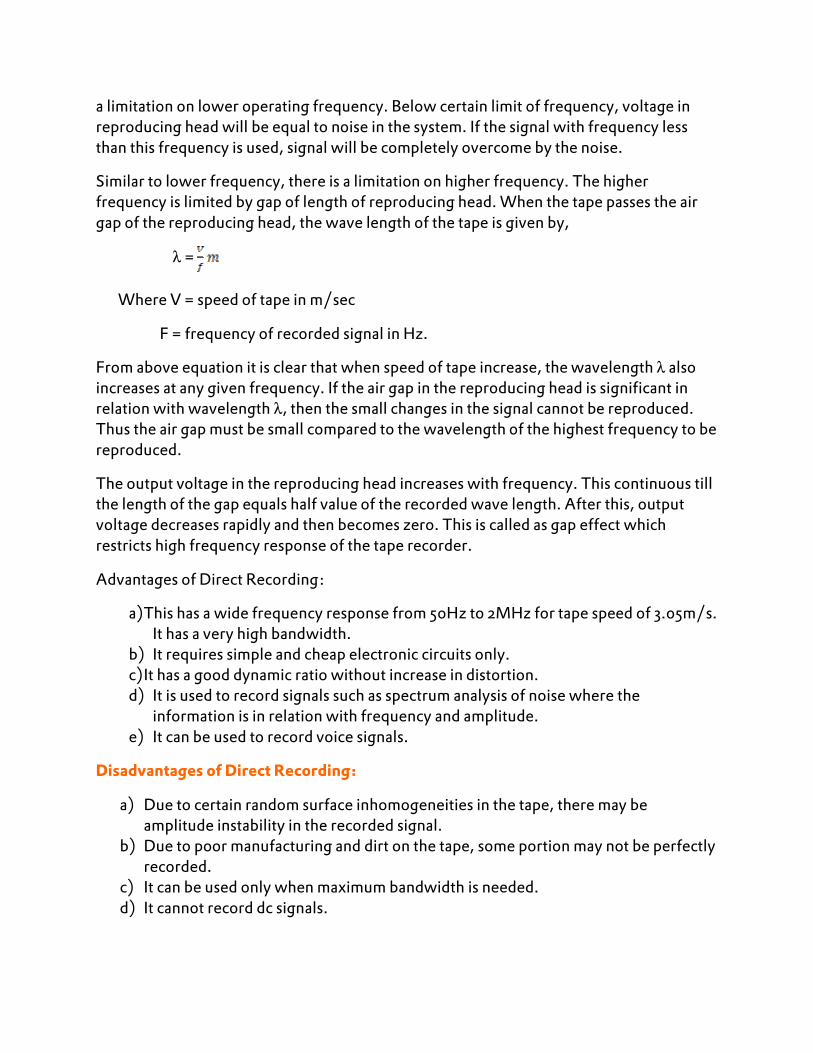
Similar to lower frequency, there is a limitation on higher frequency. The higher frequency is limited by gap of length of reproducing head. When the tape passes the air gap of the reproducing head, the wave length of the tape is given by,
λ =
Where V = speed of tape in m/sec
F = frequency of recorded signal in Hz.
From above equation it is clear that when speed of tape increase, the wavelength λ also increases at any given frequency. If the air gap in the reproducing head is significant in relation with wavelength λ, then the small changes in the signal cannot be reproduced. Thus the air gap must be small compared to the wavelength of the highest frequency to be reproduced.
The output voltage in the reproducing head increases with frequency. This continuous till the length of the gap equals half value of the recorded wave length. After this, output voltage decreases rapidly and then becomes zero. This is called as gap effect which restricts high frequency response of the tape recorder.
Advantages of Direct Recording:
a) This has a wide frequency response from 50Hz to 2MHz for tape speed of 3.05m/s. It has a very high bandwidth.
b) It requires simple and cheap electronic circuits only. c) It has a good dynamic ratio without increase in distortion. d) It is used to record signals such as spectrum analysis of noise where the
information is in relation with frequency and amplitude. e) It can be used to record voice signals.
Disadvantages of Direct Recording:
a) Due to certain random surface inhomogeneities in the tape, there may be amplitude instability in the recorded signal.
b) Due to poor manufacturing and dirt on the tape, some portion may not be perfectly recorded.
c) It can be used only when maximum bandwidth is needed. d) It cannot record dc signals.
Frequency Modulation (FM) Recording:
The major disadvantage of direct recording is that it is difficult to record dc signals. This difficulty is overcome by using frequency modulation recording in which accurate dc response is obtained.
Principle of Operation:
In the FM recording, the carrier frequency fC is modulated by the input signal. FM recording uses the variation of frequency to carry the required information instead of varying the amplitude. The modulated signal is then recorded using the recording head in normal way. The reproducing head reproduces the signal in normal way. This reproduced signal is passed through FM demodulator, low pass filter to get original signal.
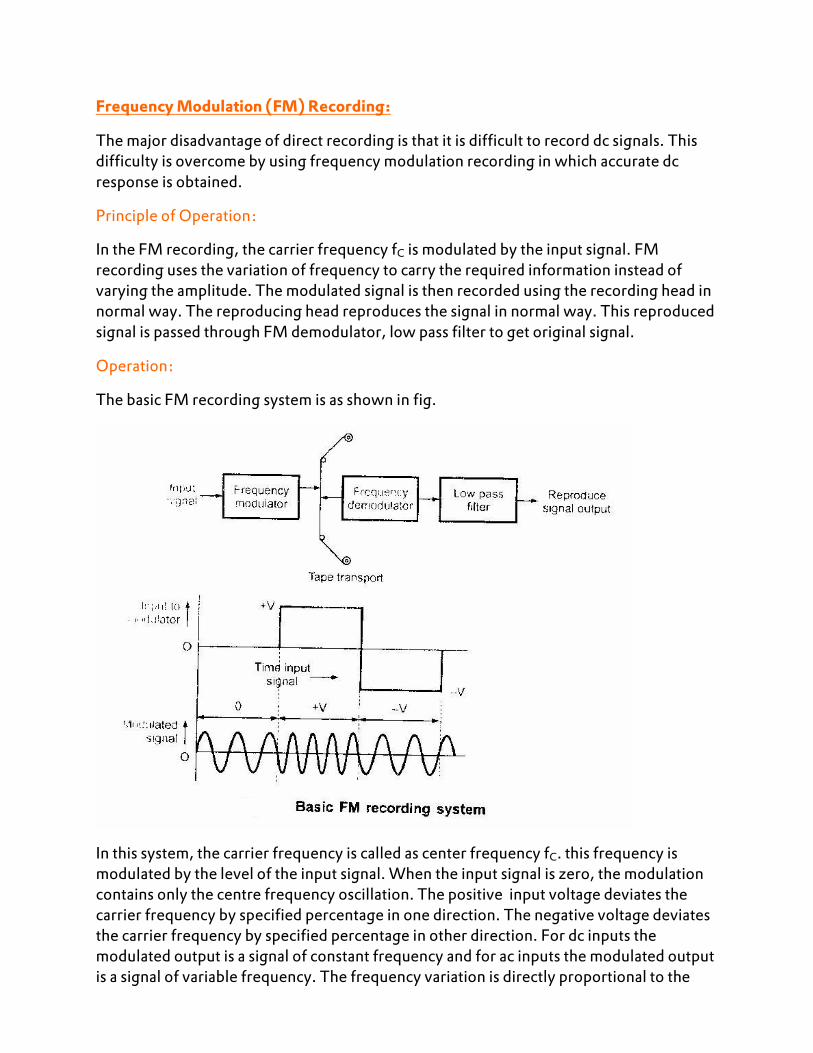
Operation:
The basic FM recording system is as shown in fig.
In this system, the carrier frequency is called as center frequency fC. this frequency is modulated by the level of the input signal. When the input signal is zero, the modulation contains only the centre frequency oscillation. The positive input voltage deviates the carrier frequency by specified percentage in one direction. The negative voltage deviates the carrier frequency by specified percentage in other direction. For dc inputs the modulated output is a signal of constant frequency and for ac inputs the modulated output is a signal of variable frequency. The frequency variation is directly proportional to the
amplitude of input signal. During the playback, the output of the reproducing head is passed through FM demodulator. The demodulated signal is passed through the filter which removes the carrier frequency fC and the unwanted signals. The FM demodulator converts the difference between center frequency and frequency on the tape, to a voltage proportional to frequency difference. Thus the FM recording enables to record signals from dc to several thousand Hz.
The central frequency is selected with respect to the tape speed. The frequency deviation selected is ± 40% about carrier frequency. When the tape speed is changed, there is proportional change in the carrier frequency. So for the dc signal the wavelength λ remains same as λ = and as speed V changes, the frequency also changes in proportion.
There are two factors related to FM recording.
(i) Percentage Deviation
(ii) Deviation Ratio.
(i) Percentage Deviation:
It is defined as ratio of carrier deviation to center frequency. It is denoted by M.
∴ Percentage deviation = M = x 100
It is also called as Modulation Index.
(ii) Deviation Ratio:
It is the ratio of carrier deviation from centre frequency to the signal frequency or modulating frequency. It is denoted by δ.
δ = where fm = modulating frequency.
Advantages of FM Recording:
I. FM recording is useful mainly to record dc components. II. FM recording has wide frequency range from 0Hz to several kHz. III. In FM recording, drop out effects due to inhomogeneities are not possible. IV. Amplitude variation is neglected in FM recording and input signal is correctly
recorded.
V. FM recording is extensively used for recording non electrical quantities such as, force pressure etc.
VI. FM recording is extensively used for multiplexing in the instrumentation and process system.
Disadvantages of FM Recording:
I. The tape speed fluctuations affect the FM recording. II. The circuitry used for FM recording is complicated as compared to that of direct
recording. III. FM systems have limited frequency response. IV. For FM recording high tape speed are required. V. Better recording requires high quality tape transport and speed control
mechanisms. VI. It is comparatively expensive.
(iii) Pulse Duration Modulation Recording (PDM):
The pulse duration modulation is also called as pulse width modulation. The principle of operation is that the amplitude and starting time of each pulse of a signal is kept constant while width of pulse is made proportional to amplitude of signal at that instant.
In this recording system, the input signal is converted to a pulse at the sampling instant. The width of each pulse is dependent on the amplitude of the signal at that instant. The sampled signal is recorded at various instants instead of recording instantaneous values continuously. On playback original signal can be obtained by passing recorded signal to appropriate filter.
Advantages of Pulse Duration Modulation Recording:
(i) PDM recording is mainly useful when large number of information from various channels is to be recorded simultaneously.
(ii) PDM recording has high accuracy.
(iii) PDM recording has high signal to noise ratio.
Disadvantages of Pulse Duration Modulation Recording:
I. It has limited frequency response. II. Because of complex circuitry, reliability of recording is low. III. Only useful to record several slowly varying signals simultantaneously.
Example: 4.1:-
In a typical FM recording system ± 30% deviation of carrier frequency corresponds to plus and minus full scale of input signal. What will be frequency of output of modulator if
carrier frequency is 50kHz. What will be frequency of output signal of modulator if d.c. signal is applied.
Solution:
Modulation index M = 30%
= 0.3
Carrier frequency fC = 50kHz.
(a) Now, modulation index M = x 100
∆f = x 50k
∆f = 15,000 Hz.
The frequency of output signal of Modulator output is fC + ∆f
F = 50,000 + 15,000
F = 65000 Hz.
(b) When d.c signal is applied, m = 0 ∴ ∆f =0
The frequency of output signal of modulator is fC = 50000Hz.
Example 4.2:-
The gap of tape recorder is 7µm. Determine speed of the tape so as to home satisfactory response at 40000Hz. Assume the wavelength of the recorded signal is 3 times greater than the gap of recorder.
Solution:-
The recorded wavelength λ = 3 x 7
= 21 µm
For satisfactory response, the speed of tape is calculated as
V = λ.f
= = 21 µm
V = 8.4 m/sec.
Digital Data Recording:
In the applications of digital data processing, digital tape recorders are used. There are basically two types of the digital tape recorders.
(i) Incremental Digital Recorders,
(ii) Synchronous Digital Recorders.
(i) Incremental Digital Recorders:
Incremental digital recorders are commanded to increment for each digital character to be recorded. Input data may be relatively slow or may be discontinuous. Each then each character is equally spaced on the tape.
(ii) synchronous Digital Recorder:
In synchronous digital recorder, the magnetic tape is moved at a constant speed using tape transport e mechanism. In these recorders, large number of data characters are recorded. These data characters are inputed at precise rate. The recording of data is in the form of a block tape in which each character is equally spaced. These characters are separated from each other by a erased area on the tape called as record gap. The synchronous unit starts the tape at a instant, recording is done on the tape and then tape is stopped at a instant.
On the magnetic tape, the characters are recorded by a coded combination of 1 bit in tracks along the tape width. For digital recording the bits are nothing but logic ‘1’ and logic ‘0’. Non zero Return (NZR) recording of IBM format is generally standard procedure.
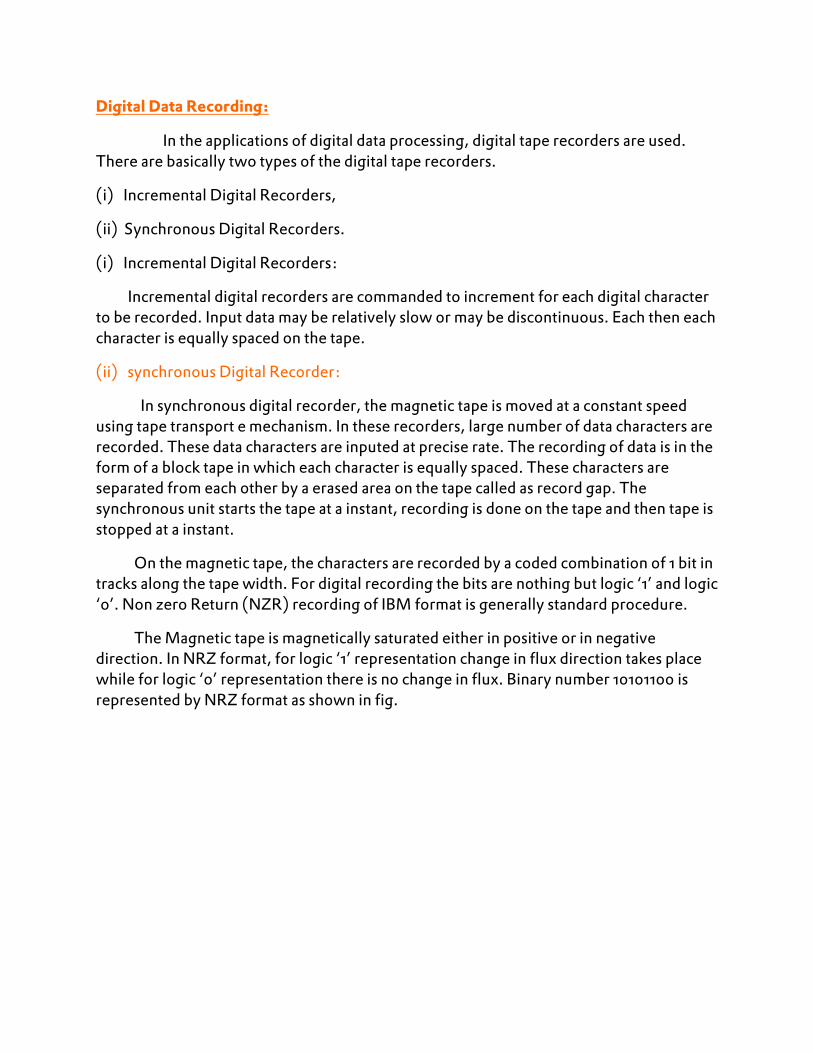
The Magnetic tape is magnetically saturated either in positive or in negative direction. In NRZ format, for logic ‘1’ representation change in flux direction takes place while for logic ‘0’ representation there is no change in flux. Binary number 10101100 is represented by NRZ format as shown in fig.
Initially, the magnetic tape is in negative saturation level. Then to record logic’1’, the level of saturation changes to positive level. Then to record logic ‘0’, there is no change in flux direction. That means if at the occurrence of logic ‘0’ if the saturation level is positive direction, it remains same, while recording logic ‘0’. If saturation level is negative then it remains same at the occurrence of logic ‘0’. The same thing is illustrated in above example.
There is another method of recording digital data known as R-Z method. The Return to zero- (RZ) method is also used in many instrumentation systems.
The RZ method uses the fact that there is a positive magnetization to express logic ‘1’. Before and after this, the saturation is once again negative. Then no change in negative saturation expresses logic ‘0’. Binary number 10100101 can be represented in RZ format as shown in fig.
Here, Since magnetization is independent of frequency of amplitude and depends only on polarity of recording current, non-linearlty and distortion problems do not exist.
Above recording of logic ‘1’ and logic ‘0’ can be achieved by using timing signal from separate clock track. Self clocking systems are also used where the level is regularly reversed when 1 or 0 are recorded.
Advantages of Digital Data Recording:
I. The process of recording digitally coded numbers is simple. It requires amplifier in recorder and another amplifier in reproducer to condition signal.
II. The digital data recorders have high accuracy. III. They are insensitive to speed or magnetic tape. IV. The simple conditioning equipments are sufficient for these recorders. V. The information can be directly fed to computers for processing and
control. VI. Non-lineraly and distortion problems do no exist in these recorders.
Disadvantages of Digital Data Recording:
I. The major problem is the drop out errors or loss of pulses and spurious pulses. The dropout errors become critical when rate of pulses increases.
II. In parallel recording, the recording head and the reproducing head should be at right angles to the tape. For this, extra circuitry is required.
III. If the tape becomes skewed the signals can not be read at the same time and hence errors will be introduced. Hence to avoid these errors, accurate alignment of tape is necessary.
IV. In digital recording, the system requires analog to digital converter (ADC) as the signal form transducers is mostly in analog form.
V. For proper digital recording, high quality of magnetic tape and tape transport mechanism is required.
Printers:
Printers can be classified according to their printing methodology: Impact printers and Non-Impact printers. Impact printers press formed character faces against an inked ribbon onto the paper. A line printer and dot matrix printer are the examples of an impact printers. Non impact printers and plotters use laser techniques, ink jet sprays, xerographic processes, electrostatic methods, and electrothermal methods to get images onto the paper. A ink-jet printer and laser printer are the examples of non-impact printers.
Line Printers:
A line printer prints a complete line at a time. The printing speed of line printer vary from 150 lines to 2500 liners per minute with 96 to 100 characters on one line. The line printers are divided into two categories: Drum printers and chain printer.
Drum Printers:
A drum printers consists of a cylindrical drum. One complete set of characters is embossed on all the print positions on a line, as shown in the fig. The character to be printed is adjusted by rotating drum.
The codes of all characters to be printed on line are transmitted from the memory of the computer to a printer memory, commonly known as printer buffer. This printer buffer can store 132 characters. A print drum is rotated with high speed and when printer buffer information matches with the drum character, character is printed by striking the hammer. Thus to print one line drum has to rotate one full rotation. A carbon ribbon and paper are in between the hammer and the drum therefore when hammer strikes the paper an impression is made on the backside of the paper by the ribbon mounted behind the paper. In drum printers to get good impression of the line on paper it is necessary to synchronize the movements of drum and the hammer.
Chain Printers:
In these printers chain with embossed character set is used, instead of drum. Here, the character to be printed is adjusted by rotating chain. To print line, computer loads the code of all characters to be printed on line into print buffer. The chain rotated and when character specified in the print buffer appears in front of hammer, hammer strikes the carbon ribbon. A carbon ribbon is placed between the chain, paper and hammer. In this printer to get good printing quality the movement of hammer and chain must be synchronized.
Dot Matrix Printers:
Dot matrix printers are also called serial printers as they print one character at a time, with printer and head moving across a line. In dot matrix printer the print head consists of a 9 x 7 array of pins. As per the character definition pin are moved forward to from a character and they hit the carbon ribbon in front of the paper thereby printing that character, as shown in fig.
In these printers character definition can be changed to get different font as shown in the fig.
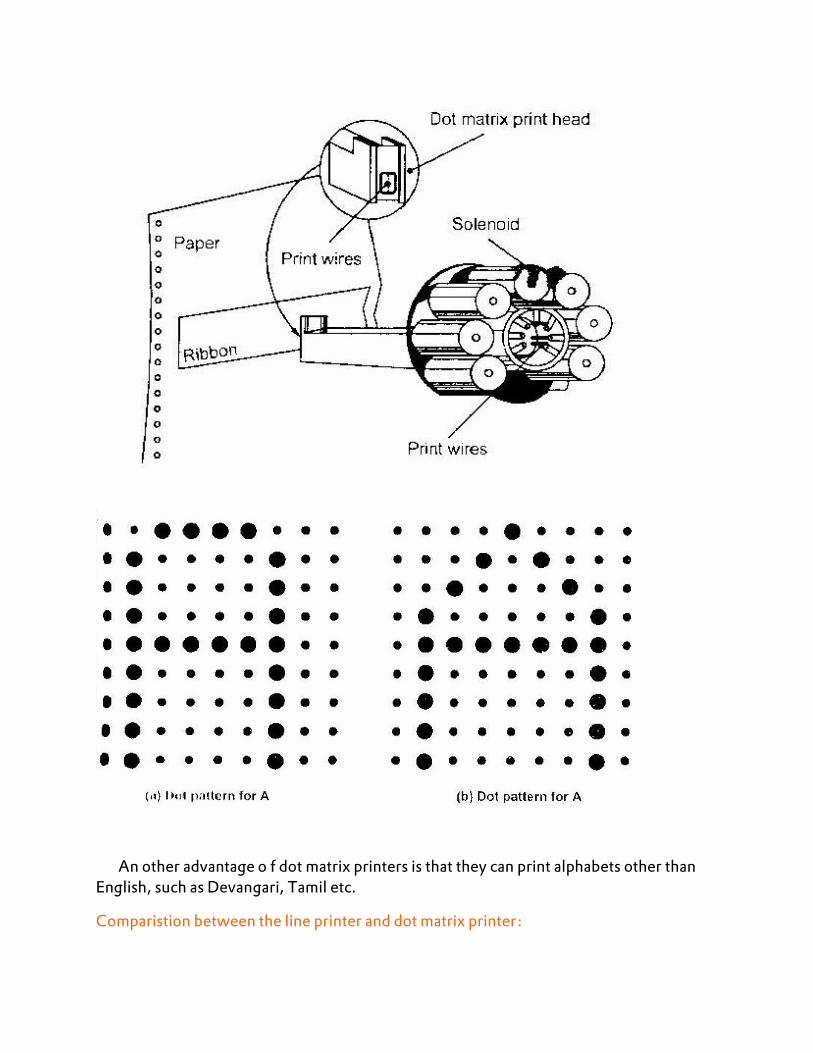
An other advantage o f dot matrix printers is that they can print alphabets other than English, such as Devangari, Tamil etc.
Comparistion between the line printer and dot matrix printer:
S.No Line Printer Dot Matrix Printer 1. Prints one line at a time Prints a character at a time. 2. Characters are embossed on the drum or
chain Characters are formed by combination of dots.
3. Characters can not be printed with different fonts.
Characters can be printed with various fonts.
4. Better printing quality Poor printing quality as characters are formed by combination of dots.
5. Better printing speed Poor printing speed. 6. Heavy duty printers. Light duty printers.
Ink Jet Printer:
An ink-jet printer places extremely small droplets of ink onto paper to create an image. If we ever look at a piece of paper that has come out of an ink jet printer, we know that, the dots are extremely small (usually between 50 and 60 microns in diameter), so small that they are thinner than the diameter of a human hair (70 microns). The dots are positioned very precisely, with resolutions of up to 1440 x 720 dots per inch (dpi). The dots can have different colours combined together to create photo quality images.
Ink jet printers print directly on paper by spraying ink through tiny nozzles as shown in fig.
As shown in the fig. the ink is deflected by an electric field with the help of horizontal and vertical charged plates to produce dot matrix patterns.
Features of ink-jet printer:
1. They can print from two to four pages per minute 2. Resolution is about 360 dots per inch, therefore better printing quality is
achieved. 3. The operating cost is quite low, the only part that needs replacement is the
ink cartridge. 4. Colour ink jet printers have four ink nozzles with colours cyan, magnets,
yellow and black, because it is possible to combine these colours to create any colour in the visible spectrum.
Laser Printer:
The line, dot matrix, and ink jet printers need a head movement on a ribbon to print characters. This mechanical movement is relatively slow due to the high inertia of mechanical elements. In laser printers these mechanical movements are avoided. In these printers, an electronically controlled laser beam traces out the desired character charged, which attracts an oppositely charged ink from the ink toner on to the exposed areas. This
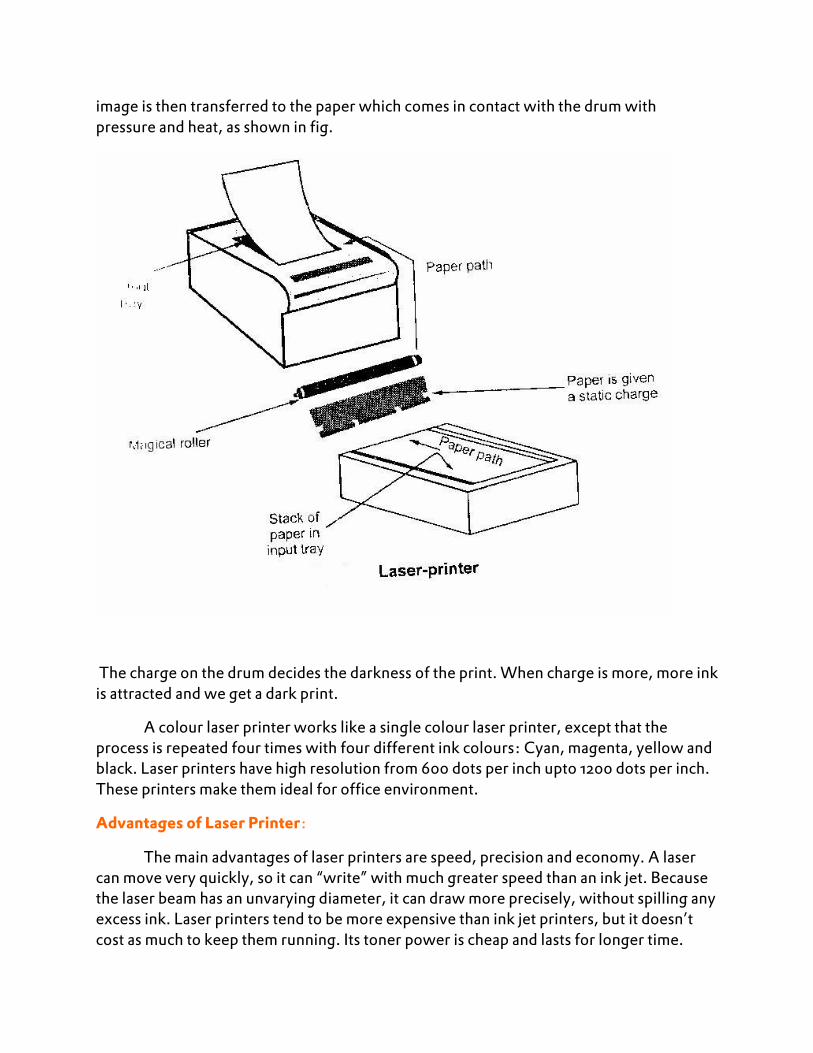
image is then transferred to the paper which comes in contact with the drum with pressure and heat, as shown in fig.
The charge on the drum decides the darkness of the print. When charge is more, more ink is attracted and we get a dark print.
A colour laser printer works like a single colour laser printer, except that the process is repeated four times with four different ink colours: Cyan, magenta, yellow and black. Laser printers have high resolution from 600 dots per inch upto 1200 dots per inch. These printers make them ideal for office environment.
Advantages of Laser Printer:
The main advantages of laser printers are speed, precision and economy. A laser can move very quickly, so it can “write” with much greater speed than an ink jet. Because the laser beam has an unvarying diameter, it can draw more precisely, without spilling any excess ink. Laser printers tend to be more expensive than ink jet printers, but it doesn’t cost as much to keep them running. Its toner power is cheap and lasts for longer time.

Thermal Transfer Printer:
In thermal transfer printer, wax paper and plain paper are drawn together over the strip of heating nibs. The heating nibs are selectively heated to cause the pigment transfer. In case of colour thermal transfer printers, the wax paper is placed on a roll of alternating, cyan, magenta, yellow and black strips, each of a length equal to the paper size. It is possible to create one colour hardcopy with less than 1 minute. This is possible because the material used to manufacture nib heats and cools very rapidly. Modern thermal transfer printers accept a video signal and digital bitmap input, making them convenient for creating hard copy of video images.
Question For Practice
Choose the Best Answer:
1. Strip chart recorders have the advantages(of)s
a) long period run b)more actually usable width c) possibility of change in chart speed
simply by lever actions d)uniform resolution e) all the above
2. The advantage of zero –suppression control over pen position control is that full gain
cabapality is available for
a) Whole signal b) static part of signal c) dynamic part of signal d) none of the above
3. Galvanometer recorders use
a) Vibration galvanometer b) ballistic galvanometer c) D’arsonval galvanometer simply
d) Tangent galvanometer
4. Null type recorders are ----------------- recorders
a) Potentiometer b) Bridge c) LVDT d) any of the above
5. The potentiometer recorder have the advantage(s) of
a) Very high input impedance b) high sensitivity c) high response to rapidly
changing quantities d) both A and B
Answer:
1. (e) 2. (c) 3. (c) 4 (d) 5(d)
True or False:
6. An CRO mostly we use electro- magnetic deflection
7. An CRO higher the bandwidth, higher will be the anode voltage
8 .Higher the voltage range, higher will be the anode voltage
Answer:
6. False 7.True 8.False
Oscilloscopes:
OBJECTIVES:
We shall learn
� CRT display, digital CRO,
� LED, LCD & dot matrix display
� Data Loggers
Introduction:
In studying the various electronic, electrical networks and systems, signals which are functions of time, are often encountered. Such signals may be periodic or non periodic in nature. The device which allows, the amplitude of such signals, to be displayed primarily as a function of time, is called cathode ray oscilloscope, commonly known as C.R.O. The C.R.O gives the visual representation of the time varying signals. The oscilloscope has become an universal instrument and is probably most versalite tool for the development of electronic circuits and systems. It is an integral part of the electronic laboratories.
The oscilloscope is, in fact, a voltmeter instead of the mechanical deflection of a metallic pointer as used in the normal voltmeters, the oscilloscope uses the movement of an electron beam against a fluorescent screen, which produces the movement of a visible spot. The movement of such spot on the screen is proportional to the varying magnitude of the signal, which is under measurement.
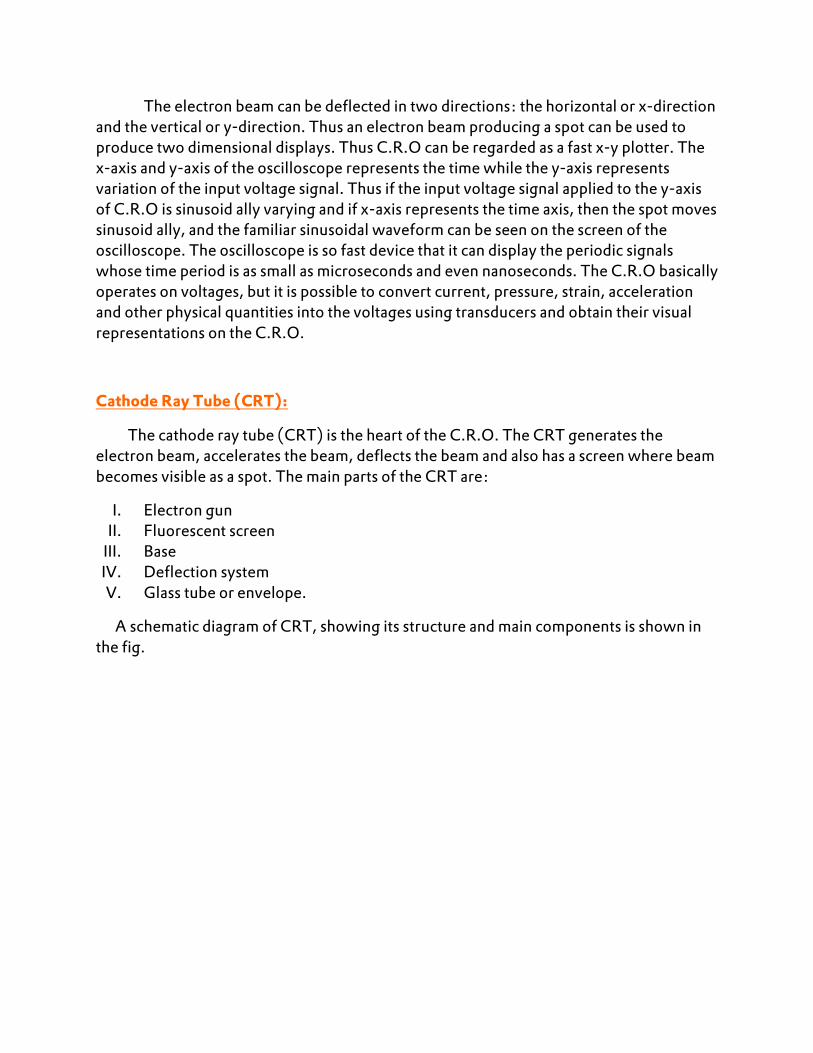
The electron beam can be deflected in two directions: the horizontal or x-direction and the vertical or y-direction. Thus an electron beam producing a spot can be used to produce two dimensional displays. Thus C.R.O can be regarded as a fast x-y plotter. The x-axis and y-axis of the oscilloscope represents the time while the y-axis represents variation of the input voltage signal. Thus if the input voltage signal applied to the y-axis of C.R.O is sinusoid ally varying and if x-axis represents the time axis, then the spot moves sinusoid ally, and the familiar sinusoidal waveform can be seen on the screen of the oscilloscope. The oscilloscope is so fast device that it can display the periodic signals whose time period is as small as microseconds and even nanoseconds. The C.R.O basically operates on voltages, but it is possible to convert current, pressure, strain, acceleration and other physical quantities into the voltages using transducers and obtain their visual representations on the C.R.O.
Cathode Ray Tube (CRT):
The cathode ray tube (CRT) is the heart of the C.R.O. The CRT generates the electron beam, accelerates the beam, deflects the beam and also has a screen where beam becomes visible as a spot. The main parts of the CRT are:
I. Electron gun II. Fluorescent screen III. Base IV. Deflection system V. Glass tube or envelope.
A schematic diagram of CRT, showing its structure and main components is shown in the fig.
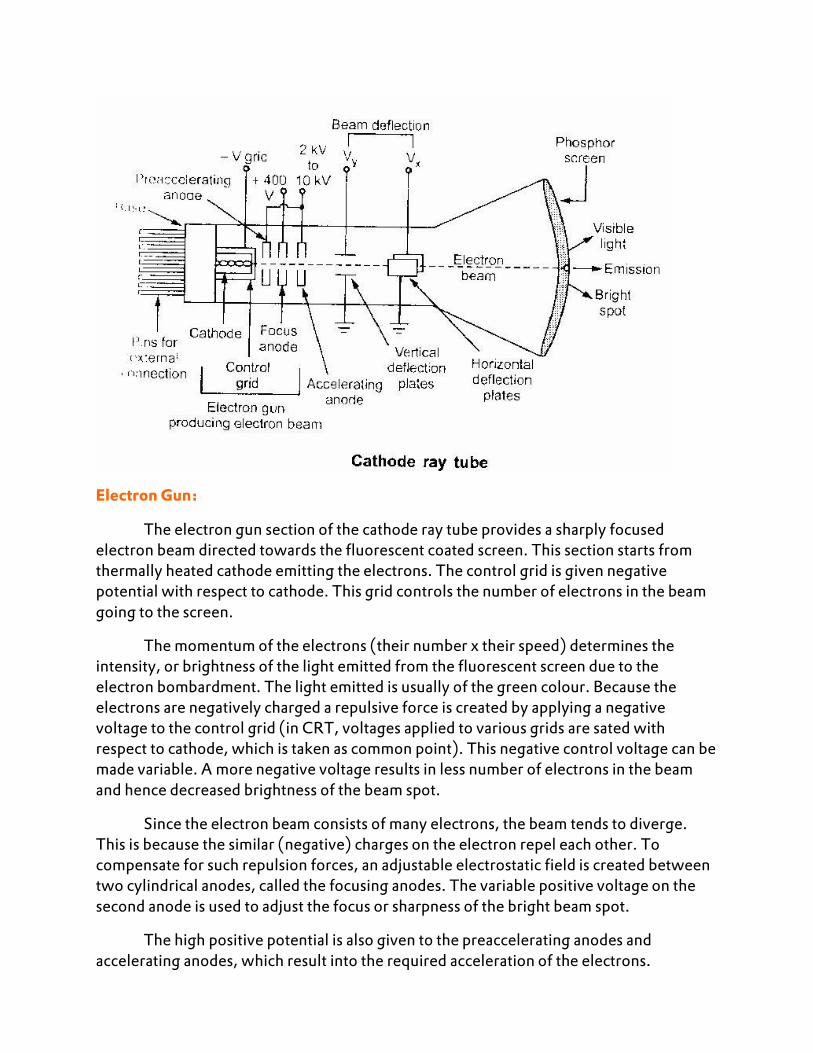
Electron Gun:
The electron gun section of the cathode ray tube provides a sharply focused electron beam directed towards the fluorescent coated screen. This section starts from thermally heated cathode emitting the electrons. The control grid is given negative potential with respect to cathode. This grid controls the number of electrons in the beam going to the screen.
The momentum of the electrons (their number x their speed) determines the intensity, or brightness of the light emitted from the fluorescent screen due to the electron bombardment. The light emitted is usually of the green colour. Because the electrons are negatively charged a repulsive force is created by applying a negative voltage to the control grid (in CRT, voltages applied to various grids are sated with respect to cathode, which is taken as common point). This negative control voltage can be made variable. A more negative voltage results in less number of electrons in the beam and hence decreased brightness of the beam spot.
Since the electron beam consists of many electrons, the beam tends to diverge. This is because the similar (negative) charges on the electron repel each other. To compensate for such repulsion forces, an adjustable electrostatic field is created between two cylindrical anodes, called the focusing anodes. The variable positive voltage on the second anode is used to adjust the focus or sharpness of the bright beam spot.
The high positive potential is also given to the preaccelerating anodes and accelerating anodes, which result into the required acceleration of the electrons.
Both focusing and accelerating anodes are cylindrical in shape having small openings located in the centre of each electrode, co-axial with the tube axis. The preaccelerating anodes are connected to a common positive high voltage which varies between 2KV to 10KV. The focusing anode is connected to a lower positive voltage of about 400 V to 500V.
Deflection System:
When the electron beam is accelerated it passes through the deflection system, with which beam can be positioned anywhere on the screen.
The deflection system of the cathode ray tube consists of two pairs of parallel plates, referred to as the vertical and horizontal deflection plates. One of the plates in each set is connected to ground (0V). To the other plate of each set, the external deflection voltage is applied through an internal adjustable gain amplifier stage. To apply the deflection voltage externally, an external terminal, called the Y input or the X input, is available.
As shown in the fig. the electron beam passes through these plates. A positive voltage applied to the Y input terminal (Vy) causes the beam to deflect vertically upward due to the attraction forces, while a negative voltage applied to the Y input terminal will cause the electron beam to deflect vertically downward, due to the repulsion forces.
Similarly, a positive voltage applied to X-input terminal (Vx) will cause the electron beam to deflect horizontally towards the right; while a negative voltage applied to the X-input terminal will cause the electron beam to deflect horizontally towards the left of the screen. The amount of vertical or horizontal deflection is directly proportional to the correspondingly applied voltage.
When the voltages are applied simultaneously to vertical and horizontal deflecting plates, the electron beam is deflected due to the resultant of these two voltages.
The face of the screen can be considered as an x-y plane. The (x,y) position of the beam spot is thus directly influenced by the horizontal and the vertical voltages applied to the deflection plates Vx and Vy, respectively.
The horizontal deflection (x) produced will be proportional to the horizontal deflecting voltage, Vx, applied to X-input.
X ∝ Vx
X = Kx Vx
Where Kx is constant of proportionality.
The deflection produced is usually measured in cm or as a number of divisions, on the scale, in the horizontal direction.
Then Kx = where Kx expressed as cm/volts or division/volt, is called horizontal
sensitivity of the oscilloscope.
Similarly, the vertical deflection (y) produced will be proportional to the vertical deflecting voltage, Vy, applied to the y-input.
y ∝ Vy
y = Ky Vy
Ky = y/Vy and Ky, and the vertical sensitivity, will be expressed as cm/volt, or division/volt.
The values of vertical and horizontal sensitivity are selectable and adjustable through multipositional switches on the front panel that controls the gain of the corresponding internal amplifier stage. The bright spot of the electron beam can thus trace (or plot) the x-y relationship between the two voltages, Vx and Vy.
The schematic arrangement of the vertical and the horizontal plates, controlling the position of the spot on the screen is shown in the fig.
Fluorescent Screen:
The light produced by the screen does not disappear immediately when bombardment by electrons ceases, ie when the signal becomes zero. The time period for which the trace remains on the screen after the signal becomes zero is known as “persistence”. The persistence may be as short as a few microsecond, or as long as tens of seconds or even minutes.
Medium persistence traces are mostly used for general purpose applications.
Long persistence traces are used in the study of transients. Long persistence helps in the study of transients since the trace is still seen on the screen after the transient has disappeared.
Short persistence is needed for extremely high speed phenomena.
The screen is coated with a fluorescent material called phosphor which emits light when bombarded by electrons. There are various phosphors available which differ in colour, persistence, and efficiency.
One of the common phosphor is Willemite, which is zinc, orthosillicate, ZnO + SiO2, with traces of manganese. This produces the familiar greenish trace. Other useful screen materials include compounds of zinc, cadmium, magnesium and silicon

The kinetic energy of the electron beam is converted into both light and heat energy when it hits the screen. The heat so produced gives rise to “phosphor burn” which is damaging and sometimes destructive. This degrades the light output of phosphor and sometimes may cause complete phosphor destruction. Thus the phosphor must have high burn resistance to avoid accidental damage.
Similarly, the phosphor screen is provided with an aluminium layer called aluminizing the cathode ray tube. This is shown in the fig.
Such a layer serves three functions.
I. To avoid build up of charges on the phosphor which tend to slow down the electrons and limits the brightness.
II. It serves as a light scatter. When the beam strikes the phosphor with aluminized layer, the light emitted back into the tube is reflected back towards the viewer which increases the brightness.
III. The aluminum layer acts as a heat sink for the phosphor and thus reduces the chances of the phosphor burning.
Phosphor Screen Characteristics:
Many phosphor materials having different excitation times and colours as well as different phosphorescence times are available.
The type P1, P2, P11 or P31 are the short persistence phosphors and are used for the general purpose oscilloscopes.
Medical oscilloscopes require a longer phosphor decay and hence phosphors like P7 and P39 are preferred for such applications.
Very slow displays like radar require long persistence phosphors to maintain sufficient flicker free picture. Such phosphors are P19, P26 and P33.
The phosphors P19, P26, P33 have low burn resistance. The phosphors P1, P2, P4, P7, P11 have medium burn resistance while P15, P31 have high burn resistance.
The various phosphors and their characteristics are given in the Table.
Colour Phosphor
Under excitation
After glow
Persistence Relative luminance
Relative writing speed
Applications
P1 Yellow – green
Yellow green
Medium 45 35 General purpose
P2 Blue-green
Green Medium 60 70 General purpose
P4 White White Medium to short
50 75 Black and white T.V.
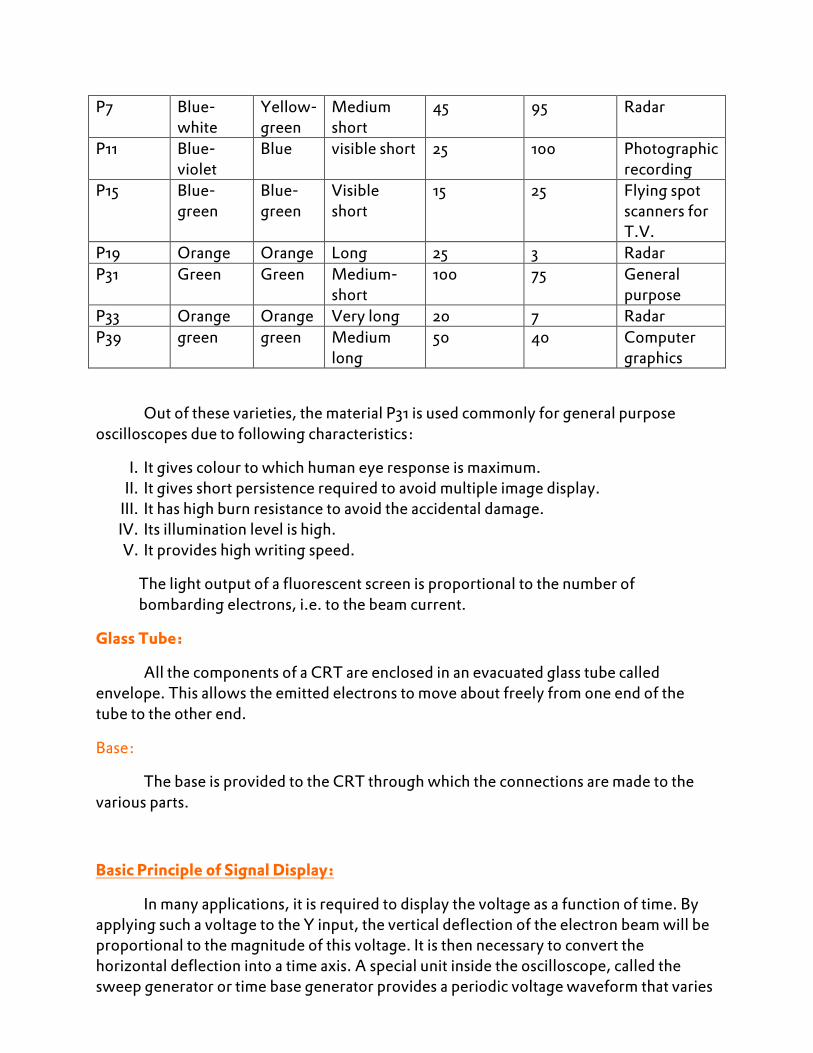
P7 Blue-white
Yellow-green
Medium short
45 95 Radar
P11 Blue-violet
Blue visible short 25 100 Photographic recording
P15 Blue-green
Blue-green
Visible short
15 25 Flying spot scanners for T.V.
P19 Orange Orange Long 25 3 Radar P31 Green Green Medium-
short 100 75 General
purpose P33 Orange Orange Very long 20 7 Radar P39 green green Medium
long 50 40 Computer
graphics
Out of these varieties, the material P31 is used commonly for general purpose oscilloscopes due to following characteristics:
I. It gives colour to which human eye response is maximum. II. It gives short persistence required to avoid multiple image display. III. It has high burn resistance to avoid the accidental damage. IV. Its illumination level is high. V. It provides high writing speed.
The light output of a fluorescent screen is proportional to the number of bombarding electrons, i.e. to the beam current.
Glass Tube:
All the components of a CRT are enclosed in an evacuated glass tube called envelope. This allows the emitted electrons to move about freely from one end of the tube to the other end.
Base:
The base is provided to the CRT through which the connections are made to the various parts.
Basic Principle of Signal Display:
In many applications, it is required to display the voltage as a function of time. By applying such a voltage to the Y input, the vertical deflection of the electron beam will be proportional to the magnitude of this voltage. It is then necessary to convert the horizontal deflection into a time axis. A special unit inside the oscilloscope, called the sweep generator or time base generator provides a periodic voltage waveform that varies
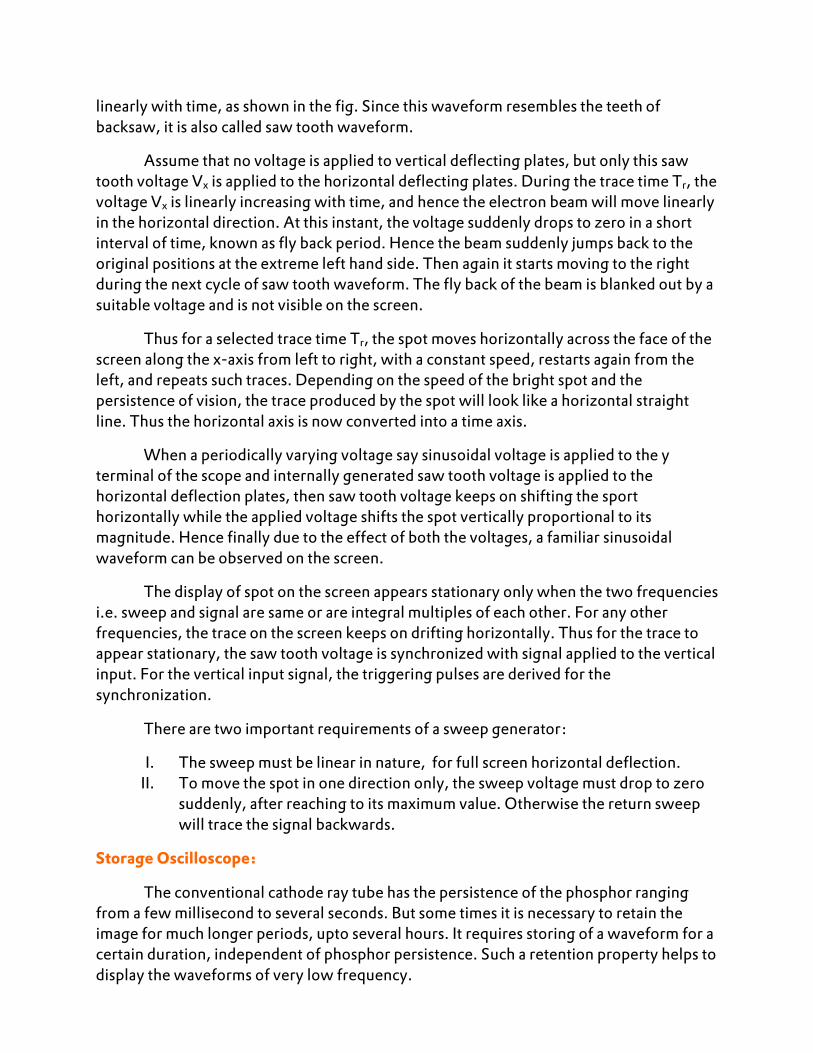
linearly with time, as shown in the fig. Since this waveform resembles the teeth of backsaw, it is also called saw tooth waveform.
Assume that no voltage is applied to vertical deflecting plates, but only this saw tooth voltage Vx is applied to the horizontal deflecting plates. During the trace time Tr, the voltage Vx is linearly increasing with time, and hence the electron beam will move linearly in the horizontal direction. At this instant, the voltage suddenly drops to zero in a short interval of time, known as fly back period. Hence the beam suddenly jumps back to the original positions at the extreme left hand side. Then again it starts moving to the right during the next cycle of saw tooth waveform. The fly back of the beam is blanked out by a suitable voltage and is not visible on the screen.
Thus for a selected trace time Tr, the spot moves horizontally across the face of the screen along the x-axis from left to right, with a constant speed, restarts again from the left, and repeats such traces. Depending on the speed of the bright spot and the persistence of vision, the trace produced by the spot will look like a horizontal straight line. Thus the horizontal axis is now converted into a time axis.
When a periodically varying voltage say sinusoidal voltage is applied to the y terminal of the scope and internally generated saw tooth voltage is applied to the horizontal deflection plates, then saw tooth voltage keeps on shifting the sport horizontally while the applied voltage shifts the spot vertically proportional to its magnitude. Hence finally due to the effect of both the voltages, a familiar sinusoidal waveform can be observed on the screen.
The display of spot on the screen appears stationary only when the two frequencies i.e. sweep and signal are same or are integral multiples of each other. For any other frequencies, the trace on the screen keeps on drifting horizontally. Thus for the trace to appear stationary, the saw tooth voltage is synchronized with signal applied to the vertical input. For the vertical input signal, the triggering pulses are derived for the synchronization.
There are two important requirements of a sweep generator:
I. The sweep must be linear in nature, for full screen horizontal deflection. II. To move the spot in one direction only, the sweep voltage must drop to zero
suddenly, after reaching to its maximum value. Otherwise the return sweep will trace the signal backwards.
Storage Oscilloscope:
The conventional cathode ray tube has the persistence of the phosphor ranging from a few millisecond to several seconds. But some times it is necessary to retain the image for much longer periods, upto several hours. It requires storing of a waveform for a certain duration, independent of phosphor persistence. Such a retention property helps to display the waveforms of very low frequency.
Mainly two types of storage techniques are used in cathode ray tubes which are:
(i) Mesh storage and (ii) Phosphor storage.
Mesh Storage:
Basically mesh storage consists of a dielectric material deposited on a storage mesh. This is called storage target. It is placed between the deflecting plates and the phosphor screen. The writing beam i.e. normally focused electron beam charges the dielectric material of storage target positively where hit.
Now the low velocity electrons are bombarded on storage target form the flood gun. The positively charged storage target material allows these electrons to pass through, to the phosphor screen. Thus the image stored with the help of storage mesh gets reproduced on the screen. Thus the storage technique has both storage target and a phosphor display target used for storing and displaying the image.
In addition to the standard CRT, this CRT consists of dielectric material deposited on storage mesh, a collector mesh, a flood gun and a collimator. The dielectric material such as magnesium fluoride is deposited in a thin layer on the storage mesh. This is called storage target. This techniques uses the principle of secondary emission. An electron gun producing an electron beam is called the writing gun.
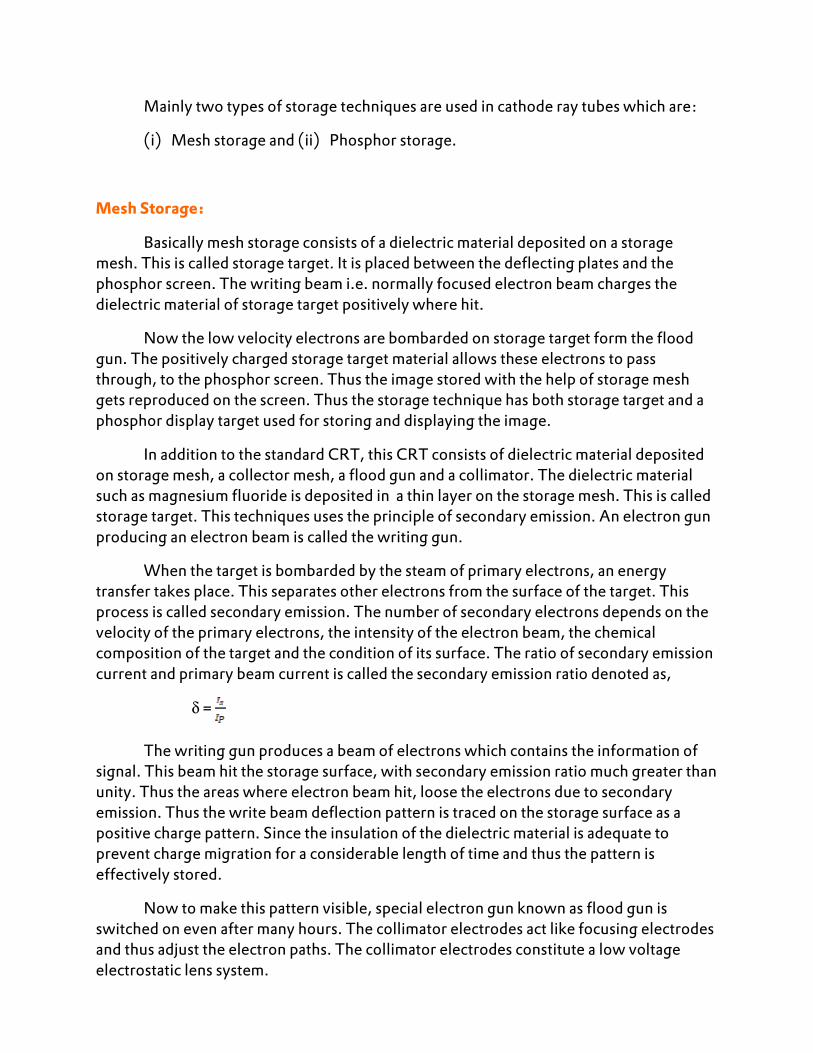
When the target is bombarded by the steam of primary electrons, an energy transfer takes place. This separates other electrons from the surface of the target. This process is called secondary emission. The number of secondary electrons depends on the velocity of the primary electrons, the intensity of the electron beam, the chemical composition of the target and the condition of its surface. The ratio of secondary emission current and primary beam current is called the secondary emission ratio denoted as,
δ =
The writing gun produces a beam of electrons which contains the information of signal. This beam hit the storage surface, with secondary emission ratio much greater than unity. Thus the areas where electron beam hit, loose the electrons due to secondary emission. Thus the write beam deflection pattern is traced on the storage surface as a positive charge pattern. Since the insulation of the dielectric material is adequate to prevent charge migration for a considerable length of time and thus the pattern is effectively stored.
Now to make this pattern visible, special electron gun known as flood gun is switched on even after many hours. The collimator electrodes act like focusing electrodes and thus adjust the electron paths. The collimator electrodes constitute a low voltage electrostatic lens system.
Most of the electrons are stopped and collected by the collector mesh. But the electrons can pass through the positively charged areas of the storage target while the areas where the image is not stored are negatively charged and electrons repel from those areas. Thus the electrons near stored positive charge only can pass through to the post accelerator region and finally upto the display target phosphor. These electrons hit on the phosphor screen, producing the image which is stored. The display of image remains as long as the flood guns are on. The display of stored charged pattern on a mesh storage is shown in the fig.
The function of collimator is to align the flood electrons so that they approach the storage surface perpendicularly.
To erase the pattern on the storage mesh, a negative voltage is applied to neutralize the stored positive charge. For erase cycle the ERASE button is provided.
For typical CRT, the normal storage mesh voltage is +3.3 V while potential of storage surface is -10 V. To erase the trace, when erase button is pressed, storage mesh potential becomes equal to collector mesh which is about 156v. When the erase button is released, the storage mesh potential falls to 3.3V. This level remains constant for 100 msec. During this time the surface is charged back to 0V. Then the storage mesh is raised to 13.3 V and due to capacitive coupling, surface potential raises to +10V.
The storage surface decays again to 0V in a time less than 200 msec. after this time, the storage mesh is again returned to +3.3V while the storage surface goes to its normal potential -10v. This completes the erase cycle. The mesh and surface potentials during the erase cycle are shown in the fig.
Phosphor Storage:
In this technique of storage, the tube used is a bistable storage tube. The same material is used for both the storage target and the display phosphor. Infact the thin phosphor layer acts as storage target as well as the display target hence the name bistable tube.
The material used for both storage and display targets is P1 phosphor to achieve good secondary emission characteristics. The boundary migration of stored charge should be eliminated which is achieved by having scattered phosphor particles. The layer may be more than one particle thick which allows a phosphor viewing in a continuous manner. But beyond a particular threshold thickness, the storage is not possible.
The controlling electrode is the conductive back plate. This is the thin layer of metal film deposited inside the face plate. This deposition is done before the phosphor material deposition. The storage characteristics is controlled by the voltage applied to the
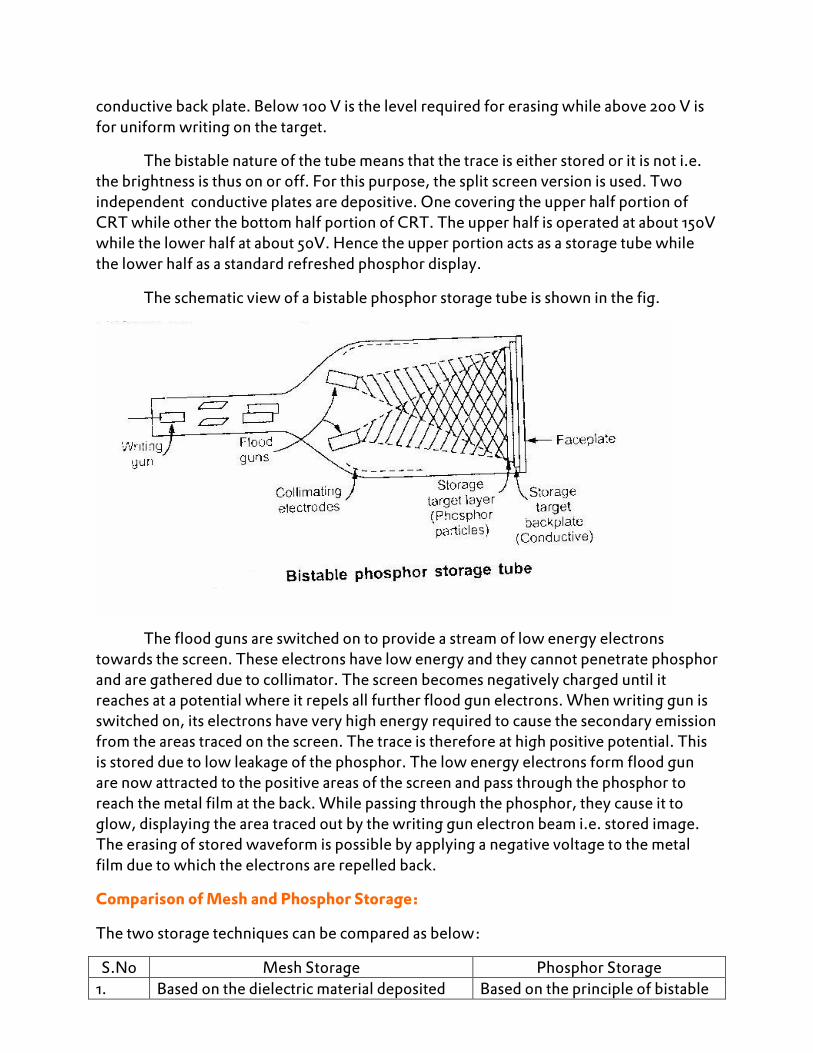
conductive back plate. Below 100 V is the level required for erasing while above 200 V is for uniform writing on the target.
The bistable nature of the tube means that the trace is either stored or it is not i.e. the brightness is thus on or off. For this purpose, the split screen version is used. Two independent conductive plates are depositive. One covering the upper half portion of CRT while other the bottom half portion of CRT. The upper half is operated at about 150V while the lower half at about 50V. Hence the upper portion acts as a storage tube while the lower half as a standard refreshed phosphor display.
The schematic view of a bistable phosphor storage tube is shown in the fig.
The flood guns are switched on to provide a stream of low energy electrons towards the screen. These electrons have low energy and they cannot penetrate phosphor and are gathered due to collimator. The screen becomes negatively charged until it reaches at a potential where it repels all further flood gun electrons. When writing gun is switched on, its electrons have very high energy required to cause the secondary emission from the areas traced on the screen. The trace is therefore at high positive potential. This is stored due to low leakage of the phosphor. The low energy electrons form flood gun are now attracted to the positive areas of the screen and pass through the phosphor to reach the metal film at the back. While passing through the phosphor, they cause it to glow, displaying the area traced out by the writing gun electron beam i.e. stored image. The erasing of stored waveform is possible by applying a negative voltage to the metal film due to which the electrons are repelled back.
Comparison of Mesh and Phosphor Storage:
The two storage techniques can be compared as below:
S.No Mesh Storage Phosphor Storage 1. Based on the dielectric material deposited Based on the principle of bistable

on a storage mesh. storage nature of the tube. 2. Storage target and display target are
different. Storage and display target is same
3. There is no possibility of reduction in the light output with use.
It is susceptible to light output reduction with the use.
4. Variable persistence is possible Variable persistence is not possible
5. Grey scales or half tones are possible. Halftones are not possible 6. Continuous persistence control is possible Continuous persistence control is
not possible. 7. The material used for storage target and
display target is different. The same material mostly P1 phosphor is used for both storage as well as display target.
8. Relatively long CRT life. Relatively short CRT life. 9. Comparison of previous waveform and
present waveform is not possible. Comparison of previous waveform and present waveform is possible due to split screen feature.
Digital Storage Oscilloscope:
There are certain disadvantages of storage cathode ray tube due to which there is need of digital storage oscilloscope. The disadvantages of analog storage cathode ray tube are as follows:
I. The waveform can be preserved for finite amount of time only and eventually the waveform will be lost.
II. As long as image is required to be stored, the power must be supplied to the tube. III. The trace obtained from the storage tube is not fine as compared to the
conventional oscilloscope tube. IV. The writing rate of storage tube is less than that of conventional cathode ray tube.
This limits the speed of the storage tube. V. The storage cathode ray tube requires additional power supplies. VI. Only one waveform can be stored in storage tube. If two traces are to be
compared, they are required to be superimposed on the same screen and must be displayed together.
VII. The stored waveform cannot be reproduced on the external device like computer.
The digital storage oscilloscope eliminates all the above mentioned disadvantages. In this oscilloscope, the waveform to be stored is digitized and then stored in a digital memory. The conventional cathode ray tube is used in this oscilloscope hence the cost is less. The power to be applied to memory is mall and can be supplied by small battery. Due to this the stored image can be displayed indefinitely as long as power is supplied to
memory. Once the waveform is digitized then it can be further loaded into the computer and can be analyzed in detail.
Block Diagram:
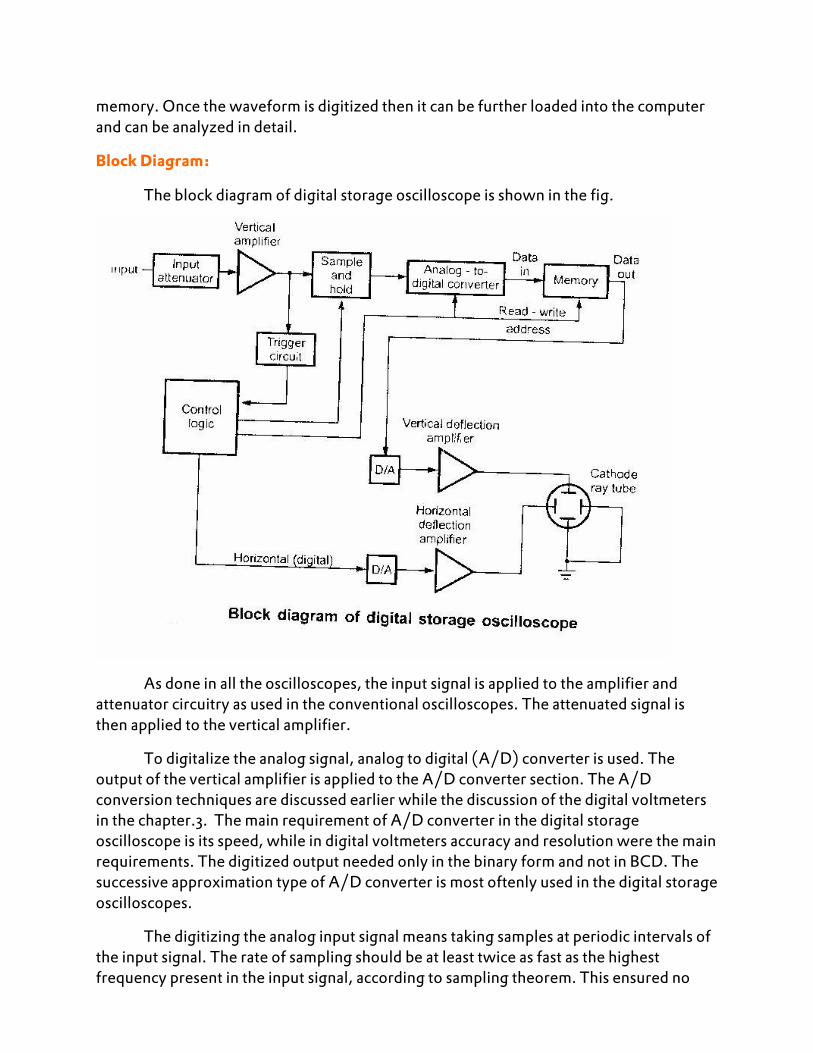
The block diagram of digital storage oscilloscope is shown in the fig.
As done in all the oscilloscopes, the input signal is applied to the amplifier and attenuator circuitry as used in the conventional oscilloscopes. The attenuated signal is then applied to the vertical amplifier.
To digitalize the analog signal, analog to digital (A/D) converter is used. The output of the vertical amplifier is applied to the A/D converter section. The A/D conversion techniques are discussed earlier while the discussion of the digital voltmeters in the chapter.3. The main requirement of A/D converter in the digital storage oscilloscope is its speed, while in digital voltmeters accuracy and resolution were the main requirements. The digitized output needed only in the binary form and not in BCD. The successive approximation type of A/D converter is most oftenly used in the digital storage oscilloscopes.
The digitizing the analog input signal means taking samples at periodic intervals of the input signal. The rate of sampling should be at least twice as fast as the highest frequency present in the input signal, according to sampling theorem. This ensured no
loss of information. The sampling rates as high as 100,000 samples per second is used. This requires very fast conversion rate of A/D converter. Hence, generally flash analog to digital converters are used, whose resolution decreases as the sampling rate increases.
If a 12 bit converter is used, 0.025% resolution is obtained while if 10 bit A/D converter is used then resolution of 0.1% (1 part in 1024) is obtained. Similarly with 10 bit A/D converter, the frequency response of 25 kHz is obtained. The total digital memory storage capacity is 4096 for a single channel, 2048 for two channels each and 1024 for four channels each.
The sampling rate and memory size are selected depending upon the duration and the waveform to be recorded.
Once the input signal is sampled, the A/D converter digitizes it. The signal is then captured in the memory. One it is stored in the memory, many manipulations are possible as memory can be read out without being erased.
One important feature of digital storage oscilloscope is its mode of operation called pretrigger view. This modes means that the oscilloscope can display what happened before a trigger input is applied. This mode of operation is useful when a failure occurs.
Single shot evens, such as the waveform of an explosion are transient in nature and very quickly lost. The observer can not see such events, unless the waveform is photographed or stored. Such events can be stored in memory of digital storage oscilloscope and reading the memory rapidly and repetitively the continuous waveform can be obtained.
The digital storage oscilloscope has three modes of operation:
I. Roll Mode: Very fast varying signals are displayed clearly in this mode. In this mode, the input signal is not triggered at all. The fast varying signal is displayed as if it is changing slowly, on the screen in this mode.
II. Store Mode: This is called refresh. In this case input initiates trigger circuit. Memory write cycle starts with trigger pulse. When memory is full, write cycle stops. Then using digital to analog converter, the stored signal is converted to analog and displayed. When next trigger occurs the memory is refreshed.
III. Hold or save mode: This is automatic refresh mode. When new sweep signal is generated by time base generator, the old contents get over written by new one. By pressing hold or save button, overwriting can be stopped and previously saved signal gets locked.
Advantages:
Let us summarize the advantages of the digital storage oscilloscope:
I. It is easier to operate and has more capability. II. The storage time is infinite.
III. The display flexibility is available. The number of traces that can be stored and recalled depends on the size of the memory.
IV. The cursor measurement is possible. V. The characters can be displayed on screen along with the waveform which can
indicate waveform information such as minimum, maximum, frequency, amplitude etc.
VI. The X-Y plots, B-H curve, P-V diagrams can be displayed. VII. The pretrigger viewing feature allows to display the waveform before trigger
pulse. VIII. Keeping the records is possible by transmitting the data to computer system where
the further processing is possible. IX. Signal processing is possible which includes translating the raw data into finished
information e.g. computing parameters of a captured signal like r.m.s. value, energy stored ect.
Acquisition Methods:
In the digital storage oscilloscope, it is necessary to capture the digital signal and store it. Depending upon the particular application, there are three different acquisition methods used in the digital storage oscilloscopes. There three methods are :
I. Real time sampling. II. Random repetitive sampling. III. Sequential repetitive sampling.
Real Time Sampling:
This is the most straight forward method of digital signal capturing. In this method, in response to singl trigger event, the complete record on nm samples is simultaneously captured on each and every channel. From these samples recorded in a single acquisition cycle, the waveform is displayed on the screen of digital storage oscilloscope.
Three important features of this method are,
I. The display and analysis of waveform can be carried out at later stage while the signal gets recorded in memory at an earlier stage.
II. It is very easy to capture the signals that happen before the trigger event. III. A truly simultaneous capture of multiple signals is automatic.
This method can be used in a continuously repeating mode but each waveform displayed is captured from a single acquisition cycle. The larger memory and fast sampling rate plays an important role in the real time sampling. The higher sampling rate is required to capture long time interval signal capturing. This is possible due to large memory. The signal fluctuations occurring entirely between samples will not be captured in the sample record.
The sampling theorem helps to select the proper sampling rate. It states that if a signal is sampled greater than twice the frequency of highest frequency component in signal then the original signal can be reconstructed, exactly from the samples. Half the sampling frequency is called Nyquist limit or Nyquist critical frequency. This is denoted as fc.
Any signal component having a frequency higher than fc gets falsely translated to another frequency somewhere between d.c. and fc by the act of sampling. This is called aliasing. A signal of frequency fc + ∆ will be aliased to fc -∆ for ∆ < fc. The 3 dB bandwidth of the vertical amplifier should be less than fc at the fastest sampling rate. In practice the 3dB bandwidth is set to fs/4 with about 5% over shoot where fs is sampling frequency.
Random Repetitive Sampling:
The bandwidth limited to fs/4 in real time sampling. The major disadvantages of this is increasing bandwidth means increasing sampling rate and fast sample rate digitizers and memory are very expensive. The method in which the bandwidth is not limited by sampling rate is random repetitive method.
In this method, repeated real time data acquisition cycles are performed. Still each sample value is plotted independently on display as a dot. Interpolation between samples is not done. Each acquisition cycle produces random time interval td between trigger point and sample clock as shown in the fig.
The time between the samples from that capture is ts with an offset of td from the trigger point. The trigger interpolater measures the time interval td on each acquisition cycle. It is located in the time base.
Each successive acquisition is plotted at its measured random offset. This progressively fills the picture of the waveform.
As the waveform fills in the gaps between the dots become smaller and effective sampling rate increases. Accurace of trigger interpolater while measuring td limits the effective sampling rate.
The disadvantage of this method is that the abilities to capture a nonrecurring transient is lost.
Sequential Repetitive Sampling:
An oscilloscope having bandwidth 20 to 50GHz need very fast sweep speed settings. In such case, random repetitive method can not work satisfactorily. Hence sequential repetitive sampling is used.
In this method, one sample value per trigger event is captured at a carefully controlled time delay tds after the triggering pulse, as shown in the fig.
This delay is increased by small amount tse after each point is captured. The single sample acquisition cycle is repeated till the entire waveform has been plotted. In this method the increase in delay which is tde is the effective sample time.
This method can not capture trigger event or any pretrigger information. The major disadvantage of this method is pretrigger view feature gets lost. Hence this method is used only in microwave bandwidth digital oscilloscopes.
Automatic Measurements:
In the digital oscilloscope, the waveforms can be easily made available to the computer and due to the involvement of computer the digital oscilloscope can have variety of useful features. The automatic measurements is one of such powerful features of a digital oscilloscope. Some of the uses of automatic measurements are,
1. Calibration 2. Auto scale 3. Measurement of parameters 4. Mathematical operations.
Calibration:
Due to computer, digital oscilloscope can take the measurements and analyse them automatically. Hence this feature is used to streamline the process of calibration of the digital oscilloscope. In earlier days, calibration is carried out by trained user. But this was time consuming and costly process as many tests, measurements and adjustments were involved in it.
In the digital oscilloscope, the system embedded computer is used to measure and analyse the signals automatically. The results are stored in a memory which retains the information though power is turned off. Such memory is called non volatile memory. Hence manual internal adjustments are not required. This reduces the oscilloscope operating cost.
Auto Scale:
In a digital oscilloscope, an auto scale control button is provided on the front panel. When the button is pressed, the internal controller checks all the channels for presence of any active signal. If any active signal is recognized then the auto scale facility adjusts the control settings automatically such that few cycles of that signal are displayed on screen. This feature is very useful for the signals whose amplitude frequency d.c. offset etc. are unknown. The operator gets the display of the signal very quickly on screen.
Measurement:
In practice it is possible to measure many parameters of the signals other than amplitude and frequency. This involves a lot of calculations. In some cases it is difficult to
executive such computations. Such calculations are required to be repeated many times in some cases, which is time consuming.
But in digital oscilloscope, preprogramme for the various parameter measurements can be fed. The parameters are calculated automatically from the sampled data record stored in the memory. This built in computing power of digital oscilloscope is a real time saver. The various built in measurements possible in digital oscilloscope are, frequency, period, duty cycle, overshoot, maximum and minimum voltages, peak to peak voltages, average voltage, r.m.s. voltage, rise time, fall time etc.
Mathematical operations:
In some cases it is the requirements to perform a mathematical operation on the entire sampled data record captured on a signal channel. Such operations are integration, differentiation, fast fourier transform etc. the digital oscilloscope can perform such operations automatically and displays the result on screen. Not only this but two records captured on two different channels can be algebraically manipulated by a digital oscilloscope. Thus such two different channel signals can be added, subtracted, multiplied, divided and can be displayed on the screen.
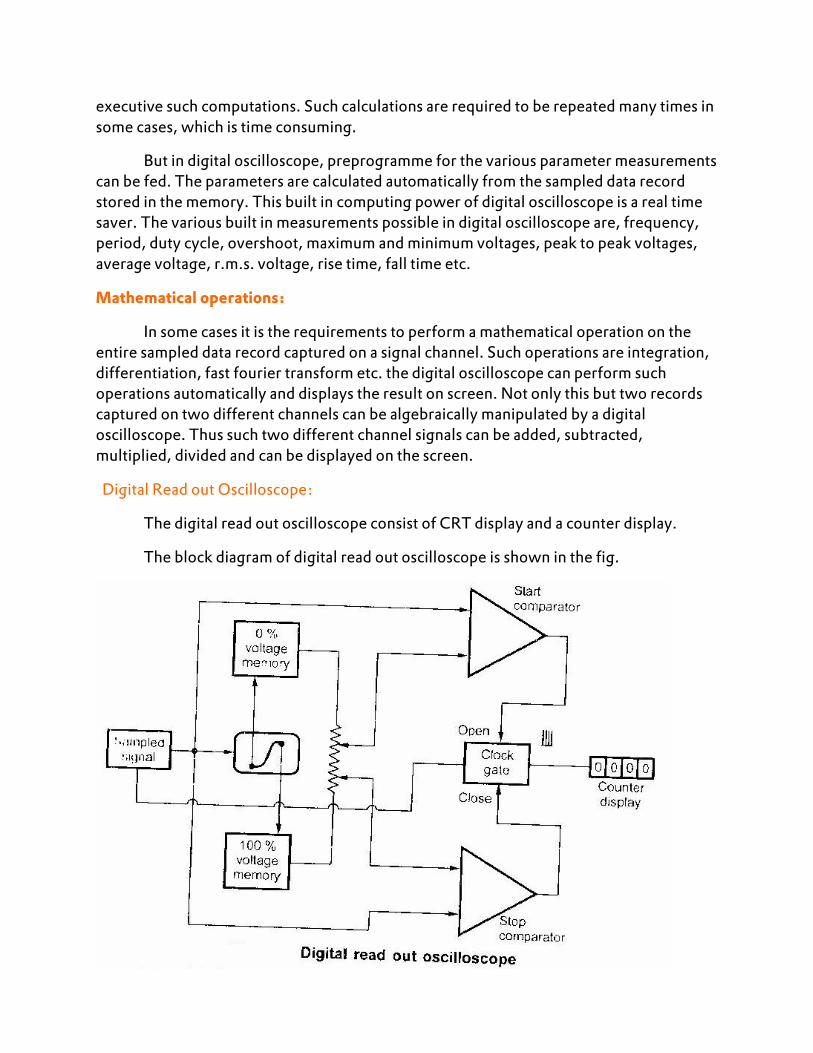
Digital Read out Oscilloscope:
The digital read out oscilloscope consist of CRT display and a counter display.
The block diagram of digital read out oscilloscope is shown in the fig.

Questions For Practice
Choose the Best answer
1. The main draw back of balancing recorders is that
a) Their ability to response to rapidly changing quantities is quite limited b) low input
impedance c) low input sensitivity d) none of these
2. The advantages of x-y recorders are that
a) the are economical to operate b)they are easy and convenient to use c) the are
cheaper than strip-chart recorders d) the can be conveniently used for continuous
recording e) both A and B
3.The recorders used for plotting B-H curves for magnetic materials, current – voltage
curves for transistors and speed-time curves for electric motor are ---------recorders.
a) LVDT type b) circular chart c) x-y d) potentiometer type
4. X-Y recorders
a) Record one quantity on x-axis with respect to time on y- axis
b) Record one quantity on y-axis with respect to time on x- axis
c) Record one quantity with respect to another quantity
d) None of the above
Answer
1 .(a) 2.(e) 3. (c) 4. (c)
True or False
1. A CRO is an instrument which presents signal waveform visually.
2. The cathode of a CRO is usually coated with copper oxide
3. A CRO can operate upto 50Hz
4. An electron gun produces a stream of electrons
Answer:
1. True 2. False 3.False 4.True
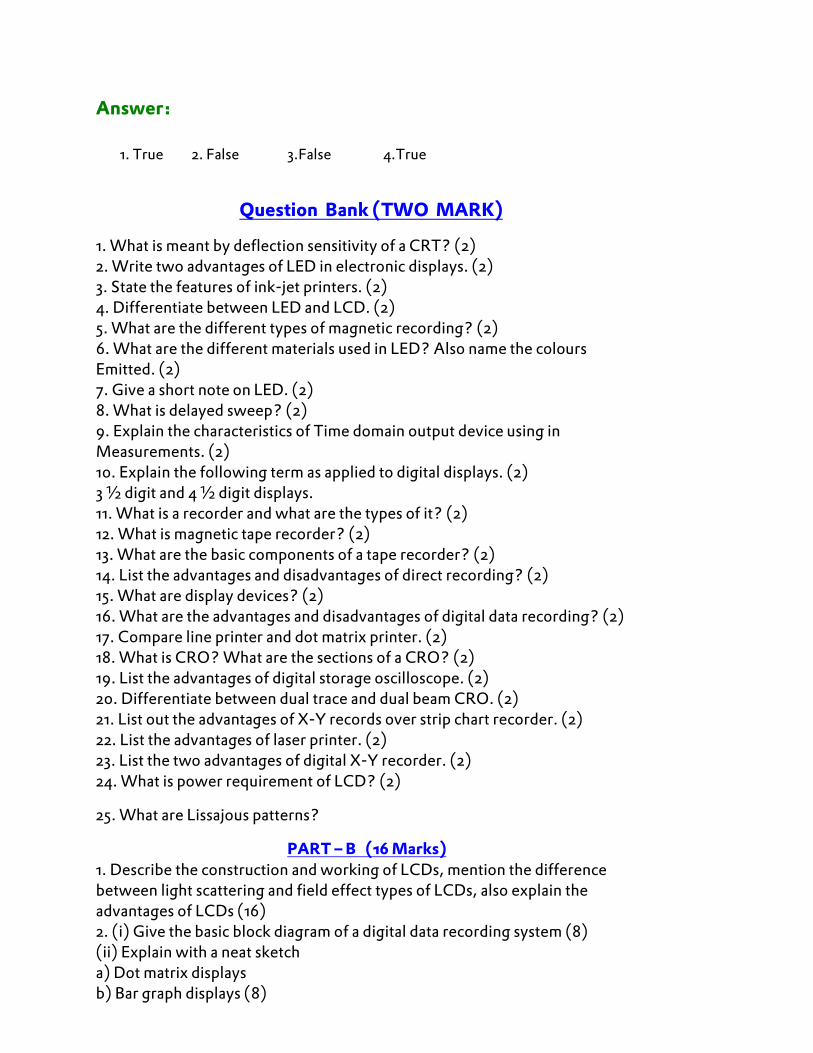
Question Bank (TWO MARK)
1. What is meant by deflection sensitivity of a CRT? (2) 2. Write two advantages of LED in electronic displays. (2) 3. State the features of ink-jet printers. (2) 4. Differentiate between LED and LCD. (2) 5. What are the different types of magnetic recording? (2) 6. What are the different materials used in LED? Also name the colours Emitted. (2) 7. Give a short note on LED. (2) 8. What is delayed sweep? (2) 9. Explain the characteristics of Time domain output device using in Measurements. (2) 10. Explain the following term as applied to digital displays. (2) 3 ½ digit and 4 ½ digit displays. 11. What is a recorder and what are the types of it? (2) 12. What is magnetic tape recorder? (2) 13. What are the basic components of a tape recorder? (2) 14. List the advantages and disadvantages of direct recording? (2) 15. What are display devices? (2) 16. What are the advantages and disadvantages of digital data recording? (2) 17. Compare line printer and dot matrix printer. (2) 18. What is CRO? What are the sections of a CRO? (2) 19. List the advantages of digital storage oscilloscope. (2) 20. Differentiate between dual trace and dual beam CRO. (2) 21. List out the advantages of X-Y records over strip chart recorder. (2) 22. List the advantages of laser printer. (2) 23. List the two advantages of digital X-Y recorder. (2) 24. What is power requirement of LCD? (2)
25. What are Lissajous patterns?
PART – B (16 Marks) 1. Describe the construction and working of LCDs, mention the difference between light scattering and field effect types of LCDs, also explain the advantages of LCDs (16) 2. (i) Give the basic block diagram of a digital data recording system (8) (ii) Explain with a neat sketch a) Dot matrix displays b) Bar graph displays (8)

3. (i) Explain the basic elements of a magnetic tape recorder. (8) (ii) Explain the block diagram of oscilloscope with a neat sketch (8) 4. (i) Describe the basic components of a CRT. (10) (ii) Write short notes on liquid crystal displays. (6) 5. (i) With a neat block diagram, explain the working of digital storage oscilloscope. (8) (ii) Discuss briefly about the applications of LED. (8) 6. (i) What are the various types of oscilloscopes? (4) (ii) Discuss in detail the construction of a storage type oscilloscope. What are the accessories for a CRO? (12) 7. (i) Explain in detail, how the data is stored in a magnetic disk and tape? (10) (ii) Describe the performance of digital plotter. (6) 8. (i) Explain the block diagram of a general purpose oscilloscope and also describe about the observation of waveform on CRO. (10) (ii) Write short notes on Printers. (6)