Embed Size (px)
Citation preview

United States Economic Forecast4th Quarter 2019

Deloitte Global Economist Network
The Deloitte Global Economist Network is a diverse group of economists that produce relevant, interesting, and thought-provoking content for external and internal audiences. The network’s industry and economics expertise allow it to bring sophisticated analysis to complex, industry-based questions. Publications range from in-depth reports and thought leadership examining critical issues to executive briefs aimed at keeping Deloitte’s top management and partners abreast of topical issues.

Contents
Introduction 2
Scenarios 3
Sectors 5
Consumer spending 5
Housing 7
Business investment 9
Foreign trade 11
Government 14
Labor markets 16
Financial markets 18
Prices 20
Appendix 22
Endnotes 26

2
IntroductionComing in for a (soft) landing?
“IF YOU CAN walk away from a landing,” test pilot Chuck Yeager is supposed to have said,
“it’s a good landing.” That’s not quite true for economies: A bumpy landing might be quite uncomfortable, especially given the considerable risks facing today’s economy. And there’s no ques-tion that the US economy is coming in for a landing. A slowdown in late 2019 and early 2020 has been a feature of the Deloitte US economic forecast since early 2018, so this is hardly a surprise. But it leaves a question: Just how rapidly will the economy slow—and could it slow enough to actually crash?
The landing is particularly complicated because policymakers have jiggled the controls on the econ-omy several times in the past two years. Here’s a list of the major policy changes—and, yes, that’s more than usual in such a short period of time.
• The 2017 tax cut bill put a substantial amount of short-term demand into the economy in the first half of 2018. And the economy responded: The 2018 growth rate was nearly 3.0 percent, considerably above the forecast rate.
• The 2018 budget agreement raised spending in 2018 by quite a bit, which added to the growth of short-term demand and helped to boost the growth rate.
• The 2018–19 government shutdown temporar-ily reduced demand and added to uncertainty. That helped to reduce spending—especially business spending—in the subsequent quarters.
• Starting in 2017 and continuing through today, the Trump administration has continued to
impose additional tariffs, often unexpectedly. The tariffs have been met with retaliation (espe-cially on the part of China). The results: slowing exports and more uncertainty, adding to the reluctance of businesses to spend money on investment.
• The Federal Reserve continued the tightening cycle it started in 2015 until this past summer. The high level of uncertainty and falling busi-ness investment (and recession in the manufacturing sector), combined with the lack of inflation, convinced most of the decision-makers at the Fed that monetary policy needed to be more accommodating. Since then, the Fed has lowered the funds rate three times and started to purchase Treasuries to increase reserves.
Despite, or perhaps because of these offsetting pol-icy moves, the US economy is moving gradually toward its long-run potential growth rate of between 1.5 percent and 2.0 percent. Don’t be sur-prised if that slowdown is accompanied by a few bumps, in the form of ugly monthly or quarterly data releases. But monthly data is volatile—and a single weak release does not indicate that the econ-omy is headed for recession.
There is, however, one area of substantial concern: The manufacturing sector is in recession, at least according to the Wall Street Journal Survey of Forecasters.1 As of November, manufacturing out-put was down for the year. Most analyses attribute the slowdown to a combination of trade restric-tions and business uncertainty about policy—especially trade policy.2 The manufacturing
United States Economic Forecast
2

3
History Forecast
Source: Deloitte analysis.Deloitte Insights | deloitte.com/insights
FIGURE 1
Real GDP growth Baseline Coordinated global recovery Recession Continued slow growth
-3
-2
-1
0
1
2
3
4
5
1995 2005 2005 2010 2015 2020
Percent
slowdown is global and has already had an econo-mywide impact in Germany and China. The rest of the US economy could start to feel it soon.3
Scenarios
Our scenarios are designed to demonstrate the dif-ferent paths down which the administration’s policies and congressional action might take the American economy. Foreign risks are, if anything, rising, and we’ve incorporated them into the sce-narios. But for now, we view the greatest uncertainty in the US economy to be that gener-ated within the nation’s borders.
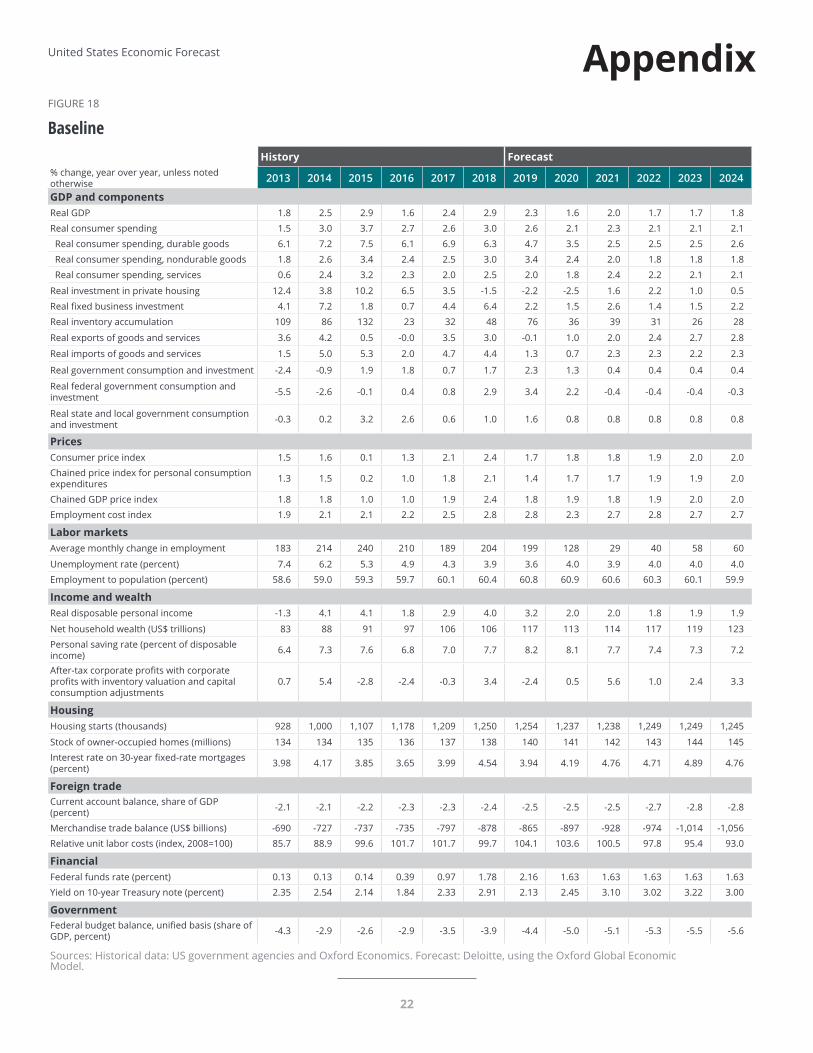
The baseline (55 percent probability): Uncertainty from the trade war with China damp-ens investment spending. Employment and consumer spending are slow but remain relatively strong. Employment growth stays above the replacement level for another year or two but even-tually slows to below 100,000 per month as the stock of potential workers is exhausted. While gov-ernment spending does not fall, it no longer contributes to accelerating growth. Growth slows below potential in 2020 but picks up to potential (a bit below 2.0 percent) for the remainder of the forecast.
4th Quarter 2019
3

4
Recession (25 percent): The economy weakens in late 2019 and early 2020 from the impact of tar-iffs and softening investment spending. With the economy already weak, a financial crisis pushes the economy into recession. The Fed and the European Central Bank act to ease conditions, and the finan-cial system recovers relatively rapidly. GDP falls in the first three quarters of 2020 and then recovers.
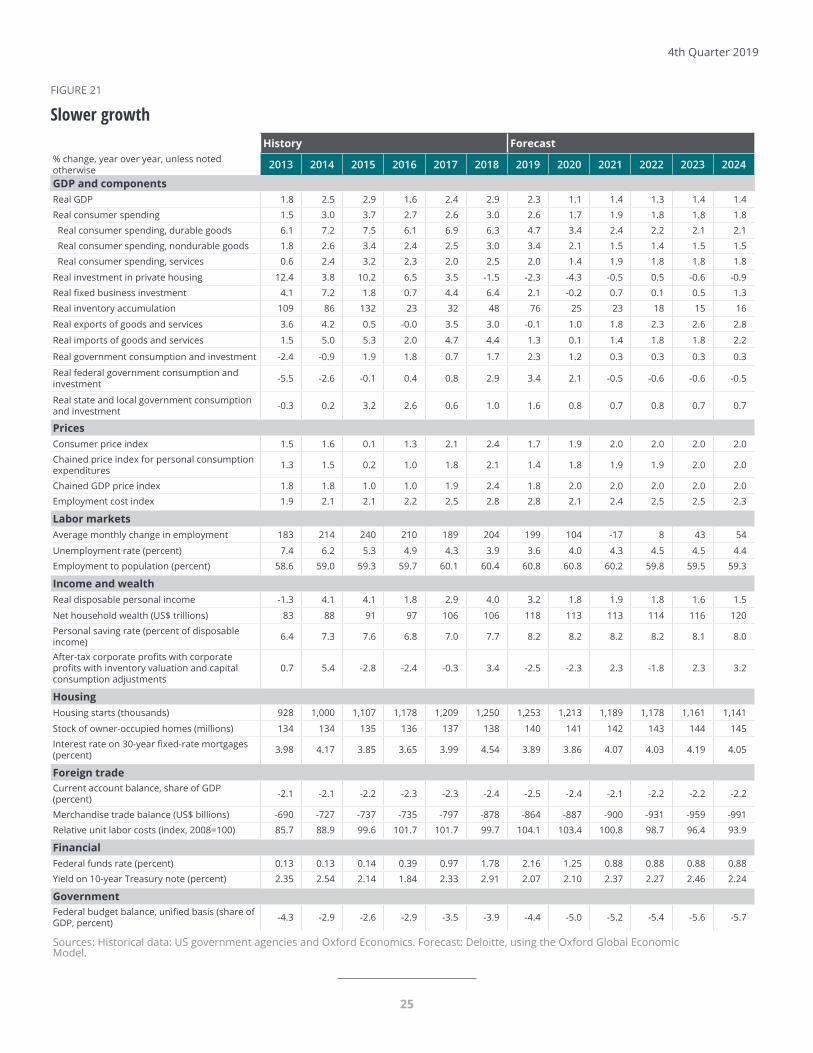
Slower growth (10 percent): Productivity growth becomes even more sluggish. Tariffs raise costs and disrupt supply chains. The combination of low returns on investment and uncertainty about trade policy propels businesses to hold back on investments. Foreign growth lowers the demand
for US exports. GDP growth falls to less than 1.5 percent over the forecast period, while the unemployment rate rises.
Productivity bonanza (10 percent): Technological advances begin to lower corporate costs, as continuing deregulation improves busi-ness confidence. Trade agreements reduce uncertainty. Tariffs turn out to have a smaller impact than many economists expected. Business investment picks up as companies rush to take advantage of the low cost of putting the technology in place. The US economy grows 2.5 percent in 2019, with growth at 2.3 percent after 2021, while inflation remains subdued.
United States Economic Forecast
4

5
Sectors
Consumer spending
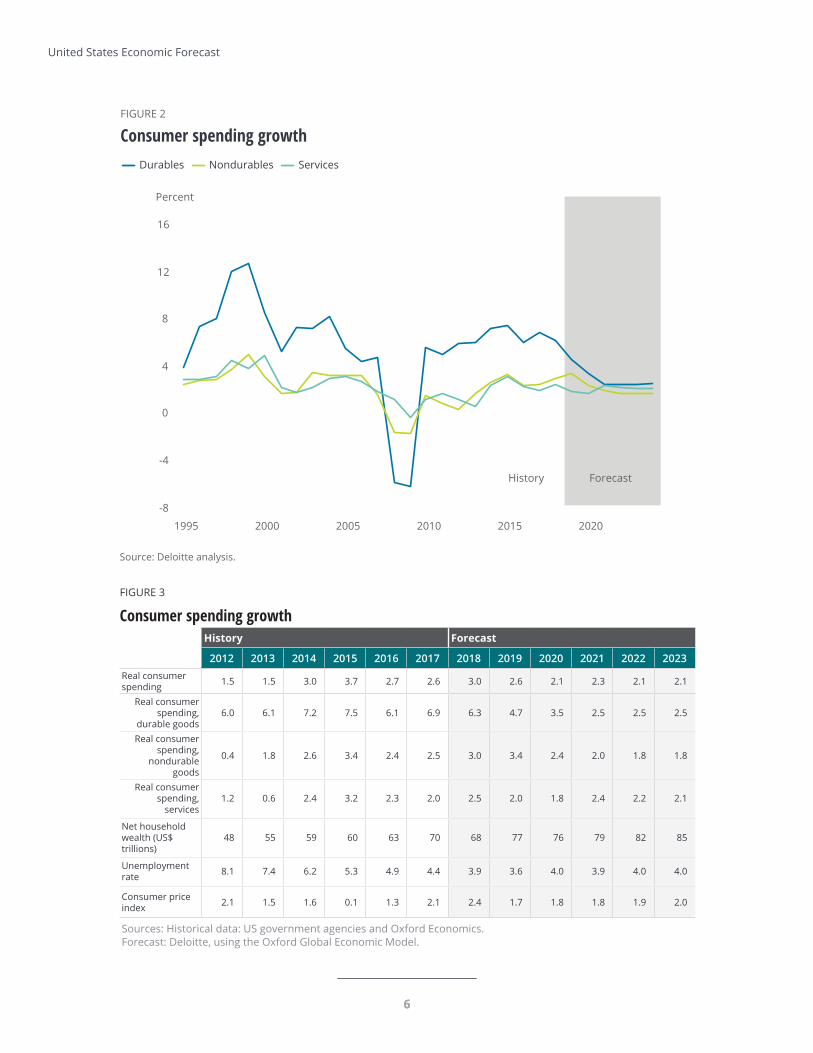
The household sector has provided an underpin-ning of steady growth for the US economy over the past few years. Consumer spending has grown steadily even as business investment weakened, exports faced substantial headwinds, and housing stalled. But that’s unsurprising, since job growth has remained quite strong. Even with relatively low wage growth, those jobs have helped put money in consumers’ pockets, enabling households to con-tinue to increase their spending. The continued steady (if modest) growth in house prices has helped, too, since houses are most households’ main form of wealth.
For all the daily speculation about how political developments might affect consumer choices, when it comes to spending decisions, political noise seems to be just that—in the background—to con-sumers who seem focused on their own situations. As long as job growth holds up and house prices keep rising, consumer spending will likely remain strong. And the 2017 tax cut, while modest for
most consumers, seems to have bolstered their confidence that they can safely spend. At some point, wages might begin to rise enough for people to notice, and that could give consumer spending a further boost.
The medium term presents a different picture. Many American consumers spent the 1990s and ’00s trying to maintain spending even as incomes stagnated. But now they are wiser (and older, which is another challenge, as many baby boomers face imminent retirement with inadequate sav-ings).4 That may constrain spending and require higher savings in the future. And although American households seem to face fewer obstacles in their pursuit of the good life than just a few years ago, rising income inequality could pose a significant challenge for the sector’s long-run health. For instance, low unemployment hasn’t alleviated many people’s economic insecurity: Four in 10 adults would be able to cover an unexpected US$400 expense only by borrowing money or sell-ing something.5 (For more about inequality, see Income inequality in the United States).6
4th Quarter 2019
5
6
FIGURE 3
Consumer spending growthHistory Forecast
2012 2013 2014 2015 2016 2017 2018 2019 2020 2021 2022 2023Real consumer spending 1.5 1.5 3.0 3.7 2.7 2.6 3.0 2.6 2.1 2.3 2.1 2.1
Real consumer spending,
durable goods6.0 6.1 7.2 7.5 6.1 6.9 6.3 4.7 3.5 2.5 2.5 2.5
Real consumer spending,
nondurable goods
0.4 1.8 2.6 3.4 2.4 2.5 3.0 3.4 2.4 2.0 1.8 1.8
Real consumer spending,
services1.2 0.6 2.4 3.2 2.3 2.0 2.5 2.0 1.8 2.4 2.2 2.1
Net household wealth (US$ trillions)
48 55 59 60 63 70 68 77 76 79 82 85
Unemployment rate 8.1 7.4 6.2 5.3 4.9 4.4 3.9 3.6 4.0 3.9 4.0 4.0
Consumer price index 2.1 1.5 1.6 0.1 1.3 2.1 2.4 1.7 1.8 1.8 1.9 2.0
Sources: Historical data: US government agencies and Oxford Economics. Forecast: Deloitte, using the Oxford Global Economic Model.
History Forecast
Source: Deloitte analysis.Deloitte Insights | deloitte.com/insights
FIGURE 2
Consumer spending growth Durables Nondurables Services
Percent
-8
-4
0
4
8
12
16
1995 2000 2005 2010 2015 2020
United States Economic Forecast
6

7
Housing
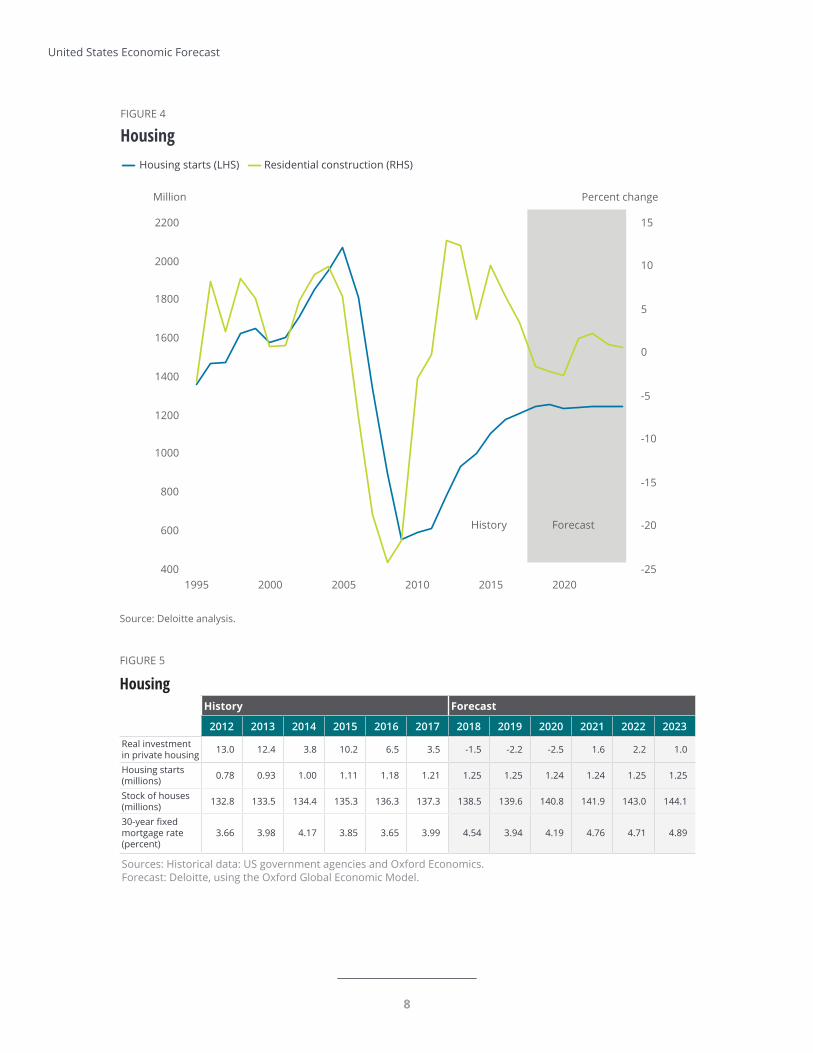
The housing market has stabilized, and is growing modestly. In fact, we might have already seen the best of the recovery from the sector’s destruction in the 2007–09 crash. Housing starts at the current level of around 1.2 to 1.3 million may be able to meet the needs of the population, limiting the upside to the sector. We created a simple model of the market based on demographics and reasonable assumptions about the depreciation of the housing stock,7 and it suggests that housing starts are likely to stay in the 1.1–1.2 million range. In the baseline forecast, the housing sector stagnates as the econ-omy weakens in the next year or two and, then, gradually recovers over the five-year horizon.
Housing remains a smaller share of the economy than it was before the Great Recession, and that’s to be expected. In some ways, it’s a relief to see the sector return to “normalcy.” But with slowing pop-ulation growth, housing simply can’t be a major generator of growth for the US economy in the medium and long run.
Some folks reacted to the slowing housing market with alarm, remembering something about how the last recession was connected to a housing prob-lem.8 It’s certainly not a happy sight, especially for anybody in the home construction business. But a construction decline didn’t cause the last recession: Construction began subtracting from GDP growth in the fourth quarter of 2005, two years before the recession, and GDP growth remained healthy. It was housing finance that ultimately created the cri-sis, not housing itself. Today, housing accounts for just under 4.0 percent of GDP, down from about 6.0 percent in 2005. The sector simply isn’t large enough to cause a recession—unless, once again, huge hidden bets on housing prices come to light.
4th Quarter 2019
8
FIGURE 5
HousingHistory Forecast
2012 2013 2014 2015 2016 2017 2018 2019 2020 2021 2022 2023Real investment in private housing 13.0 12.4 3.8 10.2 6.5 3.5 -1.5 -2.2 -2.5 1.6 2.2 1.0
Housing starts (millions) 0.78 0.93 1.00 1.11 1.18 1.21 1.25 1.25 1.24 1.24 1.25 1.25
Stock of houses (millions) 132.8 133.5 134.4 135.3 136.3 137.3 138.5 139.6 140.8 141.9 143.0 144.1
30-year fixed mortgage rate (percent)
3.66 3.98 4.17 3.85 3.65 3.99 4.54 3.94 4.19 4.76 4.71 4.89
Sources: Historical data: US government agencies and Oxford Economics. Forecast: Deloitte, using the Oxford Global Economic Model.
Source: Deloitte analysis.Deloitte Insights | deloitte.com/insights
FIGURE 4
Housing Housing starts (LHS) Residential construction (RHS)
Million Percent change
-25
-20
-15
-10
-5
0
5
10
15
400
600
800
1000
1200
1400
1600
1800
2000
2200
1995 2000 2005 2010 2015 2020
History Forecast
United States Economic Forecast
8

9
Business investment
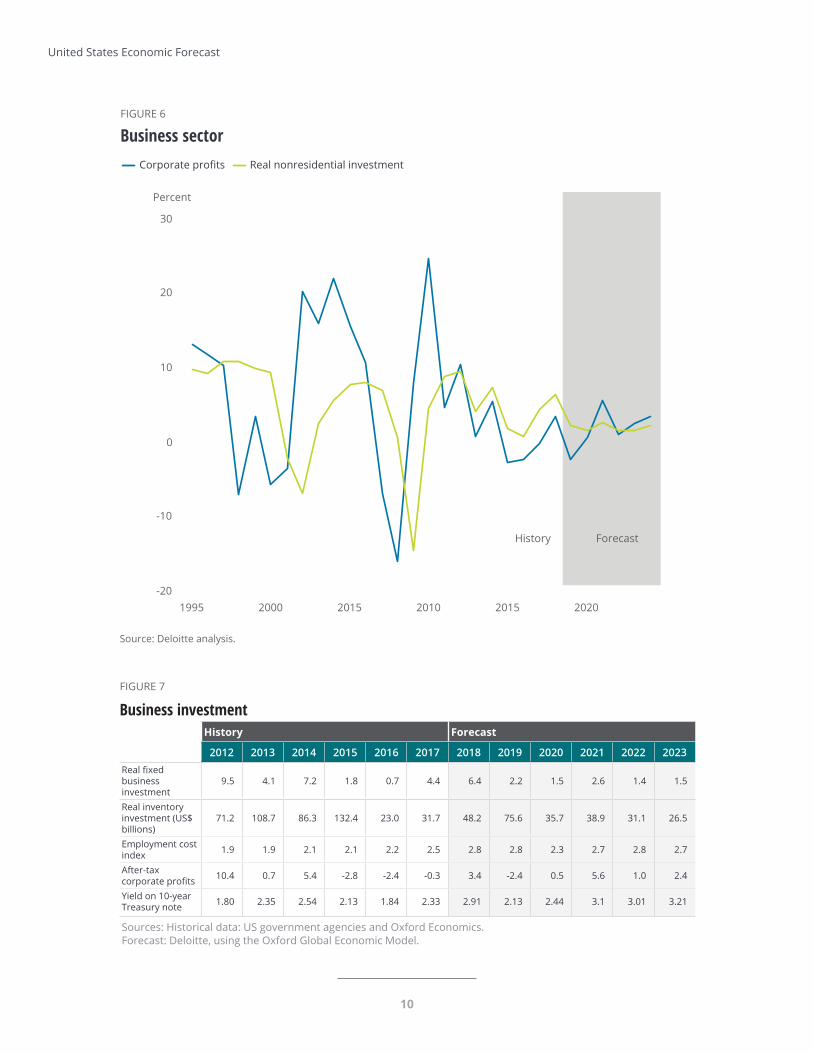
Policy uncertainty is one of the biggest potential roadblocks to strong investment spending.
Businesses were still reckoning with the implica-tions of the tax bill for investment when the US government introduced additional uncertainty with a significant shift in international trade policy.9 And while passage of the Bipartisan Budget Act of 2019 answered some budget questions, plenty of uncertainty remains. On top of everything else, the Fed has executed a 180-degree turn in policy over the past six months, leaving Fed watchers arguing about what might happen next. Many officials cited trade tensions as one of the factors causing Open Market Committee members to change their views about monetary policy.10
Business investment has been slowing in the past few quarters despite a decline in long-term interest rates and the reduced tax rate on corporate profits. In truth, the cost of capital has been at historic lows over the past decade, but many businesses have remained reluctant to take advantage of cheap capital to raise investment. Nothing that has happened in the past few years seems to have sub-stantially altered that problem, and many analysts are skeptical that further rate cuts would spur new investment.
The imposition of tariffs on a wide variety of goods—and foreign retaliation in the form of tariffs on American products—creates even more
uncertainty, particularly for manufacturing firms. Some CEOs face a painful medium-term dilemma: deciding whether their businesses need to rebuild their supply chains. Industries such as automobile production have developed intricate networks across North America and are reaching into Asia and Europe, based on the long-standing assump-tion that materials and parts can be moved across borders with little cost or disruption.
And fiscal policy uncertainty lingers. While the budget bill appeared to take the budget and debt ceiling off the table for two years, Congress failed to pass appropriations bills on time. Complex three-way negotiations between the House, the Senate, and the Trump administration continue while the government operates under a continuing resolution.
The Deloitte economics team remains optimistic about investment in the medium term, since the United States remains a fundamentally good place to do business. But business investment plays a key role in differentiating between Deloitte’s baseline, slow growth, and productivity bonanza scenarios. One marker of the difference between the scenarios is productivity. If it accelerates enough, businesses might be persuaded to up their investment, which happens in the productivity bonanza scenario. But decelerating productivity could leave businesses unwilling to spend more money to put new capital in place, further slowing the economy, as in the slower growth scenario.
4th Quarter 2019
9
10
FIGURE 7
Business investmentHistory Forecast
2012 2013 2014 2015 2016 2017 2018 2019 2020 2021 2022 2023Real fixed business investment
9.5 4.1 7.2 1.8 0.7 4.4 6.4 2.2 1.5 2.6 1.4 1.5
Real inventory investment (US$ billions)
71.2 108.7 86.3 132.4 23.0 31.7 48.2 75.6 35.7 38.9 31.1 26.5
Employment cost index 1.9 1.9 2.1 2.1 2.2 2.5 2.8 2.8 2.3 2.7 2.8 2.7
After-tax corporate profits 10.4 0.7 5.4 -2.8 -2.4 -0.3 3.4 -2.4 0.5 5.6 1.0 2.4
Yield on 10-year Treasury note 1.80 2.35 2.54 2.13 1.84 2.33 2.91 2.13 2.44 3.1 3.01 3.21
Sources: Historical data: US government agencies and Oxford Economics. Forecast: Deloitte, using the Oxford Global Economic Model.
Source: Deloitte analysis.Deloitte Insights | deloitte.com/insights
FIGURE 6
Business sector Corporate profits Real nonresidential investment
Percent
-20
-10
0
10
20
30
1995 2000 2015 2010 2015 2020
History Forecast
United States Economic Forecast

11
Foreign trade
Over the past few decades, business—especially manufacturing—has taken advantage of generally open borders and cheap transportation to cut costs and improve global efficiency. The result is a com-plex matrix of production that makes the traditional measures of imports and exports some-what misleading. For example, in 2017, 37 percent of Mexico’s exports to the United States consisted of intermediate inputs purchased from … the United States.11
Recent events appear to be placing this global man-ufacturing system at risk. The United Kingdom’s increasingly tenuous post-Brexit position in the European manufacturing ecosystem,12 along with ongoing negotiations to replace the North American Free Trade Agreement, may slow the growth of this system or even cause it to unwind.
But the biggest challenge now facing the global trading system is the unpredictable tit-for-tat
explosion of trade restrictions between China and the United States.
The trade war flared up this summer when President Trump announced that the United States would impose a 10 percent tariff on all Chinese goods not already affected by tariffs on September 1. China responded by permitting its currency to depreciate by about 2 percent; the administration countered by officially declaring China to be a “cur-rency manipulator.” By mid-August, the administration had delayed some (but not all) of those tariffs. And in October, the administration delayed the tariffs again, while Chinese and US sources leaked suggestions that a deal was/was not in the cards. That added to stock market volatility and did nothing to reduce the uncertainty around US trade policy.13
A key source of uncertainty lies in the fact that the president’s advisers appear divided about the ulti-mate goal of the tariffs and the trade negotiations. White House trade adviser Peter Navarro argues that the tariffs are necessary to reduce the US trade deficit and to help the United States strengthen domestic industries such as steel production for strategic reasons.14 This suggests that tariffs in
“strategic” industries could be permanent. But Commerce Secretary Wilbur Ross has stated that the goal is to force US trading partners to lower their own barriers to American exports.15 That sug-gests that the administration intends the tariffs to be a temporary measure to be traded for better access to foreign markets.
The apparent lack of clarity in the administration’s stated objectives for tariffs adds to the overall uncertainty about global trade policy. Uncertainty about border-crossing costs may be limiting busi-ness investment spending. Businesses may be reluctant to invest when facing the possibility of a sudden shift in costs. Deloitte’s baseline scenario assumes that the impact is large enough to affect overall business investment in 2020, and the slow
4th Quarter 2019

12
scenario assumes a wider trade war and a larger impact on investment.
The challenge that many companies face is that a significant change in border-crossing costs could potentially reduce the value of capital investment put in place to take advantage of global goods flows. Essentially, the global capital stock could depreci-ate more quickly than our normal measures would suggest. In practical terms, some US plants and equipment could go idle without the ability to access foreign intermediate products at previously planned prices.
With this loss of productive capacity would come the need to replace it with plants and equipment that would be profitable at the higher border cost. We might expect gross investment to increase once the outline of a new global trading system becomes apparent.
In the longer term, a more protectionist environ-ment is likely to raise costs. That’s a simple conclusion to be drawn from the fact that globaliza-tion was largely driven by businesses trying to cut costs. How those extra costs are distributed depends a great deal on economic policy—for example, central banks can attempt to fight the impact of lower globalization on prices (with a resulting period of high unemployment) or to accommodate it (allowing inflation to pick up).
Whatever happens, the tariffs are unlikely to have a direct impact on the US current account, except perhaps in the very short run. The current account is determined by global financial flows, not trade costs.16 Any potential reduction in the current account deficit is likely to be largely offset by a reduction in American competitiveness through higher costs in the United States, lower costs abroad, and a higher dollar. All four scenarios of our forecast assume that the direct impact of trade policy on the current account deficit is small. In fact, despite the impact of a wide variety of tariffs
on American imports over the past two years, the US trade deficit has increased substantially, from a seasonally adjusted monthly rate of around US$46 billion in January 2017 to US$52 billion in September 2019. The evidence is clear that the tar-iffs have not reduced the country’s trade deficit.
Adding to the problems in the trade sector, growth in Europe and China has clearly slowed. These are two of the three regions that drive the global econ-omy (the third is the United States). Slow growth abroad is very likely to translate into slower growth in US exports and perhaps a higher dollar, further slowing export growth. That’s an important con-tributor to downside risk for the American economy.
Brexit is an immediate issue in the short run, although it does not affect the medium- or long-term US outlook that much. A hard Brexit is unlikely to significantly affect US sales abroad directly. But it could help soften overall European economic growth even further, providing yet another headwind for American exporters.
United States Economic Forecast
12

13
Source: Deloitte analysis.Deloitte Insights | deloitte.com/insights
FIGURE 8
Foreign trade Merchandise trade balance (RHS) Exports (LHS) Imports (LHS)
Percent US$ billion
-1300
-1100
-900
-700
-500
-300
-100
-20
-16
-12
-8
-4
0
4
8
12
16
20
24
1995 2000 2005 2010 2015 2020
History Forecast
FIGURE 9
Foreign tradeHistory Forecast
2012 2013 2014 2015 2016 2017 2018 2019 2020 2021 2022 2023Real exports of goods and services
3.4 3.6 4.2 0.5 0.0 3.5 3.0 -0.1 1.0 2.0 2.4 2.7
Real imports of goods and services
2.7 1.5 5.0 5.3 2.0 4.7 4.4 1.3 0.7 2.3 2.3 2.2
Current account balance (share of GDP)
-2.6 -2.1 -2.1 -2.2 -2.3 -2.3 -2.4 -2.5 -2.5 -2.5 -2.7 -2.8
Merchandise trade balance (US$ billions)
-730 -690 -727 -737 -735 -797 -878 -865 -897 -928 -974 -1014
Relative unit labor costs (index, 2008=100)
88.0 85.7 88.9 99.6 101.7 101.7 99.7 104.1 103.6 100.5 97.8 95.4
Sources: Historical data: US government agencies and Oxford Economics. Forecast: Deloitte, using the Oxford Global Economic Model.
4th Quarter 2019
13
14
Government
In July, Congress passed, and the president signed, a two-year budget agreement. What’s included: a removal of the debt ceiling (for two years) and total budget amounts for defense and nondefense dis-cretionary spending. What’s not included: all the detailed and specific spending amounts that go into the appropriations bills. At the time, it seemed like a relief—budget problems were over for the time being. However, Congress and the president have not yet agreed on detailed appropriations bills. The administration’s desire for public funding for the border wall seems to be a big sticking point. However, nobody wants a government shutdown again, and everyone has agreed to a continuing res-olution (and perhaps more than one) to avoid a shutdown. It’s certainly possible that the govern-ment could operate under a continuing resolution for the rest of the year.
High government spending doesn’t help the long-term budget outlook, but it does prevent the spending cliff that would have occurred had the budget caps gone back into place. That means that government spending won’t fall, even if it won’t continue to contribute to growth. As a result, we’ve raised our outlook for GDP in 2020 substantially from earlier this year, although it remains rela-tively low due to the trade dispute with China.
On top of this, the demand-side impact of the 2017 tax cut has long passed. What’s left is not much: The reduction in tax rates simply does not seem to have translated into a significant increase in busi-ness investment. Or perhaps the impact of other issues, such as the trade war, has overwhelmed any positive impact of the tax bill. The Congressional Research Service has concluded in a preliminary analysis that “the growth patterns for different types of assets do not appear to be consistent with the direction and size of the supply-side incentive
effects one would expect from the tax changes. This potential outcome may raise questions about how much longer-run growth will result from the tax revision.”17
In any event, investment spending has been slow-ing. We expect this to continue for at least a few quarters because of the uncertainty around trade policy. But the tax cut does have an impact on gov-ernment finances. In our baseline, the deficit rises from 4.6 percent in FY 2019 to 5.6 percent in FY 2024 despite growth at or near potential. At some point in the future, this will become unsustainable. But with Treasury rates at near record lows, the federal deficit presents a relatively small risk over our five-year forecast horizon.
After years of belt-tightening, many state and local governments are no longer actively cutting spend-ing. However, many state budgets remain constrained by questions around the effects of new federal tax policy18 and the need to meet large unfunded pension obligations,19 so state and local spending growth will likely remain low over this forecast’s five-year horizon.
However, last year’s public teacher protests in sev-eral states may be having an impact on education spending. The growth of local government employ-ment in education has accelerated recently, reaching 1.0 percent in the year ending in October (up from an average of 0.5 percent in 2018). Compensation has also been accelerating a bit. Compensation for local government employees in elementary and secondary schools was up 3.0 percent from the previous year in 2019 Q2, slightly faster than for all civilian workers. With education costs accounting for about a third of all state and local spending, a significant upturn in this category could create some additional stimu-lus—and could require an increase in state and local taxes.
United States Economic Forecast
14

15
FIGURE 10
Government sector State and local All government Federal
Source: Deloitte Analytics.
Deloitte Insights | deloitte.com/insights
–8
–6
–4
–2
0
2
4
6
8
1995 2000 2005 2010 2015 2020
Percent
History Forecast
FIGURE 11
Government sectorHistory Forecast
2012 2013 2014 2015 2016 2017 2018 2019 2020 2021 2022 2023Real government consumption and investment
-2.1 -2.4 -0.9 1.9 1.8 0.7 1.7 2.3 1.3 0.4 0.4 0.4
Real federal government consumption and investment
-1.9 -5.5 -2.6 -0.1 0.4 0.8 2.9 3.4 2.2 -0.4 -0.4 -0.4
Real state and local government consumption and investment
-2.2 -0.3 0.2 3.2 2.6 0.6 1.0 1.6 0.8 0.8 0.8 0.8
Federal budget balance, unified basis (share of GDP)
-7.3 -4.3 -2.9 -2.6 -2.9 -3.5 -3.9 -4.4 -5.0 -5.1 -5.3 -5.5
Sources: Historical data: US government agencies and Oxford Economics. Forecast: Deloitte, using the Oxford Global Economic Model.
4th Quarter 2019
15

16
Labor markets
If the American economy is to effectively produce more goods and services, it will need more workers. Some potential employees remain out of the labor force, having left in 2009, when the labor market was challenging. Some are returning: The labor force participation rate for 24–54-year-old workers began rising in the middle of 2015, and it remains below the peak of over 84 percent reached in the late 1990s. This suggests that there may be a con-siderable number of workers who can be enticed back into the labor market as conditions improve. Our baseline forecast reflects that possibility.
Meanwhile, the labor force participation rate for over-65s is rising. At almost 20 percent, it’s much higher than the historical average—and it is cer-tainly possible that, with better labor market conditions, employers can entice even more over-65s back into the labor force.
But a great many people are still on the sidelines and have been out of steady employment for years—long enough that their basic work skills may be eroding. Are those people still employable? So far, the answer has been “yes,” as job growth continues to be strong without pushing up wages. Deloitte’s forecast team remains optimistic that improve-ments in the labor market will prove increasingly attractive to potential workers, and labor force par-ticipation is likely to continue to improve accordingly. However, we are now close enough to full employment that average monthly job growth is likely to drop from the current 200,000 per month to about 100,000 per month in the next two years, even if the economy remains healthy.
In the longer run, demographics are slowing the growth of the population in prime labor force age. As boomers age, lagging demographic growth will help slow the economy’s potential growth. That’s why we foresee trend GDP growth below 2.0 percent by 2021: Even with an optimistic out-look on productivity, we expect that slow labor
force growth will eventually be felt in lower eco-nomic growth.
Immigration reform might have a marginal impact on the labor force. According to the Pew Research Center, undocumented immigrants make up about 4.8 percent of the total American labor force.20 Immigration reform that restricts immigration and/or increases the removal of undocumented workers might create labor shortages in certain industries, such as agriculture, in which (according to Pew) a quarter of workers are unauthorized, and construction, in which an estimated 15 percent of workers are unauthorized. But it would likely have little significant impact at the aggregate level.
United States Economic Forecast
16

17
FIGURE 12
Labor market Average monthly job gain (RHS) Unemployment rate (LHS)
Source: Deloitte Analytics.
Deloitte Insights | deloitte.com/insights
–500
–400
–300
–200
–100
0
100
200
300
3
4
5
6
7
8
9
10
11
1995 2000 2005 2010 2015 2020
ThousandsPercent
History Forecast
FIGURE 13
Labor marketsHistory Forecast
2012 2013 2014 2015 2016 2017 2018 2019 2020 2021 2022 2023Average monthly change in employment (thousands)
186 183 214 240 210 189 204 199 128 29 40 58
Unemployment rate (percent) 8.1 7.4 6.2 5.3 4.9 4.4 3.9 3.6 4.0 3.9 4.0 4.0
Employment-to-population ratio (percent)
45.37 45.52 45.93 46.38 46.86 47.1 47.5 47.71 47.85 47.68 47.52 47.42
Employment cost index 1.9 1.9 2.1 2.1 2.2 2.5 2.8 2.8 2.3 2.7 2.8 2.7
Sources: Historical data: US government agencies and Oxford Economics. Forecast: Deloitte, using the Oxford Global Economic Model.
4th Quarter 2019

18
Financial markets
Interest rates are among the most difficult eco-nomic variables to forecast because interest rates depend on news—and if we knew it ahead of time, it wouldn’t be news. The Deloitte interest rate fore-cast is designed to show a path for rates consistent with the forecast for the real economy. But the potential risk for different interest rate movements is higher here than in other parts of our forecast.
Short-term interest rates are driven by Fed policy, and the Fed has changed direction remarkably quickly. As late as March, the median FOMC mem-ber’s projection of the funds rate called for an increase in 2020 to 2.6 percent. By end of October, the Fed had cut rates three times (to a target range of (1.50–1.75 percent). Fed chairman Jerome Powell described this policy change as a “mid-course correction” and has indicated that a key reason for the Fed’s change is “trade policy uncer-tainty.”21 Fed officials then went on a campaign in early November to convince markets that the cen-tral bank would hold rates steady at this lower rate until news about the economy gave them reason to cut further.
Long-term interest rates have begun to rise from the low of 1.47 percent (for the 10-year Treasury note) on September 3. By November, rates were up to about 1.8 percent. That’s still very low, however, reflecting a long-term decline in global interest
rates.22 The larger problem is the overall low level of long-term interest rates. The decline in interest rates is global, with a substantial number of coun-tries—including economic powerhouses such as Germany and Japan—paying negative interest rates. In fact, about US$17 trillion in government debt now trades at negative rates.23
This has made a standard way of thinking about “normal” interest rates obsolete. It used to be a kind of rule of thumb that, in the medium term, a full employment economy would see a spread of about 200 basis points between the short- and long-term rates. Previous Deloitte forecasts24 assumed that the Fed would raise short-term rates to the 2.5 percent or even 3.0 percent level, above the tar-geted 2 percent rate of inflation. That argued for the key long-term rate in the forecast—the 10-year Treasury note yield—to move to 4.5 or 5.0 percent. This is becoming very unlikely over the next few years.
The current baseline assume that long-term US interest rates settle in at an equilibrium rate of around 3.0 percent during the five-year forecast horizon. This is lower than we previously forecast, and lower than historical experience would suggest. However, it’s hard to argue with the current state of financial markets, falling long-term interest rates, and (at such low rates) low demand for funds to finance investment projects over the past sev-eral years.
United States Economic Forecast

19
FIGURE 14
Financial markets 10–year Treasury yield Federal funds rate
Source: Deloitte Analytics.
Deloitte Insights | deloitte.com/insights
0
1
2
3
4
5
6
7
8
1995 2000 2005 2010 2015 2020
Percent
History Forecast
FIGURE 15
Financial marketsHistory Forecast
2012 2013 2014 2015 2016 2017 2018 2019 2020 2021 2022 2023
Federal funds rate 0.13 0.13 0.13 0.14 0.39 0.97 1.78 2.16 1.63 1.63 1.62 1.62
Yield on 10-year Treasury bill 1.80 2.35 2.54 2.14 1.84 2.33 2.91 2.13 2.45 3.10 3.02 3.22
Interest rate on 30-year fixed-rate mortgage
3.66 3.98 4.17 3.85 3.65 3.99 4.54 3.94 4.19 4.76 4.71 4.89
Net household wealth (US$ trillions)
47.6 54.5 58.5 59.5 63.2 69.6 68.4 77.3 76.3 78.8 81.8 84.6
Sources: Historical data: US government agencies and Oxford Economics. Forecast: Deloitte, using the Oxford Global Economic Model.
4th Quarter 2019

20
Prices
It’s been a long time since inflation has posed a problem for American policymakers. Could price instability break out as the economy reaches full employment? Many economists are increasingly wondering about this, as it becomes ever more evi-dent that something is amiss in the standard inflation models. These models posit that, since labor accounts for about 70 percent of business costs, tight labor markets driving higher wages would be the main cause of accelerating inflation. The US unemployment rate has been below 4.0 percent for over a year. Unit labor costs have been accelerating, but at 3.0 percent, they are still growing at a moderate pace.
But it’s also quite possible that the economy simply hasn’t hit full employment. Despite the low unem-ployment rate, the labor force participation rate for prime-age workers remains about two points below the rate before the financial crisis. Two percent of the prime working-age population suggests that about 4 million more people could be enticed into the labor force under the right conditions. Whether those people are available is unclear, and many
economists are debating the issue.25 The combina-tion of low labor-cost growth and continued high employment growth suggests that people are likely being enticed back into the labor market.
At some point, however, economic growth and the robust labor market could push the economy into a real labor shortage. And tariffs are something of a wild card. Although most of the tariffs have been on intermediate products, there is evidence that the additional cost was simply passed through to final consumers.26 The most recent tariff increase included more consumer goods and may be felt directly in the CPI. Interpreting inflation data under those circumstances could be tricky. And if that rise sparks wage hikes to maintain real wages—a possibility at current unemployment rates—inflation could indeed tick up.
A return to 1970s-style inflation is about as likely as polyester leisure suits coming back into style. But it would not be surprising in these circumstances to see the core CPI rise to above 2.5 percent. Even in the faster growth scenario, though, it wouldn’t require a lot of Fed action to keep a lid on prices.
United States Economic Forecast

21
FIGURE 16
Prices CPI Employment cost index
Source: Deloitte Analytics.
Deloitte Insights | deloitte.com/insights
–1
0
1
2
3
4
5
1995 2000 2005 2010 2015 2020
Percent
History Forecast
FIGURE 17
PricesHistory Forecast
2012 2013 2014 2015 2016 2017 2018 2019 2020 2021 2022 2023
Chained GDP price index 1.9 1.8 1.8 1.0 1.0 1.9 2.4 1.8 1.9 1.8 1.9 2.0
Consumer price index 2.1 1.5 1.6 0.1 1.3 2.1 2.4 1.7 1.8 1.8 1.9 2.0
Chained price index for personal consumption expenditures
1.9 1.3 1.5 0.2 1.0 1.8 2.1 1.4 1.7 1.7 1.9 1.9
Employment cost index 1.9 1.9 2.1 2.1 2.2 2.5 2.8 2.8 2.3 2.7 2.8 2.7
Sources: Historical data: US government agencies and Oxford Economics. Forecast: Deloitte, using the Oxford Global Economic Model.
4th Quarter 2019
22
AppendixFIGURE 18
BaselineHistory Forecast
% change, year over year, unless noted otherwise 2013 2014 2015 2016 2017 2018 2019 2020 2021 2022 2023 2024
GDP and componentsReal GDP 1.8 2.5 2.9 1.6 2.4 2.9 2.3 1.6 2.0 1.7 1.7 1.8
Real consumer spending 1.5 3.0 3.7 2.7 2.6 3.0 2.6 2.1 2.3 2.1 2.1 2.1
Real consumer spending, durable goods 6.1 7.2 7.5 6.1 6.9 6.3 4.7 3.5 2.5 2.5 2.5 2.6
Real consumer spending, nondurable goods 1.8 2.6 3.4 2.4 2.5 3.0 3.4 2.4 2.0 1.8 1.8 1.8
Real consumer spending, services 0.6 2.4 3.2 2.3 2.0 2.5 2.0 1.8 2.4 2.2 2.1 2.1
Real investment in private housing 12.4 3.8 10.2 6.5 3.5 -1.5 -2.2 -2.5 1.6 2.2 1.0 0.5
Real fixed business investment 4.1 7.2 1.8 0.7 4.4 6.4 2.2 1.5 2.6 1.4 1.5 2.2
Real inventory accumulation 109 86 132 23 32 48 76 36 39 31 26 28
Real exports of goods and services 3.6 4.2 0.5 -0.0 3.5 3.0 -0.1 1.0 2.0 2.4 2.7 2.8
Real imports of goods and services 1.5 5.0 5.3 2.0 4.7 4.4 1.3 0.7 2.3 2.3 2.2 2.3
Real government consumption and investment -2.4 -0.9 1.9 1.8 0.7 1.7 2.3 1.3 0.4 0.4 0.4 0.4
Real federal government consumption and investment -5.5 -2.6 -0.1 0.4 0.8 2.9 3.4 2.2 -0.4 -0.4 -0.4 -0.3
Real state and local government consumption and investment -0.3 0.2 3.2 2.6 0.6 1.0 1.6 0.8 0.8 0.8 0.8 0.8
PricesConsumer price index 1.5 1.6 0.1 1.3 2.1 2.4 1.7 1.8 1.8 1.9 2.0 2.0
Chained price index for personal consumption expenditures 1.3 1.5 0.2 1.0 1.8 2.1 1.4 1.7 1.7 1.9 1.9 2.0
Chained GDP price index 1.8 1.8 1.0 1.0 1.9 2.4 1.8 1.9 1.8 1.9 2.0 2.0
Employment cost index 1.9 2.1 2.1 2.2 2.5 2.8 2.8 2.3 2.7 2.8 2.7 2.7
Labor marketsAverage monthly change in employment 183 214 240 210 189 204 199 128 29 40 58 60
Unemployment rate (percent) 7.4 6.2 5.3 4.9 4.3 3.9 3.6 4.0 3.9 4.0 4.0 4.0
Employment to population (percent) 58.6 59.0 59.3 59.7 60.1 60.4 60.8 60.9 60.6 60.3 60.1 59.9
Income and wealthReal disposable personal income -1.3 4.1 4.1 1.8 2.9 4.0 3.2 2.0 2.0 1.8 1.9 1.9
Net household wealth (US$ trillions) 83 88 91 97 106 106 117 113 114 117 119 123
Personal saving rate (percent of disposable income) 6.4 7.3 7.6 6.8 7.0 7.7 8.2 8.1 7.7 7.4 7.3 7.2
After-tax corporate profits with corporate profits with inventory valuation and capital consumption adjustments
0.7 5.4 -2.8 -2.4 -0.3 3.4 -2.4 0.5 5.6 1.0 2.4 3.3
HousingHousing starts (thousands) 928 1,000 1,107 1,178 1,209 1,250 1,254 1,237 1,238 1,249 1,249 1,245
Stock of owner-occupied homes (millions) 134 134 135 136 137 138 140 141 142 143 144 145
Interest rate on 30-year fixed-rate mortgages (percent) 3.98 4.17 3.85 3.65 3.99 4.54 3.94 4.19 4.76 4.71 4.89 4.76
Foreign tradeCurrent account balance, share of GDP (percent) -2.1 -2.1 -2.2 -2.3 -2.3 -2.4 -2.5 -2.5 -2.5 -2.7 -2.8 -2.8
Merchandise trade balance (US$ billions) -690 -727 -737 -735 -797 -878 -865 -897 -928 -974 -1,014 -1,056
Relative unit labor costs (index, 2008=100) 85.7 88.9 99.6 101.7 101.7 99.7 104.1 103.6 100.5 97.8 95.4 93.0
FinancialFederal funds rate (percent) 0.13 0.13 0.14 0.39 0.97 1.78 2.16 1.63 1.63 1.63 1.63 1.63
Yield on 10-year Treasury note (percent) 2.35 2.54 2.14 1.84 2.33 2.91 2.13 2.45 3.10 3.02 3.22 3.00
GovernmentFederal budget balance, unified basis (share of GDP, percent) -4.3 -2.9 -2.6 -2.9 -3.5 -3.9 -4.4 -5.0 -5.1 -5.3 -5.5 -5.6
Sources: Historical data: US government agencies and Oxford Economics. Forecast: Deloitte, using the Oxford Global Economic Model.
United States Economic Forecast

23
FIGURE 19
Productivity bonanzaHistory Forecast
% change, year over year, unless noted otherwise 2013 2014 2015 2016 2017 2018 2019 2020 2021 2022 2023 2024
GDP and componentsReal GDP 1.8 2.5 2.9 1.6 2.4 2.9 2.3 2.1 2.6 2.1 2.2 2.4
Real consumer spending 1.5 3.0 3.7 2.7 2.6 3.0 2.5 2.5 2.9 2.6 2.6 2.7
Real consumer spending, durable goods 6.1 7.2 7.5 6.1 6.9 6.3 4.7 3.6 3.2 3.0 3.0 3.4
Real consumer spending, nondurable goods 1.8 2.6 3.4 2.4 2.5 3.0 3.4 2.8 2.5 2.2 2.3 2.3
Real consumer spending, services 0.6 2.4 3.2 2.3 2.0 2.5 2.0 2.2 3.0 2.6 2.6 2.7
Real investment in private housing 12.4 3.8 10.2 6.5 3.5 -1.5 -2.2 1.1 3.3 2.6 1.5 1.1
Real fixed business investment 4.1 7.2 1.8 0.7 4.4 6.4 2.2 2.8 4.2 2.3 2.5 3.2
Real inventory accumulation 109 86 132 23 32 48 76 46 55 43 40 45
Real exports of goods and services 3.6 4.2 0.5 -0.0 3.5 3.0 -0.1 1.1 2.2 2.4 2.6 2.9
Real imports of goods and services 1.5 5.0 5.3 2.0 4.7 4.4 1.3 1.5 3.4 2.8 2.4 2.3
Real government consumption and investment -2.4 -0.9 1.9 1.8 0.7 1.7 2.3 1.3 0.4 0.4 0.4 0.4
Real federal government consumption and investment -5.5 -2.6 -0.1 0.4 0.8 2.9 3.4 2.2 -0.4 -0.4 -0.4 -0.3
Real state and local government consumption and investment -0.3 0.2 3.2 2.6 0.6 1.0 1.6 0.8 0.8 0.8 0.8 0.8
PricesConsumer price index 1.5 1.6 0.1 1.3 2.1 2.4 1.7 1.8 2.0 1.9 1.7 1.9
Chained price index for personal consumption expenditures 1.3 1.5 0.2 1.0 1.8 2.1 1.4 1.7 1.9 1.8 1.7 1.8
Chained GDP price index 1.8 1.8 1.0 1.0 1.9 2.4 1.8 1.9 2.0 1.9 1.7 2.0
Employment cost index 1.9 2.1 2.1 2.2 2.5 2.8 2.8 2.9 3.2 3.1 3.2 3.4
Labor marketsAverage monthly change in employment 183 214 240 210 189 204 199 148 87 71 57 52
Unemployment rate (percent) 7.4 6.2 5.3 4.9 4.3 3.9 3.6 3.6 3.8 4.0 3.9 3.9
Employment to population (percent) 58.6 59.0 59.3 59.7 60.1 60.4 60.8 61.0 61.0 60.8 60.6 60.4
Income and wealthReal disposable personal income -1.3 4.1 4.1 1.8 2.9 4.0 3.2 2.4 2.6 2.3 2.4 2.4
Net household wealth (US$ trillions) 83 88 91 97 106 106 117 115 119 123 127 133
Personal saving rate (percent of disposable income) 6.4 7.3 7.6 6.8 7.0 7.7 8.2 8.0 7.7 7.4 7.3 7.1
After-tax corporate profits with corporate profits with inventory valuation and capital consumption adjustments
0.7 5.4 -2.8 -2.4 -0.3 3.4 -3.4 -1.9 6.0 1.0 2.6 3.6
HousingHousing starts (thousands) 928 1,000 1,107 1,178 1,209 1,250 1,254 1,282 1,305 1,321 1,328 1,331
Stock of owner-occupied homes (millions) 134 134 135 136 137 138 140 141 142 143 144 146
Interest rate on 30-year fixed-rate mortgages (percent) 3.98 4.17 3.85 3.65 3.99 4.54 3.94 4.35 4.87 5.04 5.56 5.45
Foreign tradeCurrent account balance, share of GDP (percent) -2.1 -2.1 -2.2 -2.3 -2.3 -2.4 -2.6 -3.0 -3.1 -3.3 -3.4 -3.4
Merchandise trade balance (US$ billions) -690 -727 -737 -735 -797 -878 -866 -921 -987 -1,047 -1,095 -1,136
Relative unit labor costs (index, 2008=100) 85.7 88.9 99.6 101.7 101.7 99.7 104.1 103.9 101.1 98.9 96.8 94.1
FinancialFederal funds rate (percent) 0.13 0.13 0.14 0.39 0.97 1.78 2.16 1.63 1.63 2.00 2.38 2.38
Yield on 10-year Treasury note (percent) 2.35 2.54 2.14 1.84 2.33 2.91 2.14 2.69 3.35 3.42 3.95 3.74
GovernmentFederal budget balance, unified basis (share of GDP, percent) -4.3 -2.9 -2.6 -2.9 -3.5 -3.9 -4.4 -4.9 -4.9 -5.0 -5.1 -5.2
Sources: Historical data: US government agencies and Oxford Economics. Forecast: Deloitte, using the Oxford Global Economic Model.
4th Quarter 2019

24
FIGURE 20
RecessionHistory Forecast
% change, year over year, unless noted otherwise 2013 2014 2015 2016 2017 2018 2019 2020 2021 2022 2023 2024
GDP and componentsReal GDP 1.8 2.5 2.9 1.6 2.4 2.9 2.3 -0.6 0.9 3.1 1.8 1.7
Real consumer spending 1.5 3.0 3.7 2.7 2.6 3.0 2.6 0.8 0.7 1.7 2.4 2.0
Real consumer spending, durable goods 6.1 7.2 7.5 6.1 6.9 6.3 4.7 1.7 -0.2 2.5 2.5 3.0
Real consumer spending, nondurable goods 1.8 2.6 3.4 2.4 2.5 3.0 3.4 1.3 0.6 1.3 2.1 1.7
Real consumer spending, services 0.6 2.4 3.2 2.3 2.0 2.5 2.0 0.5 0.8 1.7 2.4 2.0
Real investment in private housing 12.4 3.8 10.2 6.5 3.5 -1.5 -2.2 -2.8 -7.3 4.6 3.0 1.6
Real fixed business investment 4.1 7.2 1.8 0.7 4.4 6.4 2.2 -4.0 0.5 8.0 1.9 2.1
Real inventory accumulation 109 86 132 23 32 48 76 -6 -6 55 35 25
Real exports of goods and services 3.6 4.2 0.5 -0.0 3.5 3.0 -0.1 -6.3 -2.8 7.8 5.0 4.8
Real imports of goods and services 1.5 5.0 5.3 2.0 4.7 4.4 1.3 -2.4 -5.8 3.0 5.2 4.6
Real government consumption and investment -2.4 -0.9 1.9 1.8 0.7 1.7 2.3 1.3 0.4 0.4 0.4 0.4
Real federal government consumption and investment -5.5 -2.6 -0.1 0.4 0.8 2.9 3.4 2.2 -0.4 -0.4 -0.4 -0.3
Real state and local government consumption and investment -0.3 0.2 3.2 2.6 0.6 1.0 1.6 0.8 0.8 0.8 0.8 0.8
PricesConsumer price index 1.5 1.6 0.1 1.3 2.1 2.4 1.7 -1.6 2.3 2.3 2.2 2.3
Chained price index for personal consumption expenditures 1.3 1.5 0.2 1.0 1.8 2.1 1.4 -1.6 2.1 2.2 2.2 2.3
Chained GDP price index 1.8 1.8 1.0 1.0 1.9 2.4 1.8 -1.7 2.3 2.9 2.1 2.2
Employment cost index 1.9 2.1 2.1 2.2 2.5 2.8 2.8 1.3 1.0 2.8 2.6 2.2
Labor marketsAverage monthly change in employment 183 214 240 210 189 204 199 46 -104 190 124 60
Unemployment rate (percent) 7.4 6.2 5.3 4.9 4.3 3.9 3.6 4.6 5.6 4.5 4.0 4.0
Employment to population (percent) 58.6 59.0 59.3 59.7 60.1 60.4 60.8 60.5 59.5 60.0 60.1 59.9
Income and wealthReal disposable personal income -1.3 4.1 4.1 1.8 2.9 4.0 3.2 1.0 -2.7 2.2 2.6 2.9
Net household wealth (US$ trillions) 83 88 91 97 106 106 117 78 113 118 112 111
Personal saving rate (percent of disposable income) 6.4 7.3 7.6 6.8 7.0 7.7 8.2 8.2 5.0 5.6 6.0 6.9
After-tax corporate profits with corporate profits with inventory valuation and capital consumption adjustments
0.7 5.4 -2.8 -2.4 -0.3 3.4 -2.4 -8.7 3.9 8.1 4.0 3.3
HousingHousing starts (thousands) 928 1,000 1,107 1,178 1,209 1,250 1,254 1,233 1,127 1,162 1,186 1,195
Stock of owner-occupied homes (millions) 134 134 135 136 137 138 140 141 142 143 144 145
Interest rate on 30-year fixed-rate mortgages (percent) 3.98 4.17 3.85 3.65 3.99 4.54 3.94 4.26 2.70 2.97 4.19 4.73
Foreign tradeCurrent account balance, share of GDP (percent) -2.1 -2.1 -2.2 -2.3 -2.3 -2.4 -2.5 -2.5 -2.2 -2.0 -2.6 -2.6
Merchandise trade balance (US$ billions) -690 -727 -737 -735 -797 -878 -865 -877 -815 -758 -848 -923
Relative unit labor costs (index, 2008=100) 85.7 88.9 99.6 101.7 101.7 99.7 104.1 106.1 102.1 100.1 100.4 99.6
FinancialFederal funds rate (percent) 0.13 0.13 0.14 0.39 0.97 1.78 2.16 0.89 0.16 0.25 1.13 1.63
Yield on 10-year Treasury note (percent) 2.35 2.54 2.14 1.84 2.33 2.91 2.13 1.86 1.68 1.62 2.56 2.96
GovernmentFederal budget balance, unified basis (share of GDP, percent) -4.3 -2.9 -2.6 -2.9 -3.5 -3.9 -4.4 -5.3 -6.3 -6.2 -6.0 -5.9
Sources: Historical data: US government agencies and Oxford Economics. Forecast: Deloitte, using the Oxford Global Economic Model.
United States Economic Forecast
25
FIGURE 21
Slower growthHistory Forecast
% change, year over year, unless noted otherwise 2013 2014 2015 2016 2017 2018 2019 2020 2021 2022 2023 2024
GDP and componentsReal GDP 1.8 2.5 2.9 1.6 2.4 2.9 2.3 1.1 1.4 1.3 1.4 1.4
Real consumer spending 1.5 3.0 3.7 2.7 2.6 3.0 2.6 1.7 1.9 1.8 1.8 1.8
Real consumer spending, durable goods 6.1 7.2 7.5 6.1 6.9 6.3 4.7 3.4 2.4 2.2 2.1 2.1
Real consumer spending, nondurable goods 1.8 2.6 3.4 2.4 2.5 3.0 3.4 2.1 1.5 1.4 1.5 1.5
Real consumer spending, services 0.6 2.4 3.2 2.3 2.0 2.5 2.0 1.4 1.9 1.8 1.8 1.8
Real investment in private housing 12.4 3.8 10.2 6.5 3.5 -1.5 -2.3 -4.3 -0.5 0.5 -0.6 -0.9
Real fixed business investment 4.1 7.2 1.8 0.7 4.4 6.4 2.1 -0.2 0.7 0.1 0.5 1.3
Real inventory accumulation 109 86 132 23 32 48 76 25 23 18 15 16
Real exports of goods and services 3.6 4.2 0.5 -0.0 3.5 3.0 -0.1 1.0 1.8 2.3 2.6 2.8
Real imports of goods and services 1.5 5.0 5.3 2.0 4.7 4.4 1.3 0.1 1.4 1.8 1.8 2.2
Real government consumption and investment -2.4 -0.9 1.9 1.8 0.7 1.7 2.3 1.2 0.3 0.3 0.3 0.3
Real federal government consumption and investment -5.5 -2.6 -0.1 0.4 0.8 2.9 3.4 2.1 -0.5 -0.6 -0.6 -0.5
Real state and local government consumption and investment -0.3 0.2 3.2 2.6 0.6 1.0 1.6 0.8 0.7 0.8 0.7 0.7
PricesConsumer price index 1.5 1.6 0.1 1.3 2.1 2.4 1.7 1.9 2.0 2.0 2.0 2.0
Chained price index for personal consumption expenditures 1.3 1.5 0.2 1.0 1.8 2.1 1.4 1.8 1.9 1.9 2.0 2.0
Chained GDP price index 1.8 1.8 1.0 1.0 1.9 2.4 1.8 2.0 2.0 2.0 2.0 2.0
Employment cost index 1.9 2.1 2.1 2.2 2.5 2.8 2.8 2.1 2.4 2.5 2.5 2.3
Labor marketsAverage monthly change in employment 183 214 240 210 189 204 199 104 -17 8 43 54
Unemployment rate (percent) 7.4 6.2 5.3 4.9 4.3 3.9 3.6 4.0 4.3 4.5 4.5 4.4
Employment to population (percent) 58.6 59.0 59.3 59.7 60.1 60.4 60.8 60.8 60.2 59.8 59.5 59.3
Income and wealthReal disposable personal income -1.3 4.1 4.1 1.8 2.9 4.0 3.2 1.8 1.9 1.8 1.6 1.5
Net household wealth (US$ trillions) 83 88 91 97 106 106 118 113 113 114 116 120
Personal saving rate (percent of disposable income) 6.4 7.3 7.6 6.8 7.0 7.7 8.2 8.2 8.2 8.2 8.1 8.0
After-tax corporate profits with corporate profits with inventory valuation and capital consumption adjustments
0.7 5.4 -2.8 -2.4 -0.3 3.4 -2.5 -2.3 2.3 -1.8 2.3 3.2
HousingHousing starts (thousands) 928 1,000 1,107 1,178 1,209 1,250 1,253 1,213 1,189 1,178 1,161 1,141
Stock of owner-occupied homes (millions) 134 134 135 136 137 138 140 141 142 143 144 145
Interest rate on 30-year fixed-rate mortgages (percent) 3.98 4.17 3.85 3.65 3.99 4.54 3.89 3.86 4.07 4.03 4.19 4.05
Foreign tradeCurrent account balance, share of GDP (percent) -2.1 -2.1 -2.2 -2.3 -2.3 -2.4 -2.5 -2.4 -2.1 -2.2 -2.2 -2.2
Merchandise trade balance (US$ billions) -690 -727 -737 -735 -797 -878 -864 -887 -900 -931 -959 -991
Relative unit labor costs (index, 2008=100) 85.7 88.9 99.6 101.7 101.7 99.7 104.1 103.4 100.8 98.7 96.4 93.9
FinancialFederal funds rate (percent) 0.13 0.13 0.14 0.39 0.97 1.78 2.16 1.25 0.88 0.88 0.88 0.88
Yield on 10-year Treasury note (percent) 2.35 2.54 2.14 1.84 2.33 2.91 2.07 2.10 2.37 2.27 2.46 2.24
GovernmentFederal budget balance, unified basis (share of GDP, percent) -4.3 -2.9 -2.6 -2.9 -3.5 -3.9 -4.4 -5.0 -5.2 -5.4 -5.6 -5.7
Sources: Historical data: US government agencies and Oxford Economics. Forecast: Deloitte, using the Oxford Global Economic Model.
4th Quarter 2019

26
1. Harriet Torry, “WSJ survey: Majority of economists say manufacturing sector in recession,” Wall Street Journal, October 10, 2019.
2. Ibid.
3. Unless otherwise noted, the data is supplied by Haver Analytics, which compiles statistics from the US Bureau of Labor Statistics, the Bureau of Economic Analysis, and other databases.
4. See, for example, US Government Accountability Office, Retirement security: Most households approaching retire-ment have low savings, May 12, 2015; Gaobo Pang and Mark J. Warshawsky, “Retirement savings adequacy of US workers,” SSRN, May 11, 2013.
5. Board of Governors of the Federal Reserve System, Report on the economic well-being of U.S. households in 2017, May 2018.
6. Dr. Daniel Bachman, Income inequality in the United States: What do we know and what does it mean?, Deloitte University Press, July 12, 2017.
7. Lester Gunnion, Housing America: A forecast of housing construction in the United States, Economics Spotlight, Deloitte Insights, February 28, 2019.
8. See, for example, Dave Goodson and Colin Dugas, “U.S. housing: Headlines suggest trouble,” Voya Investment Management, November 6, 2018.
9. Steven J. Davis, “Trump’s trade-policy uncertainty deters investment,” Chicago Booth Review, November 14, 2018.
10. Jerome H. Powell, “Challenges for monetary policy,” Challenges for Monetary Policy symposium, August 23, 2019.
11. Richard Baldwin, “Global supply chains: Why they emerged, why they matter, and where they are going,” CEPR discussion papers, IDEAS/RePEc, 2012; see also Dr. Patricia Buckley, A new view of international trade, Issues by the Numbers, Deloitte University Press, March 18, 2014.
12. See, for example, Deloitte, Impact of Brexit on the manufacturing industry: Managing through uncertainty, August 2017; Maria C. Latorre et al., “Brexit: Everyone loses, but Britain loses the most,” Peterson Institute for Interna-tional Economics working paper, March 2019.
13. For an up-to-date timeline of US trade actions, see Chad P. Bown and Melina Kolb, “Trump’s trade war timeline: An up-to-date guide,” Peterson Institute for International Economics, September 20, 2019.
14. Peter Navarro, “The era of American complacency on trade is over,” New York Times, June 8, 2018.
15. Tae Kim, “Commerce secretary Ross: ‘The ultimate objective of the president is to reduce tariffs’,” CNBC, June 21, 2018.
16. For an explanation, see Dr. Daniel Bachman, Balancing payments: Why it’s harder than you might think to cut the trade deficit, Behind the Numbers, Deloitte Insights, February 28, 2017.
17. Jane G. Gravelle and Donald J. Marples, The economic effects of the 2017 tax revision: Preliminary observations, Congressional Research Service, May 22, 2019.
18. Valerie C. Dickerson, Scott Schiefelbein, and Thomas Cornett, Federal tax reform—Multistate tax considerations and conformity, Deloitte, January 29, 2018.
Endnotes
United States Economic Forecast

27
19. Alicia H. Munnell and Jean-Pierre Aubry, “The funding of state and local pensions, 2015–2020,” Center for Retirement Research at Boston College, June 2016.
20. Jeffrey S. Passel and D’Vera Cohn, “U.S. unauthorized immigrant total dips to lowest level in a decade,” Pew Research Center, November 27, 2018.
21. Powell, “Challenges for monetary policy.”
22. See Akrur Barua, Monetary policy in advanced economies: Low policy rates are here to stay, Deloitte Insights, October 18, 2019; Dr. Daniel Bachman, Falling interest rates: Puzzles keeping economists awake at night, Econom-ics Spotlight, Deloitte Insights, October 29, 2019.
23. Bank for International Settlements, BIS quarterly review, September 2019.
24. Deloitte Insights, US Economic Forecast, accessed December 10, 2019.
25. For example, in: Douglas Webber and Melissa J. Bjelland, “The impact of work-limiting disability on labor force participation,” Health Economics 24, no. 3 (2015), D.A. Webber and M.J. Bjelland estimate that 4.8 million individuals have left the labor force, accounting, therefore, for more than the missing 4 million noted above. On the other hand, Monique Morrissey argues that the impact is considerably smaller. See, Monique Mor-rissey, “Are disability benefits becoming more generous?,” Working Economics Blog, Economic Policy Institute, July 1, 2015.
26. Mary Amiti, Stephen J. Redding, and David Weinstein, “The impact of the 2018 trade war on U.S. prices and welfare,” Centre for Economic Policy Research, discussion paper series, March 2, 2019.
4th Quarter 2019

28
Dr. Daniel Bachman | [email protected]
Dr. Daniel Bachman is a senior manager for US macroeconomics at Deloitte Services LP. He is based in Arlington, Virginia.
Dr. Ira Kalish | [email protected]
Dr. Ira Kalish is chief global economist for Deloitte Touche Tohmatsu Ltd. He is based in Los Angeles.
Dr. Patricia Buckley | [email protected]
Dr. Patricia Buckley is director of economic policy and analysis for Deloitte Services LP. She is based in Arlington, Virginia.
Lester Gunnion | [email protected]
Lester Gunnion is an economist and assistant manager at Deloitte Services LP. He is based in Hyderabad.
About the author
CONTRIBUTORS
United States Economic Forecast

29
Contact usOur insights can help you take advantage of change. If you’re looking for fresh ideas to address your challenges, we should talk.
Global economics team
Dr. Daniel BachmanDeloitte Research | Deloitte Services LP+1 202 220 2053 | [email protected]
Dr. Ira KalishDeloitte Touche Tohmatsu Limited+1 213 688 4765 | [email protected]
Dr. Patricia BuckleyDeloitte Research | Deloitte Services LP+1 517 814 6508 | [email protected]
4th Quarter 2019
29

About Deloitte Insights
Deloitte Insights publishes original articles, reports and periodicals that provide insights for businesses, the public sector and NGOs. Our goal is to draw upon research and experience from throughout our professional services organization, and that of coauthors in academia and business, to advance the conversation on a broad spectrum of topics of interest to executives and government leaders.
Deloitte Insights is an imprint of Deloitte Development LLC.
About this publication
This publication contains general information only, and none of Deloitte Touche Tohmatsu Limited, its member firms, or its and their affiliates are, by means of this publication, rendering accounting, business, financial, investment, legal, tax, or other professional advice or services. This publication is not a substitute for such professional advice or services, nor should it be used as a basis for any decision or action that may affect your finances or your business. Before making any decision or taking any action that may affect your finances or your business, you should consult a qualified professional adviser.
None of Deloitte Touche Tohmatsu Limited, its member firms, or its and their respective affiliates shall be responsible for any loss whatsoever sustained by any person who relies on this publication.
About Deloitte
Deloitte refers to one or more of Deloitte Touche Tohmatsu Limited, a UK private company limited by guarantee (“DTTL”), its network of member firms, and their related entities. DTTL and each of its member firms are legally separate and independent entities. DTTL (also referred to as “Deloitte Global”) does not provide services to clients. In the United States, Deloitte refers to one or more of the US member firms of DTTL, their related entities that operate using the “Deloitte” name in the United States and their respective affiliates. Certain services may not be available to attest clients under the rules and regulations of public accounting. Please see www.deloitte.com/about to learn more about our global network of member firms.
Copyright © 2019 Deloitte Development LLC. All rights reserved. Member of Deloitte Touche Tohmatsu Limited
Deloitte Insights contributorsEditorial: Matthew Budman, Blythe Hurley, Nairita Gangopadhyay, and Rupesh BhatCreative: Sonya Vasilieff, Adamya Manshiva, and Anoop K RPromotion: Ankana ChakrabortyCover artwork: David Vogin
Sign up for Deloitte Insights updates at www.deloitte.com/insights.
Follow @DeloitteInsight