Embed Size (px)
Citation preview
Q1 Q2 Q3 Q4 Q1 Q2 Q2 Q3 Q4 Q1 Q2Personal income (millions of dollars) 1 18,822,070.0 20,329,659.1 19,755,197.1 19,522,861.8 21,849,045.1 20,548,928.3 1,507,589.1 -574,462.0 -232,335.3 2,326,183.3 -1,300,116.8 Nonfarm personal income 2 18,728,976.1 20,249,894.2 19,651,062.0 19,379,639.7 21,740,733.0 20,404,805.8 1,520,918.1 -598,832.2 -271,422.3 2,361,093.3 -1,335,927.1 Farm income 3 93,093.9 79,764.9 104,135.1 143,222.1 108,312.1 144,122.5 -13,329.0 24,370.3 39,087.0 -34,910.0 35,810.3Population (persons) 4 329,269,393 329,430,588 329,646,660 329,933,229 330,092,941 330,290,763 161,195 216,072 286,569 159,712 197,822Per capita personal income (dollars) 5 57,163 61,712 59,928 59,172 66,191 62,215 4,549 -1,784 -756 7,019 -3,976Derivation of personal income Earnings by place of work 6 13,374,109.7 12,481,823.7 13,278,502.1 13,675,464.5 13,784,971.9 14,123,887.1 -892,286.0 796,678.4 396,962.4 109,507.5 338,915.1 Less: Contributions for government social insurance 7 1,469,360.0 1,403,344.0 1,456,032.0 1,498,636.0 1,531,100.0 1,555,772.0 -66,016.0 52,688.0 42,604.0 32,464.0 24,672.0 Employee and self-employed contributions for government social insurance 8 802,968.0 764,892.0 792,836.0 817,148.0 833,622.0 846,377.0 -38,076.0 27,944.0 24,312.0 16,474.0 12,755.0 Employer contributions for government social insurance 9 666,392.0 638,452.0 663,196.0 681,488.0 697,478.0 709,395.0 -27,940.0 24,744.0 18,292.0 15,990.0 11,917.0 Plus: Adjustment for residence 10 3,668.2 3,771.4 3,703.1 3,645.3 3,629.2 3,596.2 103.2 -68.3 -57.7 -16.2 -32.9 Equals: Net earnings by place of residence 11 11,908,418.0 11,082,251.1 11,826,173.1 12,180,473.8 12,257,501.1 12,571,711.3 -826,166.9 743,922.0 354,300.7 77,027.3 314,210.2 Plus: Dividends, interest, and rent 12 3,681,880.0 3,613,732.0 3,559,608.0 3,612,888.0 3,608,940.0 3,648,057.0 -68,148.0 -54,124.0 53,280.0 -3,948.0 39,117.0 Plus: Personal current transfer receipts 13 3,231,772.0 5,633,676.0 4,369,416.0 3,729,500.0 5,982,604.0 4,329,160.0 2,401,904.0 -1,264,260.0 -639,916.0 2,253,104.0 -1,653,444.0 Social Security 14 1,067,884.0 1,074,792.0 1,080,220.0 1,088,816.0 1,106,317.0 1,109,695.0 6,908.0 5,428.0 8,596.0 17,501.0 3,378.0 Medicare 15 808,480.0 821,576.0 825,768.0 820,984.0 814,146.0 815,291.0 13,096.0 4,192.0 -4,784.0 -6,838.0 1,145.0 Of which: Increase in Medicare reimbursement rates1 16 9,628.0 14,416.0 14,308.0 14,200.0 14,100.0 9,628.0 4,788.0 -108.0 -108.0 -100.0 Medicaid 17 606,156.0 654,220.0 690,352.0 678,304.0 695,895.0 735,482.0 48,064.0 36,132.0 -12,048.0 17,591.0 39,587.0 State unemployment insurance 18 39,060.0 1,038,508.0 766,984.0 299,188.0 565,173.0 479,921.0 999,448.0 -271,524.0 -467,796.0 265,985.0 -85,252.0 Of which:2
Extended Unemployment Benefits 19 68.0 3,656.0 12,944.0 25,000.0 5,800.0 68.0 3,588.0 9,288.0 12,056.0 -19,200.0 Pandemic Emergency Unemployment Compensation 20 6,256.0 26,672.0 82,120.0 97,800.0 104,500.0 6,256.0 20,416.0 55,448.0 15,680.0 6,700.0 Pandemic Unemployment Assistance 21 74,368.0 138,272.0 106,840.0 95,300.0 82,100.0 74,368.0 63,904.0 -31,432.0 -11,540.0 -13,200.0 Pandemic Unemployment Compensation Payments 22 698,908.0 413,852.0 14,740.0 286,900.0 237,200.0 698,908.0 -285,056.0 -399,112.0 272,160.0 -49,700.0 All other personal current transfer receipts 23 710,192.0 2,044,580.0 1,006,092.0 842,208.0 2,801,073.0 1,188,771.0 1,334,388.0 -1,038,488.0 -163,884.0 1,958,865.0 -1,612,302.0 Of which: Economic impact payments3 24 1,078,096.0 15,564.0 5,048.0 1,933,700.0 290,100.0 1,078,096.0 -1,062,532.0 -10,516.0 1,928,652.0 -1,643,600.0 Lost wages supplemental payments4 25 0.0 106,208.0 35,852.0 1,600.0 600.0 0.0 106,208.0 -70,356.0 -34,252.0 -1,000.0 Paycheck Protection Program loans to NPISH5 26 57,172.0 81,212.0 24,404.0 10,800.0 24,700.0 57,172.0 24,040.0 -56,808.0 -13,604.0 13,900.0 Provider Relief Fund to NPISH6 27 1,524.0 160,936.0 58,436.0 34,480.0 42,800.0 26,600.0 159,412.0 -102,500.0 -23,956.0 8,320.0 -16,200.0Components of earnings by place of work Wages and salaries 28 9,587,520.0 8,959,480.0 9,391,236.0 9,764,576.0 9,861,341.0 10,060,036.0 -628,040.0 431,756.0 373,340.0 96,765.0 198,695.0 Supplements to wages and salaries 29 2,141,092.0 2,040,188.0 2,118,840.0 2,170,284.0 2,198,756.0 2,218,107.0 -100,904.0 78,652.0 51,444.0 28,472.0 19,351.0 Employer contributions for employee pension and insurance funds 30 1,474,700.0 1,401,736.0 1,455,644.0 1,488,796.0 1,501,278.0 1,508,712.0 -72,964.0 53,908.0 33,152.0 12,482.0 7,434.0 Employer contributions for government social insurance 31 666,392.0 638,452.0 663,196.0 681,488.0 697,478.0 709,395.0 -27,940.0 24,744.0 18,292.0 15,990.0 11,917.0 Proprietors' income 32 1,645,497.7 1,482,155.7 1,768,426.1 1,740,604.5 1,724,874.9 1,845,744.1 -163,342.0 286,270.4 -27,821.6 -15,729.5 120,869.1 Farm proprietors' income 33 67,453.7 54,219.7 78,446.1 117,140.5 81,668.9 117,124.1 -13,234.0 24,226.4 38,694.4 -35,471.5 35,455.1 Of which: Coronavirus Food Assistance Program7 34 16,879.4 18,446.4 46,229.9 914.0 1,764.4 16,879.4 1,567.0 27,783.5 -45,315.9 850.4 Paycheck Protection Program loans to businesses5 35 6,121.5 8,695.6 2,613.1 4,887.7 11,313.0 6,121.5 2,574.2 -6,082.5 2,274.6 6,425.3 Nonfarm proprietors' income 36 1,578,044.0 1,427,936.0 1,689,980.0 1,623,464.0 1,643,206.0 1,728,620.0 -150,108.0 262,044.0 -66,516.0 19,742.0 85,414.0 Of which: Paycheck Protection Program loans to businesses5 37 198,015.0 281,221.0 84,508.0 76,751.0 177,644.0 198,015.0 83,206.0 -196,713.0 -7,757.0 100,893.0
Data on this table will be superseded by updated estimates. Regional estimates were controlled to the annual update to the National accounts released August 26, 2021.
2020 2021
Effects of Selected Federal Pandemic Response Programs on State Personal Income, 2021Q2United States
(Millions of dollars, seasonally adjusted at annual rates)Levels Change from preceding period
Note: BEA state per capita personal income statistics are calculated using unpublished Census Bureau midquarter population estimates. These midquarter estimates are based on the 2010 census. BEA will incorporate Census Bureau population estimates based on the 2020 census results wh
Source. U.S. Bureau of Economic AnalysisLast updated: September 23, 2021.
Line
3. Economic impact payments, initially established by the CARES Act, provide direct payments to individuals. For more information, see How are federal economic impact payments to support individuals during the COVID-19 pandemic recorded in the NIPAs?4. The Federal Emergency Management Agency (FEMA) was authorized to make payments from the Disaster Relief Fund to supplement wages lost as a result of the COVID-19 pandemic.5. The Paycheck Protection Program, initially established by the CARES Act, provides forgivable loans to help small businesses and nonprofit institutions make payroll and cover other expenses. It also provides funding to reimburse private lending institutions for the costs of administering these loans. For more information, see How does the Paycheck Protection Program impact the national income and product accounts (NIPAs)?6. The Department of Health and Human Services distributes money from the Provider Relief Fund to hospitals and health care providers on the front lines of the coronavirus response. This funding supports health care-related expenses or lost revenue attributable to COVID-19 and ensures uninsured Americans can get treatment for COVID-19. In the NIPAs, funds provided to nonprofit hospitals are recorded as social benefits.7. The Coronavirus Food Assistance Program, initially established by the CARES Act, provides direct support to farmers and ranchers where prices and market supply chains have been impacted by the COVID-19 pandemic.
CARES -Coronavirus Aid, Relief, and Economic SecurityNPISH -Nonprofit institutions serving households1. A two percent reduction in reimbursements paid to Medicare service providers that went into effect in 2013 was initially suspended by the CARES Act. The resulting increased reimbursement rates went into effect beginning on May 1, 2020.2. Unemployment insurance benefits were expanded through several programs that were initially established through the CARES Act. For more information, see How will the expansion of unemployment benefits in response to the COVID-19 pandemic be recorded in the NIPAs?
2020 2021

Q1 Q2 Q3 Q4 Q1 Q2 Q2 Q3 Q4 Q1 Q2Personal income (millions of dollars) 1 221,523.4 240,126.6 227,926.7 225,418.5 259,487.6 237,403.1 18,603.2 -12,200.0 -2,508.1 34,069.1 -22,084.6 Nonfarm personal income 2 220,297.6 240,129.8 227,457.5 224,482.4 258,799.4 236,589.2 19,832.1 -12,672.2 -2,975.1 34,316.9 -22,210.2 Farm income 3 1,225.8 -3.2 469.1 936.1 688.2 813.8 -1,228.9 472.3 467.0 -247.9 125.6Population (persons) 4 4,919,385 4,920,954 4,924,127 4,928,670 4,930,141 4,932,200 1,569 3,173 4,543 1,471 2,059Per capita personal income (dollars) 5 45,031 48,797 46,288 45,736 52,633 48,133 3,766 -2,509 -552 6,897 -4,500Derivation of personal income Earnings by place of work 6 146,167.5 135,793.6 145,273.7 148,400.1 148,427.0 152,726.1 -10,373.9 9,480.0 3,126.4 26.9 4,299.1 Less: Contributions for government social insurance 7 17,661.0 16,978.0 17,657.4 18,149.9 18,368.3 18,594.8 -683.0 679.4 492.6 218.4 226.5 Employee and self-employed contributions for government social insurance 8 9,924.7 9,510.3 9,893.3 10,184.0 10,289.5 10,413.0 -414.4 383.0 290.7 105.5 123.5 Employer contributions for government social insurance 9 7,736.3 7,467.6 7,764.0 7,965.9 8,078.8 8,181.8 -268.6 296.4 201.8 112.9 103.0 Plus: Adjustment for residence 10 2,513.5 2,338.7 2,465.1 2,567.0 2,605.2 2,665.0 -174.8 126.4 101.9 38.2 59.8 Equals: Net earnings by place of residence 11 131,020.0 121,154.4 130,081.4 132,817.2 132,663.9 136,796.3 -9,865.6 8,927.1 2,735.8 -153.3 4,132.4 Plus: Dividends, interest, and rent 12 39,445.4 38,728.7 38,198.9 38,578.0 38,562.6 38,884.1 -716.7 -529.8 379.2 -15.4 321.5 Plus: Personal current transfer receipts 13 51,058.0 80,243.6 59,646.3 54,023.3 88,261.1 61,722.7 29,185.5 -20,597.2 -5,623.0 34,237.8 -26,538.4 Social Security 14 19,046.8 19,144.0 19,221.8 19,354.0 19,631.9 19,685.5 97.2 77.8 132.2 277.9 53.6 Medicare 15 13,144.6 13,341.0 13,403.6 13,331.3 13,232.7 13,249.0 196.4 62.6 -72.3 -98.6 16.3 Of which: Increase in Medicare reimbursement rates1 16 156.4 234.1 232.4 230.6 229.0 156.4 77.8 -1.8 -1.8 -1.6 Medicaid 17 5,868.4 6,158.4 6,286.5 6,007.0 6,171.8 6,405.3 290.1 128.1 -279.5 164.8 233.5 State unemployment insurance 18 222.6 8,624.7 4,846.3 1,551.6 3,484.0 2,356.7 8,402.1 -3,778.5 -3,294.7 1,932.3 -1,127.3 Of which:2
Extended Unemployment Benefits 19 0.0 59.7 31.3 0.5 0.1 0.0 59.7 -28.3 -30.8 -0.4 Pandemic Emergency Unemployment Compensation 20 76.9 867.1 486.7 899.5 680.5 76.9 790.3 -380.5 412.8 -219.0 Pandemic Unemployment Assistance 21 193.3 284.0 509.0 287.5 151.0 193.3 90.7 225.0 -221.5 -136.5 Pandemic Unemployment Compensation Payments 22 6,766.7 2,430.0 65.8 1,982.7 1,283.6 6,766.7 -4,336.7 -2,364.2 1,917.0 -699.1 All other personal current transfer receipts 23 12,775.6 32,975.4 15,888.2 13,779.5 45,740.9 20,026.3 20,199.8 -17,087.2 -2,108.7 31,961.4 -25,714.6 Of which: Economic impact payments3 24 16,968.5 244.8 79.4 30,774.3 4,616.9 16,968.5 -16,723.6 -165.4 30,694.9 -26,157.4 Lost wages supplemental payments4 25 0.0 1,091.2 64.4 11.3 6.3 0.0 1,091.2 -1,026.8 -53.1 -4.9 Paycheck Protection Program loans to NPISH5 26 942.8 379.0 113.9 115.4 222.7 942.8 -563.8 -265.1 1.5 107.3 Provider Relief Fund to NPISH6 27 15.8 1,664.6 735.7 155.1 430.9 267.8 1,648.9 -928.9 -580.7 275.9 -163.1Components of earnings by place of work Wages and salaries 28 106,904.9 99,855.7 104,602.7 108,375.2 108,379.5 110,199.9 -7,049.2 4,747.1 3,772.5 4.3 1,820.4 Supplements to wages and salaries 29 24,999.6 23,892.1 24,793.7 25,365.1 25,470.5 25,609.6 -1,107.6 901.7 571.3 105.4 139.1 Employer contributions for employee pension and insurance funds 30 17,263.4 16,424.4 17,029.7 17,399.2 17,391.7 17,427.8 -838.9 605.3 369.5 -7.5 36.1 Employer contributions for government social insurance 31 7,736.3 7,467.6 7,764.0 7,965.9 8,078.8 8,181.8 -268.6 296.4 201.8 112.9 103.0 Proprietors' income 32 14,263.0 12,045.9 15,877.2 14,659.8 14,577.0 16,916.6 -2,217.1 3,831.3 -1,217.4 -82.8 2,339.6 Farm proprietors' income 33 1,115.1 -113.8 357.6 822.8 572.5 696.6 -1,228.9 471.4 465.2 -250.3 124.1 Of which: Coronavirus Food Assistance Program7 34 186.3 139.3 324.8 0.3 14.2 186.3 -47.1 185.5 -324.4 13.9 Paycheck Protection Program loans to businesses5 35 52.6 74.7 22.4 50.7 123.9 52.6 22.1 -52.2 28.3 73.2 Nonfarm proprietors' income 36 13,147.9 12,159.7 15,519.6 13,837.0 14,004.5 16,220.0 -988.2 3,359.9 -1,682.6 167.5 2,215.5 Of which: Paycheck Protection Program loans to businesses5 37 1,986.4 3,569.6 903.6 889.7 3,292.4 1,986.4 1,583.3 -2,666.1 -13.9 2,402.8
Data on this table will be superseded by updated estimates. Regional estimates were controlled to the annual update to the National accounts released August 26, 2021.
2020 2021
Effects of Selected Federal Pandemic Response Programs on State Personal Income, 2021Q2Alabama
(Millions of dollars, seasonally adjusted at annual rates)Levels Change from preceding period
Note: BEA state per capita personal income statistics are calculated using unpublished Census Bureau midquarter population estimates. These midquarter estimates are based on the 2010 census. BEA will incorporate Census Bureau population estimates based on the 2020 census results wh
Source. U.S. Bureau of Economic AnalysisLast updated: September 23, 2021.
Line
3. Economic impact payments, initially established by the CARES Act, provide direct payments to individuals. For more information, see How are federal economic impact payments to support individuals during the COVID-19 pandemic recorded in the NIPAs?4. The Federal Emergency Management Agency (FEMA) was authorized to make payments from the Disaster Relief Fund to supplement wages lost as a result of the COVID-19 pandemic.5. The Paycheck Protection Program, initially established by the CARES Act, provides forgivable loans to help small businesses and nonprofit institutions make payroll and cover other expenses. It also provides funding to reimburse private lending institutions for the costs of administering these loans. For more information, see How does the Paycheck Protection Program impact the national income and product accounts (NIPAs)?6. The Department of Health and Human Services distributes money from the Provider Relief Fund to hospitals and health care providers on the front lines of the coronavirus response. This funding supports health care-related expenses or lost revenue attributable to COVID-19 and ensures uninsured Americans can get treatment for COVID-19. In the NIPAs, funds provided to nonprofit hospitals are recorded as social benefits.7. The Coronavirus Food Assistance Program, initially established by the CARES Act, provides direct support to farmers and ranchers where prices and market supply chains have been impacted by the COVID-19 pandemic.
CARES -Coronavirus Aid, Relief, and Economic SecurityNPISH -Nonprofit institutions serving households1. A two percent reduction in reimbursements paid to Medicare service providers that went into effect in 2013 was initially suspended by the CARES Act. The resulting increased reimbursement rates went into effect beginning on May 1, 2020.2. Unemployment insurance benefits were expanded through several programs that were initially established through the CARES Act. For more information, see How will the expansion of unemployment benefits in response to the COVID-19 pandemic be recorded in the NIPAs?
2020 2021
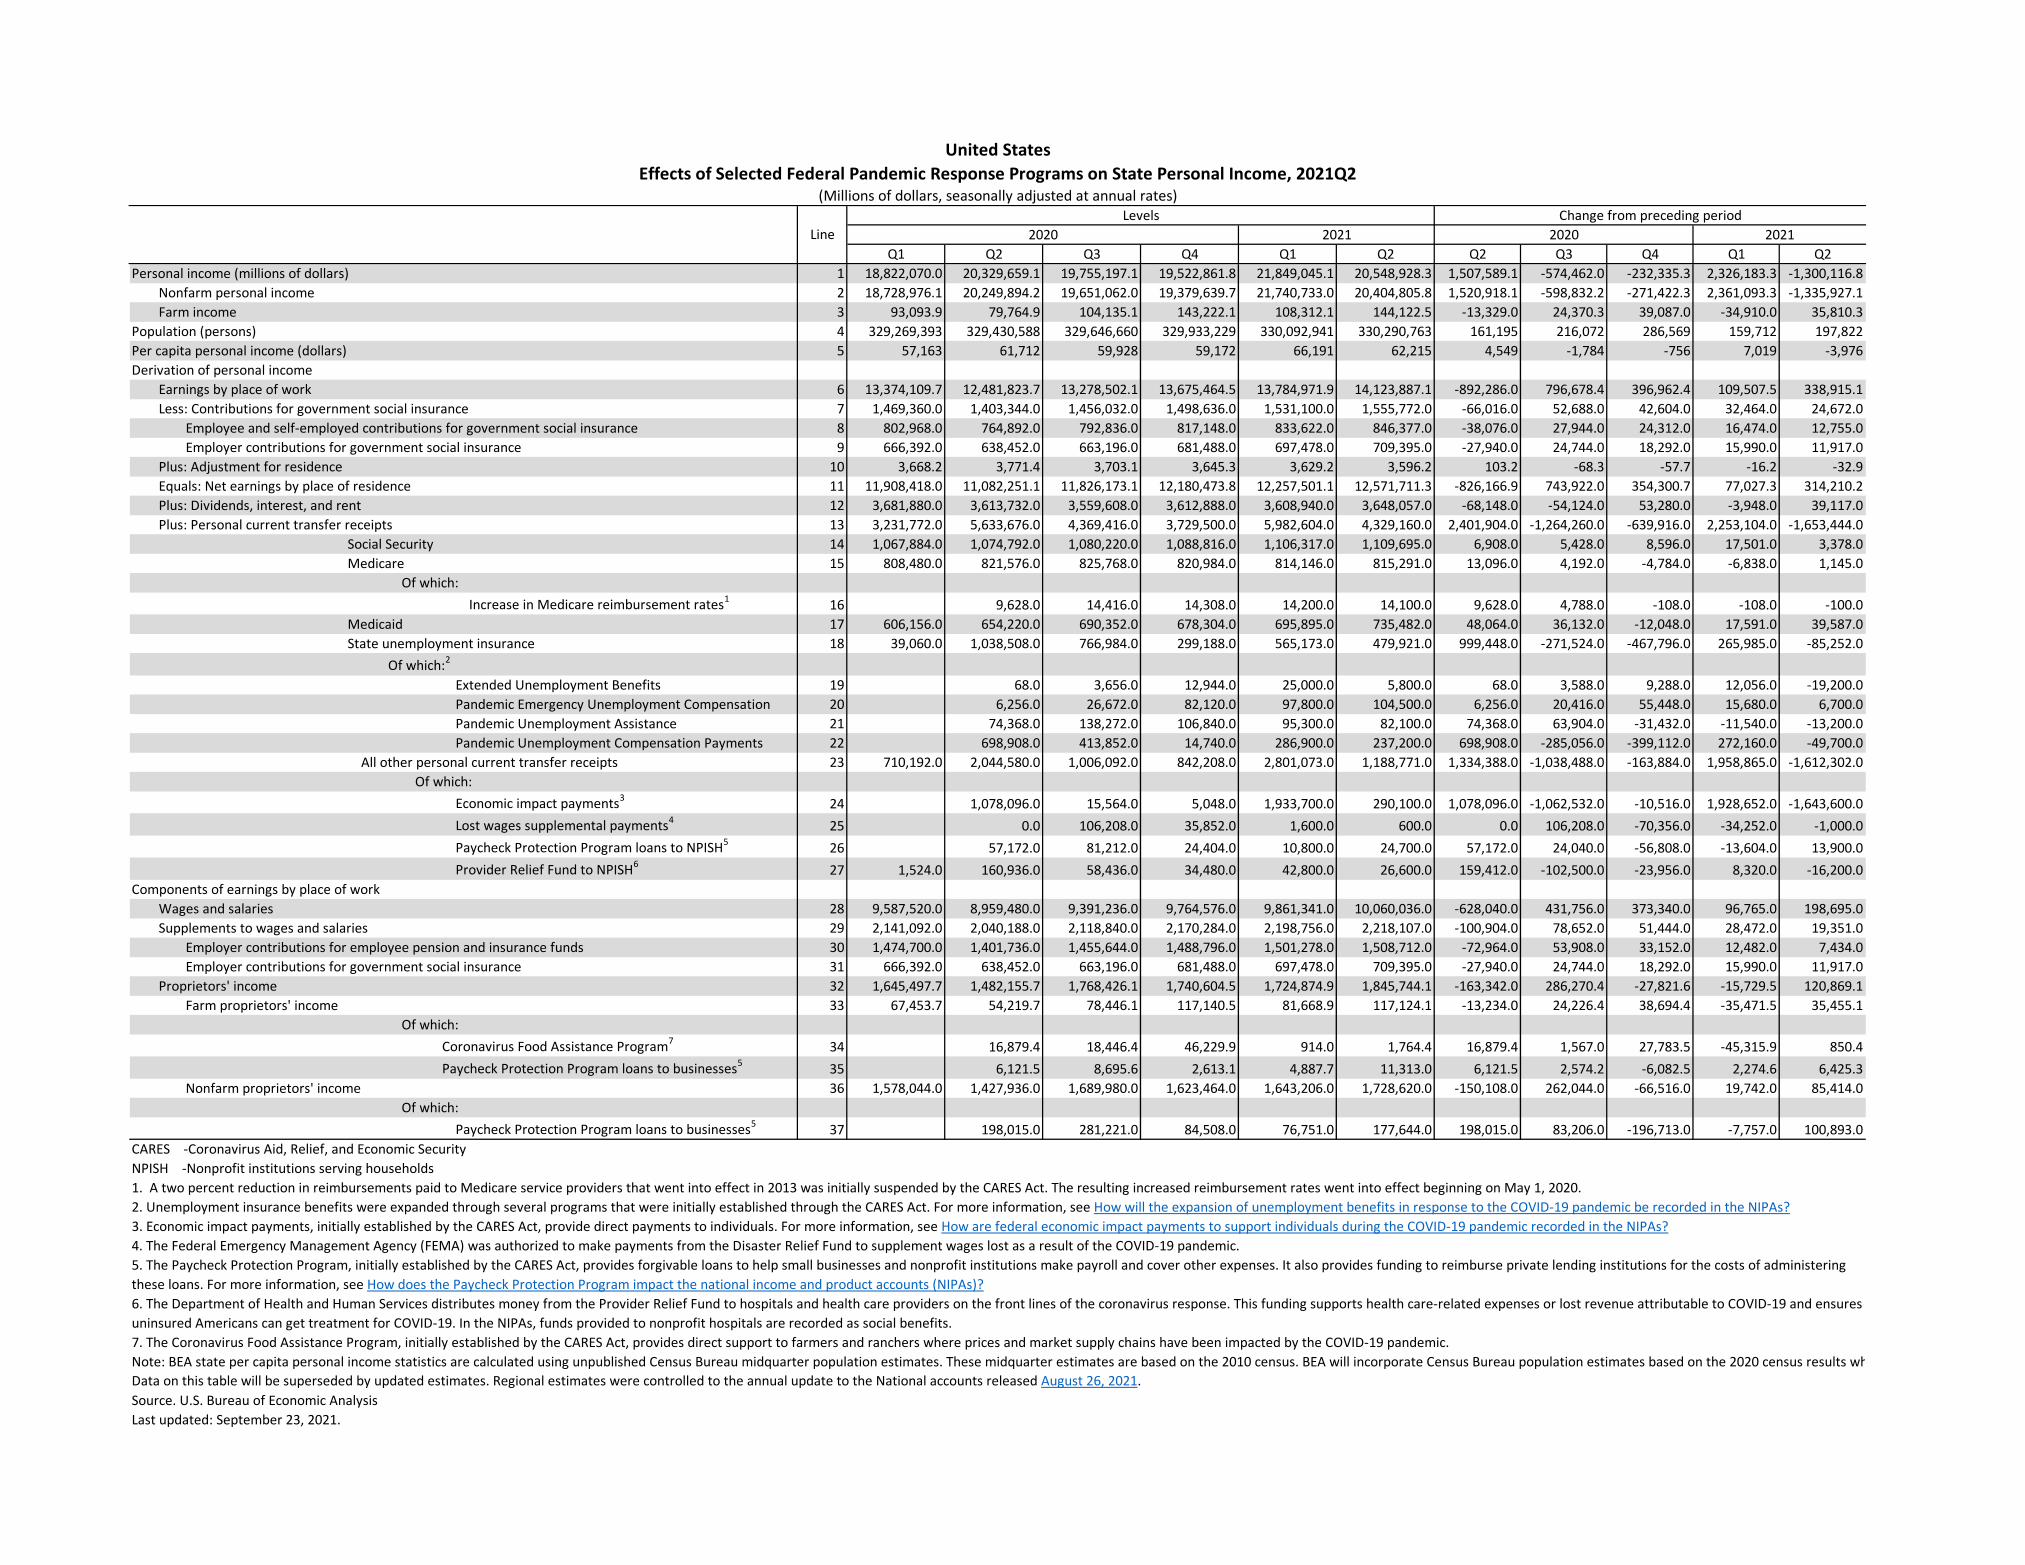
Q1 Q2 Q3 Q4 Q1 Q2 Q2 Q3 Q4 Q1 Q2Personal income (millions of dollars) 1 45,435.5 48,456.2 46,041.0 45,788.5 50,812.8 47,715.2 3,020.7 -2,415.2 -252.5 5,024.3 -3,097.6 Nonfarm personal income 2 45,392.2 48,397.6 45,979.3 45,729.4 50,763.6 47,665.1 3,005.3 -2,418.2 -250.0 5,034.3 -3,098.5 Farm income 3 43.3 58.6 61.6 59.1 49.2 50.1 15.3 3.0 -2.5 -10.0 1.0Population (persons) 4 732,407 731,605 730,832 730,138 729,197 728,469 -802 -773 -694 -941 -728Per capita personal income (dollars) 5 62,036 66,233 62,998 62,712 69,683 65,501 4,197 -3,235 -286 6,971 -4,182Derivation of personal income Earnings by place of work 6 32,807.2 30,700.8 32,181.2 32,799.5 31,922.8 32,273.3 -2,106.4 1,480.4 618.3 -876.7 350.4 Less: Contributions for government social insurance 7 3,310.6 3,143.4 3,239.0 3,301.5 3,247.7 3,297.4 -167.2 95.5 62.5 -53.7 49.6 Employee and self-employed contributions for government social insurance 8 1,722.8 1,625.1 1,669.7 1,701.6 1,667.8 1,692.0 -97.7 44.6 31.9 -33.7 24.1 Employer contributions for government social insurance 9 1,587.8 1,518.3 1,569.3 1,599.9 1,579.9 1,605.4 -69.5 51.0 30.6 -20.0 25.5 Plus: Adjustment for residence 10 -197.7 -184.1 -190.9 -195.1 -186.7 -189.2 13.6 -6.8 -4.2 8.4 -2.5 Equals: Net earnings by place of residence 11 29,298.9 27,373.3 28,751.3 29,303.0 28,488.4 28,786.7 -1,925.6 1,378.0 551.6 -814.6 298.3 Plus: Dividends, interest, and rent 12 8,466.4 8,333.9 8,245.9 8,289.6 8,303.1 8,352.3 -132.5 -88.0 43.7 13.5 49.2 Plus: Personal current transfer receipts 13 7,670.2 12,748.9 9,043.7 8,195.9 14,021.3 10,576.2 5,078.7 -3,705.2 -847.8 5,825.4 -3,445.0 Social Security 14 1,714.3 1,731.1 1,744.0 1,763.1 1,800.8 1,808.0 16.7 12.9 19.1 37.6 7.3 Medicare 15 1,154.8 1,173.3 1,177.4 1,167.0 1,153.1 1,155.5 18.5 4.1 -10.5 -13.9 2.4 Of which: Increase in Medicare reimbursement rates1 16 13.7 20.6 20.4 20.3 20.1 13.7 6.8 -0.2 -0.2 -0.1 Medicaid 17 1,978.5 1,992.1 1,963.7 1,811.3 1,820.2 1,935.5 13.6 -28.4 -152.4 9.0 115.3 State unemployment insurance 18 114.4 1,966.3 1,136.7 366.3 872.9 843.0 1,852.0 -829.6 -770.4 506.5 -29.8 Of which:2
Extended Unemployment Benefits 19 0.3 5.2 20.1 13.9 0.5 0.3 4.9 14.9 -6.2 -13.4 Pandemic Emergency Unemployment Compensation 20 9.6 66.9 118.2 166.3 205.1 9.6 57.3 51.2 48.1 38.8 Pandemic Unemployment Assistance 21 66.0 66.3 51.4 57.9 54.6 66.0 0.3 -14.8 6.5 -3.3 Pandemic Unemployment Compensation Payments 22 1,379.9 615.1 6.2 496.2 457.5 1,379.9 -764.8 -608.9 490.0 -38.7 All other personal current transfer receipts 23 2,708.2 5,886.2 3,021.9 3,088.2 8,374.3 4,834.2 3,178.0 -2,864.3 66.3 5,286.1 -3,540.1 Of which: Economic impact payments3 24 2,438.4 35.2 11.4 4,326.9 649.1 2,438.4 -2,403.2 -23.8 4,315.4 -3,677.7 Lost wages supplemental payments4 25 0.0 0.0 199.6 32.7 3.8 0.0 0.0 199.6 -166.9 -28.9 Paycheck Protection Program loans to NPISH5 26 165.4 148.2 44.5 39.5 128.0 165.4 -17.2 -103.7 -5.0 88.5 Provider Relief Fund to NPISH6 27 4.4 467.5 62.8 75.3 102.2 63.5 463.1 -404.7 12.4 27.0 -38.7Components of earnings by place of work Wages and salaries 28 22,179.2 20,564.4 21,394.5 22,006.5 21,353.4 21,764.7 -1,614.9 830.1 612.0 -653.0 411.2 Supplements to wages and salaries 29 7,362.1 7,050.6 7,281.6 7,380.2 7,181.4 7,209.0 -311.5 231.0 98.7 -198.8 27.6 Employer contributions for employee pension and insurance funds 30 5,774.2 5,532.3 5,712.3 5,780.3 5,601.5 5,603.6 -242.0 180.0 68.1 -178.9 2.1 Employer contributions for government social insurance 31 1,587.8 1,518.3 1,569.3 1,599.9 1,579.9 1,605.4 -69.5 51.0 30.6 -20.0 25.5 Proprietors' income 32 3,265.9 3,085.8 3,505.2 3,412.8 3,388.0 3,299.6 -180.0 419.3 -92.3 -24.8 -88.4 Farm proprietors' income 33 22.1 37.3 40.1 37.2 26.8 27.5 15.3 2.8 -2.9 -10.4 0.7 Of which: Coronavirus Food Assistance Program7 34 0.2 0.3 3.3 0.2 0.3 0.2 0.1 3.1 -3.1 0.0 Paycheck Protection Program loans to businesses5 35 4.0 5.6 1.7 1.3 3.0 4.0 1.7 -3.9 -0.4 1.7 Nonfarm proprietors' income 36 3,243.8 3,048.5 3,465.0 3,375.6 3,361.2 3,272.1 -195.3 416.5 -89.4 -14.4 -89.1 Of which: Paycheck Protection Program loans to businesses5 37 684.6 614.3 287.3 224.2 233.1 684.6 -70.3 -327.1 -63.1 8.9
Data on this table will be superseded by updated estimates. Regional estimates were controlled to the annual update to the National accounts released August 26, 2021.
2020 2021
Effects of Selected Federal Pandemic Response Programs on State Personal Income, 2021Q2Alaska
(Millions of dollars, seasonally adjusted at annual rates)Levels Change from preceding period
Note: BEA state per capita personal income statistics are calculated using unpublished Census Bureau midquarter population estimates. These midquarter estimates are based on the 2010 census. BEA will incorporate Census Bureau population estimates based on the 2020 census results wh
Source. U.S. Bureau of Economic AnalysisLast updated: September 23, 2021.
Line
3. Economic impact payments, initially established by the CARES Act, provide direct payments to individuals. For more information, see How are federal economic impact payments to support individuals during the COVID-19 pandemic recorded in the NIPAs?4. The Federal Emergency Management Agency (FEMA) was authorized to make payments from the Disaster Relief Fund to supplement wages lost as a result of the COVID-19 pandemic.5. The Paycheck Protection Program, initially established by the CARES Act, provides forgivable loans to help small businesses and nonprofit institutions make payroll and cover other expenses. It also provides funding to reimburse private lending institutions for the costs of administering these loans. For more information, see How does the Paycheck Protection Program impact the national income and product accounts (NIPAs)?6. The Department of Health and Human Services distributes money from the Provider Relief Fund to hospitals and health care providers on the front lines of the coronavirus response. This funding supports health care-related expenses or lost revenue attributable to COVID-19 and ensures uninsured Americans can get treatment for COVID-19. In the NIPAs, funds provided to nonprofit hospitals are recorded as social benefits.7. The Coronavirus Food Assistance Program, initially established by the CARES Act, provides direct support to farmers and ranchers where prices and market supply chains have been impacted by the COVID-19 pandemic.
CARES -Coronavirus Aid, Relief, and Economic SecurityNPISH -Nonprofit institutions serving households1. A two percent reduction in reimbursements paid to Medicare service providers that went into effect in 2013 was initially suspended by the CARES Act. The resulting increased reimbursement rates went into effect beginning on May 1, 2020.2. Unemployment insurance benefits were expanded through several programs that were initially established through the CARES Act. For more information, see How will the expansion of unemployment benefits in response to the COVID-19 pandemic be recorded in the NIPAs?
2020 2021

Q1 Q2 Q3 Q4 Q1 Q2 Q2 Q3 Q4 Q1 Q2Personal income (millions of dollars) 1 350,283.0 385,259.1 374,902.4 363,390.1 409,853.9 379,521.8 34,976.1 -10,356.7 -11,512.3 46,463.8 -30,332.1 Nonfarm personal income 2 348,578.1 383,522.3 372,862.6 361,292.7 408,028.6 377,456.9 34,944.3 -10,659.7 -11,569.9 46,735.9 -30,571.7 Farm income 3 1,704.9 1,736.8 2,039.8 2,097.4 1,825.3 2,064.9 31.9 303.0 57.6 -272.1 239.6Population (persons) 4 7,378,105 7,407,412 7,439,087 7,473,388 7,503,701 7,534,248 29,307 31,675 34,301 30,313 30,547Per capita personal income (dollars) 5 47,476 52,010 50,396 48,625 54,620 50,373 4,534 -1,614 -1,771 5,995 -4,247Derivation of personal income Earnings by place of work 6 242,171.3 227,766.7 241,511.4 247,283.8 245,622.4 250,401.4 -14,404.7 13,744.7 5,772.5 -1,661.4 4,779.0 Less: Contributions for government social insurance 7 28,641.5 27,216.7 28,308.2 29,146.6 29,342.4 29,740.7 -1,424.8 1,091.5 838.4 195.8 398.3 Employee and self-employed contributions for government social insurance 8 16,001.1 15,149.9 15,751.7 16,240.2 16,335.2 16,545.1 -851.2 601.8 488.5 95.0 209.9 Employer contributions for government social insurance 9 12,640.4 12,066.8 12,556.5 12,906.4 13,007.2 13,195.7 -573.6 489.7 349.9 100.8 188.5 Plus: Adjustment for residence 10 1,583.6 1,458.1 1,535.5 1,594.4 1,636.6 1,685.0 -125.4 77.4 58.8 42.2 48.4 Equals: Net earnings by place of residence 11 215,113.5 202,008.2 214,738.7 219,731.6 217,916.6 222,345.7 -13,105.3 12,730.5 4,993.0 -1,815.0 4,429.1 Plus: Dividends, interest, and rent 12 65,314.4 64,337.0 63,607.1 64,589.5 64,632.4 65,335.1 -977.3 -729.9 982.4 42.9 702.7 Plus: Personal current transfer receipts 13 69,855.1 118,913.9 96,556.6 79,068.9 127,304.9 91,841.0 49,058.8 -22,357.3 -17,487.7 48,236.0 -35,463.9 Social Security 14 24,407.3 24,633.6 24,808.5 25,065.6 25,570.2 25,667.5 226.3 174.9 257.1 504.5 97.4 Medicare 15 16,767.8 17,094.6 17,205.6 17,099.0 16,927.5 16,956.7 326.8 111.0 -106.7 -171.5 29.2 Of which: Increase in Medicare reimbursement rates1 16 200.3 299.9 297.6 295.4 293.3 200.3 99.6 -2.2 -2.2 -2.1 Medicaid 17 13,372.8 14,578.9 16,010.8 16,367.9 17,210.1 18,550.5 1,206.1 1,431.9 357.1 842.2 1,340.4 State unemployment insurance 18 517.7 20,878.5 17,207.9 4,183.7 7,050.3 6,149.6 20,360.8 -3,670.6 -13,024.2 2,866.6 -900.7 Of which:2
Extended Unemployment Benefits 19 0.0 3.3 63.2 103.0 7.7 0.0 3.3 59.8 39.8 -95.3 Pandemic Emergency Unemployment Compensation 20 9.0 143.3 616.1 941.2 973.4 9.0 134.3 472.8 325.1 32.2 Pandemic Unemployment Assistance 21 2,391.4 3,808.2 2,467.1 1,106.2 1,005.2 2,391.4 1,416.7 -1,341.1 -1,360.9 -100.9 Pandemic Unemployment Compensation Payments 22 15,897.0 11,390.1 129.8 4,180.5 3,515.9 15,897.0 -4,506.8 -11,260.4 4,050.7 -664.6 All other personal current transfer receipts 23 14,789.5 41,728.3 21,323.8 16,352.7 60,546.8 24,516.6 26,938.8 -20,404.5 -4,971.0 44,194.1 -36,030.2 Of which: Economic impact payments3 24 23,663.7 342.3 111.0 43,188.9 6,479.3 23,663.7 -23,321.4 -231.3 43,077.9 -36,709.6 Lost wages supplemental payments4 25 0.0 3,440.5 148.9 36.4 1.7 0.0 3,440.5 -3,291.6 -112.5 -34.7 Paycheck Protection Program loans to NPISH5 26 497.4 1,321.2 397.0 128.5 384.4 497.4 823.8 -924.2 -268.5 255.9 Provider Relief Fund to NPISH6 27 19.4 2,053.2 756.9 252.5 516.5 321.0 2,033.7 -1,296.3 -504.3 264.0 -195.5Components of earnings by place of work Wages and salaries 28 179,796.7 166,918.3 175,496.8 182,503.1 181,696.8 184,910.0 -12,878.4 8,578.5 7,006.2 -806.3 3,213.2 Supplements to wages and salaries 29 38,289.6 36,445.5 37,890.9 38,835.5 38,582.7 38,801.5 -1,844.1 1,445.3 944.6 -252.8 218.7 Employer contributions for employee pension and insurance funds 30 25,649.2 24,378.8 25,334.4 25,929.1 25,575.5 25,605.8 -1,270.5 955.6 594.8 -353.6 30.3 Employer contributions for government social insurance 31 12,640.4 12,066.8 12,556.5 12,906.4 13,007.2 13,195.7 -573.6 489.7 349.9 100.8 188.5 Proprietors' income 32 24,085.0 24,402.8 28,123.7 25,945.3 25,342.9 26,690.0 317.8 3,720.8 -2,178.4 -602.4 1,347.1 Farm proprietors' income 33 1,214.0 1,249.5 1,551.0 1,601.7 1,318.9 1,551.7 35.5 301.4 50.7 -282.8 232.7 Of which: Coronavirus Food Assistance Program7 34 68.6 138.0 238.3 6.9 10.0 68.6 69.4 100.3 -231.5 3.1 Paycheck Protection Program loans to businesses5 35 104.5 148.5 44.6 13.6 32.2 104.5 44.0 -103.8 -31.0 18.6 Nonfarm proprietors' income 36 22,871.0 23,153.3 26,572.7 24,343.6 24,024.0 25,138.3 282.3 3,419.4 -2,229.1 -319.6 1,114.3 Of which: Paycheck Protection Program loans to businesses5 37 4,550.4 5,629.1 1,651.6 1,431.0 2,914.2 4,550.4 1,078.8 -3,977.5 -220.6 1,483.3
Data on this table will be superseded by updated estimates. Regional estimates were controlled to the annual update to the National accounts released August 26, 2021.
2020 2021
Effects of Selected Federal Pandemic Response Programs on State Personal Income, 2021Q2Arizona
(Millions of dollars, seasonally adjusted at annual rates)Levels Change from preceding period
Note: BEA state per capita personal income statistics are calculated using unpublished Census Bureau midquarter population estimates. These midquarter estimates are based on the 2010 census. BEA will incorporate Census Bureau population estimates based on the 2020 census results wh
Source. U.S. Bureau of Economic AnalysisLast updated: September 23, 2021.
Line
3. Economic impact payments, initially established by the CARES Act, provide direct payments to individuals. For more information, see How are federal economic impact payments to support individuals during the COVID-19 pandemic recorded in the NIPAs?4. The Federal Emergency Management Agency (FEMA) was authorized to make payments from the Disaster Relief Fund to supplement wages lost as a result of the COVID-19 pandemic.5. The Paycheck Protection Program, initially established by the CARES Act, provides forgivable loans to help small businesses and nonprofit institutions make payroll and cover other expenses. It also provides funding to reimburse private lending institutions for the costs of administering these loans. For more information, see How does the Paycheck Protection Program impact the national income and product accounts (NIPAs)?6. The Department of Health and Human Services distributes money from the Provider Relief Fund to hospitals and health care providers on the front lines of the coronavirus response. This funding supports health care-related expenses or lost revenue attributable to COVID-19 and ensures uninsured Americans can get treatment for COVID-19. In the NIPAs, funds provided to nonprofit hospitals are recorded as social benefits.7. The Coronavirus Food Assistance Program, initially established by the CARES Act, provides direct support to farmers and ranchers where prices and market supply chains have been impacted by the COVID-19 pandemic.
CARES -Coronavirus Aid, Relief, and Economic SecurityNPISH -Nonprofit institutions serving households1. A two percent reduction in reimbursements paid to Medicare service providers that went into effect in 2013 was initially suspended by the CARES Act. The resulting increased reimbursement rates went into effect beginning on May 1, 2020.2. Unemployment insurance benefits were expanded through several programs that were initially established through the CARES Act. For more information, see How will the expansion of unemployment benefits in response to the COVID-19 pandemic be recorded in the NIPAs?
2020 2021

Q1 Q2 Q3 Q4 Q1 Q2 Q2 Q3 Q4 Q1 Q2Personal income (millions of dollars) 1 138,921.8 150,394.2 141,548.5 141,726.9 162,901.7 149,122.2 11,472.4 -8,845.7 178.4 21,174.8 -13,779.4 Nonfarm personal income 2 137,572.8 150,684.4 141,199.1 140,433.2 161,848.2 147,509.2 13,111.7 -9,485.4 -765.9 21,415.1 -14,339.1 Farm income 3 1,349.0 -290.3 349.5 1,293.7 1,053.4 1,613.1 -1,639.3 639.7 944.2 -240.3 559.7Population (persons) 4 3,028,684 3,029,995 3,032,333 3,035,564 3,036,787 3,038,401 1,311 2,338 3,231 1,223 1,614Per capita personal income (dollars) 5 45,869 49,635 46,680 46,689 53,643 49,079 3,766 -2,955 9 6,954 -4,564Derivation of personal income Earnings by place of work 6 84,549.1 77,891.8 82,493.9 86,347.2 87,067.6 89,262.0 -6,657.3 4,602.1 3,853.3 720.3 2,194.4 Less: Contributions for government social insurance 7 10,679.9 10,262.9 10,719.9 11,035.5 11,321.5 11,422.3 -417.0 456.9 315.6 286.0 100.9 Employee and self-employed contributions for government social insurance 8 6,007.9 5,765.7 6,026.9 6,216.5 6,374.6 6,426.0 -242.2 261.2 189.6 158.1 51.4 Employer contributions for government social insurance 9 4,672.0 4,497.2 4,692.9 4,819.0 4,946.9 4,996.4 -174.8 195.7 126.0 127.9 49.4 Plus: Adjustment for residence 10 -367.9 -345.7 -364.3 -373.7 -384.7 -375.4 22.2 -18.6 -9.4 -11.0 9.3 Equals: Net earnings by place of residence 11 73,501.3 67,283.2 71,409.7 74,938.1 75,361.4 77,464.2 -6,218.2 4,126.6 3,528.4 423.3 2,102.8 Plus: Dividends, interest, and rent 12 33,328.8 32,687.6 32,178.7 32,711.1 32,739.9 33,137.9 -641.3 -508.9 532.4 28.8 397.9 Plus: Personal current transfer receipts 13 32,091.7 50,423.4 37,960.1 34,077.7 54,800.3 38,520.1 18,331.8 -12,463.3 -3,882.5 20,722.7 -16,280.2 Social Security 14 11,170.3 11,224.5 11,267.9 11,341.1 11,494.5 11,524.1 54.2 43.3 73.2 153.4 29.6 Medicare 15 7,429.1 7,538.3 7,573.5 7,534.1 7,480.8 7,489.5 109.2 35.2 -39.4 -53.3 8.8 Of which: Increase in Medicare reimbursement rates1 16 88.4 132.3 131.3 130.3 129.4 88.4 44.0 -1.0 -1.0 -0.9 Medicaid 17 6,510.6 6,628.8 6,829.4 6,643.0 6,725.3 7,081.1 118.2 200.6 -186.4 82.3 355.8 State unemployment insurance 18 176.9 5,119.0 4,027.4 891.4 1,688.0 1,259.8 4,942.1 -1,091.6 -3,136.0 796.7 -428.2 Of which:2
Extended Unemployment Benefits 19 0.0 12.3 17.7 (L) 0.1 0.0 12.3 5.4 (L) (L) Pandemic Emergency Unemployment Compensation 20 40.2 176.0 137.5 214.8 150.3 40.2 135.8 -38.5 77.4 -64.5 Pandemic Unemployment Assistance 21 244.1 616.5 386.1 309.9 245.2 244.1 372.4 -230.5 -76.2 -64.7 Pandemic Unemployment Compensation Payments 22 4,053.9 2,628.8 74.2 975.4 698.2 4,053.9 -1,425.1 -2,554.6 901.2 -277.2 All other personal current transfer receipts 23 6,804.8 19,912.8 8,262.0 7,668.2 27,411.8 11,165.6 13,108.0 -11,650.8 -593.8 19,743.6 -16,246.3 Of which: Economic impact payments3 24 10,597.0 153.0 49.6 19,355.3 2,903.7 10,597.0 -10,444.1 -103.3 19,305.7 -16,451.6 Lost wages supplemental payments4 25 0.0 281.8 200.2 2.3 0.3 0.0 281.8 -81.6 -197.9 -1.9 Paycheck Protection Program loans to NPISH5 26 559.2 518.0 155.7 73.1 153.6 559.2 -41.2 -362.3 -82.5 80.5 Provider Relief Fund to NPISH6 27 15.4 1,629.0 191.6 147.6 332.5 206.6 1,613.5 -1,437.3 -44.0 184.8 -125.8Components of earnings by place of work Wages and salaries 28 63,050.9 58,792.4 61,753.7 64,041.0 64,993.7 65,829.5 -4,258.5 2,961.3 2,287.3 952.7 835.8 Supplements to wages and salaries 29 13,653.7 12,988.7 13,509.7 13,806.0 13,997.2 14,051.8 -665.0 521.0 296.3 191.2 54.6 Employer contributions for employee pension and insurance funds 30 8,981.7 8,491.5 8,816.8 8,987.0 9,050.3 9,055.5 -490.2 325.3 170.2 63.3 5.2 Employer contributions for government social insurance 31 4,672.0 4,497.2 4,692.9 4,819.0 4,946.9 4,996.4 -174.8 195.7 126.0 127.9 49.4 Proprietors' income 32 7,844.5 6,110.7 7,230.5 8,500.2 8,076.7 9,380.6 -1,733.8 1,119.8 1,269.7 -423.5 1,304.0 Farm proprietors' income 33 1,091.2 -547.3 90.9 1,031.2 785.3 1,341.4 -1,638.5 638.2 940.3 -245.9 556.1 Of which: Coronavirus Food Assistance Program7 34 256.5 228.1 633.5 1.2 12.9 256.5 -28.4 405.4 -632.3 11.7 Paycheck Protection Program loans to businesses5 35 63.1 89.7 26.9 84.0 200.0 63.1 26.5 -62.7 57.0 116.1 Nonfarm proprietors' income 36 6,753.3 6,658.0 7,139.5 7,469.0 7,291.4 8,039.3 -95.3 481.6 329.5 -177.6 747.8 Of which: Paycheck Protection Program loans to businesses5 37 1,152.1 847.4 607.4 442.5 1,357.1 1,152.1 -304.6 -240.0 -164.9 914.6
Data on this table will be superseded by updated estimates. Regional estimates were controlled to the annual update to the National accounts released August 26, 2021.
2021 2020 2021
Effects of Selected Federal Pandemic Response Programs on State Personal Income, 2021Q2Arkansas
(Millions of dollars, seasonally adjusted at annual rates)Levels Change from preceding period
NPISH -Nonprofit institutions serving households
Note: BEA state per capita personal income statistics are calculated using unpublished Census Bureau midquarter population estimates. These midquarter estimates are based on the 2010 census. BEA will incorporate Census Bureau population estimates based on the 2020 census results when t
Source. U.S. Bureau of Economic AnalysisLast updated: September 23, 2021.
Line
3. Economic impact payments, initially established by the CARES Act, provide direct payments to individuals. For more information, see How are federal economic impact payments to support individuals during the COVID-19 pandemic recorded in the NIPAs?
4. The Federal Emergency Management Agency (FEMA) was authorized to make payments from the Disaster Relief Fund to supplement wages lost as a result of the COVID-19 pandemic.5. The Paycheck Protection Program, initially established by the CARES Act, provides forgivable loans to help small businesses and nonprofit institutions make payroll and cover other expenses. It also provides funding to reimburse private lending institutions for the costs of administering these loans. For more information, see How does the Paycheck Protection Program impact the national income and product accounts (NIPAs)?6. The Department of Health and Human Services distributes money from the Provider Relief Fund to hospitals and health care providers on the front lines of the coronavirus response. This funding supports health care-related expenses or lost revenue attributable to COVID-19 and ensures 7. The Coronavirus Food Assistance Program, initially established by the CARES Act, provides direct support to farmers and ranchers where prices and market supply chains have been impacted by the COVID-19 pandemic.
CARES -Coronavirus Aid, Relief, and Economic Security
(L) Less than $50,000.1. A two percent reduction in reimbursements paid to Medicare service providers that went into effect in 2013 was initially suspended by the CARES Act. The resulting increased reimbursement rates went into effect beginning on May 1, 2020.2. Unemployment insurance benefits were expanded through several programs that were initially established through the CARES Act. For more information, see How will the expansion of unemployment benefits in response to the COVID-19 pandemic be recorded in the NIPAs?
2020

Q1 Q2 Q3 Q4 Q1 Q2 Q2 Q3 Q4 Q1 Q2Personal income (millions of dollars) 1 2,631,478.1 2,801,274.0 2,851,416.5 2,769,079.4 3,052,950.7 2,919,391.2 169,795.9 50,142.6 -82,337.1 283,871.4 -133,559.5 Nonfarm personal income 2 2,613,740.2 2,782,187.2 2,829,703.6 2,745,390.6 3,032,385.9 2,895,856.8 168,447.0 47,516.4 -84,313.0 286,995.3 -136,529.2 Farm income 3 17,737.8 19,086.8 21,712.9 23,688.8 20,564.8 23,534.5 1,348.9 2,626.1 1,975.8 -3,123.9 2,969.7Population (persons) 4 39,427,174 39,392,248 39,363,261 39,349,300 39,320,927 39,289,961 -34,926 -28,987 -13,961 -28,373 -30,966Per capita personal income (dollars) 5 66,743 71,112 72,439 70,372 77,642 74,304 4,369 1,327 -2,067 7,270 -3,338Derivation of personal income Earnings by place of work 6 1,941,482.0 1,799,991.6 1,926,719.2 1,981,655.6 2,015,755.9 2,066,167.3 -141,490.4 126,727.7 54,936.4 34,100.2 50,411.4 Less: Contributions for government social insurance 7 200,191.2 190,241.7 197,286.9 203,108.1 209,154.4 213,326.3 -9,949.5 7,045.2 5,821.2 6,046.3 4,171.9 Employee and self-employed contributions for government social insurance 8 111,405.9 105,420.4 108,997.9 112,269.3 115,544.5 117,819.1 -5,985.5 3,577.4 3,271.4 3,275.2 2,274.6 Employer contributions for government social insurance 9 88,785.4 84,821.3 88,289.0 90,838.8 93,609.9 95,507.2 -3,964.0 3,467.7 2,549.8 2,771.1 1,897.3 Plus: Adjustment for residence 10 -2,215.6 -2,101.7 -2,215.9 -2,313.6 -2,421.3 -2,493.5 113.9 -114.1 -97.8 -107.7 -72.1 Equals: Net earnings by place of residence 11 1,739,075.1 1,607,648.1 1,727,216.4 1,776,233.9 1,804,180.1 1,850,347.5 -131,427.0 119,568.4 49,017.5 27,946.2 46,167.4 Plus: Dividends, interest, and rent 12 507,537.2 497,872.0 490,318.1 498,318.4 498,099.6 503,961.9 -9,665.3 -7,553.9 8,000.3 -218.8 5,862.3 Plus: Personal current transfer receipts 13 384,865.7 695,753.9 633,882.0 494,527.0 750,671.0 565,081.8 310,888.2 -61,871.9 -139,354.9 256,144.0 -185,589.2 Social Security 14 101,312.8 101,959.5 102,469.4 103,288.5 104,966.8 105,290.8 646.8 509.9 819.1 1,678.4 324.0 Medicare 15 90,510.7 91,992.9 92,470.8 91,936.3 91,165.9 91,295.0 1,482.2 477.9 -534.5 -770.4 129.1 Of which: Increase in Medicare reimbursement rates1 16 1,078.1 1,614.2 1,602.1 1,590.0 1,578.8 1,078.1 536.1 -12.1 -12.1 -11.2 Medicaid 17 90,316.3 99,766.6 109,884.9 110,311.2 114,800.3 122,190.7 9,450.3 10,118.2 426.3 4,489.1 7,390.4 State unemployment insurance 18 6,899.5 165,568.7 193,874.8 66,340.9 109,303.0 95,606.2 158,669.2 28,306.2 -127,534.0 42,962.1 -13,696.8 Of which:2
Extended Unemployment Benefits 19 30.0 733.6 2,638.9 6,549.7 2,206.9 30.0 703.5 1,905.3 3,910.8 -4,342.8 Pandemic Emergency Unemployment Compensation 20 1,239.2 4,328.3 19,127.1 17,051.1 15,996.6 1,239.2 3,089.0 14,798.8 -2,076.0 -1,054.5 Pandemic Unemployment Assistance 21 9,633.9 46,498.9 24,073.0 17,692.2 19,483.9 9,633.9 36,865.0 -22,425.9 -6,380.8 1,791.7 Pandemic Unemployment Compensation Payments 22 107,875.2 104,209.1 3,655.0 55,554.7 47,747.6 107,875.2 -3,666.1 -100,554.1 51,899.7 -7,807.2 All other personal current transfer receipts 23 95,826.5 236,466.2 135,182.0 122,650.2 330,435.0 150,699.1 140,639.7 -101,284.1 -12,531.9 207,784.8 -179,735.8 Of which: Economic impact payments3 24 118,352.2 1,713.6 555.8 215,878.3 32,386.8 118,352.2 -116,638.6 -1,157.8 215,322.5 -183,491.5 Lost wages supplemental payments4 25 0.0 17,077.5 12,647.2 135.2 30.2 0.0 17,077.5 -4,430.3 -12,511.9 -105.1 Paycheck Protection Program loans to NPISH5 26 5,419.4 11,353.9 3,411.8 1,222.8 2,007.0 5,419.4 5,934.4 -7,942.0 -2,189.0 784.2 Provider Relief Fund to NPISH6 27 110.6 11,680.0 4,639.4 5,935.6 3,748.4 2,329.6 11,569.4 -7,040.6 1,296.2 -2,187.2 -1,418.8Components of earnings by place of work Wages and salaries 28 1,394,736.8 1,302,448.9 1,367,948.4 1,424,475.8 1,450,993.6 1,486,631.4 -92,287.9 65,499.5 56,527.4 26,517.8 35,637.9 Supplements to wages and salaries 29 298,346.5 284,159.4 296,086.4 303,196.2 309,922.0 313,237.5 -14,187.1 11,927.0 7,109.8 6,725.9 3,315.4 Employer contributions for employee pension and insurance funds 30 209,561.1 199,338.1 207,797.4 212,357.4 216,312.1 217,730.3 -10,223.0 8,459.3 4,560.0 3,954.7 1,418.2 Employer contributions for government social insurance 31 88,785.4 84,821.3 88,289.0 90,838.8 93,609.9 95,507.2 -3,964.0 3,467.7 2,549.8 2,771.1 1,897.3 Proprietors' income 32 248,398.7 213,383.2 262,684.4 253,983.7 254,840.2 266,298.4 -35,015.4 49,301.2 -8,700.8 856.6 11,458.2 Farm proprietors' income 33 10,473.7 11,810.5 14,370.1 16,221.6 12,936.9 15,807.2 1,336.8 2,559.6 1,851.5 -3,284.7 2,870.3 Of which: Coronavirus Food Assistance Program7 34 807.6 1,460.3 3,871.1 456.5 550.5 807.6 652.7 2,410.9 -3,414.6 94.1 Paycheck Protection Program loans to businesses5 35 1,190.5 1,691.1 508.2 252.4 588.8 1,190.5 500.6 -1,182.9 -255.8 336.4 Nonfarm proprietors' income 36 237,925.0 201,572.8 248,314.4 237,762.1 241,903.3 250,491.2 -36,352.2 46,741.6 -10,552.3 4,141.2 8,587.9 Of which: Paycheck Protection Program loans to businesses5 37 17,557.9 36,411.3 6,939.5 7,560.7 19,695.1 17,557.9 18,853.3 -29,471.7 621.2 12,134.4
Data on this table will be superseded by updated estimates. Regional estimates were controlled to the annual update to the National accounts released August 26, 2021.
2020 2021
Effects of Selected Federal Pandemic Response Programs on State Personal Income, 2021Q2California
(Millions of dollars, seasonally adjusted at annual rates)Levels Change from preceding period
Note: BEA state per capita personal income statistics are calculated using unpublished Census Bureau midquarter population estimates. These midquarter estimates are based on the 2010 census. BEA will incorporate Census Bureau population estimates based on the 2020 census results wh
Source. U.S. Bureau of Economic AnalysisLast updated: September 23, 2021.
Line
3. Economic impact payments, initially established by the CARES Act, provide direct payments to individuals. For more information, see How are federal economic impact payments to support individuals during the COVID-19 pandemic recorded in the NIPAs?4. The Federal Emergency Management Agency (FEMA) was authorized to make payments from the Disaster Relief Fund to supplement wages lost as a result of the COVID-19 pandemic.5. The Paycheck Protection Program, initially established by the CARES Act, provides forgivable loans to help small businesses and nonprofit institutions make payroll and cover other expenses. It also provides funding to reimburse private lending institutions for the costs of administering these loans. For more information, see How does the Paycheck Protection Program impact the national income and product accounts (NIPAs)?6. The Department of Health and Human Services distributes money from the Provider Relief Fund to hospitals and health care providers on the front lines of the coronavirus response. This funding supports health care-related expenses or lost revenue attributable to COVID-19 and ensures uninsured Americans can get treatment for COVID-19. In the NIPAs, funds provided to nonprofit hospitals are recorded as social benefits.7. The Coronavirus Food Assistance Program, initially established by the CARES Act, provides direct support to farmers and ranchers where prices and market supply chains have been impacted by the COVID-19 pandemic.
CARES -Coronavirus Aid, Relief, and Economic SecurityNPISH -Nonprofit institutions serving households1. A two percent reduction in reimbursements paid to Medicare service providers that went into effect in 2013 was initially suspended by the CARES Act. The resulting increased reimbursement rates went into effect beginning on May 1, 2020.2. Unemployment insurance benefits were expanded through several programs that were initially established through the CARES Act. For more information, see How will the expansion of unemployment benefits in response to the COVID-19 pandemic be recorded in the NIPAs?
2020 2021

Q1 Q2 Q3 Q4 Q1 Q2 Q2 Q3 Q4 Q1 Q2Personal income (millions of dollars) 1 360,736.0 381,070.6 368,151.9 371,609.9 410,584.9 390,046.3 20,334.6 -12,918.7 3,458.0 38,975.0 -20,538.6 Nonfarm personal income 2 359,103.1 379,738.9 366,169.4 369,162.2 408,930.8 387,973.4 20,635.9 -13,569.6 2,992.8 39,768.7 -20,957.5 Farm income 3 1,632.9 1,331.7 1,982.6 2,447.8 1,654.0 2,072.9 -301.3 650.9 465.2 -793.7 418.9Population (persons) 4 5,792,330 5,802,805 5,814,775 5,828,171 5,838,464 5,849,598 10,475 11,970 13,396 10,293 11,134Per capita personal income (dollars) 5 62,278 65,670 63,313 63,761 70,324 66,679 3,392 -2,357 448 6,563 -3,645Derivation of personal income Earnings by place of work 6 264,082.2 246,925.1 259,970.3 269,863.8 273,752.7 279,183.8 -17,157.1 13,045.2 9,893.5 3,888.9 5,431.1 Less: Contributions for government social insurance 7 28,301.8 26,860.0 27,844.6 28,675.9 29,432.0 29,908.3 -1,441.9 984.6 831.4 756.1 476.3 Employee and self-employed contributions for government social insurance 8 15,178.7 14,379.4 14,880.5 15,335.6 15,727.6 15,969.3 -799.4 501.2 455.1 392.0 241.7 Employer contributions for government social insurance 9 13,123.1 12,480.6 12,964.1 13,340.3 13,704.4 13,939.0 -642.5 483.5 376.3 364.0 234.6 Plus: Adjustment for residence 10 1,407.4 1,312.4 1,372.7 1,421.0 1,430.5 1,457.6 -94.9 60.2 48.3 9.5 27.1 Equals: Net earnings by place of residence 11 237,187.8 221,377.6 233,498.4 242,608.8 245,751.2 250,733.1 -15,810.2 12,120.8 9,110.4 3,142.4 4,981.9 Plus: Dividends, interest, and rent 12 76,607.0 75,005.5 73,773.4 74,895.3 74,798.9 75,650.7 -1,601.5 -1,232.1 1,121.9 -96.4 851.8 Plus: Personal current transfer receipts 13 46,941.2 84,687.5 60,880.2 54,105.9 90,034.8 63,662.5 37,746.3 -23,807.3 -6,774.3 35,929.0 -26,372.4 Social Security 14 15,572.2 15,704.3 15,807.1 15,963.2 16,274.4 16,334.5 132.1 102.8 156.0 311.2 60.1 Medicare 15 10,683.1 10,872.9 10,932.3 10,860.3 10,753.3 10,771.5 189.8 59.4 -72.1 -107.0 18.2 Of which: Increase in Medicare reimbursement rates1 16 127.4 190.7 189.3 187.8 186.5 127.4 63.3 -1.4 -1.4 -1.3 Medicaid 17 8,839.8 9,430.3 9,987.4 9,644.3 9,816.3 10,639.7 590.5 557.1 -343.1 172.0 823.4 State unemployment insurance 18 703.7 15,588.5 8,865.1 5,116.2 7,690.2 6,988.5 14,884.8 -6,723.3 -3,748.9 2,574.0 -701.8 Of which:2
Extended Unemployment Benefits 19 0.0 1.9 114.3 8.8 30.8 0.0 1.9 112.4 -105.5 21.9 Pandemic Emergency Unemployment Compensation 20 0.0 304.9 1,219.9 1,692.5 1,955.8 0.0 304.9 915.0 472.6 263.3 Pandemic Unemployment Assistance 21 3,767.4 2,551.2 2,042.2 1,144.5 800.3 3,767.4 -1,216.2 -509.0 -897.7 -344.2 Pandemic Unemployment Compensation Payments 22 7,106.5 3,024.9 83.7 3,608.0 3,118.2 7,106.5 -4,081.6 -2,941.1 3,524.3 -489.8 All other personal current transfer receipts 23 11,142.5 33,091.5 15,288.2 12,521.9 45,500.6 18,928.3 21,949.0 -17,803.3 -2,766.3 32,978.7 -26,572.2 Of which: Economic impact payments3 24 18,398.3 265.8 86.2 32,059.7 4,809.7 18,398.3 -18,132.5 -179.6 31,973.5 -27,250.0 Lost wages supplemental payments4 25 0.0 1,352.3 204.7 0.2 0.0 0.0 1,352.3 -1,147.6 -204.4 -0.2 Paycheck Protection Program loans to NPISH5 26 1,250.3 1,217.3 365.8 229.9 508.3 1,250.3 -32.9 -851.5 -135.9 278.4 Provider Relief Fund to NPISH6 27 16.5 1,741.0 947.0 450.9 528.8 328.7 1,724.5 -793.9 -496.2 78.0 -200.2Components of earnings by place of work Wages and salaries 28 190,909.8 177,689.7 186,210.3 193,703.1 196,617.6 200,592.3 -13,220.1 8,520.6 7,492.8 2,914.5 3,974.7 Supplements to wages and salaries 29 37,512.7 35,693.8 37,038.6 38,031.4 38,634.3 38,987.5 -1,819.0 1,344.9 992.8 602.8 353.2 Employer contributions for employee pension and insurance funds 30 24,389.6 23,213.2 24,074.6 24,691.1 24,929.9 25,048.5 -1,176.5 861.4 616.5 238.8 118.6 Employer contributions for government social insurance 31 13,123.1 12,480.6 12,964.1 13,340.3 13,704.4 13,939.0 -642.5 483.5 376.3 364.0 234.6 Proprietors' income 32 35,659.7 33,541.7 36,721.4 38,129.2 38,500.8 39,604.0 -2,118.0 3,179.8 1,407.8 371.6 1,103.2 Farm proprietors' income 33 1,107.1 810.6 1,460.5 1,918.6 1,113.5 1,525.0 -296.5 649.8 458.2 -805.1 411.5 Of which: Coronavirus Food Assistance Program7 34 214.6 389.7 715.6 40.6 28.8 214.6 175.1 325.9 -675.0 -11.8 Paycheck Protection Program loans to businesses5 35 95.5 135.6 40.8 70.4 159.4 95.5 40.1 -94.9 29.6 89.0 Nonfarm proprietors' income 36 34,552.5 32,731.0 35,261.0 36,210.6 37,387.3 38,079.0 -1,821.5 2,529.9 949.6 1,176.7 691.7 Of which: Paycheck Protection Program loans to businesses5 37 5,059.3 3,861.3 1,974.5 1,592.2 1,808.3 5,059.3 -1,198.0 -1,886.8 -382.3 216.1
Data on this table will be superseded by updated estimates. Regional estimates were controlled to the annual update to the National accounts released August 26, 2021.
2020 2021
Effects of Selected Federal Pandemic Response Programs on State Personal Income, 2021Q2Colorado
(Millions of dollars, seasonally adjusted at annual rates)Levels Change from preceding period
Note: BEA state per capita personal income statistics are calculated using unpublished Census Bureau midquarter population estimates. These midquarter estimates are based on the 2010 census. BEA will incorporate Census Bureau population estimates based on the 2020 census results wh
Source. U.S. Bureau of Economic AnalysisLast updated: September 23, 2021.
Line
3. Economic impact payments, initially established by the CARES Act, provide direct payments to individuals. For more information, see How are federal economic impact payments to support individuals during the COVID-19 pandemic recorded in the NIPAs?4. The Federal Emergency Management Agency (FEMA) was authorized to make payments from the Disaster Relief Fund to supplement wages lost as a result of the COVID-19 pandemic.5. The Paycheck Protection Program, initially established by the CARES Act, provides forgivable loans to help small businesses and nonprofit institutions make payroll and cover other expenses. It also provides funding to reimburse private lending institutions for the costs of administering these loans. For more information, see How does the Paycheck Protection Program impact the national income and product accounts (NIPAs)?6. The Department of Health and Human Services distributes money from the Provider Relief Fund to hospitals and health care providers on the front lines of the coronavirus response. This funding supports health care-related expenses or lost revenue attributable to COVID-19 and ensures uninsured Americans can get treatment for COVID-19. In the NIPAs, funds provided to nonprofit hospitals are recorded as social benefits.7. The Coronavirus Food Assistance Program, initially established by the CARES Act, provides direct support to farmers and ranchers where prices and market supply chains have been impacted by the COVID-19 pandemic.
CARES -Coronavirus Aid, Relief, and Economic SecurityNPISH -Nonprofit institutions serving households1. A two percent reduction in reimbursements paid to Medicare service providers that went into effect in 2013 was initially suspended by the CARES Act. The resulting increased reimbursement rates went into effect beginning on May 1, 2020.2. Unemployment insurance benefits were expanded through several programs that were initially established through the CARES Act. For more information, see How will the expansion of unemployment benefits in response to the COVID-19 pandemic be recorded in the NIPAs?
2020 2021

Q1 Q2 Q3 Q4 Q1 Q2 Q2 Q3 Q4 Q1 Q2Personal income (millions of dollars) 1 271,831.6 285,208.4 280,636.9 280,772.6 303,286.2 290,146.7 13,376.8 -4,571.5 135.7 22,513.6 -13,139.5 Nonfarm personal income 2 271,666.3 285,009.1 280,414.8 280,514.5 303,093.5 289,925.3 13,342.8 -4,594.3 99.7 22,578.9 -13,168.1 Farm income 3 165.3 199.3 222.1 258.1 192.7 221.4 34.0 22.8 36.0 -65.4 28.6Population (persons) 4 3,562,853 3,559,122 3,555,590 3,552,301 3,548,297 3,544,930 -3,731 -3,532 -3,289 -4,004 -3,367Per capita personal income (dollars) 5 76,296 80,134 78,928 79,040 85,474 81,848 3,838 -1,206 112 6,434 -3,626Derivation of personal income Earnings by place of work 6 176,812.6 165,341.7 174,775.0 181,059.5 180,347.7 182,639.6 -11,470.9 9,433.3 6,284.5 -711.8 2,291.9 Less: Contributions for government social insurance 7 18,312.9 17,627.5 18,172.4 18,736.4 18,856.0 19,141.1 -685.4 544.9 564.0 119.6 285.1 Employee and self-employed contributions for government social insurance 8 9,959.7 9,579.6 9,848.2 10,163.9 10,192.4 10,338.1 -380.0 268.6 315.7 28.5 145.7 Employer contributions for government social insurance 9 8,353.2 8,047.9 8,324.1 8,572.4 8,663.6 8,803.0 -305.3 276.3 248.3 91.1 139.5 Plus: Adjustment for residence 10 18,739.0 17,688.1 18,458.8 19,174.7 19,720.2 19,956.9 -1,051.0 770.7 715.9 545.5 236.7 Equals: Net earnings by place of residence 11 177,238.7 165,402.3 175,061.4 181,497.8 181,211.9 183,455.4 -11,836.4 9,659.1 6,436.4 -285.9 2,243.5 Plus: Dividends, interest, and rent 12 57,763.7 56,757.8 56,090.4 56,683.9 56,981.5 57,534.1 -1,005.9 -667.4 593.5 297.6 552.6 Plus: Personal current transfer receipts 13 36,829.1 63,048.3 49,485.2 42,590.9 65,092.7 49,157.1 26,219.2 -13,563.1 -6,894.2 22,501.8 -15,935.6 Social Security 14 12,883.7 12,958.1 13,016.4 13,108.3 13,295.1 13,331.1 74.3 58.3 91.9 186.7 36.0 Medicare 15 9,825.0 9,968.7 10,013.3 9,958.3 9,884.7 9,896.8 143.7 44.7 -55.1 -73.6 12.2 Of which: Increase in Medicare reimbursement rates1 16 116.8 174.9 173.6 172.3 171.1 116.8 58.1 -1.3 -1.3 -1.2 Medicaid 17 7,585.3 8,298.9 8,793.2 8,717.3 9,051.8 9,742.8 713.6 494.3 -75.9 334.5 690.9 State unemployment insurance 18 629.8 12,154.4 7,458.5 3,189.9 6,512.9 5,821.6 11,524.6 -4,695.9 -4,268.5 3,322.9 -691.2 Of which:2
Extended Unemployment Benefits 19 0.0 78.9 209.1 258.8 9.7 0.0 78.9 130.2 49.7 -249.1 Pandemic Emergency Unemployment Compensation 20 135.0 260.8 983.8 1,261.4 1,465.3 135.0 125.8 723.0 277.6 203.9 Pandemic Unemployment Assistance 21 364.6 642.1 530.1 540.3 501.2 364.6 277.5 -112.0 10.2 -39.1 Pandemic Unemployment Compensation Payments 22 8,507.8 3,673.5 67.2 3,323.7 2,865.8 8,507.8 -4,834.3 -3,606.3 3,256.5 -457.8 All other personal current transfer receipts 23 5,905.2 19,668.3 10,203.7 7,617.0 26,348.3 10,364.8 13,763.1 -9,464.6 -2,586.7 18,731.2 -15,983.4 Of which: Economic impact payments3 24 10,925.7 157.6 51.1 18,893.7 2,834.5 10,925.7 -10,768.1 -106.5 18,842.5 -16,059.2 Lost wages supplemental payments4 25 0.0 1,214.0 242.7 6.8 2.8 0.0 1,214.0 -971.2 -236.0 -3.9 Paycheck Protection Program loans to NPISH5 26 544.2 1,404.7 422.1 163.5 293.8 544.2 860.5 -982.6 -258.6 130.3 Provider Relief Fund to NPISH6 27 19.2 2,023.7 1,248.3 719.4 672.2 417.7 2,004.5 -775.4 -528.9 -47.3 -254.4Components of earnings by place of work Wages and salaries 28 121,481.3 114,840.0 119,591.7 124,601.3 123,673.0 126,040.0 -6,641.4 4,751.8 5,009.5 -928.3 2,367.1 Supplements to wages and salaries 29 26,673.6 25,600.0 26,556.5 27,302.4 27,120.0 27,355.2 -1,073.6 956.5 745.9 -182.4 235.2 Employer contributions for employee pension and insurance funds 30 18,320.4 17,552.1 18,232.3 18,730.0 18,456.4 18,552.2 -768.2 680.2 497.6 -273.5 95.7 Employer contributions for government social insurance 31 8,353.2 8,047.9 8,324.1 8,572.4 8,663.6 8,803.0 -305.3 276.3 248.3 91.1 139.5 Proprietors' income 32 28,657.6 24,901.8 28,626.8 29,155.9 29,554.7 29,244.3 -3,755.9 3,725.0 529.1 398.9 -310.4 Farm proprietors' income 33 63.4 97.6 119.7 154.0 86.4 113.7 34.1 22.1 34.3 -67.6 27.3 Of which: Coronavirus Food Assistance Program7 34 17.2 8.0 64.6 3.8 5.0 17.2 -9.2 56.6 -60.8 1.1 Paycheck Protection Program loans to businesses5 35 28.2 40.1 12.0 4.9 11.3 28.2 11.9 -28.0 -7.1 6.3 Nonfarm proprietors' income 36 28,594.2 24,804.2 28,507.1 29,001.8 29,468.3 29,130.6 -3,790.0 3,702.9 494.7 466.4 -337.6 Of which: Paycheck Protection Program loans to businesses5 37 3,339.8 3,812.2 1,591.8 1,226.3 1,284.2 3,339.8 472.4 -2,220.5 -365.5 57.9
Data on this table will be superseded by updated estimates. Regional estimates were controlled to the annual update to the National accounts released August 26, 2021.
2020 2021
Effects of Selected Federal Pandemic Response Programs on State Personal Income, 2021Q2Connecticut
(Millions of dollars, seasonally adjusted at annual rates)Levels Change from preceding period
Note: BEA state per capita personal income statistics are calculated using unpublished Census Bureau midquarter population estimates. These midquarter estimates are based on the 2010 census. BEA will incorporate Census Bureau population estimates based on the 2020 census results wh
Source. U.S. Bureau of Economic AnalysisLast updated: September 23, 2021.
Line
3. Economic impact payments, initially established by the CARES Act, provide direct payments to individuals. For more information, see How are federal economic impact payments to support individuals during the COVID-19 pandemic recorded in the NIPAs?4. The Federal Emergency Management Agency (FEMA) was authorized to make payments from the Disaster Relief Fund to supplement wages lost as a result of the COVID-19 pandemic.5. The Paycheck Protection Program, initially established by the CARES Act, provides forgivable loans to help small businesses and nonprofit institutions make payroll and cover other expenses. It also provides funding to reimburse private lending institutions for the costs of administering these loans. For more information, see How does the Paycheck Protection Program impact the national income and product accounts (NIPAs)?6. The Department of Health and Human Services distributes money from the Provider Relief Fund to hospitals and health care providers on the front lines of the coronavirus response. This funding supports health care-related expenses or lost revenue attributable to COVID-19 and ensures uninsured Americans can get treatment for COVID-19. In the NIPAs, funds provided to nonprofit hospitals are recorded as social benefits.7. The Coronavirus Food Assistance Program, initially established by the CARES Act, provides direct support to farmers and ranchers where prices and market supply chains have been impacted by the COVID-19 pandemic.
CARES -Coronavirus Aid, Relief, and Economic SecurityNPISH -Nonprofit institutions serving households1. A two percent reduction in reimbursements paid to Medicare service providers that went into effect in 2013 was initially suspended by the CARES Act. The resulting increased reimbursement rates went into effect beginning on May 1, 2020.2. Unemployment insurance benefits were expanded through several programs that were initially established through the CARES Act. For more information, see How will the expansion of unemployment benefits in response to the COVID-19 pandemic be recorded in the NIPAs?
2020 2021

Q1 Q2 Q3 Q4 Q1 Q2 Q2 Q3 Q4 Q1 Q2Personal income (millions of dollars) 1 53,837.3 57,113.7 55,086.5 55,392.0 61,364.8 57,229.8 3,276.4 -2,027.2 305.5 5,972.8 -4,135.0 Nonfarm personal income 2 53,382.2 57,021.6 54,855.3 55,019.6 61,015.8 56,840.8 3,639.3 -2,166.2 164.2 5,996.2 -4,175.0 Farm income 3 455.1 92.1 231.2 372.4 349.0 389.0 -362.9 139.0 141.3 -23.4 40.0Population (persons) 4 983,714 985,835 988,196 990,851 992,986 995,225 2,121 2,361 2,655 2,135 2,239Per capita personal income (dollars) 5 54,729 57,934 55,745 55,903 61,798 57,504 3,205 -2,189 158 5,895 -4,294Derivation of personal income Earnings by place of work 6 38,949.1 35,838.0 38,303.8 39,945.5 39,251.6 39,997.1 -3,111.1 2,465.8 1,641.7 -693.8 745.5 Less: Contributions for government social insurance 7 4,483.9 4,339.3 4,507.4 4,647.8 4,612.8 4,689.8 -144.6 168.1 140.4 -35.0 77.0 Employee and self-employed contributions for government social insurance 8 2,440.4 2,356.0 2,444.6 2,524.8 2,499.3 2,539.5 -84.4 88.6 80.2 -25.4 40.2 Employer contributions for government social insurance 9 2,043.5 1,983.3 2,062.8 2,123.0 2,113.4 2,150.3 -60.2 79.5 60.2 -9.6 36.9 Plus: Adjustment for residence 10 -2,256.3 -2,127.9 -2,227.7 -2,315.8 -2,062.4 -2,127.4 128.4 -99.8 -88.0 253.4 -65.0 Equals: Net earnings by place of residence 11 32,208.9 29,370.8 31,568.7 32,981.9 32,576.5 33,179.9 -2,838.1 2,197.9 1,413.3 -405.5 603.5 Plus: Dividends, interest, and rent 12 10,132.4 9,951.6 9,824.4 9,946.9 9,957.3 10,056.2 -180.9 -127.2 122.5 10.3 98.9 Plus: Personal current transfer receipts 13 11,495.9 17,791.3 13,693.5 12,463.2 18,831.1 13,993.7 6,295.4 -4,097.9 -1,230.3 6,367.9 -4,837.3 Social Security 14 4,071.7 4,106.2 4,133.2 4,174.5 4,257.5 4,273.6 34.5 26.9 41.4 83.0 16.0 Medicare 15 2,937.7 2,992.1 3,010.1 2,991.3 2,962.4 2,967.3 54.3 18.0 -18.7 -29.0 4.9 Of which: Increase in Medicare reimbursement rates1 16 35.1 52.5 52.1 51.7 51.3 35.1 17.4 -0.4 -0.4 -0.4 Medicaid 17 2,225.6 2,293.2 2,433.8 2,397.4 2,451.8 2,625.7 67.6 140.7 -36.4 54.3 173.9 State unemployment insurance 18 96.6 2,182.0 1,014.3 244.3 684.6 496.9 2,085.4 -1,167.7 -770.1 440.3 -187.6 Of which:2
Extended Unemployment Benefits 19 0.0 9.1 27.7 11.9 0.5 0.0 9.1 18.7 -15.9 -11.4 Pandemic Emergency Unemployment Compensation 20 13.6 10.4 1.6 1.0 223.7 13.6 -3.2 -8.9 -0.6 222.7 Pandemic Unemployment Assistance 21 133.2 210.6 65.6 51.3 18.4 133.2 77.4 -145.0 -14.3 -32.9 Pandemic Unemployment Compensation Payments 22 1,505.2 462.8 15.7 504.8 154.2 1,505.2 -1,042.4 -447.1 489.0 -350.6 All other personal current transfer receipts 23 2,164.3 6,217.8 3,102.1 2,655.6 8,474.8 3,630.3 4,053.6 -3,115.7 -446.5 5,819.3 -4,844.5 Of which: Economic impact payments3 24 3,284.9 47.4 15.4 5,760.0 864.1 3,284.9 -3,237.5 -32.0 5,744.7 -4,895.9 Lost wages supplemental payments4 25 0.0 185.7 33.3 2.4 1.9 0.0 185.7 -152.4 -30.8 -0.5 Paycheck Protection Program loans to NPISH5 26 50.3 378.5 113.7 38.0 40.3 50.3 328.2 -264.8 -75.7 2.3 Provider Relief Fund to NPISH6 27 5.7 599.0 237.9 254.7 183.9 114.3 593.3 -361.1 16.9 -70.8 -69.6Components of earnings by place of work Wages and salaries 28 28,229.3 26,600.6 27,819.5 28,931.4 28,350.2 28,941.8 -1,628.6 1,218.9 1,111.9 -581.2 591.6 Supplements to wages and salaries 29 6,879.5 6,596.3 6,855.2 7,020.7 6,850.6 6,918.7 -283.3 259.0 165.5 -170.1 68.1 Employer contributions for employee pension and insurance funds 30 4,836.1 4,613.0 4,792.4 4,897.7 4,737.2 4,768.4 -223.1 179.4 105.3 -160.6 31.3 Employer contributions for government social insurance 31 2,043.5 1,983.3 2,062.8 2,123.0 2,113.4 2,150.3 -60.2 79.5 60.2 -9.6 36.9 Proprietors' income 32 3,840.3 2,641.1 3,629.0 3,993.3 4,050.8 4,136.6 -1,199.2 987.9 364.3 57.5 85.8 Farm proprietors' income 33 424.4 61.8 200.8 341.7 317.6 357.2 -362.6 139.0 140.9 -24.1 39.5 Of which: Coronavirus Food Assistance Program7 34 5.9 8.0 58.6 2.0 1.6 5.9 2.0 50.7 -56.6 -0.4 Paycheck Protection Program loans to businesses5 35 7.9 11.2 3.4 3.5 9.0 7.9 3.3 -7.9 0.1 5.5 Nonfarm proprietors' income 36 3,415.9 2,579.3 3,428.2 3,651.6 3,733.1 3,779.4 -836.6 848.9 223.4 81.6 46.3 Of which: Paycheck Protection Program loans to businesses5 37 618.3 684.0 246.9 217.9 527.7 618.3 65.8 -437.1 -29.0 309.8
Data on this table will be superseded by updated estimates. Regional estimates were controlled to the annual update to the National accounts released August 26, 2021.
2020 2021
Effects of Selected Federal Pandemic Response Programs on State Personal Income, 2021Q2Delaware
(Millions of dollars, seasonally adjusted at annual rates)Levels Change from preceding period
Note: BEA state per capita personal income statistics are calculated using unpublished Census Bureau midquarter population estimates. These midquarter estimates are based on the 2010 census. BEA will incorporate Census Bureau population estimates based on the 2020 census results wh
Source. U.S. Bureau of Economic AnalysisLast updated: September 23, 2021.
Line
3. Economic impact payments, initially established by the CARES Act, provide direct payments to individuals. For more information, see How are federal economic impact payments to support individuals during the COVID-19 pandemic recorded in the NIPAs?4. The Federal Emergency Management Agency (FEMA) was authorized to make payments from the Disaster Relief Fund to supplement wages lost as a result of the COVID-19 pandemic.5. The Paycheck Protection Program, initially established by the CARES Act, provides forgivable loans to help small businesses and nonprofit institutions make payroll and cover other expenses. It also provides funding to reimburse private lending institutions for the costs of administering these loans. For more information, see How does the Paycheck Protection Program impact the national income and product accounts (NIPAs)?6. The Department of Health and Human Services distributes money from the Provider Relief Fund to hospitals and health care providers on the front lines of the coronavirus response. This funding supports health care-related expenses or lost revenue attributable to COVID-19 and ensures uninsured Americans can get treatment for COVID-19. In the NIPAs, funds provided to nonprofit hospitals are recorded as social benefits.7. The Coronavirus Food Assistance Program, initially established by the CARES Act, provides direct support to farmers and ranchers where prices and market supply chains have been impacted by the COVID-19 pandemic.
CARES -Coronavirus Aid, Relief, and Economic SecurityNPISH -Nonprofit institutions serving households1. A two percent reduction in reimbursements paid to Medicare service providers that went into effect in 2013 was initially suspended by the CARES Act. The resulting increased reimbursement rates went into effect beginning on May 1, 2020.2. Unemployment insurance benefits were expanded through several programs that were initially established through the CARES Act. For more information, see How will the expansion of unemployment benefits in response to the COVID-19 pandemic be recorded in the NIPAs?
2020 2021

Q1 Q2 Q3 Q4 Q1 Q2 Q2 Q3 Q4 Q1 Q2Personal income (millions of dollars) 1 58,603.7 63,205.1 62,966.0 62,049.7 66,176.3 64,435.3 4,601.4 -239.1 -916.3 4,126.6 -1,741.0 Nonfarm personal income 2 58,603.7 63,205.1 62,966.0 62,049.7 66,176.3 64,435.3 4,601.4 -239.1 -916.3 4,126.6 -1,741.0 Farm income 3 0.0 0.0 0.0 0.0 0.0 0.0 0.0 0.0 0.0 0.0 0.0Population (persons) 4 711,598 712,460 713,198 713,905 714,667 715,603 862 738 707 762 936Per capita personal income (dollars) 5 82,355 88,714 88,287 86,916 92,597 90,043 6,359 -427 -1,371 5,681 -2,554Derivation of personal income Earnings by place of work 6 107,163.8 103,441.6 106,949.2 110,466.3 109,739.5 111,015.2 -3,722.3 3,507.6 3,517.1 -726.8 1,275.7 Less: Contributions for government social insurance 7 11,287.6 10,986.4 11,180.7 11,462.2 11,482.6 11,568.9 -301.2 194.3 281.5 20.4 86.3 Employee and self-employed contributions for government social insurance 8 5,581.8 5,402.2 5,501.5 5,652.3 5,654.1 5,690.1 -179.6 99.3 150.8 1.8 36.0 Employer contributions for government social insurance 9 5,705.8 5,584.2 5,679.2 5,809.9 5,828.5 5,878.7 -121.6 95.0 130.7 18.6 50.2 Plus: Adjustment for residence 10 -54,850.9 -52,780.6 -54,438.2 -56,500.0 -55,687.7 -56,205.2 2,070.4 -1,657.6 -2,061.8 812.3 -517.5 Equals: Net earnings by place of residence 11 41,025.3 39,674.7 41,330.3 42,504.1 42,569.2 43,241.1 -1,350.7 1,655.7 1,173.8 65.0 672.0 Plus: Dividends, interest, and rent 12 10,098.0 9,936.1 9,814.7 9,918.0 9,915.8 9,998.1 -162.0 -121.3 103.3 -2.2 82.3 Plus: Personal current transfer receipts 13 7,480.3 13,594.4 11,821.0 9,627.6 13,691.3 11,196.1 6,114.1 -1,773.4 -2,193.4 4,063.7 -2,495.2 Social Security 14 1,361.3 1,368.7 1,374.6 1,385.2 1,407.9 1,412.2 7.3 5.9 10.6 22.6 4.4 Medicare 15 1,300.6 1,315.9 1,319.6 1,311.7 1,302.7 1,304.1 15.3 3.7 -7.9 -9.1 1.5 Of which: Increase in Medicare reimbursement rates1 16 15.4 23.1 22.9 22.7 22.6 15.4 7.7 -0.2 -0.2 -0.2 Medicaid 17 2,907.4 3,072.0 3,377.5 3,318.3 3,346.1 3,584.4 164.6 305.5 -59.2 27.7 238.3 State unemployment insurance 18 213.7 2,935.0 1,985.8 1,141.7 2,347.8 1,978.4 2,721.3 -949.2 -844.1 1,206.2 -369.4 Of which:2
Extended Unemployment Benefits 19 0.4 7.0 33.5 343.0 257.3 0.4 6.6 26.5 309.5 -85.7 Pandemic Emergency Unemployment Compensation 20 11.8 47.0 432.2 413.2 354.3 11.8 35.2 385.3 -19.0 -58.9 Pandemic Unemployment Assistance 21 63.0 119.4 149.5 171.1 150.5 63.0 56.3 30.2 21.5 -20.6 Pandemic Unemployment Compensation Payments 22 1,998.9 960.8 24.3 1,053.9 919.1 1,998.9 -1,038.1 -936.4 1,029.6 -134.8 All other personal current transfer receipts 23 1,697.3 4,902.8 3,763.5 2,470.7 5,286.9 2,917.0 3,205.5 -1,139.3 -1,292.8 2,816.3 -2,370.0 Of which: Economic impact payments3 24 1,793.7 26.0 8.4 3,027.5 454.2 1,793.7 -1,767.7 -17.6 3,019.1 -2,573.3 Lost wages supplemental payments4 25 0.0 289.7 205.2 6.5 2.0 0.0 289.7 -84.5 -198.7 -4.4 Paycheck Protection Program loans to NPISH5 26 997.7 1,390.3 417.8 192.8 362.2 997.7 392.6 -972.5 -225.0 169.4 Provider Relief Fund to NPISH6 27 3.0 320.7 281.0 69.1 112.9 70.2 317.6 -39.6 -211.9 43.8 -42.7Components of earnings by place of work Wages and salaries 28 80,654.4 77,045.9 79,711.9 82,799.3 81,978.9 82,896.4 -3,608.5 2,666.0 3,087.4 -820.5 917.6 Supplements to wages and salaries 29 20,776.3 20,461.4 20,852.0 21,374.1 21,353.2 21,412.2 -314.9 390.7 522.1 -20.9 58.9 Employer contributions for employee pension and insurance funds 30 15,070.5 14,877.2 15,172.9 15,564.2 15,524.7 15,533.4 -193.3 295.7 391.4 -39.5 8.7 Employer contributions for government social insurance 31 5,705.8 5,584.2 5,679.2 5,809.9 5,828.5 5,878.7 -121.6 95.0 130.7 18.6 50.2 Proprietors' income 32 5,733.2 5,934.3 6,385.3 6,292.8 6,407.4 6,706.6 201.1 450.9 -92.4 114.5 299.3 Farm proprietors' income 33 0.0 0.0 0.0 0.0 0.0 0.0 0.0 0.0 0.0 0.0 0.0 Of which: Coronavirus Food Assistance Program7 34 0.0 0.0 0.0 0.0 0.0 0.0 0.0 0.0 0.0 0.0 Paycheck Protection Program loans to businesses5 35 0.0 0.0 0.0 0.0 0.0 0.0 0.0 0.0 0.0 0.0 Nonfarm proprietors' income 36 5,733.2 5,934.3 6,385.3 6,292.8 6,407.4 6,706.6 201.1 450.9 -92.4 114.5 299.3 Of which: Paycheck Protection Program loans to businesses5 37 1,235.8 1,164.6 396.8 354.2 755.5 1,235.8 -71.1 -767.8 -42.7 401.3
Data on this table will be superseded by updated estimates. Regional estimates were controlled to the annual update to the National accounts released August 26, 2021.
2020 2021
Effects of Selected Federal Pandemic Response Programs on State Personal Income, 2021Q2District of Columbia
(Millions of dollars, seasonally adjusted at annual rates)Levels Change from preceding period
Note: BEA state per capita personal income statistics are calculated using unpublished Census Bureau midquarter population estimates. These midquarter estimates are based on the 2010 census. BEA will incorporate Census Bureau population estimates based on the 2020 census results wh
Source. U.S. Bureau of Economic AnalysisLast updated: September 23, 2021.
Line
3. Economic impact payments, initially established by the CARES Act, provide direct payments to individuals. For more information, see How are federal economic impact payments to support individuals during the COVID-19 pandemic recorded in the NIPAs?4. The Federal Emergency Management Agency (FEMA) was authorized to make payments from the Disaster Relief Fund to supplement wages lost as a result of the COVID-19 pandemic.5. The Paycheck Protection Program, initially established by the CARES Act, provides forgivable loans to help small businesses and nonprofit institutions make payroll and cover other expenses. It also provides funding to reimburse private lending institutions for the costs of administering these loans. For more information, see How does the Paycheck Protection Program impact the national income and product accounts (NIPAs)?6. The Department of Health and Human Services distributes money from the Provider Relief Fund to hospitals and health care providers on the front lines of the coronavirus response. This funding supports health care-related expenses or lost revenue attributable to COVID-19 and ensures uninsured Americans can get treatment for COVID-19. In the NIPAs, funds provided to nonprofit hospitals are recorded as social benefits.7. The Coronavirus Food Assistance Program, initially established by the CARES Act, provides direct support to farmers and ranchers where prices and market supply chains have been impacted by the COVID-19 pandemic.
CARES -Coronavirus Aid, Relief, and Economic SecurityNPISH -Nonprofit institutions serving households1. A two percent reduction in reimbursements paid to Medicare service providers that went into effect in 2013 was initially suspended by the CARES Act. The resulting increased reimbursement rates went into effect beginning on May 1, 2020.2. Unemployment insurance benefits were expanded through several programs that were initially established through the CARES Act. For more information, see How will the expansion of unemployment benefits in response to the COVID-19 pandemic be recorded in the NIPAs?
2020 2021

Q1 Q2 Q3 Q4 Q1 Q2 Q2 Q3 Q4 Q1 Q2Personal income (millions of dollars) 1 1,175,293.1 1,246,105.4 1,216,737.0 1,201,848.2 1,363,364.2 1,280,833.8 70,812.3 -29,368.4 -14,888.8 161,516.0 -82,530.4 Nonfarm personal income 2 1,172,649.2 1,242,848.2 1,213,134.1 1,198,019.1 1,360,158.1 1,277,096.1 70,199.0 -29,714.1 -15,115.0 162,139.1 -83,062.0 Farm income 3 2,643.9 3,257.3 3,602.9 3,829.1 3,206.0 3,737.6 613.3 345.6 226.2 -623.1 531.6Population (persons) 4 21,659,884 21,710,061 21,761,157 21,814,197 21,863,957 21,916,767 50,177 51,096 53,040 49,760 52,810Per capita personal income (dollars) 5 54,261 57,398 55,913 55,095 62,357 58,441 3,137 -1,485 -818 7,262 -3,916Derivation of personal income Earnings by place of work 6 696,679.4 647,895.2 701,716.9 708,767.5 718,250.8 743,023.5 -48,784.2 53,821.7 7,050.6 9,483.3 24,772.7 Less: Contributions for government social insurance 7 83,022.1 78,445.7 82,069.1 84,603.8 86,784.9 88,377.1 -4,576.5 3,623.4 2,534.7 2,181.1 1,592.2 Employee and self-employed contributions for government social insurance 8 47,695.5 44,982.3 47,093.8 48,640.3 49,833.2 50,716.1 -2,713.2 2,111.5 1,546.5 1,192.8 883.0 Employer contributions for government social insurance 9 35,326.6 33,463.4 34,975.3 35,963.4 36,951.7 37,661.0 -1,863.3 1,511.9 988.2 988.2 709.3 Plus: Adjustment for residence 10 3,601.7 3,418.8 3,558.0 3,690.2 3,713.7 3,766.5 -182.9 139.2 132.1 23.6 52.8 Equals: Net earnings by place of residence 11 617,259.0 572,868.4 623,205.8 627,853.9 635,179.7 658,412.9 -44,390.6 50,337.5 4,648.1 7,325.8 23,233.2 Plus: Dividends, interest, and rent 12 331,708.1 324,268.3 317,614.4 325,136.1 323,479.6 328,375.8 -7,439.8 -6,653.9 7,521.7 -1,656.5 4,896.1 Plus: Personal current transfer receipts 13 226,326.0 348,968.7 275,916.8 248,858.2 404,704.9 294,045.1 122,642.7 -73,052.0 -27,058.6 155,846.7 -110,659.8 Social Security 14 80,682.2 81,314.9 81,807.3 82,555.4 84,048.1 84,336.2 632.7 492.4 748.1 1,492.7 288.1 Medicare 15 68,206.7 69,440.4 69,854.0 69,440.6 68,803.1 68,910.9 1,233.8 413.6 -413.5 -637.5 107.8 Of which: Increase in Medicare reimbursement rates1 16 813.7 1,218.4 1,209.3 1,200.1 1,191.7 813.7 404.7 -9.1 -9.1 -8.5 Medicaid 17 23,323.3 25,759.4 27,171.4 27,116.1 28,501.2 29,505.4 2,436.1 1,412.0 -55.4 1,385.2 1,004.2 State unemployment insurance 18 964.7 33,538.0 29,269.5 10,215.7 25,209.5 21,621.8 32,573.2 -4,268.5 -19,053.8 14,993.8 -3,587.7 Of which:2
Extended Unemployment Benefits 19 0.7 (L) 84.2 748.8 50.1 0.7 (L) (L) 664.6 -698.7 Pandemic Emergency Unemployment Compensation 20 128.6 3,770.0 3,269.8 5,778.6 6,179.2 128.6 3,641.3 -500.1 2,508.7 400.6 Pandemic Unemployment Assistance 21 830.1 1,981.6 4,131.1 2,878.1 2,408.4 830.1 1,151.4 2,149.6 -1,253.1 -469.6 Pandemic Unemployment Compensation Payments 22 25,650.3 18,665.9 1,023.1 14,619.1 11,874.9 25,650.3 -6,984.4 -17,642.8 13,596.0 -2,744.2 All other personal current transfer receipts 23 53,149.1 138,916.0 67,814.5 59,530.5 198,143.1 89,670.9 85,766.9 -71,101.4 -8,284.1 138,612.6 -108,472.1 Of which: Economic impact payments3 24 74,032.0 1,069.7 346.9 131,808.2 19,774.3 74,032.0 -72,962.3 -722.8 131,461.2 -112,033.9 Lost wages supplemental payments4 25 0.0 4,398.5 237.2 79.6 24.5 0.0 4,398.5 -4,161.3 -157.6 -55.1 Paycheck Protection Program loans to NPISH5 26 2,066.7 4,041.7 1,214.5 491.9 887.7 2,066.7 1,975.0 -2,827.2 -722.6 395.8 Provider Relief Fund to NPISH6 27 50.9 5,371.0 1,468.3 1,215.0 1,358.4 844.2 5,320.1 -3,902.7 -253.3 143.4 -514.2Components of earnings by place of work Wages and salaries 28 522,630.1 481,625.1 508,715.7 529,346.0 536,767.1 548,883.6 -41,005.0 27,090.6 20,630.3 7,421.1 12,116.6 Supplements to wages and salaries 29 107,496.9 100,808.9 104,907.2 107,457.3 108,897.7 110,077.9 -6,687.9 4,098.3 2,550.1 1,440.4 1,180.2 Employer contributions for employee pension and insurance funds 30 72,170.2 67,345.5 69,931.9 71,493.8 71,946.0 72,417.0 -4,824.7 2,586.4 1,561.9 452.2 470.9 Employer contributions for government social insurance 31 35,326.6 33,463.4 34,975.3 35,963.4 36,951.7 37,661.0 -1,863.3 1,511.9 988.2 988.2 709.3 Proprietors' income 32 66,552.4 65,461.2 88,094.0 71,964.3 72,586.0 84,061.9 -1,091.2 22,632.8 -16,129.7 621.7 11,475.9 Farm proprietors' income 33 1,124.0 1,741.6 2,077.8 2,280.3 1,623.9 2,134.5 617.6 336.2 202.5 -656.4 510.6 Of which: Coronavirus Food Assistance Program7 34 218.8 374.7 741.8 33.5 132.6 218.8 156.0 367.1 -708.4 99.1 Paycheck Protection Program loans to businesses5 35 266.4 378.4 113.7 58.6 148.2 266.4 112.0 -264.7 -55.1 89.6 Nonfarm proprietors' income 36 65,428.5 63,719.6 86,016.2 69,684.0 70,962.1 81,927.4 -1,708.8 22,296.5 -16,332.2 1,278.1 10,965.3 Of which: Paycheck Protection Program loans to businesses5 37 8,617.7 24,641.4 3,860.5 5,449.8 16,962.1 8,617.7 16,023.7 -20,781.0 1,589.3 11,512.3
Data on this table will be superseded by updated estimates. Regional estimates were controlled to the annual update to the National accounts released August 26, 2021.
2021 2020 2021
Effects of Selected Federal Pandemic Response Programs on State Personal Income, 2021Q2Florida
(Millions of dollars, seasonally adjusted at annual rates)Levels Change from preceding period
NPISH -Nonprofit institutions serving households
Note: BEA state per capita personal income statistics are calculated using unpublished Census Bureau midquarter population estimates. These midquarter estimates are based on the 2010 census. BEA will incorporate Census Bureau population estimates based on the 2020 census results when t
Source. U.S. Bureau of Economic AnalysisLast updated: September 23, 2021.
Line
3. Economic impact payments, initially established by the CARES Act, provide direct payments to individuals. For more information, see How are federal economic impact payments to support individuals during the COVID-19 pandemic recorded in the NIPAs?
4. The Federal Emergency Management Agency (FEMA) was authorized to make payments from the Disaster Relief Fund to supplement wages lost as a result of the COVID-19 pandemic.5. The Paycheck Protection Program, initially established by the CARES Act, provides forgivable loans to help small businesses and nonprofit institutions make payroll and cover other expenses. It also provides funding to reimburse private lending institutions for the costs of administering these loans. For more information, see How does the Paycheck Protection Program impact the national income and product accounts (NIPAs)?6. The Department of Health and Human Services distributes money from the Provider Relief Fund to hospitals and health care providers on the front lines of the coronavirus response. This funding supports health care-related expenses or lost revenue attributable to COVID-19 and ensures 7. The Coronavirus Food Assistance Program, initially established by the CARES Act, provides direct support to farmers and ranchers where prices and market supply chains have been impacted by the COVID-19 pandemic.
CARES -Coronavirus Aid, Relief, and Economic Security
(L) Less than $50,000.1. A two percent reduction in reimbursements paid to Medicare service providers that went into effect in 2013 was initially suspended by the CARES Act. The resulting increased reimbursement rates went into effect beginning on May 1, 2020.2. Unemployment insurance benefits were expanded through several programs that were initially established through the CARES Act. For more information, see How will the expansion of unemployment benefits in response to the COVID-19 pandemic be recorded in the NIPAs?
2020

Q1 Q2 Q3 Q4 Q1 Q2 Q2 Q3 Q4 Q1 Q2Personal income (millions of dollars) 1 530,578.5 578,265.1 561,497.2 547,925.0 624,799.4 586,626.1 47,686.6 -16,767.9 -13,572.2 76,874.4 -38,173.3 Nonfarm personal income 2 528,314.1 577,528.4 560,041.7 545,784.8 623,262.8 584,861.3 49,214.4 -17,486.7 -14,256.9 77,478.0 -38,401.5 Farm income 3 2,264.5 736.7 1,455.5 2,140.2 1,536.5 1,764.8 -1,527.8 718.8 684.7 -603.6 228.3Population (persons) 4 10,685,821 10,702,475 10,720,826 10,741,218 10,757,490 10,775,320 16,654 18,351 20,392 16,272 17,830Per capita personal income (dollars) 5 49,653 54,031 52,374 51,011 58,080 54,442 4,378 -1,657 -1,363 7,069 -3,638Derivation of personal income Earnings by place of work 6 386,136.5 361,260.8 389,514.3 396,443.2 400,038.4 418,954.3 -24,875.7 28,253.5 6,928.9 3,595.1 18,916.0 Less: Contributions for government social insurance 7 41,495.7 39,795.6 41,347.8 42,629.6 43,486.9 44,207.4 -1,700.1 1,552.2 1,281.8 857.3 720.5 Employee and self-employed contributions for government social insurance 8 22,877.2 21,879.0 22,726.5 23,462.5 23,907.4 24,292.7 -998.1 847.4 736.0 444.9 385.4 Employer contributions for government social insurance 9 18,618.5 17,916.5 18,621.3 19,167.1 19,579.5 19,914.6 -702.0 704.8 545.8 412.4 335.1 Plus: Adjustment for residence 10 -1,537.4 -1,490.6 -1,555.7 -1,630.5 -1,611.4 -1,649.2 46.8 -65.1 -74.8 19.1 -37.9 Equals: Net earnings by place of residence 11 343,103.4 319,974.6 346,610.9 352,183.2 354,940.1 373,097.7 -23,128.7 26,636.2 5,572.3 2,756.9 18,157.6 Plus: Dividends, interest, and rent 12 97,744.9 95,459.6 93,538.1 95,231.0 94,742.2 95,924.9 -2,285.3 -1,921.5 1,692.9 -488.9 1,182.7 Plus: Personal current transfer receipts 13 89,730.3 162,830.9 121,348.3 100,510.8 175,117.1 117,603.5 73,100.6 -41,482.7 -20,837.5 74,606.3 -57,513.6 Social Security 14 31,189.2 31,399.7 31,566.2 31,837.1 32,395.5 32,503.2 210.5 166.5 270.9 558.4 107.8 Medicare 15 22,187.8 22,572.3 22,696.7 22,558.8 22,354.0 22,388.6 384.5 124.4 -137.9 -204.8 34.6 Of which: Increase in Medicare reimbursement rates1 16 264.5 396.0 393.0 390.1 387.3 264.5 131.5 -3.0 -3.0 -2.7 Medicaid 17 10,555.9 11,089.1 11,674.0 11,112.8 11,348.5 12,047.8 533.2 584.8 -561.2 235.7 699.3 State unemployment insurance 18 1,152.7 32,470.1 21,885.9 7,995.8 16,279.1 10,629.9 31,317.4 -10,584.2 -13,890.1 8,283.3 -5,649.2 Of which:2
Extended Unemployment Benefits 19 0.0 46.0 272.9 253.7 2.5 0.0 46.0 226.9 -19.2 -251.2 Pandemic Emergency Unemployment Compensation 20 51.9 382.1 2,419.9 3,596.8 2,115.1 51.9 330.2 2,037.8 1,176.9 -1,481.7 Pandemic Unemployment Assistance 21 1,989.6 3,541.2 2,535.6 2,102.7 1,620.0 1,989.6 1,551.6 -1,005.7 -432.9 -482.7 Pandemic Unemployment Compensation Payments 22 23,105.7 12,433.9 219.6 8,586.1 5,537.7 23,105.7 -10,671.8 -12,214.3 8,366.5 -3,048.4 All other personal current transfer receipts 23 24,644.7 65,299.7 33,525.5 27,006.3 92,740.0 40,033.9 40,655.0 -31,774.2 -6,519.2 65,733.7 -52,706.1 Of which: Economic impact payments3 24 34,308.7 496.1 160.9 63,164.0 9,476.1 34,308.7 -33,812.7 -335.2 63,003.1 -53,687.9 Lost wages supplemental payments4 25 0.0 3,975.3 315.9 47.4 35.2 0.0 3,975.3 -3,659.5 -268.5 -12.2 Paycheck Protection Program loans to NPISH5 26 871.1 1,422.4 427.4 227.8 315.0 871.1 551.4 -995.0 -199.7 87.2 Provider Relief Fund to NPISH6 27 38.8 4,095.7 1,751.3 281.9 1,033.7 642.4 4,056.9 -2,344.3 -1,469.4 751.8 -391.3Components of earnings by place of work Wages and salaries 28 279,527.8 261,659.6 274,513.7 285,675.6 288,110.8 294,148.4 -17,868.2 12,854.1 11,161.9 2,435.2 6,037.7 Supplements to wages and salaries 29 60,303.3 57,811.1 60,218.3 61,835.3 62,663.7 63,204.7 -2,492.2 2,407.2 1,617.0 828.4 541.0 Employer contributions for employee pension and insurance funds 30 41,684.8 39,894.6 41,597.0 42,668.1 43,084.2 43,290.1 -1,790.2 1,702.4 1,071.1 416.0 205.9 Employer contributions for government social insurance 31 18,618.5 17,916.5 18,621.3 19,167.1 19,579.5 19,914.6 -702.0 704.8 545.8 412.4 335.1 Proprietors' income 32 46,305.4 41,790.1 54,782.3 48,932.4 49,263.9 61,601.2 -4,515.3 12,992.1 -5,849.9 331.5 12,337.2 Farm proprietors' income 33 1,912.4 387.2 1,104.9 1,784.6 1,173.3 1,396.7 -1,525.2 717.7 679.7 -611.3 223.4 Of which: Coronavirus Food Assistance Program7 34 224.0 255.2 666.0 0.0 33.7 224.0 31.2 410.8 -666.0 33.7 Paycheck Protection Program loans to businesses5 35 115.3 163.7 49.2 72.6 185.3 115.3 48.5 -114.5 23.4 112.7 Nonfarm proprietors' income 36 44,393.1 41,403.0 53,677.4 47,147.8 48,090.6 60,204.4 -2,990.1 12,274.4 -6,529.6 942.8 12,113.9 Of which: Paycheck Protection Program loans to businesses5 37 3,581.5 11,532.9 1,983.3 2,893.3 15,447.5 3,581.5 7,951.4 -9,549.6 910.1 12,554.2
Data on this table will be superseded by updated estimates. Regional estimates were controlled to the annual update to the National accounts released August 26, 2021.
2020 2021
Effects of Selected Federal Pandemic Response Programs on State Personal Income, 2021Q2Georgia
(Millions of dollars, seasonally adjusted at annual rates)Levels Change from preceding period
Note: BEA state per capita personal income statistics are calculated using unpublished Census Bureau midquarter population estimates. These midquarter estimates are based on the 2010 census. BEA will incorporate Census Bureau population estimates based on the 2020 census results wh
Source. U.S. Bureau of Economic AnalysisLast updated: September 23, 2021.
Line
3. Economic impact payments, initially established by the CARES Act, provide direct payments to individuals. For more information, see How are federal economic impact payments to support individuals during the COVID-19 pandemic recorded in the NIPAs?4. The Federal Emergency Management Agency (FEMA) was authorized to make payments from the Disaster Relief Fund to supplement wages lost as a result of the COVID-19 pandemic.5. The Paycheck Protection Program, initially established by the CARES Act, provides forgivable loans to help small businesses and nonprofit institutions make payroll and cover other expenses. It also provides funding to reimburse private lending institutions for the costs of administering these loans. For more information, see How does the Paycheck Protection Program impact the national income and product accounts (NIPAs)?6. The Department of Health and Human Services distributes money from the Provider Relief Fund to hospitals and health care providers on the front lines of the coronavirus response. This funding supports health care-related expenses or lost revenue attributable to COVID-19 and ensures uninsured Americans can get treatment for COVID-19. In the NIPAs, funds provided to nonprofit hospitals are recorded as social benefits.7. The Coronavirus Food Assistance Program, initially established by the CARES Act, provides direct support to farmers and ranchers where prices and market supply chains have been impacted by the COVID-19 pandemic.
CARES -Coronavirus Aid, Relief, and Economic SecurityNPISH -Nonprofit institutions serving households1. A two percent reduction in reimbursements paid to Medicare service providers that went into effect in 2013 was initially suspended by the CARES Act. The resulting increased reimbursement rates went into effect beginning on May 1, 2020.2. Unemployment insurance benefits were expanded through several programs that were initially established through the CARES Act. For more information, see How will the expansion of unemployment benefits in response to the COVID-19 pandemic be recorded in the NIPAs?
2020 2021

Q1 Q2 Q3 Q4 Q1 Q2 Q2 Q3 Q4 Q1 Q2Personal income (millions of dollars) 1 77,356.7 87,787.7 82,980.6 81,984.4 91,749.7 85,039.6 10,430.9 -4,807.1 -996.2 9,765.3 -6,710.1 Nonfarm personal income 2 77,184.5 87,549.9 82,699.5 81,701.3 91,528.9 84,781.3 10,365.4 -4,850.4 -998.2 9,827.6 -6,747.5 Farm income 3 172.2 237.8 281.1 283.1 220.9 258.3 65.6 43.3 2.0 -62.3 37.4Population (persons) 4 1,411,684 1,408,762 1,405,965 1,403,784 1,401,274 1,398,512 -2,922 -2,797 -2,181 -2,510 -2,762Per capita personal income (dollars) 5 54,797 62,315 59,020 58,402 65,476 60,807 7,518 -3,295 -618 7,074 -4,669Derivation of personal income Earnings by place of work 6 55,234.8 51,414.8 54,635.0 55,827.2 55,727.6 57,113.7 -3,819.9 3,220.2 1,192.2 -99.6 1,386.1 Less: Contributions for government social insurance 7 6,393.4 6,029.5 6,294.3 6,430.7 6,509.6 6,703.1 -363.9 264.8 136.4 78.9 193.5 Employee and self-employed contributions for government social insurance 8 3,403.3 3,190.9 3,335.8 3,414.4 3,451.8 3,556.7 -212.4 144.9 78.6 37.4 104.9 Employer contributions for government social insurance 9 2,990.1 2,838.6 2,958.5 3,016.3 3,057.8 3,146.4 -151.5 119.9 57.8 41.6 88.6 Plus: Adjustment for residence 10 0.0 0.0 0.0 0.0 0.0 0.0 0.0 0.0 0.0 0.0 0.0 Equals: Net earnings by place of residence 11 48,841.4 45,385.4 48,340.7 49,396.5 49,218.0 50,410.6 -3,456.0 2,955.4 1,055.8 -178.6 1,192.6 Plus: Dividends, interest, and rent 12 15,381.2 15,166.7 15,045.0 15,101.7 15,148.1 15,226.5 -214.4 -121.7 56.6 46.4 78.4 Plus: Personal current transfer receipts 13 13,134.2 27,235.6 19,594.8 17,486.2 27,383.6 19,402.5 14,101.4 -7,640.8 -2,108.6 9,897.5 -7,981.1 Social Security 14 4,730.4 4,768.7 4,798.3 4,841.3 4,925.2 4,941.4 38.3 29.6 43.0 83.9 16.2 Medicare 15 2,946.4 2,997.6 3,015.1 2,998.6 2,973.5 2,977.7 51.2 17.5 -16.5 -25.1 4.2 Of which: Increase in Medicare reimbursement rates1 16 35.1 52.6 52.2 51.8 51.5 35.1 17.5 -0.4 -0.4 -0.4 Medicaid 17 2,196.4 2,376.0 2,591.7 2,609.8 2,816.7 2,986.5 179.6 215.7 18.2 206.9 169.8 State unemployment insurance 18 159.2 7,314.8 5,322.4 2,747.5 4,277.4 3,372.6 7,155.6 -1,992.4 -2,574.9 1,529.8 -904.8 Of which:2
Extended Unemployment Benefits 19 0.0 0.0 13.4 85.7 12.7 0.0 0.0 13.4 72.3 -73.0 Pandemic Emergency Unemployment Compensation 20 17.1 52.9 976.2 1,343.6 1,055.3 17.1 35.8 923.3 367.4 -288.4 Pandemic Unemployment Assistance 21 513.7 611.0 650.4 576.5 492.0 513.7 97.3 39.5 -73.9 -84.6 Pandemic Unemployment Compensation Payments 22 3,932.6 2,484.5 103.8 1,610.6 1,307.0 3,932.6 -1,448.1 -2,380.7 1,506.8 -303.6 All other personal current transfer receipts 23 3,101.8 9,778.4 3,867.4 4,288.9 12,390.8 5,124.3 6,676.7 -5,911.0 421.5 8,101.9 -7,266.5 Of which: Economic impact payments3 24 4,927.8 71.2 23.1 8,588.5 1,288.5 4,927.8 -4,856.5 -48.1 8,565.4 -7,300.0 Lost wages supplemental payments4 25 0.0 226.9 832.6 13.4 4.9 0.0 226.9 605.7 -819.2 -8.6 Paycheck Protection Program loans to NPISH5 26 841.6 129.7 39.0 77.1 58.7 841.6 -711.9 -90.8 38.1 -18.4 Provider Relief Fund to NPISH6 27 7.0 737.9 163.9 120.5 172.5 107.2 730.9 -574.0 -43.4 52.0 -65.3Components of earnings by place of work Wages and salaries 28 37,583.6 34,480.6 36,378.0 37,519.1 37,543.9 38,863.2 -3,103.0 1,897.4 1,141.1 24.8 1,319.3 Supplements to wages and salaries 29 10,912.5 10,498.0 10,970.6 11,193.5 11,259.9 11,467.9 -414.5 472.5 222.9 66.4 208.0 Employer contributions for employee pension and insurance funds 30 7,922.4 7,659.5 8,012.1 8,177.3 8,202.1 8,321.5 -262.9 352.6 165.1 24.9 119.4 Employer contributions for government social insurance 31 2,990.1 2,838.6 2,958.5 3,016.3 3,057.8 3,146.4 -151.5 119.9 57.8 41.6 88.6 Proprietors' income 32 6,738.6 6,436.2 7,286.5 7,114.6 6,923.8 6,782.6 -302.5 850.3 -171.9 -190.8 -141.1 Farm proprietors' income 33 -17.3 48.0 89.6 88.4 21.9 56.8 65.3 41.6 -1.2 -66.4 34.8 Of which: Coronavirus Food Assistance Program7 34 11.0 45.6 65.6 0.9 9.2 11.0 34.6 20.0 -64.7 8.3 Paycheck Protection Program loans to businesses5 35 27.3 38.8 11.7 8.2 17.7 27.3 11.5 -27.1 -3.5 9.6 Nonfarm proprietors' income 36 6,755.9 6,388.2 7,196.9 7,026.2 6,901.8 6,725.9 -367.7 808.7 -170.7 -124.4 -176.0 Of which: Paycheck Protection Program loans to businesses5 37 1,606.6 1,450.0 624.4 453.8 427.1 1,606.6 -156.6 -825.6 -170.6 -26.7
Data on this table will be superseded by updated estimates. Regional estimates were controlled to the annual update to the National accounts released August 26, 2021.
2020 2021
Effects of Selected Federal Pandemic Response Programs on State Personal Income, 2021Q2Hawaii
(Millions of dollars, seasonally adjusted at annual rates)Levels Change from preceding period
Note: BEA state per capita personal income statistics are calculated using unpublished Census Bureau midquarter population estimates. These midquarter estimates are based on the 2010 census. BEA will incorporate Census Bureau population estimates based on the 2020 census results wh
Source. U.S. Bureau of Economic AnalysisLast updated: September 23, 2021.
Line
3. Economic impact payments, initially established by the CARES Act, provide direct payments to individuals. For more information, see How are federal economic impact payments to support individuals during the COVID-19 pandemic recorded in the NIPAs?4. The Federal Emergency Management Agency (FEMA) was authorized to make payments from the Disaster Relief Fund to supplement wages lost as a result of the COVID-19 pandemic.5. The Paycheck Protection Program, initially established by the CARES Act, provides forgivable loans to help small businesses and nonprofit institutions make payroll and cover other expenses. It also provides funding to reimburse private lending institutions for the costs of administering these loans. For more information, see How does the Paycheck Protection Program impact the national income and product accounts (NIPAs)?6. The Department of Health and Human Services distributes money from the Provider Relief Fund to hospitals and health care providers on the front lines of the coronavirus response. This funding supports health care-related expenses or lost revenue attributable to COVID-19 and ensures uninsured Americans can get treatment for COVID-19. In the NIPAs, funds provided to nonprofit hospitals are recorded as social benefits.7. The Coronavirus Food Assistance Program, initially established by the CARES Act, provides direct support to farmers and ranchers where prices and market supply chains have been impacted by the COVID-19 pandemic.
CARES -Coronavirus Aid, Relief, and Economic SecurityNPISH -Nonprofit institutions serving households1. A two percent reduction in reimbursements paid to Medicare service providers that went into effect in 2013 was initially suspended by the CARES Act. The resulting increased reimbursement rates went into effect beginning on May 1, 2020.2. Unemployment insurance benefits were expanded through several programs that were initially established through the CARES Act. For more information, see How will the expansion of unemployment benefits in response to the COVID-19 pandemic be recorded in the NIPAs?
2020 2021

Q1 Q2 Q3 Q4 Q1 Q2 Q2 Q3 Q4 Q1 Q2Personal income (millions of dollars) 1 86,666.9 92,365.1 87,911.3 89,367.6 101,872.6 93,450.3 5,698.2 -4,453.8 1,456.3 12,505.0 -8,422.3 Nonfarm personal income 2 83,680.1 89,742.9 84,249.4 85,278.9 98,953.3 89,968.1 6,062.8 -5,493.5 1,029.5 13,674.5 -8,985.3 Farm income 3 2,986.8 2,622.2 3,661.9 4,088.7 2,919.3 3,482.2 -364.6 1,039.7 426.8 -1,169.4 563.0Population (persons) 4 1,813,615 1,822,513 1,831,954 1,841,857 1,850,797 1,860,060 8,898 9,441 9,903 8,940 9,263Per capita personal income (dollars) 5 47,787 50,680 47,988 48,520 55,043 50,240 2,893 -2,692 532 6,523 -4,803Derivation of personal income Earnings by place of work 6 58,537.3 54,084.5 57,850.5 60,347.9 60,433.0 61,722.4 -4,452.7 3,766.0 2,497.4 85.0 1,289.4 Less: Contributions for government social insurance 7 7,068.1 6,736.6 7,030.8 7,225.9 7,471.9 7,574.7 -331.5 294.2 195.1 246.1 102.7 Employee and self-employed contributions for government social insurance 8 3,807.3 3,605.9 3,750.2 3,855.2 3,978.0 4,030.4 -201.4 144.3 105.0 122.8 52.3 Employer contributions for government social insurance 9 3,260.8 3,130.7 3,280.6 3,370.7 3,493.9 3,544.3 -130.1 149.9 90.1 123.2 50.4 Plus: Adjustment for residence 10 1,504.3 1,414.9 1,486.4 1,546.7 1,555.4 1,596.7 -89.5 71.5 60.3 8.6 41.3 Equals: Net earnings by place of residence 11 52,973.5 48,762.8 52,306.2 54,668.8 54,516.4 55,744.4 -4,210.7 3,543.4 2,362.6 -152.4 1,228.0 Plus: Dividends, interest, and rent 12 17,966.2 17,614.1 17,345.6 17,635.1 17,625.1 17,837.6 -352.2 -268.4 289.5 -10.0 212.5 Plus: Personal current transfer receipts 13 15,727.2 25,988.3 18,259.5 17,063.7 29,731.1 19,868.3 10,261.1 -7,728.8 -1,195.8 12,667.4 -9,862.8 Social Security 14 6,013.0 6,075.0 6,122.7 6,190.6 6,321.7 6,347.0 62.0 47.6 67.9 131.1 25.3 Medicare 15 3,714.1 3,792.0 3,819.4 3,795.8 3,755.7 3,762.6 77.9 27.4 -23.6 -40.1 6.9 Of which: Increase in Medicare reimbursement rates1 16 44.4 66.5 66.0 65.5 65.1 44.4 22.1 -0.5 -0.5 -0.5 Medicaid 17 2,191.6 2,490.3 2,717.3 2,714.2 2,824.0 3,066.4 298.8 226.9 -3.0 109.8 242.4 State unemployment insurance 18 88.5 2,467.0 1,127.4 370.7 712.7 339.6 2,378.5 -1,339.6 -756.7 342.0 -373.1 Of which:2
Extended Unemployment Benefits 19 (L) 1.3 (L) (L) 0.1 (L) (L) (L) (L) (L) Pandemic Emergency Unemployment Compensation 20 26.9 89.6 81.8 116.1 58.1 26.9 62.7 -7.8 34.2 -57.9 Pandemic Unemployment Assistance 21 132.9 144.0 138.7 85.8 40.9 132.9 11.1 -5.3 -52.9 -44.9 Pandemic Unemployment Compensation Payments 22 1,767.6 558.9 5.3 421.4 166.8 1,767.6 -1,208.7 -553.6 416.1 -254.6 All other personal current transfer receipts 23 3,719.9 11,163.8 4,472.7 3,992.4 16,117.0 6,352.8 7,443.9 -6,691.2 -480.3 12,124.6 -9,764.2 Of which: Economic impact payments3 24 6,361.2 91.6 29.7 11,679.5 1,752.2 6,361.2 -6,269.6 -61.9 11,649.7 -9,927.3 Lost wages supplemental payments4 25 0.0 171.7 0.0 0.0 0.0 0.0 171.7 -171.7 0.0 0.0 Paycheck Protection Program loans to NPISH5 26 176.6 272.1 81.8 26.2 30.7 176.6 95.5 -190.3 -55.6 4.5 Provider Relief Fund to NPISH6 27 6.7 709.0 92.3 69.5 147.1 91.4 702.3 -616.7 -22.8 77.6 -55.7Components of earnings by place of work Wages and salaries 28 39,009.6 36,246.4 38,128.6 39,539.8 40,379.5 41,105.1 -2,763.2 1,882.2 1,411.3 839.6 725.7 Supplements to wages and salaries 29 9,379.5 8,879.8 9,229.8 9,426.9 9,640.8 9,722.7 -499.7 350.0 197.1 213.9 81.9 Employer contributions for employee pension and insurance funds 30 6,118.6 5,749.1 5,949.2 6,056.2 6,146.9 6,178.4 -369.6 200.1 107.0 90.6 31.6 Employer contributions for government social insurance 31 3,260.8 3,130.7 3,280.6 3,370.7 3,493.9 3,544.3 -130.1 149.9 90.1 123.2 50.4 Proprietors' income 32 10,148.1 8,958.3 10,492.1 11,381.2 10,412.7 10,894.6 -1,189.8 1,533.8 889.0 -968.4 481.8 Farm proprietors' income 33 2,275.3 1,918.3 2,957.3 3,375.0 2,190.2 2,743.2 -357.0 1,039.0 417.7 -1,184.8 553.1 Of which: Coronavirus Food Assistance Program7 34 320.8 481.1 923.2 10.8 33.7 320.8 160.3 442.1 -912.4 22.8 Paycheck Protection Program loans to businesses5 35 159.8 227.0 68.2 39.7 94.7 159.8 67.2 -158.8 -28.5 54.9 Nonfarm proprietors' income 36 7,872.9 7,040.0 7,534.8 8,006.2 8,222.6 8,151.3 -832.9 494.8 471.4 216.4 -71.2 Of which: Paycheck Protection Program loans to businesses5 37 1,142.8 609.2 459.4 316.6 426.6 1,142.8 -533.6 -149.8 -142.8 110.0
Data on this table will be superseded by updated estimates. Regional estimates were controlled to the annual update to the National accounts released August 26, 2021.
2021 2020 2021
Effects of Selected Federal Pandemic Response Programs on State Personal Income, 2021Q2Idaho
(Millions of dollars, seasonally adjusted at annual rates)Levels Change from preceding period
(L) Less than $50,000.
Note: BEA state per capita personal income statistics are calculated using unpublished Census Bureau midquarter population estimates. These midquarter estimates are based on the 2010 census. BEA will incorporate Census Bureau population estimates based on the 2020 census results when t
Source. U.S. Bureau of Economic AnalysisLast updated: September 23, 2021.
Line
3. Economic impact payments, initially established by the CARES Act, provide direct payments to individuals. For more information, see How are federal economic impact payments to support individuals during the COVID-19 pandemic recorded in the NIPAs?
4. The Federal Emergency Management Agency (FEMA) was authorized to make payments from the Disaster Relief Fund to supplement wages lost as a result of the COVID-19 pandemic.5. The Paycheck Protection Program, initially established by the CARES Act, provides forgivable loans to help small businesses and nonprofit institutions make payroll and cover other expenses. It also provides funding to reimburse private lending institutions for the costs of administering these loans. For more information, see How does the Paycheck Protection Program impact the national income and product accounts (NIPAs)?6. The Department of Health and Human Services distributes money from the Provider Relief Fund to hospitals and health care providers on the front lines of the coronavirus response. This funding supports health care-related expenses or lost revenue attributable to COVID-19 and ensures 7. The Coronavirus Food Assistance Program, initially established by the CARES Act, provides direct support to farmers and ranchers where prices and market supply chains have been impacted by the COVID-19 pandemic.
CARES -Coronavirus Aid, Relief, and Economic SecurityNPISH -Nonprofit institutions serving households
1. A two percent reduction in reimbursements paid to Medicare service providers that went into effect in 2013 was initially suspended by the CARES Act. The resulting increased reimbursement rates went into effect beginning on May 1, 2020.2. Unemployment insurance benefits were expanded through several programs that were initially established through the CARES Act. For more information, see How will the expansion of unemployment benefits in response to the COVID-19 pandemic be recorded in the NIPAs?
2020

Q1 Q2 Q3 Q4 Q1 Q2 Q2 Q3 Q4 Q1 Q2Personal income (millions of dollars) 1 760,301.6 814,570.1 799,747.1 793,923.0 885,872.2 841,320.6 54,268.5 -14,822.9 -5,824.1 91,949.2 -44,551.6 Nonfarm personal income 2 756,041.9 810,122.2 794,733.6 785,806.5 878,478.6 830,573.1 54,080.3 -15,388.6 -8,927.2 92,672.1 -47,905.5 Farm income 3 4,259.6 4,447.9 5,013.5 8,116.6 7,393.6 10,747.5 188.2 565.7 3,103.0 -722.9 3,353.9Population (persons) 4 12,625,670 12,600,937 12,578,779 12,559,673 12,534,991 12,511,672 -24,733 -22,158 -19,106 -24,682 -23,319Per capita personal income (dollars) 5 60,219 64,644 63,579 63,212 70,672 67,243 4,425 -1,065 -367 7,460 -3,429Derivation of personal income Earnings by place of work 6 550,538.1 513,603.0 549,109.5 565,153.4 573,305.3 592,774.8 -36,935.1 35,506.4 16,044.0 8,151.8 19,469.5 Less: Contributions for government social insurance 7 57,966.7 55,503.4 57,506.3 59,238.1 60,921.1 61,881.8 -2,463.3 2,002.9 1,731.8 1,683.0 960.7 Employee and self-employed contributions for government social insurance 8 31,506.2 30,119.5 31,151.4 32,121.8 32,959.6 33,452.8 -1,386.7 1,031.9 970.4 837.7 493.3 Employer contributions for government social insurance 9 26,460.5 25,383.9 26,354.9 27,116.3 27,961.5 28,428.9 -1,076.6 971.0 761.4 845.2 467.4 Plus: Adjustment for residence 10 -3,995.7 -3,818.2 -3,967.9 -4,142.9 -4,309.1 -4,408.7 177.5 -149.6 -175.0 -166.2 -99.6 Equals: Net earnings by place of residence 11 488,575.7 454,281.4 487,635.4 501,772.4 508,075.1 526,484.4 -34,294.3 33,354.0 14,137.1 6,302.7 18,409.2 Plus: Dividends, interest, and rent 12 154,244.0 151,451.3 149,157.7 151,266.5 151,048.6 152,593.5 -2,792.7 -2,293.6 2,108.8 -217.9 1,544.8 Plus: Personal current transfer receipts 13 117,481.9 208,837.4 162,954.1 140,884.1 226,748.5 162,242.8 91,355.5 -45,883.3 -22,070.0 85,864.4 -64,505.7 Social Security 14 39,343.7 39,529.0 39,677.5 39,932.1 40,468.9 40,572.6 185.3 148.5 254.6 536.8 103.6 Medicare 15 30,053.9 30,491.9 30,626.7 30,455.9 30,228.5 30,266.1 438.0 134.8 -170.8 -227.4 37.6 Of which: Increase in Medicare reimbursement rates1 16 357.4 535.1 531.1 527.1 523.4 357.4 177.7 -4.0 -4.0 -3.7 Medicaid 17 21,399.8 24,617.1 26,314.9 27,609.4 27,473.0 28,216.2 3,217.3 1,697.7 1,294.5 -136.4 743.3 State unemployment insurance 18 1,607.7 36,081.0 29,061.1 14,185.4 25,906.2 21,139.4 34,473.2 -7,019.9 -14,875.6 11,720.7 -4,766.7 Of which:2
Extended Unemployment Benefits 19 7.5 217.0 617.1 1,540.9 18.4 7.5 209.4 400.1 923.8 -1,522.4 Pandemic Emergency Unemployment Compensation 20 314.2 666.3 3,661.7 3,994.1 5,362.8 314.2 352.1 2,995.4 332.4 1,368.7 Pandemic Unemployment Assistance 21 1,391.5 3,632.3 4,887.7 4,561.9 2,773.8 1,391.5 2,240.8 1,255.4 -325.8 -1,788.1 Pandemic Unemployment Compensation Payments 22 22,055.2 15,647.8 1,383.4 13,152.4 10,668.5 22,055.2 -6,407.3 -14,264.4 11,769.0 -2,483.9 All other personal current transfer receipts 23 25,076.7 78,118.4 37,273.9 28,701.2 102,671.9 42,048.5 53,041.7 -40,844.4 -8,572.7 73,970.7 -60,623.4 Of which: Economic impact payments3 24 40,096.6 578.3 187.6 71,857.4 10,780.3 40,096.6 -39,518.3 -390.7 71,669.9 -61,077.1 Lost wages supplemental payments4 25 0.0 4,288.1 685.1 50.8 11.5 0.0 4,288.1 -3,603.0 -634.3 -39.3 Paycheck Protection Program loans to NPISH5 26 4,083.7 1,967.3 591.2 532.4 968.1 4,083.7 -2,116.4 -1,376.2 -58.8 435.7 Provider Relief Fund to NPISH6 27 73.5 7,757.1 4,314.8 1,130.9 2,225.0 1,382.9 7,683.6 -3,442.2 -3,184.0 1,094.2 -842.2Components of earnings by place of work Wages and salaries 28 399,990.6 375,266.6 392,753.2 408,633.0 414,990.2 423,213.6 -24,724.0 17,486.6 15,879.8 6,357.1 8,223.4 Supplements to wages and salaries 29 90,042.2 85,704.3 89,009.2 91,215.0 92,732.7 93,490.7 -4,337.9 3,304.9 2,205.8 1,517.7 758.0 Employer contributions for employee pension and insurance funds 30 63,581.8 60,320.4 62,654.4 64,098.7 64,771.2 65,061.7 -3,261.3 2,333.9 1,444.3 672.5 290.6 Employer contributions for government social insurance 31 26,460.5 25,383.9 26,354.9 27,116.3 27,961.5 28,428.9 -1,076.6 971.0 761.4 845.2 467.4 Proprietors' income 32 60,505.3 52,632.2 67,347.1 65,305.4 65,582.4 76,070.6 -7,873.1 14,714.9 -2,041.7 277.0 10,488.1 Farm proprietors' income 33 3,777.7 3,966.8 4,529.2 7,624.5 6,891.0 10,238.2 189.1 562.4 3,095.3 -733.5 3,347.2 Of which: Coronavirus Food Assistance Program7 34 800.7 880.0 2,756.1 5.1 35.1 800.7 79.3 1,876.2 -2,751.0 29.9 Paycheck Protection Program loans to businesses5 35 271.2 385.3 115.8 340.4 797.5 271.2 114.0 -269.5 224.6 457.1 Nonfarm proprietors' income 36 56,727.6 48,665.4 62,817.9 57,680.9 58,691.4 65,832.3 -8,062.2 14,152.6 -5,137.0 1,010.5 7,140.9 Of which: Paycheck Protection Program loans to businesses5 37 5,250.4 12,841.0 2,859.2 3,681.1 11,806.6 5,250.4 7,590.6 -9,981.9 822.0 8,125.5
Data on this table will be superseded by updated estimates. Regional estimates were controlled to the annual update to the National accounts released August 26, 2021.
2020 2021
Effects of Selected Federal Pandemic Response Programs on State Personal Income, 2021Q2Illinois
(Millions of dollars, seasonally adjusted at annual rates)Levels Change from preceding period
Note: BEA state per capita personal income statistics are calculated using unpublished Census Bureau midquarter population estimates. These midquarter estimates are based on the 2010 census. BEA will incorporate Census Bureau population estimates based on the 2020 census results wh
Source. U.S. Bureau of Economic AnalysisLast updated: September 23, 2021.
Line
3. Economic impact payments, initially established by the CARES Act, provide direct payments to individuals. For more information, see How are federal economic impact payments to support individuals during the COVID-19 pandemic recorded in the NIPAs?4. The Federal Emergency Management Agency (FEMA) was authorized to make payments from the Disaster Relief Fund to supplement wages lost as a result of the COVID-19 pandemic.5. The Paycheck Protection Program, initially established by the CARES Act, provides forgivable loans to help small businesses and nonprofit institutions make payroll and cover other expenses. It also provides funding to reimburse private lending institutions for the costs of administering these loans. For more information, see How does the Paycheck Protection Program impact the national income and product accounts (NIPAs)?6. The Department of Health and Human Services distributes money from the Provider Relief Fund to hospitals and health care providers on the front lines of the coronavirus response. This funding supports health care-related expenses or lost revenue attributable to COVID-19 and ensures uninsured Americans can get treatment for COVID-19. In the NIPAs, funds provided to nonprofit hospitals are recorded as social benefits.7. The Coronavirus Food Assistance Program, initially established by the CARES Act, provides direct support to farmers and ranchers where prices and market supply chains have been impacted by the COVID-19 pandemic.
CARES -Coronavirus Aid, Relief, and Economic SecurityNPISH -Nonprofit institutions serving households1. A two percent reduction in reimbursements paid to Medicare service providers that went into effect in 2013 was initially suspended by the CARES Act. The resulting increased reimbursement rates went into effect beginning on May 1, 2020.2. Unemployment insurance benefits were expanded through several programs that were initially established through the CARES Act. For more information, see How will the expansion of unemployment benefits in response to the COVID-19 pandemic be recorded in the NIPAs?
2020 2021

Q1 Q2 Q3 Q4 Q1 Q2 Q2 Q3 Q4 Q1 Q2Personal income (millions of dollars) 1 338,781.2 363,680.2 349,234.3 351,342.3 400,397.2 369,892.8 24,899.0 -14,445.9 2,108.0 49,054.8 -30,504.4 Nonfarm personal income 2 335,981.3 361,483.4 346,444.3 346,783.4 396,402.4 364,248.2 25,502.1 -15,039.1 339.1 49,619.0 -32,154.3 Farm income 3 2,799.9 2,196.8 2,790.0 4,558.9 3,994.7 5,644.6 -603.1 593.2 1,768.9 -564.2 1,649.9Population (persons) 4 6,749,563 6,753,337 6,758,180 6,763,974 6,767,021 6,771,473 3,774 4,843 5,794 3,047 4,452Per capita personal income (dollars) 5 50,193 53,852 51,676 51,943 59,169 54,625 3,659 -2,176 267 7,226 -4,544Derivation of personal income Earnings by place of work 6 238,841.2 221,205.6 236,196.6 245,502.4 248,043.4 253,402.3 -17,635.7 14,991.0 9,305.8 2,541.0 5,359.0 Less: Contributions for government social insurance 7 27,342.5 26,128.4 27,286.6 28,112.1 28,896.5 29,253.3 -1,214.0 1,158.1 825.5 784.4 356.8 Employee and self-employed contributions for government social insurance 8 15,034.2 14,308.2 14,937.4 15,405.4 15,771.2 15,969.3 -726.0 629.2 468.0 365.8 198.1 Employer contributions for government social insurance 9 12,308.3 11,820.2 12,349.1 12,706.7 13,125.3 13,283.9 -488.1 528.9 357.6 418.6 158.6 Plus: Adjustment for residence 10 7,799.1 7,351.4 7,676.8 7,969.4 8,050.6 8,203.0 -447.7 325.4 292.6 81.1 152.5 Equals: Net earnings by place of residence 11 219,297.8 202,428.5 216,586.8 225,359.7 227,197.4 232,352.1 -16,869.3 14,158.4 8,772.9 1,837.7 5,154.7 Plus: Dividends, interest, and rent 12 53,835.5 52,886.0 52,157.8 52,815.8 52,793.7 53,300.9 -949.5 -728.2 658.0 -22.1 507.1 Plus: Personal current transfer receipts 13 65,647.9 108,365.7 80,489.7 73,166.8 120,406.0 84,239.8 42,717.8 -27,876.0 -7,322.9 47,239.2 -36,166.2 Social Security 14 24,043.5 24,177.0 24,282.5 24,453.4 24,805.2 24,873.1 133.5 105.5 170.9 351.7 67.9 Medicare 15 16,547.6 16,802.9 16,883.4 16,787.7 16,655.2 16,677.3 255.3 80.5 -95.7 -132.5 22.1 Of which: Increase in Medicare reimbursement rates1 16 196.9 294.9 292.6 290.4 288.4 196.9 97.9 -2.2 -2.2 -2.0 Medicaid 17 12,729.3 14,330.3 15,577.4 15,368.5 16,061.3 16,634.0 1,600.9 1,247.1 -208.8 692.8 572.7 State unemployment insurance 18 417.8 13,603.1 7,532.8 2,892.4 6,519.0 5,324.3 13,185.4 -6,070.4 -4,640.4 3,626.6 -1,194.7 Of which:2
Extended Unemployment Benefits 19 0.0 28.6 28.4 1.4 0.1 0.0 28.6 -0.2 -27.0 -1.3 Pandemic Emergency Unemployment Compensation 20 63.3 108.1 609.5 908.9 774.1 63.3 44.8 501.3 299.4 -134.8 Pandemic Unemployment Assistance 21 738.3 854.3 1,069.8 1,171.1 1,004.9 738.3 116.0 215.5 101.3 -166.1 Pandemic Unemployment Compensation Payments 22 9,365.9 4,515.0 388.6 3,932.8 3,092.5 9,365.9 -4,850.8 -4,126.4 3,544.2 -840.4 All other personal current transfer receipts 23 11,909.7 39,452.5 16,213.7 13,664.8 56,365.3 20,731.2 27,542.7 -23,238.8 -2,548.9 42,700.5 -35,634.1 Of which: Economic impact payments3 24 23,282.1 335.2 108.7 42,165.2 6,325.8 23,282.1 -22,946.8 -226.5 42,056.5 -35,839.4 Lost wages supplemental payments4 25 0.0 1,227.2 253.4 26.6 15.0 0.0 1,227.2 -973.8 -226.8 -11.7 Paycheck Protection Program loans to NPISH5 26 673.7 1,263.7 379.7 168.0 291.4 673.7 590.0 -884.0 -211.7 123.3 Provider Relief Fund to NPISH6 27 29.1 3,072.6 957.1 485.5 761.6 473.3 3,043.5 -2,115.5 -471.6 276.1 -288.3Components of earnings by place of work Wages and salaries 28 165,991.8 154,085.3 162,078.0 168,291.0 170,518.9 173,483.4 -11,906.5 7,992.6 6,213.1 2,227.9 2,964.4 Supplements to wages and salaries 29 38,807.0 36,973.5 38,663.2 39,732.0 40,674.3 40,909.1 -1,833.4 1,689.6 1,068.8 942.3 234.8 Employer contributions for employee pension and insurance funds 30 26,498.7 25,153.3 26,314.0 27,025.2 27,548.9 27,625.1 -1,345.4 1,160.7 711.2 523.7 76.2 Employer contributions for government social insurance 31 12,308.3 11,820.2 12,349.1 12,706.7 13,125.3 13,283.9 -488.1 528.9 357.6 418.6 158.6 Proprietors' income 32 34,042.4 30,146.7 35,455.5 37,479.4 36,850.1 39,009.9 -3,895.8 5,308.8 2,023.9 -629.2 2,159.7 Farm proprietors' income 33 2,437.4 1,837.4 2,429.6 4,193.4 3,621.4 5,266.1 -600.1 592.3 1,763.8 -572.1 1,644.7 Of which: Coronavirus Food Assistance Program7 34 434.0 426.9 1,450.1 0.0 24.9 434.0 -7.1 1,023.2 -1,450.1 24.9 Paycheck Protection Program loans to businesses5 35 117.2 166.5 50.0 119.5 275.8 117.2 49.3 -116.5 69.5 156.2 Nonfarm proprietors' income 36 31,605.0 28,309.3 33,025.8 33,285.9 33,228.7 33,743.8 -3,295.7 4,716.5 260.1 -57.2 515.0 Of which: Paycheck Protection Program loans to businesses5 37 3,016.6 3,614.3 1,351.7 1,080.4 2,683.4 3,016.6 597.6 -2,262.6 -271.3 1,603.0
Data on this table will be superseded by updated estimates. Regional estimates were controlled to the annual update to the National accounts released August 26, 2021.
2020 2021
Effects of Selected Federal Pandemic Response Programs on State Personal Income, 2021Q2Indiana
(Millions of dollars, seasonally adjusted at annual rates)Levels Change from preceding period
Note: BEA state per capita personal income statistics are calculated using unpublished Census Bureau midquarter population estimates. These midquarter estimates are based on the 2010 census. BEA will incorporate Census Bureau population estimates based on the 2020 census results wh
Source. U.S. Bureau of Economic AnalysisLast updated: September 23, 2021.
Line
3. Economic impact payments, initially established by the CARES Act, provide direct payments to individuals. For more information, see How are federal economic impact payments to support individuals during the COVID-19 pandemic recorded in the NIPAs?4. The Federal Emergency Management Agency (FEMA) was authorized to make payments from the Disaster Relief Fund to supplement wages lost as a result of the COVID-19 pandemic.5. The Paycheck Protection Program, initially established by the CARES Act, provides forgivable loans to help small businesses and nonprofit institutions make payroll and cover other expenses. It also provides funding to reimburse private lending institutions for the costs of administering these loans. For more information, see How does the Paycheck Protection Program impact the national income and product accounts (NIPAs)?6. The Department of Health and Human Services distributes money from the Provider Relief Fund to hospitals and health care providers on the front lines of the coronavirus response. This funding supports health care-related expenses or lost revenue attributable to COVID-19 and ensures uninsured Americans can get treatment for COVID-19. In the NIPAs, funds provided to nonprofit hospitals are recorded as social benefits.7. The Coronavirus Food Assistance Program, initially established by the CARES Act, provides direct support to farmers and ranchers where prices and market supply chains have been impacted by the COVID-19 pandemic.
CARES -Coronavirus Aid, Relief, and Economic SecurityNPISH -Nonprofit institutions serving households1. A two percent reduction in reimbursements paid to Medicare service providers that went into effect in 2013 was initially suspended by the CARES Act. The resulting increased reimbursement rates went into effect beginning on May 1, 2020.2. Unemployment insurance benefits were expanded through several programs that were initially established through the CARES Act. For more information, see How will the expansion of unemployment benefits in response to the COVID-19 pandemic be recorded in the NIPAs?
2020 2021

Q1 Q2 Q3 Q4 Q1 Q2 Q2 Q3 Q4 Q1 Q2Personal income (millions of dollars) 1 162,492.5 176,419.8 167,002.6 170,811.6 190,352.2 178,648.6 13,927.3 -9,417.2 3,809.0 19,540.6 -11,703.6 Nonfarm personal income 2 160,337.5 174,664.0 164,253.2 164,169.1 186,264.6 171,170.5 14,326.6 -10,410.8 -84.0 22,095.4 -15,094.0 Farm income 3 2,155.1 1,755.8 2,749.4 6,642.5 4,087.6 7,478.1 -399.3 993.6 3,893.0 -2,554.8 3,390.4Population (persons) 4 3,163,869 3,163,732 3,164,061 3,164,703 3,164,178 3,164,353 -137 329 642 -525 175Per capita personal income (dollars) 5 51,359 55,763 52,781 53,974 60,159 56,457 4,404 -2,982 1,193 6,185 -3,702Derivation of personal income Earnings by place of work 6 114,015.5 106,209.5 112,782.1 120,643.0 118,863.9 123,648.7 -7,806.0 6,572.6 7,860.9 -1,779.1 4,784.8 Less: Contributions for government social insurance 7 13,830.7 13,309.1 13,808.7 14,206.7 14,498.3 14,648.3 -521.6 499.6 398.0 291.7 149.9 Employee and self-employed contributions for government social insurance 8 7,521.1 7,210.1 7,473.8 7,697.9 7,842.0 7,921.0 -311.1 263.8 224.1 144.0 79.0 Employer contributions for government social insurance 9 6,309.5 6,099.0 6,334.9 6,508.8 6,656.4 6,727.3 -210.5 235.9 173.9 147.6 70.9 Plus: Adjustment for residence 10 1,695.9 1,588.8 1,661.6 1,727.6 1,729.0 1,767.7 -107.1 72.8 66.0 1.4 38.6 Equals: Net earnings by place of residence 11 101,880.8 94,489.2 100,634.9 108,163.8 106,094.5 110,768.0 -7,391.6 6,145.7 7,528.9 -2,069.3 4,673.5 Plus: Dividends, interest, and rent 12 31,045.2 30,473.8 30,003.5 30,371.9 30,285.6 30,559.3 -571.3 -470.4 368.4 -86.3 273.8 Plus: Personal current transfer receipts 13 29,566.6 51,456.8 36,364.3 32,275.9 53,972.1 37,321.3 21,890.2 -15,092.5 -4,088.4 21,696.2 -16,650.8 Social Security 14 11,247.9 11,315.9 11,369.3 11,453.7 11,625.3 11,658.4 68.0 53.4 84.4 171.6 33.1 Medicare 15 7,308.1 7,422.2 7,459.4 7,418.8 7,361.8 7,371.2 114.2 37.1 -40.5 -57.1 9.5 Of which: Increase in Medicare reimbursement rates1 16 87.0 130.3 129.3 128.3 127.4 87.0 43.3 -1.0 -1.0 -0.9 Medicaid 17 5,032.9 5,405.2 5,783.5 5,501.1 5,617.6 6,060.6 372.2 378.3 -282.3 116.5 442.9 State unemployment insurance 18 411.8 7,262.5 3,561.6 1,515.8 2,723.8 2,096.6 6,850.7 -3,701.0 -2,045.7 1,208.0 -627.2 Of which:2
Extended Unemployment Benefits 19 0.0 32.2 36.9 0.7 1.3 0.0 32.2 4.7 -36.2 0.6 Pandemic Emergency Unemployment Compensation 20 56.5 233.3 439.1 254.6 327.1 56.5 176.8 205.8 -184.5 72.5 Pandemic Unemployment Assistance 21 215.5 232.7 228.9 248.8 182.1 215.5 17.1 -3.8 19.9 -66.8 Pandemic Unemployment Compensation Payments 22 4,688.9 1,673.2 234.6 1,791.7 1,174.5 4,688.9 -3,015.7 -1,438.6 1,557.1 -617.2 All other personal current transfer receipts 23 5,565.8 20,050.9 8,190.5 6,386.4 26,643.6 10,134.5 14,485.1 -11,860.4 -1,804.1 20,257.2 -16,509.2 Of which: Economic impact payments3 24 10,985.1 158.1 51.3 19,681.5 2,952.7 10,985.1 -10,827.0 -106.8 19,630.2 -16,728.8 Lost wages supplemental payments4 25 0.0 597.8 29.5 5.0 3.0 0.0 597.8 -568.4 -24.5 -2.0 Paycheck Protection Program loans to NPISH5 26 1,010.3 944.9 284.0 108.8 208.1 1,010.3 -65.3 -661.0 -175.1 99.3 Provider Relief Fund to NPISH6 27 20.9 2,209.5 666.9 226.0 523.5 325.3 2,188.6 -1,542.6 -440.9 297.5 -198.1Components of earnings by place of work Wages and salaries 28 81,220.8 76,174.4 79,721.5 82,754.3 83,438.3 84,680.3 -5,046.3 3,547.1 3,032.8 684.0 1,242.0 Supplements to wages and salaries 29 20,547.6 19,607.4 20,355.1 20,853.8 21,092.7 21,194.5 -940.1 747.7 498.7 238.9 101.8 Employer contributions for employee pension and insurance funds 30 14,238.0 13,508.4 14,020.3 14,345.0 14,436.3 14,467.2 -729.6 511.8 324.8 91.3 30.9 Employer contributions for government social insurance 31 6,309.5 6,099.0 6,334.9 6,508.8 6,656.4 6,727.3 -210.5 235.9 173.9 147.6 70.9 Proprietors' income 32 12,247.2 10,427.6 12,705.4 17,034.9 14,332.9 17,773.9 -1,819.6 2,277.8 4,329.5 -2,702.0 3,441.0 Farm proprietors' income 33 1,540.9 1,140.8 2,129.0 6,011.6 3,443.2 6,825.3 -400.0 988.2 3,882.6 -2,568.4 3,382.0 Of which: Coronavirus Food Assistance Program7 34 1,791.7 1,582.5 4,026.7 0.0 38.6 1,791.7 -209.2 2,444.1 -4,026.7 38.6 Paycheck Protection Program loans to businesses5 35 260.2 369.7 111.1 532.2 1,203.8 260.2 109.4 -258.6 421.1 671.6 Nonfarm proprietors' income 36 10,706.3 9,286.8 10,576.3 11,023.2 10,889.6 10,948.6 -1,419.5 1,289.6 446.9 -133.6 59.0 Of which: Paycheck Protection Program loans to businesses5 37 955.8 1,067.8 637.1 619.6 965.0 955.8 112.0 -430.8 -17.5 345.4
Data on this table will be superseded by updated estimates. Regional estimates were controlled to the annual update to the National accounts released August 26, 2021.
2020 2021
Effects of Selected Federal Pandemic Response Programs on State Personal Income, 2021Q2Iowa
(Millions of dollars, seasonally adjusted at annual rates)Levels Change from preceding period
Note: BEA state per capita personal income statistics are calculated using unpublished Census Bureau midquarter population estimates. These midquarter estimates are based on the 2010 census. BEA will incorporate Census Bureau population estimates based on the 2020 census results wh
Source. U.S. Bureau of Economic AnalysisLast updated: September 23, 2021.
Line
3. Economic impact payments, initially established by the CARES Act, provide direct payments to individuals. For more information, see How are federal economic impact payments to support individuals during the COVID-19 pandemic recorded in the NIPAs?4. The Federal Emergency Management Agency (FEMA) was authorized to make payments from the Disaster Relief Fund to supplement wages lost as a result of the COVID-19 pandemic.5. The Paycheck Protection Program, initially established by the CARES Act, provides forgivable loans to help small businesses and nonprofit institutions make payroll and cover other expenses. It also provides funding to reimburse private lending institutions for the costs of administering these loans. For more information, see How does the Paycheck Protection Program impact the national income and product accounts (NIPAs)?6. The Department of Health and Human Services distributes money from the Provider Relief Fund to hospitals and health care providers on the front lines of the coronavirus response. This funding supports health care-related expenses or lost revenue attributable to COVID-19 and ensures uninsured Americans can get treatment for COVID-19. In the NIPAs, funds provided to nonprofit hospitals are recorded as social benefits.7. The Coronavirus Food Assistance Program, initially established by the CARES Act, provides direct support to farmers and ranchers where prices and market supply chains have been impacted by the COVID-19 pandemic.
CARES -Coronavirus Aid, Relief, and Economic SecurityNPISH -Nonprofit institutions serving households1. A two percent reduction in reimbursements paid to Medicare service providers that went into effect in 2013 was initially suspended by the CARES Act. The resulting increased reimbursement rates went into effect beginning on May 1, 2020.2. Unemployment insurance benefits were expanded through several programs that were initially established through the CARES Act. For more information, see How will the expansion of unemployment benefits in response to the COVID-19 pandemic be recorded in the NIPAs?
2020 2021

Q1 Q2 Q3 Q4 Q1 Q2 Q2 Q3 Q4 Q1 Q2Personal income (millions of dollars) 1 158,409.5 169,709.3 160,691.8 165,038.1 180,862.3 170,078.5 11,299.8 -9,017.5 4,346.3 15,824.2 -10,783.8 Nonfarm personal income 2 156,244.2 168,307.0 158,493.8 160,351.2 177,838.6 164,919.6 12,062.8 -9,813.1 1,857.4 17,487.4 -12,918.9 Farm income 3 2,165.3 1,402.3 2,198.0 4,686.9 3,023.7 5,158.9 -762.9 795.7 2,488.9 -1,663.2 2,135.2Population (persons) 4 2,915,050 2,914,318 2,914,230 2,914,698 2,913,752 2,913,307 -732 -88 468 -946 -445Per capita personal income (dollars) 5 54,342 58,233 55,140 56,623 62,072 58,380 3,891 -3,093 1,483 5,449 -3,692Derivation of personal income Earnings by place of work 6 113,119.7 105,858.6 111,492.1 118,247.8 116,185.7 119,642.7 -7,261.2 5,633.5 6,755.7 -2,062.1 3,457.1 Less: Contributions for government social insurance 7 12,790.2 12,287.6 12,718.8 13,063.9 13,183.3 13,352.0 -502.6 431.2 345.1 119.3 168.7 Employee and self-employed contributions for government social insurance 8 6,979.8 6,673.6 6,903.1 7,099.4 7,146.6 7,234.6 -306.3 229.5 196.3 47.2 88.0 Employer contributions for government social insurance 9 5,810.4 5,614.0 5,815.7 5,964.5 6,036.7 6,117.4 -196.4 201.7 148.8 72.2 80.7 Plus: Adjustment for residence 10 1,442.0 1,301.5 1,386.5 1,449.4 1,558.7 1,600.8 -140.5 85.0 62.9 109.3 42.1 Equals: Net earnings by place of residence 11 101,771.5 94,872.5 100,159.7 106,633.2 104,561.1 107,891.6 -6,899.0 5,287.2 6,473.4 -2,072.1 3,330.5 Plus: Dividends, interest, and rent 12 30,757.5 30,281.8 29,907.0 30,187.8 30,148.3 30,369.9 -475.7 -374.8 280.8 -39.5 221.7 Plus: Personal current transfer receipts 13 25,880.4 44,555.0 30,625.1 28,217.2 46,153.0 31,817.0 18,674.6 -13,929.9 -2,408.0 17,935.8 -14,335.9 Social Security 14 9,829.3 9,893.6 9,943.9 10,022.1 10,179.9 10,210.4 64.3 50.3 78.2 157.8 30.5 Medicare 15 6,643.7 6,749.6 6,784.2 6,746.9 6,693.7 6,702.6 105.9 34.6 -37.3 -53.2 8.9 Of which: Increase in Medicare reimbursement rates1 16 79.1 118.5 117.6 116.7 115.9 79.1 39.3 -0.9 -0.9 -0.8 Medicaid 17 3,593.0 3,786.4 3,991.8 3,848.6 3,901.4 4,087.8 193.3 205.4 -143.2 52.9 186.4 State unemployment insurance 18 292.5 5,301.0 3,354.1 1,045.9 945.0 1,157.7 5,008.5 -1,946.9 -2,308.2 -100.9 212.6 Of which:2
Extended Unemployment Benefits 19 0.0 8.3 37.1 2.6 1.3 0.0 8.3 28.8 -34.6 -1.2 Pandemic Emergency Unemployment Compensation 20 11.0 93.7 337.0 169.4 290.0 11.0 82.7 243.3 -167.5 120.6 Pandemic Unemployment Assistance 21 267.8 293.7 110.4 29.8 63.2 267.8 25.9 -183.3 -80.6 33.5 Pandemic Unemployment Compensation Payments 22 3,198.0 1,691.5 15.3 406.9 504.5 3,198.0 -1,506.5 -1,676.1 391.6 97.6 All other personal current transfer receipts 23 5,521.8 18,824.3 6,551.1 6,553.6 24,432.9 9,658.6 13,302.5 -12,273.3 2.6 17,879.2 -14,774.3 Of which: Economic impact payments3 24 9,767.6 140.8 45.7 17,601.8 2,640.7 9,767.6 -9,626.8 -95.1 17,556.1 -14,961.1 Lost wages supplemental payments4 25 0.0 0.0 469.8 54.9 0.3 0.0 0.0 469.8 -414.9 -54.6 Paycheck Protection Program loans to NPISH5 26 1,425.2 373.7 112.3 100.4 220.6 1,425.2 -1,051.5 -261.4 -11.9 120.2 Provider Relief Fund to NPISH6 27 17.4 1,835.4 306.2 225.4 399.6 248.4 1,818.1 -1,529.2 -80.8 174.2 -151.3Components of earnings by place of work Wages and salaries 28 77,018.7 72,227.7 75,561.1 78,385.7 78,100.3 79,438.1 -4,791.1 3,333.4 2,824.6 -285.4 1,337.8 Supplements to wages and salaries 29 17,710.1 16,916.8 17,508.7 17,908.1 18,019.0 18,122.3 -793.3 592.0 399.4 110.9 103.3 Employer contributions for employee pension and insurance funds 30 11,899.7 11,302.7 11,693.0 11,943.6 11,982.3 12,004.9 -596.9 390.3 250.6 38.7 22.6 Employer contributions for government social insurance 31 5,810.4 5,614.0 5,815.7 5,964.5 6,036.7 6,117.4 -196.4 201.7 148.8 72.2 80.7 Proprietors' income 32 18,390.9 16,714.1 18,422.3 21,954.0 20,066.3 22,082.3 -1,676.8 1,708.1 3,531.7 -1,887.6 2,016.0 Farm proprietors' income 33 1,703.7 943.9 1,737.8 4,220.0 2,546.8 4,675.3 -759.9 793.9 2,482.2 -1,673.2 2,128.6 Of which: Coronavirus Food Assistance Program7 34 847.3 744.3 2,283.2 9.1 41.7 847.3 -103.0 1,538.9 -2,274.1 32.6 Paycheck Protection Program loans to businesses5 35 156.1 221.7 66.6 272.2 617.9 156.1 65.6 -155.1 205.6 345.6 Nonfarm proprietors' income 36 16,687.2 15,770.2 16,684.4 17,734.0 17,519.5 17,407.0 -916.9 914.2 1,049.5 -214.4 -112.6 Of which: Paycheck Protection Program loans to businesses5 37 2,250.7 1,171.9 1,018.0 656.5 944.5 2,250.7 -1,078.8 -154.0 -361.5 288.0
Data on this table will be superseded by updated estimates. Regional estimates were controlled to the annual update to the National accounts released August 26, 2021.
2020 2021
Effects of Selected Federal Pandemic Response Programs on State Personal Income, 2021Q2Kansas
(Millions of dollars, seasonally adjusted at annual rates)Levels Change from preceding period
Note: BEA state per capita personal income statistics are calculated using unpublished Census Bureau midquarter population estimates. These midquarter estimates are based on the 2010 census. BEA will incorporate Census Bureau population estimates based on the 2020 census results wh
Source. U.S. Bureau of Economic AnalysisLast updated: September 23, 2021.
Line
3. Economic impact payments, initially established by the CARES Act, provide direct payments to individuals. For more information, see How are federal economic impact payments to support individuals during the COVID-19 pandemic recorded in the NIPAs?4. The Federal Emergency Management Agency (FEMA) was authorized to make payments from the Disaster Relief Fund to supplement wages lost as a result of the COVID-19 pandemic.5. The Paycheck Protection Program, initially established by the CARES Act, provides forgivable loans to help small businesses and nonprofit institutions make payroll and cover other expenses. It also provides funding to reimburse private lending institutions for the costs of administering these loans. For more information, see How does the Paycheck Protection Program impact the national income and product accounts (NIPAs)?6. The Department of Health and Human Services distributes money from the Provider Relief Fund to hospitals and health care providers on the front lines of the coronavirus response. This funding supports health care-related expenses or lost revenue attributable to COVID-19 and ensures uninsured Americans can get treatment for COVID-19. In the NIPAs, funds provided to nonprofit hospitals are recorded as social benefits.7. The Coronavirus Food Assistance Program, initially established by the CARES Act, provides direct support to farmers and ranchers where prices and market supply chains have been impacted by the COVID-19 pandemic.
CARES -Coronavirus Aid, Relief, and Economic SecurityNPISH -Nonprofit institutions serving households1. A two percent reduction in reimbursements paid to Medicare service providers that went into effect in 2013 was initially suspended by the CARES Act. The resulting increased reimbursement rates went into effect beginning on May 1, 2020.2. Unemployment insurance benefits were expanded through several programs that were initially established through the CARES Act. For more information, see How will the expansion of unemployment benefits in response to the COVID-19 pandemic be recorded in the NIPAs?
2020 2021

Q1 Q2 Q3 Q4 Q1 Q2 Q2 Q3 Q4 Q1 Q2Personal income (millions of dollars) 1 200,695.5 227,604.3 209,285.0 210,205.6 241,175.1 220,716.2 26,908.8 -18,319.2 920.6 30,969.5 -20,458.9 Nonfarm personal income 2 198,959.7 226,208.4 207,640.8 207,774.2 239,185.4 218,077.5 27,248.8 -18,567.7 133.4 31,411.2 -21,107.8 Farm income 3 1,735.8 1,395.9 1,644.3 2,431.5 1,989.7 2,638.7 -340.0 248.4 787.2 -441.7 648.9Population (persons) 4 4,477,580 4,477,422 4,478,653 4,480,945 4,480,430 4,480,714 -158 1,231 2,292 -515 284Per capita personal income (dollars) 5 44,822 50,834 46,729 46,911 53,829 49,259 6,012 -4,105 182 6,918 -4,570Derivation of personal income Earnings by place of work 6 137,289.8 129,038.0 136,059.1 141,404.6 142,315.4 145,181.1 -8,251.8 7,021.1 5,345.5 910.7 2,865.7 Less: Contributions for government social insurance 7 16,423.3 15,840.5 16,584.0 17,107.9 17,522.6 17,774.0 -582.8 743.6 523.9 414.7 251.4 Employee and self-employed contributions for government social insurance 8 8,939.5 8,594.4 8,993.7 9,285.7 9,496.8 9,628.7 -345.1 399.2 292.0 211.1 131.9 Employer contributions for government social insurance 9 7,483.8 7,246.0 7,590.4 7,822.2 8,025.8 8,145.3 -237.8 344.4 231.8 203.6 119.5 Plus: Adjustment for residence 10 -2,833.2 -2,662.4 -2,809.3 -2,904.6 -2,985.4 -3,039.3 170.8 -146.9 -95.4 -80.8 -53.9 Equals: Net earnings by place of residence 11 118,033.3 110,535.2 116,665.8 121,392.1 121,807.3 124,367.8 -7,498.2 6,130.7 4,726.2 415.3 2,560.5 Plus: Dividends, interest, and rent 12 33,309.7 32,810.1 32,406.2 32,786.7 32,723.1 32,996.7 -499.5 -403.9 380.5 -63.6 273.7 Plus: Personal current transfer receipts 13 49,352.5 84,259.0 60,212.9 56,026.9 86,644.7 63,351.7 34,906.5 -24,046.0 -4,186.1 30,617.9 -23,293.0 Social Security 14 16,069.8 16,153.7 16,220.1 16,329.0 16,554.1 16,597.6 83.9 66.5 108.9 225.1 43.4 Medicare 15 11,828.3 12,009.6 12,069.8 12,007.8 11,920.9 11,935.2 181.3 60.2 -62.0 -86.9 14.3 Of which: Increase in Medicare reimbursement rates1 16 140.8 210.8 209.2 207.6 206.2 140.8 70.0 -1.6 -1.6 -1.5 Medicaid 17 10,574.2 12,035.9 13,208.3 13,250.7 13,582.5 15,377.0 1,461.8 1,172.3 42.4 331.9 1,794.4 State unemployment insurance 18 711.8 13,266.2 6,209.9 2,460.6 3,350.4 2,703.6 12,554.4 -7,056.2 -3,749.3 889.8 -646.7 Of which:2
Extended Unemployment Benefits 19 0.0 24.2 52.9 0.6 0.4 0.0 24.2 28.7 -52.2 -0.2 Pandemic Emergency Unemployment Compensation 20 68.1 80.0 437.6 619.5 543.2 68.1 11.9 357.6 181.9 -76.3 Pandemic Unemployment Assistance 21 846.6 944.1 614.8 421.7 330.3 846.6 97.4 -329.3 -193.1 -91.4 Pandemic Unemployment Compensation Payments 22 8,344.9 3,081.8 138.4 1,408.8 1,115.8 8,344.9 -5,263.1 -2,943.4 1,270.3 -293.0 All other personal current transfer receipts 23 10,168.5 30,793.6 12,504.9 11,978.8 41,236.8 16,738.3 20,625.1 -18,288.8 -526.0 29,258.0 -24,498.5 Of which: Economic impact payments3 24 16,126.1 232.3 75.4 29,017.6 4,353.3 16,126.1 -15,893.8 -157.0 28,942.2 -24,664.3 Lost wages supplemental payments4 25 0.0 380.7 535.1 0.7 0.0 0.0 380.7 154.4 -534.5 -0.7 Paycheck Protection Program loans to NPISH5 26 1,063.1 492.7 148.0 107.7 212.3 1,063.1 -570.4 -344.6 -40.4 104.6 Provider Relief Fund to NPISH6 27 28.1 2,969.4 752.3 564.3 723.0 449.4 2,941.3 -2,217.1 -188.0 158.7 -273.7Components of earnings by place of work Wages and salaries 28 98,922.6 92,265.7 96,933.8 100,579.4 101,810.6 103,714.6 -6,656.8 4,668.0 3,645.7 1,231.2 1,904.0 Supplements to wages and salaries 29 24,885.6 23,902.6 25,007.4 25,701.6 26,160.0 26,351.1 -982.9 1,104.8 694.2 458.4 191.1 Employer contributions for employee pension and insurance funds 30 17,401.8 16,656.6 17,417.0 17,879.4 18,134.2 18,205.9 -745.2 760.4 462.4 254.8 71.6 Employer contributions for government social insurance 31 7,483.8 7,246.0 7,590.4 7,822.2 8,025.8 8,145.3 -237.8 344.4 231.8 203.6 119.5 Proprietors' income 32 13,481.7 12,869.6 14,118.0 15,123.6 14,344.8 15,115.3 -612.1 1,248.4 1,005.6 -778.8 770.6 Farm proprietors' income 33 1,481.0 1,143.6 1,391.7 2,175.6 1,728.4 2,373.8 -337.4 248.1 783.9 -447.2 645.4 Of which: Coronavirus Food Assistance Program7 34 367.5 251.9 727.8 0.0 0.0 367.5 -115.6 475.9 -727.8 0.0 Paycheck Protection Program loans to businesses5 35 68.1 96.7 29.1 117.6 265.9 68.1 28.6 -67.6 88.5 148.3 Nonfarm proprietors' income 36 12,000.7 11,726.0 12,726.3 12,948.0 12,616.4 12,741.6 -274.7 1,000.3 221.7 -331.6 125.2 Of which: Paycheck Protection Program loans to businesses5 37 2,404.0 1,923.0 1,057.1 823.2 1,201.6 2,404.0 -480.9 -865.9 -233.9 378.4
Data on this table will be superseded by updated estimates. Regional estimates were controlled to the annual update to the National accounts released August 26, 2021.
2020 2021
Effects of Selected Federal Pandemic Response Programs on State Personal Income, 2021Q2Kentucky
(Millions of dollars, seasonally adjusted at annual rates)Levels Change from preceding period
Note: BEA state per capita personal income statistics are calculated using unpublished Census Bureau midquarter population estimates. These midquarter estimates are based on the 2010 census. BEA will incorporate Census Bureau population estimates based on the 2020 census results wh
Source. U.S. Bureau of Economic AnalysisLast updated: September 23, 2021.
Line
3. Economic impact payments, initially established by the CARES Act, provide direct payments to individuals. For more information, see How are federal economic impact payments to support individuals during the COVID-19 pandemic recorded in the NIPAs?4. The Federal Emergency Management Agency (FEMA) was authorized to make payments from the Disaster Relief Fund to supplement wages lost as a result of the COVID-19 pandemic.5. The Paycheck Protection Program, initially established by the CARES Act, provides forgivable loans to help small businesses and nonprofit institutions make payroll and cover other expenses. It also provides funding to reimburse private lending institutions for the costs of administering these loans. For more information, see How does the Paycheck Protection Program impact the national income and product accounts (NIPAs)?6. The Department of Health and Human Services distributes money from the Provider Relief Fund to hospitals and health care providers on the front lines of the coronavirus response. This funding supports health care-related expenses or lost revenue attributable to COVID-19 and ensures uninsured Americans can get treatment for COVID-19. In the NIPAs, funds provided to nonprofit hospitals are recorded as social benefits.7. The Coronavirus Food Assistance Program, initially established by the CARES Act, provides direct support to farmers and ranchers where prices and market supply chains have been impacted by the COVID-19 pandemic.
CARES -Coronavirus Aid, Relief, and Economic SecurityNPISH -Nonprofit institutions serving households1. A two percent reduction in reimbursements paid to Medicare service providers that went into effect in 2013 was initially suspended by the CARES Act. The resulting increased reimbursement rates went into effect beginning on May 1, 2020.2. Unemployment insurance benefits were expanded through several programs that were initially established through the CARES Act. For more information, see How will the expansion of unemployment benefits in response to the COVID-19 pandemic be recorded in the NIPAs?
2020 2021

Q1 Q2 Q3 Q4 Q1 Q2 Q2 Q3 Q4 Q1 Q2Personal income (millions of dollars) 1 224,128.0 250,861.4 239,656.8 230,662.5 264,456.4 246,778.4 26,733.4 -11,204.7 -8,994.3 33,793.9 -17,678.0 Nonfarm personal income 2 223,254.7 250,133.5 238,570.6 229,389.0 263,361.8 245,331.8 26,878.8 -11,562.9 -9,181.5 33,972.8 -18,030.0 Farm income 3 873.3 728.0 1,086.2 1,273.5 1,094.5 1,446.6 -145.4 358.2 187.3 -179.0 352.0Population (persons) 4 4,652,911 4,648,004 4,644,149 4,641,229 4,636,038 4,631,606 -4,907 -3,855 -2,920 -5,191 -4,432Per capita personal income (dollars) 5 48,169 53,972 51,604 49,699 57,044 53,281 5,803 -2,368 -1,905 7,345 -3,763Derivation of personal income Earnings by place of work 6 149,676.0 140,862.0 151,151.4 152,872.1 153,189.0 159,054.1 -8,814.0 10,289.4 1,720.7 316.9 5,865.1 Less: Contributions for government social insurance 7 15,566.3 14,815.8 15,536.0 15,997.0 16,241.4 16,451.9 -750.5 720.2 461.0 244.3 210.5 Employee and self-employed contributions for government social insurance 8 8,830.8 8,403.4 8,811.9 9,080.3 9,186.5 9,299.0 -427.3 408.5 268.4 106.2 112.5 Employer contributions for government social insurance 9 6,735.6 6,412.4 6,724.1 6,916.8 7,054.9 7,152.8 -323.2 311.7 192.6 138.1 98.0 Plus: Adjustment for residence 10 -576.5 -516.0 -552.7 -566.0 -554.0 -552.2 60.5 -36.7 -13.3 12.0 1.9 Equals: Net earnings by place of residence 11 133,533.1 125,530.1 135,062.6 136,309.0 136,393.6 142,050.1 -8,003.0 9,532.5 1,246.4 84.6 5,656.5 Plus: Dividends, interest, and rent 12 40,189.1 39,585.2 39,152.0 39,373.7 39,345.1 39,561.6 -603.9 -433.2 221.8 -28.6 216.5 Plus: Personal current transfer receipts 13 50,405.8 85,746.1 65,442.2 54,979.8 88,717.7 65,166.7 35,340.3 -20,304.0 -10,462.4 33,737.9 -23,551.0 Social Security 14 14,528.8 14,600.2 14,658.2 14,763.0 14,988.6 15,032.2 71.4 58.1 104.8 225.6 43.5 Medicare 15 12,519.2 12,711.6 12,770.4 12,694.6 12,590.8 12,608.1 192.3 58.8 -75.8 -103.8 17.4 Of which: Increase in Medicare reimbursement rates1 16 149.0 223.0 221.4 219.7 218.1 149.0 74.1 -1.7 -1.7 -1.5 Medicaid 17 11,979.5 12,634.6 13,456.6 13,147.0 13,150.8 14,095.8 655.1 821.9 -309.6 3.8 945.0 State unemployment insurance 18 533.9 15,286.0 7,901.7 2,274.4 6,151.8 5,732.3 14,752.2 -7,384.3 -5,627.3 3,877.5 -419.6 Of which:2
Extended Unemployment Benefits 19 0.0 54.3 26.6 15.3 0.1 0.0 54.3 -27.7 -11.4 -15.1 Pandemic Emergency Unemployment Compensation 20 6.7 38.4 290.3 879.0 790.7 6.7 31.7 251.9 588.7 -88.3 Pandemic Unemployment Assistance 21 284.3 851.9 840.3 832.5 819.3 284.3 567.6 -11.6 -7.8 -13.2 Pandemic Unemployment Compensation Payments 22 12,379.6 4,958.8 19.0 3,590.9 3,414.6 12,379.6 -7,420.8 -4,939.8 3,571.9 -176.3 All other personal current transfer receipts 23 10,844.4 30,513.7 16,655.3 12,100.8 41,835.6 17,698.3 19,669.3 -13,858.4 -4,554.5 29,734.8 -24,137.3 Of which: Economic impact payments3 24 15,634.5 226.0 73.3 28,696.0 4,305.1 15,634.5 -15,408.5 -152.7 28,622.7 -24,391.0 Lost wages supplemental payments4 25 0.0 2,229.8 53.5 8.8 3.0 0.0 2,229.8 -2,176.3 -44.7 -5.8 Paycheck Protection Program loans to NPISH5 26 914.9 1,125.8 338.3 120.3 207.5 914.9 210.9 -787.5 -218.0 87.2 Provider Relief Fund to NPISH6 27 24.2 2,559.5 1,324.8 206.5 689.7 428.6 2,535.3 -1,234.7 -1,118.4 483.2 -261.0Components of earnings by place of work Wages and salaries 28 104,484.7 96,376.0 101,386.6 104,957.5 105,100.1 106,892.1 -8,108.7 5,010.6 3,570.9 142.7 1,792.0 Supplements to wages and salaries 29 24,671.1 23,424.2 24,466.3 25,013.1 25,016.6 25,128.3 -1,246.8 1,042.1 546.8 3.5 111.8 Employer contributions for employee pension and insurance funds 30 17,935.5 17,011.8 17,742.2 18,096.3 17,961.7 17,975.5 -923.7 730.4 354.1 -134.6 13.8 Employer contributions for government social insurance 31 6,735.6 6,412.4 6,724.1 6,916.8 7,054.9 7,152.8 -323.2 311.7 192.6 138.1 98.0 Proprietors' income 32 20,520.2 21,061.8 25,298.5 22,901.5 23,072.3 27,033.6 541.6 4,236.7 -2,396.9 170.8 3,961.3 Farm proprietors' income 33 743.5 597.9 955.0 1,140.1 958.3 1,308.6 -145.6 357.1 185.1 -181.8 350.3 Of which: Coronavirus Food Assistance Program7 34 74.1 307.4 366.6 9.1 14.6 74.1 233.3 59.2 -357.5 5.5 Paycheck Protection Program loans to businesses5 35 46.3 65.8 19.8 39.4 99.4 46.3 19.5 -46.0 19.6 60.0 Nonfarm proprietors' income 36 19,776.8 20,463.9 24,343.5 21,761.5 22,114.0 25,725.0 687.1 3,879.6 -2,582.0 352.6 3,611.0 Of which: Paycheck Protection Program loans to businesses5 37 4,774.8 6,227.9 2,116.2 1,800.3 5,293.4 4,774.8 1,453.1 -4,111.7 -315.9 3,493.1
Data on this table will be superseded by updated estimates. Regional estimates were controlled to the annual update to the National accounts released August 26, 2021.
2020 2021
Effects of Selected Federal Pandemic Response Programs on State Personal Income, 2021Q2Louisiana
(Millions of dollars, seasonally adjusted at annual rates)Levels Change from preceding period
Note: BEA state per capita personal income statistics are calculated using unpublished Census Bureau midquarter population estimates. These midquarter estimates are based on the 2010 census. BEA will incorporate Census Bureau population estimates based on the 2020 census results wh
Source. U.S. Bureau of Economic AnalysisLast updated: September 23, 2021.
Line
3. Economic impact payments, initially established by the CARES Act, provide direct payments to individuals. For more information, see How are federal economic impact payments to support individuals during the COVID-19 pandemic recorded in the NIPAs?4. The Federal Emergency Management Agency (FEMA) was authorized to make payments from the Disaster Relief Fund to supplement wages lost as a result of the COVID-19 pandemic.5. The Paycheck Protection Program, initially established by the CARES Act, provides forgivable loans to help small businesses and nonprofit institutions make payroll and cover other expenses. It also provides funding to reimburse private lending institutions for the costs of administering these loans. For more information, see How does the Paycheck Protection Program impact the national income and product accounts (NIPAs)?6. The Department of Health and Human Services distributes money from the Provider Relief Fund to hospitals and health care providers on the front lines of the coronavirus response. This funding supports health care-related expenses or lost revenue attributable to COVID-19 and ensures uninsured Americans can get treatment for COVID-19. In the NIPAs, funds provided to nonprofit hospitals are recorded as social benefits.7. The Coronavirus Food Assistance Program, initially established by the CARES Act, provides direct support to farmers and ranchers where prices and market supply chains have been impacted by the COVID-19 pandemic.
CARES -Coronavirus Aid, Relief, and Economic SecurityNPISH -Nonprofit institutions serving households1. A two percent reduction in reimbursements paid to Medicare service providers that went into effect in 2013 was initially suspended by the CARES Act. The resulting increased reimbursement rates went into effect beginning on May 1, 2020.2. Unemployment insurance benefits were expanded through several programs that were initially established through the CARES Act. For more information, see How will the expansion of unemployment benefits in response to the COVID-19 pandemic be recorded in the NIPAs?
2020 2021

Q1 Q2 Q3 Q4 Q1 Q2 Q2 Q3 Q4 Q1 Q2Personal income (millions of dollars) 1 70,306.6 77,809.9 72,047.6 72,607.1 81,649.0 75,278.9 7,503.3 -5,762.2 559.4 9,041.9 -6,370.1 Nonfarm personal income 2 70,017.2 77,502.4 71,653.1 72,188.8 81,333.5 74,927.8 7,485.2 -5,849.3 535.7 9,144.7 -6,405.7 Farm income 3 289.4 307.4 394.6 418.3 315.5 351.1 18.1 87.1 23.7 -102.8 35.6Population (persons) 4 1,349,254 1,349,857 1,350,792 1,351,930 1,352,370 1,353,109 603 935 1,138 440 739Per capita personal income (dollars) 5 52,108 57,643 53,337 53,706 60,375 55,634 5,535 -4,306 369 6,669 -4,741Derivation of personal income Earnings by place of work 6 46,446.0 42,843.3 45,483.0 47,263.9 46,791.6 47,537.2 -3,602.7 2,639.6 1,780.9 -472.3 745.6 Less: Contributions for government social insurance 7 5,577.0 5,307.1 5,543.8 5,697.0 5,703.6 5,814.1 -270.0 236.7 153.2 6.6 110.5 Employee and self-employed contributions for government social insurance 8 3,187.9 3,027.3 3,157.6 3,245.9 3,245.6 3,304.5 -160.6 130.3 88.3 -0.3 58.9 Employer contributions for government social insurance 9 2,389.1 2,279.8 2,386.2 2,451.1 2,458.0 2,509.6 -109.4 106.4 64.9 6.9 51.6 Plus: Adjustment for residence 10 1,151.3 1,084.9 1,131.1 1,179.8 1,170.6 1,177.8 -66.4 46.2 48.7 -9.1 7.2 Equals: Net earnings by place of residence 11 42,020.3 38,621.2 41,070.3 42,746.7 42,258.6 42,900.8 -3,399.1 2,449.1 1,676.4 -488.1 642.2 Plus: Dividends, interest, and rent 12 12,711.3 12,511.2 12,376.5 12,484.0 12,493.6 12,587.9 -200.0 -134.8 107.5 9.6 94.4 Plus: Personal current transfer receipts 13 15,575.0 26,677.4 18,600.9 17,376.4 26,896.8 19,790.1 11,102.4 -8,076.6 -1,224.4 9,520.3 -7,106.7 Social Security 14 5,586.8 5,626.6 5,657.6 5,704.1 5,796.4 5,814.3 39.9 30.9 46.5 92.3 17.8 Medicare 15 3,946.8 4,015.3 4,039.0 4,017.5 3,984.5 3,990.0 68.5 23.7 -21.5 -33.0 5.5 Of which: Increase in Medicare reimbursement rates1 16 47.1 70.5 69.9 69.4 68.9 47.1 23.4 -0.5 -0.5 -0.5 Medicaid 17 2,931.6 3,049.3 3,396.0 3,258.5 3,288.4 3,493.5 117.6 346.8 -137.5 29.9 205.0 State unemployment insurance 18 97.1 3,624.5 1,861.0 605.3 1,421.8 1,215.9 3,527.3 -1,763.5 -1,255.7 816.5 -205.9 Of which:2
Extended Unemployment Benefits 19 0.0 3.7 12.8 0.1 (L) 0.0 3.7 9.1 -12.7 (L) Pandemic Emergency Unemployment Compensation 20 0.1 85.4 210.2 313.1 292.6 0.1 85.4 124.7 102.9 -20.5 Pandemic Unemployment Assistance 21 221.5 301.2 219.2 181.5 168.1 221.5 79.7 -82.1 -37.7 -13.4 Pandemic Unemployment Compensation Payments 22 2,991.0 1,135.4 16.6 809.6 651.8 2,991.0 -1,855.6 -1,118.9 793.1 -157.9 All other personal current transfer receipts 23 3,012.6 10,361.8 3,647.3 3,791.1 12,405.6 5,276.5 7,349.2 -6,714.5 143.8 8,614.5 -7,129.1 Of which: Economic impact payments3 24 5,085.4 73.2 23.7 8,639.9 1,296.2 5,085.4 -5,012.2 -49.5 8,616.1 -7,343.7 Lost wages supplemental payments4 25 0.0 0.0 422.6 1.3 3.3 0.0 0.0 422.6 -421.3 2.0 Paycheck Protection Program loans to NPISH5 26 758.5 170.4 51.2 69.7 268.4 758.5 -588.1 -119.2 18.5 198.7 Provider Relief Fund to NPISH6 27 13.0 1,372.8 287.3 190.0 312.3 194.1 1,359.8 -1,085.6 -97.3 122.2 -118.2Components of earnings by place of work Wages and salaries 28 32,904.1 30,597.5 32,240.8 33,412.8 33,068.9 33,828.6 -2,306.6 1,643.3 1,171.9 -343.9 759.7 Supplements to wages and salaries 29 8,025.5 7,642.8 7,983.2 8,161.3 8,134.7 8,227.1 -382.7 340.4 178.1 -26.6 92.5 Employer contributions for employee pension and insurance funds 30 5,636.3 5,363.1 5,597.0 5,710.2 5,676.7 5,717.5 -273.3 234.0 113.2 -33.5 40.8 Employer contributions for government social insurance 31 2,389.1 2,279.8 2,386.2 2,451.1 2,458.0 2,509.6 -109.4 106.4 64.9 6.9 51.6 Proprietors' income 32 5,516.4 4,603.0 5,259.0 5,689.9 5,588.0 5,481.5 -913.5 656.0 430.9 -101.8 -106.6 Farm proprietors' income 33 210.1 228.3 315.0 337.5 232.9 267.4 18.3 86.6 22.5 -104.6 34.5 Of which: Coronavirus Food Assistance Program7 34 26.9 61.8 98.5 8.0 6.3 26.9 34.9 36.7 -90.5 -1.8 Paycheck Protection Program loans to businesses5 35 25.5 36.2 10.9 6.1 14.1 25.5 10.7 -25.3 -4.8 8.0 Nonfarm proprietors' income 36 5,306.4 4,374.6 4,944.0 5,352.4 5,355.1 5,214.1 -931.7 569.4 408.4 2.7 -141.1 Of which: Paycheck Protection Program loans to businesses5 37 536.1 407.0 318.1 278.0 268.5 536.1 -129.1 -88.9 -40.1 -9.5
Data on this table will be superseded by updated estimates. Regional estimates were controlled to the annual update to the National accounts released August 26, 2021.
2021 2020 2021
Effects of Selected Federal Pandemic Response Programs on State Personal Income, 2021Q2Maine
(Millions of dollars, seasonally adjusted at annual rates)Levels Change from preceding period
NPISH -Nonprofit institutions serving households
Note: BEA state per capita personal income statistics are calculated using unpublished Census Bureau midquarter population estimates. These midquarter estimates are based on the 2010 census. BEA will incorporate Census Bureau population estimates based on the 2020 census results when t
Source. U.S. Bureau of Economic AnalysisLast updated: September 23, 2021.
Line
3. Economic impact payments, initially established by the CARES Act, provide direct payments to individuals. For more information, see How are federal economic impact payments to support individuals during the COVID-19 pandemic recorded in the NIPAs?
4. The Federal Emergency Management Agency (FEMA) was authorized to make payments from the Disaster Relief Fund to supplement wages lost as a result of the COVID-19 pandemic.5. The Paycheck Protection Program, initially established by the CARES Act, provides forgivable loans to help small businesses and nonprofit institutions make payroll and cover other expenses. It also provides funding to reimburse private lending institutions for the costs of administering these loans. For more information, see How does the Paycheck Protection Program impact the national income and product accounts (NIPAs)?6. The Department of Health and Human Services distributes money from the Provider Relief Fund to hospitals and health care providers on the front lines of the coronavirus response. This funding supports health care-related expenses or lost revenue attributable to COVID-19 and ensures 7. The Coronavirus Food Assistance Program, initially established by the CARES Act, provides direct support to farmers and ranchers where prices and market supply chains have been impacted by the COVID-19 pandemic.
CARES -Coronavirus Aid, Relief, and Economic Security
(L) Less than $50,000.1. A two percent reduction in reimbursements paid to Medicare service providers that went into effect in 2013 was initially suspended by the CARES Act. The resulting increased reimbursement rates went into effect beginning on May 1, 2020.2. Unemployment insurance benefits were expanded through several programs that were initially established through the CARES Act. For more information, see How will the expansion of unemployment benefits in response to the COVID-19 pandemic be recorded in the NIPAs?
2020

Q1 Q2 Q3 Q4 Q1 Q2 Q2 Q3 Q4 Q1 Q2Personal income (millions of dollars) 1 389,931.6 415,937.2 408,911.2 403,303.0 448,455.1 423,545.1 26,005.6 -7,025.9 -5,608.2 45,152.1 -24,910.0 Nonfarm personal income 2 389,369.6 415,711.1 408,487.6 402,677.1 447,935.3 422,893.7 26,341.5 -7,223.5 -5,810.5 45,258.2 -25,041.6 Farm income 3 562.0 226.0 423.6 625.9 519.8 651.4 -335.9 197.6 202.3 -106.1 131.6Population (persons) 4 6,059,754 6,057,454 6,055,661 6,054,671 6,052,133 6,050,432 -2,300 -1,793 -990 -2,538 -1,701Per capita personal income (dollars) 5 64,348 68,665 67,525 66,610 74,099 70,002 4,317 -1,140 -915 7,489 -4,097Derivation of personal income Earnings by place of work 6 265,293.6 249,458.8 264,637.7 271,167.7 279,336.6 283,219.5 -15,834.8 15,178.8 6,530.1 8,168.9 3,882.9 Less: Contributions for government social insurance 7 29,626.0 28,455.6 29,324.1 30,036.1 31,372.8 31,615.4 -1,170.4 868.5 712.0 1,336.7 242.6 Employee and self-employed contributions for government social insurance 8 15,905.4 15,227.2 15,704.8 16,120.9 16,829.9 16,939.2 -678.1 477.6 416.2 708.9 109.3 Employer contributions for government social insurance 9 13,720.6 13,228.4 13,619.3 13,915.2 14,542.9 14,676.2 -492.2 390.9 295.9 627.8 133.3 Plus: Adjustment for residence 10 26,821.0 25,884.0 26,600.8 27,621.6 26,352.2 26,702.8 -936.9 716.8 1,020.8 -1,269.4 350.6 Equals: Net earnings by place of residence 11 262,488.6 246,887.2 261,914.4 268,753.2 274,316.0 278,307.0 -15,601.4 15,027.1 6,838.8 5,562.8 3,991.0 Plus: Dividends, interest, and rent 12 71,098.5 70,021.0 69,153.4 69,898.4 69,752.5 70,300.8 -1,077.5 -867.6 745.1 -145.9 548.2 Plus: Personal current transfer receipts 13 56,344.5 99,029.0 77,843.5 64,651.4 104,386.5 74,937.3 42,684.5 -21,185.5 -13,192.1 39,735.1 -29,449.2 Social Security 14 18,424.4 18,549.4 18,647.8 18,804.9 19,126.2 19,188.2 125.0 98.4 157.2 321.3 62.0 Medicare 15 14,660.5 14,892.0 14,963.3 14,873.1 14,747.5 14,768.5 231.5 71.3 -90.2 -125.7 21.1 Of which: Increase in Medicare reimbursement rates1 16 174.5 261.3 259.3 257.4 255.5 174.5 86.8 -2.0 -2.0 -1.8 Medicaid 17 11,486.5 12,005.4 12,650.2 12,507.7 12,940.2 13,850.9 519.0 644.8 -142.5 432.5 910.6 State unemployment insurance 18 587.3 18,807.5 13,527.7 5,560.3 11,228.2 8,196.2 18,220.2 -5,279.8 -7,967.4 5,667.9 -3,032.0 Of which:2
Extended Unemployment Benefits 19 0.0 29.5 125.7 1.8 2.5 0.0 29.5 96.3 -123.9 0.7 Pandemic Emergency Unemployment Compensation 20 59.4 188.7 947.8 1,358.5 1,284.0 59.4 129.3 759.1 410.6 -74.4 Pandemic Unemployment Assistance 21 2,907.4 3,906.6 2,901.6 3,222.0 2,152.0 2,907.4 999.2 -1,005.0 320.4 -1,070.0 Pandemic Unemployment Compensation Payments 22 12,972.8 6,695.5 276.5 5,685.2 3,902.8 12,972.8 -6,277.3 -6,419.0 5,408.7 -1,782.4 All other personal current transfer receipts 23 11,185.9 34,774.7 18,054.5 12,905.3 46,344.4 18,933.5 23,588.8 -16,720.3 -5,149.2 33,439.1 -27,410.9 Of which: Economic impact payments3 24 18,442.9 266.6 86.5 32,390.4 4,859.3 18,442.9 -18,176.3 -180.1 32,303.9 -27,531.1 Lost wages supplemental payments4 25 0.0 2,372.6 171.2 91.2 22.8 0.0 2,372.6 -2,201.4 -79.9 -68.4 Paycheck Protection Program loans to NPISH5 26 1,748.6 1,753.6 526.9 251.3 289.3 1,748.6 5.0 -1,226.6 -275.7 38.0 Provider Relief Fund to NPISH6 27 26.4 2,793.2 1,891.1 355.2 849.0 527.7 2,766.7 -902.1 -1,535.8 493.8 -321.4Components of earnings by place of work Wages and salaries 28 191,843.3 180,803.0 189,074.0 196,028.6 202,541.9 204,833.0 -11,040.3 8,271.0 6,954.6 6,513.4 2,291.1 Supplements to wages and salaries 29 44,962.8 43,380.0 44,760.4 45,670.9 47,252.5 47,401.1 -1,582.8 1,380.4 910.5 1,581.6 148.6 Employer contributions for employee pension and insurance funds 30 31,242.2 30,151.6 31,141.1 31,755.7 32,709.6 32,724.9 -1,090.6 989.5 614.6 953.9 15.3 Employer contributions for government social insurance 31 13,720.6 13,228.4 13,619.3 13,915.2 14,542.9 14,676.2 -492.2 390.9 295.9 627.8 133.3 Proprietors' income 32 28,487.6 25,275.9 30,803.3 29,468.3 29,542.1 30,985.4 -3,211.7 5,527.4 -1,335.1 73.9 1,443.2 Farm proprietors' income 33 416.4 81.1 278.0 478.1 368.8 498.4 -335.3 196.9 200.1 -109.3 129.6 Of which: Coronavirus Food Assistance Program7 34 41.0 39.4 157.1 3.8 9.5 41.0 -1.7 117.8 -153.3 5.7 Paycheck Protection Program loans to businesses5 35 50.2 71.3 21.4 11.9 30.0 50.2 21.1 -49.9 -9.5 18.1 Nonfarm proprietors' income 36 28,071.2 25,194.8 30,525.3 28,990.2 29,173.4 30,487.0 -2,876.4 5,330.5 -1,535.1 183.2 1,313.6 Of which: Paycheck Protection Program loans to businesses5 37 3,866.6 5,652.2 1,597.7 1,437.3 3,196.8 3,866.6 1,785.6 -4,054.5 -160.4 1,759.5
Data on this table will be superseded by updated estimates. Regional estimates were controlled to the annual update to the National accounts released August 26, 2021.
2020 2021
Effects of Selected Federal Pandemic Response Programs on State Personal Income, 2021Q2Maryland
(Millions of dollars, seasonally adjusted at annual rates)Levels Change from preceding period
Note: BEA state per capita personal income statistics are calculated using unpublished Census Bureau midquarter population estimates. These midquarter estimates are based on the 2010 census. BEA will incorporate Census Bureau population estimates based on the 2020 census results wh
Source. U.S. Bureau of Economic AnalysisLast updated: September 23, 2021.
Line
3. Economic impact payments, initially established by the CARES Act, provide direct payments to individuals. For more information, see How are federal economic impact payments to support individuals during the COVID-19 pandemic recorded in the NIPAs?4. The Federal Emergency Management Agency (FEMA) was authorized to make payments from the Disaster Relief Fund to supplement wages lost as a result of the COVID-19 pandemic.5. The Paycheck Protection Program, initially established by the CARES Act, provides forgivable loans to help small businesses and nonprofit institutions make payroll and cover other expenses. It also provides funding to reimburse private lending institutions for the costs of administering these loans. For more information, see How does the Paycheck Protection Program impact the national income and product accounts (NIPAs)?6. The Department of Health and Human Services distributes money from the Provider Relief Fund to hospitals and health care providers on the front lines of the coronavirus response. This funding supports health care-related expenses or lost revenue attributable to COVID-19 and ensures uninsured Americans can get treatment for COVID-19. In the NIPAs, funds provided to nonprofit hospitals are recorded as social benefits.7. The Coronavirus Food Assistance Program, initially established by the CARES Act, provides direct support to farmers and ranchers where prices and market supply chains have been impacted by the COVID-19 pandemic.
CARES -Coronavirus Aid, Relief, and Economic SecurityNPISH -Nonprofit institutions serving households1. A two percent reduction in reimbursements paid to Medicare service providers that went into effect in 2013 was initially suspended by the CARES Act. The resulting increased reimbursement rates went into effect beginning on May 1, 2020.2. Unemployment insurance benefits were expanded through several programs that were initially established through the CARES Act. For more information, see How will the expansion of unemployment benefits in response to the COVID-19 pandemic be recorded in the NIPAs?
2020 2021

Q1 Q2 Q3 Q4 Q1 Q2 Q2 Q3 Q4 Q1 Q2Personal income (millions of dollars) 1 515,249.0 565,149.2 543,021.7 540,001.2 586,859.0 564,262.7 49,900.2 -22,127.5 -3,020.5 46,857.8 -22,596.3 Nonfarm personal income 2 515,148.4 564,994.0 542,843.4 539,773.2 586,730.9 564,108.5 49,845.6 -22,150.6 -3,070.2 46,957.8 -22,622.5 Farm income 3 100.6 155.2 178.3 228.0 128.1 154.2 54.6 23.1 49.7 -100.0 26.2Population (persons) 4 6,898,624 6,895,616 6,891,926 6,887,991 6,884,020 6,881,699 -3,008 -3,690 -3,935 -3,971 -2,321Per capita personal income (dollars) 5 74,689 81,958 78,791 78,397 85,249 81,995 7,269 -3,167 -394 6,852 -3,254Derivation of personal income Earnings by place of work 6 394,591.6 369,646.6 388,294.6 403,553.2 403,544.5 410,013.3 -24,945.1 18,648.1 15,258.5 -8.6 6,468.8 Less: Contributions for government social insurance 7 40,143.8 38,454.3 39,663.3 40,894.4 41,288.2 41,962.0 -1,689.5 1,209.0 1,231.0 393.8 673.8 Employee and self-employed contributions for government social insurance 8 21,295.6 20,380.0 20,957.0 21,617.3 21,773.6 22,108.7 -915.6 577.0 660.3 156.3 335.1 Employer contributions for government social insurance 9 18,848.2 18,074.3 18,706.3 19,277.1 19,514.6 19,853.3 -773.8 632.0 570.8 237.5 338.7 Plus: Adjustment for residence 10 -10,775.3 -10,229.6 -10,649.7 -11,107.3 -11,166.1 -11,396.1 545.7 -420.1 -457.6 -58.8 -230.0 Equals: Net earnings by place of residence 11 343,672.6 320,962.6 337,981.5 351,551.5 351,090.2 356,655.2 -22,709.9 17,018.9 13,570.0 -461.3 5,565.0 Plus: Dividends, interest, and rent 12 98,402.8 96,685.0 95,325.1 96,671.5 96,569.7 97,556.8 -1,717.9 -1,359.9 1,346.4 -101.8 987.1 Plus: Personal current transfer receipts 13 73,173.6 147,501.6 109,715.1 91,778.2 139,199.0 110,050.7 74,328.0 -37,786.6 -17,936.9 47,420.9 -29,148.4 Social Security 14 22,402.1 22,529.6 22,630.3 22,793.9 23,130.8 23,195.8 127.5 100.8 163.6 336.9 65.0 Medicare 15 19,125.7 19,406.4 19,488.5 19,370.9 19,215.0 19,241.0 280.6 82.2 -117.7 -155.9 26.0 Of which: Increase in Medicare reimbursement rates1 16 227.4 340.5 337.9 335.4 333.0 227.4 113.1 -2.6 -2.6 -2.4 Medicaid 17 16,394.1 18,708.6 19,058.3 18,859.3 19,403.0 20,970.8 2,314.5 349.7 -199.0 543.7 1,567.8 State unemployment insurance 18 1,209.5 44,867.5 23,569.3 12,405.6 23,892.1 21,527.2 43,658.0 -21,298.2 -11,163.7 11,486.4 -2,364.9 Of which:2
Extended Unemployment Benefits 19 0.0 91.3 602.7 1,271.5 101.6 0.0 91.3 511.4 668.8 -1,169.9 Pandemic Emergency Unemployment Compensation 20 588.9 1,641.1 3,370.0 6,236.2 8,376.6 588.9 1,052.2 1,728.9 2,866.3 2,140.3 Pandemic Unemployment Assistance 21 4,977.2 4,522.3 4,499.4 4,207.1 3,655.0 4,977.2 -454.9 -22.9 -292.4 -552.0 Pandemic Unemployment Compensation Payments 22 27,342.8 10,223.7 312.8 9,726.2 7,713.6 27,342.8 -17,119.1 -9,910.9 9,413.3 -2,012.6 All other personal current transfer receipts 23 14,042.2 41,989.6 24,968.6 18,348.5 53,558.2 25,115.9 27,947.4 -17,021.0 -6,620.1 35,209.7 -28,442.3 Of which: Economic impact payments3 24 20,991.9 302.8 98.2 35,390.6 5,309.4 20,991.9 -20,689.1 -204.6 35,292.4 -30,081.2 Lost wages supplemental payments4 25 0.0 4,558.2 319.0 42.6 37.0 0.0 4,558.2 -4,239.1 -276.4 -5.6 Paycheck Protection Program loans to NPISH5 26 2,230.3 2,800.1 841.4 366.5 1,835.0 2,230.3 569.8 -1,958.7 -474.9 1,468.5 Provider Relief Fund to NPISH6 27 36.8 3,884.7 2,534.7 2,364.2 1,478.3 918.7 3,848.0 -1,350.1 -170.4 -886.0 -559.5Components of earnings by place of work Wages and salaries 28 288,580.2 272,295.6 284,254.4 296,330.6 295,419.1 301,399.5 -16,284.6 11,958.8 12,076.1 -911.5 5,980.5 Supplements to wages and salaries 29 59,527.9 56,772.5 58,769.8 60,300.7 60,601.2 61,149.2 -2,755.3 1,997.3 1,530.9 300.5 548.0 Employer contributions for employee pension and insurance funds 30 40,679.7 38,698.2 40,063.5 41,023.6 41,086.6 41,295.9 -1,981.5 1,365.3 960.1 63.0 209.3 Employer contributions for government social insurance 31 18,848.2 18,074.3 18,706.3 19,277.1 19,514.6 19,853.3 -773.8 632.0 570.8 237.5 338.7 Proprietors' income 32 46,483.6 40,578.4 45,270.4 46,921.9 47,524.3 47,464.6 -5,905.1 4,692.0 1,651.5 602.3 -59.7 Farm proprietors' income 33 7.8 62.7 85.3 133.5 31.5 56.4 54.9 22.6 48.2 -102.0 24.9 Of which: Coronavirus Food Assistance Program7 34 11.0 12.1 98.3 4.1 4.2 11.0 1.1 86.2 -94.2 0.1 Paycheck Protection Program loans to businesses5 35 41.1 58.4 17.5 9.0 21.4 41.1 17.3 -40.8 -8.5 12.4 Nonfarm proprietors' income 36 46,475.8 40,515.7 45,185.1 46,788.4 47,492.7 47,408.2 -5,960.0 4,669.4 1,603.3 704.3 -84.6 Of which: Paycheck Protection Program loans to businesses5 37 5,367.2 4,791.5 2,069.9 1,595.4 2,161.2 5,367.2 -575.7 -2,721.6 -474.5 565.8
Data on this table will be superseded by updated estimates. Regional estimates were controlled to the annual update to the National accounts released August 26, 2021.
2020 2021
Effects of Selected Federal Pandemic Response Programs on State Personal Income, 2021Q2Massachusetts
(Millions of dollars, seasonally adjusted at annual rates)Levels Change from preceding period
Note: BEA state per capita personal income statistics are calculated using unpublished Census Bureau midquarter population estimates. These midquarter estimates are based on the 2010 census. BEA will incorporate Census Bureau population estimates based on the 2020 census results wh
Source. U.S. Bureau of Economic AnalysisLast updated: September 23, 2021.
Line
3. Economic impact payments, initially established by the CARES Act, provide direct payments to individuals. For more information, see How are federal economic impact payments to support individuals during the COVID-19 pandemic recorded in the NIPAs?4. The Federal Emergency Management Agency (FEMA) was authorized to make payments from the Disaster Relief Fund to supplement wages lost as a result of the COVID-19 pandemic.5. The Paycheck Protection Program, initially established by the CARES Act, provides forgivable loans to help small businesses and nonprofit institutions make payroll and cover other expenses. It also provides funding to reimburse private lending institutions for the costs of administering these loans. For more information, see How does the Paycheck Protection Program impact the national income and product accounts (NIPAs)?6. The Department of Health and Human Services distributes money from the Provider Relief Fund to hospitals and health care providers on the front lines of the coronavirus response. This funding supports health care-related expenses or lost revenue attributable to COVID-19 and ensures uninsured Americans can get treatment for COVID-19. In the NIPAs, funds provided to nonprofit hospitals are recorded as social benefits.7. The Coronavirus Food Assistance Program, initially established by the CARES Act, provides direct support to farmers and ranchers where prices and market supply chains have been impacted by the COVID-19 pandemic.
CARES -Coronavirus Aid, Relief, and Economic SecurityNPISH -Nonprofit institutions serving households1. A two percent reduction in reimbursements paid to Medicare service providers that went into effect in 2013 was initially suspended by the CARES Act. The resulting increased reimbursement rates went into effect beginning on May 1, 2020.2. Unemployment insurance benefits were expanded through several programs that were initially established through the CARES Act. For more information, see How will the expansion of unemployment benefits in response to the COVID-19 pandemic be recorded in the NIPAs?
2020 2021

Q1 Q2 Q3 Q4 Q1 Q2 Q2 Q3 Q4 Q1 Q2Personal income (millions of dollars) 1 495,078.5 579,554.4 530,786.8 517,814.5 589,985.2 545,782.8 84,475.9 -48,767.6 -12,972.3 72,170.7 -44,202.5 Nonfarm personal income 2 493,288.7 577,921.2 528,517.6 514,607.0 587,857.5 542,880.7 84,632.5 -49,403.6 -13,910.6 73,250.5 -44,976.8 Farm income 3 1,789.8 1,633.3 2,269.2 3,207.5 2,127.7 2,902.1 -156.5 635.9 938.2 -1,079.7 774.3Population (persons) 4 9,979,328 9,971,093 9,965,997 9,963,565 9,955,104 9,947,871 -8,235 -5,096 -2,432 -8,461 -7,233Per capita personal income (dollars) 5 49,610 58,123 53,260 51,971 59,265 54,864 8,513 -4,863 -1,289 7,294 -4,401Derivation of personal income Earnings by place of work 6 337,380.8 315,066.0 335,365.6 345,510.6 345,824.1 355,087.5 -22,314.8 20,299.6 10,145.0 313.5 9,263.4 Less: Contributions for government social insurance 7 40,312.6 38,526.3 39,970.5 41,149.3 41,806.1 42,512.8 -1,786.4 1,444.3 1,178.8 656.8 706.7 Employee and self-employed contributions for government social insurance 8 22,254.0 21,230.2 22,038.2 22,725.8 23,046.8 23,422.4 -1,023.8 808.0 687.5 321.0 375.6 Employer contributions for government social insurance 9 18,058.6 17,296.0 17,932.3 18,423.5 18,759.3 19,090.5 -762.5 636.3 491.2 335.8 331.1 Plus: Adjustment for residence 10 2,517.1 2,354.2 2,462.8 2,548.2 2,582.7 2,614.4 -162.9 108.6 85.4 34.6 31.7 Equals: Net earnings by place of residence 11 299,585.3 278,893.9 297,857.8 306,909.4 306,600.7 315,189.1 -20,691.4 18,963.9 9,051.6 -308.8 8,588.4 Plus: Dividends, interest, and rent 12 89,659.0 88,430.8 87,449.4 88,282.7 88,099.9 88,713.2 -1,228.3 -981.3 833.3 -182.9 613.3 Plus: Personal current transfer receipts 13 105,834.2 212,229.7 145,479.6 122,622.3 195,284.7 141,880.5 106,395.6 -66,750.2 -22,857.3 72,662.4 -53,404.2 Social Security 14 39,830.9 40,030.1 40,188.4 40,450.0 40,993.3 41,098.2 199.2 158.2 261.7 543.3 104.9 Medicare 15 28,496.5 28,913.2 29,040.2 28,875.4 28,655.9 28,692.3 416.7 127.0 -164.8 -219.5 36.4 Of which: Increase in Medicare reimbursement rates1 16 338.9 507.4 503.6 499.8 496.2 338.9 168.5 -3.8 -3.8 -3.5 Medicaid 17 17,813.2 18,969.9 20,112.9 19,387.4 20,180.6 21,171.8 1,156.7 1,143.0 -725.5 793.2 991.1 State unemployment insurance 18 1,072.7 63,438.8 27,195.7 10,903.3 22,135.6 19,257.3 62,366.1 -36,243.1 -16,292.4 11,232.2 -2,878.2 Of which:2
Extended Unemployment Benefits 19 0.0 8.2 555.4 1,326.8 38.0 0.0 8.2 547.2 771.4 -1,288.7 Pandemic Emergency Unemployment Compensation 20 192.5 666.7 2,908.0 2,897.4 3,718.9 192.5 474.2 2,241.3 -10.6 821.5 Pandemic Unemployment Assistance 21 6,506.3 5,278.8 4,479.6 4,256.6 3,706.8 6,506.3 -1,227.5 -799.2 -223.0 -549.8 Pandemic Unemployment Compensation Payments 22 45,550.4 16,231.4 217.8 12,228.0 10,592.1 45,550.4 -29,319.0 -16,013.6 12,010.2 -1,635.9 All other personal current transfer receipts 23 18,620.9 60,877.8 28,942.4 23,006.1 83,319.3 31,660.9 42,256.9 -31,935.3 -5,936.3 60,313.1 -51,658.4 Of which: Economic impact payments3 24 34,499.4 496.9 161.2 60,913.4 9,138.4 34,499.4 -34,002.5 -335.8 60,752.2 -51,775.0 Lost wages supplemental payments4 25 0.0 4,720.1 1,625.0 139.6 96.6 0.0 4,720.1 -3,095.1 -1,485.4 -43.0 Paycheck Protection Program loans to NPISH5 26 899.2 2,899.5 871.3 285.3 372.8 899.2 2,000.3 -2,028.2 -586.0 87.5 Provider Relief Fund to NPISH6 27 57.9 6,111.8 1,411.7 905.8 1,422.4 884.0 6,053.9 -4,700.1 -505.8 516.6 -538.4Components of earnings by place of work Wages and salaries 28 246,784.0 230,546.4 241,821.8 251,424.1 252,363.8 257,700.5 -16,237.6 11,275.4 9,602.3 939.7 5,336.7 Supplements to wages and salaries 29 56,839.2 54,027.7 56,206.1 57,690.7 58,275.8 58,864.5 -2,811.6 2,178.5 1,484.6 585.1 588.7 Employer contributions for employee pension and insurance funds 30 38,780.6 36,731.6 38,273.8 39,267.2 39,516.4 39,774.0 -2,049.0 1,542.2 993.3 249.3 257.6 Employer contributions for government social insurance 31 18,058.6 17,296.0 17,932.3 18,423.5 18,759.3 19,090.5 -762.5 636.3 491.2 335.8 331.1 Proprietors' income 32 33,757.6 30,491.9 37,337.7 36,395.8 35,184.5 38,522.5 -3,265.7 6,845.7 -941.8 -1,211.3 3,338.0 Farm proprietors' income 33 1,098.6 943.8 1,575.3 2,502.6 1,407.7 2,172.4 -154.8 631.5 927.3 -1,094.9 764.7 Of which: Coronavirus Food Assistance Program7 34 343.7 326.1 1,208.7 3.8 32.7 343.7 -17.6 882.6 -1,204.9 28.9 Paycheck Protection Program loans to businesses5 35 190.5 270.6 81.3 96.5 210.2 190.5 80.1 -189.3 15.2 113.7 Nonfarm proprietors' income 36 32,659.0 29,548.1 35,762.4 33,893.2 33,776.8 36,350.1 -3,110.8 6,214.3 -1,869.2 -116.4 2,573.3 Of which: Paycheck Protection Program loans to businesses5 37 4,851.5 6,930.1 2,133.7 1,991.9 5,237.7 4,851.5 2,078.6 -4,796.4 -141.9 3,245.8
Data on this table will be superseded by updated estimates. Regional estimates were controlled to the annual update to the National accounts released August 26, 2021.
2020 2021
Effects of Selected Federal Pandemic Response Programs on State Personal Income, 2021Q2Michigan
(Millions of dollars, seasonally adjusted at annual rates)Levels Change from preceding period
Note: BEA state per capita personal income statistics are calculated using unpublished Census Bureau midquarter population estimates. These midquarter estimates are based on the 2010 census. BEA will incorporate Census Bureau population estimates based on the 2020 census results wh
Source. U.S. Bureau of Economic AnalysisLast updated: September 23, 2021.
Line
3. Economic impact payments, initially established by the CARES Act, provide direct payments to individuals. For more information, see How are federal economic impact payments to support individuals during the COVID-19 pandemic recorded in the NIPAs?4. The Federal Emergency Management Agency (FEMA) was authorized to make payments from the Disaster Relief Fund to supplement wages lost as a result of the COVID-19 pandemic.5. The Paycheck Protection Program, initially established by the CARES Act, provides forgivable loans to help small businesses and nonprofit institutions make payroll and cover other expenses. It also provides funding to reimburse private lending institutions for the costs of administering these loans. For more information, see How does the Paycheck Protection Program impact the national income and product accounts (NIPAs)?6. The Department of Health and Human Services distributes money from the Provider Relief Fund to hospitals and health care providers on the front lines of the coronavirus response. This funding supports health care-related expenses or lost revenue attributable to COVID-19 and ensures uninsured Americans can get treatment for COVID-19. In the NIPAs, funds provided to nonprofit hospitals are recorded as social benefits.7. The Coronavirus Food Assistance Program, initially established by the CARES Act, provides direct support to farmers and ranchers where prices and market supply chains have been impacted by the COVID-19 pandemic.
CARES -Coronavirus Aid, Relief, and Economic SecurityNPISH -Nonprofit institutions serving households1. A two percent reduction in reimbursements paid to Medicare service providers that went into effect in 2013 was initially suspended by the CARES Act. The resulting increased reimbursement rates went into effect beginning on May 1, 2020.2. Unemployment insurance benefits were expanded through several programs that were initially established through the CARES Act. For more information, see How will the expansion of unemployment benefits in response to the COVID-19 pandemic be recorded in the NIPAs?
2020 2021

Q1 Q2 Q3 Q4 Q1 Q2 Q2 Q3 Q4 Q1 Q2Personal income (millions of dollars) 1 337,003.9 367,963.3 348,415.2 349,756.4 388,235.9 366,590.3 30,959.5 -19,548.2 1,341.2 38,479.6 -21,645.6 Nonfarm personal income 2 333,894.7 365,199.1 344,694.4 343,437.5 383,873.1 359,994.2 31,304.4 -20,504.8 -1,256.8 40,435.5 -23,878.8 Farm income 3 3,109.2 2,764.2 3,720.8 6,318.8 4,362.9 6,596.1 -344.9 956.6 2,598.0 -1,956.0 2,233.2Population (persons) 4 5,654,054 5,656,419 5,659,622 5,663,552 5,665,311 5,668,240 2,365 3,203 3,930 1,759 2,929Per capita personal income (dollars) 5 59,604 65,052 61,562 61,756 68,529 64,674 5,448 -3,490 194 6,773 -3,855Derivation of personal income Earnings by place of work 6 247,085.8 233,816.0 244,934.0 256,352.4 255,527.6 262,086.2 -13,269.8 11,118.0 11,418.4 -824.8 6,558.5 Less: Contributions for government social insurance 7 28,623.5 27,546.6 28,519.2 29,351.4 29,896.7 30,355.0 -1,076.9 972.6 832.1 545.4 458.3 Employee and self-employed contributions for government social insurance 8 15,422.9 14,801.7 15,319.8 15,801.4 16,037.1 16,281.2 -621.2 518.1 481.6 235.7 244.1 Employer contributions for government social insurance 9 13,200.6 12,744.9 13,199.4 13,549.9 13,859.7 14,073.8 -455.8 454.6 350.5 309.7 214.2 Plus: Adjustment for residence 10 -1,275.0 -1,225.6 -1,286.8 -1,355.9 -1,331.2 -1,354.0 49.4 -61.1 -69.2 24.7 -22.8 Equals: Net earnings by place of residence 11 217,187.3 205,043.8 215,128.1 225,645.2 224,299.7 230,377.2 -12,143.5 10,084.3 10,517.1 -1,345.4 6,077.4 Plus: Dividends, interest, and rent 12 64,919.5 63,613.4 62,549.4 63,413.7 63,210.4 63,847.6 -1,306.1 -1,064.1 864.3 -203.3 637.2 Plus: Personal current transfer receipts 13 54,897.1 99,306.1 70,737.7 60,697.5 100,725.8 72,365.5 44,409.1 -28,568.4 -10,040.2 40,028.3 -28,360.3 Social Security 14 18,645.7 18,783.9 18,891.5 19,055.1 19,381.8 19,444.9 138.2 107.6 163.6 326.7 63.1 Medicare 15 12,624.5 12,830.4 12,895.7 12,819.1 12,709.5 12,727.9 206.0 65.2 -76.6 -109.5 18.4 Of which: Increase in Medicare reimbursement rates1 16 150.3 225.1 223.4 221.7 220.2 150.3 74.8 -1.7 -1.7 -1.6 Medicaid 17 12,609.4 12,428.7 13,265.1 12,974.9 13,595.7 14,372.3 -180.6 836.3 -290.2 620.8 776.6 State unemployment insurance 18 1,129.3 20,801.3 10,128.2 4,512.4 9,497.5 7,746.9 19,672.0 -10,673.1 -5,615.8 4,985.1 -1,750.5 Of which:2
Extended Unemployment Benefits 19 0.0 77.4 244.6 2.1 0.3 0.0 77.4 167.2 -242.5 -1.8 Pandemic Emergency Unemployment Compensation 20 173.6 473.6 1,526.5 2,540.6 2,303.4 173.6 300.0 1,052.9 1,014.0 -237.2 Pandemic Unemployment Assistance 21 861.8 802.4 736.7 760.5 702.9 861.8 -59.5 -65.6 23.7 -57.5 Pandemic Unemployment Compensation Payments 22 13,327.9 4,235.4 52.1 4,836.0 3,605.8 13,327.9 -9,092.6 -4,183.3 4,784.0 -1,230.2 All other personal current transfer receipts 23 9,888.2 34,461.7 15,557.3 11,336.0 45,541.2 18,073.4 24,573.5 -18,904.5 -4,221.3 34,205.2 -27,467.8 Of which: Economic impact payments3 24 18,878.2 272.0 88.2 33,106.9 4,966.8 18,878.2 -18,606.2 -183.8 33,018.7 -28,140.1 Lost wages supplemental payments4 25 0.0 1,906.8 55.8 15.7 3.5 0.0 1,906.8 -1,851.1 -40.1 -12.2 Paycheck Protection Program loans to NPISH5 26 1,511.8 1,544.5 464.1 318.0 962.3 1,511.8 32.7 -1,080.4 -146.2 644.3 Provider Relief Fund to NPISH6 27 35.2 3,717.1 1,522.5 434.0 956.8 594.6 3,681.9 -2,194.6 -1,088.5 522.8 -362.1Components of earnings by place of work Wages and salaries 28 181,692.9 170,734.3 178,519.7 185,629.3 186,470.0 190,209.3 -10,958.7 7,785.4 7,109.6 840.8 3,739.2 Supplements to wages and salaries 29 39,188.1 37,509.3 39,012.7 40,104.6 40,379.3 40,704.9 -1,678.7 1,503.4 1,091.9 274.8 325.5 Employer contributions for employee pension and insurance funds 30 25,987.4 24,764.4 25,813.3 26,554.6 26,519.7 26,631.1 -1,223.0 1,048.8 741.4 -34.9 111.4 Employer contributions for government social insurance 31 13,200.6 12,744.9 13,199.4 13,549.9 13,859.7 14,073.8 -455.8 454.6 350.5 309.7 214.2 Proprietors' income 32 26,204.8 25,572.4 27,401.6 30,618.6 28,678.3 31,172.0 -632.4 1,829.2 3,217.0 -1,940.3 2,493.8 Farm proprietors' income 33 2,456.8 2,113.3 3,065.6 5,653.3 3,683.0 5,907.1 -343.5 952.3 2,587.7 -1,970.3 2,224.2 Of which: Coronavirus Food Assistance Program7 34 1,078.4 1,037.0 2,857.6 5.2 35.4 1,078.4 -41.4 1,820.6 -2,852.4 30.3 Paycheck Protection Program loans to businesses5 35 237.5 337.4 101.4 341.5 765.4 237.5 99.9 -236.0 240.1 423.9 Nonfarm proprietors' income 36 23,748.1 23,459.1 24,336.1 24,965.4 24,995.3 25,264.9 -288.9 876.9 629.3 30.0 269.6 Of which: Paycheck Protection Program loans to businesses5 37 3,732.3 2,636.2 1,560.0 1,245.0 1,914.4 3,732.3 -1,096.1 -1,076.2 -315.0 669.4
Data on this table will be superseded by updated estimates. Regional estimates were controlled to the annual update to the National accounts released August 26, 2021.
2020 2021
Effects of Selected Federal Pandemic Response Programs on State Personal Income, 2021Q2Minnesota
(Millions of dollars, seasonally adjusted at annual rates)Levels Change from preceding period
Note: BEA state per capita personal income statistics are calculated using unpublished Census Bureau midquarter population estimates. These midquarter estimates are based on the 2010 census. BEA will incorporate Census Bureau population estimates based on the 2020 census results wh
Source. U.S. Bureau of Economic AnalysisLast updated: September 23, 2021.
Line
3. Economic impact payments, initially established by the CARES Act, provide direct payments to individuals. For more information, see How are federal economic impact payments to support individuals during the COVID-19 pandemic recorded in the NIPAs?4. The Federal Emergency Management Agency (FEMA) was authorized to make payments from the Disaster Relief Fund to supplement wages lost as a result of the COVID-19 pandemic.5. The Paycheck Protection Program, initially established by the CARES Act, provides forgivable loans to help small businesses and nonprofit institutions make payroll and cover other expenses. It also provides funding to reimburse private lending institutions for the costs of administering these loans. For more information, see How does the Paycheck Protection Program impact the national income and product accounts (NIPAs)?6. The Department of Health and Human Services distributes money from the Provider Relief Fund to hospitals and health care providers on the front lines of the coronavirus response. This funding supports health care-related expenses or lost revenue attributable to COVID-19 and ensures uninsured Americans can get treatment for COVID-19. In the NIPAs, funds provided to nonprofit hospitals are recorded as social benefits.7. The Coronavirus Food Assistance Program, initially established by the CARES Act, provides direct support to farmers and ranchers where prices and market supply chains have been impacted by the COVID-19 pandemic.
CARES -Coronavirus Aid, Relief, and Economic SecurityNPISH -Nonprofit institutions serving households1. A two percent reduction in reimbursements paid to Medicare service providers that went into effect in 2013 was initially suspended by the CARES Act. The resulting increased reimbursement rates went into effect beginning on May 1, 2020.2. Unemployment insurance benefits were expanded through several programs that were initially established through the CARES Act. For more information, see How will the expansion of unemployment benefits in response to the COVID-19 pandemic be recorded in the NIPAs?
2020 2021

Q1 Q2 Q3 Q4 Q1 Q2 Q2 Q3 Q4 Q1 Q2Personal income (millions of dollars) 1 119,522.9 133,973.3 124,580.9 121,875.7 143,160.8 130,505.0 14,450.4 -9,392.3 -2,705.3 21,285.1 -12,655.8 Nonfarm personal income 2 118,103.2 133,455.8 123,723.5 120,414.1 141,970.8 128,952.3 15,352.6 -9,732.2 -3,309.4 21,556.7 -13,018.4 Farm income 3 1,419.7 517.5 857.4 1,461.5 1,190.0 1,552.7 -902.2 339.9 604.1 -271.5 362.6Population (persons) 4 2,972,908 2,968,921 2,966,316 2,964,929 2,961,129 2,957,449 -3,987 -2,605 -1,387 -3,800 -3,680Per capita personal income (dollars) 5 40,204 45,125 41,999 41,106 48,347 44,128 4,921 -3,126 -893 7,241 -4,219Derivation of personal income Earnings by place of work 6 75,019.4 68,651.9 74,054.1 76,011.4 75,408.9 79,368.6 -6,367.4 5,402.1 1,957.3 -602.5 3,959.7 Less: Contributions for government social insurance 7 9,394.5 8,948.3 9,347.2 9,596.4 9,635.3 9,785.7 -446.2 398.9 249.1 38.9 150.5 Employee and self-employed contributions for government social insurance 8 5,382.9 5,107.4 5,338.0 5,486.9 5,497.2 5,579.6 -275.5 230.6 149.0 10.2 82.5 Employer contributions for government social insurance 9 4,011.7 3,841.0 4,009.2 4,109.4 4,138.1 4,206.1 -170.7 168.3 100.2 28.7 68.0 Plus: Adjustment for residence 10 3,603.9 3,349.8 3,523.9 3,667.3 3,803.1 3,870.3 -254.1 174.1 143.4 135.8 67.2 Equals: Net earnings by place of residence 11 69,228.8 63,053.4 68,230.8 70,082.3 69,576.8 73,453.2 -6,175.4 5,177.3 1,851.6 -505.5 3,876.5 Plus: Dividends, interest, and rent 12 18,755.3 18,512.5 18,346.5 18,439.1 18,458.7 18,554.2 -242.7 -166.0 92.6 19.6 95.5 Plus: Personal current transfer receipts 13 31,538.9 52,407.3 38,003.7 33,354.2 55,125.3 38,497.6 20,868.5 -14,403.7 -4,649.5 21,771.1 -16,627.8 Social Security 14 10,630.0 10,681.0 10,722.1 10,793.9 10,946.4 10,975.8 51.0 41.1 71.8 152.5 29.4 Medicare 15 8,044.8 8,161.1 8,197.4 8,152.8 8,093.7 8,103.4 116.4 36.2 -44.5 -59.2 9.8 Of which: Increase in Medicare reimbursement rates1 16 95.7 143.2 142.2 141.1 140.1 95.7 47.6 -1.1 -1.1 -1.0 Medicaid 17 5,369.2 5,643.8 5,773.1 5,547.9 5,578.3 5,705.2 274.6 129.3 -225.2 30.4 126.8 State unemployment insurance 18 262.7 7,969.9 3,826.6 1,049.0 2,751.5 2,083.4 7,707.1 -4,143.3 -2,777.6 1,702.5 -668.2 Of which:2
Extended Unemployment Benefits 19 0.0 9.1 39.2 0.5 (L) 0.0 9.1 30.1 -38.7 (L) Pandemic Emergency Unemployment Compensation 20 11.6 90.8 256.9 412.0 316.3 11.6 79.2 166.1 155.1 -95.6 Pandemic Unemployment Assistance 21 373.3 423.1 330.2 318.3 198.6 373.3 49.8 -92.9 -11.9 -119.7 Pandemic Unemployment Compensation Payments 22 6,414.9 2,497.0 18.6 1,719.5 1,301.8 6,414.9 -3,917.8 -2,478.4 1,700.9 -417.7 All other personal current transfer receipts 23 7,232.1 19,951.5 9,484.5 7,810.6 27,755.4 11,629.8 12,719.4 -10,467.0 -1,674.0 19,944.9 -16,125.6 Of which: Economic impact payments3 24 10,298.8 148.7 48.2 19,262.2 2,889.8 10,298.8 -10,150.1 -100.5 19,214.0 -16,372.4 Lost wages supplemental payments4 25 0.0 942.8 35.8 10.5 1.6 0.0 942.8 -907.1 -25.3 -8.8 Paycheck Protection Program loans to NPISH5 26 267.7 445.7 133.9 66.4 226.2 267.7 178.0 -311.8 -67.6 159.9 Provider Relief Fund to NPISH6 27 17.6 1,860.6 449.3 83.4 404.1 251.1 1,843.0 -1,411.2 -365.9 320.7 -152.9Components of earnings by place of work Wages and salaries 28 53,494.6 49,481.9 52,056.5 53,845.5 53,400.3 54,454.7 -4,012.8 2,574.6 1,789.0 -445.2 1,054.4 Supplements to wages and salaries 29 12,941.1 12,338.1 12,869.4 13,157.7 13,149.5 13,275.3 -603.1 531.3 288.3 -8.3 125.8 Employer contributions for employee pension and insurance funds 30 8,929.5 8,497.1 8,860.2 9,048.3 9,011.4 9,069.2 -432.4 363.1 188.1 -36.9 57.8 Employer contributions for government social insurance 31 4,011.7 3,841.0 4,009.2 4,109.4 4,138.1 4,206.1 -170.7 168.3 100.2 28.7 68.0 Proprietors' income 32 8,583.6 6,832.0 9,128.2 9,008.2 8,859.1 11,638.6 -1,751.6 2,296.2 -120.0 -149.0 2,779.5 Farm proprietors' income 33 1,292.4 391.1 730.7 1,333.0 1,058.7 1,419.6 -901.2 339.5 602.3 -274.3 360.9 Of which: Coronavirus Food Assistance Program7 34 210.8 147.3 467.7 2.3 6.4 210.8 -63.5 320.4 -465.4 4.1 Paycheck Protection Program loans to businesses5 35 56.6 80.4 24.1 46.1 120.4 56.6 23.8 -56.2 21.9 74.3 Nonfarm proprietors' income 36 7,291.2 6,440.9 8,397.5 7,675.2 7,800.4 10,219.0 -850.3 1,956.7 -722.4 125.2 2,418.6 Of which: Paycheck Protection Program loans to businesses5 37 962.5 1,833.6 540.3 613.2 3,113.8 962.5 871.1 -1,293.3 72.9 2,500.6
Data on this table will be superseded by updated estimates. Regional estimates were controlled to the annual update to the National accounts released August 26, 2021.
2021 2020 2021
Effects of Selected Federal Pandemic Response Programs on State Personal Income, 2021Q2Mississippi
(Millions of dollars, seasonally adjusted at annual rates)Levels Change from preceding period
NPISH -Nonprofit institutions serving households
Note: BEA state per capita personal income statistics are calculated using unpublished Census Bureau midquarter population estimates. These midquarter estimates are based on the 2010 census. BEA will incorporate Census Bureau population estimates based on the 2020 census results when t
Source. U.S. Bureau of Economic AnalysisLast updated: September 23, 2021.
Line
3. Economic impact payments, initially established by the CARES Act, provide direct payments to individuals. For more information, see How are federal economic impact payments to support individuals during the COVID-19 pandemic recorded in the NIPAs?
4. The Federal Emergency Management Agency (FEMA) was authorized to make payments from the Disaster Relief Fund to supplement wages lost as a result of the COVID-19 pandemic.5. The Paycheck Protection Program, initially established by the CARES Act, provides forgivable loans to help small businesses and nonprofit institutions make payroll and cover other expenses. It also provides funding to reimburse private lending institutions for the costs of administering these loans. For more information, see How does the Paycheck Protection Program impact the national income and product accounts (NIPAs)?6. The Department of Health and Human Services distributes money from the Provider Relief Fund to hospitals and health care providers on the front lines of the coronavirus response. This funding supports health care-related expenses or lost revenue attributable to COVID-19 and ensures 7. The Coronavirus Food Assistance Program, initially established by the CARES Act, provides direct support to farmers and ranchers where prices and market supply chains have been impacted by the COVID-19 pandemic.
CARES -Coronavirus Aid, Relief, and Economic Security
(L) Less than $50,000.1. A two percent reduction in reimbursements paid to Medicare service providers that went into effect in 2013 was initially suspended by the CARES Act. The resulting increased reimbursement rates went into effect beginning on May 1, 2020.2. Unemployment insurance benefits were expanded through several programs that were initially established through the CARES Act. For more information, see How will the expansion of unemployment benefits in response to the COVID-19 pandemic be recorded in the NIPAs?
2020

Q1 Q2 Q3 Q4 Q1 Q2 Q2 Q3 Q4 Q1 Q2Personal income (millions of dollars) 1 307,725.0 333,626.3 314,381.4 316,343.6 358,514.8 333,383.8 25,901.3 -19,244.9 1,962.1 42,171.2 -25,131.0 Nonfarm personal income 2 305,530.0 331,738.1 311,985.4 312,576.8 355,364.3 328,757.1 26,208.1 -19,752.7 591.5 42,787.5 -26,607.2 Farm income 3 2,195.0 1,888.3 2,396.1 3,766.7 3,150.5 4,626.7 -306.7 507.8 1,370.7 -616.3 1,476.2Population (persons) 4 6,150,802 6,151,427 6,154,104 6,158,432 6,158,796 6,160,030 625 2,677 4,328 364 1,234Per capita personal income (dollars) 5 50,030 54,236 51,085 51,368 58,212 54,120 4,206 -3,151 283 6,844 -4,092Derivation of personal income Earnings by place of work 6 218,755.8 205,044.8 216,047.3 224,970.9 226,062.1 231,681.5 -13,711.0 11,002.5 8,923.6 1,091.3 5,619.4 Less: Contributions for government social insurance 7 25,271.9 24,239.9 25,260.1 26,038.4 26,572.9 26,964.9 -1,032.0 1,020.3 778.3 534.5 392.0 Employee and self-employed contributions for government social insurance 8 13,959.6 13,353.1 13,907.5 14,355.0 14,628.3 14,836.5 -606.5 554.3 447.6 273.3 208.3 Employer contributions for government social insurance 9 11,312.3 10,886.8 11,352.7 11,683.4 11,944.6 12,128.3 -425.5 465.9 330.7 261.2 183.7 Plus: Adjustment for residence 10 -5,717.6 -5,281.8 -5,563.5 -5,781.5 -5,907.9 -6,027.1 435.9 -281.8 -217.9 -126.5 -119.2 Equals: Net earnings by place of residence 11 187,766.3 175,523.1 185,223.6 193,151.0 193,581.3 198,689.5 -12,243.1 9,700.5 7,927.4 430.3 5,108.2 Plus: Dividends, interest, and rent 12 59,532.6 58,549.4 57,798.3 58,538.3 58,586.9 59,158.3 -983.2 -751.1 739.9 48.6 571.4 Plus: Personal current transfer receipts 13 60,426.1 99,553.8 71,359.5 64,654.3 106,346.6 75,536.0 39,127.7 -28,194.3 -6,705.2 41,692.3 -30,810.7 Social Security 14 21,843.5 21,965.9 22,062.0 22,213.8 22,522.3 22,581.9 122.4 96.1 151.8 308.6 59.6 Medicare 15 15,774.8 16,016.3 16,095.0 16,009.7 15,890.9 15,910.5 241.5 78.7 -85.3 -118.8 19.6 Of which: Increase in Medicare reimbursement rates1 16 187.7 281.1 279.0 276.9 274.9 187.7 93.4 -2.1 -2.1 -2.0 Medicaid 17 10,281.4 10,846.0 11,471.3 11,104.2 11,220.6 11,828.0 564.6 625.3 -367.1 116.4 607.4 State unemployment insurance 18 422.2 11,543.9 5,594.3 1,663.0 3,922.4 3,218.7 11,121.8 -5,949.7 -3,931.3 2,259.4 -703.7 Of which:2
Extended Unemployment Benefits 19 0.0 36.8 13.3 0.7 0.1 0.0 36.8 -23.5 -12.7 -0.6 Pandemic Emergency Unemployment Compensation 20 54.9 297.4 510.1 729.9 604.7 54.9 242.5 212.7 219.8 -125.2 Pandemic Unemployment Assistance 21 407.4 580.1 456.1 421.8 357.2 407.4 172.7 -123.9 -34.3 -64.6 Pandemic Unemployment Compensation Payments 22 8,775.2 3,250.7 48.3 2,310.6 1,847.8 8,775.2 -5,524.6 -3,202.4 2,262.4 -462.8 All other personal current transfer receipts 23 12,104.3 39,181.7 16,137.0 13,663.7 52,790.4 21,996.9 27,077.4 -23,044.7 -2,473.3 39,126.7 -30,793.5 Of which: Economic impact payments3 24 21,400.1 308.6 100.1 38,016.3 5,703.3 21,400.1 -21,091.5 -208.5 37,916.2 -32,312.9 Lost wages supplemental payments4 25 0.0 1,158.0 29.4 9.5 5.5 0.0 1,158.0 -1,128.6 -19.9 -4.0 Paycheck Protection Program loans to NPISH5 26 1,496.1 1,005.0 302.0 230.3 527.9 1,496.1 -491.1 -703.0 -71.7 297.5 Provider Relief Fund to NPISH6 27 34.2 3,608.7 1,053.7 647.9 895.7 556.7 3,574.6 -2,555.0 -405.8 247.8 -339.0Components of earnings by place of work Wages and salaries 28 160,040.5 149,422.9 156,876.5 163,061.8 164,463.6 167,598.2 -10,617.6 7,453.6 6,185.3 1,401.8 3,134.6 Supplements to wages and salaries 29 37,621.0 35,661.9 36,995.4 37,865.8 38,371.9 38,655.2 -1,959.2 1,333.5 870.4 506.1 283.4 Employer contributions for employee pension and insurance funds 30 26,308.7 24,775.1 25,642.7 26,182.4 26,427.2 26,526.9 -1,533.6 867.6 539.7 244.9 99.6 Employer contributions for government social insurance 31 11,312.3 10,886.8 11,352.7 11,683.4 11,944.6 12,128.3 -425.5 465.9 330.7 261.2 183.7 Proprietors' income 32 21,094.3 19,960.0 22,175.4 24,043.4 23,226.7 25,428.1 -1,134.2 2,215.4 1,867.9 -816.6 2,201.4 Farm proprietors' income 33 1,891.1 1,586.9 2,093.9 3,460.4 2,837.6 4,309.4 -304.2 507.0 1,366.5 -622.9 1,471.9 Of which: Coronavirus Food Assistance Program7 34 633.5 679.7 1,437.7 7.8 20.0 633.5 46.2 757.9 -1,429.9 12.2 Paycheck Protection Program loans to businesses5 35 93.5 132.8 39.9 257.6 579.9 93.5 39.3 -92.9 217.7 322.3 Nonfarm proprietors' income 36 19,203.1 18,373.1 20,081.5 20,582.9 20,389.2 21,118.7 -830.0 1,708.4 501.5 -193.8 729.5 Of which: Paycheck Protection Program loans to businesses5 37 2,791.0 2,705.6 1,589.4 1,421.9 2,507.3 2,791.0 -85.3 -1,116.2 -167.5 1,085.4
Data on this table will be superseded by updated estimates. Regional estimates were controlled to the annual update to the National accounts released August 26, 2021.
2020 2021
Effects of Selected Federal Pandemic Response Programs on State Personal Income, 2021Q2Missouri
(Millions of dollars, seasonally adjusted at annual rates)Levels Change from preceding period
Note: BEA state per capita personal income statistics are calculated using unpublished Census Bureau midquarter population estimates. These midquarter estimates are based on the 2010 census. BEA will incorporate Census Bureau population estimates based on the 2020 census results wh
Source. U.S. Bureau of Economic AnalysisLast updated: September 23, 2021.
Line
3. Economic impact payments, initially established by the CARES Act, provide direct payments to individuals. For more information, see How are federal economic impact payments to support individuals during the COVID-19 pandemic recorded in the NIPAs?4. The Federal Emergency Management Agency (FEMA) was authorized to make payments from the Disaster Relief Fund to supplement wages lost as a result of the COVID-19 pandemic.5. The Paycheck Protection Program, initially established by the CARES Act, provides forgivable loans to help small businesses and nonprofit institutions make payroll and cover other expenses. It also provides funding to reimburse private lending institutions for the costs of administering these loans. For more information, see How does the Paycheck Protection Program impact the national income and product accounts (NIPAs)?6. The Department of Health and Human Services distributes money from the Provider Relief Fund to hospitals and health care providers on the front lines of the coronavirus response. This funding supports health care-related expenses or lost revenue attributable to COVID-19 and ensures uninsured Americans can get treatment for COVID-19. In the NIPAs, funds provided to nonprofit hospitals are recorded as social benefits.7. The Coronavirus Food Assistance Program, initially established by the CARES Act, provides direct support to farmers and ranchers where prices and market supply chains have been impacted by the COVID-19 pandemic.
CARES -Coronavirus Aid, Relief, and Economic SecurityNPISH -Nonprofit institutions serving households1. A two percent reduction in reimbursements paid to Medicare service providers that went into effect in 2013 was initially suspended by the CARES Act. The resulting increased reimbursement rates went into effect beginning on May 1, 2020.2. Unemployment insurance benefits were expanded through several programs that were initially established through the CARES Act. For more information, see How will the expansion of unemployment benefits in response to the COVID-19 pandemic be recorded in the NIPAs?
2020 2021

Q1 Q2 Q3 Q4 Q1 Q2 Q2 Q3 Q4 Q1 Q2Personal income (millions of dollars) 1 55,412.3 61,077.5 56,619.6 57,531.2 64,958.5 60,490.5 5,665.2 -4,458.0 911.6 7,427.3 -4,468.0 Nonfarm personal income 2 54,570.5 59,982.5 55,313.4 55,488.9 63,654.6 58,717.3 5,412.1 -4,669.2 175.6 8,165.7 -4,937.3 Farm income 3 841.9 1,095.0 1,306.2 2,042.3 1,303.9 1,773.2 253.1 211.2 736.0 -738.4 469.3Population (persons) 4 1,077,213 1,079,466 1,082,001 1,084,745 1,086,888 1,089,268 2,253 2,535 2,744 2,143 2,380Per capita personal income (dollars) 5 51,440 56,581 52,329 53,037 59,766 55,533 5,141 -4,252 708 6,729 -4,233Derivation of personal income Earnings by place of work 6 35,314.7 32,750.8 34,643.0 36,684.8 36,677.5 37,756.3 -2,563.9 1,892.3 2,041.8 -7.3 1,078.8 Less: Contributions for government social insurance 7 4,510.0 4,267.9 4,456.5 4,571.5 4,716.9 4,808.2 -242.1 188.6 114.9 145.5 91.3 Employee and self-employed contributions for government social insurance 8 2,439.5 2,293.5 2,387.0 2,448.7 2,521.1 2,567.6 -146.0 93.5 61.6 72.4 46.6 Employer contributions for government social insurance 9 2,070.5 1,974.4 2,069.5 2,122.8 2,195.9 2,240.6 -96.1 95.1 53.3 73.1 44.7 Plus: Adjustment for residence 10 302.7 282.1 293.5 302.8 306.9 312.9 -20.6 11.3 9.4 4.0 6.0 Equals: Net earnings by place of residence 11 31,107.4 28,765.0 30,480.0 32,416.2 32,267.4 33,261.0 -2,342.4 1,715.0 1,936.2 -148.8 993.6 Plus: Dividends, interest, and rent 12 13,730.4 13,439.8 13,183.6 13,433.6 13,366.6 13,533.9 -290.6 -256.1 249.9 -67.0 167.3 Plus: Personal current transfer receipts 13 10,574.6 18,872.8 12,956.0 11,681.4 19,324.5 13,695.6 8,298.2 -5,916.8 -1,274.5 7,643.1 -5,628.9 Social Security 14 3,910.0 3,942.0 3,966.8 4,004.1 4,078.0 4,092.3 32.0 24.8 37.3 74.0 14.3 Medicare 15 2,400.2 2,443.4 2,457.5 2,442.3 2,419.2 2,423.1 43.2 14.1 -15.2 -23.1 3.9 Of which: Increase in Medicare reimbursement rates1 16 28.6 42.9 42.5 42.2 41.9 28.6 14.2 -0.3 -0.3 -0.3 Medicaid 17 1,630.7 2,032.0 2,146.8 2,054.1 2,095.5 2,285.7 401.3 114.9 -92.7 41.3 190.2 State unemployment insurance 18 125.9 2,611.1 1,121.7 410.1 756.3 656.5 2,485.2 -1,489.4 -711.6 346.1 -99.8 Of which:2
Extended Unemployment Benefits 19 0.0 4.2 7.2 0.5 0.2 0.0 4.2 2.9 -6.6 -0.3 Pandemic Emergency Unemployment Compensation 20 14.8 43.0 73.7 131.7 113.5 14.8 28.2 30.6 58.0 -18.2 Pandemic Unemployment Assistance 21 128.4 121.0 146.6 125.0 102.8 128.4 -7.4 25.6 -21.6 -22.2 Pandemic Unemployment Compensation Payments 22 1,869.6 583.2 22.4 387.5 345.2 1,869.6 -1,286.4 -560.8 365.1 -42.3 All other personal current transfer receipts 23 2,507.7 7,844.3 3,263.1 2,770.8 9,975.6 4,238.0 5,336.6 -4,581.2 -492.3 7,204.8 -5,737.5 Of which: Economic impact payments3 24 3,911.1 56.4 18.3 6,835.2 1,025.4 3,911.1 -3,854.7 -38.1 6,816.9 -5,809.7 Lost wages supplemental payments4 25 0.0 192.9 0.0 0.5 0.0 0.0 192.9 -192.9 0.5 -0.5 Paycheck Protection Program loans to NPISH5 26 312.7 307.8 92.5 40.4 37.4 312.7 -4.9 -215.3 -52.1 -3.1 Provider Relief Fund to NPISH6 27 9.1 965.7 88.1 58.9 188.0 116.8 956.6 -877.7 -29.2 129.1 -71.2Components of earnings by place of work Wages and salaries 28 24,166.1 22,279.6 23,442.5 24,252.7 24,712.2 25,287.1 -1,886.4 1,162.9 810.1 459.6 574.9 Supplements to wages and salaries 29 5,850.6 5,507.6 5,694.5 5,797.8 5,907.7 5,980.2 -343.1 187.0 103.3 110.0 72.5 Employer contributions for employee pension and insurance funds 30 3,780.1 3,533.2 3,625.0 3,675.0 3,711.8 3,739.6 -247.0 91.9 50.0 36.8 27.8 Employer contributions for government social insurance 31 2,070.5 1,974.4 2,069.5 2,122.8 2,195.9 2,240.6 -96.1 95.1 53.3 73.1 44.7 Proprietors' income 32 5,298.0 4,963.6 5,506.0 6,634.4 6,057.5 6,489.0 -334.4 542.4 1,128.4 -576.9 431.5 Farm proprietors' income 33 582.7 838.3 1,049.1 1,781.7 1,037.7 1,503.5 255.6 210.8 732.6 -744.0 465.7 Of which: Coronavirus Food Assistance Program7 34 260.0 364.4 935.0 4.6 29.9 260.0 104.5 570.5 -930.3 25.3 Paycheck Protection Program loans to businesses5 35 32.9 46.8 14.1 71.6 161.9 32.9 13.9 -32.7 57.5 90.3 Nonfarm proprietors' income 36 4,715.3 4,125.3 4,456.9 4,852.7 5,019.8 4,985.5 -590.0 331.6 395.8 167.1 -34.3 Of which: Paycheck Protection Program loans to businesses5 37 526.5 251.0 258.8 215.5 254.6 526.5 -275.5 7.8 -43.3 39.1
Data on this table will be superseded by updated estimates. Regional estimates were controlled to the annual update to the National accounts released August 26, 2021.
2020 2021
Effects of Selected Federal Pandemic Response Programs on State Personal Income, 2021Q2Montana
(Millions of dollars, seasonally adjusted at annual rates)Levels Change from preceding period
Note: BEA state per capita personal income statistics are calculated using unpublished Census Bureau midquarter population estimates. These midquarter estimates are based on the 2010 census. BEA will incorporate Census Bureau population estimates based on the 2020 census results wh
Source. U.S. Bureau of Economic AnalysisLast updated: September 23, 2021.
Line
3. Economic impact payments, initially established by the CARES Act, provide direct payments to individuals. For more information, see How are federal economic impact payments to support individuals during the COVID-19 pandemic recorded in the NIPAs?4. The Federal Emergency Management Agency (FEMA) was authorized to make payments from the Disaster Relief Fund to supplement wages lost as a result of the COVID-19 pandemic.5. The Paycheck Protection Program, initially established by the CARES Act, provides forgivable loans to help small businesses and nonprofit institutions make payroll and cover other expenses. It also provides funding to reimburse private lending institutions for the costs of administering these loans. For more information, see How does the Paycheck Protection Program impact the national income and product accounts (NIPAs)?6. The Department of Health and Human Services distributes money from the Provider Relief Fund to hospitals and health care providers on the front lines of the coronavirus response. This funding supports health care-related expenses or lost revenue attributable to COVID-19 and ensures uninsured Americans can get treatment for COVID-19. In the NIPAs, funds provided to nonprofit hospitals are recorded as social benefits.7. The Coronavirus Food Assistance Program, initially established by the CARES Act, provides direct support to farmers and ranchers where prices and market supply chains have been impacted by the COVID-19 pandemic.
CARES -Coronavirus Aid, Relief, and Economic SecurityNPISH -Nonprofit institutions serving households1. A two percent reduction in reimbursements paid to Medicare service providers that went into effect in 2013 was initially suspended by the CARES Act. The resulting increased reimbursement rates went into effect beginning on May 1, 2020.2. Unemployment insurance benefits were expanded through several programs that were initially established through the CARES Act. For more information, see How will the expansion of unemployment benefits in response to the COVID-19 pandemic be recorded in the NIPAs?
2020 2021

Q1 Q2 Q3 Q4 Q1 Q2 Q2 Q3 Q4 Q1 Q2Personal income (millions of dollars) 1 108,001.4 115,110.9 109,415.5 113,652.3 124,839.3 118,971.0 7,109.6 -5,695.4 4,236.8 11,187.0 -5,868.2 Nonfarm personal income 2 104,608.4 111,912.7 105,279.3 106,605.0 119,554.6 110,885.1 7,304.3 -6,633.4 1,325.7 12,949.6 -8,669.5 Farm income 3 3,393.0 3,198.3 4,136.2 7,047.3 5,284.7 8,085.9 -194.7 937.9 2,911.0 -1,762.6 2,801.3Population (persons) 4 1,936,742 1,937,348 1,938,407 1,939,875 1,940,334 1,941,133 606 1,059 1,468 459 799Per capita personal income (dollars) 5 55,764 59,417 56,446 58,587 64,339 61,289 3,653 -2,971 2,141 5,752 -3,050Derivation of personal income Earnings by place of work 6 79,801.0 74,910.1 78,972.9 84,918.1 82,934.3 86,736.9 -4,890.9 4,062.8 5,945.2 -1,983.7 3,802.5 Less: Contributions for government social insurance 7 9,028.9 8,706.0 9,029.6 9,288.4 9,392.3 9,494.2 -322.8 323.6 258.8 103.8 102.0 Employee and self-employed contributions for government social insurance 8 4,893.6 4,696.6 4,870.2 5,016.9 5,068.7 5,123.0 -197.0 173.6 146.7 51.8 54.3 Employer contributions for government social insurance 9 4,135.3 4,009.5 4,159.4 4,271.6 4,323.6 4,371.3 -125.8 150.0 112.1 52.0 47.7 Plus: Adjustment for residence 10 -1,204.9 -1,129.6 -1,179.1 -1,221.8 -1,212.0 -1,229.7 75.4 -49.6 -42.6 9.8 -17.7 Equals: Net earnings by place of residence 11 69,567.2 65,074.5 68,764.2 74,407.9 72,330.1 76,013.0 -4,492.7 3,689.7 5,643.7 -2,077.8 3,682.8 Plus: Dividends, interest, and rent 12 21,531.4 21,177.7 20,913.3 21,129.4 21,129.5 21,304.9 -353.6 -264.4 216.0 0.1 175.4 Plus: Personal current transfer receipts 13 16,902.8 28,858.7 19,738.0 18,115.0 31,379.6 21,653.2 11,955.9 -9,120.8 -1,622.9 13,264.6 -9,726.5 Social Security 14 6,020.0 6,061.2 6,093.4 6,143.0 6,242.5 6,261.8 41.2 32.2 49.6 99.6 19.2 Medicare 15 4,247.9 4,318.3 4,341.7 4,317.7 4,282.5 4,288.4 70.4 23.4 -24.0 -35.2 5.9 Of which: Increase in Medicare reimbursement rates1 16 50.6 75.8 75.2 74.6 74.1 50.6 25.2 -0.6 -0.6 -0.5 Medicaid 17 2,150.1 2,352.9 2,556.2 2,564.7 2,761.3 3,135.5 202.9 203.2 8.6 196.6 374.2 State unemployment insurance 18 144.1 2,930.9 1,215.7 329.3 527.1 470.8 2,786.8 -1,715.1 -886.4 197.8 -56.3 Of which:2
Extended Unemployment Benefits 19 0.0 1.3 1.3 (L) (L) 0.0 1.3 0.0 (L) (L) Pandemic Emergency Unemployment Compensation 20 6.3 32.3 63.5 70.1 90.2 6.3 26.0 31.2 6.6 20.1 Pandemic Unemployment Assistance 21 132.4 90.3 47.7 31.3 33.1 132.4 -42.1 -42.6 -16.4 1.8 Pandemic Unemployment Compensation Payments 22 2,153.4 670.5 8.7 279.0 233.5 2,153.4 -1,482.9 -661.8 270.3 -45.5 All other personal current transfer receipts 23 4,340.8 13,195.5 5,531.0 4,760.3 17,566.2 7,496.7 8,854.7 -7,664.5 -770.7 12,805.9 -10,069.5 Of which: Economic impact payments3 24 6,635.8 95.5 31.0 12,071.5 1,811.0 6,635.8 -6,540.3 -64.5 12,040.5 -10,260.5 Lost wages supplemental payments4 25 0.0 193.9 14.5 2.8 3.1 0.0 193.9 -179.4 -11.7 0.3 Paycheck Protection Program loans to NPISH5 26 280.4 468.5 140.8 80.1 112.9 280.4 188.1 -327.7 -60.7 32.8 Provider Relief Fund to NPISH6 27 15.9 1,684.3 284.9 135.8 355.5 220.9 1,668.3 -1,399.3 -149.2 219.7 -134.5Components of earnings by place of work Wages and salaries 28 54,856.4 51,504.6 53,922.8 55,981.8 55,981.6 56,851.2 -3,351.8 2,418.2 2,059.0 -0.3 869.7 Supplements to wages and salaries 29 13,371.3 12,687.6 13,097.3 13,393.5 13,448.5 13,516.5 -683.8 409.8 296.1 55.1 67.9 Employer contributions for employee pension and insurance funds 30 9,236.1 8,678.1 8,937.9 9,121.9 9,124.9 9,145.2 -558.0 259.8 184.0 3.0 20.3 Employer contributions for government social insurance 31 4,135.3 4,009.5 4,159.4 4,271.6 4,323.6 4,371.3 -125.8 150.0 112.1 52.0 47.7 Proprietors' income 32 11,573.3 10,717.9 11,952.8 15,542.8 13,504.2 16,369.1 -855.3 1,234.9 3,590.0 -2,038.6 2,864.9 Farm proprietors' income 33 2,884.9 2,693.5 3,629.5 6,533.1 4,759.5 7,553.5 -191.4 936.0 2,903.6 -1,773.7 2,794.0 Of which: Coronavirus Food Assistance Program7 34 1,202.3 1,279.9 2,953.6 13.4 39.8 1,202.3 77.5 1,673.8 -2,940.3 26.4 Paycheck Protection Program loans to businesses5 35 190.7 270.9 81.4 371.3 831.8 190.7 80.2 -189.5 289.9 460.5 Nonfarm proprietors' income 36 8,688.3 8,024.4 8,323.3 9,009.6 8,744.8 8,815.7 -663.9 298.9 686.3 -264.9 70.9 Of which: Paycheck Protection Program loans to businesses5 37 950.8 479.0 563.2 417.9 627.4 950.8 -471.8 84.2 -145.3 209.6
Data on this table will be superseded by updated estimates. Regional estimates were controlled to the annual update to the National accounts released August 26, 2021.
2021 2020 2021
Effects of Selected Federal Pandemic Response Programs on State Personal Income, 2021Q2Nebraska
(Millions of dollars, seasonally adjusted at annual rates)Levels Change from preceding period
(L) Less than $50,000.
Note: BEA state per capita personal income statistics are calculated using unpublished Census Bureau midquarter population estimates. These midquarter estimates are based on the 2010 census. BEA will incorporate Census Bureau population estimates based on the 2020 census results when t
Source. U.S. Bureau of Economic AnalysisLast updated: September 23, 2021.
Line
3. Economic impact payments, initially established by the CARES Act, provide direct payments to individuals. For more information, see How are federal economic impact payments to support individuals during the COVID-19 pandemic recorded in the NIPAs?4. The Federal Emergency Management Agency (FEMA) was authorized to make payments from the Disaster Relief Fund to supplement wages lost as a result of the COVID-19 pandemic.5. The Paycheck Protection Program, initially established by the CARES Act, provides forgivable loans to help small businesses and nonprofit institutions make payroll and cover other expenses. It also provides funding to reimburse private lending institutions for the costs of administering these loans. For more information, see How does the Paycheck Protection Program impact the national income and product accounts (NIPAs)?6. The Department of Health and Human Services distributes money from the Provider Relief Fund to hospitals and health care providers on the front lines of the coronavirus response. This funding supports health care-related expenses or lost revenue attributable to COVID-19 and ensures uninsured Americans can get treatment for COVID-19. In the NIPAs, funds provided to nonprofit hospitals are recorded as social benefits.7. The Coronavirus Food Assistance Program, initially established by the CARES Act, provides direct support to farmers and ranchers where prices and market supply chains have been impacted by the COVID-19 pandemic.
CARES -Coronavirus Aid, Relief, and Economic SecurityNPISH -Nonprofit institutions serving households
1. A two percent reduction in reimbursements paid to Medicare service providers that went into effect in 2013 was initially suspended by the CARES Act. The resulting increased reimbursement rates went into effect beginning on May 1, 2020.2. Unemployment insurance benefits were expanded through several programs that were initially established through the CARES Act. For more information, see How will the expansion of unemployment benefits in response to the COVID-19 pandemic be recorded in the NIPAs?
2020

Q1 Q2 Q3 Q4 Q1 Q2 Q2 Q3 Q4 Q1 Q2Personal income (millions of dollars) 1 162,709.6 177,634.7 168,127.1 165,877.6 189,060.8 176,647.4 14,925.1 -9,507.6 -2,249.6 23,183.2 -12,413.4 Nonfarm personal income 2 162,492.0 177,392.3 167,841.4 165,563.5 188,856.8 176,413.3 14,900.3 -9,550.9 -2,277.9 23,293.4 -12,443.6 Farm income 3 217.6 242.4 285.7 314.1 203.9 234.1 24.8 43.4 28.4 -110.2 30.2Population (persons) 4 3,122,643 3,133,273 3,144,432 3,156,432 3,167,315 3,178,410 10,630 11,159 12,000 10,883 11,095Per capita personal income (dollars) 5 52,106 56,693 53,468 52,552 59,691 55,577 4,587 -3,225 -916 7,139 -4,114Derivation of personal income Earnings by place of work 6 109,168.5 94,239.5 104,553.3 106,629.7 106,871.5 111,463.6 -14,929.0 10,313.8 2,076.5 241.7 4,592.1 Less: Contributions for government social insurance 7 12,228.0 11,059.1 11,792.1 12,213.1 12,379.4 12,748.3 -1,168.9 733.1 420.9 166.4 368.9 Employee and self-employed contributions for government social insurance 8 6,520.7 5,909.5 6,284.4 6,508.5 6,576.1 6,756.0 -611.2 374.8 224.1 67.7 179.9 Employer contributions for government social insurance 9 5,707.3 5,149.5 5,507.8 5,704.6 5,803.3 5,992.3 -557.8 358.3 196.8 98.7 189.1 Plus: Adjustment for residence 10 99.6 199.1 174.6 179.8 210.1 193.4 99.6 -24.5 5.2 30.3 -16.7 Equals: Net earnings by place of residence 11 97,040.1 83,379.5 92,935.8 94,596.5 94,702.1 98,908.6 -13,660.5 9,556.2 1,660.8 105.6 4,206.5 Plus: Dividends, interest, and rent 12 38,214.2 37,307.9 36,551.9 37,252.0 37,086.5 37,576.9 -906.3 -756.0 700.1 -165.5 490.3 Plus: Personal current transfer receipts 13 27,455.4 56,947.3 38,639.5 34,029.1 57,272.1 40,161.9 29,491.9 -18,307.8 -4,610.5 23,243.0 -17,110.2 Social Security 14 9,329.1 9,405.0 9,464.3 9,555.9 9,740.3 9,775.9 75.9 59.3 91.6 184.4 35.6 Medicare 15 7,091.4 7,226.2 7,270.2 7,222.3 7,147.9 7,160.6 134.9 43.9 -47.8 -74.4 12.7 Of which: Increase in Medicare reimbursement rates1 16 84.6 126.8 125.8 124.8 124.0 84.6 42.1 -1.0 -1.0 -0.9 Medicaid 17 3,882.9 4,034.6 4,272.8 4,043.0 4,237.9 4,636.4 151.8 238.2 -229.8 194.8 398.5 State unemployment insurance 18 513.3 17,663.2 9,692.8 4,292.9 8,637.5 6,975.2 17,149.9 -7,970.4 -5,399.9 4,344.6 -1,662.3 Of which:2
Extended Unemployment Benefits 19 1.7 20.9 176.7 1,090.9 124.6 1.7 19.2 155.7 914.2 -966.3 Pandemic Emergency Unemployment Compensation 20 42.3 297.1 1,600.3 1,347.4 1,848.0 42.3 254.8 1,303.3 -253.0 500.7 Pandemic Unemployment Assistance 21 1,223.7 1,003.0 1,021.7 983.8 780.4 1,223.7 -220.7 18.7 -37.9 -203.4 Pandemic Unemployment Compensation Payments 22 11,308.7 5,051.6 251.1 4,358.7 3,490.8 11,308.7 -6,257.2 -4,800.5 4,107.7 -867.9 All other personal current transfer receipts 23 6,638.7 18,618.2 7,939.4 8,914.9 27,508.5 11,613.7 11,979.5 -10,678.8 975.4 18,593.6 -15,894.7 Of which: Economic impact payments3 24 10,493.8 151.7 49.2 19,196.8 2,880.0 10,493.8 -10,342.1 -102.5 19,147.6 -16,316.8 Lost wages supplemental payments4 25 0.0 0.0 1,596.1 40.9 15.4 0.0 0.0 1,596.1 -1,555.2 -25.5 Paycheck Protection Program loans to NPISH5 26 207.9 517.2 155.4 41.5 68.3 207.9 309.4 -361.8 -113.9 26.8 Provider Relief Fund to NPISH6 27 7.0 739.6 194.7 83.7 171.8 106.8 732.6 -544.9 -111.0 88.1 -65.0Components of earnings by place of work Wages and salaries 28 77,917.9 68,767.8 73,592.7 76,688.7 76,694.4 79,164.9 -9,150.1 4,824.9 3,096.1 5.7 2,470.4 Supplements to wages and salaries 29 18,128.8 16,600.6 17,489.1 17,946.6 17,939.4 18,295.0 -1,528.1 888.5 457.5 -7.2 355.6 Employer contributions for employee pension and insurance funds 30 12,421.5 11,451.1 11,981.3 12,242.1 12,136.1 12,302.7 -970.4 530.2 260.7 -105.9 166.5 Employer contributions for government social insurance 31 5,707.3 5,149.5 5,507.8 5,704.6 5,803.3 5,992.3 -557.8 358.3 196.8 98.7 189.1 Proprietors' income 32 13,121.8 8,871.0 13,471.5 11,994.4 12,237.6 14,003.7 -4,250.8 4,600.4 -1,477.1 243.2 1,766.1 Farm proprietors' income 33 133.1 159.0 202.4 229.7 117.7 146.7 25.9 43.4 27.3 -112.0 29.0 Of which: Coronavirus Food Assistance Program7 34 46.9 36.0 81.4 1.0 1.0 46.9 -10.9 45.3 -80.3 -0.1 Paycheck Protection Program loans to businesses5 35 27.2 38.7 11.6 4.3 12.9 27.2 11.5 -27.1 -7.3 8.6 Nonfarm proprietors' income 36 12,988.7 8,712.0 13,269.1 11,764.7 12,119.9 13,857.0 -4,276.7 4,557.1 -1,504.4 355.2 1,737.1 Of which: Paycheck Protection Program loans to businesses5 37 1,617.8 3,740.8 719.5 904.4 2,725.6 1,617.8 2,123.0 -3,021.3 184.9 1,821.2
Data on this table will be superseded by updated estimates. Regional estimates were controlled to the annual update to the National accounts released August 26, 2021.
2020 2021
Effects of Selected Federal Pandemic Response Programs on State Personal Income, 2021Q2Nevada
(Millions of dollars, seasonally adjusted at annual rates)Levels Change from preceding period
Note: BEA state per capita personal income statistics are calculated using unpublished Census Bureau midquarter population estimates. These midquarter estimates are based on the 2010 census. BEA will incorporate Census Bureau population estimates based on the 2020 census results wh
Source. U.S. Bureau of Economic AnalysisLast updated: September 23, 2021.
Line
3. Economic impact payments, initially established by the CARES Act, provide direct payments to individuals. For more information, see How are federal economic impact payments to support individuals during the COVID-19 pandemic recorded in the NIPAs?4. The Federal Emergency Management Agency (FEMA) was authorized to make payments from the Disaster Relief Fund to supplement wages lost as a result of the COVID-19 pandemic.5. The Paycheck Protection Program, initially established by the CARES Act, provides forgivable loans to help small businesses and nonprofit institutions make payroll and cover other expenses. It also provides funding to reimburse private lending institutions for the costs of administering these loans. For more information, see How does the Paycheck Protection Program impact the national income and product accounts (NIPAs)?6. The Department of Health and Human Services distributes money from the Provider Relief Fund to hospitals and health care providers on the front lines of the coronavirus response. This funding supports health care-related expenses or lost revenue attributable to COVID-19 and ensures uninsured Americans can get treatment for COVID-19. In the NIPAs, funds provided to nonprofit hospitals are recorded as social benefits.7. The Coronavirus Food Assistance Program, initially established by the CARES Act, provides direct support to farmers and ranchers where prices and market supply chains have been impacted by the COVID-19 pandemic.
CARES -Coronavirus Aid, Relief, and Economic SecurityNPISH -Nonprofit institutions serving households1. A two percent reduction in reimbursements paid to Medicare service providers that went into effect in 2013 was initially suspended by the CARES Act. The resulting increased reimbursement rates went into effect beginning on May 1, 2020.2. Unemployment insurance benefits were expanded through several programs that were initially established through the CARES Act. For more information, see How will the expansion of unemployment benefits in response to the COVID-19 pandemic be recorded in the NIPAs?
2020 2021

Q1 Q2 Q3 Q4 Q1 Q2 Q2 Q3 Q4 Q1 Q2Personal income (millions of dollars) 1 89,481.4 94,650.5 90,956.8 91,603.6 99,840.5 93,328.0 5,169.1 -3,693.6 646.7 8,236.9 -6,512.5 Nonfarm personal income 2 89,441.9 94,606.0 90,897.3 91,539.9 99,801.2 93,284.7 5,164.1 -3,708.8 642.6 8,261.4 -6,516.5 Farm income 3 39.5 44.4 59.6 63.7 39.3 43.2 5.0 15.1 4.1 -24.4 4.0Population (persons) 4 1,364,948 1,365,849 1,366,952 1,368,179 1,368,893 1,369,930 901 1,103 1,227 714 1,037Per capita personal income (dollars) 5 65,557 69,298 66,540 66,953 72,935 68,126 3,741 -2,758 413 5,982 -4,809Derivation of personal income Earnings by place of work 6 61,243.2 56,263.4 59,358.7 61,888.8 61,177.8 61,297.6 -4,979.8 3,095.3 2,530.2 -711.0 119.8 Less: Contributions for government social insurance 7 6,674.2 6,333.8 6,557.7 6,745.8 6,773.4 6,815.1 -340.4 223.9 188.1 27.6 41.7 Employee and self-employed contributions for government social insurance 8 3,817.6 3,605.9 3,723.2 3,831.4 3,815.9 3,831.4 -211.7 117.3 108.2 -15.5 15.5 Employer contributions for government social insurance 9 2,856.5 2,727.9 2,834.5 2,914.4 2,957.5 2,983.7 -128.6 106.6 79.9 43.1 26.3 Plus: Adjustment for residence 10 6,574.4 6,244.8 6,499.9 6,766.4 6,803.1 6,992.7 -329.6 255.1 266.6 36.7 189.6 Equals: Net earnings by place of residence 11 61,143.5 56,174.4 59,300.8 61,909.4 61,207.5 61,475.2 -4,969.1 3,126.4 2,608.7 -701.9 267.6 Plus: Dividends, interest, and rent 12 14,897.6 14,733.4 14,618.3 14,730.8 14,737.2 14,827.2 -164.2 -115.1 112.5 6.4 90.0 Plus: Personal current transfer receipts 13 13,440.3 23,742.7 17,037.7 14,963.3 23,895.7 17,025.6 10,302.4 -6,704.9 -2,074.4 8,932.4 -6,870.1 Social Security 14 5,637.1 5,682.2 5,717.2 5,769.8 5,874.2 5,894.3 45.1 35.0 52.6 104.3 20.1 Medicare 15 3,504.8 3,566.1 3,585.9 3,563.9 3,531.1 3,536.7 61.3 19.8 -22.0 -32.8 5.5 Of which: Increase in Medicare reimbursement rates1 16 41.8 62.6 62.1 61.6 61.2 41.8 20.8 -0.5 -0.5 -0.4 Medicaid 17 1,935.4 2,120.0 2,489.0 2,404.4 2,550.2 2,567.1 184.6 369.0 -84.5 145.8 16.9 State unemployment insurance 18 78.2 3,627.2 2,025.6 495.7 1,074.7 707.8 3,549.0 -1,601.6 -1,529.9 578.9 -366.8 Of which:2
Extended Unemployment Benefits 19 0.1 1.3 8.4 0.1 0.1 0.1 1.1 7.1 -8.3 0.0 Pandemic Emergency Unemployment Compensation 20 0.0 18.4 85.9 162.6 127.6 0.0 18.4 67.6 76.6 -35.0 Pandemic Unemployment Assistance 21 81.7 785.7 253.7 145.3 122.3 81.7 703.9 -532.0 -108.3 -23.1 Pandemic Unemployment Compensation Payments 22 2,788.7 832.1 9.3 680.7 390.4 2,788.7 -1,956.6 -822.8 671.4 -290.3 All other personal current transfer receipts 23 2,284.8 8,747.2 3,220.0 2,729.4 10,865.6 4,319.7 6,462.4 -5,527.2 -490.6 8,136.2 -6,545.9 Of which: Economic impact payments3 24 4,735.6 68.2 22.1 7,906.4 1,186.1 4,735.6 -4,667.5 -46.0 7,884.3 -6,720.2 Lost wages supplemental payments4 25 0.0 357.2 10.7 2.2 0.8 0.0 357.2 -346.5 -8.5 -1.4 Paycheck Protection Program loans to NPISH5 26 760.0 170.0 51.1 62.3 185.3 760.0 -590.0 -118.9 11.2 123.0 Provider Relief Fund to NPISH6 27 7.8 823.2 225.4 259.2 220.5 137.0 815.4 -597.8 33.9 -38.8 -83.5Components of earnings by place of work Wages and salaries 28 42,347.0 39,517.7 41,473.4 43,159.0 42,546.9 42,924.0 -2,829.3 1,955.7 1,685.6 -612.1 377.1 Supplements to wages and salaries 29 9,152.5 8,670.6 8,999.2 9,220.3 9,231.1 9,262.3 -481.9 328.6 221.1 10.8 31.2 Employer contributions for employee pension and insurance funds 30 6,296.0 5,942.7 6,164.7 6,305.9 6,273.6 6,278.5 -353.3 222.0 141.2 -32.3 4.9 Employer contributions for government social insurance 31 2,856.5 2,727.9 2,834.5 2,914.4 2,957.5 2,983.7 -128.6 106.6 79.9 43.1 26.3 Proprietors' income 32 9,743.7 8,075.2 8,886.1 9,509.6 9,399.9 9,111.4 -1,668.6 810.9 623.5 -109.7 -288.5 Farm proprietors' income 33 10.5 15.6 30.6 34.3 9.2 12.8 5.1 15.0 3.7 -25.1 3.6 Of which: Coronavirus Food Assistance Program7 34 10.3 5.9 20.1 3.1 1.3 10.3 -4.4 14.1 -17.0 -1.8 Paycheck Protection Program loans to businesses5 35 12.1 17.2 5.2 1.1 2.9 12.1 5.1 -12.0 -4.1 1.8 Nonfarm proprietors' income 36 9,733.2 8,059.6 8,855.5 9,475.3 9,390.7 9,098.6 -1,673.7 796.0 619.7 -84.6 -292.1 Of which: Paycheck Protection Program loans to businesses5 37 1,536.0 1,058.9 690.9 429.6 308.7 1,536.0 -477.1 -367.9 -261.3 -120.9
Data on this table will be superseded by updated estimates. Regional estimates were controlled to the annual update to the National accounts released August 26, 2021.
2020 2021
Effects of Selected Federal Pandemic Response Programs on State Personal Income, 2021Q2New Hampshire
(Millions of dollars, seasonally adjusted at annual rates)Levels Change from preceding period
Note: BEA state per capita personal income statistics are calculated using unpublished Census Bureau midquarter population estimates. These midquarter estimates are based on the 2010 census. BEA will incorporate Census Bureau population estimates based on the 2020 census results wh
Source. U.S. Bureau of Economic AnalysisLast updated: September 23, 2021.
Line
3. Economic impact payments, initially established by the CARES Act, provide direct payments to individuals. For more information, see How are federal economic impact payments to support individuals during the COVID-19 pandemic recorded in the NIPAs?4. The Federal Emergency Management Agency (FEMA) was authorized to make payments from the Disaster Relief Fund to supplement wages lost as a result of the COVID-19 pandemic.5. The Paycheck Protection Program, initially established by the CARES Act, provides forgivable loans to help small businesses and nonprofit institutions make payroll and cover other expenses. It also provides funding to reimburse private lending institutions for the costs of administering these loans. For more information, see How does the Paycheck Protection Program impact the national income and product accounts (NIPAs)?6. The Department of Health and Human Services distributes money from the Provider Relief Fund to hospitals and health care providers on the front lines of the coronavirus response. This funding supports health care-related expenses or lost revenue attributable to COVID-19 and ensures uninsured Americans can get treatment for COVID-19. In the NIPAs, funds provided to nonprofit hospitals are recorded as social benefits.7. The Coronavirus Food Assistance Program, initially established by the CARES Act, provides direct support to farmers and ranchers where prices and market supply chains have been impacted by the COVID-19 pandemic.
CARES -Coronavirus Aid, Relief, and Economic SecurityNPISH -Nonprofit institutions serving households1. A two percent reduction in reimbursements paid to Medicare service providers that went into effect in 2013 was initially suspended by the CARES Act. The resulting increased reimbursement rates went into effect beginning on May 1, 2020.2. Unemployment insurance benefits were expanded through several programs that were initially established through the CARES Act. For more information, see How will the expansion of unemployment benefits in response to the COVID-19 pandemic be recorded in the NIPAs?
2020 2021

Q1 Q2 Q3 Q4 Q1 Q2 Q2 Q3 Q4 Q1 Q2Personal income (millions of dollars) 1 626,557.9 670,177.6 657,270.4 655,989.7 716,082.0 684,373.7 43,619.6 -12,907.2 -1,280.7 60,092.3 -31,708.4 Nonfarm personal income 2 626,137.6 669,640.7 656,705.7 655,311.0 715,511.5 683,697.4 43,503.2 -12,935.0 -1,394.7 60,200.5 -31,814.2 Farm income 3 420.3 536.8 564.7 678.7 570.5 676.3 116.5 27.9 114.0 -108.2 105.8Population (persons) 4 8,892,331 8,886,338 8,880,858 8,876,834 8,870,833 8,865,730 -5,993 -5,480 -4,024 -6,001 -5,103Per capita personal income (dollars) 5 70,460 75,417 74,010 73,899 80,723 77,193 4,957 -1,407 -111 6,824 -3,530Derivation of personal income Earnings by place of work 6 417,811.6 392,701.3 416,813.2 426,932.7 431,915.5 440,410.4 -25,110.3 24,111.9 10,119.5 4,982.8 8,494.9 Less: Contributions for government social insurance 7 45,869.5 43,942.9 45,396.2 46,703.3 47,767.5 48,695.8 -1,926.6 1,453.3 1,307.1 1,064.2 928.3 Employee and self-employed contributions for government social insurance 8 25,193.3 24,075.5 24,817.4 25,563.7 26,100.4 26,583.0 -1,117.8 741.9 746.3 536.7 482.6 Employer contributions for government social insurance 9 20,676.2 19,867.4 20,578.8 21,139.6 21,667.1 22,112.8 -808.8 711.4 560.8 527.5 445.7 Plus: Adjustment for residence 10 58,048.3 55,023.8 57,280.8 59,523.5 60,638.8 61,044.3 -3,024.5 2,257.0 2,242.7 1,115.3 405.5 Equals: Net earnings by place of residence 11 429,990.4 403,782.2 428,697.8 439,752.9 444,786.8 452,758.9 -26,208.2 24,915.5 11,055.1 5,033.9 7,972.2 Plus: Dividends, interest, and rent 12 107,446.1 105,935.8 104,753.4 105,842.1 105,710.2 106,519.2 -1,510.3 -1,182.4 1,088.7 -132.0 809.0 Plus: Personal current transfer receipts 13 89,121.4 160,459.5 123,819.2 110,394.7 165,585.1 125,095.5 71,338.2 -36,640.3 -13,424.5 55,190.4 -40,489.5 Social Security 14 30,832.8 30,998.1 31,128.2 31,336.3 31,761.7 31,843.8 165.3 130.2 208.0 425.4 82.1 Medicare 15 24,174.8 24,509.6 24,608.0 24,468.3 24,289.4 24,318.9 334.8 98.4 -139.7 -179.0 29.5 Of which: Increase in Medicare reimbursement rates1 16 287.2 430.1 426.9 423.6 420.7 287.2 142.8 -3.2 -3.2 -3.0 Medicaid 17 15,770.2 16,545.8 17,307.2 16,895.5 17,665.9 18,736.3 775.7 761.4 -411.7 770.5 1,070.4 State unemployment insurance 18 1,658.9 37,113.8 26,920.2 12,933.8 23,246.0 22,025.5 35,454.9 -10,193.6 -13,986.4 10,312.2 -1,220.5 Of which:2
Extended Unemployment Benefits 19 0.0 290.5 864.7 1,682.4 324.1 0.0 290.5 574.3 817.7 -1,358.3 Pandemic Emergency Unemployment Compensation 20 537.3 1,148.4 3,563.0 3,887.0 4,756.1 537.3 611.1 2,414.6 324.0 869.1 Pandemic Unemployment Assistance 21 2,222.6 5,192.5 4,953.3 5,127.2 4,929.5 2,222.6 2,969.9 -239.2 173.9 -197.6 Pandemic Unemployment Compensation Payments 22 22,621.4 13,167.3 391.3 10,266.9 10,067.5 22,621.4 -9,454.1 -12,776.0 9,875.6 -199.4 All other personal current transfer receipts 23 16,684.8 51,292.2 23,855.5 24,760.7 68,622.1 28,171.0 34,607.5 -27,436.8 905.3 43,861.4 -40,451.1 Of which: Economic impact payments3 24 27,218.1 393.2 127.5 47,920.1 7,189.1 27,218.1 -26,824.9 -265.7 47,792.6 -40,731.0 Lost wages supplemental payments4 25 0.0 0.0 5,382.9 81.3 1.6 0.0 0.0 5,382.9 -5,301.6 -79.7 Paycheck Protection Program loans to NPISH5 26 885.6 3,391.2 1,019.0 256.9 508.1 885.6 2,505.5 -2,372.1 -762.1 251.2 Provider Relief Fund to NPISH6 27 53.4 5,643.4 2,463.1 586.2 1,465.8 911.0 5,590.0 -3,180.3 -1,876.9 879.6 -554.8Components of earnings by place of work Wages and salaries 28 290,894.3 273,729.5 286,185.6 297,791.0 300,927.2 307,954.5 -17,164.9 12,456.1 11,605.4 3,136.2 7,027.2 Supplements to wages and salaries 29 64,386.2 61,162.0 63,388.9 64,956.0 66,135.6 66,987.5 -3,224.2 2,226.9 1,567.1 1,179.7 851.8 Employer contributions for employee pension and insurance funds 30 43,710.0 41,294.6 42,810.1 43,816.4 44,468.5 44,874.7 -2,415.4 1,515.5 1,006.3 652.2 406.2 Employer contributions for government social insurance 31 20,676.2 19,867.4 20,578.8 21,139.6 21,667.1 22,112.8 -808.8 711.4 560.8 527.5 445.7 Proprietors' income 32 62,531.0 57,809.8 67,238.7 64,185.7 64,852.7 65,468.5 -4,721.2 9,428.9 -3,052.9 666.9 615.8 Farm proprietors' income 33 233.6 350.2 376.7 487.7 375.4 478.7 116.6 26.5 111.0 -112.3 103.3 Of which: Coronavirus Food Assistance Program7 34 5.7 13.6 161.1 13.2 18.7 5.7 7.8 147.5 -147.9 5.5 Paycheck Protection Program loans to businesses5 35 63.9 90.8 27.3 15.5 38.5 63.9 26.9 -63.5 -11.8 23.0 Nonfarm proprietors' income 36 62,297.4 57,459.5 66,861.9 63,698.0 64,477.2 64,989.7 -4,837.8 9,402.4 -3,163.9 779.2 512.5 Of which: Paycheck Protection Program loans to businesses5 37 9,470.5 11,549.7 3,310.0 2,628.6 4,129.0 9,470.5 2,079.2 -8,239.8 -681.4 1,500.5
Data on this table will be superseded by updated estimates. Regional estimates were controlled to the annual update to the National accounts released August 26, 2021.
2020 2021
Effects of Selected Federal Pandemic Response Programs on State Personal Income, 2021Q2New Jersey
(Millions of dollars, seasonally adjusted at annual rates)Levels Change from preceding period
Note: BEA state per capita personal income statistics are calculated using unpublished Census Bureau midquarter population estimates. These midquarter estimates are based on the 2010 census. BEA will incorporate Census Bureau population estimates based on the 2020 census results wh
Source. U.S. Bureau of Economic AnalysisLast updated: September 23, 2021.
Line
3. Economic impact payments, initially established by the CARES Act, provide direct payments to individuals. For more information, see How are federal economic impact payments to support individuals during the COVID-19 pandemic recorded in the NIPAs?4. The Federal Emergency Management Agency (FEMA) was authorized to make payments from the Disaster Relief Fund to supplement wages lost as a result of the COVID-19 pandemic.5. The Paycheck Protection Program, initially established by the CARES Act, provides forgivable loans to help small businesses and nonprofit institutions make payroll and cover other expenses. It also provides funding to reimburse private lending institutions for the costs of administering these loans. For more information, see How does the Paycheck Protection Program impact the national income and product accounts (NIPAs)?6. The Department of Health and Human Services distributes money from the Provider Relief Fund to hospitals and health care providers on the front lines of the coronavirus response. This funding supports health care-related expenses or lost revenue attributable to COVID-19 and ensures uninsured Americans can get treatment for COVID-19. In the NIPAs, funds provided to nonprofit hospitals are recorded as social benefits.7. The Coronavirus Food Assistance Program, initially established by the CARES Act, provides direct support to farmers and ranchers where prices and market supply chains have been impacted by the COVID-19 pandemic.
CARES -Coronavirus Aid, Relief, and Economic SecurityNPISH -Nonprofit institutions serving households1. A two percent reduction in reimbursements paid to Medicare service providers that went into effect in 2013 was initially suspended by the CARES Act. The resulting increased reimbursement rates went into effect beginning on May 1, 2020.2. Unemployment insurance benefits were expanded through several programs that were initially established through the CARES Act. For more information, see How will the expansion of unemployment benefits in response to the COVID-19 pandemic be recorded in the NIPAs?
2020 2021

Q1 Q2 Q3 Q4 Q1 Q2 Q2 Q3 Q4 Q1 Q2Personal income (millions of dollars) 1 92,890.8 102,502.1 98,623.3 96,397.7 111,223.8 101,664.9 9,611.3 -3,878.8 -2,225.6 14,826.1 -9,558.9 Nonfarm personal income 2 91,728.8 101,566.5 97,244.4 94,938.6 110,279.3 100,579.3 9,837.7 -4,322.1 -2,305.8 15,340.7 -9,700.1 Farm income 3 1,161.9 935.6 1,378.8 1,459.1 944.5 1,085.6 -226.4 443.3 80.3 -514.6 141.1Population (persons) 4 2,105,359 2,106,155 2,107,303 2,109,032 2,109,925 2,110,930 796 1,148 1,729 893 1,005Per capita personal income (dollars) 5 44,121 48,668 46,801 45,707 52,715 48,161 4,547 -1,867 -1,094 7,008 -4,554Derivation of personal income Earnings by place of work 6 60,641.8 56,212.0 59,882.3 61,421.5 60,710.1 61,725.0 -4,429.8 3,670.3 1,539.2 -711.4 1,014.8 Less: Contributions for government social insurance 7 7,471.2 7,137.3 7,393.2 7,570.1 7,637.2 7,734.3 -333.9 255.9 176.8 67.2 97.1 Employee and self-employed contributions for government social insurance 8 4,159.2 3,957.0 4,099.7 4,203.6 4,235.1 4,287.9 -202.2 142.7 103.9 31.5 52.8 Employer contributions for government social insurance 9 3,312.1 3,180.3 3,293.5 3,366.4 3,402.1 3,446.4 -131.8 113.2 72.9 35.7 44.3 Plus: Adjustment for residence 10 125.9 116.8 124.8 137.5 150.7 158.5 -9.1 8.0 12.7 13.2 7.8 Equals: Net earnings by place of residence 11 53,296.6 49,191.5 52,613.9 53,989.0 53,223.6 54,149.2 -4,105.1 3,422.4 1,375.1 -765.4 925.6 Plus: Dividends, interest, and rent 12 16,764.7 16,507.7 16,329.7 16,439.0 16,448.4 16,553.4 -257.0 -178.0 109.3 9.4 105.0 Plus: Personal current transfer receipts 13 22,829.5 36,802.9 29,679.7 25,969.8 41,551.8 30,962.2 13,973.4 -7,123.2 -3,710.0 15,582.0 -10,589.5 Social Security 14 7,105.7 7,156.9 7,197.1 7,261.3 7,392.2 7,417.5 51.2 40.3 64.1 131.0 25.3 Medicare 15 4,604.5 4,679.7 4,702.8 4,673.4 4,631.7 4,638.7 75.2 23.1 -29.4 -41.7 7.0 Of which: Increase in Medicare reimbursement rates1 16 54.8 82.1 81.5 80.9 80.3 54.8 27.3 -0.6 -0.6 -0.6 Medicaid 17 5,657.2 6,305.8 6,940.0 6,890.9 6,994.8 7,496.2 648.6 634.3 -49.2 103.9 501.5 State unemployment insurance 18 274.6 4,885.6 3,463.5 1,379.0 3,327.6 2,967.5 4,610.9 -1,422.1 -2,084.5 1,948.6 -360.1 Of which:2
Extended Unemployment Benefits 19 0.4 14.3 35.0 318.2 6.0 0.4 13.8 20.7 283.3 -312.3 Pandemic Emergency Unemployment Compensation 20 25.4 88.7 454.0 477.5 944.0 25.4 63.3 365.3 23.5 466.5 Pandemic Unemployment Assistance 21 308.3 458.4 305.3 335.9 341.9 308.3 150.0 -153.1 30.6 6.1 Pandemic Unemployment Compensation Payments 22 3,485.1 1,734.0 9.8 1,743.4 1,288.9 3,485.1 -1,751.2 -1,724.1 1,733.6 -454.4 All other personal current transfer receipts 23 5,187.4 13,775.0 7,376.2 5,765.2 19,205.5 8,442.3 8,587.5 -6,398.7 -1,611.0 13,440.2 -10,763.2 Of which: Economic impact payments3 24 7,148.5 103.3 33.5 12,917.0 1,937.9 7,148.5 -7,045.2 -69.8 12,883.5 -10,979.2 Lost wages supplemental payments4 25 0.0 772.0 19.8 8.1 2.9 0.0 772.0 -752.2 -11.7 -5.2 Paycheck Protection Program loans to NPISH5 26 371.7 484.7 145.7 54.2 125.3 371.7 113.0 -339.1 -91.5 71.1 Provider Relief Fund to NPISH6 27 7.1 747.1 506.5 53.5 220.2 136.9 740.0 -240.5 -453.1 166.8 -83.4Components of earnings by place of work Wages and salaries 28 43,943.8 40,844.3 42,685.3 44,090.3 43,966.5 44,726.6 -3,099.4 1,841.0 1,405.0 -123.9 760.1 Supplements to wages and salaries 29 10,629.6 10,159.4 10,501.6 10,686.5 10,702.5 10,792.3 -470.2 342.2 184.9 16.1 89.8 Employer contributions for employee pension and insurance funds 30 7,317.5 6,979.1 7,208.1 7,320.1 7,300.4 7,345.9 -338.4 229.0 112.0 -19.7 45.5 Employer contributions for government social insurance 31 3,312.1 3,180.3 3,293.5 3,366.4 3,402.1 3,446.4 -131.8 113.2 72.9 35.7 44.3 Proprietors' income 32 6,068.5 5,208.3 6,695.3 6,644.7 6,041.1 6,206.1 -860.3 1,487.1 -50.6 -603.6 164.9 Farm proprietors' income 33 885.7 662.8 1,106.2 1,183.0 662.4 799.6 -222.9 443.4 76.8 -520.6 137.2 Of which: Coronavirus Food Assistance Program7 34 166.8 206.7 327.2 4.6 9.8 166.8 39.9 120.5 -322.6 5.2 Paycheck Protection Program loans to businesses5 35 52.3 74.3 22.3 17.0 41.2 52.3 22.0 -52.0 -5.3 24.2 Nonfarm proprietors' income 36 5,182.8 4,545.5 5,589.2 5,461.7 5,378.7 5,406.4 -637.3 1,043.7 -127.4 -83.0 27.7 Of which: Paycheck Protection Program loans to businesses5 37 852.2 1,123.5 481.5 376.3 470.3 852.2 271.3 -642.0 -105.2 94.1
Data on this table will be superseded by updated estimates. Regional estimates were controlled to the annual update to the National accounts released August 26, 2021.
2020 2021
Effects of Selected Federal Pandemic Response Programs on State Personal Income, 2021Q2New Mexico
(Millions of dollars, seasonally adjusted at annual rates)Levels Change from preceding period
Note: BEA state per capita personal income statistics are calculated using unpublished Census Bureau midquarter population estimates. These midquarter estimates are based on the 2010 census. BEA will incorporate Census Bureau population estimates based on the 2020 census results wh
Source. U.S. Bureau of Economic AnalysisLast updated: September 23, 2021.
Line
3. Economic impact payments, initially established by the CARES Act, provide direct payments to individuals. For more information, see How are federal economic impact payments to support individuals during the COVID-19 pandemic recorded in the NIPAs?4. The Federal Emergency Management Agency (FEMA) was authorized to make payments from the Disaster Relief Fund to supplement wages lost as a result of the COVID-19 pandemic.5. The Paycheck Protection Program, initially established by the CARES Act, provides forgivable loans to help small businesses and nonprofit institutions make payroll and cover other expenses. It also provides funding to reimburse private lending institutions for the costs of administering these loans. For more information, see How does the Paycheck Protection Program impact the national income and product accounts (NIPAs)?6. The Department of Health and Human Services distributes money from the Provider Relief Fund to hospitals and health care providers on the front lines of the coronavirus response. This funding supports health care-related expenses or lost revenue attributable to COVID-19 and ensures uninsured Americans can get treatment for COVID-19. In the NIPAs, funds provided to nonprofit hospitals are recorded as social benefits.7. The Coronavirus Food Assistance Program, initially established by the CARES Act, provides direct support to farmers and ranchers where prices and market supply chains have been impacted by the COVID-19 pandemic.
CARES -Coronavirus Aid, Relief, and Economic SecurityNPISH -Nonprofit institutions serving households1. A two percent reduction in reimbursements paid to Medicare service providers that went into effect in 2013 was initially suspended by the CARES Act. The resulting increased reimbursement rates went into effect beginning on May 1, 2020.2. Unemployment insurance benefits were expanded through several programs that were initially established through the CARES Act. For more information, see How will the expansion of unemployment benefits in response to the COVID-19 pandemic be recorded in the NIPAs?
2020 2021

Q1 Q2 Q3 Q4 Q1 Q2 Q2 Q3 Q4 Q1 Q2Personal income (millions of dollars) 1 1,364,819.2 1,501,593.6 1,472,400.3 1,421,384.9 1,585,461.0 1,506,160.0 136,774.3 -29,193.3 -51,015.4 164,076.2 -79,301.0 Nonfarm personal income 2 1,363,019.8 1,499,870.1 1,470,050.7 1,418,724.1 1,583,880.0 1,504,247.0 136,850.3 -29,819.4 -51,326.6 165,155.9 -79,633.0 Farm income 3 1,799.5 1,723.5 2,349.6 2,660.8 1,581.0 1,913.0 -76.0 626.1 311.2 -1,079.7 332.0Population (persons) 4 19,398,857 19,358,910 19,320,970 19,287,180 19,247,975 19,210,236 -39,947 -37,940 -33,790 -39,205 -37,739Per capita personal income (dollars) 5 70,356 77,566 76,207 73,696 82,370 78,404 7,210 -1,359 -2,511 8,674 -3,966Derivation of personal income Earnings by place of work 6 1,038,260.8 981,082.8 1,035,416.8 1,062,373.0 1,082,280.1 1,098,440.4 -57,178.1 54,334.0 26,956.2 19,907.1 16,160.3 Less: Contributions for government social insurance 7 106,897.5 102,793.7 106,007.5 109,103.9 112,262.0 113,617.1 -4,103.8 3,213.8 3,096.3 3,158.1 1,355.1 Employee and self-employed contributions for government social insurance 8 56,439.2 54,236.0 55,757.6 57,518.7 59,296.8 59,781.9 -2,203.2 1,521.7 1,761.0 1,778.1 485.1 Employer contributions for government social insurance 9 50,458.3 48,557.7 50,249.9 51,585.2 52,965.2 53,835.2 -1,900.5 1,692.2 1,335.3 1,380.0 870.0 Plus: Adjustment for residence 10 -81,558.3 -77,164.1 -80,444.4 -83,700.2 -85,739.2 -86,535.7 4,394.3 -3,280.4 -3,255.8 -2,039.0 -796.5 Equals: Net earnings by place of residence 11 849,805.1 801,125.0 848,964.8 869,569.0 884,279.0 898,287.7 -48,680.1 47,839.8 20,604.2 14,710.0 14,008.7 Plus: Dividends, interest, and rent 12 280,014.2 274,443.8 270,197.3 274,541.3 274,980.6 278,335.4 -5,570.4 -4,246.5 4,344.0 439.3 3,354.8 Plus: Personal current transfer receipts 13 234,999.9 426,024.7 353,238.2 277,274.6 426,201.4 329,536.9 191,024.8 -72,786.6 -75,963.6 148,926.8 -96,664.5 Social Security 14 63,798.3 64,099.4 64,340.5 64,751.7 65,616.9 65,783.9 301.1 241.1 411.2 865.2 167.0 Medicare 15 53,051.1 53,767.4 53,970.0 53,655.3 53,260.1 53,325.3 716.4 202.6 -314.8 -395.2 65.3 Of which: Increase in Medicare reimbursement rates1 16 630.1 943.4 936.4 929.3 922.7 630.1 313.3 -7.1 -7.1 -6.5 Medicaid 17 71,341.4 71,562.8 69,939.2 66,936.6 64,318.1 67,982.2 221.4 -1,623.6 -3,002.7 -2,618.5 3,664.1 State unemployment insurance 18 3,038.4 98,969.1 83,535.8 36,726.8 76,302.9 66,652.6 95,930.6 -15,433.3 -46,809.0 39,576.2 -9,650.3 Of which:2
Extended Unemployment Benefits 19 15.8 362.2 1,424.9 4,030.7 2,287.4 15.8 346.4 1,062.7 2,605.8 -1,743.3 Pandemic Emergency Unemployment Compensation 20 499.1 1,187.8 10,659.6 10,548.2 11,288.8 499.1 688.7 9,471.7 -111.3 740.5 Pandemic Unemployment Assistance 21 9,073.3 16,539.9 14,306.4 16,657.0 13,894.1 9,073.3 7,466.6 -2,233.5 2,350.6 -2,763.0 Pandemic Unemployment Compensation Payments 22 65,187.5 45,958.1 2,307.1 38,670.9 33,930.5 65,187.5 -19,229.4 -43,651.1 36,363.8 -4,740.4 All other personal current transfer receipts 23 43,770.7 137,626.0 81,452.6 55,204.3 166,703.4 75,792.9 93,855.3 -56,173.4 -26,248.3 111,499.1 -90,910.5 Of which: Economic impact payments3 24 62,869.1 908.2 294.6 111,042.5 16,659.0 62,869.1 -61,960.9 -613.6 110,748.0 -94,383.6 Lost wages supplemental payments4 25 0.0 15,274.9 1,112.9 72.6 16.0 0.0 15,274.9 -14,162.0 -1,040.3 -56.6 Paycheck Protection Program loans to NPISH5 26 3,757.4 13,223.9 3,973.7 1,177.0 5,721.0 3,757.4 9,466.5 -9,250.1 -2,796.8 4,544.0 Provider Relief Fund to NPISH6 27 241.4 25,496.3 6,336.3 3,999.2 6,045.7 3,757.4 25,254.8 -19,160.0 -2,337.0 2,046.5 -2,288.3Components of earnings by place of work Wages and salaries 28 741,043.1 700,726.9 730,361.4 760,943.4 776,418.4 786,520.9 -40,316.2 29,634.5 30,582.0 15,475.0 10,102.4 Supplements to wages and salaries 29 170,288.0 163,045.6 168,764.4 172,546.3 176,155.9 177,197.1 -7,242.4 5,718.8 3,781.9 3,609.6 1,041.1 Employer contributions for employee pension and insurance funds 30 119,829.7 114,487.8 118,514.5 120,961.2 123,190.8 123,361.9 -5,341.9 4,026.7 2,446.7 2,229.6 171.1 Employer contributions for government social insurance 31 50,458.3 48,557.7 50,249.9 51,585.2 52,965.2 53,835.2 -1,900.5 1,692.2 1,335.3 1,380.0 870.0 Proprietors' income 32 126,929.7 117,310.3 136,290.9 128,883.3 129,705.7 134,722.5 -9,619.4 18,980.6 -7,407.7 822.5 5,016.7 Farm proprietors' income 33 1,317.0 1,241.8 1,864.5 2,168.1 1,077.7 1,403.2 -75.2 622.8 303.6 -1,090.4 325.5 Of which: Coronavirus Food Assistance Program7 34 464.5 295.1 798.0 8.5 21.5 464.5 -169.4 502.9 -789.5 13.0 Paycheck Protection Program loans to businesses5 35 202.4 287.5 86.4 41.4 106.7 202.4 85.1 -201.1 -45.0 65.3 Nonfarm proprietors' income 36 125,612.8 116,068.5 134,426.4 126,715.2 128,628.0 133,319.3 -9,544.2 18,357.9 -7,711.2 1,912.8 4,691.3 Of which: Paycheck Protection Program loans to businesses5 37 16,675.5 23,542.1 6,179.2 5,629.9 10,933.9 16,675.5 6,866.6 -17,362.9 -549.3 5,304.0
Data on this table will be superseded by updated estimates. Regional estimates were controlled to the annual update to the National accounts released August 26, 2021.
2020 2021
Effects of Selected Federal Pandemic Response Programs on State Personal Income, 2021Q2New York
(Millions of dollars, seasonally adjusted at annual rates)Levels Change from preceding period
Note: BEA state per capita personal income statistics are calculated using unpublished Census Bureau midquarter population estimates. These midquarter estimates are based on the 2010 census. BEA will incorporate Census Bureau population estimates based on the 2020 census results wh
Source. U.S. Bureau of Economic AnalysisLast updated: September 23, 2021.
Line
3. Economic impact payments, initially established by the CARES Act, provide direct payments to individuals. For more information, see How are federal economic impact payments to support individuals during the COVID-19 pandemic recorded in the NIPAs?4. The Federal Emergency Management Agency (FEMA) was authorized to make payments from the Disaster Relief Fund to supplement wages lost as a result of the COVID-19 pandemic.5. The Paycheck Protection Program, initially established by the CARES Act, provides forgivable loans to help small businesses and nonprofit institutions make payroll and cover other expenses. It also provides funding to reimburse private lending institutions for the costs of administering these loans. For more information, see How does the Paycheck Protection Program impact the national income and product accounts (NIPAs)?6. The Department of Health and Human Services distributes money from the Provider Relief Fund to hospitals and health care providers on the front lines of the coronavirus response. This funding supports health care-related expenses or lost revenue attributable to COVID-19 and ensures uninsured Americans can get treatment for COVID-19. In the NIPAs, funds provided to nonprofit hospitals are recorded as social benefits.7. The Coronavirus Food Assistance Program, initially established by the CARES Act, provides direct support to farmers and ranchers where prices and market supply chains have been impacted by the COVID-19 pandemic.
CARES -Coronavirus Aid, Relief, and Economic SecurityNPISH -Nonprofit institutions serving households1. A two percent reduction in reimbursements paid to Medicare service providers that went into effect in 2013 was initially suspended by the CARES Act. The resulting increased reimbursement rates went into effect beginning on May 1, 2020.2. Unemployment insurance benefits were expanded through several programs that were initially established through the CARES Act. For more information, see How will the expansion of unemployment benefits in response to the COVID-19 pandemic be recorded in the NIPAs?
2020 2021

Q1 Q2 Q3 Q4 Q1 Q2 Q2 Q3 Q4 Q1 Q2Personal income (millions of dollars) 1 516,713.6 555,147.2 531,153.6 530,063.0 606,775.5 561,597.7 38,433.6 -23,993.6 -1,090.6 76,712.5 -45,177.8 Nonfarm personal income 2 513,705.3 554,150.2 529,235.7 527,049.3 604,384.7 558,786.4 40,444.9 -24,914.5 -2,186.4 77,335.4 -45,598.3 Farm income 3 3,008.2 997.0 1,917.9 3,013.6 2,390.8 2,811.3 -2,011.3 920.9 1,095.8 -622.9 420.5Population (persons) 4 10,570,086 10,590,996 10,614,498 10,640,407 10,661,149 10,683,292 20,910 23,502 25,909 20,742 22,143Per capita personal income (dollars) 5 48,885 52,417 50,040 49,816 56,915 52,568 3,532 -2,377 -224 7,099 -4,347Derivation of personal income Earnings by place of work 6 366,883.2 340,852.5 362,789.2 373,696.1 379,941.8 387,880.5 -26,030.7 21,936.8 10,906.8 6,245.7 7,938.7 Less: Contributions for government social insurance 7 42,556.1 40,786.6 42,261.6 43,481.0 44,958.6 45,642.3 -1,769.5 1,474.9 1,219.5 1,477.6 683.7 Employee and self-employed contributions for government social insurance 8 23,606.9 22,536.5 23,347.6 24,057.2 24,839.3 25,210.5 -1,070.3 811.0 709.6 782.1 371.2 Employer contributions for government social insurance 9 18,949.2 18,250.1 18,914.0 19,423.8 20,119.3 20,431.9 -699.2 663.9 509.9 695.5 312.6 Plus: Adjustment for residence 10 -2,132.5 -2,009.3 -2,096.6 -2,183.7 -2,340.0 -2,385.1 123.2 -87.3 -87.1 -156.3 -45.2 Equals: Net earnings by place of residence 11 322,194.5 298,056.6 318,431.1 328,031.3 332,643.2 339,853.1 -24,138.0 20,374.5 9,600.3 4,611.9 7,209.8 Plus: Dividends, interest, and rent 12 93,579.2 91,969.4 90,629.7 91,991.9 91,744.3 92,689.2 -1,609.8 -1,339.7 1,362.3 -247.6 944.9 Plus: Personal current transfer receipts 13 100,939.8 165,121.2 122,092.9 110,039.7 182,388.0 129,055.5 64,181.4 -43,028.4 -12,053.2 72,348.3 -53,332.5 Social Security 14 36,448.7 36,715.4 36,923.4 37,241.8 37,879.8 38,002.9 266.7 207.9 318.4 638.0 123.1 Medicare 15 25,226.4 25,655.6 25,795.9 25,644.9 25,421.7 25,459.2 429.2 140.3 -151.0 -223.2 37.5 Of which: Increase in Medicare reimbursement rates1 16 300.6 450.2 446.8 443.4 440.3 300.6 149.5 -3.4 -3.4 -3.1 Medicaid 17 13,736.6 15,133.0 15,617.3 15,097.5 17,035.7 17,573.6 1,396.4 484.3 -519.8 1,938.2 537.9 State unemployment insurance 18 441.2 20,578.9 11,902.9 4,396.3 8,746.6 7,045.7 20,137.7 -8,676.0 -7,506.6 4,350.3 -1,701.0 Of which:2
Extended Unemployment Benefits 19 0.0 180.8 729.0 268.5 2.3 0.0 180.8 548.2 -460.5 -266.2 Pandemic Emergency Unemployment Compensation 20 193.7 1,989.2 1,014.5 1,913.9 1,830.8 193.7 1,795.5 -974.7 899.4 -83.1 Pandemic Unemployment Assistance 21 1,099.1 1,229.2 1,569.6 1,169.1 718.8 1,099.1 130.0 340.4 -400.5 -450.3 Pandemic Unemployment Compensation Payments 22 16,294.1 6,485.6 96.1 4,710.6 3,963.2 16,294.1 -9,808.5 -6,389.6 4,614.5 -747.4 All other personal current transfer receipts 23 25,086.9 67,038.3 31,853.5 27,659.2 93,304.2 40,974.1 41,951.4 -35,184.9 -4,194.2 65,645.0 -52,330.2 Of which: Economic impact payments3 24 34,876.8 503.2 163.2 62,938.1 9,442.2 34,876.8 -34,373.5 -340.0 62,774.9 -53,495.9 Lost wages supplemental payments4 25 0.0 2,742.2 81.7 0.0 0.8 0.0 2,742.2 -2,660.5 -81.7 0.8 Paycheck Protection Program loans to NPISH5 26 1,296.0 1,504.8 452.2 228.2 356.3 1,296.0 208.8 -1,052.6 -224.0 128.1 Provider Relief Fund to NPISH6 27 40.3 4,255.3 794.5 788.9 985.3 612.4 4,215.0 -3,460.8 -5.5 196.4 -372.9Components of earnings by place of work Wages and salaries 28 269,198.2 251,866.0 263,787.0 274,115.3 280,118.3 285,659.7 -17,332.3 11,921.1 10,328.2 6,003.0 5,541.4 Supplements to wages and salaries 29 59,136.0 56,512.1 58,592.5 60,008.6 61,116.1 61,586.1 -2,623.8 2,080.4 1,416.1 1,107.5 470.1 Employer contributions for employee pension and insurance funds 30 40,186.7 38,262.0 39,678.6 40,584.8 40,996.8 41,154.2 -1,924.7 1,416.5 906.2 412.0 157.5 Employer contributions for government social insurance 31 18,949.2 18,250.1 18,914.0 19,423.8 20,119.3 20,431.9 -699.2 663.9 509.9 695.5 312.6 Proprietors' income 32 38,549.0 32,474.4 40,409.7 39,572.2 38,707.4 40,634.7 -6,074.6 7,935.3 -837.5 -864.8 1,927.3 Farm proprietors' income 33 2,309.8 306.0 1,226.3 2,313.0 1,675.0 2,085.7 -2,003.7 920.2 1,086.7 -638.0 410.7 Of which: Coronavirus Food Assistance Program7 34 150.5 167.5 735.6 16.9 43.4 150.5 16.9 568.1 -718.7 26.5 Paycheck Protection Program loans to businesses5 35 106.9 151.9 45.7 43.9 119.1 106.9 45.0 -106.3 -1.8 75.2 Nonfarm proprietors' income 36 36,239.2 32,168.4 39,183.4 37,259.3 37,032.4 38,549.0 -4,070.8 7,015.1 -1,924.2 -226.8 1,516.6 Of which: Paycheck Protection Program loans to businesses5 37 4,921.6 7,270.6 1,950.2 1,519.2 3,611.8 4,921.6 2,349.0 -5,320.4 -431.0 2,092.7
Data on this table will be superseded by updated estimates. Regional estimates were controlled to the annual update to the National accounts released August 26, 2021.
2020 2021
Effects of Selected Federal Pandemic Response Programs on State Personal Income, 2021Q2North Carolina
(Millions of dollars, seasonally adjusted at annual rates)Levels Change from preceding period
Note: BEA state per capita personal income statistics are calculated using unpublished Census Bureau midquarter population estimates. These midquarter estimates are based on the 2010 census. BEA will incorporate Census Bureau population estimates based on the 2020 census results wh
Source. U.S. Bureau of Economic AnalysisLast updated: September 23, 2021.
Line
3. Economic impact payments, initially established by the CARES Act, provide direct payments to individuals. For more information, see How are federal economic impact payments to support individuals during the COVID-19 pandemic recorded in the NIPAs?4. The Federal Emergency Management Agency (FEMA) was authorized to make payments from the Disaster Relief Fund to supplement wages lost as a result of the COVID-19 pandemic.5. The Paycheck Protection Program, initially established by the CARES Act, provides forgivable loans to help small businesses and nonprofit institutions make payroll and cover other expenses. It also provides funding to reimburse private lending institutions for the costs of administering these loans. For more information, see How does the Paycheck Protection Program impact the national income and product accounts (NIPAs)?6. The Department of Health and Human Services distributes money from the Provider Relief Fund to hospitals and health care providers on the front lines of the coronavirus response. This funding supports health care-related expenses or lost revenue attributable to COVID-19 and ensures uninsured Americans can get treatment for COVID-19. In the NIPAs, funds provided to nonprofit hospitals are recorded as social benefits.7. The Coronavirus Food Assistance Program, initially established by the CARES Act, provides direct support to farmers and ranchers where prices and market supply chains have been impacted by the COVID-19 pandemic.
CARES -Coronavirus Aid, Relief, and Economic SecurityNPISH -Nonprofit institutions serving households1. A two percent reduction in reimbursements paid to Medicare service providers that went into effect in 2013 was initially suspended by the CARES Act. The resulting increased reimbursement rates went into effect beginning on May 1, 2020.2. Unemployment insurance benefits were expanded through several programs that were initially established through the CARES Act. For more information, see How will the expansion of unemployment benefits in response to the COVID-19 pandemic be recorded in the NIPAs?
2020 2021

Q1 Q2 Q3 Q4 Q1 Q2 Q2 Q3 Q4 Q1 Q2Personal income (millions of dollars) 1 45,006.3 49,154.8 46,230.2 47,966.1 52,595.3 50,516.7 4,148.5 -2,924.6 1,735.9 4,629.2 -2,078.6 Nonfarm personal income 2 42,982.2 46,941.1 43,520.7 43,835.7 49,387.8 46,039.4 3,958.9 -3,420.3 315.0 5,552.1 -3,348.3 Farm income 3 2,024.1 2,213.7 2,709.5 4,130.4 3,207.5 4,477.3 189.6 495.7 1,420.9 -922.9 1,269.8Population (persons) 4 765,074 765,243 765,601 766,086 766,155 766,400 169 358 485 69 245Per capita personal income (dollars) 5 58,826 64,234 60,384 62,612 68,648 65,914 5,408 -3,850 2,228 6,036 -2,734Derivation of personal income Earnings by place of work 6 34,896.0 32,959.9 34,716.7 37,474.3 37,102.0 38,962.5 -1,936.1 1,756.7 2,757.7 -372.3 1,860.5 Less: Contributions for government social insurance 7 4,056.9 3,898.6 4,048.4 4,151.1 4,284.3 4,361.9 -158.3 149.8 102.6 133.2 77.7 Employee and self-employed contributions for government social insurance 8 2,134.1 2,042.4 2,119.6 2,178.9 2,242.2 2,282.2 -91.7 77.2 59.3 63.3 40.0 Employer contributions for government social insurance 9 1,922.8 1,856.2 1,928.8 1,972.2 2,042.1 2,079.8 -66.6 72.6 43.4 69.9 37.7 Plus: Adjustment for residence 10 -2,124.4 -1,971.0 -2,051.5 -2,112.7 -2,162.3 -2,210.1 153.4 -80.5 -61.2 -49.7 -47.7 Equals: Net earnings by place of residence 11 28,714.7 27,090.3 28,616.7 31,210.6 30,655.4 32,390.5 -1,624.4 1,526.4 2,593.9 -555.2 1,735.0 Plus: Dividends, interest, and rent 12 9,748.4 9,585.4 9,456.9 9,547.9 9,528.4 9,600.4 -163.0 -128.6 91.0 -19.5 72.0 Plus: Personal current transfer receipts 13 6,543.2 12,479.0 8,156.6 7,207.6 12,411.4 8,525.8 5,935.8 -4,322.4 -949.0 5,203.8 -3,885.7 Social Security 14 2,260.6 2,276.4 2,288.8 2,308.7 2,349.5 2,357.3 15.8 12.4 19.9 40.8 7.9 Medicare 15 1,547.0 1,572.8 1,581.4 1,572.8 1,560.0 1,562.2 25.8 8.6 -8.6 -12.8 2.1 Of which: Increase in Medicare reimbursement rates1 16 18.4 27.6 27.4 27.2 27.0 18.4 9.2 -0.2 -0.2 -0.2 Medicaid 17 1,161.6 1,248.0 1,336.9 1,277.8 1,302.0 1,380.7 86.4 88.9 -59.1 24.2 78.7 State unemployment insurance 18 92.7 1,981.2 998.3 437.5 765.1 560.8 1,888.5 -982.9 -560.8 327.6 -204.3 Of which:2
Extended Unemployment Benefits 19 0.0 5.6 1.3 (L) 0.0 0.0 5.6 -4.3 (L) (L) Pandemic Emergency Unemployment Compensation 20 22.0 76.2 140.7 211.6 169.1 22.0 54.1 64.5 71.0 -42.6 Pandemic Unemployment Assistance 21 65.5 59.2 74.2 46.8 49.5 65.5 -6.3 15.0 -27.4 2.8 Pandemic Unemployment Compensation Payments 22 1,283.8 408.8 8.2 341.7 209.4 1,283.8 -875.0 -400.6 333.5 -132.4 All other personal current transfer receipts 23 1,481.3 5,400.7 1,951.2 1,610.9 6,434.8 2,664.8 3,919.4 -3,449.5 -340.3 4,824.0 -3,770.0 Of which: Economic impact payments3 24 2,600.1 37.5 12.2 4,580.8 687.2 2,600.1 -2,562.6 -25.3 4,568.7 -3,893.6 Lost wages supplemental payments4 25 0.0 124.8 10.3 2.4 1.2 0.0 124.8 -114.6 -7.9 -1.1 Paycheck Protection Program loans to NPISH5 26 374.2 112.3 33.7 32.8 171.1 374.2 -261.9 -78.5 -1.0 138.4 Provider Relief Fund to NPISH6 27 8.4 890.9 151.5 34.2 181.9 113.0 882.5 -739.4 -117.2 147.6 -68.8Components of earnings by place of work Wages and salaries 28 23,990.2 22,294.1 23,240.1 24,014.5 24,457.9 25,011.4 -1,696.1 946.0 774.4 443.4 553.6 Supplements to wages and salaries 29 5,595.8 5,373.4 5,576.7 5,698.2 5,846.5 5,916.9 -222.4 203.4 121.4 148.3 70.4 Employer contributions for employee pension and insurance funds 30 3,673.0 3,517.2 3,647.9 3,726.0 3,804.4 3,837.1 -155.8 130.8 78.1 78.4 32.7 Employer contributions for government social insurance 31 1,922.8 1,856.2 1,928.8 1,972.2 2,042.1 2,079.8 -66.6 72.6 43.4 69.9 37.7 Proprietors' income 32 5,310.0 5,292.4 5,899.8 7,761.7 6,797.6 8,034.1 -17.6 607.4 1,861.8 -964.0 1,236.5 Farm proprietors' income 33 1,786.4 1,977.8 2,472.7 3,890.2 2,962.1 4,228.5 191.4 494.9 1,417.5 -928.1 1,266.4 Of which: Coronavirus Food Assistance Program7 34 339.5 680.2 1,657.0 2.6 35.8 339.5 340.7 976.8 -1,654.5 33.3 Paycheck Protection Program loans to businesses5 35 101.2 143.7 43.2 183.8 414.8 101.2 42.6 -100.5 140.6 230.9 Nonfarm proprietors' income 36 3,523.6 3,314.7 3,427.2 3,871.4 3,835.5 3,805.6 -208.9 112.5 444.3 -36.0 -29.9 Of which: Paycheck Protection Program loans to businesses5 37 425.6 139.8 324.3 282.3 290.8 425.6 -285.8 184.5 -42.0 8.6
Data on this table will be superseded by updated estimates. Regional estimates were controlled to the annual update to the National accounts released August 26, 2021.
2021 2020 2021
Effects of Selected Federal Pandemic Response Programs on State Personal Income, 2021Q2North Dakota
(Millions of dollars, seasonally adjusted at annual rates)Levels Change from preceding period
NPISH -Nonprofit institutions serving households
Note: BEA state per capita personal income statistics are calculated using unpublished Census Bureau midquarter population estimates. These midquarter estimates are based on the 2010 census. BEA will incorporate Census Bureau population estimates based on the 2020 census results when t
Source. U.S. Bureau of Economic AnalysisLast updated: September 23, 2021.
Line
3. Economic impact payments, initially established by the CARES Act, provide direct payments to individuals. For more information, see How are federal economic impact payments to support individuals during the COVID-19 pandemic recorded in the NIPAs?
4. The Federal Emergency Management Agency (FEMA) was authorized to make payments from the Disaster Relief Fund to supplement wages lost as a result of the COVID-19 pandemic.5. The Paycheck Protection Program, initially established by the CARES Act, provides forgivable loans to help small businesses and nonprofit institutions make payroll and cover other expenses. It also provides funding to reimburse private lending institutions for the costs of administering these loans. For more information, see How does the Paycheck Protection Program impact the national income and product accounts (NIPAs)?6. The Department of Health and Human Services distributes money from the Provider Relief Fund to hospitals and health care providers on the front lines of the coronavirus response. This funding supports health care-related expenses or lost revenue attributable to COVID-19 and ensures 7. The Coronavirus Food Assistance Program, initially established by the CARES Act, provides direct support to farmers and ranchers where prices and market supply chains have been impacted by the COVID-19 pandemic.
CARES -Coronavirus Aid, Relief, and Economic Security
(L) Less than $50,000.1. A two percent reduction in reimbursements paid to Medicare service providers that went into effect in 2013 was initially suspended by the CARES Act. The resulting increased reimbursement rates went into effect beginning on May 1, 2020.2. Unemployment insurance benefits were expanded through several programs that were initially established through the CARES Act. For more information, see How will the expansion of unemployment benefits in response to the COVID-19 pandemic be recorded in the NIPAs?
2020

Q1 Q2 Q3 Q4 Q1 Q2 Q2 Q3 Q4 Q1 Q2Personal income (millions of dollars) 1 600,047.1 659,946.2 627,527.3 621,404.8 705,692.6 651,683.9 59,899.1 -32,418.9 -6,122.5 84,287.8 -54,008.7 Nonfarm personal income 2 597,995.4 658,440.4 625,351.7 617,990.1 702,866.7 647,606.1 60,445.0 -33,088.7 -7,361.6 84,876.6 -55,260.6 Farm income 3 2,051.7 1,505.8 2,175.6 3,414.7 2,825.9 4,077.9 -545.9 669.8 1,239.1 -588.8 1,252.0Population (persons) 4 11,701,100 11,696,135 11,694,445 11,695,351 11,689,678 11,685,870 -4,965 -1,690 906 -5,673 -3,808Per capita personal income (dollars) 5 51,281 56,424 53,660 53,133 60,369 55,767 5,143 -2,764 -527 7,236 -4,602Derivation of personal income Earnings by place of work 6 426,069.8 399,094.4 422,797.9 434,842.7 436,007.9 447,014.3 -26,975.4 23,703.4 12,044.9 1,165.2 11,006.4 Less: Contributions for government social insurance 7 47,435.2 45,263.5 47,047.8 48,480.9 49,330.1 49,989.9 -2,171.7 1,784.3 1,433.1 849.1 659.9 Employee and self-employed contributions for government social insurance 8 25,640.6 24,464.6 25,405.1 26,192.6 26,572.7 26,911.8 -1,176.0 940.4 787.5 380.1 339.1 Employer contributions for government social insurance 9 21,794.6 20,798.9 21,642.7 22,288.3 22,757.4 23,078.2 -995.7 843.8 645.6 469.0 320.8 Plus: Adjustment for residence 10 -2,531.1 -2,371.4 -2,475.8 -2,581.2 -2,573.6 -2,595.5 159.7 -104.5 -105.4 7.7 -21.9 Equals: Net earnings by place of residence 11 376,103.5 351,459.6 373,274.2 383,780.6 384,104.2 394,428.9 -24,644.0 21,814.7 10,506.3 323.7 10,324.7 Plus: Dividends, interest, and rent 12 105,504.4 103,501.3 101,982.9 103,363.5 103,420.2 104,509.0 -2,003.1 -1,518.4 1,380.6 56.7 1,088.8 Plus: Personal current transfer receipts 13 118,439.2 204,985.4 152,270.1 134,260.7 218,168.1 152,746.0 86,546.2 -52,715.2 -18,009.4 83,907.4 -65,422.1 Social Security 14 39,874.0 40,083.1 40,247.9 40,511.5 41,051.0 41,155.1 209.1 164.7 263.6 539.4 104.1 Medicare 15 31,629.4 32,110.2 32,264.3 32,089.0 31,847.2 31,887.3 480.9 154.1 -175.3 -241.8 40.0 Of which: Increase in Medicare reimbursement rates1 16 376.4 563.5 559.3 555.1 551.2 376.4 187.2 -4.2 -4.2 -3.9 Medicaid 17 23,484.4 25,088.9 27,440.7 27,120.1 27,228.5 29,128.5 1,604.6 2,351.8 -320.6 108.5 1,900.0 State unemployment insurance 18 1,307.3 35,498.3 18,518.9 8,346.5 18,155.3 12,407.0 34,191.0 -16,979.4 -10,172.3 9,808.8 -5,748.3 Of which:2
Extended Unemployment Benefits 19 3.5 81.1 314.3 30.9 1.6 3.5 77.6 233.2 -283.4 -29.3 Pandemic Emergency Unemployment Compensation 20 108.7 358.4 1,519.1 2,530.3 2,085.1 108.7 249.7 1,160.7 1,011.2 -445.2 Pandemic Unemployment Assistance 21 3,678.2 3,986.2 4,476.7 4,555.2 2,768.7 3,678.2 307.9 490.5 78.5 -1,786.5 Pandemic Unemployment Compensation Payments 22 24,195.5 9,352.6 269.4 9,782.1 6,422.7 24,195.5 -14,843.0 -9,083.1 9,512.7 -3,359.4 All other personal current transfer receipts 23 22,144.2 72,204.7 33,798.3 26,193.5 99,886.1 38,168.2 50,060.5 -38,406.4 -7,604.8 73,692.6 -61,717.9 Of which: Economic impact payments3 24 40,980.0 590.3 191.4 72,859.8 10,930.7 40,980.0 -40,389.7 -398.8 72,668.4 -61,929.2 Lost wages supplemental payments4 25 0.0 3,527.4 557.7 101.0 37.7 0.0 3,527.4 -2,969.7 -456.7 -63.3 Paycheck Protection Program loans to NPISH5 26 1,751.0 3,466.6 1,041.7 362.8 562.6 1,751.0 1,715.6 -2,424.9 -678.9 199.8 Provider Relief Fund to NPISH6 27 59.7 6,308.9 3,020.6 1,187.6 1,772.6 1,101.7 6,249.2 -3,288.3 -1,833.0 585.0 -671.0Components of earnings by place of work Wages and salaries 28 309,901.5 289,328.3 303,399.4 315,284.3 316,586.3 322,155.4 -20,573.2 14,071.1 11,884.9 1,302.1 5,569.1 Supplements to wages and salaries 29 72,091.2 68,383.0 70,900.5 72,610.0 73,212.8 73,696.8 -3,708.2 2,517.5 1,709.4 602.9 484.0 Employer contributions for employee pension and insurance funds 30 50,296.6 47,584.1 49,257.8 50,321.6 50,455.5 50,618.7 -2,712.5 1,673.7 1,063.9 133.8 163.2 Employer contributions for government social insurance 31 21,794.6 20,798.9 21,642.7 22,288.3 22,757.4 23,078.2 -995.7 843.8 645.6 469.0 320.8 Proprietors' income 32 44,077.1 41,383.1 48,498.0 46,948.5 46,208.7 51,162.0 -2,694.0 7,114.8 -1,549.4 -739.8 4,953.3 Farm proprietors' income 33 1,613.1 1,070.0 1,738.0 2,970.7 2,372.4 3,618.2 -543.1 668.1 1,232.7 -598.3 1,245.8 Of which: Coronavirus Food Assistance Program7 34 317.4 424.1 1,187.6 2.1 25.1 317.4 106.7 763.5 -1,185.5 23.0 Paycheck Protection Program loans to businesses5 35 104.8 148.9 44.8 153.3 344.6 104.8 44.1 -104.2 108.6 191.3 Nonfarm proprietors' income 36 42,464.0 40,313.2 46,759.9 43,977.8 43,836.3 47,543.9 -2,150.8 6,446.7 -2,782.1 -141.5 3,707.5 Of which: Paycheck Protection Program loans to businesses5 37 7,185.5 9,239.8 2,881.1 2,416.2 6,809.7 7,185.5 2,054.3 -6,358.7 -464.9 4,393.4
Data on this table will be superseded by updated estimates. Regional estimates were controlled to the annual update to the National accounts released August 26, 2021.
2020 2021
Effects of Selected Federal Pandemic Response Programs on State Personal Income, 2021Q2Ohio
(Millions of dollars, seasonally adjusted at annual rates)Levels Change from preceding period
Note: BEA state per capita personal income statistics are calculated using unpublished Census Bureau midquarter population estimates. These midquarter estimates are based on the 2010 census. BEA will incorporate Census Bureau population estimates based on the 2020 census results wh
Source. U.S. Bureau of Economic AnalysisLast updated: September 23, 2021.
Line
3. Economic impact payments, initially established by the CARES Act, provide direct payments to individuals. For more information, see How are federal economic impact payments to support individuals during the COVID-19 pandemic recorded in the NIPAs?4. The Federal Emergency Management Agency (FEMA) was authorized to make payments from the Disaster Relief Fund to supplement wages lost as a result of the COVID-19 pandemic.5. The Paycheck Protection Program, initially established by the CARES Act, provides forgivable loans to help small businesses and nonprofit institutions make payroll and cover other expenses. It also provides funding to reimburse private lending institutions for the costs of administering these loans. For more information, see How does the Paycheck Protection Program impact the national income and product accounts (NIPAs)?6. The Department of Health and Human Services distributes money from the Provider Relief Fund to hospitals and health care providers on the front lines of the coronavirus response. This funding supports health care-related expenses or lost revenue attributable to COVID-19 and ensures uninsured Americans can get treatment for COVID-19. In the NIPAs, funds provided to nonprofit hospitals are recorded as social benefits.7. The Coronavirus Food Assistance Program, initially established by the CARES Act, provides direct support to farmers and ranchers where prices and market supply chains have been impacted by the COVID-19 pandemic.
CARES -Coronavirus Aid, Relief, and Economic SecurityNPISH -Nonprofit institutions serving households1. A two percent reduction in reimbursements paid to Medicare service providers that went into effect in 2013 was initially suspended by the CARES Act. The resulting increased reimbursement rates went into effect beginning on May 1, 2020.2. Unemployment insurance benefits were expanded through several programs that were initially established through the CARES Act. For more information, see How will the expansion of unemployment benefits in response to the COVID-19 pandemic be recorded in the NIPAs?
2020 2021

Q1 Q2 Q3 Q4 Q1 Q2 Q2 Q3 Q4 Q1 Q2Personal income (millions of dollars) 1 192,838.3 208,087.2 195,692.4 197,590.5 223,551.0 206,090.4 15,248.9 -12,394.8 1,898.1 25,960.5 -17,460.6 Nonfarm personal income 2 191,673.9 207,080.6 194,363.7 195,475.0 222,431.1 204,354.3 15,406.7 -12,717.0 1,111.3 26,956.1 -18,076.8 Farm income 3 1,164.4 1,006.6 1,328.7 2,115.5 1,119.9 1,736.2 -157.8 322.1 786.8 -995.7 616.3Population (persons) 4 3,975,430 3,979,102 3,983,811 3,989,339 3,992,739 3,996,822 3,672 4,709 5,528 3,400 4,083Per capita personal income (dollars) 5 48,508 52,295 49,122 49,530 55,989 51,564 3,787 -3,173 408 6,459 -4,425Derivation of personal income Earnings by place of work 6 131,771.9 122,815.3 128,380.0 134,441.0 132,832.1 135,765.0 -8,956.6 5,564.7 6,061.0 -1,608.9 2,932.9 Less: Contributions for government social insurance 7 14,214.6 13,562.7 14,070.3 14,436.1 14,527.4 14,687.7 -651.9 507.6 365.8 91.2 160.3 Employee and self-employed contributions for government social insurance 8 7,874.6 7,483.1 7,766.5 7,981.0 8,019.7 8,105.6 -391.5 283.5 214.5 38.7 85.9 Employer contributions for government social insurance 9 6,340.0 6,079.6 6,303.7 6,455.1 6,507.7 6,582.1 -260.4 224.1 151.4 52.6 74.4 Plus: Adjustment for residence 10 445.0 419.6 441.2 461.6 487.2 499.0 -25.4 21.6 20.4 25.5 11.8 Equals: Net earnings by place of residence 11 118,002.4 109,672.2 114,751.0 120,466.5 118,791.9 121,576.3 -8,330.2 5,078.8 5,715.6 -1,674.6 2,784.4 Plus: Dividends, interest, and rent 12 37,103.7 36,568.4 36,189.1 36,492.9 36,506.7 36,764.1 -535.3 -379.3 303.8 13.8 257.4 Plus: Personal current transfer receipts 13 37,732.3 61,846.6 44,752.3 40,631.1 68,252.4 47,750.1 24,114.4 -17,094.3 -4,121.3 27,621.4 -20,502.3 Social Security 14 13,231.6 13,313.9 13,378.4 13,479.9 13,685.7 13,725.4 82.3 64.5 101.4 205.8 39.7 Medicare 15 9,330.0 9,477.1 9,525.8 9,475.2 9,403.1 9,415.0 147.1 48.7 -50.6 -72.1 12.0 Of which: Increase in Medicare reimbursement rates1 16 111.1 166.3 165.1 163.8 162.7 111.1 55.2 -1.3 -1.2 -1.2 Medicaid 17 4,955.5 5,043.7 5,322.7 5,068.3 5,092.9 5,497.3 88.2 278.9 -254.3 24.6 404.4 State unemployment insurance 18 397.8 7,649.9 4,488.0 1,880.7 3,488.2 3,062.7 7,252.1 -3,161.9 -2,607.3 1,607.5 -425.5 Of which:2
Extended Unemployment Benefits 19 0.0 12.9 104.3 1.7 0.7 0.0 12.9 91.4 -102.6 -1.0 Pandemic Emergency Unemployment Compensation 20 43.0 218.2 712.6 1,005.7 872.6 43.0 175.2 494.4 293.1 -133.1 Pandemic Unemployment Assistance 21 62.6 258.9 259.6 270.8 289.0 62.6 196.2 0.7 11.3 18.2 Pandemic Unemployment Compensation Payments 22 4,955.4 2,324.6 78.4 1,687.5 1,478.6 4,955.4 -2,630.7 -2,246.2 1,609.1 -209.0 All other personal current transfer receipts 23 9,817.3 26,362.0 12,037.5 10,727.0 36,582.5 16,049.6 16,544.7 -14,324.5 -1,310.5 25,855.5 -20,532.9 Of which: Economic impact payments3 24 13,521.2 195.2 63.3 24,649.7 3,698.0 13,521.2 -13,326.0 -131.9 24,586.4 -20,951.7 Lost wages supplemental payments4 25 0.0 800.5 145.8 9.9 5.7 0.0 800.5 -654.7 -136.0 -4.1 Paycheck Protection Program loans to NPISH5 26 590.5 470.9 141.5 92.4 77.3 590.5 -119.7 -329.4 -49.1 -15.1 Provider Relief Fund to NPISH6 27 17.4 1,833.3 308.2 184.4 392.7 244.1 1,815.9 -1,525.0 -123.9 208.4 -148.6Components of earnings by place of work Wages and salaries 28 86,472.6 80,135.3 83,781.0 86,669.2 86,201.9 87,539.8 -6,337.3 3,645.8 2,888.2 -467.3 1,337.9 Supplements to wages and salaries 29 20,776.7 19,899.4 20,709.5 21,197.1 21,100.7 21,197.6 -877.2 810.0 487.7 -96.4 96.9 Employer contributions for employee pension and insurance funds 30 14,436.7 13,819.8 14,405.8 14,742.0 14,593.0 14,615.5 -616.9 585.9 336.3 -149.0 22.5 Employer contributions for government social insurance 31 6,340.0 6,079.6 6,303.7 6,455.1 6,507.7 6,582.1 -260.4 224.1 151.4 52.6 74.4 Proprietors' income 32 24,522.6 22,780.5 23,889.5 26,574.6 25,529.5 27,027.6 -1,742.1 1,109.0 2,685.1 -1,045.1 1,498.1 Farm proprietors' income 33 925.4 768.3 1,089.1 1,872.2 871.2 1,484.1 -157.0 320.7 783.1 -1,000.9 612.9 Of which: Coronavirus Food Assistance Program7 34 644.7 559.5 1,080.3 0.0 35.4 644.7 -85.2 520.9 -1,080.3 35.4 Paycheck Protection Program loans to businesses5 35 48.8 69.3 20.8 186.1 437.1 48.8 20.5 -48.5 165.3 251.0 Nonfarm proprietors' income 36 23,597.3 22,012.2 22,800.4 24,702.5 24,658.2 25,543.4 -1,585.1 788.2 1,902.1 -44.2 885.2 Of which: Paycheck Protection Program loans to businesses5 37 3,590.8 1,844.2 1,887.9 1,097.9 1,357.3 3,590.8 -1,746.6 43.7 -790.0 259.3
Data on this table will be superseded by updated estimates. Regional estimates were controlled to the annual update to the National accounts released August 26, 2021.
2020 2021
Effects of Selected Federal Pandemic Response Programs on State Personal Income, 2021Q2Oklahoma
(Millions of dollars, seasonally adjusted at annual rates)Levels Change from preceding period
Note: BEA state per capita personal income statistics are calculated using unpublished Census Bureau midquarter population estimates. These midquarter estimates are based on the 2010 census. BEA will incorporate Census Bureau population estimates based on the 2020 census results wh
Source. U.S. Bureau of Economic AnalysisLast updated: September 23, 2021.
Line
3. Economic impact payments, initially established by the CARES Act, provide direct payments to individuals. For more information, see How are federal economic impact payments to support individuals during the COVID-19 pandemic recorded in the NIPAs?4. The Federal Emergency Management Agency (FEMA) was authorized to make payments from the Disaster Relief Fund to supplement wages lost as a result of the COVID-19 pandemic.5. The Paycheck Protection Program, initially established by the CARES Act, provides forgivable loans to help small businesses and nonprofit institutions make payroll and cover other expenses. It also provides funding to reimburse private lending institutions for the costs of administering these loans. For more information, see How does the Paycheck Protection Program impact the national income and product accounts (NIPAs)?6. The Department of Health and Human Services distributes money from the Provider Relief Fund to hospitals and health care providers on the front lines of the coronavirus response. This funding supports health care-related expenses or lost revenue attributable to COVID-19 and ensures uninsured Americans can get treatment for COVID-19. In the NIPAs, funds provided to nonprofit hospitals are recorded as social benefits.7. The Coronavirus Food Assistance Program, initially established by the CARES Act, provides direct support to farmers and ranchers where prices and market supply chains have been impacted by the COVID-19 pandemic.
CARES -Coronavirus Aid, Relief, and Economic SecurityNPISH -Nonprofit institutions serving households1. A two percent reduction in reimbursements paid to Medicare service providers that went into effect in 2013 was initially suspended by the CARES Act. The resulting increased reimbursement rates went into effect beginning on May 1, 2020.2. Unemployment insurance benefits were expanded through several programs that were initially established through the CARES Act. For more information, see How will the expansion of unemployment benefits in response to the COVID-19 pandemic be recorded in the NIPAs?
2020 2021

Q1 Q2 Q3 Q4 Q1 Q2 Q2 Q3 Q4 Q1 Q2Personal income (millions of dollars) 1 229,040.2 246,396.5 239,795.4 240,156.1 268,054.2 249,525.5 17,356.3 -6,601.1 360.7 27,898.1 -18,528.8 Nonfarm personal income 2 227,123.5 244,233.0 237,368.5 237,422.1 265,789.7 246,889.8 17,109.5 -6,864.5 53.5 28,367.7 -18,899.9 Farm income 3 1,916.7 2,163.5 2,426.9 2,734.1 2,264.5 2,635.7 246.9 263.4 307.2 -469.6 371.2Population (persons) 4 4,234,519 4,239,315 4,245,292 4,252,262 4,256,922 4,262,164 4,796 5,977 6,970 4,660 5,242Per capita personal income (dollars) 5 54,089 58,122 56,485 56,477 62,969 58,544 4,033 -1,637 -8 6,492 -4,425Derivation of personal income Earnings by place of work 6 165,746.8 153,946.7 165,310.1 169,440.1 170,214.9 173,386.3 -11,800.1 11,363.4 4,130.0 774.8 3,171.4 Less: Contributions for government social insurance 7 20,386.6 19,376.9 20,151.3 20,720.5 21,095.0 21,484.6 -1,009.7 774.4 569.2 374.5 389.6 Employee and self-employed contributions for government social insurance 8 10,649.3 10,101.9 10,499.3 10,814.3 10,978.3 11,170.0 -547.4 397.4 315.0 164.0 191.7 Employer contributions for government social insurance 9 9,737.3 9,275.0 9,652.0 9,906.2 10,116.7 10,314.6 -462.3 377.0 254.1 210.5 197.9 Plus: Adjustment for residence 10 -5,617.7 -5,221.7 -5,490.2 -5,692.7 -5,701.3 -5,810.4 396.0 -268.5 -202.5 -8.6 -109.1 Equals: Net earnings by place of residence 11 139,742.5 129,348.1 139,668.6 143,027.0 143,418.6 146,091.3 -10,394.5 10,320.5 3,358.4 391.6 2,672.7 Plus: Dividends, interest, and rent 12 44,987.0 44,052.9 43,299.7 44,077.6 43,935.7 44,479.7 -934.0 -753.2 777.8 -141.9 544.0 Plus: Personal current transfer receipts 13 44,310.7 72,995.5 56,827.1 53,051.6 80,699.9 58,954.5 28,684.8 -16,168.4 -3,775.5 27,648.3 -21,745.4 Social Security 14 15,303.4 15,410.7 15,495.2 15,630.4 15,906.9 15,960.3 107.3 84.5 135.2 276.5 53.4 Medicare 15 9,797.1 9,962.9 10,014.0 9,949.6 9,856.5 9,872.3 165.8 51.1 -64.5 -93.1 15.8 Of which: Increase in Medicare reimbursement rates1 16 116.7 174.8 173.5 172.1 170.9 116.7 58.0 -1.3 -1.3 -1.2 Medicaid 17 9,766.0 10,391.0 11,474.5 11,203.0 11,363.0 11,765.6 625.0 1,083.5 -271.4 160.0 402.6 State unemployment insurance 18 627.1 10,908.8 8,966.4 4,565.5 7,675.9 6,545.4 10,281.7 -1,942.4 -4,400.9 3,110.5 -1,130.5 Of which:2
Extended Unemployment Benefits 19 0.0 40.5 173.4 267.2 10.0 0.0 40.5 132.9 93.7 -257.1 Pandemic Emergency Unemployment Compensation 20 49.1 254.0 1,172.5 1,541.9 1,759.9 49.1 204.9 918.5 369.4 218.0 Pandemic Unemployment Assistance 21 127.8 648.6 1,138.5 1,067.0 859.4 127.8 520.9 489.9 -71.5 -207.6 Pandemic Unemployment Compensation Payments 22 6,745.0 5,076.8 765.8 3,836.3 3,092.4 6,745.0 -1,668.3 -4,311.0 3,070.5 -743.9 All other personal current transfer receipts 23 8,817.1 26,322.1 10,877.0 11,703.1 35,897.6 14,810.9 17,505.1 -15,445.2 826.2 24,194.5 -21,086.6 Of which: Economic impact payments3 24 14,401.6 208.0 67.5 25,033.4 3,755.6 14,401.6 -14,193.6 -140.6 24,965.9 -21,277.8 Lost wages supplemental payments4 25 0.0 0.0 1,521.1 64.5 33.0 0.0 0.0 1,521.1 -1,456.6 -31.5 Paycheck Protection Program loans to NPISH5 26 746.3 1,023.9 307.7 161.7 132.0 746.3 277.6 -716.2 -145.9 -29.7 Provider Relief Fund to NPISH6 27 17.3 1,829.1 302.5 501.8 444.2 276.1 1,811.8 -1,526.6 199.4 -57.6 -168.1Components of earnings by place of work Wages and salaries 28 117,431.2 109,299.6 114,930.6 119,432.0 120,001.3 122,678.0 -8,131.7 5,631.0 4,501.5 569.3 2,676.7 Supplements to wages and salaries 29 28,006.2 26,699.9 27,827.7 28,509.6 29,039.9 29,377.5 -1,306.3 1,127.8 681.9 530.3 337.6 Employer contributions for employee pension and insurance funds 30 18,268.9 17,424.9 18,175.7 18,603.4 18,923.2 19,062.9 -844.0 750.8 427.7 319.8 139.7 Employer contributions for government social insurance 31 9,737.3 9,275.0 9,652.0 9,906.2 10,116.7 10,314.6 -462.3 377.0 254.1 210.5 197.9 Proprietors' income 32 20,309.4 17,947.2 22,551.8 21,498.5 21,173.7 21,330.7 -2,362.2 4,604.6 -1,053.3 -324.8 157.1 Farm proprietors' income 33 1,106.2 1,360.0 1,621.5 1,917.6 1,430.5 1,790.3 253.9 261.4 296.1 -487.2 359.8 Of which: Coronavirus Food Assistance Program7 34 141.3 203.7 546.7 24.9 40.9 141.3 62.4 343.0 -521.8 16.0 Paycheck Protection Program loans to businesses5 35 153.4 217.9 65.5 51.2 119.1 153.4 64.5 -152.4 -14.3 67.9 Nonfarm proprietors' income 36 19,203.2 16,587.2 20,930.3 19,580.9 19,743.2 19,540.5 -2,616.0 4,343.2 -1,349.5 162.4 -202.8 Of which: Paycheck Protection Program loans to businesses5 37 2,466.7 4,093.1 1,044.0 916.8 1,160.4 2,466.7 1,626.4 -3,049.1 -127.3 243.7
Data on this table will be superseded by updated estimates. Regional estimates were controlled to the annual update to the National accounts released August 26, 2021.
2020 2021
Effects of Selected Federal Pandemic Response Programs on State Personal Income, 2021Q2Oregon
(Millions of dollars, seasonally adjusted at annual rates)Levels Change from preceding period
Note: BEA state per capita personal income statistics are calculated using unpublished Census Bureau midquarter population estimates. These midquarter estimates are based on the 2010 census. BEA will incorporate Census Bureau population estimates based on the 2020 census results wh
Source. U.S. Bureau of Economic AnalysisLast updated: September 23, 2021.
Line
3. Economic impact payments, initially established by the CARES Act, provide direct payments to individuals. For more information, see How are federal economic impact payments to support individuals during the COVID-19 pandemic recorded in the NIPAs?4. The Federal Emergency Management Agency (FEMA) was authorized to make payments from the Disaster Relief Fund to supplement wages lost as a result of the COVID-19 pandemic.5. The Paycheck Protection Program, initially established by the CARES Act, provides forgivable loans to help small businesses and nonprofit institutions make payroll and cover other expenses. It also provides funding to reimburse private lending institutions for the costs of administering these loans. For more information, see How does the Paycheck Protection Program impact the national income and product accounts (NIPAs)?6. The Department of Health and Human Services distributes money from the Provider Relief Fund to hospitals and health care providers on the front lines of the coronavirus response. This funding supports health care-related expenses or lost revenue attributable to COVID-19 and ensures uninsured Americans can get treatment for COVID-19. In the NIPAs, funds provided to nonprofit hospitals are recorded as social benefits.7. The Coronavirus Food Assistance Program, initially established by the CARES Act, provides direct support to farmers and ranchers where prices and market supply chains have been impacted by the COVID-19 pandemic.
CARES -Coronavirus Aid, Relief, and Economic SecurityNPISH -Nonprofit institutions serving households1. A two percent reduction in reimbursements paid to Medicare service providers that went into effect in 2013 was initially suspended by the CARES Act. The resulting increased reimbursement rates went into effect beginning on May 1, 2020.2. Unemployment insurance benefits were expanded through several programs that were initially established through the CARES Act. For more information, see How will the expansion of unemployment benefits in response to the COVID-19 pandemic be recorded in the NIPAs?
2020 2021

Q1 Q2 Q3 Q4 Q1 Q2 Q2 Q3 Q4 Q1 Q2Personal income (millions of dollars) 1 744,113.4 830,663.9 802,975.5 777,148.0 865,974.2 807,530.8 86,550.5 -27,688.4 -25,827.5 88,826.2 -58,443.4 Nonfarm personal income 2 742,236.8 829,350.3 800,925.0 774,699.8 864,270.3 805,423.8 87,113.6 -28,425.3 -26,225.3 89,570.5 -58,846.5 Farm income 3 1,876.6 1,313.5 2,050.4 2,448.3 1,703.9 2,107.0 -563.1 736.9 397.8 -744.3 403.1Population (persons) 4 12,797,416 12,788,403 12,782,588 12,779,376 12,769,811 12,762,077 -9,013 -5,815 -3,212 -9,565 -7,734Per capita personal income (dollars) 5 58,146 64,954 62,818 60,813 67,814 63,276 6,808 -2,136 -2,005 7,001 -4,538Derivation of personal income Earnings by place of work 6 513,337.8 482,161.0 508,002.2 524,635.0 523,980.4 533,433.1 -31,176.8 25,841.2 16,632.8 -654.6 9,452.7 Less: Contributions for government social insurance 7 57,953.4 55,499.2 57,390.9 59,031.3 59,768.4 60,632.0 -2,454.3 1,891.8 1,640.4 737.1 863.6 Employee and self-employed contributions for government social insurance 8 31,249.0 29,959.7 31,031.4 32,005.3 32,352.8 32,798.9 -1,289.3 1,071.7 974.0 347.4 446.1 Employer contributions for government social insurance 9 26,704.4 25,539.5 26,359.6 27,026.0 27,415.7 27,833.1 -1,164.9 820.1 666.4 389.7 417.5 Plus: Adjustment for residence 10 11,274.8 10,681.3 11,140.5 11,561.2 11,897.2 12,129.8 -593.5 459.2 420.7 336.0 232.6 Equals: Net earnings by place of residence 11 466,659.2 437,343.1 461,751.8 477,164.8 476,109.1 484,930.9 -29,316.1 24,408.6 15,413.1 -1,055.7 8,821.7 Plus: Dividends, interest, and rent 12 131,156.7 129,141.5 127,628.6 129,401.7 129,653.2 130,996.3 -2,015.2 -1,512.9 1,773.1 251.5 1,343.2 Plus: Personal current transfer receipts 13 146,297.5 264,179.3 213,595.1 170,581.5 260,211.9 191,603.6 117,881.7 -50,584.1 -43,013.6 89,630.4 -68,608.3 Social Security 14 50,198.0 50,468.4 50,681.8 51,025.7 51,731.7 51,868.0 270.4 213.4 343.9 706.0 136.3 Medicare 15 37,400.9 37,953.4 38,128.4 37,923.1 37,645.6 37,691.4 552.5 175.0 -205.3 -277.5 45.8 Of which: Increase in Medicare reimbursement rates1 16 444.9 666.1 661.1 656.1 651.5 444.9 221.2 -5.0 -5.0 -4.6 Medicaid 17 30,430.8 35,457.2 34,318.0 33,837.0 35,921.9 38,757.4 5,026.4 -1,139.2 -481.0 2,084.9 2,835.5 State unemployment insurance 18 2,310.5 60,073.2 47,738.3 15,682.2 26,604.2 18,713.1 57,762.7 -12,334.9 -32,056.1 10,922.0 -7,891.1 Of which:2
Extended Unemployment Benefits 19 7.5 258.2 556.7 992.7 81.6 7.5 250.7 298.5 436.0 -911.2 Pandemic Emergency Unemployment Compensation 20 352.1 754.0 3,343.2 3,834.2 3,563.5 352.1 401.9 2,589.2 490.9 -270.7 Pandemic Unemployment Assistance 21 8,179.7 11,866.7 7,728.4 6,722.2 4,235.7 8,179.7 3,687.0 -4,138.3 -1,006.1 -2,486.5 Pandemic Unemployment Compensation Payments 22 39,101.8 26,010.7 533.4 12,144.7 8,320.3 39,101.8 -13,091.1 -25,477.4 11,611.3 -3,824.4 All other personal current transfer receipts 23 25,957.3 80,227.1 42,728.6 32,113.5 108,308.5 44,573.6 54,269.7 -37,498.4 -10,615.1 76,195.0 -63,734.9 Of which: Economic impact payments3 24 43,962.8 633.2 205.4 76,585.5 11,489.6 43,962.8 -43,329.6 -427.8 76,380.1 -65,095.9 Lost wages supplemental payments4 25 0.0 6,437.7 1,001.2 90.0 10.0 0.0 6,437.7 -5,436.5 -911.2 -80.0 Paycheck Protection Program loans to NPISH5 26 2,480.0 4,648.2 1,396.8 482.3 1,696.8 2,480.0 2,168.2 -3,251.4 -914.5 1,214.6 Provider Relief Fund to NPISH6 27 63.7 6,722.6 4,049.5 2,591.4 2,250.3 1,398.6 6,659.0 -2,673.2 -1,458.0 -341.1 -851.8Components of earnings by place of work Wages and salaries 28 358,305.1 336,355.3 351,976.4 365,989.7 366,178.3 372,997.5 -21,949.7 15,621.0 14,013.4 188.6 6,819.2 Supplements to wages and salaries 29 87,430.6 83,196.5 86,189.5 88,273.8 88,313.5 89,050.3 -4,234.0 2,993.0 2,084.3 39.8 736.8 Employer contributions for employee pension and insurance funds 30 60,726.1 57,657.0 59,829.9 61,247.8 60,897.9 61,217.1 -3,069.1 2,172.9 1,417.8 -349.9 319.3 Employer contributions for government social insurance 31 26,704.4 25,539.5 26,359.6 27,026.0 27,415.7 27,833.1 -1,164.9 820.1 666.4 389.7 417.5 Proprietors' income 32 67,602.2 62,609.2 69,836.3 70,371.5 69,488.5 71,385.3 -4,993.0 7,227.2 535.2 -883.0 1,896.8 Farm proprietors' income 33 1,413.0 851.5 1,585.8 1,976.5 1,222.0 1,618.8 -561.5 734.3 390.8 -754.5 396.8 Of which: Coronavirus Food Assistance Program7 34 309.2 285.2 627.4 0.0 19.8 309.2 -24.0 342.2 -627.4 19.8 Paycheck Protection Program loans to businesses5 35 144.3 205.0 61.6 40.2 99.5 144.3 60.7 -143.4 -21.4 59.3 Nonfarm proprietors' income 36 66,189.2 61,757.7 68,250.6 68,395.0 68,266.5 69,766.5 -4,431.6 6,492.9 144.4 -128.5 1,500.0 Of which: Paycheck Protection Program loans to businesses5 37 8,600.5 8,652.1 3,472.9 2,492.7 4,924.6 8,600.5 51.6 -5,179.2 -980.1 2,431.9
Data on this table will be superseded by updated estimates. Regional estimates were controlled to the annual update to the National accounts released August 26, 2021.
2020 2021
Effects of Selected Federal Pandemic Response Programs on State Personal Income, 2021Q2Pennsylvania
(Millions of dollars, seasonally adjusted at annual rates)Levels Change from preceding period
Note: BEA state per capita personal income statistics are calculated using unpublished Census Bureau midquarter population estimates. These midquarter estimates are based on the 2010 census. BEA will incorporate Census Bureau population estimates based on the 2020 census results wh
Source. U.S. Bureau of Economic AnalysisLast updated: September 23, 2021.
Line
3. Economic impact payments, initially established by the CARES Act, provide direct payments to individuals. For more information, see How are federal economic impact payments to support individuals during the COVID-19 pandemic recorded in the NIPAs?4. The Federal Emergency Management Agency (FEMA) was authorized to make payments from the Disaster Relief Fund to supplement wages lost as a result of the COVID-19 pandemic.5. The Paycheck Protection Program, initially established by the CARES Act, provides forgivable loans to help small businesses and nonprofit institutions make payroll and cover other expenses. It also provides funding to reimburse private lending institutions for the costs of administering these loans. For more information, see How does the Paycheck Protection Program impact the national income and product accounts (NIPAs)?6. The Department of Health and Human Services distributes money from the Provider Relief Fund to hospitals and health care providers on the front lines of the coronavirus response. This funding supports health care-related expenses or lost revenue attributable to COVID-19 and ensures uninsured Americans can get treatment for COVID-19. In the NIPAs, funds provided to nonprofit hospitals are recorded as social benefits.7. The Coronavirus Food Assistance Program, initially established by the CARES Act, provides direct support to farmers and ranchers where prices and market supply chains have been impacted by the COVID-19 pandemic.
CARES -Coronavirus Aid, Relief, and Economic SecurityNPISH -Nonprofit institutions serving households1. A two percent reduction in reimbursements paid to Medicare service providers that went into effect in 2013 was initially suspended by the CARES Act. The resulting increased reimbursement rates went into effect beginning on May 1, 2020.2. Unemployment insurance benefits were expanded through several programs that were initially established through the CARES Act. For more information, see How will the expansion of unemployment benefits in response to the COVID-19 pandemic be recorded in the NIPAs?
2020 2021
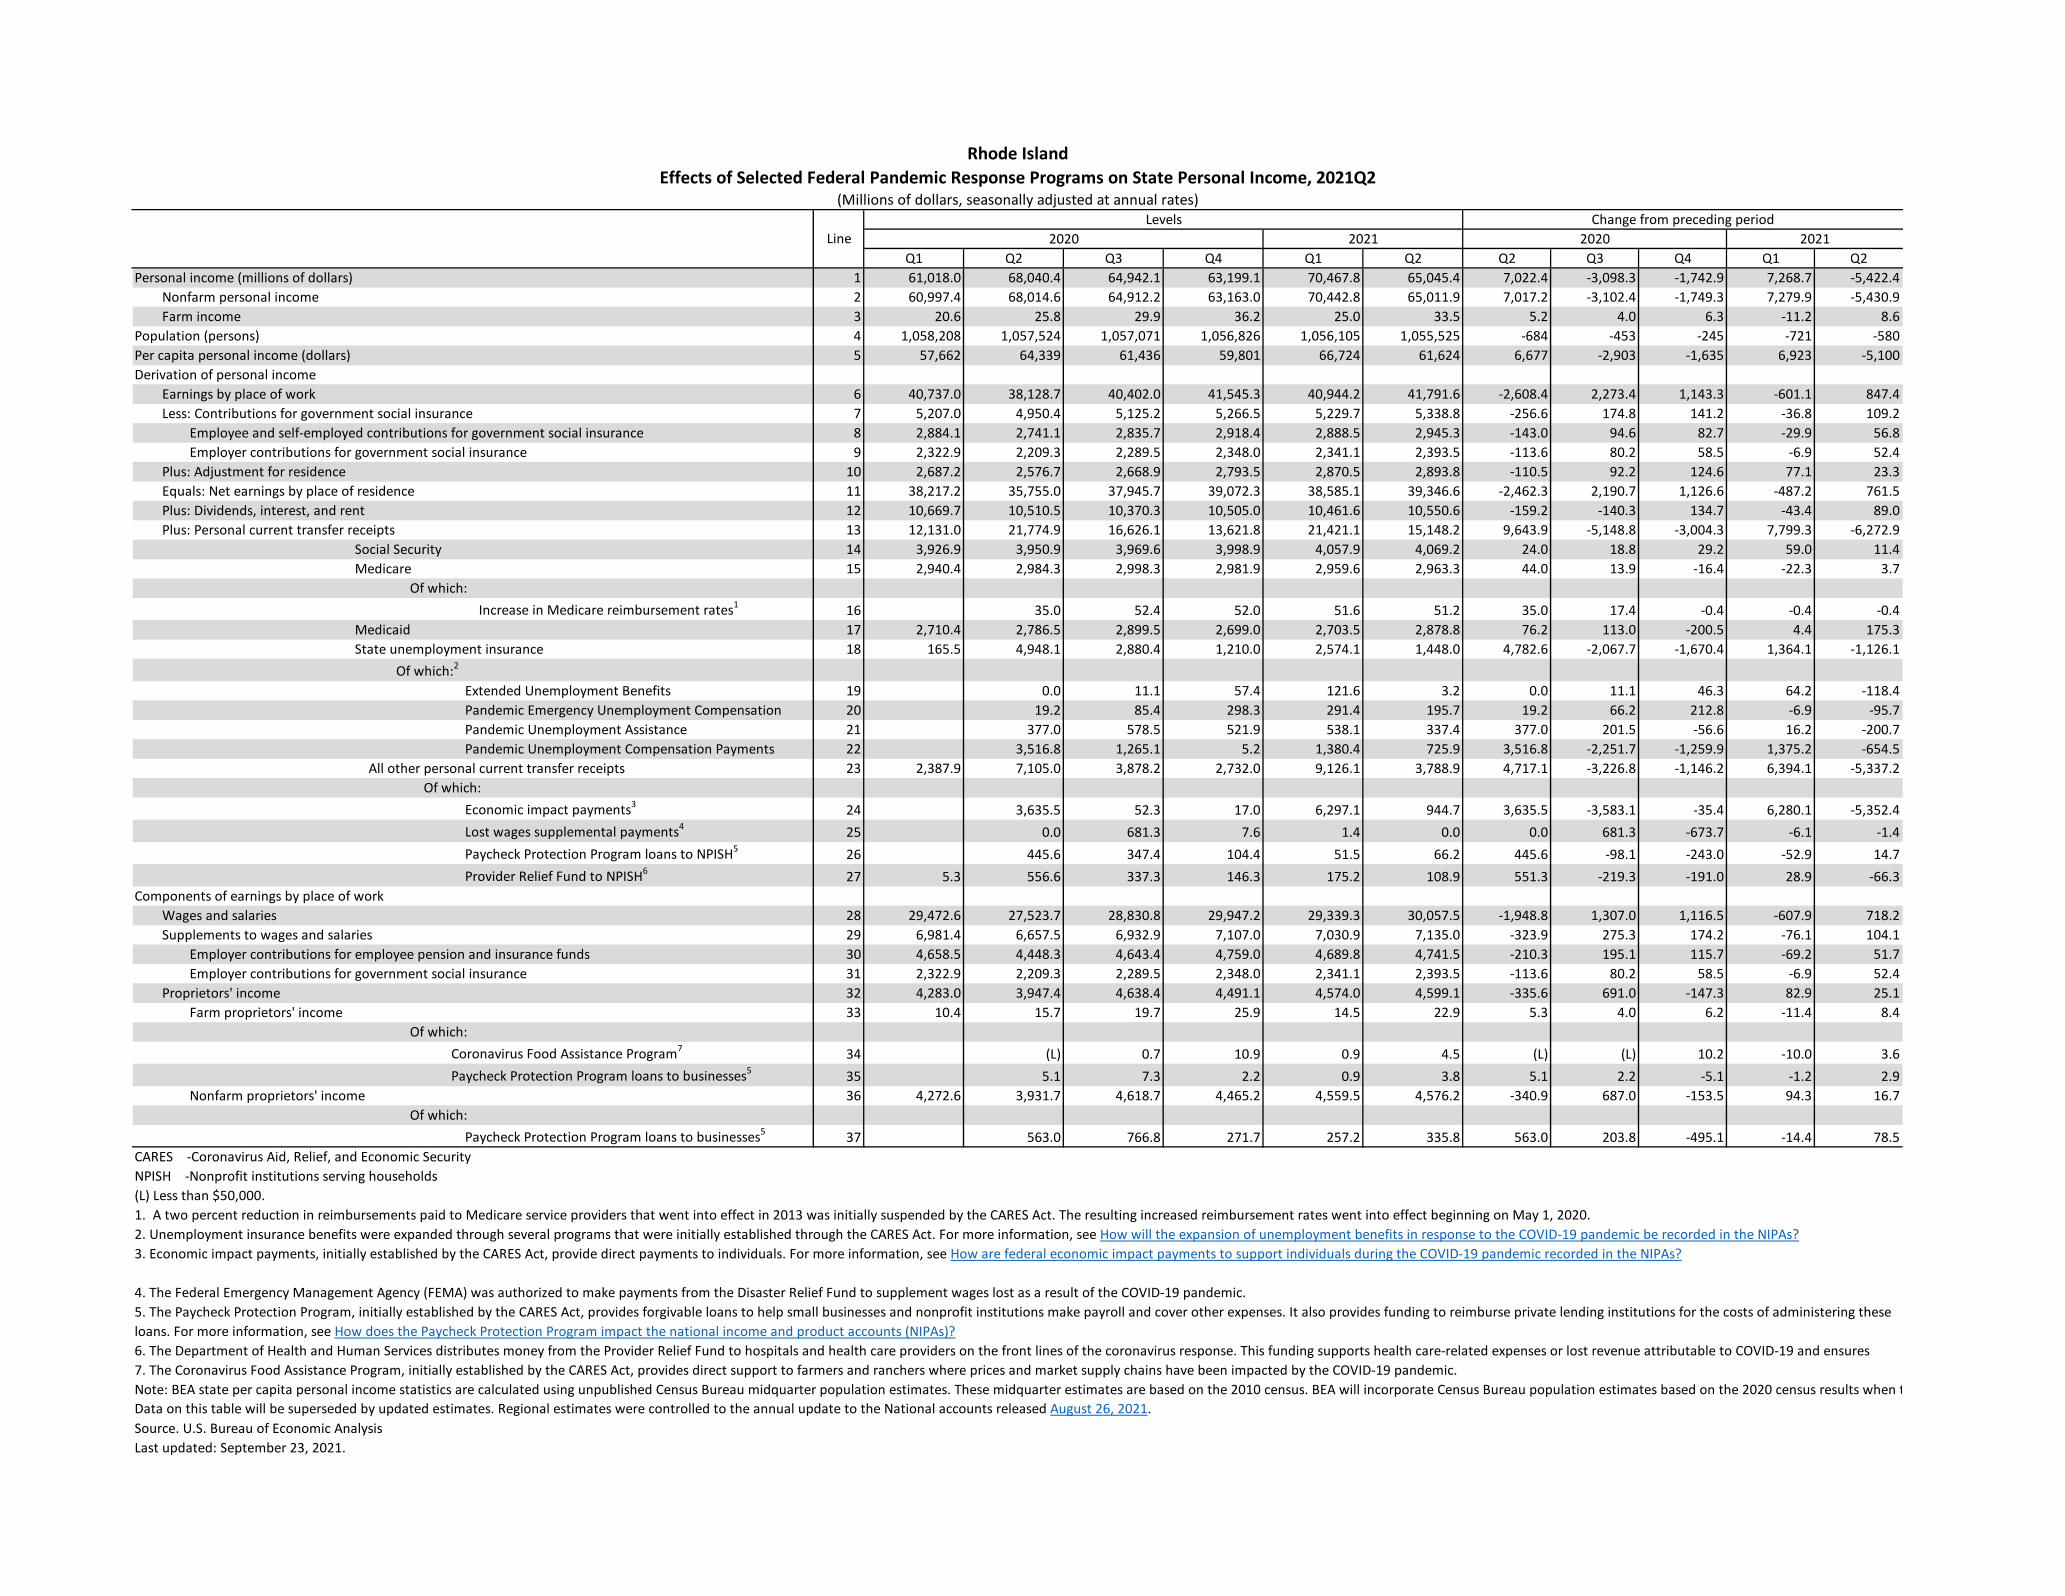
Q1 Q2 Q3 Q4 Q1 Q2 Q2 Q3 Q4 Q1 Q2Personal income (millions of dollars) 1 61,018.0 68,040.4 64,942.1 63,199.1 70,467.8 65,045.4 7,022.4 -3,098.3 -1,742.9 7,268.7 -5,422.4 Nonfarm personal income 2 60,997.4 68,014.6 64,912.2 63,163.0 70,442.8 65,011.9 7,017.2 -3,102.4 -1,749.3 7,279.9 -5,430.9 Farm income 3 20.6 25.8 29.9 36.2 25.0 33.5 5.2 4.0 6.3 -11.2 8.6Population (persons) 4 1,058,208 1,057,524 1,057,071 1,056,826 1,056,105 1,055,525 -684 -453 -245 -721 -580Per capita personal income (dollars) 5 57,662 64,339 61,436 59,801 66,724 61,624 6,677 -2,903 -1,635 6,923 -5,100Derivation of personal income Earnings by place of work 6 40,737.0 38,128.7 40,402.0 41,545.3 40,944.2 41,791.6 -2,608.4 2,273.4 1,143.3 -601.1 847.4 Less: Contributions for government social insurance 7 5,207.0 4,950.4 5,125.2 5,266.5 5,229.7 5,338.8 -256.6 174.8 141.2 -36.8 109.2 Employee and self-employed contributions for government social insurance 8 2,884.1 2,741.1 2,835.7 2,918.4 2,888.5 2,945.3 -143.0 94.6 82.7 -29.9 56.8 Employer contributions for government social insurance 9 2,322.9 2,209.3 2,289.5 2,348.0 2,341.1 2,393.5 -113.6 80.2 58.5 -6.9 52.4 Plus: Adjustment for residence 10 2,687.2 2,576.7 2,668.9 2,793.5 2,870.5 2,893.8 -110.5 92.2 124.6 77.1 23.3 Equals: Net earnings by place of residence 11 38,217.2 35,755.0 37,945.7 39,072.3 38,585.1 39,346.6 -2,462.3 2,190.7 1,126.6 -487.2 761.5 Plus: Dividends, interest, and rent 12 10,669.7 10,510.5 10,370.3 10,505.0 10,461.6 10,550.6 -159.2 -140.3 134.7 -43.4 89.0 Plus: Personal current transfer receipts 13 12,131.0 21,774.9 16,626.1 13,621.8 21,421.1 15,148.2 9,643.9 -5,148.8 -3,004.3 7,799.3 -6,272.9 Social Security 14 3,926.9 3,950.9 3,969.6 3,998.9 4,057.9 4,069.2 24.0 18.8 29.2 59.0 11.4 Medicare 15 2,940.4 2,984.3 2,998.3 2,981.9 2,959.6 2,963.3 44.0 13.9 -16.4 -22.3 3.7 Of which: Increase in Medicare reimbursement rates1 16 35.0 52.4 52.0 51.6 51.2 35.0 17.4 -0.4 -0.4 -0.4 Medicaid 17 2,710.4 2,786.5 2,899.5 2,699.0 2,703.5 2,878.8 76.2 113.0 -200.5 4.4 175.3 State unemployment insurance 18 165.5 4,948.1 2,880.4 1,210.0 2,574.1 1,448.0 4,782.6 -2,067.7 -1,670.4 1,364.1 -1,126.1 Of which:2
Extended Unemployment Benefits 19 0.0 11.1 57.4 121.6 3.2 0.0 11.1 46.3 64.2 -118.4 Pandemic Emergency Unemployment Compensation 20 19.2 85.4 298.3 291.4 195.7 19.2 66.2 212.8 -6.9 -95.7 Pandemic Unemployment Assistance 21 377.0 578.5 521.9 538.1 337.4 377.0 201.5 -56.6 16.2 -200.7 Pandemic Unemployment Compensation Payments 22 3,516.8 1,265.1 5.2 1,380.4 725.9 3,516.8 -2,251.7 -1,259.9 1,375.2 -654.5 All other personal current transfer receipts 23 2,387.9 7,105.0 3,878.2 2,732.0 9,126.1 3,788.9 4,717.1 -3,226.8 -1,146.2 6,394.1 -5,337.2 Of which: Economic impact payments3 24 3,635.5 52.3 17.0 6,297.1 944.7 3,635.5 -3,583.1 -35.4 6,280.1 -5,352.4 Lost wages supplemental payments4 25 0.0 681.3 7.6 1.4 0.0 0.0 681.3 -673.7 -6.1 -1.4 Paycheck Protection Program loans to NPISH5 26 445.6 347.4 104.4 51.5 66.2 445.6 -98.1 -243.0 -52.9 14.7 Provider Relief Fund to NPISH6 27 5.3 556.6 337.3 146.3 175.2 108.9 551.3 -219.3 -191.0 28.9 -66.3Components of earnings by place of work Wages and salaries 28 29,472.6 27,523.7 28,830.8 29,947.2 29,339.3 30,057.5 -1,948.8 1,307.0 1,116.5 -607.9 718.2 Supplements to wages and salaries 29 6,981.4 6,657.5 6,932.9 7,107.0 7,030.9 7,135.0 -323.9 275.3 174.2 -76.1 104.1 Employer contributions for employee pension and insurance funds 30 4,658.5 4,448.3 4,643.4 4,759.0 4,689.8 4,741.5 -210.3 195.1 115.7 -69.2 51.7 Employer contributions for government social insurance 31 2,322.9 2,209.3 2,289.5 2,348.0 2,341.1 2,393.5 -113.6 80.2 58.5 -6.9 52.4 Proprietors' income 32 4,283.0 3,947.4 4,638.4 4,491.1 4,574.0 4,599.1 -335.6 691.0 -147.3 82.9 25.1 Farm proprietors' income 33 10.4 15.7 19.7 25.9 14.5 22.9 5.3 4.0 6.2 -11.4 8.4 Of which: Coronavirus Food Assistance Program7 34 (L) 0.7 10.9 0.9 4.5 (L) (L) 10.2 -10.0 3.6 Paycheck Protection Program loans to businesses5 35 5.1 7.3 2.2 0.9 3.8 5.1 2.2 -5.1 -1.2 2.9 Nonfarm proprietors' income 36 4,272.6 3,931.7 4,618.7 4,465.2 4,559.5 4,576.2 -340.9 687.0 -153.5 94.3 16.7 Of which: Paycheck Protection Program loans to businesses5 37 563.0 766.8 271.7 257.2 335.8 563.0 203.8 -495.1 -14.4 78.5
Data on this table will be superseded by updated estimates. Regional estimates were controlled to the annual update to the National accounts released August 26, 2021.
2021 2020 2021
Effects of Selected Federal Pandemic Response Programs on State Personal Income, 2021Q2Rhode Island
(Millions of dollars, seasonally adjusted at annual rates)Levels Change from preceding period
NPISH -Nonprofit institutions serving households
Note: BEA state per capita personal income statistics are calculated using unpublished Census Bureau midquarter population estimates. These midquarter estimates are based on the 2010 census. BEA will incorporate Census Bureau population estimates based on the 2020 census results when t
Source. U.S. Bureau of Economic AnalysisLast updated: September 23, 2021.
Line
3. Economic impact payments, initially established by the CARES Act, provide direct payments to individuals. For more information, see How are federal economic impact payments to support individuals during the COVID-19 pandemic recorded in the NIPAs?
4. The Federal Emergency Management Agency (FEMA) was authorized to make payments from the Disaster Relief Fund to supplement wages lost as a result of the COVID-19 pandemic.5. The Paycheck Protection Program, initially established by the CARES Act, provides forgivable loans to help small businesses and nonprofit institutions make payroll and cover other expenses. It also provides funding to reimburse private lending institutions for the costs of administering these loans. For more information, see How does the Paycheck Protection Program impact the national income and product accounts (NIPAs)?6. The Department of Health and Human Services distributes money from the Provider Relief Fund to hospitals and health care providers on the front lines of the coronavirus response. This funding supports health care-related expenses or lost revenue attributable to COVID-19 and ensures 7. The Coronavirus Food Assistance Program, initially established by the CARES Act, provides direct support to farmers and ranchers where prices and market supply chains have been impacted by the COVID-19 pandemic.
CARES -Coronavirus Aid, Relief, and Economic Security
(L) Less than $50,000.1. A two percent reduction in reimbursements paid to Medicare service providers that went into effect in 2013 was initially suspended by the CARES Act. The resulting increased reimbursement rates went into effect beginning on May 1, 2020.2. Unemployment insurance benefits were expanded through several programs that were initially established through the CARES Act. For more information, see How will the expansion of unemployment benefits in response to the COVID-19 pandemic be recorded in the NIPAs?
2020

Q1 Q2 Q3 Q4 Q1 Q2 Q2 Q3 Q4 Q1 Q2Personal income (millions of dollars) 1 242,424.0 263,678.4 248,183.1 248,008.9 284,150.5 262,121.5 21,254.4 -15,495.3 -174.2 36,141.6 -22,028.9 Nonfarm personal income 2 242,042.6 263,581.1 247,931.4 247,574.8 283,851.3 261,723.2 21,538.6 -15,649.8 -356.6 36,276.5 -22,128.1 Farm income 3 381.5 97.2 251.7 434.1 299.2 398.3 -284.2 154.5 182.4 -135.0 99.1Population (persons) 4 5,198,709 5,211,779 5,226,660 5,243,144 5,256,371 5,270,105 13,070 14,881 16,484 13,227 13,734Per capita personal income (dollars) 5 46,632 50,593 47,484 47,302 54,058 49,737 3,961 -3,109 -182 6,756 -4,321Derivation of personal income Earnings by place of work 6 156,672.3 144,711.7 155,166.4 158,602.9 159,365.9 164,111.1 -11,960.7 10,454.7 3,436.6 762.9 4,745.3 Less: Contributions for government social insurance 7 18,811.5 17,808.0 18,523.6 19,005.0 19,334.7 19,662.5 -1,003.5 715.7 481.4 329.6 327.9 Employee and self-employed contributions for government social insurance 8 10,568.0 10,025.4 10,463.5 10,771.3 10,938.0 11,115.8 -542.6 438.1 307.7 166.8 177.7 Employer contributions for government social insurance 9 8,243.4 7,782.5 8,060.1 8,233.7 8,396.6 8,546.8 -460.9 277.6 173.6 162.9 150.2 Plus: Adjustment for residence 10 5,182.7 4,900.5 5,115.2 5,324.2 5,473.5 5,568.1 -282.1 214.6 209.0 149.3 94.6 Equals: Net earnings by place of residence 11 143,043.5 131,804.2 141,757.9 144,922.1 145,504.7 150,016.7 -11,239.3 9,953.7 3,164.2 582.6 4,512.0 Plus: Dividends, interest, and rent 12 46,585.8 45,817.7 45,230.3 46,027.6 46,070.1 46,637.0 -768.1 -587.4 797.3 42.5 566.9 Plus: Personal current transfer receipts 13 52,794.7 86,056.4 61,194.9 57,059.2 92,575.7 65,467.8 33,261.8 -24,861.6 -4,135.7 35,516.5 -27,107.9 Social Security 14 20,154.0 20,311.3 20,434.4 20,626.8 21,016.0 21,091.1 157.3 123.2 192.4 389.2 75.1 Medicare 15 13,713.7 13,958.3 14,038.3 13,952.3 13,822.2 13,844.3 244.5 80.0 -85.9 -130.1 22.0 Of which: Increase in Medicare reimbursement rates1 16 163.5 244.9 243.0 241.2 239.5 163.5 81.3 -1.8 -1.8 -1.7 Medicaid 17 6,234.9 6,705.8 7,022.8 6,714.9 6,822.6 7,036.3 470.9 317.0 -307.8 107.7 213.8 State unemployment insurance 18 280.1 12,122.5 4,439.4 1,977.0 4,269.3 3,448.6 11,842.4 -7,683.1 -2,462.4 2,292.3 -820.7 Of which:2
Extended Unemployment Benefits 19 0.0 56.9 137.4 1.6 1.3 0.0 56.9 80.5 -135.9 -0.3 Pandemic Emergency Unemployment Compensation 20 57.3 351.8 678.3 970.1 827.0 57.3 294.6 326.5 291.8 -143.1 Pandemic Unemployment Assistance 21 489.2 409.7 445.9 457.5 339.0 489.2 -79.5 36.2 11.6 -118.5 Pandemic Unemployment Compensation Payments 22 9,539.9 2,358.4 58.0 2,348.0 1,879.1 9,539.9 -7,181.5 -2,300.4 2,290.0 -468.9 All other personal current transfer receipts 23 12,412.0 32,958.7 15,260.0 13,788.1 46,645.6 20,047.5 20,546.7 -17,698.7 -1,471.9 32,857.5 -26,598.1 Of which: Economic impact payments3 24 17,687.3 255.2 82.8 31,953.0 4,793.7 17,687.3 -17,432.1 -172.4 31,870.2 -27,159.3 Lost wages supplemental payments4 25 0.0 744.2 381.9 17.6 12.3 0.0 744.2 -362.3 -364.3 -5.4 Paycheck Protection Program loans to NPISH5 26 543.4 755.3 227.0 91.9 131.2 543.4 211.9 -528.3 -135.1 39.3 Provider Relief Fund to NPISH6 27 15.7 1,659.0 572.8 225.5 414.5 257.6 1,643.3 -1,086.2 -347.2 188.9 -156.9Components of earnings by place of work Wages and salaries 28 112,427.2 104,183.2 109,650.3 113,690.0 114,269.1 116,675.3 -8,244.1 5,467.1 4,039.8 579.1 2,406.2 Supplements to wages and salaries 29 27,198.2 25,633.8 26,613.7 27,162.2 27,403.9 27,678.1 -1,564.4 979.9 548.4 241.7 274.2 Employer contributions for employee pension and insurance funds 30 18,954.8 17,851.3 18,553.6 18,928.4 19,007.3 19,131.3 -1,103.5 702.3 374.8 78.9 124.0 Employer contributions for government social insurance 31 8,243.4 7,782.5 8,060.1 8,233.7 8,396.6 8,546.8 -460.9 277.6 173.6 162.9 150.2 Proprietors' income 32 17,046.9 14,894.6 18,902.4 17,750.8 17,692.8 19,757.8 -2,152.2 4,007.7 -1,151.6 -57.9 2,064.9 Farm proprietors' income 33 287.0 3.3 157.4 338.5 201.4 299.3 -283.7 154.1 181.0 -137.0 97.8 Of which: Coronavirus Food Assistance Program7 34 56.9 57.2 172.5 1.7 18.7 56.9 0.3 115.3 -170.8 17.0 Paycheck Protection Program loans to businesses5 35 43.0 61.1 18.4 11.2 30.3 43.0 18.1 -42.7 -7.2 19.1 Nonfarm proprietors' income 36 16,759.9 14,891.3 18,744.9 17,412.3 17,491.4 19,458.5 -1,868.6 3,853.6 -1,332.6 79.1 1,967.1 Of which: Paycheck Protection Program loans to businesses5 37 1,680.7 3,647.2 818.5 943.9 3,079.6 1,680.7 1,966.5 -2,828.7 125.4 2,135.7
Data on this table will be superseded by updated estimates. Regional estimates were controlled to the annual update to the National accounts released August 26, 2021.
2020 2021
Effects of Selected Federal Pandemic Response Programs on State Personal Income, 2021Q2South Carolina
(Millions of dollars, seasonally adjusted at annual rates)Levels Change from preceding period
Note: BEA state per capita personal income statistics are calculated using unpublished Census Bureau midquarter population estimates. These midquarter estimates are based on the 2010 census. BEA will incorporate Census Bureau population estimates based on the 2020 census results wh
Source. U.S. Bureau of Economic AnalysisLast updated: September 23, 2021.
Line
3. Economic impact payments, initially established by the CARES Act, provide direct payments to individuals. For more information, see How are federal economic impact payments to support individuals during the COVID-19 pandemic recorded in the NIPAs?4. The Federal Emergency Management Agency (FEMA) was authorized to make payments from the Disaster Relief Fund to supplement wages lost as a result of the COVID-19 pandemic.5. The Paycheck Protection Program, initially established by the CARES Act, provides forgivable loans to help small businesses and nonprofit institutions make payroll and cover other expenses. It also provides funding to reimburse private lending institutions for the costs of administering these loans. For more information, see How does the Paycheck Protection Program impact the national income and product accounts (NIPAs)?6. The Department of Health and Human Services distributes money from the Provider Relief Fund to hospitals and health care providers on the front lines of the coronavirus response. This funding supports health care-related expenses or lost revenue attributable to COVID-19 and ensures uninsured Americans can get treatment for COVID-19. In the NIPAs, funds provided to nonprofit hospitals are recorded as social benefits.7. The Coronavirus Food Assistance Program, initially established by the CARES Act, provides direct support to farmers and ranchers where prices and market supply chains have been impacted by the COVID-19 pandemic.
CARES -Coronavirus Aid, Relief, and Economic SecurityNPISH -Nonprofit institutions serving households1. A two percent reduction in reimbursements paid to Medicare service providers that went into effect in 2013 was initially suspended by the CARES Act. The resulting increased reimbursement rates went into effect beginning on May 1, 2020.2. Unemployment insurance benefits were expanded through several programs that were initially established through the CARES Act. For more information, see How will the expansion of unemployment benefits in response to the COVID-19 pandemic be recorded in the NIPAs?
2020 2021

Q1 Q2 Q3 Q4 Q1 Q2 Q2 Q3 Q4 Q1 Q2Personal income (millions of dollars) 1 51,399.2 54,449.0 51,609.7 54,224.8 58,983.0 55,999.3 3,049.8 -2,839.3 2,615.1 4,758.2 -2,983.7 Nonfarm personal income 2 48,859.1 51,628.0 48,432.9 49,386.7 55,426.6 51,018.7 2,768.9 -3,195.1 953.8 6,039.8 -4,407.8 Farm income 3 2,540.1 2,821.1 3,176.8 4,838.1 3,556.4 4,980.6 280.9 355.8 1,661.3 -1,281.7 1,424.2Population (persons) 4 891,075 892,182 893,369 894,597 895,568 896,770 1,107 1,187 1,228 971 1,202Per capita personal income (dollars) 5 57,682 61,029 57,770 60,614 65,861 62,446 3,347 -3,259 2,844 5,247 -3,415Derivation of personal income Earnings by place of work 6 35,970.3 33,532.5 35,555.6 38,777.0 37,267.4 38,959.0 -2,437.7 2,023.1 3,221.4 -1,509.6 1,691.6 Less: Contributions for government social insurance 7 3,790.9 3,655.3 3,814.9 3,928.2 3,934.1 3,970.3 -135.5 159.6 113.3 5.9 36.2 Employee and self-employed contributions for government social insurance 8 2,152.2 2,059.1 2,144.5 2,208.8 2,203.7 2,223.1 -93.1 85.4 64.3 -5.2 19.4 Employer contributions for government social insurance 9 1,638.7 1,596.2 1,670.4 1,719.3 1,730.4 1,747.2 -42.5 74.2 48.9 11.1 16.7 Plus: Adjustment for residence 10 -158.5 -146.7 -155.3 -160.9 -147.2 -147.1 11.8 -8.7 -5.6 13.7 0.1 Equals: Net earnings by place of residence 11 32,020.9 29,730.5 31,585.3 34,687.9 33,186.1 34,841.6 -2,290.5 1,854.8 3,102.6 -1,501.8 1,655.5 Plus: Dividends, interest, and rent 12 11,558.6 11,318.7 11,155.3 11,288.0 11,346.1 11,470.2 -240.0 -163.4 132.7 58.1 124.1 Plus: Personal current transfer receipts 13 7,819.7 13,399.9 8,869.2 8,249.0 14,450.8 9,687.5 5,580.2 -4,530.7 -620.2 6,201.8 -4,763.3 Social Security 14 2,993.8 3,016.7 3,034.5 3,061.9 3,116.9 3,127.5 22.9 17.8 27.4 55.0 10.6 Medicare 15 2,032.2 2,066.5 2,077.6 2,065.3 2,047.3 2,050.3 34.3 11.1 -12.3 -18.1 3.0 Of which: Increase in Medicare reimbursement rates1 16 24.2 36.3 36.0 35.7 35.5 24.2 12.0 -0.3 -0.3 -0.3 Medicaid 17 877.8 922.3 982.5 948.6 954.5 1,007.0 44.5 60.2 -33.9 5.9 52.5 State unemployment insurance 18 39.6 820.1 394.6 93.1 133.2 97.6 780.5 -425.5 -301.5 40.1 -35.6 Of which:2
Extended Unemployment Benefits 19 0.0 0.0 0.1 0.1 0.0 0.0 0.0 0.1 0.1 -0.1 Pandemic Emergency Unemployment Compensation 20 1.6 5.1 10.6 15.8 17.4 1.6 3.5 5.5 5.2 1.7 Pandemic Unemployment Assistance 21 20.3 34.8 19.4 4.1 4.9 20.3 14.4 -15.4 -15.4 0.8 Pandemic Unemployment Compensation Payments 22 599.9 226.1 7.7 75.8 43.2 599.9 -373.8 -218.4 68.1 -32.6 All other personal current transfer receipts 23 1,876.2 6,574.3 2,379.9 2,080.1 8,199.0 3,405.1 4,698.0 -4,194.4 -299.8 6,118.9 -4,793.8 Of which: Economic impact payments3 24 3,179.0 45.9 14.9 5,687.9 853.3 3,179.0 -3,133.1 -31.0 5,673.0 -4,834.6 Lost wages supplemental payments4 25 0.0 0.0 0.0 0.0 0.0 0.0 0.0 0.0 0.0 0.0 Paycheck Protection Program loans to NPISH5 26 286.1 53.0 15.9 29.5 41.0 286.1 -233.1 -37.1 13.5 11.5 Provider Relief Fund to NPISH6 27 10.4 1,103.8 301.0 80.6 250.7 155.8 1,093.4 -802.8 -220.4 170.1 -94.9Components of earnings by place of work Wages and salaries 28 22,084.6 20,635.6 21,666.6 22,474.3 22,194.4 22,496.5 -1,449.0 1,031.0 807.7 -279.9 302.1 Supplements to wages and salaries 29 5,334.5 5,060.8 5,239.0 5,360.4 5,332.0 5,350.1 -273.6 178.1 121.4 -28.5 18.2 Employer contributions for employee pension and insurance funds 30 3,695.8 3,464.6 3,568.6 3,641.1 3,601.5 3,603.0 -231.2 104.0 72.5 -39.6 1.4 Employer contributions for government social insurance 31 1,638.7 1,596.2 1,670.4 1,719.3 1,730.4 1,747.2 -42.5 74.2 48.9 11.1 16.7 Proprietors' income 32 8,551.2 7,836.1 8,650.0 10,942.3 9,741.1 11,112.4 -715.1 813.9 2,292.3 -1,201.3 1,371.3 Farm proprietors' income 33 2,290.8 2,573.6 2,928.6 4,586.3 3,299.2 4,719.8 282.8 354.9 1,657.7 -1,287.1 1,420.6 Of which: Coronavirus Food Assistance Program7 34 882.5 786.5 1,934.6 10.2 7.5 882.5 -96.0 1,148.1 -1,924.3 -2.8 Paycheck Protection Program loans to businesses5 35 93.3 132.6 39.8 237.1 546.9 93.3 39.3 -92.7 197.3 309.8 Nonfarm proprietors' income 36 6,260.4 5,262.5 5,721.5 6,356.0 6,441.8 6,392.6 -997.9 459.0 634.6 85.8 -49.3 Of which: Paycheck Protection Program loans to businesses5 37 435.6 224.0 330.1 233.2 287.7 435.6 -211.6 106.1 -97.0 54.5
Data on this table will be superseded by updated estimates. Regional estimates were controlled to the annual update to the National accounts released August 26, 2021.
2020 2021
Effects of Selected Federal Pandemic Response Programs on State Personal Income, 2021Q2South Dakota
(Millions of dollars, seasonally adjusted at annual rates)Levels Change from preceding period
Note: BEA state per capita personal income statistics are calculated using unpublished Census Bureau midquarter population estimates. These midquarter estimates are based on the 2010 census. BEA will incorporate Census Bureau population estimates based on the 2020 census results wh
Source. U.S. Bureau of Economic AnalysisLast updated: September 23, 2021.
Line
3. Economic impact payments, initially established by the CARES Act, provide direct payments to individuals. For more information, see How are federal economic impact payments to support individuals during the COVID-19 pandemic recorded in the NIPAs?4. The Federal Emergency Management Agency (FEMA) was authorized to make payments from the Disaster Relief Fund to supplement wages lost as a result of the COVID-19 pandemic.5. The Paycheck Protection Program, initially established by the CARES Act, provides forgivable loans to help small businesses and nonprofit institutions make payroll and cover other expenses. It also provides funding to reimburse private lending institutions for the costs of administering these loans. For more information, see How does the Paycheck Protection Program impact the national income and product accounts (NIPAs)?6. The Department of Health and Human Services distributes money from the Provider Relief Fund to hospitals and health care providers on the front lines of the coronavirus response. This funding supports health care-related expenses or lost revenue attributable to COVID-19 and ensures uninsured Americans can get treatment for COVID-19. In the NIPAs, funds provided to nonprofit hospitals are recorded as social benefits.7. The Coronavirus Food Assistance Program, initially established by the CARES Act, provides direct support to farmers and ranchers where prices and market supply chains have been impacted by the COVID-19 pandemic.
CARES -Coronavirus Aid, Relief, and Economic SecurityNPISH -Nonprofit institutions serving households1. A two percent reduction in reimbursements paid to Medicare service providers that went into effect in 2013 was initially suspended by the CARES Act. The resulting increased reimbursement rates went into effect beginning on May 1, 2020.2. Unemployment insurance benefits were expanded through several programs that were initially established through the CARES Act. For more information, see How will the expansion of unemployment benefits in response to the COVID-19 pandemic be recorded in the NIPAs?
2020 2021

Q1 Q2 Q3 Q4 Q1 Q2 Q2 Q3 Q4 Q1 Q2Personal income (millions of dollars) 1 342,779.9 364,158.4 350,696.9 348,550.1 399,758.7 369,916.1 21,378.5 -13,461.5 -2,146.8 51,208.6 -29,842.6 Nonfarm personal income 2 342,522.7 363,982.0 350,390.9 347,784.2 399,340.8 369,106.2 21,459.4 -13,591.2 -2,606.7 51,556.7 -30,234.6 Farm income 3 257.2 176.3 306.0 765.9 417.9 809.9 -80.9 129.7 460.0 -348.1 392.0Population (persons) 4 6,869,301 6,881,164 6,895,106 6,910,829 6,922,373 6,935,011 11,863 13,942 15,723 11,544 12,638Per capita personal income (dollars) 5 49,900 52,921 50,862 50,435 57,749 53,340 3,021 -2,059 -427 7,314 -4,409Derivation of personal income Earnings by place of work 6 254,089.4 231,960.4 249,491.3 256,998.8 262,476.2 268,376.8 -22,129.0 17,531.0 7,507.4 5,477.4 5,900.6 Less: Contributions for government social insurance 7 27,499.5 26,213.7 27,389.5 28,252.2 29,328.2 29,807.8 -1,285.8 1,175.8 862.7 1,076.1 479.6 Employee and self-employed contributions for government social insurance 8 15,737.1 14,928.0 15,579.2 16,083.2 16,685.1 16,943.3 -809.1 651.2 504.0 602.0 258.2 Employer contributions for government social insurance 9 11,762.4 11,285.8 11,810.3 12,169.0 12,643.1 12,864.5 -476.7 524.5 358.7 474.1 221.4 Plus: Adjustment for residence 10 -2,181.5 -1,983.3 -2,113.9 -2,215.2 -2,411.8 -2,471.6 198.2 -130.6 -101.3 -196.6 -59.8 Equals: Net earnings by place of residence 11 224,408.4 203,763.3 219,987.9 226,531.4 230,736.1 236,097.4 -20,645.1 16,224.6 6,543.5 4,204.8 5,361.3 Plus: Dividends, interest, and rent 12 50,323.7 49,373.5 48,735.2 49,406.1 49,551.2 50,106.8 -950.2 -638.4 670.9 145.1 555.5 Plus: Personal current transfer receipts 13 68,047.8 111,021.5 81,973.8 72,612.6 119,471.3 83,711.9 42,973.7 -29,047.7 -9,361.1 46,858.7 -35,759.4 Social Security 14 24,683.2 24,842.8 24,967.8 25,163.1 25,558.0 25,634.3 159.6 125.0 195.3 394.9 76.2 Medicare 15 17,335.1 17,612.8 17,703.8 17,606.3 17,466.7 17,490.0 277.7 90.9 -97.5 -139.6 23.2 Of which: Increase in Medicare reimbursement rates1 16 206.4 309.1 306.8 304.5 302.3 206.4 102.7 -2.3 -2.3 -2.1 Medicaid 17 10,304.3 10,374.7 11,269.5 10,589.3 10,661.9 11,131.5 70.4 894.8 -680.2 72.6 469.7 State unemployment insurance 18 417.6 13,377.3 7,727.1 1,789.0 3,904.8 3,842.4 12,959.7 -5,650.2 -5,938.1 2,115.8 -62.4 Of which:2
Extended Unemployment Benefits 19 0.0 10.4 12.9 0.1 0.2 0.0 10.4 2.5 -12.7 0.0 Pandemic Emergency Unemployment Compensation 20 21.7 181.7 362.1 690.3 654.4 21.7 160.0 180.4 328.2 -35.9 Pandemic Unemployment Assistance 21 452.7 849.6 499.5 500.1 457.1 452.7 396.8 -350.1 0.6 -43.0 Pandemic Unemployment Compensation Payments 22 10,356.4 4,767.5 68.8 2,178.8 2,253.0 10,356.4 -5,589.0 -4,698.6 2,110.0 74.2 All other personal current transfer receipts 23 15,307.6 44,813.9 20,305.6 17,465.0 61,880.0 25,613.7 29,506.3 -24,508.2 -2,840.6 44,414.9 -36,266.2 Of which: Economic impact payments3 24 23,960.3 345.5 112.1 43,133.3 6,471.0 23,960.3 -23,614.8 -233.4 43,021.3 -36,662.3 Lost wages supplemental payments4 25 0.0 1,647.3 97.4 31.2 12.7 0.0 1,647.3 -1,549.9 -66.1 -18.6 Paycheck Protection Program loans to NPISH5 26 979.5 1,167.0 350.7 165.7 217.8 979.5 187.4 -816.3 -184.9 52.0 Provider Relief Fund to NPISH6 27 34.9 3,681.9 1,008.0 787.1 923.8 574.1 3,647.0 -2,673.8 -220.9 136.7 -349.7Components of earnings by place of work Wages and salaries 28 170,732.0 158,370.2 166,819.3 173,537.0 178,178.0 181,795.6 -12,361.8 8,449.1 6,717.7 4,641.0 3,617.6 Supplements to wages and salaries 29 36,683.5 34,897.7 36,451.6 37,427.0 38,471.7 38,858.7 -1,785.8 1,553.9 975.4 1,044.7 387.0 Employer contributions for employee pension and insurance funds 30 24,921.0 23,611.9 24,641.3 25,258.0 25,828.6 25,994.2 -1,309.1 1,029.4 616.7 570.6 165.6 Employer contributions for government social insurance 31 11,762.4 11,285.8 11,810.3 12,169.0 12,643.1 12,864.5 -476.7 524.5 358.7 474.1 221.4 Proprietors' income 32 46,674.0 38,692.5 46,220.5 46,034.8 45,826.5 47,722.5 -7,981.5 7,528.0 -185.7 -208.3 1,896.0 Farm proprietors' income 33 78.7 -0.5 128.8 586.4 234.5 624.0 -79.2 129.3 457.6 -351.9 389.5 Of which: Coronavirus Food Assistance Program7 34 238.8 221.5 542.2 4.7 24.6 238.8 -17.2 320.7 -537.5 19.9 Paycheck Protection Program loans to businesses5 35 46.7 66.3 19.9 62.1 153.7 46.7 19.6 -46.4 42.2 91.5 Nonfarm proprietors' income 36 46,595.2 38,693.0 46,091.6 45,448.4 45,592.0 47,098.5 -7,902.2 7,398.6 -643.2 143.6 1,506.5 Of which: Paycheck Protection Program loans to businesses5 37 7,761.1 8,086.1 3,174.1 1,697.4 4,169.9 7,761.1 325.0 -4,911.9 -1,476.7 2,472.5
Data on this table will be superseded by updated estimates. Regional estimates were controlled to the annual update to the National accounts released August 26, 2021.
2020 2021
Effects of Selected Federal Pandemic Response Programs on State Personal Income, 2021Q2Tennessee
(Millions of dollars, seasonally adjusted at annual rates)Levels Change from preceding period
Note: BEA state per capita personal income statistics are calculated using unpublished Census Bureau midquarter population estimates. These midquarter estimates are based on the 2010 census. BEA will incorporate Census Bureau population estimates based on the 2020 census results wh
Source. U.S. Bureau of Economic AnalysisLast updated: September 23, 2021.
Line
3. Economic impact payments, initially established by the CARES Act, provide direct payments to individuals. For more information, see How are federal economic impact payments to support individuals during the COVID-19 pandemic recorded in the NIPAs?4. The Federal Emergency Management Agency (FEMA) was authorized to make payments from the Disaster Relief Fund to supplement wages lost as a result of the COVID-19 pandemic.5. The Paycheck Protection Program, initially established by the CARES Act, provides forgivable loans to help small businesses and nonprofit institutions make payroll and cover other expenses. It also provides funding to reimburse private lending institutions for the costs of administering these loans. For more information, see How does the Paycheck Protection Program impact the national income and product accounts (NIPAs)?6. The Department of Health and Human Services distributes money from the Provider Relief Fund to hospitals and health care providers on the front lines of the coronavirus response. This funding supports health care-related expenses or lost revenue attributable to COVID-19 and ensures uninsured Americans can get treatment for COVID-19. In the NIPAs, funds provided to nonprofit hospitals are recorded as social benefits.7. The Coronavirus Food Assistance Program, initially established by the CARES Act, provides direct support to farmers and ranchers where prices and market supply chains have been impacted by the COVID-19 pandemic.
CARES -Coronavirus Aid, Relief, and Economic SecurityNPISH -Nonprofit institutions serving households1. A two percent reduction in reimbursements paid to Medicare service providers that went into effect in 2013 was initially suspended by the CARES Act. The resulting increased reimbursement rates went into effect beginning on May 1, 2020.2. Unemployment insurance benefits were expanded through several programs that were initially established through the CARES Act. For more information, see How will the expansion of unemployment benefits in response to the COVID-19 pandemic be recorded in the NIPAs?
2020 2021

Q1 Q2 Q3 Q4 Q1 Q2 Q2 Q3 Q4 Q1 Q2Personal income (millions of dollars) 1 1,570,524.9 1,659,472.7 1,628,647.2 1,615,895.7 1,822,541.0 1,714,493.9 88,947.8 -30,825.5 -12,751.5 206,645.3 -108,047.1 Nonfarm personal income 2 1,566,151.7 1,657,370.1 1,624,310.2 1,609,993.3 1,819,564.5 1,710,334.2 91,218.4 -33,059.9 -14,316.9 209,571.2 -109,230.3 Farm income 3 4,373.2 2,102.6 4,337.1 5,902.4 2,976.5 4,159.7 -2,270.6 2,234.4 1,565.3 -2,925.9 1,183.2Population (persons) 4 29,239,757 29,322,694 29,406,563 29,495,549 29,578,917 29,665,740 82,937 83,869 88,986 83,368 86,823Per capita personal income (dollars) 5 53,712 56,593 55,384 54,784 61,616 57,794 2,881 -1,209 -600 6,832 -3,822Derivation of personal income Earnings by place of work 6 1,162,680.5 1,079,409.7 1,151,551.1 1,180,914.4 1,194,094.6 1,229,352.2 -83,270.7 72,141.4 29,363.3 13,180.2 35,257.6 Less: Contributions for government social insurance 7 116,249.9 110,713.5 114,782.4 118,200.5 120,641.0 122,906.8 -5,536.4 4,068.9 3,418.1 2,440.5 2,265.8 Employee and self-employed contributions for government social insurance 8 62,913.2 59,794.6 61,931.7 63,848.0 65,072.6 66,261.6 -3,118.6 2,137.0 1,916.3 1,224.6 1,189.0 Employer contributions for government social insurance 9 53,336.7 50,918.9 52,850.8 54,352.5 55,568.4 56,645.3 -2,417.8 1,931.9 1,501.8 1,215.9 1,076.8 Plus: Adjustment for residence 10 -2,214.6 -2,061.0 -2,138.8 -2,232.0 -2,278.4 -2,352.6 153.6 -77.8 -93.2 -46.4 -74.3 Equals: Net earnings by place of residence 11 1,044,215.9 966,635.2 1,034,629.9 1,060,481.8 1,071,175.2 1,104,092.7 -77,580.7 67,994.6 25,852.0 10,693.4 32,917.5 Plus: Dividends, interest, and rent 12 292,090.7 286,368.8 281,807.8 286,002.9 285,567.6 288,682.5 -5,721.8 -4,561.1 4,195.2 -435.4 3,114.9 Plus: Personal current transfer receipts 13 234,218.3 406,468.6 312,209.6 269,410.9 465,798.2 321,718.7 172,250.3 -94,259.0 -42,798.6 196,387.3 -144,079.5 Social Security 14 71,901.2 72,473.5 72,920.3 73,608.6 74,991.7 75,258.7 572.3 446.8 688.4 1,383.1 267.0 Medicare 15 60,059.6 61,171.4 61,545.2 61,174.6 60,596.1 60,694.2 1,111.8 373.8 -370.6 -578.5 98.1 Of which: Increase in Medicare reimbursement rates1 16 716.8 1,073.2 1,065.2 1,057.2 1,049.7 716.8 356.5 -8.0 -8.0 -7.4 Medicaid 17 37,690.4 42,648.0 45,174.3 44,649.4 46,449.3 46,430.0 4,957.5 2,526.3 -524.9 1,799.9 -19.2 State unemployment insurance 18 3,544.7 63,728.9 49,069.3 22,290.5 38,291.2 37,137.1 60,184.2 -14,659.5 -26,778.8 16,000.6 -1,154.1 Of which:2
Extended Unemployment Benefits 19 0.0 532.5 1,811.9 3,029.1 191.4 0.0 532.5 1,279.4 1,217.2 -2,837.7 Pandemic Emergency Unemployment Compensation 20 559.5 2,844.8 6,827.1 7,439.8 10,686.1 559.5 2,285.2 3,982.3 612.7 3,246.3 Pandemic Unemployment Assistance 21 2,862.8 5,711.9 6,040.3 4,681.3 4,529.2 2,862.8 2,849.1 328.5 -1,359.0 -152.1 Pandemic Unemployment Compensation Payments 22 40,857.0 26,090.0 514.5 17,698.9 17,000.5 40,857.0 -14,767.0 -25,575.5 17,184.4 -698.4 All other personal current transfer receipts 23 61,022.3 166,446.9 83,500.5 67,687.8 245,470.0 102,198.8 105,424.5 -82,946.4 -15,812.7 177,782.2 -143,271.2 Of which: Economic impact payments3 24 91,378.5 1,321.3 428.6 171,645.6 25,750.8 91,378.5 -90,057.2 -892.8 171,217.1 -145,894.8 Lost wages supplemental payments4 25 0.0 11,283.7 441.9 51.4 38.4 0.0 11,283.7 -10,841.8 -390.5 -13.0 Paycheck Protection Program loans to NPISH5 26 3,275.9 3,381.7 1,016.2 713.2 751.9 3,275.9 105.8 -2,365.5 -303.0 38.7 Provider Relief Fund to NPISH6 27 67.1 7,087.3 3,480.3 2,077.5 2,130.5 1,324.1 7,020.2 -3,607.0 -1,402.7 53.0 -806.4Components of earnings by place of work Wages and salaries 28 808,996.2 752,023.3 786,369.5 817,039.6 824,180.9 843,243.4 -56,972.9 34,346.2 30,670.1 7,141.3 19,062.5 Supplements to wages and salaries 29 167,255.3 159,086.6 165,000.0 169,135.1 171,587.9 173,373.8 -8,168.7 5,913.4 4,135.0 2,452.8 1,785.9 Employer contributions for employee pension and insurance funds 30 113,918.7 108,167.8 112,149.3 114,782.5 116,019.5 116,728.5 -5,750.9 3,981.5 2,633.2 1,236.9 709.0 Employer contributions for government social insurance 31 53,336.7 50,918.9 52,850.8 54,352.5 55,568.4 56,645.3 -2,417.8 1,931.9 1,501.8 1,215.9 1,076.8 Proprietors' income 32 186,428.9 168,299.8 200,181.5 194,739.6 198,325.8 212,735.0 -18,129.1 31,881.7 -5,441.9 3,586.1 14,409.2 Farm proprietors' income 33 3,393.0 1,125.8 3,354.5 4,904.7 1,957.3 3,126.8 -2,267.2 2,228.7 1,550.2 -2,947.4 1,169.5 Of which: Coronavirus Food Assistance Program7 34 834.6 1,338.5 2,445.7 49.2 102.9 834.6 503.9 1,107.2 -2,396.5 53.7 Paycheck Protection Program loans to businesses5 35 293.8 417.3 125.4 208.5 516.7 293.8 123.5 -291.9 83.1 308.2 Nonfarm proprietors' income 36 183,035.8 167,174.0 196,827.0 189,834.9 196,368.5 209,608.2 -15,861.9 29,653.0 -6,992.1 6,533.5 13,239.7 Of which: Paycheck Protection Program loans to businesses5 37 21,263.7 31,157.1 9,135.9 8,071.3 17,851.3 21,263.7 9,893.3 -22,021.1 -1,064.6 9,780.0
Data on this table will be superseded by updated estimates. Regional estimates were controlled to the annual update to the National accounts released August 26, 2021.
2020 2021
Effects of Selected Federal Pandemic Response Programs on State Personal Income, 2021Q2Texas
(Millions of dollars, seasonally adjusted at annual rates)Levels Change from preceding period
Note: BEA state per capita personal income statistics are calculated using unpublished Census Bureau midquarter population estimates. These midquarter estimates are based on the 2010 census. BEA will incorporate Census Bureau population estimates based on the 2020 census results wh
Source. U.S. Bureau of Economic AnalysisLast updated: September 23, 2021.
Line
3. Economic impact payments, initially established by the CARES Act, provide direct payments to individuals. For more information, see How are federal economic impact payments to support individuals during the COVID-19 pandemic recorded in the NIPAs?4. The Federal Emergency Management Agency (FEMA) was authorized to make payments from the Disaster Relief Fund to supplement wages lost as a result of the COVID-19 pandemic.5. The Paycheck Protection Program, initially established by the CARES Act, provides forgivable loans to help small businesses and nonprofit institutions make payroll and cover other expenses. It also provides funding to reimburse private lending institutions for the costs of administering these loans. For more information, see How does the Paycheck Protection Program impact the national income and product accounts (NIPAs)?6. The Department of Health and Human Services distributes money from the Provider Relief Fund to hospitals and health care providers on the front lines of the coronavirus response. This funding supports health care-related expenses or lost revenue attributable to COVID-19 and ensures uninsured Americans can get treatment for COVID-19. In the NIPAs, funds provided to nonprofit hospitals are recorded as social benefits.7. The Coronavirus Food Assistance Program, initially established by the CARES Act, provides direct support to farmers and ranchers where prices and market supply chains have been impacted by the COVID-19 pandemic.
CARES -Coronavirus Aid, Relief, and Economic SecurityNPISH -Nonprofit institutions serving households1. A two percent reduction in reimbursements paid to Medicare service providers that went into effect in 2013 was initially suspended by the CARES Act. The resulting increased reimbursement rates went into effect beginning on May 1, 2020.2. Unemployment insurance benefits were expanded through several programs that were initially established through the CARES Act. For more information, see How will the expansion of unemployment benefits in response to the COVID-19 pandemic be recorded in the NIPAs?
2020 2021

Q1 Q2 Q3 Q4 Q1 Q2 Q2 Q3 Q4 Q1 Q2Personal income (millions of dollars) 1 166,006.4 175,132.0 167,365.7 170,121.3 190,018.7 176,103.5 9,125.5 -7,766.2 2,755.6 19,897.4 -13,915.2 Nonfarm personal income 2 165,423.4 174,579.9 166,662.8 169,286.3 189,471.6 175,449.1 9,156.5 -7,917.1 2,623.5 20,185.3 -14,022.4 Farm income 3 583.0 552.1 702.9 835.0 547.2 654.4 -30.9 150.9 132.1 -287.9 107.2Population (persons) 4 3,233,763 3,244,602 3,255,803 3,267,452 3,277,945 3,289,256 10,839 11,201 11,649 10,493 11,311Per capita personal income (dollars) 5 51,335 53,976 51,405 52,065 57,969 53,539 2,641 -2,571 660 5,904 -4,430Derivation of personal income Earnings by place of work 6 124,533.3 118,120.7 123,470.5 127,493.4 126,833.5 128,850.5 -6,412.6 5,349.8 4,022.9 -659.9 2,017.0 Less: Contributions for government social insurance 7 13,988.5 13,337.9 13,833.2 14,232.2 14,338.2 14,578.3 -650.7 495.3 399.0 106.0 240.1 Employee and self-employed contributions for government social insurance 8 7,496.2 7,109.2 7,366.4 7,588.2 7,630.9 7,757.4 -387.0 257.2 221.8 42.7 126.4 Employer contributions for government social insurance 9 6,492.4 6,228.7 6,466.8 6,644.0 6,707.3 6,820.9 -263.7 238.1 177.2 63.3 113.7 Plus: Adjustment for residence 10 -93.9 -96.8 -99.2 -103.7 -94.5 -94.9 -2.9 -2.4 -4.6 9.3 -0.4 Equals: Net earnings by place of residence 11 110,450.9 104,686.1 109,538.1 113,157.4 112,400.8 114,177.4 -5,764.9 4,852.0 3,619.3 -756.6 1,776.6 Plus: Dividends, interest, and rent 12 34,946.8 34,125.5 33,454.7 34,331.2 34,359.6 34,973.1 -821.3 -670.8 876.5 28.4 613.5 Plus: Personal current transfer receipts 13 20,608.7 36,320.4 24,372.9 22,632.6 43,258.3 26,953.0 15,711.7 -11,947.5 -1,740.3 20,625.7 -16,305.3 Social Security 14 7,309.4 7,379.1 7,432.8 7,511.0 7,663.4 7,692.8 69.7 53.7 78.1 152.4 29.4 Medicare 15 4,574.0 4,662.6 4,693.0 4,664.4 4,618.5 4,626.4 88.6 30.3 -28.5 -45.9 7.8 Of which: Increase in Medicare reimbursement rates1 16 54.6 81.8 81.2 80.6 80.0 54.6 27.2 -0.6 -0.6 -0.6 Medicaid 17 2,922.8 3,193.5 3,481.8 3,544.1 3,664.4 3,965.9 270.7 288.4 62.3 120.3 301.5 State unemployment insurance 18 198.3 3,895.5 1,936.5 564.5 999.7 884.3 3,697.2 -1,959.0 -1,372.0 435.2 -115.4 Of which:2
Extended Unemployment Benefits 19 0.0 8.3 2.1 (L) 0.0 0.0 8.3 -6.2 (L) (L) Pandemic Emergency Unemployment Compensation 20 21.6 115.1 182.7 273.6 272.0 21.6 93.4 67.6 90.9 -1.6 Pandemic Unemployment Assistance 21 106.7 119.5 51.7 27.3 35.5 106.7 12.8 -67.8 -24.3 8.1 Pandemic Unemployment Compensation Payments 22 2,525.4 934.5 9.0 483.0 399.0 2,525.4 -1,590.9 -925.5 474.0 -84.0 All other personal current transfer receipts 23 5,604.2 17,189.7 6,828.8 6,348.6 26,312.2 9,783.6 11,585.5 -10,360.9 -480.3 19,963.6 -16,528.6 Of which: Economic impact payments3 24 10,384.2 149.8 48.6 19,666.5 2,950.4 10,384.2 -10,234.4 -101.2 19,617.9 -16,716.0 Lost wages supplemental payments4 25 0.0 255.7 48.2 2.5 1.6 0.0 255.7 -207.4 -45.7 -0.9 Paycheck Protection Program loans to NPISH5 26 152.7 472.1 141.9 60.2 37.9 152.7 319.4 -330.2 -81.7 -22.3 Provider Relief Fund to NPISH6 27 7.3 772.1 165.0 367.6 219.9 136.7 764.7 -607.1 202.6 -147.7 -83.2Components of earnings by place of work Wages and salaries 28 90,972.4 84,859.5 89,093.5 92,661.3 92,232.3 94,204.9 -6,112.9 4,234.0 3,567.8 -429.0 1,972.6 Supplements to wages and salaries 29 20,197.1 19,180.1 19,873.5 20,364.4 20,430.3 20,626.5 -1,017.0 693.4 490.9 65.9 196.2 Employer contributions for employee pension and insurance funds 30 13,704.7 12,951.4 13,406.7 13,720.4 13,723.0 13,805.5 -753.3 455.3 313.7 2.6 82.5 Employer contributions for government social insurance 31 6,492.4 6,228.7 6,466.8 6,644.0 6,707.3 6,820.9 -263.7 238.1 177.2 63.3 113.7 Proprietors' income 32 13,363.9 14,081.1 14,503.5 14,467.7 14,171.0 14,019.1 717.2 422.4 -35.8 -296.8 -151.8 Farm proprietors' income 33 378.8 349.4 499.6 628.9 336.6 441.0 -29.4 150.2 129.2 -292.3 104.4 Of which: Coronavirus Food Assistance Program7 34 123.3 108.7 236.0 0.5 10.2 123.3 -14.5 127.2 -235.5 9.7 Paycheck Protection Program loans to businesses5 35 35.8 50.9 15.3 19.3 46.3 35.8 15.1 -35.6 4.0 27.0 Nonfarm proprietors' income 36 12,985.1 13,731.7 14,003.9 13,838.8 13,834.4 13,578.2 746.6 272.2 -165.0 -4.5 -256.2 Of which: Paycheck Protection Program loans to businesses5 37 2,856.2 1,964.0 892.4 695.1 709.8 2,856.2 -892.2 -1,071.7 -197.3 14.7
Data on this table will be superseded by updated estimates. Regional estimates were controlled to the annual update to the National accounts released August 26, 2021.
2021 2020 2021
Effects of Selected Federal Pandemic Response Programs on State Personal Income, 2021Q2Utah
(Millions of dollars, seasonally adjusted at annual rates)Levels Change from preceding period
NPISH -Nonprofit institutions serving households
Note: BEA state per capita personal income statistics are calculated using unpublished Census Bureau midquarter population estimates. These midquarter estimates are based on the 2010 census. BEA will incorporate Census Bureau population estimates based on the 2020 census results when t
Source. U.S. Bureau of Economic AnalysisLast updated: September 23, 2021.
Line
3. Economic impact payments, initially established by the CARES Act, provide direct payments to individuals. For more information, see How are federal economic impact payments to support individuals during the COVID-19 pandemic recorded in the NIPAs?
4. The Federal Emergency Management Agency (FEMA) was authorized to make payments from the Disaster Relief Fund to supplement wages lost as a result of the COVID-19 pandemic.5. The Paycheck Protection Program, initially established by the CARES Act, provides forgivable loans to help small businesses and nonprofit institutions make payroll and cover other expenses. It also provides funding to reimburse private lending institutions for the costs of administering these loans. For more information, see How does the Paycheck Protection Program impact the national income and product accounts (NIPAs)?6. The Department of Health and Human Services distributes money from the Provider Relief Fund to hospitals and health care providers on the front lines of the coronavirus response. This funding supports health care-related expenses or lost revenue attributable to COVID-19 and ensures 7. The Coronavirus Food Assistance Program, initially established by the CARES Act, provides direct support to farmers and ranchers where prices and market supply chains have been impacted by the COVID-19 pandemic.
CARES -Coronavirus Aid, Relief, and Economic Security
(L) Less than $50,000.1. A two percent reduction in reimbursements paid to Medicare service providers that went into effect in 2013 was initially suspended by the CARES Act. The resulting increased reimbursement rates went into effect beginning on May 1, 2020.2. Unemployment insurance benefits were expanded through several programs that were initially established through the CARES Act. For more information, see How will the expansion of unemployment benefits in response to the COVID-19 pandemic be recorded in the NIPAs?
2020

Q1 Q2 Q3 Q4 Q1 Q2 Q2 Q3 Q4 Q1 Q2Personal income (millions of dollars) 1 35,158.3 39,513.8 36,525.5 36,379.4 40,579.5 37,590.8 4,355.5 -2,988.3 -146.2 4,200.1 -2,988.7 Nonfarm personal income 2 34,920.7 39,321.3 36,182.8 36,023.6 40,405.9 37,392.0 4,400.6 -3,138.5 -159.2 4,382.3 -3,013.8 Farm income 3 237.6 192.5 342.7 355.8 173.6 198.8 -45.1 150.2 13.0 -182.2 25.2Population (persons) 4 623,958 623,554 623,333 623,198 622,747 622,405 -404 -221 -135 -451 -342Per capita personal income (dollars) 5 56,347 63,369 58,597 58,375 65,162 60,396 7,022 -4,772 -222 6,787 -4,766Derivation of personal income Earnings by place of work 6 23,316.1 21,500.1 22,950.6 23,741.1 23,577.1 23,990.8 -1,815.9 1,450.5 790.5 -164.0 413.7 Less: Contributions for government social insurance 7 2,882.8 2,745.9 2,865.4 2,941.8 2,976.0 3,035.4 -137.0 119.5 76.4 34.1 59.5 Employee and self-employed contributions for government social insurance 8 1,590.8 1,511.0 1,575.9 1,619.6 1,633.8 1,662.1 -79.8 64.9 43.7 14.2 28.3 Employer contributions for government social insurance 9 1,292.0 1,234.8 1,289.5 1,322.2 1,342.1 1,373.3 -57.2 54.7 32.7 20.0 31.1 Plus: Adjustment for residence 10 500.2 476.7 494.7 519.6 512.1 506.4 -23.5 18.1 24.8 -7.5 -5.6 Equals: Net earnings by place of residence 11 20,933.4 19,231.0 20,580.0 21,318.9 21,113.2 21,461.8 -1,702.5 1,349.1 738.9 -205.7 348.6 Plus: Dividends, interest, and rent 12 6,990.0 6,915.2 6,862.6 6,911.0 6,916.8 6,956.8 -74.8 -52.6 48.5 5.8 40.0 Plus: Personal current transfer receipts 13 7,234.8 13,367.7 9,082.9 8,149.4 12,549.4 9,172.2 6,132.8 -4,284.8 -933.5 4,400.0 -3,377.2 Social Security 14 2,610.1 2,630.5 2,646.2 2,669.4 2,715.0 2,723.8 20.4 15.7 23.2 45.6 8.8 Medicare 15 1,701.5 1,729.6 1,738.7 1,728.4 1,713.5 1,716.0 28.2 9.0 -10.3 -14.9 2.5 Of which: Increase in Medicare reimbursement rates1 16 20.3 30.3 30.1 29.9 29.7 20.3 10.1 -0.2 -0.2 -0.2 Medicaid 17 1,551.0 1,608.2 1,667.3 1,620.4 1,555.5 1,652.6 57.2 59.1 -46.9 -64.9 97.1 State unemployment insurance 18 99.4 2,879.7 1,188.9 489.8 1,086.2 836.0 2,780.3 -1,690.9 -699.1 596.4 -250.2 Of which:2
Extended Unemployment Benefits 19 0.0 4.6 15.6 0.6 (L) 0.0 4.6 11.0 -15.0 (L) Pandemic Emergency Unemployment Compensation 20 7.8 31.3 161.3 242.2 180.6 7.8 23.5 130.0 80.9 -61.5 Pandemic Unemployment Assistance 21 172.7 148.3 134.6 145.3 135.2 172.7 -24.4 -13.7 10.7 -10.1 Pandemic Unemployment Compensation Payments 22 1,872.7 569.4 8.7 588.4 421.9 1,872.7 -1,303.3 -560.7 579.7 -166.5 All other personal current transfer receipts 23 1,272.8 4,519.7 1,841.9 1,641.4 5,479.2 2,243.9 3,246.8 -2,677.8 -200.5 3,837.8 -3,235.4 Of which: Economic impact payments3 24 2,308.6 33.2 10.8 3,905.9 586.0 2,308.6 -2,275.4 -22.5 3,895.2 -3,320.0 Lost wages supplemental payments4 25 0.0 86.8 137.3 0.1 0.0 0.0 86.8 50.5 -137.3 -0.1 Paycheck Protection Program loans to NPISH5 26 256.8 346.6 104.1 37.0 126.7 256.8 89.8 -242.4 -67.1 89.7 Provider Relief Fund to NPISH6 27 6.0 633.5 60.0 76.2 130.0 80.8 627.5 -573.5 16.2 53.8 -49.2Components of earnings by place of work Wages and salaries 28 16,242.6 15,069.6 15,845.3 16,400.7 16,375.4 16,737.5 -1,172.9 775.6 555.4 -25.3 362.1 Supplements to wages and salaries 29 3,951.4 3,775.4 3,948.7 4,042.5 4,050.5 4,118.4 -176.0 173.2 93.8 8.0 68.0 Employer contributions for employee pension and insurance funds 30 2,659.4 2,540.6 2,659.2 2,720.3 2,708.3 2,745.2 -118.8 118.6 61.1 -12.0 36.8 Employer contributions for government social insurance 31 1,292.0 1,234.8 1,289.5 1,322.2 1,342.1 1,373.3 -57.2 54.7 32.7 20.0 31.1 Proprietors' income 32 3,122.1 2,655.1 3,156.7 3,298.0 3,151.2 3,134.8 -467.0 501.6 141.3 -146.7 -16.4 Farm proprietors' income 33 172.9 127.8 277.4 289.4 105.8 130.1 -45.1 149.7 12.0 -183.6 24.3 Of which: Coronavirus Food Assistance Program7 34 61.7 78.0 123.3 5.2 0.0 61.7 16.4 45.2 -118.1 -5.2 Paycheck Protection Program loans to businesses5 35 23.4 33.2 10.0 4.9 12.8 23.4 9.8 -23.2 -5.1 7.9 Nonfarm proprietors' income 36 2,949.2 2,527.3 2,879.2 3,008.6 3,045.4 3,004.7 -421.9 351.9 129.3 36.9 -40.7 Of which: Paycheck Protection Program loans to businesses5 37 401.2 342.2 179.1 151.0 158.5 401.2 -59.0 -163.1 -28.2 7.5
Data on this table will be superseded by updated estimates. Regional estimates were controlled to the annual update to the National accounts released August 26, 2021.
2021 2020 2021
Effects of Selected Federal Pandemic Response Programs on State Personal Income, 2021Q2Vermont
(Millions of dollars, seasonally adjusted at annual rates)Levels Change from preceding period
NPISH -Nonprofit institutions serving households
Note: BEA state per capita personal income statistics are calculated using unpublished Census Bureau midquarter population estimates. These midquarter estimates are based on the 2010 census. BEA will incorporate Census Bureau population estimates based on the 2020 census results when t
Source. U.S. Bureau of Economic AnalysisLast updated: September 23, 2021.
Line
3. Economic impact payments, initially established by the CARES Act, provide direct payments to individuals. For more information, see How are federal economic impact payments to support individuals during the COVID-19 pandemic recorded in the NIPAs?
4. The Federal Emergency Management Agency (FEMA) was authorized to make payments from the Disaster Relief Fund to supplement wages lost as a result of the COVID-19 pandemic.5. The Paycheck Protection Program, initially established by the CARES Act, provides forgivable loans to help small businesses and nonprofit institutions make payroll and cover other expenses. It also provides funding to reimburse private lending institutions for the costs of administering these loans. For more information, see How does the Paycheck Protection Program impact the national income and product accounts (NIPAs)?6. The Department of Health and Human Services distributes money from the Provider Relief Fund to hospitals and health care providers on the front lines of the coronavirus response. This funding supports health care-related expenses or lost revenue attributable to COVID-19 and ensures 7. The Coronavirus Food Assistance Program, initially established by the CARES Act, provides direct support to farmers and ranchers where prices and market supply chains have been impacted by the COVID-19 pandemic.
CARES -Coronavirus Aid, Relief, and Economic Security
(L) Less than $50,000.1. A two percent reduction in reimbursements paid to Medicare service providers that went into effect in 2013 was initially suspended by the CARES Act. The resulting increased reimbursement rates went into effect beginning on May 1, 2020.2. Unemployment insurance benefits were expanded through several programs that were initially established through the CARES Act. For more information, see How will the expansion of unemployment benefits in response to the COVID-19 pandemic be recorded in the NIPAs?
2020
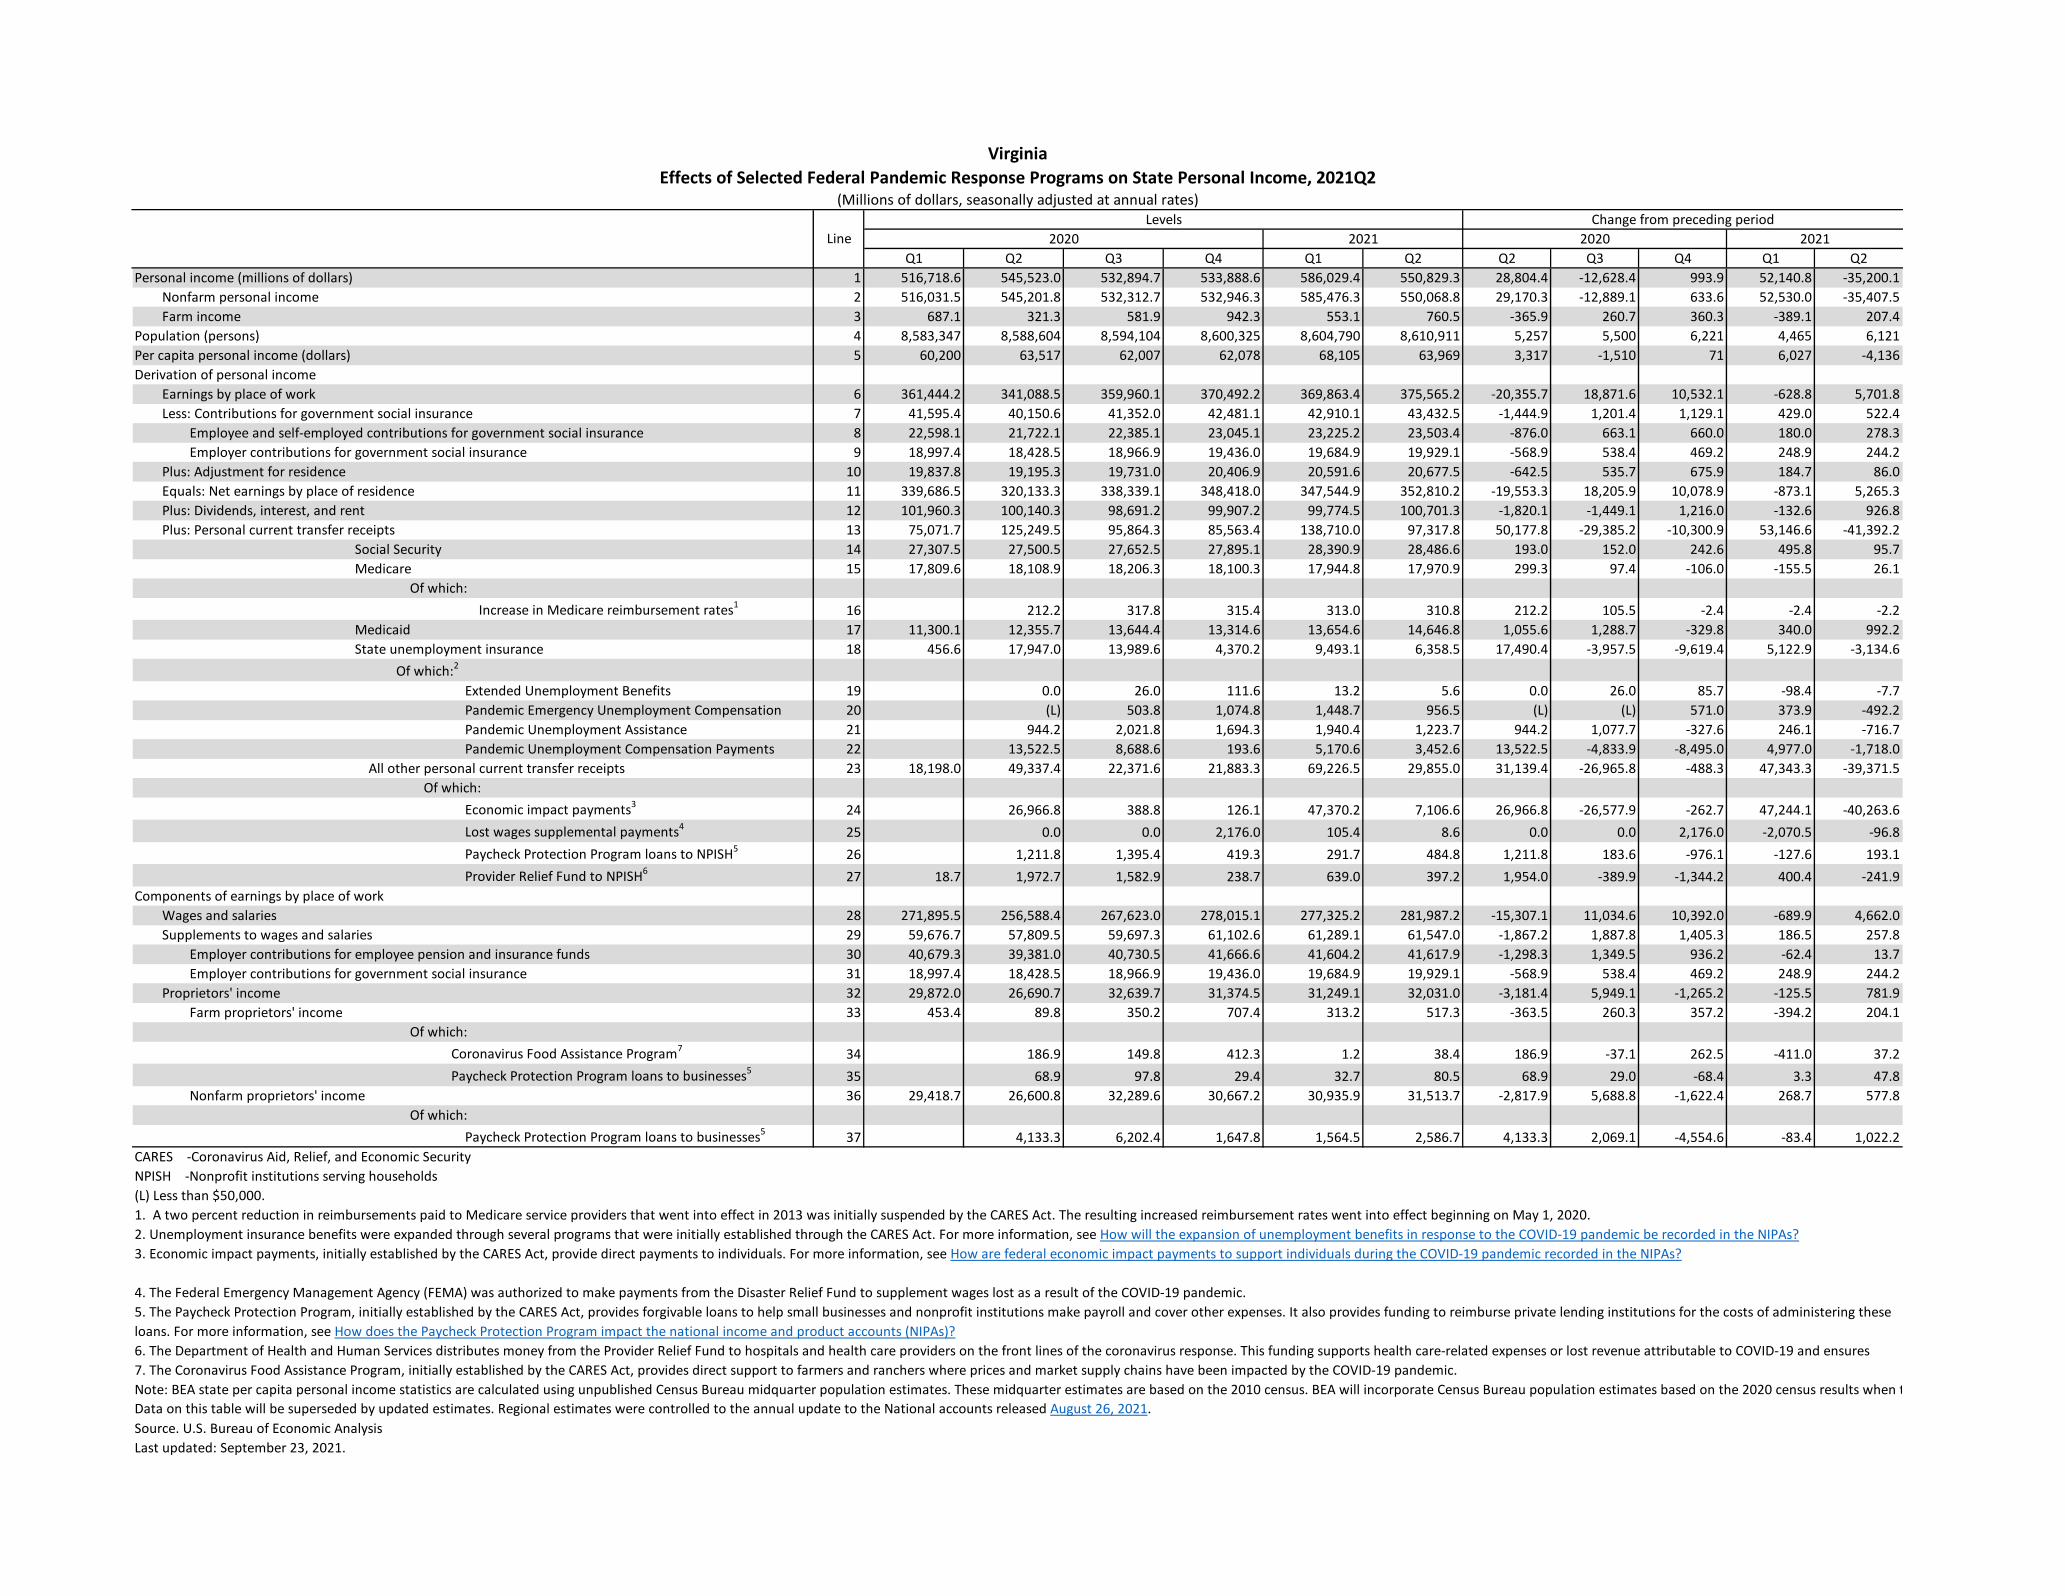
Q1 Q2 Q3 Q4 Q1 Q2 Q2 Q3 Q4 Q1 Q2Personal income (millions of dollars) 1 516,718.6 545,523.0 532,894.7 533,888.6 586,029.4 550,829.3 28,804.4 -12,628.4 993.9 52,140.8 -35,200.1 Nonfarm personal income 2 516,031.5 545,201.8 532,312.7 532,946.3 585,476.3 550,068.8 29,170.3 -12,889.1 633.6 52,530.0 -35,407.5 Farm income 3 687.1 321.3 581.9 942.3 553.1 760.5 -365.9 260.7 360.3 -389.1 207.4Population (persons) 4 8,583,347 8,588,604 8,594,104 8,600,325 8,604,790 8,610,911 5,257 5,500 6,221 4,465 6,121Per capita personal income (dollars) 5 60,200 63,517 62,007 62,078 68,105 63,969 3,317 -1,510 71 6,027 -4,136Derivation of personal income Earnings by place of work 6 361,444.2 341,088.5 359,960.1 370,492.2 369,863.4 375,565.2 -20,355.7 18,871.6 10,532.1 -628.8 5,701.8 Less: Contributions for government social insurance 7 41,595.4 40,150.6 41,352.0 42,481.1 42,910.1 43,432.5 -1,444.9 1,201.4 1,129.1 429.0 522.4 Employee and self-employed contributions for government social insurance 8 22,598.1 21,722.1 22,385.1 23,045.1 23,225.2 23,503.4 -876.0 663.1 660.0 180.0 278.3 Employer contributions for government social insurance 9 18,997.4 18,428.5 18,966.9 19,436.0 19,684.9 19,929.1 -568.9 538.4 469.2 248.9 244.2 Plus: Adjustment for residence 10 19,837.8 19,195.3 19,731.0 20,406.9 20,591.6 20,677.5 -642.5 535.7 675.9 184.7 86.0 Equals: Net earnings by place of residence 11 339,686.5 320,133.3 338,339.1 348,418.0 347,544.9 352,810.2 -19,553.3 18,205.9 10,078.9 -873.1 5,265.3 Plus: Dividends, interest, and rent 12 101,960.3 100,140.3 98,691.2 99,907.2 99,774.5 100,701.3 -1,820.1 -1,449.1 1,216.0 -132.6 926.8 Plus: Personal current transfer receipts 13 75,071.7 125,249.5 95,864.3 85,563.4 138,710.0 97,317.8 50,177.8 -29,385.2 -10,300.9 53,146.6 -41,392.2 Social Security 14 27,307.5 27,500.5 27,652.5 27,895.1 28,390.9 28,486.6 193.0 152.0 242.6 495.8 95.7 Medicare 15 17,809.6 18,108.9 18,206.3 18,100.3 17,944.8 17,970.9 299.3 97.4 -106.0 -155.5 26.1 Of which: Increase in Medicare reimbursement rates1 16 212.2 317.8 315.4 313.0 310.8 212.2 105.5 -2.4 -2.4 -2.2 Medicaid 17 11,300.1 12,355.7 13,644.4 13,314.6 13,654.6 14,646.8 1,055.6 1,288.7 -329.8 340.0 992.2 State unemployment insurance 18 456.6 17,947.0 13,989.6 4,370.2 9,493.1 6,358.5 17,490.4 -3,957.5 -9,619.4 5,122.9 -3,134.6 Of which:2
Extended Unemployment Benefits 19 0.0 26.0 111.6 13.2 5.6 0.0 26.0 85.7 -98.4 -7.7 Pandemic Emergency Unemployment Compensation 20 (L) 503.8 1,074.8 1,448.7 956.5 (L) (L) 571.0 373.9 -492.2 Pandemic Unemployment Assistance 21 944.2 2,021.8 1,694.3 1,940.4 1,223.7 944.2 1,077.7 -327.6 246.1 -716.7 Pandemic Unemployment Compensation Payments 22 13,522.5 8,688.6 193.6 5,170.6 3,452.6 13,522.5 -4,833.9 -8,495.0 4,977.0 -1,718.0 All other personal current transfer receipts 23 18,198.0 49,337.4 22,371.6 21,883.3 69,226.5 29,855.0 31,139.4 -26,965.8 -488.3 47,343.3 -39,371.5 Of which: Economic impact payments3 24 26,966.8 388.8 126.1 47,370.2 7,106.6 26,966.8 -26,577.9 -262.7 47,244.1 -40,263.6 Lost wages supplemental payments4 25 0.0 0.0 2,176.0 105.4 8.6 0.0 0.0 2,176.0 -2,070.5 -96.8 Paycheck Protection Program loans to NPISH5 26 1,211.8 1,395.4 419.3 291.7 484.8 1,211.8 183.6 -976.1 -127.6 193.1 Provider Relief Fund to NPISH6 27 18.7 1,972.7 1,582.9 238.7 639.0 397.2 1,954.0 -389.9 -1,344.2 400.4 -241.9Components of earnings by place of work Wages and salaries 28 271,895.5 256,588.4 267,623.0 278,015.1 277,325.2 281,987.2 -15,307.1 11,034.6 10,392.0 -689.9 4,662.0 Supplements to wages and salaries 29 59,676.7 57,809.5 59,697.3 61,102.6 61,289.1 61,547.0 -1,867.2 1,887.8 1,405.3 186.5 257.8 Employer contributions for employee pension and insurance funds 30 40,679.3 39,381.0 40,730.5 41,666.6 41,604.2 41,617.9 -1,298.3 1,349.5 936.2 -62.4 13.7 Employer contributions for government social insurance 31 18,997.4 18,428.5 18,966.9 19,436.0 19,684.9 19,929.1 -568.9 538.4 469.2 248.9 244.2 Proprietors' income 32 29,872.0 26,690.7 32,639.7 31,374.5 31,249.1 32,031.0 -3,181.4 5,949.1 -1,265.2 -125.5 781.9 Farm proprietors' income 33 453.4 89.8 350.2 707.4 313.2 517.3 -363.5 260.3 357.2 -394.2 204.1 Of which: Coronavirus Food Assistance Program7 34 186.9 149.8 412.3 1.2 38.4 186.9 -37.1 262.5 -411.0 37.2 Paycheck Protection Program loans to businesses5 35 68.9 97.8 29.4 32.7 80.5 68.9 29.0 -68.4 3.3 47.8 Nonfarm proprietors' income 36 29,418.7 26,600.8 32,289.6 30,667.2 30,935.9 31,513.7 -2,817.9 5,688.8 -1,622.4 268.7 577.8 Of which: Paycheck Protection Program loans to businesses5 37 4,133.3 6,202.4 1,647.8 1,564.5 2,586.7 4,133.3 2,069.1 -4,554.6 -83.4 1,022.2
Data on this table will be superseded by updated estimates. Regional estimates were controlled to the annual update to the National accounts released August 26, 2021.
2021 2020 2021
Effects of Selected Federal Pandemic Response Programs on State Personal Income, 2021Q2Virginia
(Millions of dollars, seasonally adjusted at annual rates)Levels Change from preceding period
NPISH -Nonprofit institutions serving households
Note: BEA state per capita personal income statistics are calculated using unpublished Census Bureau midquarter population estimates. These midquarter estimates are based on the 2010 census. BEA will incorporate Census Bureau population estimates based on the 2020 census results when t
Source. U.S. Bureau of Economic AnalysisLast updated: September 23, 2021.
Line
3. Economic impact payments, initially established by the CARES Act, provide direct payments to individuals. For more information, see How are federal economic impact payments to support individuals during the COVID-19 pandemic recorded in the NIPAs?
4. The Federal Emergency Management Agency (FEMA) was authorized to make payments from the Disaster Relief Fund to supplement wages lost as a result of the COVID-19 pandemic.5. The Paycheck Protection Program, initially established by the CARES Act, provides forgivable loans to help small businesses and nonprofit institutions make payroll and cover other expenses. It also provides funding to reimburse private lending institutions for the costs of administering these loans. For more information, see How does the Paycheck Protection Program impact the national income and product accounts (NIPAs)?6. The Department of Health and Human Services distributes money from the Provider Relief Fund to hospitals and health care providers on the front lines of the coronavirus response. This funding supports health care-related expenses or lost revenue attributable to COVID-19 and ensures 7. The Coronavirus Food Assistance Program, initially established by the CARES Act, provides direct support to farmers and ranchers where prices and market supply chains have been impacted by the COVID-19 pandemic.
CARES -Coronavirus Aid, Relief, and Economic Security
(L) Less than $50,000.1. A two percent reduction in reimbursements paid to Medicare service providers that went into effect in 2013 was initially suspended by the CARES Act. The resulting increased reimbursement rates went into effect beginning on May 1, 2020.2. Unemployment insurance benefits were expanded through several programs that were initially established through the CARES Act. For more information, see How will the expansion of unemployment benefits in response to the COVID-19 pandemic be recorded in the NIPAs?
2020

Q1 Q2 Q3 Q4 Q1 Q2 Q2 Q3 Q4 Q1 Q2Personal income (millions of dollars) 1 498,786.6 533,033.0 517,545.2 516,399.5 571,461.5 546,255.6 34,246.4 -15,487.8 -1,145.7 55,062.0 -25,205.8 Nonfarm personal income 2 493,797.4 527,804.5 511,745.3 510,034.5 565,654.9 539,634.4 34,007.1 -16,059.2 -1,710.8 55,620.4 -26,020.5 Farm income 3 4,989.2 5,228.5 5,799.9 6,365.0 5,806.6 6,621.2 239.3 571.4 565.1 -558.4 814.6Population (persons) 4 7,668,664 7,685,747 7,702,749 7,720,285 7,736,762 7,754,761 17,083 17,002 17,536 16,477 17,999Per capita personal income (dollars) 5 65,042 69,353 67,190 66,889 73,863 70,441 4,311 -2,163 -301 6,974 -3,422Derivation of personal income Earnings by place of work 6 362,742.3 340,973.0 362,840.1 374,477.1 380,397.5 388,902.5 -21,769.3 21,867.1 11,637.0 5,920.5 8,504.9 Less: Contributions for government social insurance 7 41,629.9 39,918.1 41,507.7 42,722.7 43,934.9 44,888.3 -1,711.8 1,589.6 1,215.0 1,212.2 953.4 Employee and self-employed contributions for government social insurance 8 21,244.3 20,284.4 21,049.0 21,702.7 22,287.7 22,757.4 -959.9 764.6 653.7 585.0 469.7 Employer contributions for government social insurance 9 20,385.6 19,633.7 20,458.7 21,020.0 21,647.2 22,130.9 -751.8 825.0 561.3 627.2 483.7 Plus: Adjustment for residence 10 5,046.7 4,682.0 4,907.0 5,073.0 5,069.6 5,148.4 -364.7 225.0 166.0 -3.4 78.8 Equals: Net earnings by place of residence 11 326,159.2 305,736.9 326,239.4 336,827.4 341,532.2 349,162.6 -20,422.3 20,502.5 10,588.0 4,704.9 7,630.3 Plus: Dividends, interest, and rent 12 101,325.4 99,437.7 97,902.4 99,405.3 99,094.0 100,149.4 -1,887.7 -1,535.4 1,502.9 -311.4 1,055.4 Plus: Personal current transfer receipts 13 71,302.1 127,858.4 93,403.5 80,166.8 130,835.3 96,943.7 56,556.3 -34,455.0 -13,236.6 50,668.5 -33,891.6 Social Security 14 24,591.6 24,777.1 24,922.5 25,150.8 25,613.8 25,703.1 185.5 145.4 228.3 462.9 89.4 Medicare 15 15,228.7 15,497.1 15,583.2 15,485.3 15,339.3 15,364.0 268.4 86.0 -97.9 -146.0 24.8 Of which: Increase in Medicare reimbursement rates1 16 181.6 271.9 269.8 267.8 265.9 181.6 90.3 -2.0 -2.0 -1.9 Medicaid 17 13,078.6 13,897.8 14,343.4 13,210.8 13,371.4 14,286.5 819.2 445.6 -1,132.7 160.6 915.1 State unemployment insurance 18 1,355.6 26,217.6 15,031.1 6,428.6 13,033.4 13,805.4 24,862.0 -11,186.5 -8,602.5 6,604.8 772.1 Of which:2
Extended Unemployment Benefits 19 0.0 134.4 425.5 591.5 10.2 0.0 134.4 291.0 166.0 -581.3 Pandemic Emergency Unemployment Compensation 20 259.0 666.8 1,999.0 2,936.7 3,965.7 259.0 407.8 1,332.2 937.7 1,029.0 Pandemic Unemployment Assistance 21 1,957.1 1,879.4 1,643.0 1,798.2 2,487.5 1,957.1 -77.7 -236.4 155.1 689.3 Pandemic Unemployment Compensation Payments 22 16,593.0 7,094.9 220.3 6,248.9 6,123.8 16,593.0 -9,498.1 -6,874.6 6,028.6 -125.1 All other personal current transfer receipts 23 17,047.6 47,468.8 23,523.2 19,891.3 63,477.5 27,784.6 30,421.2 -23,945.6 -3,631.9 43,586.2 -35,692.9 Of which: Economic impact payments3 24 24,586.0 355.0 115.1 43,057.3 6,459.6 24,586.0 -24,231.0 -239.9 42,942.1 -36,597.7 Lost wages supplemental payments4 25 0.0 2,569.0 212.9 53.5 67.2 0.0 2,569.0 -2,356.1 -159.4 13.7 Paycheck Protection Program loans to NPISH5 26 1,333.2 1,895.2 569.5 245.5 845.9 1,333.2 562.0 -1,325.7 -324.0 600.4 Provider Relief Fund to NPISH6 27 35.3 3,731.0 984.4 1,316.7 1,016.9 632.0 3,695.7 -2,746.6 332.3 -299.8 -384.9Components of earnings by place of work Wages and salaries 28 266,784.5 250,837.5 263,996.3 274,962.4 279,478.0 286,728.1 -15,947.0 13,158.8 10,966.1 4,515.6 7,250.1 Supplements to wages and salaries 29 56,978.0 54,527.9 56,679.3 58,052.4 59,178.4 60,082.1 -2,450.0 2,151.3 1,373.1 1,126.0 903.7 Employer contributions for employee pension and insurance funds 30 36,592.4 34,894.2 36,220.6 37,032.3 37,531.2 37,951.2 -1,698.2 1,326.3 811.8 498.8 420.1 Employer contributions for government social insurance 31 20,385.6 19,633.7 20,458.7 21,020.0 21,647.2 22,130.9 -751.8 825.0 561.3 627.2 483.7 Proprietors' income 32 38,979.8 35,607.6 42,164.5 41,462.3 41,741.2 42,092.3 -3,372.2 6,556.9 -702.2 278.9 351.1 Farm proprietors' income 33 3,025.8 3,288.7 3,859.7 4,400.2 3,799.5 4,586.3 262.9 571.1 540.5 -600.7 786.8 Of which: Coronavirus Food Assistance Program7 34 163.5 277.6 857.7 111.3 105.7 163.5 114.2 580.0 -746.4 -5.6 Paycheck Protection Program loans to businesses5 35 297.6 422.8 127.0 90.7 201.0 297.6 125.2 -295.7 -36.3 110.3 Nonfarm proprietors' income 36 35,954.0 32,318.9 38,304.8 37,062.1 37,941.7 37,506.0 -3,635.1 5,985.9 -1,242.7 879.6 -435.7 Of which: Paycheck Protection Program loans to businesses5 37 4,594.8 6,060.4 1,945.0 1,822.3 2,093.5 4,594.8 1,465.5 -4,115.4 -122.7 271.2
Data on this table will be superseded by updated estimates. Regional estimates were controlled to the annual update to the National accounts released August 26, 2021.
2020 2021
Effects of Selected Federal Pandemic Response Programs on State Personal Income, 2021Q2Washington
(Millions of dollars, seasonally adjusted at annual rates)Levels Change from preceding period
Note: BEA state per capita personal income statistics are calculated using unpublished Census Bureau midquarter population estimates. These midquarter estimates are based on the 2010 census. BEA will incorporate Census Bureau population estimates based on the 2020 census results wh
Source. U.S. Bureau of Economic AnalysisLast updated: September 23, 2021.
Line
3. Economic impact payments, initially established by the CARES Act, provide direct payments to individuals. For more information, see How are federal economic impact payments to support individuals during the COVID-19 pandemic recorded in the NIPAs?4. The Federal Emergency Management Agency (FEMA) was authorized to make payments from the Disaster Relief Fund to supplement wages lost as a result of the COVID-19 pandemic.5. The Paycheck Protection Program, initially established by the CARES Act, provides forgivable loans to help small businesses and nonprofit institutions make payroll and cover other expenses. It also provides funding to reimburse private lending institutions for the costs of administering these loans. For more information, see How does the Paycheck Protection Program impact the national income and product accounts (NIPAs)?6. The Department of Health and Human Services distributes money from the Provider Relief Fund to hospitals and health care providers on the front lines of the coronavirus response. This funding supports health care-related expenses or lost revenue attributable to COVID-19 and ensures uninsured Americans can get treatment for COVID-19. In the NIPAs, funds provided to nonprofit hospitals are recorded as social benefits.7. The Coronavirus Food Assistance Program, initially established by the CARES Act, provides direct support to farmers and ranchers where prices and market supply chains have been impacted by the COVID-19 pandemic.
CARES -Coronavirus Aid, Relief, and Economic SecurityNPISH -Nonprofit institutions serving households1. A two percent reduction in reimbursements paid to Medicare service providers that went into effect in 2013 was initially suspended by the CARES Act. The resulting increased reimbursement rates went into effect beginning on May 1, 2020.2. Unemployment insurance benefits were expanded through several programs that were initially established through the CARES Act. For more information, see How will the expansion of unemployment benefits in response to the COVID-19 pandemic be recorded in the NIPAs?
2020 2021

Q1 Q2 Q3 Q4 Q1 Q2 Q2 Q3 Q4 Q1 Q2Personal income (millions of dollars) 1 76,634.8 87,151.3 79,065.3 78,364.7 91,270.7 82,264.7 10,516.5 -8,086.0 -700.6 12,906.0 -9,006.0 Nonfarm personal income 2 76,594.0 87,194.3 79,049.9 78,279.2 91,266.5 82,232.3 10,600.3 -8,144.4 -770.7 12,987.3 -9,034.2 Farm income 3 40.9 -43.0 15.4 85.5 4.2 32.4 -83.8 58.4 70.1 -81.3 28.2Population (persons) 4 1,789,633 1,786,411 1,783,796 1,781,568 1,778,133 1,775,108 -3,222 -2,615 -2,228 -3,435 -3,025Per capita personal income (dollars) 5 42,822 48,786 44,324 43,986 51,330 46,343 5,964 -4,462 -338 7,344 -4,987Derivation of personal income Earnings by place of work 6 46,697.6 43,599.9 45,973.7 47,273.0 47,086.0 47,969.3 -3,097.7 2,373.9 1,299.3 -187.0 883.4 Less: Contributions for government social insurance 7 5,996.5 5,743.4 6,006.8 6,167.7 6,244.6 6,367.3 -253.0 263.4 160.9 76.9 122.8 Employee and self-employed contributions for government social insurance 8 3,373.0 3,223.8 3,370.8 3,465.3 3,470.1 3,523.0 -149.2 147.0 94.5 4.8 52.9 Employer contributions for government social insurance 9 2,623.5 2,519.6 2,636.0 2,702.3 2,774.4 2,844.3 -103.9 116.4 66.3 72.1 69.9 Plus: Adjustment for residence 10 1,987.0 1,946.4 2,024.5 2,125.0 2,197.3 2,200.1 -40.6 78.2 100.5 72.3 2.8 Equals: Net earnings by place of residence 11 42,688.1 39,802.8 41,991.4 43,230.3 43,038.7 43,802.1 -2,885.3 2,188.6 1,238.9 -191.6 763.4 Plus: Dividends, interest, and rent 12 11,851.2 11,655.3 11,507.9 11,599.0 11,583.0 11,661.8 -195.8 -147.4 91.0 -16.0 78.8 Plus: Personal current transfer receipts 13 22,095.6 35,693.2 25,565.9 23,535.4 36,649.0 26,800.8 13,597.6 -10,127.2 -2,030.5 13,113.6 -9,848.2 Social Security 14 7,889.3 7,919.3 7,943.6 7,987.7 8,082.5 8,100.8 30.0 24.4 44.1 94.8 18.3 Medicare 15 5,456.2 5,528.5 5,550.8 5,522.7 5,487.5 5,493.2 72.3 22.3 -28.1 -35.2 5.7 Of which: Increase in Medicare reimbursement rates1 16 64.8 97.0 96.3 95.6 94.9 64.8 32.2 -0.7 -0.7 -0.7 Medicaid 17 3,786.9 4,077.6 4,334.8 4,185.2 4,327.8 4,647.5 290.7 257.3 -149.6 142.6 319.7 State unemployment insurance 18 208.3 4,512.8 1,785.6 654.5 1,319.6 976.4 4,304.5 -2,727.2 -1,131.0 665.1 -343.3 Of which:2
Extended Unemployment Benefits 19 0.0 17.3 32.0 2.1 0.4 0.0 17.3 14.7 -29.9 -1.7 Pandemic Emergency Unemployment Compensation 20 28.7 79.0 222.4 285.4 229.9 28.7 50.3 143.4 63.0 -55.6 Pandemic Unemployment Assistance 21 199.4 116.8 85.9 68.8 58.4 199.4 -82.6 -31.0 -17.0 -10.4 Pandemic Unemployment Compensation Payments 22 3,358.4 946.0 23.7 759.3 523.1 3,358.4 -2,412.4 -922.3 735.5 -236.2 All other personal current transfer receipts 23 4,754.9 13,655.0 5,951.1 5,185.4 17,431.6 7,582.9 8,900.2 -7,703.9 -765.8 12,246.2 -9,848.6 Of which: Economic impact payments3 24 6,650.6 95.8 31.1 11,675.5 1,751.6 6,650.6 -6,554.9 -64.7 11,644.4 -9,923.9 Lost wages supplemental payments4 25 0.0 367.6 5.0 5.9 1.8 0.0 367.6 -362.6 0.9 -4.1 Paycheck Protection Program loans to NPISH5 26 449.7 330.3 99.3 39.6 33.9 449.7 -119.4 -231.1 -59.6 -5.8 Provider Relief Fund to NPISH6 27 14.7 1,553.7 170.4 68.1 302.8 188.2 1,539.0 -1,383.3 -102.3 234.8 -114.6Components of earnings by place of work Wages and salaries 28 33,341.1 30,887.5 32,393.0 33,451.6 33,157.6 33,820.8 -2,453.6 1,505.5 1,058.6 -294.0 663.1 Supplements to wages and salaries 29 8,588.3 8,116.6 8,416.9 8,570.9 8,712.1 8,907.2 -471.7 300.3 154.0 141.1 195.2 Employer contributions for employee pension and insurance funds 30 5,964.8 5,597.0 5,780.9 5,868.6 5,937.6 6,062.9 -367.8 183.9 87.7 69.0 125.3 Employer contributions for government social insurance 31 2,623.5 2,519.6 2,636.0 2,702.3 2,774.4 2,844.3 -103.9 116.4 66.3 72.1 69.9 Proprietors' income 32 4,768.2 4,595.7 5,163.9 5,250.5 5,216.3 5,241.3 -172.5 568.1 86.6 -34.2 25.1 Farm proprietors' income 33 14.8 -68.8 -10.4 59.3 -22.6 5.3 -83.6 58.3 69.7 -81.9 27.8 Of which: Coronavirus Food Assistance Program7 34 34.1 41.1 83.5 0.3 6.4 34.1 7.0 42.3 -83.2 6.1 Paycheck Protection Program loans to businesses5 35 5.7 8.0 2.4 6.4 18.3 5.7 2.4 -5.6 4.0 11.9 Nonfarm proprietors' income 36 4,753.4 4,664.5 5,174.3 5,191.2 5,238.8 5,236.1 -88.9 509.8 16.9 47.7 -2.8 Of which: Paycheck Protection Program loans to businesses5 37 812.3 767.2 389.1 276.1 323.6 812.3 -45.1 -378.0 -113.0 47.5
Data on this table will be superseded by updated estimates. Regional estimates were controlled to the annual update to the National accounts released August 26, 2021.
2020 2021
Effects of Selected Federal Pandemic Response Programs on State Personal Income, 2021Q2West Virginia
(Millions of dollars, seasonally adjusted at annual rates)Levels Change from preceding period
Note: BEA state per capita personal income statistics are calculated using unpublished Census Bureau midquarter population estimates. These midquarter estimates are based on the 2010 census. BEA will incorporate Census Bureau population estimates based on the 2020 census results wh
Source. U.S. Bureau of Economic AnalysisLast updated: September 23, 2021.
Line
3. Economic impact payments, initially established by the CARES Act, provide direct payments to individuals. For more information, see How are federal economic impact payments to support individuals during the COVID-19 pandemic recorded in the NIPAs?4. The Federal Emergency Management Agency (FEMA) was authorized to make payments from the Disaster Relief Fund to supplement wages lost as a result of the COVID-19 pandemic.5. The Paycheck Protection Program, initially established by the CARES Act, provides forgivable loans to help small businesses and nonprofit institutions make payroll and cover other expenses. It also provides funding to reimburse private lending institutions for the costs of administering these loans. For more information, see How does the Paycheck Protection Program impact the national income and product accounts (NIPAs)?6. The Department of Health and Human Services distributes money from the Provider Relief Fund to hospitals and health care providers on the front lines of the coronavirus response. This funding supports health care-related expenses or lost revenue attributable to COVID-19 and ensures uninsured Americans can get treatment for COVID-19. In the NIPAs, funds provided to nonprofit hospitals are recorded as social benefits.7. The Coronavirus Food Assistance Program, initially established by the CARES Act, provides direct support to farmers and ranchers where prices and market supply chains have been impacted by the COVID-19 pandemic.
CARES -Coronavirus Aid, Relief, and Economic SecurityNPISH -Nonprofit institutions serving households1. A two percent reduction in reimbursements paid to Medicare service providers that went into effect in 2013 was initially suspended by the CARES Act. The resulting increased reimbursement rates went into effect beginning on May 1, 2020.2. Unemployment insurance benefits were expanded through several programs that were initially established through the CARES Act. For more information, see How will the expansion of unemployment benefits in response to the COVID-19 pandemic be recorded in the NIPAs?
2020 2021

Q1 Q2 Q3 Q4 Q1 Q2 Q2 Q3 Q4 Q1 Q2Personal income (millions of dollars) 1 315,239.7 336,606.7 319,962.0 325,199.5 360,791.0 334,840.9 21,367.0 -16,644.7 5,237.5 35,591.5 -25,950.0 Nonfarm personal income 2 312,352.7 334,176.2 316,345.3 320,522.8 358,303.6 331,455.6 21,823.5 -17,830.9 4,177.5 37,780.8 -26,848.0 Farm income 3 2,887.0 2,430.6 3,616.7 4,676.7 2,487.4 3,385.4 -456.4 1,186.1 1,060.0 -2,189.3 898.0Population (persons) 4 5,832,860 5,832,853 5,834,484 5,837,390 5,837,002 5,837,570 -7 1,631 2,906 -388 568Per capita personal income (dollars) 5 54,045 57,709 54,840 55,710 61,811 57,360 3,664 -2,869 870 6,101 -4,451Derivation of personal income Earnings by place of work 6 221,924.3 207,627.1 219,260.1 228,354.6 226,214.3 230,724.6 -14,297.3 11,633.0 9,094.6 -2,140.3 4,510.3 Less: Contributions for government social insurance 7 25,901.8 24,830.4 25,786.3 26,523.1 26,904.6 27,291.0 -1,071.4 956.0 736.7 381.5 386.4 Employee and self-employed contributions for government social insurance 8 14,164.4 13,535.2 14,051.9 14,480.0 14,638.9 14,839.5 -629.2 516.7 428.1 158.9 200.6 Employer contributions for government social insurance 9 11,737.4 11,295.2 11,734.4 12,043.1 12,265.8 12,451.6 -442.2 439.2 308.7 222.7 185.8 Plus: Adjustment for residence 10 3,898.1 3,674.4 3,837.7 3,994.1 4,068.4 4,147.9 -223.7 163.4 156.4 74.3 79.5 Equals: Net earnings by place of residence 11 199,920.6 186,471.0 197,311.4 205,825.7 203,378.1 207,581.6 -13,449.6 10,840.4 8,514.3 -2,447.5 4,203.4 Plus: Dividends, interest, and rent 12 59,082.0 58,083.8 57,227.1 58,020.0 57,797.7 58,339.7 -998.1 -856.7 792.9 -222.2 542.0 Plus: Personal current transfer receipts 13 56,237.1 92,051.9 65,423.5 61,353.8 99,615.1 68,919.7 35,814.8 -26,628.4 -4,069.7 38,261.3 -30,695.4 Social Security 14 21,962.0 22,111.2 22,227.9 22,409.0 22,774.0 22,844.5 149.3 116.7 181.1 365.0 70.5 Medicare 15 14,006.0 14,240.8 14,317.2 14,233.8 14,111.8 14,132.3 234.8 76.4 -83.3 -122.0 20.5 Of which: Increase in Medicare reimbursement rates1 16 166.9 249.9 248.0 246.1 244.4 166.9 83.0 -1.9 -1.9 -1.7 Medicaid 17 9,170.6 9,342.2 9,939.0 9,659.1 9,669.4 9,993.1 171.6 596.8 -279.9 10.3 323.7 State unemployment insurance 18 497.7 10,033.5 6,095.0 1,829.2 3,871.7 3,165.9 9,535.7 -3,938.5 -4,265.8 2,042.5 -705.8 Of which:2
Extended Unemployment Benefits 19 0.0 0.0 21.0 13.6 6.1 0.0 0.0 21.0 -7.4 -7.4 Pandemic Emergency Unemployment Compensation 20 22.5 154.5 480.5 685.2 603.3 22.5 131.9 326.0 204.7 -82.0 Pandemic Unemployment Assistance 21 46.0 432.5 296.9 251.5 272.4 46.0 386.6 -135.7 -45.4 20.9 Pandemic Unemployment Compensation Payments 22 6,648.0 3,665.8 281.9 2,406.1 1,805.8 6,648.0 -2,982.2 -3,383.9 2,124.2 -600.3 All other personal current transfer receipts 23 10,600.8 36,324.1 12,844.3 13,222.7 49,188.1 18,783.9 25,723.4 -23,479.8 378.3 35,965.4 -30,404.2 Of which: Economic impact payments3 24 20,445.0 294.2 95.4 35,929.7 5,390.3 20,445.0 -20,150.8 -198.7 35,834.3 -30,539.4 Lost wages supplemental payments4 25 0.0 0.0 869.4 23.3 12.1 0.0 0.0 869.4 -846.1 -11.2 Paycheck Protection Program loans to NPISH5 26 1,743.7 482.2 144.9 218.0 153.8 1,743.7 -1,261.6 -337.3 73.1 -64.2 Provider Relief Fund to NPISH6 27 27.9 2,942.3 958.2 1,039.3 832.6 517.4 2,914.5 -1,984.1 81.1 -206.8 -315.1Components of earnings by place of work Wages and salaries 28 159,259.1 148,970.4 156,219.4 162,277.6 162,379.5 165,389.4 -10,288.8 7,249.1 6,058.2 101.9 3,009.9 Supplements to wages and salaries 29 40,911.1 38,883.2 40,418.8 41,407.8 41,527.3 41,865.8 -2,027.9 1,535.7 989.0 119.4 338.5 Employer contributions for employee pension and insurance funds 30 29,173.7 27,588.0 28,684.4 29,364.7 29,261.5 29,414.2 -1,585.7 1,096.4 680.3 -103.2 152.7 Employer contributions for government social insurance 31 11,737.4 11,295.2 11,734.4 12,043.1 12,265.8 12,451.6 -442.2 439.2 308.7 222.7 185.8 Proprietors' income 32 21,754.2 19,773.5 22,621.8 24,669.2 22,307.6 23,469.5 -1,980.6 2,848.3 2,047.4 -2,361.6 1,161.9 Farm proprietors' income 33 2,084.7 1,625.1 2,802.7 3,848.4 1,641.2 2,528.4 -459.6 1,177.6 1,045.7 -2,207.2 887.1 Of which: Coronavirus Food Assistance Program7 34 1,128.4 690.5 1,807.0 12.5 19.5 1,128.4 -437.9 1,116.5 -1,794.5 7.0 Paycheck Protection Program loans to businesses5 35 223.4 317.4 95.4 155.3 337.6 223.4 94.0 -222.0 59.9 182.3 Nonfarm proprietors' income 36 19,669.5 18,148.4 19,819.1 20,820.8 20,666.3 20,941.1 -1,521.0 1,670.7 1,001.7 -154.5 274.8 Of which: Paycheck Protection Program loans to businesses5 37 2,592.4 2,121.5 1,419.0 1,224.8 1,839.9 2,592.4 -471.0 -702.5 -194.2 615.1
Data on this table will be superseded by updated estimates. Regional estimates were controlled to the annual update to the National accounts released August 26, 2021.
2020 2021
Effects of Selected Federal Pandemic Response Programs on State Personal Income, 2021Q2Wisconsin
(Millions of dollars, seasonally adjusted at annual rates)Levels Change from preceding period
Note: BEA state per capita personal income statistics are calculated using unpublished Census Bureau midquarter population estimates. These midquarter estimates are based on the 2010 census. BEA will incorporate Census Bureau population estimates based on the 2020 census results wh
Source. U.S. Bureau of Economic AnalysisLast updated: September 23, 2021.
Line
3. Economic impact payments, initially established by the CARES Act, provide direct payments to individuals. For more information, see How are federal economic impact payments to support individuals during the COVID-19 pandemic recorded in the NIPAs?4. The Federal Emergency Management Agency (FEMA) was authorized to make payments from the Disaster Relief Fund to supplement wages lost as a result of the COVID-19 pandemic.5. The Paycheck Protection Program, initially established by the CARES Act, provides forgivable loans to help small businesses and nonprofit institutions make payroll and cover other expenses. It also provides funding to reimburse private lending institutions for the costs of administering these loans. For more information, see How does the Paycheck Protection Program impact the national income and product accounts (NIPAs)?6. The Department of Health and Human Services distributes money from the Provider Relief Fund to hospitals and health care providers on the front lines of the coronavirus response. This funding supports health care-related expenses or lost revenue attributable to COVID-19 and ensures uninsured Americans can get treatment for COVID-19. In the NIPAs, funds provided to nonprofit hospitals are recorded as social benefits.7. The Coronavirus Food Assistance Program, initially established by the CARES Act, provides direct support to farmers and ranchers where prices and market supply chains have been impacted by the COVID-19 pandemic.
CARES -Coronavirus Aid, Relief, and Economic SecurityNPISH -Nonprofit institutions serving households1. A two percent reduction in reimbursements paid to Medicare service providers that went into effect in 2013 was initially suspended by the CARES Act. The resulting increased reimbursement rates went into effect beginning on May 1, 2020.2. Unemployment insurance benefits were expanded through several programs that were initially established through the CARES Act. For more information, see How will the expansion of unemployment benefits in response to the COVID-19 pandemic be recorded in the NIPAs?
2020 2021

Q1 Q2 Q3 Q4 Q1 Q2 Q2 Q3 Q4 Q1 Q2Personal income (millions of dollars) 1 35,576.6 37,267.7 35,407.2 35,827.5 39,704.7 37,141.5 1,691.1 -1,860.5 420.3 3,877.3 -2,563.2 Nonfarm personal income 2 35,231.7 36,868.4 34,914.6 35,195.9 39,317.7 36,661.4 1,636.7 -1,953.8 281.2 4,121.8 -2,656.3 Farm income 3 344.9 399.3 492.6 631.6 387.1 480.1 54.4 93.3 139.0 -244.6 93.0Population (persons) 4 581,779 582,157 582,693 583,332 583,653 584,090 378 536 639 321 437Per capita personal income (dollars) 5 61,151 64,017 60,765 61,419 68,028 63,589 2,866 -3,252 654 6,609 -4,439Derivation of personal income Earnings by place of work 6 23,529.0 21,531.4 22,743.1 23,556.1 23,471.0 23,844.4 -1,997.6 1,211.7 813.0 -85.1 373.4 Less: Contributions for government social insurance 7 2,805.6 2,622.7 2,714.6 2,775.6 2,821.7 2,858.5 -183.0 92.0 61.0 46.1 36.7 Employee and self-employed contributions for government social insurance 8 1,403.2 1,313.0 1,358.4 1,392.1 1,412.1 1,430.0 -90.2 45.4 33.7 20.0 17.9 Employer contributions for government social insurance 9 1,402.5 1,309.7 1,356.2 1,383.5 1,409.6 1,428.5 -92.8 46.5 27.3 26.1 18.8 Plus: Adjustment for residence 10 -305.5 -274.8 -283.7 -290.0 -288.2 -291.3 30.7 -9.0 -6.3 1.8 -3.0 Equals: Net earnings by place of residence 11 20,417.9 18,634.0 19,744.8 20,490.5 20,361.1 20,694.7 -1,783.9 1,110.8 745.8 -129.5 333.6 Plus: Dividends, interest, and rent 12 9,864.0 9,689.5 9,551.3 9,676.1 9,668.0 9,762.3 -174.5 -138.3 124.8 -8.1 94.3 Plus: Personal current transfer receipts 13 5,294.7 8,944.2 6,111.2 5,660.8 9,675.7 6,684.5 3,649.5 -2,833.0 -450.3 4,014.8 -2,991.2 Social Security 14 2,024.1 2,042.1 2,056.1 2,076.9 2,117.8 2,125.8 18.0 14.0 20.8 41.0 7.9 Medicare 15 1,234.8 1,257.9 1,265.5 1,257.8 1,245.7 1,247.7 23.0 7.7 -7.8 -12.1 2.1 Of which: Increase in Medicare reimbursement rates1 16 14.7 22.1 21.9 21.7 21.6 14.7 7.3 -0.2 -0.2 -0.2 Medicaid 17 559.5 596.6 650.6 639.9 614.8 637.8 37.1 54.0 -10.7 -25.1 23.1 State unemployment insurance 18 90.2 873.6 512.3 185.8 331.6 266.1 783.4 -361.3 -326.5 145.8 -65.4 Of which:2
Extended Unemployment Benefits 19 0.0 1.9 0.3 0.1 0.0 0.0 1.9 -1.6 -0.3 -0.1 Pandemic Emergency Unemployment Compensation 20 2.5 24.2 45.0 69.5 64.9 2.5 21.7 20.8 24.6 -4.6 Pandemic Unemployment Assistance 21 34.2 31.6 20.6 13.2 8.6 34.2 -2.6 -11.0 -7.4 -4.6 Pandemic Unemployment Compensation Payments 22 573.1 214.2 1.7 155.8 105.9 573.1 -358.9 -212.5 154.1 -49.9 All other personal current transfer receipts 23 1,386.1 4,174.0 1,626.6 1,500.5 5,365.8 2,407.0 2,787.9 -2,547.3 -126.1 3,865.3 -2,958.8 Of which: Economic impact payments3 24 2,018.9 29.1 9.4 3,597.2 539.7 2,018.9 -1,989.8 -19.6 3,587.8 -3,057.5 Lost wages supplemental payments4 25 0.0 61.8 2.5 0.1 0.2 0.0 61.8 -59.3 -2.4 0.1 Paycheck Protection Program loans to NPISH5 26 214.1 31.8 9.6 31.8 72.0 214.1 -182.2 -22.3 22.2 40.2 Provider Relief Fund to NPISH6 27 4.3 457.8 40.9 25.1 88.5 55.0 453.4 -416.9 -15.8 63.4 -33.5Components of earnings by place of work Wages and salaries 28 15,181.5 13,837.3 14,407.7 14,856.8 14,916.0 15,176.4 -1,344.2 570.4 449.1 59.2 260.3 Supplements to wages and salaries 29 4,138.4 3,914.4 4,039.2 4,107.7 4,157.5 4,178.7 -224.0 124.9 68.4 49.8 21.2 Employer contributions for employee pension and insurance funds 30 2,735.9 2,604.7 2,683.0 2,724.2 2,747.8 2,750.2 -131.2 78.3 41.1 23.7 2.4 Employer contributions for government social insurance 31 1,402.5 1,309.7 1,356.2 1,383.5 1,409.6 1,428.5 -92.8 46.5 27.3 26.1 18.8 Proprietors' income 32 4,209.0 3,779.7 4,296.1 4,591.7 4,397.5 4,489.4 -429.3 516.4 295.5 -194.1 91.8 Farm proprietors' income 33 199.2 255.7 349.2 486.6 238.9 329.8 56.5 93.5 137.3 -247.7 91.0 Of which: Coronavirus Food Assistance Program7 34 117.8 149.9 250.9 6.3 1.7 117.8 32.1 101.0 -244.5 -4.6 Paycheck Protection Program loans to businesses5 35 14.6 20.8 6.3 27.8 59.9 14.6 6.2 -14.5 21.5 32.2 Nonfarm proprietors' income 36 4,009.8 3,524.0 3,946.9 4,105.1 4,158.6 4,159.5 -485.8 422.9 158.2 53.6 0.9 Of which: Paycheck Protection Program loans to businesses5 37 208.0 267.9 166.4 191.2 178.4 208.0 59.9 -101.5 24.8 -12.9
Data on this table will be superseded by updated estimates. Regional estimates were controlled to the annual update to the National accounts released August 26, 2021.
2020 2021
Effects of Selected Federal Pandemic Response Programs on State Personal Income, 2021Q2Wyoming
(Millions of dollars, seasonally adjusted at annual rates)Levels Change from preceding period
Note: BEA state per capita personal income statistics are calculated using unpublished Census Bureau midquarter population estimates. These midquarter estimates are based on the 2010 census. BEA will incorporate Census Bureau population estimates based on the 2020 census results when t
Source. U.S. Bureau of Economic AnalysisLast updated: September 23, 2021.
Line
3. Economic impact payments, initially established by the CARES Act, provide direct payments to individuals. For more information, see How are federal economic impact payments to support individuals during the COVID-19 pandemic recorded in the NIPAs?4. The Federal Emergency Management Agency (FEMA) was authorized to make payments from the Disaster Relief Fund to supplement wages lost as a result of the COVID-19 pandemic.5. The Paycheck Protection Program, initially established by the CARES Act, provides forgivable loans to help small businesses and nonprofit institutions make payroll and cover other expenses. It also provides funding to reimburse private lending institutions for the costs of administering these loans. For more information, see How does the Paycheck Protection Program impact the national income and product accounts (NIPAs)?6. The Department of Health and Human Services distributes money from the Provider Relief Fund to hospitals and health care providers on the front lines of the coronavirus response. This funding supports health care-related expenses or lost revenue attributable to COVID-19 and ensures uninsured Americans can get treatment for COVID-19. In the NIPAs, funds provided to nonprofit hospitals are recorded as social benefits.7. The Coronavirus Food Assistance Program, initially established by the CARES Act, provides direct support to farmers and ranchers where prices and market supply chains have been impacted by the COVID-19 pandemic.
CARES -Coronavirus Aid, Relief, and Economic SecurityNPISH -Nonprofit institutions serving households1. A two percent reduction in reimbursements paid to Medicare service providers that went into effect in 2013 was initially suspended by the CARES Act. The resulting increased reimbursement rates went into effect beginning on May 1, 2020.2. Unemployment insurance benefits were expanded through several programs that were initially established through the CARES Act. For more information, see How will the expansion of unemployment benefits in response to the COVID-19 pandemic be recorded in the NIPAs?
2020 2021