Embed Size (px)
Citation preview

UNITED STATESSECURITIES AND EXCHANGE COMMISSION
Washington, D.C. 20549
FORM 10-K(Mark One)
Í ANNUAL REPORT PURSUANT TO SECTION 13 OR 15(D) OF THE SECURITIES EXCHANGE ACT OF 1934FOR THE FISCAL YEAR ENDED MAY 31, 2016
OR
‘ TRANSITION REPORT PURSUANT TO SECTION 13 OR 15(D) OF THE SECURITIES EXCHANGE ACT OF 1934FOR THE TRANSITION PERIOD FROM TO .
Commission File No. 1-10635
NIKE, Inc.(Exact name of Registrant as specified in its charter)
OREGON 93-0584541(State or other jurisdiction of incorporation) (IRS Employer Identification No.)
One Bowerman Drive, Beaverton, Oregon 97005-6453(Address of principal executive offices) (Zip Code)
(503) 671-6453
(Registrant’s Telephone Number, Including Area Code)SECURITIES REGISTERED PURSUANT TO SECTION 12(B) OF THE ACT:
Class B Common Stock New York Stock Exchange(Title of Each Class) (Name of Each Exchange on Which Registered)
SECURITIES REGISTERED PURSUANT TO SECTION 12(G) OF THE ACT:NONE
Indicate by check mark: YES NO• if the registrant is a well-known seasoned issuer, as defined in Rule 405 of the
Securities Act. Í ‘• if the registrant is not required to file reports pursuant to Section 13 or Section 15(d) of
the Act. ‘ Í• whether the Registrant (1) has filed all reports required to be filed by Section 13 or 15(d)
of the Securities Exchange Act of 1934 during the preceding 12 months (or for suchshorter period that the Registrant was required to file such reports), and (2) has beensubject to such filing requirements for the past 90 days. Í ‘
• whether the registrant has submitted electronically and posted on its corporateWebsite, if any, every Interactive Data File required to be submitted and postedpursuant to Rule 405 of Regulation S-T (§232.405 of this chapter) during the preceding12 months (or for such shorter period that the registrant was required to submit andpost such files). Í ‘
• if disclosure of delinquent filers pursuant to Item 405 of Regulation S-K (§229.405 of thischapter) is not contained herein, and will not be contained, to the best of Registrant’sknowledge, in definitive proxy or information statements incorporated by reference inPart III of this Form 10-K or any amendment to this Form 10-K. Í
• whether the Registrant is a large accelerated filer, an accelerated filer, a non-accelerated filer, or a smaller reporting company. See the definitionsof “large accelerated filer,” “accelerated filer” and “smaller reporting company” in Rule 12b-2 of the Exchange Act.
Large accelerated filer Í Accelerated filer ‘ Non-accelerated filer ‘ Smaller reporting company ‘
• whether the registrant is a shell company (as defined in Rule 12b-2 of the Act). ‘ ÍAs of November 30, 2015, the aggregate market values of the Registrant’s Common Stock held by non-affiliates were:
Class A $ 4,075,394,149Class B 89,393,235,582
$93,468,629,731As of July 15, 2016, the number of shares of the Registrant’s Common Stock outstanding were:
Class A 329,251,752Class B 1,348,366,883
1,677,618,635
DOCUMENTS INCORPORATED BY REFERENCE:Parts of Registrant’s Proxy Statement for the Annual Meeting of Shareholders to be held on September 22, 2016 are incorporated byreference into Part III of this Report.
55
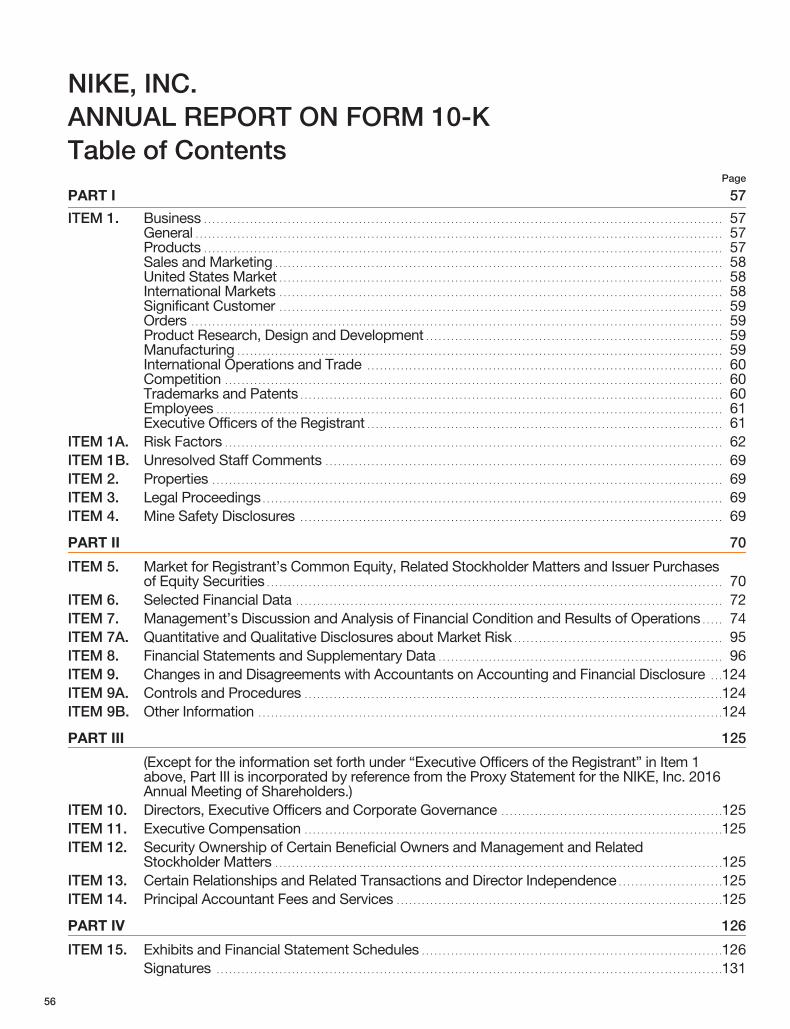
NIKE, INC.ANNUAL REPORT ON FORM 10-KTable of Contents
Page
PART I 57
ITEM 1. Business . . . . . . . . . . . . . . . . . . . . . . . . . . . . . . . . . . . . . . . . . . . . . . . . . . . . . . . . . . . . . . . . . . . . . . . . . . . . . . . . . . . . . . . . . . . . . . . . . . . . . . . . . . . . . . . . . . . . . . . . . . . . 57General . . . . . . . . . . . . . . . . . . . . . . . . . . . . . . . . . . . . . . . . . . . . . . . . . . . . . . . . . . . . . . . . . . . . . . . . . . . . . . . . . . . . . . . . . . . . . . . . . . . . . . . . . . . . . . . . . . . . . . . . . . . . . . 57Products . . . . . . . . . . . . . . . . . . . . . . . . . . . . . . . . . . . . . . . . . . . . . . . . . . . . . . . . . . . . . . . . . . . . . . . . . . . . . . . . . . . . . . . . . . . . . . . . . . . . . . . . . . . . . . . . . . . . . . . . . . . . 57Sales and Marketing . . . . . . . . . . . . . . . . . . . . . . . . . . . . . . . . . . . . . . . . . . . . . . . . . . . . . . . . . . . . . . . . . . . . . . . . . . . . . . . . . . . . . . . . . . . . . . . . . . . . . . . . . . . 58United States Market . . . . . . . . . . . . . . . . . . . . . . . . . . . . . . . . . . . . . . . . . . . . . . . . . . . . . . . . . . . . . . . . . . . . . . . . . . . . . . . . . . . . . . . . . . . . . . . . . . . . . . . . . . 58International Markets . . . . . . . . . . . . . . . . . . . . . . . . . . . . . . . . . . . . . . . . . . . . . . . . . . . . . . . . . . . . . . . . . . . . . . . . . . . . . . . . . . . . . . . . . . . . . . . . . . . . . . . . . . 58Significant Customer . . . . . . . . . . . . . . . . . . . . . . . . . . . . . . . . . . . . . . . . . . . . . . . . . . . . . . . . . . . . . . . . . . . . . . . . . . . . . . . . . . . . . . . . . . . . . . . . . . . . . . . . . . 59Orders . . . . . . . . . . . . . . . . . . . . . . . . . . . . . . . . . . . . . . . . . . . . . . . . . . . . . . . . . . . . . . . . . . . . . . . . . . . . . . . . . . . . . . . . . . . . . . . . . . . . . . . . . . . . . . . . . . . . . . . . . . . . . . . 59Product Research, Design and Development . . . . . . . . . . . . . . . . . . . . . . . . . . . . . . . . . . . . . . . . . . . . . . . . . . . . . . . . . . . . . . . . . . . . . . . 59Manufacturing . . . . . . . . . . . . . . . . . . . . . . . . . . . . . . . . . . . . . . . . . . . . . . . . . . . . . . . . . . . . . . . . . . . . . . . . . . . . . . . . . . . . . . . . . . . . . . . . . . . . . . . . . . . . . . . . . . . . 59International Operations and Trade . . . . . . . . . . . . . . . . . . . . . . . . . . . . . . . . . . . . . . . . . . . . . . . . . . . . . . . . . . . . . . . . . . . . . . . . . . . . . . . . . . . . . 60Competition . . . . . . . . . . . . . . . . . . . . . . . . . . . . . . . . . . . . . . . . . . . . . . . . . . . . . . . . . . . . . . . . . . . . . . . . . . . . . . . . . . . . . . . . . . . . . . . . . . . . . . . . . . . . . . . . . . . . . . . 60Trademarks and Patents . . . . . . . . . . . . . . . . . . . . . . . . . . . . . . . . . . . . . . . . . . . . . . . . . . . . . . . . . . . . . . . . . . . . . . . . . . . . . . . . . . . . . . . . . . . . . . . . . . . . . 60Employees . . . . . . . . . . . . . . . . . . . . . . . . . . . . . . . . . . . . . . . . . . . . . . . . . . . . . . . . . . . . . . . . . . . . . . . . . . . . . . . . . . . . . . . . . . . . . . . . . . . . . . . . . . . . . . . . . . . . . . . . . 61Executive Officers of the Registrant . . . . . . . . . . . . . . . . . . . . . . . . . . . . . . . . . . . . . . . . . . . . . . . . . . . . . . . . . . . . . . . . . . . . . . . . . . . . . . . . . . . . . 61
ITEM 1A. Risk Factors . . . . . . . . . . . . . . . . . . . . . . . . . . . . . . . . . . . . . . . . . . . . . . . . . . . . . . . . . . . . . . . . . . . . . . . . . . . . . . . . . . . . . . . . . . . . . . . . . . . . . . . . . . . . . . . . . . . . . . . 62ITEM 1B. Unresolved Staff Comments . . . . . . . . . . . . . . . . . . . . . . . . . . . . . . . . . . . . . . . . . . . . . . . . . . . . . . . . . . . . . . . . . . . . . . . . . . . . . . . . . . . . . . . . . . . . . . . 69ITEM 2. Properties . . . . . . . . . . . . . . . . . . . . . . . . . . . . . . . . . . . . . . . . . . . . . . . . . . . . . . . . . . . . . . . . . . . . . . . . . . . . . . . . . . . . . . . . . . . . . . . . . . . . . . . . . . . . . . . . . . . . . . . . . . 69ITEM 3. Legal Proceedings . . . . . . . . . . . . . . . . . . . . . . . . . . . . . . . . . . . . . . . . . . . . . . . . . . . . . . . . . . . . . . . . . . . . . . . . . . . . . . . . . . . . . . . . . . . . . . . . . . . . . . . . . . . . . . 69ITEM 4. Mine Safety Disclosures . . . . . . . . . . . . . . . . . . . . . . . . . . . . . . . . . . . . . . . . . . . . . . . . . . . . . . . . . . . . . . . . . . . . . . . . . . . . . . . . . . . . . . . . . . . . . . . . . . . . . 69
PART II 70
ITEM 5. Market for Registrant’s Common Equity, Related Stockholder Matters and Issuer Purchasesof Equity Securities . . . . . . . . . . . . . . . . . . . . . . . . . . . . . . . . . . . . . . . . . . . . . . . . . . . . . . . . . . . . . . . . . . . . . . . . . . . . . . . . . . . . . . . . . . . . . . . . . . . . . . . . . . . . . 70
ITEM 6. Selected Financial Data . . . . . . . . . . . . . . . . . . . . . . . . . . . . . . . . . . . . . . . . . . . . . . . . . . . . . . . . . . . . . . . . . . . . . . . . . . . . . . . . . . . . . . . . . . . . . . . . . . . . . . 72ITEM 7. Management’s Discussion and Analysis of Financial Condition and Results of Operations . . . . . 74ITEM 7A. Quantitative and Qualitative Disclosures about Market Risk . . . . . . . . . . . . . . . . . . . . . . . . . . . . . . . . . . . . . . . . . . . . . . . . . . 95ITEM 8. Financial Statements and Supplementary Data . . . . . . . . . . . . . . . . . . . . . . . . . . . . . . . . . . . . . . . . . . . . . . . . . . . . . . . . . . . . . . . . . . . . 96ITEM 9. Changes in and Disagreements with Accountants on Accounting and Financial Disclosure . . .124ITEM 9A. Controls and Procedures . . . . . . . . . . . . . . . . . . . . . . . . . . . . . . . . . . . . . . . . . . . . . . . . . . . . . . . . . . . . . . . . . . . . . . . . . . . . . . . . . . . . . . . . . . . . . . . . . . . .124ITEM 9B. Other Information . . . . . . . . . . . . . . . . . . . . . . . . . . . . . . . . . . . . . . . . . . . . . . . . . . . . . . . . . . . . . . . . . . . . . . . . . . . . . . . . . . . . . . . . . . . . . . . . . . . . . . . . . . . . . . .124
PART III 125
(Except for the information set forth under “Executive Officers of the Registrant” in Item 1above, Part III is incorporated by reference from the Proxy Statement for the NIKE, Inc. 2016Annual Meeting of Shareholders.)
ITEM 10. Directors, Executive Officers and Corporate Governance . . . . . . . . . . . . . . . . . . . . . . . . . . . . . . . . . . . . . . . . . . . . . . . . . . . . .125ITEM 11. Executive Compensation . . . . . . . . . . . . . . . . . . . . . . . . . . . . . . . . . . . . . . . . . . . . . . . . . . . . . . . . . . . . . . . . . . . . . . . . . . . . . . . . . . . . . . . . . . . . . . . . . . . .125ITEM 12. Security Ownership of Certain Beneficial Owners and Management and Related
Stockholder Matters . . . . . . . . . . . . . . . . . . . . . . . . . . . . . . . . . . . . . . . . . . . . . . . . . . . . . . . . . . . . . . . . . . . . . . . . . . . . . . . . . . . . . . . . . . . . . . . . . . . . . . . . . . .125ITEM 13. Certain Relationships and Related Transactions and Director Independence . . . . . . . . . . . . . . . . . . . . . . . . .125ITEM 14. Principal Accountant Fees and Services . . . . . . . . . . . . . . . . . . . . . . . . . . . . . . . . . . . . . . . . . . . . . . . . . . . . . . . . . . . . . . . . . . . . . . . . . . . . . .125
PART IV 126
ITEM 15. Exhibits and Financial Statement Schedules . . . . . . . . . . . . . . . . . . . . . . . . . . . . . . . . . . . . . . . . . . . . . . . . . . . . . . . . . . . . . . . . . . . . . . . .126Signatures . . . . . . . . . . . . . . . . . . . . . . . . . . . . . . . . . . . . . . . . . . . . . . . . . . . . . . . . . . . . . . . . . . . . . . . . . . . . . . . . . . . . . . . . . . . . . . . . . . . . . . . . . . . . . . . . . . . . . . . . .131
56
PART I
PART I
ITEM 1. Business
General
NIKE, Inc. was incorporated in 1967 under the laws of the State of Oregon. Asused in this report, the terms “we,” “us,” “NIKE,” and the “Company” refer toNIKE, Inc. and its predecessors, subsidiaries and affiliates, collectively, unlessthe context indicates otherwise. Our NIKE e-commerce website is located atwww.nike.com. On our NIKE corporate website, located at news.nike.com,we post the following filings as soon as reasonably practicable after they areelectronically filed with or furnished to the United States Securities andExchange Commission (the “SEC”): our annual report on Form 10-K, ourquarterly reports on Form 10-Q, our current reports on Form 8-K and anyamendments to those reports filed or furnished pursuant to Section 13(a) or15(d) of the Securities and Exchange Act of 1934, as amended. Our definitiveProxy Statements are also posted on our corporate website. All such filingson our corporate website are available free of charge. Copies of these filingsmay also be obtained by visiting the Public Reference Room of the SEC at100 F Street, NE, Washington, D.C. 20549, or by calling the SEC at 1-800-SEC-0330. In addition, the SEC maintains a website (www.sec.gov) thatcontains current, quarterly and annual reports, proxy and information
statements and other information regarding issuers that file electronically. Alsoavailable on our corporate website are the charters of the committees of ourBoard of Directors, as well as our corporate governance guidelines and codeof ethics; copies of any of these documents will be provided in print to anyshareholder who submits a request in writing to NIKE Investor Relations, OneBowerman Drive, Beaverton, Oregon 97005-6453.
Our principal business activity is the design, development and worldwidemarketing and selling of athletic footwear, apparel, equipment, accessoriesand services. NIKE is the largest seller of athletic footwear and apparel in theworld. We sell our products to retail accounts, through NIKE-owned retailstores and internet websites (which we refer to collectively as our “Direct toConsumer” or “DTC” operations), and through a mix of independentdistributors and licensees throughout the world. Virtually all of our productsare manufactured by independent contractors. Nearly all footwear andapparel products are produced outside the United States, while equipmentproducts are produced both in the United States and abroad.
Products
We focus our NIKE Brand product offerings in nine key categories: Running,NIKE Basketball, the Jordan Brand, Football (Soccer), Men’s Training,Women’s Training, Action Sports, Sportswear (our sports-inspired lifestyleproducts) and Golf. Men’s Training includes our baseball and Americanfootball product offerings. We also market products designed for kids, as wellas for other athletic and recreational uses such as cricket, lacrosse, tennis,volleyball, wrestling, walking and outdoor activities.
NIKE’s athletic footwear products are designed primarily for specific athleticuse, although a large percentage of the products are worn for casual or leisurepurposes. We place considerable emphasis on innovation and high-qualityconstruction in our products. Sportswear, Running, the Jordan Brand andFootball (Soccer) are currently our top-selling footwear categories and weexpect them to continue to lead in footwear sales.
We also sell sports apparel covering the above-mentioned categories, whichfeature the same trademarks and are sold predominantly through the samemarketing and distribution channels as athletic footwear. Our sports apparel,similar to our athletic footwear products, is designed primarily for athletic useand exemplifies our commitment to innovation and high-quality construction.Sportswear, Men’s Training, Running, Football (Soccer) and Women’sTraining are currently our top-selling apparel categories, and we expect themto continue to lead in apparel sales. We often market footwear, apparel andaccessories in “collections” of similar use or by category. We also marketapparel with licensed college and professional team and league logos.
We sell a line of performance equipment and accessories under the NIKEBrand name, including bags, socks, sport balls, eyewear, timepieces, digitaldevices, bats, gloves, protective equipment, golf clubs and other equipment
designed for sports activities. We also sell small amounts of various plasticproducts to other manufacturers through our wholly-owned subsidiary, NIKEIHM, Inc.
Our Jordan Brand designs, distributes and licenses athletic and casualfootwear, apparel and accessories predominantly focused on basketballusing the Jumpman trademark. Sales and operating results for the JordanBrand are reported as a separate category and within the NIKE Brandgeographic operating segments, respectively.
One of our wholly-owned subsidiary brands, Hurley, headquartered in CostaMesa, California, designs and distributes a line of action sports and youthlifestyle apparel and accessories under the Hurley trademark. Sales andoperating results for Hurley are included within the NIKE Brand Action Sportscategory and within the NIKE Brand’s North America geographic operatingsegment, respectively.
Another of our wholly-owned subsidiary brands, Converse, headquartered inBoston, Massachusetts, designs, distributes and licenses casual sneakers,apparel and accessories under the Converse, Chuck Taylor, All Star, OneStar, Star Chevron and Jack Purcell trademarks. Operating results of theConverse brand are reported on a stand-alone basis.
In addition to the products we sell to our wholesale customers and directly toconsumers through our DTC operations, we have also entered into licenseagreements that permit unaffiliated parties to manufacture and sell, usingNIKE-owned trademarks, certain apparel, digital devices and applicationsand other equipment designed for sports activities.
NIKE, INC. 2016 Annual Report and Notice of Annual Meeting 57
FOR
M10
-K
PART I
Sales and Marketing
Financial information about geographic and segment operations appears inNote 17 — Operating Segments and Related Information of theaccompanying Notes to the Consolidated Financial Statements.
We experience moderate fluctuations in aggregate sales volume during theyear. Historically, revenues in the first and fourth fiscal quarters have slightlyexceeded those in the second and third quarters. However, the mix ofproduct sales may vary considerably as a result of changes in seasonal andgeographic demand for particular types of footwear, apparel and equipment,as well as other macroeconomic, operating and logistics-related factors.
Because NIKE is a consumer products company, the relative popularity ofvarious sports and fitness activities and changing design trends affect thedemand for our products. We must, therefore, respond to trends and shifts inconsumer preferences by adjusting the mix of existing product offerings,developing new products, styles and categories and influencing sports andfitness preferences through extensive marketing. Failure to respond in a timely
and adequate manner could have a material adverse effect on our sales andprofitability. This is a continuing risk. Refer to Item 1A. Risk Factors.
We report our NIKE Brand operations based on our internal geographicorganization. Each NIKE Brand geography operates predominantly in oneindustry: the design, development, marketing and selling of athletic footwear,apparel, equipment, accessories and services. Our reportable operatingsegments for the NIKE Brand are: North America, Western Europe, Central &Eastern Europe, Greater China, Japan and Emerging Markets. Our NIKEBrand Direct to Consumer operations are managed within each geographicoperating segment.
Converse is also a reportable segment and operates in one industry: thedesign, marketing, licensing and selling of casual sneakers, apparel andaccessories. Converse Direct to Consumer operations, includinge-commerce, are reported within the Converse operating segment results.
United States Market
For fiscal 2016, NIKE Brand and Converse sales in the United Statesaccounted for approximately 47% of total revenues, compared to 46% forboth fiscal 2015 and fiscal 2014. We sell our NIKE Brand, Jordan Brand,Hurley and Converse products to thousands of retail accounts in the UnitedStates, including a mix of footwear stores, sporting goods stores, athleticspecialty stores, department stores, skate, tennis and golf shops and otherretail accounts. In the United States, we utilize NIKE sales offices to solicitsales as well as independent sales representatives to sell specialty productsfor golf and skateboarding. During fiscal 2016, our three largest customersaccounted for approximately 25% of sales in the United States.
We make substantial use of our futures ordering program, which allowsretailers to order five to six months in advance of delivery with the commitment
that their orders will be delivered within a set time period at a fixed price. Infiscal 2016, 84% of our U.S. wholesale footwear shipments were made underthe futures program, compared to 87% in fiscal 2015 and 86% in fiscal 2014.In fiscal 2016, 66% of our U.S. wholesale apparel shipments were madeunder the futures program, compared to 67% in fiscal 2015 and 71% in fiscal2014.
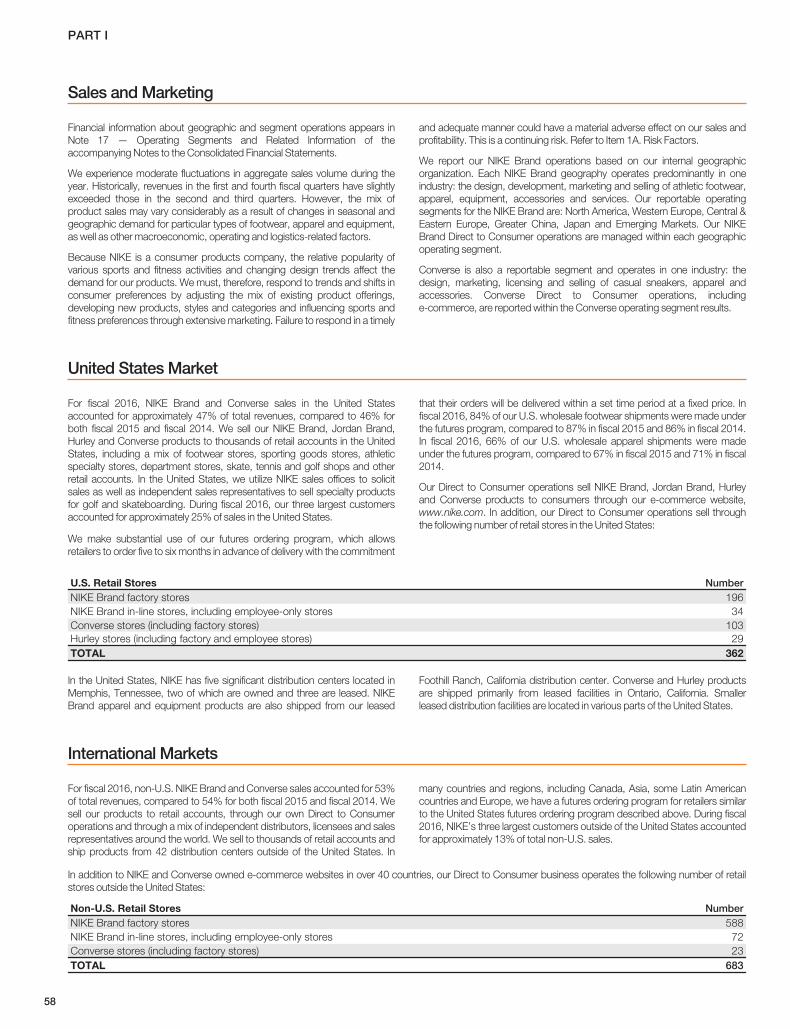
Our Direct to Consumer operations sell NIKE Brand, Jordan Brand, Hurleyand Converse products to consumers through our e-commerce website,www.nike.com. In addition, our Direct to Consumer operations sell throughthe following number of retail stores in the United States:
U.S. Retail Stores NumberNIKE Brand factory stores 196NIKE Brand in-line stores, including employee-only stores 34Converse stores (including factory stores) 103Hurley stores (including factory and employee stores) 29TOTAL 362
In the United States, NIKE has five significant distribution centers located inMemphis, Tennessee, two of which are owned and three are leased. NIKEBrand apparel and equipment products are also shipped from our leased
Foothill Ranch, California distribution center. Converse and Hurley productsare shipped primarily from leased facilities in Ontario, California. Smallerleased distribution facilities are located in various parts of the United States.
International Markets
For fiscal 2016, non-U.S. NIKE Brand and Converse sales accounted for 53%of total revenues, compared to 54% for both fiscal 2015 and fiscal 2014. Wesell our products to retail accounts, through our own Direct to Consumeroperations and through a mix of independent distributors, licensees and salesrepresentatives around the world. We sell to thousands of retail accounts andship products from 42 distribution centers outside of the United States. In
many countries and regions, including Canada, Asia, some Latin Americancountries and Europe, we have a futures ordering program for retailers similarto the United States futures ordering program described above. During fiscal2016, NIKE’s three largest customers outside of the United States accountedfor approximately 13% of total non-U.S. sales.
In addition to NIKE and Converse owned e-commerce websites in over 40 countries, our Direct to Consumer business operates the following number of retailstores outside the United States:
Non-U.S. Retail Stores NumberNIKE Brand factory stores 588NIKE Brand in-line stores, including employee-only stores 72Converse stores (including factory stores) 23TOTAL 683
58
PART I
International branch offices and subsidiaries of NIKE are located in Argentina,Australia, Austria, Belgium, Bermuda, Brazil, Canada, Chile, China, Croatia,the Czech Republic, Denmark, Finland, France, Germany, Greece, HongKong, Hungary, India, Indonesia, Ireland, Israel, Italy, Japan, Jordan, Korea,
Malaysia, Mexico, New Zealand, the Netherlands, Norway, Panama, thePhilippines, Poland, Portugal, Russia, Singapore, Slovakia, Slovenia, SouthAfrica, Spain, Sri Lanka, Sweden, Switzerland, Taiwan, Thailand, Turkey, theUnited Arab Emirates, the United Kingdom, Uruguay and Vietnam.
Significant Customer
No customer accounted for 10% or more of our worldwide net revenues during fiscal 2016.
Orders
Worldwide futures orders for NIKE Brand athletic footwear and apparel,scheduled for delivery from June through November 2016, were $14.9 billioncompared with $13.8 billion for the same period last year. NIKE Brandreported futures include (1) orders from external wholesale customers and (2)internal orders from our DTC in-line stores and e-commerce operations whichare reflected at prices that are comparable to prices charged to externalwholesale customers. The U.S. Dollar futures orders amount is calculatedbased upon our internal forecast of the actual currency exchange rates underwhich our revenues will be translated during this period. Reported futuresorders are not necessarily indicative of our expectation of revenues for thisperiod. This is because the mix of orders can shift between futures and at-
once orders and the fulfillment of certain of these futures orders may falloutside of the scheduled time period noted above. In addition, foreigncurrency exchange rate fluctuations as well as differing levels of ordercancellations, discounts and returns can cause differences in thecomparisons between futures orders and actual revenues. Moreover, aportion of our revenue is not derived from futures orders, including sales of at-once and closeout NIKE Brand footwear and apparel, all sales of NIKE Brandequipment, the difference between retail sales and internal orders from ourDirect to Consumer in-line stores and e-commerce operations, and salesfrom our Converse, Hurley and NIKE Golf businesses.
Product Research, Design and Development
We believe our research, design and development efforts are key factors inour success. Technical innovation in the design and manufacturing process offootwear, apparel and athletic equipment receive continued emphasis as westrive to produce products that help to enhance athletic performance, reduceinjury and maximize comfort while reducing waste.
In addition to our own staff of specialists in the areas of biomechanics,chemistry, exercise physiology, engineering, industrial design, sustainabilityand related fields, we also utilize research committees and advisory boardsmade up of athletes, coaches, trainers, equipment managers, orthopedists,podiatrists and other experts who consult with us and review designs,materials, concepts for product and manufacturing process improvementsand compliance with product safety regulations around the world. Employee
athletes, athletes engaged under sports marketing contracts and otherathletes wear-test and evaluate products during the design and developmentprocess.
As we continue to develop new technologies, we are simultaneously focusedon the design of innovative products incorporating such technologiesthroughout our product categories. Using market intelligence and research,our various design teams identify opportunities to leverage new technologiesin existing categories responding to consumer preferences. The proliferationof NIKE Air, Lunar, Zoom, Free, Flywire, Dri-Fit, Flyknit, Flyweave and NIKE+technologies through Running, NIKE Basketball, the Jordan Brand, Football(Soccer), Men’s Training, Women’s Training and Sportswear, among others,typifies our dedication to designing innovative products.
Manufacturing
We are supplied by approximately 142 footwear factories located in 15countries. The largest single footwear factory accounted for approximately7% of total fiscal 2016 NIKE Brand footwear production. Virtually all of ourfootwear is manufactured outside of the United States by independentcontract manufacturers who often operate multiple factories. In fiscal 2016,contract factories in Vietnam, China and Indonesia manufacturedapproximately 44%, 29% and 21% of total NIKE Brand footwear,respectively. We also have manufacturing agreements with independentfactories in Argentina, India, Brazil and Mexico to manufacture footwear forsale primarily within those countries. In fiscal 2016, five footwear contractmanufacturers each accounted for greater than 10% of footwear productionand in aggregate accounted for approximately 69% of NIKE Brand footwearproduction.
We are supplied by approximately 394 apparel factories located in 39countries. The largest single apparel factory accounted for approximately12% of total fiscal 2016 NIKE Brand apparel production. Virtually all of ourapparel is manufactured outside of the United States by independent contractmanufacturers which often operate multiple factories. In fiscal 2016, contractfactories in China, Vietnam and Indonesia produced approximately 26%,23% and 9% of total NIKE Brand apparel, respectively. In fiscal 2016, oneapparel contract manufacturer accounted for more than 10% of apparelproduction, and the top five contract manufacturers in aggregate accountedfor approximately 39% of NIKE Brand apparel production.
The principal materials used in our footwear products are natural andsynthetic rubber, plastic compounds, foam cushioning materials, natural andsynthetic leather, nylon, polyester and canvas, as well as polyurethane filmsused to make NIKE Air-Sole cushioning components. During fiscal 2016,NIKE IHM, Inc., a wholly-owned subsidiary of NIKE, Inc., with facilities nearBeaverton, Oregon and in St. Charles, Missouri, as well as independentcontractors in China and Vietnam, were our largest suppliers of the Air-Solecushioning components used in footwear. The principal materials used in ourapparel products are natural and synthetic fabrics and threads (both virginand recycled); specialized performance fabrics designed to efficiently wickmoisture away from the body, retain heat and repel rain and/or snow; andplastic and metal hardware. NIKE’s independent contractors and suppliersbuy raw materials for the manufacturing of our footwear, apparel andequipment products. Most raw materials are available and purchased bythose independent contractors and suppliers in the countries wheremanufacturing takes place. NIKE’s independent contract manufacturers andsuppliers have thus far experienced little difficulty in satisfying raw materialrequirements for the production of our products.
Since 1972, Sojitz Corporation of America (“Sojitz America”), a largeJapanese trading company and the sole owner of our redeemable preferredstock, has performed significant import-export financing services for us.During fiscal 2016, Sojitz America provided financing and purchasing servicesfor NIKE Brand products sold in certain NIKE markets including Argentina,
NIKE, INC. 2016 Annual Report and Notice of Annual Meeting 59
FOR
M10
-K
PART I
Uruguay, Brazil, Canada, India, South Africa and Thailand, excludingproducts produced and sold in the same country. Approximately 6% of NIKEBrand sales occurred in those countries. Any failure of Sojitz America toprovide these services or any failure of Sojitz America’s banks could disruptour ability to acquire products from our suppliers and to deliver products toour customers in those markets. Such a disruption could result in canceled
orders that would adversely affect sales and profitability. However, we believethat any such disruption would be short-term in duration due to the readyavailability of alternative sources of financing at competitive rates. Our currentagreements with Sojitz America expire on May 31, 2018 and contain aprovision allowing us to extend the agreements to May 31, 2019.
International Operations and Trade
Our international operations and sources of supply are subject to the usualrisks of doing business abroad, such as possible increases in import duties,anti-dumping measures, quotas, safeguard measures, trade restrictions,restrictions on the transfer of funds and, in certain parts of the world, politicalinstability and terrorism. We have not, to date, been materially affected by anysuch risk, but cannot predict the likelihood of such material effects occurringin the future.
In recent years, uncertain global and regional economic conditions haveaffected international trade and caused a rise in protectionist actions aroundthe world. These trends are affecting many global manufacturing and servicesectors, and the footwear and apparel industries, as a whole, are not immune.Companies in our industry are facing trade protectionism in many differentregions, and in nearly all cases we are working together with industry groupsto address trade issues and reduce the impact to the industry, whileobserving applicable competition laws. Notwithstanding our efforts,protectionist measures have resulted in increases in the cost of our products,and additional measures, if implemented, could adversely affect sales and/orprofitability for NIKE as well as the imported footwear and apparel industry asa whole.
We monitor protectionist trends and developments throughout the world thatmay materially impact our industry, and we engage in administrative andjudicial processes to mitigate trade restrictions. We are actively monitoringactions that may result in additional anti-dumping measures and could affectour industry. We are also monitoring for and advocating against otherimpediments that may limit or delay customs clearance for imports of
footwear, apparel and equipment. Moreover, with respect to trade restrictionstargeting China, which represents an important sourcing country andconsumer market for us, we are working with a broad coalition of globalbusinesses and trade associations representing a wide variety of sectors tohelp ensure that any legislation enacted and implemented (i) addresseslegitimate and core concerns, (ii) is consistent with international trade rules,and (iii) reflects and considers China’s domestic economy and the importantrole it has in the global economic community.
Where trade protection measures are implemented, we believe that we havethe ability to develop, over a period of time, adequate alternative sources ofsupply for the products obtained from our present suppliers. If eventsprevented us from acquiring products from our suppliers in a particularcountry, our operations could be temporarily disrupted and we couldexperience an adverse financial impact. However, we believe we could abateany such disruption, and that much of the adverse impact on supply would,therefore, be of a short-term nature, although alternate sources of supplymight not be as cost-effective and could have an ongoing adverse impact onprofitability.
NIKE advocates for trade liberalization for footwear and apparel in a numberof regional and bilateral free trade agreements. The Trans-Pacific Partnership(TPP), if ultimately ratified, has the potential to reduce or eliminate high rates ofcustoms duties for imports into the United States of NIKE products sourcedfrom TPP countries (primarily footwear and apparel from Vietnam and apparelfrom Malaysia). Similarly, the European Union has concluded a free tradeagreement with Vietnam that, if approved, could lead to duty reduction orelimination for footwear and apparel.
Competition
The athletic footwear, apparel and equipment industry is highly competitive ona worldwide basis. We compete internationally with a significant number ofathletic and leisure footwear companies, athletic and leisure apparelcompanies, sports equipment companies and large companies havingdiversified lines of athletic and leisure footwear, apparel and equipment,including adidas, ASICS, Li Ning, lululemon athletica, Puma, V.F. Corporationand Under Armour, among others. The intense competition and the rapidchanges in technology and consumer preferences in the markets for athleticand leisure footwear and apparel and athletic equipment, constitutesignificant risk factors in our operations.
NIKE is the largest seller of athletic footwear, apparel and equipment in theworld. Important aspects of competition in this industry are:
• Product attributes such as quality; performance and reliability; new productinnovation and development and consumer price/value.
• Consumer connection and affinity for brands and products, developedthrough marketing and promotion; social media interaction; customersupport and service; identification with prominent and influential athletes,coaches, teams, colleges and sports leagues who endorse our brands anduse our products and active engagement through sponsored sportingevents and clinics.
• Effective sourcing and distribution of products, with attractivemerchandising and presentation at retail, both in-store and online.
We believe that we are competitive in all of these areas.
Trademarks and Patents
We utilize trademarks on nearly all of our products and believe havingdistinctive marks that are readily identifiable is an important factor in creating amarket for our goods, in identifying our brands and the Company and indistinguishing our goods from the goods of others. We consider our NIKE andSwoosh Design trademarks to be among our most valuable assets and wehave registered these trademarks in almost 170 jurisdictions worldwide. Inaddition, we own many other trademarks that we utilize in marketing ourproducts. We own common law rights in the trade dress of several significantshoe designs and elements. For certain trade dress, we have sought andobtained trademark registrations.
We have copyright protection in our design, graphics and other originalworks. When appropriate, we have sought registrations for this content.
We own patents and have a patent license, facilitating our use of “Air”technologies.
We also file and maintain many U.S. and foreign utility patents, as well asmany U.S. and foreign design patents protecting components,manufacturing techniques, features and industrial design used in variousathletic and leisure footwear and apparel, athletic equipment, digital devicesand golf products. These patents expire at various times; patents issued fororiginal applications filed this calendar year in the United States may last until2031 for design patents and until 2036 for utility patents.
60
PART I
We believe our success depends upon our capabilities in areas such asdesign, research and development, production and marketing rather thanexclusively upon our patent and trade secret positions. However, we havefollowed a policy of filing patent applications for the United States and select
foreign countries on inventions, designs and improvements that we deemvaluable. We also continue to vigorously protect our trademarks and patentsagainst third-party infringement.
Employees
As of May 31, 2016, we had approximately 70,700 employees worldwide,including retail and part-time employees. Management considers itsrelationship with employees to be excellent. None of our employees arerepresented by a union, except for certain employees in the EmergingMarkets geography, where local law requires those employees to berepresented by a trade union. Also, in some countries outside of the United
States, local laws require employee representation by works councils (whichmay be entitled to information and consultation on certain Companydecisions) or by organizations similar to a union. In certain Europeancountries, we are required by local law to enter into and/or comply withindustry-wide or national collective bargaining agreements. NIKE has neverexperienced a material interruption of operations due to labor disagreements.
Executive Officers of the Registrant
The executive officers of NIKE, Inc. as of July 15, 2016 are as follows:
Mark G. Parker, Chairman, President and Chief Executive Officer —Mr. Parker, 60, was appointed President and Chief Executive Officer inJanuary 2006 and named Chairman of the Board in June 2016. He has beenemployed by NIKE since 1979 with primary responsibilities in productresearch, design and development, marketing and brand management.Mr. Parker was appointed divisional Vice President in charge of productdevelopment in 1987, corporate Vice President in 1989, General Manager in1993, Vice President of Global Footwear in 1998 and President of the NIKEBrand in 2001.
Chris L. Abston, Vice President and Corporate Controller — Mr. Abston,53, joined NIKE in 2015 from Wal-Mart Stores, Inc., where he served as VicePresident, Global Controls and Governance since February 2015. Prior to thathe was Vice President and Controller of Walmart International from February2013 to January 2015, responsible for the oversight of internationalaccounting and reporting, and Vice President and Assistant Controller of Wal-Mart Stores, Inc. from May 2011 to January 2013. Before joining Wal-Mart,Mr. Abston spent 25 years in public accounting with Ernst & Young LLP, mostrecently leading its Strategic Growth Markets practice as a Partner in theDallas office.
David J. Ayre, Executive Vice President, Global Human Resources —Mr. Ayre, 56, joined NIKE as Vice President, Global Human Resources in2007. Prior to joining NIKE, he held a number of senior human resourcepositions with PepsiCo, Inc. since 1990, most recently as head of Talent andPerformance Rewards.
Andrew Campion, Executive Vice President and Chief Financial Officer —Mr. Campion, 44, joined NIKE in 2007 as Vice President of Global Planningand Development, leading strategic and financial planning. He was appointedChief Financial Officer of the NIKE Brand in 2010, responsible for leading allaspects of financial management for the Company’s flagship brand. In 2014,he was appointed Senior Vice President, Strategy, Finance and InvestorRelations in addition to his role as Chief Financial Officer of NIKE Brand.Mr. Campion assumed the role of Executive Vice President and ChiefFinancial Officer in August 2015. Prior to joining NIKE, he held leadership rolesin strategic planning, mergers and acquisitions, financial planning andanalysis, operations and planning, investor relations and tax at The WaltDisney Company from 1996 to 2007.
Trevor A. Edwards, President, NIKE Brand — Mr. Edwards, 53, joinedNIKE in 1992. He was appointed Marketing Manager, Strategic Accounts forFoot Locker in 1993, Director of Marketing for the Americas in 1995, Directorof Marketing for Europe in 1997, Vice President, Marketing for Europe, MiddleEast and Africa in 1999 and Vice President, U.S. Brand Marketing in 2000.Mr. Edwards was appointed corporate Vice President, Global BrandManagement in 2002, Vice President, Global Brand and CategoryManagement in 2006 and President, NIKE Brand in 2013. Prior to NIKE,Mr.Edwards was with the Colgate-Palmolive Company.
Jeanne P. Jackson, President & Strategic Advisor — Ms. Jackson,64, joined NIKE in 2009. She was appointed President & Strategic Advisor inJune 2016. She was appointed President, Product and Merchandising in2013 and President, Direct to Consumer in 2009. Ms. Jackson also served asa member of the NIKE, Inc. Board of Directors from 2001 through 2009. Shefounded and served as Chief Executive Officer of MSP Capital, a privateinvestment company, from 2002 to 2009. Ms. Jackson was Chief ExecutiveOfficer of Walmart.com from March 2000 to January 2002. She was withGap, Inc., as President and Chief Executive Officer of Banana Republic from1995 to 2000, also serving as Chief Executive Officer of Gap, Inc. Direct from1998 to 2000. Since 1978, she has held various retail management positionswith Victoria’s Secret, The Walt Disney Company, Saks Fifth Avenue andFederated Department Stores.
Hilary K. Krane, Executive Vice President, Chief Administrative Officer andGeneral Counsel — Ms. Krane, 52, joined NIKE as Vice President andGeneral Counsel in April 2010. In 2011, her responsibilities expanded and shebecame Vice President, General Counsel and Corporate Affairs. Ms. Kranewas appointed Executive Vice President, Chief Administrative Officer andGeneral Counsel in 2013. Prior to joining NIKE, Ms. Krane was GeneralCounsel and Senior Vice President for Corporate Affairs at Levi Strauss & Co.from 2006 to 2010. From 1996 to 2006, she was a partner and assistantgeneral counsel at PricewaterhouseCoopers LLP.
John F. Slusher, Executive Vice President, Global Sports Marketing —Mr. Slusher, 47, has been employed by NIKE since 1998 with primaryresponsibilities in global sports marketing. Mr. Slusher was appointed Directorof Sports Marketing for the Asia Pacific and Americas in 2006, divisional VicePresident of Asia Pacific & Americas Sports Marketing in September 2007and Vice President, Global Sports Marketing in November 2007. Prior tojoining NIKE, Mr. Slusher was an attorney at the law firm of O’Melveny &Myers from 1995 to 1998.
Michael Spillane, President, Product and Merchandising — Mr. Spillane,56, joined NIKE in 2007. He was appointed President, Product andMerchandising in 2016. He has served the Company in various roles includingVice President and General Manager of Greater China, Chief Executive Officerof Umbro and Converse and most recently as Vice President and GeneralManager of Footwear. Prior to joining NIKE, Mr. Spillane held leadership rolesat Polartec, Maiden Mills Industries, Inc. and Tommy Hilfiger Licensing, LLC.
Eric D. Sprunk, Chief Operating Officer — Mr. Sprunk, 52, joined NIKE in1993. He was appointed Finance Director and General Manager of theAmericas in 1994, Finance Director for NIKE Europe in 1995, RegionalGeneral Manager of NIKE Europe Footwear in 1998 and Vice President &General Manager of the Americas in 2000. Mr. Sprunk was appointed VicePresident of Global Footwear in 2001, Vice President of Merchandising andProduct in 2009 and Chief Operating Officer in 2013. Prior to joining NIKE,Mr. Sprunk was a certified public accountant with Price Waterhouse from1987 to 1993.
NIKE, INC. 2016 Annual Report and Notice of Annual Meeting 61
FOR
M10
-K
PART I
ITEM 1A. Risk FactorsSpecial Note Regarding Forward-Looking Statements andAnalyst Reports
Certain written and oral statements, other than purely historic information,including estimates, projections, statements relating to NIKE’s businessplans, objectives and expected operating results and the assumptions uponwhich those statements are based, made or incorporated by reference fromtime to time by NIKE or its representatives in this report, other reports, filingswith the SEC, press releases, conferences or otherwise, are “forward-lookingstatements” within the meaning of the Private Securities Litigation Reform Actof 1995 and Section 21E of the Securities Exchange Act of 1934, asamended. Forward-looking statements include, without limitation, anystatement that may predict, forecast, indicate or imply future results,performance or achievements, and may contain the words “believe,”“anticipate,” “expect,” “estimate,” “project,” “will be,” “will continue,” “will likelyresult” or words or phrases of similar meaning. Forward-looking statementsinvolve risks and uncertainties which may cause actual results to differmaterially from the forward-looking statements. The risks and uncertaintiesare detailed from time to time in reports filed by NIKE with the SEC, includingreports filed on Forms 8-K, 10-Q and 10-K, and include, among others, thefollowing: international, national and local general economic and marketconditions; the size and growth of the overall athletic footwear, apparel andequipment markets; intense competition among designers, marketers,distributors and sellers of athletic footwear, apparel and equipment forconsumers and endorsers; demographic changes; changes in consumerpreferences; popularity of particular designs, categories of products andsports; seasonal and geographic demand for NIKE products; difficulties inanticipating or forecasting changes in consumer preferences, consumerdemand for NIKE products and the various market factors described above;difficulties in implementing, operating and maintaining NIKE’s increasinglycomplex information systems and controls, including, without limitation, thesystems related to demand and supply planning and inventory control;interruptions in data and information technology systems; consumer datasecurity; fluctuations and difficulty in forecasting operating results, including,without limitation, the fact that advance futures orders may not be indicative offuture revenues due to changes in shipment timing, the changing mix offutures and at-once orders, and discounts, order cancellations and returns;the ability of NIKE to sustain, manage or forecast its growth and inventories;the size, timing and mix of purchases of NIKE’s products; increases in thecost of materials, labor and energy used to manufacture products; newproduct development and introduction; the ability to secure and protecttrademarks, patents and other intellectual property; product performance andquality; customer service; adverse publicity; the loss of significant customersor suppliers; dependence on distributors and licensees; business disruptions;increased costs of freight and transportation to meet delivery deadlines;increases in borrowing costs due to any decline in NIKE’s debt ratings;changes in business strategy or development plans; general risks associatedwith doing business outside the United States, including, without limitation,exchange rate fluctuations, import duties, tariffs, quotas, political andeconomic instability and terrorism; changes in government regulations; theimpact of, including business and legal developments relating to, climatechange, natural disasters, liability and other claims asserted against NIKE; theability to attract and retain qualified personnel; the effects of NIKE’s decisionto invest in or divest of businesses and other factors referenced orincorporated by reference in this report and other reports.
The risks included here are not exhaustive. Other sections of this report mayinclude additional factors which could adversely affect NIKE’s business andfinancial performance. Moreover, NIKE operates in a very competitive andrapidly changing environment. New risks emerge from time to time and it isnot possible for management to predict all such risks, nor can it assess theimpact of all such risks on NIKE’s business or the extent to which any risk, orcombination of risks, may cause actual results to differ materially from thosecontained in any forward-looking statements. Given these risks anduncertainties, investors should not place undue reliance on forward-lookingstatements as a prediction of actual results.
Investors should also be aware that while NIKE does, from time to time,communicate with securities analysts, it is against NIKE’s policy to disclose tothem any material non-public information or other confidential commercialinformation. Accordingly, shareholders should not assume that NIKE agreeswith any statement or report issued by any analyst irrespective of the contentof the statement or report. Furthermore, NIKE has a policy against issuing orconfirming financial forecasts or projections issued by others. Thus, to theextent that reports issued by securities analysts contain any projections,forecasts or opinions, such reports are not the responsibility of NIKE.
Our products face intense competition.
NIKE is a consumer products company and the relative popularity of varioussports and fitness activities and changing design trends affect the demand forour products. The athletic footwear, apparel and equipment industry is highlycompetitive both in the United States and worldwide. We competeinternationally with a significant number of athletic and leisure footwearcompanies, athletic and leisure apparel companies, sports equipmentcompanies and large companies having diversified lines of athletic and leisurefootwear, apparel and equipment. We also compete with other companies forthe production capacity of independent manufacturers that produce ourproducts.
Product offerings, technologies, marketing expenditures (includingexpenditures for advertising and endorsements), pricing, costs of production,customer service and social media presence are areas of intense competition.This, in addition to rapid changes in technology and consumer preferences inthe markets for athletic and leisure footwear and apparel and athleticequipment, constitute significant risk factors in our operations. If we do notadequately and timely anticipate and respond to our competitors, our costsmay increase or the consumer demand for our products may declinesignificantly.
Failure to maintain our reputation and brand image couldnegatively impact our business.
Our iconic brands have worldwide recognition, and our success depends onour ability to maintain and enhance our brand image and reputation.Maintaining, promoting and growing our brands will depend on our designand marketing efforts, including advertising and consumer campaigns,product innovation and product quality. Our commitment to productinnovation and quality and our continuing investment in design (includingmaterials) and marketing may not have the desired impact on our brandimage and reputation. We could be adversely impacted if we fail to achieveany of these objectives or if the reputation or image of any of our brands istarnished or receives negative publicity. In addition, adverse publicity aboutregulatory or legal action against us, or by us, could damage our reputationand brand image, undermine consumer confidence in us and reduce long-term demand for our products, even if the regulatory or legal action isunfounded or not material to our operations.
In addition, our success in maintaining, extending and expanding our brandimage depends on our ability to adapt to a rapidly changing mediaenvironment, including our increasing reliance on social media and digitaldissemination of advertising campaigns. Negative posts or comments aboutus on social networking websites could seriously damage our reputation andbrand image. If we do not maintain, extend and expand our brand image,then our product sales, financial condition and results of operations could bematerially and adversely affected.
If we are unable to anticipate consumer preferences anddevelop new products, we may not be able to maintain orincrease our revenues and profits.
Our success depends on our ability to identify, originate and define producttrends as well as to anticipate, gauge and react to changing consumerdemands in a timely manner. However, lead times for many of our products
62
PART I
may make it more difficult for us to respond rapidly to new or changingproduct trends or consumer preferences. All of our products are subject tochanging consumer preferences that cannot be predicted with certainty. Ournew products may not receive consumer acceptance as consumerpreferences could shift rapidly to different types of performance products oraway from these types of products altogether, and our future successdepends in part on our ability to anticipate and respond to these changes. Ifwe fail to anticipate accurately and respond to trends and shifts in consumerpreferences by adjusting the mix of existing product offerings, developing newproducts, designs, styles and categories, and influencing sports and fitnesspreferences through aggressive marketing, we could experience lower sales,excess inventories or lower profit margins, any of which could have anadverse effect on our results of operations and financial condition. In addition,we market our products globally through a diverse spectrum of advertisingand promotional programs and campaigns, including social media and onlineadvertising. If we do not successfully market our products or if advertising andpromotional costs increase, these factors could have an adverse effect on ourbusiness, financial condition and results of operations.
We rely on technical innovation and high-quality productsto compete in the market for our products.
Technical innovation and quality control in the design and manufacturingprocess of footwear, apparel and athletic equipment is essential to thecommercial success of our products. Research and development plays a keyrole in technical innovation. We rely upon specialists in the fields ofbiomechanics, chemistry, exercise physiology, engineering, industrial design,sustainability and related fields, as well as research committees and advisoryboards made up of athletes, coaches, trainers, equipment managers,orthopedists, podiatrists and other experts to develop and test cutting edgeperformance products. While we strive to produce products that help toenhance athletic performance, reduce injury and maximize comfort, if we failto introduce technical innovation in our products, consumer demand for ourproducts could decline, and if we experience problems with the quality of ourproducts, we may incur substantial expense to remedy the problems.
Failure to continue to obtain or maintain high-qualityendorsers of our products could harm our business.
We establish relationships with professional athletes, sports teams andleagues to develop, evaluate and promote our products, as well as establishproduct authenticity with consumers. However, as competition in our industryhas increased, the costs associated with establishing and retaining suchsponsorships and other relationships have increased. If we are unable tomaintain our current associations with professional athletes, sports teams andleagues, or to do so at a reasonable cost, we could lose the on-fieldauthenticity associated with our products, and we may be required to modifyand substantially increase our marketing investments. As a result, our brands,net revenues, expenses and profitability could be harmed.
Furthermore, if certain endorsers were to stop using our products contrary totheir endorsement agreements, our business could be adversely affected. Inaddition, actions taken by athletes, teams or leagues associated with ourproducts that harm the reputations of those athletes, teams or leagues, couldalso seriously harm our brand image with consumers and, as a result, couldhave an adverse effect on our sales and financial condition. In addition, poorperformance by our endorsers, a failure to continue to correctly identifypromising athletes to use and endorse our products or a failure to enter intocost-effective endorsement arrangements with prominent athletes and sportsorganizations could adversely affect our brand, sales and profitability.
Currency exchange rate fluctuations could result in lowerrevenues, higher costs and decreased margins andearnings.
A majority of our products are manufactured and sold outside of the UnitedStates. As a result, we conduct purchase and sale transactions in variouscurrencies, which increases our exposure to fluctuations in foreign currencyexchange rates globally. Additionally, there has been, and may continue tobe, volatility in currency exchange rates as a result of the United Kingdom’sJune 23, 2016 referendum in which voters approved the United Kingdom’s
exit from the European Union, commonly referred to as “Brexit.” Ourinternational revenues and expenses generally are derived from sales andoperations in foreign currencies, and these revenues and expenses could beaffected by currency fluctuations, specifically amounts recorded in foreigncurrencies and translated into U.S. Dollars for consolidated financial reporting,as weakening of foreign currencies relative to the U.S. Dollar adversely affectsthe U.S. Dollar value of the Company’s foreign currency-denominated salesand earnings. Currency exchange rate fluctuations could also disrupt thebusiness of the independent manufacturers that produce our products bymaking their purchases of raw materials more expensive and more difficult tofinance. Foreign currency fluctuations have adversely affected and couldcontinue to have an adverse effect on our results of operations and financialcondition.
We may hedge certain foreign currency exposures to lessen and delay, butnot to completely eliminate, the effects of foreign currency fluctuations on ourfinancial results. Since the hedging activities are designed to lessen volatility,they not only reduce the negative impact of a stronger U.S. Dollar or othertrading currency, but they also reduce the positive impact of a weaker U.S.Dollar or other trading currency. Our future financial results could besignificantly affected by the value of the U.S. Dollar in relation to the foreigncurrencies in which we conduct business. The degree to which our financialresults are affected for any given time period will depend in part upon ourhedging activities.
Global economic conditions could have a material adverseeffect on our business, operating results and financialcondition.
The uncertain state of the global economy continues to impact businessesaround the world, most acutely in emerging markets and developingeconomies. If global economic and financial market conditions do notimprove or deteriorate, the following factors could have a material adverseeffect on our business, operating results and financial condition:
• Slower consumer spending may result in reduced demand for ourproducts, reduced orders from retailers for our products, ordercancellations, lower revenues, higher discounts, increased inventories andlower gross margins.
• In the future, we may be unable to access financing in the credit and capitalmarkets at reasonable rates in the event we find it desirable to do so.
• We conduct transactions in various currencies, which increases ourexposure to fluctuations in foreign currency exchange rates relative to theU.S. Dollar. Continued volatility in the markets and exchange rates forforeign currencies and contracts in foreign currencies could have asignificant impact on our reported operating results and financial condition.
• Continued volatility in the availability and prices for commodities and rawmaterials we use in our products and in our supply chain (such as cotton orpetroleum derivatives) could have a material adverse effect on our costs,gross margins and profitability.
• If retailers of our products experience declining revenues or experiencedifficulty obtaining financing in the capital and credit markets to purchaseour products, this could result in reduced orders for our products, ordercancellations, late retailer payments, extended payment terms, higheraccounts receivable, reduced cash flows, greater expense associated withcollection efforts and increased bad debt expense.
• If retailers of our products experience severe financial difficulty, some maybecome insolvent and cease business operations, which could negativelyimpact the sale of our products to consumers.
• If contract manufacturers of our products or other participants in our supplychain experience difficulty obtaining financing in the capital and creditmarkets to purchase raw materials or to finance capital equipment andother general working capital needs, it may result in delays or non-delivery ofshipments of our products.
NIKE, INC. 2016 Annual Report and Notice of Annual Meeting 63
FOR
M10
-K
PART I
Our business is affected by seasonality, which could resultin fluctuations in our operating results.
We experience moderate fluctuations in aggregate sales volume during theyear. Historically, revenues in the first and fourth fiscal quarters have slightlyexceeded those in the second and third fiscal quarters. However, the mix ofproduct sales may vary considerably from time to time as a result of changesin seasonal and geographic demand for particular types of footwear, appareland equipment and in connection with the timing of significant sportingevents, including without limitation the Olympics and the European footballchampionship. In addition, our customers may cancel orders, change deliveryschedules or change the mix of products ordered with minimal notice. As aresult, we may not be able to accurately predict our quarterly sales.Accordingly, our results of operations are likely to fluctuate significantly fromperiod to period. This seasonality, along with other factors that are beyond ourcontrol, including general economic conditions, changes in consumerpreferences, weather conditions, availability of import quotas, transportationdisruptions and currency exchange rate fluctuations, could adversely affectour business and cause our results of operations to fluctuate. Our operatingmargins are also sensitive to a number of additional factors that are beyondour control, including manufacturing and transportation costs, shifts inproduct sales mix and geographic sales trends, all of which we expect tocontinue. Results of operations in any period should not be consideredindicative of the results to be expected for any future period.
Futures orders may not be an accurate indication of ourfuture revenues.
We make substantial use of our futures ordering program, which allowsretailers to order five to six months in advance of delivery with the commitmentthat their orders will be delivered within a set period of time at a fixed price.Our futures ordering program allows us to minimize the amount of productswe hold in inventory, purchasing costs, the time necessary to fill customerorders and the risk of non-delivery. We report changes in futures orders in ourperiodic financial reports. Although we believe futures orders are an importantindicator of our future revenues, reported futures orders are not necessarilyindicative of our expectation of revenues for any future period. This is due toyear-over-year changes in shipment timing, changes in the mix of ordersbetween futures and at-once orders and because the fulfillment of certainorders may fall outside of the schedule noted above. In addition, foreigncurrency exchange rate fluctuations, as well as differing levels of ordercancellations, discounts and returns can cause differences in thecomparisons between futures orders and actual revenues. Moreover, aportion of our revenue is not derived from futures orders, including sales of at-once and closeout NIKE Brand footwear and apparel, all sales of NIKE Brandequipment, the difference between retail sales and internal orders from ourDirect to Consumer in-line stores and e-commerce operations, and salesfrom Converse, NIKE Golf and Hurley.
Our futures ordering program does not prevent excessinventories or inventory shortages, which could result indecreased operating margins, reduced cash flows andharm to our business.
We purchase products from manufacturers outside of our futures orderingprogram and in advance of customer orders, which we hold in inventory andresell to customers. There is a risk we may be unable to sell excess productsordered from manufacturers. Inventory levels in excess of customer demandmay result in inventory write-downs, and the sale of excess inventory atdiscounted prices could significantly impair our brand image and have anadverse effect on our operating results, financial condition and cash flows.Conversely, if we underestimate consumer demand for our products or if ourmanufacturers fail to supply products we require at the time we need them,we may experience inventory shortages. Inventory shortages might delayshipments to customers, negatively impact retailer and distributorrelationships and diminish brand loyalty.
The difficulty in forecasting demand also makes it difficult to estimate ourfuture results of operations, financial condition and cash flows from period toperiod. A failure to accurately predict the level of demand for our productscould adversely affect our net revenues and net income, and we are unlikelyto forecast such effects with any certainty in advance.
We may be adversely affected by the financial health of ourcustomers.
We extend credit to our customers based on an assessment of a customer’sfinancial condition, generally without requiring collateral. To assist in thescheduling of production and the shipping of seasonal products, we offercustomers the ability to place orders five to six months ahead of deliveryunder our futures ordering program. These advance orders may be canceled,and the risk of cancellation may increase when dealing with financiallyunstable retailers or retailers struggling with economic uncertainty. In the past,some customers have experienced financial difficulties up to and includingbankruptcies, which have had an adverse effect on our sales, our ability tocollect on receivables and our financial condition. When the retail economyweakens, retailers may be more cautious with orders. A slowing economy inour key markets could adversely affect the financial health of our customers,which in turn could have an adverse effect on our results of operations andfinancial condition. In addition, product sales are dependent in part on highquality merchandising and an appealing store environment to attractconsumers, which requires continuing investments by retailers. Retailers thatexperience financial difficulties may fail to make such investments or delaythem, resulting in lower sales and orders for our products.
Consolidation of retailers or concentration of retail marketshare among a few retailers may increase and concentrateour credit risk and impair our ability to sell products.
The athletic footwear, apparel and equipment retail markets in some countriesare dominated by a few large athletic footwear, apparel and equipmentretailers with many stores. These retailers have in the past increased theirmarket share and may continue to do so in the future by expanding throughacquisitions and construction of additional stores. These situationsconcentrate our credit risk with a relatively small number of retailers, and, ifany of these retailers were to experience a shortage of liquidity, it wouldincrease the risk that their outstanding payables to us may not be paid. Inaddition, increasing market share concentration among one or a few retailersin a particular country or region increases the risk that if any one of themsubstantially reduces their purchases of our products, we may be unable tofind a sufficient number of other retail outlets for our products to sustain thesame level of sales and revenues.
Our Direct to Consumer operations have required and willcontinue to require a substantial investment andcommitment of resources and are subject to numerousrisks and uncertainties.
Our Direct to Consumer stores have required substantial fixed investment inequipment and leasehold improvements, information systems, inventory andpersonnel. We have entered into substantial operating lease commitments forretail space. Certain stores have been designed and built to serve as high-profile venues to promote brand awareness and marketing activities.Because of their unique design elements, locations and size, these storesrequire substantially more investment than other stores. Due to the high fixed-cost structure associated with our Direct to Consumer operations, a decline insales or the closure or poor performance of individual or multiple stores couldresult in significant lease termination costs, write-offs of equipment andleasehold improvements and employee-related costs.
Many factors unique to retail operations, some of which are beyond theCompany’s control, pose risks and uncertainties. Risks include, but are notlimited to: credit card fraud; mismanagement of existing retail channelpartners; and inability to manage costs associated with store constructionand operation. In addition, extreme weather conditions in the areas in whichour stores are located could adversely affect our business.
If the technology-based systems that give our customersthe ability to shop with us online do not function effectively,our operating results, as well as our ability to grow oure-commerce business globally, could be materiallyadversely affected.
Many of our customers shop with us through our e-commerce website andmobile commerce applications. Increasingly, customers are using tablets andsmart phones to shop online with us and with our competitors and to do
64
PART I
comparison shopping. We are increasingly using social media and proprietarymobile applications to interact with our customers and as a means toenhance their shopping experience. Any failure on our part to provideattractive, effective, reliable, user-friendly e-commerce platforms that offer awide assortment of merchandise with rapid delivery options and thatcontinually meet the changing expectations of online shoppers could place usat a competitive disadvantage, result in the loss of e-commerce and othersales, harm our reputation with customers, have a material adverse impact onthe growth of our e-commerce business globally and could have a materialadverse impact on our business and results of operations.
Risks specific to our e-commerce business also include diversion of salesfrom our and our retailers’ brick and mortar stores, difficulty in recreating thein-store experience through direct channels and liability for online content. Ourfailure to successfully respond to these risks might adversely affect sales inour e-commerce business, as well as damage our reputation and brands.
Failure to adequately protect or enforce our intellectualproperty rights could adversely affect our business.
We believe that our intellectual property rights are important to our brand, oursuccess and our competitive position. We periodically discover products thatare counterfeit reproductions of our products or that otherwise infringe on ourintellectual property rights. If we are unsuccessful in enforcing our intellectualproperty, continued sales of these products could adversely affect our salesand our brand and could result in a shift of consumer preference away fromour products.
The actions we take to establish and protect our intellectual property rightsmay not be adequate to prevent imitation of our products by others or toprevent others from seeking to block sales of our products as violations ofproprietary rights.
We may be subject to liability if third parties successfully claim that we infringeon their intellectual property rights. Defending infringement claims could beexpensive and time-consuming and might result in our entering into costlylicense agreements. We also may be subject to significant damages orinjunctions against development, use, importation and/or sale of certainproducts.
We take various actions to prevent the unauthorized use and/or disclosure ofconfidential information. Such actions include contractual measures such asentering into non-disclosure and non-compete agreements and providingconfidential information awareness training. Our controls and efforts toprevent unauthorized use and/or disclosure of confidential information mightnot always be effective. Confidential information that is related to businessstrategy, new technologies, mergers and acquisitions, unpublished financialresults or personal data could be prematurely or inadvertently used and/ordisclosed, resulting in a loss of reputation, a decline in our stock price and/or anegative impact on our market position, and could lead to damages, fines,penalties or injunctions.
In addition, the laws of certain countries may not protect or allow enforcementof intellectual property rights to the same extent as the laws of the UnitedStates. We may face significant expenses and liability in connection with theprotection of our intellectual property rights, including outside the UnitedStates, and if we are unable to successfully protect our rights or resolveintellectual property conflicts with others, our business or financial conditionmay be adversely affected.
We are subject to the risk that our licensees may notgenerate expected sales or maintain the value of ourbrands.
We currently license, and expect to continue licensing, certain of ourproprietary rights, such as trademarks or copyrighted material, to third parties.If our licensees fail to successfully market and sell licensed products, or fail toobtain sufficient capital or effectively manage their business operations,customer relationships, labor relationships, supplier relationships or creditrisks, it could adversely affect our revenues, both directly from reducedroyalties received and indirectly from reduced sales of our other products.
We also rely on our licensees to help preserve the value of our brands.Although we attempt to protect our brands through approval rights over the
design, production processes, quality, packaging, merchandising,distribution, advertising and promotion of our licensed products, we cannotcompletely control the use of our licensed brands by our licensees. Themisuse of a brand by a licensee could have a material adverse effect on thatbrand and on us.
We are subject to data security and privacy risks that couldnegatively affect our results, operations or reputation.
In addition to our own sensitive and proprietary business information, wecollect transactional and personal information about our customers and usersof our digital experiences, which include online distribution channels andproduct engagement and personal fitness applications. Hackers and datathieves are increasingly sophisticated and operate large-scale and complexautomated attacks. Any breach of our network may result in the loss ofvaluable business data, misappropriation of our consumers’, users’ oremployees’ personal information or a disruption of our business, which couldgive rise to unwanted media attention, materially damage our consumers,customer relationships and our reputation and result in lost sales, lost users,fines, or lawsuits. We also may need to expend significant resources toprotect against, respond to and/or redress problems caused by any breach.
In addition, we must comply with increasingly complex and rigorousregulatory standards enacted to protect business and personal data.Compliance with existing and proposed laws and regulations can be costly,and any failure to comply with these regulatory standards could subject us tolegal and reputational risks. Misuse of or failure to secure personal informationcould also result in violation of data privacy laws and regulations, proceedingsagainst the Company by governmental entities or others, damage to ourreputation and credibility and could have a negative impact on revenues andprofits.
Failure of our contractors or our licensees’ contractors tocomply with our code of conduct, local laws and otherstandards could harm our business.
We work with hundreds of contractors outside of the United States tomanufacture our products, and we also have license agreements that permitunaffiliated parties to manufacture or contract for the manufacture of productsusing our intellectual property. We require the contractors that directlymanufacture our products and our licensees that make products using ourintellectual property (including, indirectly, their contract manufacturers) tocomply with a code of conduct and other environmental, health and safetystandards for the benefit of workers. We also require these contractors tocomply with applicable standards for product safety. Notwithstanding theircontractual obligations, from time to time contractors may not comply withsuch standards or applicable local law or our licensees may fail to enforcesuch standards or applicable local law on their contractors. Significant orcontinuing noncompliance with such standards and laws by one or morecontractors could harm our reputation or result in a product recall and, as aresult, could have an adverse effect on our sales and financial condition.
Our international operations involve inherent risks whichcould result in harm to our business.
Virtually all of our athletic footwear and apparel is manufactured outside of theUnited States, and the majority of our products are sold outside of the UnitedStates. Accordingly, we are subject to the risks generally associated withglobal trade and doing business abroad, which include foreign laws andregulations, varying consumer preferences across geographic regions,political unrest, disruptions or delays in cross-border shipments and changesin economic conditions in countries in which our products are manufacturedor where we sell products. This includes, for example, the uncertaintysurrounding the implementation and effect of Brexit, including changes to thelegal and regulatory framework that apply to the United Kingdom and itsrelationship with the European Union. In addition, disease outbreaks, terroristacts and military conflict have increased the risks of doing business abroad.These factors, among others, could affect our ability to manufacture productsor procure materials, our ability to import products, our ability to sell productsin international markets and our cost of doing business. If any of these or otherfactors make the conduct of business in a particular country undesirable orimpractical, our business could be adversely affected. In addition, many of our
NIKE, INC. 2016 Annual Report and Notice of Annual Meeting 65
FOR
M10
-K
PART I
imported products are subject to duties, tariffs or quotas that affect the costand quantity of various types of goods imported into the United States andother countries. Any country in which our products are produced or sold mayeliminate, adjust or impose new quotas, duties, tariffs, safeguard measures,anti-dumping duties, cargo restrictions to prevent terrorism, restrictions onthe transfer of currency, climate change legislation, product safety regulationsor other charges or restrictions, any of which could have an adverse effect onour results of operations and financial condition.
We could be subject to changes in tax rates, adoption ofnew tax laws or additional tax liabilities.
We are subject to the tax laws in the United States and numerous foreignjurisdictions. Current economic and political conditions make tax rules in anyjurisdiction, including the United States, subject to significant change. Therehave been proposals to reform U.S. and foreign tax laws that couldsignificantly impact how U.S. multinational corporations are taxed on foreignearnings. Although we cannot predict whether or in what form theseproposals will pass, several of the proposals considered, if enacted into law,could have an adverse impact on our income tax expense and cash flows.We earn a substantial portion of our income in foreign countries and aresubject to the tax laws of those jurisdictions. If our capital or financing needs inthe United States require us to repatriate earnings from foreign jurisdictionsabove our current levels, our effective income tax rates for the affectedperiods could be negatively impacted.
Portions of our operations are subject to a reduced tax rate or are free of taxunder various tax holidays and rulings that expire in whole or in part from timeto time. These tax holidays and rulings may be extended when certainconditions are met, or terminated if certain conditions are not met. If the taxholidays and rulings are not extended, or if we fail to satisfy the conditions ofthe reduced tax rate, our future effective income tax rate would increase in thefuture.
We are also subject to the examination of our tax returns by the United StatesInternal Revenue Service (“IRS”) and other tax authorities. We regularly assessthe likelihood of an adverse outcome resulting from these examinations todetermine the adequacy of its provision for income taxes. Although we believeour tax provisions are adequate, the final determination of tax audits and anyrelated disputes could be materially different from our historical income taxprovisions and accruals. The results of audits or related disputes could havean adverse effect on our financial statements for the period or periods forwhich the applicable final determinations are made. For example, the IRS hasassessed additional tax liabilities for 2011 and 2012 related to a foreign taxcredit matter. We are currently contesting the matter in U.S. Tax Court. Inaddition to the risk of additional tax for these years, if this litigation is adverselydetermined and the IRS was to seek similar adjustments in subsequent years,we could be subject to significant additional tax liabilities. Additionally, we andour subsidiaries are engaged in a number of intercompany transactionsacross multiple tax jurisdictions. Although we believe we have clearly reflectedthe economics of these transactions and the proper local transfer pricingdocumentation is in place, tax authorities may propose and sustainadjustments that could result in changes that may impact our mix of earningsin countries with differing statutory tax rates.
If one or more of our counterparty financial institutionsdefault on their obligations to us or fail, we may incursignificant losses.
As part of our hedging activities, we enter into transactions involving derivativefinancial instruments, which may include forward contracts, commodityfutures contracts, option contracts, collars and swaps with various financialinstitutions. In addition, we have significant amounts of cash, cash equivalentsand other investments on deposit or in accounts with banks or other financialinstitutions in the United States and abroad. As a result, we are exposed tothe risk of default by or failure of counterparty financial institutions. The risk ofcounterparty default or failure may be heightened during economicdownturns and periods of uncertainty in the financial markets. If one of ourcounterparties were to become insolvent or file for bankruptcy, our ability torecover losses incurred as a result of default or our assets that are depositedor held in accounts with such counterparty may be limited by thecounterparty’s liquidity or the applicable laws governing the insolvency or
bankruptcy proceedings. In the event of default or failure of one or more of ourcounterparties, we could incur significant losses, which could negativelyimpact our results of operations and financial condition.
We rely on a concentrated source base of contractmanufacturers to supply a significant portion of ourfootwear products.
NIKE is supplied by approximately 142 footwear factories located in 15countries. We do not own or operate any of our own footwear manufacturingfacilities and depend upon independent contract manufacturers tomanufacture all of the footwear products we sell. In fiscal 2016, five footwearcontract manufacturers each accounted for greater than 10% of fiscal 2016footwear production and in aggregate accounted for approximately 69% ofNIKE Brand footwear production in fiscal 2016. Our ability to meet ourcustomers’ needs depends on our ability to maintain a steady supply ofproducts from our independent contract manufacturers. If one or more of oursignificant suppliers were to sever their relationship with us or significantly alterthe terms of our relationship, we may not be able to obtain replacementproducts in a timely manner, which could have a material adverse effect onour sales, financial condition or results of operations. Additionally, if any of ourprimary contract manufacturers fail to make timely shipments, do not meetour quality standards or otherwise fail to deliver us product in accordance withour plans, there could be a material adverse effect on our results ofoperations.
Our products are subject to risks associated with overseassourcing, manufacturing and financing.
The principal materials used in our apparel products — natural and syntheticfabrics and threads, specialized performance fabrics designed to efficientlywick moisture away from the body, retain heat or repel rain and/or snow aswell as plastic and metal hardware — are available in countries where ourmanufacturing takes place. The principal materials used in our footwearproducts — natural and synthetic rubber, plastic compounds, foamcushioning materials, natural and synthetic leather, natural and syntheticfabrics and threads, nylon, canvas and polyurethane films — are also locallyavailable to manufacturers. Both our apparel and footwear products aredependent upon the ability of our unaffiliated contract manufacturers tolocate, train, employ and retain adequate personnel. NIKE contractors andsuppliers buy raw materials and are subject to wage rates that are oftentimesregulated by the governments of the countries in which our products aremanufactured.
There could be a significant disruption in the supply of fabrics or raw materialsfrom current sources or, in the event of a disruption, our contractmanufacturers might not be able to locate alternative suppliers of materials ofcomparable quality at an acceptable price or at all. Further, our unaffiliatedcontract manufacturers have experienced and may continue to experience inthe future, unexpected increases in work wages, whether governmentmandated or otherwise and increases in compliance costs due togovernmental regulation concerning certain metals used in the manufacturingof our products. In addition, we cannot be certain that our unaffiliatedmanufacturers will be able to fill our orders in a timely manner. If weexperience significant increases in demand, or reductions in the availability ofmaterials, or need to replace an existing manufacturer, there can be noassurance that additional supplies of fabrics or raw materials or additionalmanufacturing capacity will be available when required on terms that areacceptable to us, or at all, or that any supplier or manufacturer would allocatesufficient capacity to us in order to meet our requirements. In addition, even ifwe are able to expand existing or find new manufacturing or sources ofmaterials, we may encounter delays in production and added costs as aresult of the time it takes to train suppliers and manufacturers in our methods,products, quality control standards and labor, health and safety standards.Any delays, interruption or increased costs in labor or wages, or the supply ofmaterials or manufacture of our products could have an adverse effect on ourability to meet retail customer and consumer demand for our products andresult in lower revenues and net income both in the short- and long-term.
Because independent manufacturers make a majority of our products outsideof our principal sales markets, our products must be transported by thirdparties over large geographic distances. Delays in the shipment or delivery of
66
PART I
our products due to the availability of transportation, work stoppages, portstrikes, infrastructure congestion or other factors, and costs and delaysassociated with consolidating or transitioning between manufacturers, couldadversely impact our financial performance. In addition, manufacturing delaysor unexpected demand for our products may require us to use faster, butmore expensive, transportation methods such as air freight, which couldadversely affect our profit margins. The cost of oil is a significant component inmanufacturing and transportation costs, so increases in the price ofpetroleum products can adversely affect our profit margins.
In addition, Sojitz America performs significant import-export financingservices for the Company. During fiscal 2016, Sojitz America providedfinancing and purchasing services for NIKE Brand products sold in certainNIKE markets including Argentina, Uruguay, Brazil, Canada, India, SouthAfrica and Thailand (collectively the “Sojitz Markets”), excluding productsproduced and sold in the same country. Any failure of Sojitz America toprovide these services or any failure of Sojitz America’s banks could disruptour ability to acquire products from our suppliers and to deliver products toour customers in the Sojitz Markets. Such a disruption could result incanceled orders that would adversely affect sales and profitability.
Our success depends on our global distribution facilities.
We distribute our products to customers directly from the factory and throughdistribution centers located throughout the world. Our ability to meetcustomer expectations, manage inventory, complete sales and achieveobjectives for operating efficiencies and growth, particularly in emergingmarkets, depends on the proper operation of our distribution facilities, thedevelopment or expansion of additional distribution capabilities and the timelyperformance of services by third parties (including those involved in shippingproduct to and from our distribution facilities). Our distribution facilities couldbe interrupted by information technology problems and disasters such asearthquakes or fires. Any significant failure in our distribution facilities couldresult in an adverse effect on our business. We maintain business interruptioninsurance, but it may not adequately protect us from adverse effects thatcould be caused by significant disruptions in our distribution facilities.
We rely significantly on information technology to operateour business, including our supply chain and retailoperations, and any failure, inadequacy or interruption ofthat technology could harm our ability to effectivelyoperate our business.
We are heavily dependent on information technology systems and networks,including the Internet and third-party hosted services (“information technologysystems”), across our supply chain, including product design, production,forecasting, ordering, manufacturing, transportation, sales and distribution, aswell as for processing financial information for external and internal reportingpurposes, retail operations and other business activities. Our informationtechnology systems are critical to many of our operating activities and ourbusiness processes and may be negatively impacted by any serviceinterruption or shutdown. For example, our ability to effectively manage andmaintain our inventory and to ship products to customers on a timely basisdepends significantly on the reliability of these information technologysystems. Over a number of years, we have implemented informationtechnology systems in all of the geographical regions in which we operate.Our work to integrate, secure and enhance these systems and relatedprocesses in our global operations is ongoing and NIKE will continue to investin these efforts. The failure of these systems to operate effectively, including asa result of security breaches, viruses, hackers or other causes, or our failure toproperly maintain, protect, repair or upgrade our systems, or problems withtransitioning to upgraded or replacement systems could cause delays inproduct fulfillment and reduced efficiency of our operations, could requiresignificant capital investments to remediate the problem and may have anadverse effect on our reputation, results of operations and financial condition.
We also use information technology systems to process financial informationand results of operations for internal reporting purposes and to comply withregulatory financial reporting, legal and tax requirements. If our informationtechnology systems suffer severe damage, disruption or shutdown and ourbusiness continuity plans do not effectively resolve the issues in a timely
manner, we could experience delays in reporting our financial results, whichcould result in lost revenues and profits, as well as reputational damage.Furthermore, we depend on information technology systems and personaldata collection and use for digital marketing, digital commerce, consumerengagement and the marketing and use of our digital products and services.We also rely on our ability to engage in electronic communications throughoutthe world between and among our employees as well as with other thirdparties, including customers, suppliers, vendors and consumers. Anyinterruption in our information technology systems may impede our ability toengage in the digital space and result in lost revenues, damage to ourreputation, and loss of users.
The market for prime real estate is competitive.
Our ability to effectively obtain real estate to open new retail stores andotherwise conduct our operations, both domestically and internationally,depends on the availability of real estate that meets our criteria for traffic,square footage, co-tenancies, lease economics, demographics and otherfactors. We also must be able to effectively renew our existing real estateleases. In addition, from time to time, we seek to downsize, consolidate,reposition or close some of our real estate locations, which may requiremodification of an existing lease. Failure to secure adequate new locations orsuccessfully modify leases for existing locations, or failure to effectivelymanage the profitability of our existing fleet of retail stores, could have anadverse effect on our operating results and financial condition.
Additionally, the economic environment may at times make it difficult todetermine the fair market rent of real estate properties domestically andinternationally. This could impact the quality of our decisions to exercise leaseoptions at previously negotiated rents and to renew expiring leases atnegotiated rents. Any adverse effect on the quality of these decisions couldimpact our ability to retain real estate locations adequate to meet our targetsor efficiently manage the profitability of our existing fleet of stores, which couldhave an adverse effect on our operating results and financial condition.
Extreme weather conditions and natural disasters couldnegatively impact our operating results and financialcondition.
Extreme weather conditions in the areas in which our retail stores, suppliers,customers, distribution centers and vendors are located could adverselyaffect our operating results and financial condition. Moreover, naturaldisasters such as earthquakes, hurricanes and tsunamis, whether occurringin the United States or abroad, and their related consequences and effects,including energy shortages and public health issues, could disrupt ouroperations, the operations of our vendors and other suppliers or result ineconomic instability that may negatively impact our operating results andfinancial condition.
Our financial results may be adversely affected ifsubstantial investments in businesses and operations failto produce expected returns.
From time to time, we may invest in technology, business infrastructure, newbusinesses, product offering and manufacturing innovation and expansion ofexisting businesses, such as our retail operations, which require substantialcash investments and management attention. We believe cost-effectiveinvestments are essential to business growth and profitability. However,significant investments are subject to typical risks and uncertainties inherent indeveloping a new business or expanding an existing business. The failure ofany significant investment to provide expected returns or profitability couldhave a material adverse effect on our financial results and divert managementattention from more profitable business operations.
We are subject to periodic litigation and other regulatoryproceedings, which could result in unexpected expense oftime and resources.
From time to time we are called upon to defend ourselves against lawsuitsand regulatory actions relating to our business. Due to the inherentuncertainties of litigation and regulatory proceedings, we cannot accuratelypredict the ultimate outcome of any such proceedings. An unfavorable
NIKE, INC. 2016 Annual Report and Notice of Annual Meeting 67
FOR
M10
-K
PART I
outcome could have an adverse impact on our business, financial conditionand results of operations. In addition, any significant litigation in the future,regardless of its merits, could divert management’s attention from ouroperations and result in substantial legal fees.
We depend on key personnel, the loss of whom wouldharm our business.
Our future success will depend in part on the continued service of keyexecutive officers and personnel. The loss of the services of any key individualcould harm our business. Our future success also depends on our ability torecruit, retain and engage our personnel sufficiently, both to maintain ourcurrent business and to execute our strategic initiatives. Competition foremployees in our industry is intense and we may not be successful inattracting and retaining such personnel.
The sale of a large number of shares of common stock byour principal stockholder could depress the market priceof our common stock.
As of June 30, 2016, Swoosh, LLC beneficially owned more than 78% of ourClass A Common Stock. If, on June 30, 2016, all of these shares wereconverted into Class B Common Stock, the commensurate ownershippercentage of our Class B Common Stock would be approximately 16%. Theshares are available for resale, subject to the requirements of the U.S.securities laws and the terms of the limited liability company agreementgoverning Swoosh, LLC. The sale or prospect of a sale of a substantialnumber of these shares could have an adverse effect on the market price ofour common stock. Swoosh, LLC was formed by Philip H. Knight, ourChairman Emeritus, to hold the majority of his shares of Class A CommonStock. On June 30, 2016, Mr. Knight sold his voting interest in Swoosh, LLCto a trust controlled by his son and NIKE director, Travis Knight.
Changes in our credit ratings or macroeconomicconditions may affect our liquidity, increasing borrowingcosts and limiting our financing options.
Our long-term debt is currently rated Investment Grade by Standard & Poor’sand Moody’s Investors Service. If our credit ratings are lowered, borrowingcosts for future long-term debt or short-term credit facilities may increase andour financing options, including our access to the unsecured credit market,could be limited. We may also be subject to restrictive covenants that wouldreduce our flexibility to, among other things, incur additional indebtedness,make restricted payments, pledge assets as security, make investments,loans, advances, guarantees and acquisitions, undergo fundamentalchanges and enter into transactions with affiliates. Failure to comply with suchcovenants could result in a default, and as a result, the commitments of ourlenders under our credit agreements may be terminated and the maturity ofamounts owed may be accelerated. In addition, macroeconomic conditions,such as increased volatility or disruption in the credit markets, could adverselyaffect our ability to refinance existing debt.
If our internal controls are ineffective, our operating resultscould be adversely affected.
Our internal control over financial reporting may not prevent or detectmisstatements because of its inherent limitations, including the possibility ofhuman error, the circumvention or overriding of controls or fraud. Eveneffective internal controls can provide only reasonable assurance with respectto the preparation and fair presentation of financial statements. If we fail tomaintain the adequacy of our internal controls, including any failure toimplement required new or improved controls, or if we experience difficulties
in their implementation, our business and operating results could be harmedand we could fail to meet our financial reporting obligations.
If our estimates or judgments relating to our criticalaccounting policies prove to be incorrect, our operatingresults could be adversely affected.
The preparation of financial statements in conformity with accountingprinciples generally accepted in the United States of America requiresmanagement to make estimates and assumptions that affect the amountsreported in the consolidated financial statements and accompanying notes.We base our estimates on historical experience and on various otherassumptions that we believe to be reasonable under the circumstances, asprovided in “Management’s Discussion and Analysis of Financial Conditionand Results of Operations.” The results of these estimates form the basis formaking judgments about the carrying values of assets, liabilities and equity,and the amount of revenue and expenses that are not readily apparent fromother sources. Significant assumptions and estimates used in preparing ourconsolidated financial statements include those related to revenuerecognition, allowance for uncollectible accounts receivable, inventories,contingent payments under endorsement contracts, accounting for property,plant and equipment and definite-lived assets and goodwill and indefinite-lived intangible assets. Our operating results may be adversely affected if ourassumptions change or if actual circumstances differ from those in ourassumptions, which could cause our operating results to fall below theexpectations of securities analysts and investors, resulting in a decline in theprice of our Class B Common Stock.
Anti-takeover provisions may impair an acquisition of theCompany or reduce the price of our common stock.
There are provisions of our articles of incorporation and Oregon law that areintended to protect shareholder interests by providing the Board of Directorsa means to attempt to deny coercive takeover attempts or to negotiate with apotential acquirer in order to obtain more favorable terms. Such provisionsinclude a control share acquisition statute, a freeze-out statute, two classes ofstock that vote separately on certain issues, and the fact that holders ofClass A Common Stock elect three-quarters of the Board of Directorsrounded down to the next whole number. However, such provisions coulddiscourage, delay or prevent an unsolicited merger, acquisition or otherchange in control of our company that some shareholders might believe to bein their best interests or in which shareholders might receive a premium fortheir common stock over the prevailing market price. These provisions couldalso discourage proxy contests for control of the Company.
We may fail to meet market expectations, which couldcause the price of our stock to decline.
Our Class B Common Stock is traded publicly, and at any given time varioussecurities analysts follow our financial results and issue reports on us. Thesereports include information about our historical financial results as well asanalysts’ estimates of our future performance. Analysts’ estimates are basedupon their own opinions and are often different from our estimates orexpectations. If our operating results are below the estimates or expectationsof public market analysts and investors, our stock price could decline. In thepast, securities class action litigation has been brought against NIKE andother companies following a decline in the market price of their securities. Ifour stock price is volatile, we may become involved in this type of litigation inthe future. Any litigation could result in substantial costs and a diversion ofmanagement’s attention and resources that are needed to successfully runour business.
68
PART I
ITEM 1B. Unresolved Staff CommentsNone.
ITEM 2. PropertiesThe following is a summary of principal properties owned or leased by NIKE:
The NIKE World Campus, owned by NIKE and located near Beaverton,Oregon, USA, is a 400-acre site consisting of over 40 buildings which,together with adjacent leased properties, functions as our world headquartersand is occupied by approximately 10,700 employees engaged inmanagement, research, design, development, marketing, finance and otheradministrative functions serving nearly all of our divisions. We also leasevarious office facilities in the surrounding metropolitan area. We lease a similar,but smaller, administrative facility in Hilversum, the Netherlands, which servesas the headquarters for the Western Europe and Central & Eastern Europegeographies and management of certain brand functions for our non-U.S.operations. We also lease an office complex in Shanghai, China, ourheadquarters for Greater China, occupied by employees focused onimplementing our wholesale, DTC and merchandising strategies in the region,among other functions. In the United States, NIKE has five significantdistribution centers located in Memphis, Tennessee, two of which are ownedand three are leased. NIKE Brand apparel and equipment are also shipped
from our Foothill Ranch, California distribution center, which we lease. Smallerleased distribution facilities are located in various parts of the United States.We also own or lease distribution and customer service facilities outside theUnited States. The most significant are the distribution facilities located inLaakdal, Belgium; Taicang, China; Tomisato, Japan and Incheon, Korea, all ofwhich we own.
NIKE IHM, Inc. manufactures Air-Sole cushioning components at NIKE-owned facilities located near Beaverton, Oregon and in St. Charles, Missouri.We also manufacture and sell small amounts of various other plastic productsto other manufacturers through NIKE IHM, Inc.
Aside from the principal properties described above, we lease many officesworldwide for sales and administrative purposes. We lease approximately1,044 retail stores worldwide, which consist primarily of factory outlet stores.See “United States Market” and “International Markets” in Part I of this Report.Our leases expire at various dates through the year 2033.
ITEM 3. Legal ProceedingsThere are no material pending legal proceedings, other than ordinary routine litigation incidental to our business, to which we are a party or of which any of ourproperty is the subject.
ITEM 4. Mine Safety DisclosuresNot applicable.
NIKE, INC. 2016 Annual Report and Notice of Annual Meeting 69
FOR
M10
-K
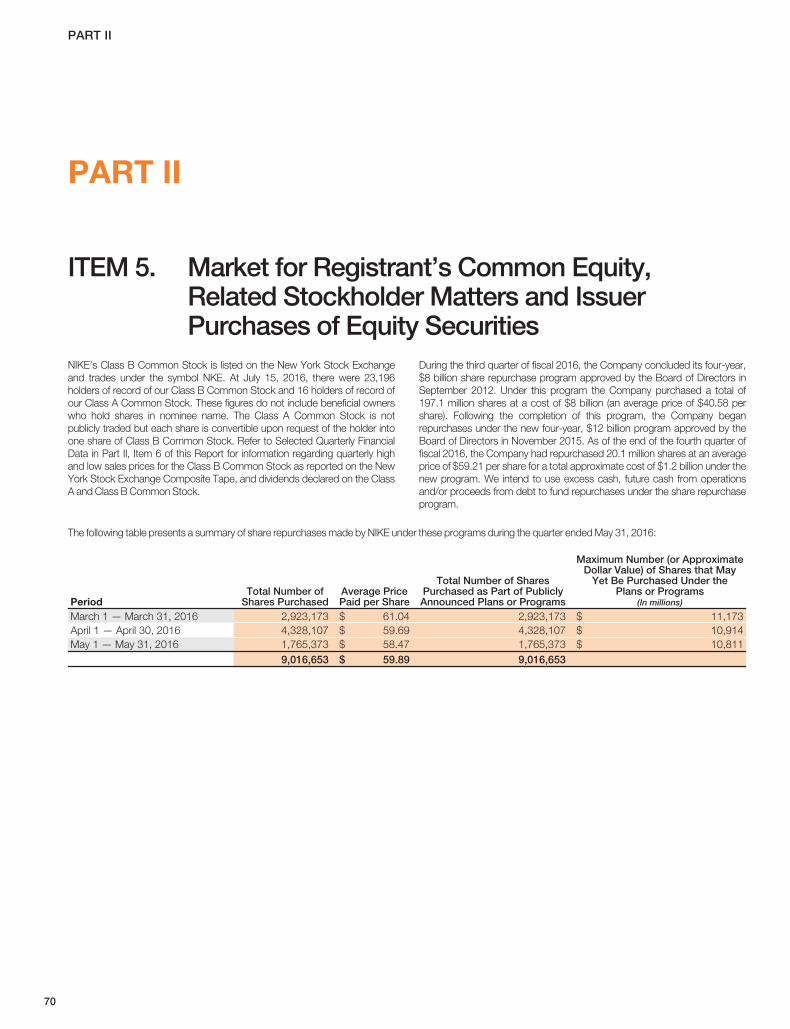
PART II
PART II
ITEM 5. Market for Registrant’s Common Equity,Related Stockholder Matters and IssuerPurchases of Equity Securities
NIKE’s Class B Common Stock is listed on the New York Stock Exchangeand trades under the symbol NKE. At July 15, 2016, there were 23,196holders of record of our Class B Common Stock and 16 holders of record ofour Class A Common Stock. These figures do not include beneficial ownerswho hold shares in nominee name. The Class A Common Stock is notpublicly traded but each share is convertible upon request of the holder intoone share of Class B Common Stock. Refer to Selected Quarterly FinancialData in Part II, Item 6 of this Report for information regarding quarterly highand low sales prices for the Class B Common Stock as reported on the NewYork Stock Exchange Composite Tape, and dividends declared on the ClassA and Class B Common Stock.
During the third quarter of fiscal 2016, the Company concluded its four-year,$8 billion share repurchase program approved by the Board of Directors inSeptember 2012. Under this program the Company purchased a total of197.1 million shares at a cost of $8 billion (an average price of $40.58 pershare). Following the completion of this program, the Company beganrepurchases under the new four-year, $12 billion program approved by theBoard of Directors in November 2015. As of the end of the fourth quarter offiscal 2016, the Company had repurchased 20.1 million shares at an averageprice of $59.21 per share for a total approximate cost of $1.2 billion under thenew program. We intend to use excess cash, future cash from operationsand/or proceeds from debt to fund repurchases under the share repurchaseprogram.
The following table presents a summary of share repurchases made by NIKE under these programs during the quarter ended May 31, 2016:
PeriodTotal Number of
Shares PurchasedAverage PricePaid per Share
Total Number of SharesPurchased as Part of PubliclyAnnounced Plans or Programs
Maximum Number (or ApproximateDollar Value) of Shares that May
Yet Be Purchased Under thePlans or Programs
(In millions)
March 1 — March 31, 2016 2,923,173 $ 61.04 2,923,173 $ 11,173April 1 — April 30, 2016 4,328,107 $ 59.69 4,328,107 $ 10,914May 1 — May 31, 2016 1,765,373 $ 58.47 1,765,373 $ 10,811
9,016,653 $ 59.89 9,016,653
70
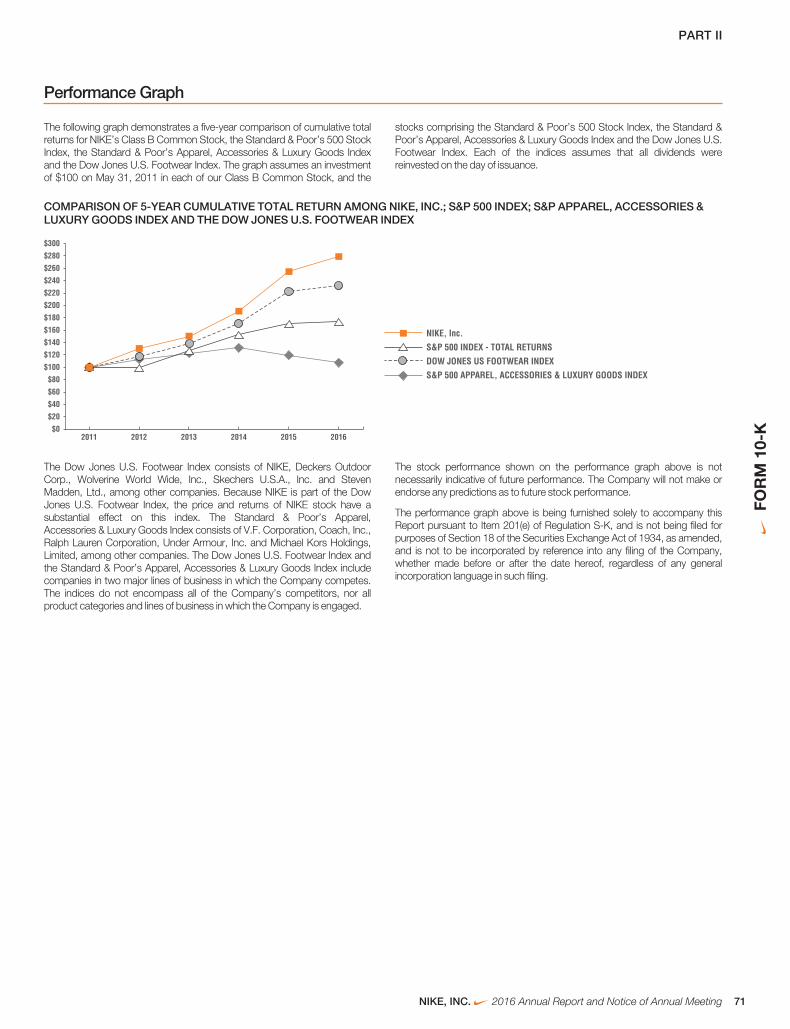
PART II
Performance Graph
The following graph demonstrates a five-year comparison of cumulative totalreturns for NIKE’s Class B Common Stock, the Standard & Poor’s 500 StockIndex, the Standard & Poor’s Apparel, Accessories & Luxury Goods Indexand the Dow Jones U.S. Footwear Index. The graph assumes an investmentof $100 on May 31, 2011 in each of our Class B Common Stock, and the
stocks comprising the Standard & Poor’s 500 Stock Index, the Standard &Poor’s Apparel, Accessories & Luxury Goods Index and the Dow Jones U.S.Footwear Index. Each of the indices assumes that all dividends werereinvested on the day of issuance.
COMPARISON OF 5-YEAR CUMULATIVE TOTAL RETURN AMONG NIKE, INC.; S&P 500 INDEX; S&P APPAREL, ACCESSORIES &LUXURY GOODS INDEX AND THE DOW JONES U.S. FOOTWEAR INDEX
$220$200$180$160$140$120$100$80$60$40$20$0
2011 2012 2013 2014 2015 2016
$240$260$280$300
NIKE, Inc.
S&P 500 INDEX - TOTAL RETURNS
DOW JONES US FOOTWEAR INDEX
S&P 500 APPAREL, ACCESSORIES & LUXURY GOODS INDEX
The Dow Jones U.S. Footwear Index consists of NIKE, Deckers OutdoorCorp., Wolverine World Wide, Inc., Skechers U.S.A., Inc. and StevenMadden, Ltd., among other companies. Because NIKE is part of the DowJones U.S. Footwear Index, the price and returns of NIKE stock have asubstantial effect on this index. The Standard & Poor’s Apparel,Accessories & Luxury Goods Index consists of V.F. Corporation, Coach, Inc.,Ralph Lauren Corporation, Under Armour, Inc. and Michael Kors Holdings,Limited, among other companies. The Dow Jones U.S. Footwear Index andthe Standard & Poor’s Apparel, Accessories & Luxury Goods Index includecompanies in two major lines of business in which the Company competes.The indices do not encompass all of the Company’s competitors, nor allproduct categories and lines of business in which the Company is engaged.
The stock performance shown on the performance graph above is notnecessarily indicative of future performance. The Company will not make orendorse any predictions as to future stock performance.
The performance graph above is being furnished solely to accompany thisReport pursuant to Item 201(e) of Regulation S-K, and is not being filed forpurposes of Section 18 of the Securities Exchange Act of 1934, as amended,and is not to be incorporated by reference into any filing of the Company,whether made before or after the date hereof, regardless of any generalincorporation language in such filing.
NIKE, INC. 2016 Annual Report and Notice of Annual Meeting 71
FOR
M10
-K
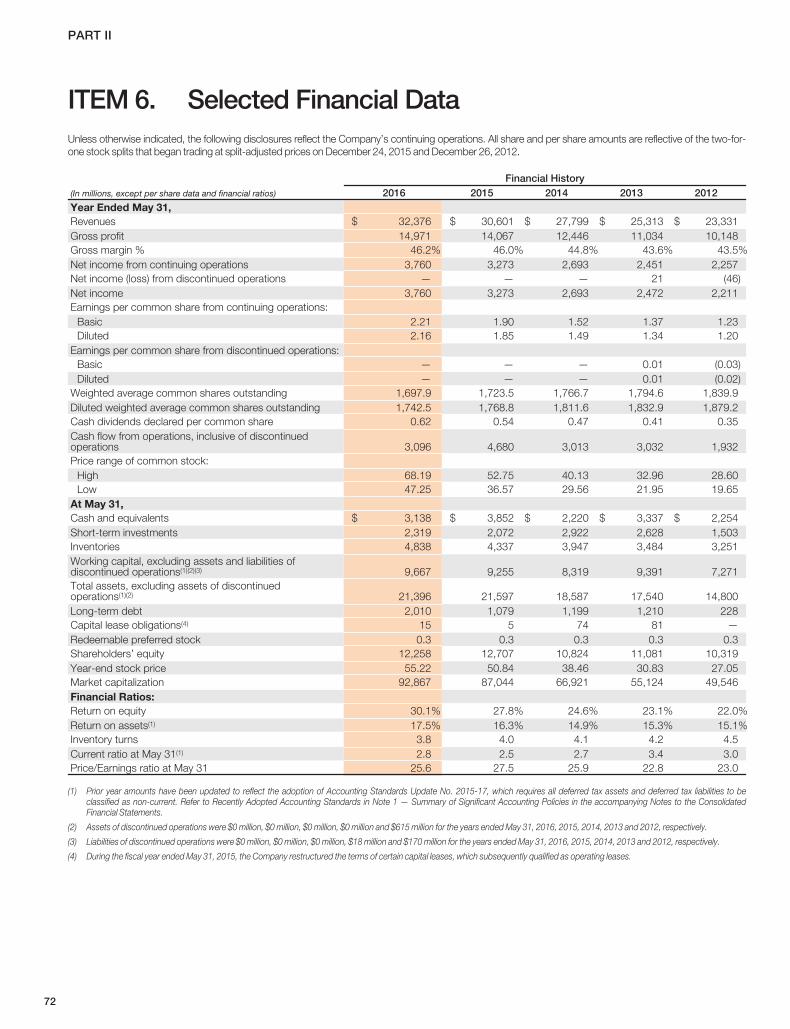
PART II
ITEM 6. Selected Financial DataUnless otherwise indicated, the following disclosures reflect the Company’s continuing operations. All share and per share amounts are reflective of the two-for-one stock splits that began trading at split-adjusted prices on December 24, 2015 and December 26, 2012.
(In millions, except per share data and financial ratios)
Financial History2016 2015 2014 2013 2012
Year Ended May 31,Revenues $ 32,376 $ 30,601 $ 27,799 $ 25,313 $ 23,331Gross profit 14,971 14,067 12,446 11,034 10,148Gross margin % 46.2% 46.0% 44.8% 43.6% 43.5%Net income from continuing operations 3,760 3,273 2,693 2,451 2,257Net income (loss) from discontinued operations — — — 21 (46)Net income 3,760 3,273 2,693 2,472 2,211Earnings per common share from continuing operations:
Basic 2.21 1.90 1.52 1.37 1.23Diluted 2.16 1.85 1.49 1.34 1.20
Earnings per common share from discontinued operations:Basic — — — 0.01 (0.03)Diluted — — — 0.01 (0.02)
Weighted average common shares outstanding 1,697.9 1,723.5 1,766.7 1,794.6 1,839.9Diluted weighted average common shares outstanding 1,742.5 1,768.8 1,811.6 1,832.9 1,879.2Cash dividends declared per common share 0.62 0.54 0.47 0.41 0.35Cash flow from operations, inclusive of discontinuedoperations 3,096 4,680 3,013 3,032 1,932Price range of common stock:
High 68.19 52.75 40.13 32.96 28.60Low 47.25 36.57 29.56 21.95 19.65
At May 31,Cash and equivalents $ 3,138 $ 3,852 $ 2,220 $ 3,337 $ 2,254Short-term investments 2,319 2,072 2,922 2,628 1,503Inventories 4,838 4,337 3,947 3,484 3,251Working capital, excluding assets and liabilities ofdiscontinued operations(1)(2)(3) 9,667 9,255 8,319 9,391 7,271Total assets, excluding assets of discontinuedoperations(1)(2) 21,396 21,597 18,587 17,540 14,800Long-term debt 2,010 1,079 1,199 1,210 228Capital lease obligations(4) 15 5 74 81 —Redeemable preferred stock 0.3 0.3 0.3 0.3 0.3Shareholders’ equity 12,258 12,707 10,824 11,081 10,319Year-end stock price 55.22 50.84 38.46 30.83 27.05Market capitalization 92,867 87,044 66,921 55,124 49,546Financial Ratios:Return on equity 30.1% 27.8% 24.6% 23.1% 22.0%Return on assets(1) 17.5% 16.3% 14.9% 15.3% 15.1%Inventory turns 3.8 4.0 4.1 4.2 4.5Current ratio at May 31(1) 2.8 2.5 2.7 3.4 3.0Price/Earnings ratio at May 31 25.6 27.5 25.9 22.8 23.0
(1) Prior year amounts have been updated to reflect the adoption of Accounting Standards Update No. 2015-17, which requires all deferred tax assets and deferred tax liabilities to beclassified as non-current. Refer to Recently Adopted Accounting Standards in Note 1 — Summary of Significant Accounting Policies in the accompanying Notes to the ConsolidatedFinancial Statements.
(2) Assets of discontinued operations were $0 million, $0 million, $0 million, $0 million and $615 million for the years ended May 31, 2016, 2015, 2014, 2013 and 2012, respectively.
(3) Liabilities of discontinued operations were $0 million, $0 million, $0 million, $18 million and $170 million for the years ended May 31, 2016, 2015, 2014, 2013 and 2012, respectively.
(4) During the fiscal year ended May 31, 2015, the Company restructured the terms of certain capital leases, which subsequently qualified as operating leases.
72
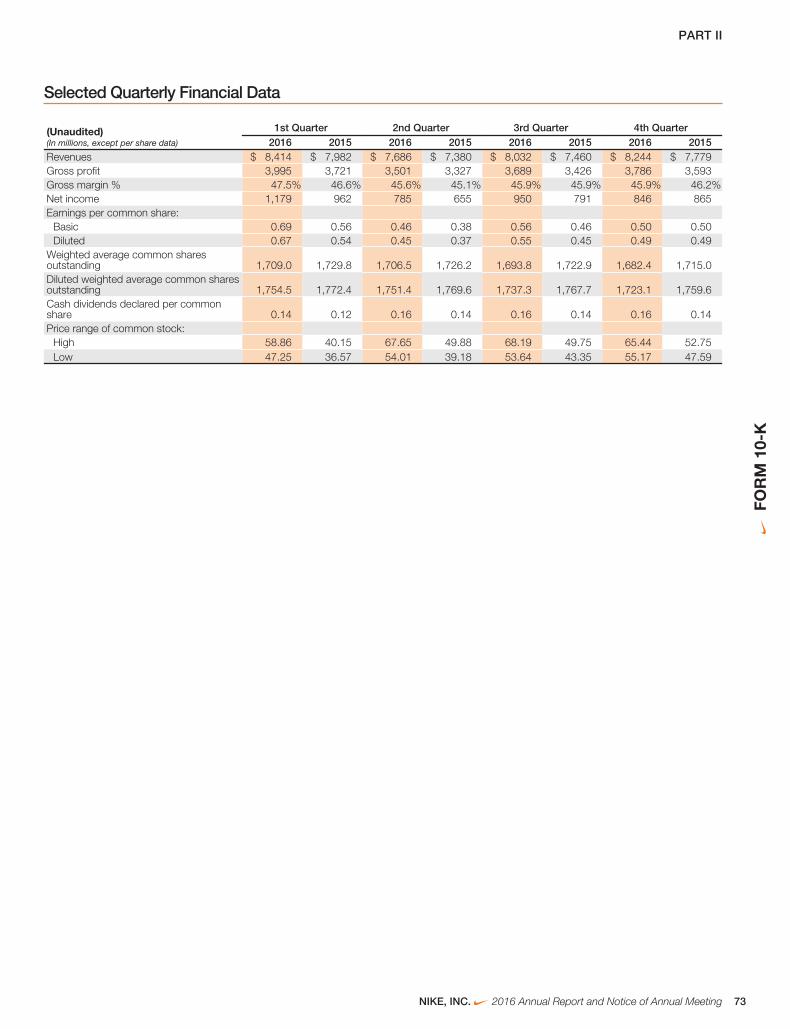
PART II
Selected Quarterly Financial Data
(Unaudited)(In millions, except per share data)
1st Quarter 2nd Quarter 3rd Quarter 4th Quarter2016 2015 2016 2015 2016 2015 2016 2015
Revenues $ 8,414 $ 7,982 $ 7,686 $ 7,380 $ 8,032 $ 7,460 $ 8,244 $ 7,779Gross profit 3,995 3,721 3,501 3,327 3,689 3,426 3,786 3,593Gross margin % 47.5% 46.6% 45.6% 45.1% 45.9% 45.9% 45.9% 46.2%Net income 1,179 962 785 655 950 791 846 865Earnings per common share:
Basic 0.69 0.56 0.46 0.38 0.56 0.46 0.50 0.50Diluted 0.67 0.54 0.45 0.37 0.55 0.45 0.49 0.49
Weighted average common sharesoutstanding 1,709.0 1,729.8 1,706.5 1,726.2 1,693.8 1,722.9 1,682.4 1,715.0Diluted weighted average common sharesoutstanding 1,754.5 1,772.4 1,751.4 1,769.6 1,737.3 1,767.7 1,723.1 1,759.6Cash dividends declared per commonshare 0.14 0.12 0.16 0.14 0.16 0.14 0.16 0.14Price range of common stock:
High 58.86 40.15 67.65 49.88 68.19 49.75 65.44 52.75Low 47.25 36.57 54.01 39.18 53.64 43.35 55.17 47.59
NIKE, INC. 2016 Annual Report and Notice of Annual Meeting 73
FOR
M10
-K
PART II
ITEM 7. Management’s Discussion and Analysis ofFinancial Condition and Results of Operations
NIKE designs, develops, markets and sells athletic footwear, apparel,equipment, accessories and services worldwide. We are the largest seller ofathletic footwear and apparel in the world. We sell our products to retailaccounts, through NIKE-owned in-line and factory retail stores and NIKE-owned internet websites (which we refer to collectively as our “Direct toConsumer” or “DTC” operations) and through a mix of independentdistributors, licensees and sales representatives in virtually all countriesaround the world. Our goal is to deliver value to our shareholders by building aprofitable global portfolio of branded footwear, apparel, equipment andaccessories businesses. Our strategy is to achieve long-term revenue growthby creating innovative, “must have” products, building deep personalconsumer connections with our brands and delivering compelling consumerexperiences at retail and online.
In addition to achieving long-term, sustainable revenue growth, we continueto strive to deliver shareholder value by driving operational excellence inseveral key areas:
• Expanding gross margin by:
– Delivering innovative, premium products that command higher priceswhile maintaining a balanced price-to-value equation for consumers;
– Reducing product costs through a continued focus on manufacturingefficiency, product design and innovation;
– Making our supply chain a competitive advantage by investing in newtechnologies that increase automation, help reduce waste and have long-term potential to increase both customization of our products and speedto market; and
– Driving growth in our higher gross margin DTC business, led byNIKE.com, as part of an integrated marketplace growth strategy acrossour DTC and wholesale operations.
• Optimizing selling and administrative expense by focusing on:
– Investments in consumer engagement that drive economic returns in theform of incremental revenue and gross profit;
– Infrastructure investments that improve the efficiency and effectiveness ofour operations; and
– Investments in key areas of future growth, including our DTC business.
• Managing working capital efficiency; and
• Deploying capital effectively.
Through execution of this strategy, our long-term financial goals through fiscal2020, on average per year, are as follows:
• High single-digit to low-double digit revenue growth;
• Mid-teens earnings per share growth;
• High-twenties to low-thirties percentage rate of return on invested capital;
• Free cash flow growing faster than net income; and
• Sustainable, profitable, long-term growth through effective management ofour diversified portfolio of businesses.
Over the past ten years, we have achieved many of our financial goals. Duringthis time, revenues and diluted earnings per common share for NIKE, Inc.,
inclusive of both continuing and discontinued operations, have grown 8% and13%, respectively, on an annual compounded basis. We expanded grossmargin by approximately 220 basis points and our return on invested capitalhas increased from 22.6% to 29.7%.
On November 19, 2015, we announced a two-for-one stock split of bothNIKE Class A and Class B Common Stock. The stock split was in the form ofa 100 percent stock dividend payable on December 23, 2015 to shareholdersof record at the close of business on December 9, 2015. Common stockbegan trading at the split-adjusted price on December 24, 2015. All share andper share amounts presented reflect the stock split.
Our fiscal 2016 results demonstrated the power of the NIKE, Inc. portfolio todeliver continued growth and expanding profitability. Despite significantforeign currency headwinds, we achieved record revenues and earnings pershare for fiscal 2016. NIKE, Inc. Revenues grew 6% to $32.4 billion, grossmargin expanded 20 basis points, Net income increased 15% and dilutedearnings per common share grew 17% to $2.16. We also delivered strongcash returns to shareholders while investing for long-term growth.
Earnings before interest and income taxes (“EBIT”) increased 10% for fiscal2016, driven by revenue growth and gross margin expansion, while sellingand administrative expense was flat as a percent of revenues. The increase inrevenues was attributable to growth for nearly every NIKE Brand geographyand across most key categories and product types. This broad-based growthwas primarily fueled by:
• Innovative performance and sportswear products, incorporating proprietarytechnology platforms such as NIKE Air, Free, Zoom, Lunar, Flywire, Dri-Fitand Flyknit;
• Deep brand connections with consumers through our category offense,reinforced by investments in endorsements by high-profile athletes, sportsteams and leagues, high-impact marketing around global sporting eventsand digital marketing; and
• Strong category retail presentation online and at NIKE-owned and retailpartner stores.
Converse revenues and EBIT decreased 1% and 6%, respectively, as growthin direct distribution markets was more than offset by the negative impact ofchanges in foreign currency exchange rates.
Gross margin increased primarily due to higher full-price average selling priceand the favorable impact of growth in our higher-margin DTC businesses,partially offset by higher product costs, primarily due to shifts in mix to higher-cost products and labor input cost inflation, higher off-price mix andunfavorable changes in foreign currency exchange rates.
For fiscal 2016, the growth in Net income was positively affected by a year-over-year decrease in our effective tax rate of 350 basis points primarily due toan increase in the proportion of earnings from operations outside the UnitedStates, which are generally subject to a lower tax rate. Diluted earnings percommon share grew at a higher rate than Net income due to a 1% decreasein the weighted average diluted common shares outstanding, driven by ourshare repurchase program.
While foreign currency markets remain volatile, we continue to seeopportunities to drive future growth and profitability, and remain committed toeffectively managing our business to achieve our financial goals over the long-term by executing against the operational strategies outlined above.
74
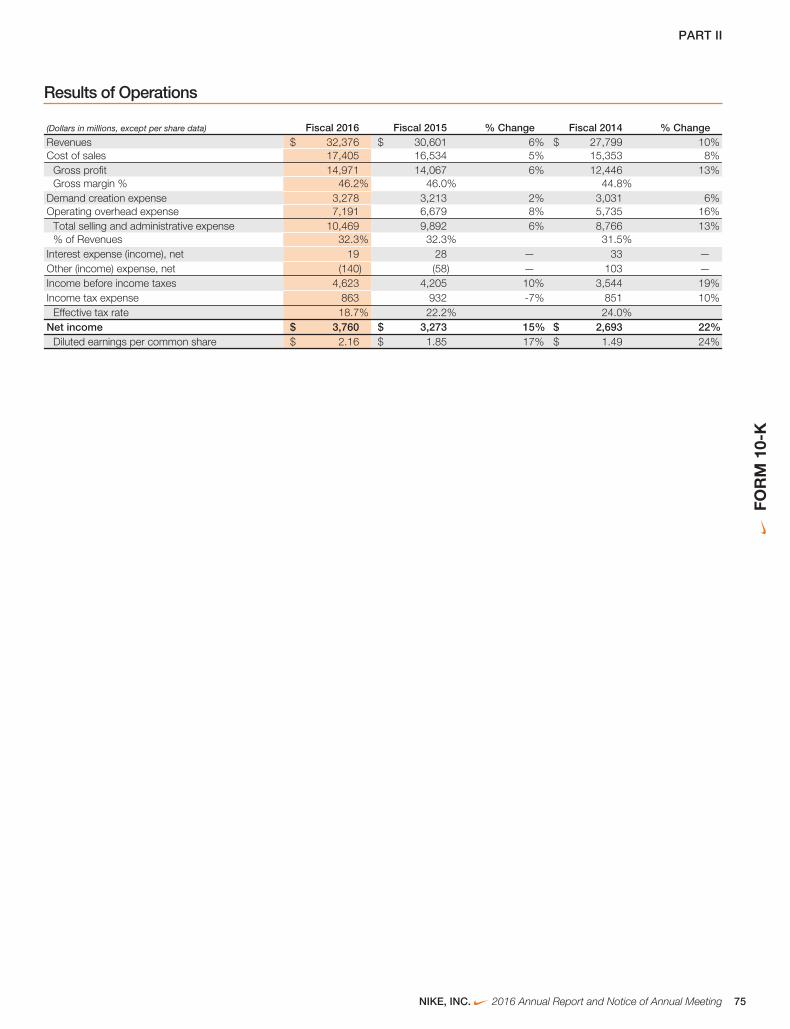
PART II
Results of Operations
(Dollars in millions, except per share data) Fiscal 2016 Fiscal 2015 % Change Fiscal 2014 % ChangeRevenues $ 32,376 $ 30,601 6% $ 27,799 10%Cost of sales 17,405 16,534 5% 15,353 8%
Gross profit 14,971 14,067 6% 12,446 13%Gross margin % 46.2% 46.0% 44.8%
Demand creation expense 3,278 3,213 2% 3,031 6%Operating overhead expense 7,191 6,679 8% 5,735 16%
Total selling and administrative expense 10,469 9,892 6% 8,766 13%% of Revenues 32.3% 32.3% 31.5%
Interest expense (income), net 19 28 — 33 —Other (income) expense, net (140) (58) — 103 —Income before income taxes 4,623 4,205 10% 3,544 19%Income tax expense 863 932 -7% 851 10%
Effective tax rate 18.7% 22.2% 24.0%Net income $ 3,760 $ 3,273 15% $ 2,693 22%
Diluted earnings per common share $ 2.16 $ 1.85 17% $ 1.49 24%
NIKE, INC. 2016 Annual Report and Notice of Annual Meeting 75
FOR
M10
-K
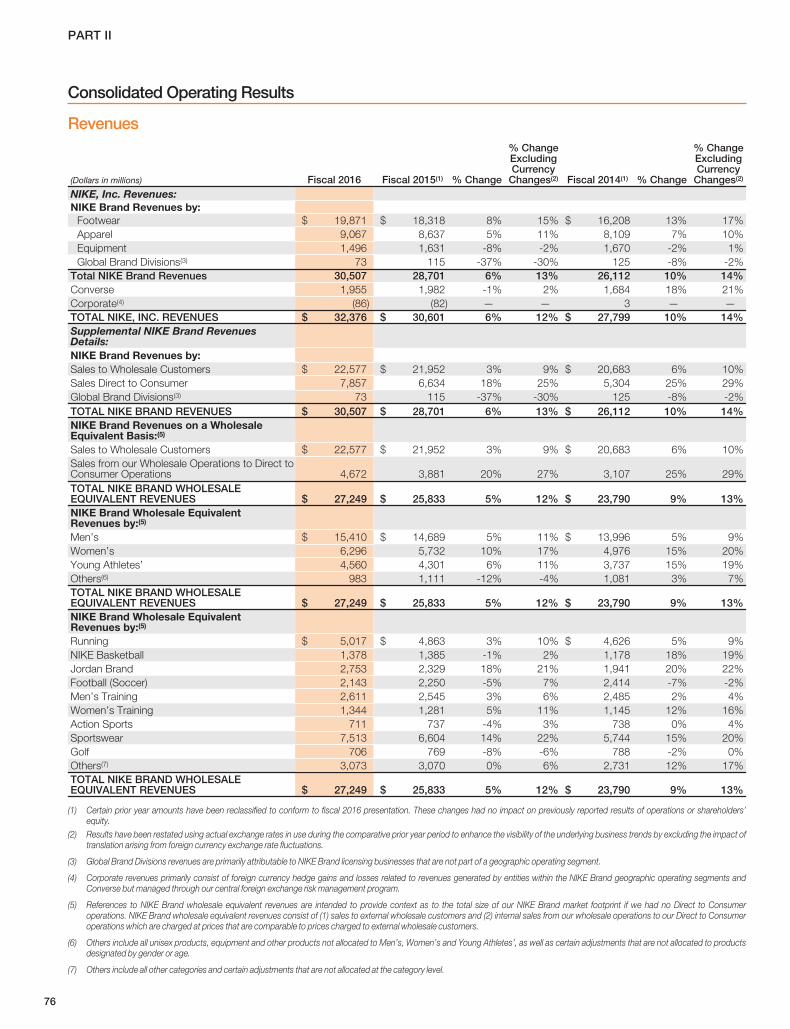
PART II
Consolidated Operating Results
Revenues
(Dollars in millions) Fiscal 2016 Fiscal 2015(1) % Change
% ChangeExcludingCurrency
Changes(2) Fiscal 2014(1) % Change
% ChangeExcludingCurrency
Changes(2)
NIKE, Inc. Revenues:NIKE Brand Revenues by:
Footwear $ 19,871 $ 18,318 8% 15% $ 16,208 13% 17%Apparel 9,067 8,637 5% 11% 8,109 7% 10%Equipment 1,496 1,631 -8% -2% 1,670 -2% 1%Global Brand Divisions(3) 73 115 -37% -30% 125 -8% -2%
Total NIKE Brand Revenues 30,507 28,701 6% 13% 26,112 10% 14%Converse 1,955 1,982 -1% 2% 1,684 18% 21%Corporate(4) (86) (82) — — 3 — —TOTAL NIKE, INC. REVENUES $ 32,376 $ 30,601 6% 12% $ 27,799 10% 14%Supplemental NIKE Brand RevenuesDetails:NIKE Brand Revenues by:Sales to Wholesale Customers $ 22,577 $ 21,952 3% 9% $ 20,683 6% 10%Sales Direct to Consumer 7,857 6,634 18% 25% 5,304 25% 29%Global Brand Divisions(3) 73 115 -37% -30% 125 -8% -2%TOTAL NIKE BRAND REVENUES $ 30,507 $ 28,701 6% 13% $ 26,112 10% 14%NIKE Brand Revenues on a WholesaleEquivalent Basis:(5)
Sales to Wholesale Customers $ 22,577 $ 21,952 3% 9% $ 20,683 6% 10%Sales from our Wholesale Operations to Direct toConsumer Operations 4,672 3,881 20% 27% 3,107 25% 29%TOTAL NIKE BRAND WHOLESALEEQUIVALENT REVENUES $ 27,249 $ 25,833 5% 12% $ 23,790 9% 13%NIKE Brand Wholesale EquivalentRevenues by:(5)
Men’s $ 15,410 $ 14,689 5% 11% $ 13,996 5% 9%Women’s 6,296 5,732 10% 17% 4,976 15% 20%Young Athletes’ 4,560 4,301 6% 11% 3,737 15% 19%Others(6) 983 1,111 -12% -4% 1,081 3% 7%TOTAL NIKE BRAND WHOLESALEEQUIVALENT REVENUES $ 27,249 $ 25,833 5% 12% $ 23,790 9% 13%NIKE Brand Wholesale EquivalentRevenues by:(5)
Running $ 5,017 $ 4,863 3% 10% $ 4,626 5% 9%NIKE Basketball 1,378 1,385 -1% 2% 1,178 18% 19%Jordan Brand 2,753 2,329 18% 21% 1,941 20% 22%Football (Soccer) 2,143 2,250 -5% 7% 2,414 -7% -2%Men’s Training 2,611 2,545 3% 6% 2,485 2% 4%Women’s Training 1,344 1,281 5% 11% 1,145 12% 16%Action Sports 711 737 -4% 3% 738 0% 4%Sportswear 7,513 6,604 14% 22% 5,744 15% 20%Golf 706 769 -8% -6% 788 -2% 0%Others(7) 3,073 3,070 0% 6% 2,731 12% 17%TOTAL NIKE BRAND WHOLESALEEQUIVALENT REVENUES $ 27,249 $ 25,833 5% 12% $ 23,790 9% 13%
(1) Certain prior year amounts have been reclassified to conform to fiscal 2016 presentation. These changes had no impact on previously reported results of operations or shareholders’equity.
(2) Results have been restated using actual exchange rates in use during the comparative prior year period to enhance the visibility of the underlying business trends by excluding the impact oftranslation arising from foreign currency exchange rate fluctuations.
(3) Global Brand Divisions revenues are primarily attributable to NIKE Brand licensing businesses that are not part of a geographic operating segment.
(4) Corporate revenues primarily consist of foreign currency hedge gains and losses related to revenues generated by entities within the NIKE Brand geographic operating segments andConverse but managed through our central foreign exchange risk management program.
(5) References to NIKE Brand wholesale equivalent revenues are intended to provide context as to the total size of our NIKE Brand market footprint if we had no Direct to Consumeroperations. NIKE Brand wholesale equivalent revenues consist of (1) sales to external wholesale customers and (2) internal sales from our wholesale operations to our Direct to Consumeroperations which are charged at prices that are comparable to prices charged to external wholesale customers.
(6) Others include all unisex products, equipment and other products not allocated to Men’s, Women’s and Young Athletes’, as well as certain adjustments that are not allocated to productsdesignated by gender or age.
(7) Others include all other categories and certain adjustments that are not allocated at the category level.
76
PART II
Fiscal 2016 Compared to Fiscal 2015
On a currency-neutral basis, NIKE, Inc. Revenues grew 12% for fiscal 2016,primarily driven by higher revenues for the NIKE Brand. Every NIKE Brandgeography grew revenues for fiscal 2016 as our category offense continuedto deliver innovative products, deep brand connections and compelling retailexperiences to consumers online and at NIKE-owned and retail partnerstores, driving strong demand for NIKE Brand products. North Americacontributed approximately 4 percentage points of the increase in NIKE, Inc.revenues, while Greater China and Western Europe each contributedapproximately 3 percentage points, Emerging Markets contributedapproximately 2 percentage points and Central & Eastern Europe contributedapproximately 1 percentage point.
Excluding the effects of changes in currency exchange rates, NIKE Brandfootwear and apparel revenues increased 15% and 11%, respectively, forfiscal 2016, while NIKE Brand equipment revenues decreased 2%. Theincrease in NIKE Brand footwear revenues for fiscal 2016 was driven bygrowth in nearly every key category, including strong growth in Sportswear,the Jordan Brand and Running. Footwear unit sales for fiscal 2016 increased9%, with higher average selling price (ASP) per pair contributingapproximately 6 percentage points of footwear revenue growth. Higher ASPper pair was driven by higher full-price ASP, and to a lesser extent, thefavorable impact of an increase in the proportion of revenues from our higher-priced DTC business.
The constant-currency increase in NIKE Brand apparel revenues for fiscal2016 was attributable to growth in most key categories, led by Sportswear,Men’s Training, Running, Women’s Training and Football (Soccer). Apparelunit sales for fiscal 2016 increased 7%. Higher ASP per unit contributedapproximately 4 percentage points of apparel revenue growth, primarily dueto higher full-price ASP and growth in our higher-priced DTC business.
While wholesale revenues remain the largest component of overall NIKEBrand revenues, we continue to expand our DTC businesses in each of ourgeographies. NIKE Brand DTC operations include NIKE-owned in-line andfactory stores, as well as online sales through NIKE-owned websites. Forfiscal 2016, DTC revenues represented approximately 26% of our total NIKEBrand revenues. On a currency-neutral basis, DTC revenues increased 25%for fiscal 2016, driven by strong online sales growth, the addition of newstores and comparable store sales growth of 10%. Comparable store salesinclude revenues from NIKE-owned in-line and factory stores for which allthree of the following requirements have been met: (1) the store has beenopen at least one year, (2) square footage has not changed by more than15% within the past year and (3) the store has not been permanentlyrepositioned within the past year. Online sales through NIKE-owned websites,which are not included in comparable store sales, grew 51% in fiscal 2016.For fiscal 2016, online sales represented approximately 22% of our total NIKEBrand DTC revenues.
On a wholesale equivalent basis and excluding the effects of changes incurrency exchange rates, fiscal 2016 NIKE Brand Men’s revenues increased11%, driven by growth in Sportswear and the Jordan Brand, while Women’srevenues increased 17%, led by Sportswear, Running and Women’sTraining. Revenues for our Young Athletes’ business increased 11%, withgrowth across multiple categories, most notably the Jordan Brand.
Fiscal 2015 Compared to Fiscal 2014
On a currency-neutral basis, revenues from NIKE, Inc. continuing operationsgrew 14% for fiscal 2015, driven by increases in revenues for both the NIKEBrand and Converse. Every NIKE Brand geography delivered higher revenuesfor fiscal 2015 as our category offense continued to deliver innovativeproducts, deep brand connections and compelling retail experiences toconsumers. North America contributed 5 percentage points of the increase inNIKE, Inc. revenues, while Western Europe contributed 4 percentage points,Greater China contributed 2 percentage points and Central & Eastern Europe,Emerging Markets and Converse each contributed 1 percentage point.
Excluding the effects of changes in currency exchange rates, NIKE Brandfootwear and apparel revenues increased 17% and 10%, respectively, whileNIKE Brand equipment revenues increased 1% during fiscal 2015. Theincrease in NIKE Brand footwear revenues for fiscal 2015 was driven bystrong performance in Sportswear, the Jordan Brand, Running, NIKEBasketball and Football (Soccer). Footwear unit sales in fiscal 2015 increased9%. Higher ASP per pair contributed approximately 8 percentage points offootwear revenue growth, driven primarily by higher full-price ASP, and to alesser extent, the favorable impact of growth in our higher-priced DTCbusiness.
The constant-currency increase in NIKE Brand apparel revenues for fiscal2015 was driven by growth in most key categories, led by Sportswear,Running and Women’s Training, which were partially offset by a decline inFootball (Soccer) due largely to the comparison to significant sales of replicaapparel in advance of the World Cup in 2014. Fiscal 2015 unit sales of apparelincreased 8% with higher ASP per unit contributing approximately 2percentage points of apparel revenue growth, driven primarily by growth inour higher-priced DTC business.
For fiscal 2015, DTC revenues represented approximately 23% of our totalNIKE Brand revenues compared to 20% in fiscal 2014. On a currency-neutralbasis, DTC revenues grew 29% for fiscal 2015, driven by strong comparablestore sales growth of 16%, significant online sales growth and the addition ofnew stores. Online sales through NIKE-owned websites grew 59% in fiscal2015. Online sales represented approximately 18% of our total NIKE BrandDTC revenues for fiscal 2015 compared to 15% for fiscal 2014.
On a wholesale equivalent basis and excluding the effects of changes incurrency exchange rates, fiscal 2015 NIKE Brand Men’s revenues increased9%, driven by growth in our Sportswear, the Jordan Brand, NIKE Basketballand Running categories. Women’s revenues accelerated in fiscal 2015,achieving 20% growth primarily due to increases in Sportswear, Running andWomen’s Training categories. Revenues in our Young Athletes’ businessincreased 19% as a result of continued efforts to expand footwear andapparel offerings for this group across multiple categories, particularly theJordan Brand.
Futures Orders
Futures orders for NIKE Brand footwear and apparel scheduled for deliveryfrom June through November 2016 totaled $14.9 billion and were 8% higherthan the orders reported for the comparable prior year period. NIKE Brandreported futures include (1) orders from external wholesale customers and (2)internal orders from our DTC in-line stores and e-commerce operations whichare reflected at prices that are comparable to prices charged to externalwholesale customers. The U.S. Dollar futures orders amount is calculatedbased upon our internal forecast of the currency exchange rates under whichour revenues will be translated during this period. Excluding the impact ofcurrency changes, futures orders increased 11%, with unit orders increasing4% and average selling price per unit contributing approximately 7percentage points of growth.
NIKE, INC. 2016 Annual Report and Notice of Annual Meeting 77
FOR
M10
-K
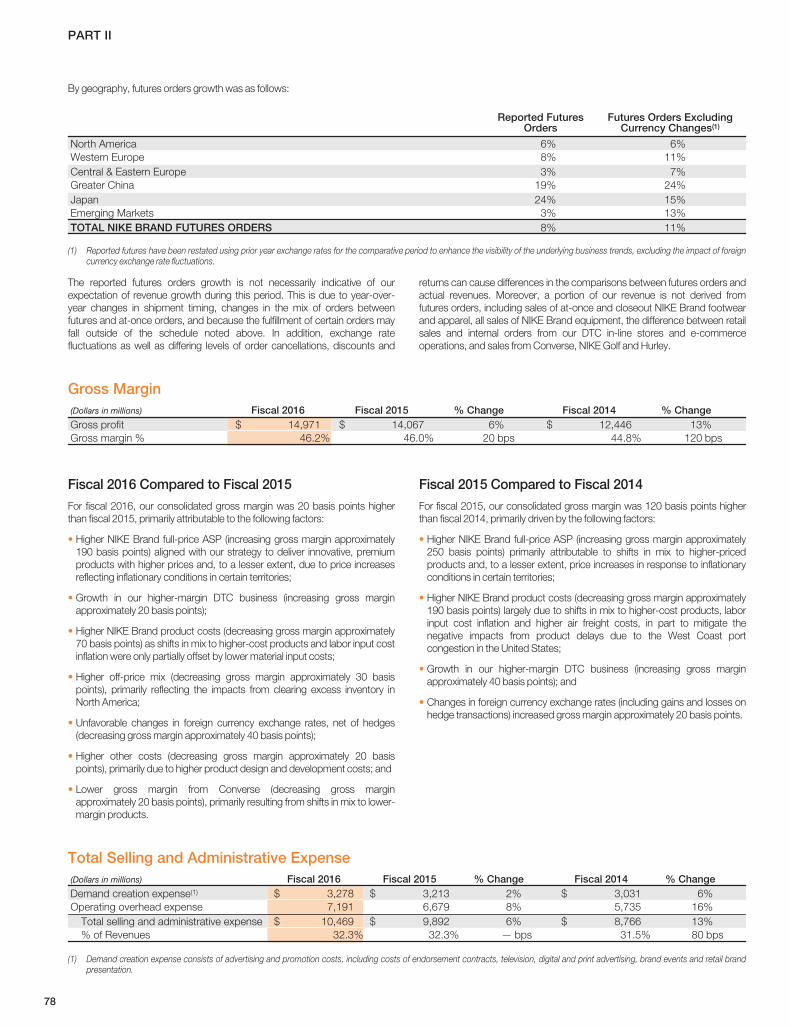
PART II
By geography, futures orders growth was as follows:
Reported FuturesOrders
Futures Orders ExcludingCurrency Changes(1)
North America 6% 6%Western Europe 8% 11%Central & Eastern Europe 3% 7%Greater China 19% 24%Japan 24% 15%Emerging Markets 3% 13%TOTAL NIKE BRAND FUTURES ORDERS 8% 11%
(1) Reported futures have been restated using prior year exchange rates for the comparative period to enhance the visibility of the underlying business trends, excluding the impact of foreigncurrency exchange rate fluctuations.
The reported futures orders growth is not necessarily indicative of ourexpectation of revenue growth during this period. This is due to year-over-year changes in shipment timing, changes in the mix of orders betweenfutures and at-once orders, and because the fulfillment of certain orders mayfall outside of the schedule noted above. In addition, exchange ratefluctuations as well as differing levels of order cancellations, discounts and
returns can cause differences in the comparisons between futures orders andactual revenues. Moreover, a portion of our revenue is not derived fromfutures orders, including sales of at-once and closeout NIKE Brand footwearand apparel, all sales of NIKE Brand equipment, the difference between retailsales and internal orders from our DTC in-line stores and e-commerceoperations, and sales from Converse, NIKE Golf and Hurley.
Gross Margin(Dollars in millions) Fiscal 2016 Fiscal 2015 % Change Fiscal 2014 % ChangeGross profit $ 14,971 $ 14,067 6% $ 12,446 13%Gross margin % 46.2% 46.0% 20 bps 44.8% 120 bps
Fiscal 2016 Compared to Fiscal 2015
For fiscal 2016, our consolidated gross margin was 20 basis points higherthan fiscal 2015, primarily attributable to the following factors:
• Higher NIKE Brand full-price ASP (increasing gross margin approximately190 basis points) aligned with our strategy to deliver innovative, premiumproducts with higher prices and, to a lesser extent, due to price increasesreflecting inflationary conditions in certain territories;
• Growth in our higher-margin DTC business (increasing gross marginapproximately 20 basis points);
• Higher NIKE Brand product costs (decreasing gross margin approximately70 basis points) as shifts in mix to higher-cost products and labor input costinflation were only partially offset by lower material input costs;
• Higher off-price mix (decreasing gross margin approximately 30 basispoints), primarily reflecting the impacts from clearing excess inventory inNorth America;
• Unfavorable changes in foreign currency exchange rates, net of hedges(decreasing gross margin approximately 40 basis points);
• Higher other costs (decreasing gross margin approximately 20 basispoints), primarily due to higher product design and development costs; and
• Lower gross margin from Converse (decreasing gross marginapproximately 20 basis points), primarily resulting from shifts in mix to lower-margin products.
Fiscal 2015 Compared to Fiscal 2014
For fiscal 2015, our consolidated gross margin was 120 basis points higherthan fiscal 2014, primarily driven by the following factors:
• Higher NIKE Brand full-price ASP (increasing gross margin approximately250 basis points) primarily attributable to shifts in mix to higher-pricedproducts and, to a lesser extent, price increases in response to inflationaryconditions in certain territories;
• Higher NIKE Brand product costs (decreasing gross margin approximately190 basis points) largely due to shifts in mix to higher-cost products, laborinput cost inflation and higher air freight costs, in part to mitigate thenegative impacts from product delays due to the West Coast portcongestion in the United States;
• Growth in our higher-margin DTC business (increasing gross marginapproximately 40 basis points); and
• Changes in foreign currency exchange rates (including gains and losses onhedge transactions) increased gross margin approximately 20 basis points.
Total Selling and Administrative Expense(Dollars in millions) Fiscal 2016 Fiscal 2015 % Change Fiscal 2014 % ChangeDemand creation expense(1) $ 3,278 $ 3,213 2% $ 3,031 6%Operating overhead expense 7,191 6,679 8% 5,735 16%
Total selling and administrative expense $ 10,469 $ 9,892 6% $ 8,766 13%% of Revenues 32.3% 32.3% — bps 31.5% 80 bps
(1) Demand creation expense consists of advertising and promotion costs, including costs of endorsement contracts, television, digital and print advertising, brand events and retail brandpresentation.
78
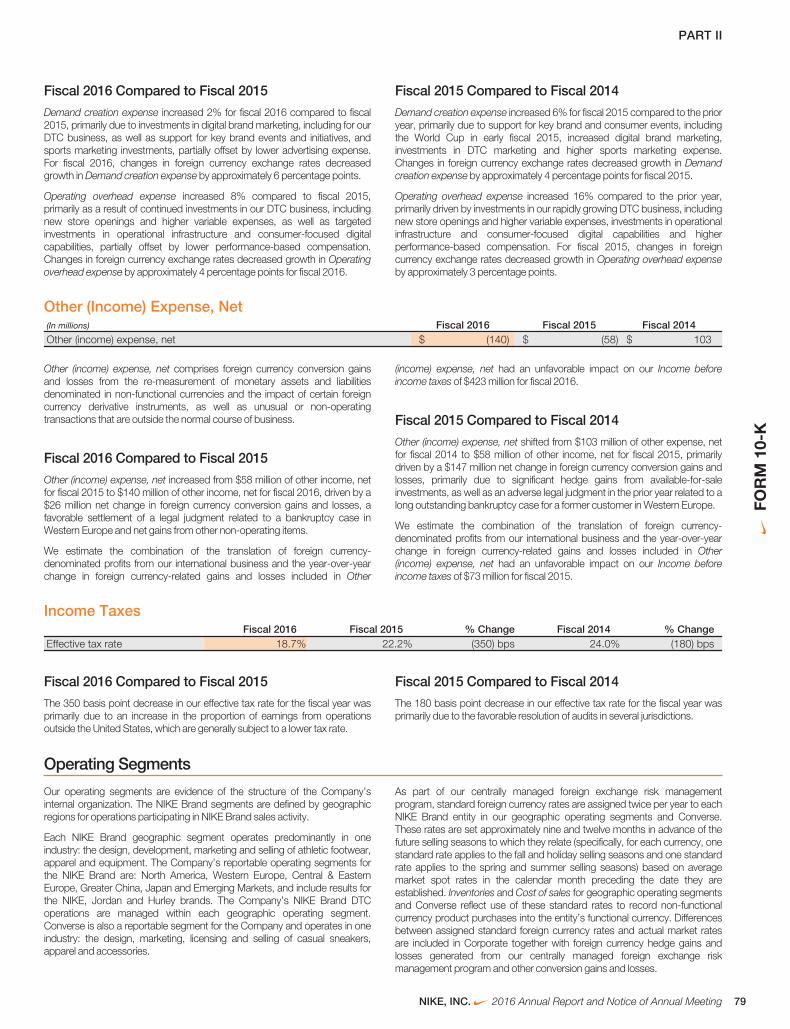
PART II
Fiscal 2016 Compared to Fiscal 2015
Demand creation expense increased 2% for fiscal 2016 compared to fiscal2015, primarily due to investments in digital brand marketing, including for ourDTC business, as well as support for key brand events and initiatives, andsports marketing investments, partially offset by lower advertising expense.For fiscal 2016, changes in foreign currency exchange rates decreasedgrowth in Demand creation expense by approximately 6 percentage points.
Operating overhead expense increased 8% compared to fiscal 2015,primarily as a result of continued investments in our DTC business, includingnew store openings and higher variable expenses, as well as targetedinvestments in operational infrastructure and consumer-focused digitalcapabilities, partially offset by lower performance-based compensation.Changes in foreign currency exchange rates decreased growth in Operatingoverhead expense by approximately 4 percentage points for fiscal 2016.
Fiscal 2015 Compared to Fiscal 2014
Demand creation expense increased 6% for fiscal 2015 compared to the prioryear, primarily due to support for key brand and consumer events, includingthe World Cup in early fiscal 2015, increased digital brand marketing,investments in DTC marketing and higher sports marketing expense.Changes in foreign currency exchange rates decreased growth in Demandcreation expense by approximately 4 percentage points for fiscal 2015.
Operating overhead expense increased 16% compared to the prior year,primarily driven by investments in our rapidly growing DTC business, includingnew store openings and higher variable expenses, investments in operationalinfrastructure and consumer-focused digital capabilities and higherperformance-based compensation. For fiscal 2015, changes in foreigncurrency exchange rates decreased growth in Operating overhead expenseby approximately 3 percentage points.
Other (Income) Expense, Net(In millions) Fiscal 2016 Fiscal 2015 Fiscal 2014Other (income) expense, net $ (140) $ (58) $ 103
Other (income) expense, net comprises foreign currency conversion gainsand losses from the re-measurement of monetary assets and liabilitiesdenominated in non-functional currencies and the impact of certain foreigncurrency derivative instruments, as well as unusual or non-operatingtransactions that are outside the normal course of business.
Fiscal 2016 Compared to Fiscal 2015
Other (income) expense, net increased from $58 million of other income, netfor fiscal 2015 to $140 million of other income, net for fiscal 2016, driven by a$26 million net change in foreign currency conversion gains and losses, afavorable settlement of a legal judgment related to a bankruptcy case inWestern Europe and net gains from other non-operating items.
We estimate the combination of the translation of foreign currency-denominated profits from our international business and the year-over-yearchange in foreign currency-related gains and losses included in Other
(income) expense, net had an unfavorable impact on our Income beforeincome taxes of $423 million for fiscal 2016.
Fiscal 2015 Compared to Fiscal 2014
Other (income) expense, net shifted from $103 million of other expense, netfor fiscal 2014 to $58 million of other income, net for fiscal 2015, primarilydriven by a $147 million net change in foreign currency conversion gains andlosses, primarily due to significant hedge gains from available-for-saleinvestments, as well as an adverse legal judgment in the prior year related to along outstanding bankruptcy case for a former customer in Western Europe.
We estimate the combination of the translation of foreign currency-denominated profits from our international business and the year-over-yearchange in foreign currency-related gains and losses included in Other(income) expense, net had an unfavorable impact on our Income beforeincome taxes of $73 million for fiscal 2015.
Income TaxesFiscal 2016 Fiscal 2015 % Change Fiscal 2014 % Change
Effective tax rate 18.7% 22.2% (350) bps 24.0% (180) bps
Fiscal 2016 Compared to Fiscal 2015
The 350 basis point decrease in our effective tax rate for the fiscal year wasprimarily due to an increase in the proportion of earnings from operationsoutside the United States, which are generally subject to a lower tax rate.
Fiscal 2015 Compared to Fiscal 2014
The 180 basis point decrease in our effective tax rate for the fiscal year wasprimarily due to the favorable resolution of audits in several jurisdictions.
Operating Segments
Our operating segments are evidence of the structure of the Company’sinternal organization. The NIKE Brand segments are defined by geographicregions for operations participating in NIKE Brand sales activity.
Each NIKE Brand geographic segment operates predominantly in oneindustry: the design, development, marketing and selling of athletic footwear,apparel and equipment. The Company’s reportable operating segments forthe NIKE Brand are: North America, Western Europe, Central & EasternEurope, Greater China, Japan and Emerging Markets, and include results forthe NIKE, Jordan and Hurley brands. The Company’s NIKE Brand DTCoperations are managed within each geographic operating segment.Converse is also a reportable segment for the Company and operates in oneindustry: the design, marketing, licensing and selling of casual sneakers,apparel and accessories.
As part of our centrally managed foreign exchange risk managementprogram, standard foreign currency rates are assigned twice per year to eachNIKE Brand entity in our geographic operating segments and Converse.These rates are set approximately nine and twelve months in advance of thefuture selling seasons to which they relate (specifically, for each currency, onestandard rate applies to the fall and holiday selling seasons and one standardrate applies to the spring and summer selling seasons) based on averagemarket spot rates in the calendar month preceding the date they areestablished. Inventories and Cost of sales for geographic operating segmentsand Converse reflect use of these standard rates to record non-functionalcurrency product purchases into the entity’s functional currency. Differencesbetween assigned standard foreign currency rates and actual market ratesare included in Corporate together with foreign currency hedge gains andlosses generated from our centrally managed foreign exchange riskmanagement program and other conversion gains and losses.
NIKE, INC. 2016 Annual Report and Notice of Annual Meeting 79
FOR
M10
-K
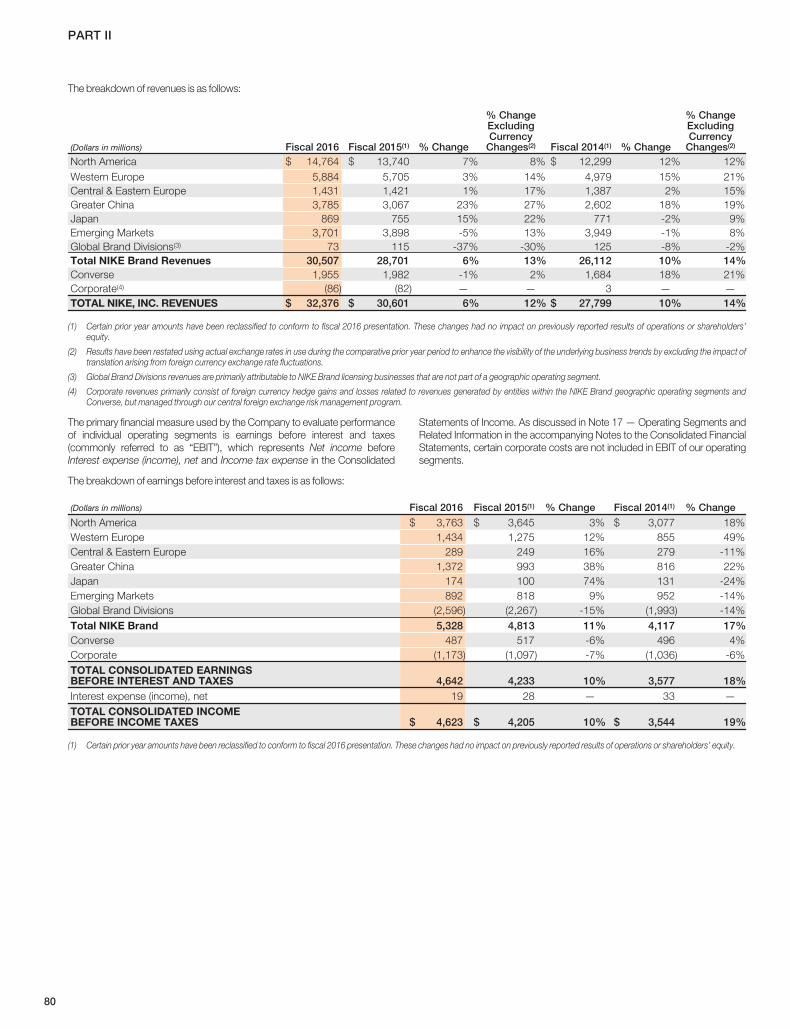
PART II
The breakdown of revenues is as follows:
(Dollars in millions) Fiscal 2016 Fiscal 2015(1) % Change
% ChangeExcludingCurrency
Changes(2) Fiscal 2014(1) % Change
% ChangeExcludingCurrency
Changes(2)
North America $ 14,764 $ 13,740 7% 8% $ 12,299 12% 12%Western Europe 5,884 5,705 3% 14% 4,979 15% 21%Central & Eastern Europe 1,431 1,421 1% 17% 1,387 2% 15%Greater China 3,785 3,067 23% 27% 2,602 18% 19%Japan 869 755 15% 22% 771 -2% 9%Emerging Markets 3,701 3,898 -5% 13% 3,949 -1% 8%Global Brand Divisions(3) 73 115 -37% -30% 125 -8% -2%Total NIKE Brand Revenues 30,507 28,701 6% 13% 26,112 10% 14%Converse 1,955 1,982 -1% 2% 1,684 18% 21%Corporate(4) (86) (82) — — 3 — —TOTAL NIKE, INC. REVENUES $ 32,376 $ 30,601 6% 12% $ 27,799 10% 14%
(1) Certain prior year amounts have been reclassified to conform to fiscal 2016 presentation. These changes had no impact on previously reported results of operations or shareholders’equity.
(2) Results have been restated using actual exchange rates in use during the comparative prior year period to enhance the visibility of the underlying business trends by excluding the impact oftranslation arising from foreign currency exchange rate fluctuations.
(3) Global Brand Divisions revenues are primarily attributable to NIKE Brand licensing businesses that are not part of a geographic operating segment.
(4) Corporate revenues primarily consist of foreign currency hedge gains and losses related to revenues generated by entities within the NIKE Brand geographic operating segments andConverse, but managed through our central foreign exchange risk management program.
The primary financial measure used by the Company to evaluate performanceof individual operating segments is earnings before interest and taxes(commonly referred to as “EBIT”), which represents Net income beforeInterest expense (income), net and Income tax expense in the Consolidated
Statements of Income. As discussed in Note 17 — Operating Segments andRelated Information in the accompanying Notes to the Consolidated FinancialStatements, certain corporate costs are not included in EBIT of our operatingsegments.
The breakdown of earnings before interest and taxes is as follows:
(Dollars in millions) Fiscal 2016 Fiscal 2015(1) % Change Fiscal 2014(1) % Change
North America $ 3,763 $ 3,645 3% $ 3,077 18%Western Europe 1,434 1,275 12% 855 49%Central & Eastern Europe 289 249 16% 279 -11%Greater China 1,372 993 38% 816 22%Japan 174 100 74% 131 -24%Emerging Markets 892 818 9% 952 -14%Global Brand Divisions (2,596) (2,267) -15% (1,993) -14%Total NIKE Brand 5,328 4,813 11% 4,117 17%Converse 487 517 -6% 496 4%Corporate (1,173) (1,097) -7% (1,036) -6%TOTAL CONSOLIDATED EARNINGSBEFORE INTEREST AND TAXES 4,642 4,233 10% 3,577 18%Interest expense (income), net 19 28 — 33 —TOTAL CONSOLIDATED INCOMEBEFORE INCOME TAXES $ 4,623 $ 4,205 10% $ 3,544 19%
(1) Certain prior year amounts have been reclassified to conform to fiscal 2016 presentation. These changes had no impact on previously reported results of operations or shareholders’ equity.
80
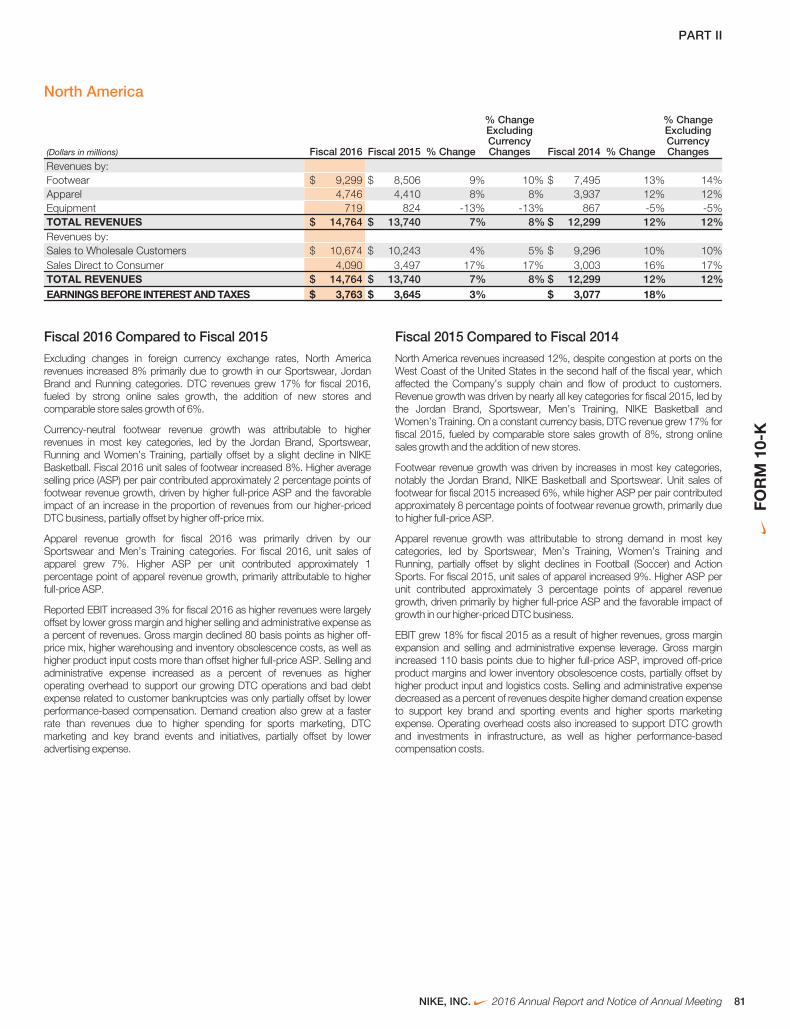
PART II
North America
(Dollars in millions) Fiscal 2016 Fiscal 2015 % Change
% ChangeExcludingCurrencyChanges Fiscal 2014 % Change
% ChangeExcludingCurrencyChanges
Revenues by:Footwear $ 9,299 $ 8,506 9% 10% $ 7,495 13% 14%Apparel 4,746 4,410 8% 8% 3,937 12% 12%Equipment 719 824 -13% -13% 867 -5% -5%TOTAL REVENUES $ 14,764 $ 13,740 7% 8% $ 12,299 12% 12%Revenues by:Sales to Wholesale Customers $ 10,674 $ 10,243 4% 5% $ 9,296 10% 10%Sales Direct to Consumer 4,090 3,497 17% 17% 3,003 16% 17%TOTAL REVENUES $ 14,764 $ 13,740 7% 8% $ 12,299 12% 12%EARNINGS BEFORE INTEREST AND TAXES $ 3,763 $ 3,645 3% $ 3,077 18%
Fiscal 2016 Compared to Fiscal 2015
Excluding changes in foreign currency exchange rates, North Americarevenues increased 8% primarily due to growth in our Sportswear, JordanBrand and Running categories. DTC revenues grew 17% for fiscal 2016,fueled by strong online sales growth, the addition of new stores andcomparable store sales growth of 6%.
Currency-neutral footwear revenue growth was attributable to higherrevenues in most key categories, led by the Jordan Brand, Sportswear,Running and Women’s Training, partially offset by a slight decline in NIKEBasketball. Fiscal 2016 unit sales of footwear increased 8%. Higher averageselling price (ASP) per pair contributed approximately 2 percentage points offootwear revenue growth, driven by higher full-price ASP and the favorableimpact of an increase in the proportion of revenues from our higher-pricedDTC business, partially offset by higher off-price mix.
Apparel revenue growth for fiscal 2016 was primarily driven by ourSportswear and Men’s Training categories. For fiscal 2016, unit sales ofapparel grew 7%. Higher ASP per unit contributed approximately 1percentage point of apparel revenue growth, primarily attributable to higherfull-price ASP.
Reported EBIT increased 3% for fiscal 2016 as higher revenues were largelyoffset by lower gross margin and higher selling and administrative expense asa percent of revenues. Gross margin declined 80 basis points as higher off-price mix, higher warehousing and inventory obsolescence costs, as well ashigher product input costs more than offset higher full-price ASP. Selling andadministrative expense increased as a percent of revenues as higheroperating overhead to support our growing DTC operations and bad debtexpense related to customer bankruptcies was only partially offset by lowerperformance-based compensation. Demand creation also grew at a fasterrate than revenues due to higher spending for sports marketing, DTCmarketing and key brand events and initiatives, partially offset by loweradvertising expense.
Fiscal 2015 Compared to Fiscal 2014
North America revenues increased 12%, despite congestion at ports on theWest Coast of the United States in the second half of the fiscal year, whichaffected the Company’s supply chain and flow of product to customers.Revenue growth was driven by nearly all key categories for fiscal 2015, led bythe Jordan Brand, Sportswear, Men’s Training, NIKE Basketball andWomen’s Training. On a constant currency basis, DTC revenue grew 17% forfiscal 2015, fueled by comparable store sales growth of 8%, strong onlinesales growth and the addition of new stores.
Footwear revenue growth was driven by increases in most key categories,notably the Jordan Brand, NIKE Basketball and Sportswear. Unit sales offootwear for fiscal 2015 increased 6%, while higher ASP per pair contributedapproximately 8 percentage points of footwear revenue growth, primarily dueto higher full-price ASP.
Apparel revenue growth was attributable to strong demand in most keycategories, led by Sportswear, Men’s Training, Women’s Training andRunning, partially offset by slight declines in Football (Soccer) and ActionSports. For fiscal 2015, unit sales of apparel increased 9%. Higher ASP perunit contributed approximately 3 percentage points of apparel revenuegrowth, driven primarily by higher full-price ASP and the favorable impact ofgrowth in our higher-priced DTC business.
EBIT grew 18% for fiscal 2015 as a result of higher revenues, gross marginexpansion and selling and administrative expense leverage. Gross marginincreased 110 basis points due to higher full-price ASP, improved off-priceproduct margins and lower inventory obsolescence costs, partially offset byhigher product input and logistics costs. Selling and administrative expensedecreased as a percent of revenues despite higher demand creation expenseto support key brand and sporting events and higher sports marketingexpense. Operating overhead costs also increased to support DTC growthand investments in infrastructure, as well as higher performance-basedcompensation costs.
NIKE, INC. 2016 Annual Report and Notice of Annual Meeting 81
FOR
M10
-K
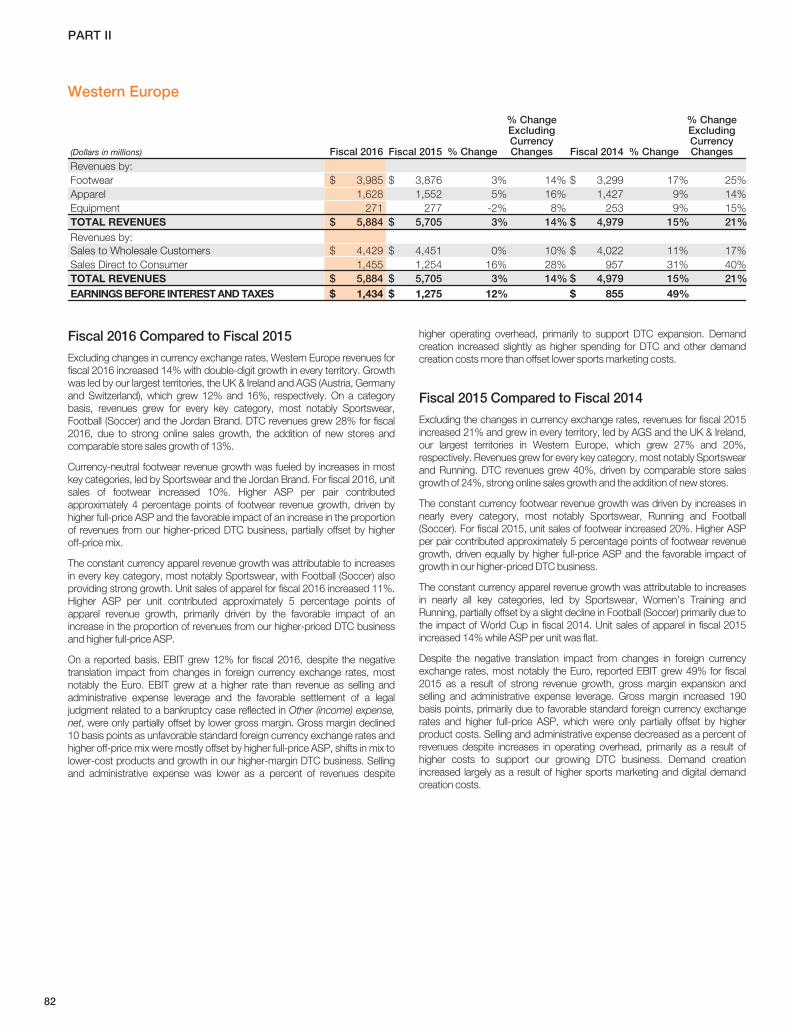
PART II
Western Europe
(Dollars in millions) Fiscal 2016 Fiscal 2015 % Change
% ChangeExcludingCurrencyChanges Fiscal 2014 % Change
% ChangeExcludingCurrencyChanges
Revenues by:Footwear $ 3,985 $ 3,876 3% 14% $ 3,299 17% 25%Apparel 1,628 1,552 5% 16% 1,427 9% 14%Equipment 271 277 -2% 8% 253 9% 15%TOTAL REVENUES $ 5,884 $ 5,705 3% 14% $ 4,979 15% 21%Revenues by:Sales to Wholesale Customers $ 4,429 $ 4,451 0% 10% $ 4,022 11% 17%Sales Direct to Consumer 1,455 1,254 16% 28% 957 31% 40%TOTAL REVENUES $ 5,884 $ 5,705 3% 14% $ 4,979 15% 21%EARNINGS BEFORE INTEREST AND TAXES $ 1,434 $ 1,275 12% $ 855 49%
Fiscal 2016 Compared to Fiscal 2015
Excluding changes in currency exchange rates, Western Europe revenues forfiscal 2016 increased 14% with double-digit growth in every territory. Growthwas led by our largest territories, the UK & Ireland and AGS (Austria, Germanyand Switzerland), which grew 12% and 16%, respectively. On a categorybasis, revenues grew for every key category, most notably Sportswear,Football (Soccer) and the Jordan Brand. DTC revenues grew 28% for fiscal2016, due to strong online sales growth, the addition of new stores andcomparable store sales growth of 13%.
Currency-neutral footwear revenue growth was fueled by increases in mostkey categories, led by Sportswear and the Jordan Brand. For fiscal 2016, unitsales of footwear increased 10%. Higher ASP per pair contributedapproximately 4 percentage points of footwear revenue growth, driven byhigher full-price ASP and the favorable impact of an increase in the proportionof revenues from our higher-priced DTC business, partially offset by higheroff-price mix.
The constant currency apparel revenue growth was attributable to increasesin every key category, most notably Sportswear, with Football (Soccer) alsoproviding strong growth. Unit sales of apparel for fiscal 2016 increased 11%.Higher ASP per unit contributed approximately 5 percentage points ofapparel revenue growth, primarily driven by the favorable impact of anincrease in the proportion of revenues from our higher-priced DTC businessand higher full-price ASP.
On a reported basis, EBIT grew 12% for fiscal 2016, despite the negativetranslation impact from changes in foreign currency exchange rates, mostnotably the Euro. EBIT grew at a higher rate than revenue as selling andadministrative expense leverage and the favorable settlement of a legaljudgment related to a bankruptcy case reflected in Other (income) expense,net, were only partially offset by lower gross margin. Gross margin declined10 basis points as unfavorable standard foreign currency exchange rates andhigher off-price mix were mostly offset by higher full-price ASP, shifts in mix tolower-cost products and growth in our higher-margin DTC business. Sellingand administrative expense was lower as a percent of revenues despite
higher operating overhead, primarily to support DTC expansion. Demandcreation increased slightly as higher spending for DTC and other demandcreation costs more than offset lower sports marketing costs.
Fiscal 2015 Compared to Fiscal 2014
Excluding the changes in currency exchange rates, revenues for fiscal 2015increased 21% and grew in every territory, led by AGS and the UK & Ireland,our largest territories in Western Europe, which grew 27% and 20%,respectively. Revenues grew for every key category, most notably Sportswearand Running. DTC revenues grew 40%, driven by comparable store salesgrowth of 24%, strong online sales growth and the addition of new stores.
The constant currency footwear revenue growth was driven by increases innearly every category, most notably Sportswear, Running and Football(Soccer). For fiscal 2015, unit sales of footwear increased 20%. Higher ASPper pair contributed approximately 5 percentage points of footwear revenuegrowth, driven equally by higher full-price ASP and the favorable impact ofgrowth in our higher-priced DTC business.
The constant currency apparel revenue growth was attributable to increasesin nearly all key categories, led by Sportswear, Women’s Training andRunning, partially offset by a slight decline in Football (Soccer) primarily due tothe impact of World Cup in fiscal 2014. Unit sales of apparel in fiscal 2015increased 14% while ASP per unit was flat.
Despite the negative translation impact from changes in foreign currencyexchange rates, most notably the Euro, reported EBIT grew 49% for fiscal2015 as a result of strong revenue growth, gross margin expansion andselling and administrative expense leverage. Gross margin increased 190basis points, primarily due to favorable standard foreign currency exchangerates and higher full-price ASP, which were only partially offset by higherproduct costs. Selling and administrative expense decreased as a percent ofrevenues despite increases in operating overhead, primarily as a result ofhigher costs to support our growing DTC business. Demand creationincreased largely as a result of higher sports marketing and digital demandcreation costs.
82
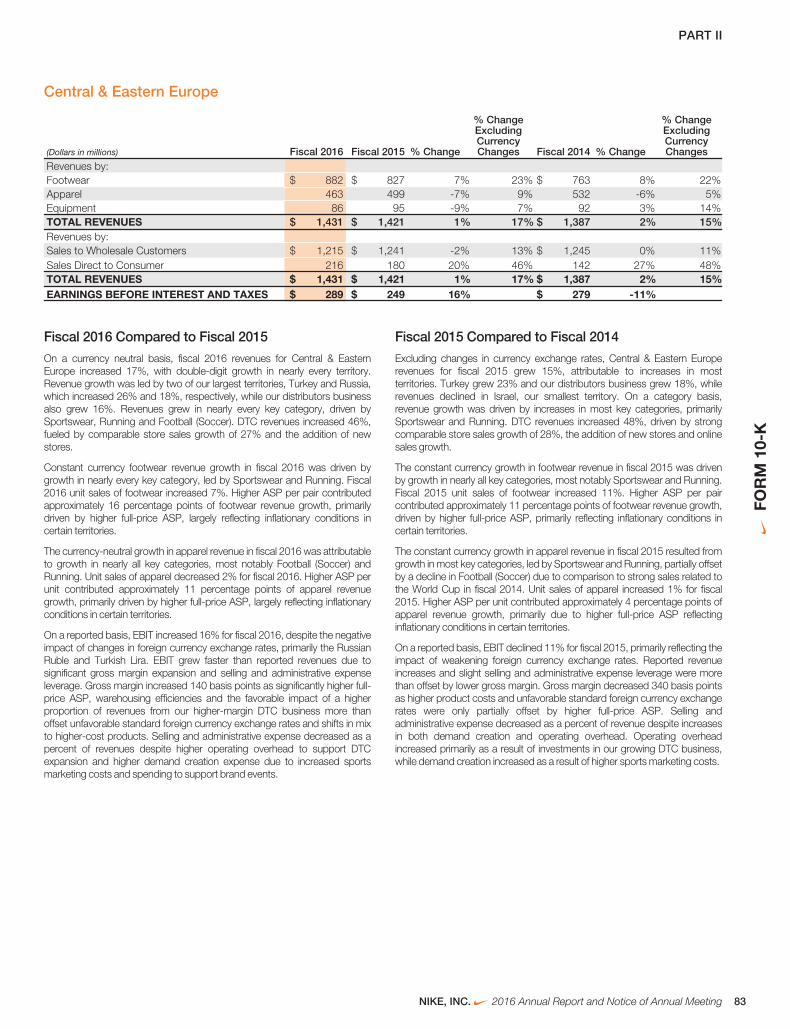
PART II
Central & Eastern Europe
(Dollars in millions) Fiscal 2016 Fiscal 2015 % Change
% ChangeExcludingCurrencyChanges Fiscal 2014 % Change
% ChangeExcludingCurrencyChanges
Revenues by:Footwear $ 882 $ 827 7% 23% $ 763 8% 22%Apparel 463 499 -7% 9% 532 -6% 5%Equipment 86 95 -9% 7% 92 3% 14%TOTAL REVENUES $ 1,431 $ 1,421 1% 17% $ 1,387 2% 15%Revenues by:Sales to Wholesale Customers $ 1,215 $ 1,241 -2% 13% $ 1,245 0% 11%Sales Direct to Consumer 216 180 20% 46% 142 27% 48%TOTAL REVENUES $ 1,431 $ 1,421 1% 17% $ 1,387 2% 15%EARNINGS BEFORE INTEREST AND TAXES $ 289 $ 249 16% $ 279 -11%
Fiscal 2016 Compared to Fiscal 2015
On a currency neutral basis, fiscal 2016 revenues for Central & EasternEurope increased 17%, with double-digit growth in nearly every territory.Revenue growth was led by two of our largest territories, Turkey and Russia,which increased 26% and 18%, respectively, while our distributors businessalso grew 16%. Revenues grew in nearly every key category, driven bySportswear, Running and Football (Soccer). DTC revenues increased 46%,fueled by comparable store sales growth of 27% and the addition of newstores.
Constant currency footwear revenue growth in fiscal 2016 was driven bygrowth in nearly every key category, led by Sportswear and Running. Fiscal2016 unit sales of footwear increased 7%. Higher ASP per pair contributedapproximately 16 percentage points of footwear revenue growth, primarilydriven by higher full-price ASP, largely reflecting inflationary conditions incertain territories.
The currency-neutral growth in apparel revenue in fiscal 2016 was attributableto growth in nearly all key categories, most notably Football (Soccer) andRunning. Unit sales of apparel decreased 2% for fiscal 2016. Higher ASP perunit contributed approximately 11 percentage points of apparel revenuegrowth, primarily driven by higher full-price ASP, largely reflecting inflationaryconditions in certain territories.
On a reported basis, EBIT increased 16% for fiscal 2016, despite the negativeimpact of changes in foreign currency exchange rates, primarily the RussianRuble and Turkish Lira. EBIT grew faster than reported revenues due tosignificant gross margin expansion and selling and administrative expenseleverage. Gross margin increased 140 basis points as significantly higher full-price ASP, warehousing efficiencies and the favorable impact of a higherproportion of revenues from our higher-margin DTC business more thanoffset unfavorable standard foreign currency exchange rates and shifts in mixto higher-cost products. Selling and administrative expense decreased as apercent of revenues despite higher operating overhead to support DTCexpansion and higher demand creation expense due to increased sportsmarketing costs and spending to support brand events.
Fiscal 2015 Compared to Fiscal 2014
Excluding changes in currency exchange rates, Central & Eastern Europerevenues for fiscal 2015 grew 15%, attributable to increases in mostterritories. Turkey grew 23% and our distributors business grew 18%, whilerevenues declined in Israel, our smallest territory. On a category basis,revenue growth was driven by increases in most key categories, primarilySportswear and Running. DTC revenues increased 48%, driven by strongcomparable store sales growth of 28%, the addition of new stores and onlinesales growth.
The constant currency growth in footwear revenue in fiscal 2015 was drivenby growth in nearly all key categories, most notably Sportswear and Running.Fiscal 2015 unit sales of footwear increased 11%. Higher ASP per paircontributed approximately 11 percentage points of footwear revenue growth,driven by higher full-price ASP, primarily reflecting inflationary conditions incertain territories.
The constant currency growth in apparel revenue in fiscal 2015 resulted fromgrowth in most key categories, led by Sportswear and Running, partially offsetby a decline in Football (Soccer) due to comparison to strong sales related tothe World Cup in fiscal 2014. Unit sales of apparel increased 1% for fiscal2015. Higher ASP per unit contributed approximately 4 percentage points ofapparel revenue growth, primarily due to higher full-price ASP reflectinginflationary conditions in certain territories.
On a reported basis, EBIT declined 11% for fiscal 2015, primarily reflecting theimpact of weakening foreign currency exchange rates. Reported revenueincreases and slight selling and administrative expense leverage were morethan offset by lower gross margin. Gross margin decreased 340 basis pointsas higher product costs and unfavorable standard foreign currency exchangerates were only partially offset by higher full-price ASP. Selling andadministrative expense decreased as a percent of revenue despite increasesin both demand creation and operating overhead. Operating overheadincreased primarily as a result of investments in our growing DTC business,while demand creation increased as a result of higher sports marketing costs.
NIKE, INC. 2016 Annual Report and Notice of Annual Meeting 83
FOR
M10
-K
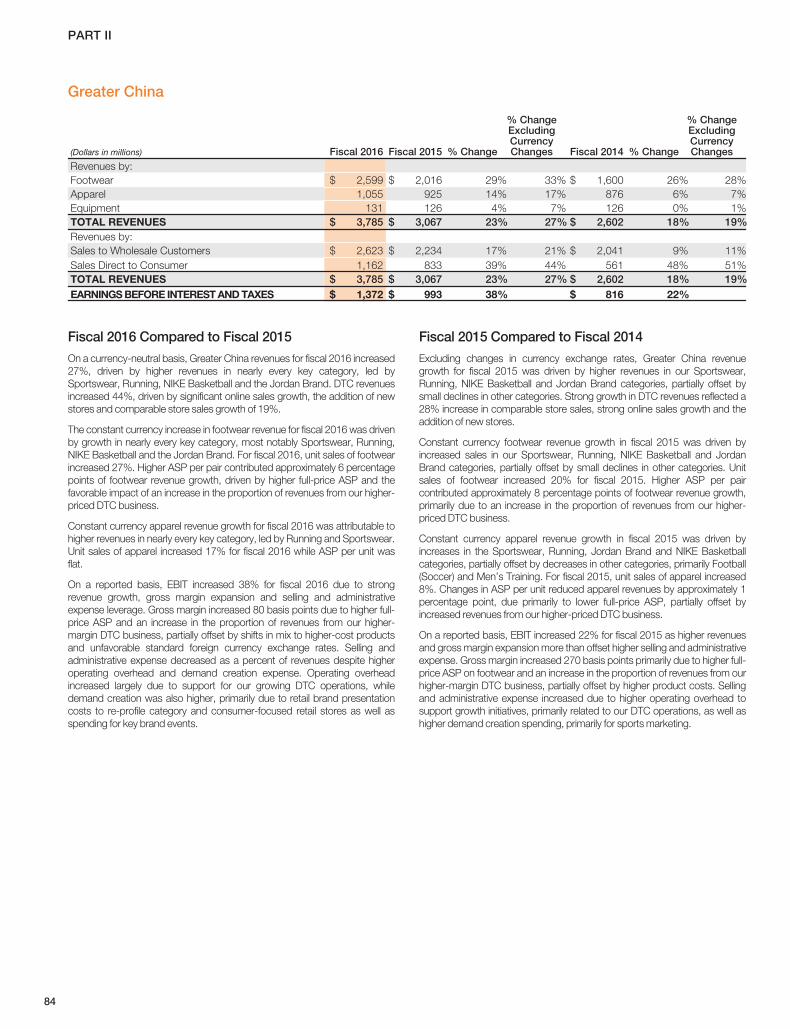
PART II
Greater China
(Dollars in millions) Fiscal 2016 Fiscal 2015 % Change
% ChangeExcludingCurrencyChanges Fiscal 2014 % Change
% ChangeExcludingCurrencyChanges
Revenues by:Footwear $ 2,599 $ 2,016 29% 33% $ 1,600 26% 28%Apparel 1,055 925 14% 17% 876 6% 7%Equipment 131 126 4% 7% 126 0% 1%TOTAL REVENUES $ 3,785 $ 3,067 23% 27% $ 2,602 18% 19%Revenues by:Sales to Wholesale Customers $ 2,623 $ 2,234 17% 21% $ 2,041 9% 11%Sales Direct to Consumer 1,162 833 39% 44% 561 48% 51%TOTAL REVENUES $ 3,785 $ 3,067 23% 27% $ 2,602 18% 19%EARNINGS BEFORE INTEREST AND TAXES $ 1,372 $ 993 38% $ 816 22%
Fiscal 2016 Compared to Fiscal 2015
On a currency-neutral basis, Greater China revenues for fiscal 2016 increased27%, driven by higher revenues in nearly every key category, led bySportswear, Running, NIKE Basketball and the Jordan Brand. DTC revenuesincreased 44%, driven by significant online sales growth, the addition of newstores and comparable store sales growth of 19%.
The constant currency increase in footwear revenue for fiscal 2016 was drivenby growth in nearly every key category, most notably Sportswear, Running,NIKE Basketball and the Jordan Brand. For fiscal 2016, unit sales of footwearincreased 27%. Higher ASP per pair contributed approximately 6 percentagepoints of footwear revenue growth, driven by higher full-price ASP and thefavorable impact of an increase in the proportion of revenues from our higher-priced DTC business.
Constant currency apparel revenue growth for fiscal 2016 was attributable tohigher revenues in nearly every key category, led by Running and Sportswear.Unit sales of apparel increased 17% for fiscal 2016 while ASP per unit wasflat.
On a reported basis, EBIT increased 38% for fiscal 2016 due to strongrevenue growth, gross margin expansion and selling and administrativeexpense leverage. Gross margin increased 80 basis points due to higher full-price ASP and an increase in the proportion of revenues from our higher-margin DTC business, partially offset by shifts in mix to higher-cost productsand unfavorable standard foreign currency exchange rates. Selling andadministrative expense decreased as a percent of revenues despite higheroperating overhead and demand creation expense. Operating overheadincreased largely due to support for our growing DTC operations, whiledemand creation was also higher, primarily due to retail brand presentationcosts to re-profile category and consumer-focused retail stores as well asspending for key brand events.
Fiscal 2015 Compared to Fiscal 2014
Excluding changes in currency exchange rates, Greater China revenuegrowth for fiscal 2015 was driven by higher revenues in our Sportswear,Running, NIKE Basketball and Jordan Brand categories, partially offset bysmall declines in other categories. Strong growth in DTC revenues reflected a28% increase in comparable store sales, strong online sales growth and theaddition of new stores.
Constant currency footwear revenue growth in fiscal 2015 was driven byincreased sales in our Sportswear, Running, NIKE Basketball and JordanBrand categories, partially offset by small declines in other categories. Unitsales of footwear increased 20% for fiscal 2015. Higher ASP per paircontributed approximately 8 percentage points of footwear revenue growth,primarily due to an increase in the proportion of revenues from our higher-priced DTC business.
Constant currency apparel revenue growth in fiscal 2015 was driven byincreases in the Sportswear, Running, Jordan Brand and NIKE Basketballcategories, partially offset by decreases in other categories, primarily Football(Soccer) and Men’s Training. For fiscal 2015, unit sales of apparel increased8%. Changes in ASP per unit reduced apparel revenues by approximately 1percentage point, due primarily to lower full-price ASP, partially offset byincreased revenues from our higher-priced DTC business.
On a reported basis, EBIT increased 22% for fiscal 2015 as higher revenuesand gross margin expansion more than offset higher selling and administrativeexpense. Gross margin increased 270 basis points primarily due to higher full-price ASP on footwear and an increase in the proportion of revenues from ourhigher-margin DTC business, partially offset by higher product costs. Sellingand administrative expense increased due to higher operating overhead tosupport growth initiatives, primarily related to our DTC operations, as well ashigher demand creation spending, primarily for sports marketing.
84
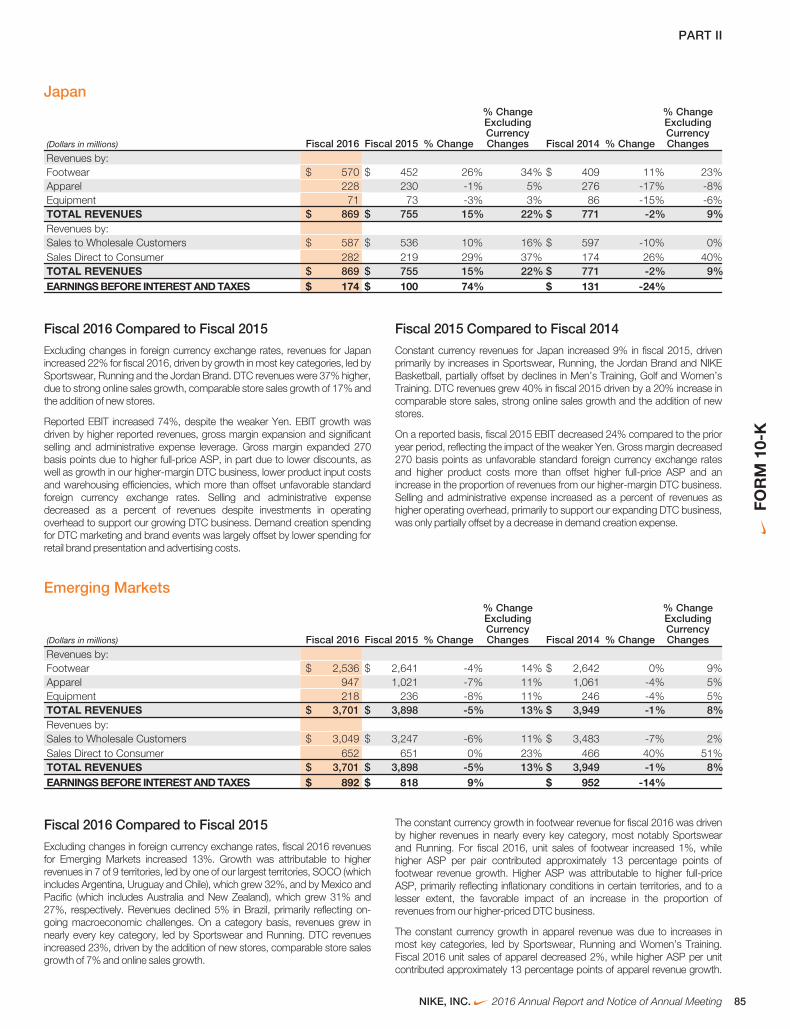
PART II
Japan
(Dollars in millions) Fiscal 2016 Fiscal 2015 % Change
% ChangeExcludingCurrencyChanges Fiscal 2014 % Change
% ChangeExcludingCurrencyChanges
Revenues by:Footwear $ 570 $ 452 26% 34% $ 409 11% 23%Apparel 228 230 -1% 5% 276 -17% -8%Equipment 71 73 -3% 3% 86 -15% -6%TOTAL REVENUES $ 869 $ 755 15% 22% $ 771 -2% 9%Revenues by:Sales to Wholesale Customers $ 587 $ 536 10% 16% $ 597 -10% 0%Sales Direct to Consumer 282 219 29% 37% 174 26% 40%TOTAL REVENUES $ 869 $ 755 15% 22% $ 771 -2% 9%EARNINGS BEFORE INTEREST AND TAXES $ 174 $ 100 74% $ 131 -24%
Fiscal 2016 Compared to Fiscal 2015
Excluding changes in foreign currency exchange rates, revenues for Japanincreased 22% for fiscal 2016, driven by growth in most key categories, led bySportswear, Running and the Jordan Brand. DTC revenues were 37% higher,due to strong online sales growth, comparable store sales growth of 17% andthe addition of new stores.
Reported EBIT increased 74%, despite the weaker Yen. EBIT growth wasdriven by higher reported revenues, gross margin expansion and significantselling and administrative expense leverage. Gross margin expanded 270basis points due to higher full-price ASP, in part due to lower discounts, aswell as growth in our higher-margin DTC business, lower product input costsand warehousing efficiencies, which more than offset unfavorable standardforeign currency exchange rates. Selling and administrative expensedecreased as a percent of revenues despite investments in operatingoverhead to support our growing DTC business. Demand creation spendingfor DTC marketing and brand events was largely offset by lower spending forretail brand presentation and advertising costs.
Fiscal 2015 Compared to Fiscal 2014
Constant currency revenues for Japan increased 9% in fiscal 2015, drivenprimarily by increases in Sportswear, Running, the Jordan Brand and NIKEBasketball, partially offset by declines in Men’s Training, Golf and Women’sTraining. DTC revenues grew 40% in fiscal 2015 driven by a 20% increase incomparable store sales, strong online sales growth and the addition of newstores.
On a reported basis, fiscal 2015 EBIT decreased 24% compared to the prioryear period, reflecting the impact of the weaker Yen. Gross margin decreased270 basis points as unfavorable standard foreign currency exchange ratesand higher product costs more than offset higher full-price ASP and anincrease in the proportion of revenues from our higher-margin DTC business.Selling and administrative expense increased as a percent of revenues ashigher operating overhead, primarily to support our expanding DTC business,was only partially offset by a decrease in demand creation expense.
Emerging Markets
(Dollars in millions) Fiscal 2016 Fiscal 2015 % Change
% ChangeExcludingCurrencyChanges Fiscal 2014 % Change
% ChangeExcludingCurrencyChanges
Revenues by:Footwear $ 2,536 $ 2,641 -4% 14% $ 2,642 0% 9%Apparel 947 1,021 -7% 11% 1,061 -4% 5%Equipment 218 236 -8% 11% 246 -4% 5%TOTAL REVENUES $ 3,701 $ 3,898 -5% 13% $ 3,949 -1% 8%Revenues by:Sales to Wholesale Customers $ 3,049 $ 3,247 -6% 11% $ 3,483 -7% 2%Sales Direct to Consumer 652 651 0% 23% 466 40% 51%TOTAL REVENUES $ 3,701 $ 3,898 -5% 13% $ 3,949 -1% 8%EARNINGS BEFORE INTEREST AND TAXES $ 892 $ 818 9% $ 952 -14%
Fiscal 2016 Compared to Fiscal 2015
Excluding changes in foreign currency exchange rates, fiscal 2016 revenuesfor Emerging Markets increased 13%. Growth was attributable to higherrevenues in 7 of 9 territories, led by one of our largest territories, SOCO (whichincludes Argentina, Uruguay and Chile), which grew 32%, and by Mexico andPacific (which includes Australia and New Zealand), which grew 31% and27%, respectively. Revenues declined 5% in Brazil, primarily reflecting on-going macroeconomic challenges. On a category basis, revenues grew innearly every key category, led by Sportswear and Running. DTC revenuesincreased 23%, driven by the addition of new stores, comparable store salesgrowth of 7% and online sales growth.
The constant currency growth in footwear revenue for fiscal 2016 was drivenby higher revenues in nearly every key category, most notably Sportswearand Running. For fiscal 2016, unit sales of footwear increased 1%, whilehigher ASP per pair contributed approximately 13 percentage points offootwear revenue growth. Higher ASP was attributable to higher full-priceASP, primarily reflecting inflationary conditions in certain territories, and to alesser extent, the favorable impact of an increase in the proportion ofrevenues from our higher-priced DTC business.
The constant currency growth in apparel revenue was due to increases inmost key categories, led by Sportswear, Running and Women’s Training.Fiscal 2016 unit sales of apparel decreased 2%, while higher ASP per unitcontributed approximately 13 percentage points of apparel revenue growth.
NIKE, INC. 2016 Annual Report and Notice of Annual Meeting 85
FOR
M10
-K
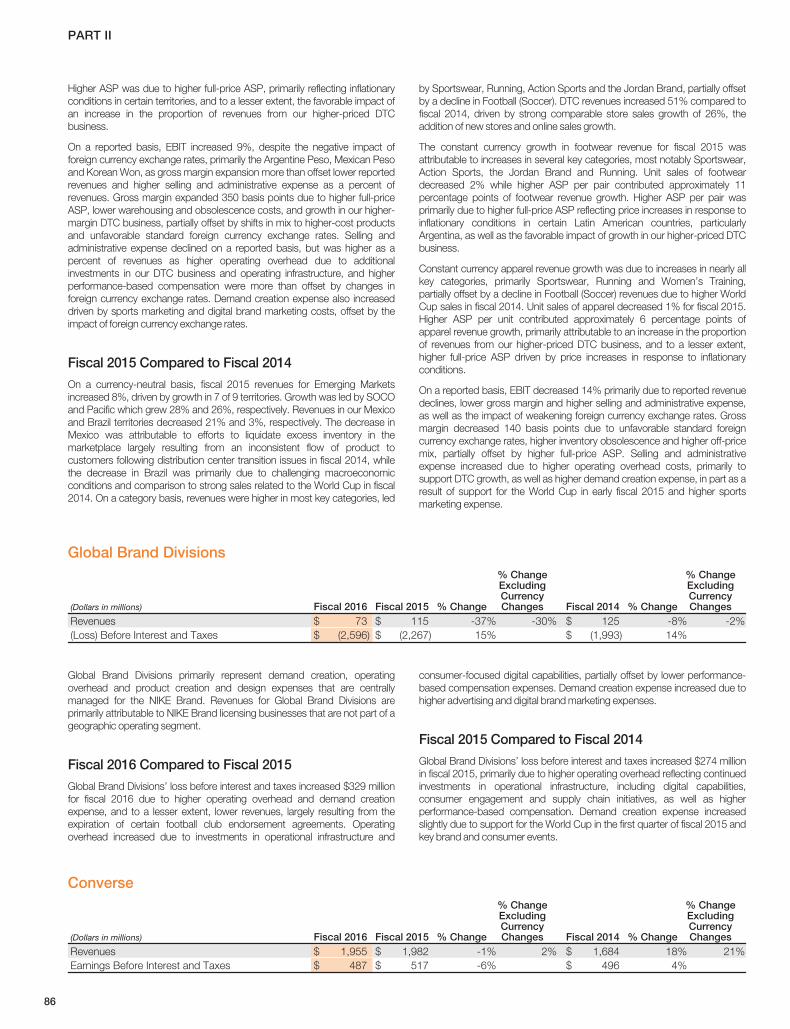
PART II
Higher ASP was due to higher full-price ASP, primarily reflecting inflationaryconditions in certain territories, and to a lesser extent, the favorable impact ofan increase in the proportion of revenues from our higher-priced DTCbusiness.
On a reported basis, EBIT increased 9%, despite the negative impact offoreign currency exchange rates, primarily the Argentine Peso, Mexican Pesoand Korean Won, as gross margin expansion more than offset lower reportedrevenues and higher selling and administrative expense as a percent ofrevenues. Gross margin expanded 350 basis points due to higher full-priceASP, lower warehousing and obsolescence costs, and growth in our higher-margin DTC business, partially offset by shifts in mix to higher-cost productsand unfavorable standard foreign currency exchange rates. Selling andadministrative expense declined on a reported basis, but was higher as apercent of revenues as higher operating overhead due to additionalinvestments in our DTC business and operating infrastructure, and higherperformance-based compensation were more than offset by changes inforeign currency exchange rates. Demand creation expense also increaseddriven by sports marketing and digital brand marketing costs, offset by theimpact of foreign currency exchange rates.
Fiscal 2015 Compared to Fiscal 2014
On a currency-neutral basis, fiscal 2015 revenues for Emerging Marketsincreased 8%, driven by growth in 7 of 9 territories. Growth was led by SOCOand Pacific which grew 28% and 26%, respectively. Revenues in our Mexicoand Brazil territories decreased 21% and 3%, respectively. The decrease inMexico was attributable to efforts to liquidate excess inventory in themarketplace largely resulting from an inconsistent flow of product tocustomers following distribution center transition issues in fiscal 2014, whilethe decrease in Brazil was primarily due to challenging macroeconomicconditions and comparison to strong sales related to the World Cup in fiscal2014. On a category basis, revenues were higher in most key categories, led
by Sportswear, Running, Action Sports and the Jordan Brand, partially offsetby a decline in Football (Soccer). DTC revenues increased 51% compared tofiscal 2014, driven by strong comparable store sales growth of 26%, theaddition of new stores and online sales growth.
The constant currency growth in footwear revenue for fiscal 2015 wasattributable to increases in several key categories, most notably Sportswear,Action Sports, the Jordan Brand and Running. Unit sales of footweardecreased 2% while higher ASP per pair contributed approximately 11percentage points of footwear revenue growth. Higher ASP per pair wasprimarily due to higher full-price ASP reflecting price increases in response toinflationary conditions in certain Latin American countries, particularlyArgentina, as well as the favorable impact of growth in our higher-priced DTCbusiness.
Constant currency apparel revenue growth was due to increases in nearly allkey categories, primarily Sportswear, Running and Women’s Training,partially offset by a decline in Football (Soccer) revenues due to higher WorldCup sales in fiscal 2014. Unit sales of apparel decreased 1% for fiscal 2015.Higher ASP per unit contributed approximately 6 percentage points ofapparel revenue growth, primarily attributable to an increase in the proportionof revenues from our higher-priced DTC business, and to a lesser extent,higher full-price ASP driven by price increases in response to inflationaryconditions.
On a reported basis, EBIT decreased 14% primarily due to reported revenuedeclines, lower gross margin and higher selling and administrative expense,as well as the impact of weakening foreign currency exchange rates. Grossmargin decreased 140 basis points due to unfavorable standard foreigncurrency exchange rates, higher inventory obsolescence and higher off-pricemix, partially offset by higher full-price ASP. Selling and administrativeexpense increased due to higher operating overhead costs, primarily tosupport DTC growth, as well as higher demand creation expense, in part as aresult of support for the World Cup in early fiscal 2015 and higher sportsmarketing expense.
Global Brand Divisions
(Dollars in millions) Fiscal 2016 Fiscal 2015 % Change
% ChangeExcludingCurrencyChanges Fiscal 2014 % Change
% ChangeExcludingCurrencyChanges
Revenues $ 73 $ 115 -37% -30% $ 125 -8% -2%(Loss) Before Interest and Taxes $ (2,596) $ (2,267) 15% $ (1,993) 14%
Global Brand Divisions primarily represent demand creation, operatingoverhead and product creation and design expenses that are centrallymanaged for the NIKE Brand. Revenues for Global Brand Divisions areprimarily attributable to NIKE Brand licensing businesses that are not part of ageographic operating segment.
Fiscal 2016 Compared to Fiscal 2015
Global Brand Divisions’ loss before interest and taxes increased $329 millionfor fiscal 2016 due to higher operating overhead and demand creationexpense, and to a lesser extent, lower revenues, largely resulting from theexpiration of certain football club endorsement agreements. Operatingoverhead increased due to investments in operational infrastructure and
consumer-focused digital capabilities, partially offset by lower performance-based compensation expenses. Demand creation expense increased due tohigher advertising and digital brand marketing expenses.
Fiscal 2015 Compared to Fiscal 2014
Global Brand Divisions’ loss before interest and taxes increased $274 millionin fiscal 2015, primarily due to higher operating overhead reflecting continuedinvestments in operational infrastructure, including digital capabilities,consumer engagement and supply chain initiatives, as well as higherperformance-based compensation. Demand creation expense increasedslightly due to support for the World Cup in the first quarter of fiscal 2015 andkey brand and consumer events.
Converse
(Dollars in millions) Fiscal 2016 Fiscal 2015 % Change
% ChangeExcludingCurrencyChanges Fiscal 2014 % Change
% ChangeExcludingCurrencyChanges
Revenues $ 1,955 $ 1,982 -1% 2% $ 1,684 18% 21%Earnings Before Interest and Taxes $ 487 $ 517 -6% $ 496 4%
86
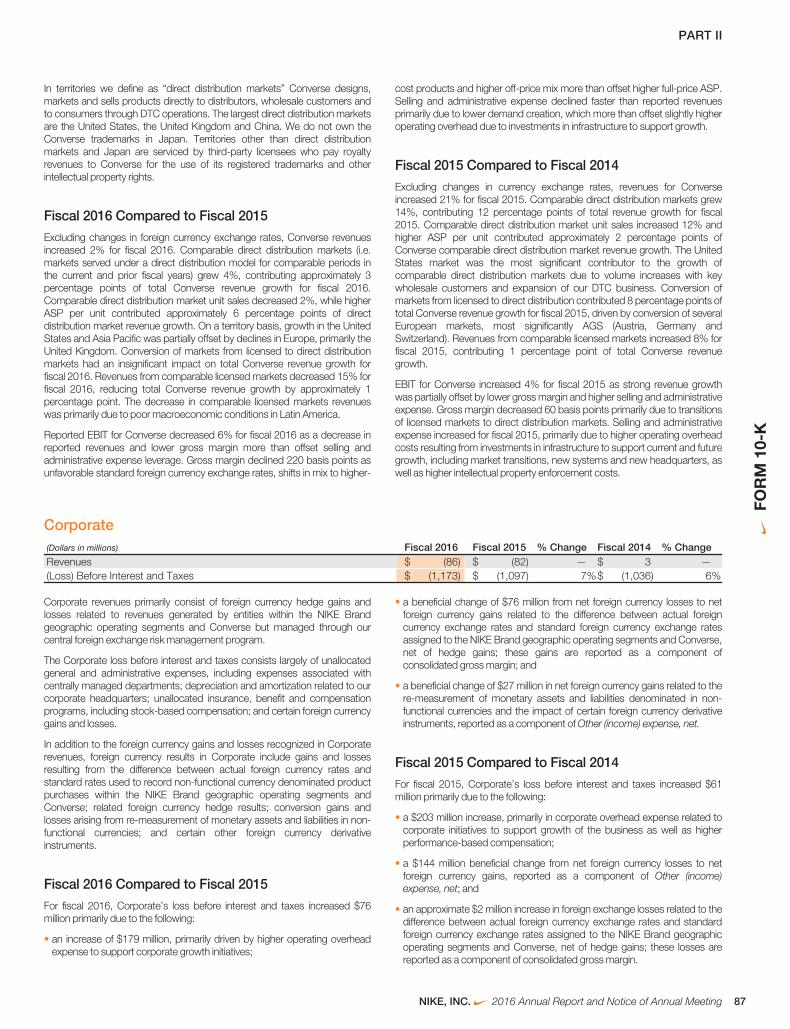
PART II
In territories we define as “direct distribution markets” Converse designs,markets and sells products directly to distributors, wholesale customers andto consumers through DTC operations. The largest direct distribution marketsare the United States, the United Kingdom and China. We do not own theConverse trademarks in Japan. Territories other than direct distributionmarkets and Japan are serviced by third-party licensees who pay royaltyrevenues to Converse for the use of its registered trademarks and otherintellectual property rights.
Fiscal 2016 Compared to Fiscal 2015
Excluding changes in foreign currency exchange rates, Converse revenuesincreased 2% for fiscal 2016. Comparable direct distribution markets (i.e.markets served under a direct distribution model for comparable periods inthe current and prior fiscal years) grew 4%, contributing approximately 3percentage points of total Converse revenue growth for fiscal 2016.Comparable direct distribution market unit sales decreased 2%, while higherASP per unit contributed approximately 6 percentage points of directdistribution market revenue growth. On a territory basis, growth in the UnitedStates and Asia Pacific was partially offset by declines in Europe, primarily theUnited Kingdom. Conversion of markets from licensed to direct distributionmarkets had an insignificant impact on total Converse revenue growth forfiscal 2016. Revenues from comparable licensed markets decreased 15% forfiscal 2016, reducing total Converse revenue growth by approximately 1percentage point. The decrease in comparable licensed markets revenueswas primarily due to poor macroeconomic conditions in Latin America.
Reported EBIT for Converse decreased 6% for fiscal 2016 as a decrease inreported revenues and lower gross margin more than offset selling andadministrative expense leverage. Gross margin declined 220 basis points asunfavorable standard foreign currency exchange rates, shifts in mix to higher-
cost products and higher off-price mix more than offset higher full-price ASP.Selling and administrative expense declined faster than reported revenuesprimarily due to lower demand creation, which more than offset slightly higheroperating overhead due to investments in infrastructure to support growth.
Fiscal 2015 Compared to Fiscal 2014
Excluding changes in currency exchange rates, revenues for Converseincreased 21% for fiscal 2015. Comparable direct distribution markets grew14%, contributing 12 percentage points of total revenue growth for fiscal2015. Comparable direct distribution market unit sales increased 12% andhigher ASP per unit contributed approximately 2 percentage points ofConverse comparable direct distribution market revenue growth. The UnitedStates market was the most significant contributor to the growth ofcomparable direct distribution markets due to volume increases with keywholesale customers and expansion of our DTC business. Conversion ofmarkets from licensed to direct distribution contributed 8 percentage points oftotal Converse revenue growth for fiscal 2015, driven by conversion of severalEuropean markets, most significantly AGS (Austria, Germany andSwitzerland). Revenues from comparable licensed markets increased 8% forfiscal 2015, contributing 1 percentage point of total Converse revenuegrowth.
EBIT for Converse increased 4% for fiscal 2015 as strong revenue growthwas partially offset by lower gross margin and higher selling and administrativeexpense. Gross margin decreased 60 basis points primarily due to transitionsof licensed markets to direct distribution markets. Selling and administrativeexpense increased for fiscal 2015, primarily due to higher operating overheadcosts resulting from investments in infrastructure to support current and futuregrowth, including market transitions, new systems and new headquarters, aswell as higher intellectual property enforcement costs.
Corporate(Dollars in millions) Fiscal 2016 Fiscal 2015 % Change Fiscal 2014 % ChangeRevenues $ (86) $ (82) — $ 3 —(Loss) Before Interest and Taxes $ (1,173) $ (1,097) 7%$ (1,036) 6%
Corporate revenues primarily consist of foreign currency hedge gains andlosses related to revenues generated by entities within the NIKE Brandgeographic operating segments and Converse but managed through ourcentral foreign exchange risk management program.
The Corporate loss before interest and taxes consists largely of unallocatedgeneral and administrative expenses, including expenses associated withcentrally managed departments; depreciation and amortization related to ourcorporate headquarters; unallocated insurance, benefit and compensationprograms, including stock-based compensation; and certain foreign currencygains and losses.
In addition to the foreign currency gains and losses recognized in Corporaterevenues, foreign currency results in Corporate include gains and lossesresulting from the difference between actual foreign currency rates andstandard rates used to record non-functional currency denominated productpurchases within the NIKE Brand geographic operating segments andConverse; related foreign currency hedge results; conversion gains andlosses arising from re-measurement of monetary assets and liabilities in non-functional currencies; and certain other foreign currency derivativeinstruments.
Fiscal 2016 Compared to Fiscal 2015
For fiscal 2016, Corporate’s loss before interest and taxes increased $76million primarily due to the following:
• an increase of $179 million, primarily driven by higher operating overheadexpense to support corporate growth initiatives;
• a beneficial change of $76 million from net foreign currency losses to netforeign currency gains related to the difference between actual foreigncurrency exchange rates and standard foreign currency exchange ratesassigned to the NIKE Brand geographic operating segments and Converse,net of hedge gains; these gains are reported as a component ofconsolidated gross margin; and
• a beneficial change of $27 million in net foreign currency gains related to there-measurement of monetary assets and liabilities denominated in non-functional currencies and the impact of certain foreign currency derivativeinstruments, reported as a component of Other (income) expense, net.
Fiscal 2015 Compared to Fiscal 2014
For fiscal 2015, Corporate’s loss before interest and taxes increased $61million primarily due to the following:
• a $203 million increase, primarily in corporate overhead expense related tocorporate initiatives to support growth of the business as well as higherperformance-based compensation;
• a $144 million beneficial change from net foreign currency losses to netforeign currency gains, reported as a component of Other (income)expense, net; and
• an approximate $2 million increase in foreign exchange losses related to thedifference between actual foreign currency exchange rates and standardforeign currency exchange rates assigned to the NIKE Brand geographicoperating segments and Converse, net of hedge gains; these losses arereported as a component of consolidated gross margin.
NIKE, INC. 2016 Annual Report and Notice of Annual Meeting 87
FOR
M10
-K
PART II
Foreign Currency Exposures and Hedging Practices
OverviewAs a global company with significant operations outside the United States, inthe normal course of business we are exposed to risk arising from changes incurrency exchange rates. Our primary foreign currency exposures arise fromthe recording of transactions denominated in non-functional currencies andthe translation of foreign currency denominated results of operations, financialposition and cash flows into U.S. Dollars.
Our foreign exchange risk management program is intended to lessen boththe positive and negative effects of currency fluctuations on our consolidatedresults of operations, financial position and cash flows. We manage globalforeign exchange risk centrally on a portfolio basis to address those risks thatare material to NIKE, Inc. We manage these exposures by taking advantageof natural offsets and currency correlations that exist within the portfolio and,where practical and material, by hedging a portion of the remaining exposuresusing derivative instruments such as forward contracts and options. Asdescribed below, the implementation of the NIKE Trading Company (“NTC”)and our foreign currency adjustment program enhanced our ability to manageour foreign exchange risk by increasing the natural offsets and currencycorrelation benefits that exist within our portfolio of foreign exchangeexposures. Our hedging policy is designed to partially or entirely offset theimpact of exchange rate changes on the underlying net exposures beinghedged. Where exposures are hedged, our program has the effect ofdelaying the impact of exchange rate movements on our ConsolidatedFinancial Statements; the length of the delay is dependent upon hedgehorizons. We do not hold or issue derivative instruments for trading orspeculative purposes.
Transactional ExposuresWe conduct business in various currencies and have transactions whichsubject us to foreign currency risk. Our most significant transactional foreigncurrency exposures are:
• Product Costs — NIKE’s product costs are exposed to fluctuations inforeign currencies in the following ways:
1. Product purchases denominated in currencies other than thefunctional currency of the transacting entity:
a. Certain NIKE entities purchase product from the NTC, a wholly-owned sourcing hub that buys NIKE branded products fromthird-party factories, predominantly in U.S. Dollars. The NTC,whose functional currency is the U.S. Dollar, then sells theproducts to NIKE entities in their respective functional currencies.When the NTC sells to a NIKE entity with a different functionalcurrency, the result is a foreign currency exposure for the NTC.
b. Other NIKE entities purchase product directly from third-partyfactories in U.S. Dollars. These purchases generate a foreigncurrency exposure for those NIKE entities with a functionalcurrency other than the U.S. Dollar.
In both purchasing scenarios, a weaker U.S. Dollar decreases theinventory cost incurred by NIKE whereas a stronger U.S. Dollarincreases its cost.
2. Factory input costs: NIKE operates a foreign currency adjustmentprogram with certain factories. The program is designed to moreeffectively manage foreign currency risk by assuming certain of thefactories’ foreign currency exposures, some of which are naturaloffsets to our existing foreign currency exposures. Under thisprogram, our payments to these factories are adjusted for ratefluctuations in the basket of currencies (“factory currency exposureindex”) in which the labor, materials and overhead costs incurred by
the factories in the production of NIKE branded products (“factoryinput costs”) are denominated.
For the currency within the factory currency exposure indices that isthe local or functional currency of the factory, the currency ratefluctuation affecting the product cost is recorded within Inventoriesand is recognized in Cost of sales when the related product is sold to athird-party. All currencies within the indices, excluding the U.S. Dollarand the local or functional currency of the factory, are recognized asembedded derivative contracts and are recorded at fair value throughOther (income) expense, net. Refer to Note 16 — Risk Managementand Derivatives in the accompanying Notes to the ConsolidatedFinancial Statements for additional detail.
As an offset to the impacts of the fluctuating U.S. Dollar on our non-functional currency denominated product purchases describedabove, a strengthening U.S. Dollar against the foreign currencieswithin the factory currency exposure indices decreases NIKE’sU.S. Dollar inventory cost. Conversely, a weakening U.S. Dollaragainst the indexed foreign currencies increases our inventory cost.
• Non-Functional Currency Denominated External Sales — A portion of ourWestern Europe and Central & Eastern Europe geography revenues, as wellas a portion of our Converse European operations revenues, are earned incurrencies other than the Euro (e.g. the British Pound) but are recognized ata subsidiary that uses the Euro as its functional currency. These salesgenerate a foreign currency exposure.
• Other Costs — Non-functional currency denominated costs, such asendorsement contracts, also generate foreign currency risk, though to alesser extent. In certain cases, the Company has also entered into othercontractual agreements which have payments that are indexed to foreigncurrencies and create embedded derivative contracts that are recorded atfair value through Other (income) expense, net. Refer to Note 16 — RiskManagement and Derivatives in the accompanying Notes to theConsolidated Financial Statements for additional detail.
• Non-Functional Currency Denominated Monetary Assets and Liabilities —Our global subsidiaries have various assets and liabilities, primarilyreceivables and payables, including intercompany receivables andpayables, denominated in currencies other than their functional currencies.These balance sheet items are subject to re-measurement which maycreate fluctuations in Other (income) expense, net within our consolidatedresults of operations.
Managing Transactional ExposuresTransactional exposures are managed on a portfolio basis within our foreigncurrency risk management program. We manage these exposures by takingadvantage of natural offsets and currency correlations that exist within theportfolio and may also elect to use currency forward and option contracts tohedge a portion of the remaining effect of exchange rate fluctuations onprobable forecasted future cash flows, including certain product costpurchase exposures, non-functional currency denominated external salesand other costs described above. Generally, these are accounted for as cashflow hedges in accordance with the accounting standards for derivatives andhedging, except for hedges of the embedded derivatives component of theproduct cost exposures as discussed below.
Certain currency forward contracts used to manage the foreign exchangeexposure of non-functional currency denominated monetary assets andliabilities subject to re-measurement and the embedded derivative contractsdiscussed above are not formally designated as hedging instruments underthe accounting standards for derivatives and hedging. Accordingly, changesin fair value of these instruments are immediately recognized in Other (income)expense, net and are intended to offset the foreign currency impact of the re-measurement of the related non-functional currency denominated asset orliability or the embedded derivative contract being hedged.
88
PART II
Refer to Note 6 — Fair Value Measurements and Note 16 — RiskManagement and Derivatives in the accompanying Notes to the ConsolidatedFinancial Statements for additional description of how the above financialinstruments are valued and recorded as well as the fair value of outstandingderivatives at each reported period end.
Translational ExposuresMany of our foreign subsidiaries operate in functional currencies other thanthe U.S. Dollar. Fluctuations in currency exchange rates create volatility in ourreported results as we are required to translate the balance sheets,operational results and cash flows of these subsidiaries into U.S. Dollars forconsolidated reporting. The translation of foreign subsidiaries’ non-U.S. Dollardenominated balance sheets into U.S. Dollars for consolidated reportingresults in a cumulative translation adjustment to Accumulated othercomprehensive income within the Consolidated Statements of Shareholders’Equity. In the translation of our Consolidated Statements of Income, a weakerU.S. Dollar in relation to foreign functional currencies benefits our consolidatedearnings whereas a stronger U.S. Dollar reduces our consolidated earnings.The impact of foreign exchange rate fluctuations on the translation of ourconsolidated Revenues was a detriment of approximately $1,985 million and$1,171 million for the years ended May 31, 2016 and 2015, respectively. Theimpact of foreign exchange rate fluctuations on the translation of our Incomebefore income taxes was a detriment of approximately $449 million and $221million for the years ended May 31, 2016 and 2015, respectively.
Managing Translational Exposures
To minimize the impact of translating foreign currency denominated revenuesand expenses into U.S. Dollars for consolidated reporting, certain foreignsubsidiaries use excess cash to purchase U.S. Dollar denominated available-for-sale investments. The variable future cash flows associated with thepurchase and subsequent sale of these U.S. Dollar denominated securities atnon-U.S. Dollar functional currency subsidiaries creates a foreign currency
exposure that qualifies for hedge accounting under the accounting standardsfor derivatives and hedging. We utilize forward contracts and/or options tomitigate the variability of the forecasted future purchases and sales of theseU.S. Dollar investments. The combination of the purchase and sale of theU.S. Dollar investment and the hedging instrument has the effect of partiallyoffsetting the year-over-year foreign currency translation impact on netearnings in the period the investments are sold. Hedges of available-for-saleinvestments are accounted for as cash flow hedges.
Refer to Note 6 — Fair Value Measurements and Note 16 — RiskManagement and Derivatives in the accompanying Notes to the ConsolidatedFinancial Statements for additional description of how the above financialinstruments are valued and recorded as well as the fair value of outstandingderivatives at each reported period end.
We estimate the combination of translation of foreign currency-denominatedprofits from our international businesses and the year-over-year change inforeign currency related gains and losses included in Other (income) expense,net had an unfavorable impact of approximately $423 million and $73 millionon our Income before income taxes for the years ended May 31, 2016 and2015, respectively.
Net Investments in Foreign SubsidiariesWe are also exposed to the impact of foreign exchange fluctuations on ourinvestments in wholly-owned foreign subsidiaries denominated in a currencyother than the U.S. Dollar, which could adversely impact the U.S. Dollar valueof these investments and therefore the value of future repatriated earnings.We have, in the past, hedged and may, in the future, hedge net investmentpositions in certain foreign subsidiaries to mitigate the effects of foreignexchange fluctuations on these net investments. These hedges areaccounted for in accordance with the accounting standards for netinvestment hedges. There were no outstanding net investment hedges as ofMay 31, 2016 and 2015. There were no cash flows from net investmenthedge settlements for the years ended May 31, 2016 and 2015.
Liquidity and Capital Resources
Cash Flow ActivityCash provided by operations was $3,096 million for fiscal 2016 compared to$4,680 million for fiscal 2015. Our primary source of operating cash flow forfiscal 2016 was Net income of $3,760 million. Our fiscal 2016 change inworking capital was a net cash outflow of $1,580 million as compared to a netcash inflow of $256 million for fiscal 2015. The change in working capital wasprimarily due to a net decrease in the amount of cash collateral received as aresult of hedging activities (refer to the Credit Risk section of Note 16 — RiskManagement and Derivatives for additional detail). For fiscal 2016, cashcollateral received from counterparties declined $863 million as compared toan increase in collateral received from counterparties of $968 million for fiscal2015.
Cash used by investing activities was $1,034 million for fiscal 2016, comparedto a $175 million use of cash for fiscal 2015. The primary driver of the increasein Cash used by investing activities was the net change in short-terminvestments (including sales, maturities and purchases) from net sales/maturities to net purchases. In fiscal 2016, there were $57 million of netpurchases of short-term investments compared to $935 million of net sales/maturities of short-term investments in the same period of fiscal 2015.Additions to property, plant and equipment were $1,143 million for fiscal 2016as compared to $963 million for fiscal 2015. The increase in Additions toproperty, plant and equipment resulted from continued investments ininfrastructure to support current and future growth, primarily relating to supplychain and corporate initiatives, as well as expansion of our DTC operations.
In fiscal 2017, we plan to continue investing in our infrastructure to supportfuture growth, as well as expand our digital capabilities. We anticipateinvesting approximately 4% of revenue, a portion of which will be used for thecontinued expansion of our corporate facilities, new DTC stores and digitalcapabilities.
Cash used by financing activities was $2,671 million for fiscal 2016 comparedto $2,790 million for fiscal 2015, a decrease of $119 million, as increases inshare repurchases and dividends were more than offset by the receipt of$981 million in net proceeds from the issuance of long-term debt in October2015.
In fiscal 2016, we purchased 55.4 million shares of NIKE’s Class B CommonStock for $3,238 million (an average price of $58.44). During the third quarterof fiscal 2016, we concluded the Company’s four-year, $8 billion sharerepurchase program approved by our Board of Directors in September 2012.Under this program the Company purchased a total of 197.1 million shares ata cost of $8 billion (an average price of $40.58 per share). Following thecompletion of this program, the Company began purchases under a four-year, $12 billion program approved by our Board of Directors in November2015. Of the total 55.4 million shares repurchased in fiscal 2016, 20.1 millionshares were purchased under this new program at a cost of approximately$1,189 million (an average price of $59.21 per share). We continue to expectfunding of share repurchases will come from operating cash flow, excesscash and/or debt. The timing and the amount of shares purchased will bedictated by our capital needs and stock market conditions.
NIKE, INC. 2016 Annual Report and Notice of Annual Meeting 89
FOR
M10
-K
PART II
Capital ResourcesOn April 23, 2013, we filed a shelf registration statement (the “Shelf”) with theSEC which permitted us to issue an unlimited amount of debt securities. OnApril 23, 2013, we issued $1.0 billion of senior notes with tranches maturing in2023 and 2043. The 2023 senior notes were issued in an initial aggregateprincipal amount of $500 million at a 2.25% fixed, annual interest rate and willmature on May 1, 2023. The 2043 senior notes were issued in an initialaggregate principal amount of $500 million at a 3.625% fixed, annual interestrate and will mature on May 1, 2043. Interest on the senior notes is payablesemi-annually on May 1 and November 1 of each year. The issuance resultedin gross proceeds before expenses of $998 million. On October 29, 2015, weissued an additional $1.0 billion of senior notes at a 3.875% fixed, annualinterest rate that will mature on November 1, 2045. Interest on the seniornotes is payable semi-annually on May 1 and November 1 of each year. Theissuance resulted in proceeds before expenses of $991 million. The Shelfexpired on April 23, 2016. We plan to file a new shelf registration statementwith the SEC in July 2016.
On August 28, 2015, we entered into a committed credit facility agreementwith a syndicate of banks, which provides for up to $2 billion of borrowings.The facility matures August 28, 2020, with a one year extension option prior toany anniversary of the closing date, provided that in no event shall it extendbeyond August 28, 2022. This facility replaces the prior $1 billion credit facilityagreement entered into on November 1, 2011, which would have maturedNovember 1, 2017. As of and for the periods ended May 31, 2016 and 2015,we had no amounts outstanding under either committed credit facility.
We currently have long-term debt ratings of AA- and A1 from Standard andPoor’s Corporation and Moody’s Investor Services, respectively. If our long-term debt ratings were to decline, the facility fee and interest rate under ourcommitted credit facility would increase. Conversely, if our long-term debtrating were to improve, the facility fee and interest rate would decrease.Changes in our long-term debt rating would not trigger acceleration ofmaturity of any then-outstanding borrowings or any future borrowings underthe committed credit facility. Under this committed revolving credit facility, wehave agreed to various covenants. These covenants include limits on ourdisposal of fixed assets, the amount of debt secured by liens we may incur, aswell as limits on the indebtedness we can incur relative to our net worth. In theevent we were to have any borrowings outstanding under this facility andfailed to meet any covenant, and were unable to obtain a waiver from amajority of the banks in the syndicate, any borrowings would becomeimmediately due and payable. As of May 31, 2016, we were in full compliancewith each of these covenants and believe it is unlikely we will fail to meet any ofthese covenants in the foreseeable future.
Liquidity is also provided by our $2 billion commercial paper program, whichincreased $1 billion during the second quarter of fiscal 2016. During the yearended May 31, 2016, we did not issue commercial paper, and as of May 31,2016, there were no outstanding borrowings under this program. Any future
issuance of commercial paper or other debt securities during fiscal 2017 willdepend on general corporate needs. We currently have short-term debtratings of A1+ and P1 from Standard and Poor’s Corporation and Moody’sInvestor Services, respectively.
As of May 31, 2016, we had cash, cash equivalents and short-terminvestments totaling $5.5 billion, of which $4.6 billion was held by our foreignsubsidiaries. Included in Cash and equivalents as of May 31, 2016 was $105million of cash collateral received from counterparties as a result of hedgingactivity. Cash equivalents and Short-term investments consist primarily ofdeposits held at major banks, money market funds, commercial paper,corporate notes, U.S. Treasury obligations, U.S. government sponsoredenterprise obligations and other investment grade fixed incomesecurities. Our fixed income investments are exposed to both credit andinterest rate risk. All of our investments are investment grade to minimize ourcredit risk. While individual securities have varying durations, as of May 31,2016, the weighted average remaining duration of our cash equivalents andshort-term investments portfolio was 91 days.
To date we have not experienced difficulty accessing the credit markets orincurred higher interest costs. Future volatility in the capital markets, however,may increase costs associated with issuing commercial paper or other debtinstruments or affect our ability to access those markets. We believe thatexisting cash, cash equivalents, short-term investments and cash generatedby operations, together with access to external sources of funds as describedabove, will be sufficient to meet our domestic and foreign capital needs in theforeseeable future.
We utilize a variety of tax planning and financing strategies to manage ourworldwide cash and deploy funds to locations where they are needed. Weroutinely repatriate a portion of our foreign earnings for which U.S. taxes havepreviously been provided. We also indefinitely reinvest a significant portion ofour foreign earnings, and our current plans do not demonstrate a need torepatriate these earnings. Should we require additional capital in the UnitedStates, we may elect to repatriate indefinitely reinvested foreign funds or raisecapital in the United States through debt. If we were to repatriate indefinitelyreinvested foreign funds, we would be required to accrue and pay additionalU.S. taxes less applicable foreign tax credits. If we elect to raise capital in theUnited States through debt, we would incur additional interest expense.
Off-Balance Sheet ArrangementsIn connection with various contracts and agreements, we routinely provideindemnification relating to the enforceability of intellectual property rights,coverage for legal issues that arise and other items where we are acting as theguarantor. Currently, we have several such agreements in place. However,based on our historical experience and the estimated probability of future loss,we have determined that the fair value of such indemnification is not materialto our financial position or results of operations.
Contractual Obligations
Our significant long-term contractual obligations as of May 31, 2016 and significant endorsement contracts, including related marketing commitments, enteredinto through the date of this report are as follows:
Description of Commitment Cash Payments Due During the Year Ending May 31,(In millions) 2017 2018 2019 2020 2021 Thereafter TotalOperating Leases $ 491 $ 453 $ 395 $ 347 $ 301 $ 1,244 $ 3,231Capital Leases 7 5 2 1 — — 15Long-Term Debt(1) 115 75 74 74 71 3,365 3,774Endorsement Contracts(2) 1,198 1,238 945 827 698 4,514 9,420Product Purchase Obligations(3) 4,149 — — — — — 4,149Other Purchase Obligations(4) 384 118 90 48 42 90 772TOTAL $ 6,344 $ 1,889 $ 1,506 $ 1,297 $ 1,112 $ 9,213 $ 21,361
(1) The cash payments due for long-term debt include estimated interest payments. Estimates of interest payments are based on outstanding principal amounts, applicable fixed interest ratesor currently effective interest rates as of May 31, 2016 (if variable), timing of scheduled payments and the term of the debt obligations.
90
PART II
(2) The amounts listed for endorsement contracts represent approximate amounts of base compensation and minimum guaranteed royalty fees we are obligated to pay athlete, sport teamand league endorsers of our products. Actual payments under some contracts may be higher than the amounts listed as these contracts provide for bonuses to be paid to the endorsersbased upon athletic achievements and/or royalties on product sales in future periods. Actual payments under some contracts may also be lower as these contracts include provisions forreduced payments if athletic performance declines in future periods.In addition to the cash payments, we are obligated to furnish our endorsers with NIKE product for their use. It is not possible to determine how much we will spend on this product on anannual basis as the contracts generally do not stipulate a specific amount of cash to be spent on the product. The amount of product provided to the endorsers will depend on manyfactors, including general playing conditions, the number of sporting events in which they participate and our own decisions regarding product and marketing initiatives. In addition, thecosts to design, develop, source and purchase the products furnished to the endorsers are incurred over a period of time and are not necessarily tracked separately from similar costsincurred for products sold to customers.
(3) We generally order product at least four to five months in advance of sale based primarily on futures orders received from external wholesale customers and internal orders from our DTCin-line stores and e-commerce operations. The amounts listed for product purchase obligations represent agreements (including open purchase orders) to purchase products in theordinary course of business that are enforceable and legally binding and that specify all significant terms. In some cases, prices are subject to change throughout the production process.
(4) Other purchase obligations primarily include service and marketing commitments, including marketing commitments associated with endorsement contracts, made in the ordinary courseof business. The amounts represent the minimum payments required by legally binding contracts and agreements that specify all significant terms, including open purchase orders for non-product purchases.
In addition to the above, we have long-term obligations for uncertain tax positions and various post-retirement benefits for which we are not able to reasonablyestimate when cash payments will occur. Refer to Note 9 — Income Taxes and Note 13 — Benefit Plans in the accompanying Notes to the ConsolidatedFinancial Statements for further information related to uncertain tax positions and post-retirement benefits, respectively.
We also have the following outstanding short-term debt obligations as of May 31, 2016. Refer to Note 7 — Short-Term Borrowings and Credit Lines in theaccompanying Notes to the Consolidated Financial Statements for further description and interest rates related to the short-term debt obligations listed below.
(In millions)Outstanding asof May 31, 2016
Notes payable, due at mutually agreed-upon dates within one year of issuance or on demand $ 1Payable to Sojitz America for the purchase of inventories, generally due 60 days after shipment of goods from a foreign port 39
As of May 31, 2016, the Company had letters of credit outstanding totaling $157 million. These letters of credit were issued primarily for the purchase of inventoryand as guarantees of the Company’s performance under certain self-insurance and other programs.
New Accounting PronouncementsRefer to Note 1 — Summary of Significant Accounting Policies in the accompanying Notes to the Consolidated Financial Statements for recently adopted andrecently issued accounting standards.
Critical Accounting PoliciesOur previous discussion and analysis of our financial condition and results ofoperations are based upon our consolidated financial statements, which havebeen prepared in accordance with accounting principles generally acceptedin the United States of America. The preparation of these financial statementsrequires us to make estimates and judgments that affect the reportedamounts of assets, liabilities, revenues and expenses and related disclosureof contingent assets and liabilities.
We believe that the estimates, assumptions and judgments involved in theaccounting policies described below have the greatest potential impact onour financial statements, so we consider these to be our critical accountingpolicies. Because of the uncertainty inherent in these matters, actual resultscould differ from the estimates we use in applying the critical accountingpolicies. Certain of these critical accounting policies affect working capitalaccount balances, including the policies for revenue recognition, theallowance for uncollectible accounts receivable, inventory reserves andcontingent payments under endorsement contracts. These policies requirethat we make estimates in the preparation of our financial statements as of agiven date. However, since our business cycle is relatively short, actual resultsrelated to these estimates are generally known within the six-month periodfollowing the financial statement date. Thus, these policies generally affectonly the timing of reported amounts across two to three fiscal quarters.
Within the context of these critical accounting policies, we are not currentlyaware of any reasonably likely events or circumstances that would result inmaterially different amounts being reported.
Revenue RecognitionWe record wholesale revenues when title passes and the risks and rewards ofownership have passed to the customer, based on the terms of sale. Titlepasses generally upon shipment or upon receipt by the customer dependingon the country of the sale and the agreement with the customer. Retail storerevenues are recorded at the time of sale and online store revenues arerecorded upon delivery to the customer.
In some instances, we ship product directly from our supplier to the customerand recognize revenue when the product is delivered to and accepted by thecustomer. Our revenues may fluctuate in cases when our customers delayaccepting shipment of product for periods of up to several weeks.
In certain countries outside of the United States, precise information regardingthe date of receipt by the customer is not readily available. In these cases, weestimate the date of receipt by the customer based upon historical deliverytimes by geographic location. On the basis of our tests of actual transactions,we have no indication that these estimates have been materially inaccuratehistorically.
As part of our revenue recognition policy, we record estimated sales returns,discounts and miscellaneous claims from customers as reductions torevenues at the time revenues are recorded. Our post invoice sales discountsconsist of contractual programs with certain customers or discretionarydiscounts that are expected to be granted to certain customers at a later date.We base our estimates on (1) historical rates of product returns, discountsand claims, (2) specific identification of outstanding claims and outstandingreturns not yet received from customers and (3) estimated returns, discountsand claims expected but not yet finalized with our customers. Actual returns,discounts and claims in any future period are inherently uncertain and thusmay differ from our estimates. If actual or expected future returns, discountsand claims are significantly greater or lower than established reserves, werecord a reduction or increase to net revenues in the period in which we makesuch determination.
Allowance for Uncollectible AccountsReceivableWe make ongoing estimates relating to the ability to collect our accountsreceivable and maintain an allowance for estimated losses resulting from theinability of our customers to make required payments. In determining theamount of the allowance, we consider our historical level of credit losses andmake judgments about the creditworthiness of significant customers based
NIKE, INC. 2016 Annual Report and Notice of Annual Meeting 91
FOR
M10
-K
PART II
on ongoing credit evaluations. Since we cannot predict future changes in thefinancial stability of our customers, actual future losses from uncollectibleaccounts may differ from our estimates. If the financial condition of ourcustomers were to deteriorate, resulting in their inability to make payments, alarger allowance might be required. In the event we determine that a smalleror larger allowance is appropriate, we would record a credit or a charge toOperating overhead expense in the period in which such a determination ismade.
Inventory ReservesWe also make ongoing estimates relating to the net realizable value ofinventories based upon our assumptions about future demand and marketconditions. If we estimate that the net realizable value of our inventory is lessthan the cost of the inventory recorded on our books, we record a reserveequal to the difference between the cost of the inventory and the estimatednet realizable value. This reserve is recorded as a charge to Cost of sales. Ifchanges in market conditions result in reductions in the estimated netrealizable value of our inventory below our previous estimate, we wouldincrease our reserve in the period in which we made such a determination andrecord a charge to Cost of sales.
Contingent Payments under EndorsementContractsA significant portion of our Demand creation expense relates to paymentsunder endorsement contracts. In general, endorsement payments areexpensed uniformly over the term of the contract. However, certain contractelements may be accounted for differently, based upon the facts andcircumstances of each individual contract.
Certain contracts provide for contingent payments to endorsers based uponspecific achievements in their sports (e.g., winning a championship). Werecord demand creation expense for these amounts when the endorserachieves the specific goal.
Certain contracts provide for variable payments based upon endorsersmaintaining a level of performance in their sport over an extended period oftime (e.g., maintaining a specified ranking in a sport for a year). When wedetermine payments are probable, the amounts are recorded in Demandcreation expense ratably over the contract period based on our best estimateof the endorser’s performance. In these instances, to the extent that actualpayments to the endorser differ from our estimate due to changes in theendorser’s performance, increased or decreased Demand creation expensemay be recorded in a future period.
Certain contracts provide for royalty payments to endorsers based upon apredetermined percent of sales of particular products. We expense thesepayments in Cost of sales as the related sales occur. In certain contracts, weoffer minimum guaranteed royalty payments. For contracts for which weestimate we will not meet the minimum guaranteed amount of royalty feesthrough sales of product, we record the amount of the guaranteed payment inexcess of that earned through sales of product in Demand creation expenseuniformly over the contract term.
Property, Plant and Equipment and Definite-Lived AssetsProperty, plant and equipment, including buildings, equipment and computerhardware and software are recorded at cost (including, in some cases, thecost of internal labor) and are depreciated over the estimated useful life.Changes in circumstances (such as technological advances or changes toour business operations) can result in differences between the actual andestimated useful lives. In those cases where we determine that the useful lifeof a long-lived asset should be shortened, we increase depreciation expenseover the remaining useful life to depreciate the asset’s net book value to itssalvage value.
We review the carrying value of long-lived assets or asset groups to be usedin operations whenever events or changes in circumstances indicate that thecarrying amount of the assets might not be recoverable. Factors that wouldnecessitate an impairment assessment include a significant adverse changein the extent or manner in which an asset is used, a significant adversechange in legal factors or the business climate that could affect the value ofthe asset or a significant decline in the observable market value of an asset,among others. If such facts indicate a potential impairment, we would assessthe recoverability of an asset group by determining if the carrying value of theasset group exceeds the sum of the projected undiscounted cash flowsexpected to result from the use and eventual disposition of the assets over theremaining economic life of the primary asset in the asset group. If therecoverability test indicates that the carrying value of the asset group is notrecoverable, we will estimate the fair value of the asset group usingappropriate valuation methodologies that would typically include an estimateof discounted cash flows. Any impairment would be measured as thedifference between the asset group’s carrying amount and its estimated fairvalue.
Goodwill and Indefinite-Lived Intangible AssetsWe perform annual impairment tests on goodwill and intangible assets withindefinite lives in the fourth quarter of each fiscal year or when events occur orcircumstances change that would, more likely than not, reduce the fair valueof a reporting unit or an intangible asset with an indefinite life below its carryingvalue. Events or changes in circumstances that may trigger interimimpairment reviews include significant changes in business climate, operatingresults, planned investments in the reporting unit, planned divestitures or anexpectation that the carrying amount may not be recoverable, among otherfactors. We may first assess qualitative factors to determine whether it is morelikely than not that the fair value of a reporting unit is less than its carryingamount. If, after assessing the totality of events and circumstances, wedetermine that it is more likely than not that the fair value of the reporting unit isgreater than its carrying amount, the two-step impairment test isunnecessary. The two-step impairment test requires us to estimate the fairvalue of our reporting units. If the carrying value of a reporting unit exceeds itsfair value, the goodwill of that reporting unit is potentially impaired and weproceed to step two of the impairment analysis. In step two of the analysis, wemeasure and record an impairment loss equal to the excess of the carryingvalue of the reporting unit’s goodwill over its implied fair value, if any.
We generally base our measurement of the fair value of a reporting unit on ablended analysis of the present value of future discounted cash flows and themarket valuation approach. The discounted cash flows model indicates thefair value of the reporting unit based on the present value of the cash flowsthat we expect the reporting unit to generate in the future. Our significantestimates in the discounted cash flows model include: our weighted averagecost of capital; long-term rate of growth and profitability of the reporting unit’sbusiness; and working capital effects. The market valuation approachindicates the fair value of the business based on a comparison of the reportingunit to comparable publicly traded companies in similar lines of business.Significant estimates in the market valuation approach model includeidentifying similar companies with comparable business factors such as size,growth, profitability, risk and return on investment, and assessing comparablerevenue and operating income multiples in estimating the fair value of thereporting unit.
Indefinite-lived intangible assets primarily consist of acquired trade names andtrademarks. We may first perform a qualitative assessment to determinewhether it is more likely than not that an indefinite-lived intangible asset isimpaired. If, after assessing the totality of events and circumstances, wedetermine that it is more likely than not that the indefinite-lived intangible assetis not impaired, no quantitative fair value measurement is necessary. If aquantitative fair value measurement calculation is required for these intangibleassets, we utilize the relief-from-royalty method. This method assumes thattrade names and trademarks have value to the extent that their owner isrelieved of the obligation to pay royalties for the benefits received from them.This method requires us to estimate the future revenue for the related brands,the appropriate royalty rate and the weighted average cost of capital.
92
PART II
Fair Value MeasurementsFor financial assets and liabilities measured at fair value on a recurring basis,fair value is the price we would receive to sell an asset or pay to transfer aliability in an orderly transaction with a market participant at the measurementdate. In general, and where applicable, we use quoted prices in activemarkets for identical assets or liabilities to determine the fair values of ourfinancial instruments. This pricing methodology applies to our Level 1investments, including U.S. Treasury securities.
In the absence of active markets for identical assets or liabilities, suchmeasurements involve developing assumptions based on market observabledata, including quoted prices for similar assets or liabilities in active marketsand quoted prices for identical or similar assets or liabilities in markets that arenot active. This pricing methodology applies to our Level 2 investments suchas time deposits, commercial paper and bonds, U.S. Agency securities andmoney market funds.
Level 3 investments are valued using internally developed models withunobservable inputs. Assets and liabilities measured using unobservableinputs are an immaterial portion of our portfolio.
A majority of our available-for-sale securities are priced by pricing vendors andare generally Level 1 or Level 2 investments as these vendors either provide aquoted market price in an active market or use observable inputs withoutapplying significant adjustments in their pricing. Observable inputs includebroker quotes, interest rates and yield curves observable at commonlyquoted intervals, volatilities and credit risks. Our fair value processes includecontrols that are designed to ensure appropriate fair values arerecorded. These controls include a comparison to another independentpricing vendor.
Hedge Accounting for DerivativesWe use derivative contracts to hedge certain anticipated foreign currency andinterest rate transactions as well as certain non-functional currency monetaryassets and liabilities. When the specific criteria to qualify for hedge accountinghas been met, changes in the fair value of contracts hedging probableforecasted future cash flows are recorded in Other comprehensive income,rather than Net income, until the underlying hedged transaction affects Netincome. In most cases, this results in gains and losses on hedge derivativesbeing released from Other comprehensive income into Net income sometimeafter the maturity of the derivative. One of the criteria for this accountingtreatment is that the notional value of these derivative contracts should not bein excess of specifically identified anticipated transactions. By their verynature, our estimates of anticipated transactions may fluctuate over time andmay ultimately vary from actual transactions. When anticipated transactionestimates or actual transaction amounts decline below hedged levels, or if it isno longer probable that a forecasted transaction will occur by the end of theoriginally specified time period or within an additional two-month period oftime thereafter, we are required to reclassify the cumulative change in fairvalue of the over-hedged portion of the related hedge contract from Othercomprehensive income to Other (income) expense, net during the quarter inwhich the decrease occurs.
We have used in the past, and may use in the future, forward contracts oroptions to hedge our investment in the net assets of certain internationalsubsidiaries to offset foreign currency translation related to our net investmentin those subsidiaries. The change in fair value of the forward contracts oroptions hedging our net investments is reported in the cumulative translationadjustment component of Accumulated other comprehensive income withinTotal shareholders’ equity, to the extent effective, to offset the foreigncurrency translation adjustments on those investments. As the value of ourunderlying net investments in wholly-owned international subsidiaries isknown at the time a hedge is placed, the designated hedge is matched to theportion of our net investment at risk. Accordingly, the variability involved in netinvestment hedges is substantially less than that of other types of hedgetransactions and we do not expect any material ineffectiveness. We consider,on a quarterly basis, the need to redesignate existing hedge relationshipsbased on changes in the underlying net investment. Should the level of our netinvestment decrease below hedged levels, the cumulative change in fair value
of the over-hedged portion of the related hedge contract would be reportedas Other (income) expense, net during the period in which changes occur.
Stock-based CompensationWe account for stock-based compensation by estimating the fair value ofstock-based compensation on the date of grant using the Black-Scholesoption pricing model. The Black-Scholes option pricing model requires theinput of highly subjective assumptions including volatility. Expected volatility isestimated based on implied volatility in market traded options on our commonstock with a term greater than one year, along with other factors. Our decisionto use implied volatility was based on the availability of actively traded optionson our common stock and our assessment that implied volatility is morerepresentative of future stock price trends than historical volatility. If factorschange and we use different assumptions for estimating stock-basedcompensation expense in future periods, stock-based compensationexpense may differ materially in the future from that recorded in the currentperiod.
Income TaxesWe record valuation allowances against our deferred tax assets, whennecessary. Realization of deferred tax assets (such as net operating losscarry-forwards) is dependent on future taxable earnings and is thereforeuncertain. At least quarterly, we assess the likelihood that our deferred taxasset balance will be recovered from future taxable income. To the extent webelieve that recovery is not likely, we establish a valuation allowance againstour net deferred tax asset, which increases our Income tax expense in theperiod when such determination is made.
In addition, we have not recorded U.S. income tax expense for foreignearnings that we have determined to be indefinitely reinvested outside theUnited States, thus reducing our overall Income tax expense. The amount ofearnings designated as indefinitely reinvested offshore is based upon theactual deployment of such earnings in our offshore assets and ourexpectations of the future cash needs of our U.S. and foreign entities. Incometax considerations are also a factor in determining the amount of foreignearnings to be indefinitely reinvested offshore.
We carefully review all factors that drive the ultimate disposition of foreignearnings determined to be reinvested offshore and apply stringent standardsto overcome the presumption of repatriation. Despite this approach, becausethe determination involves our future plans and expectations of future events,the possibility exists that amounts declared as indefinitely reinvested offshoremay ultimately be repatriated. For instance, the actual cash needs of our U.S.entities may exceed our current expectations, or the actual cash needs of ourforeign entities may be less than our current expectations. This would result inadditional Income tax expense in the year we determined that amounts wereno longer indefinitely reinvested offshore. Conversely, our approach may alsoresult in a determination that accumulated foreign earnings (for which U.S.income taxes have been provided) will be indefinitely reinvested offshore. Inthis case, our Income tax expense would be reduced in the year of suchdetermination.
On an interim basis, we estimate what our effective tax rate will be for the fullfiscal year. This estimated annual effective tax rate is then applied to the year-to-date Income before income taxes excluding infrequently occurring orunusual items, to determine the year-to-date Income tax expense. Theincome tax effects of infrequent or unusual items are recognized in the interimperiod in which they occur. As the fiscal year progresses, we continually refineour estimate based upon actual events and earnings by jurisdiction during theyear. This continual estimation process periodically results in a change to ourexpected effective tax rate for the fiscal year. When this occurs, we adjust theincome tax provision during the quarter in which the change in estimateoccurs.
On a quarterly basis, we evaluate the probability that a tax position will beeffectively sustained and the appropriateness of the amount recognized foruncertain tax positions based on factors including changes in facts orcircumstances, changes in tax law, settled audit issues and new audit activity.
NIKE, INC. 2016 Annual Report and Notice of Annual Meeting 93
FOR
M10
-K
PART II
Changes in our assessment may result in the recognition of a tax benefit or anadditional charge to the tax provision in the period our assessment changes.We recognize interest and penalties related to income tax matters in Incometax expense.
Other ContingenciesIn the ordinary course of business, we are involved in legal proceedingsregarding contractual and employment relationships, product liability claims,trademark rights and a variety of other matters. We record contingent liabilitiesresulting from claims against us, including related legal costs, when a loss isassessed to be probable and the amount of the loss is reasonably estimable.Assessing probability of loss and estimating probable losses requires analysis
of multiple factors, including in some cases judgments about the potentialactions of third-party claimants and courts. Recorded contingent liabilities arebased on the best information available and actual losses in any future periodare inherently uncertain. If future adjustments to estimated probable futurelosses or actual losses exceed our recorded liability for such claims, we wouldrecord additional charges during the period in which the actual loss or changein estimate occurred. In addition to contingent liabilities recorded for probablelosses, we disclose contingent liabilities when there is a reasonable possibilitythat the ultimate loss will materially exceed the recorded liability. While wecannot predict the outcome of pending legal matters with certainty, we do notbelieve any currently identified claim, proceeding or litigation, either individuallyor in aggregate, will have a material impact on our results of operations,financial position or cash flows.
94
PART II
ITEM 7A. Quantitative and Qualitative Disclosures aboutMarket Risk
In the normal course of business and consistent with established policies andprocedures, we employ a variety of financial instruments to manage exposureto fluctuations in the value of foreign currencies and interest rates. It is ourpolicy to utilize these financial instruments only where necessary to financeour business and manage such exposures; we do not enter into thesetransactions for trading or speculative purposes.
We are exposed to foreign currency fluctuations, primarily as a result of ourinternational sales, product sourcing and funding activities. Our foreignexchange risk management program is intended to lessen both the positiveand negative effects of currency fluctuations on our consolidated results ofoperations, financial position and cash flows. We use forward and optioncontracts to hedge certain anticipated but not yet firmly committedtransactions as well as certain firm commitments and the related receivablesand payables, including third-party and intercompany transactions. We have,in the past, and may in the future, also use forward or options contracts tohedge our investment in the net assets of certain international subsidiaries tooffset foreign currency translation adjustments related to our net investment inthose subsidiaries. Where exposures are hedged, our program has the effectof delaying the impact of exchange rate movements on our ConsolidatedFinancial Statements.
The timing for hedging exposures, as well as the type and duration of thehedge instruments employed, are guided by our hedging policies anddetermined based upon the nature of the exposure and prevailing marketconditions. Typically, the Company may enter into hedge contracts startingup to 12 to 24 months in advance of the forecasted transaction and mayplace incremental hedges up to 100% of the exposure by the time theforecasted transaction occurs. The majority of derivatives outstanding as ofMay 31, 2016 are designated as foreign currency cash flow hedges, primarilyfor Euro/U.S. Dollar, British Pound/Euro and Japanese Yen/U.S. Dollarcurrency pairs. See section “Foreign Currency Exposures and HedgingPractices” under Item 7 for additional detail.
Our earnings are also exposed to movements in short- and long-term marketinterest rates. Our objective in managing this interest rate exposure is to limitthe impact of interest rate changes on earnings and cash flows and to reduceoverall borrowing costs. To achieve these objectives, we maintain a mix ofcommercial paper, bank loans, fixed-rate debt of varying maturities and haveentered into receive-fixed, pay-variable interest rate swaps for a portion of ourfixed-rate debt, as well as pay-fixed, receive-variable forward-starting interestrate swaps for cash outflows of interest payments on future debt.
Market Risk Measurement
We monitor foreign exchange risk, interest rate risk and related derivativesusing a variety of techniques including a review of market value, sensitivityanalysis and Value-at-Risk (“VaR”). Our market-sensitive derivative and otherfinancial instruments are foreign currency forward contracts, foreign currencyoption contracts, interest rate swaps, intercompany loans denominated innon-functional currencies, fixed interest rate U.S. Dollar denominated debtand fixed interest rate Japanese Yen denominated debt.
We use VaR to monitor the foreign exchange risk of our foreign currencyforward and foreign currency option derivative instruments only. The VaRdetermines the maximum potential one-day loss in the fair value of theseforeign exchange rate-sensitive financial instruments. The VaR modelestimates assume normal market conditions and a 95% confidence level.There are various modeling techniques that can be used in the VaRcomputation. Our computations are based on interrelationships betweencurrencies and interest rates (a “variance/co-variance” technique). Theseinterrelationships are a function of foreign exchange currency market changesand interest rate changes over the preceding one year period. The value offoreign currency options does not change on a one-to-one basis withchanges in the underlying currency rate. We adjust the potential loss in optionvalue for the estimated sensitivity (the “delta” and “gamma”) to changes in theunderlying currency rate. This calculation reflects the impact of foreigncurrency rate fluctuations on the derivative instruments only and does notinclude the impact of such rate fluctuations on non-functional currencytransactions (such as anticipated transactions, firm commitments, cashbalances and accounts and loans receivable and payable), including thosewhich are hedged by these instruments.
The VaR model is a risk analysis tool and does not purport to represent actuallosses in fair value that we will incur nor does it consider the potential effect offavorable changes in market rates. It also does not represent the full extent ofthe possible loss that may occur. Actual future gains and losses will differ fromthose estimated because of changes or differences in market rates andinterrelationships, hedging instruments and hedge percentages, timing andother factors.
The estimated maximum one-day loss in fair value on our foreign currencysensitive derivative financial instruments, derived using the VaR model, was$109 million and $117 million at May 31, 2016 and 2015, respectively. TheVaR decreased year-over-year as a result of a decrease in the total notionalvalue of our foreign currency derivative portfolio at May 31, 2016. Such ahypothetical loss in the fair value of our derivatives would be offset byincreases in the value of the underlying transactions being hedged. Theaverage monthly change in the fair values of foreign currency forward andforeign currency option derivative instruments was $209 million and $205million during fiscal 2016 and fiscal 2015, respectively.
The instruments not included in the VaR are intercompany loansdenominated in non-functional currencies, fixed interest rate Japanese Yendenominated debt, fixed interest rate U.S. Dollar denominated debt andinterest rate swaps. Intercompany loans and related interest amounts areeliminated in consolidation. Furthermore, our non-functional currencyintercompany loans are substantially hedged against foreign exchange riskthrough the use of forward contracts, which are included in the VaRcalculation above. Therefore, we consider the interest rate and foreigncurrency market risks associated with our non-functional currencyintercompany loans to be immaterial to our consolidated financial position,results from operations and cash flows.
During the year ended May 31, 2016, we entered into a series of forward-starting interest rate swap agreements. A forward-starting interest rate swapis an agreement that effectively hedges the variability in future benchmarkinterest payments attributable to changes in interest rates on the forecastedissuance of fixed-rate debt. We entered into these forward-starting interestrate swaps in order to lock in fixed interest rates on our forecasted issuance ofdebt. These instruments were designated as cash flow hedges of thevariability in the expected cash outflows of interest payments on future debtdue to changes in benchmark interest rates.
Details of third-party debt and interest rate swaps are provided in the tablebelow. The table presents principal cash flows and related weighted averageinterest rates by expected maturity dates.
NIKE, INC. 2016 Annual Report and Notice of Annual Meeting 95
FOR
M10
-K
PART II
Expected Maturity DateYear Ending May 31,
(Dollars in millions) 2017 2018 2019 2020 2021 Thereafter Total Fair ValueForeign Exchange RiskJapanese Yen Functional CurrencyLong-term Japanese Yen debt — Fixed ratePrincipal payments $ 6 $ 6 $ 6 $ 6 $ 3 $ — $ 27 $ 28Average interest rate 2.4% 2.4% 2.4% 2.4% 2.4% 0.0% 2.4%
Interest Rate RiskJapanese Yen Functional CurrencyLong-term Japanese Yen debt — Fixed ratePrincipal payments $ 6 $ 6 $ 6 $ 6 $ 3 $ — $ 27 $ 28Average interest rate 2.4% 2.4% 2.4% 2.4% 2.4% 0.0% 2.4%
U.S. Dollar Functional CurrencyLong-term U.S. Dollar debt — Fixed ratePrincipal payments $ 38 $ — $ — $ — $ — $ 2,000 $2,038 $ 2,097Average interest rate 6.2% 0.0% 0.0% 0.0% 0.0% 3.4% 3.5%
Anticipated long-term U.S. Dollar debtissuance — Floating rate swapped to fixed rateNotional(1) $ 1,500 $ — $ — $ — $ — $ — $1,500 $ 38Weighted-average fixed rate 2.2% 0.0% 0.0% 0.0% 0.0% 0.0% 2.2%Weighted-average floating rate 0.7% 0.0% 0.0% 0.0% 0.0% 0.0% 0.7%
(1) Forward-starting interest rate swaps have been included in the maturities category based on when the related forecasted debt issuance and corresponding swap terminations areexpected to occur.
The fixed interest rate Japanese Yen denominated debt instruments were issued by and are accounted for by one of our Japanese subsidiaries. Accordingly, themonthly translation of these instruments, which varies due to changes in foreign exchange rates, is recognized in Accumulated other comprehensive incomeupon consolidation of this subsidiary.
ITEM 8. Financial Statements and Supplementary DataManagement of NIKE, Inc. is responsible for the information andrepresentations contained in this report. The financial statements have beenprepared in conformity with accounting principles generally accepted in theUnited States of America (“U.S. GAAP”) and include certain amounts basedon our best estimates and judgments. Other financial information in this reportis consistent with these financial statements.
Our accounting systems include controls designed to reasonably assureassets are safeguarded from unauthorized use or disposition and provide forthe preparation of financial statements in conformity with U.S. GAAP. Thesesystems are supplemented by the selection and training of qualified financialpersonnel and an organizational structure providing for appropriatesegregation of duties.
An internal Corporate Audit department reviews the results of its work with theAudit Committee of the Board of Directors, presently consisting of fouroutside directors. The Audit Committee is responsible for the appointment ofthe independent registered public accounting firm and reviews, with theindependent registered public accounting firm, management and the internalaudit staff, the scope and the results of the annual audit, the effectiveness ofthe accounting control system and other matters relating to the financialaffairs of NIKE as the Audit Committee deems appropriate. The independentregistered public accounting firm and the internal auditors have full access tothe Audit Committee, with and without the presence of management, todiscuss any appropriate matters.
96
PART II
Management’s Annual Report on Internal Control Over Financial Reporting
Management is responsible for establishing and maintaining adequate internalcontrol over financial reporting, as such term is defined in Rule 13(a)—15(f)and Rule 15(d)-15(f) of the Securities Exchange Act of 1934, as amended.Internal control over financial reporting is a process designed to providereasonable assurance regarding the reliability of financial reporting and thepreparation of the financial statements for external purposes in accordancewith generally accepted accounting principles in the United States of America.Internal control over financial reporting includes those policies and proceduresthat: (i) pertain to the maintenance of records that, in reasonable detail,accurately and fairly reflect the transactions and dispositions of assets of theCompany; (ii) provide reasonable assurance that transactions are recorded asnecessary to permit preparation of financial statements in accordance withgenerally accepted accounting principles, and that receipts and expendituresof the Company are being made only in accordance with authorizations of ourmanagement and directors; and (iii) provide reasonable assurance regardingprevention or timely detection of unauthorized acquisition, use or dispositionof assets of the Company that could have a material effect on the financialstatements.
While “reasonable assurance” is a high level of assurance, it does not meanabsolute assurance. Because of its inherent limitations, internal control overfinancial reporting may not prevent or detect every misstatement and instance
of fraud. Controls are susceptible to manipulation, especially in instances offraud caused by the collusion of two or more people, including our seniormanagement. Also, projections of any evaluation of effectiveness to futureperiods are subject to the risk that controls may become inadequate becauseof changes in conditions, or that the degree of compliance with the policies orprocedures may deteriorate.
Under the supervision and with the participation of our Chief Executive Officerand Chief Financial Officer, our management conducted an evaluation of theeffectiveness of our internal control over financial reporting based upon theframework in Internal Control — Integrated Framework (2013) issued by theCommittee of Sponsoring Organizations of the Treadway Commission(COSO). Based on the results of our evaluation, our management concludedthat our internal control over financial reporting was effective as of May 31,2016.
PricewaterhouseCoopers LLP, an independent registered public accountingfirm, has audited (1) the Consolidated Financial Statements and (2) theeffectiveness of our internal control over financial reporting as of May 31,2016, as stated in their report herein.
Mark G. Parker Andrew Campion
Chairman, President and Chief Executive Officer Chief Financial Officer
NIKE, INC. 2016 Annual Report and Notice of Annual Meeting 97
FOR
M10
-K
PART II
Report of Independent Registered Public Accounting Firm
To the Board of Directors and Shareholders of NIKE, Inc.:
In our opinion, the consolidated financial statements listed in the indexappearing under Item 15(a)(1) present fairly, in all material respects, thefinancial position of NIKE, Inc. and its subsidiaries at May 31, 2016 and 2015,and the results of their operations and their cash flows for each of the threeyears in the period ended May 31, 2016 in conformity with accountingprinciples generally accepted in the United States of America. In addition, inour opinion, the financial statement schedule listed in the index appearingunder Item 15(a)(2) presents fairly, in all material respects, the information setforth therein when read in conjunction with the related consolidated financialstatements. Also in our opinion, the Company maintained, in all materialrespects, effective internal control over financial reporting as of May 31, 2016,based on criteria established in Internal Control — Integrated Framework(2013) issued by the Committee of Sponsoring Organizations of theTreadway Commission (COSO). The Company’s management is responsiblefor these financial statements and financial statement schedule, formaintaining effective internal control over financial reporting and for itsassessment of the effectiveness of internal control over financial reporting,included in Management’s Annual Report on Internal Control over FinancialReporting appearing under Item 8. Our responsibility is to express opinions onthese financial statements, on the financial statement schedule and on theCompany’s internal control over financial reporting based on our integratedaudits. We conducted our audits in accordance with the standards of thePublic Company Accounting Oversight Board (United States). Thosestandards require that we plan and perform the audits to obtain reasonableassurance about whether the financial statements are free of materialmisstatement and whether effective internal control over financial reportingwas maintained in all material respects. Our audits of the financial statementsincluded examining, on a test basis, evidence supporting the amounts anddisclosures in the financial statements, assessing the accounting principlesused and significant estimates made by management and evaluating theoverall financial statement presentation. Our audit of internal control over
financial reporting included obtaining an understanding of internal control overfinancial reporting, assessing the risk that a material weakness exists andtesting and evaluating the design and operating effectiveness of internalcontrol based on the assessed risk. Our audits also included performing suchother procedures as we considered necessary in the circumstances. Webelieve that our audits provide a reasonable basis for our opinions.
A company’s internal control over financial reporting is a process designed toprovide reasonable assurance regarding the reliability of financial reportingand the preparation of financial statements for external purposes inaccordance with generally accepted accounting principles. A company’sinternal control over financial reporting includes those policies and proceduresthat (i) pertain to the maintenance of records that, in reasonable detail,accurately and fairly reflect the transactions and dispositions of the assets ofthe company; (ii) provide reasonable assurance that transactions arerecorded as necessary to permit preparation of financial statements inaccordance with generally accepted accounting principles, and that receiptsand expenditures of the company are being made only in accordance withauthorizations of management and directors of the company; and (iii) providereasonable assurance regarding prevention or timely detection ofunauthorized acquisition, use, or disposition of the company’s assets thatcould have a material effect on the financial statements.
Because of its inherent limitations, internal control over financial reporting maynot prevent or detect misstatements. Also, projections of any evaluation ofeffectiveness to future periods are subject to the risk that controls maybecome inadequate because of changes in conditions, or that the degree ofcompliance with the policies or procedures may deteriorate.
/S/ PRICEWATERHOUSECOOPERS LLP
Portland, OregonJuly 21, 2016
98
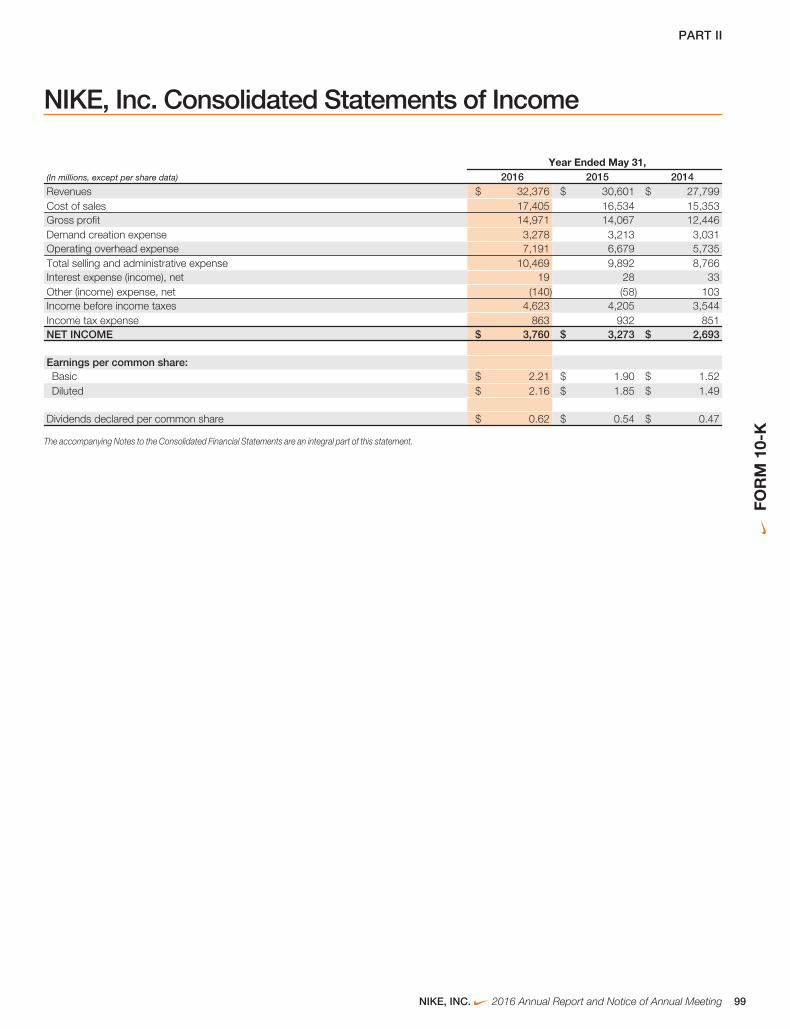
PART II
NIKE, Inc. Consolidated Statements of Income
Year Ended May 31,(In millions, except per share data) 2016 2015 2014Revenues $ 32,376 $ 30,601 $ 27,799Cost of sales 17,405 16,534 15,353Gross profit 14,971 14,067 12,446Demand creation expense 3,278 3,213 3,031Operating overhead expense 7,191 6,679 5,735Total selling and administrative expense 10,469 9,892 8,766Interest expense (income), net 19 28 33Other (income) expense, net (140) (58) 103Income before income taxes 4,623 4,205 3,544Income tax expense 863 932 851NET INCOME $ 3,760 $ 3,273 $ 2,693
Earnings per common share:Basic $ 2.21 $ 1.90 $ 1.52Diluted $ 2.16 $ 1.85 $ 1.49
Dividends declared per common share $ 0.62 $ 0.54 $ 0.47
The accompanying Notes to the Consolidated Financial Statements are an integral part of this statement.
NIKE, INC. 2016 Annual Report and Notice of Annual Meeting 99
FOR
M10
-K
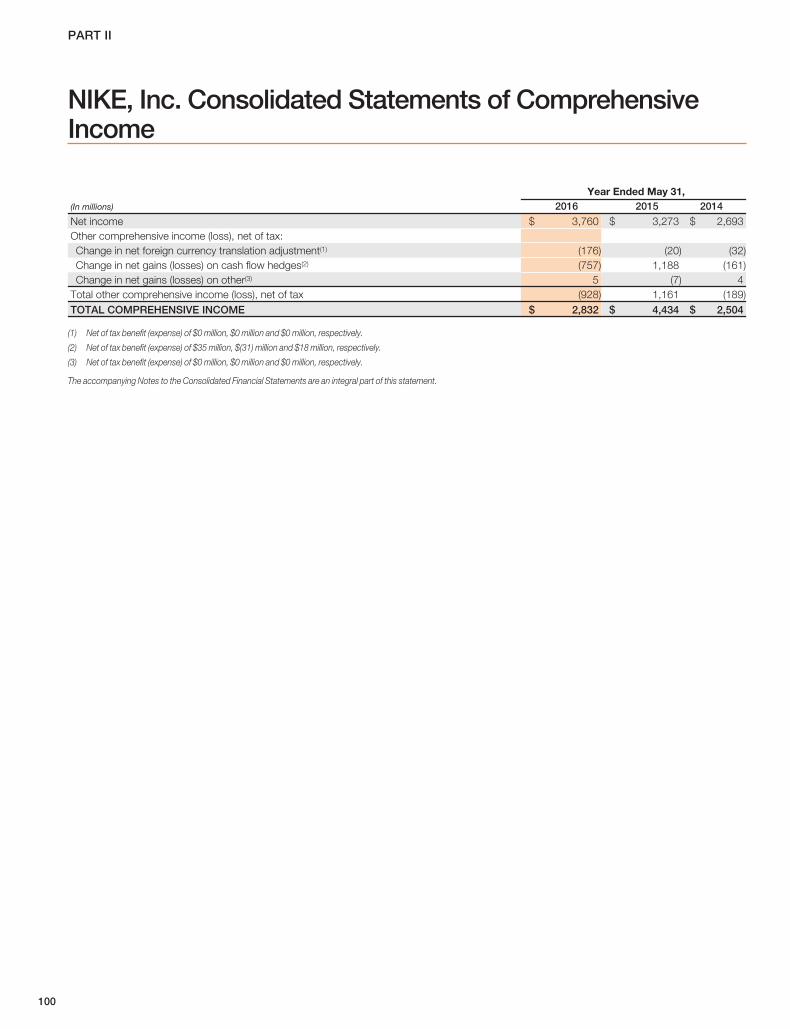
PART II
NIKE, Inc. Consolidated Statements of ComprehensiveIncome
Year Ended May 31,(In millions) 2016 2015 2014
Net income $ 3,760 $ 3,273 $ 2,693Other comprehensive income (loss), net of tax:Change in net foreign currency translation adjustment(1) (176) (20) (32)Change in net gains (losses) on cash flow hedges(2) (757) 1,188 (161)Change in net gains (losses) on other(3) 5 (7) 4
Total other comprehensive income (loss), net of tax (928) 1,161 (189)TOTAL COMPREHENSIVE INCOME $ 2,832 $ 4,434 $ 2,504
(1) Net of tax benefit (expense) of $0 million, $0 million and $0 million, respectively.
(2) Net of tax benefit (expense) of $35 million, $(31) million and $18 million, respectively.
(3) Net of tax benefit (expense) of $0 million, $0 million and $0 million, respectively.
The accompanying Notes to the Consolidated Financial Statements are an integral part of this statement.
100
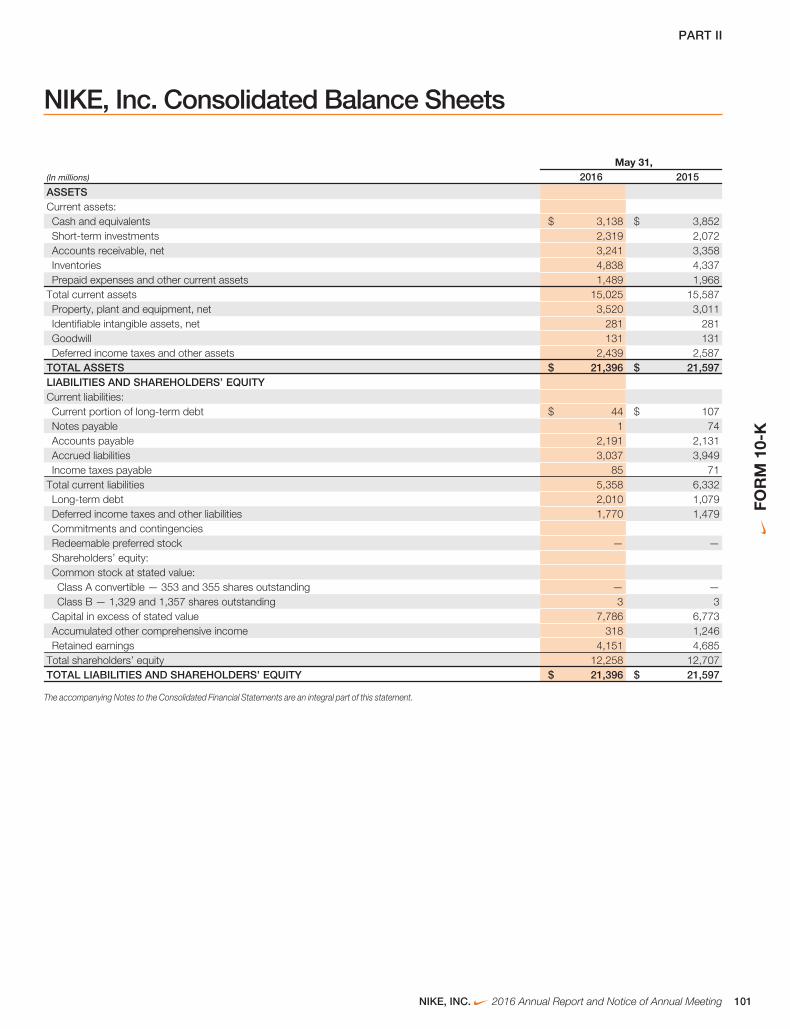
PART II
NIKE, Inc. Consolidated Balance Sheets
May 31,(In millions) 2016 2015
ASSETSCurrent assets:Cash and equivalents $ 3,138 $ 3,852Short-term investments 2,319 2,072Accounts receivable, net 3,241 3,358Inventories 4,838 4,337Prepaid expenses and other current assets 1,489 1,968
Total current assets 15,025 15,587Property, plant and equipment, net 3,520 3,011Identifiable intangible assets, net 281 281Goodwill 131 131Deferred income taxes and other assets 2,439 2,587
TOTAL ASSETS $ 21,396 $ 21,597LIABILITIES AND SHAREHOLDERS’ EQUITYCurrent liabilities:Current portion of long-term debt $ 44 $ 107Notes payable 1 74Accounts payable 2,191 2,131Accrued liabilities 3,037 3,949Income taxes payable 85 71
Total current liabilities 5,358 6,332Long-term debt 2,010 1,079Deferred income taxes and other liabilities 1,770 1,479Commitments and contingenciesRedeemable preferred stock — —Shareholders’ equity:Common stock at stated value:Class A convertible — 353 and 355 shares outstanding — —Class B — 1,329 and 1,357 shares outstanding 3 3
Capital in excess of stated value 7,786 6,773Accumulated other comprehensive income 318 1,246Retained earnings 4,151 4,685
Total shareholders’ equity 12,258 12,707TOTAL LIABILITIES AND SHAREHOLDERS’ EQUITY $ 21,396 $ 21,597
The accompanying Notes to the Consolidated Financial Statements are an integral part of this statement.
NIKE, INC. 2016 Annual Report and Notice of Annual Meeting 101
FOR
M10
-K

PART II
NIKE, Inc. Consolidated Statements of Cash Flows
Year Ended May 31,(In millions) 2016 2015 2014Cash provided by operations:Net income $ 3,760 $ 3,273 $ 2,693Income charges (credits) not affecting cash:Depreciation 649 606 518Deferred income taxes (80) (113) (11)Stock-based compensation 236 191 177Amortization and other 13 43 68Net foreign currency adjustments 98 424 56
Changes in certain working capital components and other assets and liabilities:Decrease (increase) in accounts receivable 60 (216) (298)(Increase) in inventories (590) (621) (505)(Increase) in prepaid expenses and other current assets (161) (144) (210)(Decrease) increase in accounts payable, accrued liabilities and income taxes payable (889) 1,237 525
Cash provided by operations 3,096 4,680 3,013Cash used by investing activities:Purchases of short-term investments (5,367) (4,936) (5,386)Maturities of short-term investments 2,924 3,655 3,932Sales of short-term investments 2,386 2,216 1,126Investments in reverse repurchase agreements 150 (150) —Additions to property, plant and equipment (1,143) (963) (880)Disposals of property, plant and equipment 10 3 3Decrease (increase) in other assets, net of other liabilities 6 — (2)
Cash used by investing activities (1,034) (175) (1,207)Cash used by financing activities:Net proceeds from long-term debt issuance 981 — —Long-term debt payments, including current portion (106) (7) (60)(Decrease) increase in notes payable (67) (63) 75Payments on capital lease obligations (7) (19) (17)Proceeds from exercise of stock options and other stock issuances 507 514 383Excess tax benefits from share-based payment arrangements 281 218 132Repurchase of common stock (3,238) (2,534) (2,628)Dividends — common and preferred (1,022) (899) (799)
Cash used by financing activities (2,671) (2,790) (2,914)Effect of exchange rate changes on cash and equivalents (105) (83) (9)Net (decrease) increase in cash and equivalents (714) 1,632 (1,117)Cash and equivalents, beginning of year 3,852 2,220 3,337CASH AND EQUIVALENTS, END OF YEAR $ 3,138 $ 3,852 $ 2,220Supplemental disclosure of cash flow information:Cash paid during the year for:Interest, net of capitalized interest $ 70 $ 53 $ 53Income taxes 748 1,262 856
Non-cash additions to property, plant and equipment 252 206 167Dividends declared and not paid 271 240 209
The accompanying Notes to the Consolidated Financial Statements are an integral part of this statement.
102
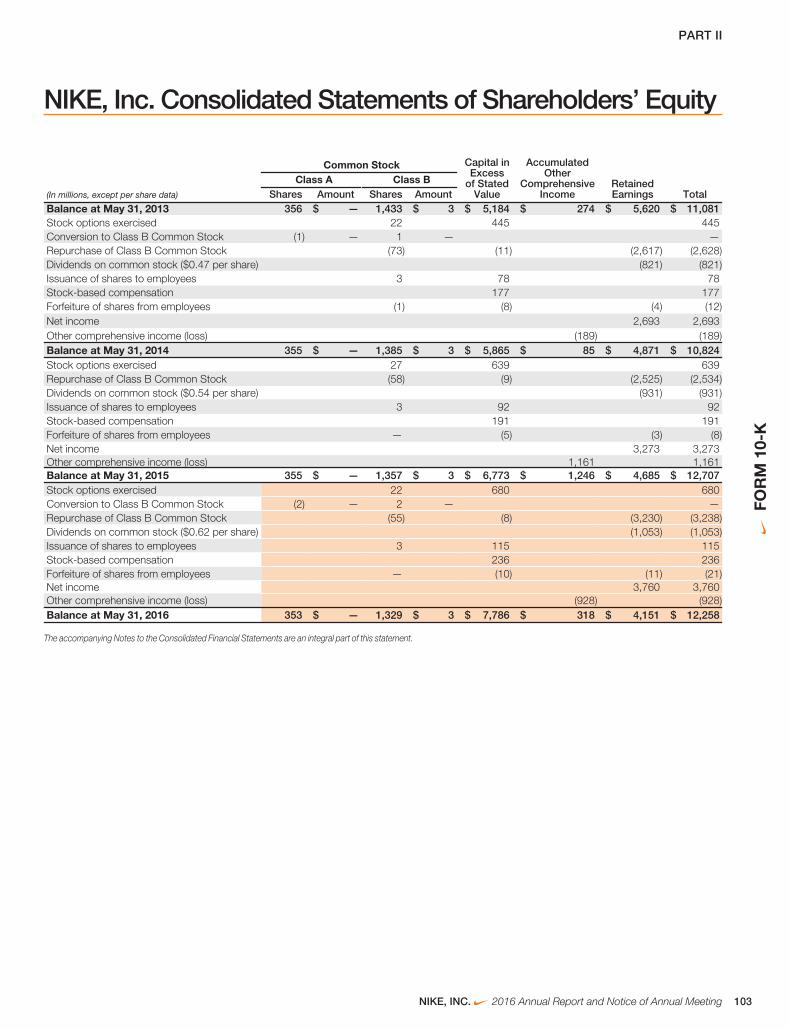
PART II
NIKE, Inc. Consolidated Statements of Shareholders’ Equity
Common Stock Capital inExcess
of StatedValue
AccumulatedOther
ComprehensiveIncome
RetainedEarnings Total
Class A Class B(In millions, except per share data) Shares Amount Shares AmountBalance at May 31, 2013 356 $ — 1,433 $ 3 $ 5,184 $ 274 $ 5,620 $ 11,081Stock options exercised 22 445 445Conversion to Class B Common Stock (1) — 1 — —Repurchase of Class B Common Stock (73) (11) (2,617) (2,628)Dividends on common stock ($0.47 per share) (821) (821)Issuance of shares to employees 3 78 78Stock-based compensation 177 177Forfeiture of shares from employees (1) (8) (4) (12)Net income 2,693 2,693Other comprehensive income (loss) (189) (189)Balance at May 31, 2014 355 $ — 1,385 $ 3 $ 5,865 $ 85 $ 4,871 $ 10,824Stock options exercised 27 639 639Repurchase of Class B Common Stock (58) (9) (2,525) (2,534)Dividends on common stock ($0.54 per share) (931) (931)Issuance of shares to employees 3 92 92Stock-based compensation 191 191Forfeiture of shares from employees — (5) (3) (8)Net income 3,273 3,273Other comprehensive income (loss) 1,161 1,161Balance at May 31, 2015 355 $ — 1,357 $ 3 $ 6,773 $ 1,246 $ 4,685 $ 12,707Stock options exercised 22 680 680Conversion to Class B Common Stock (2) — 2 — —Repurchase of Class B Common Stock (55) (8) (3,230) (3,238)Dividends on common stock ($0.62 per share) (1,053) (1,053)Issuance of shares to employees 3 115 115Stock-based compensation 236 236Forfeiture of shares from employees — (10) (11) (21)Net income 3,760 3,760Other comprehensive income (loss) (928) (928)Balance at May 31, 2016 353 $ — 1,329 $ 3 $ 7,786 $ 318 $ 4,151 $ 12,258
The accompanying Notes to the Consolidated Financial Statements are an integral part of this statement.
NIKE, INC. 2016 Annual Report and Notice of Annual Meeting 103
FOR
M10
-K
PART II
Notes to Consolidated Financial Statements
Note 1 Summary of Significant Accounting Policies . . . . . . . . . . . . . . . . . . . . . . . . . . . . . . . . . . . . . . . . . . . . . . . . . . . . . . . . . . . . . . . . . . . . . . . . . . . . . .105
Note 2 Inventories . . . . . . . . . . . . . . . . . . . . . . . . . . . . . . . . . . . . . . . . . . . . . . . . . . . . . . . . . . . . . . . . . . . . . . . . . . . . . . . . . . . . . . . . . . . . . . . . . . . . . . . . . . . . . . . . . . . . . . . . . . . .109
Note 3 Property, Plant and Equipment . . . . . . . . . . . . . . . . . . . . . . . . . . . . . . . . . . . . . . . . . . . . . . . . . . . . . . . . . . . . . . . . . . . . . . . . . . . . . . . . . . . . . . . . . . . . . . . .109
Note 4 Identifiable Intangible Assets and Goodwill . . . . . . . . . . . . . . . . . . . . . . . . . . . . . . . . . . . . . . . . . . . . . . . . . . . . . . . . . . . . . . . . . . . . . . . . . . . . . . . .109
Note 5 Accrued Liabilities . . . . . . . . . . . . . . . . . . . . . . . . . . . . . . . . . . . . . . . . . . . . . . . . . . . . . . . . . . . . . . . . . . . . . . . . . . . . . . . . . . . . . . . . . . . . . . . . . . . . . . . . . . . . . . . . . .109
Note 6 Fair Value Measurements . . . . . . . . . . . . . . . . . . . . . . . . . . . . . . . . . . . . . . . . . . . . . . . . . . . . . . . . . . . . . . . . . . . . . . . . . . . . . . . . . . . . . . . . . . . . . . . . . . . . . . . .110
Note 7 Short-Term Borrowings and Credit Lines . . . . . . . . . . . . . . . . . . . . . . . . . . . . . . . . . . . . . . . . . . . . . . . . . . . . . . . . . . . . . . . . . . . . . . . . . . . . . . . . . . .111
Note 8 Long-Term Debt . . . . . . . . . . . . . . . . . . . . . . . . . . . . . . . . . . . . . . . . . . . . . . . . . . . . . . . . . . . . . . . . . . . . . . . . . . . . . . . . . . . . . . . . . . . . . . . . . . . . . . . . . . . . . . . . . . . .112
Note 9 Income Taxes . . . . . . . . . . . . . . . . . . . . . . . . . . . . . . . . . . . . . . . . . . . . . . . . . . . . . . . . . . . . . . . . . . . . . . . . . . . . . . . . . . . . . . . . . . . . . . . . . . . . . . . . . . . . . . . . . . . . . . . .112
Note 10 Redeemable Preferred Stock . . . . . . . . . . . . . . . . . . . . . . . . . . . . . . . . . . . . . . . . . . . . . . . . . . . . . . . . . . . . . . . . . . . . . . . . . . . . . . . . . . . . . . . . . . . . . . . . . . .114
Note 11 Common Stock and Stock-Based Compensation . . . . . . . . . . . . . . . . . . . . . . . . . . . . . . . . . . . . . . . . . . . . . . . . . . . . . . . . . . . . . . . . . . . . . . .115
Note 12 Earnings Per Share . . . . . . . . . . . . . . . . . . . . . . . . . . . . . . . . . . . . . . . . . . . . . . . . . . . . . . . . . . . . . . . . . . . . . . . . . . . . . . . . . . . . . . . . . . . . . . . . . . . . . . . . . . . . . . . .116
Note 13 Benefit Plans . . . . . . . . . . . . . . . . . . . . . . . . . . . . . . . . . . . . . . . . . . . . . . . . . . . . . . . . . . . . . . . . . . . . . . . . . . . . . . . . . . . . . . . . . . . . . . . . . . . . . . . . . . . . . . . . . . . . . . . . .116
Note 14 Accumulated Other Comprehensive Income . . . . . . . . . . . . . . . . . . . . . . . . . . . . . . . . . . . . . . . . . . . . . . . . . . . . . . . . . . . . . . . . . . . . . . . . . . . . . .117
Note 15 Commitments and Contingencies . . . . . . . . . . . . . . . . . . . . . . . . . . . . . . . . . . . . . . . . . . . . . . . . . . . . . . . . . . . . . . . . . . . . . . . . . . . . . . . . . . . . . . . . . . . . .118
Note 16 Risk Management and Derivatives . . . . . . . . . . . . . . . . . . . . . . . . . . . . . . . . . . . . . . . . . . . . . . . . . . . . . . . . . . . . . . . . . . . . . . . . . . . . . . . . . . . . . . . . . . . .118
Note 17 Operating Segments and Related Information . . . . . . . . . . . . . . . . . . . . . . . . . . . . . . . . . . . . . . . . . . . . . . . . . . . . . . . . . . . . . . . . . . . . . . . . . . . .121
104
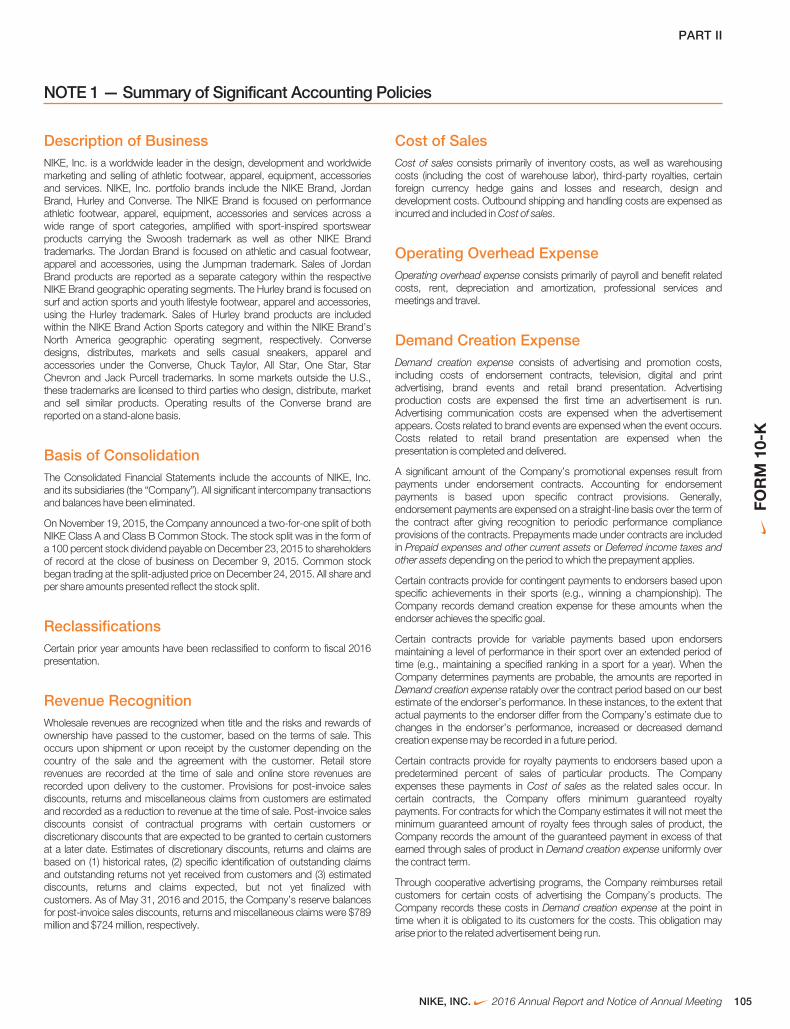
PART II
NOTE 1 — Summary of Significant Accounting Policies
Description of BusinessNIKE, Inc. is a worldwide leader in the design, development and worldwidemarketing and selling of athletic footwear, apparel, equipment, accessoriesand services. NIKE, Inc. portfolio brands include the NIKE Brand, JordanBrand, Hurley and Converse. The NIKE Brand is focused on performanceathletic footwear, apparel, equipment, accessories and services across awide range of sport categories, amplified with sport-inspired sportswearproducts carrying the Swoosh trademark as well as other NIKE Brandtrademarks. The Jordan Brand is focused on athletic and casual footwear,apparel and accessories, using the Jumpman trademark. Sales of JordanBrand products are reported as a separate category within the respectiveNIKE Brand geographic operating segments. The Hurley brand is focused onsurf and action sports and youth lifestyle footwear, apparel and accessories,using the Hurley trademark. Sales of Hurley brand products are includedwithin the NIKE Brand Action Sports category and within the NIKE Brand’sNorth America geographic operating segment, respectively. Conversedesigns, distributes, markets and sells casual sneakers, apparel andaccessories under the Converse, Chuck Taylor, All Star, One Star, StarChevron and Jack Purcell trademarks. In some markets outside the U.S.,these trademarks are licensed to third parties who design, distribute, marketand sell similar products. Operating results of the Converse brand arereported on a stand-alone basis.
Basis of ConsolidationThe Consolidated Financial Statements include the accounts of NIKE, Inc.and its subsidiaries (the “Company”). All significant intercompany transactionsand balances have been eliminated.
On November 19, 2015, the Company announced a two-for-one split of bothNIKE Class A and Class B Common Stock. The stock split was in the form ofa 100 percent stock dividend payable on December 23, 2015 to shareholdersof record at the close of business on December 9, 2015. Common stockbegan trading at the split-adjusted price on December 24, 2015. All share andper share amounts presented reflect the stock split.
ReclassificationsCertain prior year amounts have been reclassified to conform to fiscal 2016presentation.
Revenue RecognitionWholesale revenues are recognized when title and the risks and rewards ofownership have passed to the customer, based on the terms of sale. Thisoccurs upon shipment or upon receipt by the customer depending on thecountry of the sale and the agreement with the customer. Retail storerevenues are recorded at the time of sale and online store revenues arerecorded upon delivery to the customer. Provisions for post-invoice salesdiscounts, returns and miscellaneous claims from customers are estimatedand recorded as a reduction to revenue at the time of sale. Post-invoice salesdiscounts consist of contractual programs with certain customers ordiscretionary discounts that are expected to be granted to certain customersat a later date. Estimates of discretionary discounts, returns and claims arebased on (1) historical rates, (2) specific identification of outstanding claimsand outstanding returns not yet received from customers and (3) estimateddiscounts, returns and claims expected, but not yet finalized withcustomers. As of May 31, 2016 and 2015, the Company’s reserve balancesfor post-invoice sales discounts, returns and miscellaneous claims were $789million and $724 million, respectively.
Cost of SalesCost of sales consists primarily of inventory costs, as well as warehousingcosts (including the cost of warehouse labor), third-party royalties, certainforeign currency hedge gains and losses and research, design anddevelopment costs. Outbound shipping and handling costs are expensed asincurred and included in Cost of sales.
Operating Overhead ExpenseOperating overhead expense consists primarily of payroll and benefit relatedcosts, rent, depreciation and amortization, professional services andmeetings and travel.
Demand Creation ExpenseDemand creation expense consists of advertising and promotion costs,including costs of endorsement contracts, television, digital and printadvertising, brand events and retail brand presentation. Advertisingproduction costs are expensed the first time an advertisement is run.Advertising communication costs are expensed when the advertisementappears. Costs related to brand events are expensed when the event occurs.Costs related to retail brand presentation are expensed when thepresentation is completed and delivered.
A significant amount of the Company’s promotional expenses result frompayments under endorsement contracts. Accounting for endorsementpayments is based upon specific contract provisions. Generally,endorsement payments are expensed on a straight-line basis over the term ofthe contract after giving recognition to periodic performance complianceprovisions of the contracts. Prepayments made under contracts are includedin Prepaid expenses and other current assets or Deferred income taxes andother assets depending on the period to which the prepayment applies.
Certain contracts provide for contingent payments to endorsers based uponspecific achievements in their sports (e.g., winning a championship). TheCompany records demand creation expense for these amounts when theendorser achieves the specific goal.
Certain contracts provide for variable payments based upon endorsersmaintaining a level of performance in their sport over an extended period oftime (e.g., maintaining a specified ranking in a sport for a year). When theCompany determines payments are probable, the amounts are reported inDemand creation expense ratably over the contract period based on our bestestimate of the endorser’s performance. In these instances, to the extent thatactual payments to the endorser differ from the Company’s estimate due tochanges in the endorser’s performance, increased or decreased demandcreation expense may be recorded in a future period.
Certain contracts provide for royalty payments to endorsers based upon apredetermined percent of sales of particular products. The Companyexpenses these payments in Cost of sales as the related sales occur. Incertain contracts, the Company offers minimum guaranteed royaltypayments. For contracts for which the Company estimates it will not meet theminimum guaranteed amount of royalty fees through sales of product, theCompany records the amount of the guaranteed payment in excess of thatearned through sales of product in Demand creation expense uniformly overthe contract term.
Through cooperative advertising programs, the Company reimburses retailcustomers for certain costs of advertising the Company’s products. TheCompany records these costs in Demand creation expense at the point intime when it is obligated to its customers for the costs. This obligation mayarise prior to the related advertisement being run.
NIKE, INC. 2016 Annual Report and Notice of Annual Meeting 105
FOR
M10
-K
PART II
Total advertising and promotion expenses were $3,278 million, $3,213 millionand $3,031 million for the years ended May 31, 2016, 2015 and 2014,respectively. Prepaid advertising and promotion expenses totaled $540million and $455 million at May 31, 2016 and 2015, respectively, and wererecorded in Prepaid expenses and other current assets and Deferred incometaxes and other assets depending on the period to which the prepaymentapplies.
Cash and EquivalentsCash and equivalents represent cash and short-term, highly liquidinvestments, including commercial paper, U.S. Treasury, U.S. Agency,money market funds, time deposits and corporate debt securities withmaturities of 90 days or less at the date of purchase.
Short-Term InvestmentsShort-term investments consist of highly liquid investments, includingcommercial paper, U.S. Treasury, U.S. Agency, time deposits and corporatedebt securities, with maturities over 90 days at the date of purchase. Debtsecurities that the Company has the ability and positive intent to hold tomaturity are carried at amortized cost. At May 31, 2016 and 2015, theCompany did not hold any short-term investments that were classified astrading or held-to-maturity.
At May 31, 2016 and 2015, Short-term investments consisted of available-for-sale securities. Available-for-sale securities are recorded at fair value withunrealized gains and losses reported, net of tax, in Accumulated othercomprehensive income, unless unrealized losses are determined to be otherthan temporary. Realized gains and losses on the sale of securities aredetermined by specific identification. The Company considers all available-for-sale securities, including those with maturity dates beyond 12 months, asavailable to support current operational liquidity needs and therefore classifiesall securities with maturity dates beyond 90 days at the date of purchase ascurrent assets within Short-term investments on the Consolidated BalanceSheets.
Refer to Note 6 — Fair Value Measurements for more information on theCompany’s short-term investments.
Allowance for Uncollectible AccountsReceivableAccounts receivable, net consist primarily of amounts receivable fromcustomers. The Company makes ongoing estimates relating to thecollectability of its accounts receivable and maintains an allowance forestimated losses resulting from the inability of its customers to make requiredpayments. In determining the amount of the allowance, the Companyconsiders historical levels of credit losses and makes judgments about thecreditworthiness of significant customers based on ongoing creditevaluations. Accounts receivable with anticipated collection dates greaterthan 12 months from the balance sheet date and related allowances areconsidered non-current and recorded in Deferred income taxes and otherassets. The allowance for uncollectible accounts receivable was $43 millionand $78 million at May 31, 2016 and 2015, respectively, of which $17 millionand $24 million, respectively, was classified as long-term and recorded inDeferred income taxes and other assets.
Inventory ValuationInventories are stated at lower of cost or market and valued on either anaverage or specific identification cost basis. For inventories in transit thatrepresent direct shipments to customers, the related inventory and cost ofsales are recognized on a specific identification basis. Inventory costsprimarily consist of product cost from the Company’s suppliers, as well asinbound freight, import duties, taxes, insurance and logistics and otherhandling fees.
Property, Plant and Equipment andDepreciationProperty, plant and equipment are recorded at cost. Depreciation isdetermined on a straight-line basis for buildings and leasehold improvementsover 2 to 40 years and for machinery and equipment over 2 to 15 years.
Depreciation and amortization of assets used in manufacturing, warehousingand product distribution are recorded in Cost of sales. Depreciation andamortization of other assets are recorded in Operating overhead expense.
Software Development CostsInternal Use Software: Expenditures for major software purchases andsoftware developed for internal use are capitalized and amortized over a 2 to10 year period on a straight-line basis. The Company’s policy provides for thecapitalization of external direct costs of materials and services associated withdeveloping or obtaining internal use computer software. In addition, theCompany also capitalizes certain payroll and payroll-related costs foremployees who are directly associated with internal use computer softwareprojects. The amount of capitalizable payroll costs with respect to theseemployees is limited to the time directly spent on such projects. Costsassociated with preliminary project stage activities, training, maintenance andall other post-implementation stage activities are expensed as incurred.
Computer Software to be Sold, Leased or Otherwise Marketed: Developmentcosts of computer software to be sold, leased or otherwise marketed as anintegral part of a product are subject to capitalization beginning when aproduct’s technological feasibility has been established and ending when aproduct is available for general release to customers. In most instances, theCompany’s products are released soon after technological feasibility hasbeen established. Therefore, software development costs incurredsubsequent to achievement of technological feasibility are usually notsignificant, and generally most software development costs have beenexpensed as incurred.
Impairment of Long-Lived AssetsThe Company reviews the carrying value of long-lived assets or asset groupsto be used in operations whenever events or changes in circumstancesindicate that the carrying amount of the assets might not be recoverable.Factors that would necessitate an impairment assessment include asignificant adverse change in the extent or manner in which an asset is used,a significant adverse change in legal factors or the business climate that couldaffect the value of the asset or a significant decline in the observable marketvalue of an asset, among others. If such facts indicate a potential impairment,the Company would assess the recoverability of an asset group bydetermining if the carrying value of the asset group exceeds the sum of theprojected undiscounted cash flows expected to result from the use andeventual disposition of the assets over the remaining economic life of theprimary asset in the asset group. If the recoverability test indicates that thecarrying value of the asset group is not recoverable, the Company willestimate the fair value of the asset group using appropriate valuationmethodologies, which would typically include an estimate of discounted cashflows. Any impairment would be measured as the difference between theasset group’s carrying amount and its estimated fair value.
Goodwill and Indefinite-Lived Intangible AssetsThe Company performs annual impairment tests on goodwill and intangibleassets with indefinite lives in the fourth quarter of each fiscal year or whenevents occur or circumstances change that would, more likely than not,reduce the fair value of a reporting unit or an intangible asset with an indefinitelife below its carrying value. Events or changes in circumstances that maytrigger interim impairment reviews include significant changes in businessclimate, operating results, planned investments in the reporting unit, planneddivestitures or an expectation that the carrying amount may not berecoverable, among other factors. The Company may first assess qualitative
106
PART II
factors to determine whether it is more likely than not that the fair value of areporting unit is less than its carrying amount. If, after assessing the totality ofevents and circumstances, the Company determines that it is more likely thannot that the fair value of the reporting unit is greater than its carrying amount,the two-step impairment test is unnecessary. The two-step impairment testfirst requires the Company to estimate the fair value of its reporting units. If thecarrying value of a reporting unit exceeds its fair value, the goodwill of thatreporting unit is potentially impaired and the Company proceeds to step twoof the impairment analysis. In step two of the analysis, the Companymeasures and records an impairment loss equal to the excess of the carryingvalue of the reporting unit’s goodwill over its implied fair value, if any.
The Company generally bases its measurement of the fair value of a reportingunit on a blended analysis of the present value of future discounted cash flowsand the market valuation approach. The discounted cash flows modelindicates the fair value of the reporting unit based on the present value of thecash flows that the Company expects the reporting unit to generate in thefuture. The Company’s significant estimates in the discounted cash flowsmodel include: its weighted average cost of capital; long-term rate of growthand profitability of the reporting unit’s business; and working capital effects.The market valuation approach indicates the fair value of the business basedon a comparison of the reporting unit to comparable publicly tradedcompanies in similar lines of business. Significant estimates in the marketvaluation approach model include identifying similar companies withcomparable business factors such as size, growth, profitability, risk and returnon investment and assessing comparable revenue and operating incomemultiples in estimating the fair value of the reporting unit.
Indefinite-lived intangible assets primarily consist of acquired trade names andtrademarks. The Company may first perform a qualitative assessment todetermine whether it is more likely than not that an indefinite-lived intangibleasset is impaired. If, after assessing the totality of events and circumstances,the Company determines that it is more likely than not that the indefinite-livedintangible asset is not impaired, no quantitative fair value measurement isnecessary. If a quantitative fair value measurement calculation is required forthese intangible assets, the Company utilizes the relief-from-royalty method.This method assumes that trade names and trademarks have value to theextent that their owner is relieved of the obligation to pay royalties for thebenefits received from them. This method requires the Company to estimatethe future revenue for the related brands, the appropriate royalty rate and theweighted average cost of capital.
Operating LeasesThe Company leases retail store space, certain distribution and warehousefacilities, office space and other non-real estate assets under operatingleases. Operating lease agreements may contain rent escalation clauses,renewal options, rent holidays or certain landlord incentives, including tenantimprovement allowances. Rent expense for non-cancelable operating leaseswith scheduled rent increases or landlord incentives are recognized on astraight-line basis over the lease term, beginning with the effective leasecommencement date, which is generally the date in which the Companytakes possession of or controls the physical use of the property. Certainleases also provide for contingent rent, which is determined as a percent ofsales in excess of specified levels. A contingent rent liability is recognizedtogether with the corresponding rent expense when specified levels havebeen achieved or when the Company determines that achieving the specifiedlevels during the period is probable.
Fair Value MeasurementsThe Company measures certain financial assets and liabilities at fair value on arecurring basis, including derivatives and available-for-sale securities. Fairvalue is the price the Company would receive to sell an asset or pay to transfera liability in an orderly transaction with a market participant at themeasurement date. The Company uses a three-level hierarchy established bythe Financial Accounting Standards Board (“FASB”) that prioritizes fair valuemeasurements based on the types of inputs used for the various valuationtechniques (market approach, income approach and cost approach).
The levels of hierarchy are described below:
• Level 1: Quoted prices in active markets for identical assets or liabilities.
• Level 2: Inputs other than quoted prices that are observable for the asset orliability, either directly or indirectly; these include quoted prices for similarassets or liabilities in active markets and quoted prices for identical or similarassets or liabilities in markets that are not active.
• Level 3: Unobservable inputs for which there is little or no market dataavailable, which require the reporting entity to develop its own assumptions.
The Company’s assessment of the significance of a particular input to the fairvalue measurement in its entirety requires judgment and considers factorsspecific to the asset or liability. Financial assets and liabilities are classified intheir entirety based on the most conservative level of input that is significant tothe fair value measurement.
Pricing vendors are utilized for certain Level 1 and Level 2 investments. Thesevendors either provide a quoted market price in an active market or useobservable inputs without applying significant adjustments in their pricing.Observable inputs include broker quotes, interest rates and yield curvesobservable at commonly quoted intervals, volatilities and credit risks. The fairvalue of derivative contracts is determined using observable market inputssuch as the daily market foreign currency rates, forward pricing curves,currency volatilities, currency correlations and interest rates and considersnonperformance risk of the Company and that of its counterparties.
The Company’s fair value processes include controls that are designed toensure appropriate fair values are recorded. These controls include acomparison of fair values to another independent pricing vendor.
Refer to Note 6 — Fair Value Measurements for additional information.
Foreign Currency Translation and ForeignCurrency TransactionsAdjustments resulting from translating foreign functional currency financialstatements into U.S. Dollars are included in the foreign currency translationadjustment, a component of Accumulated other comprehensive income inTotal shareholders’ equity.
The Company’s global subsidiaries have various assets and liabilities,primarily receivables and payables, which are denominated in currenciesother than their functional currency. These balance sheet items are subject tore-measurement, the impact of which is recorded in Other (income) expense,net, within the Consolidated Statements of Income.
Accounting for Derivatives and HedgingActivitiesThe Company uses derivative financial instruments to reduce its exposure tochanges in foreign currency exchange rates and interest rates. All derivativesare recorded at fair value on the Consolidated Balance Sheets and changes inthe fair value of derivative financial instruments are either recognized inAccumulated other comprehensive income (a component of Totalshareholders’ equity), Long-term debt or Net income depending on thenature of the underlying exposure, whether the derivative is formallydesignated as a hedge and, if designated, the extent to which the hedge iseffective. The Company classifies the cash flows at settlement fromderivatives in the same category as the cash flows from the related hedgeditems. For undesignated hedges and designated cash flow hedges, this isprimarily within the Cash provided by operations component of theConsolidated Statements of Cash Flows. For designated net investmenthedges, this is within the Cash used by investing activities component of theConsolidated Statements of Cash Flows. For the Company’s fair valuehedges, which are interest rate swaps used to mitigate the change in fair valueof its fixed-rate debt attributable to changes in interest rates, the related cashflows from periodic interest payments are reflected within the Cash providedby operations component of the Consolidated Statements of Cash Flows.Refer to Note 16 — Risk Management and Derivatives for more informationon the Company’s risk management program and derivatives.
NIKE, INC. 2016 Annual Report and Notice of Annual Meeting 107
FOR
M10
-K
PART II
Stock-Based CompensationThe Company estimates the fair value of options and stock appreciation rightsgranted under the NIKE, Inc. Stock Incentive Plan and employees’ purchaserights under the Employee Stock Purchase Plans (“ESPPs”) using the Black-Scholes option pricing model. The Company recognizes this fair value, net ofestimated forfeitures, as Operating overhead expense in the ConsolidatedStatements of Income over the vesting period using the straight-line method.
Refer to Note 11 — Common Stock and Stock-Based Compensation formore information on the Company’s stock-based compensation programs.
Income TaxesThe Company accounts for income taxes using the asset and liability method.This approach requires the recognition of deferred tax assets and liabilities forthe expected future tax consequences of temporary differences between thecarrying amounts and the tax basis of assets and liabilities. The Companyrecords a valuation allowance to reduce deferred tax assets to the amountmanagement believes is more likely than not to be realized. United Statesincome taxes are provided currently on financial statement earnings of non-U.S. subsidiaries that are expected to be repatriated. The Companydetermines annually the amount of undistributed non-U.S. earnings to investindefinitely in its non-U.S. operations.
The Company recognizes a tax benefit from uncertain tax positions in thefinancial statements only when it is more likely than not that the position will besustained upon examination by relevant tax authorities. The Companyrecognizes interest and penalties related to income tax matters in Income taxexpense.
Refer to Note 9 — Income Taxes for further discussion.
Earnings Per ShareBasic earnings per common share is calculated by dividing Net income by theweighted average number of common shares outstanding during the year.Diluted earnings per common share is calculated by adjusting weightedaverage outstanding shares, assuming conversion of all potentially dilutivestock options and awards.
Refer to Note 12 — Earnings Per Share for further discussion.
Management EstimatesThe preparation of financial statements in conformity with generally acceptedaccounting principles requires management to make estimates, includingestimates relating to assumptions that affect the reported amounts of assetsand liabilities and disclosure of contingent assets and liabilities at the date offinancial statements and the reported amounts of revenues and expensesduring the reporting period. Actual results could differ from these estimates.
Recently Adopted Accounting StandardsIn November 2015, the FASB issued ASU No. 2015-17, Income Taxes (Topic740): Balance Sheet Classification of Deferred Taxes to simplify thepresentation of deferred taxes in the statement of financial position. Theupdated guidance requires that deferred tax assets and liabilities be classified
as non-current in a classified balance sheet. The Company elected to earlyadopt ASU 2015-17 on a retrospective basis in the fourth quarter of fiscal2016. The adoption of this standard reduced Total current assets by $389million, increased Deferred income taxes and other assets by $386 million andreduced Total current liabilities and Deferred income taxes and other liabilitiesby $2 million and $1 million, respectively, on the Consolidated Balance Sheetas of May 31, 2015.
Recently Issued Accounting StandardsIn May 2014, the Financial Accounting Standards Board (“FASB”) issued anaccounting standards update that replaces existing revenue recognitionguidance. The updated guidance requires companies to recognize revenue ina way that depicts the transfer of promised goods or services to customers inan amount that reflects the consideration to which the entity expects to beentitled in exchange for those goods or services. In addition, the newstandard requires that reporting companies disclose the nature, amount,timing and uncertainty of revenue and cash flows arising from contracts withcustomers. Based on the FASB’s decision in July 2015 to defer the effectivedate and to allow more flexibility with implementation, the new standard will beeffective for the Company beginning June 1, 2018, with early applicationpermitted. The new standard is required to be applied retrospectively to eachprior reporting period presented or retrospectively with the cumulative effectof initially applying it recognized at the date of initial application. The Companyhas not yet selected a transition method and is currently evaluating the effectthe guidance will have on the Consolidated Financial Statements.
In January 2016, the FASB issued ASU No. 2016-01, Financial Instruments— Overall (Subtopic 825-10): Recognition and Measurement of FinancialAssets and Financial Liabilities. The updated guidance enhances the reportingmodel for financial instruments, which includes amendments to addressaspects of recognition, measurement, presentation and disclosure. Theupdate to the standard is effective for the Company beginning June 1, 2018.The Company does not expect the adoption to have a material impact on theConsolidated Financial Statements.
In February 2016, the FASB issued ASU No. 2016-02, Leases (Topic 842)that replaces existing lease guidance. The new standard is intended toprovide enhanced transparency and comparability by requiring lessees torecord right-of-use assets and corresponding lease liabilities on the balancesheet. The new guidance will continue to classify leases as either finance oroperating, with classification affecting the pattern of expense recognition inthe statement of income. The standard is effective for the Company beginningJune 1, 2019, with early application permitted. The new standard is requiredto be applied with a modified retrospective approach to each prior reportingperiod presented with optional practical expedients. The Company iscurrently evaluating the effect the guidance will have on the ConsolidatedFinancial Statements.
In March 2016, the FASB Issued ASU No. 2016-09, Compensation — StockCompensation (Topic 718): Improvements to Employee Share-BasedPayment Accounting. The updated guidance changes how companiesaccount for certain aspects of share-based payment awards to employees,including the accounting for income taxes, forfeitures and statutory taxwithholding requirements, as well as classification in the statement of cashflows. The update to the standard is effective for the Company beginningJune 1, 2017, with early application permitted. The Company is currentlyevaluating the effect the guidance will have on the Consolidated FinancialStatements.
108
PART II
NOTE 2 — Inventories
Inventory balances of $4,838 million and $4,337 million at May 31, 2016 and 2015, respectively, were substantially all finished goods.
NOTE 3 — Property, Plant and Equipment
Property, plant and equipment, net included the following:
As of May 31,(In millions) 2016 2015
Land $ 286 $ 273Buildings 1,467 1,250Machinery, equipment and internal-use software 3,510 3,329Leasehold improvements 1,338 1,150Construction in process 437 350Total property, plant and equipment, gross 7,038 6,352Less accumulated depreciation 3,518 3,341TOTAL PROPERTY, PLANT AND EQUIPMENT, NET $ 3,520 $ 3,011
Capitalized interest was not material for the years ended May 31, 2016, 2015 and 2014.
NOTE 4 — Identifiable Intangible Assets and Goodwill
Identifiable intangible assets, net consist of indefinite-lived trademarks, which are not subject to amortization, and acquired trademarks and other intangibleassets, which are subject to amortization. Indefinite-lived trademarks were $281 million at May 31, 2016 and 2015. Acquired trademarks and other intangibleassets at May 31, 2016 and 2015 were $16 million and $17 million, respectively, and were fully amortized at the end of both periods. Goodwill was $131 million atMay 31, 2016 and 2015 of which $65 million was included in the Converse segment for the respective periods. The remaining amounts were included in GlobalBrand Divisions for segment reporting purposes. There were no accumulated impairment balances for goodwill as of either period end.
NOTE 5 — Accrued Liabilities
Accrued liabilities included the following:
As of May 31,(In millions) 2016 2015
Compensation and benefits, excluding taxes $ 943 $ 997Endorsement compensation 393 388Dividends payable 271 240Import and logistics costs 198 207Fair value of derivatives 162 162Taxes other than income taxes payable 159 172Advertising and marketing 119 117Collateral received from counterparties to hedging instruments 105 968Other(1) 687 698TOTAL ACCRUED LIABILITIES $ 3,037 $ 3,949
(1) Other consists of various accrued expenses with no individual item accounting for more than 5% of the total Accrued liabilities balance at May 31, 2016 and 2015.
NIKE, INC. 2016 Annual Report and Notice of Annual Meeting 109
FOR
M10
-K
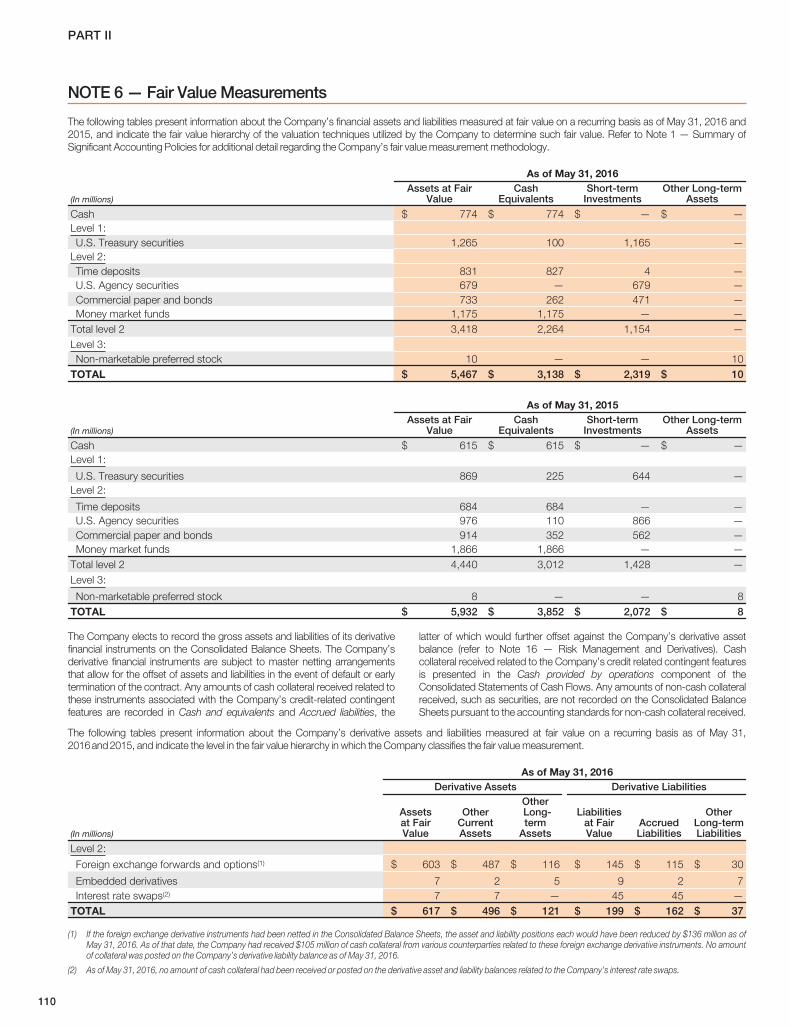
PART II
NOTE 6 — Fair Value Measurements
The following tables present information about the Company’s financial assets and liabilities measured at fair value on a recurring basis as of May 31, 2016 and2015, and indicate the fair value hierarchy of the valuation techniques utilized by the Company to determine such fair value. Refer to Note 1 — Summary ofSignificant Accounting Policies for additional detail regarding the Company’s fair value measurement methodology.
As of May 31, 2016
(In millions)Assets at Fair
ValueCash
EquivalentsShort-term
InvestmentsOther Long-term
Assets
Cash $ 774 $ 774 $ — $ —Level 1:U.S. Treasury securities 1,265 100 1,165 —
Level 2:Time deposits 831 827 4 —U.S. Agency securities 679 — 679 —Commercial paper and bonds 733 262 471 —Money market funds 1,175 1,175 — —
Total level 2 3,418 2,264 1,154 —Level 3:Non-marketable preferred stock 10 — — 10
TOTAL $ 5,467 $ 3,138 $ 2,319 $ 10
As of May 31, 2015
(In millions)Assets at Fair
ValueCash
EquivalentsShort-term
InvestmentsOther Long-term
Assets
Cash $ 615 $ 615 $ — $ —Level 1:
U.S. Treasury securities 869 225 644 —Level 2:
Time deposits 684 684 — —U.S. Agency securities 976 110 866 —Commercial paper and bonds 914 352 562 —Money market funds 1,866 1,866 — —
Total level 2 4,440 3,012 1,428 —Level 3:
Non-marketable preferred stock 8 — — 8TOTAL $ 5,932 $ 3,852 $ 2,072 $ 8
The Company elects to record the gross assets and liabilities of its derivativefinancial instruments on the Consolidated Balance Sheets. The Company’sderivative financial instruments are subject to master netting arrangementsthat allow for the offset of assets and liabilities in the event of default or earlytermination of the contract. Any amounts of cash collateral received related tothese instruments associated with the Company’s credit-related contingentfeatures are recorded in Cash and equivalents and Accrued liabilities, the
latter of which would further offset against the Company’s derivative assetbalance (refer to Note 16 — Risk Management and Derivatives). Cashcollateral received related to the Company’s credit related contingent featuresis presented in the Cash provided by operations component of theConsolidated Statements of Cash Flows. Any amounts of non-cash collateralreceived, such as securities, are not recorded on the Consolidated BalanceSheets pursuant to the accounting standards for non-cash collateral received.
The following tables present information about the Company’s derivative assets and liabilities measured at fair value on a recurring basis as of May 31,2016and2015, and indicate the level in the fair value hierarchy in which the Company classifies the fair value measurement.
As of May 31, 2016Derivative Assets Derivative Liabilities
(In millions)
Assetsat FairValue
OtherCurrentAssets
OtherLong-term
Assets
Liabilitiesat FairValue
AccruedLiabilities
OtherLong-termLiabilities
Level 2:
Foreign exchange forwards and options(1) $ 603 $ 487 $ 116 $ 145 $ 115 $ 30
Embedded derivatives 7 2 5 9 2 7Interest rate swaps(2) 7 7 — 45 45 —
TOTAL $ 617 $ 496 $ 121 $ 199 $ 162 $ 37
(1) If the foreign exchange derivative instruments had been netted in the Consolidated Balance Sheets, the asset and liability positions each would have been reduced by $136 million as ofMay 31, 2016. As of that date, the Company had received $105 million of cash collateral from various counterparties related to these foreign exchange derivative instruments. No amountof collateral was posted on the Company’s derivative liability balance as of May 31, 2016.
(2) As of May 31, 2016, no amount of cash collateral had been received or posted on the derivative asset and liability balances related to the Company’s interest rate swaps.
110
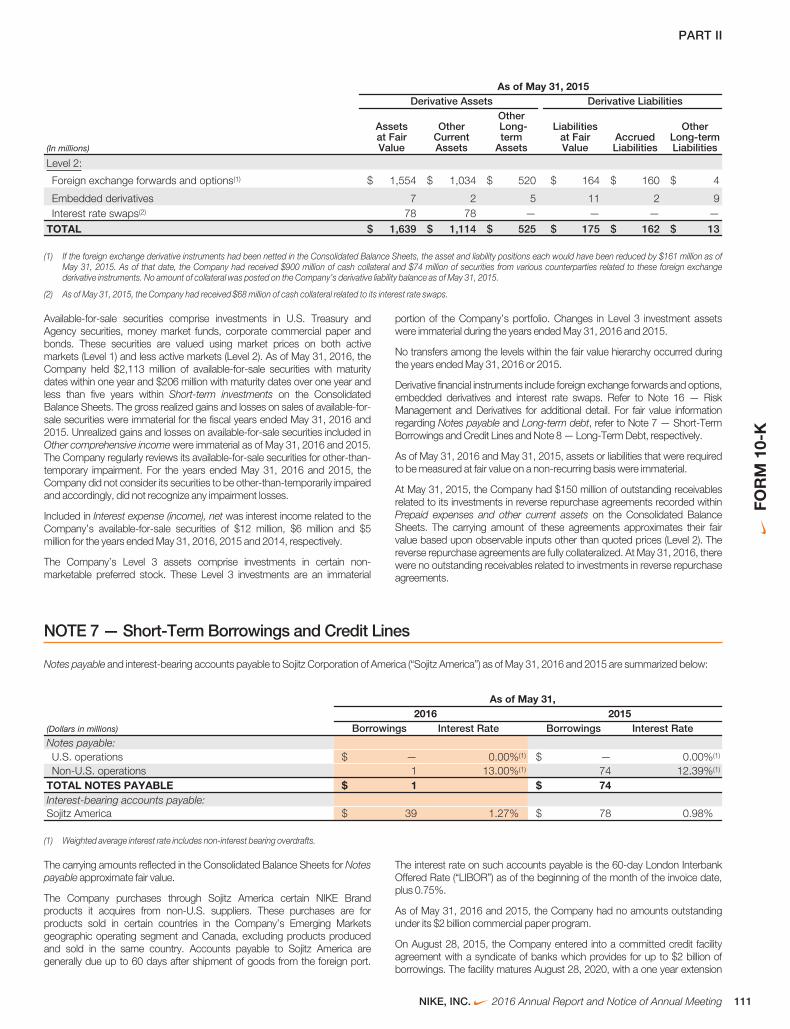
PART II
As of May 31, 2015Derivative Assets Derivative Liabilities
(In millions)
Assetsat FairValue
OtherCurrentAssets
OtherLong-term
Assets
Liabilitiesat FairValue
AccruedLiabilities
OtherLong-termLiabilities
Level 2:
Foreign exchange forwards and options(1) $ 1,554 $ 1,034 $ 520 $ 164 $ 160 $ 4
Embedded derivatives 7 2 5 11 2 9Interest rate swaps(2) 78 78 — — — —
TOTAL $ 1,639 $ 1,114 $ 525 $ 175 $ 162 $ 13
(1) If the foreign exchange derivative instruments had been netted in the Consolidated Balance Sheets, the asset and liability positions each would have been reduced by $161 million as ofMay 31, 2015. As of that date, the Company had received $900 million of cash collateral and $74 million of securities from various counterparties related to these foreign exchangederivative instruments. No amount of collateral was posted on the Company’s derivative liability balance as of May 31, 2015.
(2) As of May 31, 2015, the Company had received $68 million of cash collateral related to its interest rate swaps.
Available-for-sale securities comprise investments in U.S. Treasury andAgency securities, money market funds, corporate commercial paper andbonds. These securities are valued using market prices on both activemarkets (Level 1) and less active markets (Level 2). As of May 31, 2016, theCompany held $2,113 million of available-for-sale securities with maturitydates within one year and $206 million with maturity dates over one year andless than five years within Short-term investments on the ConsolidatedBalance Sheets. The gross realized gains and losses on sales of available-for-sale securities were immaterial for the fiscal years ended May 31, 2016 and2015. Unrealized gains and losses on available-for-sale securities included inOther comprehensive income were immaterial as of May 31, 2016 and 2015.The Company regularly reviews its available-for-sale securities for other-than-temporary impairment. For the years ended May 31, 2016 and 2015, theCompany did not consider its securities to be other-than-temporarily impairedand accordingly, did not recognize any impairment losses.
Included in Interest expense (income), net was interest income related to theCompany’s available-for-sale securities of $12 million, $6 million and $5million for the years ended May 31, 2016, 2015 and 2014, respectively.
The Company’s Level 3 assets comprise investments in certain non-marketable preferred stock. These Level 3 investments are an immaterial
portion of the Company’s portfolio. Changes in Level 3 investment assetswere immaterial during the years ended May 31, 2016 and 2015.
No transfers among the levels within the fair value hierarchy occurred duringthe years ended May 31, 2016 or 2015.
Derivative financial instruments include foreign exchange forwards and options,embedded derivatives and interest rate swaps. Refer to Note 16 — RiskManagement and Derivatives for additional detail. For fair value informationregarding Notes payable and Long-term debt, refer to Note 7 — Short-TermBorrowings and Credit Lines and Note 8 — Long-Term Debt, respectively.
As of May 31, 2016 and May 31, 2015, assets or liabilities that were requiredto be measured at fair value on a non-recurring basis were immaterial.
At May 31, 2015, the Company had $150 million of outstanding receivablesrelated to its investments in reverse repurchase agreements recorded withinPrepaid expenses and other current assets on the Consolidated BalanceSheets. The carrying amount of these agreements approximates their fairvalue based upon observable inputs other than quoted prices (Level 2). Thereverse repurchase agreements are fully collateralized. At May 31, 2016, therewere no outstanding receivables related to investments in reverse repurchaseagreements.
NOTE 7 — Short-Term Borrowings and Credit Lines
Notes payable and interest-bearing accounts payable to Sojitz Corporation of America (“Sojitz America”) as of May 31, 2016 and 2015 are summarized below:
As of May 31,2016 2015
(Dollars in millions) Borrowings Interest Rate Borrowings Interest RateNotes payable:U.S. operations $ — 0.00%(1) $ — 0.00%(1)
Non-U.S. operations 1 13.00%(1) 74 12.39%(1)
TOTAL NOTES PAYABLE $ 1 $ 74Interest-bearing accounts payable:Sojitz America $ 39 1.27% $ 78 0.98%
(1) Weighted average interest rate includes non-interest bearing overdrafts.
The carrying amounts reflected in the Consolidated Balance Sheets for Notespayable approximate fair value.
The Company purchases through Sojitz America certain NIKE Brandproducts it acquires from non-U.S. suppliers. These purchases are forproducts sold in certain countries in the Company’s Emerging Marketsgeographic operating segment and Canada, excluding products producedand sold in the same country. Accounts payable to Sojitz America aregenerally due up to 60 days after shipment of goods from the foreign port.
The interest rate on such accounts payable is the 60-day London InterbankOffered Rate (“LIBOR”) as of the beginning of the month of the invoice date,plus 0.75%.
As of May 31, 2016 and 2015, the Company had no amounts outstandingunder its $2 billion commercial paper program.
On August 28, 2015, the Company entered into a committed credit facilityagreement with a syndicate of banks which provides for up to $2 billion ofborrowings. The facility matures August 28, 2020, with a one year extension
NIKE, INC. 2016 Annual Report and Notice of Annual Meeting 111
FOR
M10
-K
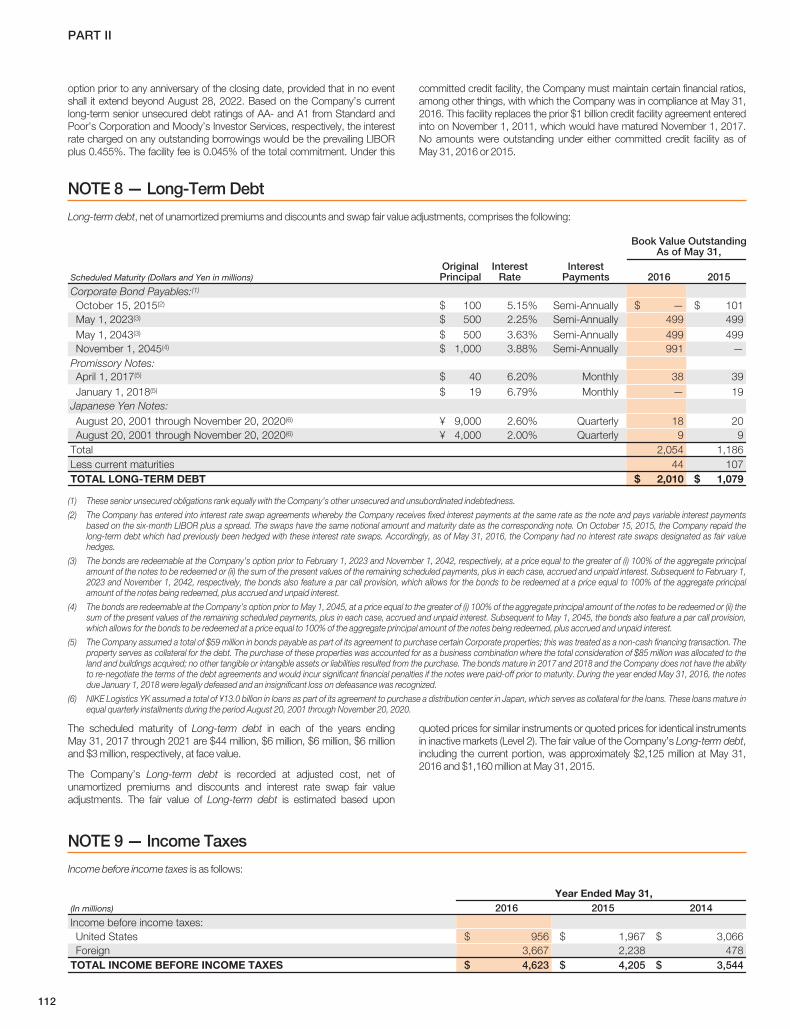
PART II
option prior to any anniversary of the closing date, provided that in no eventshall it extend beyond August 28, 2022. Based on the Company’s currentlong-term senior unsecured debt ratings of AA- and A1 from Standard andPoor’s Corporation and Moody’s Investor Services, respectively, the interestrate charged on any outstanding borrowings would be the prevailing LIBORplus 0.455%. The facility fee is 0.045% of the total commitment. Under this
committed credit facility, the Company must maintain certain financial ratios,among other things, with which the Company was in compliance at May 31,2016. This facility replaces the prior $1 billion credit facility agreement enteredinto on November 1, 2011, which would have matured November 1, 2017.No amounts were outstanding under either committed credit facility as ofMay 31, 2016 or 2015.
NOTE 8 — Long-Term Debt
Long-term debt, net of unamortized premiums and discounts and swap fair value adjustments, comprises the following:
Book Value OutstandingAs of May 31,
Scheduled Maturity (Dollars and Yen in millions)OriginalPrincipal
InterestRate
InterestPayments 2016 2015
Corporate Bond Payables:(1)
October 15, 2015(2) $ 100 5.15% Semi-Annually $ — $ 101May 1, 2023(3) $ 500 2.25% Semi-Annually 499 499May 1, 2043(3) $ 500 3.63% Semi-Annually 499 499November 1, 2045(4) $ 1,000 3.88% Semi-Annually 991 —
Promissory Notes:April 1, 2017(5) $ 40 6.20% Monthly 38 39January 1, 2018(5) $ 19 6.79% Monthly — 19
Japanese Yen Notes:August 20, 2001 through November 20, 2020(6) ¥ 9,000 2.60% Quarterly 18 20August 20, 2001 through November 20, 2020(6) ¥ 4,000 2.00% Quarterly 9 9
Total 2,054 1,186Less current maturities 44 107TOTAL LONG-TERM DEBT $ 2,010 $ 1,079
(1) These senior unsecured obligations rank equally with the Company’s other unsecured and unsubordinated indebtedness.
(2) The Company has entered into interest rate swap agreements whereby the Company receives fixed interest payments at the same rate as the note and pays variable interest paymentsbased on the six-month LIBOR plus a spread. The swaps have the same notional amount and maturity date as the corresponding note. On October 15, 2015, the Company repaid thelong-term debt which had previously been hedged with these interest rate swaps. Accordingly, as of May 31, 2016, the Company had no interest rate swaps designated as fair valuehedges.
(3) The bonds are redeemable at the Company’s option prior to February 1, 2023 and November 1, 2042, respectively, at a price equal to the greater of (i) 100% of the aggregate principalamount of the notes to be redeemed or (ii) the sum of the present values of the remaining scheduled payments, plus in each case, accrued and unpaid interest. Subsequent to February 1,2023 and November 1, 2042, respectively, the bonds also feature a par call provision, which allows for the bonds to be redeemed at a price equal to 100% of the aggregate principalamount of the notes being redeemed, plus accrued and unpaid interest.
(4) The bonds are redeemable at the Company’s option prior to May 1, 2045, at a price equal to the greater of (i) 100% of the aggregate principal amount of the notes to be redeemed or (ii) thesum of the present values of the remaining scheduled payments, plus in each case, accrued and unpaid interest. Subsequent to May 1, 2045, the bonds also feature a par call provision,which allows for the bonds to be redeemed at a price equal to 100% of the aggregate principal amount of the notes being redeemed, plus accrued and unpaid interest.
(5) The Company assumed a total of $59 million in bonds payable as part of its agreement to purchase certain Corporate properties; this was treated as a non-cash financing transaction. Theproperty serves as collateral for the debt. The purchase of these properties was accounted for as a business combination where the total consideration of $85 million was allocated to theland and buildings acquired; no other tangible or intangible assets or liabilities resulted from the purchase. The bonds mature in 2017 and 2018 and the Company does not have the abilityto re-negotiate the terms of the debt agreements and would incur significant financial penalties if the notes were paid-off prior to maturity. During the year ended May 31, 2016, the notesdue January 1, 2018 were legally defeased and an insignificant loss on defeasance was recognized.
(6) NIKE Logistics YK assumed a total of ¥13.0 billion in loans as part of its agreement to purchase a distribution center in Japan, which serves as collateral for the loans. These loans mature inequal quarterly installments during the period August 20, 2001 through November 20, 2020.
The scheduled maturity of Long-term debt in each of the years endingMay 31, 2017 through 2021 are $44 million, $6 million, $6 million, $6 millionand $3 million, respectively, at face value.
The Company’s Long-term debt is recorded at adjusted cost, net ofunamortized premiums and discounts and interest rate swap fair valueadjustments. The fair value of Long-term debt is estimated based upon
quoted prices for similar instruments or quoted prices for identical instrumentsin inactive markets (Level 2). The fair value of the Company’s Long-term debt,including the current portion, was approximately $2,125 million at May 31,2016 and $1,160 million at May 31, 2015.
NOTE 9 — Income Taxes
Income before income taxes is as follows:
Year Ended May 31,(In millions) 2016 2015 2014Income before income taxes:United States $ 956 $ 1,967 $ 3,066Foreign 3,667 2,238 478
TOTAL INCOME BEFORE INCOME TAXES $ 4,623 $ 4,205 $ 3,544
112
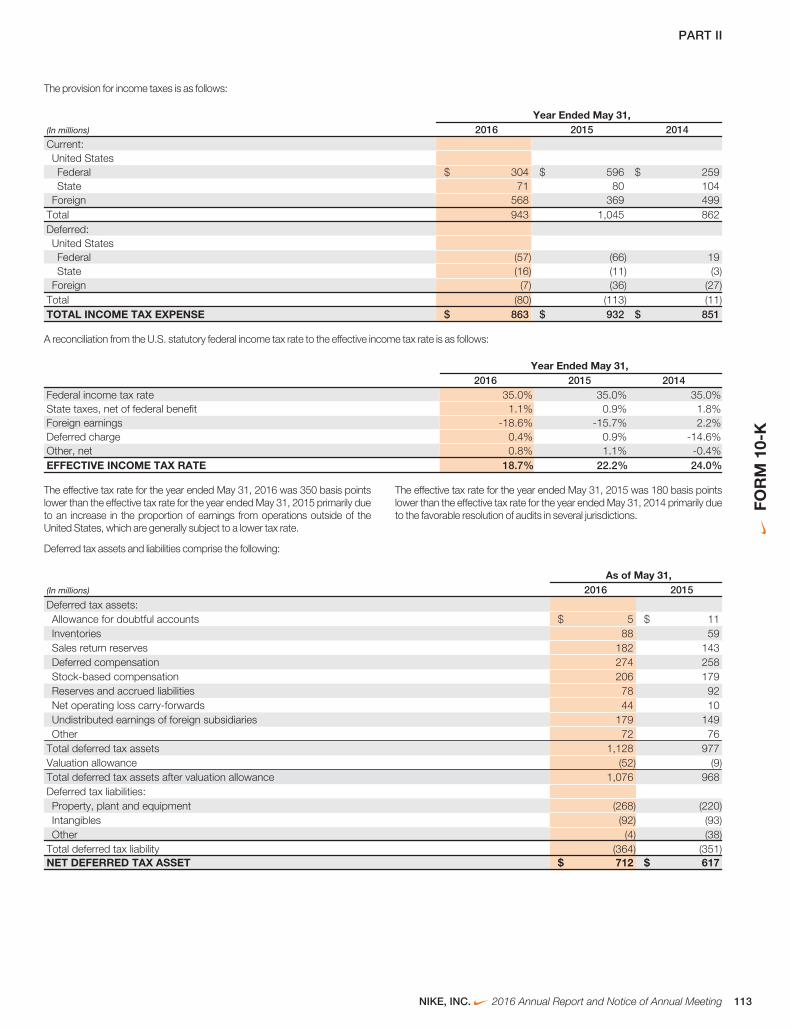
PART II
The provision for income taxes is as follows:
Year Ended May 31,(In millions) 2016 2015 2014Current:United StatesFederal $ 304 $ 596 $ 259State 71 80 104
Foreign 568 369 499Total 943 1,045 862Deferred:United StatesFederal (57) (66) 19State (16) (11) (3)
Foreign (7) (36) (27)Total (80) (113) (11)TOTAL INCOME TAX EXPENSE $ 863 $ 932 $ 851
A reconciliation from the U.S. statutory federal income tax rate to the effective income tax rate is as follows:
Year Ended May 31,2016 2015 2014
Federal income tax rate 35.0% 35.0% 35.0%State taxes, net of federal benefit 1.1% 0.9% 1.8%Foreign earnings -18.6% -15.7% 2.2%Deferred charge 0.4% 0.9% -14.6%Other, net 0.8% 1.1% -0.4%EFFECTIVE INCOME TAX RATE 18.7% 22.2% 24.0%
The effective tax rate for the year ended May 31, 2016 was 350 basis pointslower than the effective tax rate for the year ended May 31, 2015 primarily dueto an increase in the proportion of earnings from operations outside of theUnited States, which are generally subject to a lower tax rate.
The effective tax rate for the year ended May 31, 2015 was 180 basis pointslower than the effective tax rate for the year ended May 31, 2014 primarily dueto the favorable resolution of audits in several jurisdictions.
Deferred tax assets and liabilities comprise the following:
As of May 31,(In millions) 2016 2015Deferred tax assets:Allowance for doubtful accounts $ 5 $ 11Inventories 88 59Sales return reserves 182 143Deferred compensation 274 258Stock-based compensation 206 179Reserves and accrued liabilities 78 92Net operating loss carry-forwards 44 10Undistributed earnings of foreign subsidiaries 179 149Other 72 76
Total deferred tax assets 1,128 977Valuation allowance (52) (9)Total deferred tax assets after valuation allowance 1,076 968Deferred tax liabilities:Property, plant and equipment (268) (220)Intangibles (92) (93)Other (4) (38)
Total deferred tax liability (364) (351)NET DEFERRED TAX ASSET $ 712 $ 617
NIKE, INC. 2016 Annual Report and Notice of Annual Meeting 113
FOR
M10
-K
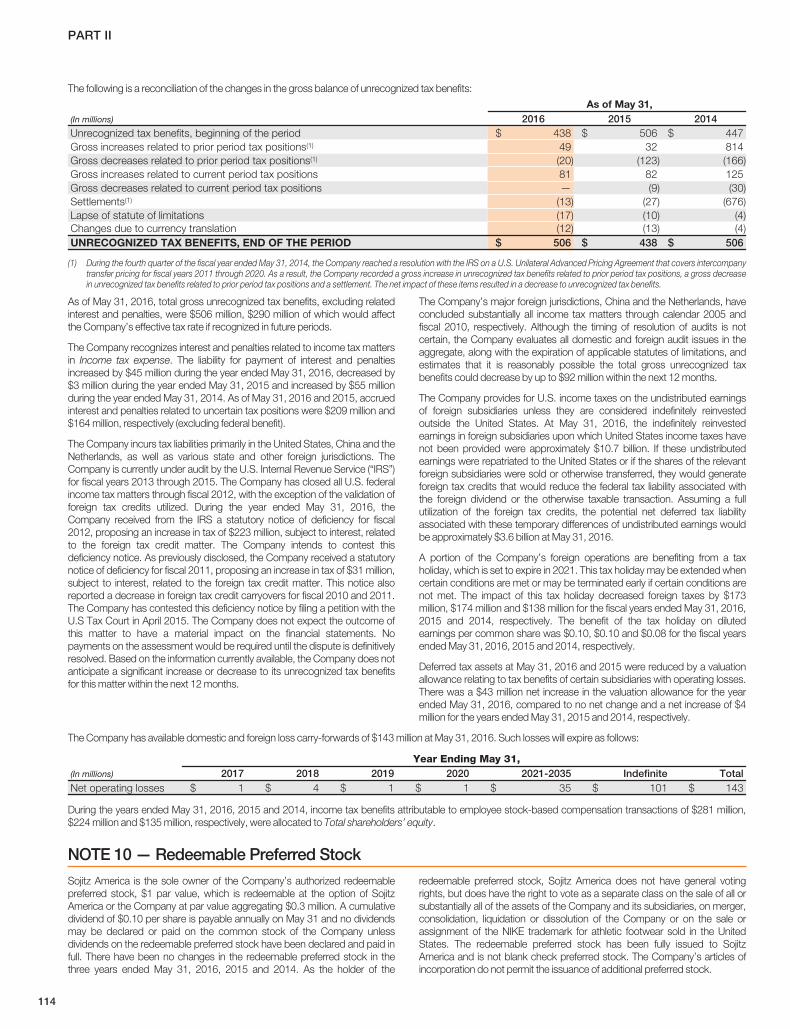
PART II
The following is a reconciliation of the changes in the gross balance of unrecognized tax benefits:
As of May 31,(In millions) 2016 2015 2014Unrecognized tax benefits, beginning of the period $ 438 $ 506 $ 447Gross increases related to prior period tax positions(1) 49 32 814Gross decreases related to prior period tax positions(1) (20) (123) (166)Gross increases related to current period tax positions 81 82 125Gross decreases related to current period tax positions — (9) (30)Settlements(1) (13) (27) (676)Lapse of statute of limitations (17) (10) (4)Changes due to currency translation (12) (13) (4)UNRECOGNIZED TAX BENEFITS, END OF THE PERIOD $ 506 $ 438 $ 506
(1) During the fourth quarter of the fiscal year ended May 31, 2014, the Company reached a resolution with the IRS on a U.S. Unilateral Advanced Pricing Agreement that covers intercompanytransfer pricing for fiscal years 2011 through 2020. As a result, the Company recorded a gross increase in unrecognized tax benefits related to prior period tax positions, a gross decreasein unrecognized tax benefits related to prior period tax positions and a settlement. The net impact of these items resulted in a decrease to unrecognized tax benefits.
As of May 31, 2016, total gross unrecognized tax benefits, excluding relatedinterest and penalties, were $506 million, $290 million of which would affectthe Company’s effective tax rate if recognized in future periods.
The Company recognizes interest and penalties related to income tax mattersin Income tax expense. The liability for payment of interest and penaltiesincreased by $45 million during the year ended May 31, 2016, decreased by$3 million during the year ended May 31, 2015 and increased by $55 millionduring the year ended May 31, 2014. As of May 31, 2016 and 2015, accruedinterest and penalties related to uncertain tax positions were $209 million and$164 million, respectively (excluding federal benefit).
The Company incurs tax liabilities primarily in the United States, China and theNetherlands, as well as various state and other foreign jurisdictions. TheCompany is currently under audit by the U.S. Internal Revenue Service (“IRS”)for fiscal years 2013 through 2015. The Company has closed all U.S. federalincome tax matters through fiscal 2012, with the exception of the validation offoreign tax credits utilized. During the year ended May 31, 2016, theCompany received from the IRS a statutory notice of deficiency for fiscal2012, proposing an increase in tax of $223 million, subject to interest, relatedto the foreign tax credit matter. The Company intends to contest thisdeficiency notice. As previously disclosed, the Company received a statutorynotice of deficiency for fiscal 2011, proposing an increase in tax of $31 million,subject to interest, related to the foreign tax credit matter. This notice alsoreported a decrease in foreign tax credit carryovers for fiscal 2010 and 2011.The Company has contested this deficiency notice by filing a petition with theU.S Tax Court in April 2015. The Company does not expect the outcome ofthis matter to have a material impact on the financial statements. Nopayments on the assessment would be required until the dispute is definitivelyresolved. Based on the information currently available, the Company does notanticipate a significant increase or decrease to its unrecognized tax benefitsfor this matter within the next 12 months.
The Company’s major foreign jurisdictions, China and the Netherlands, haveconcluded substantially all income tax matters through calendar 2005 andfiscal 2010, respectively. Although the timing of resolution of audits is notcertain, the Company evaluates all domestic and foreign audit issues in theaggregate, along with the expiration of applicable statutes of limitations, andestimates that it is reasonably possible the total gross unrecognized taxbenefits could decrease by up to $92 million within the next 12 months.
The Company provides for U.S. income taxes on the undistributed earningsof foreign subsidiaries unless they are considered indefinitely reinvestedoutside the United States. At May 31, 2016, the indefinitely reinvestedearnings in foreign subsidiaries upon which United States income taxes havenot been provided were approximately $10.7 billion. If these undistributedearnings were repatriated to the United States or if the shares of the relevantforeign subsidiaries were sold or otherwise transferred, they would generateforeign tax credits that would reduce the federal tax liability associated withthe foreign dividend or the otherwise taxable transaction. Assuming a fullutilization of the foreign tax credits, the potential net deferred tax liabilityassociated with these temporary differences of undistributed earnings wouldbe approximately $3.6 billion at May 31, 2016.
A portion of the Company’s foreign operations are benefiting from a taxholiday, which is set to expire in 2021. This tax holiday may be extended whencertain conditions are met or may be terminated early if certain conditions arenot met. The impact of this tax holiday decreased foreign taxes by $173million, $174 million and $138 million for the fiscal years ended May 31, 2016,2015 and 2014, respectively. The benefit of the tax holiday on dilutedearnings per common share was $0.10, $0.10 and $0.08 for the fiscal yearsended May 31, 2016, 2015 and 2014, respectively.
Deferred tax assets at May 31, 2016 and 2015 were reduced by a valuationallowance relating to tax benefits of certain subsidiaries with operating losses.There was a $43 million net increase in the valuation allowance for the yearended May 31, 2016, compared to no net change and a net increase of $4million for the years ended May 31, 2015 and 2014, respectively.
The Company has available domestic and foreign loss carry-forwards of $143 million at May 31, 2016. Such losses will expire as follows:
Year Ending May 31,(In millions) 2017 2018 2019 2020 2021-2035 Indefinite TotalNet operating losses $ 1 $ 4 $ 1 $ 1 $ 35 $ 101 $ 143
During the years ended May 31, 2016, 2015 and 2014, income tax benefits attributable to employee stock-based compensation transactions of $281 million,$224 million and $135 million, respectively, were allocated to Total shareholders’ equity.
NOTE 10 — Redeemable Preferred Stock
Sojitz America is the sole owner of the Company’s authorized redeemablepreferred stock, $1 par value, which is redeemable at the option of SojitzAmerica or the Company at par value aggregating $0.3 million. A cumulativedividend of $0.10 per share is payable annually on May 31 and no dividendsmay be declared or paid on the common stock of the Company unlessdividends on the redeemable preferred stock have been declared and paid infull. There have been no changes in the redeemable preferred stock in thethree years ended May 31, 2016, 2015 and 2014. As the holder of the
redeemable preferred stock, Sojitz America does not have general votingrights, but does have the right to vote as a separate class on the sale of all orsubstantially all of the assets of the Company and its subsidiaries, on merger,consolidation, liquidation or dissolution of the Company or on the sale orassignment of the NIKE trademark for athletic footwear sold in the UnitedStates. The redeemable preferred stock has been fully issued to SojitzAmerica and is not blank check preferred stock. The Company’s articles ofincorporation do not permit the issuance of additional preferred stock.
114
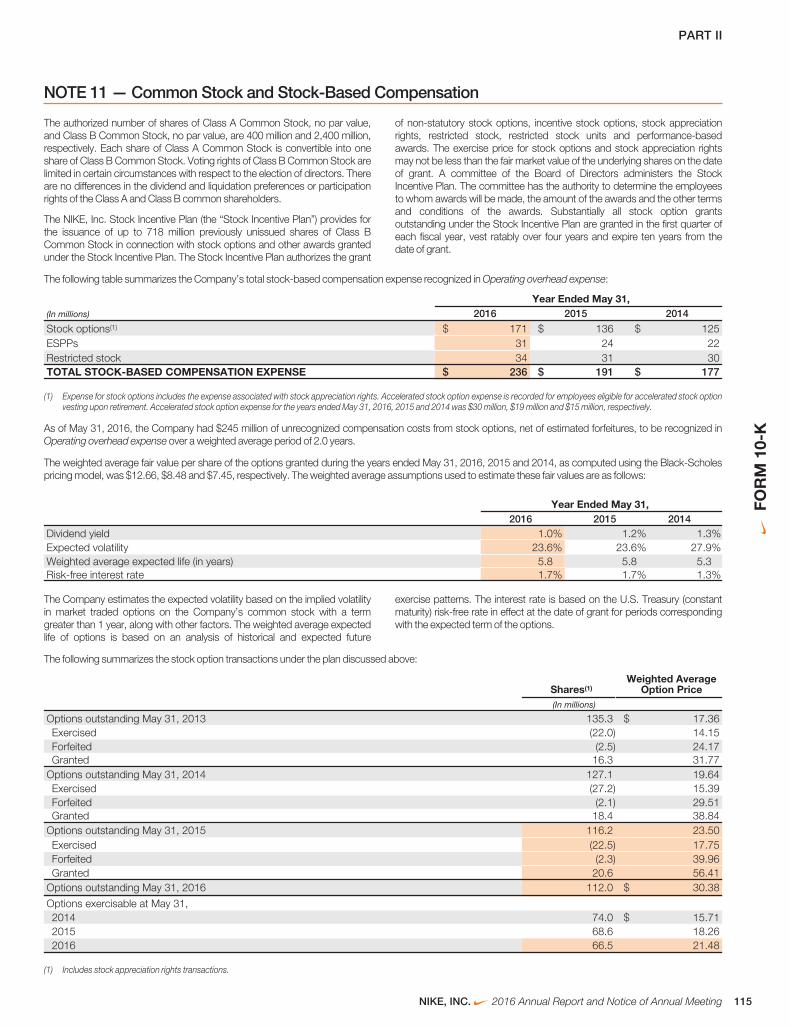
PART II
NOTE 11 — Common Stock and Stock-Based Compensation
The authorized number of shares of Class A Common Stock, no par value,and Class B Common Stock, no par value, are 400 million and 2,400 million,respectively. Each share of Class A Common Stock is convertible into oneshare of Class B Common Stock. Voting rights of Class B Common Stock arelimited in certain circumstances with respect to the election of directors. Thereare no differences in the dividend and liquidation preferences or participationrights of the Class A and Class B common shareholders.
The NIKE, Inc. Stock Incentive Plan (the “Stock Incentive Plan”) provides forthe issuance of up to 718 million previously unissued shares of Class BCommon Stock in connection with stock options and other awards grantedunder the Stock Incentive Plan. The Stock Incentive Plan authorizes the grant
of non-statutory stock options, incentive stock options, stock appreciationrights, restricted stock, restricted stock units and performance-basedawards. The exercise price for stock options and stock appreciation rightsmay not be less than the fair market value of the underlying shares on the dateof grant. A committee of the Board of Directors administers the StockIncentive Plan. The committee has the authority to determine the employeesto whom awards will be made, the amount of the awards and the other termsand conditions of the awards. Substantially all stock option grantsoutstanding under the Stock Incentive Plan are granted in the first quarter ofeach fiscal year, vest ratably over four years and expire ten years from thedate of grant.
The following table summarizes the Company’s total stock-based compensation expense recognized in Operating overhead expense:
Year Ended May 31,(In millions) 2016 2015 2014
Stock options(1) $ 171 $ 136 $ 125ESPPs 31 24 22Restricted stock 34 31 30TOTAL STOCK-BASED COMPENSATION EXPENSE $ 236 $ 191 $ 177
(1) Expense for stock options includes the expense associated with stock appreciation rights. Accelerated stock option expense is recorded for employees eligible for accelerated stock optionvesting upon retirement. Accelerated stock option expense for the years ended May 31, 2016, 2015 and 2014 was $30 million, $19 million and $15 million, respectively.
As of May 31, 2016, the Company had $245 million of unrecognized compensation costs from stock options, net of estimated forfeitures, to be recognized inOperating overhead expense over a weighted average period of 2.0 years.
The weighted average fair value per share of the options granted during the years ended May 31, 2016, 2015 and 2014, as computed using the Black-Scholespricing model, was $12.66, $8.48 and $7.45, respectively. The weighted average assumptions used to estimate these fair values are as follows:
Year Ended May 31,2016 2015 2014
Dividend yield 1.0% 1.2% 1.3%Expected volatility 23.6% 23.6% 27.9%Weighted average expected life (in years) 5.8 5.8 5.3Risk-free interest rate 1.7% 1.7% 1.3%
The Company estimates the expected volatility based on the implied volatilityin market traded options on the Company’s common stock with a termgreater than 1 year, along with other factors. The weighted average expectedlife of options is based on an analysis of historical and expected future
exercise patterns. The interest rate is based on the U.S. Treasury (constantmaturity) risk-free rate in effect at the date of grant for periods correspondingwith the expected term of the options.
The following summarizes the stock option transactions under the plan discussed above:
Shares(1)Weighted Average
Option Price(In millions)
Options outstanding May 31, 2013 135.3 $ 17.36Exercised (22.0) 14.15Forfeited (2.5) 24.17Granted 16.3 31.77
Options outstanding May 31, 2014 127.1 19.64Exercised (27.2) 15.39Forfeited (2.1) 29.51Granted 18.4 38.84
Options outstanding May 31, 2015 116.2 23.50Exercised (22.5) 17.75Forfeited (2.3) 39.96Granted 20.6 56.41
Options outstanding May 31, 2016 112.0 $ 30.38
Options exercisable at May 31,2014 74.0 $ 15.712015 68.6 18.262016 66.5 21.48
(1) Includes stock appreciation rights transactions.
NIKE, INC. 2016 Annual Report and Notice of Annual Meeting 115
FOR
M10
-K
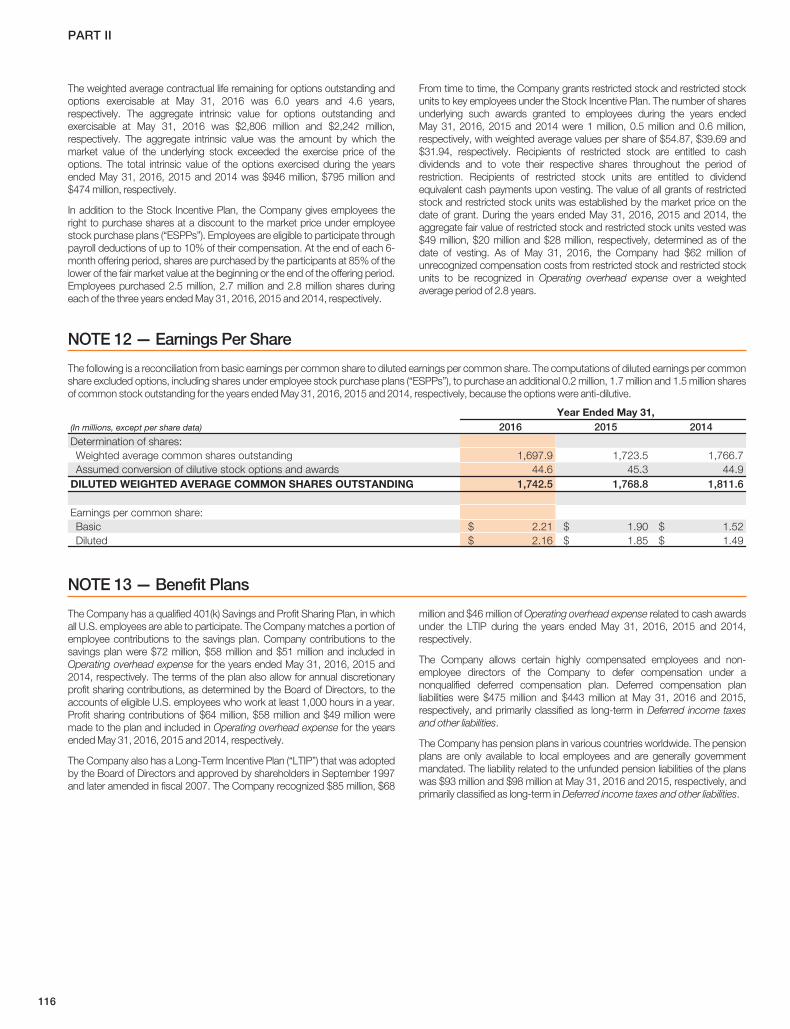
PART II
The weighted average contractual life remaining for options outstanding andoptions exercisable at May 31, 2016 was 6.0 years and 4.6 years,respectively. The aggregate intrinsic value for options outstanding andexercisable at May 31, 2016 was $2,806 million and $2,242 million,respectively. The aggregate intrinsic value was the amount by which themarket value of the underlying stock exceeded the exercise price of theoptions. The total intrinsic value of the options exercised during the yearsended May 31, 2016, 2015 and 2014 was $946 million, $795 million and$474 million, respectively.
In addition to the Stock Incentive Plan, the Company gives employees theright to purchase shares at a discount to the market price under employeestock purchase plans (“ESPPs”). Employees are eligible to participate throughpayroll deductions of up to 10% of their compensation. At the end of each 6-month offering period, shares are purchased by the participants at 85% of thelower of the fair market value at the beginning or the end of the offering period.Employees purchased 2.5 million, 2.7 million and 2.8 million shares duringeach of the three years ended May 31, 2016, 2015 and 2014, respectively.
From time to time, the Company grants restricted stock and restricted stockunits to key employees under the Stock Incentive Plan. The number of sharesunderlying such awards granted to employees during the years endedMay 31, 2016, 2015 and 2014 were 1 million, 0.5 million and 0.6 million,respectively, with weighted average values per share of $54.87, $39.69 and$31.94, respectively. Recipients of restricted stock are entitled to cashdividends and to vote their respective shares throughout the period ofrestriction. Recipients of restricted stock units are entitled to dividendequivalent cash payments upon vesting. The value of all grants of restrictedstock and restricted stock units was established by the market price on thedate of grant. During the years ended May 31, 2016, 2015 and 2014, theaggregate fair value of restricted stock and restricted stock units vested was$49 million, $20 million and $28 million, respectively, determined as of thedate of vesting. As of May 31, 2016, the Company had $62 million ofunrecognized compensation costs from restricted stock and restricted stockunits to be recognized in Operating overhead expense over a weightedaverage period of 2.8 years.
NOTE 12 — Earnings Per Share
The following is a reconciliation from basic earnings per common share to diluted earnings per common share. The computations of diluted earnings per commonshare excluded options, including shares under employee stock purchase plans (“ESPPs”), to purchase an additional 0.2 million, 1.7 million and 1.5 million sharesof common stock outstanding for the years ended May 31, 2016, 2015 and 2014, respectively, because the options were anti-dilutive.
Year Ended May 31,(In millions, except per share data) 2016 2015 2014Determination of shares:Weighted average common shares outstanding 1,697.9 1,723.5 1,766.7Assumed conversion of dilutive stock options and awards 44.6 45.3 44.9
DILUTED WEIGHTED AVERAGE COMMON SHARES OUTSTANDING 1,742.5 1,768.8 1,811.6
Earnings per common share:Basic $ 2.21 $ 1.90 $ 1.52Diluted $ 2.16 $ 1.85 $ 1.49
NOTE 13 — Benefit Plans
The Company has a qualified 401(k) Savings and Profit Sharing Plan, in whichall U.S. employees are able to participate. The Company matches a portion ofemployee contributions to the savings plan. Company contributions to thesavings plan were $72 million, $58 million and $51 million and included inOperating overhead expense for the years ended May 31, 2016, 2015 and2014, respectively. The terms of the plan also allow for annual discretionaryprofit sharing contributions, as determined by the Board of Directors, to theaccounts of eligible U.S. employees who work at least 1,000 hours in a year.Profit sharing contributions of $64 million, $58 million and $49 million weremade to the plan and included in Operating overhead expense for the yearsended May 31, 2016, 2015 and 2014, respectively.
The Company also has a Long-Term Incentive Plan (“LTIP”) that was adoptedby the Board of Directors and approved by shareholders in September 1997and later amended in fiscal 2007. The Company recognized $85 million, $68
million and $46 million of Operating overhead expense related to cash awardsunder the LTIP during the years ended May 31, 2016, 2015 and 2014,respectively.
The Company allows certain highly compensated employees and non-employee directors of the Company to defer compensation under anonqualified deferred compensation plan. Deferred compensation planliabilities were $475 million and $443 million at May 31, 2016 and 2015,respectively, and primarily classified as long-term in Deferred income taxesand other liabilities.
The Company has pension plans in various countries worldwide. The pensionplans are only available to local employees and are generally governmentmandated. The liability related to the unfunded pension liabilities of the planswas $93 million and $98 million at May 31, 2016 and 2015, respectively, andprimarily classified as long-term in Deferred income taxes and other liabilities.
116
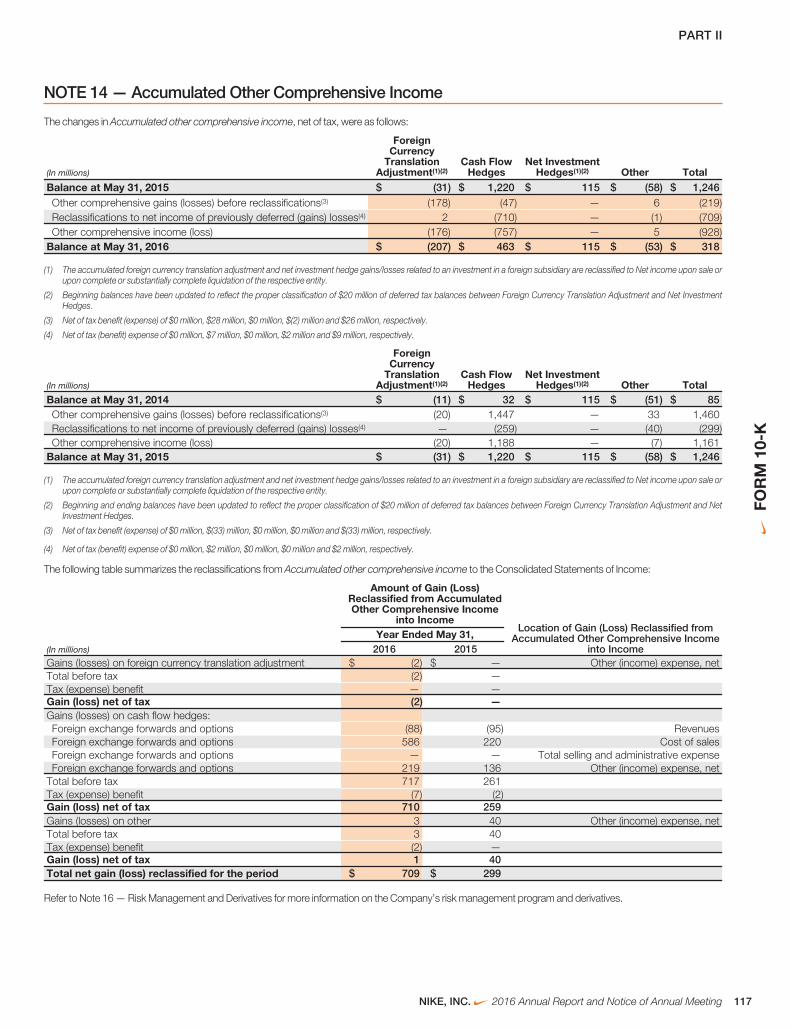
PART II
NOTE 14 — Accumulated Other Comprehensive Income
The changes in Accumulated other comprehensive income, net of tax, were as follows:
(In millions)
ForeignCurrency
TranslationAdjustment(1)(2)
Cash FlowHedges
Net InvestmentHedges(1)(2) Other Total
Balance at May 31, 2015 $ (31) $ 1,220 $ 115 $ (58) $ 1,246Other comprehensive gains (losses) before reclassifications(3) (178) (47) — 6 (219)Reclassifications to net income of previously deferred (gains) losses(4) 2 (710) — (1) (709)Other comprehensive income (loss) (176) (757) — 5 (928)
Balance at May 31, 2016 $ (207) $ 463 $ 115 $ (53) $ 318
(1) The accumulated foreign currency translation adjustment and net investment hedge gains/losses related to an investment in a foreign subsidiary are reclassified to Net income upon sale orupon complete or substantially complete liquidation of the respective entity.
(2) Beginning balances have been updated to reflect the proper classification of $20 million of deferred tax balances between Foreign Currency Translation Adjustment and Net InvestmentHedges.
(3) Net of tax benefit (expense) of $0 million, $28 million, $0 million, $(2) million and $26 million, respectively.
(4) Net of tax (benefit) expense of $0 million, $7 million, $0 million, $2 million and $9 million, respectively.
(In millions)
ForeignCurrency
TranslationAdjustment(1)(2)
Cash FlowHedges
Net InvestmentHedges(1)(2) Other Total
Balance at May 31, 2014 $ (11) $ 32 $ 115 $ (51) $ 85Other comprehensive gains (losses) before reclassifications(3) (20) 1,447 — 33 1,460Reclassifications to net income of previously deferred (gains) losses(4) — (259) — (40) (299)Other comprehensive income (loss) (20) 1,188 — (7) 1,161
Balance at May 31, 2015 $ (31) $ 1,220 $ 115 $ (58) $ 1,246
(1) The accumulated foreign currency translation adjustment and net investment hedge gains/losses related to an investment in a foreign subsidiary are reclassified to Net income upon sale orupon complete or substantially complete liquidation of the respective entity.
(2) Beginning and ending balances have been updated to reflect the proper classification of $20 million of deferred tax balances between Foreign Currency Translation Adjustment and NetInvestment Hedges.
(3) Net of tax benefit (expense) of $0 million, $(33) million, $0 million, $0 million and $(33) million, respectively.
(4) Net of tax (benefit) expense of $0 million, $2 million, $0 million, $0 million and $2 million, respectively.
The following table summarizes the reclassifications from Accumulated other comprehensive income to the Consolidated Statements of Income:
Amount of Gain (Loss)Reclassified from AccumulatedOther Comprehensive Income
into IncomeLocation of Gain (Loss) Reclassified from
Accumulated Other Comprehensive Incomeinto Income
Year Ended May 31,(In millions) 2016 2015Gains (losses) on foreign currency translation adjustment $ (2) $ — Other (income) expense, netTotal before tax (2) —Tax (expense) benefit — —Gain (loss) net of tax (2) —Gains (losses) on cash flow hedges:Foreign exchange forwards and options (88) (95) RevenuesForeign exchange forwards and options 586 220 Cost of salesForeign exchange forwards and options — — Total selling and administrative expenseForeign exchange forwards and options 219 136 Other (income) expense, net
Total before tax 717 261Tax (expense) benefit (7) (2)Gain (loss) net of tax 710 259Gains (losses) on other 3 40 Other (income) expense, netTotal before tax 3 40Tax (expense) benefit (2) —Gain (loss) net of tax 1 40Total net gain (loss) reclassified for the period $ 709 $ 299
Refer to Note 16 — Risk Management and Derivatives for more information on the Company’s risk management program and derivatives.
NIKE, INC. 2016 Annual Report and Notice of Annual Meeting 117
FOR
M10
-K
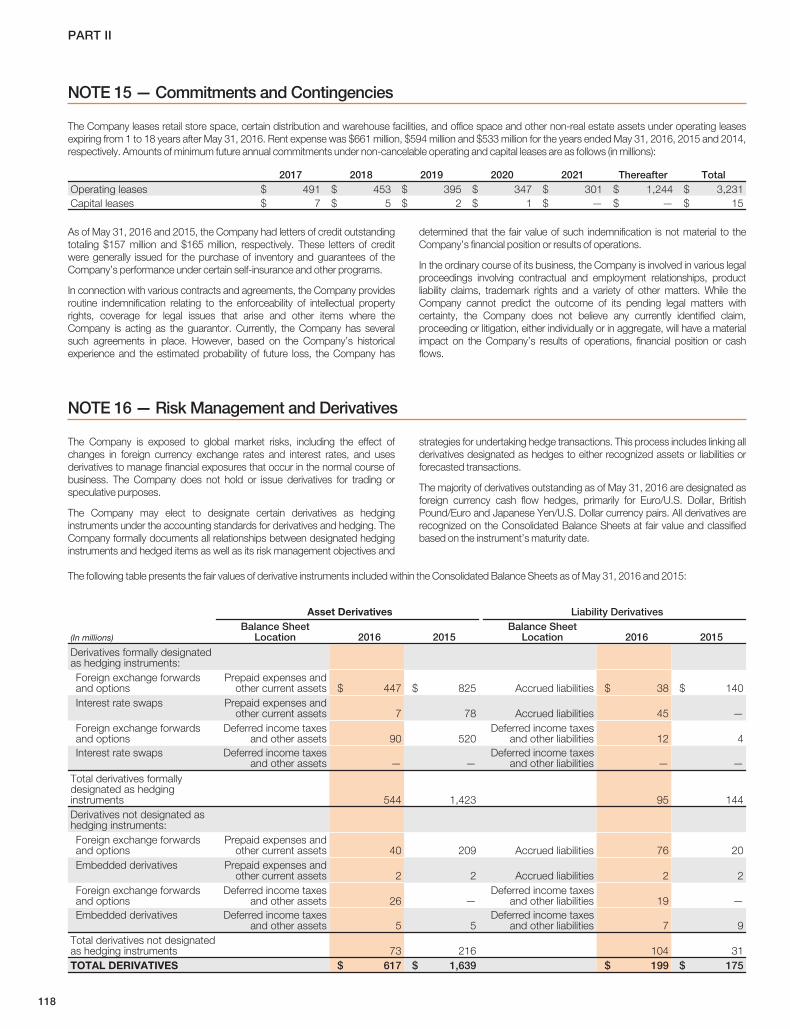
PART II
NOTE 15 — Commitments and Contingencies
The Company leases retail store space, certain distribution and warehouse facilities, and office space and other non-real estate assets under operating leasesexpiring from 1 to 18 years after May 31, 2016. Rent expense was $661 million, $594 million and $533 million for the years ended May 31, 2016, 2015 and 2014,respectively. Amounts of minimum future annual commitments under non-cancelable operating and capital leases are as follows (in millions):
2017 2018 2019 2020 2021 Thereafter TotalOperating leases $ 491 $ 453 $ 395 $ 347 $ 301 $ 1,244 $ 3,231Capital leases $ 7 $ 5 $ 2 $ 1 $ — $ — $ 15
As of May 31, 2016 and 2015, the Company had letters of credit outstandingtotaling $157 million and $165 million, respectively. These letters of creditwere generally issued for the purchase of inventory and guarantees of theCompany’s performance under certain self-insurance and other programs.
In connection with various contracts and agreements, the Company providesroutine indemnification relating to the enforceability of intellectual propertyrights, coverage for legal issues that arise and other items where theCompany is acting as the guarantor. Currently, the Company has severalsuch agreements in place. However, based on the Company’s historicalexperience and the estimated probability of future loss, the Company has
determined that the fair value of such indemnification is not material to theCompany’s financial position or results of operations.
In the ordinary course of its business, the Company is involved in various legalproceedings involving contractual and employment relationships, productliability claims, trademark rights and a variety of other matters. While theCompany cannot predict the outcome of its pending legal matters withcertainty, the Company does not believe any currently identified claim,proceeding or litigation, either individually or in aggregate, will have a materialimpact on the Company’s results of operations, financial position or cashflows.
NOTE 16 — Risk Management and Derivatives
The Company is exposed to global market risks, including the effect ofchanges in foreign currency exchange rates and interest rates, and usesderivatives to manage financial exposures that occur in the normal course ofbusiness. The Company does not hold or issue derivatives for trading orspeculative purposes.
The Company may elect to designate certain derivatives as hedginginstruments under the accounting standards for derivatives and hedging. TheCompany formally documents all relationships between designated hedginginstruments and hedged items as well as its risk management objectives and
strategies for undertaking hedge transactions. This process includes linking allderivatives designated as hedges to either recognized assets or liabilities orforecasted transactions.
The majority of derivatives outstanding as of May 31, 2016 are designated asforeign currency cash flow hedges, primarily for Euro/U.S. Dollar, BritishPound/Euro and Japanese Yen/U.S. Dollar currency pairs. All derivatives arerecognized on the Consolidated Balance Sheets at fair value and classifiedbased on the instrument’s maturity date.
The following table presents the fair values of derivative instruments included within the Consolidated Balance Sheets as of May 31, 2016 and 2015:
Asset Derivatives Liability Derivatives
(In millions)Balance Sheet
Location 2016 2015Balance Sheet
Location 2016 2015
Derivatives formally designatedas hedging instruments:Foreign exchange forwardsand options
Prepaid expenses andother current assets $ 447 $ 825 Accrued liabilities $ 38 $ 140
Interest rate swaps Prepaid expenses andother current assets 7 78 Accrued liabilities 45 —
Foreign exchange forwardsand options
Deferred income taxesand other assets 90 520
Deferred income taxesand other liabilities 12 4
Interest rate swaps Deferred income taxesand other assets — —
Deferred income taxesand other liabilities — —
Total derivatives formallydesignated as hedginginstruments 544 1,423 95 144Derivatives not designated ashedging instruments:Foreign exchange forwardsand options
Prepaid expenses andother current assets 40 209 Accrued liabilities 76 20
Embedded derivatives Prepaid expenses andother current assets 2 2 Accrued liabilities 2 2
Foreign exchange forwardsand options
Deferred income taxesand other assets 26 —
Deferred income taxesand other liabilities 19 —
Embedded derivatives Deferred income taxesand other assets 5 5
Deferred income taxesand other liabilities 7 9
Total derivatives not designatedas hedging instruments 73 216 104 31TOTAL DERIVATIVES $ 617 $ 1,639 $ 199 $ 175
118
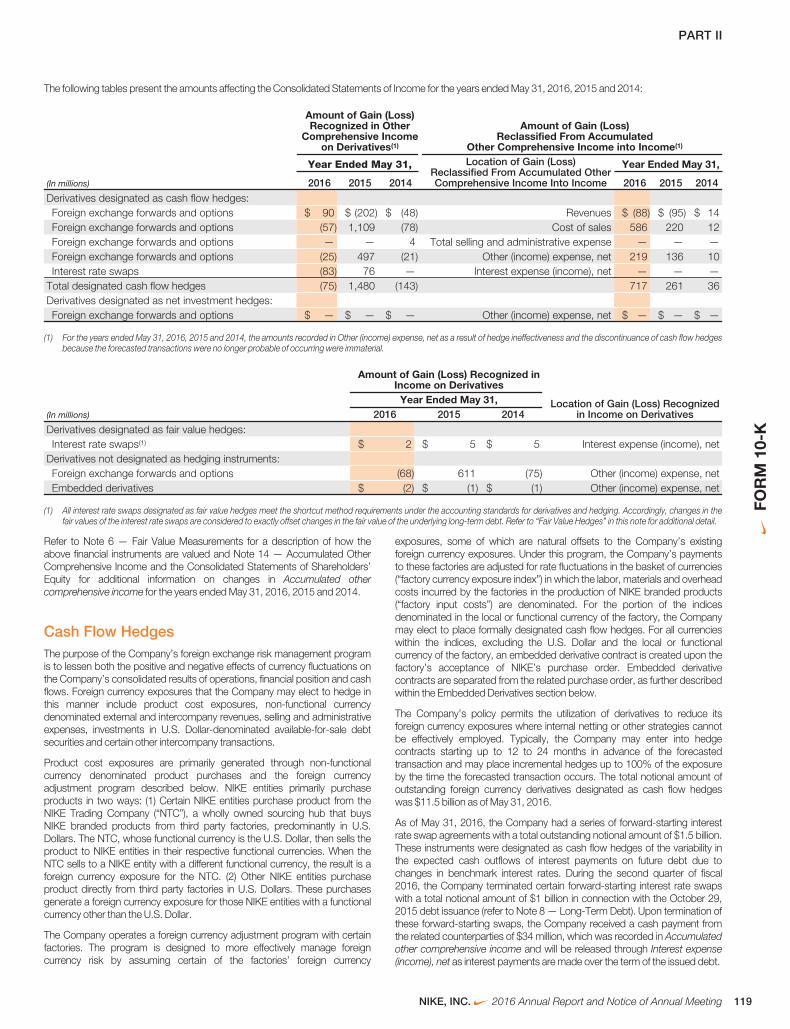
PART II
The following tables present the amounts affecting the Consolidated Statements of Income for the years ended May 31, 2016, 2015 and 2014:
(In millions)
Amount of Gain (Loss)Recognized in Other
Comprehensive Incomeon Derivatives(1)
Amount of Gain (Loss)Reclassified From Accumulated
Other Comprehensive Income into Income(1)
Year Ended May 31, Location of Gain (Loss)Reclassified From Accumulated OtherComprehensive Income Into Income
Year Ended May 31,
2016 2015 2014 2016 2015 2014
Derivatives designated as cash flow hedges:Foreign exchange forwards and options $ 90 $ (202) $ (48) Revenues $ (88) $ (95) $ 14Foreign exchange forwards and options (57) 1,109 (78) Cost of sales 586 220 12Foreign exchange forwards and options — — 4 Total selling and administrative expense — — —Foreign exchange forwards and options (25) 497 (21) Other (income) expense, net 219 136 10Interest rate swaps (83) 76 — Interest expense (income), net — — —
Total designated cash flow hedges (75) 1,480 (143) 717 261 36Derivatives designated as net investment hedges:Foreign exchange forwards and options $ — $ — $ — Other (income) expense, net $ — $ — $ —
(1) For the years ended May 31, 2016, 2015 and 2014, the amounts recorded in Other (income) expense, net as a result of hedge ineffectiveness and the discontinuance of cash flow hedgesbecause the forecasted transactions were no longer probable of occurring were immaterial.
Amount of Gain (Loss) Recognized inIncome on Derivatives
Location of Gain (Loss) Recognizedin Income on Derivatives
Year Ended May 31,(In millions) 2016 2015 2014
Derivatives designated as fair value hedges:Interest rate swaps(1) $ 2 $ 5 $ 5 Interest expense (income), net
Derivatives not designated as hedging instruments:Foreign exchange forwards and options (68) 611 (75) Other (income) expense, netEmbedded derivatives $ (2) $ (1) $ (1) Other (income) expense, net
(1) All interest rate swaps designated as fair value hedges meet the shortcut method requirements under the accounting standards for derivatives and hedging. Accordingly, changes in thefair values of the interest rate swaps are considered to exactly offset changes in the fair value of the underlying long-term debt. Refer to “Fair Value Hedges” in this note for additional detail.
Refer to Note 6 — Fair Value Measurements for a description of how theabove financial instruments are valued and Note 14 — Accumulated OtherComprehensive Income and the Consolidated Statements of Shareholders’Equity for additional information on changes in Accumulated othercomprehensive income for the years ended May 31, 2016, 2015 and 2014.
Cash Flow HedgesThe purpose of the Company’s foreign exchange risk management programis to lessen both the positive and negative effects of currency fluctuations onthe Company’s consolidated results of operations, financial position and cashflows. Foreign currency exposures that the Company may elect to hedge inthis manner include product cost exposures, non-functional currencydenominated external and intercompany revenues, selling and administrativeexpenses, investments in U.S. Dollar-denominated available-for-sale debtsecurities and certain other intercompany transactions.
Product cost exposures are primarily generated through non-functionalcurrency denominated product purchases and the foreign currencyadjustment program described below. NIKE entities primarily purchaseproducts in two ways: (1) Certain NIKE entities purchase product from theNIKE Trading Company (“NTC”), a wholly owned sourcing hub that buysNIKE branded products from third party factories, predominantly in U.S.Dollars. The NTC, whose functional currency is the U.S. Dollar, then sells theproduct to NIKE entities in their respective functional currencies. When theNTC sells to a NIKE entity with a different functional currency, the result is aforeign currency exposure for the NTC. (2) Other NIKE entities purchaseproduct directly from third party factories in U.S. Dollars. These purchasesgenerate a foreign currency exposure for those NIKE entities with a functionalcurrency other than the U.S. Dollar.
The Company operates a foreign currency adjustment program with certainfactories. The program is designed to more effectively manage foreigncurrency risk by assuming certain of the factories’ foreign currency
exposures, some of which are natural offsets to the Company’s existingforeign currency exposures. Under this program, the Company’s paymentsto these factories are adjusted for rate fluctuations in the basket of currencies(“factory currency exposure index”) in which the labor, materials and overheadcosts incurred by the factories in the production of NIKE branded products(“factory input costs”) are denominated. For the portion of the indicesdenominated in the local or functional currency of the factory, the Companymay elect to place formally designated cash flow hedges. For all currencieswithin the indices, excluding the U.S. Dollar and the local or functionalcurrency of the factory, an embedded derivative contract is created upon thefactory’s acceptance of NIKE’s purchase order. Embedded derivativecontracts are separated from the related purchase order, as further describedwithin the Embedded Derivatives section below.
The Company’s policy permits the utilization of derivatives to reduce itsforeign currency exposures where internal netting or other strategies cannotbe effectively employed. Typically, the Company may enter into hedgecontracts starting up to 12 to 24 months in advance of the forecastedtransaction and may place incremental hedges up to 100% of the exposureby the time the forecasted transaction occurs. The total notional amount ofoutstanding foreign currency derivatives designated as cash flow hedgeswas $11.5 billion as of May 31, 2016.
As of May 31, 2016, the Company had a series of forward-starting interestrate swap agreements with a total outstanding notional amount of $1.5 billion.These instruments were designated as cash flow hedges of the variability inthe expected cash outflows of interest payments on future debt due tochanges in benchmark interest rates. During the second quarter of fiscal2016, the Company terminated certain forward-starting interest rate swapswith a total notional amount of $1 billion in connection with the October 29,2015 debt issuance (refer to Note 8 — Long-Term Debt). Upon termination ofthese forward-starting swaps, the Company received a cash payment fromthe related counterparties of $34 million, which was recorded in Accumulatedother comprehensive income and will be released through Interest expense(income), net as interest payments are made over the term of the issued debt.
NIKE, INC. 2016 Annual Report and Notice of Annual Meeting 119
FOR
M10
-K
PART II
All changes in fair value of derivatives designated as cash flow hedges,excluding any ineffective portion, are recorded in Accumulated othercomprehensive income until Net income is affected by the variability of cashflows of the hedged transaction. In most cases, amounts recordedin Accumulated other comprehensive income will be released to Netincome in periods following the maturity of the related derivative, rather than atmaturity. Effective hedge results are classified within the ConsolidatedStatements of Income in the same manner as the underlying exposure. Theresults of hedges of non-functional currency denominated revenues andproduct cost exposures, excluding embedded derivatives, are recorded inRevenues or Cost of sales when the underlying hedged transaction affectsconsolidated Net income. Results of hedges of selling and administrativeexpense are recorded together with those costs when the related expense isrecorded. Amounts recorded in Accumulated other comprehensiveincome related to forward-starting interest rate swaps will be releasedthrough Interest expense (income), net as interest payments are made overthe term of the issued debt. Results of hedges of anticipated purchases andsales of U.S. Dollar-denominated available-for-sale securities are recorded inOther (income) expense, net when the securities are sold. Results of hedgesof certain anticipated intercompany transactions are recorded in Other(income) expense, net when the transaction occurs. The Company classifiesthe cash flows at settlement from these designated cash flow hedgederivatives in the same category as the cash flows from the related hedgeditems, primarily within the Cash provided by operations component of theConsolidated Statements of Cash Flows.
Premiums paid or received on options are initially recorded as deferredcharges or deferred credits, respectively. The Company assesses theeffectiveness of options based on the total cash flows method and recordstotal changes in the options’ fair value to Accumulated other comprehensiveincome to the degree they are effective.
The Company formally assesses, both at a hedge’s inception and on anongoing basis, whether the derivatives that are used in the hedgingtransaction have been highly effective in offsetting changes in the cash flowsof hedged items and whether those derivatives may be expected to remainhighly effective in future periods. Effectiveness for cash flow hedges isassessed based on changes in forward rates. Ineffectiveness was 0 billion forthe years ended May 31, 2016, 2015 and 2014.
The Company discontinues hedge accounting prospectively when: (1) itdetermines that the derivative is no longer highly effective in offsettingchanges in the cash flows of a hedged item (including hedged items such asfirm commitments or forecasted transactions); (2) the derivative expires or issold, terminated or exercised; (3) it is no longer probable that the forecastedtransaction will occur; or (4) management determines that designating thederivative as a hedging instrument is no longer appropriate.
When the Company discontinues hedge accounting because it is no longerprobable that the forecasted transaction will occur in the originally expectedperiod, but is expected to occur within an additional two-month period of timethereafter, the gain or loss on the derivative remains in Accumulated othercomprehensive income and is reclassified to Net income when the forecastedtransaction affects consolidated Net income. However, if it is probable that aforecasted transaction will not occur by the end of the originally specified timeperiod or within an additional two-month period of time thereafter, the gainsand losses that were in Accumulated other comprehensive income will berecognized immediately in Other (income) expense, net. In all situations inwhich hedge accounting is discontinued and the derivative remainsoutstanding, the Company will carry the derivative at its fair value on theConsolidated Balance Sheets, recognizing future changes in the fair value inOther (income) expense, net. For the years ended May 31, 2016, 2015 and2014, the amounts recorded in Other (income) expense, net as a result of thediscontinuance of cash flow hedging because the forecasted transaction wasno longer probable of occurring were immaterial.
As of May 31, 2016, $460 million of deferred net gains (net of tax) on bothoutstanding and matured derivatives in Accumulated other comprehensiveincome are expected to be reclassified to Net income during the next 12months concurrent with the underlying hedged transactions also beingrecorded in Net income. Actual amounts ultimately reclassified to Net incomeare dependent on the exchange rates in effect when derivative contracts that
are currently outstanding mature. As of May 31, 2016, the maximum termover which the Company is hedging exposures to the variability of cash flowsfor its forecasted transactions was 24 months.
Fair Value HedgesThe Company is also exposed to the risk of changes in the fair value of certainfixed-rate debt attributable to changes in interest rates. Derivatives used bythe Company to hedge this risk are receive-fixed, pay-variable interest rateswaps. All interest rate swaps designated as fair value hedges of the relatedlong-term debt meet the shortcut method requirements under the accountingstandards for derivatives and hedging. Accordingly, changes in the fair valuesof the interest rate swaps are considered to exactly offset changes in the fairvalue of the underlying long-term debt. The cash flows associated with theCompany’s fair value hedges are periodic interest payments while the swapsare outstanding, which are reflected within the Cash provided by operationscomponent of the Consolidated Statements of Cash Flows. The Companyrecorded no ineffectiveness from its interest rate swaps designated as fairvalue hedges for the years ended May 31, 2016, 2015 or 2014. On October15, 2015, the Company repaid the long-term debt which had previously beenhedged with these interest rate swaps. Accordingly, as of May 31, 2016, theCompany had no interest rate swaps designated as fair value hedges.
Net Investment HedgesThe Company has, in the past, hedged and may, in the future, hedge the riskof variability in foreign-currency-denominated net investments in wholly-owned international operations. All changes in fair value of the derivativesdesignated as net investment hedges, except ineffective portions, arereported in Accumulated other comprehensive income along with the foreigncurrency translation adjustments on those investments. The Companyclassifies the cash flows at settlement of its net investment hedges within theCash used by investing activities component of the Consolidated Statementsof Cash Flows. The Company assesses hedge effectiveness based onchanges in forward rates. The Company recorded no ineffectiveness from netinvestment hedges for the years ended May 31, 2016, 2015 or 2014. TheCompany had no outstanding net investment hedges as of May 31, 2016.
Undesignated Derivative InstrumentsThe Company may elect to enter into foreign exchange forwards to mitigatethe change in fair value of specific assets and liabilities on the balance sheetand/or the embedded derivative contracts. These forwards are notdesignated as hedging instruments under the accounting standards forderivatives and hedging. Accordingly, these undesignated instruments arerecorded at fair value as a derivative asset or liability on the ConsolidatedBalance Sheets with their corresponding change in fair value recognizedin Other (income) expense, net, together with the re-measurement gain or lossfrom the hedged balance sheet position or embedded derivative contract.The Company classifies the cash flows at settlement from undesignatedinstruments in the same category as the cash flows from the related hedgeditems, primarily within the Cash provided by operations component of theConsolidated Statements of Cash Flows. The total notional amount ofoutstanding undesignated derivative instruments was $7.1 billion asofMay 31, 2016.
Embedded DerivativesAs part of the foreign currency adjustment program described above, anembedded derivative contract is created upon the factory’s acceptance ofNIKE’s purchase order for currencies within the factory currency exposureindices that are neither the U.S. Dollar nor the local or functional currency ofthe factory. Embedded derivative contracts are treated as foreign currencyforward contracts that are bifurcated from the related purchase order andrecorded at fair value as a derivative asset or liability on the ConsolidatedBalance Sheets with their corresponding change in fair value recognizedin Other (income) expense, net, from the date a purchase order is accepted
120
PART II
by a factory through the date the purchase price is no longer subject to foreigncurrency fluctuations.
In addition, the Company has entered into certain other contractualagreements which have payments that are indexed to currencies that are notthe functional currency of either substantial party to the contracts. Thesepayment terms expose NIKE to variability in foreign exchange rates andcreate embedded derivative contracts that must be bifurcated from therelated contract and recorded at fair value as derivative assets or liabilities onthe Consolidated Balance Sheets with their corresponding changes in fairvalue recognized in Other (income) expense, net until each payment is settled.
At May 31, 2016, the notional amount of all embedded derivativesoutstanding was approximately $282 million.
Credit RiskThe Company is exposed to credit-related losses in the event ofnonperformance by counterparties to hedging instruments. Thecounterparties to all derivative transactions are major financial institutions withinvestment grade credit ratings. However, this does not eliminate theCompany’s exposure to credit risk with these institutions. This credit risk is
limited to the unrealized gains in such contracts should any of thesecounterparties fail to perform as contracted. To manage this risk, theCompany has established strict counterparty credit guidelines that arecontinually monitored.
The Company’s derivative contracts contain credit risk related contingentfeatures designed to protect against significant deterioration in counterparties’creditworthiness and their ultimate ability to settle outstanding derivativecontracts in the normal course of business. The Company’s bilateral creditrelated contingent features generally require the owing entity, either theCompany or the derivative counterparty, to post collateral for the portion ofthe fair value in excess of $50 million should the fair value of outstandingderivatives per counterparty be greater than $50 million. Additionally, a certainlevel of decline in credit rating of either the Company or the counterparty couldalso trigger collateral requirements. As of May 31, 2016, the Company was incompliance with all credit risk-related contingent features and had derivativeinstruments with credit risk-related contingent features in a net liability positionof $3 million. Accordingly, the Company was not required to post anycollateral as a result of these contingent features. Further, as of May 31, 2016,the Company had received $105 million of cash collateral from variouscounterparties to its derivative contracts (refer to Note 6 — Fair ValueMeasurements). Given the considerations described above, the Companyconsiders the impact of the risk of counterparty default to be immaterial.
NOTE 17 — Operating Segments and Related Information
The Company’s operating segments are evidence of the structure of theCompany’s internal organization. The NIKE Brand segments are defined bygeographic regions for operations participating in NIKE Brand sales activity.
Each NIKE Brand geographic segment operates predominantly in oneindustry: the design, development, marketing and selling of athletic footwear,apparel and equipment. The Company’s reportable operating segments forthe NIKE Brand are: North America, Western Europe, Central & EasternEurope, Greater China, Japan and Emerging Markets, and include results forthe NIKE, Jordan and Hurley brands. The Company’s NIKE Brand Direct toConsumer operations are managed within each geographic operatingsegment. Converse is also a reportable segment for the Company, andoperates in one industry: the design, marketing, licensing and selling of casualsneakers, apparel and accessories.
Global Brand Divisions is included within the NIKE Brand for presentationpurposes to align with the way management views the Company. GlobalBrand Divisions primarily represent NIKE Brand licensing businesses that arenot part of a geographic operating segment, and demand creation, operatingoverhead and product creation and design expenses that are centrallymanaged for the NIKE Brand.
Corporate consists largely of unallocated general and administrativeexpenses, including expenses associated with centrally manageddepartments; depreciation and amortization related to the Company’sheadquarters; unallocated insurance, benefit and compensation programs,including stock-based compensation; and certain foreign currency gains andlosses, including certain hedge gains and losses.
The primary financial measure used by the Company to evaluate performanceof individual operating segments is earnings before interest and taxes(commonly referred to as “EBIT”), which represents Net income beforeInterest expense (income), net and Income tax expense in the ConsolidatedStatements of Income.
As part of the Company’s centrally managed foreign exchange riskmanagement program, standard foreign currency rates are assigned twiceper year to each NIKE Brand entity in the Company’s geographic operatingsegments and to Converse. These rates are set approximately nine andtwelve months in advance of the future selling seasons to which they relate(specifically, for each currency, one standard rate applies to the fall andholiday selling seasons and one standard rate applies to the spring andsummer selling seasons) based on average market spot rates in the calendarmonth preceding the date they are established. Inventories and Cost of salesfor geographic operating segments and Converse reflect use of thesestandard rates to record non-functional currency product purchases in theentity’s functional currency. Differences between assigned standard foreigncurrency rates and actual market rates are included in Corporate, togetherwith foreign currency hedge gains and losses generated from the Company’scentrally managed foreign exchange risk management program and otherconversion gains and losses.
Accounts receivable, net, Inventories and Property, plant and equipment, netfor operating segments are regularly reviewed by management and aretherefore provided below. Additions to long-lived assets as presented in thefollowing table represent capital expenditures.
Certain prior year amounts have been reclassified to conform to fiscal 2016presentation.
NIKE, INC. 2016 Annual Report and Notice of Annual Meeting 121
FOR
M10
-K
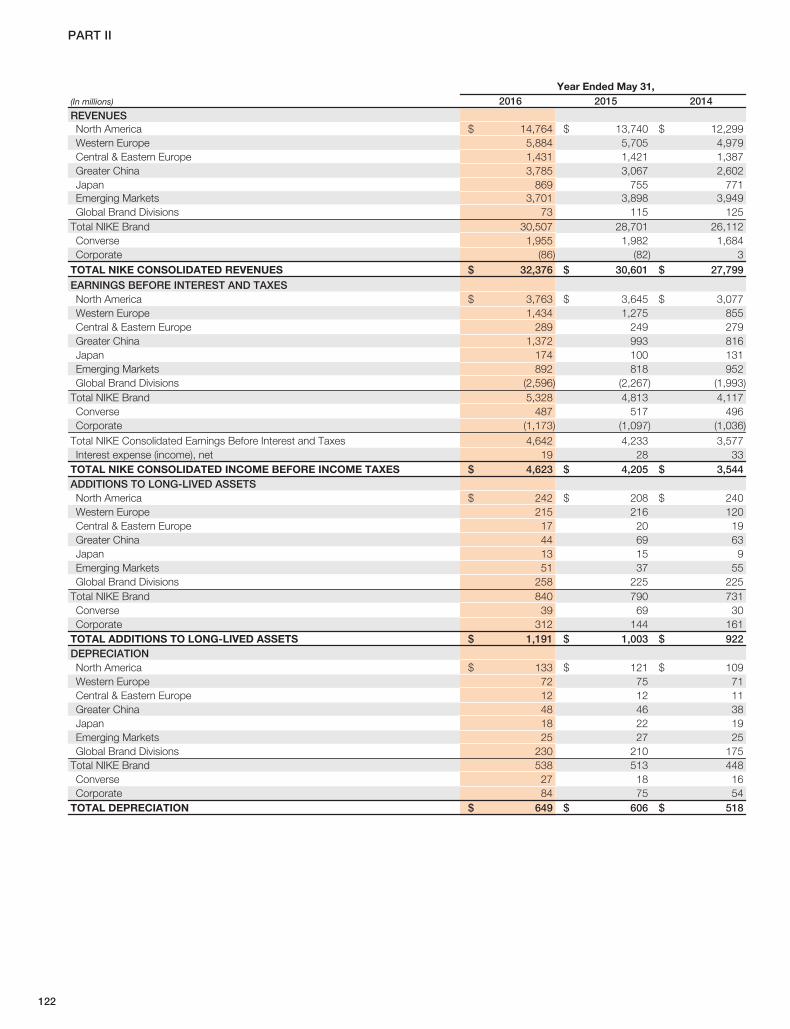
PART II
Year Ended May 31,(In millions) 2016 2015 2014REVENUESNorth America $ 14,764 $ 13,740 $ 12,299Western Europe 5,884 5,705 4,979Central & Eastern Europe 1,431 1,421 1,387Greater China 3,785 3,067 2,602Japan 869 755 771Emerging Markets 3,701 3,898 3,949Global Brand Divisions 73 115 125
Total NIKE Brand 30,507 28,701 26,112Converse 1,955 1,982 1,684Corporate (86) (82) 3
TOTAL NIKE CONSOLIDATED REVENUES $ 32,376 $ 30,601 $ 27,799EARNINGS BEFORE INTEREST AND TAXESNorth America $ 3,763 $ 3,645 $ 3,077Western Europe 1,434 1,275 855Central & Eastern Europe 289 249 279Greater China 1,372 993 816Japan 174 100 131Emerging Markets 892 818 952Global Brand Divisions (2,596) (2,267) (1,993)
Total NIKE Brand 5,328 4,813 4,117Converse 487 517 496Corporate (1,173) (1,097) (1,036)
Total NIKE Consolidated Earnings Before Interest and Taxes 4,642 4,233 3,577Interest expense (income), net 19 28 33
TOTAL NIKE CONSOLIDATED INCOME BEFORE INCOME TAXES $ 4,623 $ 4,205 $ 3,544ADDITIONS TO LONG-LIVED ASSETSNorth America $ 242 $ 208 $ 240Western Europe 215 216 120Central & Eastern Europe 17 20 19Greater China 44 69 63Japan 13 15 9Emerging Markets 51 37 55Global Brand Divisions 258 225 225
Total NIKE Brand 840 790 731Converse 39 69 30Corporate 312 144 161
TOTAL ADDITIONS TO LONG-LIVED ASSETS $ 1,191 $ 1,003 $ 922DEPRECIATIONNorth America $ 133 $ 121 $ 109Western Europe 72 75 71Central & Eastern Europe 12 12 11Greater China 48 46 38Japan 18 22 19Emerging Markets 25 27 25Global Brand Divisions 230 210 175
Total NIKE Brand 538 513 448Converse 27 18 16Corporate 84 75 54
TOTAL DEPRECIATION $ 649 $ 606 $ 518
122
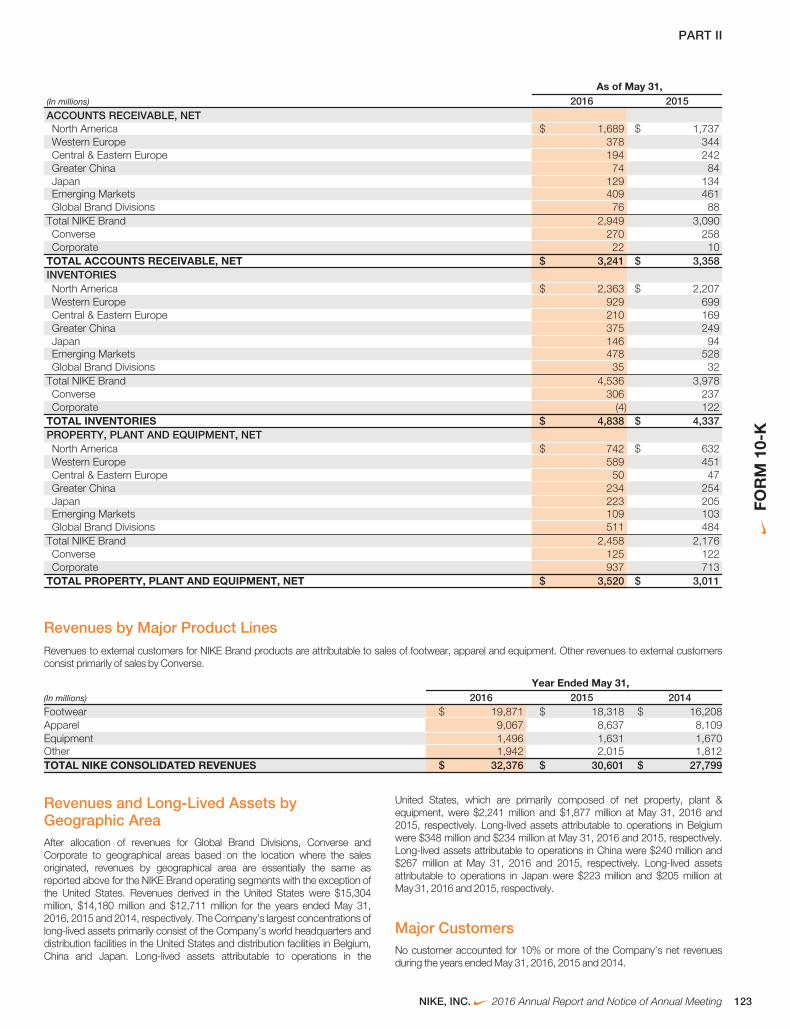
PART II
As of May 31,(In millions) 2016 2015ACCOUNTS RECEIVABLE, NETNorth America $ 1,689 $ 1,737Western Europe 378 344Central & Eastern Europe 194 242Greater China 74 84Japan 129 134Emerging Markets 409 461Global Brand Divisions 76 88
Total NIKE Brand 2,949 3,090Converse 270 258Corporate 22 10
TOTAL ACCOUNTS RECEIVABLE, NET $ 3,241 $ 3,358INVENTORIESNorth America $ 2,363 $ 2,207Western Europe 929 699Central & Eastern Europe 210 169Greater China 375 249Japan 146 94Emerging Markets 478 528Global Brand Divisions 35 32
Total NIKE Brand 4,536 3,978Converse 306 237Corporate (4) 122
TOTAL INVENTORIES $ 4,838 $ 4,337PROPERTY, PLANT AND EQUIPMENT, NETNorth America $ 742 $ 632Western Europe 589 451Central & Eastern Europe 50 47Greater China 234 254Japan 223 205Emerging Markets 109 103Global Brand Divisions 511 484
Total NIKE Brand 2,458 2,176Converse 125 122Corporate 937 713
TOTAL PROPERTY, PLANT AND EQUIPMENT, NET $ 3,520 $ 3,011
Revenues by Major Product LinesRevenues to external customers for NIKE Brand products are attributable to sales of footwear, apparel and equipment. Other revenues to external customersconsist primarily of sales by Converse.
Year Ended May 31,(In millions) 2016 2015 2014Footwear $ 19,871 $ 18,318 $ 16,208Apparel 9,067 8,637 8,109Equipment 1,496 1,631 1,670Other 1,942 2,015 1,812TOTAL NIKE CONSOLIDATED REVENUES $ 32,376 $ 30,601 $ 27,799
Revenues and Long-Lived Assets byGeographic AreaAfter allocation of revenues for Global Brand Divisions, Converse andCorporate to geographical areas based on the location where the salesoriginated, revenues by geographical area are essentially the same asreported above for the NIKE Brand operating segments with the exception ofthe United States. Revenues derived in the United States were $15,304million, $14,180 million and $12,711 million for the years ended May 31,2016, 2015 and 2014, respectively. The Company’s largest concentrations oflong-lived assets primarily consist of the Company’s world headquarters anddistribution facilities in the United States and distribution facilities in Belgium,China and Japan. Long-lived assets attributable to operations in the
United States, which are primarily composed of net property, plant &equipment, were $2,241 million and $1,877 million at May 31, 2016 and2015, respectively. Long-lived assets attributable to operations in Belgiumwere $348 million and $234 million at May 31, 2016 and 2015, respectively.Long-lived assets attributable to operations in China were $240 million and$267 million at May 31, 2016 and 2015, respectively. Long-lived assetsattributable to operations in Japan were $223 million and $205 million atMay 31, 2016 and 2015, respectively.
Major CustomersNo customer accounted for 10% or more of the Company’s net revenuesduring the years ended May 31, 2016, 2015 and 2014.
NIKE, INC. 2016 Annual Report and Notice of Annual Meeting 123
FOR
M10
-K
PART II
ITEM 9. Changes in and Disagreements withAccountants on Accounting and FinancialDisclosure
There has been no change of accountants nor any disagreements with accountants on any matter of accounting principles or practices or financial statementdisclosure required to be reported under this Item.
ITEM 9A. Controls and ProceduresWe maintain disclosure controls and procedures that are designed to ensureinformation required to be disclosed in our Exchange Act reports is recorded,processed, summarized and reported within the time periods specified in theSEC’s rules and forms and that such information is accumulated andcommunicated to our management, including our Chief Executive Officer andChief Financial Officer, as appropriate, to allow for timely decisions regardingrequired disclosure. In designing and evaluating the disclosure controls andprocedures, management recognizes that any controls and procedures, nomatter how well designed and operated, can provide only reasonableassurance of achieving the desired control objectives, and management isrequired to apply its judgment in evaluating the cost-benefit relationship ofpossible controls and procedures.
We carry out a variety of ongoing procedures, under the supervision and withthe participation of our management, including our Chief Executive Officerand Chief Financial Officer, to evaluate the effectiveness of the design andoperation of our disclosure controls and procedures. Based on the foregoing,our Chief Executive Officer and Chief Financial Officer concluded that our
disclosure controls and procedures were effective at the reasonableassurance level as of May 31, 2016.
“Management’s Annual Report on Internal Control Over Financial Reporting”is included in Item 8 of this Report.
We have commenced several transformation initiatives to centralize andsimplify our business processes and systems. These are long-term initiatives,which we believe will enhance our internal control over financial reporting dueto increased automation and further integration of related processes. We willcontinue to monitor our internal control over financial reporting foreffectiveness throughout the transformation.
There have not been any other changes in our internal control over financialreporting during our most recent fiscal quarter that have materially affected, orare reasonably likely to materially affect, our internal control over financialreporting.
ITEM 9B. Other InformationNo disclosure is required under this Item.
124
PART III
PART III
ITEM 10. Directors, Executive Officers and CorporateGovernance
The information required by Item 401 of Regulation S-K regarding directors isincluded under “Election of Directors” in the definitive Proxy Statement for our2016 Annual Meeting of Shareholders and is incorporated herein byreference. The information required by Item 401 of Regulation S-K regardingexecutive officers is included under “Executive Officers of the Registrant” inItem 1 of this Report. The information required by Item 405 of Regulation S-Kis included under “Election of Directors — Section 16(a) Beneficial OwnershipReporting Compliance” in the definitive Proxy Statement for our 2016 AnnualMeeting of Shareholders and is incorporated herein by reference. The
information required by Item 406 of Regulation S-K is included under“Corporate Governance — Code of Business Conduct and Ethics” in thedefinitive Proxy Statement for our 2016 Annual Meeting of Shareholders andis incorporated herein by reference. The information required byItems 407(d)(4) and (d)(5) of Regulation S-K regarding the Audit Committee ofthe Board of Directors is included under “Corporate Governance — BoardCommittees” in the definitive Proxy Statement for our 2016 Annual Meeting ofShareholders and is incorporated herein by reference.
ITEM 11. Executive CompensationThe information required by Items 402, 407(e)(4) and 407(e)(5) of RegulationS-K regarding executive compensation is included under “Election ofDirectors — Director Compensation for Fiscal 2016,” “CompensationDiscussion and Analysis,” “Executive Compensation,” “Election of Directors
— Compensation Committee Interlocks and Insider Participation,” and“Compensation Committee Report” in the definitive Proxy Statement for our2016 Annual Meeting of Shareholders and is incorporated herein byreference.
ITEM 12. Security Ownership of Certain BeneficialOwners and Management and RelatedStockholder Matters
The information required by Item 201(d) of Regulation S-K is included under“Executive Compensation — Equity Compensation Plans” in the definitiveProxy Statement for our 2016 Annual Meeting of Shareholders and isincorporated herein by reference. The information required by Item 403 of
Regulation S-K is included under “Election of Directors — Stock Holdings ofCertain Owners and Management” in the definitive Proxy Statement for our2016 Annual Meeting of Shareholders and is incorporated herein byreference.
ITEM 13. Certain Relationships and RelatedTransactions and Director Independence
The information required by Items 404 and 407(a) of Regulation S-K is included under “Election of Directors — Transactions with Related Persons” and“Corporate Governance — Director Independence” in the definitive Proxy Statement for our 2016 Annual Meeting of Shareholders and is incorporated herein byreference.
ITEM 14. Principal Accountant Fees and ServicesThe information required by Item 9(e) of Schedule 14A is included under “Ratification Of Independent Registered Public Accounting Firm” in the definitive ProxyStatement for our 2016 Annual Meeting of Shareholders and is incorporated herein by reference.
NIKE, INC. 2016 Annual Report and Notice of Annual Meeting 125
FOR
M10
-K
PART IV
PART IV
ITEM 15. Exhibits and Financial Statement Schedules
(a) The following documents are filed as part of this report:
Form 10-KPage No.
1. Financial Statements:
Report of Independent Registered Public Accounting Firm 98
Consolidated Statements of Income for each of the three years ended May 31, 2016, May 31, 2015and May 31, 2014
99
Consolidated Statements of Comprehensive Income for each of the three years ended May 31, 2016,May 31, 2015 and May 31, 2014
100
Consolidated Balance Sheets at May 31, 2016 and May 31, 2015 101
Consolidated Statements of Cash Flows for each of the three years ended May 31, 2016, May 31,2015 and May 31, 2014
102
Consolidated Statements of Shareholders’ Equity for each of the three years ended May 31, 2016,May 31, 2015 and May 31, 2014
103
Notes to Consolidated Financial Statements 104
2. Financial Statement Schedule:
II — Valuation and Qualifying Accounts 129
All other schedules are omitted because they are not applicable or the required information isshown in the financial statements or notes thereto.
126
PART IV
3. Exhibits:
3.1 Restated Articles of Incorporation, as amended (incorporated by reference to Exhibit 3.1 to the Company’s Quarterly Report onForm 10-Q for the fiscal quarter ended November 30, 2015).
3.2 Third Restated Bylaws, as amended (incorporated by reference to Exhibit 3.2 to the Company’s Current Report on Form 8-Kfiled June 21, 2013).
4.1 Restated Articles of Incorporation, as amended (see Exhibit 3.1).4.2 Third Restated Bylaws, as amended (see Exhibit 3.2).4.3 Indenture dated as of April 26, 2013, by and between NIKE, Inc. and Deutsche Bank Trust Company Americas, as trustee
(incorporated by reference to Exhibit 4.1 to the Company’s Form 8-Q filed April 26, 2013).4.4 Second Supplemental Indenture, dated as of October 29, 2015, by and between NIKE, Inc. and Deutsche Bank Trust Company
Americas, as trustee, including the form of 3.875% Notes due 2045 (incorporated by reference to Exhibit 5.2 to the Company’sForm 8-Q filed October 29, 2015).
10.1 Form of Non-Statutory Stock Option Agreement for options granted to non-employee directors prior to May 31, 2010 under the1990 Stock Incentive Plan (incorporated by reference to Exhibit 10.3 to the Company’s Current Report on Form 8-K filedJune 21, 2005).*
10.2 Form of Non-Statutory Stock Option Agreement for options granted to non-employee directors after May 31, 2010 under the1990 Stock Incentive Plan (incorporated by reference to Exhibit 10.2 to the Company’s Annual Report on Form 10-K for thefiscal year ended May 31, 2010).*
10.3 Form of Non-Statutory Stock Option Agreement for options granted to executives prior to May 31, 2010 under the 1990 StockIncentive Plan (incorporated by reference to Exhibit 10.1 to the Company’s Annual Report on Form 10-K for the fiscal yearended May 31, 2009).*
10.4 Form of Restricted Stock Agreement for non-employee directors under the 1990 Stock Incentive Plan (incorporated by referenceto Exhibit 10.4 to the Company’s Annual Report on Form 10-K for the fiscal year ended May 31, 2014).*
10.5 Form of Non-Statutory Stock Option Agreement for options granted to executives after May 31, 2010 under the Stock IncentivePlan (incorporated by reference to Exhibit 10.5 to the Company’s Annual Report on Form 10-K for the fiscal year ended May 31,2015).*
10.6 Form of Indemnity Agreement entered into between the Company and each of its officers and directors (incorporated byreference to Exhibit 10.2 to the Company’s Annual Report on Form 10-K for the fiscal year ended May 31, 2008).*
10.7 NIKE, Inc. 1990 Stock Incentive Plan (incorporated by reference to Exhibit 10.7 to the Company’s Annual Report on Form 10-Kfor the fiscal year ended May 31, 2014).*
10.8 NIKE, Inc. Executive Performance Sharing Plan (incorporated by reference to Exhibit 10.7 to the Company’s Annual Report onForm 10-K for the fiscal year ended May 31, 2012).*
10.9 NIKE, Inc. Long-Term Incentive Plan (incorporated by reference to Exhibit 10.9 to the Company’s Annual Report on Form 10-Kfor the fiscal year ended May 31, 2015).*
10.10 NIKE, Inc. Deferred Compensation Plan (Amended and Restated effective April 1, 2013) (incorporated by reference toExhibit 10.9 to the Company’s Annual Report on Form 10-K for the fiscal year ended May 31, 2013).*
10.11 NIKE, Inc. Deferred Compensation Plan (Amended and Restated effective June 1, 2004) (applicable to amounts deferred beforeJanuary 1, 2005) (incorporated by reference to Exhibit 10.6 to the Company’s Annual Report on Form 10-K for the fiscal yearended May 31, 2004).*
10.12 Amendment No. 1 effective January 1, 2008 to the NIKE, Inc. Deferred Compensation Plan (June 1, 2004 Restatement)(incorporated by reference to Exhibit 10.9 to the Company’s Annual Report on Form 10-K for the fiscal year ended May 31,2009).*
10.13 NIKE, Inc. Foreign Subsidiary Employee Stock Purchase Plan (incorporated by reference to Exhibit 10.1 to the Company’sQuarterly Report on Form 10-Q for the fiscal quarter ended November 30, 2008).*
10.14 Amended and Restated Covenant Not To Compete and Non-Disclosure Agreement between NIKE, Inc. and Mark G. Parkerdated July 24, 2008 (incorporated by reference to Exhibit 10.1 to the Company’s Current Report on Form 8-K filed July 24,2008).*
10.15 Form of Restricted Stock Agreement under the Stock Incentive Plan for awards after May 31, 2010 (incorporated by reference toExhibit 10.15 to the Company’s Annual Report on Form 10-K for the fiscal year ended May 31, 2015).*
10.16 Form of Restricted Stock Unit Agreement under the Stock Incentive Plan (incorporated by reference to Exhibit 10.16 to theCompany’s Annual Report on Form 10-K for the fiscal year ended May 31, 2015).*
10.17 Covenant Not to Compete and Non-Disclosure Agreement between NIKE, Inc. and Andrew Campion dated January 23, 2007.*10.18 Covenant Not to Compete and Non-Disclosure Agreement between NIKE, Inc. and Eric D. Sprunk dated April 18, 2001
(incorporated by reference to Exhibit 10.23 to the Company’s Annual Report on Form 10-K for the fiscal year ended May 31,2010).*
10.19 Covenant Not to Compete and Non-Disclosure Agreement between NIKE, Inc. and Trevor A. Edwards dated November 14,2002 (incorporated by reference to Exhibit 10.19 to the Company’s Annual Report on Form 10-K for the fiscal year endedMay 31, 2008).*
10.20 Covenant Not to Compete and Non-Disclosure Agreement between NIKE, Inc. and Jeanne Jackson dated March 4, 2009(incorporated by reference to Exhibit 10.21 to the Company’s Annual Report on Form 10-K for the fiscal year ended May 31,2014).*
10.21 Policy for Recoupment of Incentive Compensation (incorporated by reference to Exhibit 10.3 to the Company’s Current Reporton Form 8-K filed July 20, 2010).*
10.22 Credit Agreement dated as of August 28, 2015 among NIKE, Inc., Bank of America, N.A., as Administrative Agent, CitibankN.A., as Syndication Agent, Deutsche Bank A.G. New York Branch and HSBC Bank USA, National Association, as Co-Documentation Agents, and the other Banks named therein (incorporated by reference to Exhibit 10.1 to the Company’s CurrentReport on Form 8-K filed September 2, 2015).
NIKE, INC. 2016 Annual Report and Notice of Annual Meeting 127
FOR
M10
-K
PART IV
10.23 Executive Performance Sharing Plan (incorporated by reference to Exhibit 10.1 to the Company’s Current Report on Form 8-Kfiled September 23, 2015).
10.24 Stock Incentive Plan, as amended (incorporated by reference to Exhibit 10.2 to the Company’s Current Report on Form 8-K filedSeptember 23, 2015).
12.1 Computation of Ratio of Earnings to Fixed Charges.21 Subsidiaries of the Registrant.23 Consent of PricewaterhouseCoopers LLP, Independent Registered Public Accounting Firm (included within this Annual Report
on Form 10-K).31.1 Rule 13a-14(a)/15d-14(a) Certification of Chief Executive Officer.31.2 Rule 13a-14(a)/15d-14(a) Certification of Chief Financial Officer.32 Section 1350 Certifications.101.INS XBRL Instance Document101.SCH XBRL Taxonomy Extension Schema101.CAL XBRL Taxonomy Extension Calculation Linkbase101.DEF XBRL Taxonomy Extension Definition Document101.LAB XBRL Taxonomy Extension Label Linkbase101.PRE XBRL Taxonomy Extension Presentation Linkbase
* Management contract or compensatory plan or arrangement.
The Exhibits filed herewith do not include certain instruments with respect to long-term debt of NIKE and its subsidiaries, inasmuch as the total amount of debtauthorized under any such instrument does not exceed 10 percent of the total assets of NIKE and its subsidiaries on a consolidated basis. NIKE agrees, pursuantto Item 601(b)(4)(iii) of Regulation S-K, that it will furnish a copy of any such instrument to the SEC upon request.
Upon written request to Investor Relations, NIKE, Inc., One Bowerman Drive, Beaverton, Oregon 97005-6453, NIKE will furnish shareholders with a copy of anyExhibit upon payment of $0.10 per page, which represents our reasonable expenses in furnishing Exhibits.
128
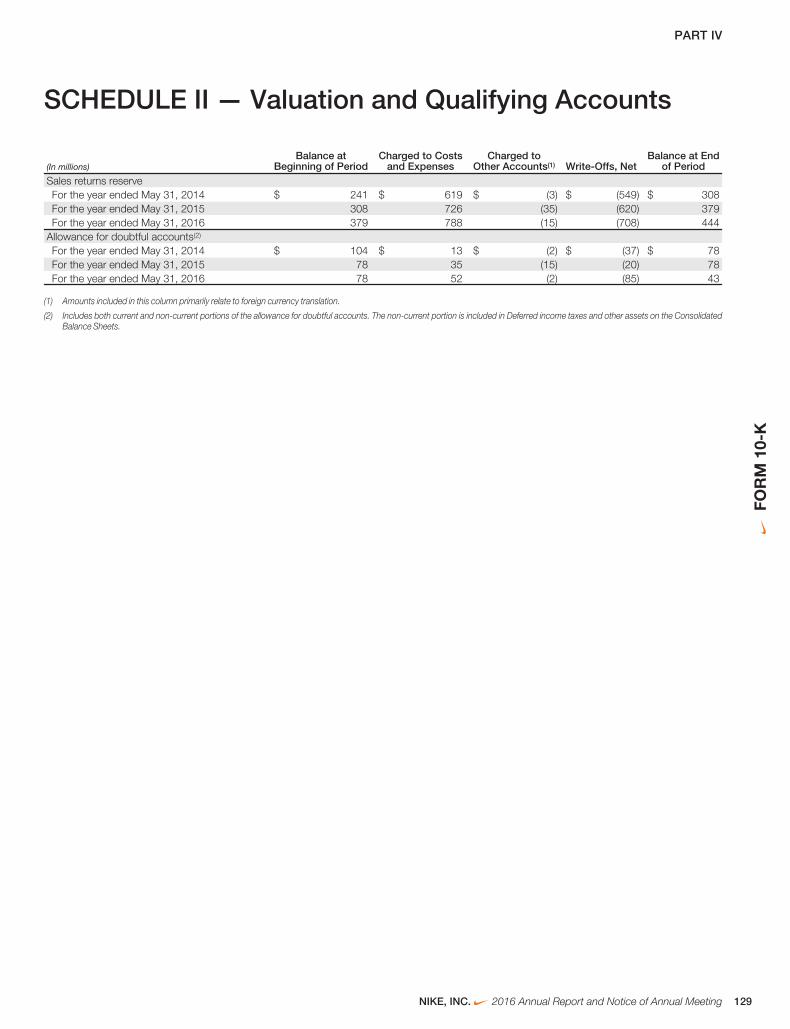
PART IV
SCHEDULE II — Valuation and Qualifying Accounts
(In millions)Balance at
Beginning of PeriodCharged to Costs
and ExpensesCharged to
Other Accounts(1) Write-Offs, NetBalance at End
of PeriodSales returns reserveFor the year ended May 31, 2014 $ 241 $ 619 $ (3) $ (549) $ 308For the year ended May 31, 2015 308 726 (35) (620) 379For the year ended May 31, 2016 379 788 (15) (708) 444
Allowance for doubtful accounts(2)
For the year ended May 31, 2014 $ 104 $ 13 $ (2) $ (37) $ 78For the year ended May 31, 2015 78 35 (15) (20) 78For the year ended May 31, 2016 78 52 (2) (85) 43
(1) Amounts included in this column primarily relate to foreign currency translation.
(2) Includes both current and non-current portions of the allowance for doubtful accounts. The non-current portion is included in Deferred income taxes and other assets on the ConsolidatedBalance Sheets.
NIKE, INC. 2016 Annual Report and Notice of Annual Meeting 129
FOR
M10
-K

PART IV
Consent of Independent Registered Public Accounting Firm
We hereby consent to the incorporation by reference in the Registration Statements on Form S-8 (Nos. 033-63995, 333-63581, 333-63583, 333-68864, 333-68886, 333-71660, 333-104822, 333-117059, 333-133360, 333-164248, 333-171647, 333-173727 and 333-208900) of NIKE, Inc. of our report datedJuly 21, 2016 relating to the financial statements, financial statement schedule and the effectiveness of internal control over financial reporting, which appears inthis Form 10-K.
/s/ PRICEWATERHOUSECOOPERS LLP
Portland, Oregon
July 21, 2016
130
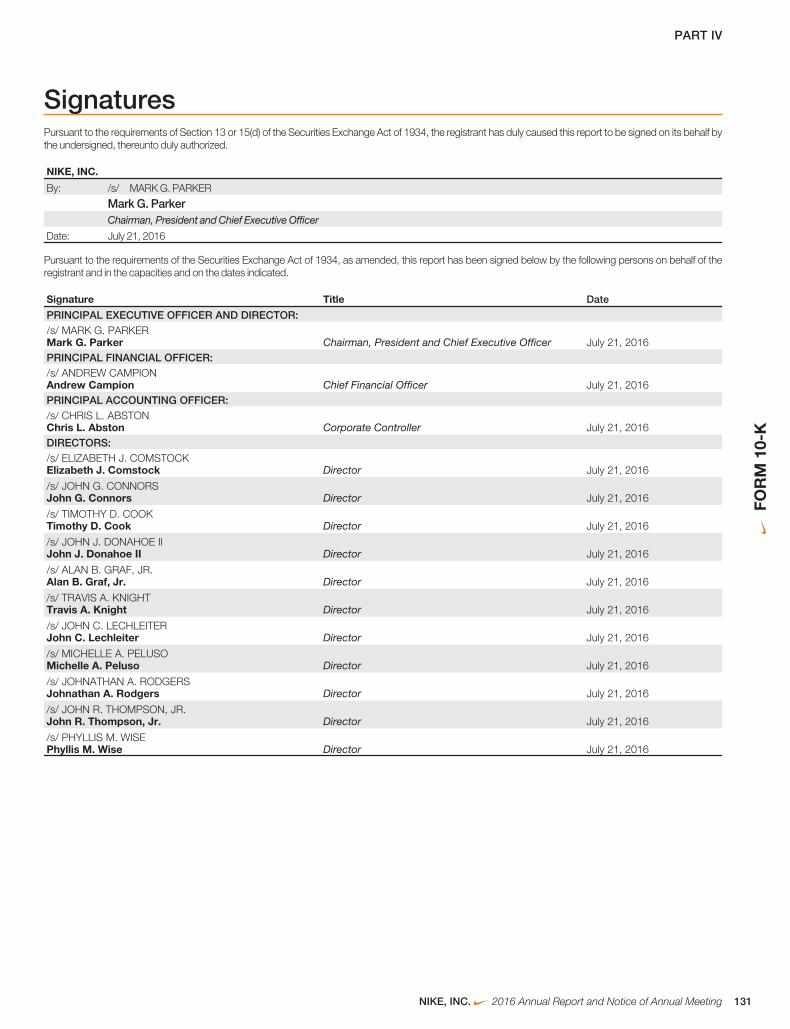
PART IV
SignaturesPursuant to the requirements of Section 13 or 15(d) of the Securities Exchange Act of 1934, the registrant has duly caused this report to be signed on its behalf bythe undersigned, thereunto duly authorized.
NIKE, INC.
By: /s/ MARK G. PARKER
Mark G. ParkerChairman, President and Chief Executive Officer
Date: July 21, 2016
Pursuant to the requirements of the Securities Exchange Act of 1934, as amended, this report has been signed below by the following persons on behalf of theregistrant and in the capacities and on the dates indicated.
Signature Title Date
PRINCIPAL EXECUTIVE OFFICER AND DIRECTOR:/s/ MARK G. PARKERMark G. Parker Chairman, President and Chief Executive Officer July 21, 2016PRINCIPAL FINANCIAL OFFICER:/s/ ANDREW CAMPIONAndrew Campion Chief Financial Officer July 21, 2016PRINCIPAL ACCOUNTING OFFICER:/s/ CHRIS L. ABSTONChris L. Abston Corporate Controller July 21, 2016DIRECTORS:/s/ ELIZABETH J. COMSTOCKElizabeth J. Comstock Director July 21, 2016
/s/ JOHN G. CONNORSJohn G. Connors Director July 21, 2016
/s/ TIMOTHY D. COOKTimothy D. Cook Director July 21, 2016
/s/ JOHN J. DONAHOE IIJohn J. Donahoe II Director July 21, 2016
/s/ ALAN B. GRAF, JR.Alan B. Graf, Jr. Director July 21, 2016
/s/ TRAVIS A. KNIGHTTravis A. Knight Director July 21, 2016
/s/ JOHN C. LECHLEITERJohn C. Lechleiter Director July 21, 2016
/s/ MICHELLE A. PELUSOMichelle A. Peluso Director July 21, 2016
/s/ JOHNATHAN A. RODGERSJohnathan A. Rodgers Director July 21, 2016
/s/ JOHN R. THOMPSON, JR.John R. Thompson, Jr. Director July 21, 2016
/s/ PHYLLIS M. WISEPhyllis M. Wise Director July 21, 2016
NIKE, INC. 2016 Annual Report and Notice of Annual Meeting 131
FOR
M10
-K
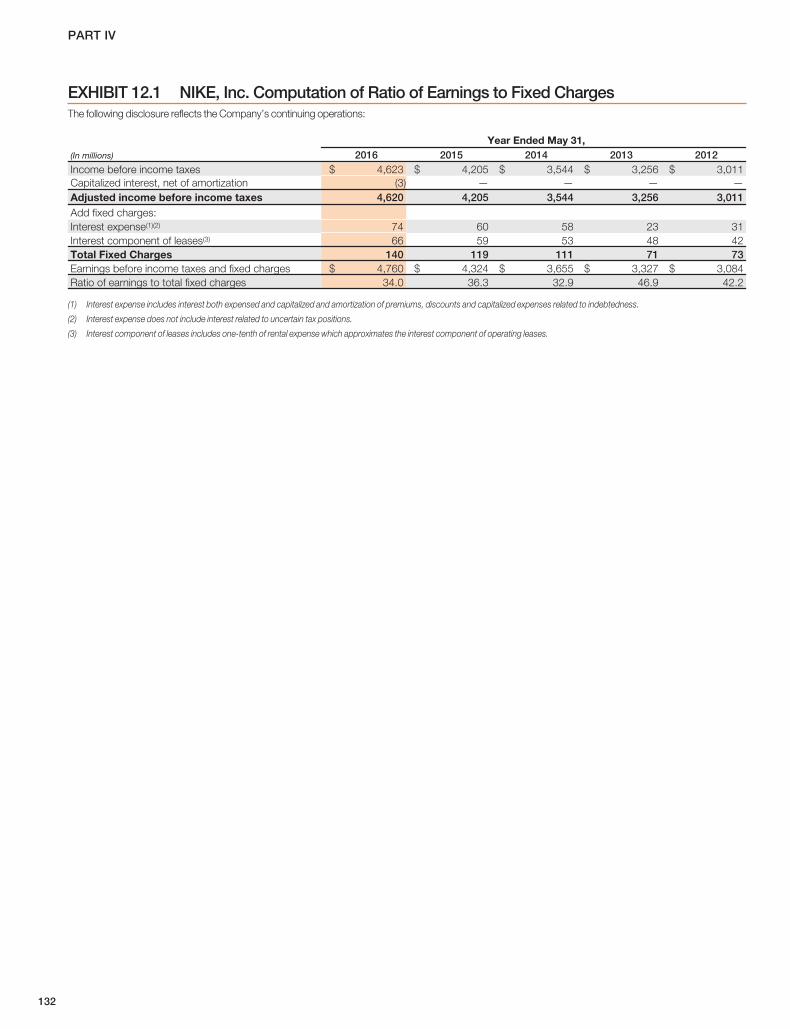
PART IV
EXHIBIT 12.1 NIKE, Inc. Computation of Ratio of Earnings to Fixed ChargesThe following disclosure reflects the Company’s continuing operations:
Year Ended May 31,(In millions) 2016 2015 2014 2013 2012Income before income taxes $ 4,623 $ 4,205 $ 3,544 $ 3,256 $ 3,011Capitalized interest, net of amortization (3) — — — —Adjusted income before income taxes 4,620 4,205 3,544 3,256 3,011Add fixed charges:Interest expense(1)(2) 74 60 58 23 31Interest component of leases(3) 66 59 53 48 42Total Fixed Charges 140 119 111 71 73Earnings before income taxes and fixed charges $ 4,760 $ 4,324 $ 3,655 $ 3,327 $ 3,084Ratio of earnings to total fixed charges 34.0 36.3 32.9 46.9 42.2
(1) Interest expense includes interest both expensed and capitalized and amortization of premiums, discounts and capitalized expenses related to indebtedness.
(2) Interest expense does not include interest related to uncertain tax positions.
(3) Interest component of leases includes one-tenth of rental expense which approximates the interest component of operating leases.
132
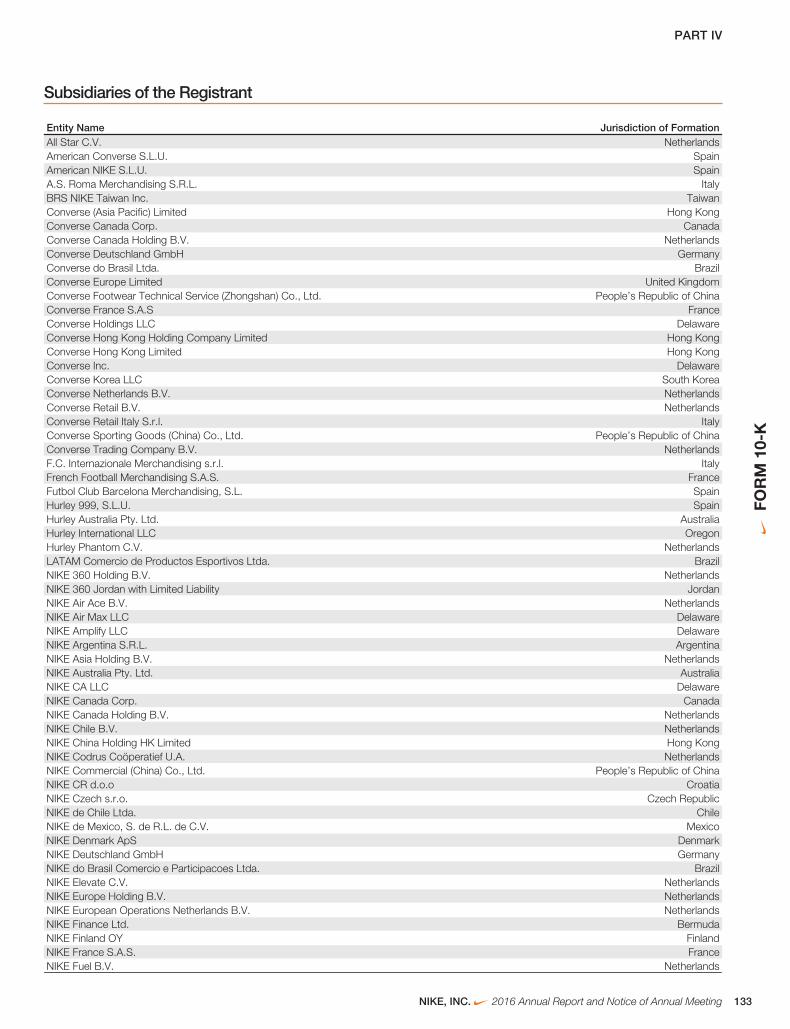
PART IV
Subsidiaries of the Registrant
Entity Name Jurisdiction of FormationAll Star C.V. NetherlandsAmerican Converse S.L.U. SpainAmerican NIKE S.L.U. SpainA.S. Roma Merchandising S.R.L. ItalyBRS NIKE Taiwan Inc. TaiwanConverse (Asia Pacific) Limited Hong KongConverse Canada Corp. CanadaConverse Canada Holding B.V. NetherlandsConverse Deutschland GmbH GermanyConverse do Brasil Ltda. BrazilConverse Europe Limited United KingdomConverse Footwear Technical Service (Zhongshan) Co., Ltd. People’s Republic of ChinaConverse France S.A.S FranceConverse Holdings LLC DelawareConverse Hong Kong Holding Company Limited Hong KongConverse Hong Kong Limited Hong KongConverse Inc. DelawareConverse Korea LLC South KoreaConverse Netherlands B.V. NetherlandsConverse Retail B.V. NetherlandsConverse Retail Italy S.r.l. ItalyConverse Sporting Goods (China) Co., Ltd. People’s Republic of ChinaConverse Trading Company B.V. NetherlandsF.C. Internazionale Merchandising s.r.l. ItalyFrench Football Merchandising S.A.S. FranceFutbol Club Barcelona Merchandising, S.L. SpainHurley 999, S.L.U. SpainHurley Australia Pty. Ltd. AustraliaHurley International LLC OregonHurley Phantom C.V. NetherlandsLATAM Comercio de Productos Esportivos Ltda. BrazilNIKE 360 Holding B.V. NetherlandsNIKE 360 Jordan with Limited Liability JordanNIKE Air Ace B.V. NetherlandsNIKE Air Max LLC DelawareNIKE Amplify LLC DelawareNIKE Argentina S.R.L. ArgentinaNIKE Asia Holding B.V. NetherlandsNIKE Australia Pty. Ltd. AustraliaNIKE CA LLC DelawareNIKE Canada Corp. CanadaNIKE Canada Holding B.V. NetherlandsNIKE Chile B.V. NetherlandsNIKE China Holding HK Limited Hong KongNIKE Codrus Coöperatief U.A. NetherlandsNIKE Commercial (China) Co., Ltd. People’s Republic of ChinaNIKE CR d.o.o CroatiaNIKE Czech s.r.o. Czech RepublicNIKE de Chile Ltda. ChileNIKE de Mexico, S. de R.L. de C.V. MexicoNIKE Denmark ApS DenmarkNIKE Deutschland GmbH GermanyNIKE do Brasil Comercio e Participacoes Ltda. BrazilNIKE Elevate C.V. NetherlandsNIKE Europe Holding B.V. NetherlandsNIKE European Operations Netherlands B.V. NetherlandsNIKE Finance Ltd. BermudaNIKE Finland OY FinlandNIKE France S.A.S. FranceNIKE Fuel B.V. Netherlands
NIKE, INC. 2016 Annual Report and Notice of Annual Meeting 133
FOR
M10
-K
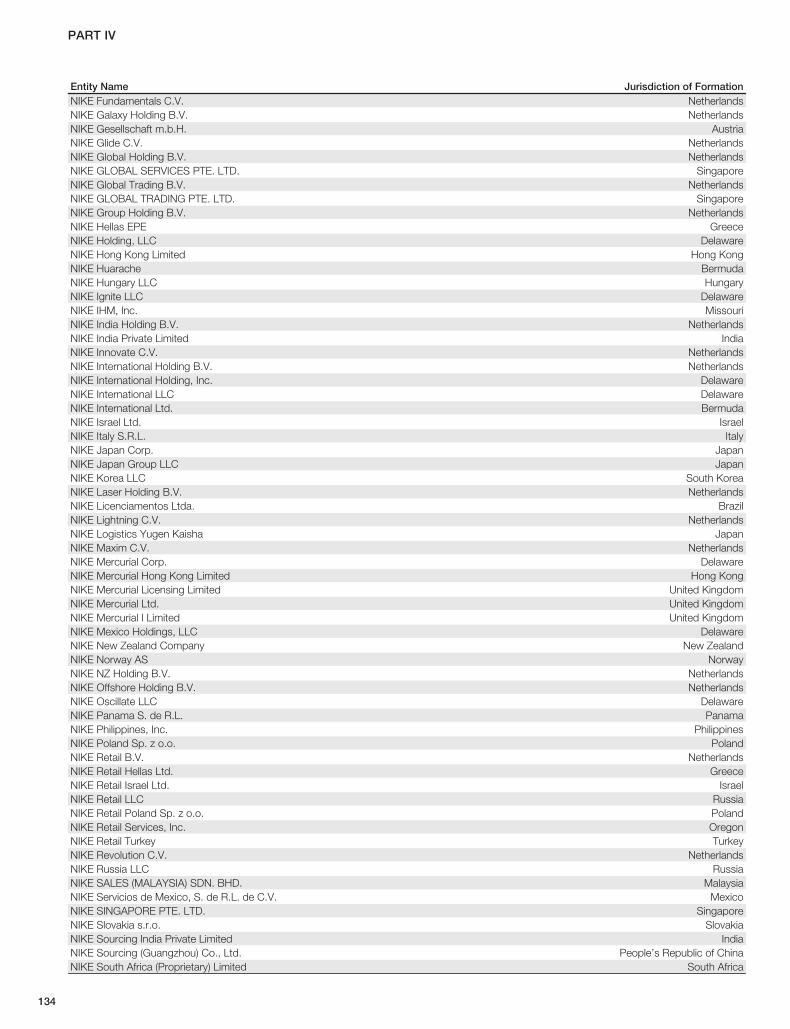
PART IV
Entity Name Jurisdiction of FormationNIKE Fundamentals C.V. NetherlandsNIKE Galaxy Holding B.V. NetherlandsNIKE Gesellschaft m.b.H. AustriaNIKE Glide C.V. NetherlandsNIKE Global Holding B.V. NetherlandsNIKE GLOBAL SERVICES PTE. LTD. SingaporeNIKE Global Trading B.V. NetherlandsNIKE GLOBAL TRADING PTE. LTD. SingaporeNIKE Group Holding B.V. NetherlandsNIKE Hellas EPE GreeceNIKE Holding, LLC DelawareNIKE Hong Kong Limited Hong KongNIKE Huarache BermudaNIKE Hungary LLC HungaryNIKE Ignite LLC DelawareNIKE IHM, Inc. MissouriNIKE India Holding B.V. NetherlandsNIKE India Private Limited IndiaNIKE Innovate C.V. NetherlandsNIKE International Holding B.V. NetherlandsNIKE International Holding, Inc. DelawareNIKE International LLC DelawareNIKE International Ltd. BermudaNIKE Israel Ltd. IsraelNIKE Italy S.R.L. ItalyNIKE Japan Corp. JapanNIKE Japan Group LLC JapanNIKE Korea LLC South KoreaNIKE Laser Holding B.V. NetherlandsNIKE Licenciamentos Ltda. BrazilNIKE Lightning C.V. NetherlandsNIKE Logistics Yugen Kaisha JapanNIKE Maxim C.V. NetherlandsNIKE Mercurial Corp. DelawareNIKE Mercurial Hong Kong Limited Hong KongNIKE Mercurial Licensing Limited United KingdomNIKE Mercurial Ltd. United KingdomNIKE Mercurial I Limited United KingdomNIKE Mexico Holdings, LLC DelawareNIKE New Zealand Company New ZealandNIKE Norway AS NorwayNIKE NZ Holding B.V. NetherlandsNIKE Offshore Holding B.V. NetherlandsNIKE Oscillate LLC DelawareNIKE Panama S. de R.L. PanamaNIKE Philippines, Inc. PhilippinesNIKE Poland Sp. z o.o. PolandNIKE Retail B.V. NetherlandsNIKE Retail Hellas Ltd. GreeceNIKE Retail Israel Ltd. IsraelNIKE Retail LLC RussiaNIKE Retail Poland Sp. z o.o. PolandNIKE Retail Services, Inc. OregonNIKE Retail Turkey TurkeyNIKE Revolution C.V. NetherlandsNIKE Russia LLC RussiaNIKE SALES (MALAYSIA) SDN. BHD. MalaysiaNIKE Servicios de Mexico, S. de R.L. de C.V. MexicoNIKE SINGAPORE PTE. LTD. SingaporeNIKE Slovakia s.r.o. SlovakiaNIKE Sourcing India Private Limited IndiaNIKE Sourcing (Guangzhou) Co., Ltd. People’s Republic of ChinaNIKE South Africa (Proprietary) Limited South Africa
134
PART IV
Entity Name Jurisdiction of FormationNIKE South Africa Holdings LLC DelawareNIKE Sphere C.V. NetherlandsNIKE Sports (China) Company, Ltd. People’s Republic of ChinaNIKE Suzhou Holding HK Limited Hong KongNIKE Sweden AB SwedenNIKE (Switzerland) GmbH SwitzerlandNIKE Taiwan Limited TaiwanNIKE (Thailand) Limited ThailandNIKE TN, Inc. OregonNIKE Trading Company B.V. NetherlandsNIKE UK Holding B.V. NetherlandsNIKE (UK) Limited United KingdomNIKE USA, Inc. OregonNIKE Vapor Ltd. United KingdomNIKE Victory Cooperatief U.A. NetherlandsNIKE Vietnam Limited Liability Company VietnamNIKE Vision, Timing and Techlab, LP TexasNIKE Vomero Cooperatief U.A. NetherlandsNIKE Wholesale LLC SloveniaNIKE Woodside I, LLC OregonNIKE Woodside II, LLC OregonNIKE Woodside I Holdings, Inc. OregonNIKE Woodside II Holdings, Inc. OregonNIKE Zoom LLC DelawareNorth West Merchandising Limited United KingdomPiemonte Merchandising S.R.L. ItalyPT Hurley Indonesia IndonesiaPT NIKE Indonesia IndonesiaTriax Insurance, Inc. HawaiiTwin Dragons Global Limited Hong KongTwin Dragons Holding B.V. NetherlandsYugen Kaisha Hurley Japan Japan
NIKE, INC. 2016 Annual Report and Notice of Annual Meeting 135
FOR
M10
-K
D I R E C T O R S C O R P O R A T E O F F I C E R S
Elizabeth J. Comstock(3)(4)
Vice ChairGeneral Electric CompanyFairfield, Connecticut
John G. Connors(2)(3)
PartnerIgnition Partners LLCBellevue, Washington
Timothy D. Cook(4)(6)
Chief Executive OfficerApple Inc.Cupertino, California
John J. Donahoe II(2)(3)(6)
ChairmanPayPal Holdings, Inc.San Jose, California
Alan B. Graf, Jr.(2)(6)
Executive Vice President & Chief Financial OfficerFedEx CorporationMemphis, Tennessee
Travis A. Knight(1)(5)
President & Chief Executive OfficerLAIKA, LLCHillsboro, Oregon
John C. Lechleiter(3)(4)(6)
Chairman of the Board, President & Chief Executive OfficerEli Lilly and CompanyIndianapolis, Indiana
Mark G. Parker(1)
Chairman of the Board, President & Chief Executive OfficerNIKE, Inc.Beaverton, Oregon
Michelle A. Peluso(2)(5)
Venture PartnerTechnology Crossover VenturesNew York, New York
Johnathan A. Rodgers(4)(5)
President & Chief Executive Officer (Retired)TV One, LLCSilver Springs, Maryland
John R. Thompson, Jr.(5)
Assistant to the President of Georgetown University for Urban AffairsGeorgetown UniversityWashington, D.C.
Phyllis M. Wise(5)(6)
Faculty MemberUniversity of Illinois, at Urbana-ChampaignUrbana, Illinois
Mark G. ParkerChairman of the Board of Directors, President & Chief ExecutiveOfficer
David J. AyreExecutive Vice President, Global Human Resources
Andrew CampionExecutive Vice President & Chief Financial Officer
Trevor A. EdwardsPresident, NIKE Brand
Hilary K. KraneExecutive Vice President, Chief Administrative Officer & GeneralCounsel
John F. SlusherExecutive Vice President, Global Sports Marketing
Michael SpillanePresident, Product & Merchandising
Eric D. SprunkChief Operating Officer
Kelley K. HallVice President, Corporate Finance & Treasurer
John F. Coburn IIIVice President & Corporate Secretary
Jeanine HayesChief Intellectual Property Officer & Assistant Secretary
Adrian L. BellSenior Counsel, Corporate Governance & Assistant Secretary
(1) Member — Executive Committee(2) Member — Audit Committee(3) Member — Finance Committee(4) Member — Compensation Committee(5) Member — Corporate Responsibility and Sustainability Committee(6) Member — Nominating and Corporate Governance Committee
136
S U B S I D I A R I E S L O C A T I O N S
CONVERSE INC.
Davide GrassoChief Executive Officer
160 North Washington St.Boston, Massachusetts 02114
HURLEY INTERNATIONAL LLC
Robert W. CoombesPresident & Chief Executive Officer
1945 Placentia AvenueCosta Mesa,
California 92627
WORLD HEADQUARTERS
One Bowerman DriveBeaverton, Oregon 97005-6453
EUROPEAN HEADQUARTERS
Colosseum 11213 NL HilversumThe Netherlands
GREATER CHINA HEADQUARTERS
LiNa BuildingTower 1, No. 99
Jiangwancheng RoadYangpu District
Shanghai, China 200438
S H A R E H O L D E R I N F O R M A T I O N
I N D E P E N D E N T A C C O U N T A N T S
PricewaterhouseCoopers LLP805 SW Broadway, Suite 800Portland, Oregon 97205
R E G I S T R A R A N D S T O C K T R A N S F E R A G E N T
Computershare Trust Company, N.A.P.O. Box 30170College Station, Texas 77842-3170800-756-8200Hearing Impaired #TDD: 800-952-9245http://www.computershare.com
Shareholder Information
NIKE, Inc. common stock is listed on the New York Stock Exchange under trading symbol ‘NKE.’ Copies of the Company’s Form 10-K or Form10-Q reports filed with the Securities and Exchange Commission are available from the Company without charge. To request a copy, please call800-640-8007 or write to NIKE’s Investor Relations Department at NIKE World Headquarters, One Bowerman Drive, Beaverton, Oregon 97005-6453. Copies are available on the investor relations website, http://investors.nike.com.
Dividend Payments
Quarterly dividends on NIKE common stock, when declared by the Board of Directors, are paid on or about July 5, October 5, January 5, and April 5. Additionalfinancial information is available at http://investors.nike.com.
Other Shareholder Assistance
Communications concerning shareholder address changes, stock transfers, changes of ownership, lost stock certificates, payment of dividends, dividend checkreplacements, duplicate mailings, or other account services should be directed to the Company’s Registrar and Stock Transfer Agent at the address or telephonenumber above.
NIKE, the Swoosh Design, and Just Do It are registered trademarks of NIKE, Inc.

NIKE, INC.One Bowerman DriveBeaverton, OR 97005-6453www.nike.com