Embed Size (px)
Citation preview
United States Steel Corporation
First Quarter 2017Earnings Presentation
April 25, 2017
© 2011 United States Steel Corporation
2
Forward-looking Statements
These slides and remarks are being provided to assist readers in understanding the results of operations, financial condition and cash flows of United States Steel Corporation for the first quarter of 2017. They should be read in conjunction with the consolidated financial statements and Notes to Consolidated Financial Statements contained in our Annual Report on Form 10-K and Quarterly Report on Forms 10-Q filed with the Securities and Exchange Commission.
This presentation contains information that may constitute “forward-looking statements” within the meaning of Section 27 of the Securities Act of 1933, as amended, and Section 21E of the Securities Exchange Act of 1934, as amended. We intend the forward-looking statements to be covered by the safe harbor provisions for forward-looking statements in those sections. Generally, we have identified such forward-looking statements by using the words “believe,” “expect,” “intend,” “estimate,” “anticipate,” “project,” “target,” “forecast,” “aim,” “should,” “will” and similar expressions or by using future dates in connection with any discussion of, among other things, operating performance, trends, events or developments that we expect or anticipate will occur in the future, statements relating to volume growth, share of sales and earnings per share growth, and statements expressing general views about futureoperating results. However, the absence of these words or similar expressions does not mean that a statement is not forward-looking. Forward-looking statements are not historical facts, but instead represent only the Company’s beliefs regarding futureevents, many of which, by their nature, are inherently uncertain and outside of the Company’s control. It is possible that the Company’s actual results and financial condition may differ, possibly materially, from the anticipated results and financial condition indicated in these forward-looking statements. Management believes that these forward-looking statements are reasonable as of the time made. However, caution should be taken not to place undue reliance on any such forward-looking statements because such statements speak only as of the date when made. Our Company undertakes no obligation to publicly update or revise any forward-looking statements, whether as a result of new information, future events or otherwise, except as required by law. In addition,forward-looking statements are subject to certain risks and uncertainties that could cause actual results to differ materially from our Company's historical experience and our present expectations or projections. These risks and uncertainties include, but are notlimited to the risks and uncertainties described in “Item 1A. Risk Factors” in our Annual Report on Form 10-K for the year endedDecember 31, 2016, and those described from time to time in our future reports filed with the Securities and Exchange Commission.
References to "we," "us," "our," the "Company," and "U. S. Steel," refer to United States Steel Corporation and its ConsolidatedSubsidiaries.
United States Steel Corporation
Explanation of Use of Non-GAAP Measures
We present adjusted net earnings (loss), adjusted net earnings (loss) per diluted share, earnings (loss) before interest, income taxes, depreciation and amortization (EBITDA) and adjusted EBITDA, which are all non-GAAP measures, as additional measurements to enhance the understanding of our operating performance.
Net debt is a non-GAAP measure calculated as total debt less cash and cash equivalents. We believe net debt is a useful measurein calculating enterprise value. We believe that EBITDA considered along with the net earnings (loss), is a relevant indicator of trends relating to cash generating activity and provides management and investors with additional information for comparison of our operating results to the operating results of other companies. Both EBITDA and net debt are used by analysts to refine and improve the accuracy of their financial models which utilize enterprise value.
Adjusted net earnings (loss) and adjusted net earnings (loss) per diluted share are non-GAAP measures that exclude the effects of restructuring charges, impairment charges, and losses on debt extinguishment that are not part of the Company’s core operations.Adjusted EBITDA is also a non-GAAP measure that excludes the effects of restructuring charges and impairment charges. We present adjusted net earnings (loss), adjusted net earnings (loss) per diluted share and adjusted EBITDA to enhance the understanding of our ongoing operating performance and established trends affecting our core operations, particularly cash generating activity, by excluding the effects of restructuring charges, impairment charges, losses on debt extinguishment, and losses associated with non-core operations that can obscure underlying trends. U. S. Steel’s management considers adjusted net earnings (loss), adjusted net earnings (loss) per diluted share and adjusted EBITDA useful to investors by facilitating a comparison of our operating performance to the operating performance of our competitors, many of which use adjusted net earnings (loss), adjusted net earnings (loss) per diluted share and adjusted EBITDA as alternative measures of operating performance. Additionally, the presentation of adjusted net earnings (loss), adjusted net earnings (loss) per diluted share and adjusted EBITDA provides insight into management’s view and assessment of the Company’s ongoing operating performance, because management does not consider the adjusting items when evaluating the Company’s financial performance or in preparing the Company’s annual financial Outlook. Adjusted net earnings (loss), adjusted net earnings (loss) per diluted share and adjusted EBITDA should not be considered a substitute for net earnings (loss), earnings (loss) per diluted share or other financial measures as computed in accordance with U.S. GAAP and is not necessarily comparable to similarly titled measures used by other companies.
United States Steel Corporation
United States Steel Corporation
2017 Outlook
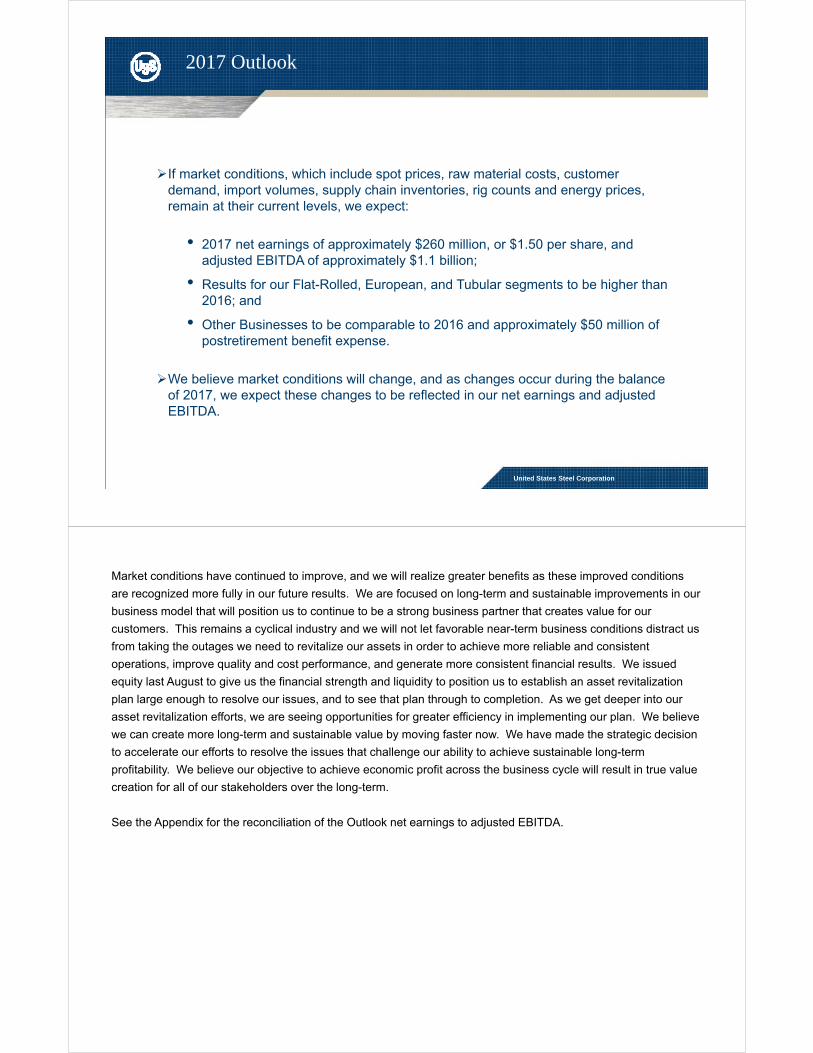
If market conditions, which include spot prices, raw material costs, customer demand, import volumes, supply chain inventories, rig counts and energy prices, remain at their current levels, we expect:
• 2017 net earnings of approximately $260 million, or $1.50 per share, and adjusted EBITDA of approximately $1.1 billion;
• Results for our Flat-Rolled, European, and Tubular segments to be higher than 2016; and
• Other Businesses to be comparable to 2016 and approximately $50 million of postretirement benefit expense.
We believe market conditions will change, and as changes occur during the balance of 2017, we expect these changes to be reflected in our net earnings and adjusted EBITDA.
6
Market conditions have continued to improve, and we will realize greater benefits as these improved conditions
are recognized more fully in our future results. We are focused on long-term and sustainable improvements in our
business model that will position us to continue to be a strong business partner that creates value for our
customers. This remains a cyclical industry and we will not let favorable near-term business conditions distract us
from taking the outages we need to revitalize our assets in order to achieve more reliable and consistent
operations, improve quality and cost performance, and generate more consistent financial results. We issued
equity last August to give us the financial strength and liquidity to position us to establish an asset revitalization
plan large enough to resolve our issues, and to see that plan through to completion. As we get deeper into our
asset revitalization efforts, we are seeing opportunities for greater efficiency in implementing our plan. We believe
we can create more long-term and sustainable value by moving faster now. We have made the strategic decision
to accelerate our efforts to resolve the issues that challenge our ability to achieve sustainable long-term
profitability. We believe our objective to achieve economic profit across the business cycle will result in true value
creation for all of our stakeholders over the long-term.
See the Appendix for the reconciliation of the Outlook net earnings to adjusted EBITDA.
Carnegie Way – Accumulating Benefits
55%
12%
United States Steel Corporation
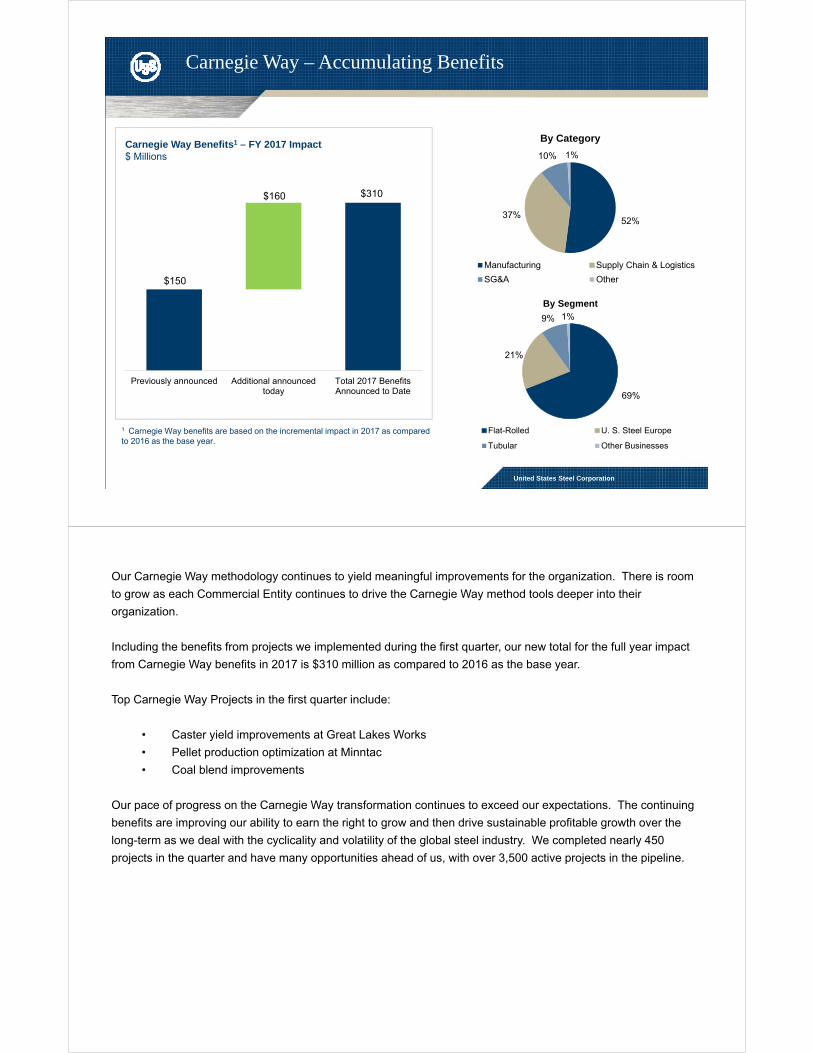
52%37%
10% 1%
By Category
Manufacturing Supply Chain & Logistics
SG&A Other
69%
21%
9% 1%
By Segment
Flat-Rolled U. S. Steel Europe
Tubular Other Businesses
Carnegie Way Benefits1 – FY 2017 Impact$ Millions
1 Carnegie Way benefits are based on the incremental impact in 2017 as compared to 2016 as the base year.
$150
$310$160
Previously announced Additional announcedtoday
Total 2017 BenefitsAnnounced to Date
8
Our Carnegie Way methodology continues to yield meaningful improvements for the organization. There is room
to grow as each Commercial Entity continues to drive the Carnegie Way method tools deeper into their
organization.
Including the benefits from projects we implemented during the first quarter, our new total for the full year impact
from Carnegie Way benefits in 2017 is $310 million as compared to 2016 as the base year.
Top Carnegie Way Projects in the first quarter include:
• Caster yield improvements at Great Lakes Works
• Pellet production optimization at Minntac
• Coal blend improvements
Our pace of progress on the Carnegie Way transformation continues to exceed our expectations. The continuing
benefits are improving our ability to earn the right to grow and then drive sustainable profitable growth over the
long-term as we deal with the cyclicality and volatility of the global steel industry. We completed nearly 450
projects in the quarter and have many opportunities ahead of us, with over 3,500 active projects in the pipeline.

United States Steel Corporation
Capitalization and Depreciation Method
Change in Accounting Estimate – Capitalization and Depreciation Method
Changing from group depreciation to unitary depreciation
Unitary depreciation is the preferred method under U.S.
GAAP
Maintenance and outage spending that had previously been
expensed will now be capitalized if it extends the useful life
of the related asset
New depreciation method is consistent with our competitors
10
During the first quarter of 2017, we completed a review of our accounting policy for property, plant and equipment
depreciated on a group basis. As a result of this review, we changed our accounting method for property, plant
and equipment from the group method of depreciation to the unitary method of depreciation, effective as of
January 1, 2017. The change from the group method to the unitary method is preferable under accounting
principles generally accepted in the U.S. as it will result in a more precise estimate of depreciation expense.
Additionally, the change to the unitary method of depreciation is consistent with the depreciation method applied
by our competitors and improves the comparability of our results to our competitors' results. Due to the
application of the unitary method of depreciation and resultant change in our capitalization policy, maintenance
and outage spending that had previously been expensed will now be capitalized if it extends the useful life of the
related asset. The 2017 estimated impact is an approximately $175 million decrease in operating expense.
United States Steel Corporation
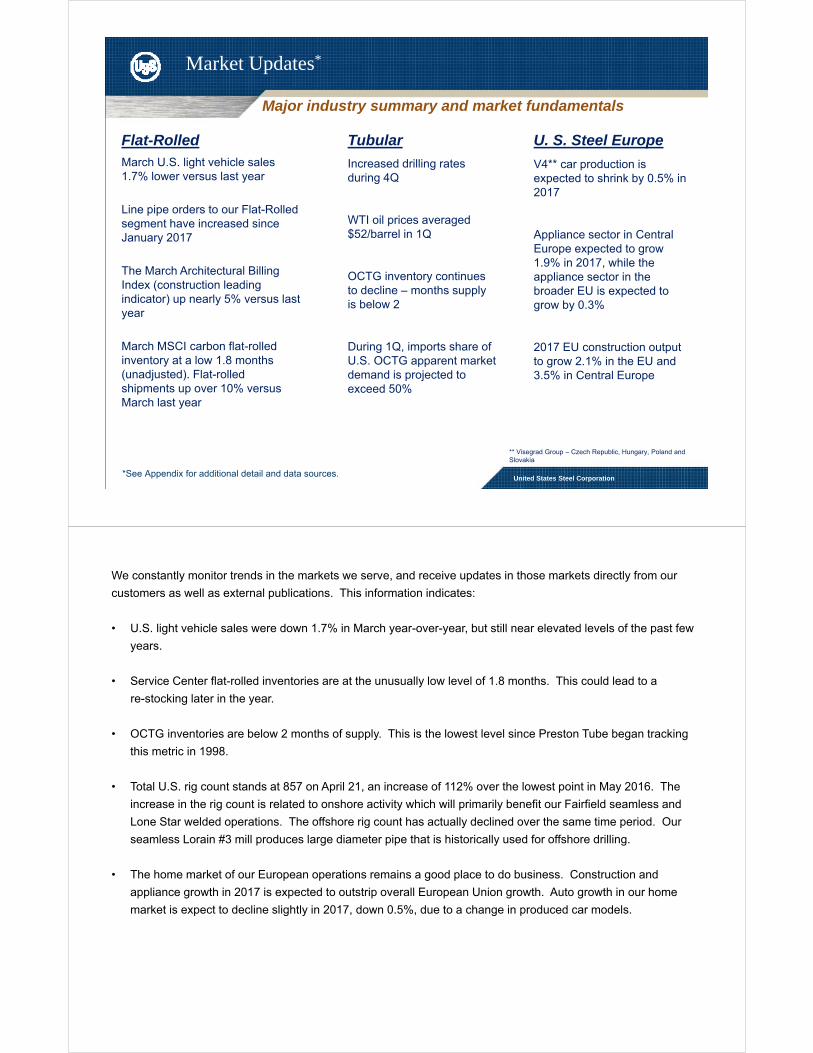
Flat-RolledMarch U.S. light vehicle sales 1.7% lower versus last year
Line pipe orders to our Flat-Rolled segment have increased since January 2017
The March Architectural Billing Index (construction leading indicator) up nearly 5% versus last year
March MSCI carbon flat-rolled inventory at a low 1.8 months (unadjusted). Flat-rolled shipments up over 10% versus March last year
U. S. Steel Europe
V4** car production is expected to shrink by 0.5% in 2017
Appliance sector in Central Europe expected to grow 1.9% in 2017, while the appliance sector in the broader EU is expected to grow by 0.3%
2017 EU construction output to grow 2.1% in the EU and 3.5% in Central Europe
Tubular
Increased drilling rates during 4Q
WTI oil prices averaged $52/barrel in 1Q
OCTG inventory continues to decline – months supply is below 2
During 1Q, imports share of U.S. OCTG apparent market demand is projected to exceed 50%
Market Updates*
Major industry summary and market fundamentals
** Visegrad Group – Czech Republic, Hungary, Poland and Slovakia
*See Appendix for additional detail and data sources.
12
We constantly monitor trends in the markets we serve, and receive updates in those markets directly from our
customers as well as external publications. This information indicates:
• U.S. light vehicle sales were down 1.7% in March year-over-year, but still near elevated levels of the past few
years.
• Service Center flat-rolled inventories are at the unusually low level of 1.8 months. This could lead to a
re-stocking later in the year.
• OCTG inventories are below 2 months of supply. This is the lowest level since Preston Tube began tracking
this metric in 1998.
• Total U.S. rig count stands at 857 on April 21, an increase of 112% over the lowest point in May 2016. The
increase in the rig count is related to onshore activity which will primarily benefit our Fairfield seamless and
Lone Star welded operations. The offshore rig count has actually declined over the same time period. Our
seamless Lorain #3 mill produces large diameter pipe that is historically used for offshore drilling.
• The home market of our European operations remains a good place to do business. Construction and
appliance growth in 2017 is expected to outstrip overall European Union growth. Auto growth in our home
market is expect to decline slightly in 2017, down 0.5%, due to a change in produced car models.

United States Steel Corporation
Business Update
Iron ore mining facilities
Steelmaking facilities
Flat-Rolled finishing facilities
Tubular facilities
U. S. Steel Europe
Operating updates
14
At our Flat-Rolled segment iron ore mining operations, we continue to operate our Minntac facility. Our Keetac facility successfully
resumed pellet production on February 24 after having been idled for nearly 2 years. The restart of Keetac will allow us to engage in
third party pellet sales while continuing to meet our current domestic steelmaking needs.
We are currently operating the steelmaking and finishing facilities at our Gary, Great Lakes and Mon Valley Works. We continue to
operate finishing facilities at our Granite City Works, and began rolling slabs on the hot strip mill on February 14. The steelmaking
operations at Granite City Works remain idled. We continue to operate the finishing facilities at our Fairfield, Midwest, East Chicago,
and Fairless Hills locations. We continuously review market conditions and the restart of idled facilities in the context of sustainable
increases in steel demand that would support operating rates at profitable levels.
On April 11, there was a process waste water release at our Midwest Plant in Portage, Indiana that impacted a water outfall that
discharges to Burns Waterway near Lake Michigan. We identified the source of the process release and made the necessary
repairs. We determined that all repairs were safely working as intended and, on April 14, we resumed operations in a controlled,
phased and highly monitored approach with extensive input from participating government agencies. We continue to work with our
customers to mitigate any supply disruptions to them as well as financial impacts to U. S. Steel. We are working with the
participating government agencies to resolve this issue. At this time, we are unable to reliably estimate the amount of any potential
liability or compliance costs associated with this incident.
We are currently operating our seamless mills in Fairfield, AL and Lorain, OH. Our seamless mill in Fairfield produces mid-range
diameter pipe, while our Lorain #3 mill produces large diameter pipe that is historically used for off-shore drilling. We are currently
purchasing rounds from third parties to feed our seamless mills. We are in the process of restarting our Lone Star #2 mill and expect
production to resume in May. We announced our intention to permanently shut down the Lorain #6 Quench and Temper mill.
However, we have decided to relocate the Lorain #6 Quench and Temper equipment to one of several other sites under consideration
to optimize our operations.
Our European operations are seeing stable market conditions and are running at high levels.

Carnegie Way transformation
Strategic Approach
United States Steel Corporation
Phase 1: Earning the right to grow:
• Economic profits
• Customer satisfaction and loyalty
• Process improvements and focused investment
$1,785 $1,645
$1,400 $1,295 $1,250
$0
$400
$800
$1,200
$1,600
$2,000
2013 2014 2015 2016 2017 Estimate
($ in
mill
ion)
Economic Profit – EBITDA break-even point
16
The Carnegie Way is the framework for who we want – and need – to be as a company and how we can get there. At its heart, the Carnegie Way is about creating real and sustainable value for all of our stakeholders.
It’s about differentiating ourselves from our competition through the development of innovative products, processes and approaches to doing business; to be a true business partner and solutions provider to our customers. It’s also about creating a culture that is rooted in time-tested principles and commitment to collaboration, accountability and results at all levels.
Our aspiration to become sustainably profitable, of earning economic profit across the cycle and being profitable across the trough remains unchanged, and the Carnegie Way is helping us get closer to that goal.
The three factors that have the most significant impact on achieving economic profit are increased margins, more efficient deployment of capital, and reducing our weighted average cost of capital (WACC).
Our Carnegie Way efforts are addressing each of these factors and we have lowered our break-even point to generate economic profit by over $500 million since 2013.
We are focused on increasing our margins by lowering our costs, improving our operational performance, and improving our product mix.
We have eliminated non-competitive facilities and are deploying our capital at the facilities that will provide the quality and reliability to support our stronger product mix, and the development of the future products that will make us a business partner that creates value for our customers. We are taking a disciplined approach that is centered on projects with lower implementation risks and faster returns on our investments.
As we improve our costs, mix and our operating consistency and reliability, we will generate more stable earnings. Lower earnings volatility will help to lower our beta and reduce our cost of equity, ultimately reducing our WACC.

Asset revitalization plan
A comprehensive plan to:
• Improve our profitability and competitiveness
• Meet the increasing expectations of our customers
A structured and flexible plan:
• Smaller and less complex projects to reduce execution risk
• Adaptable to changing business conditions
Multi-year implementation timeline to:
• Minimize disruptions to our operations
• Ensure we continue to support our customers
Carnegie Way transformation
United States Steel Corporation
18
What is it?
Our asset revitalization plan is a comprehensive investment plan, anchored in the Carnegie Way, to improve our profitability and competitiveness through projects designed to improve product capability and quality, and our operating reliability, efficiency and cost. The program focus is on investments in our existing Flat-Rolled segment assets, our people, and our processes. This targeted investment program will ensure maximum impact to our stockholders, customers and employees.
Why are you doing it?
The performance expectations of our customers are constantly increasing, and we need to be investing in our assets at a pace that will allow us to keep up with these increasing standards. On the quality side, we need to reduce our existing diversion, retreat and claim rates, and on the delivery side, consistency is the key. We will increase our spending on critical infrastructure in order to reduce major events that disrupt our entire supply chain, and to reduce our unplanned downtime and improve our reliability centered maintenance capabilities.
How are you doing it?
Importantly, while this is a large program, the majority of projects are not large, complex projects. Forty percent of the total program spend is expected to be on projects that cost less than $10 million, and sixty percent of the total program spend is expected to be on projects that cost less than $20 million. This means that assumptions are more accurate, and projects are easier to execute. Due to the smaller nature of many of the projects, we do not have to complete the entire program in order to start seeing benefits. Also, by breaking the program down into a series of smaller projects, we have greater flexibility to adjust the scope and pace of project implementation based on changes in business conditions.
Asset revitalization plan
A comprehensive plan to:
• Improve our profitability and competitiveness
• Meet the increasing expectations of our customers
A structured and flexible plan:
• Smaller and less complex projects to reduce execution risk
• Adaptable to changing business conditions
Multi-year implementation timeline to:
• Minimize disruptions to our operations
• Ensure we continue to support our customers
Carnegie Way transformation
United States Steel Corporation
20
How long will it take?
In order to ensure that we obtain the desired results from our asset revitalization efforts, it was necessary to properly plan and schedule a large number of projects. The development and scheduling of these projects required the input and coordinated efforts of hundreds of people from across the Flat-Rolled segment footprint. Once the project portfolio was prepared and optimized, actualimplementation efforts needed to be coordinated with production and maintenance schedules to minimize the disruption to production operations. The work requires outages on many facilities and we are making sure we can support our customers at the same time as we revitalize our assets. As a result, we expect the implementation schedule will stretch over a period of three to four years.
How much will it cost?
We currently expect our investment in asset revitalization in 2017 to be approximately $300 million higher compared with 2016. As noted above, we have the ability to adjust the scope and pace of implementing our plan based on changes in business conditions.
How does it create value?
Our asset revitalization plan is not just sustaining capital and maintenance spending; these projects will deliver both operational and commercial benefits, with most of the benefits coming from operational improvements. The commercial benefits we expect to realize will be driven primarily by things we can control, such as better product quality, improved delivery performance, and increased throughput on constrained assets.
After we complete our full asset revitalization plan, we will have well maintained facilities with a strong core infrastructure, and strong reliability centered maintenance organizations. We will deliver products to our customers with improved reliability and quality.
Executing this plan is a critical milestone in the Carnegie Way journey to take us from “earning the right to grow” to “driving and sustaining profitable growth.”

Investment will drive significant improvement in quality, reliability and cost metrics with attractive returns
Improvement from 2016 – year end run rate:
Key Performance Indicators 2017 2018 2019
Production volume 5% 10% 13%
Unplanned downtime 40% 50% 60%
Operating cost 2% 5% 12%
Quality 20% 50% 70%
Targeted Improvement – Gary Works Hot Strip Mill
Asset Revitalization
United States Steel Corporation
22
As we have stated, our asset revitalization plan will take three to four years to complete. But we will not have to
wait until it is fully implemented to begin realizing benefits.
This table shows the operational improvement we are targeting at our Gary Works hot strip mill as we complete a
series of projects over the next three years. After we complete our investments in this asset, we will have
significantly improved our production capability and reliability, lowered our costs, and improved our quality.

Cash from Operations$ Millions
$113$200
$264
$150
($135)
3Q 20162Q 20161Q 2016 1Q 20174Q 2016
Total Estimated Liquidity$ Millions
YE 2016YE 2015YE 2014 1Q 2017
Financial Flexibility
United States Steel Corporation
$3,082
$2,375
$2,899 $2,842
Cash and Cash Equivalents$ Millions
Net Debt$ Millions
YE 2014 YE 2015 YE 2016 1Q 2017
$2,110 $2,383
$1,516 $1,707
YE 2014 YE 2015 YE 2016 1Q 2017
$1,354
$755
$1,515$1,326
Strong cash and liquidity positions
Note: For reconciliation of non-GAAP amounts see Appendix
Cash from Operations declined in 1Q due to working capital build
Cash conversion cycle improved by4 days due primarily to improved inventory management
Strong cash and liquidity despite working capital build in the quarter
24
Net cash used in operating activities was $135 million in the first quarter compared to net cash provided by
operating activities of $113 million in the same period last year. The change is primarily due to an increase in
working capital period over period, partially offset by improved financial results.
The quarter end cash balance was $1.3 billion, down from year-end levels due to investments in working capital.
We anticipate a release of cash from working capital in the latter part of the second quarter. The cash conversion
cycle improved by four days (to 39 days) as a result of on-going inventory initiatives.
Total liquidity declined in the first quarter due to lower cash levels partially offset by higher Asset Based Loan
availability, which was driven by higher levels of collateral (inventory and accounts receivable).
The increase in net debt was a result of our lower cash balance in the quarter.
Our strong cash and liquidity position supports our strategic decision to accelerate our asset revitalization efforts.
Segment Earnings (Loss) Before Interest and Income Taxes$ Millions
Adjusted EBITDA$ Millions
4Q 20162Q 20161Q 2016
1Q 2016 2Q 2016 3Q 2016
Note: For reconciliation of non-GAAP amounts see Appendix
2Q 20161Q 2016 3Q 2016
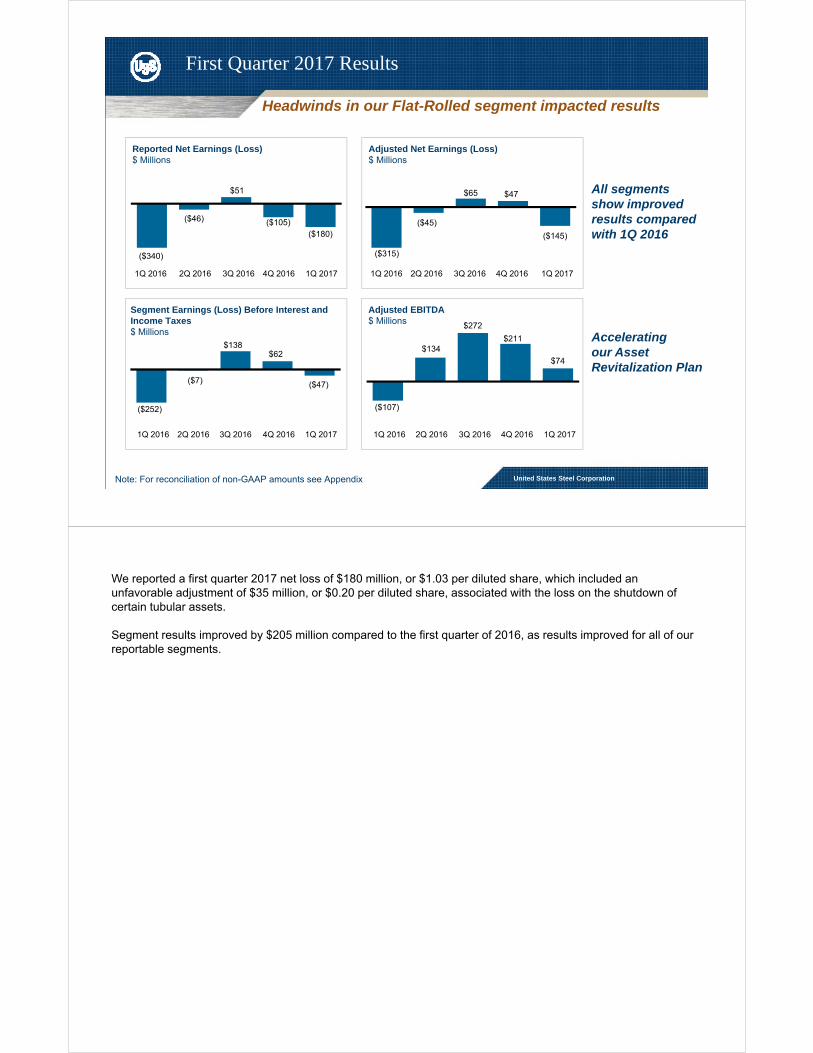
First Quarter 2017 Results
United States Steel Corporation
($315)
($45)
$65 $47
($145)
Adjusted Net Earnings (Loss)$ Millions
($107)
$134
$272
$211
$74
1Q 2016 2Q 2016 4Q 2016
Headwinds in our Flat-Rolled segment impacted results
($252)
($7)
$138 $62
($47)
3Q 2016 1Q 2017 4Q 2016 1Q 2017
3Q 2016 1Q 2017 4Q 2016 1Q 2017
All segments show improved results compared with 1Q 2016
Reported Net Earnings (Loss)$ Millions
($340)
($46)
$51
($105)($180)
Accelerating our Asset Revitalization Plan
26
We reported a first quarter 2017 net loss of $180 million, or $1.03 per diluted share, which included an unfavorable adjustment of $35 million, or $0.20 per diluted share, associated with the loss on the shutdown of certain tubular assets.
Segment results improved by $205 million compared to the first quarter of 2016, as results improved for all of our reportable segments.

Earnings (Loss) Before Interest and Income Taxes$ Millions
Flat-Rolled EBITDA Bridge4Q 2016 vs. 1Q 2017 ($ Millions)
1Q 2016 2Q 2016 3Q 2016
First Quarter 2017 Flat-Rolled Segment
4Q 2016 Commercial
RawMaterials
Flat-Rolled EBITDA Bridge1Q 2016 vs. 1Q 2017 ($ Millions)
1Q2016 Commercial
All OtherCost & Income
United States Steel Corporation
($188)
$6
$114 $65
($90)
EBITDA$ Millions
($97)
$95
$201 $147
$9
1Q 2016 2Q 2016 3Q 20164Q 2016 1Q 2017 4Q 2016 1Q 2017
LIFOAll Other
Costs & IncomeRaw
Materials1Q
2017
Note: For reconciliation of non-GAAP amounts see Appendix
Significant headwinds quarter-over-quarter
Market conditions and operating challenges create earnings volatility
$147
($72)
($60)
($95)$9
$89
1Q 2017
($97)
($36)
($60) $9$202
Strong improvement year-over-year
28
Last quarter we disclosed several headwinds that would impact our first quarter Flat-Rolled results:
• Higher raw material costs;• Higher energy costs;• Higher maintenance and outage costs; and• Facility restarts at Keetac and the Granite City hot strip mill
In addition to these items, the normal seasonal impact on our mining operations always has an adverse effect in the first quarter compared to the fourth quarter.
First quarter results for our Flat-Rolled segment declined significantly compared with the fourth quarter, as we expected, primarily due to higher raw material costs, increased planned outage costs, seasonally lower results from our mining operations, and restart costs associated with the Granite City hot strip mill and our Keetac iron ore mine. Also contributing to the decline in results was a $20 million charge from using the last-in-first-out (LIFO) inventory method in the first quarter, while we recognized a $40 million LIFO benefit in the fourth quarter. These factors were only partially offset by higher average realized prices and benefits from slightly increased shipments that were limited by operating challenges at our facilities.
The increase in Flat-Rolled results for the three months ended March 31, 2017 compared to the same period in 2016 resulted from higher average realized prices as a result of improved market conditions, partially offset by higher raw materials costs (including higher energy costs), increased planned outage costs and other operating expenses, lower results from our mining operations, and restart costs associated with the Granite City hot strip mill and our Keetac iron ore mine.
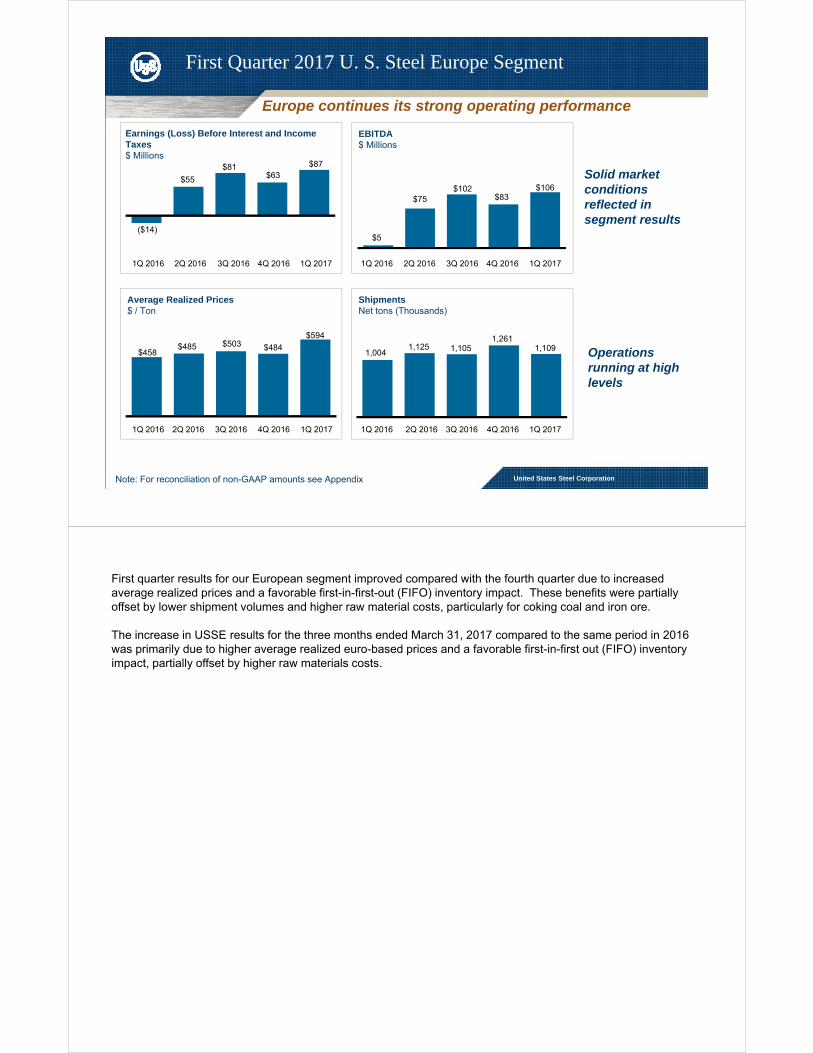
Earnings (Loss) Before Interest and Income Taxes$ Millions
Average Realized Prices$ / Ton
1Q 2016 2Q 2016 3Q 2016
First Quarter 2017 U. S. Steel Europe Segment
1Q 2016 2Q 2016 3Q 2016
ShipmentsNet tons (Thousands)
1Q 2016 2Q 2016 3Q 2016
United States Steel Corporation
($14)
$55
$81 $63
$87
$458 $485 $503 $484
$594
1,0041,125 1,105
1,2611,109
EBITDA$ Millions
$5
$75 $102
$83 $106
1Q 2016 2Q 2016 3Q 20164Q 2016 1Q 2017 4Q 2016 1Q 2017
4Q 2016 1Q 2017 4Q 2016 1Q 2017
Europe continues its strong operating performance
Note: For reconciliation of non-GAAP amounts see Appendix
Operations running at high levels
Solid market conditions reflected in segment results
30
First quarter results for our European segment improved compared with the fourth quarter due to increased average realized prices and a favorable first-in-first-out (FIFO) inventory impact. These benefits were partially offset by lower shipment volumes and higher raw material costs, particularly for coking coal and iron ore.
The increase in USSE results for the three months ended March 31, 2017 compared to the same period in 2016 was primarily due to higher average realized euro-based prices and a favorable first-in-first out (FIFO) inventory impact, partially offset by higher raw materials costs.
Loss Before Interest and Income Taxes$ Millions
Average Realized Prices$ / Ton
1Q 2016 2Q 2016 3Q 2016
First Quarter 2017 Tubular Segment
1Q 2016 2Q 2016 3Q 2016
ShipmentsNet tons (Thousands)
1Q 2016 2Q 2016 3Q 2016
United States Steel Corporation
($64)($78) ($75)
($87)
($57)
$1,180
$1,050 $1,049 $1,027 $1,097
8970
103
138 144
EBITDA$ Millions
($47)
($61) ($58)
($70)
($42)
1Q 2016 2Q 2016 3Q 20164Q 2016 1Q 2017 4Q 2016 1Q 2017
4Q 2016 1Q 2017 4Q 2016 1Q 2017
Note: For reconciliation of non-GAAP amounts see Appendix
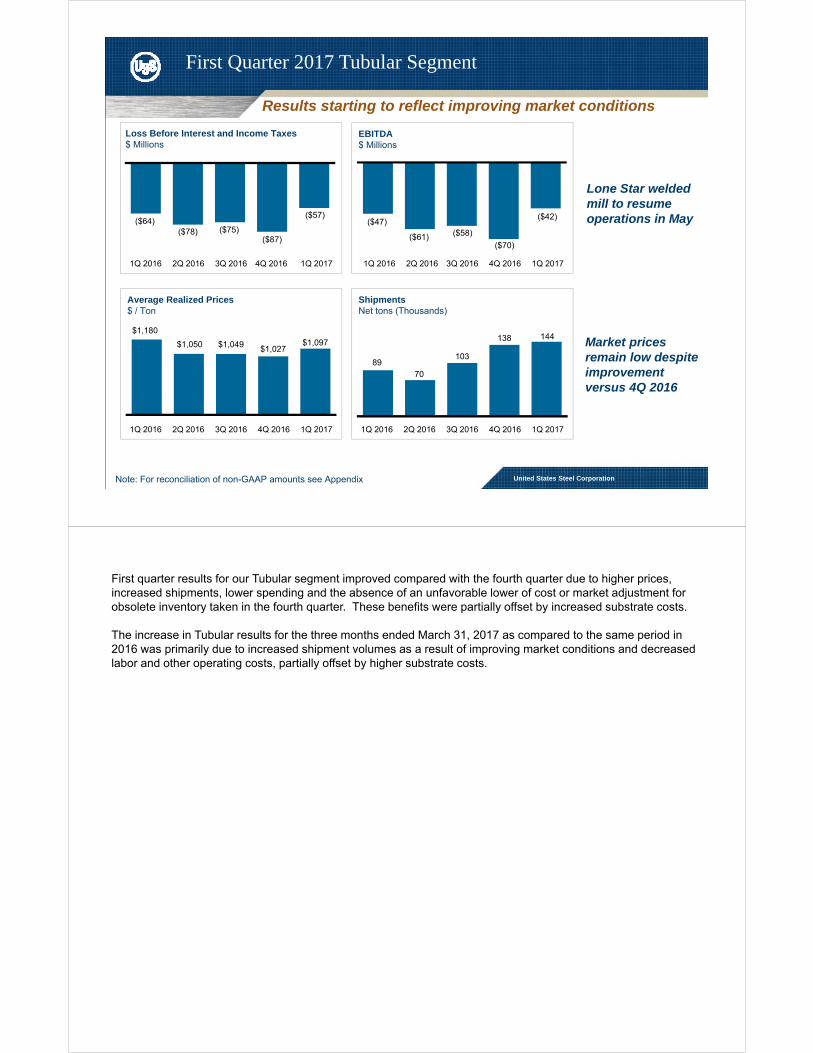
Results starting to reflect improving market conditions
Lone Star welded mill to resume operations in May
Market prices remain low despite improvement versus 4Q 2016
32
First quarter results for our Tubular segment improved compared with the fourth quarter due to higher prices, increased shipments, lower spending and the absence of an unfavorable lower of cost or market adjustment for obsolete inventory taken in the fourth quarter. These benefits were partially offset by increased substrate costs.
The increase in Tubular results for the three months ended March 31, 2017 as compared to the same period in 2016 was primarily due to increased shipment volumes as a result of improving market conditions and decreased labor and other operating costs, partially offset by higher substrate costs.
© 2011 United States Steel Corporation
Appendix
United States Steel Corporation
Major end markets summary
Flat-Rolled Segment
United States Steel Corporation
AutomotiveMarch vehicle sales fell by 1.7% versus last year to 1.54 million units, suggesting a sales SAAR of 16.53 million.1Q’17 sales were 17.1 million (SAAR), down from 17.2 million in 1Q’16.Inventory on March 31 increased to 4.145 million, with days’ supply down 2 to 72.
Industrial Equipment
Market appears relatively flat at this time, as manufacturers continue to wait for details on the proposed infrastructure bill and impact to yellow goods. Railcar industry optimistic; any slowing in tankers due to pipeline construction could be offset by (coal) hopper cars.
Tin Plate Domestic tin mill shipments decreased 8% for the first two months of 2017.1Q’17 tin mill imports up 12% y-o-y, continuing to take domestic market share.
Appliance March AHAM6 appliance shipments totaled 4.456 million units, flat versus February and up only 0.6% y-o-y.For the first quarter 2017, units shipments are +2.5% versus the year ago period.
Pipe and Tube
Structural tubing sentiment remains positive; following projected construction season increases.Line pipe orders have increased since January 2017, and numerous high volume project inquiries outstanding as well.OCTG demand improving and current supply chain is tight despite high imports.
Construction
March housing starts annualized at 1.215 million, up 9.2% y-o-y, and completions up 13.4% y-o-y.Construction spending up 3.0% y-o-y in February; private residential solid (+6.2%), gov’t weak(-7.2% y-o-y).March Dodge Momentum Index score increased 0.9% versus February to 144.4, higher than year ago levels and improved 6 consecutive months, suggesting forward looking non-residential construction improvement.March Architectural Billings Index (ABI) increased 7.1% versus February to 54.3, and is 4.6% higher than March 2016.
Service Center
March MSCI carbon flat-rolled increase to best month since March ‘14. 106,700 tons per day shipped represents an increase of 352,000 tons versus February, and a >10% improvement versus March 2016. Carbon Flat Roll inventories dropped to 1.8 months, a reduction of 156,000 from February, and a 535,000 ton (-10.7%) drop from the same period last year.
Sources: Wards / AHAM / US DOC / Customer Reports / AISI /US Census Bureau / FW Dodge / Dept of Commerce / AIA / MSCI / worldsteel

Market industry summary
Tubular Segment
United States Steel Corporation
Sources: Baker Hughes, US Energy Information Administration, Preston Publishing, Internal
Oil Directed Rig Count
U.S. energy companies continued to increase drilling rates during 1Q. The oil directed rig count averaged 593 during 1Q, an increase of 26% quarter over quarter (q-o-q). As of April 21, 2017, there were 688 active oil rigs.
Gas Directed Rig Count
Improving natural gas market fundamentals and outlook resulted in increased drilling during 1Q. The natural gas directed rig count averaged 148 during 1Q, an increase of 28% q-o-q. As of April 21, 2017, there were 167 active natural gas rigs.
Natural Gas Storage Level
As of March 31, 2017, there was 2.1 Tcf of natural gas in storage, down 17% y-o-y.
Oil Price The West Texas Intermediate oil price averaged $52 per barrel during 1Q, up $3 or 6% q-o-q.
Natural Gas Price The Henry Hub natural gas price averaged $3.02 per million btu during 1Q, down $0.02 or 1% q-o-q.
Imports Imports of OCTG remain high. During 1Q, import share of OCTG apparent market demand is projected to exceed 50%.
OCTG Inventory Overall, OCTG supply chain inventory continues to decline. Months supply is below 2.
Major end markets summary
United States Steel Corporation
U. S. Steel Europe SegmentSources: Eurofer, USSK Marketing, IHS, Eurometal, Euroconstruct
Automotive
EU car production reached 5.1 million units in 1Q ‘17, an increase of 3.6% y-o-y. EU car production is projected to fall by 5.2% y-o-y in 2Q to 4.9 million units. Increase of 1% y-o-y to 18.8 million units is currently projected for 2017. Total V4 car production reached 0.92 million units in 1Q ‘17, an increase of 2.9% y-o-y. V4 car production is anticipated to decrease by 6.7% y-o-y in 2Q to 0.9 million units. V4 car production is expected to decrease by 0.5% y-o-y in 2017 close to 3.5 million units. The reason for the small decrease is the change in produced models.
ApplianceThe EU appliance sector in 1Q ‘17 is expected to be flat y-o-y. 2Q ‘17 is expected to decrease by 1% y-o-y. Overall in 2017, the appliance market is anticipate to grow by 0.3% y-o-y in the EU. In Central Europe, as a result of expected residential construction sector performance and increased demand for home appliances, the sector is projected to grow by 1.9 % y-o-y.
Tin PlateDue to lower demand caused by higher prices, EU tin consumption in 1Q decreased by 7% y-o-y. Asian imports are low. 2Q ‘17 consumption is expected to increase by 10% q-o-q. 2017 demand is expected to increase 1% versus 2016.
Construction
Total construction activity in EU is forecasted to expand by 1.4% y-o-y in 1Q ‘17 and by 1.8% y-o-y in 2Q ‘17. The strength of the residential sector will continue in many Western European countries. In the UK, Brexit is expected to impact construction demand due to reduced investor confidence. The availability of EU funds for infrastructure projects in Central Europe will lead to a resumption of construction sector activity growth in this region. Total output is anticipated to grow by 2.1% in EU and by 3.5% in Central Europe for 2017.
Service Centers
Although the end-user market has been rather healthy in March, demand from steel service centers and distributors has not strengthened due to high inventory level as they bought large volumes in the past months. Buyers remain in wait-and-see mode and are closely monitoring developments in the EU as well as global markets.
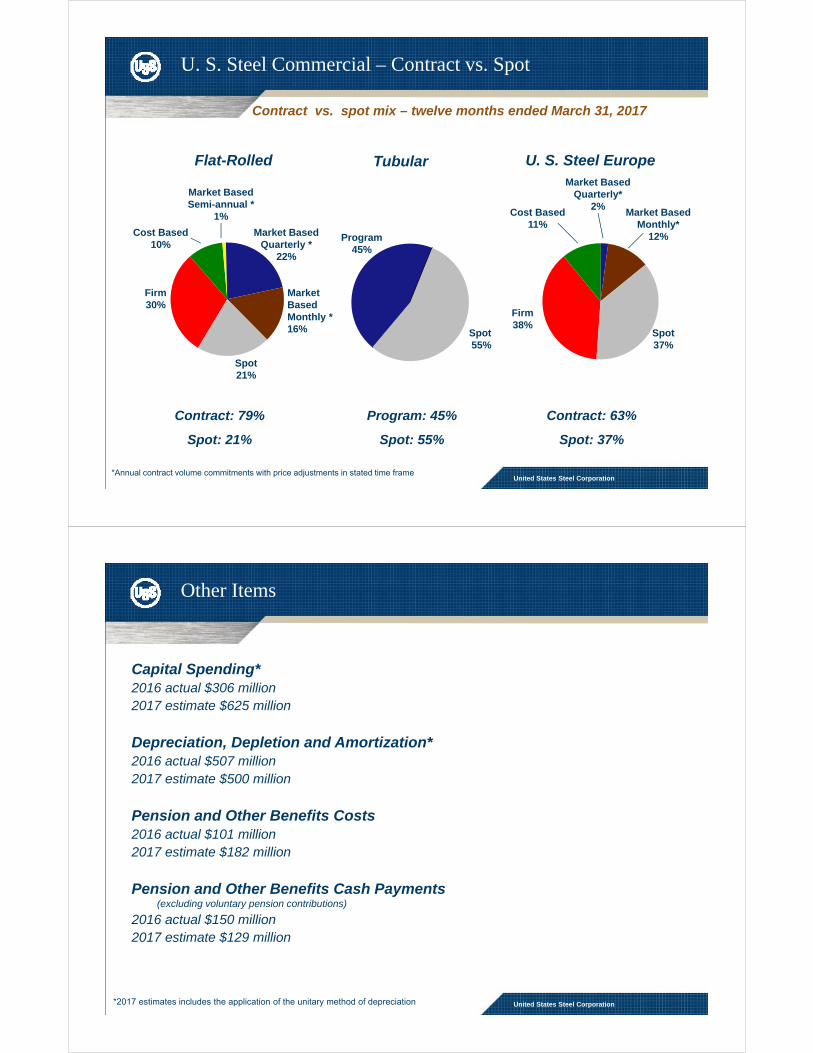
U. S. Steel Commercial – Contract vs. Spot
Contract vs. spot mix – twelve months ended March 31, 2017
Firm30%
Market Based Quarterly *
22%
Flat-Rolled
Market Based Monthly *16%
Tubular U. S. Steel Europe
Spot21%
Cost Based10%
Contract: 79%
Spot: 21%
Firm38%
Market Based Quarterly*
2%
Spot37%
Cost Based11%
Program45%
Contract: 63%
Spot: 37%
Market Based Monthly*
12%
Spot55%
Program: 45%
Spot: 55%
United States Steel Corporation
Market Based Semi-annual *
1%
*Annual contract volume commitments with price adjustments in stated time frame
United States Steel Corporation
Other Items
Capital Spending*2016 actual $306 million2017 estimate $625 million
Depreciation, Depletion and Amortization*2016 actual $507 million2017 estimate $500 million
Pension and Other Benefits Costs2016 actual $101 million2017 estimate $182 million
Pension and Other Benefits Cash Payments (excluding voluntary pension contributions)
2016 actual $150 million2017 estimate $129 million
*2017 estimates includes the application of the unitary method of depreciation
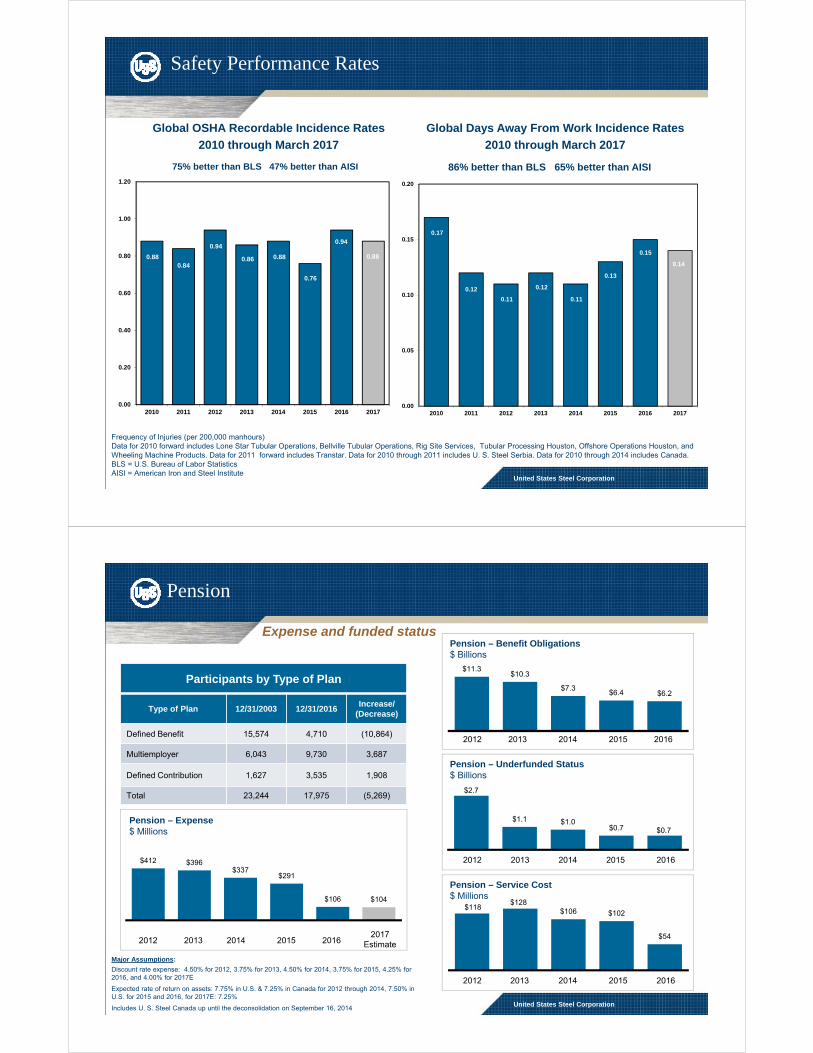
Safety Performance Rates
0.880.84
0.94
0.86 0.88
0.76
0.94
0.88
0.00
0.20
0.40
0.60
0.80
1.00
1.20
2010 2011 2012 2013 2014 2015 2016 2017
Global OSHA Recordable Incidence Rates
2010 through March 2017
United States Steel Corporation
Frequency of Injuries (per 200,000 manhours)Data for 2010 forward includes Lone Star Tubular Operations, Bellville Tubular Operations, Rig Site Services, Tubular Processing Houston, Offshore Operations Houston, and Wheeling Machine Products. Data for 2011 forward includes Transtar. Data for 2010 through 2011 includes U. S. Steel Serbia. Data for 2010 through 2014 includes Canada.BLS = U.S. Bureau of Labor StatisticsAISI = American Iron and Steel Institute
0.17
0.12
0.11
0.12
0.11
0.13
0.15
0.14
0.00
0.05
0.10
0.15
0.20
2010 2011 2012 2013 2014 2015 2016 2017
Global Days Away From Work Incidence Rates
2010 through March 2017
86% better than BLS 65% better than AISI75% better than BLS 47% better than AISI
Pension
Expense and funded status
$412 $396 $337
$291
$106 $104
Participants by Type of Plan
Type of Plan 12/31/2003 12/31/2016Increase/
(Decrease)
Defined Benefit 15,574 4,710 (10,864)
Multiemployer 6,043 9,730 3,687
Defined Contribution 1,627 3,535 1,908
Total 23,244 17,975 (5,269)
Major Assumptions:
Discount rate expense: 4.50% for 2012, 3.75% for 2013, 4.50% for 2014, 3.75% for 2015, 4.25% for 2016, and 4.00% for 2017E
Expected rate of return on assets: 7.75% in U.S. & 7.25% in Canada for 2012 through 2014, 7.50% in U.S. for 2015 and 2016, for 2017E: 7.25%
Includes U. S. Steel Canada up until the deconsolidation on September 16, 2014
Pension – Benefit Obligations$ Billions
Pension – Underfunded Status$ Billions
Pension – Service Cost$ Millions
2012 2013 2014 2015 2016
2012 2013 2014 2015 2016
2012 2013 2014 2015 2016
Pension – Expense$ Millions
2012 2013 2014 2015 20162017
Estimate
United States Steel Corporation
$11.3$10.3
$7.3$6.4 $6.2
$2.7
$1.1 $1.0$0.7 $0.7
$118 $128
$106 $102
$54
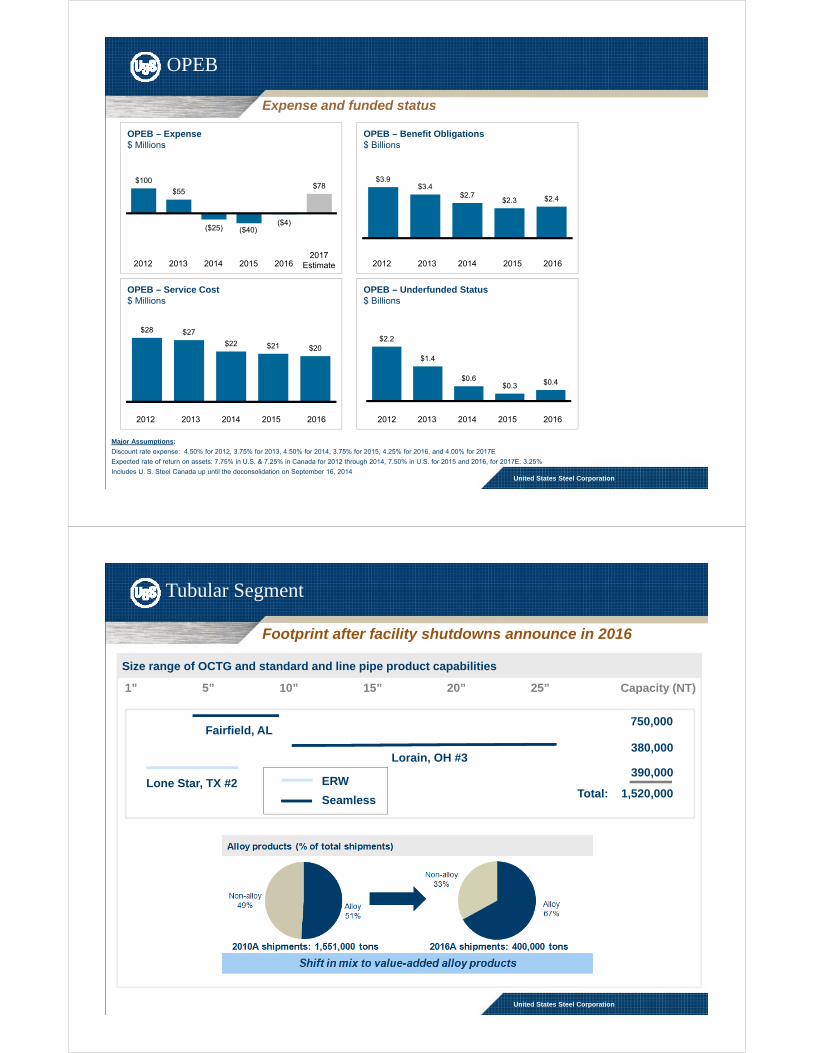
OPEB
Expense and funded status
Major Assumptions:
Discount rate expense: 4.50% for 2012, 3.75% for 2013, 4.50% for 2014, 3.75% for 2015, 4.25% for 2016, and 4.00% for 2017E
Expected rate of return on assets: 7.75% in U.S. & 7.25% in Canada for 2012 through 2014, 7.50% in U.S. for 2015 and 2016, for 2017E: 3.25%
Includes U. S. Steel Canada up until the deconsolidation on September 16, 2014
OPEB – Expense$ Millions
2012 2013 2014 2015 2016
OPEB – Benefit Obligations$ Billions
2012 2013 2014 2015 2016
OPEB – Service Cost$ Millions
2017Estimate
OPEB – Underfunded Status$ Billions
2012 2013 2014 2015 2016 2012 2013 2014 2015 2016
United States Steel Corporation
$100
$55
($25) ($40)($4)
$78 $3.9
$3.4$2.7
$2.3 $2.4
$28 $27
$22 $21 $20 $2.2
$1.4
$0.6$0.3 $0.4
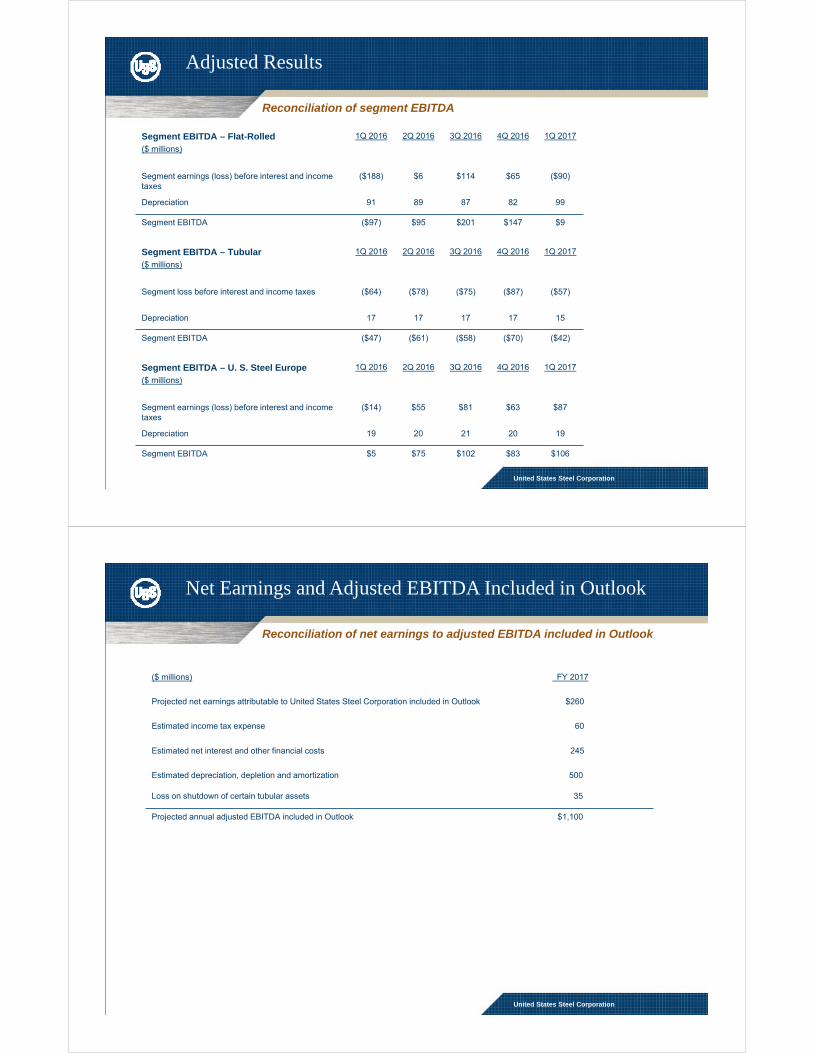
Size range of OCTG and standard and line pipe product capabilities
1” 5” 10” 15” 20” 25”
Lone Star, TX #2
Fairfield, AL
Lorain, OH #3
Capacity (NT)
750,000
380,000
390,000
Total: 1,520,000ERW
Seamless
Tubular Segment
Footprint after facility shutdowns announce in 2016
United States Steel Corporation
United States Steel Corporation
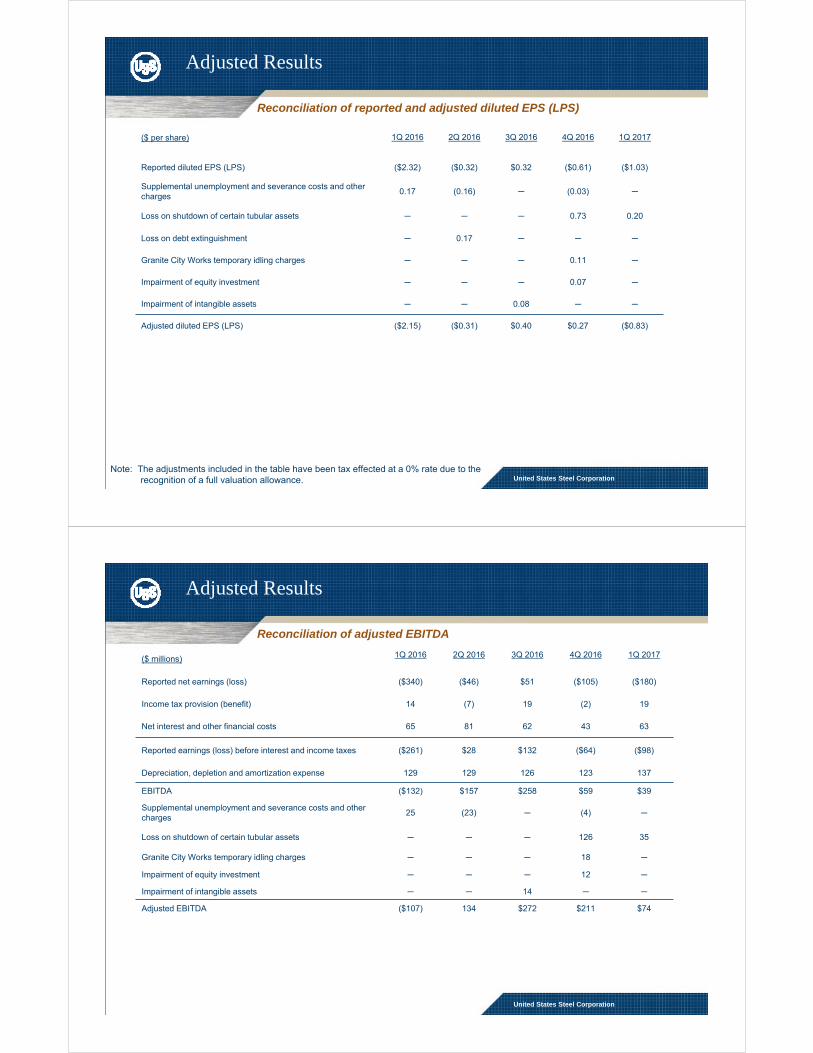
Adjusted Results
Segment EBITDA – Flat-Rolled($ millions)
1Q 2016 2Q 2016 3Q 2016 4Q 2016 1Q 2017
Segment earnings (loss) before interest and income taxes
($188) $6 $114 $65 ($90)
Depreciation 91 89 87 82 99
Segment EBITDA ($97) $95 $201 $147 $9
Reconciliation of segment EBITDA
Segment EBITDA – Tubular($ millions)
1Q 2016 2Q 2016 3Q 2016 4Q 2016 1Q 2017
Segment loss before interest and income taxes ($64) ($78) ($75) ($87) ($57)
Depreciation 17 17 17 17 15
Segment EBITDA ($47) ($61) ($58) ($70) ($42)
Segment EBITDA – U. S. Steel Europe($ millions)
1Q 2016 2Q 2016 3Q 2016 4Q 2016 1Q 2017
Segment earnings (loss) before interest and income taxes
($14) $55 $81 $63 $87
Depreciation 19 20 21 20 19
Segment EBITDA $5 $75 $102 $83 $106
United States Steel Corporation
Net Earnings and Adjusted EBITDA Included in Outlook
Reconciliation of net earnings to adjusted EBITDA included in Outlook
($ millions) FY 2017
Projected net earnings attributable to United States Steel Corporation included in Outlook $260
Estimated income tax expense 60
Estimated net interest and other financial costs 245
Estimated depreciation, depletion and amortization 500
Loss on shutdown of certain tubular assets 35
Projected annual adjusted EBITDA included in Outlook $1,100

United States Steel Corporation
Net Debt
Net Debt($ millions)
YE 2014 YE 2015 YE 2016 1Q 2017
Short-term debt and current maturities of long-term debt $378 $45 $50 $281
Long-term debt, less unamortized discount 3,086 3,093 2,981 2,752
Total Debt $3,464 $3,138 $3,031 $3,033
Less: Cash and cash equivalents 1,354 755 1,515 1,326
Net Debt $2,110 $2,383 $1,516 $1,707
Reconciliation of net debt
United States Steel Corporation
Adjusted Results
($ millions)1Q 2016 2Q 2016 3Q 2016 4Q 2016 1Q 2017
Reported net earnings (loss) ($340) ($46) $51 ($105) ($180)
Supplemental unemployment and severance costs and other charges
25 (23) ─ (4) ─
Loss on shutdown of certain tubular assets ─ ─ ─ 126 35
Loss on debt extinguishment ─ 24 ─ ─ ─
Granite City Works temporary idling charges ─ ─ ─ 18 ─
Impairment of equity investment ─ ─ ─ 12 ─
Impairment of intangible assets ─ ─ 14 ─ ─
Adjusted net earnings (loss) ($315) ($45) $65 $47 ($145)
Reconciliation of reported and adjusted net earnings (losses)
Note: The adjustments included in the table have been tax effected at a 0% rate due to the recognition of a full valuation allowance.
United States Steel Corporation
Adjusted Results
($ per share) 1Q 2016 2Q 2016 3Q 2016 4Q 2016 1Q 2017
Reported diluted EPS (LPS) ($2.32) ($0.32) $0.32 ($0.61) ($1.03)
Supplemental unemployment and severance costs and other charges
0.17 (0.16) ─ (0.03) ─
Loss on shutdown of certain tubular assets ─ ─ ─ 0.73 0.20
Loss on debt extinguishment ─ 0.17 ─ ─ ─
Granite City Works temporary idling charges ─ ─ ─ 0.11 ─
Impairment of equity investment ─ ─ ─ 0.07 ─
Impairment of intangible assets ─ ─ 0.08 ─ ─
Adjusted diluted EPS (LPS) ($2.15) ($0.31) $0.40 $0.27 ($0.83)
Reconciliation of reported and adjusted diluted EPS (LPS)
Note: The adjustments included in the table have been tax effected at a 0% rate due to the recognition of a full valuation allowance.
United States Steel Corporation
Adjusted Results
($ millions) 1Q 2016 2Q 2016 3Q 2016 4Q 2016 1Q 2017
Reported net earnings (loss) ($340) ($46) $51 ($105) ($180)
Income tax provision (benefit) 14 (7) 19 (2) 19
Net interest and other financial costs 65 81 62 43 63
Reported earnings (loss) before interest and income taxes ($261) $28 $132 ($64) ($98)
Depreciation, depletion and amortization expense 129 129 126 123 137
EBITDA ($132) $157 $258 $59 $39
Supplemental unemployment and severance costs and other charges
25 (23) ─ (4) ─
Loss on shutdown of certain tubular assets ─ ─ ─ 126 35
Granite City Works temporary idling charges ─ ─ ─ 18 ─
Impairment of equity investment ─ ─ ─ 12 ─
Impairment of intangible assets ─ ─ 14 ─ ─
Adjusted EBITDA ($107) 134 $272 $211 $74
Reconciliation of adjusted EBITDA