Embed Size (px)
Citation preview
BIG THINGSWe do the
the right way
2017 Annual Report
United
Technolo
gies C
orp
oratio
n 2017 Annual R
epo
rt
United Technologies Corp. is a leader in the global building and aerospace businesses. Our company was founded by some of the world’s greatest inventors. Our more than 200,000 employees continue their commitment to innovation. Our large investments in technology enable us to develop new and improved ways to keep people safe, comfortable, productive and on the move. By combining a passion for science with precision engineering, we create smart, sustainable solutions that prove we can do the big things the right way.
Our commercial building businesses comprise Otis, the world’s leading manufacturer of elevators, escalators and moving walkways; and UTC Climate, Controls & Security, a leading provider of heating, ventilating, air-conditioning, refrigeration, fire and security systems, and building automation and controls. Our aerospace businesses consist of Pratt & Whitney aircraft engines and UTC Aerospace Systems. We also operate a central research organization that pursues technologies for improving the performance, energy efficiency and cost of our products and processes.
To learn more, visit www.utc.com.
Contents
01 Letter to Shareowners03 Business Highlights05 Financials30 Cautionary Note Concerning Factors
That May Affect Future Results69 Reconciliation of Non-GAAP Measures
to Corresponding GAAP Measures70 Board of Directors71 Leadership72 Shareowner InformationInside Back Cover Sustainability & Recognition
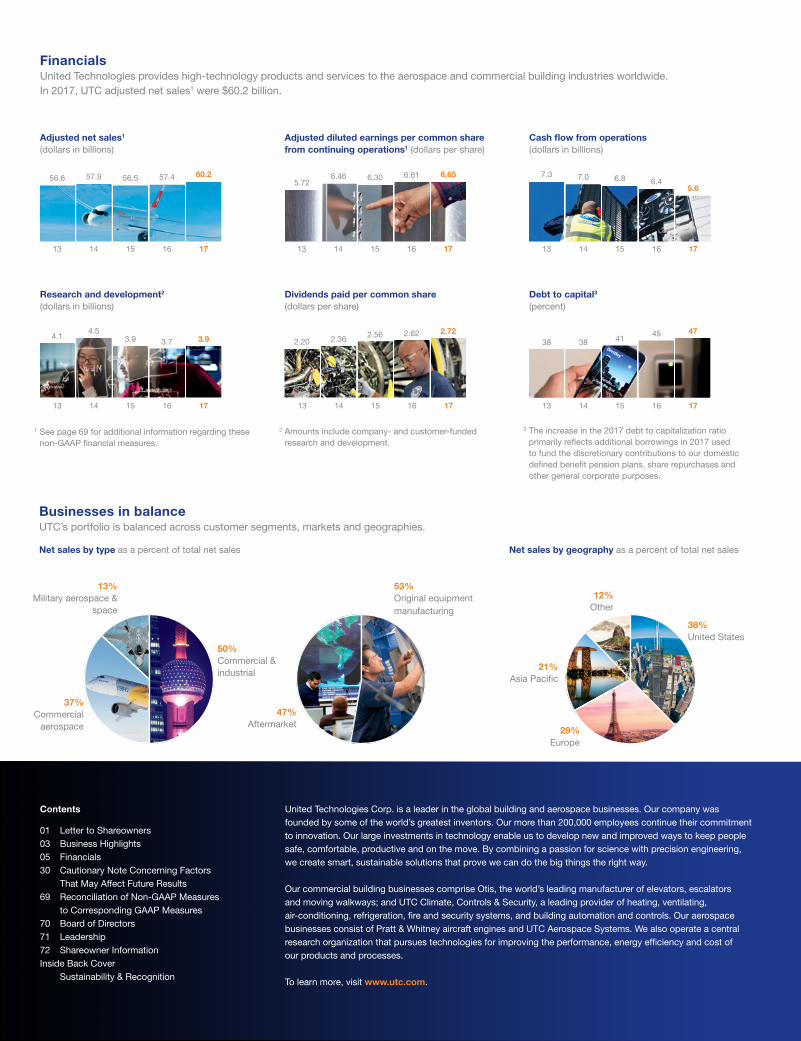
FinancialsUnited Technologies provides high-technology products and services to the aerospace and commercial building industries worldwide. In 2017, UTC adjusted net sales1 were $60.2 billion.
1 See page 69 for additional information regarding these non-GAAP financial measures.
Businesses in balanceUTC’s portfolio is balanced across customer segments, markets and geographies.
2 Amounts include company- and customer-funded research and development.
Net sales by type as a percent of total net sales Net sales by geography as a percent of total net sales
Adjusted diluted earnings per common share from continuing operations1 (dollars per share)
13 14 15 16 17
5.726.46 6.30 6.61 6.65
Cash flow from operations (dollars in billions)
13 14 15 16 17
7.3 7.0 6.8 6.45.6
13%Military aerospace &
space
50%Commercial & industrial
37%Commercial
aerospace
47%Aftermarket
53%Original equipment manufacturing
38%United States
29%Europe
21%Asia Pacific
12%Other
3 The increase in the 2017 debt to capitalization ratio primarily reflects additional borrowings in 2017 used to fund the discretionary contributions to our domestic defined benefit pension plans, share repurchases and other general corporate purposes.
Adjusted net sales1 (dollars in billions)
13 14 15 16 17
56.6 57.9 56.5 57.4 60.2
Research and development2 (dollars in billions)
13 14 15 16 17
4.14.5
3.9 3.7 3.9
Dividends paid per common share (dollars per share)
13 14 15 16 17
2.20 2.36 2.56 2.62 2.72
Debt to capital3 (percent)
13 14 15 16 17
38 38 4145 47
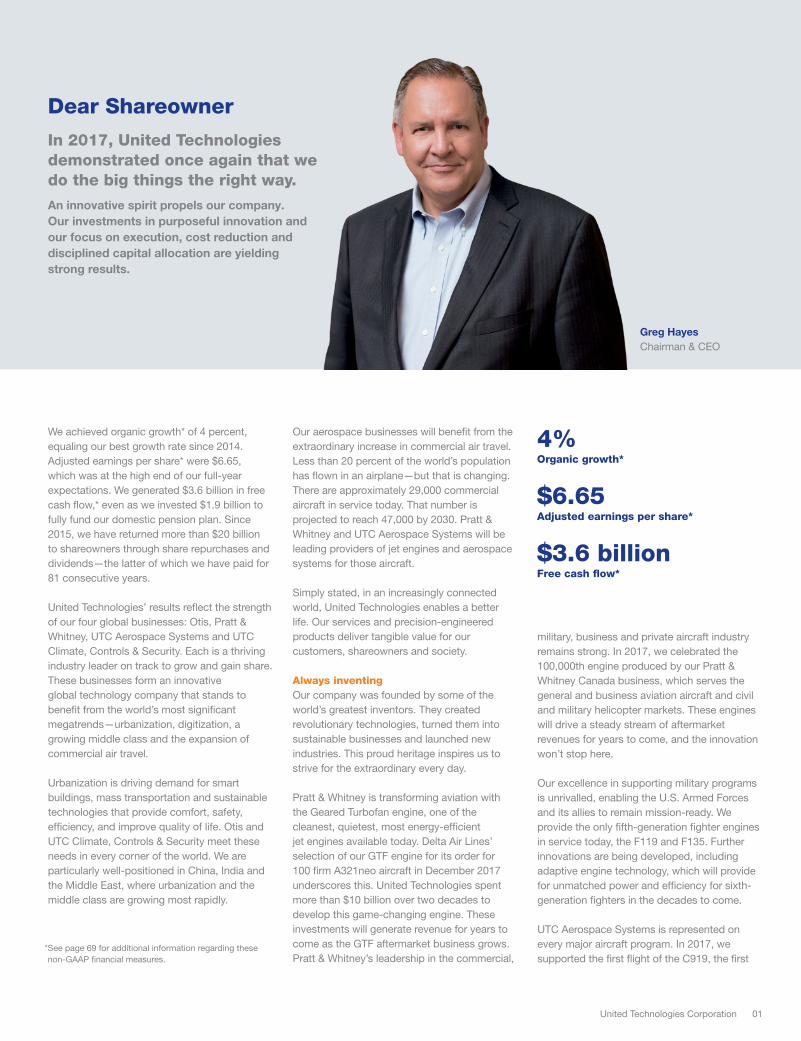
Dear Shareowner
We achieved organic growth* of 4 percent, equaling our best growth rate since 2014. Adjusted earnings per share* were $6.65, which was at the high end of our full-year expectations. We generated $3.6 billion in free cash flow,* even as we invested $1.9 billion to fully fund our domestic pension plan. Since 2015, we have returned more than $20 billion to shareowners through share repurchases and dividends—the latter of which we have paid for 81 consecutive years.
United Technologies’ results reflect the strength of our four global businesses: Otis, Pratt & Whitney, UTC Aerospace Systems and UTC Climate, Controls & Security. Each is a thriving industry leader on track to grow and gain share. These businesses form an innovativeglobal technology company that stands tobenefit from the world’s most significant megatrends—urbanization, digitization, a growing middle class and the expansion of commercial air travel.
Urbanization is driving demand for smart buildings, mass transportation and sustainable technologies that provide comfort, safety, efficiency, and improve quality of life. Otis and UTC Climate, Controls & Security meet these needs in every corner of the world. We are particularly well-positioned in China, India and the Middle East, where urbanization and the middle class are growing most rapidly.
Our aerospace businesses will benefit from the extraordinary increase in commercial air travel. Less than 20 percent of the world’s population has flown in an airplane—but that is changing. There are approximately 29,000 commercial aircraft in service today. That number is projected to reach 47,000 by 2030. Pratt & Whitney and UTC Aerospace Systems will be leading providers of jet engines and aerospace systems for those aircraft.
Simply stated, in an increasingly connected world, United Technologies enables a better life. Our services and precision-engineered products deliver tangible value for our customers, shareowners and society.
Always inventingOur company was founded by some of the world’s greatest inventors. They created revolutionary technologies, turned them into sustainable businesses and launched new industries. This proud heritage inspires us to strive for the extraordinary every day.
Pratt & Whitney is transforming aviation with the Geared Turbofan engine, one of the cleanest, quietest, most energy-efficient jet engines available today. Delta Air Lines’ selection of our GTF engine for its order for 100 firm A321neo aircraft in December 2017 underscores this. United Technologies spent more than $10 billion over two decades to develop this game-changing engine. These investments will generate revenue for years to come as the GTF aftermarket business grows. Pratt & Whitney’s leadership in the commercial,
In 2017, United Technologies demonstrated once again that we do the big things the right way.
An innovative spirit propels our company. Our investments in purposeful innovation and our focus on execution, cost reduction and disciplined capital allocation are yielding strong results.
Greg Hayes Chairman & CEO
United Technologies Corporation 01
* See page 69 for additional information regarding these non-GAAP financial measures.
military, business and private aircraft industry remains strong. In 2017, we celebrated the 100,000th engine produced by our Pratt & Whitney Canada business, which serves the general and business aviation aircraft and civil and military helicopter markets. These engines will drive a steady stream of aftermarket revenues for years to come, and the innovation won’t stop here.
Our excellence in supporting military programs is unrivalled, enabling the U.S. Armed Forces and its allies to remain mission-ready. We provide the only fifth-generation fighter engines in service today, the F119 and F135. Further innovations are being developed, including adaptive engine technology, which will provide for unmatched power and efficiency for sixth-generation fighters in the decades to come.
UTC Aerospace Systems is represented on every major aircraft program. In 2017, we supported the first flight of the C919, the first
4%Organic growth*
$6.65Adjusted earnings per share*
$3.6 billionFree cash flow*
large commercial jetliner designed and built in China. UTC Aerospace Systems is also growing its aftermarket services with comprehensive digital solutions that maximize operational efficiencies and benefit customers. Notably, we are extending our leadership in aerospace with the largest acquisition in our history. Our proposed $30 billion acquisition of Rockwell Collins will deliver tremendous value to our customers and shareowners. Rockwell Collins is recognized globally for its leading-edge avionics, flight controls, aircraft interior and data connectivity solutions, as well as its world-class customer service. The combined businesses will become Collins Aerospace Systems, an innovator that will make aircraft more intelligent and integrated.
Otis is pursuing an aggressive digital transformation to redefine its customers’ experiences. Through a strategic agreement with Microsoft, we are developing technology that empowers service technicians and sales teams with real-time equipment data to predict, monitor and respond to customer needs. Otis has a legacy of equipping the world’s most iconic structures. We continue to bring our innovative products and services to the most prestigious new buildings, including the Lotte World Tower in Seoul, which opened in 2017 and features one of the world’s fastest double-deck elevators.
UTC Climate, Controls & Security is also achieving organic growth through innovation. Our commercial businesses are using the
cloud and Internet of Things to design smarter, more sustainable products that improve lives. Carrier created a suite of new digital solutions to monitor and enhance HVAC performance and energy use. Our transport refrigeration business is also utilizing the power of the IoT to monitor food safety as we move perishable items from farm to table. UTC Climate, Controls & Security’s mission is to enable modern life by building upon its long history of developing powerful, reliable and energy-efficient products and services that support and sustain the ever more urbanizing world.
Driving growth through dataData plays an increasingly vital role in our growth opportunities. Our products generate vast amounts of data that can be deployed to benefit our customers and provide competitive advantages in the digital age.
To maximize the value of data, we established a new organization, United Technologies Digital. It reinvents the role of information technology in our company by expanding into software and data analytics. As part of this effort, we built a digital accelerator in Brooklyn, N.Y., where our business and technology talent collaborates to advance digital solutions that create value for customers, improve operations, empower employees, and enhance products and services. Our new digital team complements the well-established United Technologies Research Center. The mission of the Research Center is to use cutting-edge science and technology to solve our most
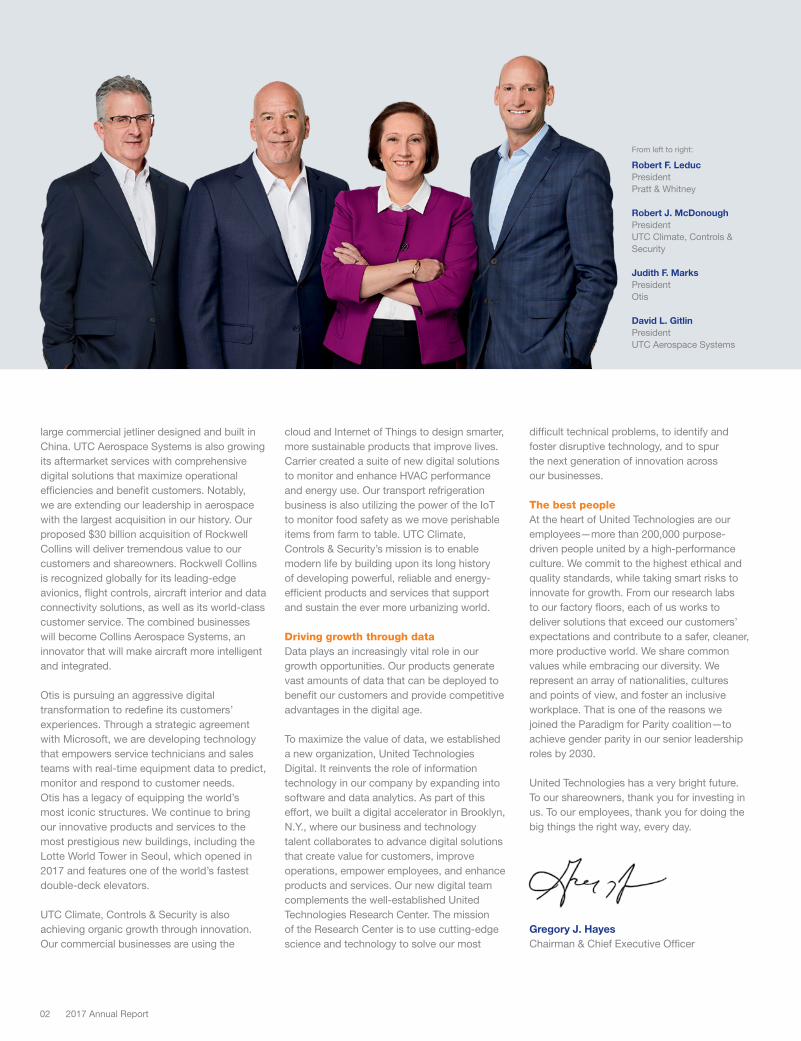
From left to right:
Robert F. LeducPresident Pratt & Whitney
Robert J. McDonoughPresident UTC Climate, Controls & Security
Judith F. MarksPresident Otis
David L. GitlinPresident UTC Aerospace Systems
02 2017 Annual Report
difficult technical problems, to identify and foster disruptive technology, and to spur the next generation of innovation across our businesses.
The best peopleAt the heart of United Technologies are our employees—more than 200,000 purpose-driven people united by a high-performance culture. We commit to the highest ethical and quality standards, while taking smart risks to innovate for growth. From our research labs to our factory floors, each of us works to deliver solutions that exceed our customers’ expectations and contribute to a safer, cleaner, more productive world. We share common values while embracing our diversity. We represent an array of nationalities, cultures and points of view, and foster an inclusive workplace. That is one of the reasons we joined the Paradigm for Parity coalition—to achieve gender parity in our senior leadership roles by 2030. United Technologies has a very bright future. To our shareowners, thank you for investing in us. To our employees, thank you for doing the big things the right way, every day.
Gregory J. HayesChairman & Chief Executive Officer
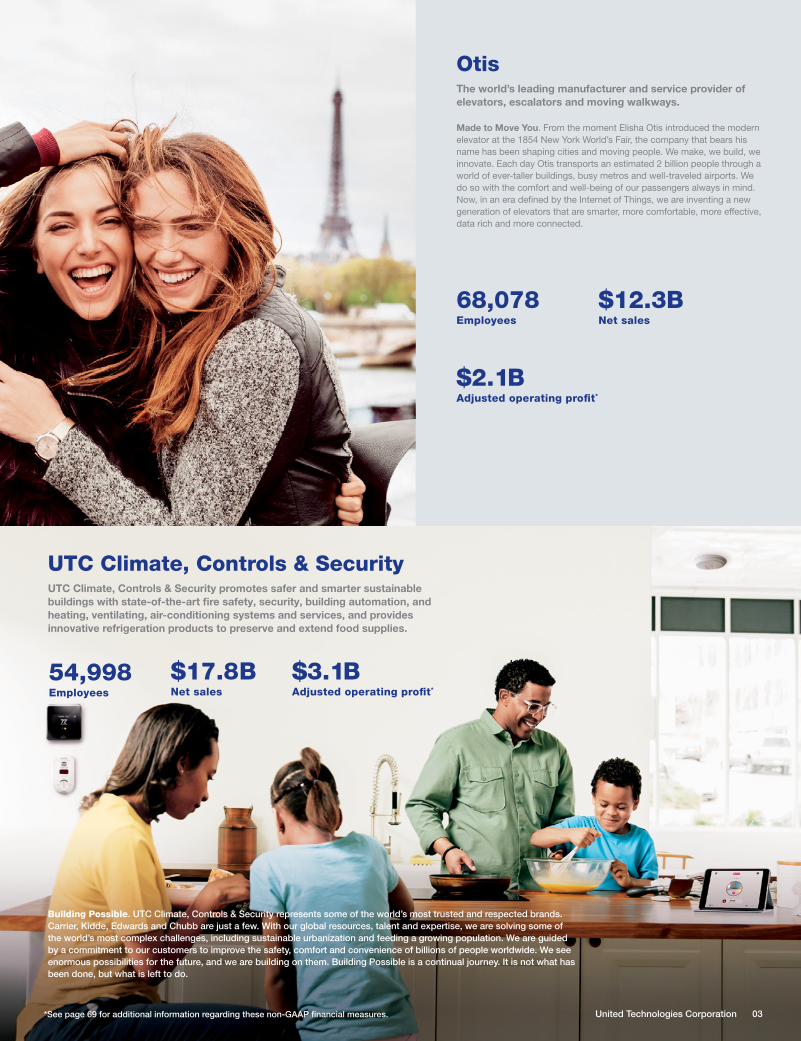
OtisThe world’s leading manufacturer and service provider of elevators, escalators and moving walkways.
Made to Move You. From the moment Elisha Otis introduced the modern elevator at the 1854 New York World’s Fair, the company that bears his name has been shaping cities and moving people. We make, we build, we innovate. Each day Otis transports an estimated 2 billion people through a world of ever-taller buildings, busy metros and well-traveled airports. We do so with the comfort and well-being of our passengers always in mind. Now, in an era defined by the Internet of Things, we are inventing a new generation of elevators that are smarter, more comfortable, more effective, data rich and more connected.
$12.3BNet sales
$2.1BAdjusted operating profit*
68,078Employees
* See page 69 for additional information regarding these non-GAAP financial measures.
UTC Climate, Controls & SecurityUTC Climate, Controls & Security promotes safer and smarter sustainable buildings with state-of-the-art fire safety, security, building automation, and heating, ventilating, air-conditioning systems and services, and provides innovative refrigeration products to preserve and extend food supplies.
$17.8BNet sales
$3.1BAdjusted operating profit*
54,998Employees
United Technologies Corporation 03
Building Possible. UTC Climate, Controls & Security represents some of the world’s most trusted and respected brands. Carrier, Kidde, Edwards and Chubb are just a few. With our global resources, talent and expertise, we are solving some of the world’s most complex challenges, including sustainable urbanization and feeding a growing population. We are guided by a commitment to our customers to improve the safety, comfort and convenience of billions of people worldwide. We see enormous possibilities for the future, and we are building on them. Building Possible is a continual journey. It is not what has been done, but what is left to do.
* See page 69 for additional information regarding these non-GAAP financial measures.
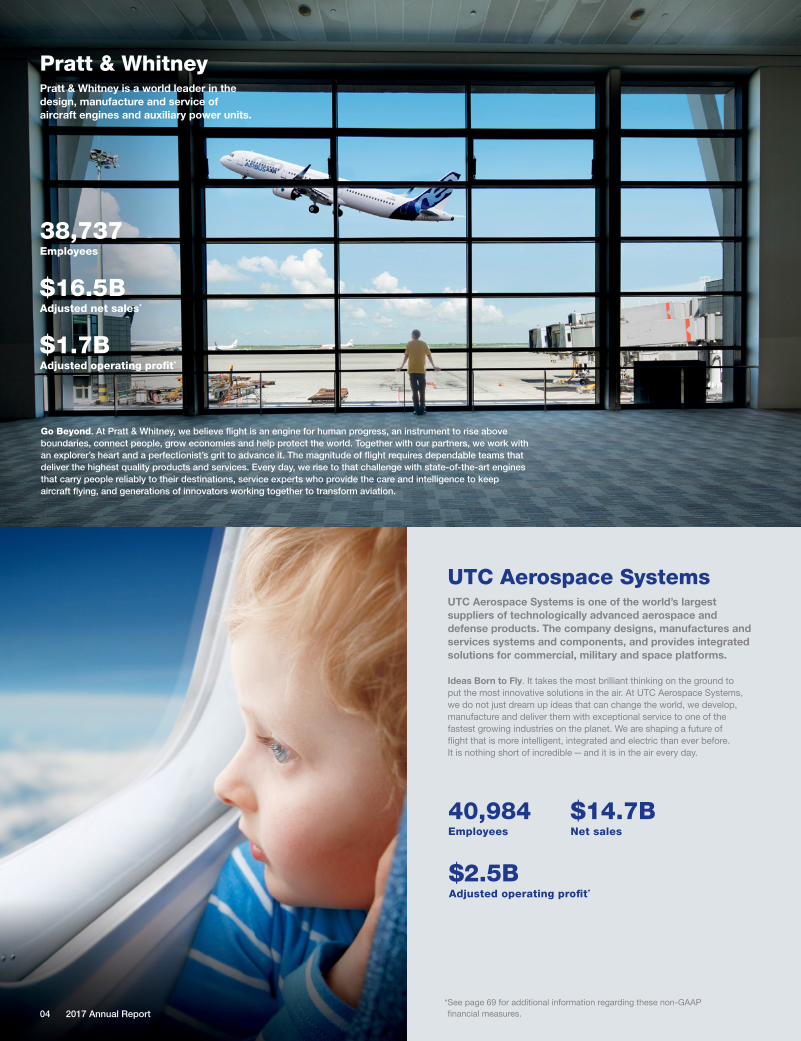
UTC Aerospace SystemsUTC Aerospace Systems is one of the world’s largest suppliers of technologically advanced aerospace and defense products. The company designs, manufactures and services systems and components, and provides integrated solutions for commercial, military and space platforms.
Ideas Born to Fly. It takes the most brilliant thinking on the ground to put the most innovative solutions in the air. At UTC Aerospace Systems, we do not just dream up ideas that can change the world, we develop, manufacture and deliver them with exceptional service to one of the fastest growing industries on the planet. We are shaping a future of flight that is more intelligent, integrated and electric than ever before. It is nothing short of incredible — and it is in the air every day.
$14.7BNet sales
$2.5BAdjusted operating profit*
40,984Employees
Pratt & WhitneyPratt & Whitney is a world leader in the design, manufacture and service of aircraft engines and auxiliary power units.
38,737Employees
$16.5BAdjusted net sales*
$1.7BAdjusted operating profit*
Go Beyond. At Pratt & Whitney, we believe flight is an engine for human progress, an instrument to rise above boundaries, connect people, grow economies and help protect the world. Together with our partners, we work with an explorer’s heart and a perfectionist’s grit to advance it. The magnitude of flight requires dependable teams that deliver the highest quality products and services. Every day, we rise to that challenge with state-of-the-art engines that carry people reliably to their destinations, service experts who provide the care and intelligence to keep aircraft flying, and generations of innovators working together to transform aviation.
04 2017 Annual Report
Financials06 Five-Year Summary
07 Management’s Discussion and Analysis
30 Cautionary Note Concerning Factors That May
Affect Future Results
32 Management’s Report on Internal Control Over
Financial Reporting
33 Report of Independent Registered Public Accounting Firm
34 Consolidated Statement of Operations
35 Consolidated Statement of Comprehensive Income
36 Consolidated Balance Sheet
37 Consolidated Statement of Cash Flows
38 Consolidated Statement of Changes in Equity
40 Notes to Consolidated Financial Statements
68 Selected Quarterly Financial Data
Go online to view the annual report and seemore of our business highlights and our corporateresponsibility achievements. 2017ar.utc.com
United Technologies Corporation 05
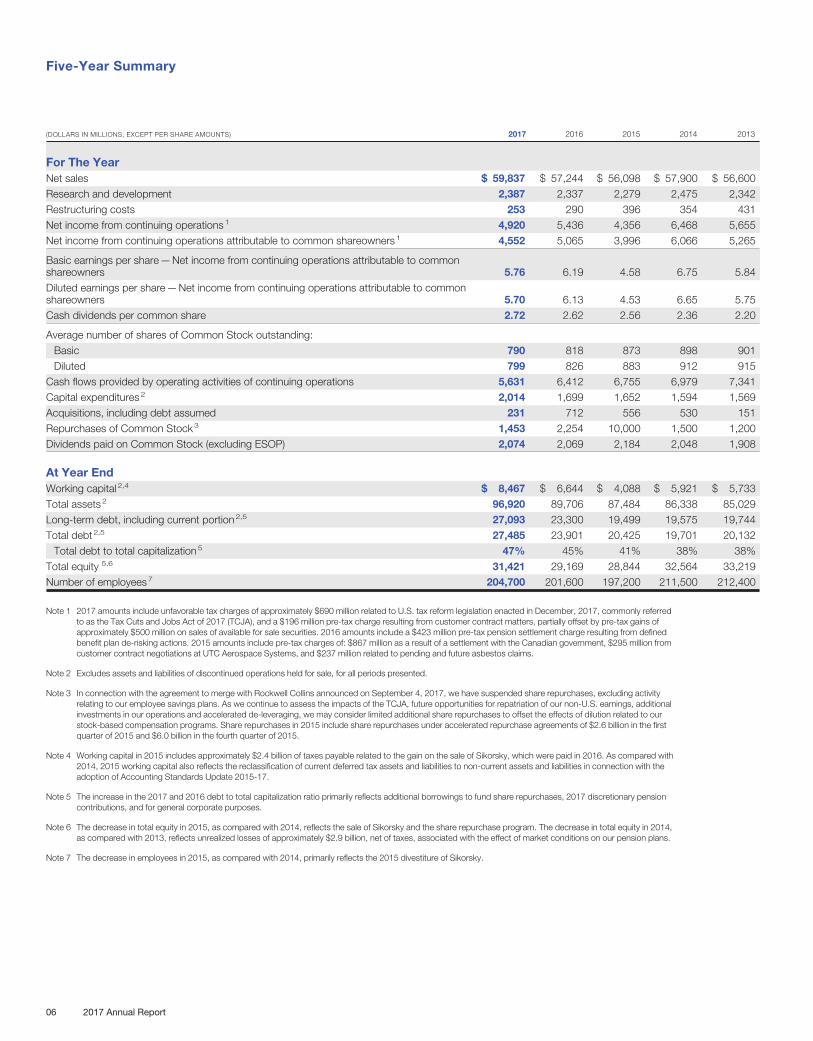
(DOLLARS IN MILLIONS, EXCEPT PER SHARE AMOUNTS) 2017 2016 2015 2014 2013
For The YearNet sales $ 59,837 $ 57,244 $ 56,098 $ 57,900 $ 56,600Research and development 2,387 2,337 2,279 2,475 2,342Restructuring costs 253 290 396 354 431Net income from continuing operations 1 4,920 5,436 4,356 6,468 5,655Net income from continuing operations attributable to common shareowners 1 4,552 5,065 3,996 6,066 5,265
Basic earnings per share—Net income from continuing operations attributable to commonshareowners 5.76 6.19 4.58 6.75 5.84Diluted earnings per share—Net income from continuing operations attributable to commonshareowners 5.70 6.13 4.53 6.65 5.75Cash dividends per common share 2.72 2.62 2.56 2.36 2.20
Average number of shares of Common Stock outstanding:Basic 790 818 873 898 901Diluted 799 826 883 912 915
Cash flows provided by operating activities of continuing operations 5,631 6,412 6,755 6,979 7,341Capital expenditures 2 2,014 1,699 1,652 1,594 1,569Acquisitions, including debt assumed 231 712 556 530 151Repurchases of Common Stock 3 1,453 2,254 10,000 1,500 1,200Dividends paid on Common Stock (excluding ESOP) 2,074 2,069 2,184 2,048 1,908
At Year EndWorking capital 2,4 $ 8,467 $ 6,644 $ 4,088 $ 5,921 $ 5,733Total assets 2 96,920 89,706 87,484 86,338 85,029Long-term debt, including current portion 2,5 27,093 23,300 19,499 19,575 19,744Total debt 2,5 27,485 23,901 20,425 19,701 20,132
Total debt to total capitalization 5 47% 45% 41% 38% 38%Total equity 5,6 31,421 29,169 28,844 32,564 33,219Number of employees 7 204,700 201,600 197,200 211,500 212,400
Note 1 2017 amounts include unfavorable tax charges of approximately $690 million related to U.S. tax reform legislation enacted in December, 2017, commonly referredto as the Tax Cuts and Jobs Act of 2017 (TCJA), and a $196 million pre-tax charge resulting from customer contract matters, partially offset by pre-tax gains ofapproximately $500 million on sales of available for sale securities. 2016 amounts include a $423 million pre-tax pension settlement charge resulting from definedbenefit plan de-risking actions. 2015 amounts include pre-tax charges of: $867 million as a result of a settlement with the Canadian government, $295 million fromcustomer contract negotiations at UTC Aerospace Systems, and $237 million related to pending and future asbestos claims.
Note 2 Excludes assets and liabilities of discontinued operations held for sale, for all periods presented.
Note 3 In connection with the agreement to merge with Rockwell Collins announced on September 4, 2017, we have suspended share repurchases, excluding activityrelating to our employee savings plans. As we continue to assess the impacts of the TCJA, future opportunities for repatriation of our non-U.S. earnings, additionalinvestments in our operations and accelerated de-leveraging, we may consider limited additional share repurchases to offset the effects of dilution related to ourstock-based compensation programs. Share repurchases in 2015 include share repurchases under accelerated repurchase agreements of $2.6 billion in the firstquarter of 2015 and $6.0 billion in the fourth quarter of 2015.
Note 4 Working capital in 2015 includes approximately $2.4 billion of taxes payable related to the gain on the sale of Sikorsky, which were paid in 2016. As compared with2014, 2015 working capital also reflects the reclassification of current deferred tax assets and liabilities to non-current assets and liabilities in connection with theadoption of Accounting Standards Update 2015-17.
Note 5 The increase in the 2017 and 2016 debt to total capitalization ratio primarily reflects additional borrowings to fund share repurchases, 2017 discretionary pensioncontributions, and for general corporate purposes.
Note 6 The decrease in total equity in 2015, as compared with 2014, reflects the sale of Sikorsky and the share repurchase program. The decrease in total equity in 2014,as compared with 2013, reflects unrealized losses of approximately $2.9 billion, net of taxes, associated with the effect of market conditions on our pension plans.
Note 7 The decrease in employees in 2015, as compared with 2014, primarily reflects the 2015 divestiture of Sikorsky.
Five-Year Summary
06 2017 Annual Report
Management’s Discussion and Analysis of FinancialCondition and Results of Operations
BUSINESS OVERVIEWWe are a global provider of high technology products and servicesto the building systems and aerospace industries. Our operations forthe periods presented herein are classified into four principal businesssegments: Otis, UTC Climate, Controls & Security, Pratt & Whitney, andUTC Aerospace Systems. Otis and UTC Climate, Controls & Securityare referred to as the “commercial businesses,” while Pratt & Whitneyand UTC Aerospace Systems are referred to as the “aerospacebusinesses.” On November 6, 2015, we completed the sale of theSikorsky Aircraft business (Sikorsky) to Lockheed Martin Corp. forapproximately $9.1 billion in cash. The results of operations and therelated cash flows of Sikorsky have been reclassified to DiscontinuedOperations in our Consolidated Statements of Operations and CashFlows for all periods presented.
The commercial businesses generally serve customers in theworldwide commercial and residential property industries, withUTC Climate, Controls & Security also serving customers in thecommercial and transport refrigeration industries. The aerospacebusinesses serve commercial and government aerospace customersin both the original equipment and aftermarket parts and servicesmarkets. Our consolidated net sales were derived from the commercialand aerospace businesses as follows:
2017 2016 2015
Commercial and industrial 50% 50% 52%
Military aerospace and space 13% 12% 12%
Commercial aerospace 37% 38% 36%
100% 100% 100%
Our consolidated net sales were derived from original equipmentmanufacturing (OEM) and aftermarket parts and services as follows:
2017 2016 2015
OEM 53% 55% 56%
Aftermarket parts and services 47% 45% 44%
100% 100% 100%
Our worldwide operations can be affected by industrial, economicand political factors on both a regional and global level. To limit theimpact of any one industry or the economy of any single country on ourconsolidated operating results, our strategy has been, and continues tobe, the maintenance of a balanced and diversified portfolio of busi-nesses. Our operations include original equipment manufacturing (OEM)and extensive related aftermarket parts and services in both our com-mercial and aerospace businesses. Our business mix also reflects thecombination of shorter cycles at UTC Climate, Controls & Security andin our commercial aerospace spares businesses, and longer cycles atOtis and in our aerospace OEM and aftermarket maintenance busi-nesses. Our customers include companies in both the public andprivate sectors, and our businesses reflect an extensive geographicdiversification that has evolved with continued globalization. The
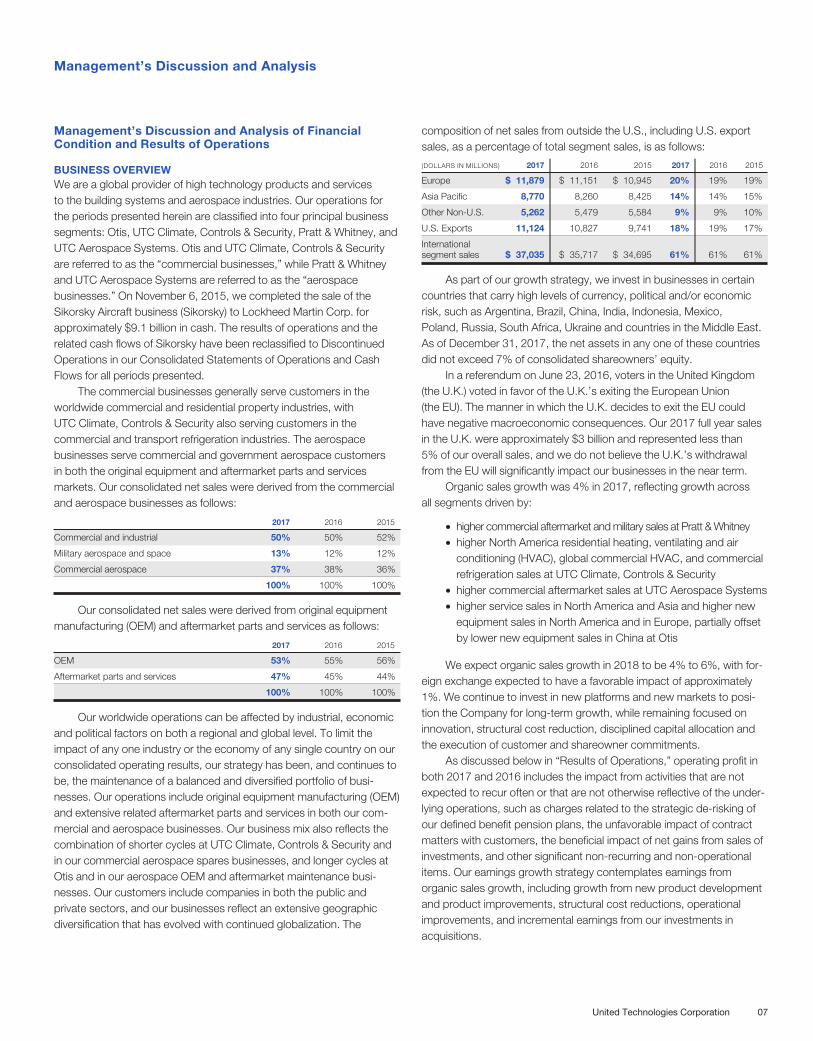
composition of net sales from outside the U.S., including U.S. exportsales, as a percentage of total segment sales, is as follows:
(DOLLARS IN MILLIONS) 2017 2016 2015 2017 2016 2015
Europe $ 11,879 $ 11,151 $ 10,945 20% 19% 19%
Asia Pacific 8,770 8,260 8,425 14% 14% 15%
Other Non-U.S. 5,262 5,479 5,584 9% 9% 10%
U.S. Exports 11,124 10,827 9,741 18% 19% 17%
Internationalsegment sales $ 37,035 $ 35,717 $ 34,695 61% 61% 61%
As part of our growth strategy, we invest in businesses in certaincountries that carry high levels of currency, political and/or economicrisk, such as Argentina, Brazil, China, India, Indonesia, Mexico,Poland, Russia, South Africa, Ukraine and countries in the Middle East.As of December 31, 2017, the net assets in any one of these countriesdid not exceed 7% of consolidated shareowners’ equity.
In a referendum on June 23, 2016, voters in the United Kingdom(the U.K.) voted in favor of the U.K.’s exiting the European Union(the EU). The manner in which the U.K. decides to exit the EU couldhave negative macroeconomic consequences. Our 2017 full year salesin the U.K. were approximately $3 billion and represented less than5% of our overall sales, and we do not believe the U.K.’s withdrawalfrom the EU will significantly impact our businesses in the near term.
Organic sales growth was 4% in 2017, reflecting growth acrossall segments driven by:
• higher commercial aftermarket and military sales at Pratt & Whitney• higher North America residential heating, ventilating and air
conditioning (HVAC), global commercial HVAC, and commercialrefrigeration sales at UTC Climate, Controls & Security
• higher commercial aftermarket sales at UTC Aerospace Systems• higher service sales in North America and Asia and higher new
equipment sales in North America and in Europe, partially offsetby lower new equipment sales in China at Otis
We expect organic sales growth in 2018 to be 4% to 6%, with for-eign exchange expected to have a favorable impact of approximately1%. We continue to invest in new platforms and new markets to posi-tion the Company for long-term growth, while remaining focused oninnovation, structural cost reduction, disciplined capital allocation andthe execution of customer and shareowner commitments.
As discussed below in “Results of Operations,” operating profit inboth 2017 and 2016 includes the impact from activities that are notexpected to recur often or that are not otherwise reflective of the under-lying operations, such as charges related to the strategic de-risking ofour defined benefit pension plans, the unfavorable impact of contractmatters with customers, the beneficial impact of net gains from sales ofinvestments, and other significant non-recurring and non-operationalitems. Our earnings growth strategy contemplates earnings fromorganic sales growth, including growth from new product developmentand product improvements, structural cost reductions, operationalimprovements, and incremental earnings from our investments inacquisitions.
Management’s Discussion and Analysis
United Technologies Corporation 07
Our investments in businesses in 2017 and 2016 totaled $231 mil-lion and $712 million (including debt assumed of $2 million),respectively. Acquisitions completed in 2017 include a number of smallacquisitions primarily in our commercial businesses. Our investments inbusinesses in 2016 included the acquisition of a majority interest in anItalian-based heating products and services company by UTC Climate,Controls & Security, the acquisition of a Japanese services company byOtis and a number of small acquisitions primarily in our commercialbusinesses.
Both acquisition and restructuring costs associated with businesscombinations are expensed as incurred. Depending on the nature andlevel of acquisition activity, earnings could be adversely impacted dueto acquisition and restructuring actions initiated in connection withthe integration of businesses acquired. For additional discussion ofacquisitions and restructuring, see “Liquidity and Financial Condition,”“Restructuring Costs” and Notes 2 and 13 to the Consolidated FinancialStatements.
On September 4, 2017, we announced that we had entered into amerger agreement with Rockwell Collins, under which we agreed toacquire Rockwell Collins. Under the terms of the merger agreement,each Rockwell Collins shareowner will receive $93.33 per share in cashand a fraction of a share of UTC common stock equal to the quotientobtained by dividing $46.67 by the average of the volume-weightedaverage price per share of UTC common stock on the NYSE oneach of the 20 consecutive trading days ending with the trading dayimmediately prior to the closing date (the “UTC Stock Price”), subjectto adjustment based on a two-way collar mechanism as describedbelow (the “Stock Consideration”). The cash and UTC stock payable inexchange for each such share of Rockwell Collins common stock arecollectively the “Merger Consideration.” The fraction of a share of UTCcommon stock into which each such share of Rockwell Collins commonstock will be converted is the “Exchange Ratio.” The Exchange Ratio willbe determined based upon the UTC Stock Price. If the UTC Stock Priceis greater than $107.01 but less than $124.37, the Exchange Ratio willbe equal to the quotient of (i) $46.67 divided by (ii) the UTC Stock Price,which, in each case, will result in the Stock Consideration having a valueequal to $46.67. If the UTC Stock Price is less than or equal to $107.01or greater than or equal to $124.37, then a two-way collar mechanismwill apply, pursuant to which, (x) if the UTC Stock Price is greater than orequal to $124.37, the Exchange Ratio will be fixed at 0.37525 and thevalue of the Stock Consideration will be greater than $46.67, and (y) ifthe UTC Stock Price is less than or equal to $107.01, the ExchangeRatio will be fixed at 0.43613 and the value of the Stock Considerationwill be less than $46.67. On January 11, 2018, the merger wasapproved by Rockwell Collins’ shareowners. We currently expect thatthe merger will be completed in the third quarter of 2018, subject tocustomary closing conditions, including the receipt of required regula-tory approvals.
We anticipate that approximately $15 billion will be required topay the aggregate cash portion of the Merger Consideration. We
expect to fund the cash portion of the Merger Consideration throughdebt issuances and cash on hand. We have entered into a $6.5 billion364-day unsecured bridge loan credit agreement that would be fundedonly to the extent certain of the anticipated debt issuances are not com-pleted prior to the completion of the merger. Additionally, we expect toassume approximately $7 billion of Rockwell Collins’ outstanding debtupon completion of the merger. To help manage the cash flow andliquidity resulting from the proposed acquisition, we have suspendedshare repurchases, excluding activity relating to our employee sav-ings plans. On December 22, 2017 Public Law 115-97 “An Act toProvide for Reconciliation Pursuant to Titles II and V of the ConcurrentResolution on the Budget for Fiscal Year 2018” was enacted. This lawis commonly referred to as the Tax Cuts and Jobs Act of 2017 (TCJA).As we continue to assess the impacts of the TCJA, future opportunitiesfor repatriation of our non-U.S. earnings, and accelerated de-leveraging,we may consider, in addition to investments in out operations, limitedadditional share repurchases to offset the effects of dilution related toour stock-based compensation programs—see Note 12.
Discontinued OperationsOn November 6, 2015, we completed the sale of Sikorsky to LockheedMartin Corp. for approximately $9.1 billion in cash. As noted above, theresults of operations and the related cash flows of Sikorsky have beenreclassified to Discontinued Operations in our Consolidated Statementsof Operations, Comprehensive Income and Cash Flows for all periodspresented. Proceeds from the sale were used to fund $6 billion of sharerepurchases through accelerated share repurchase (ASR) agreementsentered into on November 11, 2015. In connection with the sale ofSikorsky, we made tax payments of approximately $2.5 billion in 2016.
Net income from discontinued operations attributable to commonshareowners for the year ended December 31, 2016 reflects the finalpurchase price adjustment for the sale of Sikorsky, and the net effectsof filing Sikorsky’s 2015 tax returns. Net income from discontinuedoperations attributable to common shareowners for the year endedDecember 31, 2015 includes the gain on the sale of Sikorsky, net oftax expense, of $3.4 billion and includes $122 million of costs incurredin connection with the sale. Net income from discontinued operationsattributable to common shareowners also includes income fromSikorsky’s operations, net of tax expense, of $169 million, includingpension curtailment charges associated with our domestic pensionplans.
RESULTS OF OPERATIONS
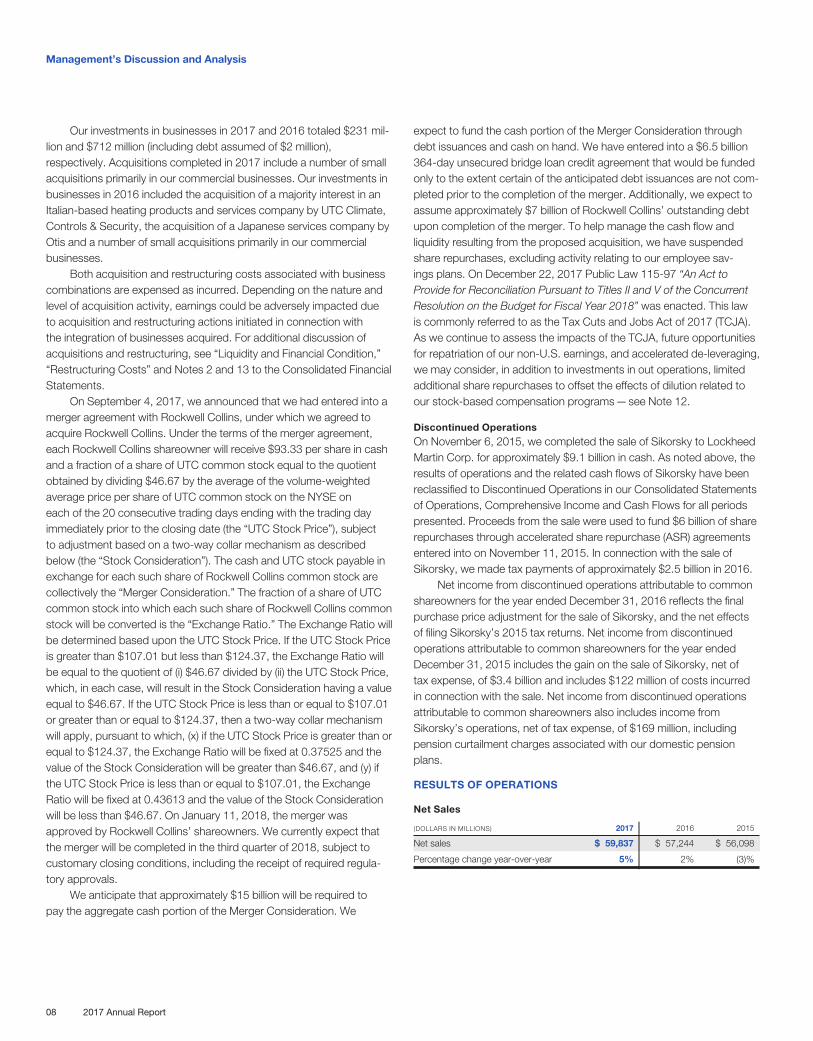
Net Sales
(DOLLARS IN MILLIONS) 2017 2016 2015
Net sales $ 59,837 $ 57,244 $ 56,098
Percentage change year-over-year 5% 2% (3)%
Management’s Discussion and Analysis
08 2017 Annual Report
The factors contributing to the total percentage change year-over-year in total net sales are as follows:
2017 2016
Organic volume 4% 2 %
Foreign currency translation — (1)%
Acquisitions and divestitures, net 1% 1 %
Total % Change 5% 2 %
All four segments experienced organic sales growth during2017. Pratt & Whitney sales were up 9% organically, reflecting highercommercial aftermarket sales and higher military sales, partially offset bylower commercial engine sales. Organic sales at UTC Climate, Controls& Security increased 4%, driven by growth in North America residentialHVAC, global commercial HVAC, and commercial refrigeration sales.Organic sales at UTC Aerospace Systems grew 2%, primarily driven byan increase in commercial aerospace aftermarket sales partially offsetby lower commercial aerospace OEM sales. Otis sales increased 2%organically, reflecting higher service sales in North America and Asia,and higher new equipment sales growth in North America and Europe,partially offset by a decline in China.
Three of our four segments experienced organic sales growthduring 2016, as organic sales growth at Pratt & Whitney (6%), UTCAerospace Systems (2%), and Otis (1%), was partially offset by adecline at UTC Climate, Controls & Security (1%). The organic salesgrowth at Pratt & Whitney primarily reflects higher commercial aftermar-ket sales. The organic sales growth at UTC Aerospace Systems wasprimarily due to an increase in commercial OEM and aftermarket salesvolume. The organic sales growth at Otis was primarily driven by higherservice sales in the Americas and Asia and higher new equipment salesin North America partially offset by lower new equipment sales in China.The decline in sales at UTC Climate, Controls & Security was primarilydriven by declines in commercial HVAC sales in the Middle East andlower fire products and transport refrigeration sales, partially offset bygrowth in North America residential HVAC. The sales increase from netacquisitions and divestitures was primarily a result of sales from newlyacquired businesses at UTC Climate, Controls & Security.
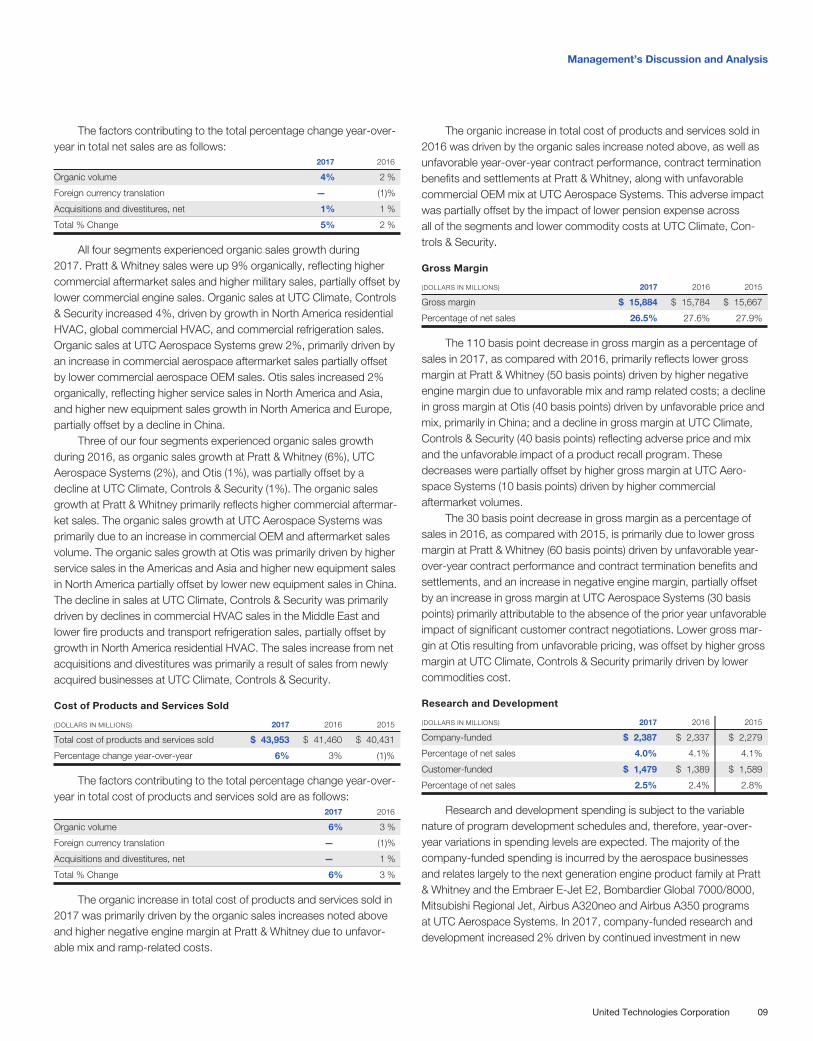
Cost of Products and Services Sold
(DOLLARS IN MILLIONS) 2017 2016 2015
Total cost of products and services sold $ 43,953 $ 41,460 $ 40,431
Percentage change year-over-year 6% 3% (1)%
The factors contributing to the total percentage change year-over-year in total cost of products and services sold are as follows:
2017 2016
Organic volume 6% 3 %
Foreign currency translation — (1)%
Acquisitions and divestitures, net — 1 %
Total % Change 6% 3 %
The organic increase in total cost of products and services sold in2017 was primarily driven by the organic sales increases noted aboveand higher negative engine margin at Pratt & Whitney due to unfavor-able mix and ramp-related costs.
The organic increase in total cost of products and services sold in2016 was driven by the organic sales increase noted above, as well asunfavorable year-over-year contract performance, contract terminationbenefits and settlements at Pratt & Whitney, along with unfavorablecommercial OEM mix at UTC Aerospace Systems. This adverse impactwas partially offset by the impact of lower pension expense acrossall of the segments and lower commodity costs at UTC Climate, Con-trols & Security.
Gross Margin
(DOLLARS IN MILLIONS) 2017 2016 2015
Gross margin $ 15,884 $ 15,784 $ 15,667
Percentage of net sales 26.5% 27.6% 27.9%
The 110 basis point decrease in gross margin as a percentage ofsales in 2017, as compared with 2016, primarily reflects lower grossmargin at Pratt & Whitney (50 basis points) driven by higher negativeengine margin due to unfavorable mix and ramp related costs; a declinein gross margin at Otis (40 basis points) driven by unfavorable price andmix, primarily in China; and a decline in gross margin at UTC Climate,Controls & Security (40 basis points) reflecting adverse price and mixand the unfavorable impact of a product recall program. Thesedecreases were partially offset by higher gross margin at UTC Aero-space Systems (10 basis points) driven by higher commercialaftermarket volumes.
The 30 basis point decrease in gross margin as a percentage ofsales in 2016, as compared with 2015, is primarily due to lower grossmargin at Pratt & Whitney (60 basis points) driven by unfavorable year-over-year contract performance and contract termination benefits andsettlements, and an increase in negative engine margin, partially offsetby an increase in gross margin at UTC Aerospace Systems (30 basispoints) primarily attributable to the absence of the prior year unfavorableimpact of significant customer contract negotiations. Lower gross mar-gin at Otis resulting from unfavorable pricing, was offset by higher grossmargin at UTC Climate, Controls & Security primarily driven by lowercommodities cost.
Research and Development
(DOLLARS IN MILLIONS) 2017 2016 2015
Company-funded $ 2,387 $ 2,337 $ 2,279
Percentage of net sales 4.0% 4.1% 4.1%
Customer-funded $ 1,479 $ 1,389 $ 1,589
Percentage of net sales 2.5% 2.4% 2.8%
Research and development spending is subject to the variablenature of program development schedules and, therefore, year-over-year variations in spending levels are expected. The majority of thecompany-funded spending is incurred by the aerospace businessesand relates largely to the next generation engine product family at Pratt& Whitney and the Embraer E-Jet E2, Bombardier Global 7000/8000,Mitsubishi Regional Jet, Airbus A320neo and Airbus A350 programsat UTC Aerospace Systems. In 2017, company-funded research anddevelopment increased 2% driven by continued investment in new
Management’s Discussion and Analysis
United Technologies Corporation 09
products at UTC Climate, Controls & Security (1%) and increasedspending on strategic initiatives at Otis (1%). Customer-funded researchand development increased 6% primarily driven by increased spendingon U.S. Government development programs at Pratt & Whitney, partiallyoffset by lower spend within UTC Aerospace Systems related to severalcommercial and military aerospace programs.
The year-over-year increase in company-funded research anddevelopment (3%) in 2016, compared with 2015, is primarily driven byhigher research and development costs within Pratt & Whitney (2%)as development programs progress towards certification, and higherspending at Otis (2%). These increases were partially offset by lowerspend within UTC Aerospace Systems related to several commercialaerospace programs (1%). Customer-funded research and develop-ment declined (13%) due primarily to lower spending on U.S.Government and commercial engine programs at Pratt & Whitney (4%),and lower spend within UTC Aerospace Systems related to severalcommercial and military aerospace programs (9%).
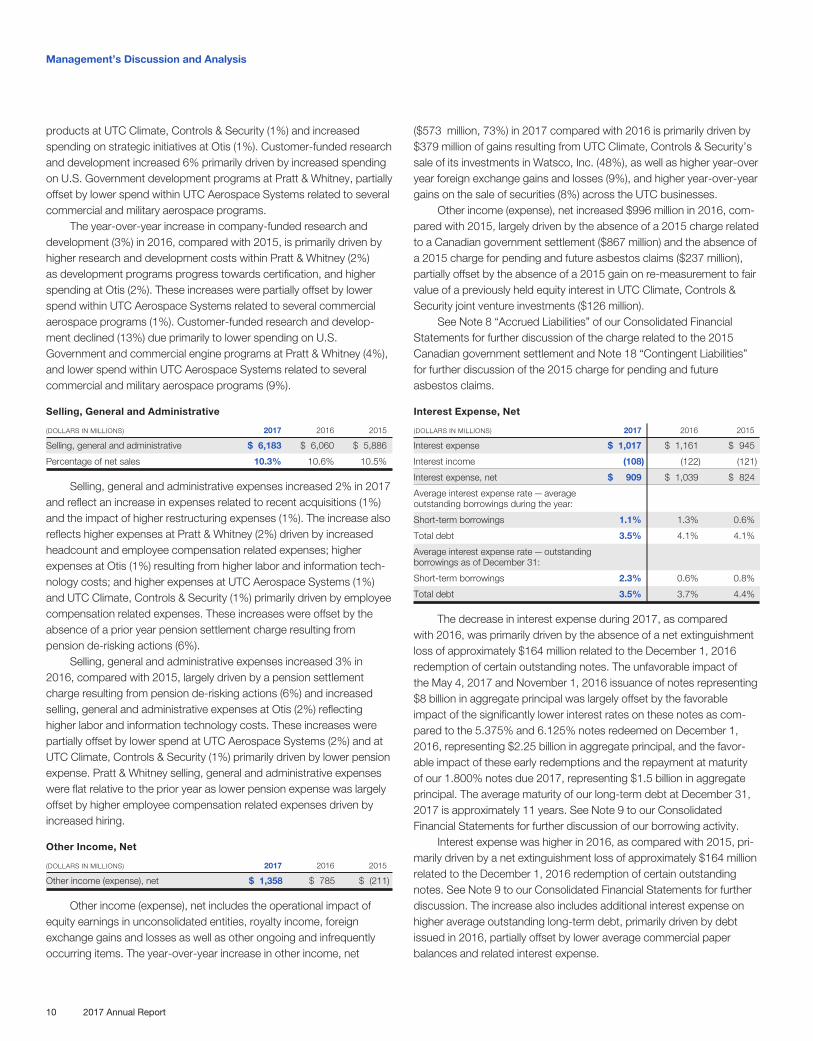
Selling, General and Administrative
(DOLLARS IN MILLIONS) 2017 2016 2015
Selling, general and administrative $ 6,183 $ 6,060 $ 5,886
Percentage of net sales 10.3% 10.6% 10.5%
Selling, general and administrative expenses increased 2% in 2017and reflect an increase in expenses related to recent acquisitions (1%)and the impact of higher restructuring expenses (1%). The increase alsoreflects higher expenses at Pratt & Whitney (2%) driven by increasedheadcount and employee compensation related expenses; higherexpenses at Otis (1%) resulting from higher labor and information tech-nology costs; and higher expenses at UTC Aerospace Systems (1%)and UTC Climate, Controls & Security (1%) primarily driven by employeecompensation related expenses. These increases were offset by theabsence of a prior year pension settlement charge resulting frompension de-risking actions (6%).
Selling, general and administrative expenses increased 3% in2016, compared with 2015, largely driven by a pension settlementcharge resulting from pension de-risking actions (6%) and increasedselling, general and administrative expenses at Otis (2%) reflectinghigher labor and information technology costs. These increases werepartially offset by lower spend at UTC Aerospace Systems (2%) and atUTC Climate, Controls & Security (1%) primarily driven by lower pensionexpense. Pratt & Whitney selling, general and administrative expenseswere flat relative to the prior year as lower pension expense was largelyoffset by higher employee compensation related expenses driven byincreased hiring.
Other Income, Net
(DOLLARS IN MILLIONS) 2017 2016 2015
Other income (expense), net $ 1,358 $ 785 $ (211)
Other income (expense), net includes the operational impact ofequity earnings in unconsolidated entities, royalty income, foreignexchange gains and losses as well as other ongoing and infrequentlyoccurring items. The year-over-year increase in other income, net
($573 million, 73%) in 2017 compared with 2016 is primarily driven by$379 million of gains resulting from UTC Climate, Controls & Security’ssale of its investments in Watsco, Inc. (48%), as well as higher year-overyear foreign exchange gains and losses (9%), and higher year-over-yeargains on the sale of securities (8%) across the UTC businesses.
Other income (expense), net increased $996 million in 2016, com-pared with 2015, largely driven by the absence of a 2015 charge relatedto a Canadian government settlement ($867 million) and the absence ofa 2015 charge for pending and future asbestos claims ($237 million),partially offset by the absence of a 2015 gain on re-measurement to fairvalue of a previously held equity interest in UTC Climate, Controls &Security joint venture investments ($126 million).
See Note 8 “Accrued Liabilities” of our Consolidated FinancialStatements for further discussion of the charge related to the 2015Canadian government settlement and Note 18 “Contingent Liabilities”for further discussion of the 2015 charge for pending and futureasbestos claims.
Interest Expense, Net
(DOLLARS IN MILLIONS) 2017 2016 2015
Interest expense $ 1,017 $ 1,161 $ 945
Interest income (108) (122) (121)
Interest expense, net $ 909 $ 1,039 $ 824
Average interest expense rate — averageoutstanding borrowings during the year:
Short-term borrowings 1.1% 1.3% 0.6%
Total debt 3.5% 4.1% 4.1%
Average interest expense rate — outstandingborrowings as of December 31:
Short-term borrowings 2.3% 0.6% 0.8%
Total debt 3.5% 3.7% 4.4%
The decrease in interest expense during 2017, as comparedwith 2016, was primarily driven by the absence of a net extinguishmentloss of approximately $164 million related to the December 1, 2016redemption of certain outstanding notes. The unfavorable impact ofthe May 4, 2017 and November 1, 2016 issuance of notes representing$8 billion in aggregate principal was largely offset by the favorableimpact of the significantly lower interest rates on these notes as com-pared to the 5.375% and 6.125% notes redeemed on December 1,2016, representing $2.25 billion in aggregate principal, and the favor-able impact of these early redemptions and the repayment at maturityof our 1.800% notes due 2017, representing $1.5 billion in aggregateprincipal. The average maturity of our long-term debt at December 31,2017 is approximately 11 years. See Note 9 to our ConsolidatedFinancial Statements for further discussion of our borrowing activity.
Interest expense was higher in 2016, as compared with 2015, pri-marily driven by a net extinguishment loss of approximately $164 millionrelated to the December 1, 2016 redemption of certain outstandingnotes. See Note 9 to our Consolidated Financial Statements for furtherdiscussion. The increase also includes additional interest expense onhigher average outstanding long-term debt, primarily driven by debtissued in 2016, partially offset by lower average commercial paperbalances and related interest expense.
Management’s Discussion and Analysis
10 2017 Annual Report
The decrease in the weighted-average interest rates forshort-term borrowings for 2017 was primarily due to higheraverage Euro-denominated commercial paper borrowings ascompared to 2016. The increase in the weighted-average interest ratesfor short-term borrowings for 2016 was primarily due to lower averagecommercial paper borrowings relative to other short-term borrowingsas compared to 2015. We had no Euro-denominated commercial paperborrowing outstanding at December 31, 2017, resulting in the higherweighted-average interest rate for short-term borrowings as ofDecember 31, 2017, as compared to December 31, 2016.
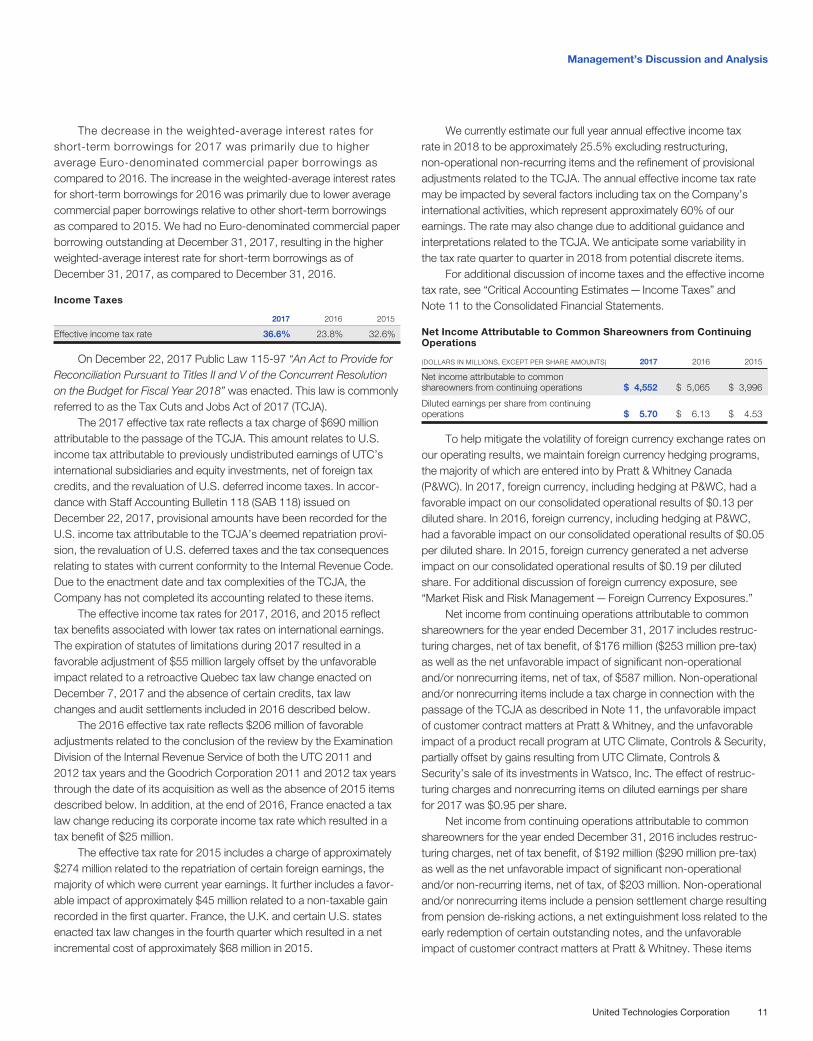
Income Taxes
2017 2016 2015
Effective income tax rate 36.6% 23.8% 32.6%
On December 22, 2017 Public Law 115-97 “An Act to Provide forReconciliation Pursuant to Titles II and V of the Concurrent Resolutionon the Budget for Fiscal Year 2018” was enacted. This law is commonlyreferred to as the Tax Cuts and Jobs Act of 2017 (TCJA).
The 2017 effective tax rate reflects a tax charge of $690 millionattributable to the passage of the TCJA. This amount relates to U.S.income tax attributable to previously undistributed earnings of UTC’sinternational subsidiaries and equity investments, net of foreign taxcredits, and the revaluation of U.S. deferred income taxes. In accor-dance with Staff Accounting Bulletin 118 (SAB 118) issued onDecember 22, 2017, provisional amounts have been recorded for theU.S. income tax attributable to the TCJA’s deemed repatriation provi-sion, the revaluation of U.S. deferred taxes and the tax consequencesrelating to states with current conformity to the Internal Revenue Code.Due to the enactment date and tax complexities of the TCJA, theCompany has not completed its accounting related to these items.
The effective income tax rates for 2017, 2016, and 2015 reflecttax benefits associated with lower tax rates on international earnings.The expiration of statutes of limitations during 2017 resulted in afavorable adjustment of $55 million largely offset by the unfavorableimpact related to a retroactive Quebec tax law change enacted onDecember 7, 2017 and the absence of certain credits, tax lawchanges and audit settlements included in 2016 described below.
The 2016 effective tax rate reflects $206 million of favorableadjustments related to the conclusion of the review by the ExaminationDivision of the Internal Revenue Service of both the UTC 2011 and2012 tax years and the Goodrich Corporation 2011 and 2012 tax yearsthrough the date of its acquisition as well as the absence of 2015 itemsdescribed below. In addition, at the end of 2016, France enacted a taxlaw change reducing its corporate income tax rate which resulted in atax benefit of $25 million.
The effective tax rate for 2015 includes a charge of approximately$274 million related to the repatriation of certain foreign earnings, themajority of which were current year earnings. It further includes a favor-able impact of approximately $45 million related to a non-taxable gainrecorded in the first quarter. France, the U.K. and certain U.S. statesenacted tax law changes in the fourth quarter which resulted in a netincremental cost of approximately $68 million in 2015.
We currently estimate our full year annual effective income taxrate in 2018 to be approximately 25.5% excluding restructuring,non-operational non-recurring items and the refinement of provisionaladjustments related to the TCJA. The annual effective income tax ratemay be impacted by several factors including tax on the Company’sinternational activities, which represent approximately 60% of ourearnings. The rate may also change due to additional guidance andinterpretations related to the TCJA. We anticipate some variability inthe tax rate quarter to quarter in 2018 from potential discrete items.
For additional discussion of income taxes and the effective incometax rate, see “Critical Accounting Estimates—Income Taxes” andNote 11 to the Consolidated Financial Statements.
Net Income Attributable to Common Shareowners from ContinuingOperations
(DOLLARS IN MILLIONS, EXCEPT PER SHARE AMOUNTS) 2017 2016 2015
Net income attributable to commonshareowners from continuing operations $ 4,552 $ 5,065 $ 3,996
Diluted earnings per share from continuingoperations $ 5.70 $ 6.13 $ 4.53
To help mitigate the volatility of foreign currency exchange rates onour operating results, we maintain foreign currency hedging programs,the majority of which are entered into by Pratt & Whitney Canada(P&WC). In 2017, foreign currency, including hedging at P&WC, had afavorable impact on our consolidated operational results of $0.13 perdiluted share. In 2016, foreign currency, including hedging at P&WC,had a favorable impact on our consolidated operational results of $0.05per diluted share. In 2015, foreign currency generated a net adverseimpact on our consolidated operational results of $0.19 per dilutedshare. For additional discussion of foreign currency exposure, see“Market Risk and Risk Management—Foreign Currency Exposures.”
Net income from continuing operations attributable to commonshareowners for the year ended December 31, 2017 includes restruc-turing charges, net of tax benefit, of $176 million ($253 million pre-tax)as well as the net unfavorable impact of significant non-operationaland/or nonrecurring items, net of tax, of $587 million. Non-operationaland/or nonrecurring items include a tax charge in connection with thepassage of the TCJA as described in Note 11, the unfavorable impactof customer contract matters at Pratt & Whitney, and the unfavorableimpact of a product recall program at UTC Climate, Controls & Security,partially offset by gains resulting from UTC Climate, Controls &Security’s sale of its investments in Watsco, Inc. The effect of restruc-turing charges and nonrecurring items on diluted earnings per sharefor 2017 was $0.95 per share.
Net income from continuing operations attributable to commonshareowners for the year ended December 31, 2016 includes restruc-turing charges, net of tax benefit, of $192 million ($290 million pre-tax)as well as the net unfavorable impact of significant non-operationaland/or non-recurring items, net of tax, of $203 million. Non-operationaland/or nonrecurring items include a pension settlement charge resultingfrom pension de-risking actions, a net extinguishment loss related to theearly redemption of certain outstanding notes, and the unfavorableimpact of customer contract matters at Pratt & Whitney. These items
Management’s Discussion and Analysis
United Technologies Corporation 11
were partially offset by favorable tax adjustments related to the conclu-sion of the review by the Examination Division of the Internal RevenueService of the 2011 and 2012 tax years. The effect of restructuringcharges and non-recurring items on diluted earnings per share for theyear ended December 31, 2016 was $0.48 per share.
Net income attributable to common shareowners from continuingoperations in 2015 includes restructuring charges, net of tax benefit, of$274 million ($396 million pre-tax) as well as the net unfavorable impactof significant non-recurring and non-operational items, net of tax ben-efit, of $1,293 million. Non-operational and/or nonrecurring itemsinclude a charge recorded by Pratt & Whitney resulting from amend-ments to research and development support arrangements previouslyentered into with federal and provincial Canadian government agencies;the unfavorable impact of customer contract negotiations at UTC Aero-space Systems; an unfavorable tax adjustment related to the plannedrepatriation of certain foreign earnings; and a charge for pending andfuture asbestos claims. The effect of restructuring charges on dilutedearnings per share for 2015 was a charge of $0.31 per share, while theeffect of significant non-operational items on diluted earnings per sharefor 2015 was a charge of $1.46 per share.
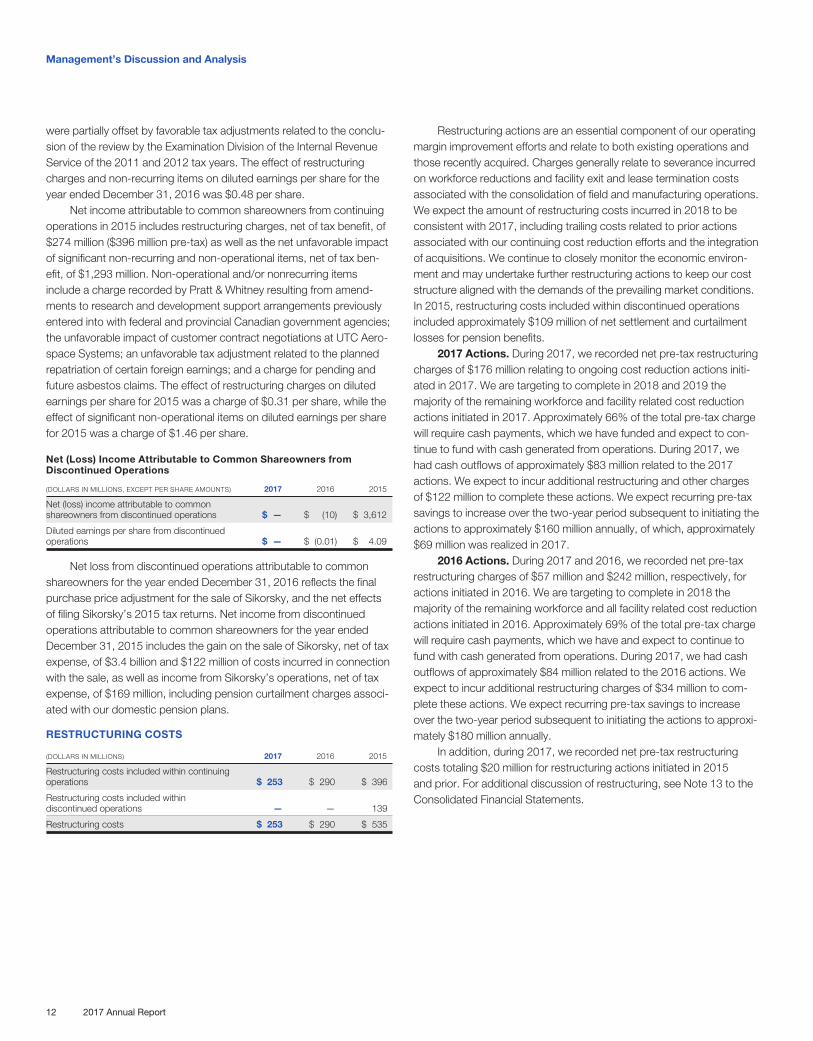
Net (Loss) Income Attributable to Common Shareowners fromDiscontinued Operations
(DOLLARS IN MILLIONS, EXCEPT PER SHARE AMOUNTS) 2017 2016 2015
Net (loss) income attributable to commonshareowners from discontinued operations $ — $ (10) $ 3,612
Diluted earnings per share from discontinuedoperations $ — $ (0.01) $ 4.09
Net loss from discontinued operations attributable to commonshareowners for the year ended December 31, 2016 reflects the finalpurchase price adjustment for the sale of Sikorsky, and the net effectsof filing Sikorsky’s 2015 tax returns. Net income from discontinuedoperations attributable to common shareowners for the year endedDecember 31, 2015 includes the gain on the sale of Sikorsky, net of taxexpense, of $3.4 billion and $122 million of costs incurred in connectionwith the sale, as well as income from Sikorsky’s operations, net of taxexpense, of $169 million, including pension curtailment charges associ-ated with our domestic pension plans.
RESTRUCTURING COSTS
(DOLLARS IN MILLIONS) 2017 2016 2015
Restructuring costs included within continuingoperations $ 253 $ 290 $ 396
Restructuring costs included withindiscontinued operations — — 139
Restructuring costs $ 253 $ 290 $ 535
Restructuring actions are an essential component of our operatingmargin improvement efforts and relate to both existing operations andthose recently acquired. Charges generally relate to severance incurredon workforce reductions and facility exit and lease termination costsassociated with the consolidation of field and manufacturing operations.We expect the amount of restructuring costs incurred in 2018 to beconsistent with 2017, including trailing costs related to prior actionsassociated with our continuing cost reduction efforts and the integrationof acquisitions. We continue to closely monitor the economic environ-ment and may undertake further restructuring actions to keep our coststructure aligned with the demands of the prevailing market conditions.In 2015, restructuring costs included within discontinued operationsincluded approximately $109 million of net settlement and curtailmentlosses for pension benefits.
2017 Actions. During 2017, we recorded net pre-tax restructuringcharges of $176 million relating to ongoing cost reduction actions initi-ated in 2017. We are targeting to complete in 2018 and 2019 themajority of the remaining workforce and facility related cost reductionactions initiated in 2017. Approximately 66% of the total pre-tax chargewill require cash payments, which we have funded and expect to con-tinue to fund with cash generated from operations. During 2017, wehad cash outflows of approximately $83 million related to the 2017actions. We expect to incur additional restructuring and other chargesof $122 million to complete these actions. We expect recurring pre-taxsavings to increase over the two-year period subsequent to initiating theactions to approximately $160 million annually, of which, approximately$69 million was realized in 2017.
2016 Actions. During 2017 and 2016, we recorded net pre-taxrestructuring charges of $57 million and $242 million, respectively, foractions initiated in 2016. We are targeting to complete in 2018 themajority of the remaining workforce and all facility related cost reductionactions initiated in 2016. Approximately 69% of the total pre-tax chargewill require cash payments, which we have and expect to continue tofund with cash generated from operations. During 2017, we had cashoutflows of approximately $84 million related to the 2016 actions. Weexpect to incur additional restructuring charges of $34 million to com-plete these actions. We expect recurring pre-tax savings to increaseover the two-year period subsequent to initiating the actions to approxi-mately $180 million annually.
In addition, during 2017, we recorded net pre-tax restructuringcosts totaling $20 million for restructuring actions initiated in 2015and prior. For additional discussion of restructuring, see Note 13 to theConsolidated Financial Statements.
Management’s Discussion and Analysis
12 2017 Annual Report
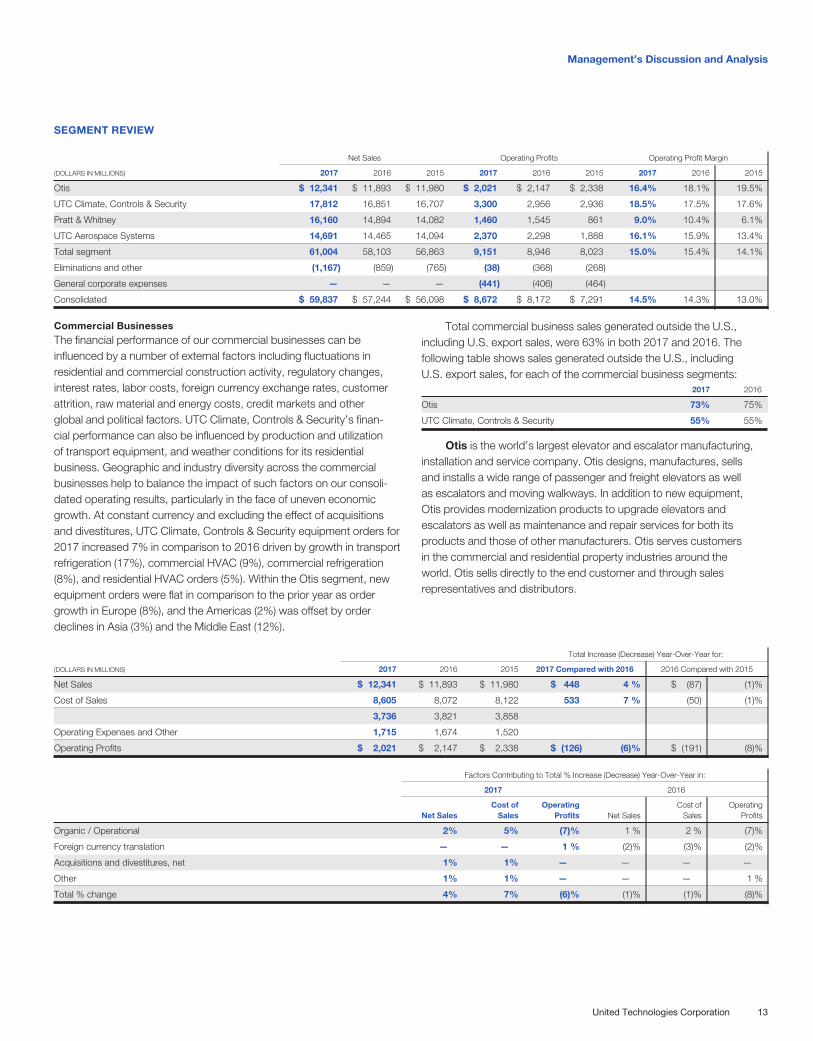
SEGMENT REVIEW
Net Sales Operating Profits Operating Profit Margin
(DOLLARS IN MILLIONS) 2017 2016 2015 2017 2016 2015 2017 2016 2015
Otis $ 12,341 $ 11,893 $ 11,980 $ 2,021 $ 2,147 $ 2,338 16.4% 18.1% 19.5%
UTC Climate, Controls & Security 17,812 16,851 16,707 3,300 2,956 2,936 18.5% 17.5% 17.6%
Pratt & Whitney 16,160 14,894 14,082 1,460 1,545 861 9.0% 10.4% 6.1%
UTC Aerospace Systems 14,691 14,465 14,094 2,370 2,298 1,888 16.1% 15.9% 13.4%
Total segment 61,004 58,103 56,863 9,151 8,946 8,023 15.0% 15.4% 14.1%
Eliminations and other (1,167) (859) (765) (38) (368) (268)
General corporate expenses — — — (441) (406) (464)
Consolidated $ 59,837 $ 57,244 $ 56,098 $ 8,672 $ 8,172 $ 7,291 14.5% 14.3% 13.0%
Commercial BusinessesThe financial performance of our commercial businesses can beinfluenced by a number of external factors including fluctuations inresidential and commercial construction activity, regulatory changes,interest rates, labor costs, foreign currency exchange rates, customerattrition, raw material and energy costs, credit markets and otherglobal and political factors. UTC Climate, Controls & Security’s finan-cial performance can also be influenced by production and utilizationof transport equipment, and weather conditions for its residentialbusiness. Geographic and industry diversity across the commercialbusinesses help to balance the impact of such factors on our consoli-dated operating results, particularly in the face of uneven economicgrowth. At constant currency and excluding the effect of acquisitionsand divestitures, UTC Climate, Controls & Security equipment orders for2017 increased 7% in comparison to 2016 driven by growth in transportrefrigeration (17%), commercial HVAC (9%), commercial refrigeration(8%), and residential HVAC orders (5%). Within the Otis segment, newequipment orders were flat in comparison to the prior year as ordergrowth in Europe (8%), and the Americas (2%) was offset by orderdeclines in Asia (3%) and the Middle East (12%).
Total commercial business sales generated outside the U.S.,including U.S. export sales, were 63% in both 2017 and 2016. Thefollowing table shows sales generated outside the U.S., includingU.S. export sales, for each of the commercial business segments:
2017 2016
Otis 73% 75%
UTC Climate, Controls & Security 55% 55%
Otis is the world’s largest elevator and escalator manufacturing,installation and service company. Otis designs, manufactures, sellsand installs a wide range of passenger and freight elevators as wellas escalators and moving walkways. In addition to new equipment,Otis provides modernization products to upgrade elevators andescalators as well as maintenance and repair services for both itsproducts and those of other manufacturers. Otis serves customersin the commercial and residential property industries around theworld. Otis sells directly to the end customer and through salesrepresentatives and distributors.
Total Increase (Decrease) Year-Over-Year for:
(DOLLARS IN MILLIONS) 2017 2016 2015 2017 Compared with 2016 2016 Compared with 2015
Net Sales $ 12,341 $ 11,893 $ 11,980 $ 448 4 % $ (87) (1)%
Cost of Sales 8,605 8,072 8,122 533 7 % (50) (1)%
3,736 3,821 3,858
Operating Expenses and Other 1,715 1,674 1,520
Operating Profits $ 2,021 $ 2,147 $ 2,338 $ (126) (6)% $ (191) (8)%
Factors Contributing to Total % Increase (Decrease) Year-Over-Year in:
2017 2016
Net SalesCost of
SalesOperating
Profits Net SalesCost of
SalesOperating
Profits
Organic / Operational 2% 5% (7)% 1 % 2 % (7)%
Foreign currency translation — — 1 % (2)% (3)% (2)%
Acquisitions and divestitures, net 1% 1% — — — —
Other 1% 1% — — — 1 %
Total % change 4% 7% (6)% (1)% (1)% (8)%
Management’s Discussion and Analysis
United Technologies Corporation 13
2017 Compared with 2016The organic sales increase of 2% primarily reflects higher service sales(1%) driven by growth in North America and Asia, and higher newequipment sales (1%) driven by growth in North America and Europe,partially offset by a decline in China.
The operational profit decrease of 7% was driven by:
• unfavorable price and mix (11%), primarily in China• higher selling, general and administrative expenses (2%),
primarily labor and information technology costs• higher research and development costs (1%)
These decreases were partially offset by:
• profit contribution from the higher sales volumes notedabove (4%)
• favorable productivity (3%)
2016 Compared with 2015The organic sales increase of 1% primarily reflects higher service sales(1%), driven by growth in the Americas and Asia. New equipment salesgrowth in the Americas (2%) was offset by a decline in new equipmentsales in China (2%).
The operational profit decrease of 7% was driven by unfavorableprice and mix (12%), primarily in China and Europe; higher selling,general and administrative expenses (5%), driven by higher labor andinformation technology costs; and higher research and developmentspending (2%); partially offset by favorable productivity and commoditycosts (combined 8%) and higher volume (4%).
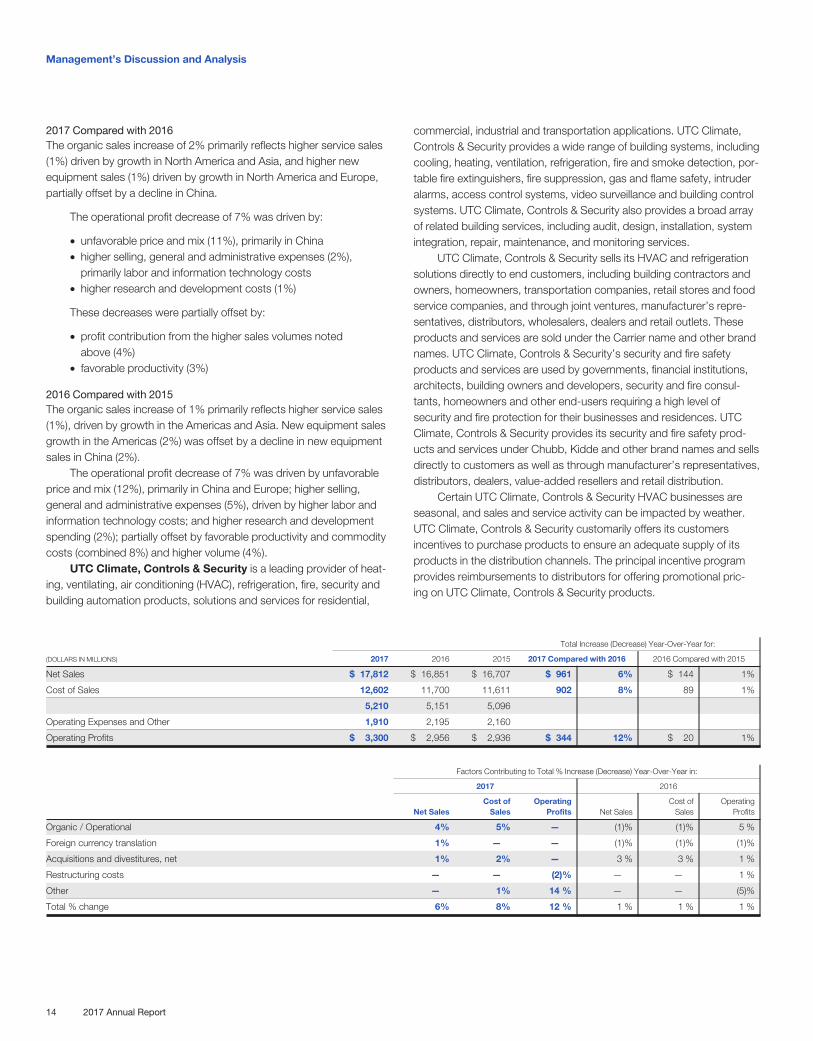
UTC Climate, Controls & Security is a leading provider of heat-ing, ventilating, air conditioning (HVAC), refrigeration, fire, security andbuilding automation products, solutions and services for residential,
commercial, industrial and transportation applications. UTC Climate,Controls & Security provides a wide range of building systems, includingcooling, heating, ventilation, refrigeration, fire and smoke detection, por-table fire extinguishers, fire suppression, gas and flame safety, intruderalarms, access control systems, video surveillance and building controlsystems. UTC Climate, Controls & Security also provides a broad arrayof related building services, including audit, design, installation, systemintegration, repair, maintenance, and monitoring services.
UTC Climate, Controls & Security sells its HVAC and refrigerationsolutions directly to end customers, including building contractors andowners, homeowners, transportation companies, retail stores and foodservice companies, and through joint ventures, manufacturer’s repre-sentatives, distributors, wholesalers, dealers and retail outlets. Theseproducts and services are sold under the Carrier name and other brandnames. UTC Climate, Controls & Security’s security and fire safetyproducts and services are used by governments, financial institutions,architects, building owners and developers, security and fire consul-tants, homeowners and other end-users requiring a high level ofsecurity and fire protection for their businesses and residences. UTCClimate, Controls & Security provides its security and fire safety prod-ucts and services under Chubb, Kidde and other brand names and sellsdirectly to customers as well as through manufacturer’s representatives,distributors, dealers, value-added resellers and retail distribution.
Certain UTC Climate, Controls & Security HVAC businesses areseasonal, and sales and service activity can be impacted by weather.UTC Climate, Controls & Security customarily offers its customersincentives to purchase products to ensure an adequate supply of itsproducts in the distribution channels. The principal incentive programprovides reimbursements to distributors for offering promotional pric-ing on UTC Climate, Controls & Security products.
Total Increase (Decrease) Year-Over-Year for:
(DOLLARS IN MILLIONS) 2017 2016 2015 2017 Compared with 2016 2016 Compared with 2015
Net Sales $ 17,812 $ 16,851 $ 16,707 $ 961 6% $ 144 1%
Cost of Sales 12,602 11,700 11,611 902 8% 89 1%
5,210 5,151 5,096
Operating Expenses and Other 1,910 2,195 2,160
Operating Profits $ 3,300 $ 2,956 $ 2,936 $ 344 12% $ 20 1%
Factors Contributing to Total % Increase (Decrease) Year-Over-Year in:
2017 2016
Net SalesCost of
SalesOperating
Profits Net SalesCost of
SalesOperating
Profits
Organic / Operational 4% 5% — (1)% (1)% 5 %
Foreign currency translation 1% — — (1)% (1)% (1)%
Acquisitions and divestitures, net 1% 2% — 3 % 3 % 1 %
Restructuring costs — — (2)% — — 1 %
Other — 1% 14 % — — (5)%
Total % change 6% 8% 12 % 1 % 1 % 1 %
Management’s Discussion and Analysis
14 2017 Annual Report
2017 Compared with 2016The organic sales increase of 4% was driven by growth in NorthAmerica residential HVAC (1%), global commercial HVAC (1%), andcommercial refrigeration (1%).
Operational profit was consistent with the prior year as the profitcontribution from higher sales volumes, net of adverse price (6%) andthe beneficial impact from restructuring savings (2%), were offset bythe impact of unfavorable mix (6%) and unfavorable contract adjust-ments related to a large commercial project (1%). The 14% increasein “other” primarily reflects gains on the sale of investments (16%),primarily Watsco, Inc., and the absence of prior year acquisition andintegration costs (1%), partially offset by the impact of a product recallprogram (3%).
2016 Compared with 2015Organic sales decreased by 1% driven by declines in commercial HVACsales in Europe and the Middle East, fire products, and transport refrig-eration (combined 1%), partially offset by growth in North AmericaHVAC (1%).
The 5% operational profit increase was driven by lower commodi-ties cost (5%) and productivity and restructuring savings (combined4%), partly offset by the impact of lower sales volume and adverse salesmix (combined 4%). The 5% decrease in “Other” is driven by theabsence of a prior year gain as a result of a fair value adjustment relatedto acquisitions of a controlling interest in joint venture investments (5%).“Other” also includes current year gains related to the acquisition of acontrolling interest in a joint venture investment in the Middle East andfrom the sale of an investment in Australia (combined 1%), which wereoffset by a prior year gain from an acquisition of a controlling interest inanother joint venture investment.
Aerospace BusinessesThe financial performance of Pratt & Whitney and UTC AerospaceSystems is directly tied to the economic conditions of the commercialaerospace and defense aerospace industries. In particular, Pratt &Whitney experiences intense competition for new commercial airframe/engine combinations. Engine suppliers may offer substantial discountsand other financial incentives, performance and operating cost guaran-tees, and participate in financing arrangements in an effort to competefor the aftermarket associated with these engine sales. These OEMengine sales may result in losses on the engine sales, which economi-cally are recovered through the sales and profits generated over theengine’s maintenance cycle. At times, the aerospace businesses alsoenter into development programs and firm fixed-price developmentcontracts, which may require the company to bear cost overrunsrelated to unforeseen technical and design challenges that arise duringthe development stage of the program. Customer selections of enginesand components can also have a significant impact on later sales ofparts and service. Predicted traffic levels, load factors, worldwide airlineprofits, general economic activity and global defense spending havebeen reliable indicators for new aircraft and aftermarket orders withinthe aerospace industry. Spare part sales and aftermarket service trendsare affected by many factors, including usage, technological improve-
ments, pricing, regulatory changes and the retirement of older aircraft.Our commercial aftermarket businesses continue to evolve as anincreasing proportion of our aerospace businesses’ customers arecovered under Fleet Management Programs (FMPs). FMPs are compre-hensive long-term spare part and maintenance agreements with ourcustomers. We expect a continued shift to FMPs in lieu of transactionalspare part sales as new engines enter customers’ fleets on FMP andlegacy fleets are retired. In 2017, as compared with 2016, total com-mercial aerospace aftermarket sales increased 11% at Pratt & Whitneyand 10% at UTC Aerospace Systems.
Our long-term aerospace contracts are subject to strict safety andperformance regulations which can affect our ability to estimate costsprecisely. Contract cost estimation for the development of complexprojects, in particular, requires management to make significant judg-ments and assumptions regarding the complexity of the work to beperformed, availability of materials, the performance by subcontractors,the timing of funding from customers and the length of time to completethe contract. As a result, we review and update our cost estimates onsignificant contracts on a quarterly basis, and no less frequently thanannually for all others, and when circumstances change and warrant amodification to a previous estimate. Changes in estimates relate to thecurrent period impact of revisions to total estimated contract sales andcosts at completion. We record changes in contract estimates primarilyusing the cumulative catch-up method. Operating profits included sig-nificant net unfavorable changes in aerospace contract estimates ofapproximately $110 million and $157 million in 2017 and 2016, respec-tively, primarily the result of unexpected increases in estimated costsrelated to Pratt & Whitney long term aftermarket contracts. Operatingprofits included significant net favorable changes in aerospace contractestimates of approximately $115 million in 2015, primarily representingfavorable contract adjustments at Pratt & Whitney. In accordance withour revenue recognition policy, losses, if any, on long-term contracts areprovided for when anticipated. There were no material loss provisionsrecorded on OEM contracts in continuing operations in 2017 or 2016.
Performance in the general aviation sector is closely tied to theoverall health of the economy. We continue to see growth in a strongcommercial airline industry. Airline traffic, as measured by revenue pas-senger miles (RPMs), grew approximately 8% in the first eleven monthsof 2017.
Our military sales are affected by U.S. Department of Defensespending levels. However, the sale of Sikorsky during 2015 reduced ourU.S. Government defense-spending exposure. Excluding Sikorsky, totalsales to the U.S. Government were $5.8 billion in 2017, $5.6 billion in2016, and $5.6 billion in 2015, and were 10% of total UTC sales in2017, 2016 and 2015. The defense portion of our aerospace businessis also affected by changes in market demand and the global politicalenvironment. Our participation in long-term production and develop-ment programs for the U.S. Government has contributed positivelyto our results in 2017 and is expected to continue to benefit resultsin 2018.
As previously disclosed, Pratt & Whitney’s PurePower PW1500Gengine models have been selected by Bombardier to power the new
Management’s Discussion and Analysis
United Technologies Corporation 15
CSeries passenger aircraft, which entered into service on July 15, 2016.There have been multi-year delays in the development of the CSeriesaircraft. Notwithstanding these delays, Bombardier reports that theyhave received over 300 orders for the aircraft and that both the CS100and CS300 aircraft models have been certified and have entered intorevenue service. We have made various investments in support of theproduction and delivery of our PW1500G engines and systems for theCSeries program, which we currently expect to recover through futuredeliveries of PW1500G powered CSeries aircraft. On October 16, 2017,Bombardier and Airbus announced an agreement to become partnerson the CSeries aircraft program. We will continue to monitor the prog-ress of the program and our ability to recover our investments, whichwe believe would be strengthened by this partnership.
Pratt & Whitney is among the world’s leading suppliers of aircraftengines for the commercial, military, business jet and general aviationmarkets. Pratt & Whitney provides fleet management services andaftermarket maintenance, repair and overhaul services. Pratt & Whitneyproduces and develops families of large engines for wide- and narrow-body and large regional aircraft in the commercial market and for fighter,bomber, tanker and transport aircraft in the military market. P&WC isamong the world’s leading suppliers of engines powering general andbusiness aviation, as well as regional airline, utility and military airplanes,and helicopters. Pratt & Whitney and P&WC also produce, sell and ser-vice auxiliary power units for commercial and military aircraft.
The development of new engines and improvements to currentproduction engines present important growth opportunities. In view ofthe risks and costs associated with developing new engines, Pratt &Whitney has entered into collaboration arrangements in which revenues,costs and risks are shared with third parties. At December 31, 2017, theinterests of third-party participants in Pratt & Whitney-directed commer-cial jet engine programs ranged from approximately 14 percent to 50percent. UTC holds a 61 percent interest in the IAE collaboration withMTU and JAEC. Pratt & Whitney also holds a 59 percent program shareinterest in the IAE LLC collaboration with MTU and JAEC. IAE LLC sellsthe PW1100G-JM engine for the Airbus A320neo aircraft and thePW1400G-JM engine for the Irkut MC-21 aircraft. In addition, Pratt &Whitney has interests in other engine programs, including a 50 percentownership interest in the EA, a joint venture with GE Aviation, whichmarkets and manufactures the GP7000 engine for the Airbus A380aircraft. Pratt & Whitney has entered into risk and revenue sharingarrangements with third parties for 40 percent of the products andservices that Pratt & Whitney is responsible for providing to the EA.Pratt & Whitney accounts for its interests in the EA joint venture underthe equity method of accounting. See Note 1 to the ConsolidatedFinancial Statements in our 2017 Annual Report for a description ofour accounting for collaborative arrangements.
Pratt & Whitney produces the PurePower PW1000G GearedTurboFan engine family, the first of which, the PW1100G-JM, enteredinto service in January 2016. The PurePower PW1000G engine hasdemonstrated a significant reduction in fuel burn and noise levels withlower environmental emissions and operating costs than current
production engines. The PW1100G-JM engine is offered on theAirbus A320neo family of aircraft. PurePower PW1000G engine modelsalso power Bombardier’s CSeries passenger aircraft. Additionally, thePurePower PW1000G engine models have been selected to powerthe new Mitsubishi Regional Jet, the new Irkut MC-21 passenger air-craft and Embraer’s E-Jet family of aircraft. The Irkut MC-21 andEmbraer’s E-Jet family aircraft are scheduled to enter service in 2018.The Mitsubishi Regional Jet is scheduled to enter service in 2020.As previously disclosed, Gulfstream announced the selection of thePurePower PW 800 engine to exclusively power Gulfstream’s newG500 and G600 business jets scheduled to enter service in 2018.P&WC’s PurePower PW 800 engine has also been selected to powerthe new Falcon business jet by Dassault Aviation. P&WC has developedand certified the PW210 engine family for helicopters manufacturedby Sikorsky and Leonardo Helicopters. Pratt & Whitney continues toenhance its programs through performance improvement measuresand product base expansion. The success of these aircraft and enginesis dependent upon many factors, including technological accomplish-ments, program execution, aircraft demand, and regulatory approval.As a result of these factors, as well as the level of success of aircraftprogram launches by aircraft manufacturers and other conditions,additional investment in these engine programs may be required.
In 2017, Pratt & Whitney’s commercial products supported enginecertification of the PW1200G and PW 1700G for the Mitsubishi RegionalJet and Embraer E190-E2 and E-195-E2, the first flight of the IrkutMC21. Pratt & Whitney Canada has developed and received EuropeanAviation Safety Agency (EASA) and the Federal Aviation Administration(FAA) Type Certifications for the PurePower PW800 turbofan engine forthe Gulfstream G500 and G600 aircraft. Also during the year, the Pratt &Whitney F-135 program experienced the first engine delivery from theJapan Final Assembly and Check Out facility and the Israeli Air Forceachieved initial operational capability for their F-35I ‘Adir’ fleet. The mili-tary business also supported FAR Part 25 aircraft certification for theBoeing Tanker KC-46A aircraft.
Pratt & Whitney is under contract with the U.S. Government’s F-35Joint Program Office to produce and sustain the F135 engine to powerthe single-engine F-35 Lightning II aircraft (commonly known as theJoint Strike Fighter) being produced by Lockheed Martin. The two F135propulsion system configurations for the F-35A, F-35B and F-35C jetsare used by the U.S. Air Force, U.S. Marine Corps and U.S. Navy,respectively. F135 engines are also used on F-35 aircraft purchased byJoint Strike Fighter partner countries and foreign military sales countries.
Pratt & Whitney’s products are sold principally to aircraft manufac-turers, airlines and other aircraft operators, aircraft leasing companiesand the U.S. and foreign governments. Pratt & Whitney’s products andservices must adhere to strict regulatory and market-driven safety andperformance standards. The frequently changing nature of these stan-dards, along with the long duration of aircraft engine development,production and support programs, creates uncertainty regarding engineprogram profitability.
Management’s Discussion and Analysis
16 2017 Annual Report
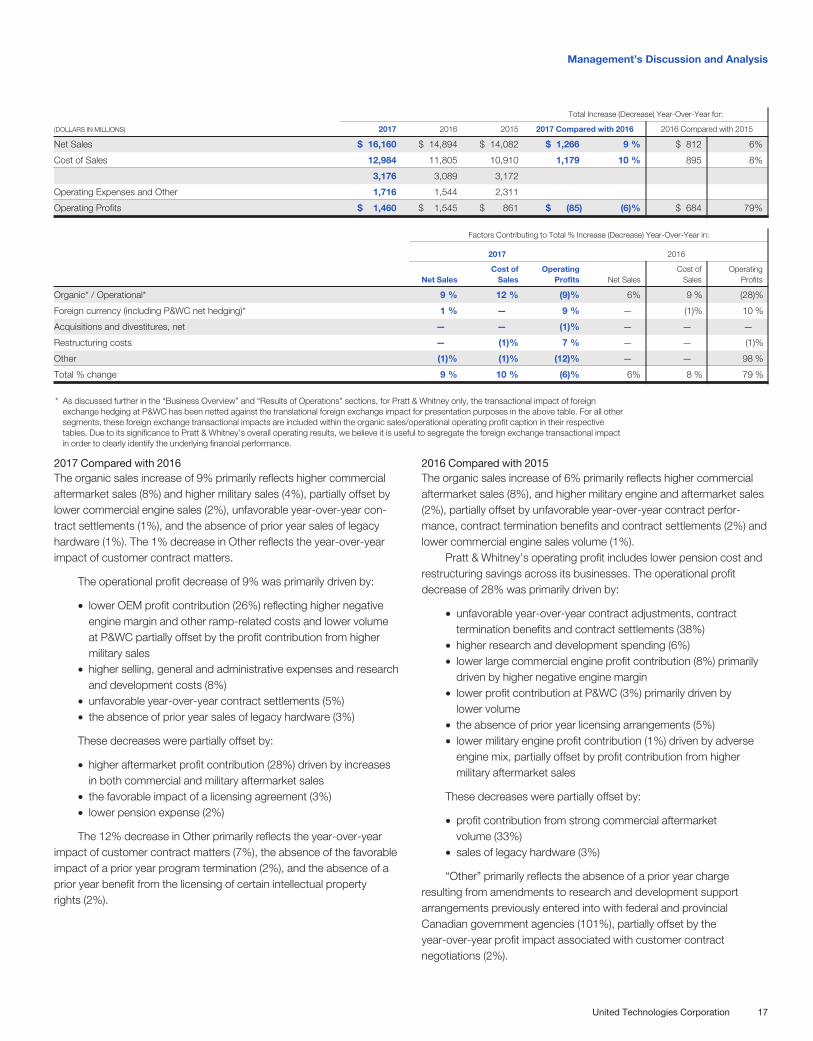
Total Increase (Decrease) Year-Over-Year for:
(DOLLARS IN MILLIONS) 2017 2016 2015 2017 Compared with 2016 2016 Compared with 2015
Net Sales $ 16,160 $ 14,894 $ 14,082 $ 1,266 9 % $ 812 6%
Cost of Sales 12,984 11,805 10,910 1,179 10 % 895 8%
3,176 3,089 3,172
Operating Expenses and Other 1,716 1,544 2,311
Operating Profits $ 1,460 $ 1,545 $ 861 $ (85) (6)% $ 684 79%
Factors Contributing to Total % Increase (Decrease) Year-Over-Year in:
2017 2016
Net SalesCost of
SalesOperating
Profits Net SalesCost of
SalesOperating
Profits
Organic* / Operational* 9 % 12 % (9)% 6% 9 % (28)%
Foreign currency (including P&WC net hedging)* 1 % — 9 % — (1)% 10 %
Acquisitions and divestitures, net — — (1)% — — —
Restructuring costs — (1)% 7 % — — (1)%
Other (1)% (1)% (12)% — — 98 %
Total % change 9 % 10 % (6)% 6% 8 % 79 %
* As discussed further in the “Business Overview” and “Results of Operations” sections, for Pratt & Whitney only, the transactional impact of foreignexchange hedging at P&WC has been netted against the translational foreign exchange impact for presentation purposes in the above table. For all othersegments, these foreign exchange transactional impacts are included within the organic sales/operational operating profit caption in their respectivetables. Due to its significance to Pratt & Whitney’s overall operating results, we believe it is useful to segregate the foreign exchange transactional impactin order to clearly identify the underlying financial performance.
2017 Compared with 2016The organic sales increase of 9% primarily reflects higher commercialaftermarket sales (8%) and higher military sales (4%), partially offset bylower commercial engine sales (2%), unfavorable year-over-year con-tract settlements (1%), and the absence of prior year sales of legacyhardware (1%). The 1% decrease in Other reflects the year-over-yearimpact of customer contract matters.
The operational profit decrease of 9% was primarily driven by:
• lower OEM profit contribution (26%) reflecting higher negativeengine margin and other ramp-related costs and lower volumeat P&WC partially offset by the profit contribution from highermilitary sales
• higher selling, general and administrative expenses and researchand development costs (8%)
• unfavorable year-over-year contract settlements (5%)• the absence of prior year sales of legacy hardware (3%)
These decreases were partially offset by:
• higher aftermarket profit contribution (28%) driven by increasesin both commercial and military aftermarket sales
• the favorable impact of a licensing agreement (3%)• lower pension expense (2%)
The 12% decrease in Other primarily reflects the year-over-yearimpact of customer contract matters (7%), the absence of the favorableimpact of a prior year program termination (2%), and the absence of aprior year benefit from the licensing of certain intellectual propertyrights (2%).
2016 Compared with 2015The organic sales increase of 6% primarily reflects higher commercialaftermarket sales (8%), and higher military engine and aftermarket sales(2%), partially offset by unfavorable year-over-year contract perfor-mance, contract termination benefits and contract settlements (2%) andlower commercial engine sales volume (1%).
Pratt & Whitney’s operating profit includes lower pension cost andrestructuring savings across its businesses. The operational profitdecrease of 28% was primarily driven by:
• unfavorable year-over-year contract adjustments, contracttermination benefits and contract settlements (38%)
• higher research and development spending (6%)• lower large commercial engine profit contribution (8%) primarily
driven by higher negative engine margin• lower profit contribution at P&WC (3%) primarily driven by
lower volume• the absence of prior year licensing arrangements (5%)• lower military engine profit contribution (1%) driven by adverse
engine mix, partially offset by profit contribution from highermilitary aftermarket sales
These decreases were partially offset by:
• profit contribution from strong commercial aftermarketvolume (33%)
• sales of legacy hardware (3%)
“Other” primarily reflects the absence of a prior year chargeresulting from amendments to research and development supportarrangements previously entered into with federal and provincialCanadian government agencies (101%), partially offset by theyear-over-year profit impact associated with customer contractnegotiations (2%).
Management’s Discussion and Analysis
United Technologies Corporation 17
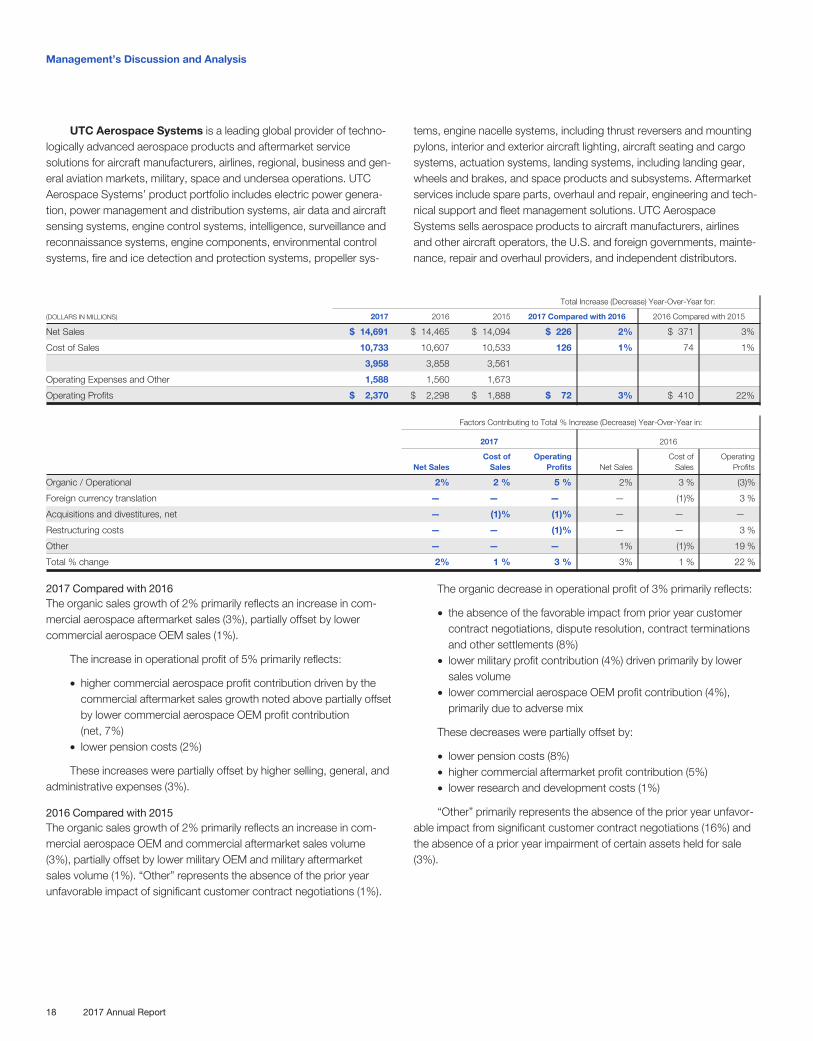
UTC Aerospace Systems is a leading global provider of techno-logically advanced aerospace products and aftermarket servicesolutions for aircraft manufacturers, airlines, regional, business and gen-eral aviation markets, military, space and undersea operations. UTCAerospace Systems’ product portfolio includes electric power genera-tion, power management and distribution systems, air data and aircraftsensing systems, engine control systems, intelligence, surveillance andreconnaissance systems, engine components, environmental controlsystems, fire and ice detection and protection systems, propeller sys-
tems, engine nacelle systems, including thrust reversers and mountingpylons, interior and exterior aircraft lighting, aircraft seating and cargosystems, actuation systems, landing systems, including landing gear,wheels and brakes, and space products and subsystems. Aftermarketservices include spare parts, overhaul and repair, engineering and tech-nical support and fleet management solutions. UTC AerospaceSystems sells aerospace products to aircraft manufacturers, airlinesand other aircraft operators, the U.S. and foreign governments, mainte-nance, repair and overhaul providers, and independent distributors.
Total Increase (Decrease) Year-Over-Year for:
(DOLLARS IN MILLIONS) 2017 2016 2015 2017 Compared with 2016 2016 Compared with 2015
Net Sales $ 14,691 $ 14,465 $ 14,094 $ 226 2% $ 371 3%
Cost of Sales 10,733 10,607 10,533 126 1% 74 1%
3,958 3,858 3,561
Operating Expenses and Other 1,588 1,560 1,673
Operating Profits $ 2,370 $ 2,298 $ 1,888 $ 72 3% $ 410 22%
Factors Contributing to Total % Increase (Decrease) Year-Over-Year in:
2017 2016
Net SalesCost of
SalesOperating
Profits Net SalesCost of
SalesOperating
Profits
Organic / Operational 2% 2 % 5 % 2% 3 % (3)%
Foreign currency translation — — — — (1)% 3 %
Acquisitions and divestitures, net — (1)% (1)% — — —
Restructuring costs — — (1)% — — 3 %
Other — — — 1% (1)% 19 %
Total % change 2% 1 % 3 % 3% 1 % 22 %
2017 Compared with 2016The organic sales growth of 2% primarily reflects an increase in com-mercial aerospace aftermarket sales (3%), partially offset by lowercommercial aerospace OEM sales (1%).
The increase in operational profit of 5% primarily reflects:
• higher commercial aerospace profit contribution driven by thecommercial aftermarket sales growth noted above partially offsetby lower commercial aerospace OEM profit contribution(net, 7%)
• lower pension costs (2%)
These increases were partially offset by higher selling, general, andadministrative expenses (3%).
2016 Compared with 2015The organic sales growth of 2% primarily reflects an increase in com-mercial aerospace OEM and commercial aftermarket sales volume(3%), partially offset by lower military OEM and military aftermarketsales volume (1%). “Other” represents the absence of the prior yearunfavorable impact of significant customer contract negotiations (1%).
The organic decrease in operational profit of 3% primarily reflects:
• the absence of the favorable impact from prior year customercontract negotiations, dispute resolution, contract terminationsand other settlements (8%)
• lower military profit contribution (4%) driven primarily by lowersales volume
• lower commercial aerospace OEM profit contribution (4%),primarily due to adverse mix
These decreases were partially offset by:
• lower pension costs (8%)• higher commercial aftermarket profit contribution (5%)• lower research and development costs (1%)
“Other” primarily represents the absence of the prior year unfavor-able impact from significant customer contract negotiations (16%) andthe absence of a prior year impairment of certain assets held for sale(3%).
Management’s Discussion and Analysis
18 2017 Annual Report
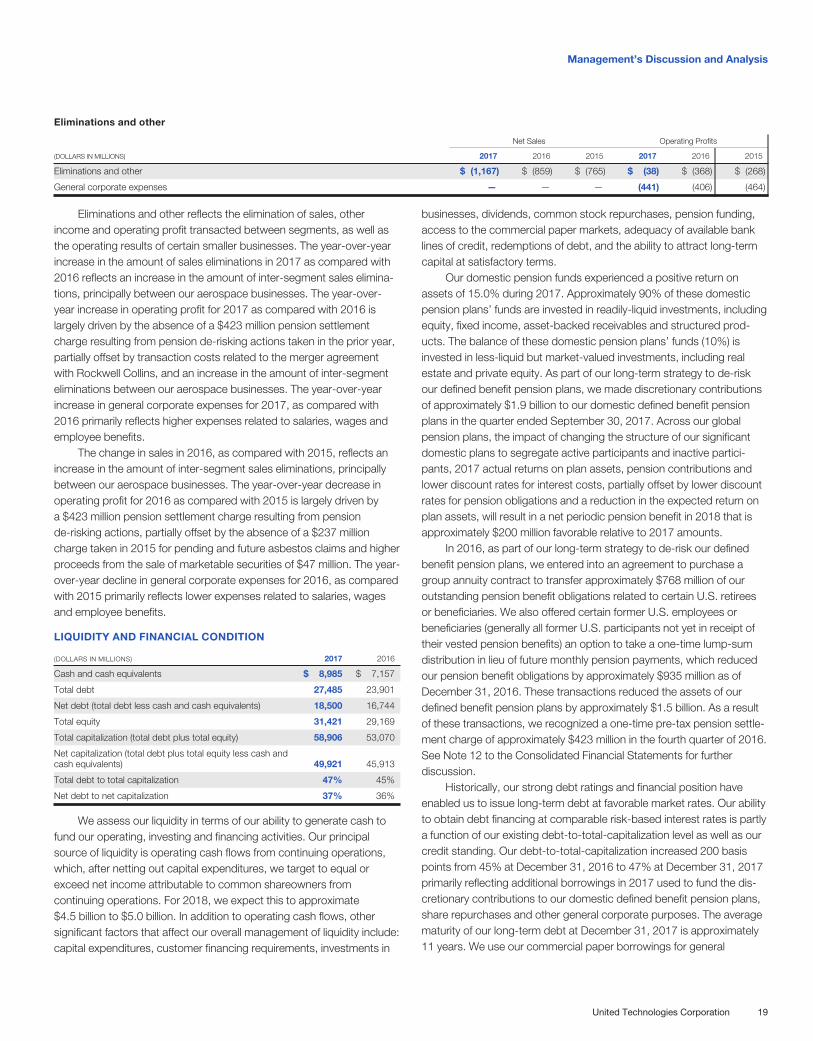
Eliminations and other
Net Sales Operating Profits
(DOLLARS IN MILLIONS) 2017 2016 2015 2017 2016 2015
Eliminations and other $ (1,167) $ (859) $ (765) $ (38) $ (368) $ (268)
General corporate expenses — — — (441) (406) (464)
Eliminations and other reflects the elimination of sales, otherincome and operating profit transacted between segments, as well asthe operating results of certain smaller businesses. The year-over-yearincrease in the amount of sales eliminations in 2017 as compared with2016 reflects an increase in the amount of inter-segment sales elimina-tions, principally between our aerospace businesses. The year-over-year increase in operating profit for 2017 as compared with 2016 islargely driven by the absence of a $423 million pension settlementcharge resulting from pension de-risking actions taken in the prior year,partially offset by transaction costs related to the merger agreementwith Rockwell Collins, and an increase in the amount of inter-segmenteliminations between our aerospace businesses. The year-over-yearincrease in general corporate expenses for 2017, as compared with2016 primarily reflects higher expenses related to salaries, wages andemployee benefits.
The change in sales in 2016, as compared with 2015, reflects anincrease in the amount of inter-segment sales eliminations, principallybetween our aerospace businesses. The year-over-year decrease inoperating profit for 2016 as compared with 2015 is largely driven bya $423 million pension settlement charge resulting from pensionde-risking actions, partially offset by the absence of a $237 millioncharge taken in 2015 for pending and future asbestos claims and higherproceeds from the sale of marketable securities of $47 million. The year-over-year decline in general corporate expenses for 2016, as comparedwith 2015 primarily reflects lower expenses related to salaries, wagesand employee benefits.
LIQUIDITY AND FINANCIAL CONDITION
(DOLLARS IN MILLIONS) 2017 2016
Cash and cash equivalents $ 8,985 $ 7,157
Total debt 27,485 23,901
Net debt (total debt less cash and cash equivalents) 18,500 16,744
Total equity 31,421 29,169
Total capitalization (total debt plus total equity) 58,906 53,070
Net capitalization (total debt plus total equity less cash andcash equivalents) 49,921 45,913
Total debt to total capitalization 47% 45%
Net debt to net capitalization 37% 36%
We assess our liquidity in terms of our ability to generate cash tofund our operating, investing and financing activities. Our principalsource of liquidity is operating cash flows from continuing operations,which, after netting out capital expenditures, we target to equal orexceed net income attributable to common shareowners fromcontinuing operations. For 2018, we expect this to approximate$4.5 billion to $5.0 billion. In addition to operating cash flows, othersignificant factors that affect our overall management of liquidity include:capital expenditures, customer financing requirements, investments in
businesses, dividends, common stock repurchases, pension funding,access to the commercial paper markets, adequacy of available banklines of credit, redemptions of debt, and the ability to attract long-termcapital at satisfactory terms.
Our domestic pension funds experienced a positive return onassets of 15.0% during 2017. Approximately 90% of these domesticpension plans’ funds are invested in readily-liquid investments, includingequity, fixed income, asset-backed receivables and structured prod-ucts. The balance of these domestic pension plans’ funds (10%) isinvested in less-liquid but market-valued investments, including realestate and private equity. As part of our long-term strategy to de-riskour defined benefit pension plans, we made discretionary contributionsof approximately $1.9 billion to our domestic defined benefit pensionplans in the quarter ended September 30, 2017. Across our globalpension plans, the impact of changing the structure of our significantdomestic plans to segregate active participants and inactive partici-pants, 2017 actual returns on plan assets, pension contributions andlower discount rates for interest costs, partially offset by lower discountrates for pension obligations and a reduction in the expected return onplan assets, will result in a net periodic pension benefit in 2018 that isapproximately $200 million favorable relative to 2017 amounts.
In 2016, as part of our long-term strategy to de-risk our definedbenefit pension plans, we entered into an agreement to purchase agroup annuity contract to transfer approximately $768 million of ouroutstanding pension benefit obligations related to certain U.S. retireesor beneficiaries. We also offered certain former U.S. employees orbeneficiaries (generally all former U.S. participants not yet in receipt oftheir vested pension benefits) an option to take a one-time lump-sumdistribution in lieu of future monthly pension payments, which reducedour pension benefit obligations by approximately $935 million as ofDecember 31, 2016. These transactions reduced the assets of ourdefined benefit pension plans by approximately $1.5 billion. As a resultof these transactions, we recognized a one-time pre-tax pension settle-ment charge of approximately $423 million in the fourth quarter of 2016.See Note 12 to the Consolidated Financial Statements for furtherdiscussion.
Historically, our strong debt ratings and financial position haveenabled us to issue long-term debt at favorable market rates. Our abilityto obtain debt financing at comparable risk-based interest rates is partlya function of our existing debt-to-total-capitalization level as well as ourcredit standing. Our debt-to-total-capitalization increased 200 basispoints from 45% at December 31, 2016 to 47% at December 31, 2017primarily reflecting additional borrowings in 2017 used to fund the dis-cretionary contributions to our domestic defined benefit pension plans,share repurchases and other general corporate purposes. The averagematurity of our long-term debt at December 31, 2017 is approximately11 years. We use our commercial paper borrowings for general
Management’s Discussion and Analysis
United Technologies Corporation 19
corporate purposes, including the funding of potential acquisitions, dis-cretionary pension contributions, debt refinancing, dividend paymentsand repurchases of our common stock. The need for commercial paperborrowings arises when the use of domestic cash for general corporatepurposes exceeds the sum of domestic cash generation and foreigncash repatriated to the U.S.
On September 4, 2017, we announced that we had entered intoa merger agreement with Rockwell Collins, under which we agreed toacquire Rockwell Collins. Under the terms of the merger agreement,each Rockwell Collins shareowner will receive $93.33 per share in cashand a fraction of a share of UTC common stock equal to the quotientobtained by dividing $46.67 by the average of the volume-weightedaverage prices per share of UTC common stock on the NYSE oneach of the 20 consecutive trading days ending with the trading dayimmediately prior to the closing date (the “UTC Stock Price”), subjectto adjustment based on a two-way collar mechanism as describedbelow (the “Stock Consideration”). The cash and UTC stock payable inexchange for each such share of Rockwell Collins common stock arecollectively the “Merger Consideration.” The fraction of a share of UTCcommon stock into which each such share of Rockwell Collins commonstock will be converted is the “Exchange Ratio.” The Exchange Ratio willbe determined based upon the UTC Stock Price. If the UTC Stock Priceis greater than $107.01 but less than $124.37, the Exchange Ratio willbe equal to the quotient of (i) $46.67 divided by (ii) the UTC Stock Price,which, in each case, will result in the Stock Consideration having a valueequal to $46.67. If the UTC Stock Price is less than or equal to $107.01or greater than or equal to $124.37, then a two-way collar mechanismwill apply, pursuant to which, (x) if the UTC Stock Price is greater thanor equal to $124.37, the Exchange Ratio will be fixed at 0.37525 andthe value of the Stock Consideration will be greater than $46.67, and(y) if the UTC Stock Price is less than or equal to $107.01, the ExchangeRatio will be fixed at 0.43613 and the value of the Stock Considerationwill be less than $46.67. On January 11, 2018, the merger wasapproved by Rockwell Collins’ shareowners. We currently expect thatthe merger will be completed in the third quarter of 2018, subject tocustomary closing conditions, including the receipt of required regula-tory approvals.
We anticipate that approximately $15 billion will be required topay the aggregate cash portion of the Merger Consideration. Weexpect to fund the cash portion of the Merger Consideration throughdebt issuances and cash on hand. Additionally, we have entered into a$6.5 billion 364-day unsecured bridge loan credit agreement that wouldbe funded only to the extent certain anticipated debt issuances are notcompleted prior to the completion of the merger. We expect to assumeapproximately $7 billion of Rockwell Collins’ outstanding debt. To helpmanage the cash flow and liquidity impact resulting from the proposedacquisition, we have suspended share repurchases, excluding activityrelating to our employee savings plans. As we continue to assess theimpacts of the TCJA, future opportunities for repatriation of our non-U.S. earnings, and accelerated de-leveraging, we may consider, inaddition to investments in our operations, limited additional share
repurchases to offset the effects of dilution related to our stock-basedcompensation programs—see Note 12.
On November 13, 2017, we issued e750 million aggregate princi-pal amount of floating rate notes due 2019. The net proceeds from thisdebt issuance were used to fund the repayment of commercial paperand for other general corporate purposes.
On May 4, 2017, we issued $1.0 billion aggregate principal amountof 1.900% notes due 2020, $500 million aggregate principal amountof 2.300% notes due 2022, $800 million aggregate principal amount of2.800% notes due 2024, $1.1 billion aggregate principal amount of3.125% notes due 2027 and $600 million aggregate principal amountof 4.050% notes due 2047. The net proceeds received from these debtissuances were used to fund the repayment at maturity of our 1.800%notes due 2017, representing $1.5 billion in aggregate principal andother general corporate purposes.
On December 1, 2016, we redeemed all outstanding 5.375%notes due in 2017, representing $1.0 billion in aggregate principal, andall outstanding 6.125% notes due in 2019, representing $1.25 billionin aggregate principal, under our redemption notice issued onNovember 1, 2016. A combined net extinguishment loss of approxi-mately $164 million was recognized within Interest expense, net in theaccompanying Consolidated Statement of Operations.
On November 1, 2016, we issued $650 million aggregate principalamount of 1.500% notes due 2019, $750 million aggregate principalamount of 1.950% notes due 2021, $1,150 million aggregate principalamount of 2.650% notes due 2026, $1,100 million aggregate principalamount of 3.750% notes due 2046 and $350 million aggregate principalamount of floating rate notes due 2019. We used the net proceedsreceived from these issuances to fund the redemption price of the5.375% notes due 2017 and the 6.125% notes due 2019, to fundthe repayment of commercial paper, and for other general corporatepurposes.
On February 22, 2016, we issued e950 million aggregate principalamount of 1.125% notes due 2021, e500 million aggregate principalamount of 1.875% notes due 2026 and e750 million aggregate princi-pal amount of floating rate notes due 2018. The net proceeds fromthese debt issuances were used for general corporate purposes.
On November 6, 2015, we completed the sale of Sikorsky toLockheed Martin Corp. for approximately $9.1 billion in cash. Inconnection with the sale of Sikorsky, we made tax payments of approxi-mately $2.5 billion in 2016. On November 11, 2015, we entered intoASR agreements to repurchase an aggregate of $6 billion of our com-mon stock utilizing the net after-tax proceeds from the sale of Sikorsky.Under the terms of the ASR agreements, we made the aggregatepayments and received an initial delivery of approximately 51.9 millionshares of our common stock, representing approximately 85% of theshares expected to be repurchased. In 2016, the shares associatedwith the remaining portion of the aggregate purchase were settled uponfinal delivery to us of approximately 10.1 million additional shares ofcommon stock.
On March 13, 2015, we entered into ASR agreements to repur-chase an aggregate of $2.65 billion of our common stock, which was
Management’s Discussion and Analysis
20 2017 Annual Report
largely funded by our commercial paper borrowings. Under the terms ofthe ASR agreements, we made the aggregate payments and receivedan initial delivery of approximately 18.6 million shares of our commonstock, representing approximately 85% of the shares expected to berepurchased. On July 31, 2015, the shares associated with the remain-ing portion of the aggregate purchase were settled upon final delivery ofapproximately 4.2 million additional shares of common stock.
At December 31, 2017, we had revolving credit agreements withvarious banks permitting aggregate borrowings of up to $4.35 billionpursuant to a $2.20 billion revolving credit agreement and a $2.15 billionmulticurrency revolving credit agreement, both of which expire inAugust 2021. As of December 31, 2017 and 2016, there were no bor-rowings under either of these revolving credit agreements. The undrawnportions of our revolving credit agreements are also available to serveas backup facilities for the issuance of commercial paper. As ofDecember 31, 2017, our maximum commercial paper borrowingauthority was $4.35 billion.
At December 31, 2017, approximately 90% of our cash was heldby UTC’s foreign subsidiaries, due to our extensive international opera-tions. We manage our worldwide cash requirements by reviewingavailable funds among the many subsidiaries through which we conductour business and the cost effectiveness with which those funds can beaccessed. As previously discussed, on December 22, 2017, the TCJAwas enacted. Prior to enactment of the TCJA, with few exceptions, theCompany had intended to reinvest its undistributed foreign earningspermanently outside the U.S. or to repatriate the earnings only when itwas tax effective to do so. Due to the inherent complexities in determin-ing any remaining U.S. federal and state taxes and the non-U.S. taxesthat may be due if these earnings were remitted to the U.S., we areevaluating our intention with regards to these undistributed earnings.
We continue to be involved in litigation with the German Tax Officein the German Tax Court with respect to certain tax benefits that wehave claimed related to a 1998 reorganization of the corporate structureof Otis operations in Germany. We made tax and interest payments ofapproximately $300 million during 2015 to avoid additional interestaccruals while we continue to litigate this matter. We do not expect tomake significant additional tax or interest payments pending final resolu-tion of this matter. See Note 18 for a further discussion of this Germantax litigation.
On occasion, we are required to maintain cash deposits with cer-tain banks with respect to contractual obligations related to acquisitionsor divestitures or other legal obligations. As of December 31, 2017,2016 and 2015, the amount of such restricted cash was approximately$33 million, $32 million and $45 million, respectively.
We believe our future operating cash flows will be sufficient to meetour future operating cash needs. Further, we continue to have access tothe commercial paper markets and our existing credit facilities, and ourability to obtain debt or equity financing, as well as the availability undercommitted credit lines, provides additional potential sources of liquidityshould they be required or appropriate.
Cash Flow — Operating Activities of Continuing Operations
(DOLLARS IN MILLIONS) 2017 2016 2015
Net cash flows provided by operating activitiesof continuing operations $ 5,631 $ 6,412 $ 6,755
2017 Compared with 2016As part of our long-term strategy to de-risk our defined benefit pensionplans, we made discretionary contributions of approximately $1.9 billionto our domestic defined benefit pension plans in the quarter endedSeptember 30, 2017. Including the effects of this contribution, cashgenerated from operating activities of continuing operations in 2017was $781 million lower than 2016. Lower net income and the higherglobal pension contributions were partially offset by lower investmentsin working capital of approximately $1.1 billion and approximately$0.6 billion favorable Other operating activities, net. The 2017 Otheroperating activities, net was driven by increases in net noncurrentincome tax liabilities resulting from the TCJA enacted in December 2017as discussed above, partially offset by gains on sales of investmentsincluded in net income, including UTC Climate, Controls & Security’ssale of investments in Watsco, Inc.
The 2017 cash outflows for working capital ($52 million) were pri-marily driven by increases in inventories of approximately $1.1 billion,primarily in our aerospace businesses supporting an increase in fore-casted OEM deliveries and related aftermarket demand, and includingapproximately $200 million of inventory costs attributable to new engineofferings recognized based on the average cost per unit expected overthe life of each contract using the units-of-delivery method of percent-age of completion accounting, as discussed in Note 6. Accountsreceivable increases at Pratt & Whitney were partially offset by declinesat UTC Climate, Controls & Security. Factoring activity provided anincrease of approximately $700 million in cash generated from operat-ing activities of continuing operations in 2017, as compared to the prioryear period. This increase does not reflect the factoring of certain aero-space receivables performed at customer request for which we arecompensated by the customer for the extended payment cycle. Theseinvestments were largely offset by the net increase in accrued liabilitiesand accounts payable of approximately $1.6 billion, primarily driven byproduction volumes at Pratt & Whitney.
For 2016, cash outflows for working capital ($1,161 million) wereprimarily driven by increases in inventory in our aerospace businessesto support deliveries and other contractual commitments, includingapproximately $220 million of inventory costs attributable to new engineofferings recognized based on the average cost per unit expected overthe life of each contract using the units-of-delivery method of percent-age of completion accounting, as discussed in Note 6. Increases inaccounts receivable at Pratt & Whitney and our commercial businesseswere partially offset by increases in accounts payable and accruedliabilities across all of our businesses.
The funded status of our defined benefit pension plans is depen-dent upon many factors, including returns on invested assets, the levelof market interest rates and actuarial mortality assumptions. We cancontribute cash or UTC shares to our plans at our discretion, subject toapplicable regulations. Total cash contributions to our global defined
Management’s Discussion and Analysis
United Technologies Corporation 21
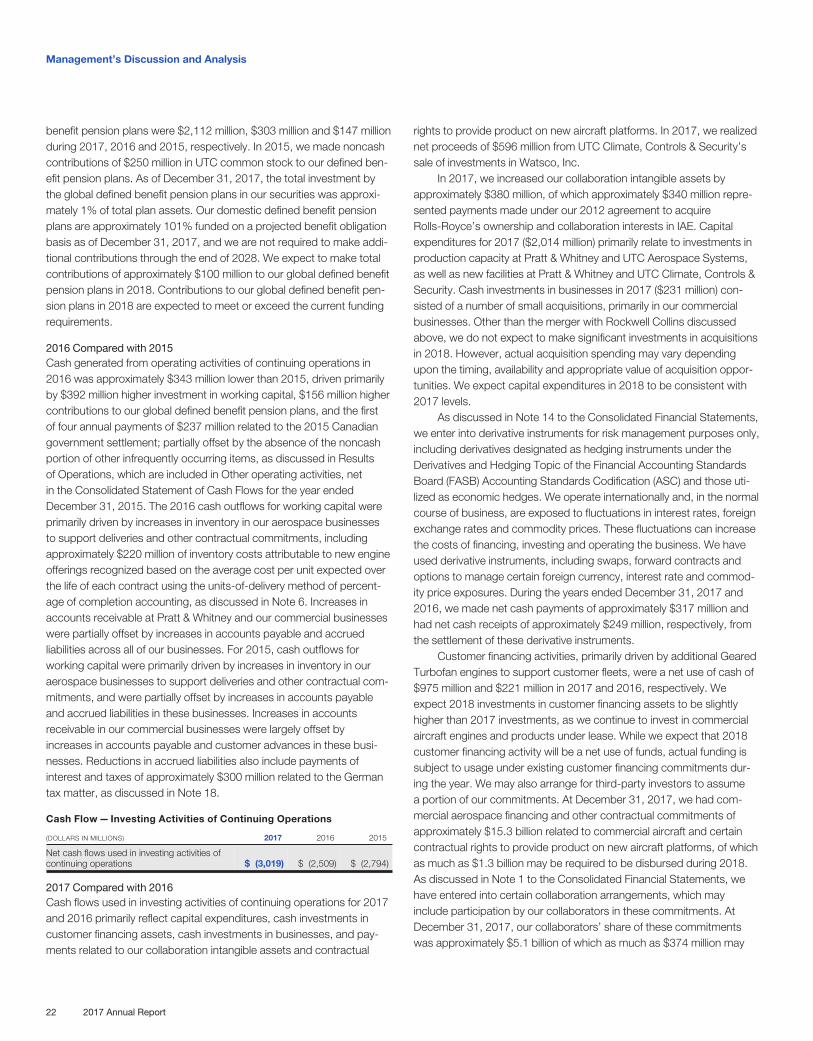
benefit pension plans were $2,112 million, $303 million and $147 millionduring 2017, 2016 and 2015, respectively. In 2015, we made noncashcontributions of $250 million in UTC common stock to our defined ben-efit pension plans. As of December 31, 2017, the total investment bythe global defined benefit pension plans in our securities was approxi-mately 1% of total plan assets. Our domestic defined benefit pensionplans are approximately 101% funded on a projected benefit obligationbasis as of December 31, 2017, and we are not required to make addi-tional contributions through the end of 2028. We expect to make totalcontributions of approximately $100 million to our global defined benefitpension plans in 2018. Contributions to our global defined benefit pen-sion plans in 2018 are expected to meet or exceed the current fundingrequirements.
2016 Compared with 2015Cash generated from operating activities of continuing operations in2016 was approximately $343 million lower than 2015, driven primarilyby $392 million higher investment in working capital, $156 million highercontributions to our global defined benefit pension plans, and the firstof four annual payments of $237 million related to the 2015 Canadiangovernment settlement; partially offset by the absence of the noncashportion of other infrequently occurring items, as discussed in Resultsof Operations, which are included in Other operating activities, netin the Consolidated Statement of Cash Flows for the year endedDecember 31, 2015. The 2016 cash outflows for working capital wereprimarily driven by increases in inventory in our aerospace businessesto support deliveries and other contractual commitments, includingapproximately $220 million of inventory costs attributable to new engineofferings recognized based on the average cost per unit expected overthe life of each contract using the units-of-delivery method of percent-age of completion accounting, as discussed in Note 6. Increases inaccounts receivable at Pratt & Whitney and our commercial businesseswere partially offset by increases in accounts payable and accruedliabilities across all of our businesses. For 2015, cash outflows forworking capital were primarily driven by increases in inventory in ouraerospace businesses to support deliveries and other contractual com-mitments, and were partially offset by increases in accounts payableand accrued liabilities in these businesses. Increases in accountsreceivable in our commercial businesses were largely offset byincreases in accounts payable and customer advances in these busi-nesses. Reductions in accrued liabilities also include payments ofinterest and taxes of approximately $300 million related to the Germantax matter, as discussed in Note 18.
Cash Flow — Investing Activities of Continuing Operations
(DOLLARS IN MILLIONS) 2017 2016 2015
Net cash flows used in investing activities ofcontinuing operations $ (3,019) $ (2,509) $ (2,794)
2017 Compared with 2016Cash flows used in investing activities of continuing operations for 2017and 2016 primarily reflect capital expenditures, cash investments incustomer financing assets, cash investments in businesses, and pay-ments related to our collaboration intangible assets and contractual
rights to provide product on new aircraft platforms. In 2017, we realizednet proceeds of $596 million from UTC Climate, Controls & Security’ssale of investments in Watsco, Inc.
In 2017, we increased our collaboration intangible assets byapproximately $380 million, of which approximately $340 million repre-sented payments made under our 2012 agreement to acquireRolls-Royce’s ownership and collaboration interests in IAE. Capitalexpenditures for 2017 ($2,014 million) primarily relate to investments inproduction capacity at Pratt & Whitney and UTC Aerospace Systems,as well as new facilities at Pratt & Whitney and UTC Climate, Controls &Security. Cash investments in businesses in 2017 ($231 million) con-sisted of a number of small acquisitions, primarily in our commercialbusinesses. Other than the merger with Rockwell Collins discussedabove, we do not expect to make significant investments in acquisitionsin 2018. However, actual acquisition spending may vary dependingupon the timing, availability and appropriate value of acquisition oppor-tunities. We expect capital expenditures in 2018 to be consistent with2017 levels.
As discussed in Note 14 to the Consolidated Financial Statements,we enter into derivative instruments for risk management purposes only,including derivatives designated as hedging instruments under theDerivatives and Hedging Topic of the Financial Accounting StandardsBoard (FASB) Accounting Standards Codification (ASC) and those uti-lized as economic hedges. We operate internationally and, in the normalcourse of business, are exposed to fluctuations in interest rates, foreignexchange rates and commodity prices. These fluctuations can increasethe costs of financing, investing and operating the business. We haveused derivative instruments, including swaps, forward contracts andoptions to manage certain foreign currency, interest rate and commod-ity price exposures. During the years ended December 31, 2017 and2016, we made net cash payments of approximately $317 million andhad net cash receipts of approximately $249 million, respectively, fromthe settlement of these derivative instruments.
Customer financing activities, primarily driven by additional GearedTurbofan engines to support customer fleets, were a net use of cash of$975 million and $221 million in 2017 and 2016, respectively. Weexpect 2018 investments in customer financing assets to be slightlyhigher than 2017 investments, as we continue to invest in commercialaircraft engines and products under lease. While we expect that 2018customer financing activity will be a net use of funds, actual funding issubject to usage under existing customer financing commitments dur-ing the year. We may also arrange for third-party investors to assumea portion of our commitments. At December 31, 2017, we had com-mercial aerospace financing and other contractual commitments ofapproximately $15.3 billion related to commercial aircraft and certaincontractual rights to provide product on new aircraft platforms, of whichas much as $1.3 billion may be required to be disbursed during 2018.As discussed in Note 1 to the Consolidated Financial Statements, wehave entered into certain collaboration arrangements, which mayinclude participation by our collaborators in these commitments. AtDecember 31, 2017, our collaborators’ share of these commitmentswas approximately $5.1 billion of which as much as $374 million may
Management’s Discussion and Analysis
22 2017 Annual Report
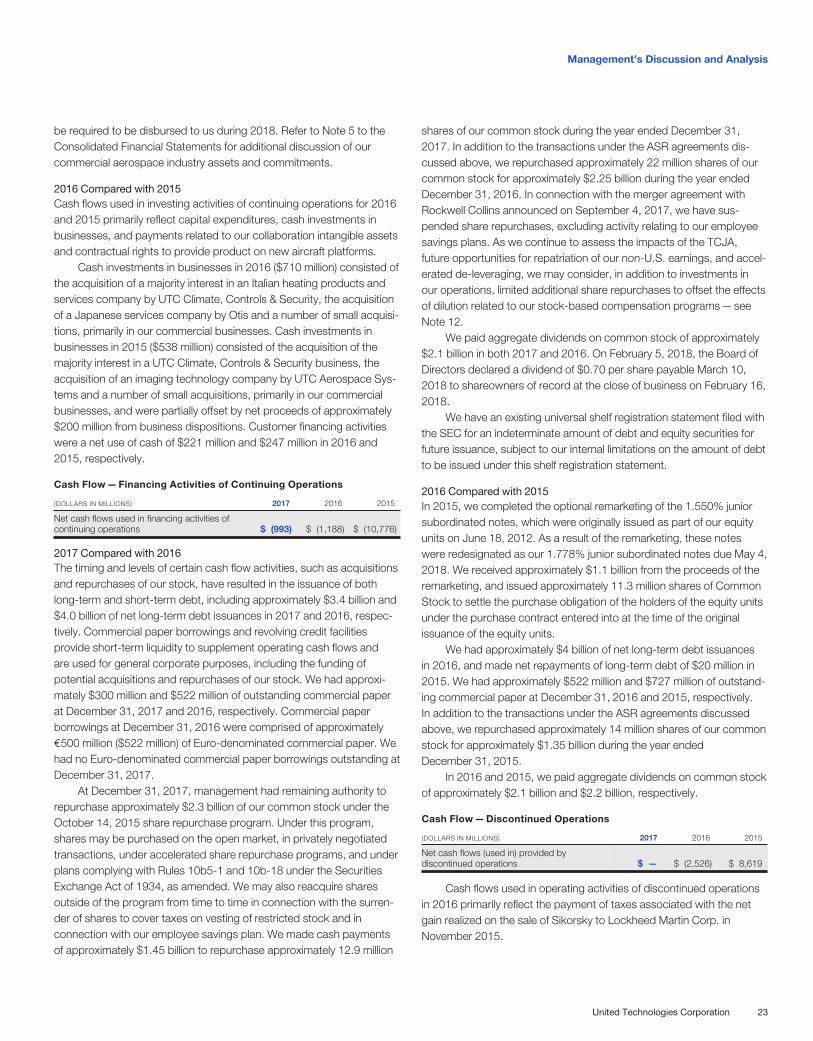
be required to be disbursed to us during 2018. Refer to Note 5 to theConsolidated Financial Statements for additional discussion of ourcommercial aerospace industry assets and commitments.
2016 Compared with 2015Cash flows used in investing activities of continuing operations for 2016and 2015 primarily reflect capital expenditures, cash investments inbusinesses, and payments related to our collaboration intangible assetsand contractual rights to provide product on new aircraft platforms.
Cash investments in businesses in 2016 ($710 million) consisted ofthe acquisition of a majority interest in an Italian heating products andservices company by UTC Climate, Controls & Security, the acquisitionof a Japanese services company by Otis and a number of small acquisi-tions, primarily in our commercial businesses. Cash investments inbusinesses in 2015 ($538 million) consisted of the acquisition of themajority interest in a UTC Climate, Controls & Security business, theacquisition of an imaging technology company by UTC Aerospace Sys-tems and a number of small acquisitions, primarily in our commercialbusinesses, and were partially offset by net proceeds of approximately$200 million from business dispositions. Customer financing activitieswere a net use of cash of $221 million and $247 million in 2016 and2015, respectively.
Cash Flow — Financing Activities of Continuing Operations
(DOLLARS IN MILLIONS) 2017 2016 2015
Net cash flows used in financing activities ofcontinuing operations $ (993) $ (1,188) $ (10,776)
2017 Compared with 2016The timing and levels of certain cash flow activities, such as acquisitionsand repurchases of our stock, have resulted in the issuance of bothlong-term and short-term debt, including approximately $3.4 billion and$4.0 billion of net long-term debt issuances in 2017 and 2016, respec-tively. Commercial paper borrowings and revolving credit facilitiesprovide short-term liquidity to supplement operating cash flows andare used for general corporate purposes, including the funding ofpotential acquisitions and repurchases of our stock. We had approxi-mately $300 million and $522 million of outstanding commercial paperat December 31, 2017 and 2016, respectively. Commercial paperborrowings at December 31, 2016 were comprised of approximatelye500 million ($522 million) of Euro-denominated commercial paper. Wehad no Euro-denominated commercial paper borrowings outstanding atDecember 31, 2017.
At December 31, 2017, management had remaining authority torepurchase approximately $2.3 billion of our common stock under theOctober 14, 2015 share repurchase program. Under this program,shares may be purchased on the open market, in privately negotiatedtransactions, under accelerated share repurchase programs, and underplans complying with Rules 10b5-1 and 10b-18 under the SecuritiesExchange Act of 1934, as amended. We may also reacquire sharesoutside of the program from time to time in connection with the surren-der of shares to cover taxes on vesting of restricted stock and inconnection with our employee savings plan. We made cash paymentsof approximately $1.45 billion to repurchase approximately 12.9 million
shares of our common stock during the year ended December 31,2017. In addition to the transactions under the ASR agreements dis-cussed above, we repurchased approximately 22 million shares of ourcommon stock for approximately $2.25 billion during the year endedDecember 31, 2016. In connection with the merger agreement withRockwell Collins announced on September 4, 2017, we have sus-pended share repurchases, excluding activity relating to our employeesavings plans. As we continue to assess the impacts of the TCJA,future opportunities for repatriation of our non-U.S. earnings, and accel-erated de-leveraging, we may consider, in addition to investments inour operations, limited additional share repurchases to offset the effectsof dilution related to our stock-based compensation programs—seeNote 12.
We paid aggregate dividends on common stock of approximately$2.1 billion in both 2017 and 2016. On February 5, 2018, the Board ofDirectors declared a dividend of $0.70 per share payable March 10,2018 to shareowners of record at the close of business on February 16,2018.
We have an existing universal shelf registration statement filed withthe SEC for an indeterminate amount of debt and equity securities forfuture issuance, subject to our internal limitations on the amount of debtto be issued under this shelf registration statement.
2016 Compared with 2015In 2015, we completed the optional remarketing of the 1.550% juniorsubordinated notes, which were originally issued as part of our equityunits on June 18, 2012. As a result of the remarketing, these noteswere redesignated as our 1.778% junior subordinated notes due May 4,2018. We received approximately $1.1 billion from the proceeds of theremarketing, and issued approximately 11.3 million shares of CommonStock to settle the purchase obligation of the holders of the equity unitsunder the purchase contract entered into at the time of the originalissuance of the equity units.
We had approximately $4 billion of net long-term debt issuancesin 2016, and made net repayments of long-term debt of $20 million in2015. We had approximately $522 million and $727 million of outstand-ing commercial paper at December 31, 2016 and 2015, respectively.In addition to the transactions under the ASR agreements discussedabove, we repurchased approximately 14 million shares of our commonstock for approximately $1.35 billion during the year endedDecember 31, 2015.
In 2016 and 2015, we paid aggregate dividends on common stockof approximately $2.1 billion and $2.2 billion, respectively.
Cash Flow — Discontinued Operations
(DOLLARS IN MILLIONS) 2017 2016 2015
Net cash flows (used in) provided bydiscontinued operations $ — $ (2,526) $ 8,619
Cash flows used in operating activities of discontinued operationsin 2016 primarily reflect the payment of taxes associated with the netgain realized on the sale of Sikorsky to Lockheed Martin Corp. inNovember 2015.
Management’s Discussion and Analysis
United Technologies Corporation 23
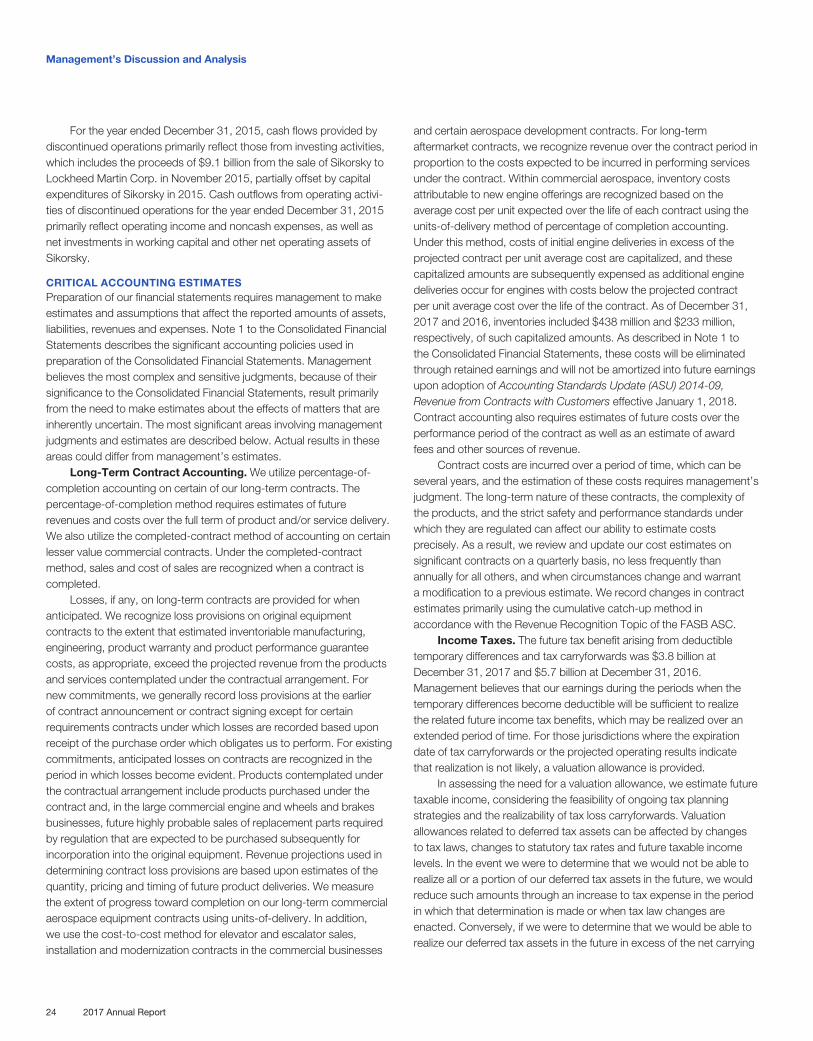
For the year ended December 31, 2015, cash flows provided bydiscontinued operations primarily reflect those from investing activities,which includes the proceeds of $9.1 billion from the sale of Sikorsky toLockheed Martin Corp. in November 2015, partially offset by capitalexpenditures of Sikorsky in 2015. Cash outflows from operating activi-ties of discontinued operations for the year ended December 31, 2015primarily reflect operating income and noncash expenses, as well asnet investments in working capital and other net operating assets ofSikorsky.
CRITICAL ACCOUNTING ESTIMATESPreparation of our financial statements requires management to makeestimates and assumptions that affect the reported amounts of assets,liabilities, revenues and expenses. Note 1 to the Consolidated FinancialStatements describes the significant accounting policies used inpreparation of the Consolidated Financial Statements. Managementbelieves the most complex and sensitive judgments, because of theirsignificance to the Consolidated Financial Statements, result primarilyfrom the need to make estimates about the effects of matters that areinherently uncertain. The most significant areas involving managementjudgments and estimates are described below. Actual results in theseareas could differ from management’s estimates.
Long-Term Contract Accounting. We utilize percentage-of-completion accounting on certain of our long-term contracts. Thepercentage-of-completion method requires estimates of futurerevenues and costs over the full term of product and/or service delivery.We also utilize the completed-contract method of accounting on certainlesser value commercial contracts. Under the completed-contractmethod, sales and cost of sales are recognized when a contract iscompleted.
Losses, if any, on long-term contracts are provided for whenanticipated. We recognize loss provisions on original equipmentcontracts to the extent that estimated inventoriable manufacturing,engineering, product warranty and product performance guaranteecosts, as appropriate, exceed the projected revenue from the productsand services contemplated under the contractual arrangement. Fornew commitments, we generally record loss provisions at the earlierof contract announcement or contract signing except for certainrequirements contracts under which losses are recorded based uponreceipt of the purchase order which obligates us to perform. For existingcommitments, anticipated losses on contracts are recognized in theperiod in which losses become evident. Products contemplated underthe contractual arrangement include products purchased under thecontract and, in the large commercial engine and wheels and brakesbusinesses, future highly probable sales of replacement parts requiredby regulation that are expected to be purchased subsequently forincorporation into the original equipment. Revenue projections used indetermining contract loss provisions are based upon estimates of thequantity, pricing and timing of future product deliveries. We measurethe extent of progress toward completion on our long-term commercialaerospace equipment contracts using units-of-delivery. In addition,we use the cost-to-cost method for elevator and escalator sales,installation and modernization contracts in the commercial businesses
and certain aerospace development contracts. For long-termaftermarket contracts, we recognize revenue over the contract period inproportion to the costs expected to be incurred in performing servicesunder the contract. Within commercial aerospace, inventory costsattributable to new engine offerings are recognized based on theaverage cost per unit expected over the life of each contract using theunits-of-delivery method of percentage of completion accounting.Under this method, costs of initial engine deliveries in excess of theprojected contract per unit average cost are capitalized, and thesecapitalized amounts are subsequently expensed as additional enginedeliveries occur for engines with costs below the projected contractper unit average cost over the life of the contract. As of December 31,2017 and 2016, inventories included $438 million and $233 million,respectively, of such capitalized amounts. As described in Note 1 tothe Consolidated Financial Statements, these costs will be eliminatedthrough retained earnings and will not be amortized into future earningsupon adoption of Accounting Standards Update (ASU) 2014-09,Revenue from Contracts with Customers effective January 1, 2018.Contract accounting also requires estimates of future costs over theperformance period of the contract as well as an estimate of awardfees and other sources of revenue.
Contract costs are incurred over a period of time, which can beseveral years, and the estimation of these costs requires management’sjudgment. The long-term nature of these contracts, the complexity ofthe products, and the strict safety and performance standards underwhich they are regulated can affect our ability to estimate costsprecisely. As a result, we review and update our cost estimates onsignificant contracts on a quarterly basis, no less frequently thanannually for all others, and when circumstances change and warranta modification to a previous estimate. We record changes in contractestimates primarily using the cumulative catch-up method inaccordance with the Revenue Recognition Topic of the FASB ASC.
Income Taxes. The future tax benefit arising from deductibletemporary differences and tax carryforwards was $3.8 billion atDecember 31, 2017 and $5.7 billion at December 31, 2016.Management believes that our earnings during the periods when thetemporary differences become deductible will be sufficient to realizethe related future income tax benefits, which may be realized over anextended period of time. For those jurisdictions where the expirationdate of tax carryforwards or the projected operating results indicatethat realization is not likely, a valuation allowance is provided.
In assessing the need for a valuation allowance, we estimate futuretaxable income, considering the feasibility of ongoing tax planningstrategies and the realizability of tax loss carryforwards. Valuationallowances related to deferred tax assets can be affected by changesto tax laws, changes to statutory tax rates and future taxable incomelevels. In the event we were to determine that we would not be able torealize all or a portion of our deferred tax assets in the future, we wouldreduce such amounts through an increase to tax expense in the periodin which that determination is made or when tax law changes areenacted. Conversely, if we were to determine that we would be able torealize our deferred tax assets in the future in excess of the net carrying
Management’s Discussion and Analysis
24 2017 Annual Report
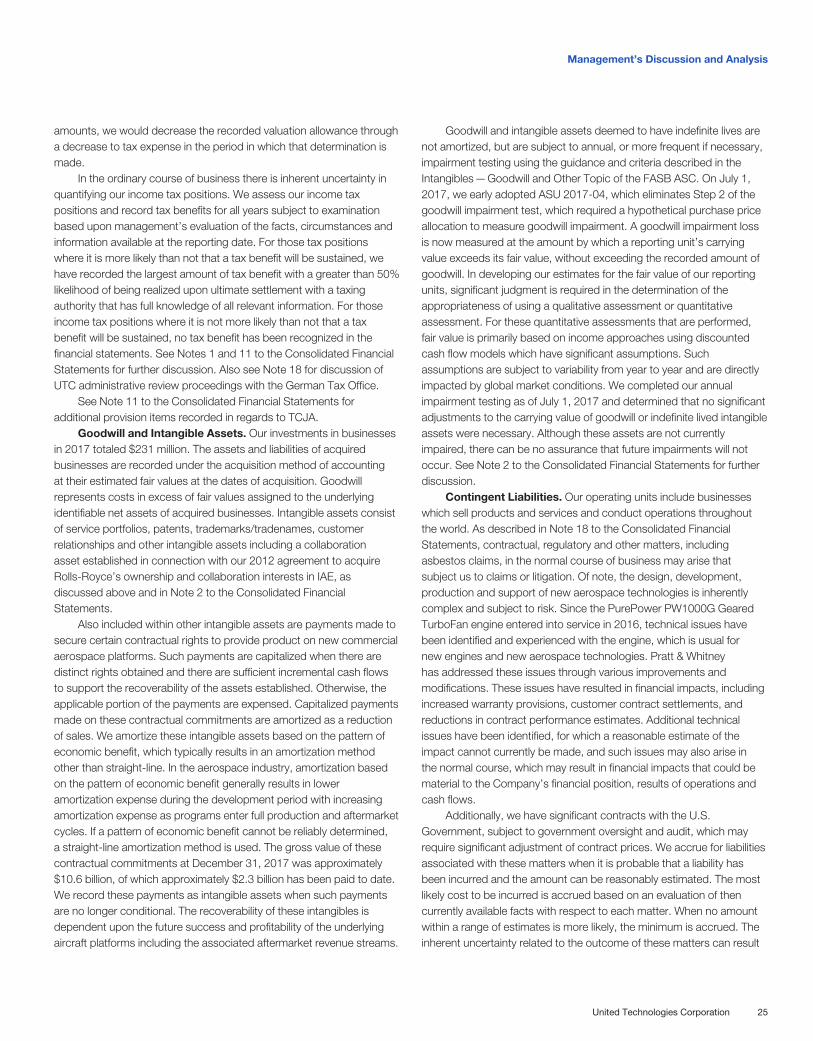
amounts, we would decrease the recorded valuation allowance througha decrease to tax expense in the period in which that determination ismade.
In the ordinary course of business there is inherent uncertainty inquantifying our income tax positions. We assess our income taxpositions and record tax benefits for all years subject to examinationbased upon management’s evaluation of the facts, circumstances andinformation available at the reporting date. For those tax positionswhere it is more likely than not that a tax benefit will be sustained, wehave recorded the largest amount of tax benefit with a greater than 50%likelihood of being realized upon ultimate settlement with a taxingauthority that has full knowledge of all relevant information. For thoseincome tax positions where it is not more likely than not that a taxbenefit will be sustained, no tax benefit has been recognized in thefinancial statements. See Notes 1 and 11 to the Consolidated FinancialStatements for further discussion. Also see Note 18 for discussion ofUTC administrative review proceedings with the German Tax Office.
See Note 11 to the Consolidated Financial Statements foradditional provision items recorded in regards to TCJA.
Goodwill and Intangible Assets. Our investments in businessesin 2017 totaled $231 million. The assets and liabilities of acquiredbusinesses are recorded under the acquisition method of accountingat their estimated fair values at the dates of acquisition. Goodwillrepresents costs in excess of fair values assigned to the underlyingidentifiable net assets of acquired businesses. Intangible assets consistof service portfolios, patents, trademarks/tradenames, customerrelationships and other intangible assets including a collaborationasset established in connection with our 2012 agreement to acquireRolls-Royce’s ownership and collaboration interests in IAE, asdiscussed above and in Note 2 to the Consolidated FinancialStatements.
Also included within other intangible assets are payments made tosecure certain contractual rights to provide product on new commercialaerospace platforms. Such payments are capitalized when there aredistinct rights obtained and there are sufficient incremental cash flowsto support the recoverability of the assets established. Otherwise, theapplicable portion of the payments are expensed. Capitalized paymentsmade on these contractual commitments are amortized as a reductionof sales. We amortize these intangible assets based on the pattern ofeconomic benefit, which typically results in an amortization methodother than straight-line. In the aerospace industry, amortization basedon the pattern of economic benefit generally results in loweramortization expense during the development period with increasingamortization expense as programs enter full production and aftermarketcycles. If a pattern of economic benefit cannot be reliably determined,a straight-line amortization method is used. The gross value of thesecontractual commitments at December 31, 2017 was approximately$10.6 billion, of which approximately $2.3 billion has been paid to date.We record these payments as intangible assets when such paymentsare no longer conditional. The recoverability of these intangibles isdependent upon the future success and profitability of the underlyingaircraft platforms including the associated aftermarket revenue streams.
Goodwill and intangible assets deemed to have indefinite lives arenot amortized, but are subject to annual, or more frequent if necessary,impairment testing using the guidance and criteria described in theIntangibles—Goodwill and Other Topic of the FASB ASC. On July 1,2017, we early adopted ASU 2017-04, which eliminates Step 2 of thegoodwill impairment test, which required a hypothetical purchase priceallocation to measure goodwill impairment. A goodwill impairment lossis now measured at the amount by which a reporting unit’s carryingvalue exceeds its fair value, without exceeding the recorded amount ofgoodwill. In developing our estimates for the fair value of our reportingunits, significant judgment is required in the determination of theappropriateness of using a qualitative assessment or quantitativeassessment. For these quantitative assessments that are performed,fair value is primarily based on income approaches using discountedcash flow models which have significant assumptions. Suchassumptions are subject to variability from year to year and are directlyimpacted by global market conditions. We completed our annualimpairment testing as of July 1, 2017 and determined that no significantadjustments to the carrying value of goodwill or indefinite lived intangibleassets were necessary. Although these assets are not currentlyimpaired, there can be no assurance that future impairments will notoccur. See Note 2 to the Consolidated Financial Statements for furtherdiscussion.
Contingent Liabilities. Our operating units include businesseswhich sell products and services and conduct operations throughoutthe world. As described in Note 18 to the Consolidated FinancialStatements, contractual, regulatory and other matters, includingasbestos claims, in the normal course of business may arise thatsubject us to claims or litigation. Of note, the design, development,production and support of new aerospace technologies is inherentlycomplex and subject to risk. Since the PurePower PW1000G GearedTurboFan engine entered into service in 2016, technical issues havebeen identified and experienced with the engine, which is usual fornew engines and new aerospace technologies. Pratt & Whitneyhas addressed these issues through various improvements andmodifications. These issues have resulted in financial impacts, includingincreased warranty provisions, customer contract settlements, andreductions in contract performance estimates. Additional technicalissues have been identified, for which a reasonable estimate of theimpact cannot currently be made, and such issues may also arise inthe normal course, which may result in financial impacts that could bematerial to the Company’s financial position, results of operations andcash flows.
Additionally, we have significant contracts with the U.S.Government, subject to government oversight and audit, which mayrequire significant adjustment of contract prices. We accrue for liabilitiesassociated with these matters when it is probable that a liability hasbeen incurred and the amount can be reasonably estimated. The mostlikely cost to be incurred is accrued based on an evaluation of thencurrently available facts with respect to each matter. When no amountwithin a range of estimates is more likely, the minimum is accrued. Theinherent uncertainty related to the outcome of these matters can result
Management’s Discussion and Analysis
United Technologies Corporation 25
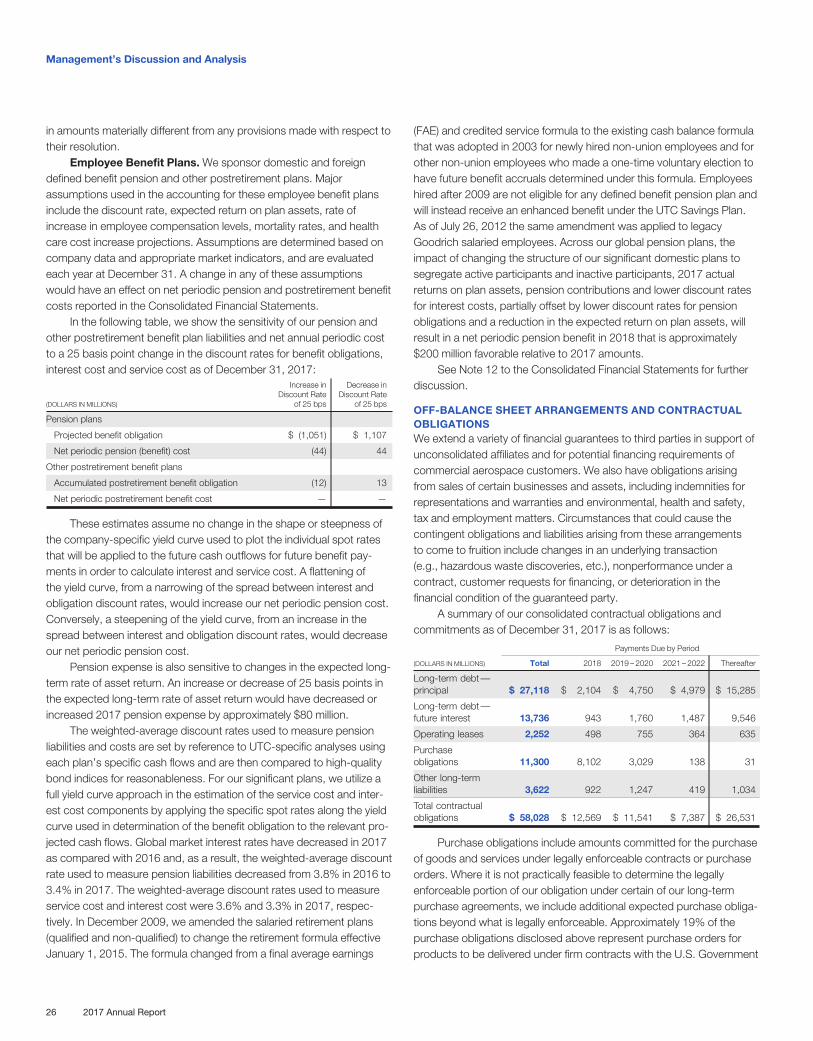
in amounts materially different from any provisions made with respect totheir resolution.
Employee Benefit Plans. We sponsor domestic and foreigndefined benefit pension and other postretirement plans. Majorassumptions used in the accounting for these employee benefit plansinclude the discount rate, expected return on plan assets, rate ofincrease in employee compensation levels, mortality rates, and healthcare cost increase projections. Assumptions are determined based oncompany data and appropriate market indicators, and are evaluatedeach year at December 31. A change in any of these assumptionswould have an effect on net periodic pension and postretirement benefitcosts reported in the Consolidated Financial Statements.
In the following table, we show the sensitivity of our pension andother postretirement benefit plan liabilities and net annual periodic costto a 25 basis point change in the discount rates for benefit obligations,interest cost and service cost as of December 31, 2017:
(DOLLARS IN MILLIONS)
Increase inDiscount Rate
of 25 bps
Decrease inDiscount Rate
of 25 bps
Pension plans
Projected benefit obligation $ (1,051) $ 1,107
Net periodic pension (benefit) cost (44) 44
Other postretirement benefit plans
Accumulated postretirement benefit obligation (12) 13
Net periodic postretirement benefit cost — —
These estimates assume no change in the shape or steepness ofthe company-specific yield curve used to plot the individual spot ratesthat will be applied to the future cash outflows for future benefit pay-ments in order to calculate interest and service cost. A flattening ofthe yield curve, from a narrowing of the spread between interest andobligation discount rates, would increase our net periodic pension cost.Conversely, a steepening of the yield curve, from an increase in thespread between interest and obligation discount rates, would decreaseour net periodic pension cost.
Pension expense is also sensitive to changes in the expected long-term rate of asset return. An increase or decrease of 25 basis points inthe expected long-term rate of asset return would have decreased orincreased 2017 pension expense by approximately $80 million.
The weighted-average discount rates used to measure pensionliabilities and costs are set by reference to UTC-specific analyses usingeach plan’s specific cash flows and are then compared to high-qualitybond indices for reasonableness. For our significant plans, we utilize afull yield curve approach in the estimation of the service cost and inter-est cost components by applying the specific spot rates along the yieldcurve used in determination of the benefit obligation to the relevant pro-jected cash flows. Global market interest rates have decreased in 2017as compared with 2016 and, as a result, the weighted-average discountrate used to measure pension liabilities decreased from 3.8% in 2016 to3.4% in 2017. The weighted-average discount rates used to measureservice cost and interest cost were 3.6% and 3.3% in 2017, respec-tively. In December 2009, we amended the salaried retirement plans(qualified and non-qualified) to change the retirement formula effectiveJanuary 1, 2015. The formula changed from a final average earnings
(FAE) and credited service formula to the existing cash balance formulathat was adopted in 2003 for newly hired non-union employees and forother non-union employees who made a one-time voluntary election tohave future benefit accruals determined under this formula. Employeeshired after 2009 are not eligible for any defined benefit pension plan andwill instead receive an enhanced benefit under the UTC Savings Plan.As of July 26, 2012 the same amendment was applied to legacyGoodrich salaried employees. Across our global pension plans, theimpact of changing the structure of our significant domestic plans tosegregate active participants and inactive participants, 2017 actualreturns on plan assets, pension contributions and lower discount ratesfor interest costs, partially offset by lower discount rates for pensionobligations and a reduction in the expected return on plan assets, willresult in a net periodic pension benefit in 2018 that is approximately$200 million favorable relative to 2017 amounts.
See Note 12 to the Consolidated Financial Statements for furtherdiscussion.
OFF-BALANCE SHEET ARRANGEMENTS AND CONTRACTUALOBLIGATIONSWe extend a variety of financial guarantees to third parties in support ofunconsolidated affiliates and for potential financing requirements ofcommercial aerospace customers. We also have obligations arisingfrom sales of certain businesses and assets, including indemnities forrepresentations and warranties and environmental, health and safety,tax and employment matters. Circumstances that could cause thecontingent obligations and liabilities arising from these arrangementsto come to fruition include changes in an underlying transaction(e.g., hazardous waste discoveries, etc.), nonperformance under acontract, customer requests for financing, or deterioration in thefinancial condition of the guaranteed party.
A summary of our consolidated contractual obligations andcommitments as of December 31, 2017 is as follows:
Payments Due by Period
(DOLLARS IN MILLIONS) Total 2018 2019 – 2020 2021 – 2022 Thereafter
Long-term debt—principal $ 27,118 $ 2,104 $ 4,750 $ 4,979 $ 15,285
Long-term debt—future interest 13,736 943 1,760 1,487 9,546
Operating leases 2,252 498 755 364 635
Purchaseobligations 11,300 8,102 3,029 138 31
Other long-termliabilities 3,622 922 1,247 419 1,034
Total contractualobligations $ 58,028 $ 12,569 $ 11,541 $ 7,387 $ 26,531
Purchase obligations include amounts committed for the purchaseof goods and services under legally enforceable contracts or purchaseorders. Where it is not practically feasible to determine the legallyenforceable portion of our obligation under certain of our long-termpurchase agreements, we include additional expected purchase obliga-tions beyond what is legally enforceable. Approximately 19% of thepurchase obligations disclosed above represent purchase orders forproducts to be delivered under firm contracts with the U.S. Government
Management’s Discussion and Analysis
26 2017 Annual Report
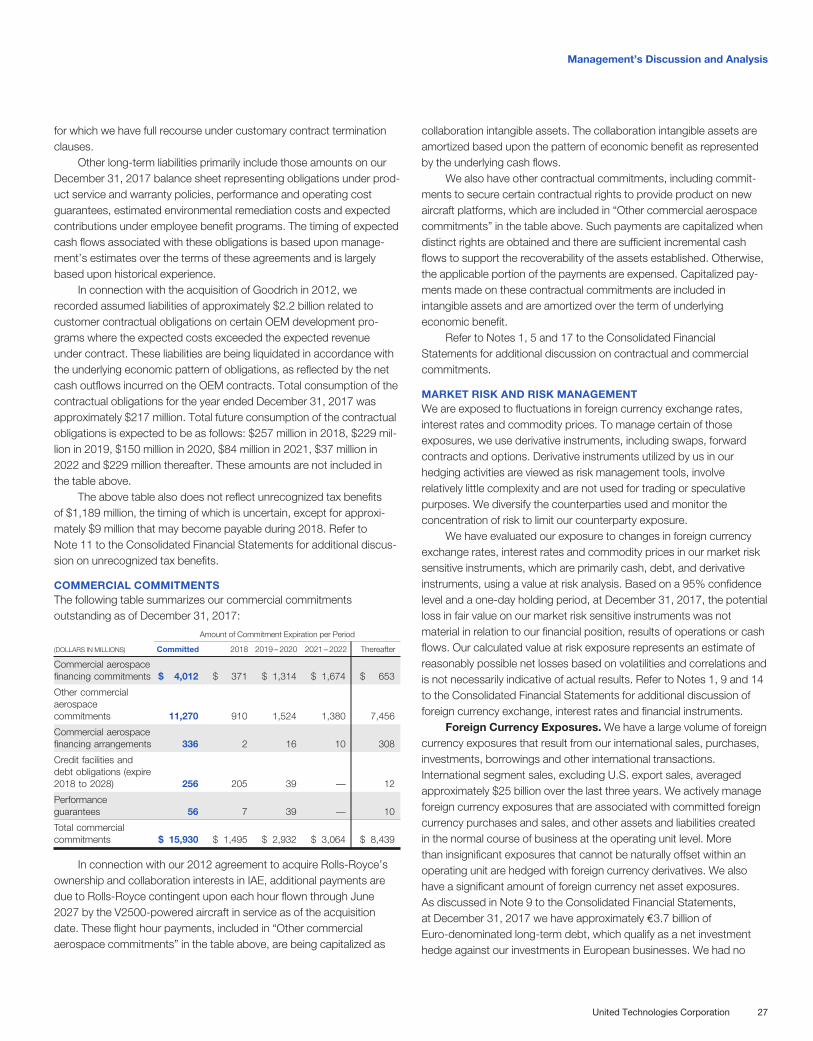
for which we have full recourse under customary contract terminationclauses.
Other long-term liabilities primarily include those amounts on ourDecember 31, 2017 balance sheet representing obligations under prod-uct service and warranty policies, performance and operating costguarantees, estimated environmental remediation costs and expectedcontributions under employee benefit programs. The timing of expectedcash flows associated with these obligations is based upon manage-ment’s estimates over the terms of these agreements and is largelybased upon historical experience.
In connection with the acquisition of Goodrich in 2012, werecorded assumed liabilities of approximately $2.2 billion related tocustomer contractual obligations on certain OEM development pro-grams where the expected costs exceeded the expected revenueunder contract. These liabilities are being liquidated in accordance withthe underlying economic pattern of obligations, as reflected by the netcash outflows incurred on the OEM contracts. Total consumption of thecontractual obligations for the year ended December 31, 2017 wasapproximately $217 million. Total future consumption of the contractualobligations is expected to be as follows: $257 million in 2018, $229 mil-lion in 2019, $150 million in 2020, $84 million in 2021, $37 million in2022 and $229 million thereafter. These amounts are not included inthe table above.
The above table also does not reflect unrecognized tax benefitsof $1,189 million, the timing of which is uncertain, except for approxi-mately $9 million that may become payable during 2018. Refer toNote 11 to the Consolidated Financial Statements for additional discus-sion on unrecognized tax benefits.
COMMERCIAL COMMITMENTSThe following table summarizes our commercial commitmentsoutstanding as of December 31, 2017:
Amount of Commitment Expiration per Period
(DOLLARS IN MILLIONS) Committed 2018 2019 – 2020 2021 – 2022 Thereafter
Commercial aerospacefinancing commitments $ 4,012 $ 371 $ 1,314 $ 1,674 $ 653
Other commercialaerospacecommitments 11,270 910 1,524 1,380 7,456
Commercial aerospacefinancing arrangements 336 2 16 10 308
Credit facilities anddebt obligations (expire2018 to 2028) 256 205 39 — 12
Performanceguarantees 56 7 39 — 10
Total commercialcommitments $ 15,930 $ 1,495 $ 2,932 $ 3,064 $ 8,439
In connection with our 2012 agreement to acquire Rolls-Royce’sownership and collaboration interests in IAE, additional payments aredue to Rolls-Royce contingent upon each hour flown through June2027 by the V2500-powered aircraft in service as of the acquisitiondate. These flight hour payments, included in “Other commercialaerospace commitments” in the table above, are being capitalized as
collaboration intangible assets. The collaboration intangible assets areamortized based upon the pattern of economic benefit as representedby the underlying cash flows.
We also have other contractual commitments, including commit-ments to secure certain contractual rights to provide product on newaircraft platforms, which are included in “Other commercial aerospacecommitments” in the table above. Such payments are capitalized whendistinct rights are obtained and there are sufficient incremental cashflows to support the recoverability of the assets established. Otherwise,the applicable portion of the payments are expensed. Capitalized pay-ments made on these contractual commitments are included inintangible assets and are amortized over the term of underlyingeconomic benefit.
Refer to Notes 1, 5 and 17 to the Consolidated FinancialStatements for additional discussion on contractual and commercialcommitments.
MARKET RISK AND RISK MANAGEMENTWe are exposed to fluctuations in foreign currency exchange rates,interest rates and commodity prices. To manage certain of thoseexposures, we use derivative instruments, including swaps, forwardcontracts and options. Derivative instruments utilized by us in ourhedging activities are viewed as risk management tools, involverelatively little complexity and are not used for trading or speculativepurposes. We diversify the counterparties used and monitor theconcentration of risk to limit our counterparty exposure.
We have evaluated our exposure to changes in foreign currencyexchange rates, interest rates and commodity prices in our market risksensitive instruments, which are primarily cash, debt, and derivativeinstruments, using a value at risk analysis. Based on a 95% confidencelevel and a one-day holding period, at December 31, 2017, the potentialloss in fair value on our market risk sensitive instruments was notmaterial in relation to our financial position, results of operations or cashflows. Our calculated value at risk exposure represents an estimate ofreasonably possible net losses based on volatilities and correlations andis not necessarily indicative of actual results. Refer to Notes 1, 9 and 14to the Consolidated Financial Statements for additional discussion offoreign currency exchange, interest rates and financial instruments.
Foreign Currency Exposures. We have a large volume of foreigncurrency exposures that result from our international sales, purchases,investments, borrowings and other international transactions.International segment sales, excluding U.S. export sales, averagedapproximately $25 billion over the last three years. We actively manageforeign currency exposures that are associated with committed foreigncurrency purchases and sales, and other assets and liabilities createdin the normal course of business at the operating unit level. Morethan insignificant exposures that cannot be naturally offset within anoperating unit are hedged with foreign currency derivatives. We alsohave a significant amount of foreign currency net asset exposures.As discussed in Note 9 to the Consolidated Financial Statements,at December 31, 2017 we have approximately e3.7 billion ofEuro-denominated long-term debt, which qualify as a net investmenthedge against our investments in European businesses. We had no
Management’s Discussion and Analysis
United Technologies Corporation 27
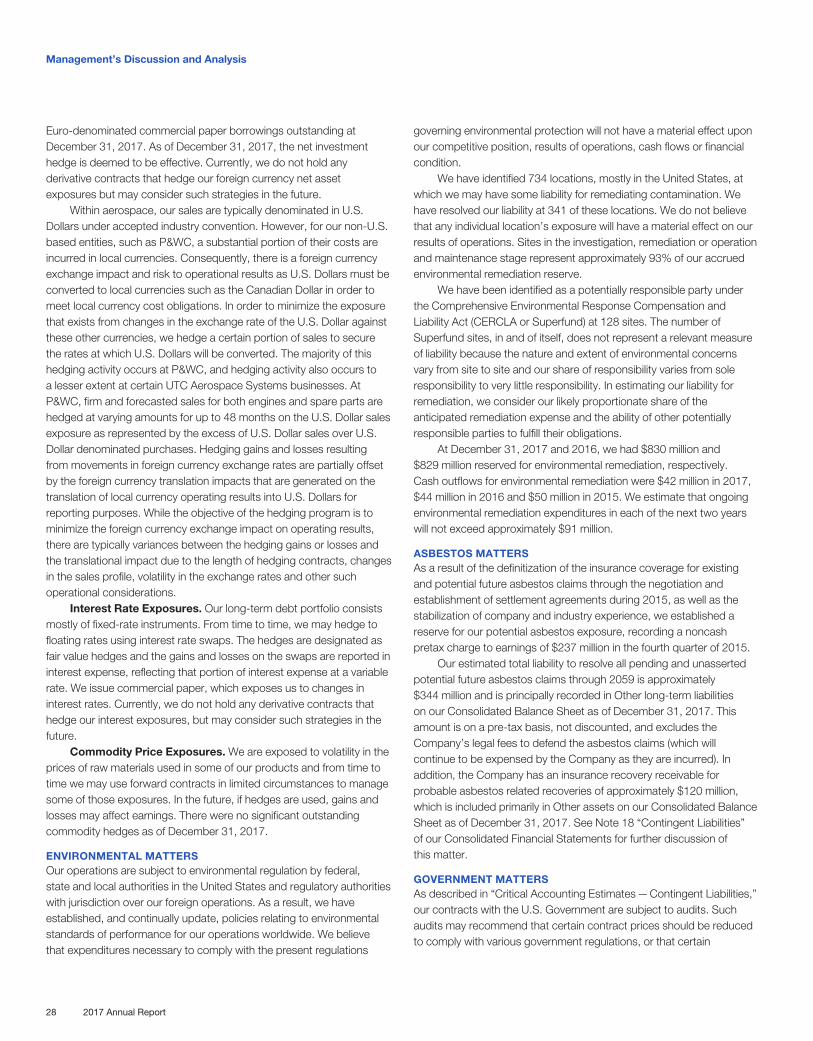
Euro-denominated commercial paper borrowings outstanding atDecember 31, 2017. As of December 31, 2017, the net investmenthedge is deemed to be effective. Currently, we do not hold anyderivative contracts that hedge our foreign currency net assetexposures but may consider such strategies in the future.
Within aerospace, our sales are typically denominated in U.S.Dollars under accepted industry convention. However, for our non-U.S.based entities, such as P&WC, a substantial portion of their costs areincurred in local currencies. Consequently, there is a foreign currencyexchange impact and risk to operational results as U.S. Dollars must beconverted to local currencies such as the Canadian Dollar in order tomeet local currency cost obligations. In order to minimize the exposurethat exists from changes in the exchange rate of the U.S. Dollar againstthese other currencies, we hedge a certain portion of sales to securethe rates at which U.S. Dollars will be converted. The majority of thishedging activity occurs at P&WC, and hedging activity also occurs toa lesser extent at certain UTC Aerospace Systems businesses. AtP&WC, firm and forecasted sales for both engines and spare parts arehedged at varying amounts for up to 48 months on the U.S. Dollar salesexposure as represented by the excess of U.S. Dollar sales over U.S.Dollar denominated purchases. Hedging gains and losses resultingfrom movements in foreign currency exchange rates are partially offsetby the foreign currency translation impacts that are generated on thetranslation of local currency operating results into U.S. Dollars forreporting purposes. While the objective of the hedging program is tominimize the foreign currency exchange impact on operating results,there are typically variances between the hedging gains or losses andthe translational impact due to the length of hedging contracts, changesin the sales profile, volatility in the exchange rates and other suchoperational considerations.
Interest Rate Exposures. Our long-term debt portfolio consistsmostly of fixed-rate instruments. From time to time, we may hedge tofloating rates using interest rate swaps. The hedges are designated asfair value hedges and the gains and losses on the swaps are reported ininterest expense, reflecting that portion of interest expense at a variablerate. We issue commercial paper, which exposes us to changes ininterest rates. Currently, we do not hold any derivative contracts thathedge our interest exposures, but may consider such strategies in thefuture.
Commodity Price Exposures. We are exposed to volatility in theprices of raw materials used in some of our products and from time totime we may use forward contracts in limited circumstances to managesome of those exposures. In the future, if hedges are used, gains andlosses may affect earnings. There were no significant outstandingcommodity hedges as of December 31, 2017.
ENVIRONMENTAL MATTERSOur operations are subject to environmental regulation by federal,state and local authorities in the United States and regulatory authoritieswith jurisdiction over our foreign operations. As a result, we haveestablished, and continually update, policies relating to environmentalstandards of performance for our operations worldwide. We believethat expenditures necessary to comply with the present regulations
governing environmental protection will not have a material effect uponour competitive position, results of operations, cash flows or financialcondition.
We have identified 734 locations, mostly in the United States, atwhich we may have some liability for remediating contamination. Wehave resolved our liability at 341 of these locations. We do not believethat any individual location’s exposure will have a material effect on ourresults of operations. Sites in the investigation, remediation or operationand maintenance stage represent approximately 93% of our accruedenvironmental remediation reserve.
We have been identified as a potentially responsible party underthe Comprehensive Environmental Response Compensation andLiability Act (CERCLA or Superfund) at 128 sites. The number ofSuperfund sites, in and of itself, does not represent a relevant measureof liability because the nature and extent of environmental concernsvary from site to site and our share of responsibility varies from soleresponsibility to very little responsibility. In estimating our liability forremediation, we consider our likely proportionate share of theanticipated remediation expense and the ability of other potentiallyresponsible parties to fulfill their obligations.
At December 31, 2017 and 2016, we had $830 million and$829 million reserved for environmental remediation, respectively.Cash outflows for environmental remediation were $42 million in 2017,$44 million in 2016 and $50 million in 2015. We estimate that ongoingenvironmental remediation expenditures in each of the next two yearswill not exceed approximately $91 million.
ASBESTOS MATTERSAs a result of the definitization of the insurance coverage for existingand potential future asbestos claims through the negotiation andestablishment of settlement agreements during 2015, as well as thestabilization of company and industry experience, we established areserve for our potential asbestos exposure, recording a noncashpretax charge to earnings of $237 million in the fourth quarter of 2015.
Our estimated total liability to resolve all pending and unassertedpotential future asbestos claims through 2059 is approximately$344 million and is principally recorded in Other long-term liabilitieson our Consolidated Balance Sheet as of December 31, 2017. Thisamount is on a pre-tax basis, not discounted, and excludes theCompany’s legal fees to defend the asbestos claims (which willcontinue to be expensed by the Company as they are incurred). Inaddition, the Company has an insurance recovery receivable forprobable asbestos related recoveries of approximately $120 million,which is included primarily in Other assets on our Consolidated BalanceSheet as of December 31, 2017. See Note 18 “Contingent Liabilities”of our Consolidated Financial Statements for further discussion ofthis matter.
GOVERNMENT MATTERSAs described in “Critical Accounting Estimates—Contingent Liabilities,”our contracts with the U.S. Government are subject to audits. Suchaudits may recommend that certain contract prices should be reducedto comply with various government regulations, or that certain
Management’s Discussion and Analysis
28 2017 Annual Report

payments be delayed or withheld. We are also the subject of one ormore investigations and legal proceedings initiated by the U.S.Government with respect to government contract matters. See “LegalProceedings” in Item 1 to this Form 10-K, and Note 11 “Income Taxes”and Note 18 “Contingent Liabilities” of our Consolidated FinancialStatements for further discussion of these and other governmentmatters.
Management’s Discussion and Analysis
United Technologies Corporation 29
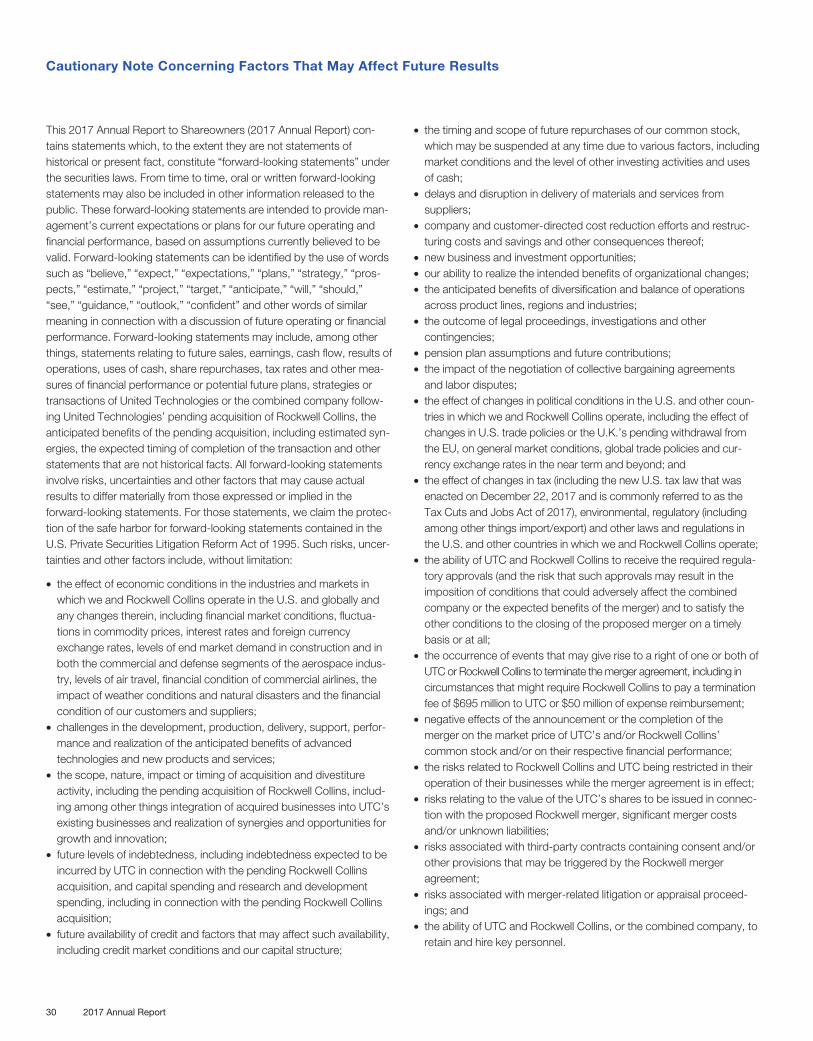
This 2017 Annual Report to Shareowners (2017 Annual Report) con-tains statements which, to the extent they are not statements ofhistorical or present fact, constitute “forward-looking statements” underthe securities laws. From time to time, oral or written forward-lookingstatements may also be included in other information released to thepublic. These forward-looking statements are intended to provide man-agement’s current expectations or plans for our future operating andfinancial performance, based on assumptions currently believed to bevalid. Forward-looking statements can be identified by the use of wordssuch as “believe,” “expect,” “expectations,” “plans,” “strategy,” “pros-pects,” “estimate,” “project,” “target,” “anticipate,” “will,” “should,”“see,” “guidance,” “outlook,” “confident” and other words of similarmeaning in connection with a discussion of future operating or financialperformance. Forward-looking statements may include, among otherthings, statements relating to future sales, earnings, cash flow, results ofoperations, uses of cash, share repurchases, tax rates and other mea-sures of financial performance or potential future plans, strategies ortransactions of United Technologies or the combined company follow-ing United Technologies’ pending acquisition of Rockwell Collins, theanticipated benefits of the pending acquisition, including estimated syn-ergies, the expected timing of completion of the transaction and otherstatements that are not historical facts. All forward-looking statementsinvolve risks, uncertainties and other factors that may cause actualresults to differ materially from those expressed or implied in theforward-looking statements. For those statements, we claim the protec-tion of the safe harbor for forward-looking statements contained in theU.S. Private Securities Litigation Reform Act of 1995. Such risks, uncer-tainties and other factors include, without limitation:
• the effect of economic conditions in the industries and markets inwhich we and Rockwell Collins operate in the U.S. and globally andany changes therein, including financial market conditions, fluctua-tions in commodity prices, interest rates and foreign currencyexchange rates, levels of end market demand in construction and inboth the commercial and defense segments of the aerospace indus-try, levels of air travel, financial condition of commercial airlines, theimpact of weather conditions and natural disasters and the financialcondition of our customers and suppliers;
• challenges in the development, production, delivery, support, perfor-mance and realization of the anticipated benefits of advancedtechnologies and new products and services;
• the scope, nature, impact or timing of acquisition and divestitureactivity, including the pending acquisition of Rockwell Collins, includ-ing among other things integration of acquired businesses into UTC’sexisting businesses and realization of synergies and opportunities forgrowth and innovation;
• future levels of indebtedness, including indebtedness expected to beincurred by UTC in connection with the pending Rockwell Collinsacquisition, and capital spending and research and developmentspending, including in connection with the pending Rockwell Collinsacquisition;
• future availability of credit and factors that may affect such availability,including credit market conditions and our capital structure;
• the timing and scope of future repurchases of our common stock,which may be suspended at any time due to various factors, includingmarket conditions and the level of other investing activities and usesof cash;
• delays and disruption in delivery of materials and services fromsuppliers;
• company and customer-directed cost reduction efforts and restruc-turing costs and savings and other consequences thereof;
• new business and investment opportunities;• our ability to realize the intended benefits of organizational changes;• the anticipated benefits of diversification and balance of operations
across product lines, regions and industries;• the outcome of legal proceedings, investigations and other
contingencies;• pension plan assumptions and future contributions;• the impact of the negotiation of collective bargaining agreements
and labor disputes;• the effect of changes in political conditions in the U.S. and other coun-
tries in which we and Rockwell Collins operate, including the effect ofchanges in U.S. trade policies or the U.K.’s pending withdrawal fromthe EU, on general market conditions, global trade policies and cur-rency exchange rates in the near term and beyond; and
• the effect of changes in tax (including the new U.S. tax law that wasenacted on December 22, 2017 and is commonly referred to as theTax Cuts and Jobs Act of 2017), environmental, regulatory (includingamong other things import/export) and other laws and regulations inthe U.S. and other countries in which we and Rockwell Collins operate;
• the ability of UTC and Rockwell Collins to receive the required regula-tory approvals (and the risk that such approvals may result in theimposition of conditions that could adversely affect the combinedcompany or the expected benefits of the merger) and to satisfy theother conditions to the closing of the proposed merger on a timelybasis or at all;
• the occurrence of events that may give rise to a right of one or both ofUTC or Rockwell Collins to terminate the merger agreement, including incircumstances that might require Rockwell Collins to pay a terminationfee of $695 million to UTC or $50 million of expense reimbursement;
• negative effects of the announcement or the completion of themerger on the market price of UTC’s and/or Rockwell Collins’common stock and/or on their respective financial performance;
• the risks related to Rockwell Collins and UTC being restricted in theiroperation of their businesses while the merger agreement is in effect;
• risks relating to the value of the UTC’s shares to be issued in connec-tion with the proposed Rockwell merger, significant merger costsand/or unknown liabilities;
• risks associated with third-party contracts containing consent and/orother provisions that may be triggered by the Rockwell mergeragreement;
• risks associated with merger-related litigation or appraisal proceed-ings; and
• the ability of UTC and Rockwell Collins, or the combined company, toretain and hire key personnel.
Cautionary Note Concerning Factors That May Affect Future Results
30 2017 Annual Report
In addition, our Annual Report on Form 10-K for 2017 includesimportant information as to risks, uncertainties and other factors thatmay cause actual results to differ materially from those expressed orimplied in the forward-looking statements. See the “Notes to Consoli-dated Financial Statements” under the heading “Note 18: ContingentLiabilities,” the section titled “Management’s Discussion and Analysisof Financial Condition and Results of Operations” under the headings“Business Overview,” “Results of Operations,” “Liquidity and FinancialCondition,” and “Critical Accounting Estimates,” and the section titled“Risk Factors.” Our Annual Report on Form 10-K for 2017 also includesimportant information as to these factors in the “Business” sectionunder the headings “General,” “Description of Business by Segment”and “Other Matters Relating to Our Business as a Whole,” and in the
“Legal Proceedings” section. Additional important information as tothese factors is included in this 2017 Annual Report in the section titled“Management’s Discussion and Analysis of Financial Condition andResults of Operations” under the headings “Restructuring Costs,”“Environmental Matters” and “Governmental Matters.” The forward-looking statements speak only as of the date of this report or, in the caseof any document incorporated by reference, the date of that document.We undertake no obligation to publicly update or revise any forward-looking statements, whether as a result of new information, future eventsor otherwise, except as required by applicable law. Additional informationas to factors that may cause actual results to differ materially from thoseexpressed or implied in the forward-looking statements is disclosed fromtime to time in our other filings with the SEC.
Cautionary Note Concerning Factors That May Affect Future Results
United Technologies Corporation 31
The management of UTC is responsible for establishing and maintainingadequate internal control over financial reporting. Internal control overfinancial reporting is a process designed to provide reasonable assur-ance regarding the reliability of financial reporting and the preparation offinancial statements for external reporting purposes in accordance withaccounting principles generally accepted in the United States ofAmerica. Because of its inherent limitations, internal control over finan-cial reporting may not prevent or detect misstatements. Managementhas assessed the effectiveness of UTC’s internal control over financialreporting as of December 31, 2017. In making its assessment, manage-ment has utilized the criteria set forth by the Committee of SponsoringOrganizations of the Treadway Commission in its Internal Control—Integrated Framework, released in 2013. Management concluded thatbased on its assessment, UTC’s internal control over financial reportingwas effective as of December 31, 2017. The effectiveness of UTC’sinternal control over financial reporting, as of December 31, 2017, hasbeen audited by PricewaterhouseCoopers LLP, an independent regis-tered public accounting firm, as stated in their report which is includedherein.
Gregory J. HayesChairman, President and Chief Executive Officer
Akhil JohriExecutive Vice President & Chief Financial Officer
Robert J. BaileyCorporate Vice President, Controller
Management’s Report on Internal Control over Financial Reporting
32 2017 Annual Report
TO THE SHAREOWNERS AND BOARD OF DIRECTORS OFUNITED TECHNOLOGIES CORPORATION
Opinions on the Financial Statements and Internal Control overFinancial ReportingWe have audited the accompanying consolidated balance sheets ofUnited Technologies Corporation and its subsidiaries as of December 31,2017 and 2016, and the related consolidated statements of operations,of comprehensive income, of changes in equity and of cash flows foreach of the three years in the period ended December 31, 2017, includ-ing the related notes (collectively referred to as the “consolidated financialstatements”). We also have audited the Corporation’s internal controlover financial reporting as of December 31, 2017, based on criteriaestablished in Internal Control—Integrated Framework (2013) issuedby the Committee of Sponsoring Organizations of the TreadwayCommission (COSO).
In our opinion, the consolidated financial statements referred toabove present fairly, in all material respects, the financial position of theCorporation as of December 31, 2017 and 2016, and the results of theiroperations and their cash flows for each of the three years in the periodended December 31, 2017 in conformity with accounting principlesgenerally accepted in the United States of America. Also in our opinion,the Corporation maintained, in all material respects, effective internalcontrol over financial reporting as of December 31, 2017, based oncriteria established in Internal Control—Integrated Framework (2013)issued by the COSO.
Basis for OpinionsThe Corporation’s management is responsible for these consoli-dated financial statements, for maintaining effective internal controlover financial reporting, and for its assessment of the effectiveness ofinternal control over financial reporting, included in the accompanyingManagement’s Report on Internal Control over Financial Reporting. Ourresponsibility is to express opinions on the Corporation’s consolidatedfinancial statements and on the Corporation’s internal control overfinancial reporting based on our audits. We are a public accountingfirm registered with the Public Company Accounting Oversight Board(United States) (“PCAOB”) and are required to be independent withrespect to the Corporation in accordance with the U.S. federal securi-ties laws and the applicable rules and regulations of the Securities andExchange Commission and the PCAOB.
We conducted our audits in accordance with the standards of thePCAOB. Those standards require that we plan and perform the auditsto obtain reasonable assurance about whether the consolidated finan-cial statements are free of material misstatement, whether due to erroror fraud, and whether effective internal control over financial reportingwas maintained in all material respects.
Our audits of the consolidated financial statements included per-forming procedures to assess the risks of material misstatement of the
consolidated financial statements, whether due to error or fraud, andperforming procedures that respond to those risks. Such proceduresincluded examining, on a test basis, evidence regarding the amountsand disclosures in the consolidated financial statements. Our auditsalso included evaluating the accounting principles used and significantestimates made by management, as well as evaluating the overall pre-sentation of the consolidated financial statements. Our audit of internalcontrol over financial reporting included obtaining an understanding ofinternal control over financial reporting, assessing the risk that a materialweakness exists, and testing and evaluating the design and operatingeffectiveness of internal control based on the assessed risk. Our auditsalso included performing such other procedures as we considerednecessary in the circumstances. We believe that our audits provide areasonable basis for our opinions.
Definition and Limitations of Internal Control overFinancial ReportingA corporation’s internal control over financial reporting is a processdesigned to provide reasonable assurance regarding the reliabilityof financial reporting and the preparation of financial statements forexternal purposes in accordance with generally accepted accountingprinciples. A corporation’s internal control over financial reportingincludes those policies and procedures that (i) pertain to the mainte-nance of records that, in reasonable detail, accurately and fairly reflectthe transactions and dispositions of the assets of the corporation;(ii) provide reasonable assurance that transactions are recorded asnecessary to permit preparation of financial statements in accordancewith generally accepted accounting principles, and that receipts andexpenditures of the corporation are being made only in accordancewith authorizations of management and directors of the corporation;and (iii) provide reasonable assurance regarding prevention or timelydetection of unauthorized acquisition, use, or disposition of thecorporation’s assets that could have a material effect on the financialstatements.
Because of its inherent limitations, internal control over financialreporting may not prevent or detect misstatements. Also, projectionsof any evaluation of effectiveness to future periods are subject to therisk that controls may become inadequate because of changes in con-ditions, or that the degree of compliance with the policies or proceduresmay deteriorate.
PricewaterhouseCoopers LLPHartford, ConnecticutFebruary 8, 2018
We have served as the Corporation’s auditor since 1947.
Report of Independent Registered Public Accounting Firm
United Technologies Corporation 33
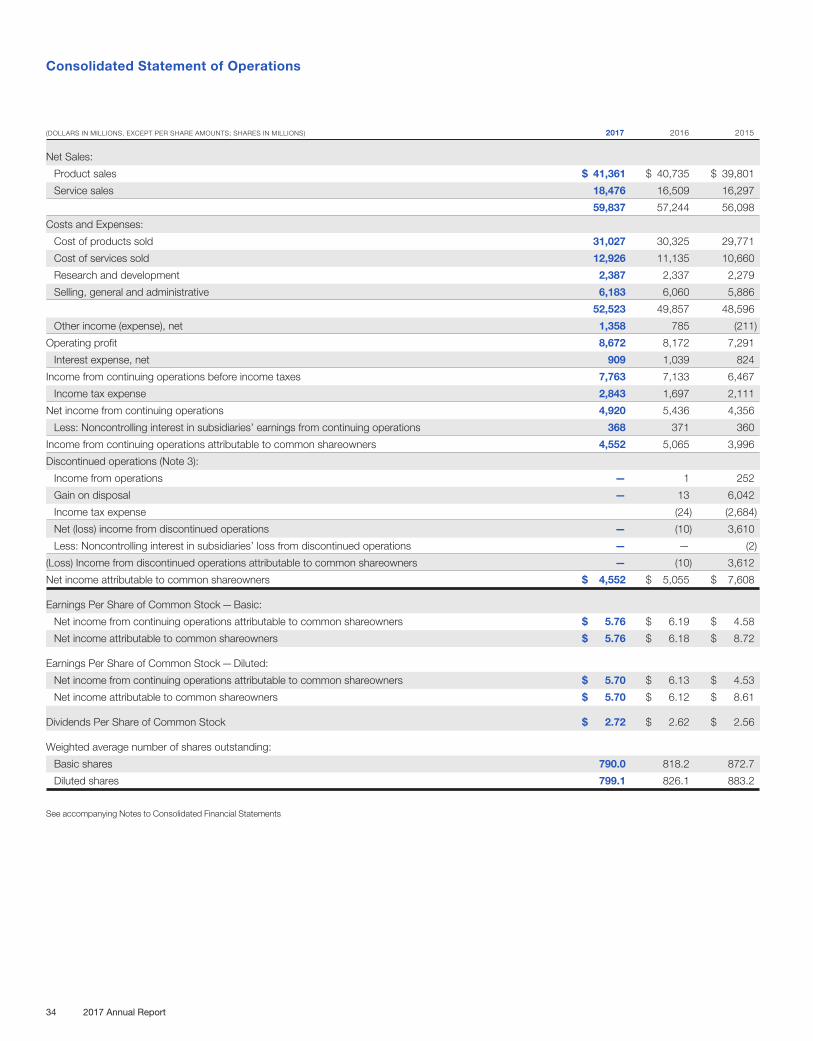
(DOLLARS IN MILLIONS, EXCEPT PER SHARE AMOUNTS; SHARES IN MILLIONS) 2017 2016 2015
Net Sales:
Product sales $ 41,361 $ 40,735 $ 39,801
Service sales 18,476 16,509 16,297
59,837 57,244 56,098
Costs and Expenses:
Cost of products sold 31,027 30,325 29,771
Cost of services sold 12,926 11,135 10,660
Research and development 2,387 2,337 2,279
Selling, general and administrative 6,183 6,060 5,886
52,523 49,857 48,596
Other income (expense), net 1,358 785 (211)
Operating profit 8,672 8,172 7,291
Interest expense, net 909 1,039 824
Income from continuing operations before income taxes 7,763 7,133 6,467
Income tax expense 2,843 1,697 2,111
Net income from continuing operations 4,920 5,436 4,356
Less: Noncontrolling interest in subsidiaries’ earnings from continuing operations 368 371 360
Income from continuing operations attributable to common shareowners 4,552 5,065 3,996
Discontinued operations (Note 3):
Income from operations — 1 252
Gain on disposal — 13 6,042
Income tax expense (24) (2,684)
Net (loss) income from discontinued operations — (10) 3,610
Less: Noncontrolling interest in subsidiaries’ loss from discontinued operations — — (2)
(Loss) Income from discontinued operations attributable to common shareowners — (10) 3,612
Net income attributable to common shareowners $ 4,552 $ 5,055 $ 7,608
Earnings Per Share of Common Stock—Basic:
Net income from continuing operations attributable to common shareowners $ 5.76 $ 6.19 $ 4.58
Net income attributable to common shareowners $ 5.76 $ 6.18 $ 8.72
Earnings Per Share of Common Stock—Diluted:
Net income from continuing operations attributable to common shareowners $ 5.70 $ 6.13 $ 4.53
Net income attributable to common shareowners $ 5.70 $ 6.12 $ 8.61
Dividends Per Share of Common Stock $ 2.72 $ 2.62 $ 2.56
Weighted average number of shares outstanding:
Basic shares 790.0 818.2 872.7
Diluted shares 799.1 826.1 883.2
See accompanying Notes to Consolidated Financial Statements
Consolidated Statement of Operations
34 2017 Annual Report
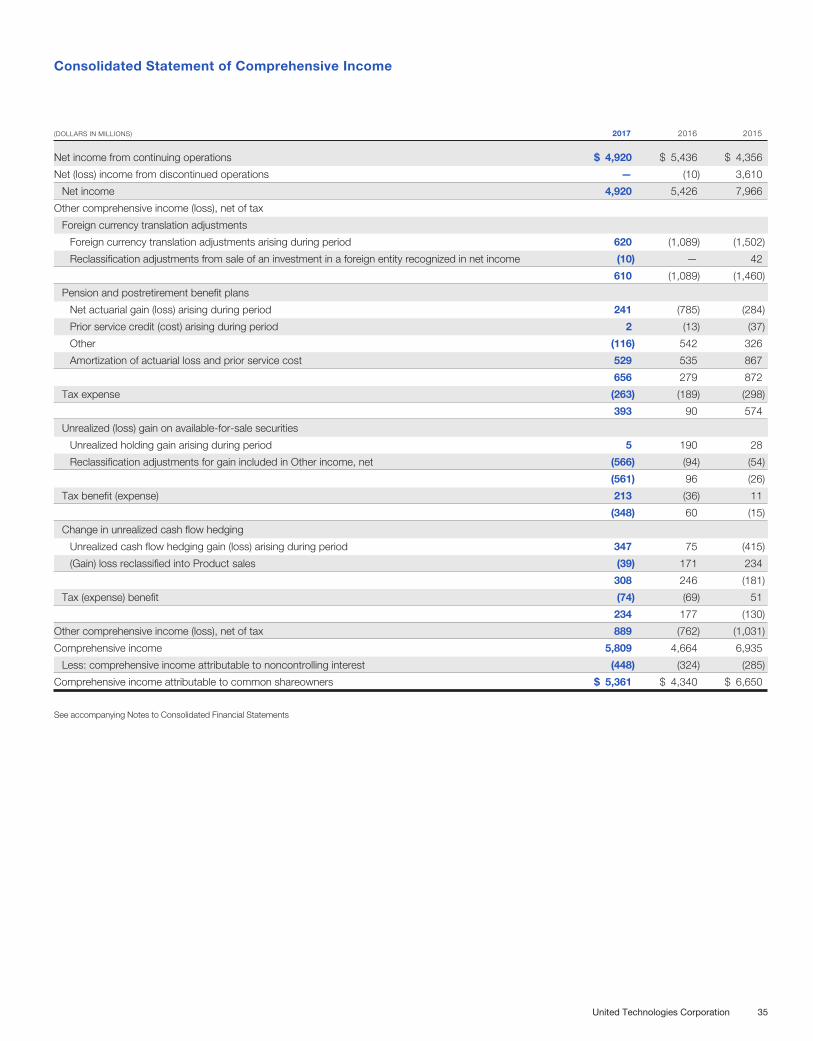
(DOLLARS IN MILLIONS) 2017 2016 2015
Net income from continuing operations $ 4,920 $ 5,436 $ 4,356
Net (loss) income from discontinued operations — (10) 3,610
Net income 4,920 5,426 7,966
Other comprehensive income (loss), net of tax
Foreign currency translation adjustments
Foreign currency translation adjustments arising during period 620 (1,089) (1,502)
Reclassification adjustments from sale of an investment in a foreign entity recognized in net income (10) — 42
610 (1,089) (1,460)
Pension and postretirement benefit plans
Net actuarial gain (loss) arising during period 241 (785) (284)
Prior service credit (cost) arising during period 2 (13) (37)
Other (116) 542 326
Amortization of actuarial loss and prior service cost 529 535 867
656 279 872
Tax expense (263) (189) (298)
393 90 574
Unrealized (loss) gain on available-for-sale securities
Unrealized holding gain arising during period 5 190 28
Reclassification adjustments for gain included in Other income, net (566) (94) (54)
(561) 96 (26)
Tax benefit (expense) 213 (36) 11
(348) 60 (15)
Change in unrealized cash flow hedging
Unrealized cash flow hedging gain (loss) arising during period 347 75 (415)
(Gain) loss reclassified into Product sales (39) 171 234
308 246 (181)
Tax (expense) benefit (74) (69) 51
234 177 (130)
Other comprehensive income (loss), net of tax 889 (762) (1,031)
Comprehensive income 5,809 4,664 6,935
Less: comprehensive income attributable to noncontrolling interest (448) (324) (285)
Comprehensive income attributable to common shareowners $ 5,361 $ 4,340 $ 6,650
See accompanying Notes to Consolidated Financial Statements
Consolidated Statement of Comprehensive Income
United Technologies Corporation 35
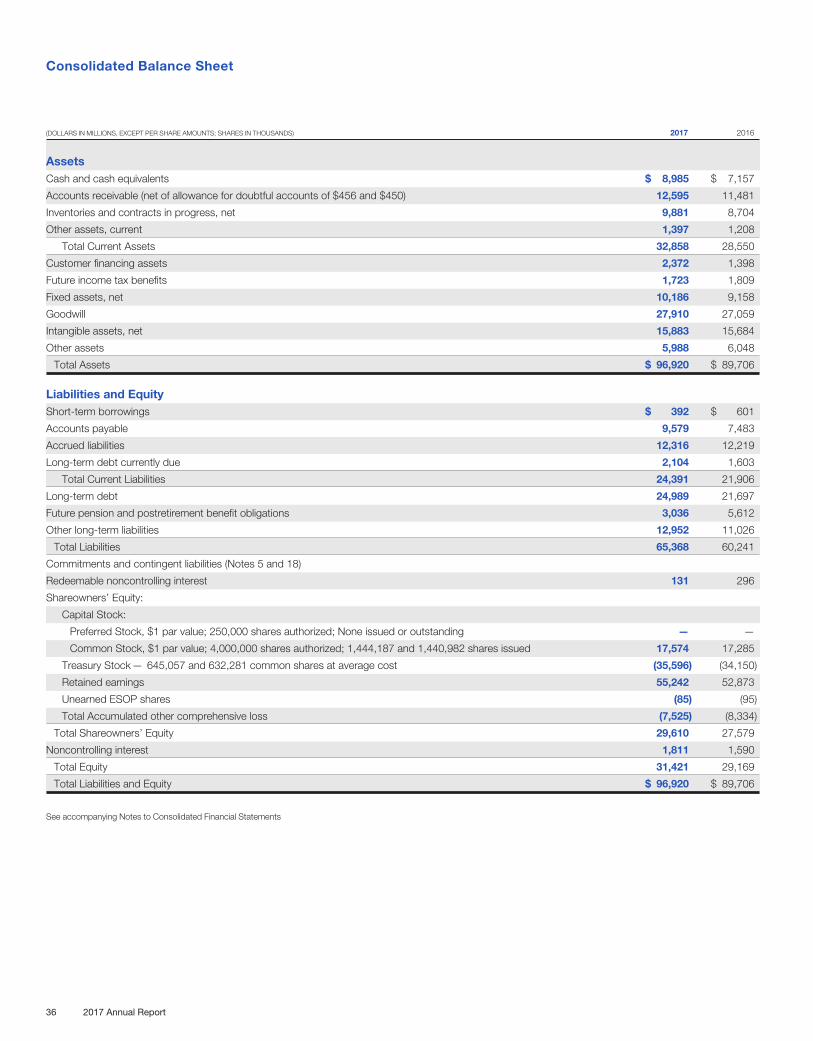
(DOLLARS IN MILLIONS, EXCEPT PER SHARE AMOUNTS; SHARES IN THOUSANDS) 2017 2016
AssetsCash and cash equivalents $ 8,985 $ 7,157
Accounts receivable (net of allowance for doubtful accounts of $456 and $450) 12,595 11,481
Inventories and contracts in progress, net 9,881 8,704
Other assets, current 1,397 1,208
Total Current Assets 32,858 28,550
Customer financing assets 2,372 1,398
Future income tax benefits 1,723 1,809
Fixed assets, net 10,186 9,158
Goodwill 27,910 27,059
Intangible assets, net 15,883 15,684
Other assets 5,988 6,048
Total Assets $ 96,920 $ 89,706
Liabilities and EquityShort-term borrowings $ 392 $ 601
Accounts payable 9,579 7,483
Accrued liabilities 12,316 12,219
Long-term debt currently due 2,104 1,603
Total Current Liabilities 24,391 21,906
Long-term debt 24,989 21,697
Future pension and postretirement benefit obligations 3,036 5,612
Other long-term liabilities 12,952 11,026
Total Liabilities 65,368 60,241
Commitments and contingent liabilities (Notes 5 and 18)
Redeemable noncontrolling interest 131 296
Shareowners’ Equity:
Capital Stock:
Preferred Stock, $1 par value; 250,000 shares authorized; None issued or outstanding — —
Common Stock, $1 par value; 4,000,000 shares authorized; 1,444,187 and 1,440,982 shares issued 17,574 17,285
Treasury Stock— 645,057 and 632,281 common shares at average cost (35,596) (34,150)
Retained earnings 55,242 52,873
Unearned ESOP shares (85) (95)
Total Accumulated other comprehensive loss (7,525) (8,334)
Total Shareowners’ Equity 29,610 27,579
Noncontrolling interest 1,811 1,590
Total Equity 31,421 29,169
Total Liabilities and Equity $ 96,920 $ 89,706
See accompanying Notes to Consolidated Financial Statements
Consolidated Balance Sheet
36 2017 Annual Report
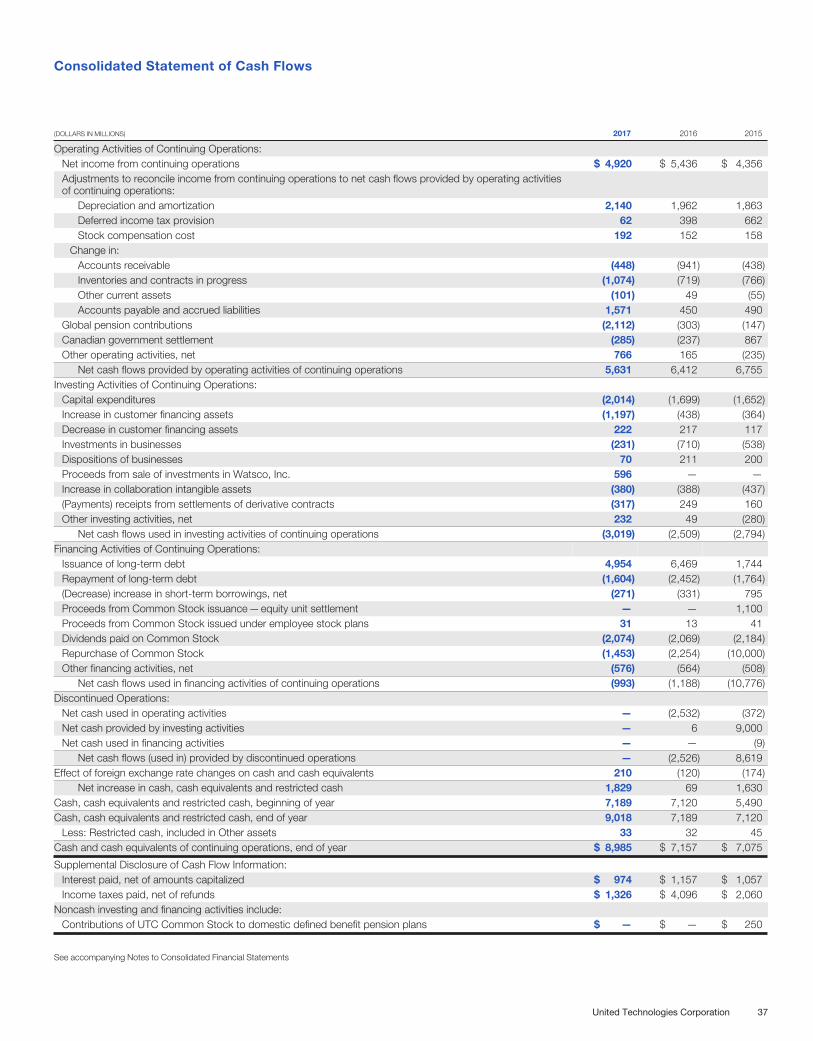
(DOLLARS IN MILLIONS) 2017 2016 2015
Operating Activities of Continuing Operations:Net income from continuing operations $ 4,920 $ 5,436 $ 4,356Adjustments to reconcile income from continuing operations to net cash flows provided by operating activitiesof continuing operations:
Depreciation and amortization 2,140 1,962 1,863Deferred income tax provision 62 398 662Stock compensation cost 192 152 158
Change in:Accounts receivable (448) (941) (438)Inventories and contracts in progress (1,074) (719) (766)Other current assets (101) 49 (55)Accounts payable and accrued liabilities 1,571 450 490
Global pension contributions (2,112) (303) (147)Canadian government settlement (285) (237) 867Other operating activities, net 766 165 (235)
Net cash flows provided by operating activities of continuing operations 5,631 6,412 6,755Investing Activities of Continuing Operations:
Capital expenditures (2,014) (1,699) (1,652)Increase in customer financing assets (1,197) (438) (364)Decrease in customer financing assets 222 217 117Investments in businesses (231) (710) (538)Dispositions of businesses 70 211 200Proceeds from sale of investments in Watsco, Inc. 596 — —Increase in collaboration intangible assets (380) (388) (437)(Payments) receipts from settlements of derivative contracts (317) 249 160Other investing activities, net 232 49 (280)
Net cash flows used in investing activities of continuing operations (3,019) (2,509) (2,794)Financing Activities of Continuing Operations:
Issuance of long-term debt 4,954 6,469 1,744Repayment of long-term debt (1,604) (2,452) (1,764)(Decrease) increase in short-term borrowings, net (271) (331) 795Proceeds from Common Stock issuance—equity unit settlement — — 1,100Proceeds from Common Stock issued under employee stock plans 31 13 41Dividends paid on Common Stock (2,074) (2,069) (2,184)Repurchase of Common Stock (1,453) (2,254) (10,000)Other financing activities, net (576) (564) (508)
Net cash flows used in financing activities of continuing operations (993) (1,188) (10,776)Discontinued Operations:
Net cash used in operating activities — (2,532) (372)Net cash provided by investing activities — 6 9,000Net cash used in financing activities — — (9)
Net cash flows (used in) provided by discontinued operations — (2,526) 8,619Effect of foreign exchange rate changes on cash and cash equivalents 210 (120) (174)
Net increase in cash, cash equivalents and restricted cash 1,829 69 1,630Cash, cash equivalents and restricted cash, beginning of year 7,189 7,120 5,490Cash, cash equivalents and restricted cash, end of year 9,018 7,189 7,120
Less: Restricted cash, included in Other assets 33 32 45Cash and cash equivalents of continuing operations, end of year $ 8,985 $ 7,157 $ 7,075
Supplemental Disclosure of Cash Flow Information:Interest paid, net of amounts capitalized $ 974 $ 1,157 $ 1,057Income taxes paid, net of refunds $ 1,326 $ 4,096 $ 2,060
Noncash investing and financing activities include:Contributions of UTC Common Stock to domestic defined benefit pension plans $ — $ — $ 250
See accompanying Notes to Consolidated Financial Statements
Consolidated Statement of Cash Flows
United Technologies Corporation 37
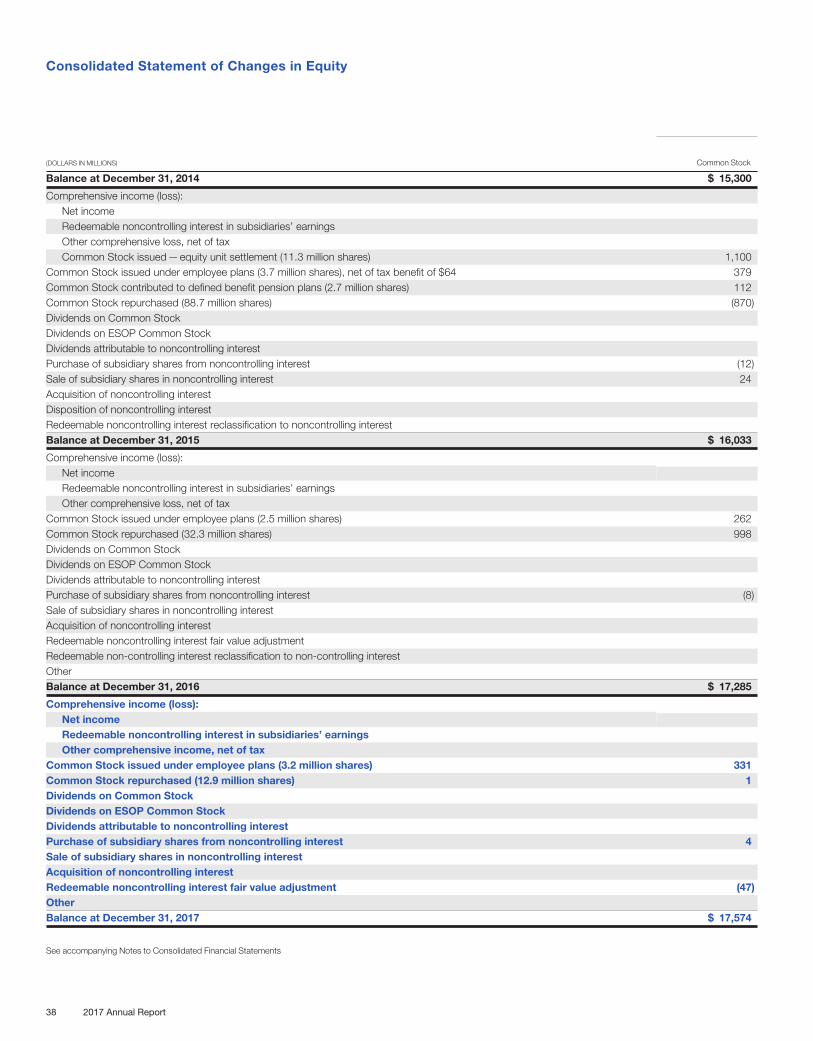
(DOLLARS IN MILLIONS) Common Stock
Balance at December 31, 2014 $ 15,300
Comprehensive income (loss):Net incomeRedeemable noncontrolling interest in subsidiaries’ earningsOther comprehensive loss, net of taxCommon Stock issued—equity unit settlement (11.3 million shares) 1,100
Common Stock issued under employee plans (3.7 million shares), net of tax benefit of $64 379Common Stock contributed to defined benefit pension plans (2.7 million shares) 112Common Stock repurchased (88.7 million shares) (870)Dividends on Common StockDividends on ESOP Common StockDividends attributable to noncontrolling interestPurchase of subsidiary shares from noncontrolling interest (12)Sale of subsidiary shares in noncontrolling interest 24Acquisition of noncontrolling interestDisposition of noncontrolling interestRedeemable noncontrolling interest reclassification to noncontrolling interestBalance at December 31, 2015 $ 16,033
Comprehensive income (loss):Net incomeRedeemable noncontrolling interest in subsidiaries’ earningsOther comprehensive loss, net of tax
Common Stock issued under employee plans (2.5 million shares) 262Common Stock repurchased (32.3 million shares) 998Dividends on Common StockDividends on ESOP Common StockDividends attributable to noncontrolling interestPurchase of subsidiary shares from noncontrolling interest (8)Sale of subsidiary shares in noncontrolling interestAcquisition of noncontrolling interestRedeemable noncontrolling interest fair value adjustmentRedeemable non-controlling interest reclassification to non-controlling interestOtherBalance at December 31, 2016 $ 17,285
Comprehensive income (loss):Net incomeRedeemable noncontrolling interest in subsidiaries’ earningsOther comprehensive income, net of tax
Common Stock issued under employee plans (3.2 million shares) 331Common Stock repurchased (12.9 million shares) 1Dividends on Common StockDividends on ESOP Common StockDividends attributable to noncontrolling interestPurchase of subsidiary shares from noncontrolling interest 4Sale of subsidiary shares in noncontrolling interestAcquisition of noncontrolling interestRedeemable noncontrolling interest fair value adjustment (47)OtherBalance at December 31, 2017 $ 17,574
See accompanying Notes to Consolidated Financial Statements
Consolidated Statement of Changes in Equity
38 2017 Annual Report
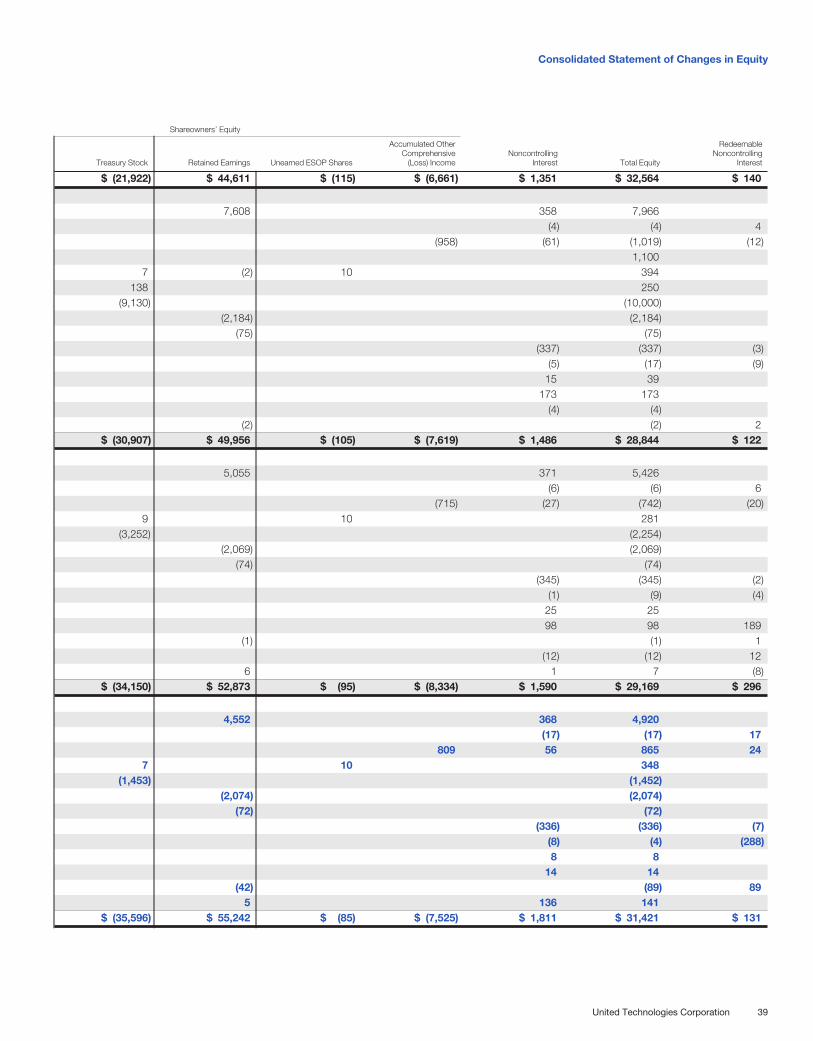
Shareowners’ Equity
Treasury Stock Retained Earnings Unearned ESOP Shares
Accumulated OtherComprehensive
(Loss) IncomeNoncontrolling
Interest Total Equity
RedeemableNoncontrolling
Interest
$ (21,922) $ 44,611 $ (115) $ (6,661) $ 1,351 $ 32,564 $ 140
7,608 358 7,966(4) (4) 4
(958) (61) (1,019) (12)1,100
7 (2) 10 394138 250
(9,130) (10,000)(2,184) (2,184)
(75) (75)(337) (337) (3)
(5) (17) (9)15 39
173 173(4) (4)
(2) (2) 2$ (30,907) $ 49,956 $ (105) $ (7,619) $ 1,486 $ 28,844 $ 122
5,055 371 5,426(6) (6) 6
(715) (27) (742) (20)9 10 281
(3,252) (2,254)(2,069) (2,069)
(74) (74)(345) (345) (2)
(1) (9) (4)25 2598 98 189
(1) (1) 1(12) (12) 12
6 1 7 (8)$ (34,150) $ 52,873 $ (95) $ (8,334) $ 1,590 $ 29,169 $ 296
4,552 368 4,920(17) (17) 17
809 56 865 247 10 348
(1,453) (1,452)(2,074) (2,074)
(72) (72)(336) (336) (7)
(8) (4) (288)8 8
14 14(42) (89) 89
5 136 141$ (35,596) $ 55,242 $ (85) $ (7,525) $ 1,811 $ 31,421 $ 131
Consolidated Statement of Changes in Equity
United Technologies Corporation 39
NOTE 1: SUMMARY OF ACCOUNTING PRINCIPLES
The preparation of financial statements requires management to makeestimates and assumptions that affect the reported amounts of assets,liabilities, revenues and expenses. Actual results could differ from thoseestimates. Certain reclassifications have been made to the prior yearamounts to conform to the current year presentation.
Consolidation. The Consolidated Financial Statements includethe accounts of United Technologies Corporation (UTC) and its con-trolled subsidiaries. Intercompany transactions have been eliminated.
Cash and Cash Equivalents. Cash and cash equivalentsincludes cash on hand, demand deposits and short-term cash invest-ments that are highly liquid in nature and have original maturities of threemonths or less.
On occasion, we are required to maintain cash deposits with cer-tain banks with respect to contractual obligations related to acquisitionsor divestitures or other legal obligations. As of December 31, 2017 and2016, the amount of such restricted cash was approximately $33 millionand $32 million, respectively.
Accounts Receivable. Current and long-term accounts receiv-able as of December 31, 2017 include retainage of $118 million andunbilled receivables of $2,770 million, which includes approximately$1,109 million of unbilled receivables under commercial aerospacelong-term aftermarket contracts. Current and long-term accountsreceivable as of December 31, 2016 include retainage of $106 millionand unbilled receivables of $2,786 million, which includes approximately$1,169 million of unbilled receivables under commercial aerospacelong-term aftermarket contracts. See Note 5 for discussion of commer-cial aerospace industry assets and commitments.
Retainage represents amounts that, pursuant to the applicablecontract, are not due until project completion and acceptance by thecustomer. Unbilled receivables represent revenues that are not currentlybillable to the customer under the terms of the contract. These itemsare expected to be billed and collected in the normal course ofbusiness.
Marketable Equity Securities. Equity securities that have a read-ily determinable fair value and that we do not intend to trade areclassified as available-for-sale and carried at fair value. Unrealized hold-ing gains and losses are recorded as a separate component ofshareowners’ equity, net of deferred income taxes.
In January 2016, the FASB issued ASU 2016-01, FinancialInstruments—Overall: Recognition and Measurement of FinancialAssets and Financial Liabilities. This ASU modifies how entities measureequity investments and present changes in the fair value of financialliabilities. Upon adoption, investments that do not result in consolidationand are not accounted for under the equity method generally must becarried at fair value, with changes in fair value recognized in net income.As discussed in Note 10, we have approximately $5 million of unrealizedgains on these securities recorded in Accumulated other comprehen-sive loss in our Consolidated Balance Sheet as of December 31, 2017.We adopted this standard effective January 1, 2018, with theseamounts recorded directly to retained earnings as of that date.
Inventories and Contracts in Progress. Inventories and con-tracts in progress are stated at the lower of cost or estimated realizablevalue and are primarily based on first-in, first-out (FIFO) or average costmethods; however, certain UTC Aerospace Systems and UTC Climate,Controls & Security entities use the last-in, first-out (LIFO) method. Ifinventories that were valued using the LIFO method had been valuedunder the FIFO method, they would have been higher by $106 millionand $114 million at December 31, 2017 and 2016, respectively.
Costs accumulated against specific contracts or orders are atactual cost. Valuation reserves for excess, obsolete, and slow-movinginventory are estimated by comparing the inventory levels of individualparts to both future sales forecasts or production requirements andhistorical usage rates in order to identify inventory where the resalevalue or replacement value is less than inventoriable cost. Other factorsthat management considers in determining the adequacy of thesereserves include whether individual inventory parts meet current specifi-cations and cannot be substituted for a part currently being sold orused as a service part, overall market conditions, and other inventorymanagement initiatives. Manufacturing costs are allocated to currentproduction and firm contracts. Within commercial aerospace, inventorycosts attributable to new engine offerings are recognized based on theaverage cost per unit expected over the life of each contract using theunits-of-delivery method of percentage of completion accounting.Under this method, costs of initial engine deliveries in excess of theprojected contract per unit average cost are capitalized, and thesecapitalized amounts are subsequently expensed as additional enginedeliveries occur for engines with costs below the projected contractper unit average cost over the life of the contract. As described in the“Revenue Recognition” section of Note 1 below, these costs will beeliminated through retained earnings and will not be amortized intofuture earnings upon adoption of Accounting Standards Update(ASU) 2014-09, Revenue from Contracts with Customers effectiveJanuary 1, 2018.
Equity Method Investments. Investments in which we havethe ability to exercise significant influence, but do not control, areaccounted for under the equity method of accounting and are includedin Other assets on the Consolidated Balance Sheet. Under this methodof accounting, our share of the net earnings or losses of the investeeis included in Other income, net on the Consolidated Statement ofOperations since the activities of the investee are closely aligned withthe operations of the business segment holding the investment. Weevaluate our equity method investments whenever events or changesin circumstance indicate that the carrying amounts of such investmentsmay be impaired. If a decline in the value of an equity method invest-ment is determined to be other than temporary, a loss is recorded inearnings in the current period.
Goodwill and Intangible Assets. Goodwill represents costs inexcess of fair values assigned to the underlying net assets of acquiredbusinesses. Goodwill and intangible assets deemed to have indefinitelives are not amortized. Goodwill and indefinite-lived intangible assetsare subject to annual impairment testing using the guidance and criteriadescribed in the Intangibles—Goodwill and Other Topic of the FASB
Notes to Consolidated Financial Statements
40 2017 Annual Report
ASC. This testing compares carrying values to fair values and, whenappropriate, the carrying value of these assets is reduced to fair value.
In January 2017, the FASB issued ASU 2017-04, Intangibles—Goodwill and Other (Topic 350): Simplifying the Test for GoodwillImpairment. This ASU eliminates Step 2 of the current goodwill impair-ment test, which requires a hypothetical purchase price allocation tomeasure goodwill impairment. A goodwill impairment loss will insteadbe measured at the amount by which a reporting unit’s carrying valueexceeds its fair value, not to exceed the recorded amount of goodwill.The provisions of this ASU are effective for years beginning afterDecember 15, 2019, with early adoption permitted for any impairmenttest performed on testing dates after January 1, 2017. We earlyadopted this standard as of July 1, 2017 and this ASU did not have asignificant impact on our financial statements or disclosures.
Intangible assets consist of service portfolios, patents, trademarks/tradenames, customer relationships and other intangible assetsincluding a collaboration asset, as discussed further in Note 2. Acquiredintangible assets are recognized at fair value in purchase accountingand then amortized to cost of sales and selling, general & administrativeexpenses over the applicable useful lives. Also included within otherintangible assets are commercial aerospace payments made to securecertain contractual rights to provide product on new aircraft platforms.We classify amortization of such payments as a reduction of sales. Suchpayments are capitalized when there are distinct rights obtained andthere are sufficient incremental cash flows to support the recoverabilityof the assets established. Otherwise, the applicable portion of the pay-ments are expensed. Consideration paid on these contractualcommitments is capitalized when it is no longer conditional.
Useful lives of finite-lived intangible assets are estimated basedupon the nature of the intangible asset and the industry in which theintangible asset is used. These intangible assets are amortized basedon the pattern in which the economic benefits of the intangible assetsare consumed. For both our commercial aerospace collaborationassets and exclusivity arrangements, the pattern of economic benefitgenerally results in lower amortization during the development periodwith increasing amortization as programs enter full rate production andaftermarket cycles. If a pattern of economic benefit cannot be reliablydetermined, a straight-line amortization method is used. The range ofestimated useful lives is as follows:
Collaboration assets 30 years
Customer relationships and related programs 1 to 50 years
Purchased service contracts 5 to 25 years
Patents & trademarks 4 to 40 years
Exclusivity assets 5 to 25 years
Other Long-Lived Assets. We evaluate the potential impairmentof other long-lived assets whenever events or changes in circumstancesindicate that the related carrying amounts may not be recoverable. If thecarrying value of other long-lived assets held and used exceeds the sumof the undiscounted expected future cash flows, the carrying value iswritten down to fair value.
Long-Term Financing Receivables. Our long-term financingreceivables primarily represent balances related to the aerospace busi-nesses such as long-term trade accounts receivable, leases, and notesreceivable. We also have other long-term receivables in our commercialbusinesses; however, both the individual and aggregate amounts ofthose other receivables are not significant.
Long-term trade accounts receivable, including unbilled receivablesrelated to long-term aftermarket contracts, are principally amounts arisingfrom the sale of goods and services with a contractual maturity date orrealization period of greater than one year and are recognized as “Otherassets” in our Consolidated Balance Sheet. Notes and leases receivablerepresent notes and lease receivables other than receivables related tooperating leases, and are recognized as “Customer financing assets” inour Consolidated Balance Sheet. The following table summarizes thebalance by class of aerospace business-related long-term receivablesas of December 31, 2017 and 2016:
(DOLLARS IN MILLIONS) 2017 2016
Long-term trade accounts receivable $ 973 $ 926
Notes and leases receivable 424 430
Total long-term receivables $ 1,397 $ 1,356
We determine a receivable is impaired when, based on currentinformation and events, it is probable that we will be unable to collectamounts due according to the contractual terms of the receivableagreement. Factors considered in assessing collectability and riskinclude, but are not limited to, examination of credit quality indicatorsand other evaluation measures, underlying value of any collateral orsecurity interests, significant past due balances, historical losses, andexisting economic conditions.
We determine credit ratings for each customer in our portfoliobased upon public information and information obtained directly fromour customers. We conduct a review of customer credit ratings, pub-lished historical credit default rates for different rating categories, andmultiple third-party aircraft value publications as a basis to validate thereasonableness of the allowance for losses on these balances quarterlyor when events and circumstances warrant. Customer credit ratingsrange from customers with an extremely strong capacity to meet finan-cial obligations, to customers whose uncollateralized receivable is indefault. There can be no assurance that actual results will not differfrom estimates or that consideration of these factors in the future willnot result in an increase or decrease to the allowance for credit losseson long-term receivables. Based upon the customer credit ratings,approximately 11% and 13% of our long-term receivables were con-sidered to bear high credit risk as of December 31, 2017 and 2016,respectively. See Note 5 for further discussion of commercial aerospaceindustry assets and commitments.
Reserves for credit losses on receivables relate to specificallyidentified receivables that are evaluated individually for impairment.For notes and leases receivable, we determine a specific reserve forexposure based on the difference between the carrying value of thereceivable and the estimated fair value of the related collateral in con-nection with the evaluation of credit risk and collectability. For long-term
Notes to Consolidated Financial Statements
United Technologies Corporation 41
trade accounts receivable, we evaluate credit risk and collectabilityindividually to determine if an allowance is necessary. Our long-termreceivables reflected in the table above, which include reserves of$17 million as of both December 31, 2017 and 2016, are individuallyevaluated for impairment. At both December 31, 2017 and 2016, wedid not have any significant balances that are considered to be delin-quent, on non-accrual status, past due 90 days or more, or consideredto be impaired.
Income Taxes. In the ordinary course of business there is inherentuncertainty in quantifying our income tax positions. We assess ourincome tax positions and record tax benefits for all years subject toexamination based upon management’s evaluation of the facts, circum-stances, and information available at the reporting date. For those taxpositions where it is more-likely-than-not that a tax benefit will be sus-tained, we have recorded the largest amount of tax benefit with agreater than 50% likelihood of being realized upon ultimate settlementwith a taxing authority that has full knowledge of all relevant information.For those income tax positions where it is not more-likely-than-not thata tax benefit will be sustained, no tax benefit has been recognized in thefinancial statements. Where applicable, associated interest expense hasalso been recognized. We recognize accrued interest related to unrec-ognized tax benefits in interest expense. Penalties, if incurred, would berecognized as a component of income tax expense.
On December 22, 2017 the TCJA was enacted. The TCJA con-tains a new law that may subject the Company to a tax on GlobalIntangible Low-Taxed Income (GILTI), beginning in 2018. GILTI is a taxon foreign income in excess of a deemed return on tangible assets offoreign corporations. The FASB has provided that companies subject toGILTI have the option to account for the GILTI tax as a period cost if andwhen incurred, or to recognize deferred taxes for temporary differences,including outside basis differences, expected to reverse as GILTI. Wehave elected to account for GILTI as a period cost, if incurred.
Revenue Recognition. As a result of our diverse product andservice mix and customer base, we use multiple revenue recognitionpractices. We recognize sales for products and services in accordancewith the provisions of Staff Accounting Bulletin (SAB) Topic 13, RevenueRecognition, as applicable. Products and services included within thescope of this SAB Topic include heating, ventilating, air-conditioningand refrigeration systems, certain alarm and fire detection and suppres-sion systems, commercially funded research and developmentcontracts and certain aerospace components. Sales within the scopeof this SAB Topic are recognized when persuasive evidence of anarrangement exists, product delivery has occurred or services havebeen rendered, pricing is fixed or determinable and collectability isreasonably assured. Subsequent changes in service contracts areaccounted for prospectively.
Contract Accounting and Separately Priced Maintenance andExtended Warranty Aftermarket Contracts: For our construction-typeand certain production-type contracts, sales are recognized on apercentage-of-completion basis following contract accounting meth-ods. Contracts consist of enforceable agreements which form the basisof our unit of accounting for measuring sales, accumulating costs and
recording loss provisions as necessary. Contract accounting requiresestimates of award fees and other sources of variable consideration aswell as future costs over the performance period of the contract. Costestimates also include the estimated cost of satisfying our offset obliga-tions required under certain contracts. Cost estimates are subject tochange and result in adjustments to margins on contracts in progress.The extent of progress toward completion on our long-term commercialaerospace equipment is measured using units of delivery or other con-tractual milestones. The extent of progress towards completion on ourdevelopment and other cost reimbursement contracts in our aerospacebusinesses and elevator and escalator sales, installation, modernizationand other construction contracts in our commercial businesses is mea-sured using cost-to-cost based input measures. Contract costs includeestimated inventoriable manufacturing, engineering, product warrantyand product performance guarantee costs, as appropriate.
For separately priced product maintenance and extended warrantyaftermarket contracts, sales are recognized over the contract period. Inthe commercial businesses, sales are primarily recognized on a straight-line basis. In the aerospace businesses, sales are primarily recognizedin proportion to cost as sufficient historical evidence indicates that costsof performing services under the contract are incurred on an other thanstraight-line basis.
Loss provisions on original equipment contracts are recognizedto the extent that estimated contract costs exceed the estimatedconsideration from the products contemplated under the contractualarrangement. For new commitments, we generally record loss provi-sions at the earlier of contract announcement or contract signing exceptfor certain requirements contracts under which losses are recordedupon receipt of the purchase order which obligates us to perform. Forexisting commitments, anticipated losses on contracts are recognizedin the period in which losses become evident. Products contemplatedunder contractual arrangements include firm quantities of products soldunder contract and, in the large commercial engine and wheels andbrakes businesses, future highly probable sales of replacement partsrequired by regulation that are expected to be sold subsequently forincorporation into the original equipment. In the large commercialengine and wheels and brakes businesses, when the combined originalequipment and aftermarket arrangements for each individual salescampaign are profitable, we record original equipment product losses,as applicable, at the time of delivery.
We review our cost estimates on significant contracts on a quar-terly basis, and for others, no less frequently than annually or whencircumstances change and warrant a modification to a previous esti-mate. We record changes in contract estimates using the cumulativecatch-up method in accordance with the Revenue Recognition Topicof the FASB ASC. Operating profits included significant net unfavorablechanges in aerospace contract estimates of approximately $110 millionand $157 million in 2017 and 2016, respectively, primarily the result ofunexpected increases in estimated costs related to Pratt & Whitney longterm aftermarket contracts. Operating profits included significant netfavorable changes in aerospace contract estimates of approximately
Notes to Consolidated Financial Statements
42 2017 Annual Report
$115 million in 2015, primarily representing favorable contract adjust-ments at Pratt & Whitney.
Collaborations: Sales generated from engine programs, spareparts sales, and aftermarket business under collaboration arrangementsare recorded consistent with our revenue recognition policies in ourconsolidated financial statements. Amounts attributable to our collabo-rators for their share of sales are recorded as cost of sales in ourfinancial statements based upon the terms and nature of the arrange-ment. Costs associated with engine programs under collaborativearrangements are expensed as incurred. Under these arrangements,collaborators contribute their program share of engine parts, incur theirown production costs and make certain payments to Pratt & Whitneyfor shared or joint program costs. The reimbursement of a collabora-tor’s share of program costs is recorded as a reduction of the relatedexpense item at that time.
Cash Payments to Customers: UTC Climate, Controls & Securitycustomarily offers its customers incentives to purchase products toensure an adequate supply of its products in the distribution channels.The principal incentive program provides reimbursements to distributorsfor offering promotional pricing for our products. We account forincentive payments made as a reduction in sales. In our aerospacebusinesses, we may make participation payments to certain customersto secure certain contractual rights. To the extent these rights are incre-mental and are supported by the incremental cash flows obtained, theyare capitalized as intangible assets. Otherwise, such payments areexpensed. We classify the subsequent amortization of the capitalizedacquired intangible assets from our customers as a reduction in sales.Contractually stated prices in arrangements with our customers thatinclude the acquisition of intangible rights within the scope of theIntangibles—Goodwill and Other Topic of the FASB ASC and deliver-ables within the scope of the Revenue Recognition Topic of the FASBASC are not presumed to be representative of fair value for determiningthe amounts to allocate to each element of an arrangement.
Accounting Standards Update (ASU) 2014-09, Revenue fromContracts with Customers: In May 2014, the FASB issued AccountingStandards Update (ASU) 2014-09, Revenue from Contracts withCustomers. In 2015 and 2016, the FASB issued various updates to thisASU as follows:
• ASU 2015-14, Revenue from Contracts with Customers(Topic 606): Deferral of the Effective Date—delays the effectivedate of ASU 2014-09 by one year.
• ASU 2016-08, Revenue from Contracts with Customers(Topic 606), Principal versus Agent Considerations (ReportingRevenue Gross versus Net)—clarifies how an entity shouldidentify the unit of accounting (i.e. the specified good or service)for the principal versus agent evaluation and how it should applythe control principle to certain types of arrangements.
• ASU 2016-10, Revenue from Contracts with Customers(Topic 606), Identifying Performance Obligations andLicensing—clarifies the guidance surrounding licensingarrangements and the identification of performance obligations.
• ASU 2016-12, Revenue from Contracts with Customers(Topic 606), Narrow-Scope Improvements and PracticalExpedients—addresses implementation issues raised by stake-holders concerning collectability, noncash consideration,presentation of sales tax, and transition.
• ASU 2016-20, Revenue from Contracts with Customers(Topic 606), Technical Corrections and Improvements—addresses loan guarantee fees, impairment testing of contractcosts, provisions for losses on certain contracts, and variousdisclosures.
ASU 2014-09 and its related amendments (collectively, theNew Revenue Standard) are effective for reporting periods beginningafter December 15, 2017, and interim periods therein. In accordancewith the standard, we have adopted the New Revenue Standard effec-tive January 1, 2018 and elected the modified retrospective approachwith the cumulative effect of adoption recognized through retainedearnings at the date of adoption.
The New Revenue Standard will change the revenue recognitionpractices for a number of revenue streams across our businesses,although the most significant impacts will be concentrated within ouraerospace units. Several businesses, which currently account for rev-enue on an output units of delivery basis will be required to use an inputmethod of an “over time” model as they meet one or more of the man-datory criteria established in the New Revenue Standard. Revenue willnow be recognized based on percentage-of-completion for repair con-tracts within Otis and UTC Climate, Controls & Security; certain U.S.Government aerospace contracts; and aerospace aftermarket servicework. For these businesses, unrecognized sales and operating profitsrelated to the satisfied portion of the performance obligations of con-tracts in process as of the date of adoption will be recorded throughretained earnings. While we are still finalizing our retained earningsimpact evaluation, the ongoing effect of recognizing revenue on an inputmethod of an over time model within these businesses is not expectedto be material.
In addition to the foregoing, our aerospace businesses will alsoincur changes related to the timing of manufacturing cost recognitionand certain engineering and development costs. In most circum-stances, our commercial aerospace businesses will identify theperformance obligation, or the unit of accounting, as the individualoriginal equipment (OEM) unit; revenues and costs to manufactureeach unit will be recognized upon OEM unit delivery. Generally undercurrent practice, the unit of accounting is the contract, and early-contract OEM unit costs in excess of the average expected over thecontract are capitalized and amortized over lower-cost units later inthe contract. With the adoption of the New Revenue Standard, deferredunit costs in excess of the contract average of $438 million as ofDecember 31, 2017 will be eliminated through retained earnings andwill not be amortized into future earnings.
With regard to costs incurred for the engineering and developmentof aerospace products under contract with customers, we generallyexpense as incurred unless there is a contractually guaranteed right ofrecovery. The New Revenue Standard requires product engineering and
Notes to Consolidated Financial Statements
United Technologies Corporation 43
development costs to be capitalized as contract fulfillment costs, to theextent recoverable from the associated contract margin, and subse-quently amortized as the OEM products are delivered to the customer.We are still finalizing the calculation of the impact of this change to ouradoption-date retained earnings. The ongoing impact will not changethe total amount of cost incurred, but will change the timing of recogni-tion of that cost.
Prior to the New Revenue Standard, any customer fundingreceived for such development efforts was recognized when earned,with the corresponding costs recognized as cost of sales. The NewRevenue Standard requires customer funding of OEM product engi-neering and development to be deferred and recognized as revenue asthe OEM products are delivered to the customer. For contracts that areopen as of the adoption date, previously recognized customer fundingwill be established as a contract liability as deferred income. We are stillfinalizing the calculation of the impact of this change to our adoption-date retained earnings.
We expect the New Revenue Standard will have an immaterialimpact on our 2018 net income. Adoption of the New Revenue Stan-dard will result in income statement classification changes betweenRevenues, Cost of sales, Research & development, and Other income.The New Revenue Standard will also result in the establishment ofContract asset and Contract liability balance sheet accounts, and inthe reclassification to these new accounts from Accounts receivable;Inventories and contracts in progress, net; and Accrued liabilities. TheNew Revenue Standard requires ongoing incremental disclosuresincluding explanation of significant changes in the Contract asset andContract liability balances, and disaggregation of revenue into catego-ries that depict how the nature, amount, timing and uncertainty ofrevenue and cash flows are affected by economic factors.
The New Revenue Standard also requires disclosure of remainingperformance obligations, which is a concept that is similar to that ofbacklog, which we report in Item I, Part I of our Form 10-K. Beginning in2018, we will align our definition of backlog with that of remaining per-formance obligations under the New Revenue Standard. We havehistorically included in backlog engine orders from airlines for whichsuch purchase orders have not yet been received. Effective with theadoption of the New Revenue Standard, we will no longer include inbacklog airline engine orders for which we have not yet received theassociated firm manufacturing purchase order. Excluding these engineorders is expected to result in a significant decline in reported backlogin 2018.
Research and Development. Research and development costsnot specifically covered by contracts and those related to the companysponsored share of research and development activity in connectionwith cost-sharing arrangements are charged to expense as incurred.Government research and development support, not associated withspecific contracts, is recorded as a reduction to research and develop-ment expense in the period earned. See Note 8 for a discussion ofamendments of certain government research and development supportarrangements concluded in December 2015 between P&WC and theCanadian government.
Research and development costs incurred under contracts withcustomers are included as a contract cost and reported as a compo-nent of cost of products sold when revenue from such contracts isrecognized. Research and development costs in excess of contractualconsideration are expensed as incurred.
Foreign Exchange. We conduct business in many different cur-rencies and, accordingly, are subject to the inherent risks associatedwith foreign exchange rate movements. The financial position andresults of operations of substantially all of our foreign subsidiaries aremeasured using the local currency as the functional currency. Foreigncurrency denominated assets and liabilities are translated into U.S.Dollars at the exchange rates existing at the respective balance sheetdates, and income and expense items are translated at the averageexchange rates during the respective periods. The aggregate effects oftranslating the balance sheets of these subsidiaries are deferred as aseparate component of shareowners’ equity.
Derivatives and Hedging Activity. We have used derivativeinstruments, including swaps, forward contracts and options, to helpmanage certain foreign currency, interest rate and commodity priceexposures. Derivative instruments are viewed as risk management toolsby us and are not used for trading or speculative purposes. By theirnature, all financial instruments involve market and credit risks. We enterinto derivative and other financial instruments with major investmentgrade financial institutions and have policies to monitor the credit risk ofthose counterparties. We limit counterparty exposure and concentrationof risk by diversifying counterparties. While there can be no assurance,we do not anticipate any material non-performance by any of thesecounterparties. We enter into transactions that are subject to enforce-able master netting arrangements or similar agreements with variouscounterparties. However, we have not elected to offset multiple con-tracts with a single counterparty and, as a result, the fair value of thederivative instruments in a loss position is not offset against the fairvalue of derivative instruments in a gain position.
Derivatives used for hedging purposes may be designated andeffective as a hedge of the identified risk exposure at the inception ofthe contract. All derivative instruments are recorded on the balancesheet at fair value. Derivatives used to hedge foreign-currency denomi-nated balance sheet items are reported directly in earnings along withoffsetting transaction gains and losses on the items being hedged.Derivatives used to hedge forecasted cash flows associated with for-eign currency commitments or forecasted commodity purchases maybe accounted for as cash flow hedges, as deemed appropriate. Gainsand losses on derivatives designated as cash flow hedges are recordedin other comprehensive income and reclassified to earnings as a com-ponent of product sales or expenses, as applicable, when the hedgedtransaction occurs. To the extent that a previously designated hedgingtransaction is no longer an effective hedge, any ineffectiveness mea-sured in the hedging relationship is recorded currently in earnings in theperiod it occurs. As discussed in Note 14, at December 31, 2017 wehave approximately e3.7 billion of Euro-denominated long-term debt,which qualify as a net investment hedge against our investments in
Notes to Consolidated Financial Statements
44 2017 Annual Report
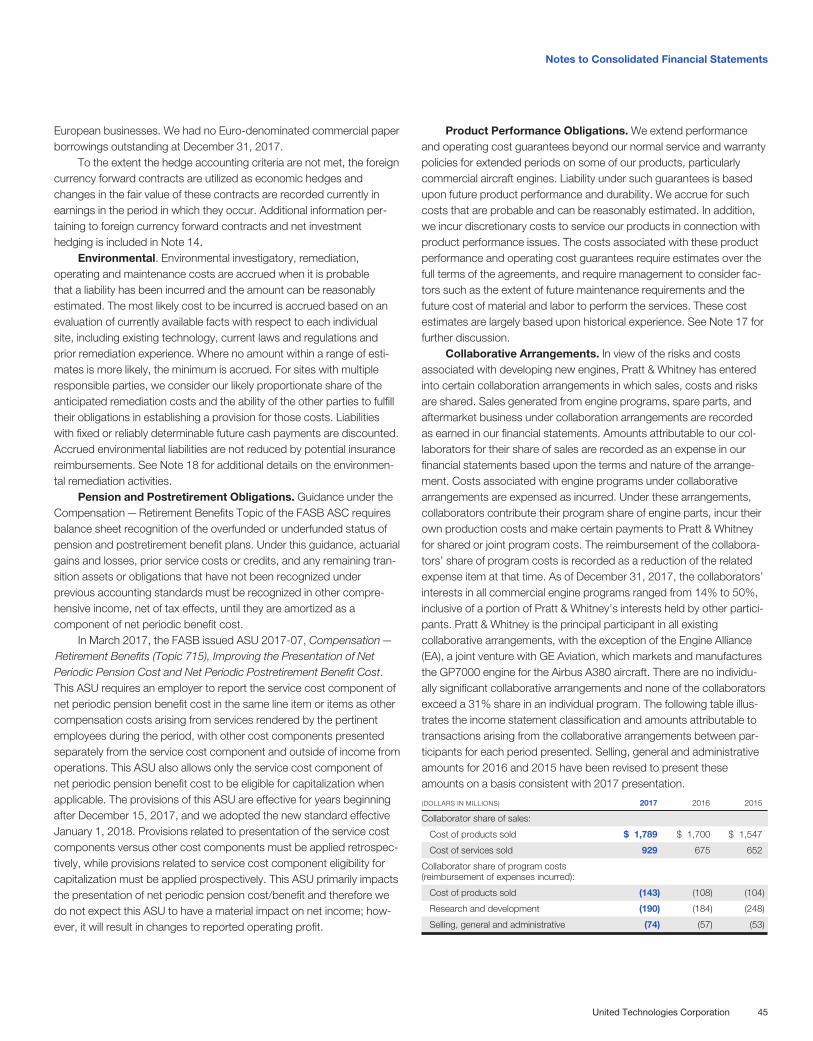
European businesses. We had no Euro-denominated commercial paperborrowings outstanding at December 31, 2017.
To the extent the hedge accounting criteria are not met, the foreigncurrency forward contracts are utilized as economic hedges andchanges in the fair value of these contracts are recorded currently inearnings in the period in which they occur. Additional information per-taining to foreign currency forward contracts and net investmenthedging is included in Note 14.
Environmental. Environmental investigatory, remediation,operating and maintenance costs are accrued when it is probablethat a liability has been incurred and the amount can be reasonablyestimated. The most likely cost to be incurred is accrued based on anevaluation of currently available facts with respect to each individualsite, including existing technology, current laws and regulations andprior remediation experience. Where no amount within a range of esti-mates is more likely, the minimum is accrued. For sites with multipleresponsible parties, we consider our likely proportionate share of theanticipated remediation costs and the ability of the other parties to fulfilltheir obligations in establishing a provision for those costs. Liabilitieswith fixed or reliably determinable future cash payments are discounted.Accrued environmental liabilities are not reduced by potential insurancereimbursements. See Note 18 for additional details on the environmen-tal remediation activities.
Pension and Postretirement Obligations. Guidance under theCompensation—Retirement Benefits Topic of the FASB ASC requiresbalance sheet recognition of the overfunded or underfunded status ofpension and postretirement benefit plans. Under this guidance, actuarialgains and losses, prior service costs or credits, and any remaining tran-sition assets or obligations that have not been recognized underprevious accounting standards must be recognized in other compre-hensive income, net of tax effects, until they are amortized as acomponent of net periodic benefit cost.
In March 2017, the FASB issued ASU 2017-07, Compensation—Retirement Benefits (Topic 715), Improving the Presentation of NetPeriodic Pension Cost and Net Periodic Postretirement Benefit Cost.This ASU requires an employer to report the service cost component ofnet periodic pension benefit cost in the same line item or items as othercompensation costs arising from services rendered by the pertinentemployees during the period, with other cost components presentedseparately from the service cost component and outside of income fromoperations. This ASU also allows only the service cost component ofnet periodic pension benefit cost to be eligible for capitalization whenapplicable. The provisions of this ASU are effective for years beginningafter December 15, 2017, and we adopted the new standard effectiveJanuary 1, 2018. Provisions related to presentation of the service costcomponents versus other cost components must be applied retrospec-tively, while provisions related to service cost component eligibility forcapitalization must be applied prospectively. This ASU primarily impactsthe presentation of net periodic pension cost/benefit and therefore wedo not expect this ASU to have a material impact on net income; how-ever, it will result in changes to reported operating profit.
Product Performance Obligations. We extend performanceand operating cost guarantees beyond our normal service and warrantypolicies for extended periods on some of our products, particularlycommercial aircraft engines. Liability under such guarantees is basedupon future product performance and durability. We accrue for suchcosts that are probable and can be reasonably estimated. In addition,we incur discretionary costs to service our products in connection withproduct performance issues. The costs associated with these productperformance and operating cost guarantees require estimates over thefull terms of the agreements, and require management to consider fac-tors such as the extent of future maintenance requirements and thefuture cost of material and labor to perform the services. These costestimates are largely based upon historical experience. See Note 17 forfurther discussion.
Collaborative Arrangements. In view of the risks and costsassociated with developing new engines, Pratt & Whitney has enteredinto certain collaboration arrangements in which sales, costs and risksare shared. Sales generated from engine programs, spare parts, andaftermarket business under collaboration arrangements are recordedas earned in our financial statements. Amounts attributable to our col-laborators for their share of sales are recorded as an expense in ourfinancial statements based upon the terms and nature of the arrange-ment. Costs associated with engine programs under collaborativearrangements are expensed as incurred. Under these arrangements,collaborators contribute their program share of engine parts, incur theirown production costs and make certain payments to Pratt & Whitneyfor shared or joint program costs. The reimbursement of the collabora-tors’ share of program costs is recorded as a reduction of the relatedexpense item at that time. As of December 31, 2017, the collaborators’interests in all commercial engine programs ranged from 14% to 50%,inclusive of a portion of Pratt & Whitney’s interests held by other partici-pants. Pratt & Whitney is the principal participant in all existingcollaborative arrangements, with the exception of the Engine Alliance(EA), a joint venture with GE Aviation, which markets and manufacturesthe GP7000 engine for the Airbus A380 aircraft. There are no individu-ally significant collaborative arrangements and none of the collaboratorsexceed a 31% share in an individual program. The following table illus-trates the income statement classification and amounts attributable totransactions arising from the collaborative arrangements between par-ticipants for each period presented. Selling, general and administrativeamounts for 2016 and 2015 have been revised to present theseamounts on a basis consistent with 2017 presentation.
(DOLLARS IN MILLIONS) 2017 2016 2015
Collaborator share of sales:
Cost of products sold $ 1,789 $ 1,700 $ 1,547
Cost of services sold 929 675 652
Collaborator share of program costs(reimbursement of expenses incurred):
Cost of products sold (143) (108) (104)
Research and development (190) (184) (248)
Selling, general and administrative (74) (57) (53)
Notes to Consolidated Financial Statements
United Technologies Corporation 45
Accounting Pronouncements. In October 2016, the FASBissued ASU 2016-16, Income Taxes (Topic 740): Intra-Entity Transfersof Assets Other Than Inventory. This ASU requires the income tax con-sequences of an intra-entity transfer of an asset, other than inventory, tobe recognized when the transfer occurs. Two common examples ofassets included in the scope of this update are intellectual property andproperty, plant, and equipment. The provisions of this ASU are effectivefor years beginning after December 15, 2017, with early adoption per-mitted. We do not expect this ASU to have a significant impact on ourfinancial statements or disclosures. We adopted the new standardeffective January 1, 2018.
In February 2016, the FASB issued ASU 2016- 02, Leases(Topic 842). The new standard establishes a right-of-use (ROU) modelthat requires a lessee to record a ROU asset and a lease liability on thebalance sheet for all leases with terms longer than 12 months. Leaseswill be classified as either finance or operating, with classification affect-ing the pattern of expense recognition in the Consolidated Statementof Operations. In addition, this standard requires a lessor to classifyleases as either sales-type, finance or operating. A lease will be treatedas a sale if it transfers all of the risks and rewards, as well as control ofthe underlying asset, to the lessee. If risks and rewards are conveyedwithout the transfer of control, the lease is treated as financing. If thelessor doesn’t convey risks and rewards or control, the lease is treatedas operating.
The new standard is effective for fiscal years beginning afterDecember 15, 2018, including interim periods within those fiscal years.A modified retrospective transition approach is required for lessees forcapital and operating leases and lessors for sales-type, direct financing,and operating leases existing at, or entered into after, the beginning ofthe earliest comparative period presented in the financial statements,with certain practical expedients available. In November 2017, theFASB announced a decision to offer an additional practical expedientrelated to the transition to the new lease accounting standard whichallows for its prospective adoption. The FASB is expected to formallycommunicate this new practical expedient through an AccountingStandards Update to be released in early 2018. While we are still evalu-ating the impact of our pending adoption of the new standard on ourconsolidated financial statements, we expect that upon adoption we willrecognize ROU assets and lease liabilities and that the amounts couldbe material. We do not expect the ASU to have a material impact on ourcash flows or results of operations.
In January 2017, the FASB issued ASU 2017-01, BusinessCombinations (Topic 805): Clarifying the Definition of a Business. ThisASU provides a new framework that will assist in the evaluation ofwhether business combination transactions should be accounted foras an acquisition of a business or as a group of assets, and specifiesthe minimum required inputs and processes necessary to be a busi-ness. The provisions of this ASU are effective for years beginning afterDecember 15, 2017, with early adoption permitted. We adopted thenew standard effective January 1, 2018.
In May 2017, the FASB issued ASU 2017-09, Compensation—Stock Compensation (Topic 718): Scope of Modification Accounting.
This ASU provides that an entity should account for the effects of amodification unless the fair value, the vesting conditions of the modifiedaward and the classification of the modified award (equity or liabilityinstrument) are the same as the original award immediately before themodification. The provisions of this ASU are effective for years beginningafter December 15, 2017, with early adoption permitted. We do notexpect this ASU to have a significant impact on our financial statementsor disclosures. We adopted the new standard effective January 1, 2018.
In August 2017, the FASB issued ASU 2017-12, Derivativesand Hedging (Topic 815): Targeted Improvements to Accounting forHedging Activities. This ASU will make more financial and nonfinancialhedging strategies eligible for hedge accounting. It also amends thepresentation and disclosure requirements and changes how companiesassess effectiveness. It is intended to more closely align hedgeaccounting with a company’s risk management strategies, simplifythe application of hedge accounting, and increase transparency as tothe scope and results of hedging programs. The provisions of this ASUare effective for years beginning after December 15, 2018, with earlyadoption permitted for any interim period after issuance of the ASU.We do not expect this ASU to have a significant impact on our results ofoperations or financial position. We adopted the new standard effectiveJanuary 1, 2018.
NOTE 2: BUSINESS ACQUISITIONS, DISPOSITIONS, GOODWILLAND INTANGIBLE ASSETS
Business Acquisitions and Dispositions. Our investments in busi-nesses in 2017, 2016 and 2015 totaled $231 million, $712 million(including debt assumed of $2 million) and $556 million (including debtassumed of $18 million), respectively. Our investments in businesses in2017 consisted of a number of small acquisitions, primarily in our com-mercial businesses. Our investments in businesses in 2016 consisted ofthe acquisition of a majority interest in an Italian heating products andservices company by UTC Climate, Controls & Security, the acquisitionof a Japanese services company by Otis and a number of small acquisi-tions, primarily in our commercial businesses. Our investments inbusinesses in 2015 consisted of the acquisition of the majority interestin a UTC Climate, Controls & Security business, the acquisition of animaging technology company by UTC Aerospace Systems, and a num-ber of small acquisitions, primarily in our commercial businesses.
On September 4, 2017, we announced that we had entered into amerger agreement with Rockwell Collins, Inc. (Rockwell Collins), underwhich we agreed to acquire Rockwell Collins. Under the terms of themerger agreement, each Rockwell Collins shareowner will receive$93.33 per share in cash and a fraction of a share of UTC commonstock equal to the quotient obtained by dividing $46.67 by the averageof the volume-weighted average prices per share of UTC commonstock on the NYSE on each of the 20 consecutive trading days endingwith the trading day immediately prior to the closing date, (the “UTCStock Price”), subject to adjustment based on a two-way collar mecha-nism as described below (the “Stock Consideration”). The cash andUTC stock payable in exchange for each such share of Rockwell Collinscommon stock are collectively the “Merger Consideration.” The fractionof a share of UTC common stock into which each such share of
Notes to Consolidated Financial Statements
46 2017 Annual Report
Rockwell Collins common stock will be converted is the “ExchangeRatio.” The Exchange Ratio will be determined based upon the UTCStock Price. If the UTC Stock Price is greater than $107.01 but lessthan $124.37, the Exchange Ratio will be equal to the quotient of (i)$46.67 divided by (ii) the UTC Stock Price, which, in each case, willresult in the Stock Consideration having a value equal to $46.67. If theUTC Stock Price is less than or equal to $107.01 or greater than orequal to $124.37, then a two-way collar mechanism will apply, pursuantto which, (x) if the UTC Stock Price is greater than or equal to $124.37,the Exchange Ratio will be fixed at 0.37525 and the value of the StockConsideration will be greater than $46.67, and (y) if the UTC Stock Priceis less than or equal to $107.01, the Exchange Ratio will be fixed at0.43613 and the value of the Stock Consideration will be less than$46.67. On January 11, 2018, the merger was approved by RockwellCollins’ shareowners. We currently expect that the merger will be com-pleted in the third quarter of 2018, subject to customary closingconditions, including the receipt of required regulatory approvals.
We anticipate that approximately $15 billion will be required topay the aggregate cash portion of the Merger Consideration. We expectto fund the cash portion of the Merger Consideration through debtissuances and cash on hand. Additionally, we have entered into a$6.5 billion 364-day unsecured bridge loan credit agreement that wouldbe funded only to the extent certain anticipated debt issuances are notcompleted prior to the completion of the merger. We expect to assumeapproximately $7 billion of Rockwell Collins’ outstanding debt uponcompletion of the merger.
As discussed further in Note 3, on November 6, 2015, we com-pleted the sale of Sikorsky to Lockheed Martin Corp. for approximately$9.1 billion in cash.
Goodwill. The changes in the carrying amount of goodwill, bysegment, in 2017 are as follows:
(DOLLARS IN MILLIONS)
Balance as ofJanuary 1,
2017
Goodwillresulting from
businesscombinations
Foreigncurrency
translationand other
Balance as ofDecember 31,
2017
Otis $ 1,575 $ 28 $ 134 $ 1,737
UTC Climate, Controls& Security 9,487 130 392 10,009
Pratt & Whitney 1,511 — — 1,511
UTC Aerospace Systems 14,483 — 167 14,650
Total Segments 27,056 158 693 27,907
Eliminations and other 3 — — 3
Total $ 27,059 $ 158 $ 693 $ 27,910
Intangible Assets. Identifiable intangible assets are comprised ofthe following:
2017 2016
(DOLLARS IN MILLIONS)Gross
AmountAccumulatedAmortization
GrossAmount
AccumulatedAmortization
Amortized:
Service portfolios $ 2,178 $ (1,534) $ 1,995 $ (1,344)
Patents and trademarks 399 (233) 378 (201)
Collaboration intangibleassets 4,109 (384) 3,724 (211)
Customer relationshipsand other 13,352 (4,100) 12,798 (3,480)
20,038 (6,251) 18,895 (5,236)
Unamortized:
Trademarks and other 2,096 — 2,025 —
Total $ 22,134 $ (6,251) $ 20,920 $ (5,236)
Customer relationship intangible assets include payments made toour customers to secure certain contractual rights. Such payments arecapitalized when distinct rights are obtained and sufficient incrementalcash flows to support the recoverability of the assets have been estab-lished. Otherwise, the applicable portion of the payments is expensed.We amortize these intangible assets based on the underlying pattern ofeconomic benefit, which may result in an amortization method otherthan straight-line. In the aerospace industry, amortization based on thepattern of economic benefit generally results in lower amortizationexpense during the development period with amortization expenseincreasing as programs enter full production and aftermarket cycles. If apattern of economic benefit cannot be reliably determined, a straight-line amortization method is used. We classify amortization of suchpayments as a reduction of sales. Amortization of intangible assets was$834 million, $778 million and $722 million in 2017, 2016 and 2015,respectively. The collaboration intangible assets are amortized basedupon the pattern of economic benefits as represented by the underlyingcash flows. The following is the expected amortization of intangibleassets for 2018 through 2022, which reflects the pattern of expectedeconomic benefit on certain aerospace intangible assets:
(DOLLARS IN MILLIONS) 2018 2019 2020 2021 2022
Amortization expense $ 902 $ 869 $ 888 $ 902 $ 895
Notes to Consolidated Financial Statements
United Technologies Corporation 47
NOTE 3: DISCONTINUED OPERATIONS
On November 6, 2015, we completed the sale of Sikorsky to LockheedMartin Corp. for $9.1 billion in cash. Accordingly, the results of opera-tions and the cash flows related to Sikorsky have been classified inDiscontinued Operations in our Consolidated Statements of Operations,Comprehensive Income and Cash Flows for all periods presented. In2016, we recognized approximately $13 million of additional gain on thedisposal, primarily resulting from the settlement of working capitaladjustments. In 2016, we recognized approximately $24 million ofincome tax expense, including the impacts related to filing Sikorsky’s2015 tax returns. Net cash outflows from discontinued operations ofapproximately $2.5 billion for the year ended December 31, 2016 wereprimarily due to the payment of taxes related to the 2015 gain realizedon the sale of Sikorsky.
UTC and its business segments have historically had sales toSikorsky and purchases from Sikorsky, in the normal course of busi-ness, which were eliminated in consolidation. Net sales to Sikorskywere $138 million and net purchases from Sikorsky included in cost ofproducts and services sold were $25 million for the year endedDecember 31, 2015.
NOTE 4: EARNINGS PER SHARE
(DOLLARS IN MILLIONS, EXCEPT PER SHAREAMOUNTS; SHARES IN MILLIONS) 2017 2016 2015
Net income attributable to commonshareowners:
Net income from continuing operations $ 4,552 $ 5,065 $ 3,996
Net (loss) income from discontinuedoperations — (10) 3,612
Net income attributable to commonshareowners $ 4,552 $ 5,055 $ 7,608
Basic weighted average number of sharesoutstanding 790.0 818.2 872.7
Stock awards 9.1 7.9 10.5
Diluted weighted average number of sharesoutstanding 799.1 826.1 883.2
Earnings Per Share of Common Stock — Basic:
Net income from continuing operations $ 5.76 $ 6.19 $ 4.58
Net (loss) income from discontinuedoperations — (0.01) 4.14
Net income attributable to commonshareowners 5.76 6.18 8.72
Earnings Per Share of Common Stock — Diluted:
Net income from continuing operations $ 5.70 $ 6.13 $ 4.53
Net (loss) income from discontinuedoperations — (0.01) 4.09
Net income attributable to commonshareowners 5.70 6.12 8.61
The computation of diluted earnings per share excludes the effectof the potential exercise of stock awards, including stock appreciation
rights and stock options, when the average market price of the com-mon stock is lower than the exercise price of the related stock awardsduring the period. These outstanding stock awards are not included inthe computation of diluted earnings per share because the effectwould have been anti-dilutive. For 2017, 2016 and 2015, there were5.9 million, 14.5 million and 9.7 million anti-dilutive stock awardsexcluded from the computation, respectively.
NOTE 5: COMMERCIAL AEROSPACE INDUSTRY ASSETS ANDCOMMITMENTS
We have receivables and other financing assets with commercial aero-space industry customers totaling $9,477 million and $7,222 million atDecember 31, 2017 and 2016, respectively. These include customerfinancing assets related to commercial aerospace industry customers,consisting of products under lease of $1,913 million and $939 million,and notes and leases receivable of $652 million and $497 million, atDecember 31, 2017 and 2016, respectively.
Aircraft financing commitments, in the form of debt or lease financ-ing, are provided to commercial aerospace customers. The extent towhich the financing commitments will be utilized is not currently known,since customers may be able to obtain more favorable terms from otherfinancing sources. We may also arrange for third-party investors toassume a portion of these commitments. If financing commitments areexercised, debt financing is generally secured by assets with fair marketvalues equal to or exceeding the financed amounts consistent with mar-ket terms and conditions. We may also lease aircraft and subsequentlysublease the aircraft to customers under long-term non-cancelableoperating leases. Our financing commitments with customers arecontingent upon maintenance of certain levels of financial condition bythe customers.
We have also made residual value and other guarantees related tovarious commercial aerospace customer financing arrangements. Theestimated fair market values of the guaranteed assets equal or exceedthe value of the related guarantees, net of existing reserves. We haveresidual value and other guarantees of $336 million as of December 31,2017. Refer to Note 17 to the Consolidated Financial Statements foradditional discussion on guarantees.
We also have other contractual commitments, including commit-ments to secure certain contractual rights to provide product on newaircraft platforms, which are included in “Other commercial aerospacecommitments” in the table below. Payments made on these contractualcommitments are included within other intangible assets and are to beamortized over the term of underlying economic benefit. Our commer-cial aerospace financing and other contractual commitments as ofDecember 31, 2017 were approximately $15.3 billion. We have enteredinto certain collaboration arrangements, which may include participationby our collaboration partners in these commitments.
Notes to Consolidated Financial Statements
48 2017 Annual Report
The following is the expected maturity of commercial aerospace industry assets and commitments as of December 31, 2017:
(DOLLARS IN MILLIONS) Committed 2018 2019 2020 2021 2022 Thereafter
Notes and leases receivable $ 652 $ 211 $ 56 $ 79 $ 38 $ 35 $ 233
Commercial aerospace financing commitments $ 4,012 $ 371 $ 678 $ 636 $ 891 $ 783 $ 653
Other commercial aerospace commitments 11,270 910 840 684 735 645 7,456
Collaboration partners’ share (5,109) (374) (402) (396) (525) (491) (2,921)
Total commercial commitments $ 10,173 $ 907 $ 1,116 $ 924 $ 1,101 $ 937 $ 5,188
In connection with our 2012 agreement to acquire Rolls-Royce’sownership and collaboration interests in IAE, additional payments aredue to Rolls-Royce contingent upon each hour flown through June2027 by the V2500-powered aircraft in service as of the acquisitiondate. These flight hour payments, included in “Other commercial aero-space commitments” in the table above, are being capitalized ascollaboration intangible assets.
We have long-term aftermarket maintenance contracts with com-mercial aerospace industry customers for which revenue is recognizedin proportion to actual costs incurred relative to total expected coststo be incurred over the respective contract periods. Billings, however,are typically based on factors such as engine flight hours. The timingdifferences between the billings and the maintenance costs incurredgenerates both unbilled receivables and deferred revenues. Unbilledreceivables under these long-term aftermarket contracts totaled$1,109 million and $1,169 million at December 31, 2017 and 2016,respectively, and are included in “Accounts receivable” and “Otherassets” in the accompanying Consolidated Balance Sheet. Deferredrevenues generated totaled $5,048 million and $4,288 million atDecember 31, 2017 and 2016, respectively, and are included in“Accrued liabilities” and “Other long-term liabilities” in the accompanyingConsolidated Balance Sheet.
Reserves related to aerospace receivables and financing assetswere $175 million and $173 million at December 31, 2017 and 2016,respectively. Reserves related to financing commitments and guaran-tees were $23 million and $36 million at December 31, 2017 and 2016,respectively.
In addition, in connection with the 2012 Goodrich acquisition, werecorded assumed liabilities of approximately $2.2 billion related to cus-tomer contractual obligations on certain OEM development programswhere the expected costs exceeded the expected revenue undercontract. These liabilities are being liquidated in accordance with theunderlying economic pattern of obligations, as reflected by the net cashoutflows incurred on the OEM contracts. Total consumption of the con-tractual obligations for the years ended December 31, 2017 and 2016was approximately $217 million and $213 million, respectively. Thebalance of the contractual obligations at December 31, 2017 was$986 million, with future consumption expected to be as follows:$257 million in 2018, $229 million in 2019, $150 million in 2020,$84 million in 2021, $37 million in 2022 and $229 million thereafter.
NOTE 6: INVENTORIES & CONTRACTS IN PROGRESS
(DOLLARS IN MILLIONS) 2017 2016
Raw materials $ 2,038 $ 2,040
Work-in-process 3,366 2,787
Finished goods 3,845 3,305
Contracts in progress 10,205 9,395
19,454 17,527
Less:
Progress payments, secured by lien, on U.S. Governmentcontracts (236) (130)
Billings on contracts in progress (9,337) (8,693)
$ 9,881 $ 8,704
Raw materials, work-in-process and finished goods are net of valu-ation reserves of $1,107 million and $877 million as of December 31,2017 and 2016, respectively. Contracts in progress principally relate toelevator and escalator contracts and include costs of manufacturedcomponents, accumulated installation costs and estimated earnings onincomplete contracts.
Inventories also include capitalized contract development costsrelated to certain aerospace programs at UTC Aerospace Systems.As of December 31, 2017 and 2016, these capitalized costs were$127 million and $140 million, respectively, which will be liquidatedas production units are delivered to customers. Within commercialaerospace, inventory costs attributable to new engine offerings arerecognized based on the average cost per unit expected over the lifeof each contract using the units-of-delivery method of percentage ofcompletion accounting. Under this method, costs of initial engine deliv-eries in excess of the projected contract per unit average cost arecapitalized, and these capitalized amounts are subsequently expensedas additional engine deliveries occur for engines with costs below theprojected contract per unit average cost over the life of the contract. Asof December 31, 2017 and 2016, inventory included $438 million and$233 million, respectively, of such capitalized amounts. See Note 1 forfurther discussion regarding the impact from the adoption of the NewRevenue Standard effective January 1, 2018.
Our sales contracts in many cases are long-term contractsexpected to be performed over periods exceeding 12 months. AtDecember 31, 2017 and 2016, approximately 63% and 68% respec-tively, of total inventories and contracts in progress have been acquiredor manufactured under such long-term contracts, with approximately38% and 41% scheduled for delivery within the succeeding 12 monthsfor 2017 and 2016, respectively.
Notes to Consolidated Financial Statements
United Technologies Corporation 49
NOTE 7: FIXED ASSETS
(DOLLARS IN MILLIONS)Estimated
Useful Lives 2017 2016
Land $ 412 $ 392
Buildings and improvements 12 - 40 years 5,727 5,180
Machinery, tools and equipment 3 - 20 years 13,476 12,471
Other, including assets under construction 1,749 1,426
21,364 19,469
Accumulated depreciation (11,178) (10,311)
$ 10,186 $ 9,158
Depreciation expense was $1,178 million in 2017, $1,105 million in2016 and $1,068 million in 2015.
NOTE 8: ACCRUED LIABILITIES
(DOLLARS IN MILLIONS) 2017 2016
Advances on sales contracts and service billings $ 4,547 $ 4,217
Accrued salaries, wages and employee benefits 1,741 1,608
Service and warranty accruals 629 555
Interest payable 439 395
Litigation and contract matters 435 488
Income taxes payable 285 382
Accrued property, sales and use taxes 258 289
Canadian government settlement — current portion 217 245
Accrued restructuring costs 212 210
Accrued workers compensation 204 208
Other 3,349 3,622
$ 12,316 $ 12,219
On December 30, 2015, P&WC and federal and provincialCanadian government agencies entered into amendments of certaingovernment research and development support arrangements. Underthe amendments, P&WC agreed to make four annual payments ofapproximately $327 million Canadian (approximately $256 million atDecember 2017), commencing in the first quarter of 2016, to fully settleand terminate P&WC’s future contractual obligations to pay royalties tothese agencies that had previously been contingent upon future enginedeliveries and P&WC sales; to maintain its commitments to perform cer-tain assembly, test and manufacturing operations in Canada; and toprovide support of innovation and research and development throughinitiatives with post-secondary institutions and key industry associationsin Canada over a 14 year period. As a result of the amendments tothese contractual arrangements, Pratt & Whitney recorded a chargeand related discounted obligation of $867 million in the fourth quarterof 2015.
The Canadian government settlement included in the tableabove represents amounts expected to be paid under this agreementin 2018, with the remaining accrual of approximately $256 million and$477 million included in Other long-term liabilities in the accompanyingConsolidated Balance Sheet as of December 31, 2017 and 2016,respectively.
NOTE 9: BORROWINGS AND LINES OF CREDIT
(DOLLARS IN MILLIONS) 2017 2016
Short-term borrowings:
Commercial paper $ 300 $ 522
Other borrowings 92 79
Total short-term borrowings $ 392 $ 601
At December 31, 2017, we had revolving credit agreements withvarious banks permitting aggregate borrowings of up to $4.35 billionpursuant to a $2.20 billion revolving credit agreement and a $2.15 billionmulticurrency revolving credit agreement, both of which expire inAugust 2021. As of December 31, 2017, there were no borrowingsunder either of these agreements. The undrawn portions of theserevolving credit agreements are also available to serve as backup facili-ties for the issuance of commercial paper. As of December 31, 2017,our maximum commercial paper borrowing limit was $4.35 billion. Wehad no Euro-denominated commercial paper borrowings outstandingat December 31, 2017. We use our commercial paper borrowings forgeneral corporate purposes, including the funding of potential acquisi-tions, discretionary pension contributions, debt refinancing, dividendpayments and repurchases of our common stock. The need for com-mercial paper borrowings arises when the use of domestic cash forgeneral corporate purposes exceeds the sum of domestic cash genera-tion and foreign cash repatriated to the U.S.
At December 31, 2017, approximately $1.3 billion was availableunder short-term lines of credit with local banks at our various domesticand international subsidiaries. The weighted-average interest ratesapplicable to short-term borrowings and total debt were as follows:
2017 2016
Average interest expense rate — average outstandingborrowings during the year:
Short-term borrowings 1.1% 1.3%
Total debt 3.5% 4.1%
Average interest expense rate — outstanding borrowings asof December 31:
Short-term borrowings 2.3% 0.6%
Total debt 3.5% 3.7%
Notes to Consolidated Financial Statements
50 2017 Annual Report
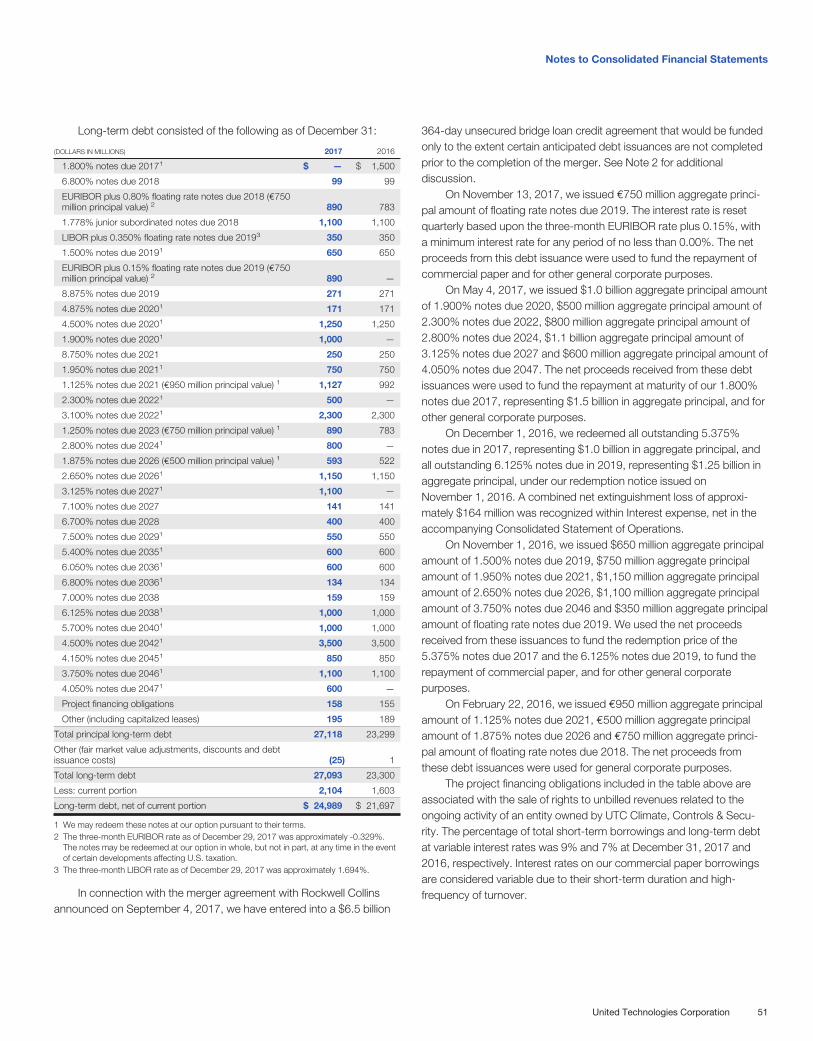
Long-term debt consisted of the following as of December 31:
(DOLLARS IN MILLIONS) 2017 2016
1.800% notes due 20171 $ — $ 1,500
6.800% notes due 2018 99 99
EURIBOR plus 0.80% floating rate notes due 2018 (e750million principal value) 2 890 783
1.778% junior subordinated notes due 2018 1,100 1,100
LIBOR plus 0.350% floating rate notes due 20193 350 350
1.500% notes due 20191 650 650
EURIBOR plus 0.15% floating rate notes due 2019 (e750million principal value) 2 890 —
8.875% notes due 2019 271 271
4.875% notes due 20201 171 171
4.500% notes due 20201 1,250 1,250
1.900% notes due 20201 1,000 —
8.750% notes due 2021 250 250
1.950% notes due 20211 750 750
1.125% notes due 2021 (e950 million principal value) 1 1,127 992
2.300% notes due 20221 500 —
3.100% notes due 20221 2,300 2,300
1.250% notes due 2023 (e750 million principal value) 1 890 783
2.800% notes due 20241 800 —
1.875% notes due 2026 (e500 million principal value) 1 593 522
2.650% notes due 20261 1,150 1,150
3.125% notes due 20271 1,100 —
7.100% notes due 2027 141 141
6.700% notes due 2028 400 400
7.500% notes due 20291 550 550
5.400% notes due 20351 600 600
6.050% notes due 20361 600 600
6.800% notes due 20361 134 134
7.000% notes due 2038 159 159
6.125% notes due 20381 1,000 1,000
5.700% notes due 20401 1,000 1,000
4.500% notes due 20421 3,500 3,500
4.150% notes due 20451 850 850
3.750% notes due 20461 1,100 1,100
4.050% notes due 20471 600 —
Project financing obligations 158 155
Other (including capitalized leases) 195 189
Total principal long-term debt 27,118 23,299
Other (fair market value adjustments, discounts and debtissuance costs) (25) 1
Total long-term debt 27,093 23,300
Less: current portion 2,104 1,603
Long-term debt, net of current portion $ 24,989 $ 21,697
1 We may redeem these notes at our option pursuant to their terms.2 The three-month EURIBOR rate as of December 29, 2017 was approximately -0.329%.
The notes may be redeemed at our option in whole, but not in part, at any time in the eventof certain developments affecting U.S. taxation.
3 The three-month LIBOR rate as of December 29, 2017 was approximately 1.694%.
In connection with the merger agreement with Rockwell Collinsannounced on September 4, 2017, we have entered into a $6.5 billion
364-day unsecured bridge loan credit agreement that would be fundedonly to the extent certain anticipated debt issuances are not completedprior to the completion of the merger. See Note 2 for additionaldiscussion.
On November 13, 2017, we issued e750 million aggregate princi-pal amount of floating rate notes due 2019. The interest rate is resetquarterly based upon the three-month EURIBOR rate plus 0.15%, witha minimum interest rate for any period of no less than 0.00%. The netproceeds from this debt issuance were used to fund the repayment ofcommercial paper and for other general corporate purposes.
On May 4, 2017, we issued $1.0 billion aggregate principal amountof 1.900% notes due 2020, $500 million aggregate principal amount of2.300% notes due 2022, $800 million aggregate principal amount of2.800% notes due 2024, $1.1 billion aggregate principal amount of3.125% notes due 2027 and $600 million aggregate principal amount of4.050% notes due 2047. The net proceeds received from these debtissuances were used to fund the repayment at maturity of our 1.800%notes due 2017, representing $1.5 billion in aggregate principal, and forother general corporate purposes.
On December 1, 2016, we redeemed all outstanding 5.375%notes due in 2017, representing $1.0 billion in aggregate principal, andall outstanding 6.125% notes due in 2019, representing $1.25 billion inaggregate principal, under our redemption notice issued onNovember 1, 2016. A combined net extinguishment loss of approxi-mately $164 million was recognized within Interest expense, net in theaccompanying Consolidated Statement of Operations.
On November 1, 2016, we issued $650 million aggregate principalamount of 1.500% notes due 2019, $750 million aggregate principalamount of 1.950% notes due 2021, $1,150 million aggregate principalamount of 2.650% notes due 2026, $1,100 million aggregate principalamount of 3.750% notes due 2046 and $350 million aggregate principalamount of floating rate notes due 2019. We used the net proceedsreceived from these issuances to fund the redemption price of the5.375% notes due 2017 and the 6.125% notes due 2019, to fund therepayment of commercial paper, and for other general corporatepurposes.
On February 22, 2016, we issued e950 million aggregate principalamount of 1.125% notes due 2021, e500 million aggregate principalamount of 1.875% notes due 2026 and e750 million aggregate princi-pal amount of floating rate notes due 2018. The net proceeds fromthese debt issuances were used for general corporate purposes.
The project financing obligations included in the table above areassociated with the sale of rights to unbilled revenues related to theongoing activity of an entity owned by UTC Climate, Controls & Secu-rity. The percentage of total short-term borrowings and long-term debtat variable interest rates was 9% and 7% at December 31, 2017 and2016, respectively. Interest rates on our commercial paper borrowingsare considered variable due to their short-term duration and high-frequency of turnover.
Notes to Consolidated Financial Statements
United Technologies Corporation 51
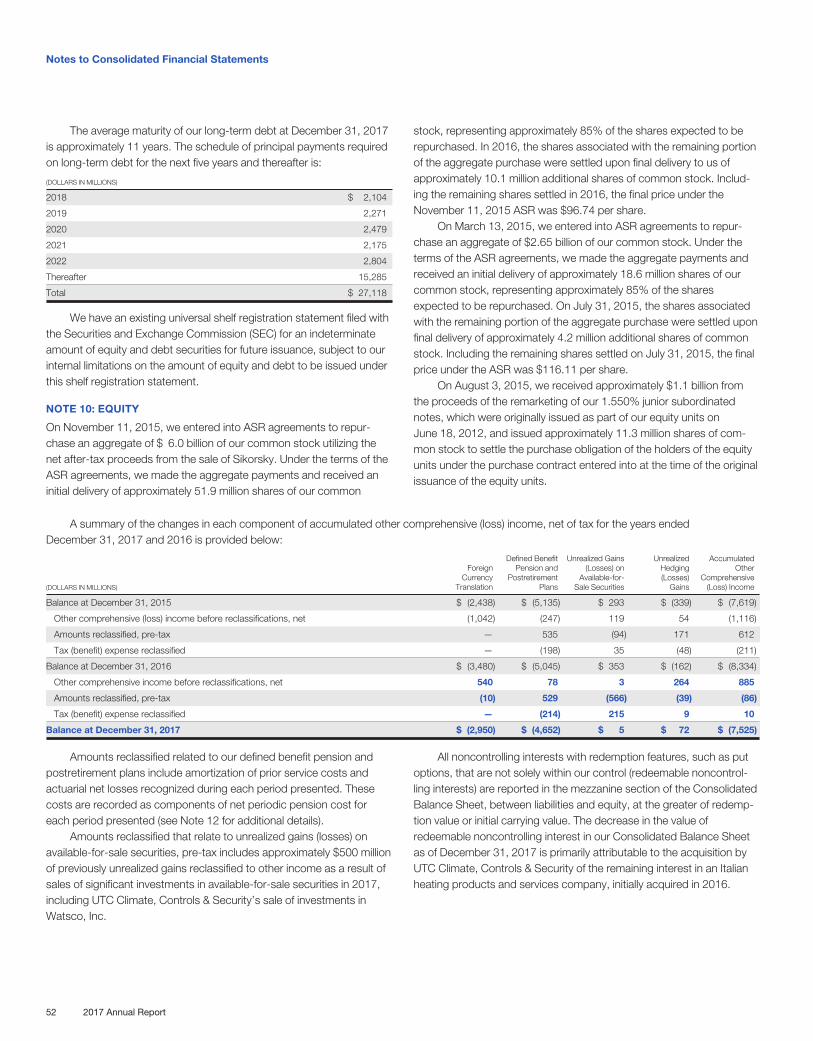
The average maturity of our long-term debt at December 31, 2017is approximately 11 years. The schedule of principal payments requiredon long-term debt for the next five years and thereafter is:
(DOLLARS IN MILLIONS)
2018 $ 2,104
2019 2,271
2020 2,479
2021 2,175
2022 2,804
Thereafter 15,285
Total $ 27,118
We have an existing universal shelf registration statement filed withthe Securities and Exchange Commission (SEC) for an indeterminateamount of equity and debt securities for future issuance, subject to ourinternal limitations on the amount of equity and debt to be issued underthis shelf registration statement.
NOTE 10: EQUITY
On November 11, 2015, we entered into ASR agreements to repur-chase an aggregate of $ 6.0 billion of our common stock utilizing thenet after-tax proceeds from the sale of Sikorsky. Under the terms of theASR agreements, we made the aggregate payments and received aninitial delivery of approximately 51.9 million shares of our common
stock, representing approximately 85% of the shares expected to berepurchased. In 2016, the shares associated with the remaining portionof the aggregate purchase were settled upon final delivery to us ofapproximately 10.1 million additional shares of common stock. Includ-ing the remaining shares settled in 2016, the final price under theNovember 11, 2015 ASR was $96.74 per share.
On March 13, 2015, we entered into ASR agreements to repur-chase an aggregate of $2.65 billion of our common stock. Under theterms of the ASR agreements, we made the aggregate payments andreceived an initial delivery of approximately 18.6 million shares of ourcommon stock, representing approximately 85% of the sharesexpected to be repurchased. On July 31, 2015, the shares associatedwith the remaining portion of the aggregate purchase were settled uponfinal delivery of approximately 4.2 million additional shares of commonstock. Including the remaining shares settled on July 31, 2015, the finalprice under the ASR was $116.11 per share.
On August 3, 2015, we received approximately $1.1 billion fromthe proceeds of the remarketing of our 1.550% junior subordinatednotes, which were originally issued as part of our equity units onJune 18, 2012, and issued approximately 11.3 million shares of com-mon stock to settle the purchase obligation of the holders of the equityunits under the purchase contract entered into at the time of the originalissuance of the equity units.
A summary of the changes in each component of accumulated other comprehensive (loss) income, net of tax for the years endedDecember 31, 2017 and 2016 is provided below:
(DOLLARS IN MILLIONS)
ForeignCurrency
Translation
Defined BenefitPension and
PostretirementPlans
Unrealized Gains(Losses) on
Available-for-Sale Securities
UnrealizedHedging(Losses)
Gains
AccumulatedOther
Comprehensive(Loss) Income
Balance at December 31, 2015 $ (2,438) $ (5,135) $ 293 $ (339) $ (7,619)
Other comprehensive (loss) income before reclassifications, net (1,042) (247) 119 54 (1,116)
Amounts reclassified, pre-tax — 535 (94) 171 612
Tax (benefit) expense reclassified — (198) 35 (48) (211)
Balance at December 31, 2016 $ (3,480) $ (5,045) $ 353 $ (162) $ (8,334)
Other comprehensive income before reclassifications, net 540 78 3 264 885
Amounts reclassified, pre-tax (10) 529 (566) (39) (86)
Tax (benefit) expense reclassified — (214) 215 9 10
Balance at December 31, 2017 $ (2,950) $ (4,652) $ 5 $ 72 $ (7,525)
Amounts reclassified related to our defined benefit pension andpostretirement plans include amortization of prior service costs andactuarial net losses recognized during each period presented. Thesecosts are recorded as components of net periodic pension cost foreach period presented (see Note 12 for additional details).
Amounts reclassified that relate to unrealized gains (losses) onavailable-for-sale securities, pre-tax includes approximately $500 millionof previously unrealized gains reclassified to other income as a result ofsales of significant investments in available-for-sale securities in 2017,including UTC Climate, Controls & Security’s sale of investments inWatsco, Inc.
All noncontrolling interests with redemption features, such as putoptions, that are not solely within our control (redeemable noncontrol-ling interests) are reported in the mezzanine section of the ConsolidatedBalance Sheet, between liabilities and equity, at the greater of redemp-tion value or initial carrying value. The decrease in the value ofredeemable noncontrolling interest in our Consolidated Balance Sheetas of December 31, 2017 is primarily attributable to the acquisition byUTC Climate, Controls & Security of the remaining interest in an Italianheating products and services company, initially acquired in 2016.
Notes to Consolidated Financial Statements
52 2017 Annual Report
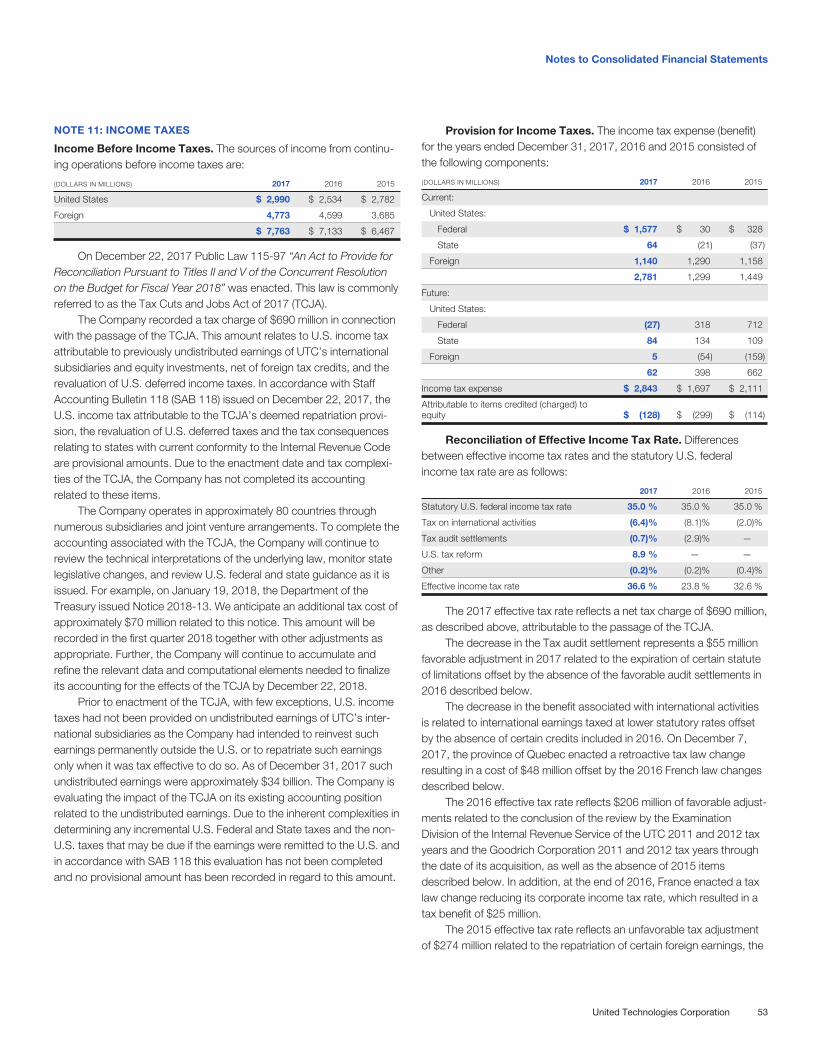
NOTE 11: INCOME TAXES
Income Before Income Taxes. The sources of income from continu-ing operations before income taxes are:
(DOLLARS IN MILLIONS) 2017 2016 2015
United States $ 2,990 $ 2,534 $ 2,782
Foreign 4,773 4,599 3,685
$ 7,763 $ 7,133 $ 6,467
On December 22, 2017 Public Law 115-97 “An Act to Provide forReconciliation Pursuant to Titles II and V of the Concurrent Resolutionon the Budget for Fiscal Year 2018” was enacted. This law is commonlyreferred to as the Tax Cuts and Jobs Act of 2017 (TCJA).
The Company recorded a tax charge of $690 million in connectionwith the passage of the TCJA. This amount relates to U.S. income taxattributable to previously undistributed earnings of UTC’s internationalsubsidiaries and equity investments, net of foreign tax credits, and therevaluation of U.S. deferred income taxes. In accordance with StaffAccounting Bulletin 118 (SAB 118) issued on December 22, 2017, theU.S. income tax attributable to the TCJA’s deemed repatriation provi-sion, the revaluation of U.S. deferred taxes and the tax consequencesrelating to states with current conformity to the Internal Revenue Codeare provisional amounts. Due to the enactment date and tax complexi-ties of the TCJA, the Company has not completed its accountingrelated to these items.
The Company operates in approximately 80 countries throughnumerous subsidiaries and joint venture arrangements. To complete theaccounting associated with the TCJA, the Company will continue toreview the technical interpretations of the underlying law, monitor statelegislative changes, and review U.S. federal and state guidance as it isissued. For example, on January 19, 2018, the Department of theTreasury issued Notice 2018-13. We anticipate an additional tax cost ofapproximately $70 million related to this notice. This amount will berecorded in the first quarter 2018 together with other adjustments asappropriate. Further, the Company will continue to accumulate andrefine the relevant data and computational elements needed to finalizeits accounting for the effects of the TCJA by December 22, 2018.
Prior to enactment of the TCJA, with few exceptions, U.S. incometaxes had not been provided on undistributed earnings of UTC’s inter-national subsidiaries as the Company had intended to reinvest suchearnings permanently outside the U.S. or to repatriate such earningsonly when it was tax effective to do so. As of December 31, 2017 suchundistributed earnings were approximately $34 billion. The Company isevaluating the impact of the TCJA on its existing accounting positionrelated to the undistributed earnings. Due to the inherent complexities indetermining any incremental U.S. Federal and State taxes and the non-U.S. taxes that may be due if the earnings were remitted to the U.S. andin accordance with SAB 118 this evaluation has not been completedand no provisional amount has been recorded in regard to this amount.
Provision for Income Taxes. The income tax expense (benefit)for the years ended December 31, 2017, 2016 and 2015 consisted ofthe following components:
(DOLLARS IN MILLIONS) 2017 2016 2015
Current:
United States:
Federal $ 1,577 $ 30 $ 328
State 64 (21) (37)
Foreign 1,140 1,290 1,158
2,781 1,299 1,449
Future:
United States:
Federal (27) 318 712
State 84 134 109
Foreign 5 (54) (159)
62 398 662
Income tax expense $ 2,843 $ 1,697 $ 2,111
Attributable to items credited (charged) toequity $ (128) $ (299) $ (114)
Reconciliation of Effective Income Tax Rate. Differencesbetween effective income tax rates and the statutory U.S. federalincome tax rate are as follows:
2017 2016 2015
Statutory U.S. federal income tax rate 35.0 % 35.0 % 35.0 %
Tax on international activities (6.4)% (8.1)% (2.0)%
Tax audit settlements (0.7)% (2.9)% —
U.S. tax reform 8.9 % — —
Other (0.2)% (0.2)% (0.4)%
Effective income tax rate 36.6 % 23.8 % 32.6 %
The 2017 effective tax rate reflects a net tax charge of $690 million,as described above, attributable to the passage of the TCJA.
The decrease in the Tax audit settlement represents a $55 millionfavorable adjustment in 2017 related to the expiration of certain statuteof limitations offset by the absence of the favorable audit settlements in2016 described below.
The decrease in the benefit associated with international activitiesis related to international earnings taxed at lower statutory rates offsetby the absence of certain credits included in 2016. On December 7,2017, the province of Quebec enacted a retroactive tax law changeresulting in a cost of $48 million offset by the 2016 French law changesdescribed below.
The 2016 effective tax rate reflects $206 million of favorable adjust-ments related to the conclusion of the review by the ExaminationDivision of the Internal Revenue Service of the UTC 2011 and 2012 taxyears and the Goodrich Corporation 2011 and 2012 tax years throughthe date of its acquisition, as well as the absence of 2015 itemsdescribed below. In addition, at the end of 2016, France enacted a taxlaw change reducing its corporate income tax rate, which resulted in atax benefit of $25 million.
The 2015 effective tax rate reflects an unfavorable tax adjustmentof $274 million related to the repatriation of certain foreign earnings, the
Notes to Consolidated Financial Statements
United Technologies Corporation 53
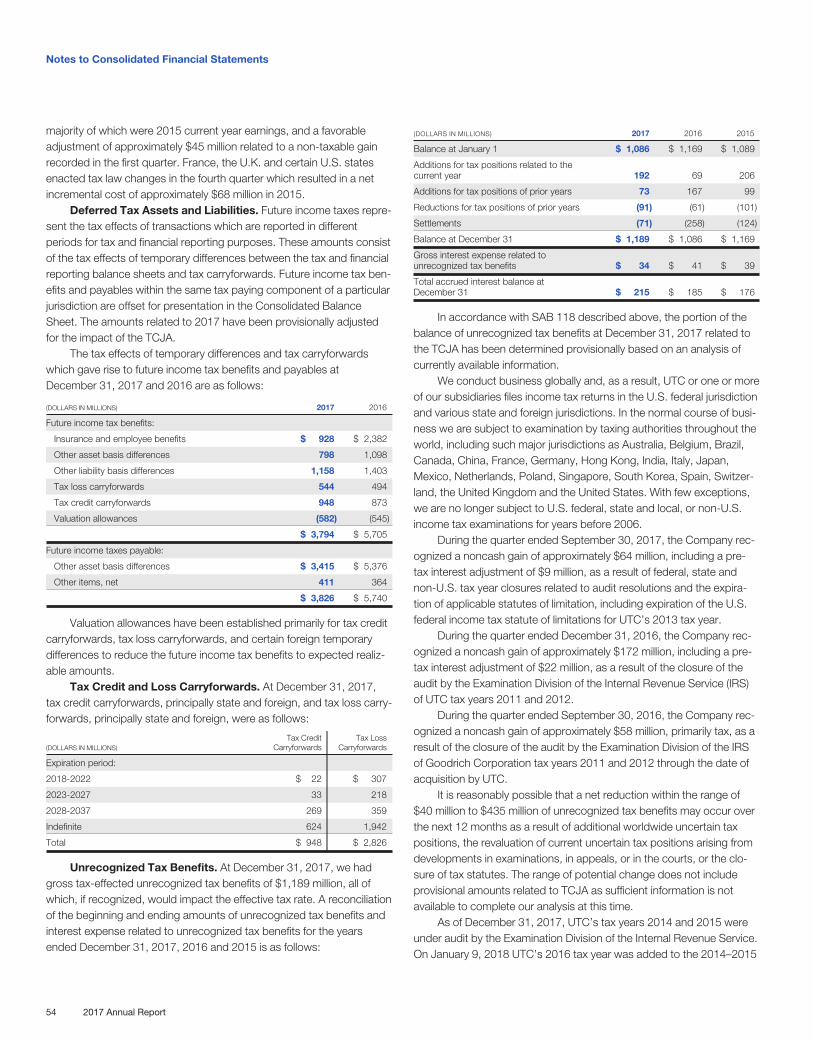
majority of which were 2015 current year earnings, and a favorableadjustment of approximately $45 million related to a non-taxable gainrecorded in the first quarter. France, the U.K. and certain U.S. statesenacted tax law changes in the fourth quarter which resulted in a netincremental cost of approximately $68 million in 2015.
Deferred Tax Assets and Liabilities. Future income taxes repre-sent the tax effects of transactions which are reported in differentperiods for tax and financial reporting purposes. These amounts consistof the tax effects of temporary differences between the tax and financialreporting balance sheets and tax carryforwards. Future income tax ben-efits and payables within the same tax paying component of a particularjurisdiction are offset for presentation in the Consolidated BalanceSheet. The amounts related to 2017 have been provisionally adjustedfor the impact of the TCJA.
The tax effects of temporary differences and tax carryforwardswhich gave rise to future income tax benefits and payables atDecember 31, 2017 and 2016 are as follows:
(DOLLARS IN MILLIONS) 2017 2016
Future income tax benefits:
Insurance and employee benefits $ 928 $ 2,382
Other asset basis differences 798 1,098
Other liability basis differences 1,158 1,403
Tax loss carryforwards 544 494
Tax credit carryforwards 948 873
Valuation allowances (582) (545)
$ 3,794 $ 5,705
Future income taxes payable:
Other asset basis differences $ 3,415 $ 5,376
Other items, net 411 364
$ 3,826 $ 5,740
Valuation allowances have been established primarily for tax creditcarryforwards, tax loss carryforwards, and certain foreign temporarydifferences to reduce the future income tax benefits to expected realiz-able amounts.
Tax Credit and Loss Carryforwards. At December 31, 2017,tax credit carryforwards, principally state and foreign, and tax loss carry-forwards, principally state and foreign, were as follows:
(DOLLARS IN MILLIONS)Tax Credit
CarryforwardsTax Loss
Carryforwards
Expiration period:
2018-2022 $ 22 $ 307
2023-2027 33 218
2028-2037 269 359
Indefinite 624 1,942
Total $ 948 $ 2,826
Unrecognized Tax Benefits. At December 31, 2017, we hadgross tax-effected unrecognized tax benefits of $1,189 million, all ofwhich, if recognized, would impact the effective tax rate. A reconciliationof the beginning and ending amounts of unrecognized tax benefits andinterest expense related to unrecognized tax benefits for the yearsended December 31, 2017, 2016 and 2015 is as follows:
(DOLLARS IN MILLIONS) 2017 2016 2015
Balance at January 1 $ 1,086 $ 1,169 $ 1,089
Additions for tax positions related to thecurrent year 192 69 206
Additions for tax positions of prior years 73 167 99
Reductions for tax positions of prior years (91) (61) (101)
Settlements (71) (258) (124)
Balance at December 31 $ 1,189 $ 1,086 $ 1,169
Gross interest expense related tounrecognized tax benefits $ 34 $ 41 $ 39
Total accrued interest balance atDecember 31 $ 215 $ 185 $ 176
In accordance with SAB 118 described above, the portion of thebalance of unrecognized tax benefits at December 31, 2017 related tothe TCJA has been determined provisionally based on an analysis ofcurrently available information.
We conduct business globally and, as a result, UTC or one or moreof our subsidiaries files income tax returns in the U.S. federal jurisdictionand various state and foreign jurisdictions. In the normal course of busi-ness we are subject to examination by taxing authorities throughout theworld, including such major jurisdictions as Australia, Belgium, Brazil,Canada, China, France, Germany, Hong Kong, India, Italy, Japan,Mexico, Netherlands, Poland, Singapore, South Korea, Spain, Switzer-land, the United Kingdom and the United States. With few exceptions,we are no longer subject to U.S. federal, state and local, or non-U.S.income tax examinations for years before 2006.
During the quarter ended September 30, 2017, the Company rec-ognized a noncash gain of approximately $64 million, including a pre-tax interest adjustment of $9 million, as a result of federal, state andnon-U.S. tax year closures related to audit resolutions and the expira-tion of applicable statutes of limitation, including expiration of the U.S.federal income tax statute of limitations for UTC’s 2013 tax year.
During the quarter ended December 31, 2016, the Company rec-ognized a noncash gain of approximately $172 million, including a pre-tax interest adjustment of $22 million, as a result of the closure of theaudit by the Examination Division of the Internal Revenue Service (IRS)of UTC tax years 2011 and 2012.
During the quarter ended September 30, 2016, the Company rec-ognized a noncash gain of approximately $58 million, primarily tax, as aresult of the closure of the audit by the Examination Division of the IRSof Goodrich Corporation tax years 2011 and 2012 through the date ofacquisition by UTC.
It is reasonably possible that a net reduction within the range of$40 million to $435 million of unrecognized tax benefits may occur overthe next 12 months as a result of additional worldwide uncertain taxpositions, the revaluation of current uncertain tax positions arising fromdevelopments in examinations, in appeals, or in the courts, or the clo-sure of tax statutes. The range of potential change does not includeprovisional amounts related to TCJA as sufficient information is notavailable to complete our analysis at this time.
As of December 31, 2017, UTC’s tax years 2014 and 2015 wereunder audit by the Examination Division of the Internal Revenue Service.On January 9, 2018 UTC’s 2016 tax year was added to the 2014–2015
Notes to Consolidated Financial Statements
54 2017 Annual Report
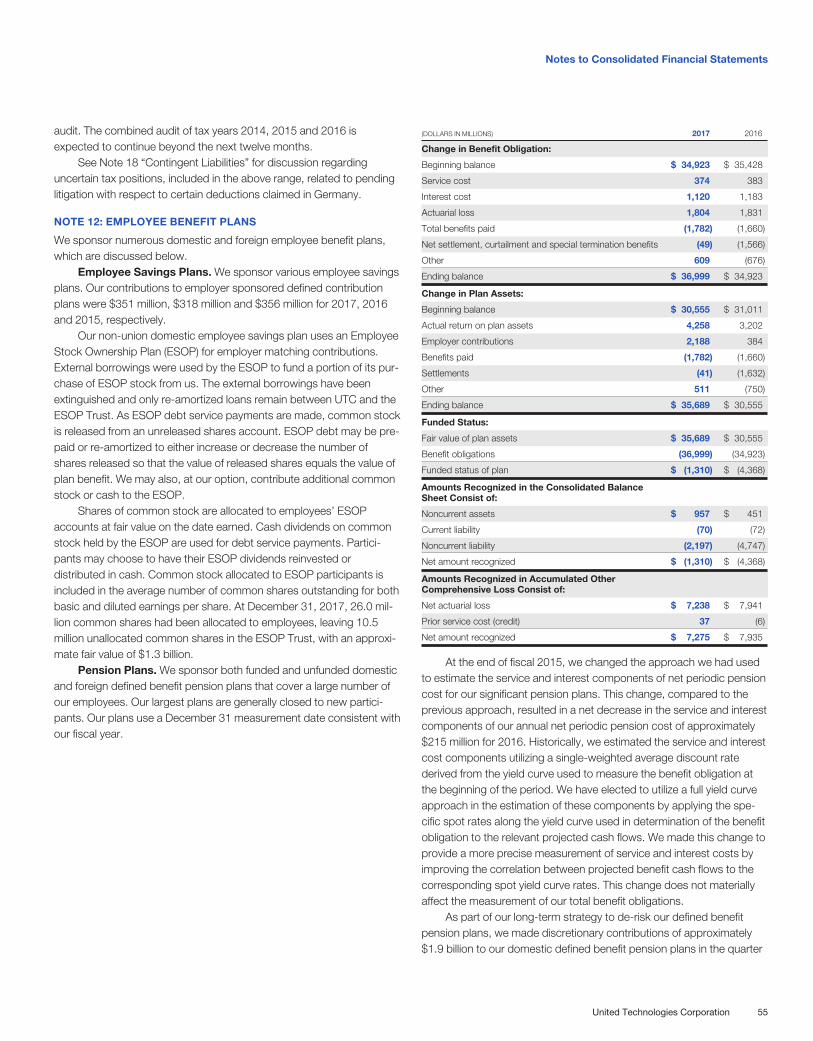
audit. The combined audit of tax years 2014, 2015 and 2016 isexpected to continue beyond the next twelve months.
See Note 18 “Contingent Liabilities” for discussion regardinguncertain tax positions, included in the above range, related to pendinglitigation with respect to certain deductions claimed in Germany.
NOTE 12: EMPLOYEE BENEFIT PLANS
We sponsor numerous domestic and foreign employee benefit plans,which are discussed below.
Employee Savings Plans. We sponsor various employee savingsplans. Our contributions to employer sponsored defined contributionplans were $351 million, $318 million and $356 million for 2017, 2016and 2015, respectively.
Our non-union domestic employee savings plan uses an EmployeeStock Ownership Plan (ESOP) for employer matching contributions.External borrowings were used by the ESOP to fund a portion of its pur-chase of ESOP stock from us. The external borrowings have beenextinguished and only re-amortized loans remain between UTC and theESOP Trust. As ESOP debt service payments are made, common stockis released from an unreleased shares account. ESOP debt may be pre-paid or re-amortized to either increase or decrease the number ofshares released so that the value of released shares equals the value ofplan benefit. We may also, at our option, contribute additional commonstock or cash to the ESOP.
Shares of common stock are allocated to employees’ ESOPaccounts at fair value on the date earned. Cash dividends on commonstock held by the ESOP are used for debt service payments. Partici-pants may choose to have their ESOP dividends reinvested ordistributed in cash. Common stock allocated to ESOP participants isincluded in the average number of common shares outstanding for bothbasic and diluted earnings per share. At December 31, 2017, 26.0 mil-lion common shares had been allocated to employees, leaving 10.5million unallocated common shares in the ESOP Trust, with an approxi-mate fair value of $1.3 billion.
Pension Plans. We sponsor both funded and unfunded domesticand foreign defined benefit pension plans that cover a large number ofour employees. Our largest plans are generally closed to new partici-pants. Our plans use a December 31 measurement date consistent withour fiscal year.
(DOLLARS IN MILLIONS) 2017 2016
Change in Benefit Obligation:
Beginning balance $ 34,923 $ 35,428
Service cost 374 383
Interest cost 1,120 1,183
Actuarial loss 1,804 1,831
Total benefits paid (1,782) (1,660)
Net settlement, curtailment and special termination benefits (49) (1,566)
Other 609 (676)
Ending balance $ 36,999 $ 34,923
Change in Plan Assets:
Beginning balance $ 30,555 $ 31,011
Actual return on plan assets 4,258 3,202
Employer contributions 2,188 384
Benefits paid (1,782) (1,660)
Settlements (41) (1,632)
Other 511 (750)
Ending balance $ 35,689 $ 30,555
Funded Status:
Fair value of plan assets $ 35,689 $ 30,555
Benefit obligations (36,999) (34,923)
Funded status of plan $ (1,310) $ (4,368)
Amounts Recognized in the Consolidated BalanceSheet Consist of:
Noncurrent assets $ 957 $ 451
Current liability (70) (72)
Noncurrent liability (2,197) (4,747)
Net amount recognized $ (1,310) $ (4,368)
Amounts Recognized in Accumulated OtherComprehensive Loss Consist of:
Net actuarial loss $ 7,238 $ 7,941
Prior service cost (credit) 37 (6)
Net amount recognized $ 7,275 $ 7,935
At the end of fiscal 2015, we changed the approach we had usedto estimate the service and interest components of net periodic pensioncost for our significant pension plans. This change, compared to theprevious approach, resulted in a net decrease in the service and interestcomponents of our annual net periodic pension cost of approximately$215 million for 2016. Historically, we estimated the service and interestcost components utilizing a single-weighted average discount ratederived from the yield curve used to measure the benefit obligation atthe beginning of the period. We have elected to utilize a full yield curveapproach in the estimation of these components by applying the spe-cific spot rates along the yield curve used in determination of the benefitobligation to the relevant projected cash flows. We made this change toprovide a more precise measurement of service and interest costs byimproving the correlation between projected benefit cash flows to thecorresponding spot yield curve rates. This change does not materiallyaffect the measurement of our total benefit obligations.
As part of our long-term strategy to de-risk our defined benefitpension plans, we made discretionary contributions of approximately$1.9 billion to our domestic defined benefit pension plans in the quarter
Notes to Consolidated Financial Statements
United Technologies Corporation 55
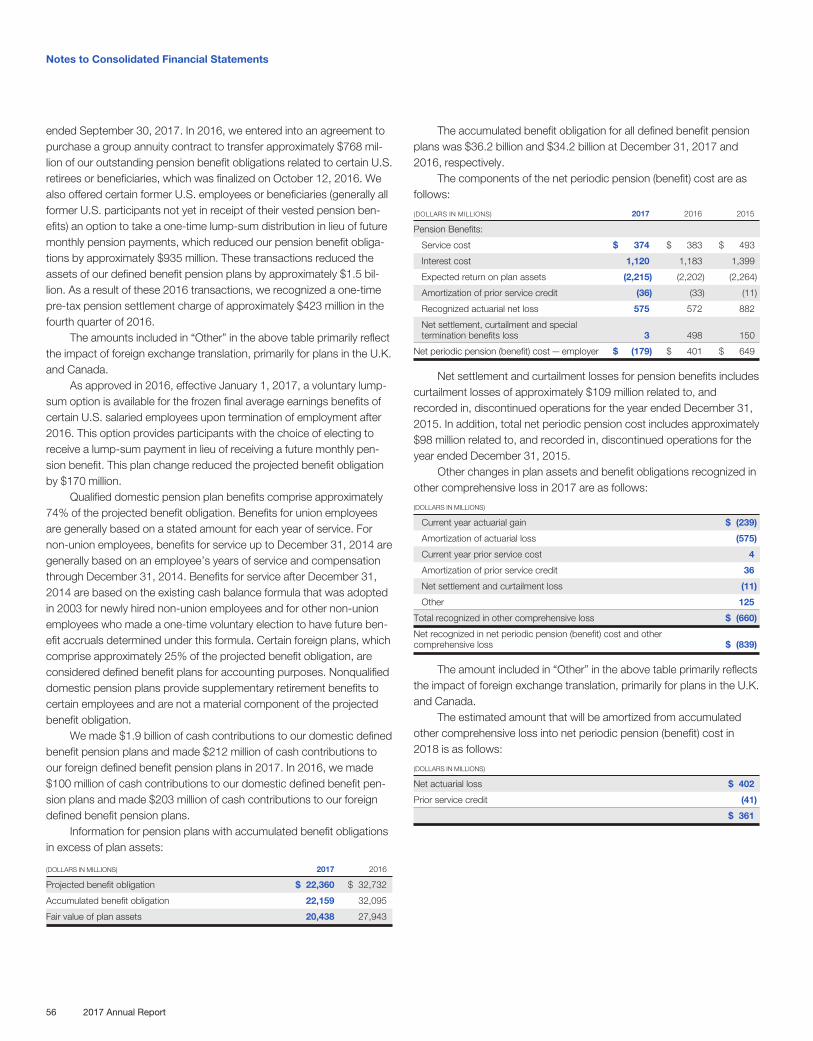
ended September 30, 2017. In 2016, we entered into an agreement topurchase a group annuity contract to transfer approximately $768 mil-lion of our outstanding pension benefit obligations related to certain U.S.retirees or beneficiaries, which was finalized on October 12, 2016. Wealso offered certain former U.S. employees or beneficiaries (generally allformer U.S. participants not yet in receipt of their vested pension ben-efits) an option to take a one-time lump-sum distribution in lieu of futuremonthly pension payments, which reduced our pension benefit obliga-tions by approximately $935 million. These transactions reduced theassets of our defined benefit pension plans by approximately $1.5 bil-lion. As a result of these 2016 transactions, we recognized a one-timepre-tax pension settlement charge of approximately $423 million in thefourth quarter of 2016.
The amounts included in “Other” in the above table primarily reflectthe impact of foreign exchange translation, primarily for plans in the U.K.and Canada.
As approved in 2016, effective January 1, 2017, a voluntary lump-sum option is available for the frozen final average earnings benefits ofcertain U.S. salaried employees upon termination of employment after2016. This option provides participants with the choice of electing toreceive a lump-sum payment in lieu of receiving a future monthly pen-sion benefit. This plan change reduced the projected benefit obligationby $170 million.
Qualified domestic pension plan benefits comprise approximately74% of the projected benefit obligation. Benefits for union employeesare generally based on a stated amount for each year of service. Fornon-union employees, benefits for service up to December 31, 2014 aregenerally based on an employee’s years of service and compensationthrough December 31, 2014. Benefits for service after December 31,2014 are based on the existing cash balance formula that was adoptedin 2003 for newly hired non-union employees and for other non-unionemployees who made a one-time voluntary election to have future ben-efit accruals determined under this formula. Certain foreign plans, whichcomprise approximately 25% of the projected benefit obligation, areconsidered defined benefit plans for accounting purposes. Nonqualifieddomestic pension plans provide supplementary retirement benefits tocertain employees and are not a material component of the projectedbenefit obligation.
We made $1.9 billion of cash contributions to our domestic definedbenefit pension plans and made $212 million of cash contributions toour foreign defined benefit pension plans in 2017. In 2016, we made$100 million of cash contributions to our domestic defined benefit pen-sion plans and made $203 million of cash contributions to our foreigndefined benefit pension plans.
Information for pension plans with accumulated benefit obligationsin excess of plan assets:
(DOLLARS IN MILLIONS) 2017 2016
Projected benefit obligation $ 22,360 $ 32,732
Accumulated benefit obligation 22,159 32,095
Fair value of plan assets 20,438 27,943
The accumulated benefit obligation for all defined benefit pensionplans was $36.2 billion and $34.2 billion at December 31, 2017 and2016, respectively.
The components of the net periodic pension (benefit) cost are asfollows:
(DOLLARS IN MILLIONS) 2017 2016 2015
Pension Benefits:
Service cost $ 374 $ 383 $ 493
Interest cost 1,120 1,183 1,399
Expected return on plan assets (2,215) (2,202) (2,264)
Amortization of prior service credit (36) (33) (11)
Recognized actuarial net loss 575 572 882
Net settlement, curtailment and specialtermination benefits loss 3 498 150
Net periodic pension (benefit) cost — employer $ (179) $ 401 $ 649
Net settlement and curtailment losses for pension benefits includescurtailment losses of approximately $109 million related to, andrecorded in, discontinued operations for the year ended December 31,2015. In addition, total net periodic pension cost includes approximately$98 million related to, and recorded in, discontinued operations for theyear ended December 31, 2015.
Other changes in plan assets and benefit obligations recognized inother comprehensive loss in 2017 are as follows:
(DOLLARS IN MILLIONS)
Current year actuarial gain $ (239)
Amortization of actuarial loss (575)
Current year prior service cost 4
Amortization of prior service credit 36
Net settlement and curtailment loss (11)
Other 125
Total recognized in other comprehensive loss $ (660)
Net recognized in net periodic pension (benefit) cost and othercomprehensive loss $ (839)
The amount included in “Other” in the above table primarily reflectsthe impact of foreign exchange translation, primarily for plans in the U.K.and Canada.
The estimated amount that will be amortized from accumulatedother comprehensive loss into net periodic pension (benefit) cost in2018 is as follows:
(DOLLARS IN MILLIONS)
Net actuarial loss $ 402
Prior service credit (41)
$ 361
Notes to Consolidated Financial Statements
56 2017 Annual Report
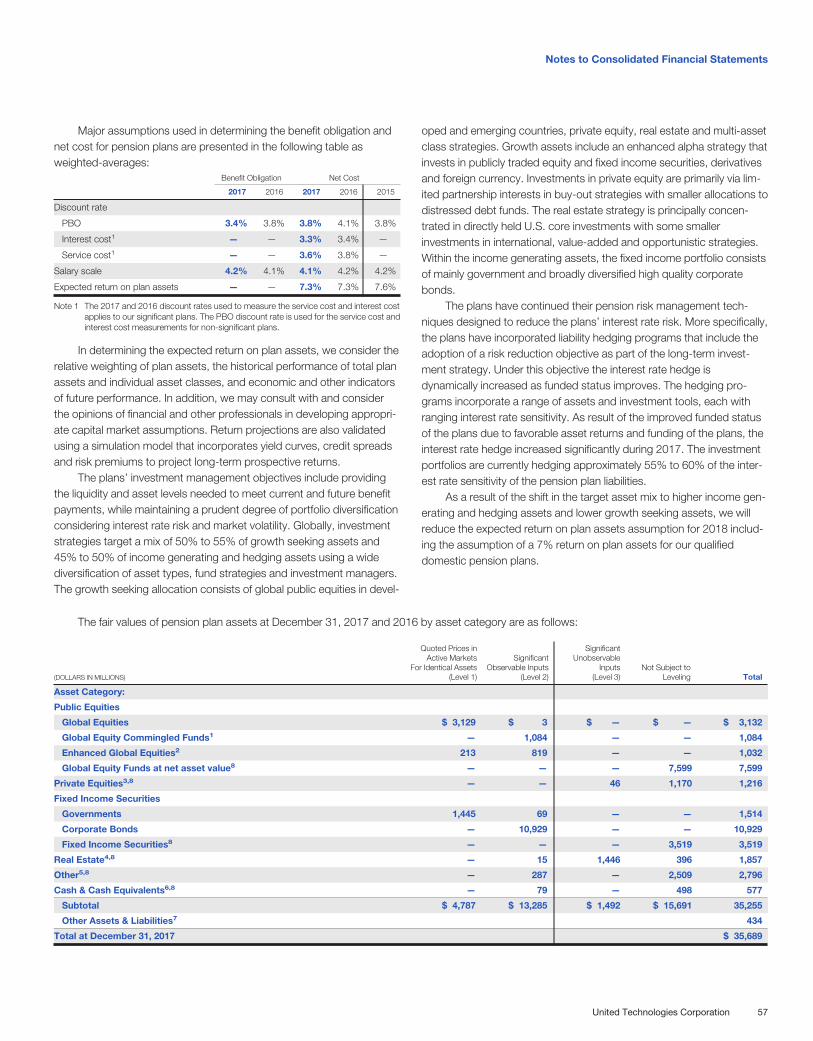
Major assumptions used in determining the benefit obligation andnet cost for pension plans are presented in the following table asweighted-averages:
Benefit Obligation Net Cost
2017 2016 2017 2016 2015
Discount rate
PBO 3.4% 3.8% 3.8% 4.1% 3.8%
Interest cost1 — — 3.3% 3.4% —
Service cost1 — — 3.6% 3.8% —
Salary scale 4.2% 4.1% 4.1% 4.2% 4.2%
Expected return on plan assets — — 7.3% 7.3% 7.6%
Note 1 The 2017 and 2016 discount rates used to measure the service cost and interest costapplies to our significant plans. The PBO discount rate is used for the service cost andinterest cost measurements for non-significant plans.
In determining the expected return on plan assets, we consider therelative weighting of plan assets, the historical performance of total planassets and individual asset classes, and economic and other indicatorsof future performance. In addition, we may consult with and considerthe opinions of financial and other professionals in developing appropri-ate capital market assumptions. Return projections are also validatedusing a simulation model that incorporates yield curves, credit spreadsand risk premiums to project long-term prospective returns.
The plans’ investment management objectives include providingthe liquidity and asset levels needed to meet current and future benefitpayments, while maintaining a prudent degree of portfolio diversificationconsidering interest rate risk and market volatility. Globally, investmentstrategies target a mix of 50% to 55% of growth seeking assets and45% to 50% of income generating and hedging assets using a widediversification of asset types, fund strategies and investment managers.The growth seeking allocation consists of global public equities in devel-
oped and emerging countries, private equity, real estate and multi-assetclass strategies. Growth assets include an enhanced alpha strategy thatinvests in publicly traded equity and fixed income securities, derivativesand foreign currency. Investments in private equity are primarily via lim-ited partnership interests in buy-out strategies with smaller allocations todistressed debt funds. The real estate strategy is principally concen-trated in directly held U.S. core investments with some smallerinvestments in international, value-added and opportunistic strategies.Within the income generating assets, the fixed income portfolio consistsof mainly government and broadly diversified high quality corporatebonds.
The plans have continued their pension risk management tech-niques designed to reduce the plans’ interest rate risk. More specifically,the plans have incorporated liability hedging programs that include theadoption of a risk reduction objective as part of the long-term invest-ment strategy. Under this objective the interest rate hedge isdynamically increased as funded status improves. The hedging pro-grams incorporate a range of assets and investment tools, each withranging interest rate sensitivity. As result of the improved funded statusof the plans due to favorable asset returns and funding of the plans, theinterest rate hedge increased significantly during 2017. The investmentportfolios are currently hedging approximately 55% to 60% of the inter-est rate sensitivity of the pension plan liabilities.
As a result of the shift in the target asset mix to higher income gen-erating and hedging assets and lower growth seeking assets, we willreduce the expected return on plan assets assumption for 2018 includ-ing the assumption of a 7% return on plan assets for our qualifieddomestic pension plans.
The fair values of pension plan assets at December 31, 2017 and 2016 by asset category are as follows:
(DOLLARS IN MILLIONS)
Quoted Prices inActive Markets
For Identical Assets(Level 1)
SignificantObservable Inputs
(Level 2)
SignificantUnobservable
Inputs(Level 3)
Not Subject toLeveling Total
Asset Category:
Public Equities
Global Equities $ 3,129 $ 3 $ — $ — $ 3,132
Global Equity Commingled Funds1 — 1,084 — — 1,084
Enhanced Global Equities2 213 819 — — 1,032
Global Equity Funds at net asset value8 — — — 7,599 7,599
Private Equities3,8 — — 46 1,170 1,216
Fixed Income Securities
Governments 1,445 69 — — 1,514
Corporate Bonds — 10,929 — — 10,929
Fixed Income Securities8 — — — 3,519 3,519
Real Estate4,8 — 15 1,446 396 1,857
Other5,8 — 287 — 2,509 2,796
Cash & Cash Equivalents6,8 — 79 — 498 577
Subtotal $ 4,787 $ 13,285 $ 1,492 $ 15,691 35,255
Other Assets & Liabilities7 434
Total at December 31, 2017 $ 35,689
Notes to Consolidated Financial Statements
United Technologies Corporation 57
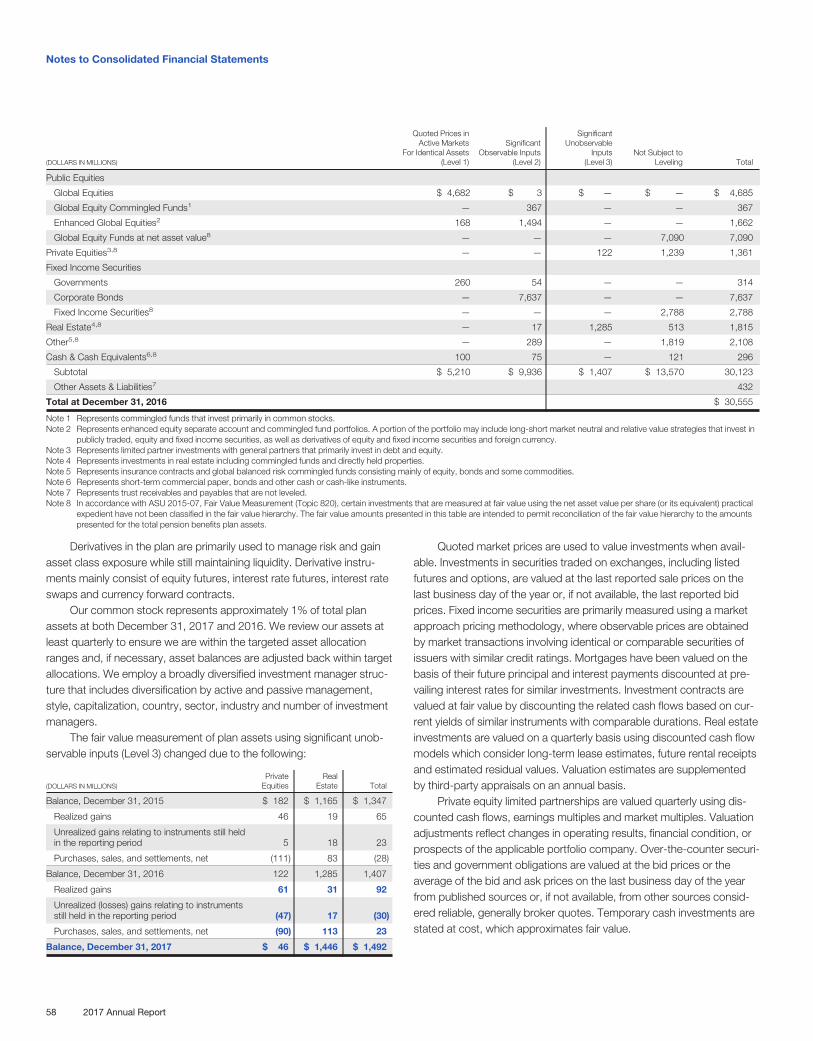
(DOLLARS IN MILLIONS)
Quoted Prices inActive Markets
For Identical Assets(Level 1)
SignificantObservable Inputs
(Level 2)
SignificantUnobservable
Inputs(Level 3)
Not Subject toLeveling Total
Public Equities
Global Equities $ 4,682 $ 3 $ — $ — $ 4,685
Global Equity Commingled Funds1 — 367 — — 367
Enhanced Global Equities2 168 1,494 — — 1,662
Global Equity Funds at net asset value8 — — — 7,090 7,090
Private Equities3,8 — — 122 1,239 1,361
Fixed Income Securities
Governments 260 54 — — 314
Corporate Bonds — 7,637 — — 7,637
Fixed Income Securities8 — — — 2,788 2,788
Real Estate4,8 — 17 1,285 513 1,815
Other5,8 — 289 — 1,819 2,108
Cash & Cash Equivalents6,8 100 75 — 121 296
Subtotal $ 5,210 $ 9,936 $ 1,407 $ 13,570 30,123
Other Assets & Liabilities7 432
Total at December 31, 2016 $ 30,555
Note 1 Represents commingled funds that invest primarily in common stocks.Note 2 Represents enhanced equity separate account and commingled fund portfolios. A portion of the portfolio may include long-short market neutral and relative value strategies that invest in
publicly traded, equity and fixed income securities, as well as derivatives of equity and fixed income securities and foreign currency.Note 3 Represents limited partner investments with general partners that primarily invest in debt and equity.Note 4 Represents investments in real estate including commingled funds and directly held properties.Note 5 Represents insurance contracts and global balanced risk commingled funds consisting mainly of equity, bonds and some commodities.Note 6 Represents short-term commercial paper, bonds and other cash or cash-like instruments.Note 7 Represents trust receivables and payables that are not leveled.Note 8 In accordance with ASU 2015-07, Fair Value Measurement (Topic 820), certain investments that are measured at fair value using the net asset value per share (or its equivalent) practical
expedient have not been classified in the fair value hierarchy. The fair value amounts presented in this table are intended to permit reconciliation of the fair value hierarchy to the amountspresented for the total pension benefits plan assets.
Derivatives in the plan are primarily used to manage risk and gainasset class exposure while still maintaining liquidity. Derivative instru-ments mainly consist of equity futures, interest rate futures, interest rateswaps and currency forward contracts.
Our common stock represents approximately 1% of total planassets at both December 31, 2017 and 2016. We review our assets atleast quarterly to ensure we are within the targeted asset allocationranges and, if necessary, asset balances are adjusted back within targetallocations. We employ a broadly diversified investment manager struc-ture that includes diversification by active and passive management,style, capitalization, country, sector, industry and number of investmentmanagers.
The fair value measurement of plan assets using significant unob-servable inputs (Level 3) changed due to the following:
(DOLLARS IN MILLIONS)Private
EquitiesReal
Estate Total
Balance, December 31, 2015 $ 182 $ 1,165 $ 1,347
Realized gains 46 19 65
Unrealized gains relating to instruments still heldin the reporting period 5 18 23
Purchases, sales, and settlements, net (111) 83 (28)
Balance, December 31, 2016 122 1,285 1,407
Realized gains 61 31 92
Unrealized (losses) gains relating to instrumentsstill held in the reporting period (47) 17 (30)
Purchases, sales, and settlements, net (90) 113 23
Balance, December 31, 2017 $ 46 $ 1,446 $ 1,492
Quoted market prices are used to value investments when avail-able. Investments in securities traded on exchanges, including listedfutures and options, are valued at the last reported sale prices on thelast business day of the year or, if not available, the last reported bidprices. Fixed income securities are primarily measured using a marketapproach pricing methodology, where observable prices are obtainedby market transactions involving identical or comparable securities ofissuers with similar credit ratings. Mortgages have been valued on thebasis of their future principal and interest payments discounted at pre-vailing interest rates for similar investments. Investment contracts arevalued at fair value by discounting the related cash flows based on cur-rent yields of similar instruments with comparable durations. Real estateinvestments are valued on a quarterly basis using discounted cash flowmodels which consider long-term lease estimates, future rental receiptsand estimated residual values. Valuation estimates are supplementedby third-party appraisals on an annual basis.
Private equity limited partnerships are valued quarterly using dis-counted cash flows, earnings multiples and market multiples. Valuationadjustments reflect changes in operating results, financial condition, orprospects of the applicable portfolio company. Over-the-counter securi-ties and government obligations are valued at the bid prices or theaverage of the bid and ask prices on the last business day of the yearfrom published sources or, if not available, from other sources consid-ered reliable, generally broker quotes. Temporary cash investments arestated at cost, which approximates fair value.
Notes to Consolidated Financial Statements
58 2017 Annual Report
As a result of the $1.9 billion contribution, we are not required tomake additional contributions to our domestic defined benefit pensionplans through the end of 2028. We expect to make total contributionsof approximately $100 million to our global defined benefit pensionplans in 2018. Contributions do not reflect benefits to be paid directlyfrom corporate assets.
Benefit payments, including amounts to be paid from corporateassets, and reflecting expected future service, as appropriate, areexpected to be paid as follows: $2,044 million in 2018, $1,903 million in2019, $1,952 million in 2020, $2,004 million in 2021, $2,054 million in2022, and $10,710 million from 2023 through 2027.
Postretirement Benefit Plans. We sponsor a number of postre-tirement benefit plans that provide health and life benefits to eligibleretirees. Such benefits are provided primarily from domestic plans,which comprise approximately 85% of the benefit obligation. The post-retirement plans are unfunded.
(DOLLARS IN MILLIONS) 2017 2016
Change in Benefit Obligation:
Beginning balance $ 805 $ 890
Service cost 2 3
Interest cost 29 34
Actuarial gain (4) (48)
Total benefits paid (87) (97)
Other 22 23
Ending balance $ 767 $ 805
Change in Plan Assets:
Beginning balance $ — $ —
Employer contributions 71 80
Benefits paid (87) (97)
Other 16 17
Ending balance $ — $ —
Funded Status:
Fair value of plan assets $ — $ —
Benefit obligations (767) (805)
Funded status of plan $ (767) $ (805)
Amounts Recognized in the Consolidated BalanceSheet Consist of:
Current liability $ (72) $ (78)
Noncurrent liability (695) (727)
Net amount recognized $ (767) $ (805)
Amounts Recognized in Accumulated OtherComprehensive Loss Consist of:
Net actuarial gain $ (143) $ (152)
Prior service credit (10) (5)
Net amount recognized $ (153) $ (157)
The components of net periodic benefit cost are as follows:
(DOLLARS IN MILLIONS) 2017 2016 2015
Other Postretirement Benefits:
Service cost $ 2 $ 3 $ 3
Interest cost 29 34 34
Amortization of prior service credit (1) — —
Recognized actuarial net gain (9) (4) (4)
Net settlement and curtailment gain — — (1)
Net periodic other postretirement benefit cost $ 21 $ 33 $ 32
Other changes in plan assets and benefit obligations recognized inother comprehensive loss in 2017 are as follows:
(DOLLARS IN MILLIONS)
Current year actuarial gain $ (2)
Current year prior service credit (6)
Amortization of prior service credit 1
Amortization of actuarial net gain 9
Other 2
Total recognized in other comprehensive loss $ 4
Net recognized in net periodic other postretirement benefit cost andother comprehensive loss $ 25
The estimated amounts that will be amortized from accumulatedother comprehensive loss into net periodic benefit cost in 2018 includeactuarial net gains of $10 million and prior service credits of $3 million.
Major assumptions used in determining the benefit obligation andnet cost for postretirement plans are presented in the following table asweighted-averages:
Benefit Obligation Net Cost
2017 2016 2017 2016 2015
Discount rate 3.4% 3.8% 3.8% 4.0% 3.8%
Assumed health care cost trend rates are as follows:
2017 2016
Health care cost trend rate assumed for next year 7.0% 6.5%
Rate that the cost trend rate gradually declines to 5.0% 5.0%
Year that the rate reaches the rate it is assumed to remain at 2026 2022
Assumed health care cost trend rates have a significant effect onthe amounts reported for the health care plans. A one-percentage-pointchange in assumed health care cost trend rates would have the follow-ing effects:
2017 One-Percentage-Point
(DOLLARS IN MILLIONS) Increase Decrease
Effect on total service and interest cost $ 2 $ (2)
Effect on postretirement benefit obligation 40 (35)
Notes to Consolidated Financial Statements
United Technologies Corporation 59
Benefit payments, including net amounts to be paid from corporateassets and reflecting expected future service, as appropriate, areexpected to be paid as follows: $72 million in 2018, $67 million in 2019,$64 million in 2020, $59 million in 2021, $54 million in 2022, and $225million from 2023 through 2027.
Multiemployer Benefit Plans. We contribute to various domesticand foreign multiemployer defined benefit pension plans. The risks ofparticipating in these multiemployer plans are different from single-employer plans in that assets contributed are pooled and may be usedto provide benefits to employees of other participating employers. If aparticipating employer stops contributing to the plan, the unfunded obli-gations of the plan may be borne by the remaining participatingemployers. Lastly, if we choose to stop participating in some of our mul-
tiemployer plans, we may be required to pay those plans a withdrawalliability based on the underfunded status of the plan.
Our participation in these plans for the annual periods endedDecember 31 is outlined in the table below. Unless otherwise noted, themost recent Pension Protection Act (PPA) zone status available in 2017and 2016 is for the plan’s year-end at June 30, 2016, and June 30,2015, respectively. The zone status is based on information that wereceived from the plan and is certified by the plan’s actuary. Our signifi-cant plan is in the green zone which represents a plan that is at least80% funded and does not require a financial improvement plan (FIP) ora rehabilitation plan (RP). An extended amortization provision of tenyears is utilized to recognize investment gains or losses for our signifi-cant plan.
(DOLLARS IN MILLIONS)Pension Protection Act
Zone StatusFIP/
RP Status Contributions
Pension FundEIN/Pension
Plan Number 2017 2016Pending/
Implemented 2017 2016 2015Surcharge
Imposed
Expiration Date ofCollective-Bargaining
Agreement
National Elevator Industry Pension Plan 23-2694291 Green Green No $ 114 $ 100 $ 88 No July 8, 2022
Other funds 31 31 32
$ 145 $ 131 $ 120
For the plan years ended June 30, 2016 and 2015, respectively,we were listed in the National Elevator Industry Pension Plan’s Forms5500 as providing more than 5% of the total contributions for the plan.At the date these financial statements were issued, Forms 5500 werenot available for the plan year ending June 30, 2017.
In addition, we participate in several multiemployer arrangementsthat provide postretirement benefits other than pensions, with theNational Elevator Industry Health Benefit Plan being the most significant.These arrangements generally provide medical and life benefits for eli-gible active employees and retirees and their dependents. Contributionsto multiemployer plans that provide postretirement benefits other thanpensions were $19 million, $17 million and $15 million for 2017, 2016and 2015, respectively.
Stock-based Compensation. UTC’s long-term incentive planauthorizes various types of market and performance based incentiveawards that may be granted to officers and employees. Our Long-TermIncentive Plan (LTIP) was last amended on February 5, 2016. Since theLTIP’s inception in 2005, a total of 149 million shares have been autho-rized for issuance pursuant to awards under the LTIP. All equity-basedcompensation awards are made exclusively through the LTIP. As ofDecember 31, 2017, approximately 29 million shares remain availablefor awards under the LTIP. The LTIP does not contain an aggregateannual award limit. We expect that the shares awarded on an annualbasis will range from 1.0% to 1.5% of shares outstanding. The LTIP willexpire after all authorized shares have been awarded or April 30, 2020,whichever is sooner.
Under the LTIP and predecessor long-term incentive plans, theexercise price of awards is set on the grant date and may not be lessthan the fair market value per share on that date. Generally, stockappreciation rights and stock options have a term of ten years and aminimum three-year vesting period. In the event of retirement, awards
held for more than one year may become vested and exercisable sub-ject to certain terms and conditions. LTIP awards with performance-based vesting generally have a minimum three-year vesting period andvest based on performance against pre-established metrics. In theevent of retirement, vesting for awards held more than one year doesnot accelerate but may vest as scheduled based on actual performancerelative to target metrics. We have historically repurchased shares of ourcommon stock in an amount at least equal to the number of sharesissued under our equity compensation arrangements and will continueto evaluate this policy in conjunction with our overall share repurchaseprogram.
We measure the cost of all share-based payments, including stockoptions, at fair value on the grant date and recognize this cost in theConsolidated Statement of Operations as follows:
(DOLLARS IN MILLIONS) 2017 2016 2015
Continuing operations $ 192 $ 152 $ 158
Discontinued operations — 1 17
Total compensation cost recognized $ 192 $ 153 $ 175
The associated future income tax benefit recognized was $38 mil-lion, $49 million and $57 million for the years ended December 31,2017, 2016 and 2015, respectively. The amounts related to 2017 havebeen provisionally adjusted for the impact of the TCJA. Please refer toNote 11 for additional detail.
For the years ended December 31, 2017, 2016 and 2015, theamount of cash received from the exercise of stock options was $29million, $17 million and $41 million, respectively, with an associated taxbenefit realized of $100 million, $69 million and $89 million, respectively.In addition, for the years ended December 31, 2017, 2016 and 2015,the associated tax benefit realized from the vesting of performanceshare units and other restricted awards was $12 million, $17 million and
Notes to Consolidated Financial Statements
60 2017 Annual Report
$48 million, respectively. In 2016, we adopted the provisions of ASU2016-09, “Compensation—Stock Compensation (Topic 718): Improve-ments to Employee Share-Based Payment Accounting.” As part of thatadoption, we elected to apply the prospective transition method andtherefore, did not revise prior years’ disclosures. As such, for the yearended December 31, 2015, based on existing guidance prior to theissuance of ASU 2016-09, $64 million of certain tax benefits have been
reported as operating cash outflows with corresponding cash inflowsfrom financing activities.
At December 31, 2017, there was $175 million of total unrecog-nized compensation cost related to non-vested equity awards grantedunder long-term incentive plans. This cost is expected to be recognizedratably over a weighted-average period of 3.3 years.
A summary of the transactions under all long-term incentive plans for the year ended December 31, 2017 follows:
Stock Options Stock Appreciation Rights Performance Share Units
(SHARES AND UNITS IN THOUSANDS) SharesAverage
Price* SharesAverage
Price* UnitsAverage
Price**
OtherIncentive
Shares/Units
Outstanding at:
December 31, 2016 2,023 $ 89.72 36,413 $ 87.18 1,967 $ 107.05 2,033
Granted 231 110.81 3,464 110.91 614 110.83 1,006
Exercised / earned (369) 77.17 (6,770) 72.86 (2) 107.78 (441)
Cancelled (103) 102.00 (720) 95.23 (699) 112.16 (123)
Other (37) $ 94.30 335 $ 92.54 (4) $ 106.38 (293)
December 31, 2017 1,745 $ 94.35 32,722 $ 92.54 1,876 $ 106.38 2,182
* weighted-average exercise price
** weighted-average grant stock price
The weighted-average grant date fair value of stock options andstock appreciation rights granted during 2017, 2016 and 2015 was$17.22, $14.02 and $18.69, respectively. The weighted-average grantdate fair value of performance share units, which vest upon achievingcertain performance metrics, granted during 2017, 2016 and 2015 was$111.00, $91.63 and $120.36, respectively. The total fair value ofawards vested during the years ended December 31, 2017, 2016 and2015 was $138 million, $165 million and $247 million, respectively. The
total intrinsic value (which is the amount by which the stock priceexceeded the exercise price on the date of exercise) of stock optionsand stock appreciation rights exercised during the years endedDecember 31, 2017, 2016 and 2015 was $320 million, $214 million and$281 million, respectively. The total intrinsic value (which is the stockprice at vesting) of performance share units and other restricted awardsvested was $49 million, $61 million and $151 million during the yearsended December 31, 2017, 2016 and 2015, respectively.
The following table summarizes information about equity awards outstanding that are vested and expected to vest and equity awards outstand-ing that are exercisable at December 31, 2017:
Equity Awards Vested and Expected to Vest Equity Awards That Are Exercisable
(SHARES IN THOUSANDS; AGGREGATE INTRINSIC VALUE IN MILLIONS) AwardsAverage
Price*
AggregateIntrinsic
ValueRemaining
Term** AwardsAverage
Price*
AggregateIntrinsic
ValueRemaining
Term**
Stock Options/Stock Appreciation Rights 34,183 $ 91.85 $ 1,221 5.5 years 21,990 $ 84.34 $ 951 4.2 years
Performance Share Units/Restricted Stock 3,462 — 442 2.1 years
* weighted-average exercise price per share
** weighted-average contractual remaining term in years
The fair value of each option award is estimated on the date ofgrant using a binomial lattice model. The following table indicates theassumptions used in estimating fair value for the years endedDecember 31, 2017, 2016 and 2015. Lattice-based option modelsincorporate ranges of assumptions for inputs; those ranges are asfollows:
2017 2016 2015
Expected volatility 19% 20% 20% - 23%
Weighted-average volatility 19% 20% 21%
Expected term (in years) 6.5 6.5 6.0 - 6.8
Expected dividend yield 2.4% 2.7% 2.2%
Risk-free rate 0.5% - 2.5% 0.2% - 2.6% 0.0% - 2.2%
Expected volatilities are based on the returns of our stock, includ-ing implied volatilities from traded options on our stock for the binomiallattice model. We use historical data to estimate equity award exerciseand employee termination behavior within the valuation model. Prior to2016, separate employee groups and equity award characteristics wereconsidered separately for valuation purposes. The expected term repre-sents an estimate of the period of time equity awards are expected toremain outstanding. The risk-free rate is based on the term structure ofinterest rates at the time of equity award grant.
Notes to Consolidated Financial Statements
United Technologies Corporation 61
NOTE 13: RESTRUCTURING COSTS
During 2017, we recorded net pre-tax restructuring costs totaling $253million for new and ongoing restructuring actions. We recorded chargesin the segments as follows:
(DOLLARS IN MILLIONS)
Otis $ 50
UTC Climate, Controls & Security 111
Pratt & Whitney 5
UTC Aerospace Systems 80
Eliminations and other 7
Total $ 253
Restructuring charges incurred in 2017 primarily relate to actionsinitiated during 2017 and 2016, and were recorded as follows:
(DOLLARS IN MILLIONS)
Cost of sales $ 119
Selling, general & administrative 134
Total $ 253
2017 Actions. During 2017, we recorded net pre-tax restructuringcosts totaling $176 million for restructuring actions initiated in 2017,consisting of $70 million in cost of sales and $106 million in selling, gen-eral and administrative expenses. The 2017 actions relate to ongoingcost reduction efforts, including workforce reductions and consolidationof field operations.
We are targeting to complete in 2018 and 2019 the majority of theremaining workforce and all facility related cost reduction actions initi-ated in 2017. No specific plans for significant other actions have beenfinalized at this time. The following table summarizes the accrual bal-ances and utilization by cost type for the 2017 restructuring actions:
(DOLLARS IN MILLIONS) Severance
Facility Exit,Lease
Termination& Other
Costs Total
Net pre-tax restructuring costs $ 160 $ 16 $ 176
Utilization and foreign exchange (76) (15) (91)
Balance at December 31, 2017 $ 84 $ 1 $ 85
The following table summarizes expected, incurred and remainingcosts for the 2017 restructuring actions by segment:
(DOLLARS IN MILLIONS)Expected
Costs
CostIncurred
During2017
RemainingCosts at
December 31,2017
Otis $ 79 $ (43) $ 36
UTC Climate, Controls & Security 87 (76) 11
Pratt & Whitney 7 (7) —
UTC Aerospace Systems 118 (43) 75
Eliminations and other 7 (7) —
Total $ 298 $ (176) $ 122
2016 Actions. During 2017, we recorded net pre-tax restructuringcosts totaling $57 million for restructuring actions initiated in 2016, con-sisting of $22 million in cost of sales and $35 million in selling, generaland administrative expenses. The 2016 actions relate to ongoing cost
reduction efforts, including workforce reductions and the consolidationof field operations. The following table summarizes the accrual balancesand utilization by cost type for the 2016 restructuring actions:
(DOLLARS IN MILLIONS) Severance
Facility Exit,Lease
Terminationand Other
Costs Total
Restructuring accruals at January 1, 2017 $ 63 $ 46 $ 109
Net pre-tax restructuring costs 34 23 57
Utilization and foreign exchange (65) (17) (82)
Balance at December 31, 2017 $ 32 $ 52 $ 84
The following table summarizes expected, incurred and remainingcosts for the 2016 programs by segment:
(DOLLARS IN MILLIONS)Expected
Costs
CostsIncurred
During2016
CostsIncurred
During2017
RemainingCosts at
December 31,2017
Otis $ 57 $ (48) $ (5) $ 4
UTC Climate, Controls & Security 79 (45) (21) 13
Pratt & Whitney 118 (118) — —
UTC Aerospace Systems 79 (31) (31) 17
Total $ 333 $ (242) $ (57) $ 34
2015 and Prior Actions. During 2017, we recorded net pre-taxrestructuring costs totaling $20 million for restructuring actions initiatedin 2015 and prior. As of December 31, 2017, we have approximately$43 million of accrual balances remaining related to 2015 and prioractions.
NOTE 14: FINANCIAL INSTRUMENTS
We enter into derivative instruments for risk management purposesonly, including derivatives designated as hedging instruments under theDerivatives and Hedging Topic of the FASB ASC and those utilized aseconomic hedges. We operate internationally and, in the ordinarycourse of business, we are exposed to fluctuations in interest rates, for-eign exchange rates and commodity prices. These fluctuations canincrease the costs of financing, investing and operating the business.We have used derivative instruments, including swaps, forward con-tracts and options to manage certain foreign currency, interest rate andcommodity price exposures.
The four quarter rolling average of the notional amount of foreignexchange contracts hedging foreign currency transactions was $19.1billion and $18.3 billion at December 31, 2017 and 2016, respectively.Additional information pertaining to foreign exchange and hedgingactivities is included in Note 1.
The following table summarizes the fair value of derivative instru-ments as of December 31, 2017 and 2016, which consist solely offoreign exchange contracts:
Asset Derivatives Liability Derivatives
(DOLLARS IN MILLIONS) 2017 2016 2017 2016
Derivatives designated as hedginginstruments $ 178 $ 15 $ 18 $ 196
Derivatives not designated ashedging instruments 75 155 60 158
Notes to Consolidated Financial Statements
62 2017 Annual Report
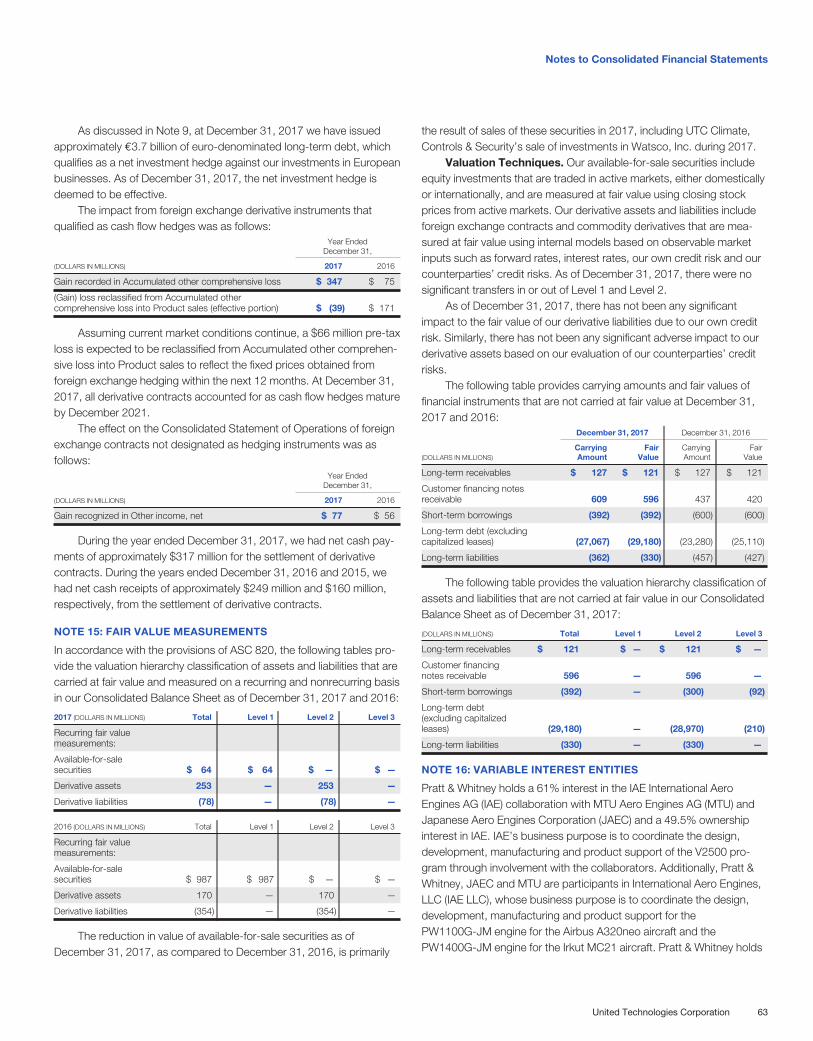
As discussed in Note 9, at December 31, 2017 we have issuedapproximately e3.7 billion of euro-denominated long-term debt, whichqualifies as a net investment hedge against our investments in Europeanbusinesses. As of December 31, 2017, the net investment hedge isdeemed to be effective.
The impact from foreign exchange derivative instruments thatqualified as cash flow hedges was as follows:
Year EndedDecember 31,
(DOLLARS IN MILLIONS) 2017 2016
Gain recorded in Accumulated other comprehensive loss $ 347 $ 75
(Gain) loss reclassified from Accumulated othercomprehensive loss into Product sales (effective portion) $ (39) $ 171
Assuming current market conditions continue, a $66 million pre-taxloss is expected to be reclassified from Accumulated other comprehen-sive loss into Product sales to reflect the fixed prices obtained fromforeign exchange hedging within the next 12 months. At December 31,2017, all derivative contracts accounted for as cash flow hedges matureby December 2021.
The effect on the Consolidated Statement of Operations of foreignexchange contracts not designated as hedging instruments was asfollows:
Year EndedDecember 31,
(DOLLARS IN MILLIONS) 2017 2016
Gain recognized in Other income, net $ 77 $ 56
During the year ended December 31, 2017, we had net cash pay-ments of approximately $317 million for the settlement of derivativecontracts. During the years ended December 31, 2016 and 2015, wehad net cash receipts of approximately $249 million and $160 million,respectively, from the settlement of derivative contracts.
NOTE 15: FAIR VALUE MEASUREMENTS
In accordance with the provisions of ASC 820, the following tables pro-vide the valuation hierarchy classification of assets and liabilities that arecarried at fair value and measured on a recurring and nonrecurring basisin our Consolidated Balance Sheet as of December 31, 2017 and 2016:
2017 (DOLLARS IN MILLIONS) Total Level 1 Level 2 Level 3
Recurring fair valuemeasurements:
Available-for-salesecurities $ 64 $ 64 $ — $ —
Derivative assets 253 — 253 —
Derivative liabilities (78) — (78) —
2016 (DOLLARS IN MILLIONS) Total Level 1 Level 2 Level 3
Recurring fair valuemeasurements:
Available-for-salesecurities $ 987 $ 987 $ — $ —
Derivative assets 170 — 170 —
Derivative liabilities (354) — (354) —
The reduction in value of available-for-sale securities as ofDecember 31, 2017, as compared to December 31, 2016, is primarily
the result of sales of these securities in 2017, including UTC Climate,Controls & Security’s sale of investments in Watsco, Inc. during 2017.
Valuation Techniques. Our available-for-sale securities includeequity investments that are traded in active markets, either domesticallyor internationally, and are measured at fair value using closing stockprices from active markets. Our derivative assets and liabilities includeforeign exchange contracts and commodity derivatives that are mea-sured at fair value using internal models based on observable marketinputs such as forward rates, interest rates, our own credit risk and ourcounterparties’ credit risks. As of December 31, 2017, there were nosignificant transfers in or out of Level 1 and Level 2.
As of December 31, 2017, there has not been any significantimpact to the fair value of our derivative liabilities due to our own creditrisk. Similarly, there has not been any significant adverse impact to ourderivative assets based on our evaluation of our counterparties’ creditrisks.
The following table provides carrying amounts and fair values offinancial instruments that are not carried at fair value at December 31,2017 and 2016:
December 31, 2017 December 31, 2016
(DOLLARS IN MILLIONS)CarryingAmount
FairValue
CarryingAmount
FairValue
Long-term receivables $ 127 $ 121 $ 127 $ 121
Customer financing notesreceivable 609 596 437 420
Short-term borrowings (392) (392) (600) (600)
Long-term debt (excludingcapitalized leases) (27,067) (29,180) (23,280) (25,110)
Long-term liabilities (362) (330) (457) (427)
The following table provides the valuation hierarchy classification ofassets and liabilities that are not carried at fair value in our ConsolidatedBalance Sheet as of December 31, 2017:
(DOLLARS IN MILLIONS) Total Level 1 Level 2 Level 3
Long-term receivables $ 121 $ — $ 121 $ —
Customer financingnotes receivable 596 — 596 —
Short-term borrowings (392) — (300) (92)
Long-term debt(excluding capitalizedleases) (29,180) — (28,970) (210)
Long-term liabilities (330) — (330) —
NOTE 16: VARIABLE INTEREST ENTITIES
Pratt & Whitney holds a 61% interest in the IAE International AeroEngines AG (IAE) collaboration with MTU Aero Engines AG (MTU) andJapanese Aero Engines Corporation (JAEC) and a 49.5% ownershipinterest in IAE. IAE’s business purpose is to coordinate the design,development, manufacturing and product support of the V2500 pro-gram through involvement with the collaborators. Additionally, Pratt &Whitney, JAEC and MTU are participants in International Aero Engines,LLC (IAE LLC), whose business purpose is to coordinate the design,development, manufacturing and product support for thePW1100G-JM engine for the Airbus A320neo aircraft and thePW1400G-JM engine for the Irkut MC21 aircraft. Pratt & Whitney holds
Notes to Consolidated Financial Statements
United Technologies Corporation 63
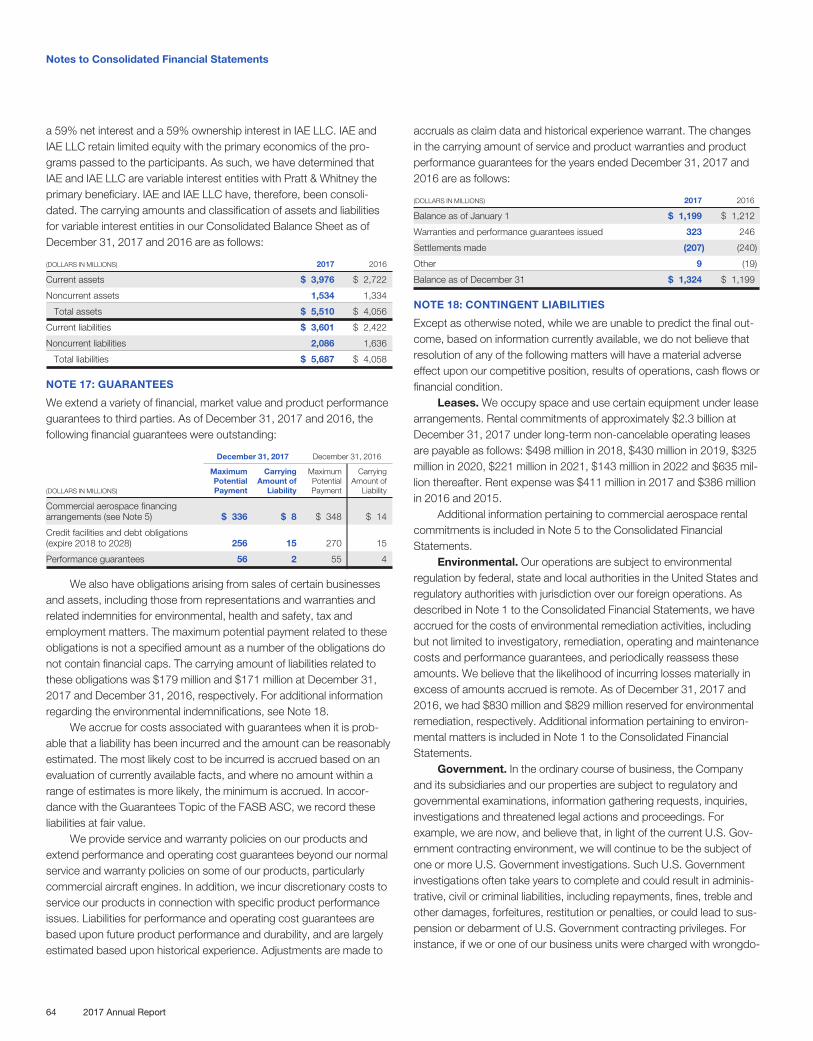
a 59% net interest and a 59% ownership interest in IAE LLC. IAE andIAE LLC retain limited equity with the primary economics of the pro-grams passed to the participants. As such, we have determined thatIAE and IAE LLC are variable interest entities with Pratt & Whitney theprimary beneficiary. IAE and IAE LLC have, therefore, been consoli-dated. The carrying amounts and classification of assets and liabilitiesfor variable interest entities in our Consolidated Balance Sheet as ofDecember 31, 2017 and 2016 are as follows:
(DOLLARS IN MILLIONS) 2017 2016
Current assets $ 3,976 $ 2,722
Noncurrent assets 1,534 1,334
Total assets $ 5,510 $ 4,056
Current liabilities $ 3,601 $ 2,422
Noncurrent liabilities 2,086 1,636
Total liabilities $ 5,687 $ 4,058
NOTE 17: GUARANTEES
We extend a variety of financial, market value and product performanceguarantees to third parties. As of December 31, 2017 and 2016, thefollowing financial guarantees were outstanding:
December 31, 2017 December 31, 2016
(DOLLARS IN MILLIONS)
MaximumPotentialPayment
CarryingAmount of
Liability
MaximumPotentialPayment
CarryingAmount of
Liability
Commercial aerospace financingarrangements (see Note 5) $ 336 $ 8 $ 348 $ 14
Credit facilities and debt obligations(expire 2018 to 2028) 256 15 270 15
Performance guarantees 56 2 55 4
We also have obligations arising from sales of certain businessesand assets, including those from representations and warranties andrelated indemnities for environmental, health and safety, tax andemployment matters. The maximum potential payment related to theseobligations is not a specified amount as a number of the obligations donot contain financial caps. The carrying amount of liabilities related tothese obligations was $179 million and $171 million at December 31,2017 and December 31, 2016, respectively. For additional informationregarding the environmental indemnifications, see Note 18.
We accrue for costs associated with guarantees when it is prob-able that a liability has been incurred and the amount can be reasonablyestimated. The most likely cost to be incurred is accrued based on anevaluation of currently available facts, and where no amount within arange of estimates is more likely, the minimum is accrued. In accor-dance with the Guarantees Topic of the FASB ASC, we record theseliabilities at fair value.
We provide service and warranty policies on our products andextend performance and operating cost guarantees beyond our normalservice and warranty policies on some of our products, particularlycommercial aircraft engines. In addition, we incur discretionary costs toservice our products in connection with specific product performanceissues. Liabilities for performance and operating cost guarantees arebased upon future product performance and durability, and are largelyestimated based upon historical experience. Adjustments are made to
accruals as claim data and historical experience warrant. The changesin the carrying amount of service and product warranties and productperformance guarantees for the years ended December 31, 2017 and2016 are as follows:
(DOLLARS IN MILLIONS) 2017 2016
Balance as of January 1 $ 1,199 $ 1,212
Warranties and performance guarantees issued 323 246
Settlements made (207) (240)
Other 9 (19)
Balance as of December 31 $ 1,324 $ 1,199
NOTE 18: CONTINGENT LIABILITIES
Except as otherwise noted, while we are unable to predict the final out-come, based on information currently available, we do not believe thatresolution of any of the following matters will have a material adverseeffect upon our competitive position, results of operations, cash flows orfinancial condition.
Leases. We occupy space and use certain equipment under leasearrangements. Rental commitments of approximately $2.3 billion atDecember 31, 2017 under long-term non-cancelable operating leasesare payable as follows: $498 million in 2018, $430 million in 2019, $325million in 2020, $221 million in 2021, $143 million in 2022 and $635 mil-lion thereafter. Rent expense was $411 million in 2017 and $386 millionin 2016 and 2015.
Additional information pertaining to commercial aerospace rentalcommitments is included in Note 5 to the Consolidated FinancialStatements.
Environmental. Our operations are subject to environmentalregulation by federal, state and local authorities in the United States andregulatory authorities with jurisdiction over our foreign operations. Asdescribed in Note 1 to the Consolidated Financial Statements, we haveaccrued for the costs of environmental remediation activities, includingbut not limited to investigatory, remediation, operating and maintenancecosts and performance guarantees, and periodically reassess theseamounts. We believe that the likelihood of incurring losses materially inexcess of amounts accrued is remote. As of December 31, 2017 and2016, we had $830 million and $829 million reserved for environmentalremediation, respectively. Additional information pertaining to environ-mental matters is included in Note 1 to the Consolidated FinancialStatements.
Government. In the ordinary course of business, the Companyand its subsidiaries and our properties are subject to regulatory andgovernmental examinations, information gathering requests, inquiries,investigations and threatened legal actions and proceedings. Forexample, we are now, and believe that, in light of the current U.S. Gov-ernment contracting environment, we will continue to be the subject ofone or more U.S. Government investigations. Such U.S. Governmentinvestigations often take years to complete and could result in adminis-trative, civil or criminal liabilities, including repayments, fines, treble andother damages, forfeitures, restitution or penalties, or could lead to sus-pension or debarment of U.S. Government contracting privileges. Forinstance, if we or one of our business units were charged with wrongdo-
Notes to Consolidated Financial Statements
64 2017 Annual Report
ing as a result of any of these investigations or other governmentinvestigations (including violations of certain environmental or exportlaws) the U.S. Government could suspend us from bidding on or receiv-ing awards of new U.S. Government contracts pending the completionof legal proceedings. If convicted or found liable, the U.S. Governmentcould fine and debar us from new U.S. Government contracting for aperiod generally not to exceed three years. The U.S. Government alsoreserves the right to debar a contractor from receiving new governmentcontracts for fraudulent, criminal or other seriously improper conduct.The U.S. Government could void any contracts found to be tainted byfraud.
Our contracts with the U.S. Government are also subject to audits.Like many defense contractors, we have received audit reports, whichrecommend that certain contract prices should be reduced to complywith various government regulations, including because cost or pricingdata we submitted in negotiation of the contract prices or cost account-ing practices may not have conformed to government regulations, orthat certain payments be delayed or withheld. Some of these auditreports involved substantial amounts. We have made voluntary refundsin those cases we believe appropriate, have settled some allegationsand, in some cases, continue to negotiate and/or litigate. In addition, weaccrue for liabilities associated with those matters that are probable andcan be reasonably estimated. The most likely settlement amount to beincurred is accrued based upon a range of estimates. Where no amountwithin a range of estimates is more likely, then we accrued the minimumamount.
Legal Proceedings. Cost Accounting Standards Claim: As previ-ously disclosed, in December 2013, a Divisional AdministrativeContracting Officer of the United States Defense Contract ManagementAgency asserted a claim against Pratt & Whitney to recover overpay-ments of approximately $177 million plus interest (approximately $72.4million through December 31, 2017). The claim is based on Pratt &Whitney’s alleged noncompliance with cost accounting standards fromJanuary 1, 2005 to December 31, 2012, due to its method of determin-ing the cost of collaborator parts used in the calculation of materialoverhead costs for government contracts. On March 18, 2014, Pratt &Whitney filed an appeal to the Armed Services Board of ContractAppeals. Pratt & Whitney’s appeal is still pending and we continue tobelieve the government’s claim is without merit.
German Tax Litigation: As previously disclosed, UTC has beeninvolved in administrative review proceedings with the German TaxOffice, which concern approximately e215 million (approximately $256million) of tax benefits that we have claimed related to a 1998 reorgani-zation of the corporate structure of Otis operations in Germany. Uponaudit, these tax benefits were disallowed by the German Tax Office.UTC estimates interest associated with the aforementioned tax benefitsis an additional approximately e118 million (approximately $140 million).On August 3, 2012, we filed suit in the local German Tax Court (Berlin-Brandenburg). In March 2016, the local German Tax Court dismissedour suit, and we have appealed this decision to the German Federal TaxCourt (FTC). In 2015, UTC made tax and interest payments to Germantax authorities of e275 million (approximately $300 million) in order to
avoid additional interest accruals pending final resolution of this matter.In the meantime, we continue vigorously to litigate this matter.
Asbestos Matters: As previously disclosed, like many other indus-trial companies, we and our subsidiaries have been named asdefendants in lawsuits alleging personal injury as a result of exposure toasbestos integrated into certain of our products or business premises.While we have never manufactured asbestos and no longer incorporateit in any currently-manufactured products, certain of our historical prod-ucts, like those of many other manufacturers, have containedcomponents incorporating asbestos. A substantial majority of theseasbestos-related claims have been dismissed without payment or werecovered in full or in part by insurance or other forms of indemnity. Addi-tional cases were litigated and settled without any insurancereimbursement. The amounts involved in asbestos related claims werenot material individually or in the aggregate in any year.
Our estimated total liability to resolve all pending and unassertedpotential future asbestos claims through 2059 is approximately $344million and is principally recorded in Other long-term liabilities on ourConsolidated Balance Sheet as of December 31, 2017. This amount ison a pre-tax basis, not discounted, and excludes the Company’s legalfees to defend the asbestos claims (which will continue to be expensedby the Company as they are incurred). In addition, the Company has aninsurance recovery receivable for probable asbestos related recoveriesof approximately $120 million, which is included primarily in Otherassets on our Consolidated Balance Sheet as of December 31, 2017.
The amounts recorded by UTC for asbestos-related liabilities andinsurance recoveries are based on currently available information andassumptions that we believe are reasonable. Our actual liabilities orinsurance recoveries could be higher or lower than those recorded ifactual results vary significantly from the assumptions. Key variables inthese assumptions include the number and type of new claims to befiled each year, the outcomes or resolution of such claims, the averagecost of resolution of each new claim, the amount of insurance available,allocation methodologies, the contractual terms with each insurer withwhom we have reached settlements, the resolution of coverage issueswith other excess insurance carriers with whom we have not yetachieved settlements, and the solvency risk with respect to our insur-ance carriers. Other factors that may affect our future liability includeuncertainties surrounding the litigation process from jurisdiction to juris-diction and from case to case, legal rulings that may be made by stateand federal courts, and the passage of state or federal legislation. At theend of each year, the Company will evaluate all of these factors and,with input from an outside actuarial expert, make any necessary adjust-ments to both our estimated asbestos liabilities and insurancerecoveries.
Other. As described in Note 17 to the Consolidated FinancialStatements, we extend performance and operating cost guaranteesbeyond our normal warranty and service policies for extended periodson some of our products. We have accrued our estimate of the liabilitythat may result under these guarantees and for service costs that areprobable and can be reasonably estimated.
Notes to Consolidated Financial Statements
United Technologies Corporation 65
We also have other commitments and contingent liabilities relatedto legal proceedings, self-insurance programs and matters arising out ofthe normal course of business. We accrue contingencies based upon arange of possible outcomes. If no amount within this range is a betterestimate than any other, then we accrue the minimum amount. Of note,the design, development, production and support of new aerospacetechnologies is inherently complex and subject to risk. Since the Pure-Power PW1000G Geared TurboFan engine entered into service in2016, technical issues have been identified and experienced with theengine, which is usual for new engines and new aerospace technolo-gies. Pratt & Whitney has addressed these issues through variousimprovements and modifications. These issues have resulted in financialimpacts, including increased warranty provisions, customer contractsettlements, and reductions in contract performance estimates. Addi-tional technical issues have been identified, for which a reasonableestimate of the impact cannot currently be made, and such issues mayalso arise in the normal course, which may result in financial impactsthat could be material to the Company’s financial position, results ofoperations and cash flows.
In the ordinary course of business, the Company and its subsidiar-ies are also routinely defendants in, parties to or otherwise subject tomany pending and threatened legal actions, claims, disputes and pro-ceedings. These matters are often based on alleged violations ofcontract, product liability, warranty, regulatory, environmental, healthand safety, employment, intellectual property, tax and other laws. Insome of these proceedings, claims for substantial monetary damagesare asserted against the Company and its subsidiaries and could resultin fines, penalties, compensatory or treble damages or non-monetaryrelief. We do not believe that these matters will have a material adverseeffect upon our competitive position, results of operations, cash flows orfinancial condition.
NOTE 19: SEGMENT FINANCIAL DATA
Our operations for the periods presented herein are classified into fourprincipal segments. The segments are generally determined based onthe management structure of the businesses and the grouping of similaroperating companies, where each management organization has gen-eral operating autonomy over diversified products and services.
As discussed in Note 3, on November 6, 2015, we completed thesale of Sikorsky to Lockheed Martin Corp. The tables below exclude
amounts attributable to Sikorsky, which have been reclassified to Dis-continued Operations in the accompanying Consolidated Statement ofOperations.
Otis products include elevators, escalators, moving walkways andservice sold to customers in the commercial and residential propertyindustries around the world.
UTC Climate, Controls & Security products and related ser-vices include HVAC and refrigeration systems, building controls andautomation, fire and special hazard suppression systems and equip-ment, security monitoring and rapid response systems, provided to adiversified international customer base principally in the industrial, com-mercial and residential property and commercial transportation sectors.
Pratt & Whitney products include commercial, military, businessjet and general aviation aircraft engines, parts and services sold to adiversified customer base, including international and domestic com-mercial airlines and aircraft leasing companies, aircraft manufacturers,and U.S. and foreign governments. Pratt & Whitney also provides prod-uct support and a full range of overhaul, repair and fleet managementservices.
UTC Aerospace Systems provides aerospace products andaftermarket services for commercial, military, business jet and generalaviation customers worldwide. Products include electric power genera-tion, power management and distribution systems, air data and flightsensing and management systems, engine control systems, electricsystems, intelligence, surveillance and reconnaissance systems, enginecomponents, environmental control systems, fire and ice detection andprotection systems, propeller systems, aircraft aerostructures includingengine nacelles, thrust reversers, and mounting pylons, interior andexterior aircraft lighting, aircraft seating and cargo systems, actuationsystems, landing systems, including landing gears, wheels and brakes,and space products and subsystems. Aftermarket services includespare parts, overhaul and repair, engineering and technical support andfleet management solutions.
We have reported our financial and operational results for the peri-ods presented herein under the four principal segments noted above,consistent with how we have reviewed our business operations fordecision-making purposes, resource allocation and performanceassessment during 2017.
Notes to Consolidated Financial Statements
66 2017 Annual Report
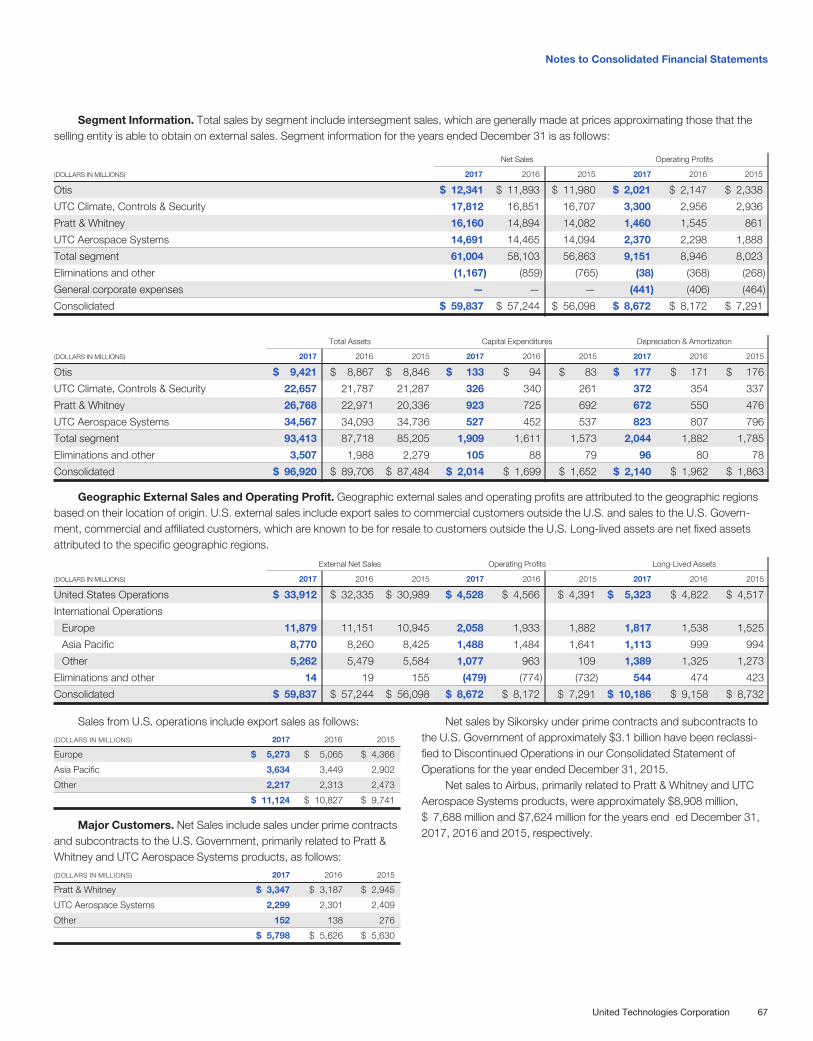
Segment Information. Total sales by segment include intersegment sales, which are generally made at prices approximating those that theselling entity is able to obtain on external sales. Segment information for the years ended December 31 is as follows:
Net Sales Operating Profits
(DOLLARS IN MILLIONS) 2017 2016 2015 2017 2016 2015
Otis $ 12,341 $ 11,893 $ 11,980 $ 2,021 $ 2,147 $ 2,338
UTC Climate, Controls & Security 17,812 16,851 16,707 3,300 2,956 2,936
Pratt & Whitney 16,160 14,894 14,082 1,460 1,545 861
UTC Aerospace Systems 14,691 14,465 14,094 2,370 2,298 1,888
Total segment 61,004 58,103 56,863 9,151 8,946 8,023
Eliminations and other (1,167) (859) (765) (38) (368) (268)
General corporate expenses — — — (441) (406) (464)
Consolidated $ 59,837 $ 57,244 $ 56,098 $ 8,672 $ 8,172 $ 7,291
Total Assets Capital Expenditures Depreciation & Amortization
(DOLLARS IN MILLIONS) 2017 2016 2015 2017 2016 2015 2017 2016 2015
Otis $ 9,421 $ 8,867 $ 8,846 $ 133 $ 94 $ 83 $ 177 $ 171 $ 176
UTC Climate, Controls & Security 22,657 21,787 21,287 326 340 261 372 354 337
Pratt & Whitney 26,768 22,971 20,336 923 725 692 672 550 476
UTC Aerospace Systems 34,567 34,093 34,736 527 452 537 823 807 796
Total segment 93,413 87,718 85,205 1,909 1,611 1,573 2,044 1,882 1,785
Eliminations and other 3,507 1,988 2,279 105 88 79 96 80 78
Consolidated $ 96,920 $ 89,706 $ 87,484 $ 2,014 $ 1,699 $ 1,652 $ 2,140 $ 1,962 $ 1,863
Geographic External Sales and Operating Profit. Geographic external sales and operating profits are attributed to the geographic regionsbased on their location of origin. U.S. external sales include export sales to commercial customers outside the U.S. and sales to the U.S. Govern-ment, commercial and affiliated customers, which are known to be for resale to customers outside the U.S. Long-lived assets are net fixed assetsattributed to the specific geographic regions.
External Net Sales Operating Profits Long-Lived Assets
(DOLLARS IN MILLIONS) 2017 2016 2015 2017 2016 2015 2017 2016 2015
United States Operations $ 33,912 $ 32,335 $ 30,989 $ 4,528 $ 4,566 $ 4,391 $ 5,323 $ 4,822 $ 4,517
International Operations
Europe 11,879 11,151 10,945 2,058 1,933 1,882 1,817 1,538 1,525
Asia Pacific 8,770 8,260 8,425 1,488 1,484 1,641 1,113 999 994
Other 5,262 5,479 5,584 1,077 963 109 1,389 1,325 1,273
Eliminations and other 14 19 155 (479) (774) (732) 544 474 423
Consolidated $ 59,837 $ 57,244 $ 56,098 $ 8,672 $ 8,172 $ 7,291 $ 10,186 $ 9,158 $ 8,732
Sales from U.S. operations include export sales as follows:
(DOLLARS IN MILLIONS) 2017 2016 2015
Europe $ 5,273 $ 5,065 $ 4,366
Asia Pacific 3,634 3,449 2,902
Other 2,217 2,313 2,473
$ 11,124 $ 10,827 $ 9,741
Major Customers. Net Sales include sales under prime contractsand subcontracts to the U.S. Government, primarily related to Pratt &Whitney and UTC Aerospace Systems products, as follows:
(DOLLARS IN MILLIONS) 2017 2016 2015
Pratt & Whitney $ 3,347 $ 3,187 $ 2,945
UTC Aerospace Systems 2,299 2,301 2,409
Other 152 138 276
$ 5,798 $ 5,626 $ 5,630
Net sales by Sikorsky under prime contracts and subcontracts tothe U.S. Government of approximately $3.1 billion have been reclassi-fied to Discontinued Operations in our Consolidated Statement ofOperations for the year ended December 31, 2015.
Net sales to Airbus, primarily related to Pratt & Whitney and UTCAerospace Systems products, were approximately $8,908 million,$ 7,688 million and $7,624 million for the years end ed December 31,2017, 2016 and 2015, respectively.
Notes to Consolidated Financial Statements
United Technologies Corporation 67
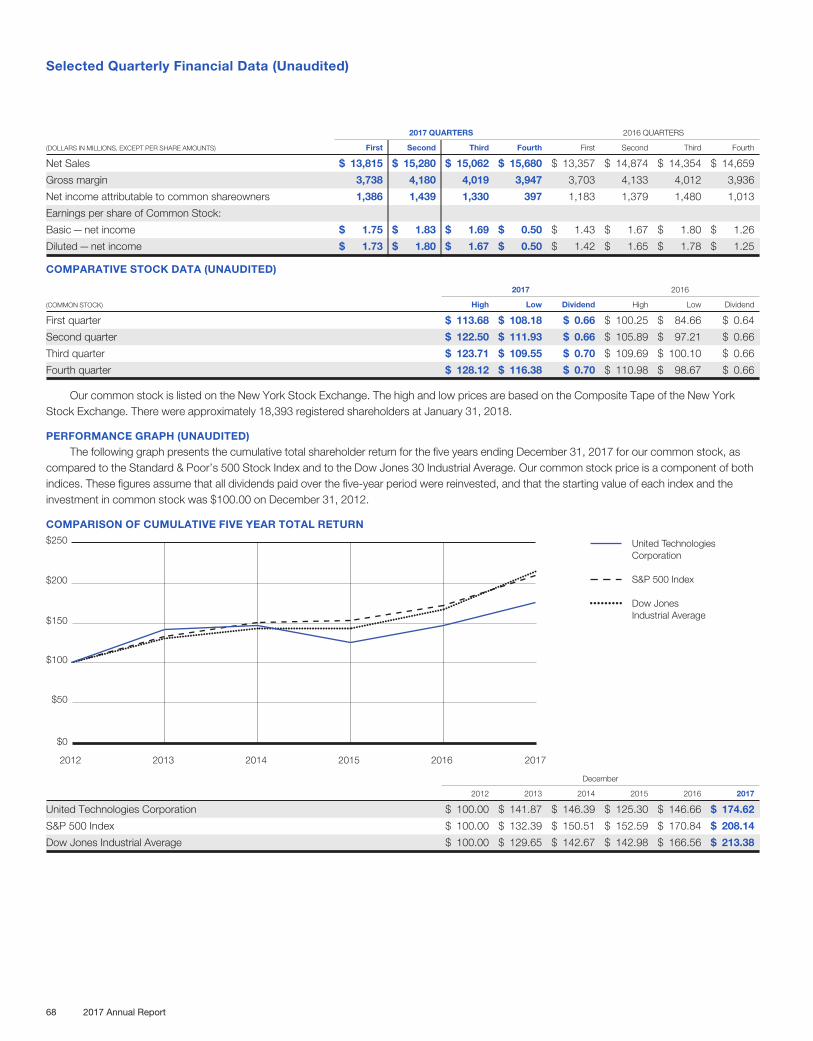
2017 QUARTERS 2016 QUARTERS
(DOLLARS IN MILLIONS, EXCEPT PER SHARE AMOUNTS) First Second Third Fourth First Second Third Fourth
Net Sales $ 13,815 $ 15,280 $ 15,062 $ 15,680 $ 13,357 $ 14,874 $ 14,354 $ 14,659
Gross margin 3,738 4,180 4,019 3,947 3,703 4,133 4,012 3,936
Net income attributable to common shareowners 1,386 1,439 1,330 397 1,183 1,379 1,480 1,013
Earnings per share of Common Stock:
Basic—net income $ 1.75 $ 1.83 $ 1.69 $ 0.50 $ 1.43 $ 1.67 $ 1.80 $ 1.26
Diluted—net income $ 1.73 $ 1.80 $ 1.67 $ 0.50 $ 1.42 $ 1.65 $ 1.78 $ 1.25
COMPARATIVE STOCK DATA (UNAUDITED)
2017 2016
(COMMON STOCK) High Low Dividend High Low Dividend
First quarter $ 113.68 $ 108.18 $ 0.66 $ 100.25 $ 84.66 $ 0.64
Second quarter $ 122.50 $ 111.93 $ 0.66 $ 105.89 $ 97.21 $ 0.66
Third quarter $ 123.71 $ 109.55 $ 0.70 $ 109.69 $ 100.10 $ 0.66
Fourth quarter $ 128.12 $ 116.38 $ 0.70 $ 110.98 $ 98.67 $ 0.66
Our common stock is listed on the New York Stock Exchange. The high and low prices are based on the Composite Tape of the New YorkStock Exchange. There were approximately 18,393 registered shareholders at January 31, 2018.
PERFORMANCE GRAPH (UNAUDITED)The following graph presents the cumulative total shareholder return for the five years ending December 31, 2017 for our common stock, as
compared to the Standard & Poor’s 500 Stock Index and to the Dow Jones 30 Industrial Average. Our common stock price is a component of bothindices. These figures assume that all dividends paid over the five-year period were reinvested, and that the starting value of each index and theinvestment in common stock was $100.00 on December 31, 2012.
COMPARISON OF CUMULATIVE FIVE YEAR TOTAL RETURN
December
2012 2013 2014 2015 2016 2017
United Technologies Corporation $ 100.00 $ 141.87 $ 146.39 $ 125.30 $ 146.66 $ 174.62
S&P 500 Index $ 100.00 $ 132.39 $ 150.51 $ 152.59 $ 170.84 $ 208.14
Dow Jones Industrial Average $ 100.00 $ 129.65 $ 142.67 $ 142.98 $ 166.56 $ 213.38
$0
$50
$100
$150
$200
$250
201720162015201420132012
United Technologies Corporation
S&P 500 Index
Dow Jones Industrial Average
Selected Quarterly Financial Data (Unaudited)
68 2017 Annual Report
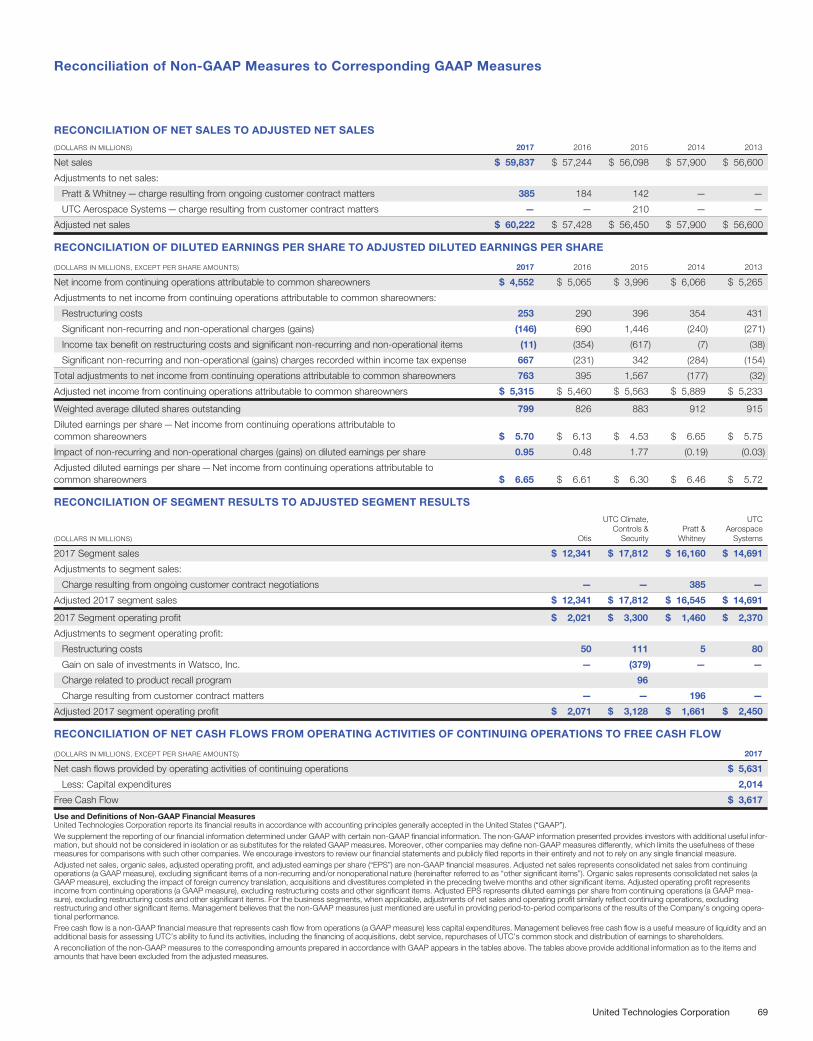
RECONCILIATION OF NET SALES TO ADJUSTED NET SALES
(DOLLARS IN MILLIONS) 2017 2016 2015 2014 2013
Net sales $ 59,837 $ 57,244 $ 56,098 $ 57,900 $ 56,600
Adjustments to net sales:
Pratt & Whitney—charge resulting from ongoing customer contract matters 385 184 142 — —
UTC Aerospace Systems—charge resulting from customer contract matters — — 210 — —
Adjusted net sales $ 60,222 $ 57,428 $ 56,450 $ 57,900 $ 56,600
RECONCILIATION OF DILUTED EARNINGS PER SHARE TO ADJUSTED DILUTED EARNINGS PER SHARE
(DOLLARS IN MILLIONS, EXCEPT PER SHARE AMOUNTS) 2017 2016 2015 2014 2013
Net income from continuing operations attributable to common shareowners $ 4,552 $ 5,065 $ 3,996 $ 6,066 $ 5,265
Adjustments to net income from continuing operations attributable to common shareowners:
Restructuring costs 253 290 396 354 431
Significant non-recurring and non-operational charges (gains) (146) 690 1,446 (240) (271)
Income tax benefit on restructuring costs and significant non-recurring and non-operational items (11) (354) (617) (7) (38)
Significant non-recurring and non-operational (gains) charges recorded within income tax expense 667 (231) 342 (284) (154)
Total adjustments to net income from continuing operations attributable to common shareowners 763 395 1,567 (177) (32)
Adjusted net income from continuing operations attributable to common shareowners $ 5,315 $ 5,460 $ 5,563 $ 5,889 $ 5,233
Weighted average diluted shares outstanding 799 826 883 912 915
Diluted earnings per share—Net income from continuing operations attributable tocommon shareowners $ 5.70 $ 6.13 $ 4.53 $ 6.65 $ 5.75
Impact of non-recurring and non-operational charges (gains) on diluted earnings per share 0.95 0.48 1.77 (0.19) (0.03)
Adjusted diluted earnings per share—Net income from continuing operations attributable tocommon shareowners $ 6.65 $ 6.61 $ 6.30 $ 6.46 $ 5.72
RECONCILIATION OF SEGMENT RESULTS TO ADJUSTED SEGMENT RESULTS
(DOLLARS IN MILLIONS) Otis
UTC Climate,Controls &
SecurityPratt &
Whitney
UTCAerospace
Systems
2017 Segment sales $ 12,341 $ 17,812 $ 16,160 $ 14,691
Adjustments to segment sales:
Charge resulting from ongoing customer contract negotiations — — 385 —
Adjusted 2017 segment sales $ 12,341 $ 17,812 $ 16,545 $ 14,691
2017 Segment operating profit $ 2,021 $ 3,300 $ 1,460 $ 2,370
Adjustments to segment operating profit:
Restructuring costs 50 111 5 80
Gain on sale of investments in Watsco, Inc. — (379) — —
Charge related to product recall program 96
Charge resulting from customer contract matters — — 196 —
Adjusted 2017 segment operating profit $ 2,071 $ 3,128 $ 1,661 $ 2,450
RECONCILIATION OF NET CASH FLOWS FROM OPERATING ACTIVITIES OF CONTINUING OPERATIONS TO FREE CASH FLOW
(DOLLARS IN MILLIONS, EXCEPT PER SHARE AMOUNTS) 2017
Net cash flows provided by operating activities of continuing operations $ 5,631
Less: Capital expenditures 2,014
Free Cash Flow $ 3,617
Use and Definitions of Non-GAAP Financial MeasuresUnited Technologies Corporation reports its financial results in accordance with accounting principles generally accepted in the United States (“GAAP”).We supplement the reporting of our financial information determined under GAAP with certain non-GAAP financial information. The non-GAAP information presented provides investors with additional useful infor-mation, but should not be considered in isolation or as substitutes for the related GAAP measures. Moreover, other companies may define non-GAAP measures differently, which limits the usefulness of thesemeasures for comparisons with such other companies. We encourage investors to review our financial statements and publicly filed reports in their entirety and not to rely on any single financial measure.Adjusted net sales, organic sales, adjusted operating profit, and adjusted earnings per share (“EPS”) are non-GAAP financial measures. Adjusted net sales represents consolidated net sales from continuingoperations (a GAAP measure), excluding significant items of a non-recurring and/or nonoperational nature (hereinafter referred to as “other significant items”). Organic sales represents consolidated net sales (aGAAP measure), excluding the impact of foreign currency translation, acquisitions and divestitures completed in the preceding twelve months and other significant items. Adjusted operating profit representsincome from continuing operations (a GAAP measure), excluding restructuring costs and other significant items. Adjusted EPS represents diluted earnings per share from continuing operations (a GAAP mea-sure), excluding restructuring costs and other significant items. For the business segments, when applicable, adjustments of net sales and operating profit similarly reflect continuing operations, excludingrestructuring and other significant items. Management believes that the non-GAAP measures just mentioned are useful in providing period-to-period comparisons of the results of the Company’s ongoing opera-tional performance.Free cash flow is a non-GAAP financial measure that represents cash flow from operations (a GAAP measure) less capital expenditures. Management believes free cash flow is a useful measure of liquidity and anadditional basis for assessing UTC’s ability to fund its activities, including the financing of acquisitions, debt service, repurchases of UTC’s common stock and distribution of earnings to shareholders.A reconciliation of the non-GAAP measures to the corresponding amounts prepared in accordance with GAAP appears in the tables above. The tables above provide additional information as to the items andamounts that have been excluded from the adjusted measures.
Reconciliation of Non-GAAP Measures to Corresponding GAAP Measures
United Technologies Corporation 69
Lloyd J. Austin III
General, U.S. Army (Ret.)and former Commander ofU.S. Central Command(Military Leadership)
Diane M. Bryant
Chief Operating OfficerGoogle Cloud(Cloud Computing Services)
John V. Faraci
Retired Chairman &Chief Executive OfficerInternational Paper(Paper, Packaging and Distribution)
Jean-Pierre Garnier
ChairmanIdorsia Pharmaceuticals Ltd.(Biopharmaceuticals)
Gregory J. Hayes
Chairman & CEOUnited Technologies Corp.(Diversified Manufacturer)
Edward A. Kangas
Lead DirectorUnited Technologies Corp.Former Chairman & CEODeloitte, Touche, Tohmatsu(Audit, Tax Services and Consulting)
Ellen J. Kullman
Retired Chair & Chief Executive OfficerE. I. du Pont de Nemours and Company(Diversified Chemicals and Materials)
Marshall O. Larsen
Retired Chairman, President &Chief Executive OfficerGoodrich Corporation(Aerospace and Defense Systemsand Services)
Harold W. McGraw III
Chairman EmeritusS&P Global Inc.(formerly McGraw Hill Financial, Inc.)(Ratings, Benchmarks and Analyticsfor Financial Markets)
Margaret L. O’Sullivan
Jeane Kirkpatrick Professor of thePractice of International Affairs andDirector of the Geopolitics ofEnergy ProjectHarvard University Kennedy School(Higher Education)
Fredric G. Reynolds
Retired Executive Vice President &Chief Financial OfficerCBS Corporation(Media)
Brian C. Rogers
Non-Executive ChairmanT. Rowe Price Group, Inc.(Investment Management)
Christine Todd Whitman
PresidentThe Whitman Strategy Group(Environment and Public Policy Consulting)Former EPA AdministratorFormer Governor of New Jersey
COMMITTEES
Audit Committee
Edward A. Kangas, ChairLloyd J. Austin IIIDiane M. BryantMarshall O. LarsenMargaret L. O’SullivanFredric G. Reynolds
Compensation Committee
Jean-Pierre Garnier, ChairJohn V. FaraciEdward A. KangasEllen J. KullmanHarold W. McGraw IIIBrian C. Rogers
Committee on Governanceand Public Policy
Ellen J. Kullman, ChairLloyd J. Austin IIIJean-Pierre GarnierHarold W. McGraw IIIMargaret L. O’SullivanChristine Todd Whitman
Executive Committee
Gregory J. Hayes, ChairJohn V. FaraciJean-Pierre GarnierEdward A. KangasEllen J. Kullman
Finance Committee
John V. Faraci, ChairDiane M. BryantGregory J. HayesMarshall O. LarsenFredric G. ReynoldsBrian C. RogersChristine Todd Whitman
Board of Directors
70 2017 Annual Report
Gregory J. Hayes*Chairman & CEO
Elizabeth B. Amato*Executive Vice President &Chief Human Resources Officer
Robert J. Bailey*Corporate Vice PresidentController
Vincent M. CampisiSenior Vice PresidentDigital & Chief Information Officer
Paul EremenkoSenior Vice President &Chief Technology Officer
Nora R. DannehyCorporate Vice PresidentGlobal Compliance
Robin L. DiamonteCorporate Vice PresidentPension Investments
*Executive Officer
Michael R. Dumais*Executive Vice PresidentOperations & Strategy
Charles D. Gill Jr.*Executive Vice President &General Counsel
David L. Gitlin*PresidentUTC Aerospace Systems
Peter J. Graber-LippermanCorporate Vice President,Secretary & AssociateGeneral Counsel
Akhil Johri*Executive Vice President &Chief Financial Officer
George Ross KearneyCorporate Vice PresidentTax
Robert F. Leduc*PresidentPratt & Whitney
Susan MackiewiczCorporate Vice PresidentInternal Audit
Judith F. Marks*PresidentOtis
Timothy J. McBrideSenior Vice PresidentGovernment Relations
Robert J. McDonough*PresidentUTC Climate, Controls & Security
Kelli ParsonsSenior Vice President &Chief Communications Officer
David R. Whitehouse*Corporate Vice PresidentTreasurer
Leadership
United Technologies Corporation 71
CORPORATE OFFICEUnited Technologies Corporation10 Farm Springs RoadFarmington, CT 06032860.728.7000www.utc.com
This report is made available to shareowners in advance of the annualmeeting of shareowners to be held at 8 a.m., April 30, 2018, in PalmBeach Gardens, Fla. The proxy statement will be made available toshareowners on or about March 19, 2018, at which time proxies forthe meeting will be requested.
STOCK LISTINGNew York Stock Exchange (ticker symbol UTX)
TRANSFER AGENT AND REGISTRARComputershare Trust Company, N.A., is the transfer agent, registrarand dividend disbursing agent for UTC’s common stock. Questions andcommunications from registered shareowners regarding transfer ofstock, replacement of lost certificates, dividends, address changes, andthe Stock Purchase and Dividend Reinvestment Plan administered byComputershare should be directed to:
Computershare Trust Company, N.A.250 Royall StreetCanton, MA 02021800.488.9281781.575.2724 (outside U.S.)800.952.9245 (TDD)www.computershare.com/investor
DIVIDENDSDividends are usually paid on the 10th day of March, June, Septemberand December.
ELECTRONIC ACCESS OR DELIVERY OF SHAREOWNERCOMMUNICATIONSRegistered shareowners can help conserve natural resources andreduce printing and mailing costs incurred by UTC by signing upfor electronic communications, including annual meeting materials,stock plan statements and tax documents at:www.computershare-na.com/green.
Beneficial shareowners may be able to request electronic access ordelivery by contacting their broker or bank, or Broadridge FinancialSolutions at: http://enroll.icsdelivery.com/utc.
2017 ANNUAL REPORT ON FORM 10-KCopies of the UTC Annual Report on Form 10-K as filed with theU.S. Securities and Exchange Commission can be accessed anddownloaded via our website at: http://ir.utc.com/investors/sec.cfm.
Copies can also be obtained, without charge, from:
UTC Corporate SecretaryUnited Technologies Corporation10 Farm Springs RoadFarmington, CT [email protected]
INVESTOR RELATIONSUnited Technologies Corporation10 Farm Springs RoadFarmington, CT [email protected]
ENVIRONMENTALLY FRIENDLY REPORTThis annual report is printed on recycled and recyclable paper.
www.utc.comwww.ccs.utc.comwww.otis.comwww.pw.utc.comwww.utcaerospacesystems.com
Shareowner Information
72 2017 Annual Report
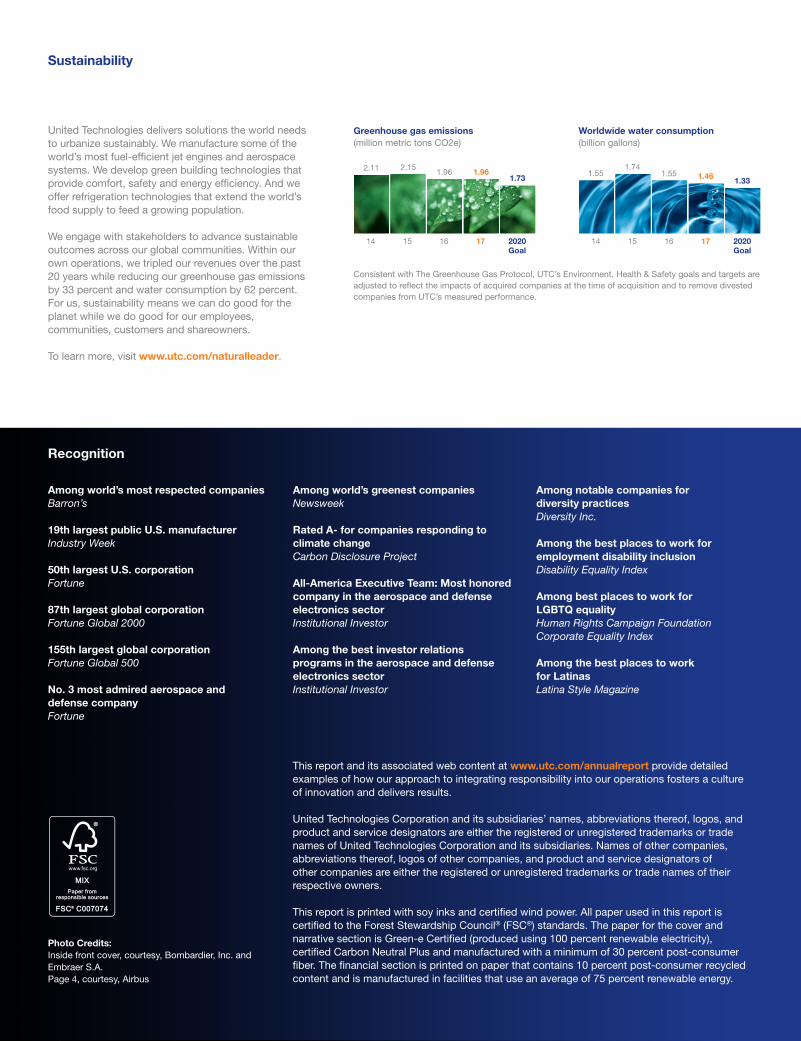
Sustainability
Recognition
United Technologies delivers solutions the world needs to urbanize sustainably. We manufacture some of the world’s most fuel-efficient jet engines and aerospace systems. We develop green building technologies that provide comfort, safety and energy efficiency. And we offer refrigeration technologies that extend the world’s food supply to feed a growing population.
We engage with stakeholders to advance sustainable outcomes across our global communities. Within our own operations, we tripled our revenues over the past 20 years while reducing our greenhouse gas emissions by 33 percent and water consumption by 62 percent. For us, sustainability means we can do good for the planet while we do good for our employees, communities, customers and shareowners.
To learn more, visit www.utc.com/naturalleader.
Among world’s most respected companiesBarron’s
19th largest public U.S. manufacturerIndustry Week
50th largest U.S. corporationFortune
87th largest global corporationFortune Global 2000
155th largest global corporation Fortune Global 500
No. 3 most admired aerospace and defense companyFortune
This report and its associated web content at www.utc.com/annualreport provide detailed examples of how our approach to integrating responsibility into our operations fosters a culture of innovation and delivers results.
United Technologies Corporation and its subsidiaries’ names, abbreviations thereof, logos, and product and service designators are either the registered or unregistered trademarks or trade names of United Technologies Corporation and its subsidiaries. Names of other companies, abbreviations thereof, logos of other companies, and product and service designators of other companies are either the registered or unregistered trademarks or trade names of their respective owners.
This report is printed with soy inks and certified wind power. All paper used in this report is certified to the Forest Stewardship Council® (FSC®) standards. The paper for the cover and narrative section is Green-e Certified (produced using 100 percent renewable electricity), certified Carbon Neutral Plus and manufactured with a minimum of 30 percent post-consumer fiber. The financial section is printed on paper that contains 10 percent post-consumer recycled content and is manufactured in facilities that use an average of 75 percent renewable energy.
Photo Credits:Inside front cover, courtesy, Bombardier, Inc. and Embraer S.A.Page 4, courtesy, Airbus
Among world’s greenest companiesNewsweek
Rated A- for companies responding to climate changeCarbon Disclosure Project
All-America Executive Team: Most honored company in the aerospace and defense electronics sectorInstitutional Investor
Among the best investor relations programs in the aerospace and defense electronics sectorInstitutional Investor
Among notable companies for diversity practices Diversity Inc.
Among the best places to work for employment disability inclusionDisability Equality Index
Among best places to work for LGBTQ equalityHuman Rights Campaign Foundation Corporate Equality Index
Among the best places to work for LatinasLatina Style Magazine
Consistent with The Greenhouse Gas Protocol, UTC’s Environment, Health & Safety goals and targets are adjusted to reflect the impacts of acquired companies at the time of acquisition and to remove divested companies from UTC’s measured performance.
Greenhouse gas emissions (million metric tons CO2e)
14 15 16 17 2020 Goal
2.11 2.151.96 1.96
1.73
Worldwide water consumption (billion gallons)
14 15 16 17 2020 Goal
1.551.74
1.55 1.46 1.33

10 Farm Springs Road Farmington, CT 06032 USA www.utc.com
OtisPratt & WhitneyUTC Aerospace SystemsUTC Climate, Controls & Security
United
Technolo
gies C
orp
oratio
n 2017 Annual R
epo
rt