Embed Size (px)
Citation preview
University of ArkAnsAs systemConsolidated Financial StatementsFY2015-16
UAMThe University of Arkansas at Monticello
Monticello • Crossett • McGehee
BOARD OF TRUSTEES
Reynie Rutledge Chairman
David H. Pryor Vice Chairman
Morril Harriman Secretary
Mark Waldrip Assistant Secretary
Ben Hyneman
John C. Goodson
Dr. Stephen A. Broughton
Charles “Cliff” Gibson, III
Sheffield Nelson
Kelly Eichler
ADMINISTRATIVE OFFICERSDonald R. Bobbitt President
Michael K. MooreVice President for Academic Affairs
Barbara A. GoswickVice President for Finance & CFO
Ann KempVice President for Administration
Melissa K. RustVice President for University Relations
Fred H. Harrison General Counsel
Reynie Rutledge, Board Chairman
Dr. Donald R. Bobbitt, President
1
Table of Contents
Board of Trustees & Administrative Officers Inside Front CoverLetter of Transmittal 2Independent Auditor’s Report 3Management Discussion & Analysis 5Five Year Summary of Key Data 14
Consolidated Financial Statements Statement of Net Position 16 Statement of Revenues, Expenses, and Changes in Net Position 17 Statement of Cash Flows 18
Discreetly Presented Component Units University of Arkansas Foundation, Inc 20 University of Arkansas Fayetteville Campus Foundation, Inc 21
Campus Financial Statements Statement of Net Position 22 Statement of Revenues, Expenses, and Changes in Net Position 23 Statement of Cash Flows 24
Notes to Financial Statements Note 1: Summary of Significant Accounting Policies 26 Note 2: Reporting Entity 29 Note 3: Hospital Revenue 30 Note 4: Compensated Absences 32 Note 5: Cash, Cash Equivalents and Investments 34 Note 6: Fair Value Measurement 38 Note 7: Income Taxes 40 Note 8: Bonds, Notes, Capital Leases and Installment Contracts 41 Note 9: Commitments 52 Note 10: Short-Term Borrowing 52 Note 11: Capital Assets 53 Note 12: Risk Management 54 Note 13: Employee Benefits 54 Note 14: Defined Benefit Pension Plans 57 Note 15: Other Postemployment Benefits (OPEB) 64 Note 16: Other Organizations 67 Note 17: Natural & Functional Classification of Operating Expenses 76 Note 18: Contingencies 76 Note 19: Elimination of Inter-Company Transactions 77 Note 20: Disaggregation of Accounts Receivable and Accounts Payable 78 Note 21: Joint Endeavor 78 Note 22: Related Parties 79 Note 23: Prior Year Restatement 79 Note 24: Subsequent Events 80
Required Supplementary Information 81
Supplemental Information – Campuses & Affiliates 85
Campus Administrators Inside back cover
2
2
December 2, 2016
Board of Trustees President Donald R. Bobbitt It is my pleasure to transmit to you the Consolidated Financial Report of the University of Arkansas System for the fiscal year ended June 30, 2016. The data presented, including the Management Discussion and Analysis, Statement of Net Position, Statement of Revenues, Expenses, and Changes in Net Position, and Statement of Cash Flows, are exhibited on a consolidated basis and include all components of the UA System: UAF (University of Arkansas Fayetteville, including Agricultural Experiment Station, Cooperative Extension Service, Arkansas Archeological Survey, Criminal Justice Institute, and Clinton School of Public Service), UAFS (University of Arkansas at Fort Smith), UALR (University of Arkansas at Little Rock), UAMS (University of Arkansas for Medical Sciences), UAM (University of Arkansas at Monticello), UAPB (University of Arkansas at Pine Bluff), CCCUA (Cossatot Community College of the University of Arkansas), PCCUA (Phillips Community College of the University of Arkansas), UACCB (University of Arkansas Community College at Batesville), UACCH (University of Arkansas Community College at Hope), UACCM (University of Arkansas Community College at Morrilton), ASMSA (Arkansas School for Mathematics, Sciences and the Arts), and SYSTEM (University of Arkansas System Administration, including University of Arkansas System eVersity). These statements were prepared in accordance with generally accepted accounting principles as prescribed by the Governmental Accounting Standards Board (GASB). The financial statements used to prepare the consolidated report, except for the Medical Sciences campus and the discretely presented component units, were audited by the Arkansas Division of Legislative Audit. The financial statements from the Medical Sciences campus were audited by PricewaterhouseCoopers LLP. All received unqualified audit opinions.
Barbara A. Goswick, CPA Vice President for Finance & CFO
2
33
500 WOODLANE STREET, SUITE 172 • LITTLE ROCK, ARKANSAS 72201-1099 • PHONE: (501) 683-8600 • FAX: (501) 683-8605www.arklegaudit.gov
Sen. Jimmy Hickey, Jr.Senate Chair
Sen. Linda ChesterfieldSenate Vice Chair
Roger A. Norman, JD, CPA, CFE, CFFLegislative Auditor
LEGISLATIVE JOINT AUDITING COMMITTEEARKANSAS LEGISLATIVE AUDIT
Rep. Mary BroadawayHouse Chair
Rep. Sue ScottHouse Vice Chair
INDEPENDENT AUDITOR'S REPORT
University of Arkansas SystemLegislative Joint Auditing Committee
Report on the Financial Statements
We have audited the accompanying financial statements of the business-type activities and the aggregate discretely presented component units of the University of Arkansas System (University), an institution of higher education of the State of Arkansas, as of and for the year ended June 30, 2016, and the related notes to the financial statements, which collectively comprise the University’s basic financial statements as listed in the table of contents.
Management’s Responsibility for the Financial Statements
Management is responsible for the preparation and fair presentation of these financial statements in accordance with accounting principles generally accepted in the United States of America; this includes the design, implementation, and maintenance of internal control relevant to the preparation and fair presentation of financial statements that are free from material misstatement, whether due to fraud or error.
Auditor’s Responsibility
Our responsibility is to express opinions on these financial statements based on our audit. We did not audit the financial statements of the University of Arkansas for Medical Sciences, a unit of the System, whose statements reflect total assets and revenues constituting 33% and 52%, respectively, of the related combined totals. Additionally, we did not audit the financial statements of the University of Arkansas Foundation, Inc. and the University of Arkansas Fayetteville Campus Foundation, Inc., which represent 100% of the assets and revenues of the aggregate discretely presented component units. Those statements were audited by other auditors whose reports have been furnished to us, and our opinion, insofar as it relates to the amounts included for the University of Arkansas for Medical Sciences, the University of Arkansas Foundation, Inc., and the University of Arkansas Fayetteville Campus Foundation, Inc., is based solely on the reports of the other auditors. We conducted our audit in accordance with auditing standards generally accepted in the United States of America and the standards applicable to financial audits contained in Government Auditing Standards, issued by the Comptroller General of the United States. Those standards require that we plan and perform the audit to obtain reasonable assurance about whether the financial statements are free from material misstatement. The financial statements of the University of Arkansas Foundation, Inc. and the University of Arkansas Fayetteville Campus Foundation, Inc. were not audited in accordance with Government Auditing Standards.
An audit involves performing procedures to obtain audit evidence about the amounts and disclosures in the financial statements. The procedures selected depend on the auditor’s judgment, including the assessment of the risks of material misstatement of the financial statements, whether due to fraud or error. In making those risk assessments, the auditor considers internal control relevant to the entity’s preparation and fair presentation of the financial statements in order to design audit procedures that are appropriate in the circumstances, but not for the purpose of expressing an opinion on the effectiveness of the entity’s internal control. Accordingly, we express no such opinion. An audit also includes evaluating the appropriateness of accounting policies used and the reasonableness of significant accounting estimates made by management, as well as evaluating the overall presentation of the financial statements.
We believe that the audit evidence we have obtained is sufficient and appropriate to provide a basis for our audit opinions.
Opinions
In our opinion, based on our audit and the reports of other auditors, the financial statements referred to above present fairly, in all material respects, the respective financial position of the business-type activities and the aggregate discretely presented component units of the University as of June 30, 2016, and the respective changes in financial position, and where applicable, cash flows thereof for the year then ended in accordance with accounting principles generally accepted in the United States of America.
44
- 2 -
Emphasis of Matter
As discussed in Notes 1 and 6 to the financial statements, the University implemented Governmental Accounting Standards Board(GASB) Statement no. 72, Fair Value Measurement and Application, during the year ended June 30, 2016. No restatement of the University’s beginning net position was required due to the adoption of this Statement. Our opinion is not modified with respect to this matter.
Other Matters
Prior Year Comparative Information
We have previously audited the University’s 2015 financial statements, and we expressed unmodified opinions on the respective financial statements of the business-type activities and the aggregate discretely presented component units in our report dated November 16, 2015. In our opinion, the comparative information presented herein as of and for the year ended June 30, 2015, is consistent, in all material respects, with the audited financial statements from which it has been derived.
Required Supplementary Information
Accounting principles generally accepted in the United States of America require that the Management’s Discussion and Analysis, certain information pertaining to pensions, and certain information pertaining to postemployment benefits other than pensions be presented to supplement the basic financial statements. Such information, although not a part of the basic financial statements, is required by the Governmental Accounting Standards Board who considers it to be an essential part of financial reporting for placing the basic financial statements in an appropriate operational, economic, or historical context. We and other auditors have applied certain limited procedures to the required supplementary information in accordance with auditing standards generally accepted in the United States of America, which consisted of inquiries of management about the methods of preparing the information and comparing the information for consistency with management’s responses to our inquiries, the basic financial statements, and other knowledge we obtained during our audit of the basic financial statements. We do not express an opinion or provide any assurance on the information because the limited procedures do not provide us with sufficient evidence to express an opinion or provide any assurance.
Other Information
Our audit was conducted for the purpose of forming opinions on the financial statements that collectively comprise the University’s basic financial statements. The Statement of Net Position by Campus, the Statement of Revenues, Expenses, and Changes in Net Position by Campus, and the Statement of Cash Flows – Direct Method - by Campus are presented for purposes of additional analysis and are not a required part of the basic financial statements.
The Statement of Net Position by Campus, the Statement of Revenues, Expenses, and Changes in Net Position by Campus, and the Statement of Cash Flows – Direct Method – by Campus are the responsibility of management and were derived from and relate directly to the underlying accounting and other records used to prepare the basic financial statements. Such information has been subjected to the auditing procedures applied in the audit of the basic financial statements and certain additional procedures, including comparing and reconciling such information directly to the underlying accounting and other records used to prepare the basic financial statements or to the basic financial statements themselves, and other additional procedures in accordance with auditing standards generally accepted inthe United States of America. In our opinion, the Statement of Net Position by Campus, the Statement of Revenues, Expenses, andChanges in Net Position by Campus, and the Statement of Cash Flows – Direct Method – by Campus are fairly stated, in all material respects, in relation to the basic financial statements as a whole.
Other Reporting Required by Government Auditing Standards
In accordance with Government Auditing Standards, we have also issued our report dated November 14, 2016 on our consideration of the University’s internal control over financial reporting and on our tests of its compliance with certain provisions of laws, regulations, contracts, and grant agreements and other matters. The purpose of that report is to describe the scope of our testing of internal control over financial reporting and compliance and the results of that testing, and not to provide an opinion on internal control over financial reporting or on compliance. That report is an integral part of an audit performed in accordance with Government Auditing Standards in considering the University’s internal control over financial reporting and compliance.
ARKANSAS LEGISLATIVE AUDIT
Roger A. Norman, JD, CPA, CFELegislative Auditor
Little Rock, ArkansasNovember 14, 2016EDHE14116
55
UNIVERSITY OF ARKANSAS SYSTEM: Management Discussion and Analysis
Introduction
The University of Arkansas System (“the University”) is pleased to present its financial statements for the fiscal year ended June 30, 2016, with comparative statements for the fiscal year ended June 30, 2015.
The University of Arkansas System (“the University”), which prior to 1969 consisted of the Fayetteville and Medical Sciences campuses, was expanded in 1969 to include the Little Rock campus (formerly Little Rock University), in 1971 to include the Monticello campus (formerly Arkansas A&M College), in 1972 to include the Pine Bluff campus (formerly Arkansas AM&N College), in 1996 to include the Phillips campus (formerly Phillips County Community College) and the Hope campus (formerly Red River Technical College), and in 1998 to include the Batesville campus (formerly Gateway Technical College). On July 1, 2001, the University was expanded to include campuses in Morrilton (formerly Petit Jean College) and DeQueen (formerly Cossatot Community College). The Fort Smith campus (formerly Westark College) joined the University on January 1, 2002. Forest Echoes Technical Institute and Great Rivers Technical Institute merged with the Monticello campus on July 1, 2003. The Arkansas School for Mathematics, Sciences and the Arts joined the University on January 1, 2004. In addition to these campuses, the University includes the System Administration, whose financial statements include eVersity, and the following units that are included in the financial statements of the Fayetteville campus: Clinton School of Public Service, Division of Agriculture (Agricultural Experiment Station and the Cooperative Extension Service), Archeological Survey, and Criminal Justice Institute. See Note 24 for information pertaining to two mergers planned in FY17.
All programs and activities of the University of Arkansas are governed by its Board of Trustees, which has delegated to the President the administrative authority for all aspects of the University’s operations. Administrative authority is further delegated to the Chancellors, the Vice President for Agriculture, the Dean of the Clinton School, the Director of the Criminal Justice Institute, the Director of Archeological Survey, and the Director of Arkansas School for Mathematics, Sciences and the Arts, who have responsibility for the programs and activities of their respective campuses or state-wide operating division.
Overview of the Financial Statements and Financial Analysis
The University’s financial statements are prepared in accordance with standards issued by the Governmental Accounting Standards Board (GASB). The financial statement presentation required by GASB Statement No. 35, Basic Financial Statements-and Management’s Discussion and Analysis-for Public Colleges and Universities, along with subsequent statements that amended Statement 35, provide a comprehensive, entity-wide perspective of the University’s assets, deferred outflows, liabilities, deferred inflows, net position, revenues, expenses, changes in net position, and cash flows. This discussion has been prepared by management and should be read in conjunction with the financial statements and notes following this section.
For the year ended June 30, 2015, the University adopted GASB Statement No. 68, Accounting and Financial Reporting for Pensions – an amendment of GASB Statement No. 27, and GASB Statement No 71, Pension Transition for Contributions Made Subsequent to the Measurement Date – an amendment of GASB Statement No. 68. These statements established standards of accounting and financial reporting for defined benefit pension plans and defined contribution pension plans. As a result, the beginning Net Position for FY15 was reduced by $40.3 million.
The University has identified two legally separate foundations, the University of Arkansas Foundation, Inc. and the University of Arkansas Fayetteville Campus Foundation, Inc., that meet the criteria set forth for component units under GASB Statement No. 39, Determining Whether Certain Organizations Are Component Units,: These foundations provide financial support for the objectives, purposes, and programs of the University. Although the University does not control the timing, purpose or amount received by these Foundations, the resources (and income thereon) they hold and invest are dedicated to benefit the University. Because these resources held by the foundations can only be used by, or for the benefit of, the University, and are deemed material, they are considered component units and are discretely presented in the financial report. Additional information about component units is provided in Note 1.
6
UNIVERSITY OF ARKANSAS SYSTEM: Management Discussion and Analysis
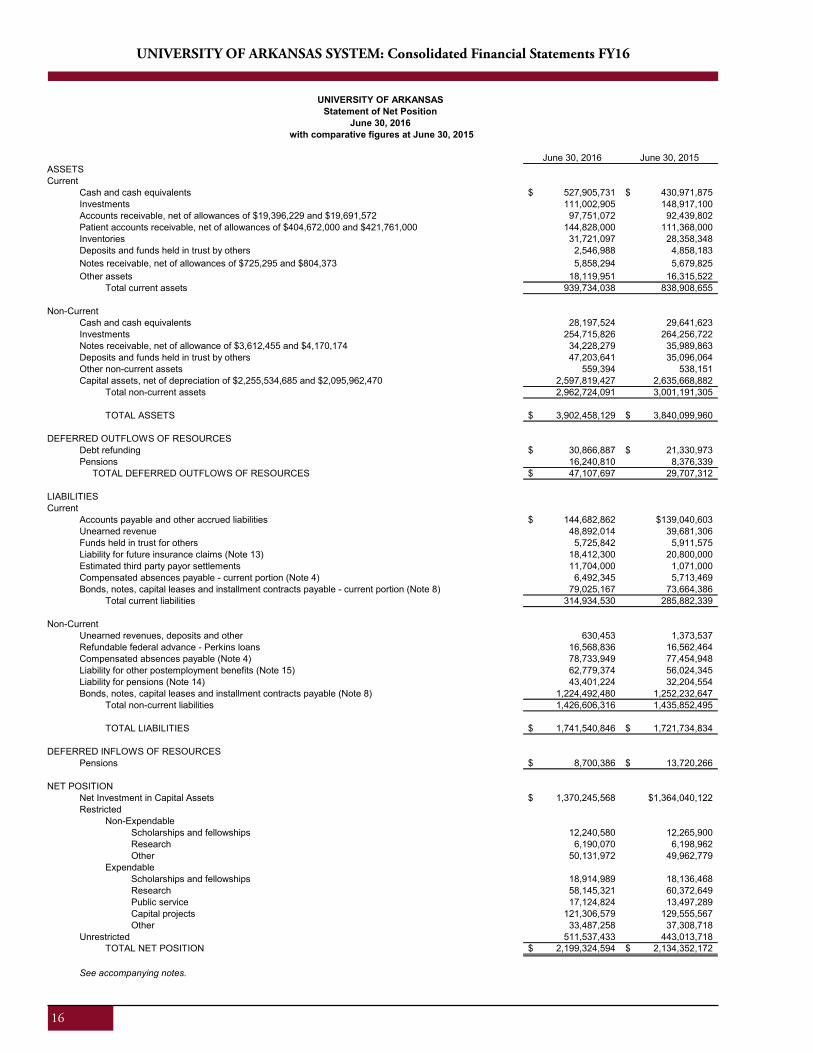
Statement of Net Position
The Statement of Net Position provides a fiscal snapshot of the University as of the end of the fiscal year. All assets (property that we own and what we are owed by others), deferred outflows of resources (consumption of net position by the University that is applicable to a future reporting period), liabilities (what we owe to others and have collected from others before we have provided the service), deferred inflows of resources (acquisition of net position by the University that is applicable to a future reporting period), and net position (assets and deferred outflows of resources minus liabilities and deferred inflows of resources) are reported in this statement. Assets and liabilities are presented in the order of their relative liquidity, and are identified as current or noncurrent. Current assets are those assets that can be realized in the coming year, and current liabilities are expected to be paid within the next year. Noncurrent assets and liabilities are not expected to be realized as cash or paid in the subsequent year. Assets, deferred outflows of resources, liabilities and deferred inflows of resources are generally measured
using current values. One exception is capital assets, which are stated at historical cost less accumulated depreciation.
Net position is divided into four major categories:Net investment in capital assets: capital assets, net of accumulated depreciation and outstanding principal balances of debt attributable to the acquisition, construction or improvement of those assets.Restricted – non-expendable: net position subject to externally-imposed stipulations that it be maintained permanently by the University.Restricted – expendable: net position whose use by the University is subject to externally-imposed stipulations that can be fulfilled by actions of the University pursuant to those stipulations or that expire by the passage of time.Unrestricted: net position that is not subject to externally imposed stipulations but can be used at the discretion of the governing board to meet current expenses for any purpose if not limited by contractual agreements with outside parties.
7
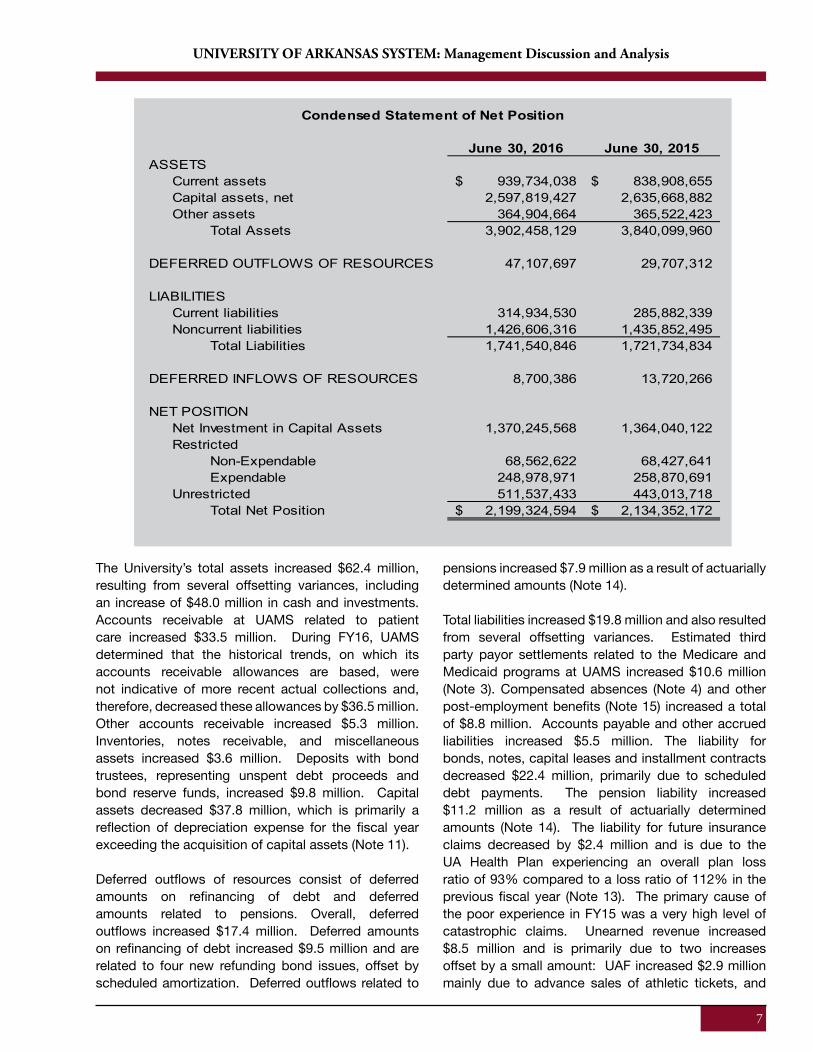
The University’s total assets increased $62.4 million, resulting from several offsetting variances, including an increase of $48.0 million in cash and investments. Accounts receivable at UAMS related to patient care increased $33.5 million. During FY16, UAMS determined that the historical trends, on which its accounts receivable allowances are based, were not indicative of more recent actual collections and, therefore, decreased these allowances by $36.5 million. Other accounts receivable increased $5.3 million. Inventories, notes receivable, and miscellaneous assets increased $3.6 million. Deposits with bond trustees, representing unspent debt proceeds and bond reserve funds, increased $9.8 million. Capital assets decreased $37.8 million, which is primarily a reflection of depreciation expense for the fiscal year exceeding the acquisition of capital assets (Note 11).
Deferred outflows of resources consist of deferred amounts on refinancing of debt and deferred amounts related to pensions. Overall, deferred outflows increased $17.4 million. Deferred amounts on refinancing of debt increased $9.5 million and are related to four new refunding bond issues, offset by scheduled amortization. Deferred outflows related to
pensions increased $7.9 million as a result of actuarially determined amounts (Note 14).
Total liabilities increased $19.8 million and also resulted from several offsetting variances. Estimated third party payor settlements related to the Medicare and Medicaid programs at UAMS increased $10.6 million (Note 3). Compensated absences (Note 4) and other post-employment benefits (Note 15) increased a total of $8.8 million. Accounts payable and other accrued liabilities increased $5.5 million. The liability for bonds, notes, capital leases and installment contracts decreased $22.4 million, primarily due to scheduled debt payments. The pension liability increased $11.2 million as a result of actuarially determined amounts (Note 14). The liability for future insurance claims decreased by $2.4 million and is due to the UA Health Plan experiencing an overall plan loss ratio of 93% compared to a loss ratio of 112% in the previous fiscal year (Note 13). The primary cause of the poor experience in FY15 was a very high level of catastrophic claims. Unearned revenue increased $8.5 million and is primarily due to two increases offset by a small amount: UAF increased $2.9 million mainly due to advance sales of athletic tickets, and
UNIVERSITY OF ARKANSAS SYSTEM: Management Discussion and Analysis
June 30, 2016 June 30, 2015ASSETS
Current assets 939,734,038$ 838,908,655$ Capital assets, net 2,597,819,427 2,635,668,882 Other assets 364,904,664 365,522,423
Total Assets 3,902,458,129 3,840,099,960
DEFERRED OUTFLOWS OF RESOURCES 47,107,697 29,707,312
LIABILITIESCurrent liabilities 314,934,530 285,882,339 Noncurrent liabilities 1,426,606,316 1,435,852,495
Total Liabilities 1,741,540,846 1,721,734,834
DEFERRED INFLOWS OF RESOURCES 8,700,386 13,720,266
NET POSITIONNet Investment in Capital Assets 1,370,245,568 1,364,040,122 Restricted
Non-Expendable 68,562,622 68,427,641 Expendable 248,978,971 258,870,691
Unrestricted 511,537,433 443,013,718 Total Net Position 2,199,324,594$ 2,134,352,172$
Condensed Statement of Net Position
8
UNIVERSITY OF ARKANSAS SYSTEM: Management Discussion and Analysis
UAMS increased $6.4 million primarily due to a timing difference between when payments were received and work done on grants.
Deferred inflows of resources related to pension plans decreased $5.0 million as a result of actuarially determined amounts (Note 14).
The net increases in assets and deferred outflows of resources of $79.8 million netted against net increases in liabilities and deferred inflows of resources $14.8 million resulted in an increase of $65.0 million in total net position for the University. Net investments in capital assets, restricted, and unrestricted are the three components of net position which experienced an increase of $6.2 million, a decrease of $9.8 million and an increase of $68.6 million, respectively. UAF, UAMS and System Administration experienced increases of $33.9 million, $18.5 million and $11.7 million, respectively. These increases were combined with a $0.9 million increase for the rest of the campuses. Contributing factors to the increase in unrestricted net position are discussed in the following section.
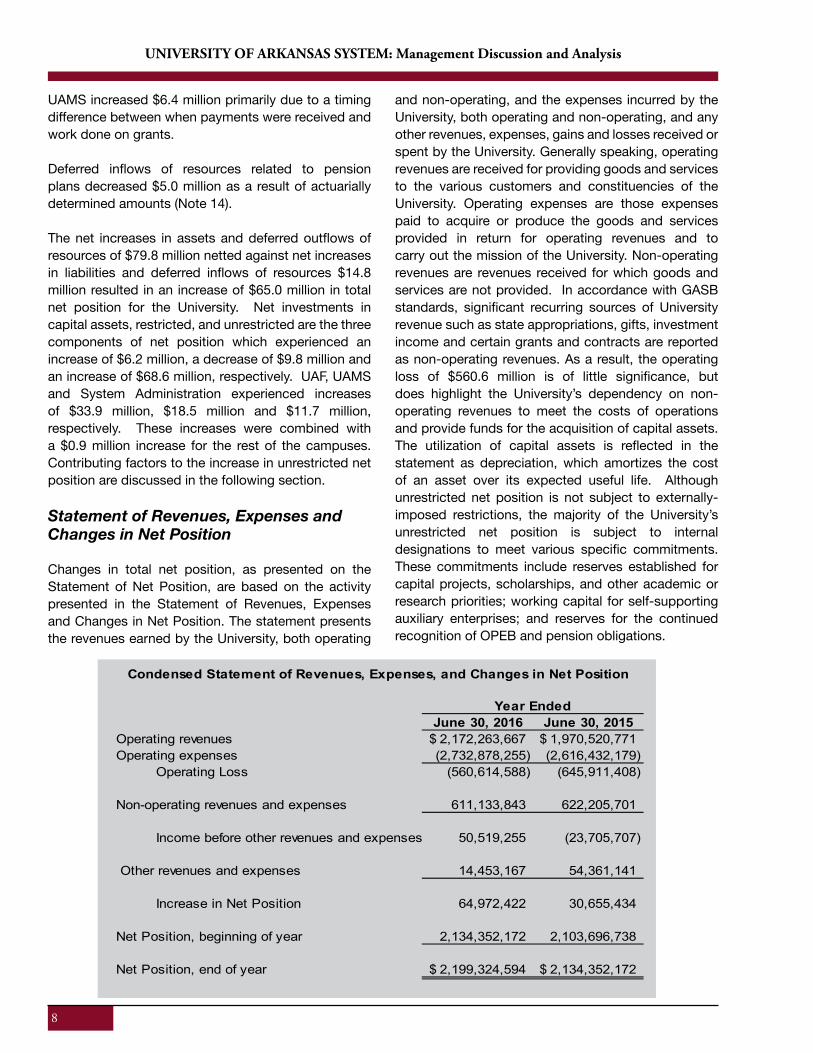
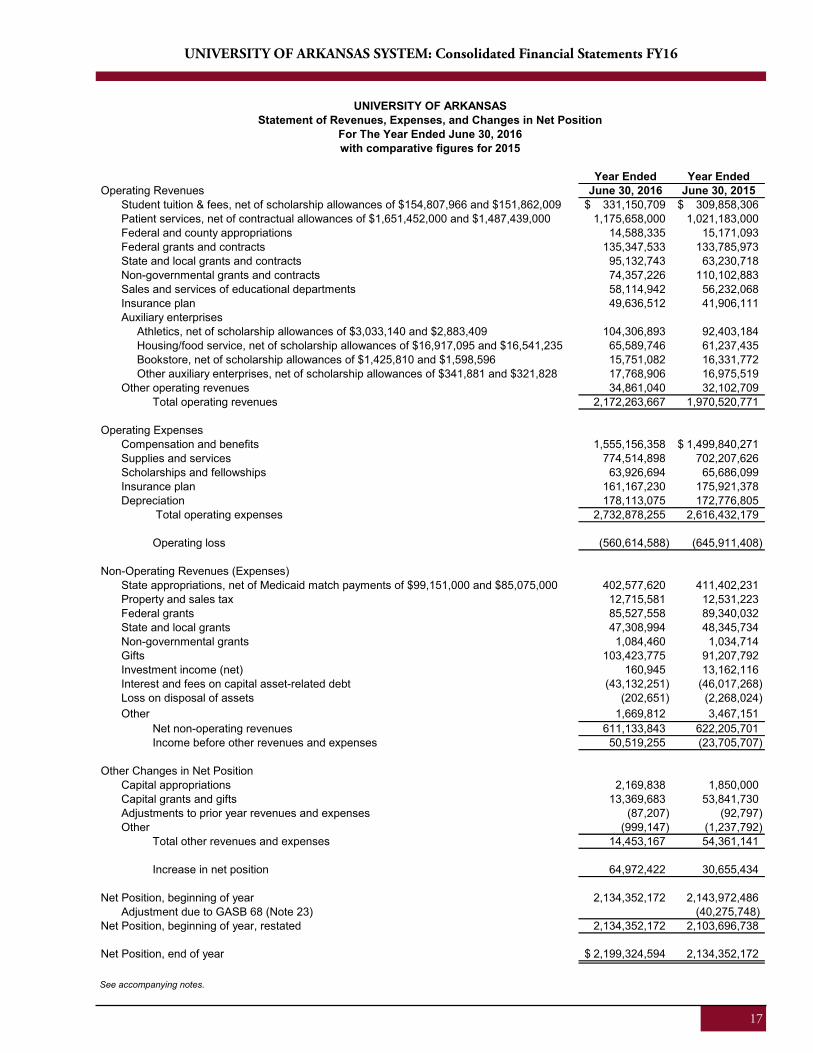
Statement of Revenues, Expenses and Changes in Net Position
Changes in total net position, as presented on the Statement of Net Position, are based on the activity presented in the Statement of Revenues, Expenses and Changes in Net Position. The statement presents the revenues earned by the University, both operating
and non-operating, and the expenses incurred by the University, both operating and non-operating, and any other revenues, expenses, gains and losses received or spent by the University. Generally speaking, operating revenues are received for providing goods and services to the various customers and constituencies of the University. Operating expenses are those expenses paid to acquire or produce the goods and services provided in return for operating revenues and to carry out the mission of the University. Non-operating revenues are revenues received for which goods and services are not provided. In accordance with GASB standards, significant recurring sources of University revenue such as state appropriations, gifts, investment income and certain grants and contracts are reported as non-operating revenues. As a result, the operating loss of $560.6 million is of little significance, but does highlight the University’s dependency on non-operating revenues to meet the costs of operations and provide funds for the acquisition of capital assets. The utilization of capital assets is reflected in the statement as depreciation, which amortizes the cost of an asset over its expected useful life. Although unrestricted net position is not subject to externally-imposed restrictions, the majority of the University’s unrestricted net position is subject to internal designations to meet various specific commitments. These commitments include reserves established for capital projects, scholarships, and other academic or research priorities; working capital for self-supporting auxiliary enterprises; and reserves for the continued recognition of OPEB and pension obligations.
June 30, 2016 June 30, 2015Operating revenues 2,172,263,667$ 1,970,520,771$ Operating expenses (2,732,878,255) (2,616,432,179)
Operating Loss (560,614,588) (645,911,408)
Non-operating revenues and expenses 611,133,843 622,205,701
Income before other revenues and expenses 50,519,255 (23,705,707)
Other revenues and expenses 14,453,167 54,361,141
Increase in Net Position 64,972,422 30,655,434
Net Position, beginning of year 2,134,352,172 2,103,696,738
Net Position, end of year 2,199,324,594$ 2,134,352,172$
Year Ended
Condensed Statement of Revenues, Expenses, and Changes in Net Position
9
UNIVERSITY OF ARKANSAS SYSTEM: Management Discussion and Analysis
Operating revenue increased $201.7 million, of which almost 77%, or $154.5 million is from an increase in net patient service revenues due to an increase in both inpatient and outpatient volumes, the merging of patient care operations to create the Integrated Clinical Enterprise for the purpose of achieving greater efficiency in providing patient care, and a correction in previously reported financial statements related to certain Medicaid programs (Note 3). Net student tuition and fees increased $21.3 million, reflecting increases for UAF of $16.8 million and UAMS of $4.5 million related to enrollment growth and rate revisions. Athletic income increased $11.9 million which is attributable to increases at UAF in SEC conference distributions, sponsorship and licensing agreements, and transfers from the Razorback Foundation. Other operating revenue increased $6.3 million, including $4.6 million in other auxiliary enterprises, demonstrating the impact of an increase in students living on campus for both UAF and UAPB. Insurance plan revenues increased $7.7 million due to increased premiums and an increase for some campuses in the percentage of premiums paid by employees.
Total operating expenses increased $116.4 million. Compensation and benefit costs increased $55.3 million, or 3.7% increase, over the previous year. Compensation and benefit expense increased: $18.8 million at UAF due in part to a necessary increase in faculty to support enrollment growth along with modest increases in salaries for faculty and staff; and $50.0 million at UAMS primarily due to the staffing required to support higher inpatient and outpatient volumes, an across-the-board increase for non-classified staff effective January 1, 2015, and for classified staff effective July 1, 2015, and higher group health insurance costs. Compensation and benefit costs decreased a total of $1.5 million for the other campuses and $12.0 million due to a change in the elimination entry (Note 19). Expense related to the UA Health Plan decreased $14.7 million due to a much lower overall plan loss ratio of 93% compared to a plan loss ratio 112% in FY15. The cost of supplies and services increased $72.3 million, of which $67.0 million, or 93%, is attributable to UAF ($22.8 million) and to UAMS ($44.2 million). Approximately half of the increase at UAF was related to renewals and replacements in plant that were not capitalized. The increase at UAMS was largely due to increases in medical supplies, primarily for a higher surgery volume, and drugs and medicines for patient care Scholarship expense decreased $1.8 million, and depreciation increased $5.3 million.
Net non-operating revenues decreased by $11.1 million. State appropriations decreased $8.8 million due to an increase UAF of $4.7 million and a reduction for UAMS of $13.5 million, which reflects an increase in Medicaid match payments that are reported as a decrease to state appropriations. Investment income decreased $13.0 million due to market performance. Non-operating grants decreased $4.8 million, non-capital gifts increased $12.2 million, and miscellaneous revenue increased $0.5 million. This combined $13.9 decrease was mitigated due to a reduction of $2.8 million in interest paid on debt.
Other changes in net position decreased almost $40 million, reflecting changes in capital grants and gifts received in FY15 to support five separate capital building projects on the Fayetteville campus and for the construction of a new art and design building on the Fort Smith campus.
Gifts reported reflect only a portion of the gifts available to the University. Most gifts for the benefit of the University are made to the University of Arkansas Foundation, whose financial information is presented in Note 1.
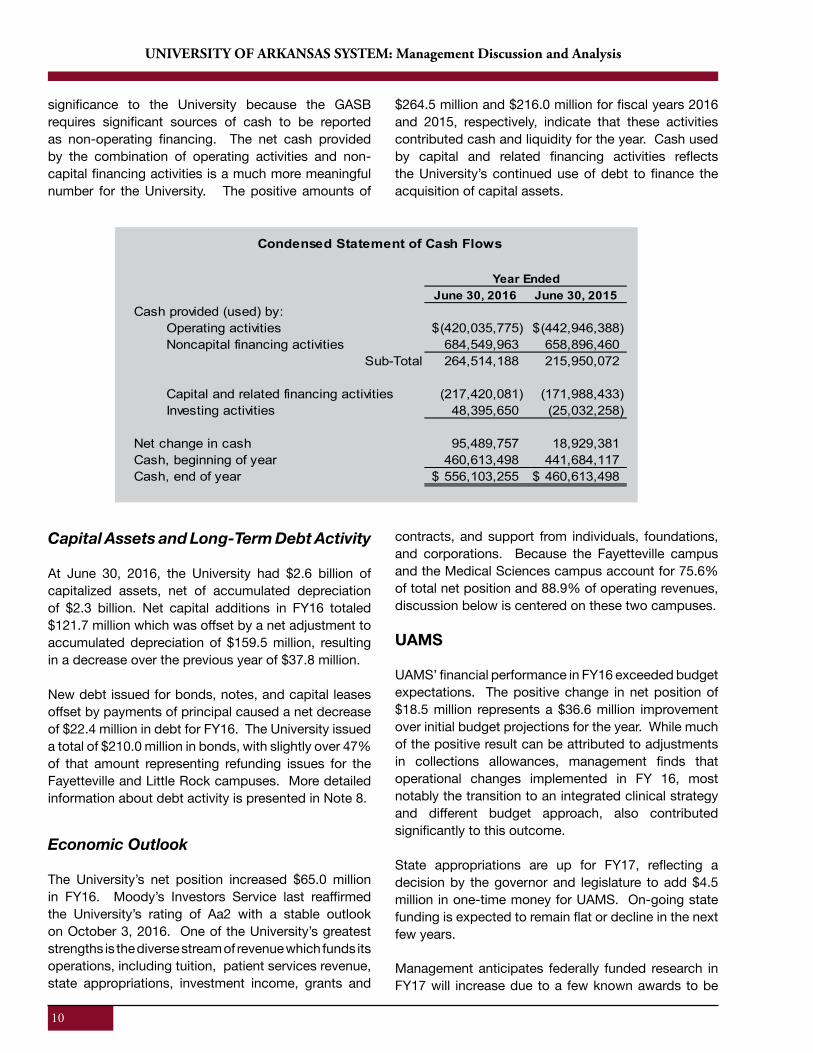
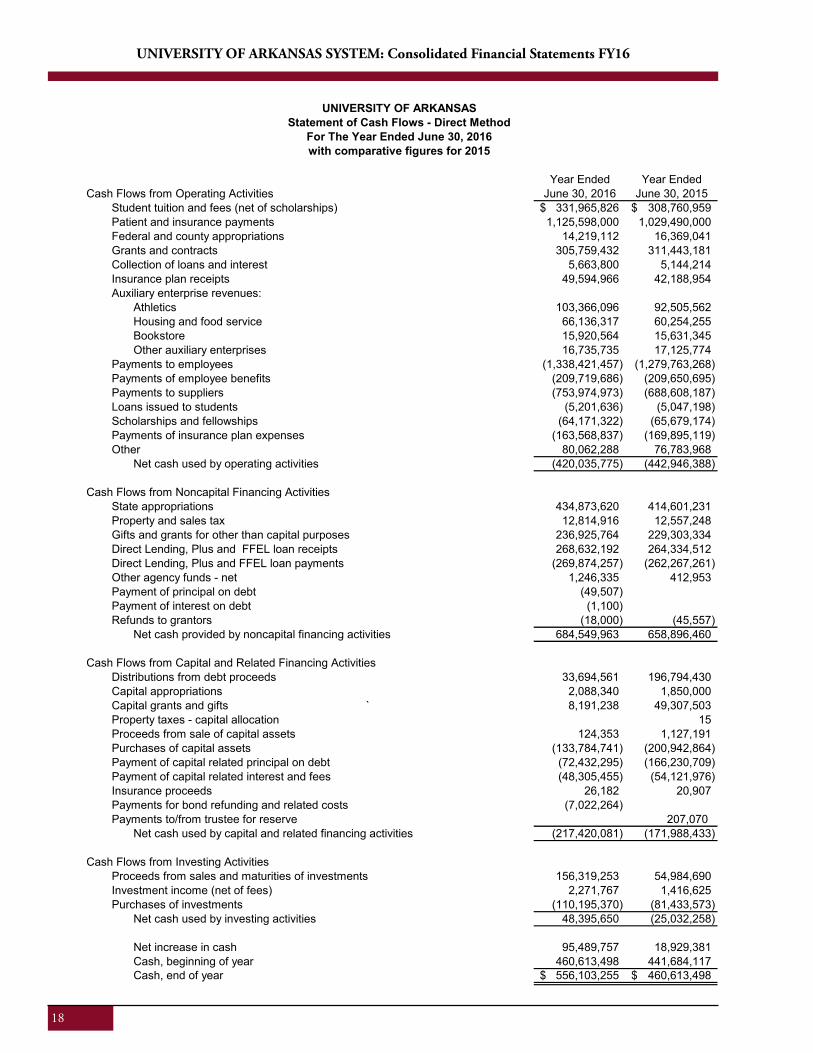
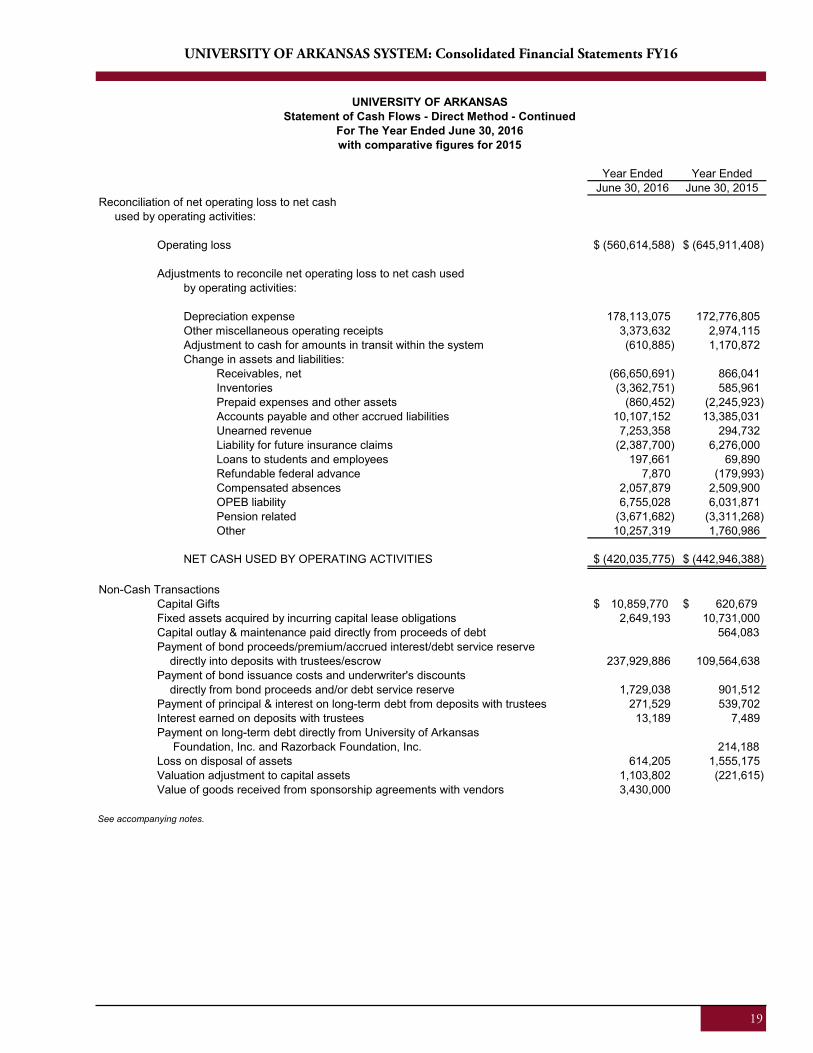
Statement of Cash Flows
The Statement of Cash Flows provides information about the cash activity of the University during the year. The statement is divided into five parts. The first part shows the net cash used by the operating activities of the institution. The second section reflects cash flows from non-capital financing activities. The third section deals with cash flows from capital and related activities, such as the acquisition and construction of capital assets and proceeds from, and payment of, debt. The fourth section reflects the cash flows from investing activities and shows the purchases, proceeds, and interest received from these activities. The fifth section, not shown in the condensed statement below, reconciles the net cash used by operating activities to the net operating income or loss reflected on the Statement of Revenues, Expenses and Changes in Net Position. The statement aids in the assessment of the University’s ability to meet obligations as they become due, the need for external financing, and the ability to generate future cash flow.
Similar to the operating loss on the Statement of Revenues, Expenses, and Changes in Net Position, net cash provided by operating activities is of little
10
UNIVERSITY OF ARKANSAS SYSTEM: Management Discussion and Analysis
significance to the University because the GASB requires significant sources of cash to be reported as non-operating financing. The net cash provided by the combination of operating activities and non-capital financing activities is a much more meaningful number for the University. The positive amounts of
$264.5 million and $216.0 million for fiscal years 2016 and 2015, respectively, indicate that these activities contributed cash and liquidity for the year. Cash used by capital and related financing activities reflects the University’s continued use of debt to finance the acquisition of capital assets.
Capital Assets and Long-Term Debt Activity
At June 30, 2016, the University had $2.6 billion of capitalized assets, net of accumulated depreciation of $2.3 billion. Net capital additions in FY16 totaled $121.7 million which was offset by a net adjustment to accumulated depreciation of $159.5 million, resulting in a decrease over the previous year of $37.8 million.
New debt issued for bonds, notes, and capital leases offset by payments of principal caused a net decrease of $22.4 million in debt for FY16. The University issued a total of $210.0 million in bonds, with slightly over 47% of that amount representing refunding issues for the Fayetteville and Little Rock campuses. More detailed information about debt activity is presented in Note 8.
Economic Outlook
The University’s net position increased $65.0 million in FY16. Moody’s Investors Service last reaffirmed the University’s rating of Aa2 with a stable outlook on October 3, 2016. One of the University’s greatest strengths is the diverse stream of revenue which funds its operations, including tuition, patient services revenue, state appropriations, investment income, grants and
contracts, and support from individuals, foundations, and corporations. Because the Fayetteville campus and the Medical Sciences campus account for 75.6% of total net position and 88.9% of operating revenues, discussion below is centered on these two campuses.
UAMS
UAMS’ financial performance in FY16 exceeded budget expectations. The positive change in net position of $18.5 million represents a $36.6 million improvement over initial budget projections for the year. While much of the positive result can be attributed to adjustments in collections allowances, management finds that operational changes implemented in FY 16, most notably the transition to an integrated clinical strategy and different budget approach, also contributed significantly to this outcome.
State appropriations are up for FY17, reflecting a decision by the governor and legislature to add $4.5 million in one-time money for UAMS. On-going state funding is expected to remain flat or decline in the next few years.
Management anticipates federally funded research in FY17 will increase due to a few known awards to be
June 30, 2016 June 30, 2015Cash provided (used) by:
Operating activities (420,035,775)$ (442,946,388)$ Noncapital financing activities 684,549,963 658,896,460
Sub-Total 264,514,188 215,950,072
Capital and related financing activities (217,420,081) (171,988,433) Investing activities 48,395,650 (25,032,258)
Net change in cash 95,489,757 18,929,381 Cash, beginning of year 460,613,498 441,684,117 Cash, end of year 556,103,255$ 460,613,498$
Year Ended
Condensed Statement of Cash Flows
11
UNIVERSITY OF ARKANSAS SYSTEM: Management Discussion and Analysis
announced during the year. The influx of new research faculty in the areas of bioinformatics, pharmacy and radiation oncology, along with the implementation of expanded research administrative support, should help reverse recent downward financial trends in this area.
Continued growth in patient services revenues is expected in the near term, although likely at a rate less than that experienced in FY16. UAMS has plans to improve care management, revenue cycle operations, and the capabilities of its electronic medical records system in order to sustain growth into the future. While generally optimistic about the benefit these efforts will yield, uncertainty regarding future Medicare and Medicaid payments cannot be underestimated. The impact of a revision in the state’s private option Medicaid expansion has been a reduction of UAMS’ percentage of self-pay patients, now close to 2.2%, or essentially the same level in FY15, the first full year of Medicaid expansion. It is unknown whether the state legislature will continue to support the program in its current form in the future. Additionally, the passage of the federal Medicare Access and CHIP Reauthorization Act (MACRA) is expected to bring further changes in Medicare payments by putting greater emphasis on healthcare quality.
Regardless of how the payment structure changes, enhancing the quality and efficiency of service delivery while reducing cost is critical. Management also recognizes that the current dependency on clinical revenues, which account for more than 75% of total revenues, must be sustained into the future. With a full year of experience gained using the service line model and strategic clinical initiatives in care management and revenue cycle operations, UAMS is well-positioned to deal with pending changes in reimbursement methods. Two new primary care clinics and the expansion of a recently created orthopedics clinic should aid in growing patient referrals.
In summary, the economic outlook for UAMS is generally positive. Management remains committed to continuing cost savings initiatives and improving performance, especially with respect to its clinical operations.
UAF
Financial and political support from state government remains a critical element to the continued financial health of the campus. In 2016, the total general
revenue distribution from the State, which is a portion of the state appropriation revenue on the Statement of Revenues, Expenses and Changes in Net Position, remained virtually flat at $201.9 million. Estimates for 2017 indicate general revenue distributions from the State will remain flat, with no significant increase or decrease. Management will continue to institute both internal and external efforts to maximize the state resources available, while seeking ways to minimize the effect of state funding levels not keeping pace with growth.
Tuition and mandatory fee increases totaling 3.8% for resident and 7.5% for nonresident students, respectively, were necessary in 2016 in order to maintain the facilities, faculty and other support needed to fulfill their mission. It is expected that the campus will continue to look at increases in tuition rates for revenue support as well as find other revenue streams as record growth in enrollment continues and state funding levels remaining flat.
Campaign Arkansas, a multi-year comprehensive fundraising effort, was officially launched in September, 2016, with a goal of raising $1 billion. All colleges and schools on campus, as well as many other units, will benefit from the fundraising effort. The campaign is critical to efforts to keep tuition affordable while enhancing academic opportunities for faculty and students. Funds raised will support scholarships and fellowships, endowed chairs, capital projects, interdisciplinary academic programs and other priority areas that will advance the campus goals and objectives. The campaign is scheduled to conclude in June, 2020.
Positive news continues with UAF’s fundraising production totals for private gift support in FY16 being the third-best year in university history. Production amounts include gifts of cash, gifts-in-kind, planned gifts and new pledges. In 2016, the University recognized $131.6 million of private gift support, surpassing its goal of $115 million. This support is critical to ensure success for students and faculty, and is a fundamental component in meeting budgetary needs. Support received from alumni, friends, organizations, faculty, and staff enhances all aspects of the student experience, including academic and need-based scholarships; technology enhancements; new and renovated facilities; undergraduate, graduate and faculty research; study abroad opportunities and innovative programs.
12
UNIVERSITY OF ARKANSAS SYSTEM: Management Discussion and Analysis
Enrollment has increased 45.8%, or more than 8,500 students over the past ten years, including another record enrollment in the fall 2016. While the growth trend continues, it has slowed to only 1.6% growth over the past year. This more sustainable rate of growth is welcome as the university assesses future goals and the optimum number of students.
All Campuses
Financial support from state government for all campuses remains a critical element to the continued financial health of the University. Arkansas appears to have successfully weathered the effects of the
national economic crisis, as general revenue forecasts are positive and the state budget remains balanced. Management will continue to budget conservatively and to emphasize cost containment.
Preliminary data shows that while the headcount number of students has remained essentially flat from the fall semester of 2012 to the fall semester of 2016, the number of full-time equivalent students has increased almost 2% from 49,841 to 50,698.
There are two pending mergers of community colleges into the University of Arkansas System that are discussed in more detail in Note 24.
13
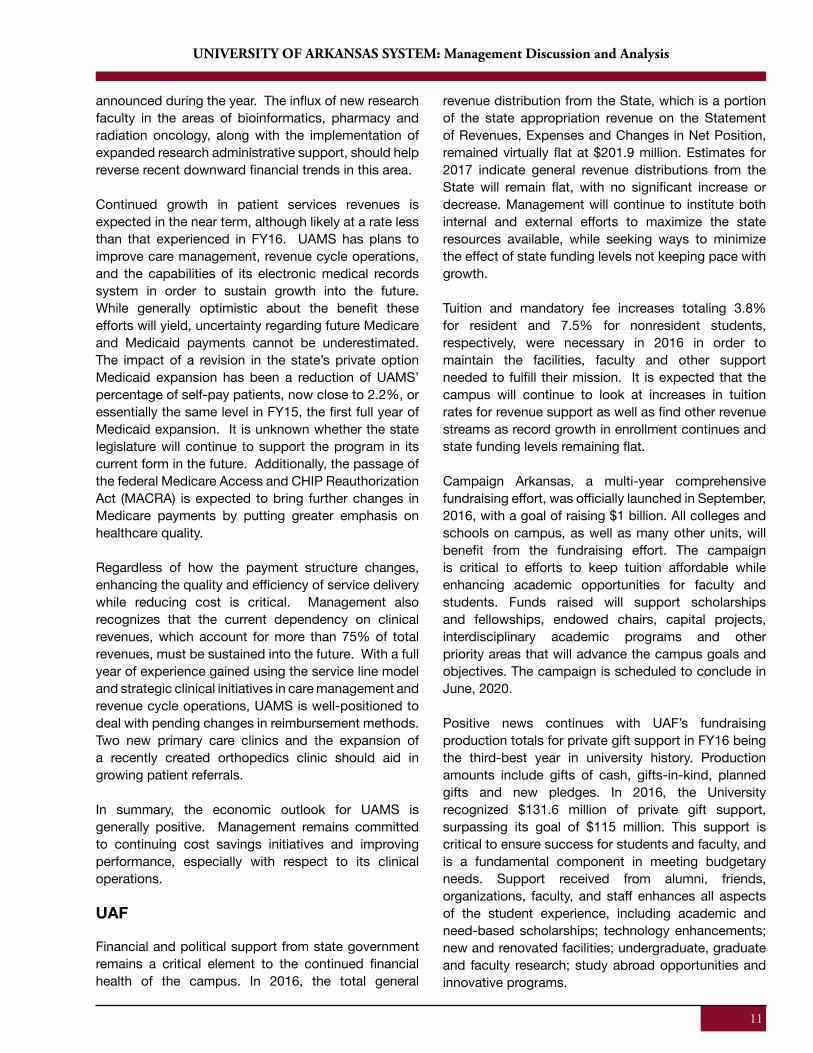
15
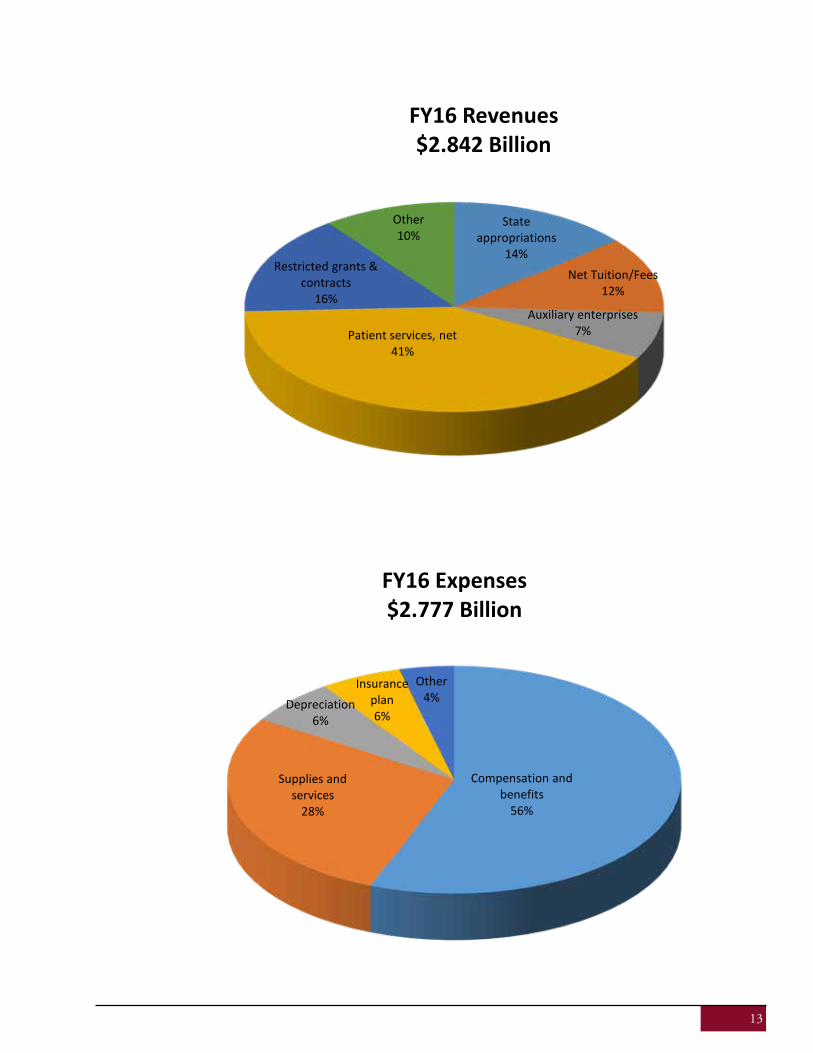
State appropriations
14%Net Tuition/Fees
12%
Auxiliary enterprises7%Patient services, net
41%
Restricted grants & contracts
16%
Other10%
FY16 Revenues$2.842 Billion
Compensation and benefits
56%
Supplies and services
28%
Depreciation6%
Insurance plan6%
Other4%
FY16 Expenses$2.777 Billion
14
UNIVERSITY OF ARKANSAS SYSTEM: Five Year Summary of Key Data
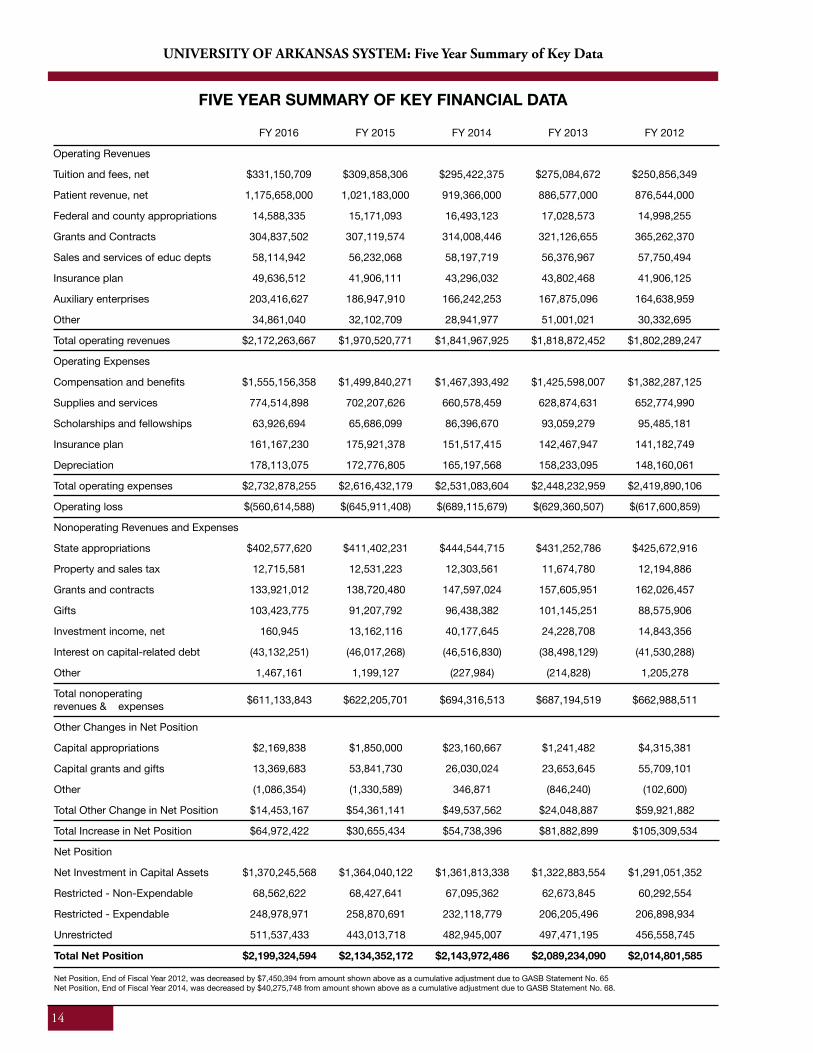
FIVE YEAR SUMMARY OF KEY FINANCIAL DATA
FY 2016 FY 2015 FY 2014 FY 2013 FY 2012
Operating Revenues
Tuition and fees, net $331,150,709 $309,858,306 $295,422,375 $275,084,672 $250,856,349
Patient revenue, net 1,175,658,000 1,021,183,000 919,366,000 886,577,000 876,544,000
Federal and county appropriations 14,588,335 15,171,093 16,493,123 17,028,573 14,998,255
Grants and Contracts 304,837,502 307,119,574 314,008,446 321,126,655 365,262,370
Sales and services of educ depts 58,114,942 56,232,068 58,197,719 56,376,967 57,750,494
Insurance plan 49,636,512 41,906,111 43,296,032 43,802,468 41,906,125
Auxiliary enterprises 203,416,627 186,947,910 166,242,253 167,875,096 164,638,959
Other 34,861,040 32,102,709 28,941,977 51,001,021 30,332,695
Total operating revenues $2,172,263,667 $1,970,520,771 $1,841,967,925 $1,818,872,452 $1,802,289,247
Operating Expenses
Compensation and benefits $1,555,156,358 $1,499,840,271 $1,467,393,492 $1,425,598,007 $1,382,287,125
Supplies and services 774,514,898 702,207,626 660,578,459 628,874,631 652,774,990
Scholarships and fellowships 63,926,694 65,686,099 86,396,670 93,059,279 95,485,181
Insurance plan 161,167,230 175,921,378 151,517,415 142,467,947 141,182,749
Depreciation 178,113,075 172,776,805 165,197,568 158,233,095 148,160,061
Total operating expenses $2,732,878,255 $2,616,432,179 $2,531,083,604 $2,448,232,959 $2,419,890,106
Operating loss $(560,614,588) $(645,911,408) $(689,115,679) $(629,360,507) $(617,600,859)
Nonoperating Revenues and Expenses
State appropriations $402,577,620 $411,402,231 $444,544,715 $431,252,786 $425,672,916
Property and sales tax 12,715,581 12,531,223 12,303,561 11,674,780 12,194,886
Grants and contracts 133,921,012 138,720,480 147,597,024 157,605,951 162,026,457
Gifts 103,423,775 91,207,792 96,438,382 101,145,251 88,575,906
Investment income, net 160,945 13,162,116 40,177,645 24,228,708 14,843,356
Interest on capital-related debt (43,132,251) (46,017,268) (46,516,830) (38,498,129) (41,530,288)
Other 1,467,161 1,199,127 (227,984) (214,828) 1,205,278
Total nonoperating revenues & expenses $611,133,843 $622,205,701 $694,316,513 $687,194,519 $662,988,511
Other Changes in Net Position
Capital appropriations $2,169,838 $1,850,000 $23,160,667 $1,241,482 $4,315,381
Capital grants and gifts 13,369,683 53,841,730 26,030,024 23,653,645 55,709,101
Other (1,086,354) (1,330,589) 346,871 (846,240) (102,600)
Total Other Change in Net Position $14,453,167 $54,361,141 $49,537,562 $24,048,887 $59,921,882
Total Increase in Net Position $64,972,422 $30,655,434 $54,738,396 $81,882,899 $105,309,534
Net Position
Net Investment in Capital Assets $1,370,245,568 $1,364,040,122 $1,361,813,338 $1,322,883,554 $1,291,051,352
Restricted - Non-Expendable 68,562,622 68,427,641 67,095,362 62,673,845 60,292,554
Restricted - Expendable 248,978,971 258,870,691 232,118,779 206,205,496 206,898,934
Unrestricted 511,537,433 443,013,718 482,945,007 497,471,195 456,558,745
Total Net Position $2,199,324,594 $2,134,352,172 $2,143,972,486 $2,089,234,090 $2,014,801,585
Net Position, End of Fiscal Year 2012, was decreased by $7,450,394 from amount shown above as a cumulative adjustment due to GASB Statement No. 65Net Position, End of Fiscal Year 2014, was decreased by $40,275,748 from amount shown above as a cumulative adjustment due to GASB Statement No. 68.
15
UNIVERSITY OF ARKANSAS SYSTEM: Five Year Summary of Key Data
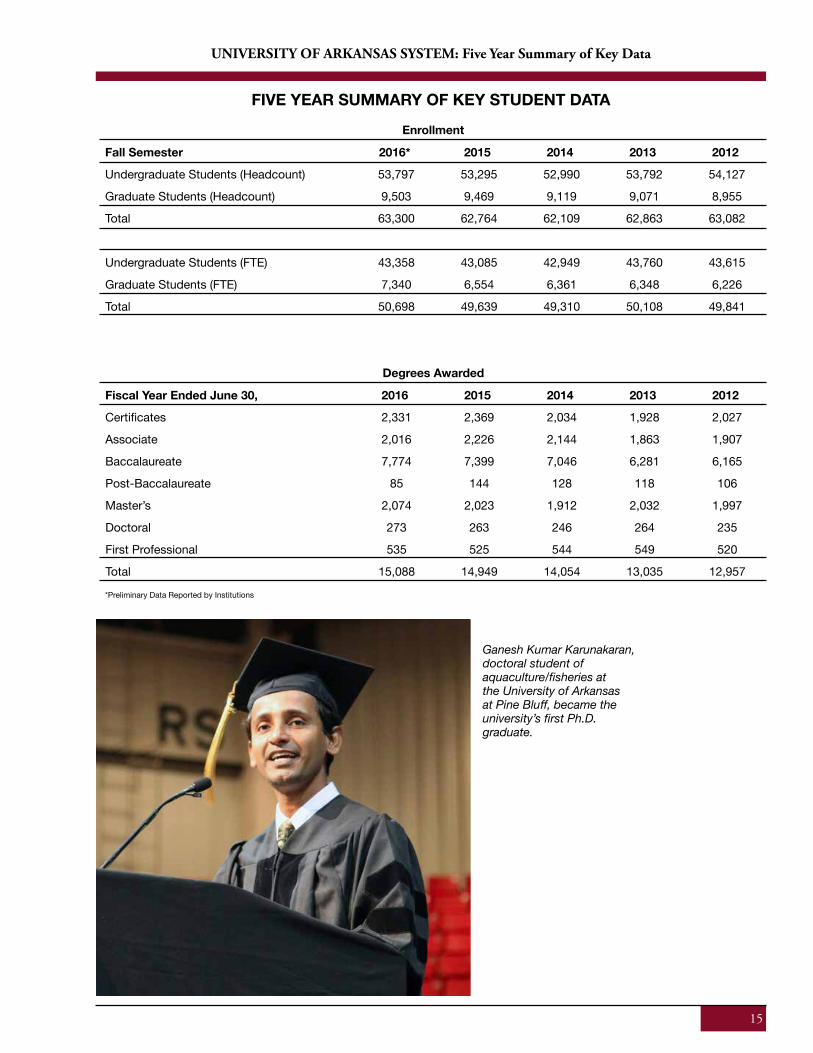
FIVE YEAR SUMMARY OF KEY STUDENT DATA
Enrollment
Fall Semester 2016* 2015 2014 2013 2012
Undergraduate Students (Headcount) 53,797 53,295 52,990 53,792 54,127
Graduate Students (Headcount) 9,503 9,469 9,119 9,071 8,955
Total 63,300 62,764 62,109 62,863 63,082
Undergraduate Students (FTE) 43,358 43,085 42,949 43,760 43,615
Graduate Students (FTE) 7,340 6,554 6,361 6,348 6,226
Total 50,698 49,639 49,310 50,108 49,841
Degrees Awarded
Fiscal Year Ended June 30, 2016 2015 2014 2013 2012
Certificates 2,331 2,369 2,034 1,928 2,027
Associate 2,016 2,226 2,144 1,863 1,907
Baccalaureate 7,774 7,399 7,046 6,281 6,165
Post-Baccalaureate 85 144 128 118 106
Master’s 2,074 2,023 1,912 2,032 1,997
Doctoral 273 263 246 264 235
First Professional 535 525 544 549 520
Total 15,088 14,949 14,054 13,035 12,957
*Preliminary Data Reported by Institutions
Ganesh Kumar Karunakaran, doctoral student of aquaculture/fisheries at the University of Arkansas at Pine Bluff, became the university’s first Ph.D. graduate.
16
UNIVERSITY OF ARKANSAS SYSTEM: Consolidated Financial Statements FY16UNIVERSITY OF ARKANSAS SYSTEM: Consolidated Financial Statements FY16
18
June 30, 2016 June 30, 2015ASSETSCurrent
Cash and cash equivalents 527,905,731$ 430,971,875$ Investments 111,002,905 148,917,100 Accounts receivable, net of allowances of $19,396,229 and $19,691,572 97,751,072 92,439,802 Patient accounts receivable, net of allowances of $404,672,000 and $421,761,000 144,828,000 111,368,000 Inventories 31,721,097 28,358,348 Deposits and funds held in trust by others 2,546,988 4,858,183 Notes receivable, net of allowances of $725,295 and $804,373 5,858,294 5,679,825 Other assets 18,119,951 16,315,522 Total current assets 939,734,038 838,908,655
Non-CurrentCash and cash equivalents 28,197,524 29,641,623 Investments 254,715,826 264,256,722 Notes receivable, net of allowance of $3,612,455 and $4,170,174 34,228,279 35,989,863 Deposits and funds held in trust by others 47,203,641 35,096,064 Other non-current assets 559,394 538,151 Capital assets, net of depreciation of $2,255,534,685 and $2,095,962,470 2,597,819,427 2,635,668,882 Total non-current assets 2,962,724,091 3,001,191,305
TOTAL ASSETS 3,902,458,129$ 3,840,099,960$
DEFERRED OUTFLOWS OF RESOURCESDebt refunding 30,866,887$ 21,330,973$ Pensions 16,240,810 8,376,339 TOTAL DEFERRED OUTFLOWS OF RESOURCES 47,107,697$ 29,707,312
LIABILITIESCurrent
Accounts payable and other accrued liabilities 144,682,862$ $139,040,603Unearned revenue 48,892,014 39,681,306 Funds held in trust for others 5,725,842 5,911,575 Liability for future insurance claims (Note 13) 18,412,300 20,800,000 Estimated third party payor settlements 11,704,000 1,071,000 Compensated absences payable - current portion (Note 4) 6,492,345 5,713,469 Bonds, notes, capital leases and installment contracts payable - current portion (Note 8) 79,025,167 73,664,386 Total current liabilities 314,934,530 285,882,339
Non-CurrentUnearned revenues, deposits and other 630,453 1,373,537 Refundable federal advance - Perkins loans 16,568,836 16,562,464 Compensated absences payable (Note 4) 78,733,949 77,454,948 Liability for other postemployment benefits (Note 15) 62,779,374 56,024,345 Liability for pensions (Note 14) 43,401,224 32,204,554 Bonds, notes, capital leases and installment contracts payable (Note 8) 1,224,492,480 1,252,232,647 Total non-current liabilities 1,426,606,316 1,435,852,495
TOTAL LIABILITIES 1,741,540,846$ 1,721,734,834$
DEFERRED INFLOWS OF RESOURCESPensions 8,700,386$ 13,720,266$
NET POSITIONNet Investment in Capital Assets 1,370,245,568$ $1,364,040,122Restricted Non-Expendable Scholarships and fellowships 12,240,580 12,265,900 Research 6,190,070 6,198,962 Other 50,131,972 49,962,779 Expendable Scholarships and fellowships 18,914,989 18,136,468 Research 58,145,321 60,372,649 Public service 17,124,824 13,497,289 Capital projects 121,306,579 129,555,567 Other 33,487,258 37,308,718 Unrestricted 511,537,433 443,013,718 TOTAL NET POSITION 2,199,324,594$ 2,134,352,172$
See accompanying notes.
UNIVERSITY OF ARKANSASStatement of Net Position
June 30, 2016 with comparative figures at June 30, 2015
17
UNIVERSITY OF ARKANSAS SYSTEM: Consolidated Financial Statements FY16
18
UNIVERSITY OF ARKANSAS SYSTEM: Consolidated Financial Statements FY16
19
Year Ended Year EndedOperating Revenues June 30, 2016 June 30, 2015
Student tuition & fees, net of scholarship allowances of $154,807,966 and $151,862,009 331,150,709$ 309,858,306$ Patient services, net of contractual allowances of $1,651,452,000 and $1,487,439,000 1,175,658,000 1,021,183,000 Federal and county appropriations 14,588,335 15,171,093 Federal grants and contracts 135,347,533 133,785,973 State and local grants and contracts 95,132,743 63,230,718 Non-governmental grants and contracts 74,357,226 110,102,883 Sales and services of educational departments 58,114,942 56,232,068 Insurance plan 49,636,512 41,906,111 Auxiliary enterprises
Athletics, net of scholarship allowances of $3,033,140 and $2,883,409 104,306,893 92,403,184 Housing/food service, net of scholarship allowances of $16,917,095 and $16,541,235 65,589,746 61,237,435 Bookstore, net of scholarship allowances of $1,425,810 and $1,598,596 15,751,082 16,331,772 Other auxiliary enterprises, net of scholarship allowances of $341,881 and $321,828 17,768,906 16,975,519
Other operating revenues 34,861,040 32,102,709 Total operating revenues 2,172,263,667 1,970,520,771
Operating ExpensesCompensation and benefits 1,555,156,358 1,499,840,271$ Supplies and services 774,514,898 702,207,626 Scholarships and fellowships 63,926,694 65,686,099 Insurance plan 161,167,230 175,921,378 Depreciation 178,113,075 172,776,805 Total operating expenses 2,732,878,255 2,616,432,179
Operating loss (560,614,588) (645,911,408)
Non-Operating Revenues (Expenses)State appropriations, net of Medicaid match payments of $99,151,000 and $85,075,000 402,577,620 411,402,231 Property and sales tax 12,715,581 12,531,223 Federal grants 85,527,558 89,340,032 State and local grants 47,308,994 48,345,734 Non-governmental grants 1,084,460 1,034,714 Gifts 103,423,775 91,207,792 Investment income (net) 160,945 13,162,116 Interest and fees on capital asset-related debt (43,132,251) (46,017,268) Loss on disposal of assets (202,651) (2,268,024) Other 1,669,812 3,467,151 Net non-operating revenues 611,133,843 622,205,701 Income before other revenues and expenses 50,519,255 (23,705,707)
Other Changes in Net PositionCapital appropriations 2,169,838 1,850,000 Capital grants and gifts 13,369,683 53,841,730 Adjustments to prior year revenues and expenses (87,207) (92,797) Other (999,147) (1,237,792) Total other revenues and expenses 14,453,167 54,361,141
Increase in net position 64,972,422 30,655,434
Net Position, beginning of year 2,134,352,172 2,143,972,486 Adjustment due to GASB 68 (Note 23) (40,275,748)
Net Position, beginning of year, restated 2,134,352,172 2,103,696,738
Net Position, end of year 2,199,324,594$ 2,134,352,172
See accompanying notes.
UNIVERSITY OF ARKANSASStatement of Revenues, Expenses, and Changes in Net Position
For The Year Ended June 30, 2016with comparative figures for 2015
UNIVERSITY OF ARKANSAS SYSTEM: Consolidated Financial Statements FY16
18
UNIVERSITY OF ARKANSAS SYSTEM: Consolidated Financial Statements FY16
19
UNIVERSITY OF ARKANSAS SYSTEM: Consolidated Financial Statements FY16UNIVERSITY OF ARKANSAS SYSTEM: Consolidated Financial Statements FY16
20
Year Ended Year EndedCash Flows from Operating Activities June 30, 2016 June 30, 2015
Student tuition and fees (net of scholarships) 331,965,826$ 308,760,959$ Patient and insurance payments 1,125,598,000 1,029,490,000 Federal and county appropriations 14,219,112 16,369,041 Grants and contracts 305,759,432 311,443,181 Collection of loans and interest 5,663,800 5,144,214 Insurance plan receipts 49,594,966 42,188,954 Auxiliary enterprise revenues:
Athletics 103,366,096 92,505,562 Housing and food service 66,136,317 60,254,255 Bookstore 15,920,564 15,631,345 Other auxiliary enterprises 16,735,735 17,125,774
Payments to employees (1,338,421,457) (1,279,763,268) Payments of employee benefits (209,719,686) (209,650,695) Payments to suppliers (753,974,973) (688,608,187) Loans issued to students (5,201,636) (5,047,198) Scholarships and fellowships (64,171,322) (65,679,174) Payments of insurance plan expenses (163,568,837) (169,895,119) Other 80,062,288 76,783,968
Net cash used by operating activities (420,035,775) (442,946,388)
Cash Flows from Noncapital Financing ActivitiesState appropriations 434,873,620 414,601,231 Property and sales tax 12,814,916 12,557,248 Gifts and grants for other than capital purposes 236,925,764 229,303,334 Direct Lending, Plus and FFEL loan receipts 268,632,192 264,334,512 Direct Lending, Plus and FFEL loan payments (269,874,257) (262,267,261) Other agency funds - net 1,246,335 412,953 Payment of principal on debt (49,507) Payment of interest on debt (1,100) Refunds to grantors (18,000) (45,557)
Net cash provided by noncapital financing activities 684,549,963 658,896,460
Cash Flows from Capital and Related Financing ActivitiesDistributions from debt proceeds 33,694,561 196,794,430 Capital appropriations 2,088,340 1,850,000 Capital grants and gifts ` 8,191,238 49,307,503 Property taxes - capital allocation 15 Proceeds from sale of capital assets 124,353 1,127,191 Purchases of capital assets (133,784,741) (200,942,864) Payment of capital related principal on debt (72,432,295) (166,230,709) Payment of capital related interest and fees (48,305,455) (54,121,976) Insurance proceeds 26,182 20,907 Payments for bond refunding and related costs (7,022,264) Payments to/from trustee for reserve 207,070
Net cash used by capital and related financing activities (217,420,081) (171,988,433)
Cash Flows from Investing ActivitiesProceeds from sales and maturities of investments 156,319,253 54,984,690 Investment income (net of fees) 2,271,767 1,416,625 Purchases of investments (110,195,370) (81,433,573)
Net cash used by investing activities 48,395,650 (25,032,258)
Net increase in cash 95,489,757 18,929,381 Cash, beginning of year 460,613,498 441,684,117 Cash, end of year 556,103,255$ 460,613,498$
UNIVERSITY OF ARKANSASStatement of Cash Flows - Direct Method
For The Year Ended June 30, 2016with comparative figures for 2015
19
UNIVERSITY OF ARKANSAS SYSTEM: Consolidated Financial Statements FY16
19
UNIVERSITY OF ARKANSAS SYSTEM: Consolidated Financial Statements FY16
21
Year Ended Year EndedJune 30, 2016 June 30, 2015
Reconciliation of net operating loss to net cash used by operating activities:
Operating loss (560,614,588)$ (645,911,408)$
Adjustments to reconcile net operating loss to net cash usedby operating activities:
Depreciation expense 178,113,075 172,776,805 Other miscellaneous operating receipts 3,373,632 2,974,115 Adjustment to cash for amounts in transit within the system (610,885) 1,170,872 Change in assets and liabilities:
Receivables, net (66,650,691) 866,041 Inventories (3,362,751) 585,961 Prepaid expenses and other assets (860,452) (2,245,923) Accounts payable and other accrued liabilities 10,107,152 13,385,031 Unearned revenue 7,253,358 294,732 Liability for future insurance claims (2,387,700) 6,276,000 Loans to students and employees 197,661 69,890 Refundable federal advance 7,870 (179,993) Compensated absences 2,057,879 2,509,900 OPEB liability 6,755,028 6,031,871 Pension related (3,671,682) (3,311,268) Other 10,257,319 1,760,986
NET CASH USED BY OPERATING ACTIVITIES (420,035,775)$ (442,946,388)$
Non-Cash TransactionsCapital Gifts $ 10,859,770 $ 620,679Fixed assets acquired by incurring capital lease obligations 2,649,193 10,731,000 Capital outlay & maintenance paid directly from proceeds of debt 564,083Payment of bond proceeds/premium/accrued interest/debt service reserve directly into deposits with trustees/escrow 237,929,886 109,564,638 Payment of bond issuance costs and underwriter's discounts directly from bond proceeds and/or debt service reserve 1,729,038 901,512 Payment of principal & interest on long-term debt from deposits with trustees 271,529 539,702 Interest earned on deposits with trustees 13,189 7,489 Payment on long-term debt directly from University of Arkansas Foundation, Inc. and Razorback Foundation, Inc. 214,188Loss on disposal of assets 614,205 1,555,175 Valuation adjustment to capital assets 1,103,802 (221,615) Value of goods received from sponsorship agreements with vendors 3,430,000
See accompanying notes.
UNIVERSITY OF ARKANSASStatement of Cash Flows - Direct Method - Continued
For The Year Ended June 30, 2016with comparative figures for 2015
UNIVERSITY OF ARKANSAS SYSTEM: Consolidated Financial Statements FY16
20
UNIVERSITY OF ARKANSAS SYSTEM: Discreetly Presented Component Units
21
UNIVERSITY OF ARKANSAS SYSTEM: Discreetly Presented Component Units
UNIVERSITY OF ARKANSAS SYSTEM: Discreetly Presented Component Units
22
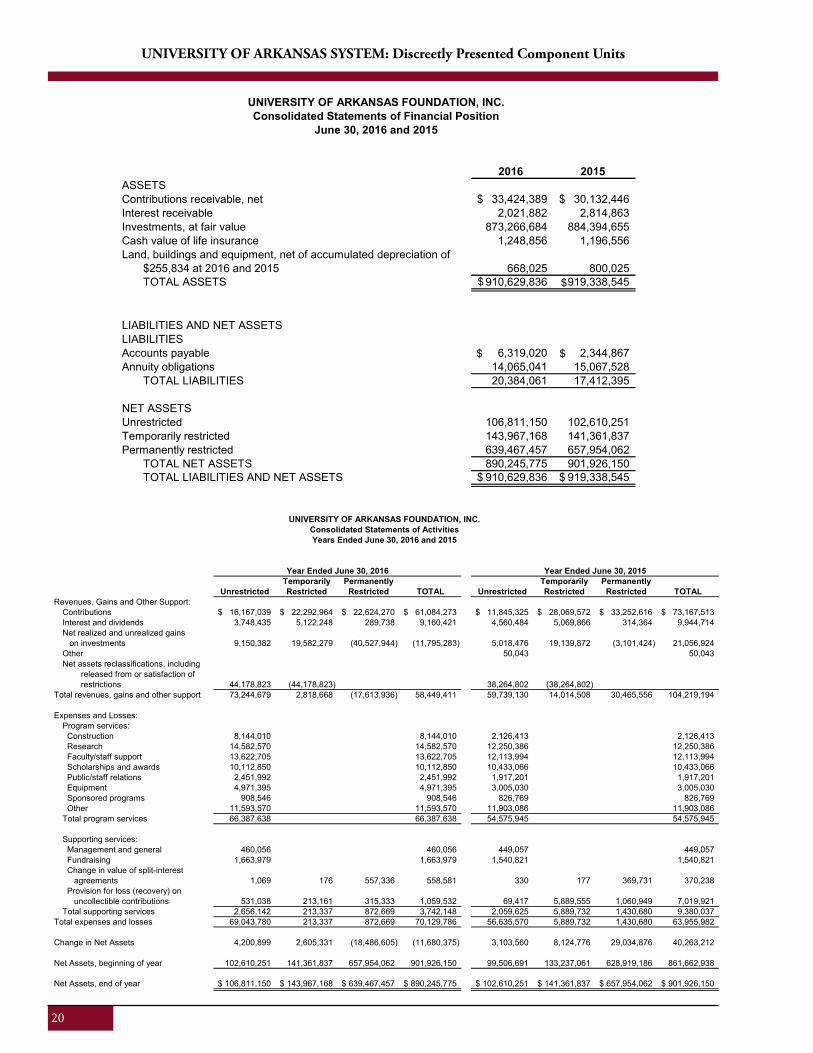
2016 2015ASSETSContributions receivable, net 33,424,389$ 30,132,446$ Interest receivable 2,021,882 2,814,863Investments, at fair value 873,266,684 884,394,655Cash value of life insurance 1,248,856 1,196,556Land, buildings and equipment, net of accumulated depreciation of
$255,834 at 2016 and 2015 668,025 800,025TOTAL ASSETS 910,629,836 919,338,545
LIABILITIES AND NET ASSETSLIABILITIESAccounts payable 6,319,020 2,344,867Annuity obligations 14,065,041 15,067,528
TOTAL LIABILITIES 20,384,061 17,412,395
NET ASSETSUnrestricted 106,811,150 102,610,251Temporarily restricted 143,967,168 141,361,837Permanently restricted 639,467,457 657,954,062
TOTAL NET ASSETS 890,245,775 901,926,150TOTAL LIABILITIES AND NET ASSETS 910,629,836$ 919,338,545$
UNIVERSITY OF ARKANSAS FOUNDATION, INC.Consolidated Statements of Financial Position
June 30, 2016 and 2015
Temporarily Permanently Temporarily PermanentlyUnrestricted Restricted Restricted TOTAL Unrestricted Restricted Restricted TOTAL
Revenues, Gains and Other Support:Contributions 16,167,039$ 22,292,964$ 22,624,270$ 61,084,273$ 11,845,325$ 28,069,572$ 33,252,616$ 73,167,513$ Interest and dividends 3,748,435 5,122,248 289,738 9,160,421 4,560,484 5,069,866 314,364 9,944,714 Net realized and unrealized gains on investments 9,150,382 19,582,279 5,018,476 19,139,872 (3,101,424) 21,056,924 Other
(40,527,944) (11,795,283) 50,043 50,043
Net assets reclassifications, including released from or satisfaction of restrictions 44,178,823 (44,178,823) 38,264,802 (38,264,802)
Total revenues, gains and other support 73,244,679 2,818,668 (17,613,936) 58,449,411 59,739,130 14,014,508 30,465,556 104,219,194
Expenses and Losses:Program services: Construction 8,144,010 8,144,010 2,126,413 2,126,413 Research 14,582,570 14,582,570 12,250,386 12,250,386 Faculty/staff support 13,622,705 13,622,705 12,113,994 12,113,994 Scholarships and awards 10,112,850 10,112,850 10,433,066 10,433,066 Public/staff relations 2,451,992 2,451,992 1,917,201 1,917,201 Equipment 4,971,395 4,971,395 3,005,030 3,005,030 Sponsored programs 908,546 908,546 826,769 826,769 Other 11,593,570 11,593,570 11,903,086 11,903,086 Total program services 66,387,638 66,387,638 54,575,945 54,575,945
Supporting services: Management and general 460,056 460,056 449,057 449,057 Fundraising 1,663,979 1,663,979 1,540,821 1,540,821 Change in value of split-interest agreements 1,069 176 557,336 558,581 330 177 369,731 370,238 Provision for loss (recovery) on uncollectible contributions 531,038 213,161 315,333 1,059,532 69,417 5,889,555 1,060,949 7,019,921 Total supporting services 2,656,142 213,337 872,669 3,742,148 2,059,625 5,889,732 1,430,680 9,380,037
Total expenses and losses 69,043,780 213,337 872,669 70,129,786 56,635,570 5,889,732 1,430,680 63,955,982
Change in Net Assets 4,200,899 2,605,331 (18,486,605) (11,680,375) 3,103,560 8,124,776 29,034,876 40,263,212
Net Assets, beginning of year 102,610,251 141,361,837 657,954,062 901,926,150 99,506,691 133,237,061 628,919,186 861,662,938
Net Assets, end of year 106,811,150$ 143,967,168$ 639,467,457$ 890,245,775$ 102,610,251$ 141,361,837$ 657,954,062$ 901,926,150$
Year Ended June 30, 2016 Year Ended June 30, 2015
UNIVERSITY OF ARKANSAS FOUNDATION, INC.Consolidated Statements of ActivitiesYears Ended June 30, 2016 and 2015
UNIVERSITY OF ARKANSAS SYSTEM: Discreetly Presented Component Units
22
2016 2015ASSETSContributions receivable, net 33,424,389$ 30,132,446$ Interest receivable 2,021,882 2,814,863 Investments, at fair value 873,266,684 884,394,655 Cash value of life insurance 1,248,856 1,196,556 Land, buildings and equipment, net of accumulated depreciation of
$255,834 at 2016 and 2015 668,025 800,025 TOTAL ASSETS 910,629,836 919,338,545
LIABILITIES AND NET ASSETSLIABILITIESAccounts payable 6,319,020 2,344,867 Annuity obligations 14,065,041 15,067,528
TOTAL LIABILITIES 20,384,061 17,412,395
NET ASSETSUnrestricted 106,811,150 102,610,251 Temporarily restricted 143,967,168 141,361,837 Permanently restricted 639,467,457 657,954,062
TOTAL NET ASSETS 890,245,775 901,926,150 TOTAL LIABILITIES AND NET ASSETS 910,629,836$ 919,338,545$
UNIVERSITY OF ARKANSAS FOUNDATION, INC.Consolidated Statements of Financial Position
June 30, 2016 and 2015
Temporarily Permanently Temporarily PermanentlyUnrestricted Restricted Restricted TOTAL Unrestricted Restricted Restricted TOTAL
Revenues, Gains and Other Support:Contributions 16,167,039$ 22,292,964$ 22,624,270$ 61,084,273$ 11,845,325$ 28,069,572$ 33,252,616$ 73,167,513$ Interest and dividends 3,748,435 5,122,248 289,738 9,160,421 4,560,484 5,069,866 314,364 9,944,714Net realized and unrealized gains on investments 9,150,382 19,582,279 (40,527,944) (11,795,283) 5,018,476 19,139,872 (3,101,424) 21,056,924Other - 50,043 50,043Net assets reclassifications, including released from or satisfaction of restrictions 44,178,823 (44,178,823) - 38,264,802 (38,264,802) -
Total revenues, gains and other support 73,244,679 2,818,668 (17,613,936) 58,449,411 59,739,130 14,014,508 30,465,556 104,219,194
Expenses and Losses:Program services: Construction 8,144,010 8,144,010 2,126,413 2,126,413 Research 14,582,570 14,582,570 12,250,386 12,250,386 Faculty/staff support 13,622,705 13,622,705 12,113,994 12,113,994 Scholarships and awards 10,112,850 10,112,850 10,433,066 10,433,066 Public/staff relations 2,451,992 2,451,992 1,917,201 1,917,201 Equipment 4,971,395 4,971,395 3,005,030 3,005,030 Sponsored programs 908,546 908,546 826,769 826,769 Other 11,593,570 11,593,570 11,903,086 11,903,086Total program services 66,387,638 66,387,638 54,575,945 54,575,945
Supporting services: Management and general 460,056 460,056 449,057 449,057 Fundraising 1,663,979 1,663,979 1,540,821 1,540,821 Change in value of split-interest agreements 1,069 176 557,336 558,581 330 177 369,731 370,238 Provision for loss (recovery) on uncollectible contributions 531,038 213,161 315,333 1,059,532 69,417 5,889,555 1,060,949 7,019,921Total supporting services 2,656,142 213,337 872,669 3,742,148 2,059,625 5,889,732 1,430,680 9,380,037
Total expenses and losses 69,043,780 213,337 872,669 70,129,786 56,635,570 5,889,732 1,430,680 63,955,982
Change in Net Assets 4,200,899 2,605,331 (18,486,605) (11,680,375) 3,103,560 8,124,776 29,034,876 40,263,212
Net Assets, beginning of year 102,610,251 141,361,837 657,954,062 901,926,150 99,506,691 133,237,061 628,919,186 861,662,938
Net Assets, end of year 106,811,150$ 143,967,168$ 639,467,457$ 890,245,775$ 102,610,251$ 141,361,837$ 657,954,062$ 901,926,150$
Year Ended June 30, 2016 Year Ended June 30, 2015
UNIVERSITY OF ARKANSAS FOUNDATION, INC.Consolidated Statements of ActivitiesYears Ended June 30, 2016 and 2015
21
UNIVERSITY OF ARKANSAS SYSTEM: Discreetly Presented Component Units
21
UNIVERSITY OF ARKANSAS SYSTEM: Discreetly Presented Component Units
23
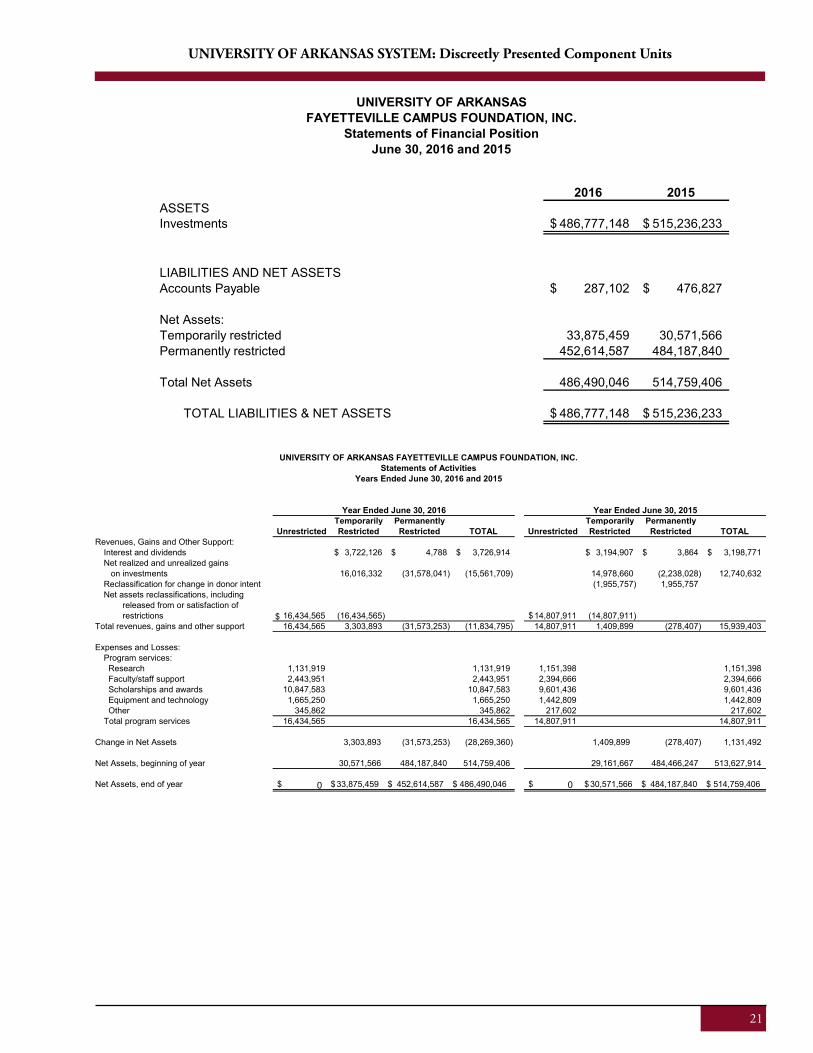
2016 2015ASSETSInvestments 486,777,148$ 515,236,233$
LIABILITIES AND NET ASSETSAccounts Payable 287,102$ 476,827$
Net Assets:Temporarily restricted 33,875,459 30,571,566 Permanently restricted 452,614,587 484,187,840
Total Net Assets 486,490,046 514,759,406
TOTAL LIABILITIES & NET ASSETS 486,777,148$ 515,236,233$
UNIVERSITY OF ARKANSAS
Statements of Financial PositionJune 30, 2016 and 2015
FAYETTEVILLE CAMPUS FOUNDATION, INC.
Temporarily Permanently Temporarily PermanentlyUnrestricted Restricted Restricted TOTAL Unrestricted Restricted Restricted TOTAL
Revenues, Gains and Other Support:Interest and dividends -$ 3,722,126$ 4,788$ 3,726,914$ -$ 3,194,907$ 3,864$ 3,198,771$ Net realized and unrealized gains on investments 16,016,332 (31,578,041) (15,561,709) 14,978,660 (2,238,028) 12,740,632Reclassification for change in donor intent - (1,955,757) 1,955,757 -Net assets reclassifications, including released from or satisfaction of restrictions 16,434,565 (16,434,565) - 14,807,911 (14,807,911) -
Total revenues, gains and other support 16,434,565 3,303,893 (31,573,253) (11,834,795) 14,807,911 1,409,899 (278,407) 15,939,403
Expenses and Losses:Program services: Research 1,131,919 1,131,919 1,151,398 1,151,398 Faculty/staff support 2,443,951 2,443,951 2,394,666 2,394,666 Scholarships and awards 10,847,583 10,847,583 9,601,436 9,601,436 Equipment and technology 1,665,250 1,665,250 1,442,809 1,442,809 Other 345,862 345,862 217,602 217,602Total program services 16,434,565 16,434,565 14,807,911 14,807,911
Change in Net Assets - 3,303,893 (31,573,253) (28,269,360) - 1,409,899 (278,407) 1,131,492
Net Assets, beginning of year - 30,571,566 484,187,840 514,759,406 29,161,667 484,466,247 513,627,914
Net Assets, end of year -$ 33,875,459$ 452,614,587$ 486,490,046$ -$ 30,571,566$ 484,187,840$ 514,759,406$
Statements of ActivitiesUNIVERSITY OF ARKANSAS FAYETTEVILLE CAMPUS FOUNDATION, INC.
Years Ended June 30, 2016 and 2015
Year Ended June 30, 2016 Year Ended June 30, 2015
UNIVERSITY OF ARKANSAS SYSTEM: Discreetly Presented Component Units
UNIVERSITY OF ARKANSAS SYSTEM: Discreetly Presented Component Units
23
2016 2015ASSETSInvestments 486,777,148$ 515,236,233$
LIABILITIES AND NET ASSETSAccounts Payable 287,102$ 476,827$
Net Assets:Temporarily restricted 33,875,459 30,571,566Permanently restricted 452,614,587 484,187,840
Total Net Assets 486,490,046 514,759,406
TOTAL LIABILITIES & NET ASSETS 486,777,148$ 515,236,233$
UNIVERSITY OF ARKANSAS
Statements of Financial PositionJune 30, 2016 and 2015
FAYETTEVILLE CAMPUS FOUNDATION, INC.
Temporarily Permanently Temporarily PermanentlyUnrestricted Restricted Restricted TOTAL Unrestricted Restricted Restricted TOTAL
Revenues, Gains and Other Support:Interest and dividends
$
3,722,126$ 4,788$ 3,726,914$
$
3,194,907$ 3,864$ 3,198,771$ Net realized and unrealized gains on investments 16,016,332 (31,578,041) (15,561,709) 14,978,660 (2,238,028) 12,740,632 Reclassification for change in donor intent (1,955,757) 1,955,757 Net assets reclassifications, including released from or satisfaction of restrictions 16,434,565 (16,434,565) 14,807,911 (14,807,911)
Total revenues, gains and other support 16,434,565 3,303,893 (31,573,253) (11,834,795) 14,807,911 1,409,899 (278,407) 15,939,403
Expenses and Losses:Program services: Research 1,131,919 1,131,919 1,151,398 1,151,398 Faculty/staff support 2,443,951 2,443,951 2,394,666 2,394,666 Scholarships and awards 10,847,583 10,847,583 9,601,436 9,601,436 Equipment and technology 1,665,250 1,665,250 1,442,809 1,442,809 Other 345,862 345,862 217,602 217,602 Total program services 16,434,565 16,434,565 14,807,911 14,807,911
Change in Net Assets 3,303,893 (31,573,253) (28,269,360) 1,409,899 (278,407) 1,131,492
Net Assets, beginning of year 30,571,566 484,187,840 514,759,406 29,161,667 484,466,247 513,627,914
Net Assets, end of year $ $ 33,875,459 $ 452,614,587 $ 486,490,046 $ $ 30,571,566 $ 484,187,840 $ 514,759,406
Statements of ActivitiesUNIVERSITY OF ARKANSAS FAYETTEVILLE CAMPUS FOUNDATION, INC.
Years Ended June 30, 2016 and 2015
Year Ended June 30, 2016 Year Ended June 30, 2015
00
22
UNIVERSITY OF ARKANSAS SYSTEM: Campus Financial Statements FY16
22
UNIVERSITY OF ARKANSAS SYSTEM: Campus Financial Statements FY16
UN
IVER
SITY
OF
ARK
ANSA
S SY
STEM
:Cam
pus
Fina
ncia
l Sta
tem
ents
FY1
6
24
Elim
inat
ion
UAF
UAF
SU
ALR
UA
MS
UA
MU
AP
BS
YSTE
MC
CC
UA
PC
CU
AU
AC
CB
UA
CC
HU
AC
CM
AS
MS
A(S
ee N
ote
19)
TOTA
LAS
SET
SC
urre
nt Cas
h an
d ca
sh e
quiv
alen
ts28
4,63
7,15
2$
13,8
78,8
75$
35,2
53,0
19$
108,
977,
000
$
5,
171,
204
$
24
,409
,327
$
30
,158
,792
$
1,
631,
399
$
11
,137
,034
$
2,92
3,67
9$
2,67
7,28
7$
1,73
8,05
2$
5,10
9,98
6$
527,
905,
731
$
20
2,92
5 $
In
vest
men
ts82
,150
,434
1,
500,
000
18,3
50,9
05
2,37
0,00
0
775,
910
295,
085
1,11
3,23
7
4,44
7,33
4
111,
002,
905
Ac
coun
ts re
ceiv
able
39,2
05,9
79
2,83
1,59
6
7,
270,
155
34,0
92,0
00
3,54
7,09
8
6,
730,
720
14,3
53,4
24
89
7,20
9
1,
378,
955
74
9,13
9
62
3,74
5
92
3,30
3
73
,300
(14,
925,
551)
97
,751
,072
Patie
nt a
ccou
nts
rece
ivab
le14
4,82
8,00
0
14
4,82
8,00
0
Inve
ntor
ies
5,64
7,81
9
24
,302
21
3,53
5
24,2
87,0
00
456,
696
26
,433
16
8,35
5
61
,247
285,
506
496,
158
54,0
46
31
,721
,097
Dep
osits
and
fund
s he
ld in
trus
t by
othe
rs2,
222,
482
322,
808
1
100
9
1,58
8
2,54
6,98
8
Not
es re
ceiv
able
3,67
6,90
8
2,
560
2,
175,
000
24
,332
(2
0,50
6)
5,85
8,29
4
Oth
er a
sset
s9,
830,
170
391,
179
57
6,34
2
6,61
7,00
0
281,
180
11
,070
16
9,11
1
145,
846
11,4
49
10
7,89
2
12
,812
115,
900
(150
,000
)
18,1
19,9
51
Tot
al c
urre
nt a
sset
s42
7,37
0,94
4
18,6
28,5
12
61,9
86,7
64
323,
346,
000
9,48
0,51
1
31
,177
,650
44
,681
,327
3,61
8,71
9
12,8
83,7
79
4,
067,
804
4,
910,
427
7,
175,
547
5,
299,
186
(1
4,89
3,13
2)
939,
734,
038
Non
-Cur
rent
Cas
h an
d ca
sh e
quiv
alen
ts2,
682,
971
4,86
9,41
6
8,
103
1,
220,
387
18,2
32,8
94
420,
750
170,
898
67,1
05
52
5,00
0
28
,197
,524
Inve
stm
ents
70,5
79,7
92
9,43
9,07
2
10
,823
,486
15
4,90
7,00
0
4,
820,
054
2,57
1,42
2
75
,000
1,50
0,00
0
254,
715,
826
N
otes
rece
ivab
le12
,415
,489
74
,729
19
3,37
5
12,8
85,0
00
499,
160
23
3,11
1
18,4
39
44
,968
24,4
23
16
,394
21,0
30
10
,986
,963
(3,1
84,8
02)
34,2
28,2
79
D
epos
its a
nd fu
nds
held
in tr
ust b
y ot
hers
27,2
27,5
13
3,63
1,16
4
92
2,08
0
4,05
3,00
0
147,
936
145,
851
11,0
76,0
97
47
,203
,641
Oth
er n
on-c
urre
nt a
sset
s55
9,39
4
600,
000
(6
00,0
00)
55
9,39
4
Cap
ital a
sset
s1,
192,
317,
818
152,
656,
582
240,
116,
118
797,
640,
000
44,2
85,1
86
86,3
03,6
45
3,40
0,22
7
14,5
42,3
33
18
,265
,356
13,2
71,5
36
17
,932
,039
12,6
80,5
64
4,
408,
023
2,
597,
819,
427
T
otal
non
-cur
rent
ass
ets
1,30
5,78
2,97
7
17
0,67
0,96
3
25
2,06
3,16
2
96
9,48
5,00
0
50
,824
,787
10
7,34
1,07
2
4,
000,
227
15
,056
,522
18,3
10,3
24
14
,943
,895
18,2
65,1
82
23
,844
,796
15,9
19,9
86
(3
,784
,802
)
2,
962,
724,
091
TO
TAL
ASSE
TS1,
733,
153,
921
189,
299,
475
314,
049,
926
1,29
2,83
1,00
0
60,3
05,2
98
138,
518,
722
48,6
81,5
54
18
,675
,241
31,1
94,1
03
19
,011
,699
23,1
75,6
09
31
,020
,343
21,2
19,1
72
(1
8,67
7,93
4)
3,90
2,45
8,12
9
DEF
ERR
ED O
UTF
LOW
S O
F R
ESO
UR
CES
Deb
t ref
undi
ng17
,248
,606
1,
705,
401
4,32
8,89
8
5,
435,
000
58
8,94
3
270,
678
95
,865
969,
129
1,82
8
200,
072
22,4
67
30
,866
,887
Pens
ions
4,08
3,96
4
93
6,70
6
3,09
9,21
6
3,
083,
000
76
1,82
0
163,
186
70
,339
73
3,04
7
52
1,94
1
86
7,51
7
67
9,26
7
99
1,49
7
24
9,31
0
16
,240
,810
TO
TAL
DE
FER
RE
D O
UTF
LOW
S O
F R
ESO
UR
CES
21,3
32,5
70
2,64
2,10
7
7,
428,
114
8,51
8,00
0
1,35
0,76
3
43
3,86
4
70,3
39
828,
912
1,49
1,07
0
869,
345
879,
339
1,01
3,96
4
249,
310
47,1
07,6
97
LIAB
ILIT
IES
Cur
rent Ac
coun
ts p
ayab
le a
nd o
ther
acc
rued
liab
ilitie
s51
,372
,428
4,
500,
280
4,36
0,62
0
92
,550
,000
1,
714,
192
1,46
6,77
3
93
0,40
0
167,
341
847,
415
199,
674
301,
550
777,
194
367,
621
(14,
872,
626)
14
4,68
2,86
2
Une
arne
d re
venu
e32
,469
,939
45
5,80
8
170,
179
14
,870
,000
18
1,19
7
210,
598
2,
241
17
7,79
9
16
7,33
4
64
,753
65,5
06
56
,660
48,8
92,0
14
Fu
nds
held
in tr
ust f
or o
ther
s1,
313,
857
182,
168
1,
088,
931
482,
000
24
5,36
4
2,14
5,90
5
44
,335
22,6
60
27
,745
66,5
04
38
,778
67,5
95
5,
725,
842
Li
abili
ty fo
r fut
ure
insu
ranc
e cl
aim
s18
,412
,300
18,4
12,3
00
Es
timat
ed th
ird p
arty
pay
or s
ettle
men
ts11
,704
,000
11
,704
,000
Com
pens
ated
abs
ence
s pa
yabl
e - c
urre
nt p
ortio
n1,
685,
575
317,
194
54
7,73
8
3,51
1,00
0
96,4
47
174,
300
11
,512
18
,627
35,9
76
26
,524
30,0
85
17
,128
20,2
39
6,
492,
345
B
onds
, not
es, c
apita
l lea
ses,
inst
allm
ent c
ontra
cts
paya
ble
32,8
16,8
15
5,62
5,80
9
6,
438,
270
30,0
48,0
00
1,03
3,65
5
84
7,74
0
49,6
16
273,
750
387,
302
371,
146
675,
765
477,
805
(20,
506)
79
,025
,167
T
otal
cur
rent
liab
ilitie
s11
9,65
8,61
4
11,0
81,2
59
12,6
05,7
38
153,
165,
000
3,27
0,85
5
4,
845,
316
19,4
06,0
69
68
1,85
2
1,
460,
687
68
9,84
2
1,
073,
904
1,
376,
411
51
2,11
5
(1
4,89
3,13
2)
314,
934,
530
Non
-Cur
rent
Une
arne
d re
venu
es, d
epos
its a
nd o
ther
28,2
29
216,
766
12
8,00
0
108,
828
14
8,63
0
60
0,00
0
(6
00,0
00)
63
0,45
3
Ref
unda
ble
fede
ral a
dvan
ce -
Perk
ins
loan
s14
,210
,926
1,
911,
000
44
6,91
0
16,5
68,8
36
C
ompe
nsat
ed a
bsen
ces
paya
ble
18,5
19,1
50
1,33
6,22
9
3,
826,
664
49,2
02,0
00
1,02
9,23
1
2,
145,
347
619,
739
35
3,90
6
44
5,22
6
45
7,20
6
35
1,69
1
34
6,14
9
10
1,41
1
78
,733
,949
Liab
ility
for o
ther
pos
t em
ploy
men
t ben
efits
15,3
86,2
70
1,32
5,31
4
5,
483,
674
33,9
18,0
00
1,44
0,77
0
2,
464,
571
243,
071
16
0,61
3
95
7,18
6
47
9,29
2
17
8,07
2
38
1,51
9
36
1,02
2
62
,779
,374
Liab
ility
for p
ensi
ons
9,29
6,12
7
2,
841,
957
6,79
4,59
3
9,
056,
000
2,
584,
391
595,
884
12
2,75
8
2,33
6,49
0
1,39
7,26
0
2,31
7,80
4
2,16
0,73
8
2,98
8,01
5
909,
207
43,4
01,2
24
Bo
nds,
not
es, c
apita
l lea
ses,
inst
allm
ent c
ontra
cts
paya
ble
662,
735,
244
74
,599
,228
11
8,65
4,21
8
30
3,12
8,00
0
16
,195
,457
16
,605
,108
2,
888,
626
4,
358,
946
10
,910
,919
865,
408
4,40
3,56
7
12,3
32,5
61
(3
,184
,802
)
1,
224,
492,
480
T
otal
non
-cur
rent
liab
ilitie
s72
0,17
5,94
6
80,1
02,7
28
134,
975,
915
397,
343,
000
21,6
96,7
59
21,9
19,7
38
3,87
4,19
4
7,20
9,95
5
13,8
59,2
21
4,
119,
710
7,
094,
068
16
,048
,244
1,97
1,64
0
(3,7
84,8
02)
1,42
6,60
6,31
6
T
OTA
L LI
AB
ILIT
IES
839,
834,
560
91
,183
,987
14
7,58
1,65
3
55
0,50
8,00
0
24
,967
,614
26
,765
,054
23
,280
,263
7,89
1,80
7
15,3
19,9
08
4,
809,
552
8,
167,
972
17
,424
,655
2,48
3,75
5
(18,
677,
934)
1,
741,
540,
846
DEF
ERR
ED IN
FLO
WS
OF
RE
SOU
RC
ES
Pens
ions
1,75
6,04
4
62
8,66
2
871,
072
1,
096,
000
76
0,72
3
185,
740
14
,138
61
1,19
4
29
7,90
1
54
9,15
4
66
2,42
7
70
0,59
8
56
6,73
3
8,
700,
386
NET
PO
SITI
ON
Net
Inve
stm
ent i
n C
apita
l Ass
ets
537,
504,
192
75
,845
,015
12
0,16
5,30
5
46
7,79
2,00
0
27
,645
,017
69
,059
,762
3,
400,
227
10
,005
,503
7,93
6,26
4
12,1
84,7
46
12
,990
,632
11,0
86,6
17
14
,630
,288
1,37
0,24
5,56
8
R
estri
cted
N
on-E
xpen
dabl
eS
chol
arsh
ips
and
fello
wsh
ips
8,36
6,07
2
29
5,40
5
3,04
9,93
8
39
4,00
0
56,0
17
79,1
48
12
,240
,580
Res
earc
h5,
739,
659
128,
852
32
1,55
9
6,19
0,07
0
Oth
er11
,481
,039
7,
698
4,
861,
872
30,0
70,0
00
50,4
86
3,66
0,87
7
50
,131
,972
E
xpen
dabl
eS
chol
arsh
ips
and
fello
wsh
ips
13,0
43,7
92
175,
309
81
8,12
0
2,61
8,00
0
244,
439
1,
148,
322
245,
460
621,
547
18,9
14,9
89
R
esea
rch
28,0
77,8
55
1,82
4,38
2
26
,279
,000
1,
436,
262
527,
822
58
,145
,321
Pub
lic s
ervi
ce8,
997,
390
130,
398
7,
726,
630
270,
406
17
,124
,824
Cap
ital p
roje
cts
10,1
91,8
97
800,
153
3
107,
191,
000
1,31
5,01
7
4,
474
42
0,75
0
1,
212,
387
17
0,89
8
12
1,30
6,57
9
Oth
er20
,292
,967
4,
501,
527
3,37
8,06
9
2,
381,
000
74
6,32
0
2,10
8,91
2
18
,065
19 60
,379
33,4
87,2
58
U
nres
trict
ed26
9,20
1,02
4
18,3
73,4
28
31,0
72,1
44
113,
020,
000
4,11
2,60
7
35
,221
,217
22
,057
,265
477,
686
7,67
3,25
3
2,33
7,57
3
2,06
3,01
9
2,20
0,89
0
3,72
7,32
7
511,
537,
433
TO
TAL
NE
T P
OS
ITIO
N91
2,89
5,88
7$
100,
128,
933
$
173,
025,
315
$
749,
745,
000
$
35
,927
,724
$
11
2,00
1,79
2$
25
,457
,492
$
11
,001
,152
$
17,0
67,3
64$
14
,522
,338
$
15,2
24,5
49$
13
,909
,054
$
18,4
17,9
94$
$
2,1
99,3
24,5
94
UN
IVER
SITY
OF
AR
KA
NSA
SSt
atem
ent o
f Net
Pos
ition
by
Cam
pus
At J
une
30, 2
016
$
0
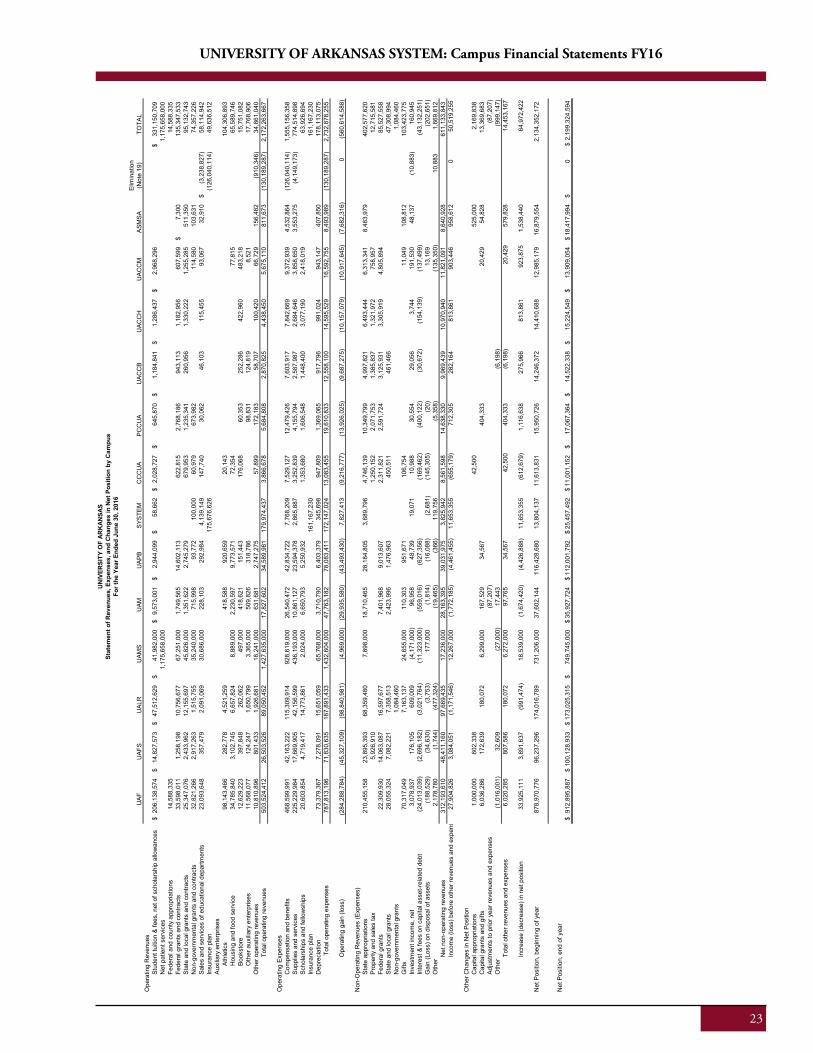
23
UNIVERSITY OF ARKANSAS SYSTEM: Campus Financial Statements FY16
23
UN
IVER
SITY
OF
ARK
ANSA
S SY
STEM
:Cam
pus
Fina
ncia
l Sta
tem
ents
FY1
6
25
Elim
inat
ion
UAF
UAF
SU
ALR
UAM
SU
AMU
APB
SYST
EMC
CC
UA
PCC
UA
UAC
CB
UAC
CH
UAC
CM
ASM
SA(N
ote
19)
TOTA
LO
pera
ting
Rev
enue
sSt
uden
t tui
tion
& fe
es, n
et o
f sch
olar
ship
allo
wan
ces
206,
138,
574
$
14,8
27,5
73$
47
,512
,629
$
41,9
82,0
00$
9,
573,
001
$
2,94
4,09
9$
58,6
62$
2,
028,
727
$
645,
870
$
1,18
4,84
1$
1,
286,
437
$
2,96
8,29
6$
33
1,15
0,70
9$
Net
pat
ient
ser
vice
s1,
175,
658,
000
1,17
5,65
8,00
0
Fe
dera
l and
cou
nty
appr
opria
tions
14,5
88,3
35
14,5
88,3
35
Fede
ral g
rant
s an
d co
ntra
cts
33,5
98,0
11
1,25
8,19
8
10,7
56,6
77
67
,251
,000
1,74
9,56
5
14
,602
,113
622,
815
2,
768,
186
943,
113
1,
182,
956
607,
599
7,
300
$
13
5,34
7,53
3
Stat
e an
d lo
cal g
rant
s an
d co
ntra
cts
25,3
47,0
76
2,43
3,96
2
12,1
55,6
97
45
,826
,000
1,35
1,62
2
2,
745,
279
67
9,95
3
1,23
5,34
1
26
0,95
6
1,33
0,22
2
1,
255,
285
511,
350
95
,132
,743
N
on-g
over
nmen
tal g
rant
s an
d co
ntra
cts
32,8
21,2
66
2,91
7,26
3
1,51
5,75
5
35,2
40,0
00
71
5,99
8
93,7
72
100,
000
60
,979
673,
982
11
4,58
0
103,
631
74
,357
,226
Sa
les
and
serv
ices
of e
duca
tiona
l dep
artm
ents
23,0
93,6
48
357,
479
2,09
1,06
9
30,6
86,0
00
22
8,10
3
292,
984
4,13
9,14
9
14
7,74
0
30,0
62
46,1
03
115,
455
93
,067
32
,910
(3,2
38,8
27)
$
58
,114
,942
In
sura
nce
plan
175,
676,
626
(1
26,0
40,1
14)
49,6
36,5
12
Auxi
liary
ent
erpr
ises
A
thle
tics
98,1
43,4
66
282,
778
4,52
1,25
9
418,
588
92
0,65
9
20
,143
104,
306,
893
Hou
sing
and
food
ser
vice
34,7
85,8
40
3,10
2,74
5
6,65
7,82
4
8,88
9,00
0
2,23
0,59
7
9,
773,
571
72
,354
77,8
15
65,5
89,7
46
B
ooks
tore
12,6
29,2
23
397,
848
262,
062
497,
000
41
8,62
1
151,
443
176,
068
60
,353
25
2,28
6
422,
960
48
3,21
8
15,7
51,0
82
O
ther
aux
iliary
ent
erpr
ises
11,5
68,0
77
124,
247
1,65
0,79
9
3,36
5,00
0
509,
826
31
8,78
6
98
,831
12
4,81
9
8,52
1
17,7
68,9
06
Oth
er o
pera
ting
reve
nues
10,8
10,8
96
801,
433
1,92
6,68
1
18,2
41,0
00
63
1,68
1
2,74
7,27
5
57,8
99
17
2,18
3
58,7
07
100,
420
66
,729
15
6,48
2
(910
,346
)
34
,861
,040
Tot
al o
pera
ting
reve
nues
503,
524,
412
26,5
03,5
26
89
,050
,452
1,42
7,63
5,00
0
17
,827
,602
34
,589
,981
179,
974,
437
3,
866,
678
5,68
4,80
8
2,
870,
825
4,43
8,45
0
5,
675,
110
811,
673
(1
30,1
89,2
87)
2,17
2,26
3,66
7
Ope
ratin
g Ex
pens
esC
ompe
nsat
ion
and
bene
fits
468,
599,
991
42,1
63,2
22
11
5,30
9,91
4
92
8,61
9,00
0
26,5
40,4
72
42,8
34,7
22
7,
768,
209
7,52
9,12
7
12
,479
,426
7,
603,
917
7,84
2,66
9
9,
372,
939
4,53
2,86
4
(1
26,0
40,1
14)
1,55
5,15
6,35
8
Su
pplie
s an
d se
rvic
es22
5,22
9,98
4
17
,669
,905
42,1
56,5
99
43
6,19
3,00
0
10,8
61,1
27
23,5
94,3
78
2,
865,
887
3,25
2,83
9
4,
155,
794
2,58
7,98
7
2,
684,
646
3,85
8,65
0
3,
553,
275
(4,1
49,1
73)
77
4,51
4,89
8
Scho
lars
hips
and
fello
wsh
ips
20,6
03,8
54
4,71
9,41
7
14,7
73,8
61
2,
024,
000
6,
650,
793
5,25
0,93
2
1,35
3,68
0
1,
606,
548
1,44
8,40
0
3,
077,
190
2,41
8,01
9
63
,926
,694
In
sura
nce
plan
161,
167,
230
16
1,16
7,23
0
Dep
reci
atio
n73
,379
,367
7,
278,
091
15
,651
,059
65,7
68,0
00
3,
710,
790
6,40
3,37
9
345,
698
94
7,80
9
1,36
9,06
5
91
7,79
6
991,
024
94
3,14
7
407,
850
17
8,11
3,07
5
T
otal
ope
ratin
g ex
pens
es78
7,81
3,19
6
71
,830
,635
187,
891,
433
1,43
2,60
4,00
0
47
,763
,182
78
,083
,411
172,
147,
024
13
,083
,455
19
,610
,833
12
,558
,100
14
,595
,529
16
,592
,755
8,
493,
989
(130
,189
,287
)
2,
732,
878,
255
O
pera
ting
gain
(los
s)(2
84,2
88,7
84)
(45,
327,
109)
(98,
840,
981)
(4,9
69,0
00)
(29,
935,
580)
(4
3,49
3,43
0)
7,
827,
413
(9,2
16,7
77)
(13,
926,
025)
(9
,687
,275
)
(1
0,15
7,07
9)
(10,
917,
645)
(7
,682
,316
)
0
(
560,
614,
588)
Non
-Ope
ratin
g R
even
ues
(Exp
ense
s)St
ate
appr
opria
tions
210,
455,
158
23,8
95,3
93
68
,359
,480
7,89
8,00
0
18,7
10,4
65
28,1
84,8
05
3,
689,
796
4,74
6,13
9
10
,349
,799
4,
997,
821
6,49
3,44
4
6,
313,
341
8,48
3,97
9
40
2,57
7,62
0
Prop
erty
and
sal
es ta
x5,
926,
910
1,
250,
152
2,07
1,75
3
1,
385,
837
1,32
1,97
2
75
8,95
7
12,7
15,5
81
Fede
ral g
rant
s22
,309
,930
14
,063
,087
16,5
97,6
77
7,
401,
968
9,01
3,60
7
2,31
1,82
1
2,
591,
724
3,12
5,93
1
3,
305,
919
4,80
5,89
4
85
,527
,558
St
ate
and
loca
l gra
nts
28,0
55,3
24
7,08
2,22
1
7,35
8,51
3
2,42
3,99
6
1,
476,
963
45
0,51
1
461,
466
47
,308
,994
N
on-g
over
nmen
tal g
rant
s1,
084,
460
1,
084,
460
Gift
s70
,317
,049
7,
163,
137
24
,655
,000
110,
303
95
1,67
1
10
6,75
4
11,0
49
108,
812
10
3,42
3,77
5
Inve
stm
ent i
ncom
e, n
et3,
078,
937
17
6,10
5
60
9,00
9
(4
,171
,000
)
96
,958
48,7
39
19,0
71
10
,988
30,5
54
29,0
56
3,74
4
191,
530
48
,137
(10,
883)
16
0,94
5
Inte
rest
& fe
es o
n ca
pita
l ass
et-r
elat
ed d
ebt
(24,
013,
039)
(2,6
96,1
82)
(3,0
21,7
64)
(11,
323,
000)
(559
,016
)
(627
,356
)
(169
,462
)
(400
,122
)
(30,
672)
(1
54,1
39)
(1
37,4
99)
(4
3,13
2,25
1)
Gai
n (L
oss)
on
disp
osal
of a
sset
s(1
88,5
29)
(34,
630)
(3,7
53)
17
7,00
0
(1,8
14)
(16,
088)
(2,6
81)
(145
,305
)
(20)
13
,169
(2
02,6
51)
O
ther
2,17
8,78
0
(1,7
44)
(4
77,3
24)
(1
9,46
5)
(366
)
119,
756
(5
,358
)
(135
,350
)
10,8
83
1,66
9,81
2
Net
non
-ope
ratin
g re
venu
es31
2,19
3,61
0
48
,411
,160
97,6
69,4
35
17
,236
,000
28,1
63,3
95
39,0
31,9
75
3,
825,
942
8,56
1,59
8
14
,638
,330
9,
969,
439
10,9
70,9
40
11,8
21,0
91
8,64
0,92
8
61
1,13
3,84
3
In
com
e (lo
ss) b
efor
e ot
her r
even
ues
and
expe
nses
27,9
04,8
26
3,08
4,05
1
(1,1
71,5
46)
12,2
67,0
00
(1
,772
,185
)
(4
,461
,455
)
11
,653
,355
(6
55,1
79)
71
2,30
5
282,
164
81
3,86
1
903,
446
95
8,61
2
050
,519
,255
Oth
er C
hang
es in
Net
Pos
ition
Cap
ital a
ppro
pria
tions
1,00
0,00
0
602,
338
42,5
00
52
5,00
0
2,16
9,83
8
C
apita
l gra
nts
and
gifts
6,03
6,28
6
172,
639
180,
072
6,29
9,00
0
167,
529
34
,567
40
4,33
3
20,4
29
54,8
28
13
,369
,683
Ad
just
men
ts to
prio
r yea
r rev
enue
s an
d ex
pens
es(8
7,20
7)
(87,
207)
O
ther
(1,0
16,0
01)
32
,609
(2
7,00
0)
17,4
43
(6
,198
)
(999
,147
)
T
otal
oth
er re
venu
es a
nd e
xpen
ses
6,02
0,28
5
807,
586
180,
072
6,27
2,00
0
97,7
65
34
,567
40
4,33
3
(6,1
98)
57
9,82
8
33,9
25,1
11
3,89
1,63
7
(991
,474
)
18,5
39,0
00
(1
,674
,420
)
(4
,426
,888
)
11
,653
,355
42,5
00
(612
,679
)1,
116,
638
275,
966
81
3,86
1
20,4
29
923,
875
1,53
8,44
0
14,4
53,1
67
64,9
72,4
22
878,
970,
776
96,2
37,2
96
17
4,01
6,78
9
73
1,20
6,00
0
37,6
02,1
44
116,
428,
680
13,8
04,1
37
11,6
13,8
31
15,9
50,7
26
14,2
46,3
72
14,4
10,6
88
12,9
85,1
79
16,8
79,5
54
2,13
4,35
2,17
2
In
crea
se (d
ecre
ase)
in n
et p
ositi
on
Net
Pos
ition
, beg
inni
ng o
f yea
r
Net
Pos
ition
, end
of y
ear
912,
895,
887
$
100,
128,
933
$
173,
025,
315
$
749,
745,
000
$
35
,927
,724
$ 11
2,00
1,79
2$
25
,457
,492
$ 11
,001
,152
$ 17
,067
,364
$
14
,522
,338
$
15
,224
,549
$
13
,909
,054
$
18
,417
,994
$ $
0
$ 2,
199,
324,
594
UN
IVER
SITY
OF
ARK
ANSA
SSt
atem
ent o
f Rev
enue
s, E
xpen
ses,
and
Cha
nges
in N
et P
ositi
on b
y C
ampu
sFo
r the
Yea
r End
ed J
une
30, 2
016
UNIVERSITY OF ARKANSAS SYSTEM: Campus Financial Statements FY16
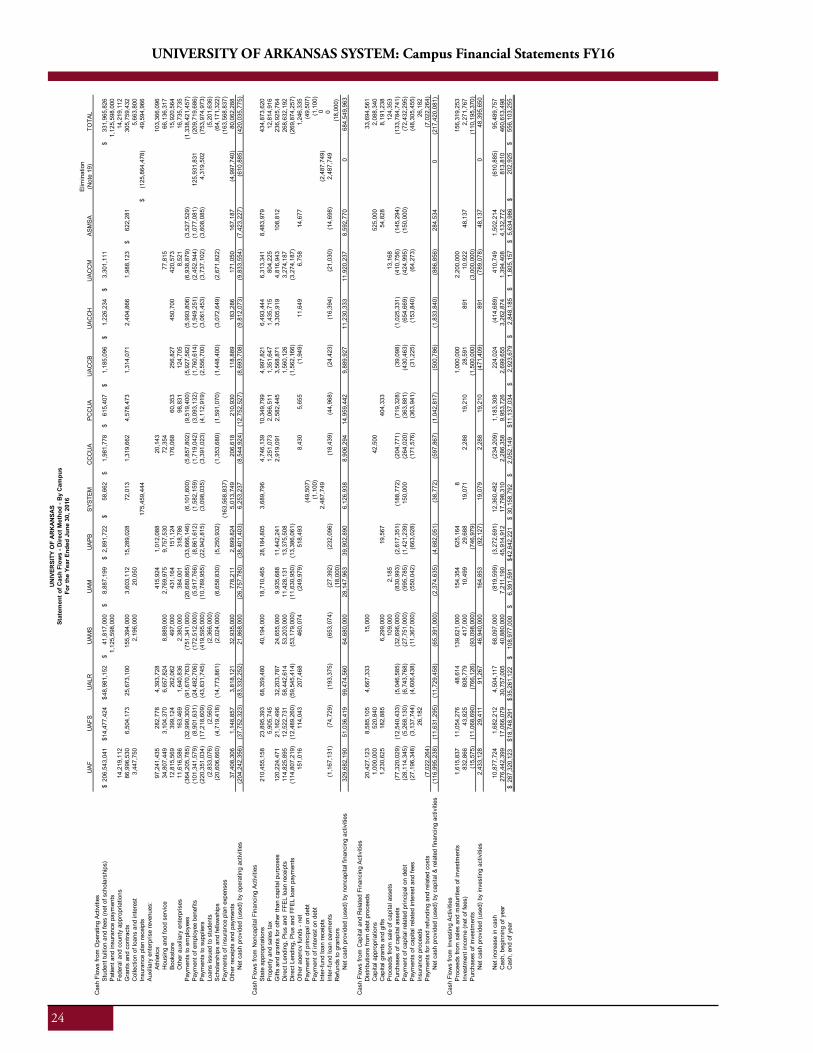
24
UNIVERSITY OF ARKANSAS SYSTEM: Campus Financial Statements FY16
24
UNIVERSITY OF ARKANSAS SYSTEM: Campus Financial Statements FY16
Sche
dule
4
Elim
inat
ion
UAF
UAF
SU
ALR
UAM
SU
AMU
APB
SYST
EMC
CC
UA
PCC
UA
UAC
CB
UAC
CH
UAC
CM
ASM
SA(N
ote
19)
TOTA
LC
ash
Flow
s fro
m O
pera
ting
Activ
ities
Stud
ent t
uitio
n an
d fe
es (n
et o
f sch
olar
ship
s)20
6,54
3,04
1$
14
,477
,424
$ 48
,981
,152
$ 41
,817
,000
$
8,
887,
199
$
2,
891,
722
$
58,6
62$
1,
981,
778
$
61
5,40
7$
1,18
5,09
6$
1,22
6,23
4$
3,30
1,11
1$
331,
965,
826
$
Pa
tient
and
insu
ranc
e pa
ymen
ts1,
125,
598,
000
1,
125,
598,
000
Fe
dera
l and
cou
nty
appr
opria
tions
14,2
19,1
12
14,2
19,1
12
Gra
nts
and
cont
ract
s86
,996
,530
6,
504,
173
25
,673
,100
15
5,39
4,00
0
3,60
3,11
2
15,2
89,0
28
72,0
13
1,31
9,66
2
4,57
8,47
3
1,31
4,07
1
2,40
4,86
6
1,98
8,12
3
622,
281
$
30
5,75
9,43
2
Col
lect
ion
of lo
ans
and
inte
rest
3,44
7,75
0
2,19
6,00
0
20,0
50
5,66
3,80
0
Insu
ranc
e pl
an re
ceip
ts17
5,45
9,44
4
(125
,864
,478
)$
49,5
94,9
66
Auxi
liary
ent
erpr
ise
reve
nues
:At
hlet
ics
97,2
41,4
35
282,
778
4,
393,
728
41
5,92
4
1,01
2,08
8
20,1
43
103,
366,
096
H
ousi
ng a
nd fo
od s
ervi
ce34
,807
,449
3,
104,
370
6,
657,
824
8,
889,
000
2,
769,
975
9,
757,
530
72
,354
77
,815
66
,136
,317
Bo
okst
ore
12,8
15,5
69
399,
124
26
2,06
2
497,
000
43
1,16
4
151,
124
17
6,06
8
60,3
53
256,
827
45
0,70
0
420,
573
15
,920
,564
O
ther
aux
iliar
y en
terp
rises
11,6
16,5
86
163,
469
1,
640,
836
2,
380,
000
38
4,00
1
318,
786
98
,831
12
4,70
5
8,52
1
16,7
35,7
35
Paym
ents
to e
mpl
oyee
s(3
64,2
05,7
85)
(3
2,99
0,30
0)
(91,
670,
763)
(7
51,3
41,0
00)
(2
0,68
0,86
5)
(33,
666,
146)
(6
,101
,600
)
(5,8
57,8
02)
(9
,519
,400
)
(5,9
27,5
82)
(5
,993
,806
)
(6,9
38,8
79)
(3
,527
,529
)
(1
,338
,421
,457
)
Paym
ent o
f em
ploy
ee b
enef
its(1
01,3
41,5
79)
(8
,901
,631
)
(24,
482,
706)
(1
72,5
12,0
00)
(5
,917
,766
)
(8,8
61,6
12)
(1,5
82,1
59)
(1
,719
,042
)
(3,0
93,1
32)
(1
,760
,614
)
(1,9
49,2
51)
(2
,452
,944
)
(1,0
77,0
81)
125,
931,
831
(2
09,7
19,6
86)
Pa
ymen
ts to
sup
plie
rs(2
20,3
51,0
34)
(1
7,21
8,60
9)
(43,
831,
745)
(4
19,5
95,0
00)
(1
0,78
9,95
5)
(22,
942,
815)
(3
,098
,035
)
(3,3
91,0
23)
(4
,112
,919
)
(2,5
56,7
00)
(3
,061
,453
)
(3,7
37,1
02)
(3
,608
,085
)
4,
319,
502
(7
53,9
74,9
73)
Lo
ans
issu
ed to
stu
dent
s(2
,833
,076
)
(2
,560
)
(2
,366
,000
)
(5,2
01,6
36)
Sc
hola
rshi
ps a
nd fe
llow
ship
s(2
0,60
6,66
0)
(4,7
19,4
18)
(1
4,77
3,86
1)
(2,0
24,0
00)
(6
,658
,830
)
(5,2
50,9
32)
(1,3
53,6
80)
(1
,591
,070
)
(1,4
48,4
00)
(3
,072
,649
)
(2,6
71,8
22)
(6
4,17
1,32
2)
Paym
ents
of i
nsur
ance
pla
n ex
pens
es(1
63,5
68,8
37)
(1
63,5
68,8
37)
O
ther
rece
ipts
and
pay
men
ts37
,408
,306
1,
148,
857
3,
818,
121
32
,935
,000
77
8,21
1
2,89
9,82
4
5,01
3,74
9
206,
618
21
0,93
0
118,
889
18
3,28
6
171,
050
16
7,18
7
(4,9
97,7
40)
80
,062
,288
N
et c
ash
prov
ided
(use
d) b
y op
erat
ing
activ
ities
(204
,242
,356
)
(37,
752,
323)
(8
3,33
2,25
2)
21,8
68,0
00
(26,
757,
780)
(3
8,40
1,40
3)
6,25
3,23
7
(8,5
44,9
24)
(1
2,75
2,52
7)
(8,6
93,7
08)
(9
,812
,073
)
(9,8
33,5
54)
(7
,423
,227
)
(610
,885
)
(420
,035
,775
)
Cas
h Fl
ows
from
Non
capi
tal F
inan
cing
Act
iviti
esSt
ate
appr
opria
tions
210,
455,
158
23
,895
,393
68
,359
,480
40
,194
,000
18
,710
,465
28
,184
,805
3,
689,
796
4,
746,
139
10
,349
,799
4,
997,
821
6,
493,
444
6,
313,
341
8,
483,
979
43
4,87
3,62
0
Prop
erty
and
sal
es ta
x5,
905,
745
1,
251,
073
2,
066,
511
1,
351,
647
1,
435,
715
80
4,22
5
12,8
14,9
16
Gift
s an
d gr
ants
for o
ther
than
cap
ital p
urpo
ses
120,
224,
471
21,1
62,4
96
32,2
03,7
87
24,6
55,0
00
9,93
5,68
8
11,4
42,2
41
2,91
9,09
1
2,58
2,44
5
3,56
8,87
1
3,30
5,91
9
4,81
6,94
3
108,
812
23
6,92
5,76
4
Dire
ct L
endi
ng, P
lus
and
FFE
L lo
an re
ceip
ts11
4,82
5,89
5
12
,522
,731
58
,442
,614
53
,203
,000
11
,428
,131
13
,375
,508
1,
560,
126
3,
274,
187
26
8,63
2,19
2
Dire
ct L
endi
ng, P
lus
and
FFEL
loan
pay
men
ts(1
14,8
07,2
19)
(1
2,48
9,26
0)
(59,
545,
414)
(5
3,17
9,00
0)
(11,
630,
950)
(1
3,38
6,06
1)
(1,5
62,1
66)
(3
,274
,187
)
(269
,874
,257
)
Oth
er a
genc
y fu
nds
- net
151,
016
11
4,04
3
207,
468
46
0,07
4
(249
,979
)
518,
493
8,
430
5,
655
(1
,949
)
11,6
49
6,75
8
14,6
77
1,24
6,33
5
Paym
ent o
f prin
cipa
l on
debt
(49,
507)
(4
9,50
7)
Paym
ent o
f int
eres
t on
debt
(1,1
00)
(1
,100
)
Inte
r-fu
nd lo
an re
ceip
ts2,
487,
749
(2
,487
,749
)
0In
ter-
fund
loan
pay
men
ts(1
,167
,131
)
(74,
729)
(1
93,3
75)
(6
53,0
74)
(2
7,39
2)
(232
,096
)
(18,
439)
(4
4,96
8)
(24,
423)
(1
6,39
4)
(21,
030)
(1
4,69
8)
2,48
7,74
9
0R
efun
ds to
gra
ntor
s(1
8,00
0)
( 18
,000
)N
et c
ash
prov
ided
(use
d) b
y no
ncap
ital f
inan
cing
act
iviti
es32
9,68
2,19
0
51,0
36,4
19
99,4
74,5
60
64,6
80,0
00
28,1
47,9
63
39,9
02,8
90
6,12
6,93
8
8,90
6,29
4
14,9
59,4
42
9,88
9,92
7
11,2
30,3
33
11,9
20,2
37
8,59
2,77
0
068
4,54
9,96
3
Cas
h Fl
ows
from
Cap
ital a
nd R
elat
ed F
inan
cing
Act
iviti
esD
istri
butio
ns fr
om d
ebt p
roce
eds
20,4
27,1
23
8,58
5,10
5
4,66
7,33
3
15,0
00
33,6
94,5
61
Cap
ital a
ppro
pria
tions
1,00
0,00
0
520,
840
42
,500
52
5,00
0
2,08
8,34
0
Cap
ital g
rant
s an
d gi
fts1,
230,
625
18
2,88
5
6,29
9,00
0
19,5
67
404,
333
54
,828
8,
191,
238
Pr
ocee
ds fr
om s
ale
of c
apita
l ass
ets
109,
000
2,
185
13
,168
12
4,35
3
Purc
hase
s of
cap
ital a
sset
s(7
7,32
0,02
9)
(12,
540,
433)
(5
,046
,585
)
(3
2,69
6,00
0)
(830
,993
)
(2,6
17,3
51)
(188
,772
)
(204
,771
)
(719
,328
)
(39,
098)
(1
,025
,331
)
(410
,756
)
(145
,294
)
(133
,784
,741
)
Paym
ent o
f cap
ital r
elat
ed p
rinci
pal o
n de
bt
(28,
114,
345)
(5
,268
,130
)
(6,7
43,7
68)
(27,
751,
000)
(9
95,7
85)
(1
,421
,239
)
15
0,00
0
(264
,020
)
(363
,881
)
(430
,463
)
(654
,669
)
(424
,995
)
(150
,000
)
(72,
432,
295)
Pa
ymen
ts o
f cap
ital r
elat
ed in
tere
st a
nd fe
es(2
7,19
6,34
8)
(3,1
37,7
44)
(4
,606
,438
)
(1
1,36
7,00
0)
(550
,042
)
(663
,028
)
(171
,576
)
(363
,941
)
(31,
225)
(1
53,8
40)
(6
4,27
3)
(48,
305,
455)
In
sura
nce
proc
eeds
26,1
82
26,1
82
Paym
ents
for b
ond
refu
ndin
g an
d re
late
d co
sts
(7,0
22,2
64)
(7
,022
,264
)
Net
cas
h pr
ovid
ed (u
sed)
by
capi
tal &
rela
ted
finan
cing
act
iviti
es(1
16,9
95,2
38)
(1
1,63
1,29
5)
(11,
729,
458)
(6
5,39
1,00
0)
(2,3
74,6
35)
(4
,682
,051
)
(3
8,77
2)
(597
,867
)
(1,0
42,8
17)
(5
00,7
86)
(1
,833
,840
)
(886
,856
)
284,
534
0
(217
,420
,081
)
Cas
h Fl
ows
from
Inve
stin
g Ac
tiviti
esPr
ocee
ds fr
om s
ales
and
mat
uriti
es o
f inv
estm
ents
1,61
5,83
7
11,0
54,2
76
48,6
14
139,
621,
000
15
4,35
4
625,
164
8
1,00
0,00
0
2,20
0,00
0
156,
319,
253
In
vest
men
t inc
ome
(net
of f
ees)
832,
866
43
,825
80
8,77
9
417,
000
10
,499
29
,688
19
,071
2,
288
19
,210
28
,591
89
1
10,9
22
48,1
37
2,27
1,76
7
Purc
hase
s of
inve
stm
ents
(15,
575)
(1
1,06
8,69
0)
(766
,126
)
(93,
098,
000)
(7
46,9
79)
(1
,500
,000
)
(3,0
00,0
00)
(1
10,1
95,3
70)
N
et c
ash
prov
ided
(use
d) b
y in
vest
ing
activ
ities
2,43
3,12
8
29,4
11
91,2
67
46,9
40,0
00
164,
853
(9
2,12
7)
19,0
79
2,28
8
19,2
10
(471
,409
)
891
(7
89,0
78)
48
,137
0
48,3
95,6
50
Net
incr
ease
in c
ash
10,8
77,7
24
1,
682,
212
4,50
4,11
7
68
,097
,000
(8
19,5
99)
(3
,272
,691
)
12
,360
,482
(234
,209
)
1,18
3,30
8
224,
024
(4
14,6
89)
41
0,74
9
1,50
2,21
4
(610
,885
)
95,4
89,7
57
Cas
h, b
egin
ning
of y
ear
276,
442,
399
17
,066
,079
30
,757
,005
40
,880
,000
7,
211,
190
45
,914
,912
17
,798
,310
2,
286,
358
9,
953,
726
2,
699,
655
3,
262,
874
1,
394,
408
4,
132,
772
81
3,81
0
460,
613,
498
C
ash,
end
of y
ear
202,
925
$ 2
87,3
20,1
23
$ 18,
748,
291
$ 35,
261,
122
$
108,
977,
000
$
6,3
91,5
91
$ 42,
642,
221
$ 30
,158
,792
$
2
,052
,149
$1
1,13
7,03
4
$
2,
923,
679
$
2,8
48,1
85
$
1,8
05,1
57
$ 5
,634
,986
$
55
6,10
3,25
5$
UN
IVER
SITY
OF
AR
KA
NSA
SSt
atem
ent o
f Cas
h Fl
ows
- Dire
ct M
etho
d - B
y C
ampu
sFo
r the
Yea
r End
ed J
une
30, 2
016
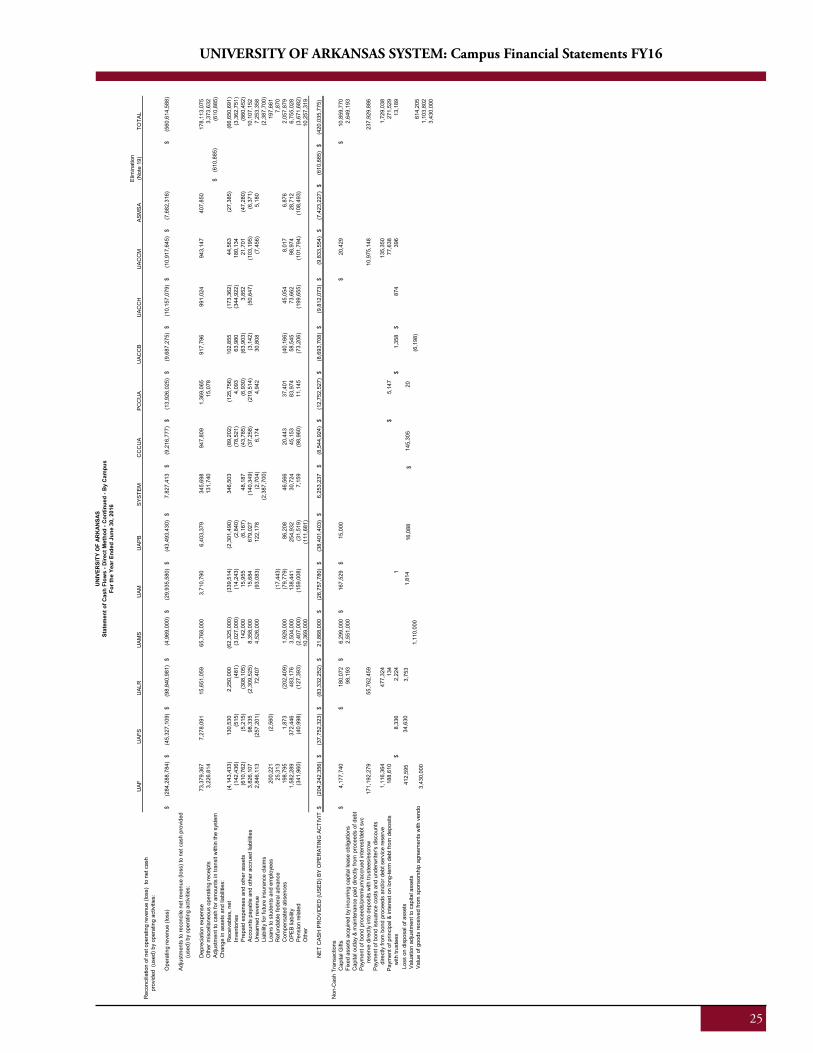
25
UNIVERSITY OF ARKANSAS SYSTEM: Campus Financial Statements FY16
25
UN
IVER
SITY
OF
ARK
ANSA
S SY
STEM
:Cam
pus
Fina
ncia
l Sta
tem
ents
FY1
6
27
Elim
inat
ion
UAF
UAF
SU
ALR
UAM
SU
AMU
APB
SYST
EMC
CC
UA
PCC
UA
UAC
CB
UAC
CH
UAC
CM
ASM
SA(N
ote
19)
TOTA
LR
econ
cilia
tion
of n
et o
pera
ting
reve
nue
(loss
) to
net
cas
h
pro
vide
d (u
sed)
by
oper
atin
g ac
tiviti
es:
Ope
ratin
g re
venu
e (lo
ss)
(284
,288
,784
)$
(45,
327,
109)
$
(9
8,84
0,98
1)$
(4,9
69,0
00)
$
(29,
935,
580)
$
(4
3,49
3,43
0)$
7,82
7,41
3$
(9
,216
,777
)$
(13,
926,
025)
$
(9
,687
,275
)$
(10,
157,
079)
$
(1
0,91
7,64
5)$
(7,6
82,3
16)
$
(5
60,6
14,5
88)
$
Adju
stm
ents
to re
conc
ile n
et re
venu
e (lo
ss) t
o ne
t cas
h pr
ovid
ed(u
sed)
by
oper
atin
g ac
tiviti
es:
Dep
reci
atio
n ex
pens
e73
,379
,367
7,27
8,09
1
15
,651
,059
65,7
68,0
00
3,
710,
790
6,40
3,37
9
34
5,69
8
947,
809
1,
369,
065
917,
796
99
1,02
4
943,
147
40
7,85
0
178,
113,
075
Oth
er m
isce
llane
ous
oper
atin
g re
ceip
ts3,
226,
814
13
1,74
0
15,0
78
3,37
3,63
2
Adju
stm
ent t
o ca
sh fo
r am
ount
s in
tran
sit w
ithin
the
syst
em
$
(610
,885
)(6
10,8
85)
C
hang
e in
ass
ets
and
liabi
litie
s:R
ecei
vabl
es, n
et(4
,143
,433
)
130,
530
2,
250,
000
(62,
325,
000)
(3
39,5
14)
(2
,301
,490
)
34
6,50
3
(89,
202)
(1
25,7
56)
10
2,85
5
(173
,362
)
44,5
63
(27,
385)
(6
6,65
0,69
1)
In
vent
orie
s(1
42,4
36)
(5
15)
(4
81)
(3
,027
,000
)
(1
4,24
3)
(2,8
40)
(7
8,52
1)
4,09
3
63,9
80
(344
,922
)
180,
134
(3
,362
,751
)
Prep
aid
expe
nses
and
oth
er a
sset
s(6
10,7
62)
(5
,215
)
(308
,105
)
142,
000
15
,955
(6
,167
)
48,1
87
(43,
785)
(6
,930
)
(63,
903)
3,
852
21
,701
(4
7,28
0)
(860
,452
)
Acco
unts
pay
able
and
oth
er a
ccru
ed li
abilit
ies
3,82
6,10
7
98,3
35
(2,3
09,5
25)
8,35
8,00
0
15
,684
67
9,02
7
(140
,349
)
(37,
258)
(2
19,5
14)
(3
,142
)
(50,
647)
(1
03,1
95)
(6
,371
)
10,1
07,1
52
U
near
ned
reve
nue
2,84
6,11
3
(257
,201
)
72,4
07
4,52
6,00
0
(9
3,08
3)
122,
178
(2
,704
)
6,17
4
4,94
2
30,8
08
(7,4
56)
5,
180
7,
253,
358
Li
abilit
y fo
r fut
ure
insu
ranc
e cl
aim
s(2
,387
,700
)
(2
,387
,700
)
Loan
s to
stu
dent
s an
d em
ploy
ees
200,
221
(2
,560
)
197,
661
R
efun
dabl
e fe
dera
l adv
ance
25,3
13
(17,
443)
7,
870
C
ompe
nsat
ed a
bsen
ces
198,
795
1,
873
(2
02,4
09)
1,
929,
000
(79,
779)
86
,208
46
,566
20
,443
37
,401
(4
0,16
6)
45,0
54
8,01
7
6,87
6
2,05
7,87
9
OPE
B lia
bilit
y1,
582,
289
37
2,44
6
483,
176
3,
504,
000
138,
441
25
4,93
2
30,7
24
45,1
53
83,9
74
58,5
45
73,6
62
98,9
74
28,7
12
6,75
5,02
8
Pens
ion
rela
ted
(341
,960
)
(40,
998)
(1
27,3
93)
(2
,407
,000
)
(1
59,0
08)
(3
1,51
9)
7,15
9
(98,
960)
11
,145
(7
3,20
6)
(199
,655
)
(101
,794
)
(108
,493
)
(3
,671
,682
)
Oth
er10
,369
,000
(111
,681
)
10,2
57,3
19
NET
CAS
H P
RO
VID
ED (U
SED
) BY
OPE
RAT
ING
AC
TIVI
TIES
(204
,242
,356
)$
(37,
752,
323)
$
(8
3,33
2,25
2)$
21,8
68,0
00$
(2
6,75
7,78
0)$
(38,
401,
403)
$
6,
253,
237
$
(8,5
44,9
24)
$
(1
2,75
2,52
7)$
(8,6
93,7
08)
$
(9
,812
,073
)$
(9
,833
,554
)$
(7
,423
,227
)$
$
(610
,885
) $
(
420,
035,
775)
Non
-Cas
h Tr
ansa
ctio
nsC
apita
l Gift
s4,
177,
740
$
180,
072
$
6,29
9,00
0$
16
7,52
9$
15
,000
$
20
,429
$
10
,859
,770
$
Fixe
d as
sets
acq
uire
d by
incu
rrin
g ca
pita
l lea
se o
blig
atio
ns98
,193
2,
551,
000
2,64
9,19
3
Cap
ital o
utla
y &
mai
nten
ance
pai
d di
rect
ly fr
om p
roce
eds
of d
ebt
Paym
ent o
f bon
d pr
ocee
ds/p
rem
ium
/acc
rued
inte
rest
/deb
t svc
r
eser
ve d
irect
ly in
to d
epos
its w
ith tr
uste
es/e
scro
w17
1,19
2,27
9
55
,762
,459
10,9
75,1
48
23
7,92
9,88
6
Pa
ymen
t of b
ond
issu
ance
cos
ts a
nd u
nder
writ
er's
dis
coun
ts
dire
ctly
from
bon
d pr
ocee
ds a
nd/o
r deb
t ser
vice
rese
rve
1,11
6,36
4
477,
324
13
5,35
0
1,72
9,03
8
th tr
uste
es13
4
5,14
7$
77
,638
27
1,52
9
8,33
6$
2,
224
1
1,35
8$
874
$
396
13
,189
Pa
ymen
t of p
rinci
pal &
inte
rest
on
long
-term
deb
t fro
m d
epos
its
1
88,6
10
w
ith tr
uste
es
412
,595
34,6
30
3,75
3
1,8
1416
,088
14
5,30
5$
20
614,
205
1,
110,
000
(6,1
98)
1,10
3,80
2
rs
3,43
0,00
0
Loss
on
disp
osal
of a
sset
sVa
luat
ion
adju
stm
ent t
o ca
pita
l ass
ets
Valu
e of
goo
ds re
ceiv
ed fr
om s
pons
orsh
ip a
gree
men
ts w
ith v
endo
3,43
0,00
0
UN
IVER
SITY
OF
ARK
ANSA
SSt
atem
ent o
f Cas
h Fl
ows
- Dire
ct M
etho
d - C
ontin
ued
- By
Cam
pus
For t
he Y
ear E
nded
Jun
e 30
, 201
6
UNIVERSITY OF ARKANSAS SYSTEM: Campus Financial Statements FY16
26
UNIVERSITY OF ARKANSAS SYSTEM: Footnotes to Consolidated Financial Statements FY16
Note 1: Summary of Significant Accounting Policies
The financial statements for the University of Arkansas (“the University”) have been prepared in accordance with generally accepted accounting principles as prescribed by the Governmental Accounting Standards Board (GASB). The accompanying notes to the financial statements are an integral part of the financial statements.
The following acronyms are used for the various campuses and divisions of the University as reported in the financial statements: UAF (University of Arkansas Fayetteville, including Agricultural Experiment Station, Cooperative Extension Service, Arkansas Archeological Survey, Criminal Justice Institute, and Clinton School of Public Service), UAFS (University of Arkansas at Fort Smith), UALR (University of Arkansas at Little Rock), UAMS (University of Arkansas for Medical Sciences), UAM (University of Arkansas at Monticello), UAPB (University of Arkansas at Pine Bluff), CCCUA (Cossatot Community College of the University of Arkansas), PCCUA (Phillips Community College of the University of Arkansas), UACCB (University of Arkansas Community College at Batesville), UACCH (University of Arkansas Community College at Hope), UACCM (University of Arkansas Community College at Morrilton), ASMSA (Arkansas School for Mathematics, Sciences and the Arts), and SYSTEM (University of Arkansas System Administration, including University of Arkansas System eVersity).
Basis of Presentation and Measurement FocusFor financial reporting purposes, the University is considered a special-purpose government engaged in business-type activities. Accordingly, the University’s financial statements have been presented using the economic resources measurement focus and the accrual basis of accounting. Revenues are recognized in the accounting period in which they are earned and become measurable. Expenses are recognized in the period in which they are incurred, if measurable, including depreciation.
Use of EstimatesThe preparation of financial statements in conformity with generally accepted accounting principles requires management to make estimates and assumptions
that affect the reported amounts of assets, liabilities, deferred inflows, deferred outflows, revenues and expenses at the date of the financial statements. Significant estimates include separation of accrued compensated absences between current and non-current and depreciation expense. Actual results could differ from those estimates.
Cash and Cash EquivalentsThe classification of “cash and cash equivalents” on the Statement of Net Position includes all readily available sources of cash such as petty cash, demand deposits, cash on deposit with the State Treasurer, and highly liquid short-term investments.
InvestmentsInvestments are stated at fair value. Changes in unrealized gain (loss) on the carrying value are reported as a component of investment income on the statement of revenues, expenses and changes in net position.
InventoriesInventories are valued at cost with cost generally being determined on a first-in, first-out basis.
Accounts ReceivableReceivables that represent charges due the University from various student fees, room and board, student fines, patient care services, and other charges are stated at estimated net realizable values; that is, the gross amount of the receivable is reduced by allowances for estimated uncollectible accounts and contractual allowances (related to patient care revenue). Receivables can also include unreimbursed expenses relating to research contracts with federal, state, and private agencies.
Patient Care RevenuePatient care revenue is reported at the estimated net realizable amounts from patients, third-party payors, and others for services rendered. Retroactive adjustments arising under reimbursement agreements with third-party payors are accrued on an estimated basis in the period in which the related services are rendered and adjusted as final settlements are determined. Charity CareUAMS provides care to patients who meet certain criteria under its charity care policy without charge or at amounts less than its established rates. Because UAMS does not pursue collection of amounts
27
UNIVERSITY OF ARKANSAS SYSTEM: Footnotes to Consolidated Financial Statements FY16
determined to qualify as charity care, these amounts are accounted for as a reduction of patient services revenue at the time the services are rendered.
EncumbrancesEncumbrances representing commitments and outstanding purchase orders for goods and services not received as of the last day of the fiscal year are not reported as expenses or included in liabilities in the accompanying financial statements.
Capital AssetsCapital assets consisting of land, buildings, improvements, furniture, equipment, intangible assets, and construction in progress, are stated at cost or acquisition value at date of gift. Library holdings are generally valued using average prices for library acquisitions.
Depreciation is computed using the straight-line method over the estimated useful lives of the assets -- generally 15-30 years for buildings, 15-20 years for infrastructure and land improvements, 3-10 years for equipment, 10 years for library holdings, and the applicable term for capital leases. Equipment includes all furniture, fixtures and equipment with a unit cost of $5,000 or more and an estimated useful life of one year or more.
Estimated useful lives for purposes of amortization and capitalization thresholds for intangible assets are as follows: purchased software (5-10 years; $500,000); internally developed software (10 years; $1,000,000); easements, land use rights, trademarks, and copyrights (15 years; $250,000); and patents (20 years; $250,000).
Livestock is maintained primarily for research purposes with any other benefits derived from the operations considered as incidental to the primary mission of the University. The inventory value placed on the animals is determined by utilizing current market prices and breeding and research intangibles.
UAMS bases its estimated useful lives on guidelines established by the American Hospital Association (AHA) which may differ slightly from those shown above for the other campuses. Capitalization of InterestThe University capitalizes interest involving qualifying assets. The amount of interest cost to be capitalized is interest cost on borrowings netted against any interest
earned on temporary investments of the proceeds of those borrowings from the date of borrowing until the specified qualifying assets acquired with those borrowings are ready for their intended use. The total amount of interest cost incurred (gross of amortizations of premiums and discounts) and the net amount thereof that has been capitalized was $49,155,698 and $2,860,539, respectively, for the fiscal year ended June 30, 2016. The total amount of interest cost incurred (gross of amortizations of premiums and discounts) and the net amount thereof that has been capitalized was $52,015,194 and $6,274,494, respectively, for the fiscal year ended June 30, 2015.
Deferred Outflows of ResourcesDeferred outflows of resources represent a decrease of net position that applies to future periods. Therefore, these items will not be recognized as an expense or expenditure until a future period.
Deferred Inflows of ResourcesDeferred inflows of resources represent an increase of net position that applies to future periods. Therefore, these items will not be recognized as revenue until a future period.
PensionsFor purposes of measuring the net pension liability, deferred outflows of resources and deferred inflows of resources related to pensions, and pension expense, information about the fiduciary net position of the Arkansas Public Employees Retirement System and the Arkansas Teacher Retirement System (the respective Systems) and additions to/deductions from the respective System’s fiduciary net position have been determined on the same basis as they are reported by the respective Systems. For this purpose, benefit payments (including refunds of employee contributions) are recognized when due and payable in accordance with the benefit terms. Investments are reported at fair value.
Net PositionThe University’s net position is classified as follows:
Net investment in capital assets -- Capital assets, net of accumulated depreciation and outstanding principal balances of debt obligations related to those capital assets. However, unexpended debt proceeds at year-end are reported as net position restricted for capital projects.
28
UNIVERSITY OF ARKANSAS SYSTEM: Footnotes to Consolidated Financial Statements FY16
Restricted/non-expendable -- endowment and similar type funds in which donors or other outside sources have stipulated, as a condition of the gift instrument, that the principal is to be maintained in perpetuity, and invested for the purpose of producing present and future income, which either may be expended or added to principal.
Restricted/expendable -- resources whose use by the University is subject to externally-imposed stipulations that can be fulfilled by actions of the University pursuant to those stipulations or that expire by the passage of time. There is no formal policy requiring restricted resources to be used either before or after unrestricted resources are used for the same purpose. Responsible officials determine at the time funds are expended to use any unrestricted resources that may be available.
Unrestricted -- resources not subject to externally imposed stipulations. These resources may be designated for specific purposes by management or the Board of Trustees or may be otherwise limited by contractual agreements with outside parties.
Classification of RevenuesThe University has classified its revenues as either operating or non-operating according to the following criteria:
Operating Revenue -- includes activities that have the characteristics of exchange transactions, such as student tuition and fees (net of scholarship discounts and allowances), patient services (net of contractual agreements), most federal, state, and local grants and contracts, revenues associated with auxiliary enterprises (net of scholarship discounts and allowances), interest on institutional student loans, and the University’s self-funded insurance plans.
Non-Operating Revenue -- includes activities that have the characteristics of non-exchange transactions, such as gifts and contributions, and other revenue sources that are defined as non-operating revenues by the GASB Statement No. 34, such as state appropriations and investment income.
State AppropriationsState appropriations are reported in the Statement of Revenues, Expenses, and Changes in Net Position
as non-operating revenue, net of the Medicaid match payments required under various contracts between UAMS and the Arkansas Department of Human Services. The match payments were $99,151,000 and $85,075,000 for the fiscal years 2016 and 2015, respectively.
Scholarship Discounts and AllowancesStudent tuition and fee revenues, and certain other revenues from students, are reported net of scholarship discounts and allowances in the Statement of Revenues, Expenses, and Changes in Net Position. Scholarship discounts and allowances are the differences between the stated charge for goods and services provided by the University, and the amount that is paid by students and/or third parties making payments on the students’ behalf. Certain governmental grants, such as Pell grants, and other federal, state, or nongovernmental programs, are recorded as either operating or non-operating revenues in the University’s financial statements. To the extent that revenues from such programs are used to satisfy tuition and fees and other student charges, the University has recorded a scholarship discount and allowance.
Component UnitsIn May 2002, the GASB issued Statement No. 39, Determining Whether Certain Organizations are Component Units, which amends Statement No. 14 to provide additional guidance to determine whether certain organizations for which the primary government is not financially accountable should be reported as component units based on the nature and significance of their relationship with a primary government. Under the standard, which became effective with the fiscal year ending June 30, 2004, the financial activities of qualifying foundations are to be included in the financial statements of the primary government, through discrete presentations. In fiscal year 2016, there were two qualifying foundations for the University of Arkansas: The University of Arkansas Foundation, Inc. and the University of Arkansas Fayetteville Campus Foundation, Inc. Although the University does not control the timing or amount of receipts from either of these foundations, the majority of resources or income thereon, which the foundations hold and invest, is restricted to the activities of the University by the donors. Because these restricted resources held by the foundations can be used only by, or for the benefit of, the University, and their individual net assets are considered as having met the financial accountability criteria of Statement No. 39 by management, these
29
UNIVERSITY OF ARKANSAS SYSTEM: Footnotes to Consolidated Financial Statements FY16
two foundations are considered component units of the University and are discretely presented in the University’s financial statements.
The University of Arkansas Foundation, Inc. is a separate nonprofit organization, which operates for charitable educational purposes, including the administration and investment of gifts and other amounts received directly or indirectly for the benefit of the University of Arkansas. The Board of Directors has twenty-two members, four of which are current or previous members of the University of Arkansas Board of Trustees. During the years ended June 30, 2016, and June 30, 2015, the Foundation distributed $66,373,172 and $54,533,713, respectively, to or on behalf of the University. Complete financial statements for the Foundation can be obtained from the administrative office at 535 Research Center Boulevard, Suite 120, Fayetteville, AR 72701.
The University of Arkansas Fayetteville Campus Foundation, Inc. is a nonprofit charitable organization which was established by the Walton Family Charitable Support Foundation, Inc., for the exclusive benefit of the University of Arkansas, Fayetteville campus. The Foundation was established on March 11, 2003, and exists primarily to support the Honors College, the Graduate School, and the University’s library. The Board of Trustees of the Foundation is made up of seven members, including three members who are also employees of the University. During the years ended June 30, 2016, and June 30, 2015, the Foundation distributed $16,434,565 and $14,807,911, respectively, to or on behalf of the University. Complete financial statements for the Foundation can be obtained from the administrative office at 535 Research Center Boulevard, Suite 120, Fayetteville, AR 72701. New Accounting PronouncementsThe GASB issued four statements which became effective for the fiscal year ended June 30, 2016. Statement No. 72, Fair Value Measurement and Application, addresses accounting and financial reporting issues related to fair value measurements and provides guidance for disclosures related to all fair value measurements. Management has added additional disclosures, discussed at Note 6, as a result of implementing Statement 72. Statement No. 73, Accounting and Financial Reporting for Pensions and Related Assets That Are Not within the Scope of GASB Statement 68, and Amendments to Certain Provisions of GASB Statements 67 and 68, addresses accounting
and financial reporting for defined benefit pension plans that are not within the scope of Statement No. 68. No defined benefit pension plans were identified that were impacted by this statement. Statement No. 76, The Hierarchy of Generally Accepted Accounting Principles for State and Local Governments, identifies a hierarchy of generally accepted accounting principles (GAAP) within the context of governmental financial reporting. Management has determined this statement has no effect on current reporting and disclosures. Statement No. 79, Certain External Investment Pools and Pool Participants, which establishes criteria for an external investment pool to qualify for making an election to measure all of its investments at amortized cost for financial reporting purposes. Management elected to report investments in the external investment pool at fair value, thus this statement has no effect on financial reporting and disclosures. The GASB issued the following statements which become effective for the fiscal year ending June 30, 2017: Statement No. 74, Financial Reporting for Postemployment Benefit Plans Other Than Pension Plans, Statement No. 77, Tax Abatement Disclosures, Statement No, 78, Pensions Provided through Certain Multiple-Employer Defined Benefit Pension Plans, Statement No. 80, Blending Requirements for Certain Component Units – an amendment of GASB Statement No. 14, and Statement No. 82, Pension Issues – an amendment of GASB Statements No, 67, No.68, and No. 73. The GASB also issued the following statements which become effective for the fiscal year ending June 30, 2018: Statement No. 75, Accounting and Financial Reporting for Postemployment Benefits Other Than Pensions and Statement No, 81, Irrevocable Split-Interest Agreements. Management has not yet determined the effects of these statements on the University’s financial statements.
Note 2: Reporting Entity
The University of Arkansas System (“the University”), which prior to 1969 consisted of the Fayetteville and Medical Sciences campuses, was expanded in 1969 to include the Little Rock campus (formerly Little Rock University), in 1971 to include the Monticello campus (formerly Arkansas A&M College), in 1972 to include the Pine Bluff campus (formerly Arkansas AM&N College), in 1996 to include the Phillips campus (formerly Phillips County Community College), and the Hope campus (formerly Red River Technical College), and in 1998 to include the Batesville campus (formerly Gateway
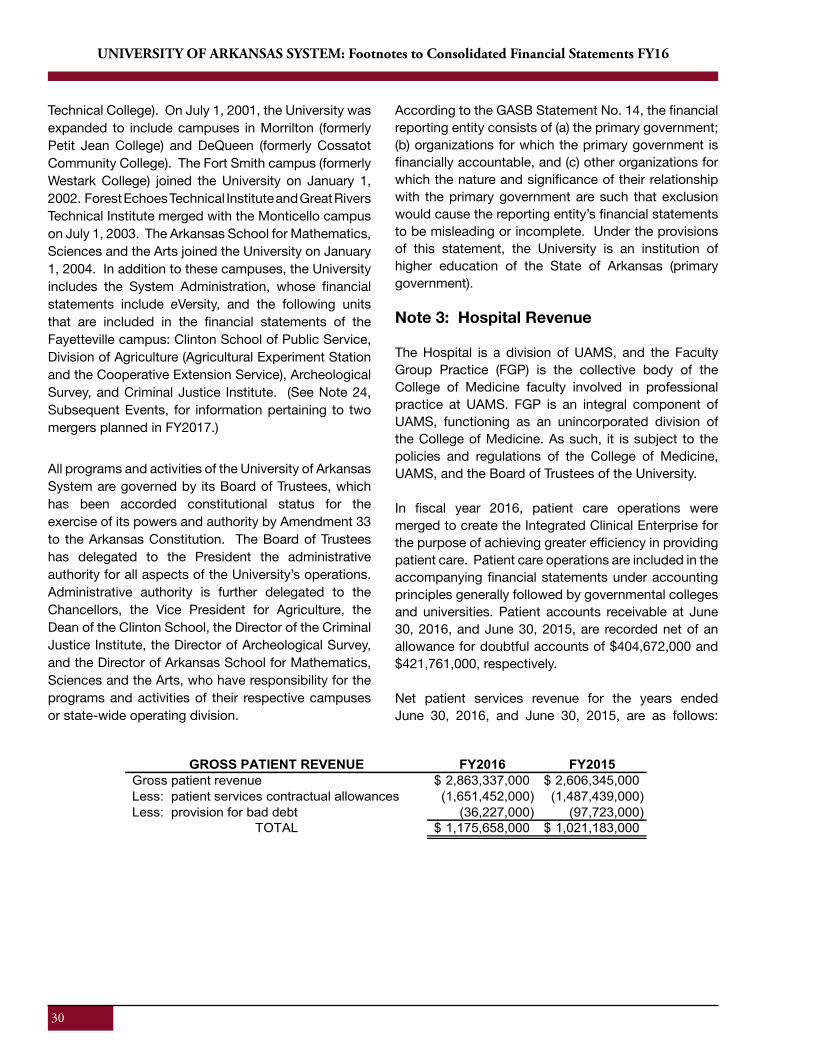
30
UNIVERSITY OF ARKANSAS SYSTEM: Footnotes to Consolidated Financial Statements FY16
Technical College). On July 1, 2001, the University was expanded to include campuses in Morrilton (formerly Petit Jean College) and DeQueen (formerly Cossatot Community College). The Fort Smith campus (formerly Westark College) joined the University on January 1, 2002. Forest Echoes Technical Institute and Great Rivers Technical Institute merged with the Monticello campus on July 1, 2003. The Arkansas School for Mathematics, Sciences and the Arts joined the University on January 1, 2004. In addition to these campuses, the University includes the System Administration, whose financial statements include eVersity, and the following units that are included in the financial statements of the Fayetteville campus: Clinton School of Public Service, Division of Agriculture (Agricultural Experiment Station and the Cooperative Extension Service), Archeological Survey, and Criminal Justice Institute. (See Note 24, Subsequent Events, for information pertaining to two mergers planned in FY2017.) All programs and activities of the University of Arkansas System are governed by its Board of Trustees, which has been accorded constitutional status for the exercise of its powers and authority by Amendment 33 to the Arkansas Constitution. The Board of Trustees has delegated to the President the administrative authority for all aspects of the University’s operations. Administrative authority is further delegated to the Chancellors, the Vice President for Agriculture, the Dean of the Clinton School, the Director of the Criminal Justice Institute, the Director of Archeological Survey, and the Director of Arkansas School for Mathematics, Sciences and the Arts, who have responsibility for the programs and activities of their respective campuses or state-wide operating division.
According to the GASB Statement No. 14, the financial reporting entity consists of (a) the primary government; (b) organizations for which the primary government is financially accountable, and (c) other organizations for which the nature and significance of their relationship with the primary government are such that exclusion would cause the reporting entity’s financial statements to be misleading or incomplete. Under the provisions of this statement, the University is an institution of higher education of the State of Arkansas (primary government). Note 3: Hospital Revenue
The Hospital is a division of UAMS, and the Faculty Group Practice (FGP) is the collective body of the College of Medicine faculty involved in professional practice at UAMS. FGP is an integral component of UAMS, functioning as an unincorporated division of the College of Medicine. As such, it is subject to the policies and regulations of the College of Medicine, UAMS, and the Board of Trustees of the University.
In fiscal year 2016, patient care operations were merged to create the Integrated Clinical Enterprise for the purpose of achieving greater efficiency in providing patient care. Patient care operations are included in the accompanying financial statements under accounting principles generally followed by governmental colleges and universities. Patient accounts receivable at June 30, 2016, and June 30, 2015, are recorded net of an allowance for doubtful accounts of $404,672,000 and $421,761,000, respectively.
Net patient services revenue for the years ended June 30, 2016, and June 30, 2015, are as follows:
UNIVERSITY OF ARKANSAS SYSTEM: Footnotes to Consolidated Financial Statements FY16
33
Net patient services revenue for the years ended June 30, 2016, and June 30, 2015, are as follows:
GROSS PATIENT REVENUE FY2016 FY2015Gross patient revenue 2,863,337,000$ 2,606,345,000$ Less: patient services contractual allowances (1,651,452,000) (1,487,439,000) Less: provision for bad debt (36,227,000) (97,723,000)
TOTAL 1,175,658,000$ 1,021,183,000$
UAMS continually monitors the allowances established for its patient accounts receivable. During FY16, UAMS determined that the historical collection trends, on which its accounts receivable allowances were based, were not indicative of more recent actual collections and, therefore, decreased these allowances by $36,500,000. This change in estimate is reflected in FY16 operating results and is the result of enhancements to UAMS’ revenue recognition process in response to improved information from its integrated clinical information system and complexities in the healthcare industry. UAMS provided approximately $77,654,000 and $72,726,000 in charity care, based on established rates, during the years ended June 30, 2016, and June 30, 2015, respectively. Because UAMS does not pursue collection of amounts determined to qualify as charity care, they are not included in gross patient revenue above. Net patient services revenue for the years ended June 30, 2016, and June 30, 2015, includes approximately $73,891,000 and $77,666,000, respectively, from the Medicaid program representing payments relating to Upper Payment Limit and Disproportionate Share reimbursements. These payments are available to state-operated teaching hospitals under Medicaid regulations. Net patient services revenue for the years ended June 30, 2016, and June 30, 2015, includes approximately $35,520,000 and $39,052,000, respectively, of net revenue from the Supplemental Medicaid program. The Hospital, FGP, and Area Health Education Centers (AHECs) have agreements with governmental and other third-party payors that provide for reimbursement at amounts different from their established rates. Contractual adjustments under third-party reimbursement programs represent the difference between the
billings at established rates for services and amounts reimbursed by third-party payors. A summary of the basis of reimbursement with significant third-party payors follows: Hospital:
Medicare – Inpatient acute care services rendered to program beneficiaries are paid at prospectively determined rates per discharge. These rates vary according to a patient classification system that is based on clinical, diagnostic, and other factors. Some transplantation services are paid based upon a cost reimbursement methodology. Outpatient services are paid based on a prospective payment system where services are classified into groups called Ambulatory Payment Classifications (APC). Services in each APC are similar clinically and in terms of the resources they require. The Hospital is paid for cost-reimbursable items at a tentative rate with final settlement determined after submission of an annual cost report by the Hospital and audit by the Medicare fiscal intermediary. As of June 30, 2016, the Hospital’s Medicare cost reports have been audited by the Medicare fiscal intermediary through June 30, 2014.
Medicaid – Inpatient and outpatient services
rendered to Medicaid program beneficiaries are reimbursed based upon a cost reimbursement methodology. The Hospital is paid at a tentative rate with final settlement determined after submission of an annual cost report by the Hospital and audits by the Medicaid audit contractor. The Hospital is required to pay the federal match for the difference in reimbursement between the Tax Equity and Fiscal Responsibility Act inpatient rate and full cost. For outpatient services, the Hospital is required to pay the federal match for the difference reimbursed between the outpatient prospective rates and full cost. As of June 30, 2016, the Hospital’s Medicaid cost reports have
31
UNIVERSITY OF ARKANSAS SYSTEM: Footnotes to Consolidated Financial Statements FY16
UAMS continually monitors the allowances established for its patient accounts receivable. During FY16, UAMS determined that the historical collection trends, on which its accounts receivable allowances were based, were not indicative of more recent actual collections and, therefore, decreased these allowances by $36,500,000. This change in estimate is reflected in FY16 operating results and is the result of enhancements to UAMS’ revenue recognition process in response to improved information from its integrated clinical information system and complexities in the healthcare industry. UAMS provided approximately $77,654,000 and $72,726,000 in charity care, based on established rates, during the years ended June 30, 2016, and June 30, 2015, respectively. Because UAMS does not pursue collection of amounts determined to qualify as charity care, they are not included in gross patient revenue above. Net patient services revenue for the years ended June 30, 2016, and June 30, 2015, includes approximately $73,891,000 and $77,666,000, respectively, from the Medicaid program representing payments relating to Upper Payment Limit and Disproportionate Share reimbursements. These payments are available to state-operated teaching hospitals under Medicaid regulations. Net patient services revenue for the years ended June 30, 2016, and June 30, 2015, includes approximately $35,520,000 and $39,052,000, respectively, of net revenue from the Supplemental Medicaid program.
The Hospital, FGP, and Area Health Education Centers (AHECs) have agreements with governmental and other third-party payors that provide for reimbursement at amounts different from their established rates. Contractual adjustments under third-party reimbursement programs represent the difference between the billings at established rates for services and amounts reimbursed by third-party payors. A summary of the basis of reimbursement with significant third-party payors follows:
Hospital:Medicare – Inpatient acute care services rendered to program beneficiaries are paid at prospectively determined rates per discharge. These rates vary according to a patient classification system that is based on clinical, diagnostic, and other factors. Some transplantation services are paid based upon a cost reimbursement methodology. Outpatient services are
paid based on a prospective payment system where services are classified into groups called Ambulatory Payment Classifications (APC). Services in each APC are similar clinically and in terms of the resources they require. The Hospital is paid for cost-reimbursable items at a tentative rate with final settlement determined after submission of an annual cost report by the Hospital and audit by the Medicare fiscal intermediary. As of June 30, 2016, the Hospital’s Medicare cost reports have been audited by the Medicare fiscal intermediary through June 30, 2014.
Medicaid – Inpatient and outpatient services rendered to Medicaid program beneficiaries are reimbursed based upon a cost reimbursement methodology. The Hospital is paid at a tentative rate with final settlement determined after submission of an annual cost report by the Hospital and audits by the Medicaid audit contractor. The Hospital is required to pay the federal match for the difference in reimbursement between the Tax Equity and Fiscal Responsibility Act inpatient rate and full cost. For outpatient services, the Hospital is required to pay the federal match for the difference reimbursed between the outpatient prospective rates and full cost. As of June 30, 2016, the Hospital’s Medicaid cost reports have been audited by the Medicaid audit contractor through June 30, 2011.
FGP and AHECs:Services rendered to both Medicare and Medicaid program beneficiaries are reimbursed on prospectively determined rates per unit of service.
Laws and regulations governing the Medicare and Medicaid programs are complex and subject to interpretation. As a result, there is at least a reasonable possibility that recorded estimates will change by a material amount in the near term. The net adjustments to estimated settlements resulted in no change to net patient services revenue for the years ended June 30, 2016, and June 30, 2015. Management believes that UAMS is in compliance with all applicable laws and regulations and is not aware of any pending or threatened investigations involving allegations of potential wrongdoing. While no such regulatory inquiries have been made, compliance with such laws and regulations can be subject to future government review and interpretation, as well as significant regulatory action including fines, penalties, and exclusion from the Medicare and Medicaid programs.
32
UNIVERSITY OF ARKANSAS SYSTEM: Footnotes to Consolidated Financial Statements FY16
The Hospital, FGP, and AHECs have agreements with certain commercial insurance carriers and preferred provider organizations, which include prospectively determined rates per discharge, discounts from established charges, and prospectively determined per diem rates.
Additionally, UAMS has agreements to provide healthcare professionals to independent healthcare providers at contractually determined rates. These providers are responsible for billing and collecting from patients and third party payors, as applicable, for the services provided by UAMS staff supplied by these contracts.
Out-of-Period Adjustments to Medicaid ProgramsDuring FY16, UAMS corrected the following errors that existed in previously reported financial statements.
In prior periods, cost reimbursement revenue related to certain Medicaid programs was recorded when the reimbursement was received, which was in the following fiscal year. Accordingly, no account receivable amount was properly recorded for the accrued revenue earned in the respective year. A correction was made in FY16 to recognize the revenue earned in FY16 and to establish the related Medicaid receivable for which payment had not been made. The impact to revenue in FY16 was a $28,200,000 increase. Additionally, the required Medicaid match on these revenues was historically recorded when the match was paid, which was in the year following when the amount should have been accrued. A correction was made in FY16 to recognize the Medicaid match owed in FY16 and to establish the related match payable for which payment had not been made. The impact to state appropriations was an $8,715,000 decrease in FY16. As such, there is out-of-period revenue and Medicaid match (which is recorded as a reduction to state appropriations), related to the FY15 amounts, included within the FY16 financial information. The total impact to net position in FY16 is a $19,485,000 increase. These amounts are not considered material to the current or any previously reported financial statements.
In prior years, the required Medicaid match on certain other Medicaid program revenue was recorded as of the date the match was paid, a portion of which was in the year following the year the expense was incurred. A correction was made in FY16 to recognize the Medicaid match owed in FY16 and to establish the related
match payable for which payment had not been made. The impact to state appropriations is a $21,487,000 decrease in FY16. As such, there is an out-of-period Medicaid match related to the FY15 amounts included within the FY16 financial information. The total impact to net position in FY16 is a $21,487,000 decrease. These amounts are not considered material to the current or any previously reported financial statements.
An overstatement of $5,528,000 of Medicaid match was identified related to FY15, and an out-of-period correction was recorded in FY16 which resulted in an understatement of Medicaid match (which is recorded as a reduction to state appropriations) of the same amount. These amounts are not considered material to the current or any previous reported financial statements.
The net effect of the above corrections in FY16 is $3,526,000, which is not considered material to the financial statements, and the net effects applicable to prior periods are also not considered material.
Note 4: Compensated Absences
Employees accrue and accumulate annual and sick leave in a ccordance with policies established by the Board of Trustees. The University accrues the dollar value of leave benefits in accordance with generally accepted accounting principles which require accrual of salary-related payments directly and incrementally associated with compensated absences, such as employer’s share of social security taxes, as well as applicable salary expenses. These leave benefits are payable upon retirement, termination, or death of employees, up to the maximum allowed.
Full-time, non-classified employees accrue annual leave at the rate of fifteen hours per month and full-time classified employees accrue at a variable rate (from eight to fifteen hours per month) depending upon the number of years of employment in state government. Employees who are less than full-time, but are at least 50% time, accrue annual leave at prorated amounts. Under the University’s policy, an employee may carry accrued annual leave forward from one calendar year to another, up to a maximum of 240 hours (30 working days).
Classified employees who meet the conditions to be considered retirees at the time of termination
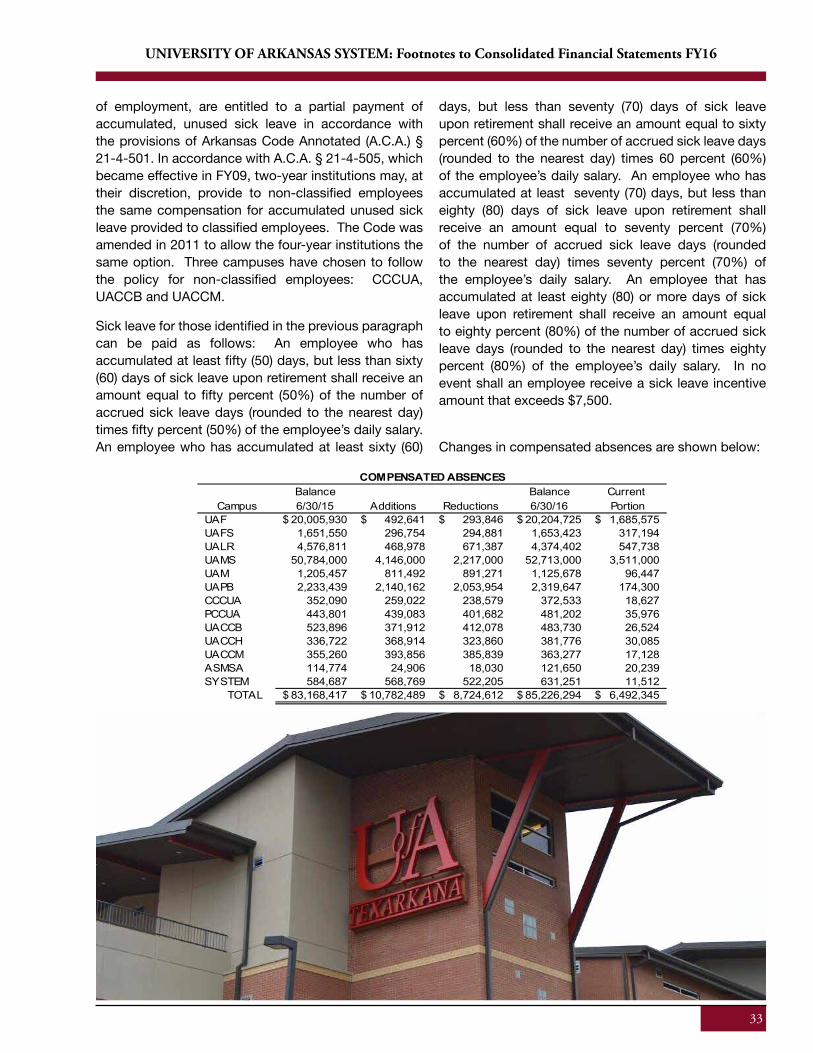
33
UNIVERSITY OF ARKANSAS SYSTEM: Footnotes to Consolidated Financial Statements FY16
of employment, are entitled to a partial payment of accumulated, unused sick leave in accordance with the provisions of Arkansas Code Annotated (A.C.A.) § 21-4-501. In accordance with A.C.A. § 21-4-505, which became effective in FY09, two-year institutions may, at their discretion, provide to non-classified employees the same compensation for accumulated unused sick leave provided to classified employees. The Code was amended in 2011 to allow the four-year institutions the same option. Three campuses have chosen to follow the policy for non-classified employees: CCCUA, UACCB and UACCM.
Sick leave for those identified in the previous paragraph can be paid as follows: An employee who has accumulated at least fifty (50) days, but less than sixty (60) days of sick leave upon retirement shall receive an amount equal to fifty percent (50%) of the number of accrued sick leave days (rounded to the nearest day) times fifty percent (50%) of the employee’s daily salary. An employee who has accumulated at least sixty (60)
days, but less than seventy (70) days of sick leave upon retirement shall receive an amount equal to sixty percent (60%) of the number of accrued sick leave days (rounded to the nearest day) times 60 percent (60%) of the employee’s daily salary. An employee who has accumulated at least seventy (70) days, but less than eighty (80) days of sick leave upon retirement shall receive an amount equal to seventy percent (70%) of the number of accrued sick leave days (rounded to the nearest day) times seventy percent (70%) of the employee’s daily salary. An employee that has accumulated at least eighty (80) or more days of sick leave upon retirement shall receive an amount equal to eighty percent (80%) of the number of accrued sick leave days (rounded to the nearest day) times eighty percent (80%) of the employee’s daily salary. In no event shall an employee receive a sick leave incentive amount that exceeds $7,500.
Changes in compensated absences are shown below:
Balance Balance Current Campus 6/30/15 Additions Reductions 6/30/16 Portion
UAF 20,005,930$ 492,641$ 293,846$ 20,204,725$ 1,685,575$ UAFS 1,651,550 296,754 294,881 1,653,423 317,194 UALR 4,576,811 468,978 671,387 4,374,402 547,738 UAMS 50,784,000 4,146,000 2,217,000 52,713,000 3,511,000 UAM 1,205,457 811,492 891,271 1,125,678 96,447 UAPB 2,233,439 2,140,162 2,053,954 2,319,647 174,300 CCCUA 352,090 259,022 238,579 372,533 18,627 PCCUA 443,801 439,083 401,682 481,202 35,976 UACCB 523,896 371,912 412,078 483,730 26,524 UACCH 336,722 368,914 323,860 381,776 30,085 UACCM 355,260 393,856 385,839 363,277 17,128 ASMSA 114,774 24,906 18,030 121,650 20,239 SYSTEM 584,687 568,769 522,205 631,251 11,512
TOTAL 83,168,417$ 10,782,489$ 8,724,612$ 85,226,294$ 6,492,345$
COMPENSATED ABSENCES
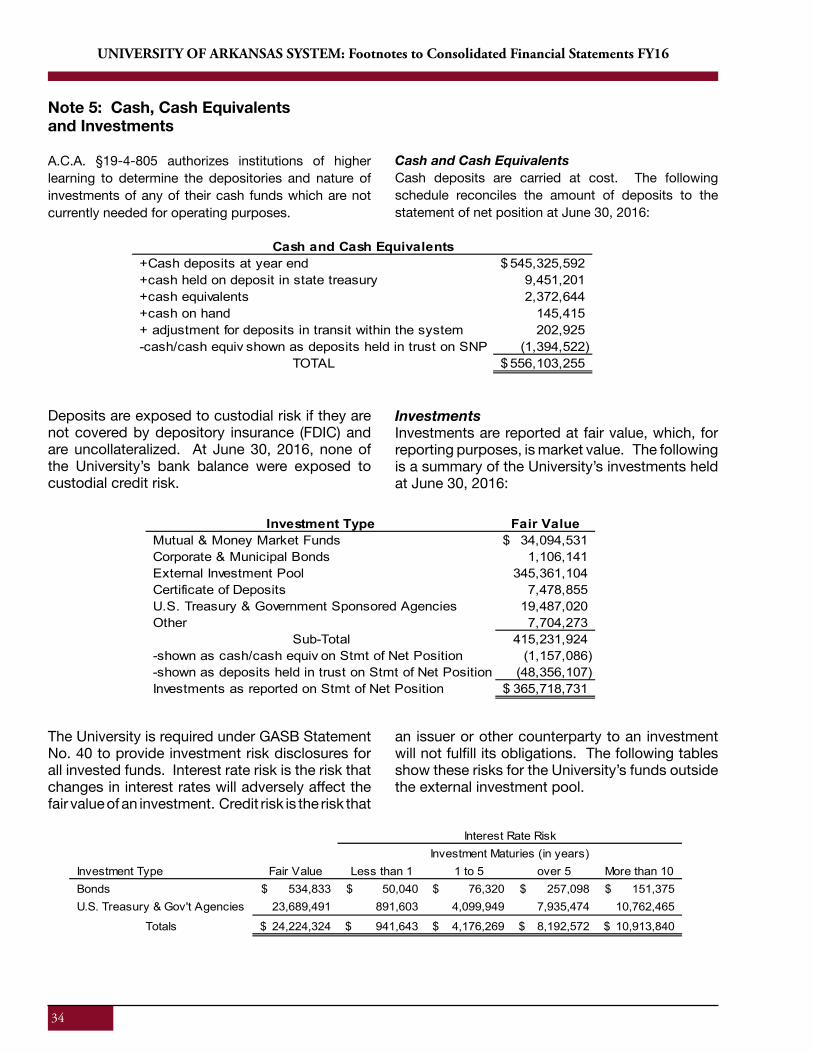
34
UNIVERSITY OF ARKANSAS SYSTEM: Footnotes to Consolidated Financial Statements FY16
Note 5: Cash, Cash Equivalents and Investments
A.C.A. §19-4-805 authorizes institutions of higher learning to determine the depositories and nature of investments of any of their cash funds which are not currently needed for operating purposes.
Cash and Cash EquivalentsCash deposits are carried at cost. The following schedule reconciles the amount of deposits to the statement of net position at June 30, 2016:
Deposits are exposed to custodial risk if they are not covered by depository insurance (FDIC) and are uncollateralized. At June 30, 2016, none of the University’s bank balance were exposed to custodial credit risk.
InvestmentsInvestments are reported at fair value, which, for reporting purposes, is market value. The following is a summary of the University’s investments held at June 30, 2016:
+Cash deposits at year end 545,325,592$ +cash held on deposit in state treasury 9,451,201 +cash equivalents 2,372,644 +cash on hand 145,415 + adjustment for deposits in transit within the system 202,925 -cash/cash equiv shown as deposits held in trust on SNP (1,394,522)
TOTAL 556,103,255$
Cash and Cash Equivalents
The University is required under GASB Statement No. 40 to provide investment risk disclosures for all invested funds. Interest rate risk is the risk that changes in interest rates will adversely affect the fair value of an investment. Credit risk is the risk that
an issuer or other counterparty to an investment will not fulfill its obligations. The following tables show these risks for the University’s funds outside the external investment pool.
Investment Type Fair ValueMutual & Money Market Funds 34,094,531$ Corporate & Municipal Bonds 1,106,141 External Investment Pool 345,361,104 Certificate of Deposits 7,478,855 U.S. Treasury & Government Sponsored Agencies 19,487,020 Other 7,704,273
Sub-Total 415,231,924 -shown as cash/cash equiv on Stmt of Net Position (1,157,086) -shown as deposits held in trust on Stmt of Net Position (48,356,107) Investments as reported on Stmt of Net Position 365,718,731$
Investment Type Fair Value Less than 1 1 to 5 over 5 More than 10Bonds 534,833$ 50,040$ 76,320$ 257,098$ 151,375$ U.S. Treasury & Gov't Agencies 23,689,491 891,603 4,099,949 7,935,474 10,762,465
Totals 24,224,324$ 941,643$ 4,176,269$ 8,192,572$ 10,913,840$
Interest Rate RiskInvestment Maturies (in years)
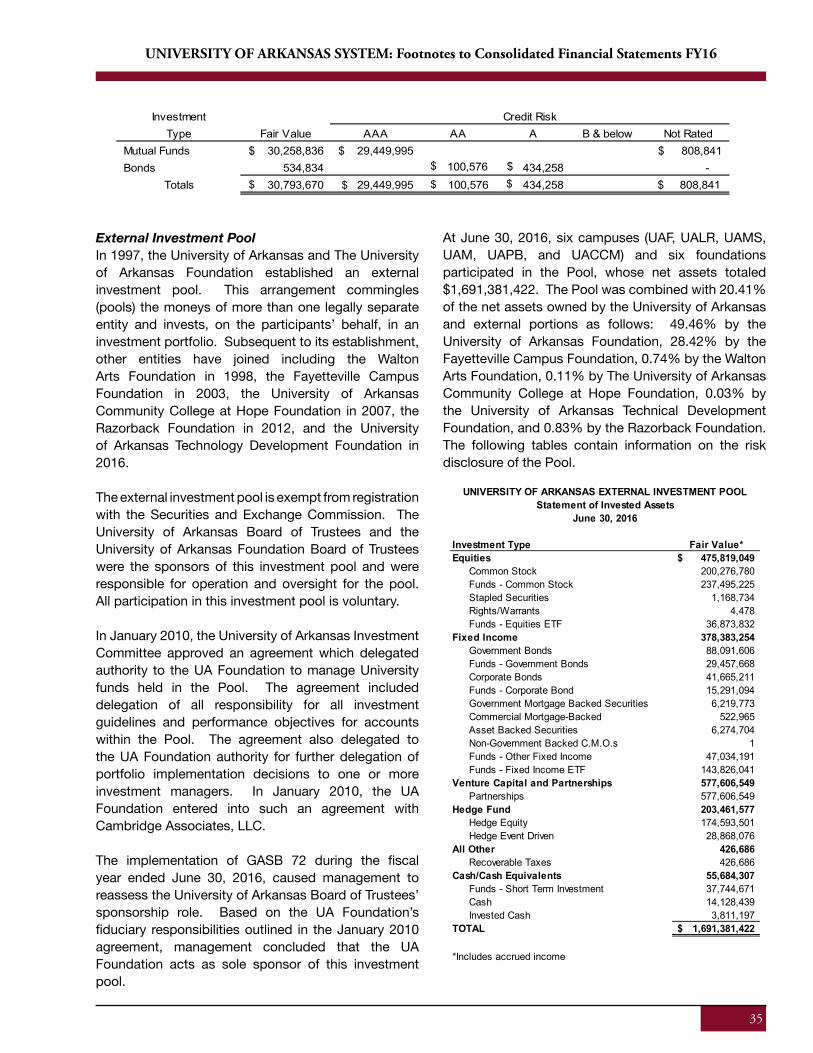
35
UNIVERSITY OF ARKANSAS SYSTEM: Footnotes to Consolidated Financial Statements FY16
External Investment PoolIn 1997, the University of Arkansas and The University of Arkansas Foundation established an external investment pool. This arrangement commingles (pools) the moneys of more than one legally separate entity and invests, on the participants’ behalf, in an investment portfolio. Subsequent to its establishment, other entities have joined including the Walton Arts Foundation in 1998, the Fayetteville Campus Foundation in 2003, the University of Arkansas Community College at Hope Foundation in 2007, the Razorback Foundation in 2012, and the University of Arkansas Technology Development Foundation in 2016.
The external investment pool is exempt from registration with the Securities and Exchange Commission. The University of Arkansas Board of Trustees and the University of Arkansas Foundation Board of Trustees were the sponsors of this investment pool and were responsible for operation and oversight for the pool. All participation in this investment pool is voluntary.
In January 2010, the University of Arkansas Investment Committee approved an agreement which delegated authority to the UA Foundation to manage University funds held in the Pool. The agreement included delegation of all responsibility for all investment guidelines and performance objectives for accounts within the Pool. The agreement also delegated to the UA Foundation authority for further delegation of portfolio implementation decisions to one or more investment managers. In January 2010, the UA Foundation entered into such an agreement with Cambridge Associates, LLC.
The implementation of GASB 72 during the fiscal year ended June 30, 2016, caused management to reassess the University of Arkansas Board of Trustees’ sponsorship role. Based on the UA Foundation’s fiduciary responsibilities outlined in the January 2010 agreement, management concluded that the UA Foundation acts as sole sponsor of this investment pool.
At June 30, 2016, six campuses (UAF, UALR, UAMS, UAM, UAPB, and UACCM) and six foundations participated in the Pool, whose net assets totaled $1,691,381,422. The Pool was combined with 20.41% of the net assets owned by the University of Arkansas and external portions as follows: 49.46% by the University of Arkansas Foundation, 28.42% by the Fayetteville Campus Foundation, 0.74% by the Walton Arts Foundation, 0.11% by The University of Arkansas Community College at Hope Foundation, 0.03% by the University of Arkansas Technical Development Foundation, and 0.83% by the Razorback Foundation. The following tables contain information on the risk disclosure of the Pool.
Investment Type Fair Value*Equities 475,819,049$
Common Stock 200,276,780Funds - Common Stock 237,495,225Stapled Securities 1,168,734Rights/Warrants 4,478Funds - Equities ETF 36,873,832
Fixed Income 378,383,254Government Bonds 88,091,606Funds - Government Bonds 29,457,668Corporate Bonds 41,665,211Funds - Corporate Bond 15,291,094Government Mortgage Backed Securities 6,219,773Commercial Mortgage-Backed 522,965Asset Backed Securities 6,274,704Non-Government Backed C.M.O.s 1Funds - Other Fixed Income 47,034,191Funds - Fixed Income ETF 143,826,041
Venture Capital and Partnerships 577,606,549Partnerships 577,606,549
Hedge Fund 203,461,577Hedge Equity 174,593,501Hedge Event Driven 28,868,076
All Other 426,686Recoverable Taxes 426,686
Cash/Cash Equivalents 55,684,307Funds - Short Term Investment 37,744,671Cash 14,128,439Invested Cash 3,811,197
TOTAL 1,691,381,422$
*Includes accrued income
UNIVERSITY OF ARKANSAS EXTERNAL INVESTMENT POOLStatement of Invested Assets
June 30, 2016
36
UNIVERSITY OF ARKANSAS SYSTEM: Footnotes to Consolidated Financial Statements FY16
InvestmentType Fair Value AAA AA A B & below Not Rated
Mutual Funds 30,258,836$ 29,449,995$ $ $
$
808,841 $ Bonds 534,834 100,576 434,258 -
Totals 30,793,670 29,449,995 100,576 434,258 808,841
Credit Risk
External Investment PoolIn 1997, the University of Arkansas and The University of Arkansas Foundation established an external investment pool. This arrangement commingles (pools) the moneys of more than one legally separate entity and invests, on the participants’ behalf, in an investment portfolio. Subsequent to its establishment, other entities have joined including the Walton Arts Foundation in 1998, the Fayetteville Campus Foundation in 2003, the University of Arkansas Community College at Hope Foundation in 2007, the Razorback Foundation in 2012, and the University of Arkansas Technology Development Foundation in 2016.
The external investment pool is exempt from registration with the Securities and Exchange Commission. The University of Arkansas Board of Trustees and the University of Arkansas Foundation Board of Trustees were the sponsors of this investment pool and were responsible for operation and oversight for the pool. All participation in this investment pool is voluntary.
In January 2010, the University of Arkansas Investment Committee approved an agreement which delegated authority to the UA Foundation to manage University funds held in the Pool. The agreement included delegation of all responsibility for all investment guidelines and performance objectives for accounts within the Pool. The agreement also delegated to the UA Foundation authority for further delegation of portfolio implementation decisions to one or more investment managers. In January 2010, the UA Foundation entered into such an agreement with Cambridge Associates, LLC.
The implementation of GASB 72 during the fiscal year ended June 30, 2016, caused management to reassess the University of Arkansas Board of Trustees’ sponsorship role. Based on the UA Foundation’s fiduciary responsibilities outlined in the January 2010 agreement, management concluded that the UA Foundation acts as sole sponsor of this investment pool.
At June 30, 2016, six campuses (UAF, UALR, UAMS, UAM, UAPB, and UACCM) and six foundations participated in the Pool, whose net assets totaled $1,691,381,422. The Pool was combined with 20.41% of the net assets owned by the University of Arkansas and external portions as follows: 49.46% by the University of Arkansas Foundation, 28.42% by the Fayetteville Campus Foundation, 0.74% by the Walton Arts Foundation, 0.11% by The University of Arkansas Community College at Hope Foundation, 0.03% by the University of Arkansas Technical Development Foundation, and 0.83% by the Razorback Foundation. The following tables contain information on the risk disclosure of the Pool.
Investment Type Fair Value*Equities 475,819,049$
Common Stock 200,276,780Funds - Common Stock 237,495,225Stapled Securities 1,168,734Rights/Warrants 4,478Funds - Equities ETF 36,873,832
Fixed Income 378,383,254Government Bonds 88,091,606Funds - Government Bonds 29,457,668Corporate Bonds 41,665,211Funds - Corporate Bond 15,291,094Government Mortgage Backed Securities 6,219,773Commercial Mortgage-Backed 522,965Asset Backed Securities 6,274,704Non-Government Backed C.M.O.s 1Funds - Other Fixed Income 47,034,191Funds - Fixed Income ETF 143,826,041
Venture Capital and Partnerships 577,606,549Partnerships 577,606,549
Hedge Fund 203,461,577Hedge Equity 174,593,501Hedge Event Driven 28,868,076
All Other 426,686Recoverable Taxes 426,686
Cash/Cash Equivalents 55,684,307Funds - Short Term Investment 37,744,671Cash 14,128,439Invested Cash 3,811,197
TOTAL 1,691,381,422$
*Includes accrued income
UNIVERSITY OF ARKANSAS EXTERNAL INVESTMENT POOLStatement of Invested Assets
June 30, 2016
$ $ $ $
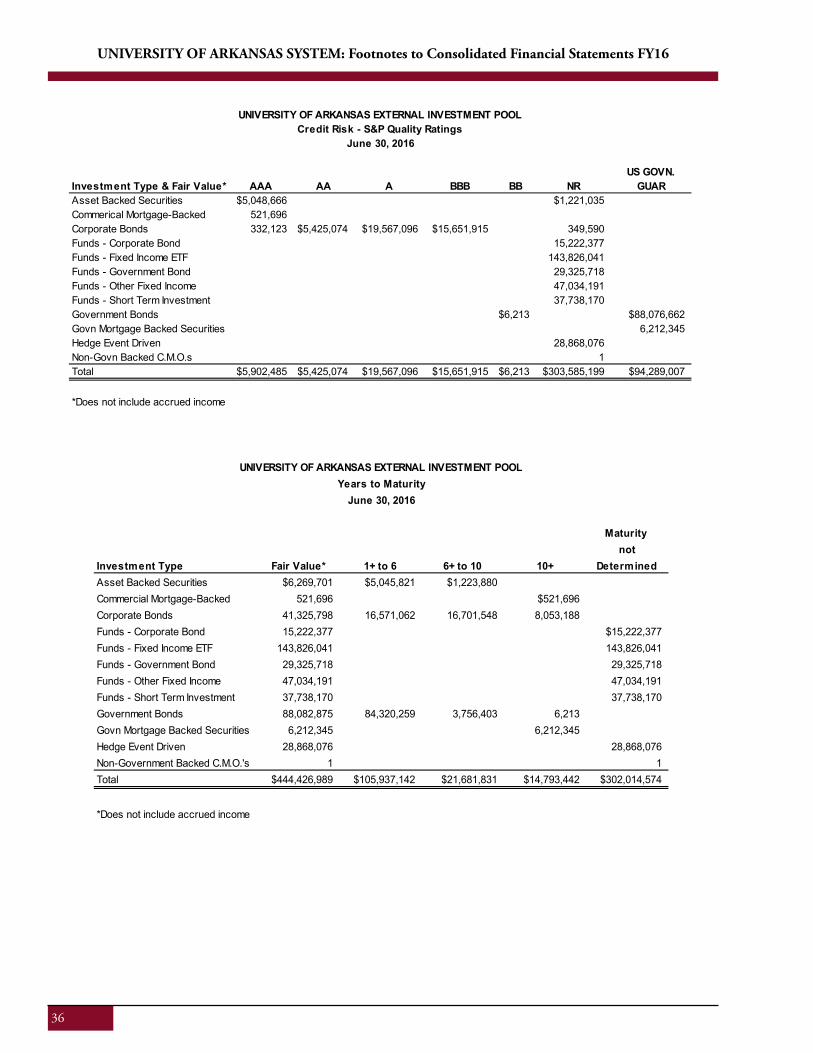
36
UNIVERSITY OF ARKANSAS SYSTEM: Footnotes to Consolidated Financial Statements FY16
US GOVN.Investment Type & Fair Value* AAA AA A BBB BB NR GUARAsset Backed Securities $5,048,666 $1,221,035Commerical Mortgage-Backed 521,696 Corporate Bonds 332,123 $5,425,074 $19,567,096 $15,651,915 349,590 Funds - Corporate Bond 15,222,377 Funds - Fixed Income ETF 143,826,041 Funds - Government Bond 29,325,718 Funds - Other Fixed Income 47,034,191 Funds - Short Term Investment 37,738,170 Government Bonds $6,213 $88,076,662Govn Mortgage Backed Securities 6,212,345 Hedge Event Driven 28,868,076 Non-Govn Backed C.M.O.s 1 Total $5,902,485 $5,425,074 $19,567,096 $15,651,915 $6,213 $303,585,199 $94,289,007
*Does not include accrued income
UNIVERSITY OF ARKANSAS EXTERNAL INVESTMENT POOLCredit Risk - S&P Quality Ratings
June 30, 2016
Maturity not
Investment Type Fair Value* 1+ to 6 6+ to 10 10+ DeterminedAsset Backed Securities $6,269,701 $5,045,821 $1,223,880Commercial Mortgage-Backed 521,696 $521,696Corporate Bonds 41,325,798 16,571,062 16,701,548 8,053,188 Funds - Corporate Bond 15,222,377 $15,222,377Funds - Fixed Income ETF 143,826,041 143,826,041 Funds - Government Bond 29,325,718 29,325,718 Funds - Other Fixed Income 47,034,191 47,034,191 Funds - Short Term Investment 37,738,170 37,738,170 Government Bonds 88,082,875 84,320,259 3,756,403 6,213 Govn Mortgage Backed Securities 6,212,345 6,212,345 Hedge Event Driven 28,868,076 28,868,076 Non-Government Backed C.M.O.'s 1 1 Total $444,426,989 $105,937,142 $21,681,831 $14,793,442 $302,014,574
*Does not include accrued income
UNIVERSITY OF ARKANSAS EXTERNAL INVESTMENT POOLYears to Maturity
June 30, 2016
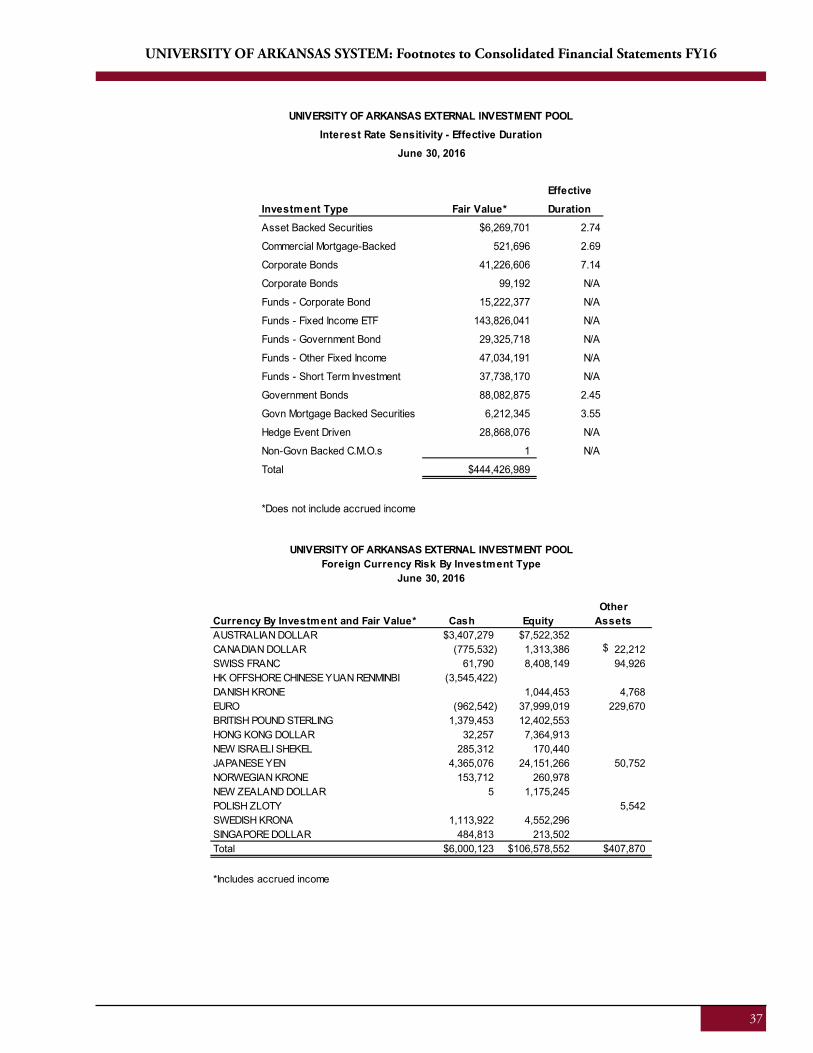
37
UNIVERSITY OF ARKANSAS SYSTEM: Footnotes to Consolidated Financial Statements FY16
38
UNIVERSITY OF ARKANSAS SYSTEM: Footnotes to Consolidated Financial Statements FY16
EffectiveInvestment Type Fair Value* DurationAsset Backed Securities $6,269,701 2.74
Commercial Mortgage-Backed 521,696 2.69
Corporate Bonds 41,226,606 7.14
Corporate Bonds 99,192 N/A
Funds - Corporate Bond 15,222,377 N/A
Funds - Fixed Income ETF 143,826,041 N/A
Funds - Government Bond 29,325,718 N/A
Funds - Other Fixed Income 47,034,191 N/A
Funds - Short Term Investment 37,738,170 N/A
Government Bonds 88,082,875 2.45
Govn Mortgage Backed Securities 6,212,345 3.55
Hedge Event Driven 28,868,076 N/A
Non-Govn Backed C.M.O.s 1 N/A
Total $444,426,989
*Does not include accrued income
UNIVERSITY OF ARKANSAS EXTERNAL INVESTMENT POOLInterest Rate Sensitivity - Effective Duration
June 30, 2016
OtherCurrency By Investment and Fair Value* Cash Equity AssetsAUSTRALIAN DOLLAR $3,407,279 $7,522,352
$CANADIAN DOLLAR (775,532) 1,313,386 22,212 SWISS FRANC 61,790 8,408,149 94,926 HK OFFSHORE CHINESE YUAN RENMINBI (3,545,422) DANISH KRONE 1,044,453 4,768 EURO (962,542) 37,999,019 229,670 BRITISH POUND STERLING 1,379,453 12,402,553 HONG KONG DOLLAR 32,257 7,364,913 NEW ISRAELI SHEKEL 285,312 170,440 JAPANESE YEN 4,365,076 24,151,266 50,752 NORWEGIAN KRONE 153,712 260,978 NEW ZEALAND DOLLAR 5 1,175,245 POLISH ZLOTY 5,542 SWEDISH KRONA 1,113,922 4,552,296 SINGAPORE DOLLAR 484,813 213,502 Total $6,000,123 $106,578,552 $407,870
*Includes accrued income
UNIVERSITY OF ARKANSAS EXTERNAL INVESTMENT POOLForeign Currency Risk By Investment Type
June 30, 2016
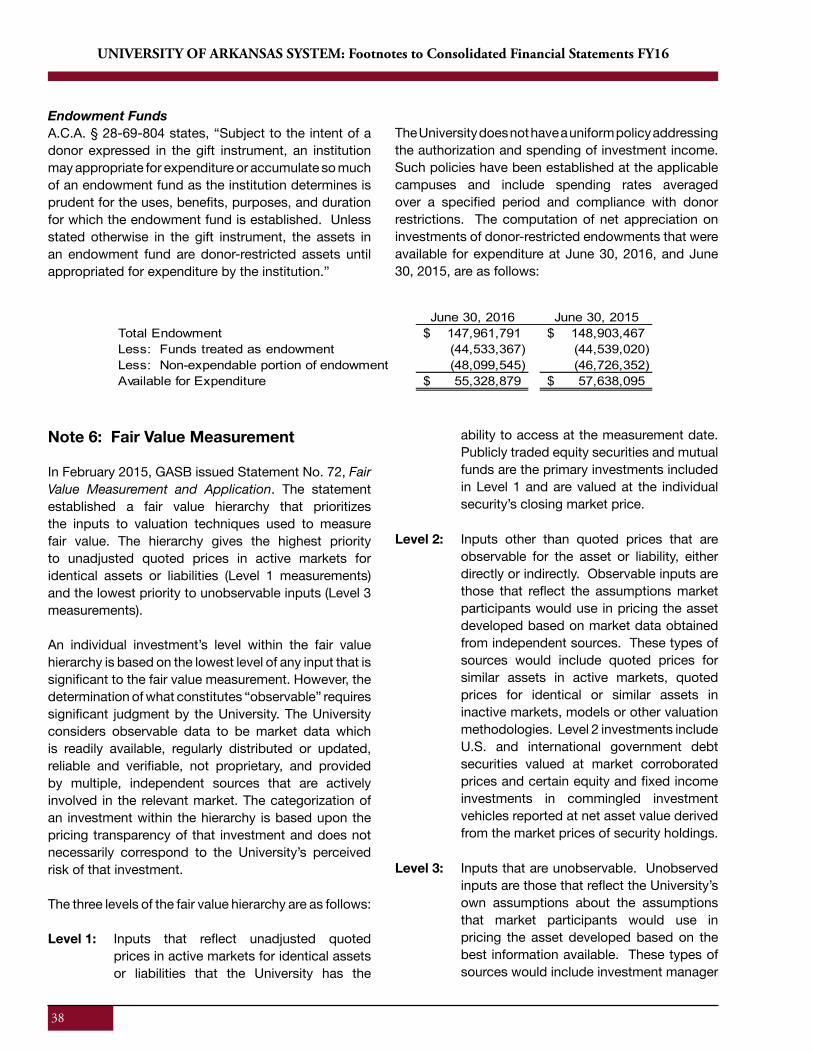
38
UNIVERSITY OF ARKANSAS SYSTEM: Footnotes to Consolidated Financial Statements FY16
Endowment FundsA.C.A. § 28-69-804 states, “Subject to the intent of a donor expressed in the gift instrument, an institution may appropriate for expenditure or accumulate so much of an endowment fund as the institution determines is prudent for the uses, benefits, purposes, and duration for which the endowment fund is established. Unless stated otherwise in the gift instrument, the assets in an endowment fund are donor-restricted assets until appropriated for expenditure by the institution.”
The University does not have a uniform policy addressing the authorization and spending of investment income. Such policies have been established at the applicable campuses and include spending rates averaged over a specified period and compliance with donor restrictions. The computation of net appreciation on investments of donor-restricted endowments that were available for expenditure at June 30, 2016, and June 30, 2015, are as follows:
Note 6: Fair Value Measurement
In February 2015, GASB issued Statement No. 72, Fair Value Measurement and Application. The statement established a fair value hierarchy that prioritizes the inputs to valuation techniques used to measure fair value. The hierarchy gives the highest priority to unadjusted quoted prices in active markets for identical assets or liabilities (Level 1 measurements) and the lowest priority to unobservable inputs (Level 3 measurements). An individual investment’s level within the fair value hierarchy is based on the lowest level of any input that is significant to the fair value measurement. However, the determination of what constitutes “observable” requires significant judgment by the University. The University considers observable data to be market data which is readily available, regularly distributed or updated, reliable and verifiable, not proprietary, and provided by multiple, independent sources that are actively involved in the relevant market. The categorization of an investment within the hierarchy is based upon the pricing transparency of that investment and does not necessarily correspond to the University’s perceived risk of that investment.
The three levels of the fair value hierarchy are as follows:
Level 1: Inputs that reflect unadjusted quoted prices in active markets for identical assets or liabilities that the University has the
ability to access at the measurement date. Publicly traded equity securities and mutual funds are the primary investments included in Level 1 and are valued at the individual security’s closing market price.
Level 2: Inputs other than quoted prices that are observable for the asset or liability, either directly or indirectly. Observable inputs are those that reflect the assumptions market participants would use in pricing the asset developed based on market data obtained from independent sources. These types of sources would include quoted prices for similar assets in active markets, quoted prices for identical or similar assets in inactive markets, models or other valuation methodologies. Level 2 investments include U.S. and international government debt securities valued at market corroborated prices and certain equity and fixed income investments in commingled investment vehicles reported at net asset value derived from the market prices of security holdings.
Level 3: Inputs that are unobservable. Unobserved inputs are those that reflect the University’s own assumptions about the assumptions that market participants would use in pricing the asset developed based on the best information available. These types of sources would include investment manager
June 30, 2016 June 30, 2015Total Endowment 147,961,791$ 148,903,467$ Less: Funds treated as endowment (44,533,367) (44,539,020) Less: Non-expendable portion of endowment (48,099,545) (46,726,352) Available for Expenditure 55,328,879$ 57,638,095$
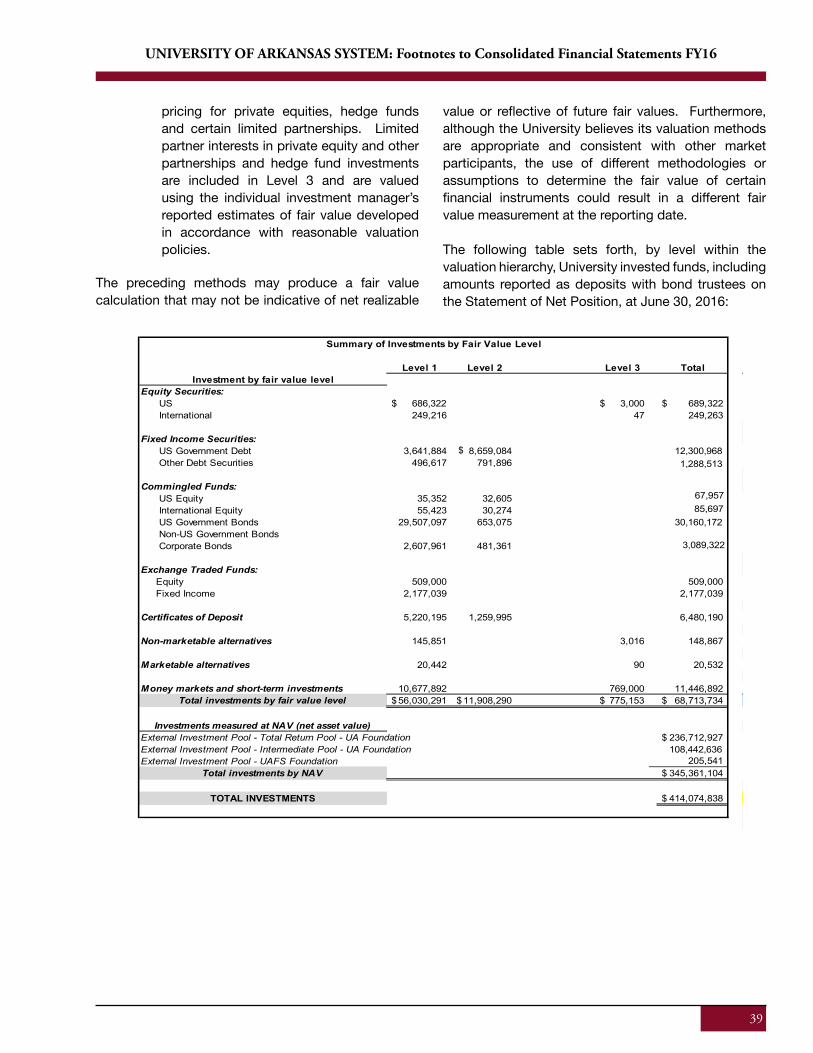
39
UNIVERSITY OF ARKANSAS SYSTEM: Footnotes to Consolidated Financial Statements FY16
pricing for private equities, hedge funds and certain limited partnerships. Limited partner interests in private equity and other partnerships and hedge fund investments are included in Level 3 and are valued using the individual investment manager’s reported estimates of fair value developed in accordance with reasonable valuation policies.
The preceding methods may produce a fair value calculation that may not be indicative of net realizable
value or reflective of future fair values. Furthermore, although the University believes its valuation methods are appropriate and consistent with other market participants, the use of different methodologies or assumptions to determine the fair value of certain financial instruments could result in a different fair value measurement at the reporting date.
The following table sets forth, by level within the valuation hierarchy, University invested funds, including amounts reported as deposits with bond trustees on the Statement of Net Position, at June 30, 2016:
Level 1 Level 2 Level 3 TotalInvestment by fair value level
Equity Securities: US $ 686,322 3,000$ 689,322$ International 249,216 47 249,263
Fixed Income Securities: US Government Debt 3,641,884 8,659,084 Other Debt Securities 496,617 791,896
Commingled Funds: US Equity 35,352 32,605 International Equity 55,423 30,274 US Government Bonds 29,507,097 653,075 Non-US Government Bonds Corporate Bonds 2,607,961 481,361
12,300,968 1,288,513
67,957 85,697
30,160,172
3,089,322
Exchange Traded Funds: Equity 509,000 509,000 Fixed Income 2,177,039 2,177,039
Certificates of Deposit 5,220,195 1,259,995 6,480,190
Non-marketable alternatives 145,851 3,016 148,867
Marketable alternatives 20,442 90 20,532
Money markets and short-term investments 10,677,892 769,000 11,446,892 Total investments by fair value level 56,030,291$ 11,908,290$ 775,153$ 68,713,734$
Investments measured at NAV (net asset value)External Investment Pool - Total Return Pool - UA Foundation 236,712,927$ External Investment Pool - Intermediate Pool - UA Foundation 108,442,636External Investment Pool - UAFS Foundation 205,541
Total investments by NAV 345,361,104$
TOTAL INVESTMENTS 414,074,838$
Summary of Investments by Fair Value Level
$
40
UNIVERSITY OF ARKANSAS SYSTEM: Footnotes to Consolidated Financial Statements FY16
Debt and equity securities classified in Level 1 of the fair value hierarchy are valued using prices quoted in active markets for those securities. Debt and equity securities classified in Level 2 of the fair value hierarchy are valued using a funds accounting technique or
are provided by time deposit custodians. Securities classified in Level 3 are valued using par value on the face of the investments.
Investments Measured at the NAV at June 30, 2016:
(1) This type includes investments in a broadly diversified external investment pool. Pooled investments include allocations to global equities, hedge funds, bonds, natural resources and real estate. The assets in the pool are accounted for at fair value determined according to the principles of the Financial Accounting Standards Board. A one-week notice is required for redemptions over $1 million. There is also a requirement for 30-days written notice if total withdrawals will exceed $25 million in any 30-day period.
(2) This type includes investments in an external investment pool comprised of fixed income investments. The pooled investments are allocated primarily to intermediate term government bonds and investment-grade intermediate term corporate bonds. The pool also includes allocations to mortgage-backed
securities, high yield bonds, emerging market debt and money market funds. The assets in the pool are accounted for at fair value determined according to the principles of the Financial Accounting Standards Board. A one-week notice is required for redemptions over $1 million. There is also a requirement for 30-days written notice if total withdrawals will exceed $25 million in any 30-day period.
Note 7: Income Taxes
The University is tax exempt under the Internal Revenue Code except for tax on unrelated business income. The University had no significant unrelated business income for the year ended June 30, 2016. It is also exempt from state income taxes under Arkansas law. Accordingly, no provision for income taxes is made in the financial statements.
41
UNIVERSITY OF ARKANSAS SYSTEM: Footnotes to Consolidated Financial Statements FY16
Debt and equity securities classified in Level 1 of the fair value hierarchy are valued using prices quoted in active markets for those securities. Debt and equity securities classified in Level 2 of the fair value hierarchy are valued using a funds accounting technique or
are provided by time deposit custodians. Securities classified in Level 3 are valued using par value on the face of the investments.
Investments Measured at the NAV at June 30, 2016:
(1) This type includes investments in a broadlydiversified external investment pool. Pooledinvestments include allocations to globalequities, hedge funds, bonds, natural resourcesand real estate. The assets in the pool areaccounted for at fair value determined accordingto the principles of the Financial AccountingStandards Board. A one-week notice is requiredfor redemptions over $1 million. There is alsoa requirement for 30-days written notice if totalwithdrawals will exceed $25 million in any 30-day period.
(2) This type includes investments in an externalinvestment pool comprised of fixed incomeinvestments. The pooled investments areallocated primarily to intermediate termgovernment bonds and investment-gradeintermediate term corporate bonds. The poolalso includes allocations to mortgage-backed
securities, high yield bonds, emerging market debt and money market funds. The assets in the pool are accounted for at fair value determined according to the principles of the Financial Accounting Standards Board. A one-week notice is required for redemptions over $1 million. There is also a requirement for 30-days written notice if total withdrawals will exceed $25 million in any 30-day period.
Note 7: Income Taxes
The University is tax exempt under the Internal Revenue Code except for tax on unrelated business income. The University had no significant unrelated business income for the year ended June 30, 2016. It is also exempt from state income taxes under Arkansas law. Accordingly, no provision for income taxes is made in the financial statements.
Unfunded Redemption RedemptionFair Value Commitments Frequency Notice Period
External Investment Pool - UA FoundationTotal Return Pool (1) 236,712,927$ 0 - 30 daysIntermediate Pool (2) 108,442,636$ 0 - 30 days
External Investment Pool - UFS Foundation 205,541$
Daily Daily
Daily 0 daysTotal Investments measured at the NAV 345,361,104$ $ 0
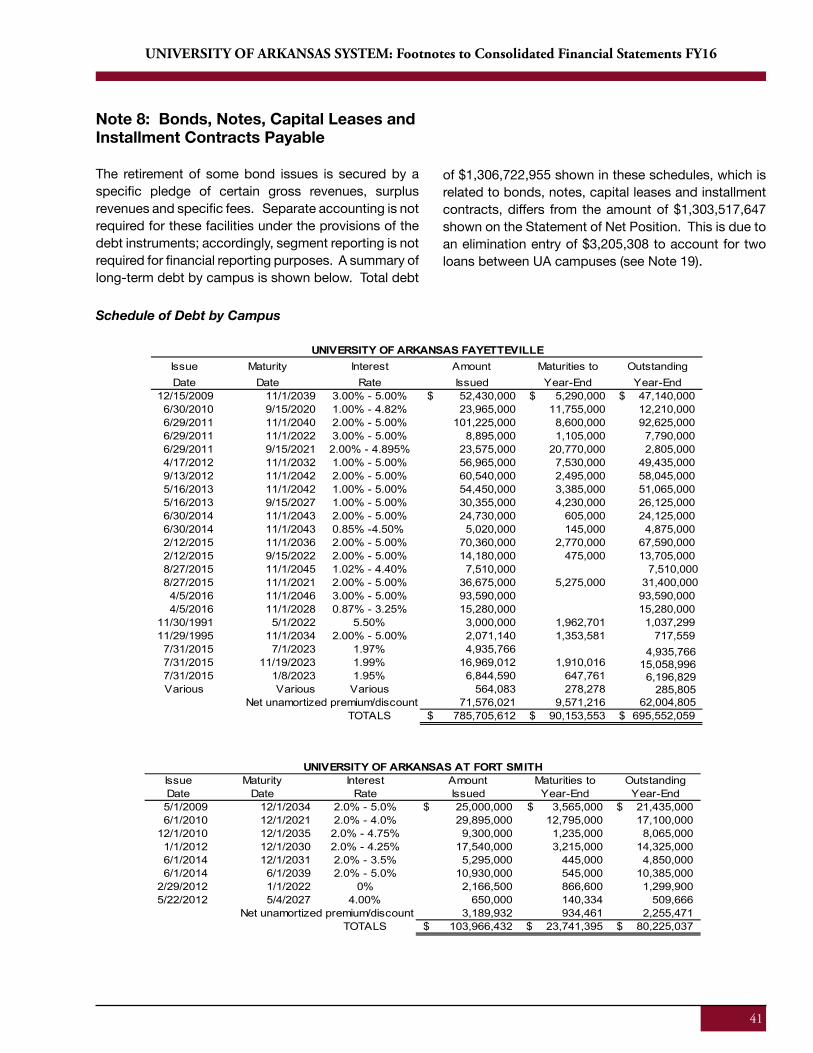
41
Note 8: Bonds, Notes, Capital Leases and Installment Contracts Payable
The retirement of some bond issues is secured by a specific pledge of certain gross revenues, surplus revenues and specific fees. Separate accounting is not required for these facilities under the provisions of the debt instruments; accordingly, segment reporting is not required for financial reporting purposes. A summary of long-term debt by campus is shown below. Total debt
of $1,306,722,955 shown in these schedules, which is related to bonds, notes, capital leases and installment contracts, differs from the amount of $1,303,517,647 shown on the Statement of Net Position. This is due to an elimination entry of $3,205,308 to account for two loans between UA campuses (see Note 19).
UNIVERSITY OF ARKANSAS SYSTEM: Footnotes to Consolidated Financial Statements FY16
Schedule of Debt by Campus
42
Note 8: Bonds, Notes, Capital Leases and Installment Contracts Payable
The retirement of some bond issues is secured by a specific pledge of certain gross revenues, surplus revenues and specific fees. Separate accounting is not required for these facilities under the provisions of the debt instruments; accordingly, segment reporting is not required for financial reporting purposes. A summary of long-term debt by campus is shown below. Total debt
of $1,306,722,955 shown in these schedules, which is related to bonds, notes, capital leases and installment contracts, differs from the amount of $1,303,517,647 shown on the Statement of Net Position. This is due to an elimination entry of $3,205,308 to account for two loans between UA campuses (see Note 19).
UNIVERSITY OF ARKANSAS SYSTEM: Footnotes to Consolidated Financial Statements FY16
Schedule of Debt by Campus
Issue Maturity Interest Amount Maturities to OutstandingDate Date Rate Issued Year-End Year-End
12/15/2009 11/1/2039 3.00% - 5.00% 52,430,000$ 5,290,000$ 47,140,000$ 6/30/2010 9/15/2020 1.00% - 4.82% 23,965,000 11,755,000 12,210,000 6/29/2011 11/1/2040 2.00% - 5.00% 101,225,000 8,600,000 92,625,000 6/29/2011 11/1/2022 3.00% - 5.00% 8,895,000 1,105,000 7,790,000 6/29/2011 9/15/2021 2.00% - 4.895% 23,575,000 20,770,000 2,805,000 4/17/2012 11/1/2032 1.00% - 5.00% 56,965,000 7,530,000 49,435,000 9/13/2012 11/1/2042 2.00% - 5.00% 60,540,000 2,495,000 58,045,000 5/16/2013 11/1/2042 1.00% - 5.00% 54,450,000 3,385,000 51,065,000 5/16/2013 9/15/2027 1.00% - 5.00% 30,355,000 4,230,000 26,125,000 6/30/2014 11/1/2043 2.00% - 5.00% 24,730,000 605,000 24,125,000 6/30/2014 11/1/2043 0.85% - 4.50% 5,020,000 145,000 4,875,000 2/12/2015 11/1/2036 2.00% - 5.00% 70,360,000 2,770,000 67,590,000 2/12/2015 9/15/2022 2.00% - 5.00% 14,180,000 475,000 13,705,000 8/27/2015 11/1/2045 1.02% - 4.40% 7,510,000 8/27/2015 11/1/2021 2.00% - 5.00% 36,675,000 5,275,000
7,510,000 31,400,000
4/5/2016 11/1/2046 3.00% - 5.00% 93,590,000 93,590,000 4/5/2016 11/1/2028 0.87% - 3.25% 15,280,000 15,280,000
11/30/1991 5/1/2022 5.50% 3,000,000 1,962,701 1,037,299 11/29/1995 11/1/2034 2.00% - 5.00% 2,071,140 1,353,581 717,559 7/31/2015 7/1/2023 1.97% 4,935,766 7/31/2015 11/19/2023 1.99% 16,969,012 1,910,016 7/31/2015 1/8/2023 1.95% 6,844,590 647,761 Various Various Various 564,083 278,278
71,576,021 9,571,216
4,935,766 15,058,996 6,196,829 285,805
62,004,805TOTALS 785,705,612$ 90,153,553$ 695,552,059$
Net unamortized premium/discount
UNIVERSITY OF ARKANSAS FAYETTEVILLE
Issue Maturity Interest Amount Maturities to OutstandingDate Date Rate Issued Year-End Year-End5/1/2009 12/1/2034 2.0% - 5.0% 25,000,000$ 3,565,000$ 21,435,000$ 6/1/2010 12/1/2021 2.0% - 4.0% 29,895,000 12,795,000 17,100,000
12/1/2010 12/1/2035 2.0% - 4.75% 9,300,000 1,235,000 8,065,000 1/1/2012 12/1/2030 2.0% - 4.25% 17,540,000 3,215,000 14,325,000 6/1/2014 12/1/2031 2.0% - 3.5% 5,295,000 445,000 4,850,000 6/1/2014 6/1/2039 2.0% - 5.0% 10,930,000 545,000 10,385,000
2/29/2012 1/1/2022 0% 2,166,500 866,600 1,299,900 5/22/2012 5/4/2027 4.00% 650,000 140,334 509,666
3,189,932 934,461 2,255,471 TOTALS 103,966,432$ 23,741,395$ 80,225,037$
UNIVERSITY OF ARKANSAS AT FORT SMITH
Net unamortized premium/discount
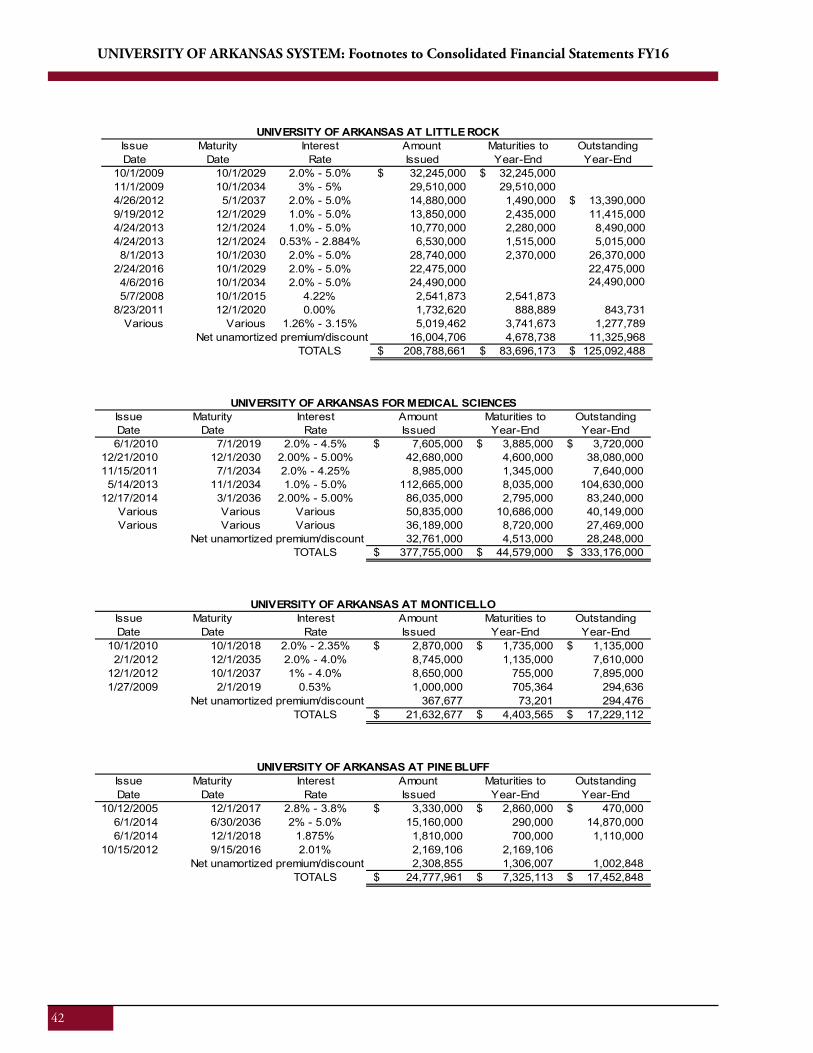
42
UNIVERSITY OF ARKANSAS SYSTEM: Footnotes to Consolidated Financial Statements FY16
42
UNIVERSITY OF ARKANSAS SYSTEM: Footnotes to Consolidated Financial Statements FY16
Issue Maturity Interest Amount Maturities to OutstandingDate Date Rate Issued Year-End Year-End
10/1/2009 10/1/2029 2.0% - 5.0% 32,245,000$ 32,245,000$ 11/1/2009 10/1/2034 3% - 5% 29,510,000 29,510,000 4/26/2012 5/1/2037 2.0% - 5.0% 14,880,000 1,490,000 13,390,000$ 9/19/2012 12/1/2029 1.0% - 5.0% 13,850,000 2,435,000 11,415,000 4/24/2013 12/1/2024 1.0% - 5.0% 10,770,000 2,280,000 8,490,000 4/24/2013 12/1/2024 0.53% - 2.884% 6,530,000 1,515,000 5,015,000 8/1/2013 10/1/2030 2.0% - 5.0% 28,740,000 2,370,000 26,370,000
2/24/2016 10/1/2029 2.0% - 5.0% 22,475,000 4/6/2016 10/1/2034 2.0% - 5.0% 24,490,000
22,475,000 24,490,000
5/7/2008 10/1/2015 4.22% 2,541,873 2,541,873 8/23/2011 12/1/2020 0.00% 1,732,620 888,889 843,731
Various Various 1.26% - 3.15% 5,019,462 3,741,673 1,277,789 16,004,706 4,678,738 11,325,968
TOTALS 208,788,661$ 83,696,173$ 125,092,488$
UNIVERSITY OF ARKANSAS AT LITTLE ROCK
Net unamortized premium/discount
Issue Maturity Interest Amount Maturities to OutstandingDate Date Rate Issued Year-End Year-End6/1/2010 7/1/2019 2.0% - 4.5% 7,605,000$ 3,885,000$ 3,720,000$
12/21/2010 12/1/2030 2.00% - 5.00% 42,680,000 4,600,000 38,080,000 11/15/2011 7/1/2034 2.0% - 4.25% 8,985,000 1,345,000 7,640,000 5/14/2013 11/1/2034 1.0% - 5.0% 112,665,000 8,035,000 104,630,000
12/17/2014 3/1/2036 2.00% - 5.00% 86,035,000 2,795,000 83,240,000 Various Various Various 50,835,000 10,686,000 40,149,000 Various Various Various 36,189,000 8,720,000 27,469,000
32,761,000 4,513,000 28,248,000 TOTALS 377,755,000$ 44,579,000$ 333,176,000$
UNIVERSITY OF ARKANSAS FOR MEDICAL SCIENCES
Net unamortized premium/discount
Issue Maturity Interest Amount Maturities to OutstandingDate Date Rate Issued Year-End Year-End
10/1/2010 10/1/2018 2.0% - 2.35% 2,870,000$ 1,735,000$ 1,135,000$ 2/1/2012 12/1/2035 2.0% - 4.0% 8,745,000 1,135,000 7,610,000
12/1/2012 10/1/2037 1% - 4.0% 8,650,000 755,000 7,895,000 1/27/2009 2/1/2019 0.53% 1,000,000 705,364 294,636
367,677 73,201 294,476 TOTALS 21,632,677$ 4,403,565$ 17,229,112$
UNIVERSITY OF ARKANSAS AT MONTICELLO
Net unamortized premium/discount
Issue Maturity Interest Amount Maturities to OutstandingDate Date Rate Issued Year-End Year-End
10/12/2005 12/1/2017 2.8% - 3.8% 3,330,000$ 2,860,000$ 470,000$ 6/1/2014 6/30/2036 2% - 5.0% 15,160,000 290,000 14,870,000 6/1/2014 12/1/2018 1.875% 1,810,000 700,000 1,110,000
10/15/2012 9/15/2016 2.01% 2,169,106 2,169,106 2,308,855 1,306,007 1,002,848
TOTALS 24,777,961$ 7,325,113$ 17,452,848$ Net unamortized premium/discount
UNIVERSITY OF ARKANSAS AT PINE BLUFF
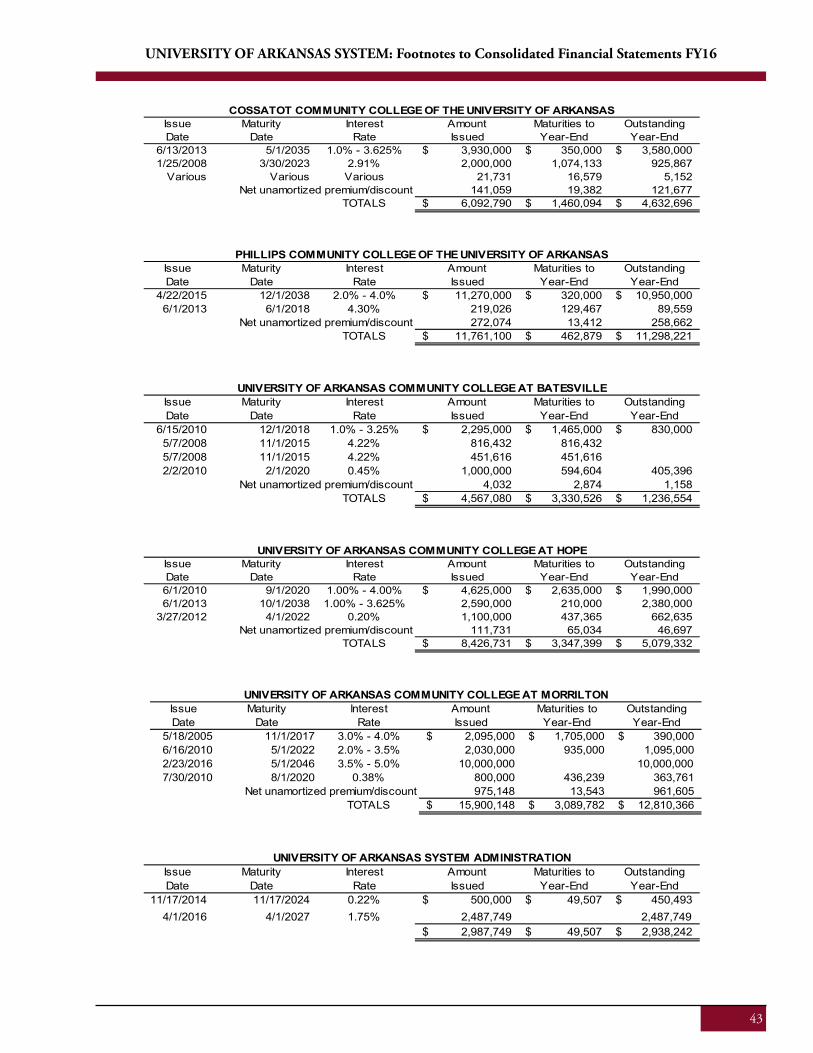
43
UNIVERSITY OF ARKANSAS SYSTEM: Footnotes to Consolidated Financial Statements FY16
44
UNIVERSITY OF ARKANSAS SYSTEM: Footnotes to Consolidated Financial Statements FY16
Issue Maturity Interest Amount Maturities to OutstandingDate Date Rate Issued Year-End Year-End
6/13/2013 5/1/2035 1.0% - 3.625% 3,930,000$ 350,000$ 3,580,000$ 1/25/2008 3/30/2023 2.91% 2,000,000 1,074,133 925,867
Various Various Various 21,731 16,579 5,152 141,059 19,382 121,677
TOTALS 6,092,790$ 1,460,094$ 4,632,696$
COSSATOT COMMUNITY COLLEGE OF THE UNIVERSITY OF ARKANSAS
Net unamortized premium/discount
Issue Maturity Interest Amount Maturities to OutstandingDate Date Rate Issued Year-End Year-End
4/22/2015 12/1/2038 2.0% - 4.0% 11,270,000$ 320,000$ 10,950,000$ 6/1/2013 6/1/2018 4.30% 219,026 129,467 89,559
272,074 13,412 258,662 TOTALS 11,761,100$ 462,879$ 11,298,221$
PHILLIPS COMMUNITY COLLEGE OF THE UNIVERSITY OF ARKANSAS
Net unamortized premium/discount
Issue Maturity Interest Amount Maturities to OutstandingDate Date Rate Issued Year-End Year-End
6/15/2010 12/1/2018 1.0% - 3.25% 2,295,000$ 1,465,000$ 830,000$ 5/7/2008 11/1/2015 4.22% 816,432 816,432 5/7/2008 11/1/2015 4.22% 451,616 451,616 2/2/2010 2/1/2020 0.45% 1,000,000 594,604 405,396
4,032 2,874 1,158 TOTALS 4,567,080$ 3,330,526$ 1,236,554$
Net unamortized premium/discount
UNIVERSITY OF ARKANSAS COMMUNITY COLLEGE AT BATESVILLE
Issue Maturity Interest Amount Maturities to OutstandingDate Date Rate Issued Year-End Year-End6/1/2010 9/1/2020 1.00% - 4.00% 4,625,000$ 2,635,000$ 1,990,000$ 6/1/2013 10/1/2038 1.00% - 3.625% 2,590,000 210,000 2,380,000
3/27/2012 4/1/2022 0.20% 1,100,000 437,365 662,635 111,731 65,034 46,697
TOTALS 8,426,731$ 3,347,399$ 5,079,332$
UNIVERSITY OF ARKANSAS COMMUNITY COLLEGE AT HOPE
Net unamortized premium/discount
Issue Maturity Interest Amount Maturities to OutstandingDate Date Rate Issued Year-End Year-End
5/18/2005 11/1/2017 3.0% - 4.0% 2,095,000$ 1,705,000$ 390,000$ 6/16/2010 5/1/2022 2.0% - 3.5% 2,030,000 935,000 1,095,000 2/23/2016 5/1/2046 3.5% - 5.0% 10,000,000 10,000,0007/30/2010 8/1/2020 0.38% 800,000 436,239 363,761
975,148 13,543 961,605 TOTALS 15,900,148$ 3,089,782$ 12,810,366$
UNIVERSITY OF ARKANSAS COMMUNITY COLLEGE AT MORRILTON
Net unamortized premium/discount
Issue Maturity Interest Amount Maturities to OutstandingDate Date Rate Issued Year-End Year-End
11/17/2014 11/17/2024 0.22% 500,000$ 49,507$ 450,493$ 4/1/2016 4/1/2027 1.75% 2,487,749 2,487,749
2,987,749$ 49,507$ 2,938,242$
UNIVERSITY OF ARKANSAS SYSTEM ADMINISTRATION
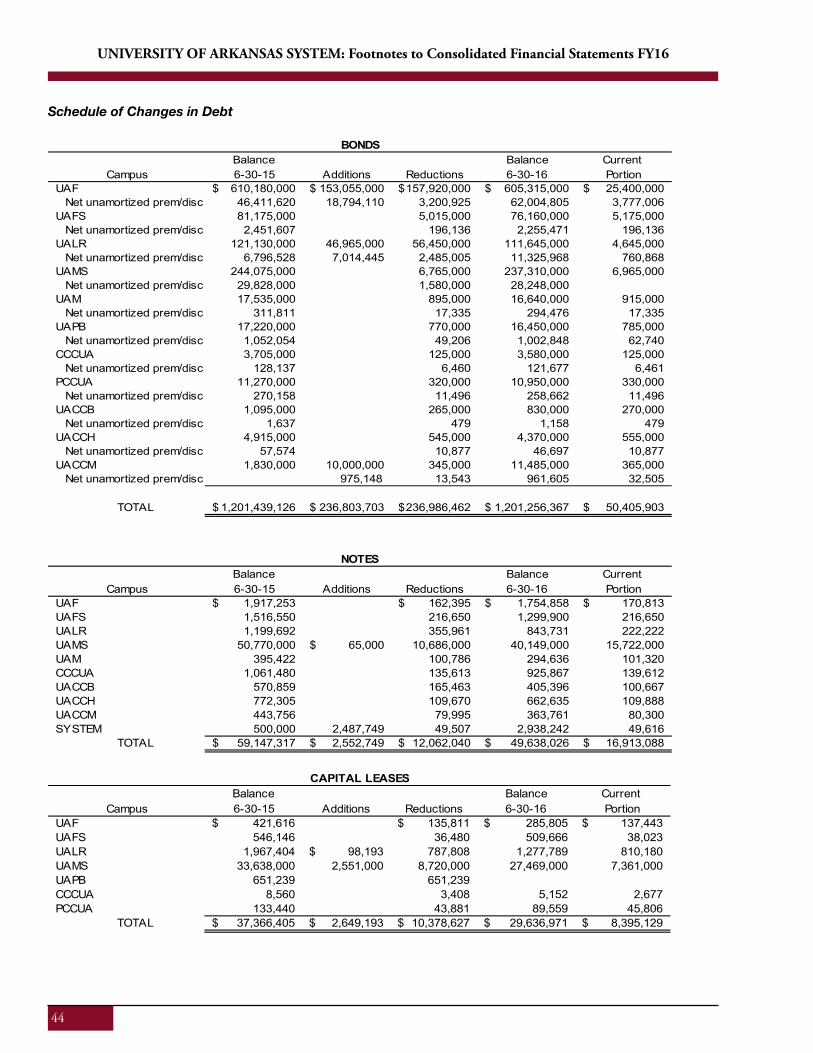
44
UNIVERSITY OF ARKANSAS SYSTEM: Footnotes to Consolidated Financial Statements FY16
Schedule of Changes in Debt
45
UNIVERSITY OF ARKANSAS SYSTEM: Footnotes to Consolidated Financial Statements FY16
Schedule of Changes in Debt
Balance Balance Current Campus 6-30-15 Additions Reductions 6-30-16 Portion
UAF 610,180,000$ 153,055,000$ 157,920,000$ 605,315,000$ 25,400,000$ Net unamortized prem/disc 46,411,620 18,794,110 3,200,925 62,004,805 3,777,006 UAFS 81,175,000 5,015,000 76,160,000 5,175,000 Net unamortized prem/disc 2,451,607 196,136 2,255,471 196,136 UALR 121,130,000 46,965,000 56,450,000 111,645,000 4,645,000 Net unamortized prem/disc 6,796,528 7,014,445 2,485,005 11,325,968 760,868 UAMS 244,075,000 6,765,000 237,310,000 6,965,000 Net unamortized prem/disc 29,828,000 1,580,000 28,248,000 UAM 17,535,000 895,000 16,640,000 915,000 Net unamortized prem/disc 311,811 17,335 294,476 17,335 UAPB 17,220,000 770,000 16,450,000 785,000 Net unamortized prem/disc 1,052,054 49,206 1,002,848 62,740 CCCUA 3,705,000 125,000 3,580,000 125,000 Net unamortized prem/disc 128,137 6,460 121,677 6,461 PCCUA 11,270,000 320,000 10,950,000 330,000 Net unamortized prem/disc 270,158 11,496 258,662 11,496 UACCB 1,095,000 265,000 830,000 270,000 Net unamortized prem/disc 1,637 479 1,158 479 UACCH 4,915,000 545,000 4,370,000 555,000 Net unamortized prem/disc 57,574 10,877 46,697 10,877 UACCM 1,830,000 10,000,000 345,000 11,485,000 365,000 Net unamortized prem/disc 975,148 13,543 961,605 32,505
TOTAL 1,201,439,126$ 236,803,703$ 236,986,462$ 1,201,256,367$ 50,405,903$
BONDS
Balance Balance Current Campus 6-30-15 Additions Reductions 6-30-16 Portion
UAF 1,917,253$ 162,395$ 1,754,858$ 170,813$ UAFS 1,516,550 216,650 1,299,900 216,650 UALR 1,199,692 355,961 843,731 222,222 UAMS 50,770,000 65,000$ 10,686,000 40,149,000 15,722,000 UAM 395,422 100,786 294,636 101,320 CCCUA 1,061,480 135,613 925,867 139,612 UACCB 570,859 165,463 405,396 100,667 UACCH 772,305 109,670 662,635 109,888 UACCM 443,756 79,995 363,761 80,300 SYSTEM 500,000 2,487,749 49,507 2,938,242 49,616
TOTAL 59,147,317$ 2,552,749$ 12,062,040$ 49,638,026$ 16,913,088$
NOTES
Balance Balance Current Campus 6-30-15 Additions Reductions 6-30-16 Portion
UAF 421,616$ 135,811$ 285,805$ 137,443$ UAFS 546,146 36,480 509,666 38,023 UALR 1,967,404 98,193$ 787,808 1,277,789 810,180 UAMS 33,638,000 2,551,000 8,720,000 27,469,000 7,361,000 UAPB 651,239 651,239 CCCUA 8,560 3,408 5,152 2,677 PCCUA 133,440 43,881 89,559 45,806
TOTAL 37,366,405$ 2,649,193$ 10,378,627$ 29,636,971$ 8,395,129$
CAPITAL LEASES
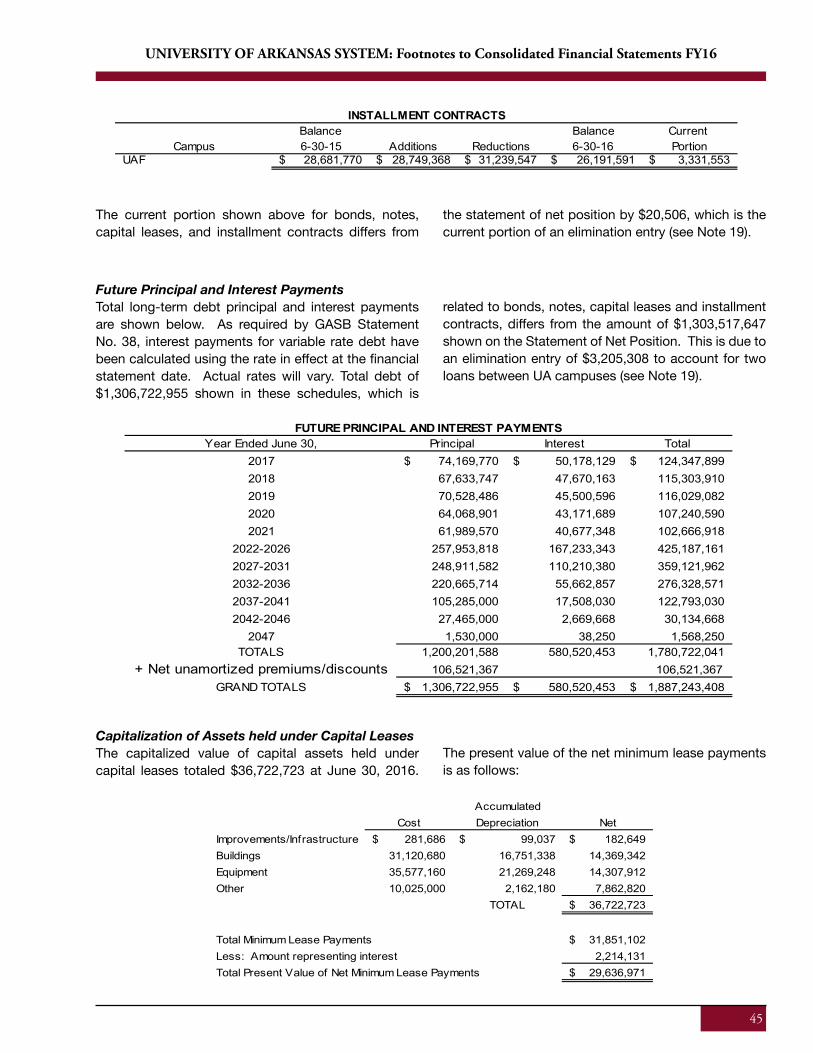
45
UNIVERSITY OF ARKANSAS SYSTEM: Footnotes to Consolidated Financial Statements FY16
The current portion shown above for bonds, notes, capital leases, and installment contracts differs from
the statement of net position by $20,506, which is the current portion of an elimination entry (see Note 19).
Future Principal and Interest PaymentsTotal long-term debt principal and interest payments are shown below. As required by GASB Statement No. 38, interest payments for variable rate debt have been calculated using the rate in effect at the financial statement date. Actual rates will vary. Total debt of $1,306,722,955 shown in these schedules, which is
related to bonds, notes, capital leases and installment contracts, differs from the amount of $1,303,517,647 shown on the Statement of Net Position. This is due to an elimination entry of $3,205,308 to account for two loans between UA campuses (see Note 19).
Capitalization of Assets held under Capital LeasesThe capitalized value of capital assets held under capital leases totaled $36,722,723 at June 30, 2016.
The present value of the net minimum lease payments is as follows:
AccumulatedCost Depreciation Net
Improvements/Infrastructure 281,686$ 99,037$ 182,649$ Buildings 31,120,680 16,751,338 14,369,342 Equipment 35,577,160 21,269,248 14,307,912 Other 10,025,000 2,162,180 7,862,820
TOTAL 36,722,723$
Total Minimum Lease Payments 31,851,102$ Less: Amount representing interest 2,214,131 Total Present Value of Net Minimum Lease Payments 29,636,971$
46
UNIVERSITY OF ARKANSAS SYSTEM: Footnotes to Consolidated Financial Statements FY16
Balance Balance Current Campus 6-30-15 Additions Reductions 6-30-16 Portion
UAF 28,681,770$ 28,749,368$ 31,239,547$ 26,191,591$ 3,331,553$
INSTALLMENT CONTRACTS
The current portion shown above for bonds, notes, capital leases, and installment contracts differs from
the statement of net position by $20,506, which is the current portion of an elimination entry (see Note 19).
Future Principal and Interest PaymentsTotal long-term debt principal and interest payments are shown below. As required by GASB Statement No. 38, interest payments for variable rate debt have been calculated using the rate in effect at the financial statement date. Actual rates will vary. Total debt of $1,306,722,955 shown in these schedules, which is
related to bonds, notes, capital leases and installment contracts, differs from the amount of $1,303,517,647 shown on the Statement of Net Position. This is due to an elimination entry of $3,205,308 to account for two loans between UA campuses (see Note 19).
Capitalization of Assets held under Capital LeasesThe capitalized value of capital assets held under capital leases totaled $36,722,723 at June 30, 2016.
The present value of the net minimum lease payments is as follows:
Year Ended June 30, Principal Interest Total2017 74,169,770$ 50,178,129$ 124,347,899$ 2018 67,633,747 47,670,163 115,303,910 2019 70,528,486 45,500,596 116,029,082 2020 64,068,901 43,171,689 107,240,590 2021 61,989,570 40,677,348 102,666,918
2022-2026 257,953,818 167,233,343 425,187,161 2027-2031 248,911,582 110,210,380 359,121,962 2032-2036 220,665,714 55,662,857 276,328,571 2037-2041 105,285,000 17,508,030 122,793,030 2042-2046 27,465,000 2,669,668 30,134,668
2047 1,530,000 38,250 1,568,250 TOTALS 1,200,201,588 580,520,453 1,780,722,041
+ Net unamortized premiums/discounts 106,521,367 106,521,367GRAND TOTALS 1,306,722,955$ 580,520,453$ 1,887,243,408$
FUTURE PRINCIPAL AND INTEREST PAYMENTS
AccumulatedCost Depreciation Net
Improvements/Infrastructure 281,686$ 99,037$ 182,649$ Buildings 31,120,680 16,751,338 14,369,342 Equipment 35,577,160 21,269,248 14,307,912 Other 10,025,000 2,162,180 7,862,820
TOTAL 36,722,723$
Total Minimum Lease Payments 31,851,102$ Less: Amount representing interest 2,214,131 Total Present Value of Net Minimum Lease Payments 29,636,971$
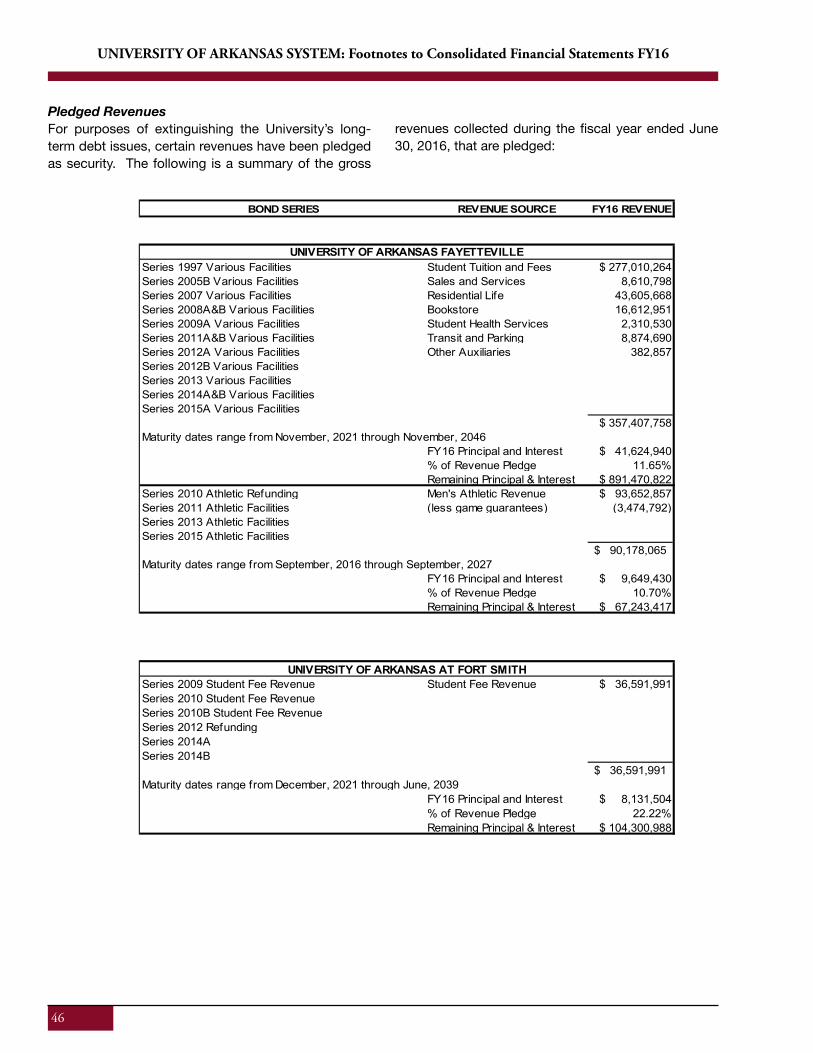
46
UNIVERSITY OF ARKANSAS SYSTEM: Footnotes to Consolidated Financial Statements FY16
BOND SERIES REVENUE SOURCE FY16 REVENUE
Series 1997 Various Facilities Student Tuition and Fees $ 277,010,264 Series 2005B Various Facilities Sales and Services 8,610,798 Series 2007 Various Facilities Residential Life 43,605,668 Series 2008A&B Various Facilities Bookstore 16,612,951 Series 2009A Various Facilities Student Health Services 2,310,530 Series 2011A&B Various Facilities Transit and Parking 8,874,690 Series 2012A Various Facilities Other Auxiliaries 382,857 Series 2012B Various FacilitiesSeries 2013 Various FacilitiesSeries 2014A&B Various FacilitiesSeries 2015A Various Facilities
$ 357,407,758 Maturity dates range from November, 2021 through November, 2046
FY16 Principal and Interest $ 41,624,940 % of Revenue Pledge 11.65%Remaining Principal & Interest $ 891,470,822
Series 2010 Athletic Refunding Men's Athletic Revenue $ 93,652,857 Series 2011 Athletic Facilities (less game guarantees) (3,474,792)Series 2013 Athletic FacilitiesSeries 2015 Athletic Facilities
$ 90,178,065 Maturity dates range from September, 2016 through September, 2027
FY16 Principal and Interest $ 9,649,430 % of Revenue Pledge 10.70%Remaining Principal & Interest $ 67,243,417
UNIVERSITY OF ARKANSAS FAYETTEVILLE
Series 2009 Student Fee Revenue Student Fee Revenue $ 36,591,991 Series 2010 Student Fee RevenueSeries 2010B Student Fee RevenueSeries 2012 RefundingSeries 2014ASeries 2014B
$ 36,591,991 Maturity dates range from December, 2021 through June, 2039
FY16 Principal and Interest $ 8,131,504 % of Revenue Pledge 22.22%Remaining Principal & Interest $ 104,300,988
UNIVERSITY OF ARKANSAS AT FORT SMITH
Pledged RevenuesFor purposes of extinguishing the University’s long-term debt issues, certain revenues have been pledged as security. The following is a summary of the gross
revenues collected during the fiscal year ended June 30, 2016, that are pledged:
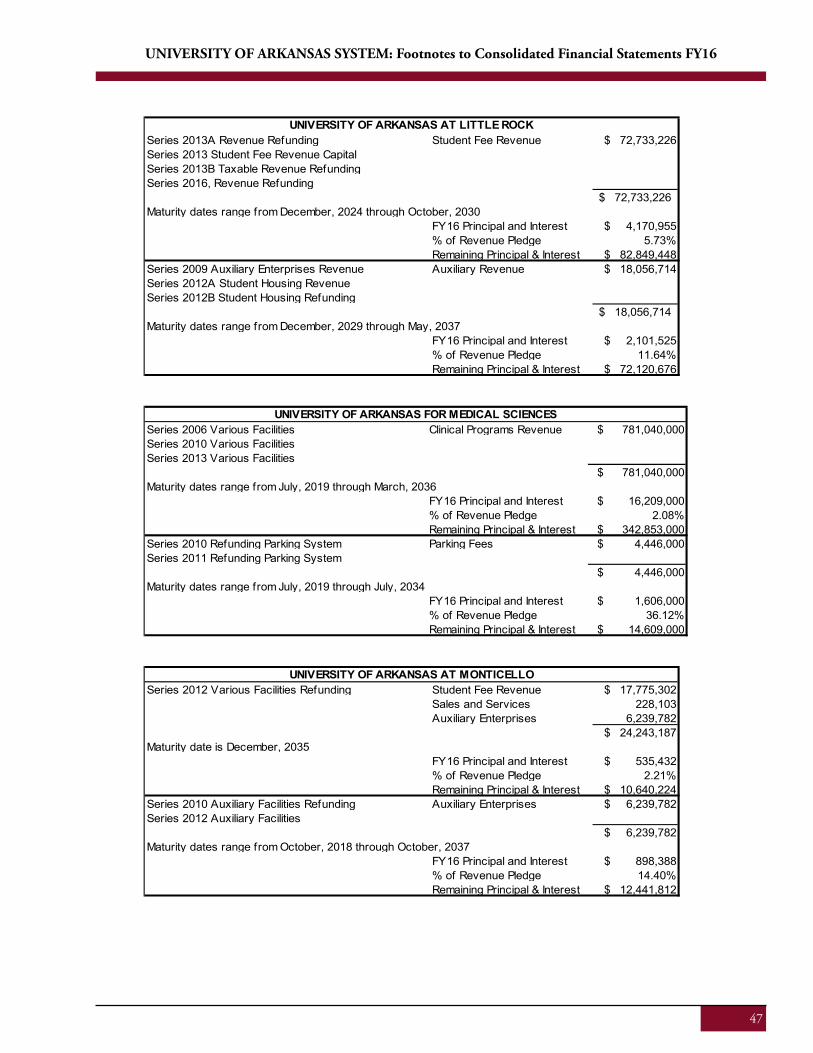
47
UNIVERSITY OF ARKANSAS SYSTEM: Footnotes to Consolidated Financial Statements FY16
Series 2013A Revenue Refunding Student Fee Revenue $ 72,733,226 Series 2013 Student Fee Revenue Capital Series 2013B Taxable Revenue RefundingSeries 2016, Revenue Refunding
$ 72,733,226 Maturity dates range from December, 2024 through October, 2030
FY16 Principal and Interest $ 4,170,955 % of Revenue Pledge 5.73%Remaining Principal & Interest $ 82,849,448
Series 2009 Auxiliary Enterprises Revenue Auxiliary Revenue $ 18,056,714 Series 2012A Student Housing RevenueSeries 2012B Student Housing Refunding
$ 18,056,714 Maturity dates range from December, 2029 through May, 2037
FY16 Principal and Interest $ 2,101,525 % of Revenue Pledge 11.64%Remaining Principal & Interest $ 72,120,676
UNIVERSITY OF ARKANSAS AT LITTLE ROCK
Series 2006 Various Facilities Clinical Programs Revenue $ 781,040,000 Series 2010 Various FacilitiesSeries 2013 Various Facilities
$ 781,040,000 Maturity dates range from July, 2019 through March, 2036
FY16 Principal and Interest $ 16,209,000 % of Revenue Pledge 2.08%Remaining Principal & Interest $ 342,853,000
Series 2010 Refunding Parking System Parking Fees $ 4,446,000 Series 2011 Refunding Parking System
$ 4,446,000 Maturity dates range from July, 2019 through July, 2034
FY16 Principal and Interest $ 1,606,000 % of Revenue Pledge 36.12%Remaining Principal & Interest $ 14,609,000
UNIVERSITY OF ARKANSAS FOR MEDICAL SCIENCES
Series 2012 Various Facilities Refunding Student Fee Revenue $ 17,775,302 Sales and Services 228,103Auxiliary Enterprises 6,239,782
$ 24,243,187 Maturity date is December, 2035
FY16 Principal and Interest $ 535,432 % of Revenue Pledge 2.21%Remaining Principal & Interest $ 10,640,224
Series 2010 Auxiliary Facilities Refunding Auxiliary Enterprises $ 6,239,782 Series 2012 Auxiliary Facilities
$ 6,239,782 Maturity dates range from October, 2018 through October, 2037
FY16 Principal and Interest $ 898,388 % of Revenue Pledge 14.40%Remaining Principal & Interest $ 12,441,812
UNIVERSITY OF ARKANSAS AT MONTICELLO
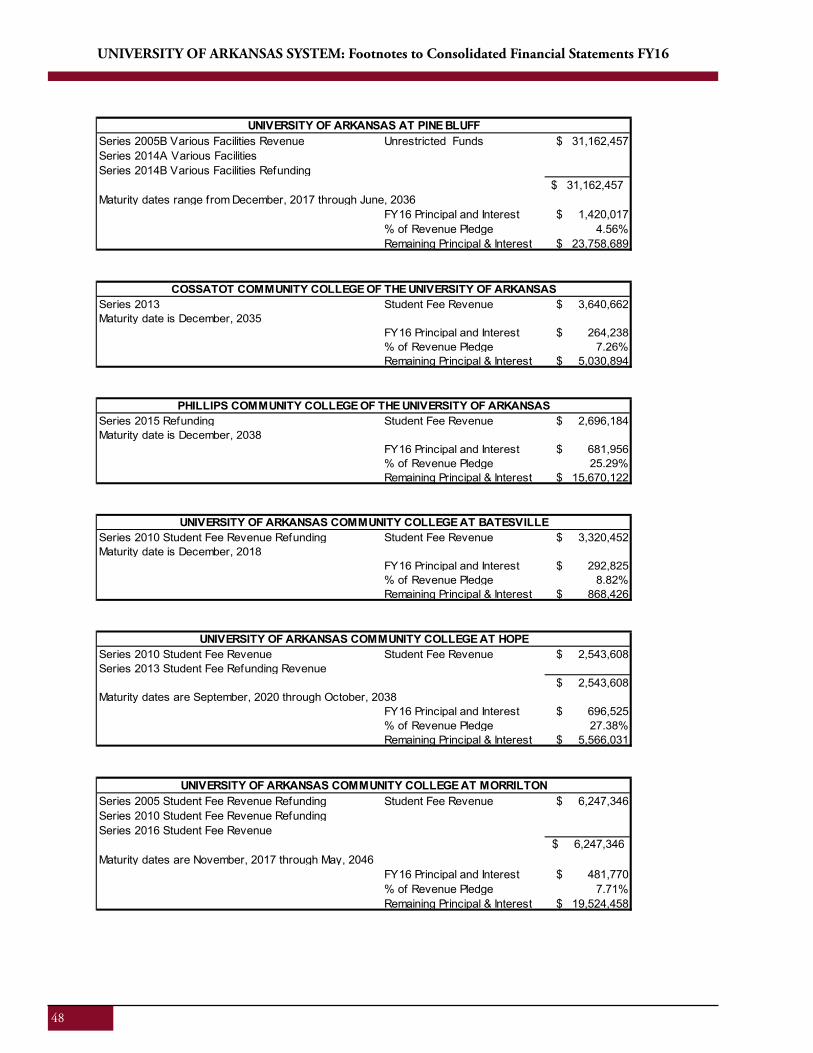
48
UNIVERSITY OF ARKANSAS SYSTEM: Footnotes to Consolidated Financial Statements FY16
Series 2005B Various Facilities Revenue Unrestricted Funds $ 31,162,457 Series 2014A Various FacilitiesSeries 2014B Various Facilities Refunding
$ 31,162,457 Maturity dates range from December, 2017 through June, 2036
FY16 Principal and Interest $ 1,420,017 % of Revenue Pledge 4.56%Remaining Principal & Interest $ 23,758,689
UNIVERSITY OF ARKANSAS AT PINE BLUFF
Series 2013 Student Fee Revenue $ 3,640,662 Maturity date is December, 2035
FY16 Principal and Interest $ 264,238 % of Revenue Pledge 7.26%Remaining Principal & Interest $ 5,030,894
COSSATOT COMMUNITY COLLEGE OF THE UNIVERSITY OF ARKANSAS
Series 2015 Refunding Student Fee Revenue $ 2,696,184 Maturity date is December, 2038
FY16 Principal and Interest $ 681,956 % of Revenue Pledge 25.29%Remaining Principal & Interest $ 15,670,122
PHILLIPS COMMUNITY COLLEGE OF THE UNIVERSITY OF ARKANSAS
Series 2010 Student Fee Revenue Refunding Student Fee Revenue $ 3,320,452 Maturity date is December, 2018
FY16 Principal and Interest $ 292,825 % of Revenue Pledge 8.82%Remaining Principal & Interest $ 868,426
UNIVERSITY OF ARKANSAS COMMUNITY COLLEGE AT BATESVILLE
Series 2010 Student Fee Revenue Student Fee Revenue $ 2,543,608 Series 2013 Student Fee Refunding Revenue
$ 2,543,608 Maturity dates are September, 2020 through October, 2038
FY16 Principal and Interest $ 696,525 % of Revenue Pledge 27.38%Remaining Principal & Interest $ 5,566,031
UNIVERSITY OF ARKANSAS COMMUNITY COLLEGE AT HOPE
Series 2005 Student Fee Revenue Refunding Student Fee Revenue $ 6,247,346 Series 2010 Student Fee Revenue RefundingSeries 2016 Student Fee Revenue
6,247,346$ Maturity dates are November, 2017 through May, 2046
FY16 Principal and Interest $ 481,770 % of Revenue Pledge 7.71%Remaining Principal & Interest $ 19,524,458
UNIVERSITY OF ARKANSAS COMMUNITY COLLEGE AT MORRILTON
49
UNIVERSITY OF ARKANSAS SYSTEM: Footnotes to Consolidated Financial Statements FY16
Refundings
Fayetteville Campus: On August 27, 2015, the University issued $36,675,000 in Various Facility Revenue Refunding Bonds, Series 2015C. The bonds with interest rates of 2.00% to 5.00% were issued to refund $45,945,000 of outstanding bonds dated March 2, 2005, with interest rates of 3.875% to 4.50%. Of the net bond proceeds and premiums of $40,255,610 and cash of $7,022,265 from the University, $46,957,841 was deposited into an escrow account to retire the bonds. Furthermore, $309,547 was used to pay the underwriter’s discount and the costs of issuance, with a residual amount of $10,487 remaining in the Series 2015C Bond Fund account. The refunding of the bonds was a current refunding, with all bonds being redeemed as of November 1, 2015. The refunding resulted in a difference between the reacquisition price and the net carrying amount of the old debt of $2,266,866. This difference, reported in the accompanying financial statements as deferred outflows of resources, will be amortized through the fiscal year 2022 using the straight-line method. The University completed the refunding to reduce its total debt service payments over the next seven years by $4,154,417 and to obtain an economic gain (difference between the present values of the old and new debt service payments) of $3,221,281. The escrow account was closed out when the refunded bonds were redeemed as of November 1, 2015, and therefore has no outstanding balance as of June 30, 2016.
On April 5, 2016, the University issued $93,590,000 in Various Facility Revenue Bonds, (Fayetteville Campus), Refunding and Improvement Series 2016A and $15,280,000 in Various Facility Revenue Bonds, (Fayetteville Campus), Refunding Series 2016B. The Series 2016A bonds, with interest rates of 3.0% to 5.0% were issued to provide funds to finance various construction and renovation projects on the University campus, and to refund $38,200,000 of outstanding bonds dated October 2, 2007, (Series 2007) with interest rates of 4.0% to 5.0%; and $35,545,000 of outstanding bonds dated August 1, 2008, (Series 2008A) with interest rates of 4.0% to 5.0%. Net bonds proceeds and premiums of $28,504,688 was available to finance construction of a civil engineering research and education center, a library storage building, campus entrance signs, intramural sports playing fields, and an addition to the Pat Walker Student Health
Center; to finance renovations of student housing; and to continue renovations of Kimpel Hall, and Discovery Hall. The Series 2016B bonds with interest rates of 0.87% to 3.35% were issued on a taxable basis to refund $13,500,000 of outstanding bonds dated August 1, 2008, (Series 2008B) with interest rates of 5.1% to 6.375%.
Net bond proceeds and premiums from Series 2016A and Series 2016B of $94,689,148 along with $1,873,821 of cash from the University was deposited into an escrow account to retire the bonds. The refunding of the bonds dated October 2, 2007, and all of the bonds dated August 1, 2008, was an advance refunding. The combined refunding resulted in a difference between the reacquisition price and the net carrying amount of the old debt of $5,764,322 for the Series 2016A bonds and $1,679,827 for the Series 2016B bonds. These differences, reported in the accompanying financial statements as deferred outflows of resources, will be amortized through the fiscal year 2039 for Series 2016A and fiscal year 2029 for Series 2016B. The University completed the refunding to reduce its total debt service payments over the next twenty-three years by $13,450,092 and to obtain an economic gain of $10,092,618. The escrow balance as of June 30, 2016, was $94,372,787. The bonds will have regularly scheduled principal and interest payments made from the escrow account until the bond call dates of November 1, 2017, for Series 2007 and November 1, 2018, for Series 2008A and Series 2008B, at which times the remaining balances of each defeased bond issue will be refunded. The remaining balance of the defeased bonds as of June 30, 2016, was $38,200,000 for Series 2007, $35,545,000 for Series 2008A, and $13,500,000 for Series 2008B.
On February 12, 2015, the University issued $70,360,000 in Various Facility Revenue Refunding Bonds, Series 2015A. The bonds, with interest rates of 2.0% to 5.0% were issued to refund $2,750,000 of outstanding bonds dated October 1, 2004 with interest rates of 2.0% to 4.375%, $13,510,000 of outstanding bonds dated March 1, 2005 with interest rates of 3.0% to 4.5%, and $60,475,000 of outstanding bonds dated June 1, 2006 with interest rates of $4.0% to 5.0%. Net bond proceeds and premiums of $81,714,224 and cash of $1,009,170 from the University were deposited into an escrow account to retire the bonds. The refunding of the bonds dated March 1, 2005 and June 1, 2006 was an advance refunding. The combined refunding resulted
50
UNIVERSITY OF ARKANSAS SYSTEM: Footnotes to Consolidated Financial Statements FY16
in a difference between the reacquisition price and the net carrying amount of the old debt of $5,083,047. This difference, reported in the accompanying financial statements as deferred outflows of resources, will be amortized through the fiscal year 2037 using the straight-line method. The University completed the refunding to reduce its total debt service payments over the next twenty-three years by $8,513,389 and to obtain an economic gain of $7,563,242. The escrow balance as of June 30, 2016 was $60,457,080. The refunding of the bonds dated October 1, 2004 was a current refunding and the bonds were called on March 15, 2015. The bonds dated March 1, 2005 continued to have regularly scheduled principal and interest payments made from the escrow account until the bond call date of November 1, 2015, at which time the remaining balance was refunded. The bonds dated June 1, 2006 will continue to have regularly scheduled principal and interest payments made from the escrow account until the bond call date of November 1, 2016, at which time the remaining balance will be refunded. The remaining balance of the defeased bonds at June 30, 2016 was $59,140,000.
On February 12, 2015, the University issued $14,180,000 in Athletic Facilities Revenue Refunding Bonds, Series 2015. The bonds, with interest rates of 2.0% to 5.0%, were issued to refund $4,770,000 of outstanding bonds dated June 1, 2006, with interest rates of 4.0% to 4.375%, and $10,475,000 of outstanding bonds dated June 29, 2011, with interest rates of 2.0% to 4.895%. Net bond proceeds and premiums of $16,222,900 and cash of $265,723 from the University were deposited into the advance refunding fund to retire the bonds. The combined refunding resulted in a difference between the reacquisition price and the net carrying amount of the old debt of $134,986. This difference, reported in the accompanying financial statements as deferred outflows of resources, will be amortized through the fiscal year 2023 using the straight-line method. The University completed the refunding to reduce its total debt service payments over the next eight years by $1,413,277 and to obtain an economic gain of $1,084,087. The escrow balance as of June 30, 2016, was $15,030,466. The bonds dated June 1, 2006, will continue to have regularly scheduled principal and interest payments made from the escrow account until the bond call date of September 15, 2016. The bonds dated June 29, 2011, were not advance refunded in total. As of June 30, 2016, there was a balance of $2,805,000 outstanding that was
not refunded. These bonds will continue to be paid normally through September 15, 2016. The refunded bonds dated June 29, 2011, will continue to have regularly scheduled interest payments made from the escrow account until the bond call date of September 15, 2016, at which date the principal will be refunded. The remaining balance of the defeased bonds at June 30, 2016, was $14,730,000.
Little Rock Campus: On February 24, 2016, the University issued $22,475,000 in Series 2016 Enterprises Refunding Revenue Bonds, with interest rates of 2% to 5% to advance refund $25,250,000 of the Series 2009 Capital Improvement Revenue Bonds, with interest rates of 4% to 5%. Bond proceeds and premium of $27,180,955 were deposited into an escrow account with the trustee for defeasance of the prior bond. The combined refunding resulted in a difference between the reacquisition price and the net carrying amount of the old debt of $644,478. This difference, reported in the accompanying financial statements as deferred outflows of resources, will be amortized through the fiscal year 2030 using the straight-line method. The University completed the refunding to reduce its total debt service requirements by $2,314,066 over the next fourteen years and to obtain an economic gain (difference between the present value of the debt service payments on the old and new debt) of $2,170,844. The bonds will be fully paid by October 1, 2017. The balance in the escrow account at June 30, 2016, was $26,632,704, and the remaining balance of the defeased bonds was $25,250,000.
On April 6, 2016, the University issued $24,490,000 in Series 2016 Auxiliary Revenue Refunding Bonds, with interest rates of 2% to 5% to advance refund $25,600,000 of the Series 2009 Auxiliary Revenue Bonds, with interest rates of 4% to 5%. Bond proceeds and premium of $28,581,504 were deposited into an escrow account with the trustee for defeasance of the prior bond. The combined refunding resulted in a difference between the reacquisition price and the net carrying amount of the old debt of $2,543,643. This difference, reported in the accompanying financial statements as deferred outflows of resources, will be amortized through the fiscal year 2035 using the straight-line method. The University completed the refunding to reduce its total debt service requirements by $1,736,111 over the next nineteen years and to obtain an economic gain (difference between the present value of the debt service payments on the
51
UNIVERSITY OF ARKANSAS SYSTEM: Footnotes to Consolidated Financial Statements FY16
old and new debt) of $1,152,088. The bonds will be fully paid by October 1, 2019. The balance in the escrow account at June 30, 2016, was $28,581,504, and the remaining balance of the defeased bonds was $25,600,000.
Medical Sciences Campus: On December 17, 2014, UAMS issued revenue refunding bonds, Series 2014, of $86,035,000 (par value) with an interest rate of 2.52% to 3.17% to advance refund Various Facility Revenue Bond Series 2006 with remaining interest rates of 4.8% to 5.0% and a par value of $91,550,000. The 2006 bonds mature March 2036. The revenue refunding bonds were issued at a premium of $12,713,000 and, after paying issuance costs of $211,000 and underwriter’s discount of $499,000. The net proceeds were $98,067,000. The net proceeds from the issuance of the revenue refunding bonds were used to purchase U.S. government securities to provide debt service payments. The advance refunding met the requirements of an in-substance debt defeasance and the 2006 Series bonds were removed from UAMS financial statements. As a result of the advance refunding, UAMS reduced its total debt service requirements by $10,012,000 which resulted in an economic gain (difference between the present value of the debt service payments on the old and new debt) of $9,313,000. Principal payments are made annually until 2036. Interest payments are made semi-annually. There was a deferred refunding loss of $1,554,000 on the transaction which will be amortized as a component of interest expense until July 2036. The escrow balance was closed as of June 30, 2016.
Pine Bluff Campus: On June 1, 2014, the University issued $16,970,000 in Various Facilities Revenue Refunding Bonds, Series 2014, with interest rates of 2% to 5% to advance refund Various Facility Revenue Refunding and Construction Bonds, Series 2005A. The Series 2005A bonds mature on December 1, 2036, and are callable on December 1, 2015. The revenue refunding bonds were issued at a premium of $1,105,422 and after paying issuance costs of
$86,000 and underwriter’s discount of $140,002, the net proceeds were $17,849,420. Accrued interest of $46,780 will be utilized for an interest payment on the new Series 2014 bonds in December 2014. The net proceeds from the issuance of the bonds were deposited into a special trust fund and will be used to provide debt service payments until the term bonds are called on December 1, 2015. As a result of the advance refunding, the University reduced its total debt service requirements by $1,900,872, which resulted in an economic gain (difference between the present value of the debt service payments on the old and new debt) of $1,397,584. The escrow account was closed as of June 30, 2016.
Phillips Campus: On April 22, 2015, the University issued Student Fee Refunding Revenue Bonds, Series 2015, in the amount of $11,270,000 with interest rates of 2.0% to 4.0%. The purpose of this issue was to refund $10,825,000 remaining from the Student Fee Revenue Bonds, Series 2009, which carried interest rates of 3.0% to 5.2%. Bond proceeds and premium of $11,363,995 (after payment of debt issuance costs of $88,411 and underwriter’s discount of $84,525), along with remaining debt service reserve funds of $395,770 were deposited into the escrow fund to retire the Series 2009 bonds on December 1, 2016. The advance refunding resulted in a difference between the reacquisition price and the net carrying amount of the old debt of $1,022,966. This difference is reported in the accompanying financial statements as deferred outflows of resources and will be amortized over the remaining life of the bonds through 2038 using the straight-line method. The University accomplished the refunding to reduce its total debt service payments by $2,168,622 and to obtain an economic gain (difference between the present values of the old and new debt service payments) of $1,338,117. The balance in the escrow account at June 30, 2016, was $10,795,299, and the remaining balance of the defeased bonds was $10,510,000.
52
UNIVERSITY OF ARKANSAS SYSTEM: Footnotes to Consolidated Financial Statements FY16
Note 9: Commitments
The University has contracted for the construction and renovations of several facilities. At June 30, 2016, the estimated remaining costs to complete these facilities are shown below.
The University has entered into various operating leases for buildings and equipment. It is expected that in the normal course of business such leases will continue to be required. Total operating leases paid in the fiscal year ended June 30, 2016, were $13,201,238.
Below are the scheduled payments for each of the five succeeding fiscal years and thereafter.
Note 10: Short-Term Borrowing
The GASB Statement No. 38, Certain Financial Statement Note Disclosures, states that governments should provide details about short-term debt activity during the year, even if no short-term debt is outstanding at year-end. The University had no short-term debt activity during the fiscal year, nor is there any outstanding balance of short-term debt as of June 30, 2016.
ContractCampus Balance
UAF $ 47,553,578 UAFS 1,406,856 UALR 554,152UAM 740,555UAMS 9,395,000UAPB 797,241PCCUA 151,398UACCH 137,842UACCM 13,725,009
$ 74,461,631
Year Ended June 30, Amount2017 8,724,987$ 2018 5,134,094 2019 2,228,577 2020 1,144,636 2021 872,351
2022-2026 2,210,814
Operating Leases
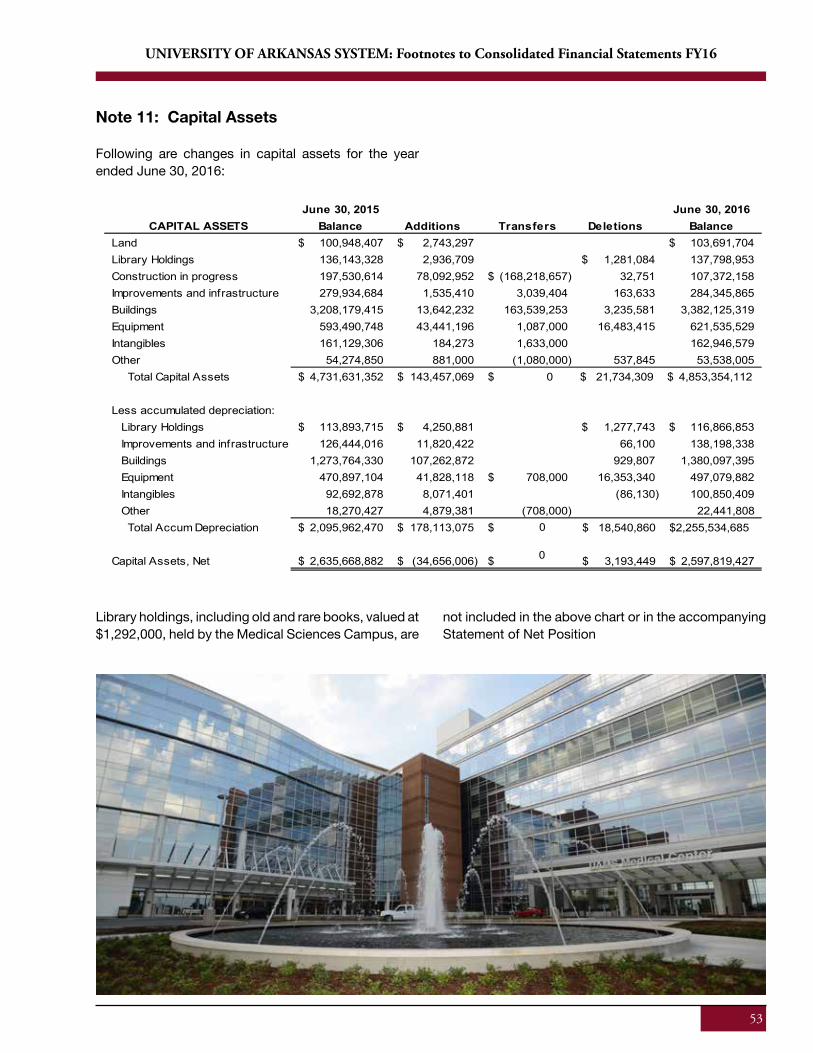
53
UNIVERSITY OF ARKANSAS SYSTEM: Footnotes to Consolidated Financial Statements FY16
Note 11: Capital Assets
Following are changes in capital assets for the year ended June 30, 2016:
Library holdings, including old and rare books, valued at $1,292,000, held by the Medical Sciences Campus, are
not included in the above chart or in the accompanying Statement of Net Position
June 30, 2015 June 30, 2016CAPITAL ASSETS Balance Additions Transfers Deletions Balance
Land 100,948,407$ 2,743,297$ 103,691,704$ Library Holdings 136,143,328 2,936,709 1,281,084$ 137,798,953 Construction in progress 197,530,614 78,092,952 (168,218,657)$ 32,751 107,372,158 Improvements and infrastructure 279,934,684 1,535,410 3,039,404 163,633 284,345,865 Buildings 3,208,179,415 13,642,232 163,539,253 3,235,581 3,382,125,319 Equipment 593,490,748 43,441,196 1,087,000 16,483,415 621,535,529 Intangibles 161,129,306 184,273 1,633,000 162,946,579 Other 54,274,850 881,000 (1,080,000) 537,845 53,538,005 Total Capital Assets 4,731,631,352$ 143,457,069$ $ 0 $ 21,734,309 $ 4,853,354,112
Less accumulated depreciation: Library Holdings 113,893,715$ 4,250,881$ 1,277,743$ 116,866,853$ Improvements and infrastructure 126,444,016 11,820,422 66,100 138,198,338 Buildings 1,273,764,330 107,262,872 929,807 1,380,097,395 Equipment 470,897,104 41,828,118 708,000$ 16,353,340 497,079,882
Intangibles Intangibles 92,692,878 8,071,401 (86,130) 100,850,409 Other 18,270,427 4,879,381 (708,000) 22,441,808 Total Accum Depreciation 2,095,962,470$ 178,113,075$ $
Capital Assets, Net 2,635,668,882$ (34,656,006)$ $
$ 18,540,860 $2,255,534,685
$ 3,193,449 $ 2,597,819,427
0
0
54
UNIVERSITY OF ARKANSAS SYSTEM: Footnotes to Consolidated Financial Statements FY16
Note 12: Risk Management
The University of Arkansas Risk Management Program provides insurance coverage for all campuses within the University of Arkansas System with the exception of the Fort Smith campus. The role of the System Office is to analyze and recommend insurance coverage, but it is ultimately up to each campus to inform the System Office regarding their specific coverage requirements.
Property coverage is insured through FM Global with a $100,000 deductible at the Fayetteville, Medical Sciences, and Little Rock campuses. The other covered campuses have a $50,000 deductible. The FM Global policy also contains earthquake/flood and domestic/foreign terrorism coverage. Additionally, the Fayetteville, Medical Sciences, Phillips, and Morrilton campuses have business interruption coverage with FM Global.
Auto coverage, through Cypress Insurance, has a physical damage deductible of $1,000 and provides coverage against liability losses up to $1,000,000 per occurrence.
The Medical Sciences campus maintains malpractice insurance for certain employees under a claims-made policy. The Fort Smith campus acquires its own property insurance through Alliant Property Insurance ($25,000 deductible) and auto insurance through Cypress Insurance ($5,000 deductible).
The University does not purchase general liability, errors or admissions, or tort immunity for claims arising from third-party losses on University property as the University of Arkansas has sovereign immunity against such claims. Claims against the University for such losses are heard before the State Claims Commission. In such cases where the University enters into a lease agreement to hold a function at a location not owned by the University or for special events off-campus, general liability coverage may be purchased for such functions.
The University maintains worker’s compensation coverage through the State of Arkansas program. Premiums are paid through payroll and are based on a formula calculated by the Arkansas Department of Finance and Administration. The types of benefits and expenditures that are paid include the following:
medical expenses, hospital expenses, death benefits, disability and claimant’s attorney fees.
Additionally, the University participates in the State of Arkansas Fidelity Bond Program for claims of employee dishonesty. This program has a limit of $300,000 recovery per occurrence with a $2,500 deductible. Premiums are paid annually via a fund transfer from state appropriations to the Arkansas Department of Finance and Administration.
There have been no reductions in insurance coverage from the prior fiscal year. Settled claims resulting from these risks have not exceeded commercial insurance coverage in any of the past three fiscal years. Note 13: Employee Benefits
Insurance PlansThe Board of Trustees of the University of Arkansas System sponsors self-funded health (including prescription coverage) and dental benefit plans for University of Arkansas System (the University) employees and their eligible dependents. All campuses participate in the health plan. All campuses, except CCCUA, PCCUA, and UACCH, participate in the dental plan. The plans are also offered to employees of the University of Arkansas Winthrop Rockefeller Institute, the University of Arkansas Foundation, Inc., the Razorback Foundation, Inc., the Walton Arts Center, and the University of Arkansas Technology Development Foundation. At June 30, 2016, a total of 17,058 active employees, former employees, and pre-65 retirees were participants in the health plan. As of June 30, 2016, the University offers two different health plans: Classic (HMO) and Point of Service (POS). Participating campuses pay anywhere from 40% to 98% of the Classic Plan premium and 35% to 91% of the Point of Service Plan premium. Each campus makes its contribution determination based on budget considerations. Retirees and former employees, through COBRA, participate on a fully contributory basis. A total of 17,674 active employees, former employees, and retirees were participants in the dental plan as of June 30, 2016. The University pays 0% to 51% of the total premium for full-time active employees, while retirees and former employees, through COBRA, participate on a fully contributory basis.
55
UNIVERSITY OF ARKANSAS SYSTEM: Footnotes to Consolidated Financial Statements FY16
Both plans are accounted for on the accrual basis. No acquisition costs were capitalized at the onset of the plan. The System Administration estimates the medical and pharmacy claims liability to be $18,037,100 at June 30, 2016. This liability is established for incurred but not paid (IBNP) claims, and includes a related accrual for claim adjustment expenses, which are expenses incurred in the ultimate settlement of the claim. The claims and claims adjustment accrual for health and pharmacy is based on the calculation prepared by Sibson Consulting.
The System Administration estimates the dental claims liability to be $375,200 at June 30, 2016. This liability is established for incurred but not paid (IBNP) claims. The IBNP claims liability includes a related accrual for claim adjustment expenses, which are expenses incurred in the ultimate settlement of the claim. The claims and claims adjustment accrual for dental is based on the calculation prepared by Sibson Consulting.
The System Administration purchases specific reinsurance from United Healthcare-BP to reduce its
exposure to large claims. In a fiscal year, after paying claims of more than $1,000,000 for any one covered individual, the University pays an aggregating specific deductible of $125,000, whether from one or more covered individuals also exceeding $1,000,000 in paid claims, before being reimbursed from the reinsurance company.
The plan has not purchased any annuity contracts on behalf of claimants. If needed, the University would make arrangements through its reinsurance carrier.
The funding levels for the Plan were established based upon anticipated year-end loss ratios of 95%. As of June 30, 2016, the loss ratio for the health plan was 93% and the loss ratio for the dental plan was 94%.
The System Administration retains and accounts for all of the risk financing associated with the self-insurance plan’s activities as defined by GASB Statement No. 10, Accounting and Financial Reporting for Risk Financing and Related Insurance Issues.
FY16 FY15Unpaid claims and claim adjustment expenses at beginning of year 20,800,000$ 14,524,000$
Incurred claims and claim adjustment expenses:Provision for insured events of the current year 151,039,946 155,077,772Adjustment in provision for insured events of prior years (5,710,599) 3,534,216Total incurred claims and claim adjustment expenses 145,329,347 158,611,988
Payments:Claims and claim adjustment expenses attributable to insured events of the current year 132,627,646 134,277,772Claims and claim adjustment expenses attributable to insured events of prior years 15,089,401 18,058,216Total Payments 147,717,047 152,335,988
Total unpaid claims and claim adjustment expenses at end of year 18,412,300$ 20,800,000$
The liability for future insurance claims includes health, pharmacy and dental incurred but not paid (IBNP) claims/claim adjustment expenses only.
Reconciliation of Changes in the Liability for Future Insurance Claims
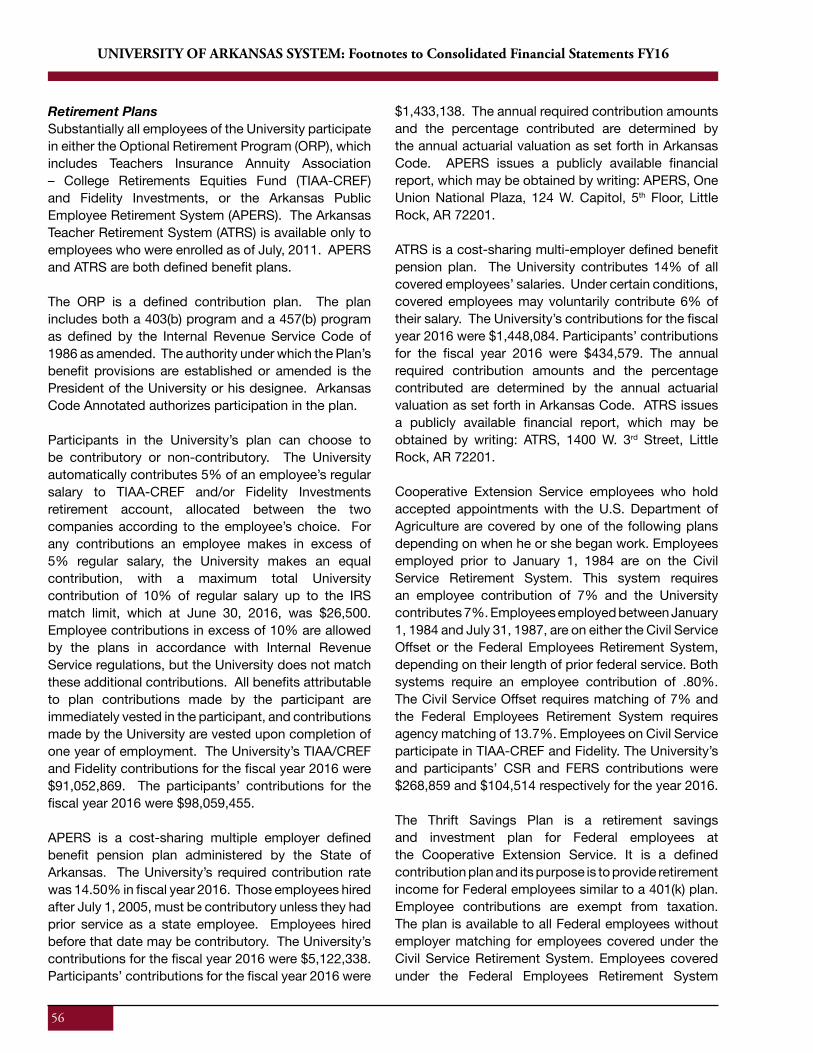
56
UNIVERSITY OF ARKANSAS SYSTEM: Footnotes to Consolidated Financial Statements FY16
Retirement PlansSubstantially all employees of the University participate in either the Optional Retirement Program (ORP), which includes Teachers Insurance Annuity Association – College Retirements Equities Fund (TIAA-CREF) and Fidelity Investments, or the Arkansas Public Employee Retirement System (APERS). The Arkansas Teacher Retirement System (ATRS) is available only to employees who were enrolled as of July, 2011. APERS and ATRS are both defined benefit plans.
The ORP is a defined contribution plan. The plan includes both a 403(b) program and a 457(b) program as defined by the Internal Revenue Service Code of 1986 as amended. The authority under which the Plan’s benefit provisions are established or amended is the President of the University or his designee. Arkansas Code Annotated authorizes participation in the plan.
Participants in the University’s plan can choose to be contributory or non-contributory. The University automatically contributes 5% of an employee’s regular salary to TIAA-CREF and/or Fidelity Investments retirement account, allocated between the two companies according to the employee’s choice. For any contributions an employee makes in excess of 5% regular salary, the University makes an equal contribution, with a maximum total University contribution of 10% of regular salary up to the IRS match limit, which at June 30, 2016, was $26,500. Employee contributions in excess of 10% are allowed by the plans in accordance with Internal Revenue Service regulations, but the University does not match these additional contributions. All benefits attributable to plan contributions made by the participant are immediately vested in the participant, and contributions made by the University are vested upon completion of one year of employment. The University’s TIAA/CREF and Fidelity contributions for the fiscal year 2016 were $91,052,869. The participants’ contributions for the fiscal year 2016 were $98,059,455.
APERS is a cost-sharing multiple employer defined benefit pension plan administered by the State of Arkansas. The University’s required contribution rate was 14.50% in fiscal year 2016. Those employees hired after July 1, 2005, must be contributory unless they had prior service as a state employee. Employees hired before that date may be contributory. The University’s contributions for the fiscal year 2016 were $5,122,338. Participants’ contributions for the fiscal year 2016 were
$1,433,138. The annual required contribution amounts and the percentage contributed are determined by the annual actuarial valuation as set forth in Arkansas Code. APERS issues a publicly available financial report, which may be obtained by writing: APERS, One Union National Plaza, 124 W. Capitol, 5th Floor, Little Rock, AR 72201.
ATRS is a cost-sharing multi-employer defined benefit pension plan. The University contributes 14% of all covered employees’ salaries. Under certain conditions, covered employees may voluntarily contribute 6% of their salary. The University’s contributions for the fiscal year 2016 were $1,448,084. Participants’ contributions for the fiscal year 2016 were $434,579. The annual required contribution amounts and the percentage contributed are determined by the annual actuarial valuation as set forth in Arkansas Code. ATRS issues a publicly available financial report, which may be obtained by writing: ATRS, 1400 W. 3rd Street, Little Rock, AR 72201.
Cooperative Extension Service employees who hold accepted appointments with the U.S. Department of Agriculture are covered by one of the following plans depending on when he or she began work. Employees employed prior to January 1, 1984 are on the Civil Service Retirement System. This system requires an employee contribution of 7% and the University contributes 7%. Employees employed between January 1, 1984 and July 31, 1987, are on either the Civil Service Offset or the Federal Employees Retirement System, depending on their length of prior federal service. Both systems require an employee contribution of .80%. The Civil Service Offset requires matching of 7% and the Federal Employees Retirement System requires agency matching of 13.7%. Employees on Civil Service participate in TIAA-CREF and Fidelity. The University’s and participants’ CSR and FERS contributions were $268,859 and $104,514 respectively for the year 2016.
The Thrift Savings Plan is a retirement savings and investment plan for Federal employees at the Cooperative Extension Service. It is a defined contribution plan and its purpose is to provide retirement income for Federal employees similar to a 401(k) plan. Employee contributions are exempt from taxation. The plan is available to all Federal employees without employer matching for employees covered under the Civil Service Retirement System. Employees covered under the Federal Employees Retirement System
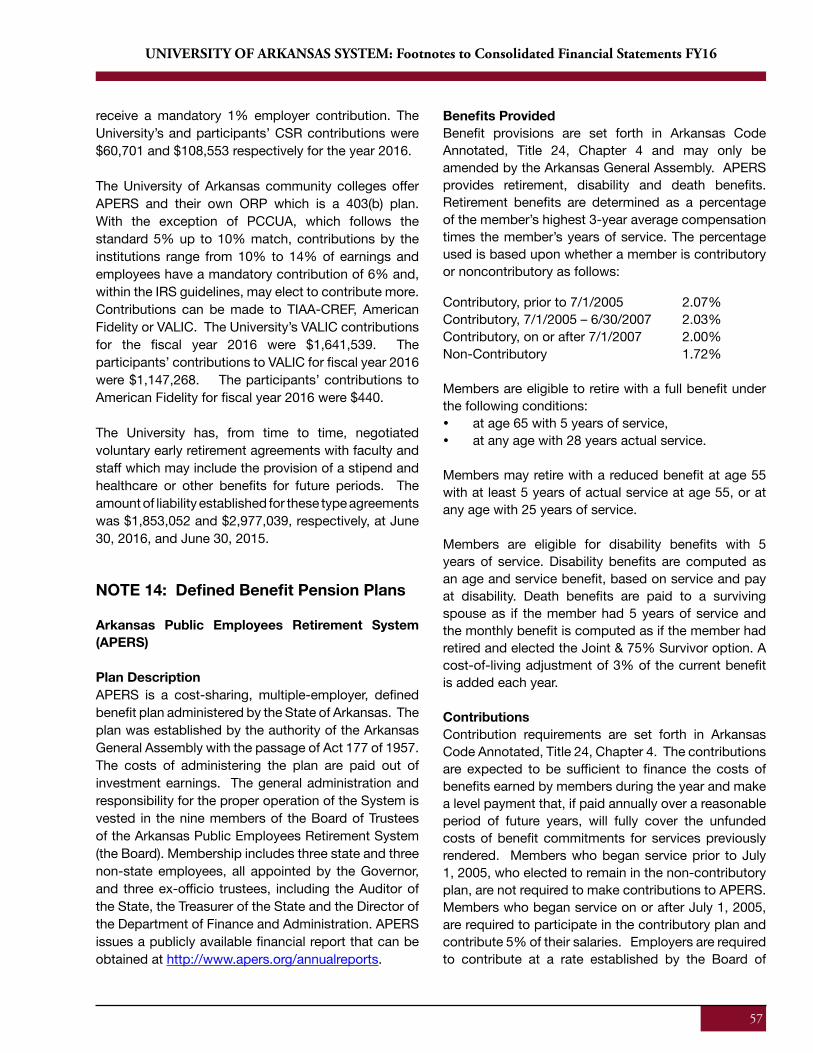
57
UNIVERSITY OF ARKANSAS SYSTEM: Footnotes to Consolidated Financial Statements FY16
receive a mandatory 1% employer contribution. The University’s and participants’ CSR contributions were $60,701 and $108,553 respectively for the year 2016.
The University of Arkansas community colleges offer APERS and their own ORP which is a 403(b) plan. With the exception of PCCUA, which follows the standard 5% up to 10% match, contributions by the institutions range from 10% to 14% of earnings and employees have a mandatory contribution of 6% and, within the IRS guidelines, may elect to contribute more. Contributions can be made to TIAA-CREF, American Fidelity or VALIC. The University’s VALIC contributions for the fiscal year 2016 were $1,641,539. The participants’ contributions to VALIC for fiscal year 2016 were $1,147,268. The participants’ contributions to American Fidelity for fiscal year 2016 were $440.
The University has, from time to time, negotiated voluntary early retirement agreements with faculty and staff which may include the provision of a stipend and healthcare or other benefits for future periods. The amount of liability established for these type agreements was $1,853,052 and $2,977,039, respectively, at June 30, 2016, and June 30, 2015.
NOTE 14: Defined Benefit Pension Plans
Arkansas Public Employees Retirement System (APERS)
Plan DescriptionAPERS is a cost-sharing, multiple-employer, defined benefit plan administered by the State of Arkansas. The plan was established by the authority of the Arkansas General Assembly with the passage of Act 177 of 1957. The costs of administering the plan are paid out of investment earnings. The general administration and responsibility for the proper operation of the System is vested in the nine members of the Board of Trustees of the Arkansas Public Employees Retirement System (the Board). Membership includes three state and three non-state employees, all appointed by the Governor, and three ex-officio trustees, including the Auditor of the State, the Treasurer of the State and the Director of the Department of Finance and Administration. APERS issues a publicly available financial report that can be obtained at http://www.apers.org/annualreports.
Benefits ProvidedBenefit provisions are set forth in Arkansas Code Annotated, Title 24, Chapter 4 and may only be amended by the Arkansas General Assembly. APERS provides retirement, disability and death benefits. Retirement benefits are determined as a percentage of the member’s highest 3-year average compensation times the member’s years of service. The percentage used is based upon whether a member is contributory or noncontributory as follows:
Contributory, prior to 7/1/2005 2.07% Contributory, 7/1/2005 – 6/30/2007 2.03% Contributory, on or after 7/1/2007 2.00%Non-Contributory 1.72%
Members are eligible to retire with a full benefit under the following conditions: at age 65 with 5 years of service, at any age with 28 years actual service.
Members may retire with a reduced benefit at age 55 with at least 5 years of actual service at age 55, or at any age with 25 years of service.
Members are eligible for disability benefits with 5 years of service. Disability benefits are computed as an age and service benefit, based on service and pay at disability. Death benefits are paid to a surviving spouse as if the member had 5 years of service and the monthly benefit is computed as if the member had retired and elected the Joint & 75% Survivor option. A cost-of-living adjustment of 3% of the current benefit is added each year.
ContributionsContribution requirements are set forth in Arkansas Code Annotated, Title 24, Chapter 4. The contributions are expected to be sufficient to finance the costs of benefits earned by members during the year and make a level payment that, if paid annually over a reasonable period of future years, will fully cover the unfunded costs of benefit commitments for services previously rendered. Members who began service prior to July 1, 2005, who elected to remain in the non-contributory plan, are not required to make contributions to APERS. Members who began service on or after July 1, 2005, are required to participate in the contributory plan and contribute 5% of their salaries. Employers are required to contribute at a rate established by the Board of
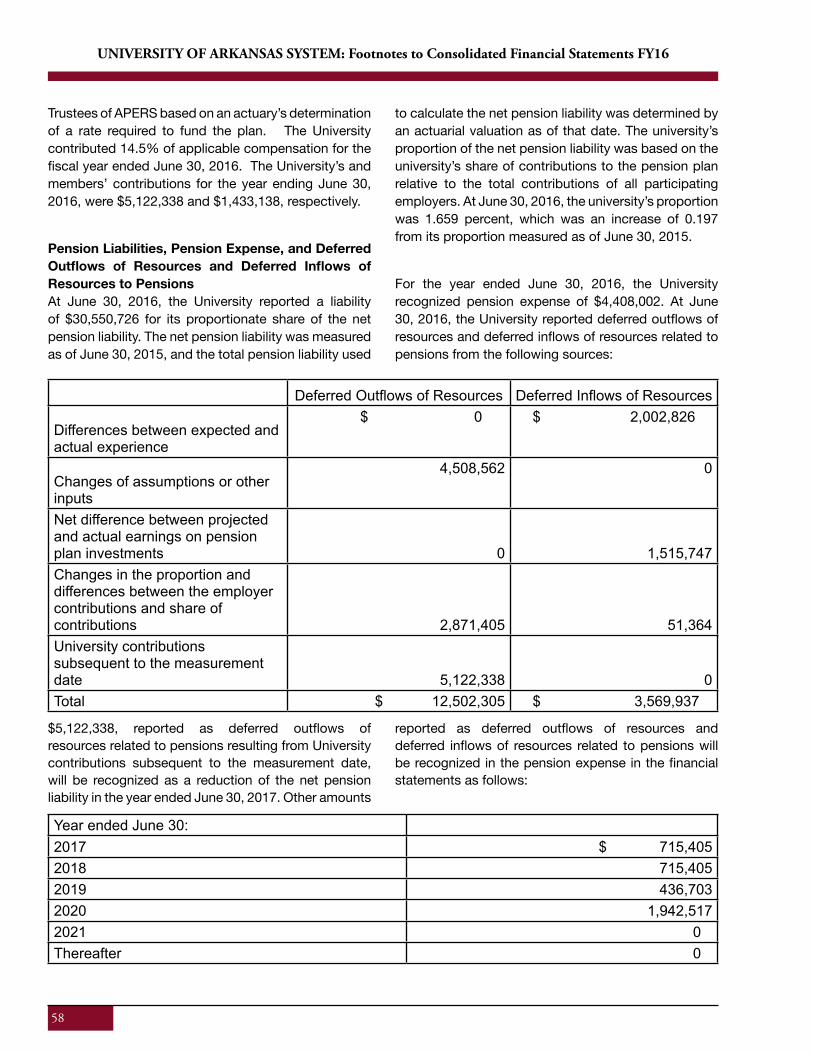
58
UNIVERSITY OF ARKANSAS SYSTEM: Footnotes to Consolidated Financial Statements FY16
Trustees of APERS based on an actuary’s determination of a rate required to fund the plan. The University contributed 14.5% of applicable compensation for the fiscal year ended June 30, 2016. The University’s and members’ contributions for the year ending June 30, 2016, were $5,122,338 and $1,433,138, respectively.
Pension Liabilities, Pension Expense, and Deferred Outflows of Resources and Deferred Inflows of Resources to PensionsAt June 30, 2016, the University reported a liability of $30,550,726 for its proportionate share of the net pension liability. The net pension liability was measured as of June 30, 2015, and the total pension liability used
to calculate the net pension liability was determined by an actuarial valuation as of that date. The university’s proportion of the net pension liability was based on the university’s share of contributions to the pension plan relative to the total contributions of all participating employers. At June 30, 2016, the university’s proportion was 1.659 percent, which was an increase of 0.197 from its proportion measured as of June 30, 2015.
For the year ended June 30, 2016, the University recognized pension expense of $4,408,002. At June 30, 2016, the University reported deferred outflows of resources and deferred inflows of resources related to pensions from the following sources:
Deferred Outflows of Resources Deferred Inflows of Resources
Differences between expected and actual experience
$ 0 $ 2,002,826
Changes of assumptions or other inputs
4,508,562 0
Net difference between projected and actual earnings on pension plan investments 0 1,515,747 Changes in the proportion and differences between the employer contributions and share of contributions 2,871,405 51,364 University contributions subsequent to the measurement date 5,122,338 0Total $ 12,502,305 $ 3,569,937
$5,122,338, reported as deferred outflows of resources related to pensions resulting from University contributions subsequent to the measurement date, will be recognized as a reduction of the net pension liability in the year ended June 30, 2017. Other amounts
reported as deferred outflows of resources and deferred inflows of resources related to pensions will be recognized in the pension expense in the financial statements as follows:
Year ended June 30:2017 $ 715,405 2018 715,4052019 436,703 2020 1,942,517 2021 0Thereafter 0
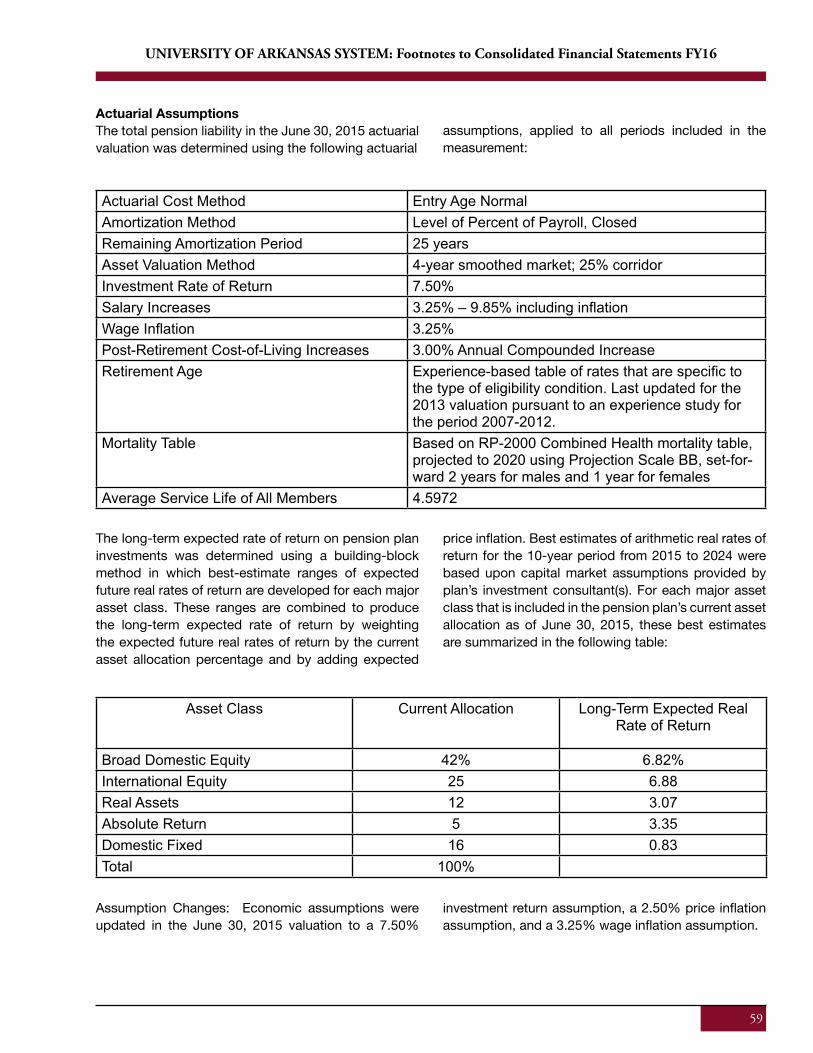
59
UNIVERSITY OF ARKANSAS SYSTEM: Footnotes to Consolidated Financial Statements FY16
Actuarial AssumptionsThe total pension liability in the June 30, 2015 actuarial valuation was determined using the following actuarial
assumptions, applied to all periods included in the measurement:
Actuarial Cost Method Entry Age Normal Amortization Method Level of Percent of Payroll, Closed Remaining Amortization Period 25 yearsAsset Valuation Method 4-year smoothed market; 25% corridorInvestment Rate of Return 7.50% Salary Increases 3.25% – 9.85% including inflationWage Inflation 3.25% Post-Retirement Cost-of-Living Increases 3.00% Annual Compounded Increase Retirement Age Experience-based table of rates that are specific to
the type of eligibility condition. Last updated for the 2013 valuation pursuant to an experience study for the period 2007-2012.
Mortality Table Based on RP-2000 Combined Health mortality table, projected to 2020 using Projection Scale BB, set-for-ward 2 years for males and 1 year for females
Average Service Life of All Members 4.5972
The long-term expected rate of return on pension plan investments was determined using a building-block method in which best-estimate ranges of expected future real rates of return are developed for each major asset class. These ranges are combined to produce the long-term expected rate of return by weighting the expected future real rates of return by the current asset allocation percentage and by adding expected
price inflation. Best estimates of arithmetic real rates of return for the 10-year period from 2015 to 2024 were based upon capital market assumptions provided by plan’s investment consultant(s). For each major asset class that is included in the pension plan’s current asset allocation as of June 30, 2015, these best estimates are summarized in the following table:
Asset Class Current Allocation Long-Term Expected Real Rate of Return
Broad Domestic Equity 42% 6.82%International Equity 25 6.88Real Assets 12 3.07Absolute Return 5 3.35Domestic Fixed 16 0.83Total 100%
Assumption Changes: Economic assumptions were updated in the June 30, 2015 valuation to a 7.50%
investment return assumption, a 2.50% price inflation assumption, and a 3.25% wage inflation assumption.
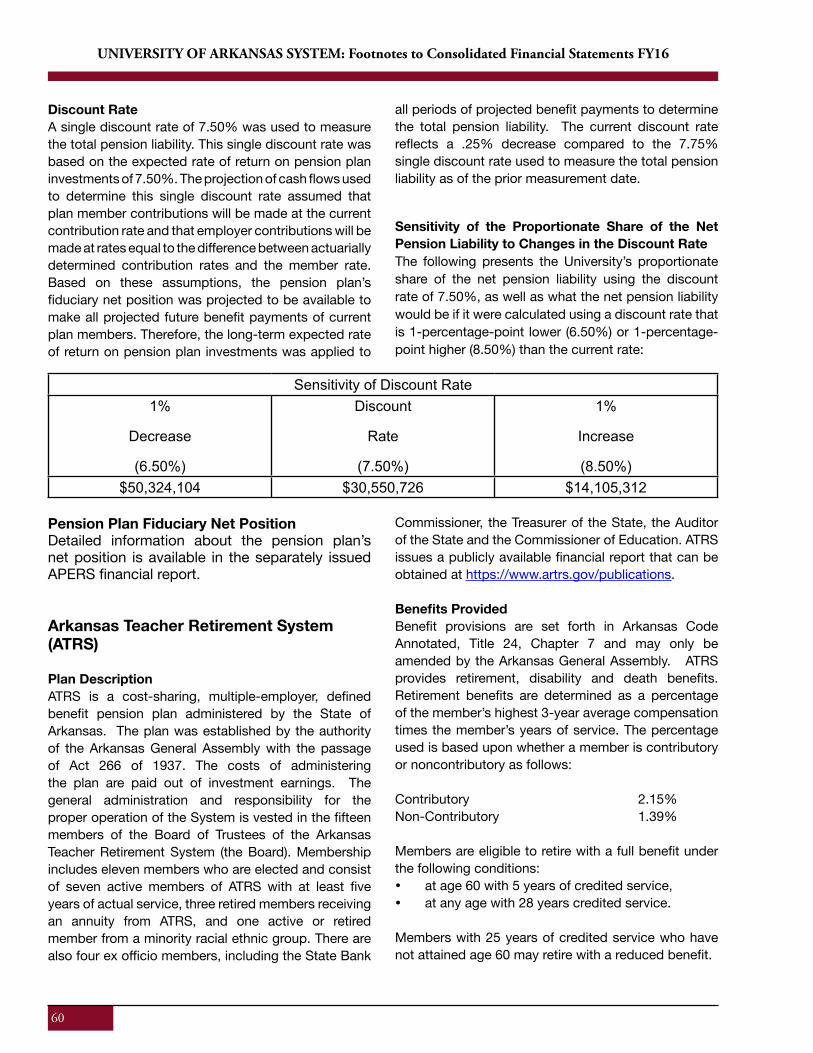
60
UNIVERSITY OF ARKANSAS SYSTEM: Footnotes to Consolidated Financial Statements FY16
Discount Rate A single discount rate of 7.50% was used to measure the total pension liability. This single discount rate was based on the expected rate of return on pension plan investments of 7.50%. The projection of cash flows used to determine this single discount rate assumed that plan member contributions will be made at the current contribution rate and that employer contributions will be made at rates equal to the difference between actuarially determined contribution rates and the member rate. Based on these assumptions, the pension plan’s fiduciary net position was projected to be available to make all projected future benefit payments of current plan members. Therefore, the long-term expected rate of return on pension plan investments was applied to
all periods of projected benefit payments to determine the total pension liability. The current discount rate reflects a .25% decrease compared to the 7.75% single discount rate used to measure the total pension liability as of the prior measurement date.
Sensitivity of the Proportionate Share of the Net Pension Liability to Changes in the Discount Rate The following presents the University’s proportionate share of the net pension liability using the discount rate of 7.50%, as well as what the net pension liability would be if it were calculated using a discount rate that is 1-percentage-point lower (6.50%) or 1-percentage-point higher (8.50%) than the current rate:
Sensitivity of Discount Rate1%
Decrease
(6.50%)
Discount
Rate
(7.50%)
1%
Increase
(8.50%)$50,324,104 $30,550,726 $14,105,312
Pension Plan Fiduciary Net PositionDetailed information about the pension plan’s net position is available in the separately issued APERS financial report.
Arkansas Teacher Retirement System (ATRS)
Plan DescriptionATRS is a cost-sharing, multiple-employer, defined benefit pension plan administered by the State of Arkansas. The plan was established by the authority of the Arkansas General Assembly with the passage of Act 266 of 1937. The costs of administering the plan are paid out of investment earnings. The general administration and responsibility for the proper operation of the System is vested in the fifteen members of the Board of Trustees of the Arkansas Teacher Retirement System (the Board). Membership includes eleven members who are elected and consist of seven active members of ATRS with at least five years of actual service, three retired members receiving an annuity from ATRS, and one active or retired member from a minority racial ethnic group. There are also four ex officio members, including the State Bank
Commissioner, the Treasurer of the State, the Auditor of the State and the Commissioner of Education. ATRS issues a publicly available financial report that can be obtained at https://www.artrs.gov/publications.
Benefits ProvidedBenefit provisions are set forth in Arkansas Code Annotated, Title 24, Chapter 7 and may only be amended by the Arkansas General Assembly. ATRS provides retirement, disability and death benefits. Retirement benefits are determined as a percentage of the member’s highest 3-year average compensation times the member’s years of service. The percentage used is based upon whether a member is contributory or noncontributory as follows:
Contributory 2.15% Non-Contributory 1.39%
Members are eligible to retire with a full benefit under the following conditions: at age 60 with 5 years of credited service, at any age with 28 years credited service.
Members with 25 years of credited service who have not attained age 60 may retire with a reduced benefit.
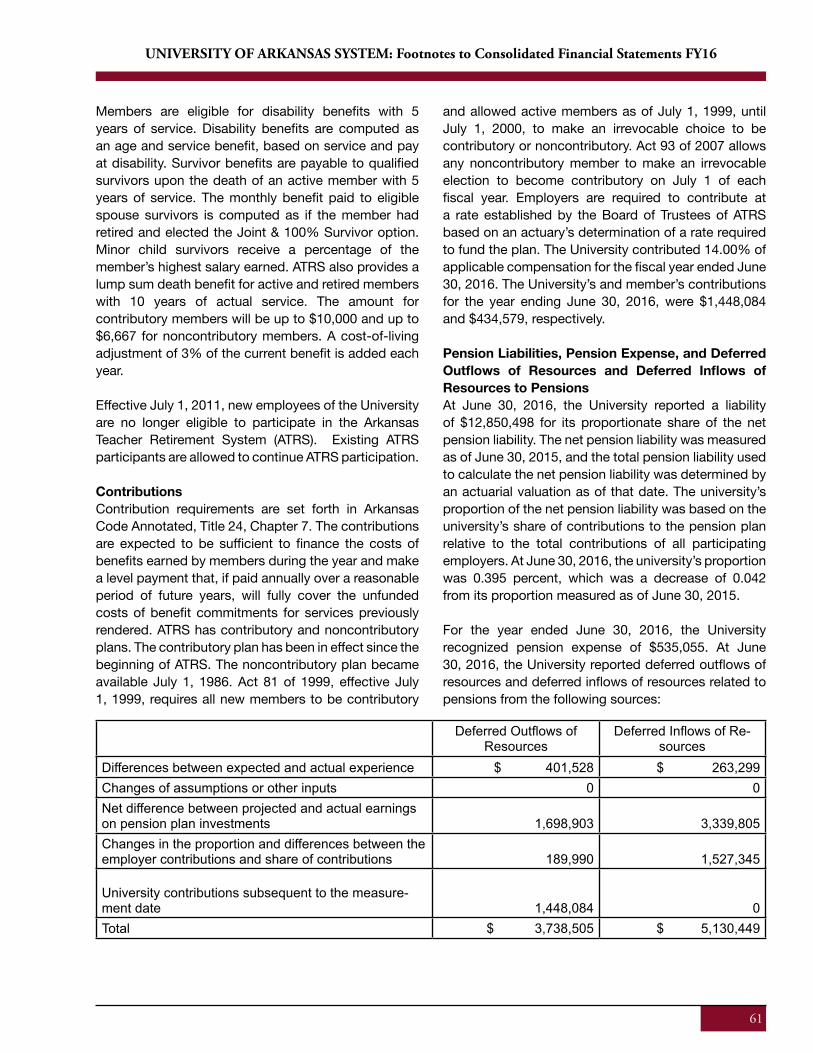
61
UNIVERSITY OF ARKANSAS SYSTEM: Footnotes to Consolidated Financial Statements FY16
Members are eligible for disability benefits with 5 years of service. Disability benefits are computed as an age and service benefit, based on service and pay at disability. Survivor benefits are payable to qualified survivors upon the death of an active member with 5 years of service. The monthly benefit paid to eligible spouse survivors is computed as if the member had retired and elected the Joint & 100% Survivor option. Minor child survivors receive a percentage of the member’s highest salary earned. ATRS also provides a lump sum death benefit for active and retired members with 10 years of actual service. The amount for contributory members will be up to $10,000 and up to $6,667 for noncontributory members. A cost-of-living adjustment of 3% of the current benefit is added each year.
Effective July 1, 2011, new employees of the University are no longer eligible to participate in the Arkansas Teacher Retirement System (ATRS). Existing ATRS participants are allowed to continue ATRS participation.
ContributionsContribution requirements are set forth in Arkansas Code Annotated, Title 24, Chapter 7. The contributions are expected to be sufficient to finance the costs of benefits earned by members during the year and make a level payment that, if paid annually over a reasonable period of future years, will fully cover the unfunded costs of benefit commitments for services previously rendered. ATRS has contributory and noncontributory plans. The contributory plan has been in effect since the beginning of ATRS. The noncontributory plan became available July 1, 1986. Act 81 of 1999, effective July 1, 1999, requires all new members to be contributory
and allowed active members as of July 1, 1999, until July 1, 2000, to make an irrevocable choice to be contributory or noncontributory. Act 93 of 2007 allows any noncontributory member to make an irrevocable election to become contributory on July 1 of each fiscal year. Employers are required to contribute at a rate established by the Board of Trustees of ATRS based on an actuary’s determination of a rate required to fund the plan. The University contributed 14.00% of applicable compensation for the fiscal year ended June 30, 2016. The University’s and member’s contributions for the year ending June 30, 2016, were $1,448,084 and $434,579, respectively.
Pension Liabilities, Pension Expense, and Deferred Outflows of Resources and Deferred Inflows of Resources to PensionsAt June 30, 2016, the University reported a liability of $12,850,498 for its proportionate share of the net pension liability. The net pension liability was measured as of June 30, 2015, and the total pension liability used to calculate the net pension liability was determined by an actuarial valuation as of that date. The university’s proportion of the net pension liability was based on the university’s share of contributions to the pension plan relative to the total contributions of all participating employers. At June 30, 2016, the university’s proportion was 0.395 percent, which was a decrease of 0.042 from its proportion measured as of June 30, 2015.
For the year ended June 30, 2016, the University recognized pension expense of $535,055. At June 30, 2016, the University reported deferred outflows of resources and deferred inflows of resources related to pensions from the following sources:
Deferred Outflows of Resources
Deferred Inflows of Re-sources
Differences between expected and actual experience $ 401,528 $ 263,299Changes of assumptions or other inputs 0 0Net difference between projected and actual earnings on pension plan investments 1,698,903 3,339,805Changes in the proportion and differences between the employer contributions and share of contributions 189,990 1,527,345
University contributions subsequent to the measure-ment date 1,448,084 0Total $ 3,738,505 $ 5,130,449
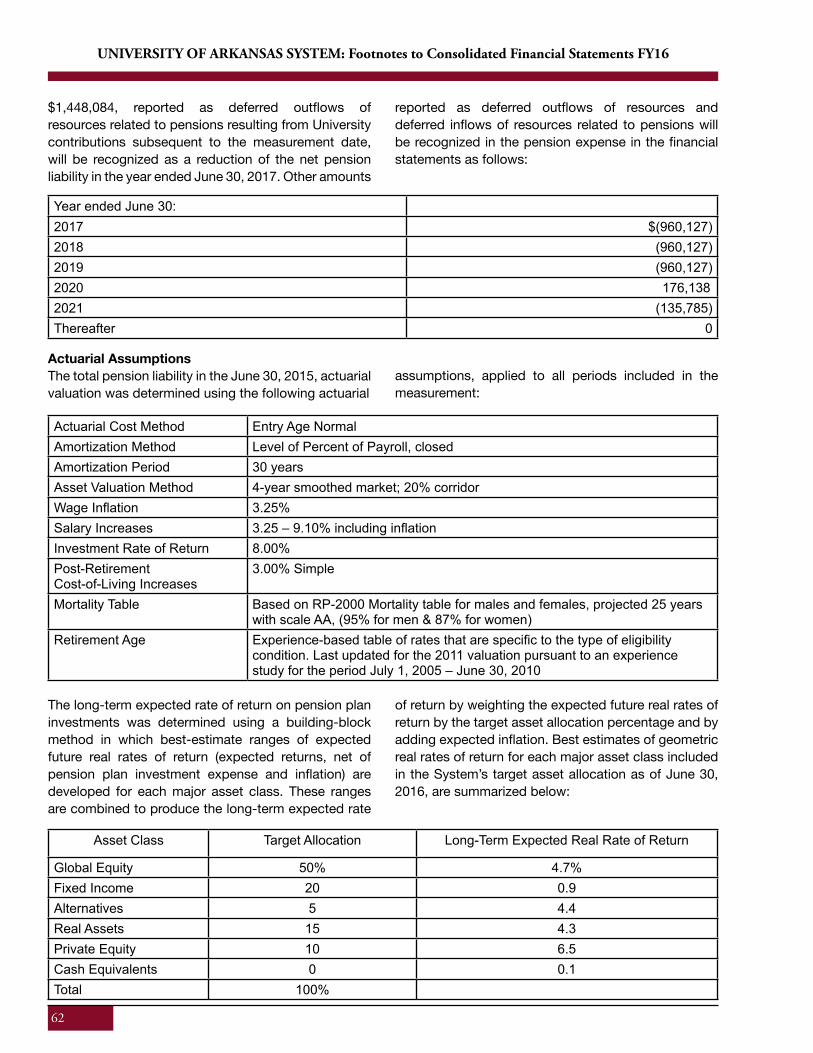
62
UNIVERSITY OF ARKANSAS SYSTEM: Footnotes to Consolidated Financial Statements FY16
$1,448,084, reported as deferred outflows of resources related to pensions resulting from University contributions subsequent to the measurement date, will be recognized as a reduction of the net pension liability in the year ended June 30, 2017. Other amounts
reported as deferred outflows of resources and deferred inflows of resources related to pensions will be recognized in the pension expense in the financial statements as follows:
Year ended June 30:2017 $(960,127) 2018 (960,127)2019 (960,127) 2020 176,138 2021 (135,785)Thereafter 0
Actuarial AssumptionsThe total pension liability in the June 30, 2015, actuarial valuation was determined using the following actuarial
assumptions, applied to all periods included in the measurement:
Actuarial Cost Method Entry Age Normal Amortization Method Level of Percent of Payroll, closed Amortization Period 30 yearsAsset Valuation Method 4-year smoothed market; 20% corridorWage Inflation 3.25%Salary Increases 3.25 – 9.10% including inflationInvestment Rate of Return 8.00% Post-Retirement Cost-of-Living Increases
3.00% Simple
Mortality Table Based on RP-2000 Mortality table for males and females, projected 25 years with scale AA, (95% for men & 87% for women)
Retirement Age Experience-based table of rates that are specific to the type of eligibility condition. Last updated for the 2011 valuation pursuant to an experience study for the period July 1, 2005 – June 30, 2010
The long-term expected rate of return on pension plan investments was determined using a building-block method in which best-estimate ranges of expected future real rates of return (expected returns, net of pension plan investment expense and inflation) are developed for each major asset class. These ranges are combined to produce the long-term expected rate
of return by weighting the expected future real rates of return by the target asset allocation percentage and by adding expected inflation. Best estimates of geometric real rates of return for each major asset class included in the System’s target asset allocation as of June 30, 2016, are summarized below:
Asset Class Target Allocation Long-Term Expected Real Rate of Return
Global Equity 50% 4.7%Fixed Income 20 0.9Alternatives 5 4.4Real Assets 15 4.3Private Equity 10 6.5Cash Equivalents 0 0.1Total 100%
63
UNIVERSITY OF ARKANSAS SYSTEM: Footnotes to Consolidated Financial Statements FY16
Discount Rate A single discount rate of 8.0% was used to measure the total pension liability. This single discount rate was based on the expected rate of return on pension plan investments of 8.00%. The projection of cash flows used to determine this single discount rate assumed that plan member contributions will be made at the current contribution rate and that employer contributions will be 14% of payroll. Based on these assumptions, the pension plan’s fiduciary net position was projected to be available to make all projected future benefit payments of current plan members. Therefore, the long-term expected rate of return on
pension plan investments was applied to all periods of projected benefit payments to determine the total pension liability.
Sensitivity of the Proportionate Share of the Net Pension Liability to Changes in the Discount Rate The following presents the University’s proportionate share of the net pension liability using the discount rate of 8.00%, as well as what the net pension liability would be if it were calculated using a discount rate that is 1-percentage-point lower (7.00%) or 1-percentage-point higher (9.00%) than the current rate:
Sensitivity of Discount Rate1%
Decrease
(7.00%)
Discount
Rate
(8.00%)
1%
Increase
(9.00%)$21,341,643 $12,850,498 $5,732,671
Pension Plan Fiduciary Net PositionDetailed information about the pension plan’s net position is available in the separately issued ATRS financial report.
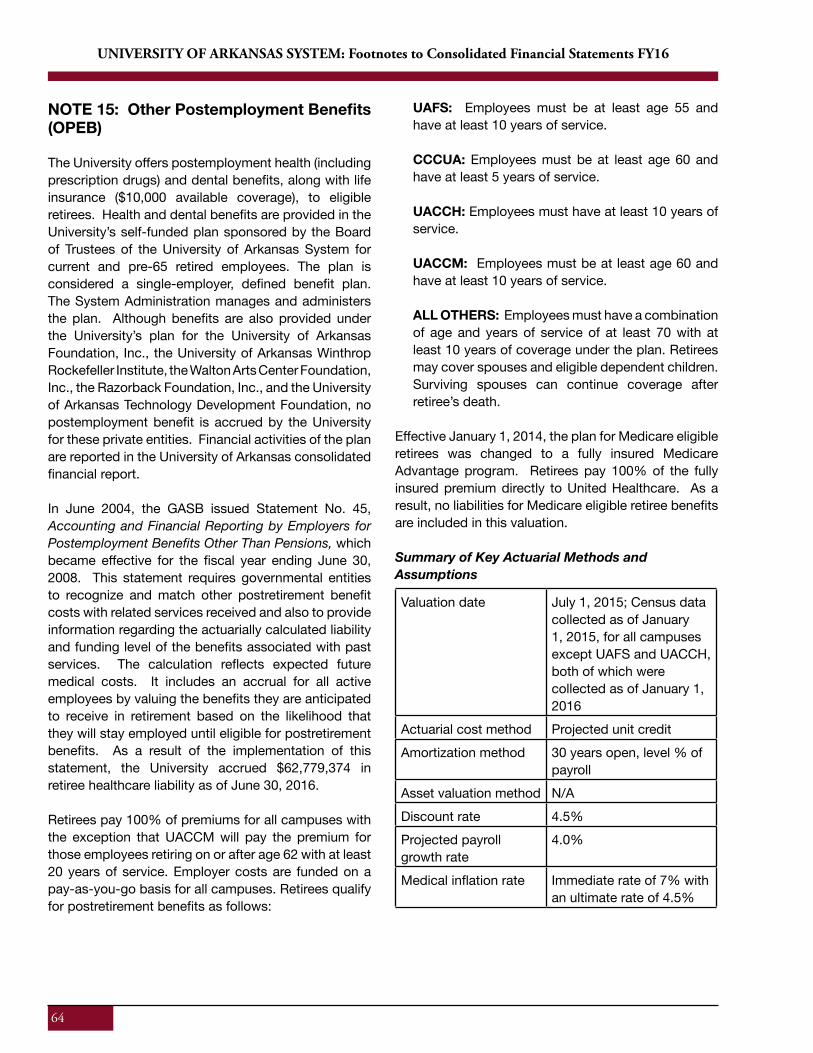
64
UNIVERSITY OF ARKANSAS SYSTEM: Footnotes to Consolidated Financial Statements FY16
NOTE 15: Other Postemployment Benefits (OPEB)
The University offers postemployment health (including prescription drugs) and dental benefits, along with life insurance ($10,000 available coverage), to eligible retirees. Health and dental benefits are provided in the University’s self-funded plan sponsored by the Board of Trustees of the University of Arkansas System for current and pre-65 retired employees. The plan is considered a single-employer, defined benefit plan. The System Administration manages and administers the plan. Although benefits are also provided under the University’s plan for the University of Arkansas Foundation, Inc., the University of Arkansas Winthrop Rockefeller Institute, the Walton Arts Center Foundation, Inc., the Razorback Foundation, Inc., and the University of Arkansas Technology Development Foundation, no postemployment benefit is accrued by the University for these private entities. Financial activities of the plan are reported in the University of Arkansas consolidated financial report.
In June 2004, the GASB issued Statement No. 45, Accounting and Financial Reporting by Employers for Postemployment Benefits Other Than Pensions, which became effective for the fiscal year ending June 30, 2008. This statement requires governmental entities to recognize and match other postretirement benefit costs with related services received and also to provide information regarding the actuarially calculated liability and funding level of the benefits associated with past services. The calculation reflects expected future medical costs. It includes an accrual for all active employees by valuing the benefits they are anticipated to receive in retirement based on the likelihood that they will stay employed until eligible for postretirement benefits. As a result of the implementation of this statement, the University accrued $62,779,374 in retiree healthcare liability as of June 30, 2016.
Retirees pay 100% of premiums for all campuses with the exception that UACCM will pay the premium for those employees retiring on or after age 62 with at least 20 years of service. Employer costs are funded on a pay-as-you-go basis for all campuses. Retirees qualify for postretirement benefits as follows:
UAFS: Employees must be at least age 55 and have at least 10 years of service.
CCCUA: Employees must be at least age 60 and have at least 5 years of service.
UACCH: Employees must have at least 10 years of service. UACCM: Employees must be at least age 60 and have at least 10 years of service.
ALL OTHERS: Employees must have a combination of age and years of service of at least 70 with at least 10 years of coverage under the plan. Retirees may cover spouses and eligible dependent children. Surviving spouses can continue coverage after retiree’s death.
Effective January 1, 2014, the plan for Medicare eligible retirees was changed to a fully insured Medicare Advantage program. Retirees pay 100% of the fully insured premium directly to United Healthcare. As a result, no liabilities for Medicare eligible retiree benefits are included in this valuation. Summary of Key Actuarial Methods and Assumptions
Valuation date July 1, 2015; Census data collected as of January 1, 2015, for all campuses except UAFS and UACCH, both of which were collected as of January 1, 2016
Actuarial cost method Projected unit creditAmortization method 30 years open, level % of
payrollAsset valuation method N/ADiscount rate 4.5%Projected payroll growth rate
4.0%
Medical inflation rate Immediate rate of 7% with an ultimate rate of 4.5%
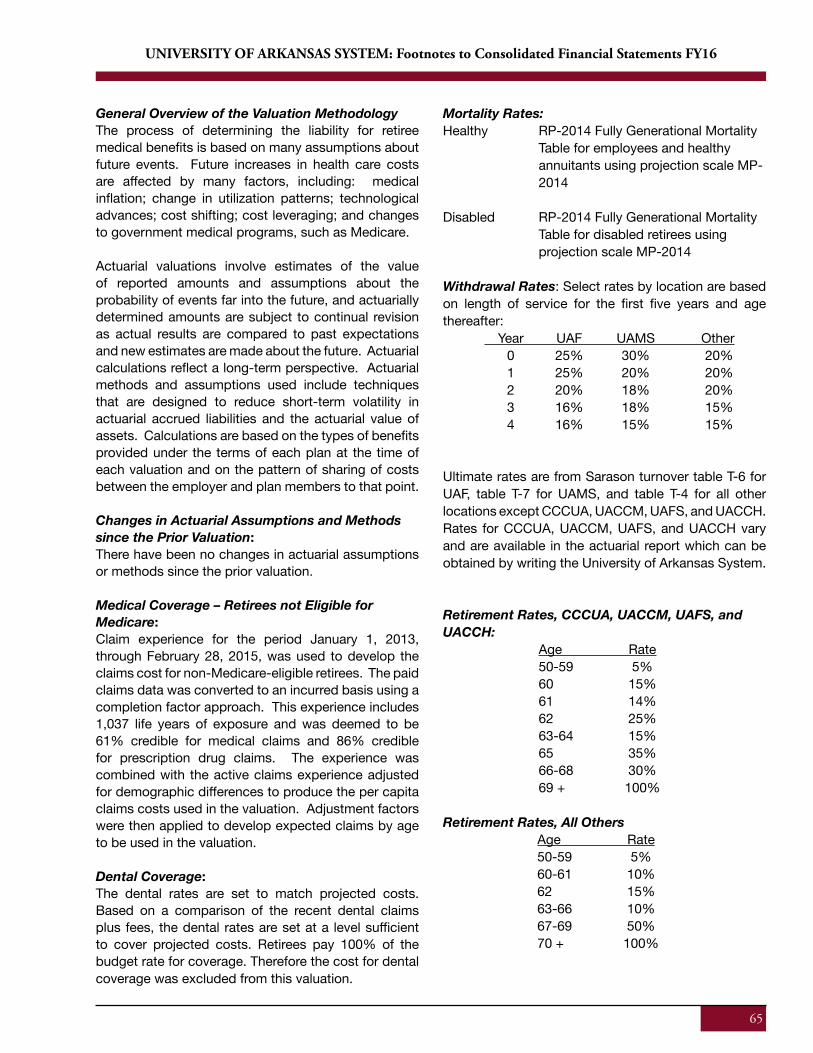
65
UNIVERSITY OF ARKANSAS SYSTEM: Footnotes to Consolidated Financial Statements FY16
General Overview of the Valuation MethodologyThe process of determining the liability for retiree medical benefits is based on many assumptions about future events. Future increases in health care costs are affected by many factors, including: medical inflation; change in utilization patterns; technological advances; cost shifting; cost leveraging; and changes to government medical programs, such as Medicare.
Actuarial valuations involve estimates of the value of reported amounts and assumptions about the probability of events far into the future, and actuarially determined amounts are subject to continual revision as actual results are compared to past expectations and new estimates are made about the future. Actuarial calculations reflect a long-term perspective. Actuarial methods and assumptions used include techniques that are designed to reduce short-term volatility in actuarial accrued liabilities and the actuarial value of assets. Calculations are based on the types of benefits provided under the terms of each plan at the time of each valuation and on the pattern of sharing of costs between the employer and plan members to that point.
Changes in Actuarial Assumptions and Methods since the Prior Valuation: There have been no changes in actuarial assumptions or methods since the prior valuation.
Medical Coverage – Retirees not Eligible for Medicare:Claim experience for the period January 1, 2013, through February 28, 2015, was used to develop the claims cost for non-Medicare-eligible retirees. The paid claims data was converted to an incurred basis using a completion factor approach. This experience includes 1,037 life years of exposure and was deemed to be 61% credible for medical claims and 86% credible for prescription drug claims. The experience was combined with the active claims experience adjusted for demographic differences to produce the per capita claims costs used in the valuation. Adjustment factors were then applied to develop expected claims by age to be used in the valuation.
Dental Coverage: The dental rates are set to match projected costs. Based on a comparison of the recent dental claims plus fees, the dental rates are set at a level sufficient to cover projected costs. Retirees pay 100% of the budget rate for coverage. Therefore the cost for dental coverage was excluded from this valuation.
Mortality Rates:Healthy RP-2014 Fully Generational Mortality
Table for employees and healthy annuitants using projection scale MP- 2014
Disabled RP-2014 Fully Generational Mortality Table for disabled retirees using projection scale MP-2014
Withdrawal Rates: Select rates by location are based on length of service for the first five years and age thereafter:
Year UAF UAMS Other 0 25% 30% 20% 1 25% 20% 20% 2 20% 18% 20% 3 16% 18% 15% 4 16% 15% 15%
Ultimate rates are from Sarason turnover table T-6 for UAF, table T-7 for UAMS, and table T-4 for all other locations except CCCUA, UACCM, UAFS, and UACCH. Rates for CCCUA, UACCM, UAFS, and UACCH vary and are available in the actuarial report which can be obtained by writing the University of Arkansas System.
Retirement Rates, CCCUA, UACCM, UAFS, and UACCH: Age Rate 50-59 5% 60 15% 61 14% 62 25% 63-64 15% 65 35% 66-68 30% 69 + 100%
Retirement Rates, All Others Age Rate 50-59 5% 60-61 10% 62 15% 63-66 10% 67-69 50% 70 + 100%
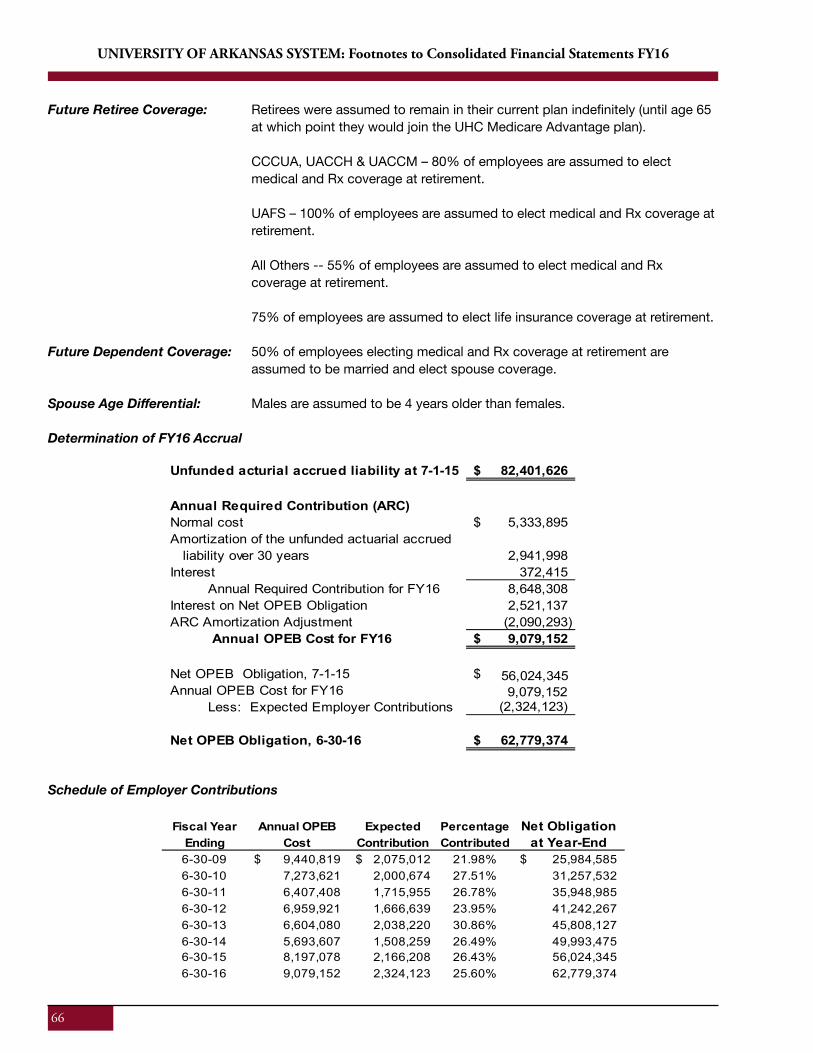
66
UNIVERSITY OF ARKANSAS SYSTEM: Footnotes to Consolidated Financial Statements FY16
Future Retiree Coverage: Retirees were assumed to remain in their current plan indefinitely (until age 65 at which point they would join the UHC Medicare Advantage plan).
CCCUA, UACCH & UACCM – 80% of employees are assumed to elect medical and Rx coverage at retirement.
UAFS – 100% of employees are assumed to elect medical and Rx coverage at retirement.
All Others -- 55% of employees are assumed to elect medical and Rx coverage at retirement.
75% of employees are assumed to elect life insurance coverage at retirement.
Future Dependent Coverage: 50% of employees electing medical and Rx coverage at retirement are assumed to be married and elect spouse coverage.
Spouse Age Differential: Males are assumed to be 4 years older than females.
Determination of FY16 Accrual
Schedule of Employer Contributions
Fiscal Year Annual OPEB Expected Percentage Net ObligationEnding Cost Contribution Contributed at Year-End6-30-09 9,440,819$ 2,075,012$ 21.98% 25,984,585$ 6-30-10 7,273,621 2,000,674 27.51% 31,257,532 6-30-11 6,407,408 1,715,955 26.78% 35,948,985 6-30-12 6,959,921 1,666,639 23.95% 41,242,267 6-30-13 6,604,080 2,038,220 30.86% 45,808,127 6-30-14 5,693,607 1,508,259 26.49% 49,993,475 6-30-15 8,197,078 2,166,208 26.43% 56,024,345 6-30-16 9,079,152 2,324,123 25.60% 62,779,374
66
UNIVERSITY OF ARKANSAS SYSTEM: Footnotes to Consolidated Financial Statements FY16
Future Retiree Coverage: Retirees were assumed to remain in their current plan indefinitely (until age 65 at which point they would join the UHC Medicare Advantage plan).
CCCUA, UACCH & UACCM – 80% of employees are assumed to elect medical and Rx coverage at retirement.
UAFS – 100% of employees are assumed to elect medical and Rx coverage at retirement.
All Others -- 55% of employees are assumed to elect medical and Rx coverage at retirement.
75% of employees are assumed to elect life insurance coverage at retirement.
Future Dependent Coverage: 50% of employees electing medical and Rx coverage at retirement are assumed to be married and elect spouse coverage.
Spouse Age Differential: Males are assumed to be 4 years older than females.
Determination of FY16 Accrual
Unfunded acturial accrued liability at 7-1-15 82,401,626$
Annual Required Contribution (ARC)Normal cost 5,333,895$ Amortization of the unfunded actuarial accrued liability over 30 years 2,941,998 Interest 372,415 Annual Required Contribution for FY16 8,648,308 Interest on Net OPEB Obligation 2,521,137 ARC Amortization Adjustment (2,090,293) Annual OPEB Cost for FY16 9,079,152$
Net OPEB Obligation, 7-1-15 56,024,345$ Annual OPEB Cost for FY16 9,079,152 Less: Expected Employer Contributions (2,324,123)
Net OPEB Obligation, 6-30-16 62,779,374$
Schedule of Employer Contributions
Fiscal Year Annual OPEB Expected Percentage Net ObligationEnding Cost Contribution Contributed at Year-End6-30-09 9,440,819$ 2,075,012$ 21.98% 25,984,585$ 6-30-10 7,273,621 2,000,674 27.51% 31,257,532 6-30-11 6,407,408 1,715,955 26.78% 35,948,985 6-30-12 6,959,921 1,666,639 23.95% 41,242,267 6-30-13 6,604,080 2,038,220 30.86% 45,808,127 6-30-14 5,693,607 1,508,259 26.49% 49,993,475 6-30-15 8,197,078 2,166,208 26.43% 56,024,345 6-30-16 9,079,152 2,324,123 25.60% 62,779,374
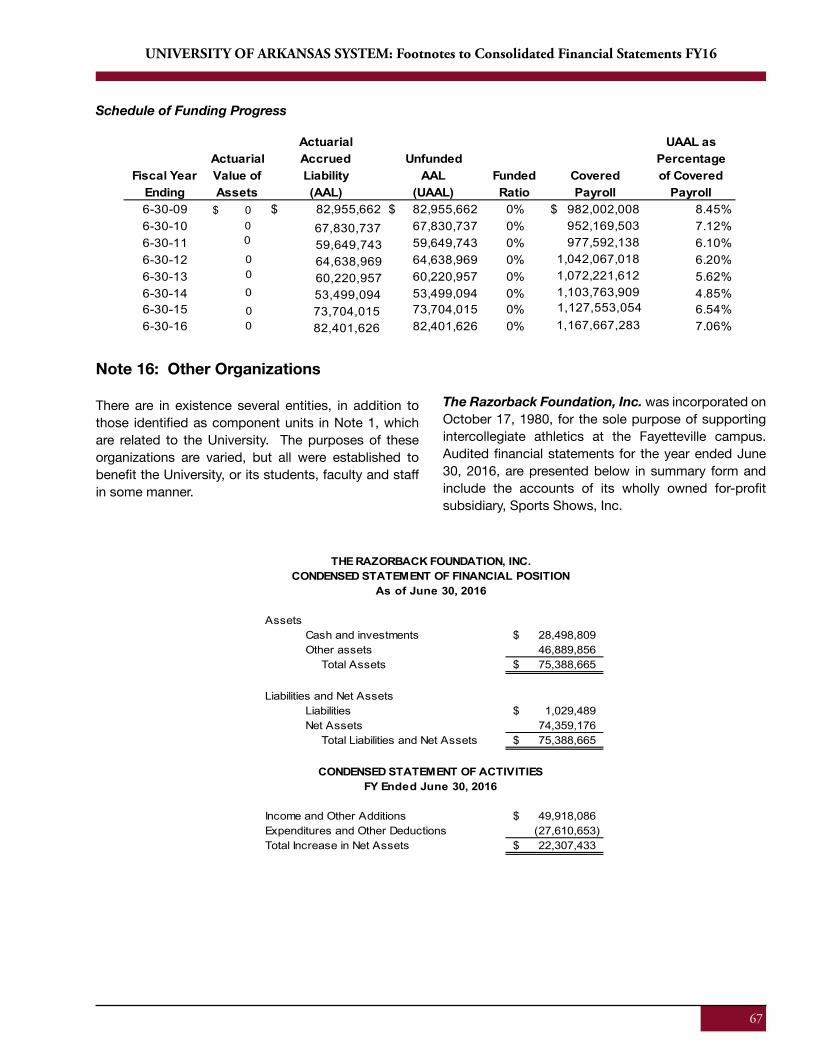
67
UNIVERSITY OF ARKANSAS SYSTEM: Footnotes to Consolidated Financial Statements FY16
Schedule of Funding Progress
Note 16: Other Organizations
There are in existence several entities, in addition to those identified as component units in Note 1, which are related to the University. The purposes of these organizations are varied, but all were established to benefit the University, or its students, faculty and staff in some manner.
The Razorback Foundation, Inc. was incorporated on October 17, 1980, for the sole purpose of supporting intercollegiate athletics at the Fayetteville campus. Audited financial statements for the year ended June 30, 2016, are presented below in summary form and include the accounts of its wholly owned for-profit subsidiary, Sports Shows, Inc.
AssetsCash and investments 28,498,809$ Other assets 46,889,856 Total Assets 75,388,665$
Liabilities and Net AssetsLiabilities 1,029,489$ Net Assets 74,359,176 Total Liabilities and Net Assets 75,388,665$
Income and Other Additions 49,918,086$ Expenditures and Other Deductions (27,610,653) Total Increase in Net Assets 22,307,433$
CONDENSED STATEMENT OF FINANCIAL POSITIONAs of June 30, 2016
CONDENSED STATEMENT OF ACTIVITIESFY Ended June 30, 2016
THE RAZORBACK FOUNDATION, INC.
68
UNIVERSITY OF ARKANSAS SYSTEM: Footnotes to Consolidated Financial Statements FY16
Schedule of Funding Progress
Actuarial UAAL asActuarial Accrued Unfunded Percentage
Fiscal Year Value of Liability AAL Funded Covered of CoveredEnding Assets (AAL) (UAAL) Ratio Payroll Payroll6-30-09 $ 82,955,662 82,955,662$ 0% 8.45%6-30-10 67,830,737 0% 7.12%6-30-11 59,649,743 0% 6.10%6-30-12 64,638,969 0% 6.20%6-30-13 60,220,957 0% 5.62%6-30-14 53,499,094 0% 4.85%6-30-15 73,704,015 0% 6.54%6-30-16
67,830,737 59,649,743 64,638,969 60,220,957 53,499,09473,704,01582,401,626 82,401,626 0%
$ 982,002,008 952,169,503 977,592,138 1,042,067,018 1,072,221,612 1,103,763,909 1,127,553,054
7.06%
Note 16: Other Organizations
There are in existence several entities, in addition to those identified as component units in Note 1, which are related to the University. The purposes of these organizations are varied, but all were established to benefit the University, or its students, faculty and staff in some manner.
The Razorback Foundation, Inc. was incorporated on October 17, 1980, for the sole purpose of supporting intercollegiate athletics at the Fayetteville campus. Audited financial statements for the year ended June 30, 2016, are presented below in summary form and include the accounts of its wholly owned for-profit subsidiary, Sports Shows, Inc.
AssetsCash and investments 28,498,809$ Other assets 46,889,856 Total Assets 75,388,665$
Liabilities and Net AssetsLiabilities 1,029,489$ Net Assets 74,359,176 Total Liabilities and Net Assets 75,388,665$
Income and Other Additions 49,918,086$ Expenditures and Other Deductions (27,610,653) Total Increase in Net Assets 22,307,433$
CONDENSED STATEMENT OF FINANCIAL POSITIONAs of June 30, 2016
CONDENSED STATEMENT OF ACTIVITIESFY Ended June 30, 2016
THE RAZORBACK FOUNDATION, INC.
$ 000
0 0
0
00 1,167,667,283
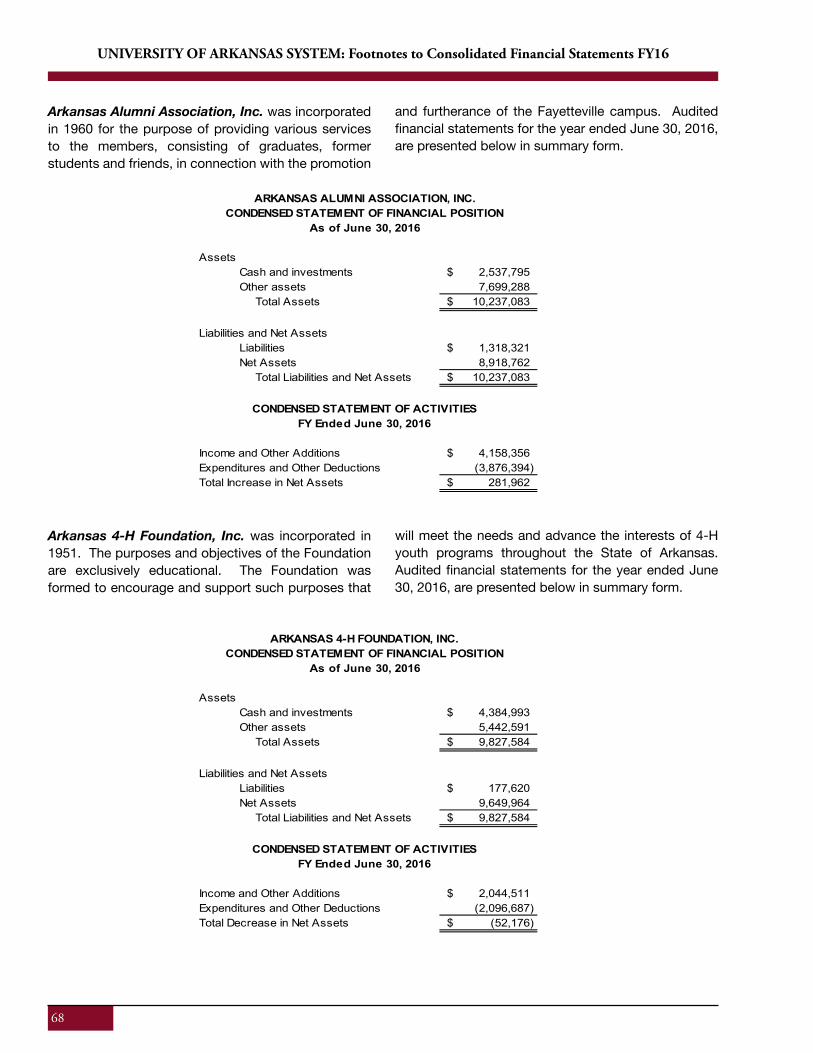
68
UNIVERSITY OF ARKANSAS SYSTEM: Footnotes to Consolidated Financial Statements FY16
Arkansas Alumni Association, Inc. was incorporated in 1960 for the purpose of providing various services to the members, consisting of graduates, former students and friends, in connection with the promotion
and furtherance of the Fayetteville campus. Audited financial statements for the year ended June 30, 2016, are presented below in summary form.
AssetsCash and investments 2,537,795$ Other assets 7,699,288 Total Assets 10,237,083$
Liabilities and Net AssetsLiabilities 1,318,321$ Net Assets 8,918,762 Total Liabilities and Net Assets 10,237,083$
Income and Other Additions 4,158,356$ Expenditures and Other Deductions (3,876,394) Total Increase in Net Assets 281,962$
CONDENSED STATEMENT OF FINANCIAL POSITIONAs of June 30, 2016
CONDENSED STATEMENT OF ACTIVITIESFY Ended June 30, 2016
ARKANSAS ALUMNI ASSOCIATION, INC.
Arkansas 4-H Foundation, Inc. was incorporated in 1951. The purposes and objectives of the Foundation are exclusively educational. The Foundation was formed to encourage and support such purposes that
will meet the needs and advance the interests of 4-H youth programs throughout the State of Arkansas. Audited financial statements for the year ended June 30, 2016, are presented below in summary form.
AssetsCash and investments 4,384,993$ Other assets 5,442,591 Total Assets 9,827,584$
Liabilities and Net AssetsLiabilities 177,620$ Net Assets 9,649,964 Total Liabilities and Net Assets 9,827,584$
Income and Other Additions 2,044,511$ Expenditures and Other Deductions (2,096,687) Total Decrease in Net Assets (52,176)$
ARKANSAS 4-H FOUNDATION, INC.CONDENSED STATEMENT OF FINANCIAL POSITION
As of June 30, 2016
CONDENSED STATEMENT OF ACTIVITIESFY Ended June 30, 2016
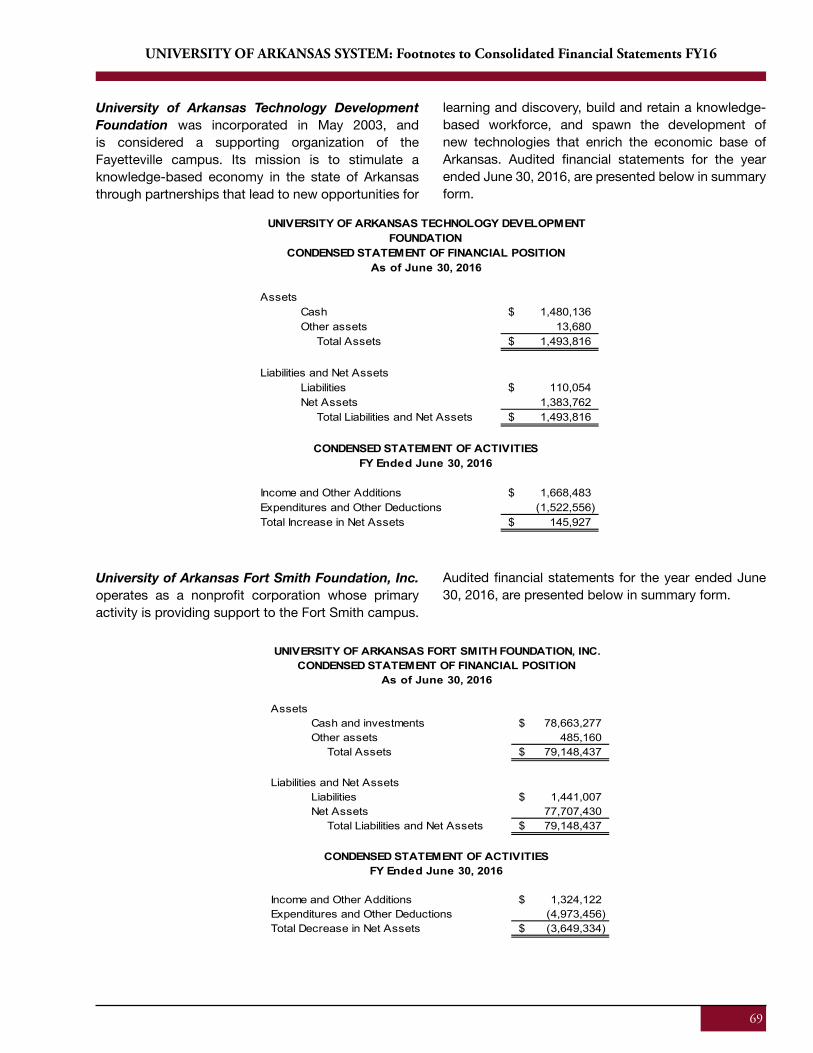
69
UNIVERSITY OF ARKANSAS SYSTEM: Footnotes to Consolidated Financial Statements FY16
University of Arkansas Technology Development Foundation was incorporated in May 2003, and is considered a supporting organization of the Fayetteville campus. Its mission is to stimulate a knowledge-based economy in the state of Arkansas through partnerships that lead to new opportunities for
learning and discovery, build and retain a knowledge-based workforce, and spawn the development of new technologies that enrich the economic base of Arkansas. Audited financial statements for the year ended June 30, 2016, are presented below in summary form.
AssetsCash 1,480,136$ Other assets 13,680 Total Assets 1,493,816$
Liabilities and Net AssetsLiabilities 110,054$ Net Assets 1,383,762 Total Liabilities and Net Assets 1,493,816$
Income and Other Additions 1,668,483$ Expenditures and Other Deductions (1,522,556) Total Increase in Net Assets 145,927$
CONDENSED STATEMENT OF FINANCIAL POSITIONAs of June 30, 2016
CONDENSED STATEMENT OF ACTIVITIESFY Ended June 30, 2016
UNIVERSITY OF ARKANSAS TECHNOLOGY DEVELOPMENT FOUNDATION
University of Arkansas Fort Smith Foundation, Inc. operates as a nonprofit corporation whose primary activity is providing support to the Fort Smith campus.
Audited financial statements for the year ended June 30, 2016, are presented below in summary form.
AssetsCash and investments 78,663,277$ Other assets 485,160 Total Assets 79,148,437$
Liabilities and Net AssetsLiabilities 1,441,007$ Net Assets 77,707,430 Total Liabilities and Net Assets 79,148,437$
Income and Other Additions 1,324,122$ Expenditures and Other Deductions (4,973,456) Total Decrease in Net Assets (3,649,334)$
UNIVERSITY OF ARKANSAS FORT SMITH FOUNDATION, INC. CONDENSED STATEMENT OF FINANCIAL POSITION
As of June 30, 2016
CONDENSED STATEMENT OF ACTIVITIESFY Ended June 30, 2016
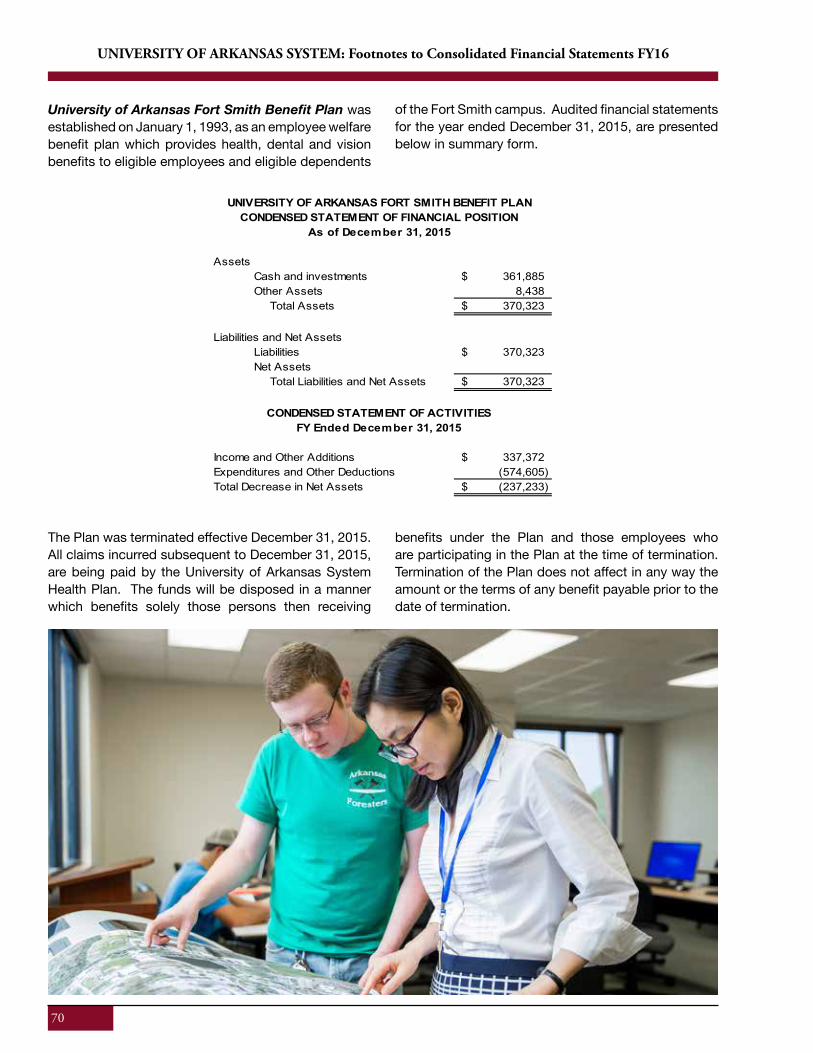
70
UNIVERSITY OF ARKANSAS SYSTEM: Footnotes to Consolidated Financial Statements FY16
University of Arkansas Fort Smith Benefit Plan was established on January 1, 1993, as an employee welfare benefit plan which provides health, dental and vision benefits to eligible employees and eligible dependents
of the Fort Smith campus. Audited financial statements for the year ended December 31, 2015, are presented below in summary form.
The Plan was terminated effective December 31, 2015. All claims incurred subsequent to December 31, 2015, are being paid by the University of Arkansas System Health Plan. The funds will be disposed in a manner which benefits solely those persons then receiving
benefits under the Plan and those employees who are participating in the Plan at the time of termination. Termination of the Plan does not affect in any way the amount or the terms of any benefit payable prior to the date of termination.
71
UNIVERSITY OF ARKANSAS SYSTEM: Footnotes to Consolidated Financial Statements FY16
University of Arkansas Fort Smith Benefit Plan was established on January 1, 1993, as an employee welfare benefit plan which provides health, dental and vision benefits to eligible employees and eligible dependents
of the Fort Smith campus. Audited financial statements for the year ended December 31, 2015, are presented below in summary form.
AssetsCash and investments 361,885$ Other Assets 8,438 Total Assets 370,323$
Liabilities and Net AssetsLiabilities 370,323$ Net Assets Total Liabilities and Net Assets 370,323$
Income and Other Additions 337,372$ Expenditures and Other Deductions (574,605) Total Decrease in Net Assets (237,233)$
CONDENSED STATEMENT OF FINANCIAL POSITIONAs of December 31, 2015
CONDENSED STATEMENT OF ACTIVITIESFY Ended December 31, 2015
UNIVERSITY OF ARKANSAS FORT SMITH BENEFIT PLAN
The Plan was terminated effective December 31, 2015. All claims incurred subsequent to December 31, 2015, are being paid by the University of Arkansas System Health Plan. The funds will be disposed in a manner which benefits solely those persons then receiving
benefits under the Plan and those employees who are participating in the Plan at the time of termination. Termination of the Plan does not affect in any way the amount or the terms of any benefit payable prior to the date of termination.
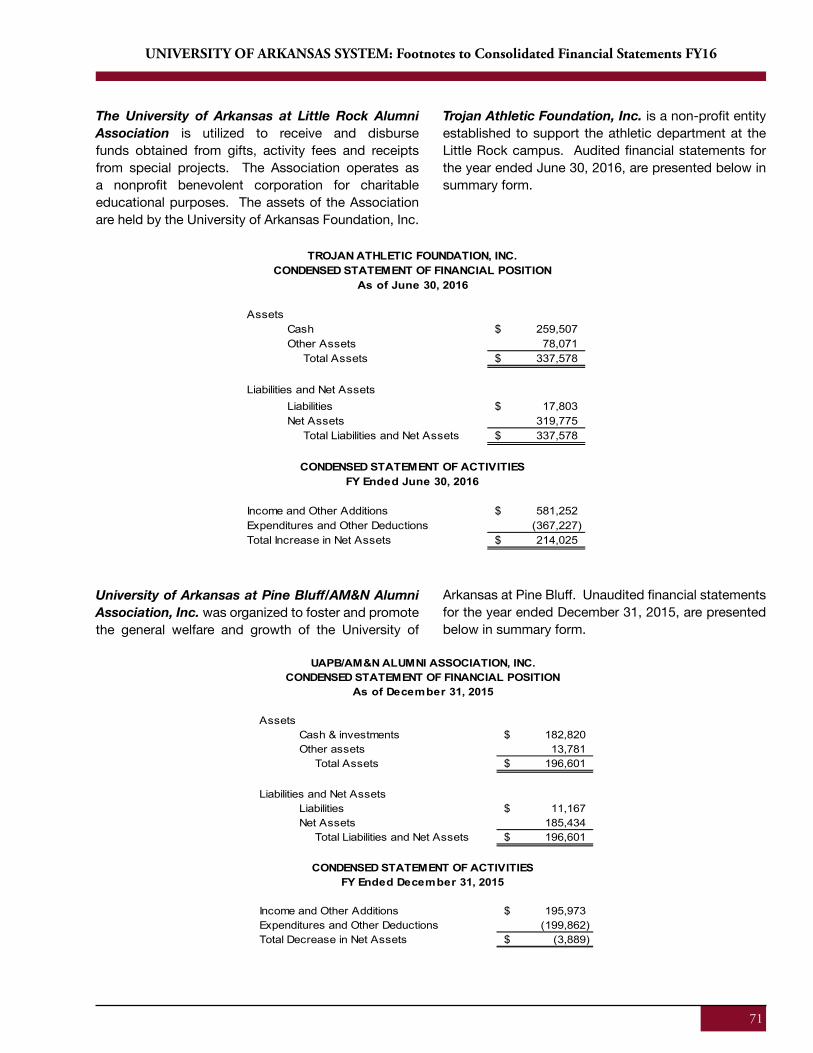
71
UNIVERSITY OF ARKANSAS SYSTEM: Footnotes to Consolidated Financial Statements FY16
The University of Arkansas at Little Rock Alumni Association is utilized to receive and disburse funds obtained from gifts, activity fees and receipts from special projects. The Association operates as a nonprofit benevolent corporation for charitable educational purposes. The assets of the Association are held by the University of Arkansas Foundation, Inc.
Trojan Athletic Foundation, Inc. is a non-profit entity established to support the athletic department at the Little Rock campus. Audited financial statements for the year ended June 30, 2016, are presented below in summary form.
AssetsCash 259,507$ Other Assets 78,071 Total Assets 337,578$
Liabilities and Net AssetsLiabilities 17,803$ Net Assets 319,775 Total Liabilities and Net Assets 337,578$
Income and Other Additions 581,252$ Expenditures and Other Deductions (367,227) Total Increase in Net Assets 214,025$
TROJAN ATHLETIC FOUNDATION, INC.CONDENSED STATEMENT OF FINANCIAL POSITION
As of June 30, 2016
CONDENSED STATEMENT OF ACTIVITIESFY Ended June 30, 2016
University of Arkansas at Pine Bluff/AM&N Alumni Association, Inc. was organized to foster and promote the general welfare and growth of the University of
Arkansas at Pine Bluff. Unaudited financial statements for the year ended December 31, 2015, are presented below in summary form.
AssetsCash & investments 182,820$ Other assets 13,781 Total Assets 196,601$
Liabilities and Net AssetsLiabilities 11,167$ Net Assets 185,434 Total Liabilities and Net Assets 196,601$
Income and Other Additions 195,973$ Expenditures and Other Deductions (199,862) Total Decrease in Net Assets (3,889)$
CONDENSED STATEMENT OF FINANCIAL POSITIONAs of December 31, 2015
CONDENSED STATEMENT OF ACTIVITIESFY Ended December 31, 2015
UAPB/AM&N ALUMNI ASSOCIATION, INC.
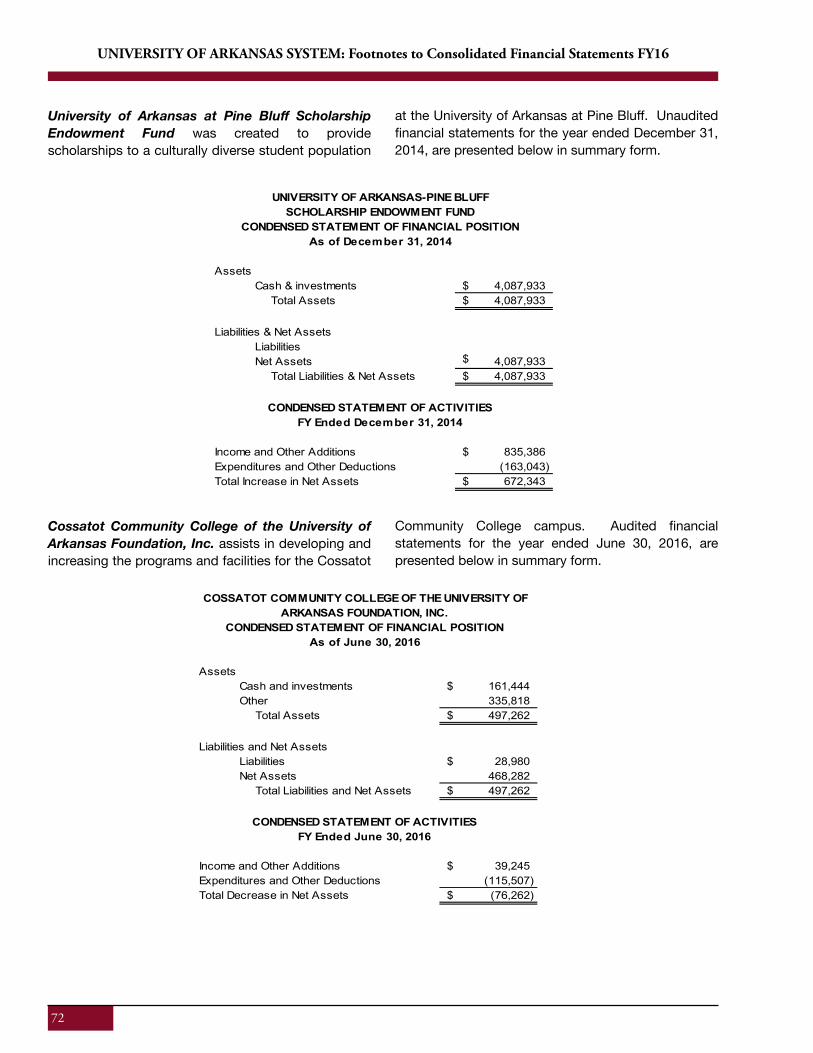
72
UNIVERSITY OF ARKANSAS SYSTEM: Footnotes to Consolidated Financial Statements FY16
University of Arkansas at Pine Bluff Scholarship Endowment Fund was created to provide scholarships to a culturally diverse student population
at the University of Arkansas at Pine Bluff. Unaudited financial statements for the year ended December 31, 2014, are presented below in summary form.
Cossatot Community College of the University of Arkansas Foundation, Inc. assists in developing and increasing the programs and facilities for the Cossatot
Community College campus. Audited financial statements for the year ended June 30, 2016, are presented below in summary form.
AssetsCash and investments 161,444$ Other 335,818 Total Assets 497,262$
Liabilities and Net AssetsLiabilities 28,980$ Net Assets 468,282 Total Liabilities and Net Assets 497,262$
Income and Other Additions 39,245$ Expenditures and Other Deductions (115,507) Total Decrease in Net Assets (76,262)$
CONDENSED STATEMENT OF FINANCIAL POSITIONAs of June 30, 2016
CONDENSED STATEMENT OF ACTIVITIESFY Ended June 30, 2016
COSSATOT COMMUNITY COLLEGE OF THE UNIVERSITY OF ARKANSAS FOUNDATION, INC.
73
UNIVERSITY OF ARKANSAS SYSTEM: Footnotes to Consolidated Financial Statements FY16
University of Arkansas at Pine Bluff Scholarship Endowment Fund was created to provide scholarships to a culturally diverse student population
at the University of Arkansas at Pine Bluff. Unaudited financial statements for the year ended December 31, 2014, are presented below in summary form.
AssetsCash & investments 4,087,933$ Total Assets 4,087,933$
Liabilities & Net AssetsLiabilities
$
Net Assets 4,087,933 Total Liabilities & Net Assets 4,087,933$
Income and Other Additions 835,386$ Expenditures and Other Deductions (163,043) Total Increase in Net Assets 672,343$
UNIVERSITY OF ARKANSAS-PINE BLUFF
CONDENSED STATEMENT OF FINANCIAL POSITIONAs of December 31, 2014
CONDENSED STATEMENT OF ACTIVITIESFY Ended December 31, 2014
SCHOLARSHIP ENDOWMENT FUND
Cossatot Community College of the University of Arkansas Foundation, Inc. assists in developing and increasing the programs and facilities for the Cossatot
Community College campus. Audited financial statements for the year ended June 30, 2016, are presented below in summary form.
AssetsCash and investments 161,444$ Other 335,818 Total Assets 497,262$
Liabilities and Net AssetsLiabilities 28,980$ Net Assets 468,282 Total Liabilities and Net Assets 497,262$
Income and Other Additions 39,245$ Expenditures and Other Deductions (115,507) Total Decrease in Net Assets (76,262)$
CONDENSED STATEMENT OF FINANCIAL POSITIONAs of June 30, 2016
CONDENSED STATEMENT OF ACTIVITIESFY Ended June 30, 2016
COSSATOT COMMUNITY COLLEGE OF THE UNIVERSITY OF ARKANSAS FOUNDATION, INC.
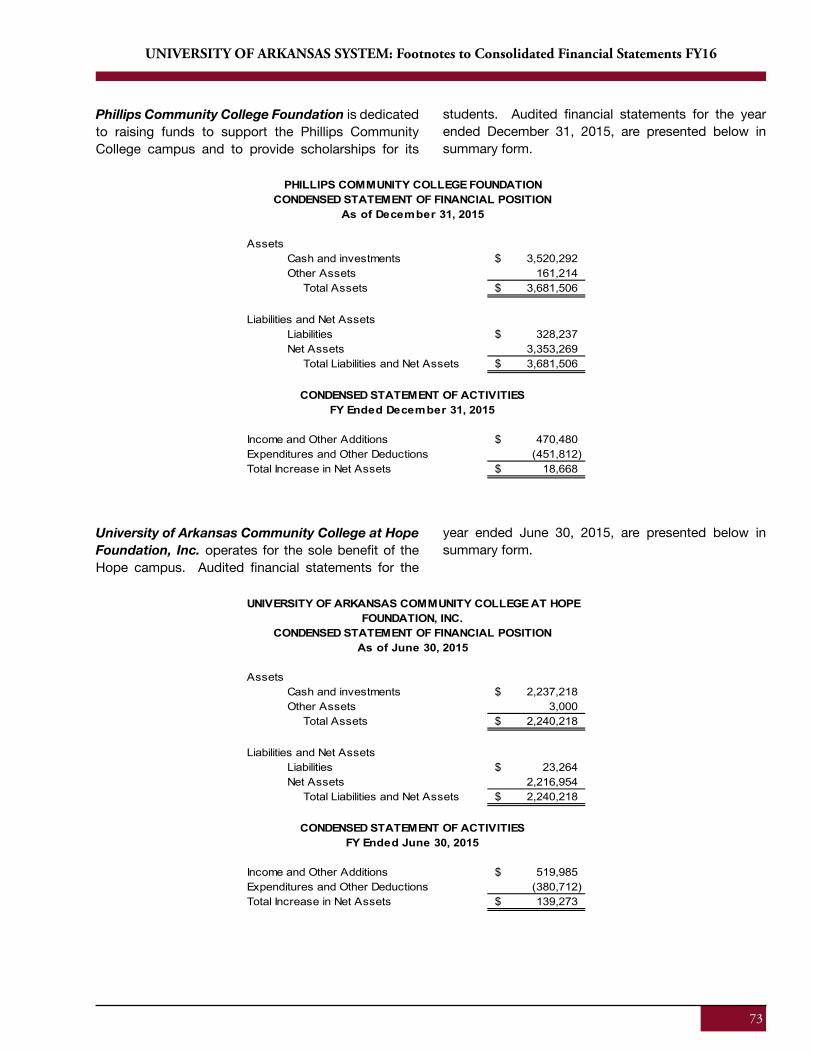
73
UNIVERSITY OF ARKANSAS SYSTEM: Footnotes to Consolidated Financial Statements FY16
Phillips Community College Foundation is dedicated to raising funds to support the Phillips Community College campus and to provide scholarships for its
students. Audited financial statements for the year ended December 31, 2015, are presented below in summary form.
AssetsCash and investments 3,520,292$ Other Assets 161,214 Total Assets 3,681,506$
Liabilities and Net AssetsLiabilities 328,237$ Net Assets 3,353,269 Total Liabilities and Net Assets 3,681,506$
Income and Other Additions 470,480$ Expenditures and Other Deductions (451,812) Total Increase in Net Assets 18,668$
CONDENSED STATEMENT OF FINANCIAL POSITIONAs of December 31, 2015
CONDENSED STATEMENT OF ACTIVITIESFY Ended December 31, 2015
PHILLIPS COMMUNITY COLLEGE FOUNDATION
University of Arkansas Community College at Hope Foundation, Inc. operates for the sole benefit of the Hope campus. Audited financial statements for the
year ended June 30, 2015, are presented below in summary form.
AssetsCash and investments 2,237,218$ Other Assets 3,000 Total Assets 2,240,218$
Liabilities and Net AssetsLiabilities 23,264$ Net Assets 2,216,954 Total Liabilities and Net Assets 2,240,218$
Income and Other Additions 519,985$ Expenditures and Other Deductions (380,712) Total Increase in Net Assets 139,273$
CONDENSED STATEMENT OF FINANCIAL POSITIONAs of June 30, 2015
CONDENSED STATEMENT OF ACTIVITIESFY Ended June 30, 2015
UNIVERSITY OF ARKANSAS COMMUNITY COLLEGE AT HOPE FOUNDATION, INC.
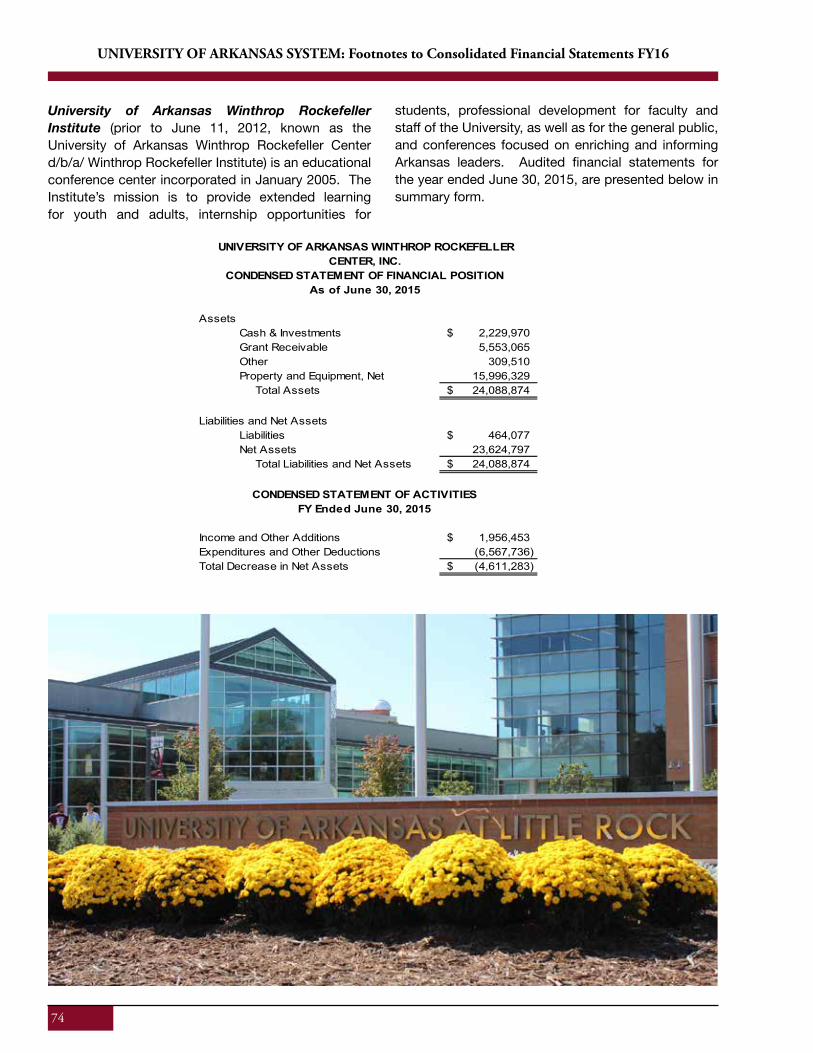
74
UNIVERSITY OF ARKANSAS SYSTEM: Footnotes to Consolidated Financial Statements FY16
University of Arkansas Winthrop Rockefeller Institute (prior to June 11, 2012, known as the University of Arkansas Winthrop Rockefeller Center d/b/a/ Winthrop Rockefeller Institute) is an educational conference center incorporated in January 2005. The Institute’s mission is to provide extended learning for youth and adults, internship opportunities for
students, professional development for faculty and staff of the University, as well as for the general public, and conferences focused on enriching and informing Arkansas leaders. Audited financial statements for the year ended June 30, 2015, are presented below in summary form.
AssetsCash & Investments 2,229,970$ Grant Receivable 5,553,065 Other 309,510 Property and Equipment, Net 15,996,329 Total Assets 24,088,874$
Liabilities and Net AssetsLiabilities 464,077$ Net Assets 23,624,797 Total Liabilities and Net Assets 24,088,874$
Income and Other Additions 1,956,453$ Expenditures and Other Deductions (6,567,736) Total Decrease in Net Assets (4,611,283)$
CONDENSED STATEMENT OF FINANCIAL POSITIONAs of June 30, 2015
CONDENSED STATEMENT OF ACTIVITIESFY Ended June 30, 2015
UNIVERSITY OF ARKANSAS WINTHROP ROCKEFELLER CENTER, INC.
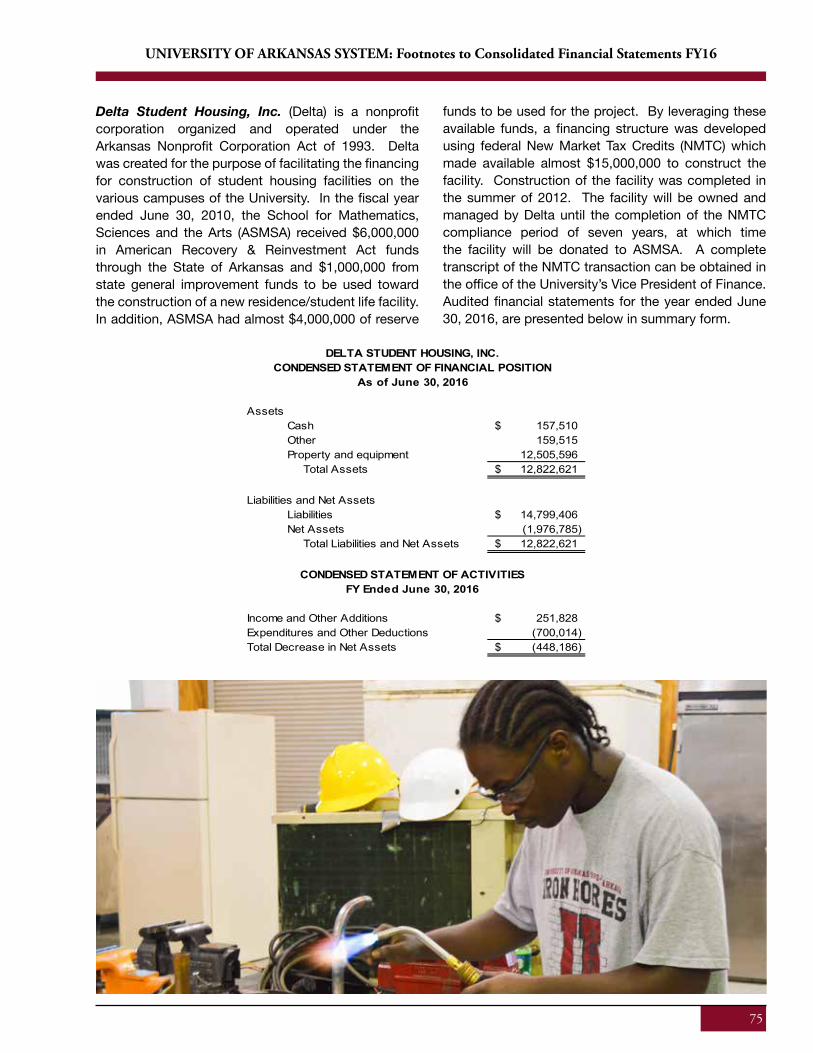
75
UNIVERSITY OF ARKANSAS SYSTEM: Footnotes to Consolidated Financial Statements FY16
Delta Student Housing, Inc. (Delta) is a nonprofit corporation organized and operated under the Arkansas Nonprofit Corporation Act of 1993. Delta was created for the purpose of facilitating the financing for construction of student housing facilities on the various campuses of the University. In the fiscal year ended June 30, 2010, the School for Mathematics, Sciences and the Arts (ASMSA) received $6,000,000 in American Recovery & Reinvestment Act funds through the State of Arkansas and $1,000,000 from state general improvement funds to be used toward the construction of a new residence/student life facility. In addition, ASMSA had almost $4,000,000 of reserve
funds to be used for the project. By leveraging these available funds, a financing structure was developed using federal New Market Tax Credits (NMTC) which made available almost $15,000,000 to construct the facility. Construction of the facility was completed in the summer of 2012. The facility will be owned and managed by Delta until the completion of the NMTC compliance period of seven years, at which time the facility will be donated to ASMSA. A complete transcript of the NMTC transaction can be obtained in the office of the University’s Vice President of Finance. Audited financial statements for the year ended June 30, 2016, are presented below in summary form.
AssetsCash 157,510$ Other 159,515 Property and equipment 12,505,596 Total Assets 12,822,621$
Liabilities and Net AssetsLiabilities 14,799,406$ Net Assets (1,976,785) Total Liabilities and Net Assets 12,822,621$
Income and Other Additions 251,828$ Expenditures and Other Deductions (700,014) Total Decrease in Net Assets (448,186)$
CONDENSED STATEMENT OF FINANCIAL POSITIONAs of June 30, 2016
CONDENSED STATEMENT OF ACTIVITIESFY Ended June 30, 2016
DELTA STUDENT HOUSING, INC.
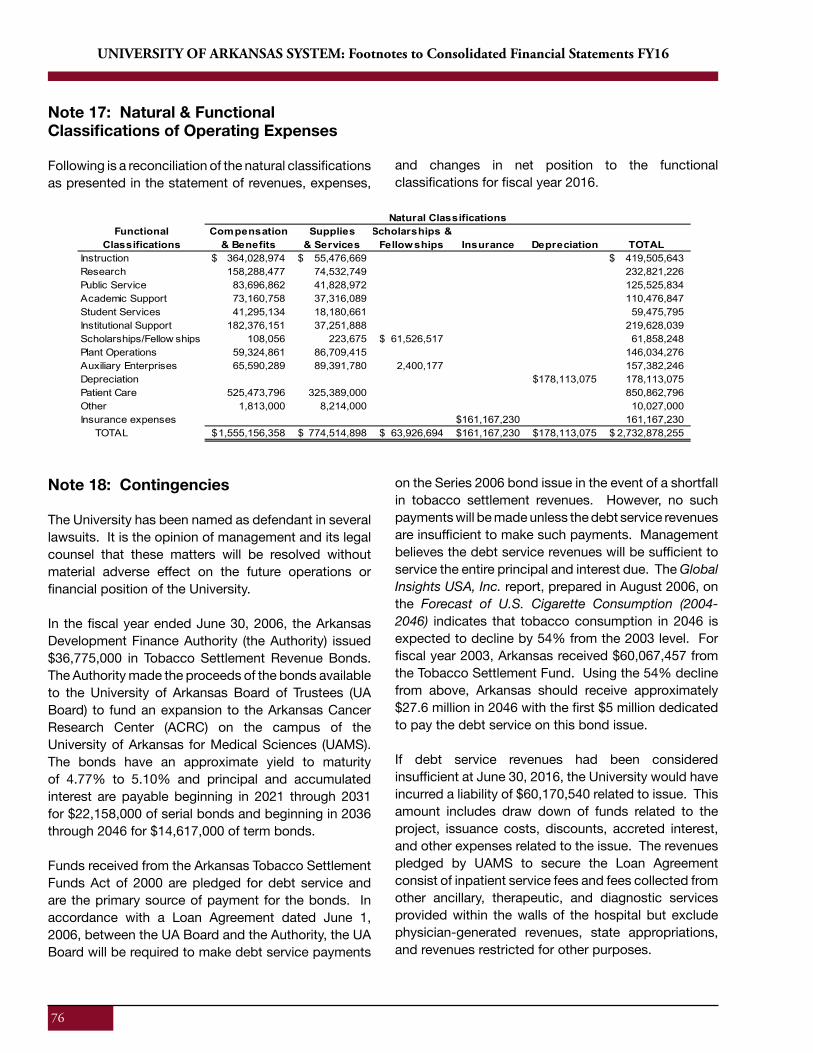
76
UNIVERSITY OF ARKANSAS SYSTEM: Footnotes to Consolidated Financial Statements FY16
Note 17: Natural & Functional Classifications of Operating Expenses Following is a reconciliation of the natural classifications as presented in the statement of revenues, expenses,
and changes in net position to the functional classifications for fiscal year 2016.
Functional Compensation Supplies Scholarships &Classifications & Benefits & Services Fellowships Insurance Depreciation TOTAL
Instruction 364,028,974$ 55,476,669$ 419,505,643$ Research 158,288,477 74,532,749 232,821,226 Public Service 83,696,862 41,828,972 125,525,834 Academic Support 73,160,758 37,316,089 110,476,847 Student Services 41,295,134 18,180,661 59,475,795 Institutional Support 182,376,151 37,251,888 219,628,039 Scholarships/Fellow ships 108,056 223,675 61,526,517$ 61,858,248 Plant Operations 59,324,861 86,709,415 146,034,276 Auxiliary Enterprises 65,590,289 89,391,780 2,400,177 157,382,246 Depreciation 178,113,075$ 178,113,075 Patient Care 525,473,796 325,389,000 850,862,796 Other 1,813,000 8,214,000 10,027,000 Insurance expenses 161,167,230$ 161,167,230 TOTAL 1,555,156,358$ 774,514,898$ 63,926,694$ 161,167,230$ 178,113,075$ 2,732,878,255$
Natural Classifications
Note 18: Contingencies
The University has been named as defendant in several lawsuits. It is the opinion of management and its legal counsel that these matters will be resolved without material adverse effect on the future operations or financial position of the University.
In the fiscal year ended June 30, 2006, the Arkansas Development Finance Authority (the Authority) issued $36,775,000 in Tobacco Settlement Revenue Bonds. The Authority made the proceeds of the bonds available to the University of Arkansas Board of Trustees (UA Board) to fund an expansion to the Arkansas Cancer Research Center (ACRC) on the campus of the University of Arkansas for Medical Sciences (UAMS). The bonds have an approximate yield to maturity of 4.77% to 5.10% and principal and accumulated interest are payable beginning in 2021 through 2031 for $22,158,000 of serial bonds and beginning in 2036 through 2046 for $14,617,000 of term bonds.
Funds received from the Arkansas Tobacco Settlement Funds Act of 2000 are pledged for debt service and are the primary source of payment for the bonds. In accordance with a Loan Agreement dated June 1, 2006, between the UA Board and the Authority, the UA Board will be required to make debt service payments
on the Series 2006 bond issue in the event of a shortfall in tobacco settlement revenues. However, no such payments will be made unless the debt service revenues are insufficient to make such payments. Management believes the debt service revenues will be sufficient to service the entire principal and interest due. The Global Insights USA, Inc. report, prepared in August 2006, on the Forecast of U.S. Cigarette Consumption (2004-2046) indicates that tobacco consumption in 2046 is expected to decline by 54% from the 2003 level. For fiscal year 2003, Arkansas received $60,067,457 from the Tobacco Settlement Fund. Using the 54% decline from above, Arkansas should receive approximately $27.6 million in 2046 with the first $5 million dedicated to pay the debt service on this bond issue.
If debt service revenues had been considered insufficient at June 30, 2016, the University would have incurred a liability of $60,170,540 related to issue. This amount includes draw down of funds related to the project, issuance costs, discounts, accreted interest, and other expenses related to the issue. The revenues pledged by UAMS to secure the Loan Agreement consist of inpatient service fees and fees collected from other ancillary, therapeutic, and diagnostic services provided within the walls of the hospital but exclude physician-generated revenues, state appropriations, and revenues restricted for other purposes.
77
UNIVERSITY OF ARKANSAS SYSTEM: Footnotes to Consolidated Financial Statements FY16
Note 19: Elimination of Inter-Company Transactions
The consolidated financial statements were prepared from financial statements submitted by each campus and the System Administration of the University. The inclusion of inter-company transactions in the consolidated financial statements is not considered materially significant to distort the amounts presented in the consolidated financial statements with the following exceptions, which were eliminated.
FY16 - Statement of Net PositionAn elimination entry was made to reduce accounts receivable by $14,925,551, which represent amounts owed by the campuses to the System Administration for insurance premiums and campus billings for services rendered, amounts owed between campuses, and interest due from a System Administration loan for eVersity from the campuses. Accounts payable was reduced by $14,722,626, representing these billed amounts adjusted by cash in-transit within the system. Cash was increased by $202,925 to account for payments in-transit within the system.
Three loans between University entities were eliminated to reduce assets and liabilities: (1) $750,000 (current portion $150,000) to reflect a loan to ASMSA by the System Administration; and (2) $3,205,308 (current portion $20,506) to reflect a loan from UAMS to UAF and from the campuses to eVersity.
FY16 - Statement of Revenues, Expenses, and Changes in Net PositionAs explained in Note 13, the System Administration administers the self-funded insurance programs for
the University. Insurance premiums remitted to the System Administration by the campuses are shown as insurance revenues, and insurance claims paid are shown as insurance expenditures on the System Administration’s financial statements. The premiums expensed by the campuses are recorded as part of compensation benefits. An elimination entry was made to reduce insurance revenue and compensation/benefits expenditures in the amount of $126,040,114.
An elimination entry was made for billings by System Administration to the campuses for services rendered to reduce operating sales and services revenue and operating supplies/services expense in the amount of $3,238,827. An elimination entry for services provided among campuses in the amount of $910,346. These amounts decreased both other operating revenues and operating supplies/services.
An elimination entry for the System Administration’s interest expense for a loan from the campuses was made to decrease other non-operating revenues (expenses) and investment income in the amount of $10,883.
FY16 - Statement of Cash FlowsThe effects of the elimination entries described above to the statement of net position and the statement of revenues, expenses and changes in net position are also reflected in the statement of cash flows.
78
UNIVERSITY OF ARKANSAS SYSTEM: Footnotes to Consolidated Financial Statements FY16
Note 20: Disaggregation of Accounts Receivable and Accounts Payable
Current accounts receivable balances, net of allowances, at June 30, 2016, and June 30, 2015, as
shown on the Statement of Net Position, consist of the following:
Current accounts payable balances at June 30, 2016, and June 30, 2015, as shown on the Statement of Net Position, consist of the following:
ACCOUNTS PAYABLE June 30, 2016 June 30, 2015Trade related $40,144,294 $36,660,269Payroll related 71,911,113 71,324,316Interest 6,867,742 7,041,665Other 25,759,713 24,014,353 Total $144,682,862 $139,040,603
Note 21: Joint Endeavor
In 1987, the University of Arkansas and the City of Fayetteville engaged in a joint endeavor to operate the Walton Arts Center. Funds were pooled from each entity to provide for the construction and operation of the center. The University of Arkansas/City of Fayetteville Arts Foundation, Inc., now called the Walton Arts Center Foundation, Inc., was established to administer this project and its funds. Activities of the foundation were managed by nine directors - three appointed by the University, three by the City of Fayetteville, and three recommended by the Foundation that were approved by the mayor and chancellor.
The Walton Arts Center Council, Inc. was formed to construct, operate, manage, and maintain the Arts Center in Fayetteville, Arkansas, in accordance with the Interlocal Cooperation Agreement between the City of Fayetteville and the University of Arkansas. The ownership of the Arts Center facilities, including land, is held equally by the City and the University. The Arts Center Council was required to submit an
annual budget to both the City and the University for approval. The Board of Trustees of The Arts Center Council was comprised of five members appointed by the University, five members appointed by the City, and ten members appointed at large, all of whom served as volunteers.
On August 14, 2014, the governing documents establishing and defining the joint endeavor between the City of Fayetteville and the University of Arkansas to operate the Walton Arts Center were revised to ensure clarity and flexibility to allow the Walton Arts Center to meet the arts and entertainment needs of all residents of Northwest Arkansas with a multi-venue system, while at the same time confirming support of the original partnership. Revisions were made to the respective Articles of Incorporation of the Walton Arts Center Foundation, Inc. and the Walton Arts Center Council, Inc. to clarify the purpose of each entity to encompass multiple venues in the Northwest Arkansas region; to allow the Walton Family Foundation to appoint nine additional directors to the Board of Directors of the Arts Center Council while ensuring that the City
79
UNIVERSITY OF ARKANSAS SYSTEM: Footnotes to Consolidated Financial Statements FY16
Note 20: Disaggregation of Accounts Receivable and Accounts Payable
Current accounts receivable balances, net of allowances, at June 30, 2016, and June 30, 2015, as
shown on the Statement of Net Position, consist of the following:
ACCOUNTS RECEIVABLE June 30, 2016 June 30, 2015Student accounts $18,720,830 $20,531,405Non-student accounts 48,733,055 17,529,754Health care related services 20,443,000Grants and contracts 27,674,033 31,222,513Property and sales taxes 2,194,511 2,293,546Other 428,643 419,584 Total $97,751,072 $92,439,802
Current accounts payable balances at June 30, 2016, and June 30, 2015, as shown on the Statement of Net Position, consist of the following:
ACCOUNTS PAYABLE June 30, 2016 June 30, 2015Trade related $40,144,294 $36,660,269Payroll related 71,911,113 71,324,316Interest 6,867,742 7,041,665Other 25,759,713 24,014,353 Total $144,682,862 $139,040,603
Note 21: Joint Endeavor
In 1987, the University of Arkansas and the City of Fayetteville engaged in a joint endeavor to operate the Walton Arts Center. Funds were pooled from each entity to provide for the construction and operation of the center. The University of Arkansas/City of Fayetteville Arts Foundation, Inc., now called the Walton Arts Center Foundation, Inc., was established to administer this project and its funds. Activities of the foundation were managed by nine directors - three appointed by the University, three by the City of Fayetteville, and three recommended by the Foundation that were approved by the mayor and chancellor.
The Walton Arts Center Council, Inc. was formed to construct, operate, manage, and maintain the Arts Center in Fayetteville, Arkansas, in accordance with the Interlocal Cooperation Agreement between the City of Fayetteville and the University of Arkansas. The ownership of the Arts Center facilities, including land, is held equally by the City and the University. The Arts Center Council was required to submit an
annual budget to both the City and the University for approval. The Board of Trustees of The Arts Center Council was comprised of five members appointed by the University, five members appointed by the City, and ten members appointed at large, all of whom served as volunteers.
On August 14, 2014, the governing documents establishing and defining the joint endeavor between the City of Fayetteville and the University of Arkansas to operate the Walton Arts
Center were revised to ensure clarity and flexibility to allow the Walton Arts Center to meet the arts and entertainment needs of all residents of Northwest Arkansas with a multi-venue system, while at the same time confirming support of the original partnership. Revisions were made to the respective Articles of Incorporation of the Walton Arts Center Foundation, Inc. and the Walton Arts Center Council, Inc. to clarify the purpose of each entity to encompass multiple venues in the Northwest Arkansas region; to allow the Walton Family Foundation to appoint nine additional
79
UNIVERSITY OF ARKANSAS SYSTEM: Footnotes to Consolidated Financial Statements FY16
and University maintain their proportionate number of Directors on the Board; to return the City of Fayetteville’s initial payment of $1.5 million to the Foundation back to the City for the City’s use in the construction of a parking facility adjacent to the Walton Arts Center or as otherwise determined by the Fayetteville City Council; and with consent by the University to expend the institution’s initial payment of $1.5 million to the Foundation to help defray the construction costs of the proposed enlargement and enhancement of the Walton Arts Center located in Fayetteville, Arkansas. To date, the University’s funds placed in the endowment have not been spent. Accordingly, the relationship of the University and Walton Arts Center Foundation, Inc., remains unchanged. In the event the funds are expended, as provided in the revised agreement, the Walton Arts Center Foundation, Inc. would no longer be an agent for the University nor would the University have the right of appointment of Walton Arts Center Foundation, Inc. directors.
An Amended and Restated Interlocal Cooperation Agreement was also executed that permits the Walton Arts Center to conduct business as a separate, free-standing non-profit corporation; that budget and operational oversight rests exclusively with the Walton Arts Center Council and confirms the Walton Arts Center is no longer an agent of the University or the City, nor restricted to the terms of the original agreement; and affirms the Walton Arts Center must comply with the terms of a new lease agreement executed by the University, City of Fayetteville and the Walton Arts Center Council.
The lease agreement extends the term to twenty-five years and recognizes the changed scope of the Walton Arts Center. The lease also provides assurances regarding the on-going quality and type of performances at the Walton Arts Center in Fayetteville.
Note 22: Related Parties The following are significant related party transactions other than those with component units discussed in Note 1.
The spouse of a member of the Board of Trustees owns a sports apparel store in Little Rock, Arkansas that has been used for several years by various campuses. In FY16, three campuses bought merchandise from the store with a cost of $68,181. Purchases of these types
are not reviewed and approved by the Board.Another member of the Board of Trustees is the Bank Chairman of the privately-held First Security Bancorp based in Searcy, Arkansas. At June 30, 2016, bank balances held at First Security Bank for UAF and UAMS total $127,078,128 (book balances shown on the Statement of Net Position total $123,343,191). The University has conducted business with the bank for several years. In addition, Crews and Associates, Inc. (Crews) is a wholly owned, non-bank affiliate of First Security Bancorp and has served as one of the University’s bond underwriters for several years. In FY16, the Board of Trustees, with this member abstaining from the vote, approved the selection of Crews as co-underwriter for four bond issues for the Fayetteville campus in the amount of $153,055,000.
The Vice Chancellor and Director of Athletics on the Fayetteville campus is a member of the Board of Directors of Arvest Bank Fayetteville, one of sixteen autonomous community-oriented banks which comprise Arvest Bank Group, Inc., based in Bentonville, Arkansas. At June 30, 2016, bank balances held for the Fayetteville campus at Arvest Bank Group, Inc. banks total $38,366,414 (book balances shown on the Statement of Net Position for the campus total $37,922,585).
The Vice Chancellor for Finance and Administration at the University of Arkansas at Fort Smith sits on the Board of Directors of Educational and Institutional Cooperative Services, Inc. (E&I). Chartered in the State of New York in 1934, the principal role of E&I is to secure group discounts and favorable terms for the member educational institutions by aggregating buying power through large-volume contracts. The University of Arkansas has been a member institution of the E&I Cooperative since 1952. E&I contracts are competitively bid and approved for the University’s use by the Office of State Procurement. UAFS made purchases totaling $506,415 during the fiscal year ended June 30, 2016, utilizing 17 E&I contracts. Note 23: Prior Year Restatement
Statement of Revenues, Expenses, and Changes in Net PositionBeginning net position for the year ended June 30, 2015, as reported on the Statement of Revenues, Expenses and Changes in Net Position, was restated due to the implementation of GASB Statements
80
UNIVERSITY OF ARKANSAS SYSTEM: Footnotes to Consolidated Financial Statements FY16
68, as amended. As a result, Net Position – beginning of the year was reduced by $40,275,748 to reflect the net effect of recognizing the University’s proportionate share of the net pension liability and deferred outflows of resources attributable to the year ended June 30, 2014.
Note 24: Subsequent Events
Fayetteville CampusOn September 8, 2016, the Board of Trustees authorized the issuance of bonds not to exceed $120,000,000 for the purpose of constructing, reconstructing, enlarging and repairing additional facilities including particularly improvements to and expansion of the Donald W. Reynolds Razorback Stadium and renovation and replacement of the Frank Broyles Athletic Center and related projects. On October 5, 2016, the University sold the Board of Trustees of the University of Arkansas Athletic Facilities Revenue Bonds (Fayetteville Campus), Tax-Exempt Series 2016A with a par amount of $24,845,000 and Taxable Series 2016B with a par amount of $90,000,000. The bond issues were closed and delivered October 19, 2016.
Fort Smith CampusOn September 8, 2016, the Board of Trustees authorized the issuance of bonds not to exceed $29,500,000 to refund all or a portion of the Series 2009 Student Fee Revenue Bonds and the Series 2010B Student Fee Revenue Bonds. On October 6, 2016, the University sold the Board of Trustees of the University of Arkansas Student Fee Refunding Revenue Bonds, Tax-Exempt Series 2016 (Fort Smith Campus), with a par value of $19,500,000. The bond issues were closed and delivered October 20, 2016.
Little Rock CampusDr. Andrew Rogerson became the chancellor at the Little Rock campus on September 1, 2016.
Batesville CampusOn September 8, 2016, the Board approved the pursuit of a loan from the Arkansas Department of Higher Education’s College Savings Bond Revolving Loan Fund. The Arkansas Department of Higher Education Coordinating Board subsequently approved the loan on September 30, 2016, in the amount of $2,000,000 with a term of ten years with an annual interest rate not to exceed 0.68%. Proceeds from the loan will be used to construct a Workforce Training Center. The remainder of funds will be provided by campus reserves.
Pending MergersOn July 28, 2016, the Board of Trustees entered into a merger agreement with the Board of Trustees of Rich Mountain Community College (“RMCC”), a publicly supported community college located in Mena, Arkansas. After the merger, RMCC will be known as University of Arkansas Community College at Rich Mountain. The merger, which is to be effective January 1, 2017, is subject to the approval of accreditation by the Higher Learning Commission of the North Central Association.
On July 28, 2016, the Board entered into a merger agreement with the Board of Trustees of Pulaski Technical College (“PTC”), a publicly supported technical college located in Pulaski County, Arkansas. After the merger, PTC will be known as University of Arkansas - Pulaski Technical College. The merger with PTC, which is to be effective February 1, 2017, is not only subject to the Higher Learning Commission approval of accreditation but also approval by the Arkansas General Assembly of enacting legislation authorizing the control of UA-Pulaski Tech be vested with the Board of Trustees.
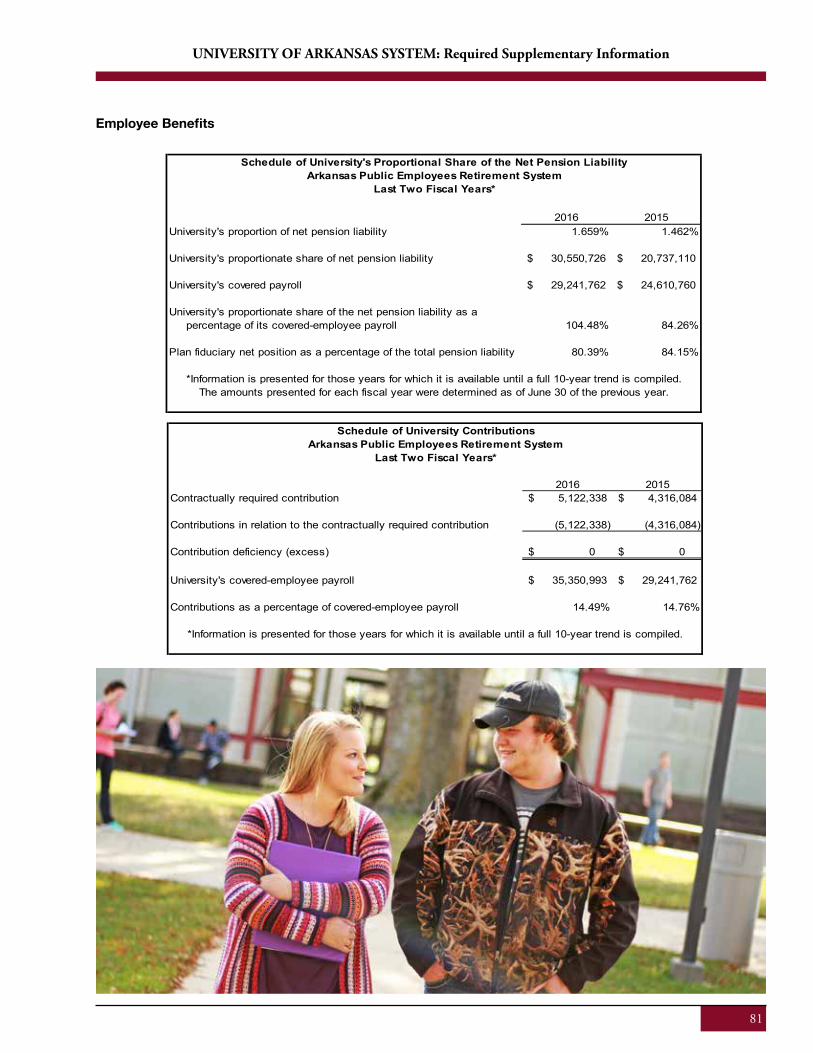
81
UNIVERSITY OF ARKANSAS SYSTEM: Required Supplementary Information
Employee Benefits
2016 2015University's proportion of net pension liability 1.659% 1.462%
University's proportionate share of net pension liability 30,550,726$ 20,737,110$
University's covered payroll 29,241,762$ 24,610,760$
University's proportionate share of the net pension liability as a percentage of its covered-employee payroll 104.48% 84.26%
Plan fiduciary net position as a percentage of the total pension liability 80.39% 84.15%
*Information is presented for those years for which it is available until a full 10-year trend is compiled.The amounts presented for each fiscal year were determined as of June 30 of the previous year.
Schedule of University's Proportional Share of the Net Pension LiabilityArkansas Public Employees Retirement System
Last Two Fiscal Years*
82
UNIVERSITY OF ARKANSAS SYSTEM: Required Supplementary Information
Employee Benefits
2016 2015University's proportion of net pension liability 1.659% 1.462%
University's proportionate share of net pension liability 30,550,726$ 20,737,110$
University's covered payroll 29,241,762$ 24,610,760$
University's proportionate share of the net pension liability as a percentage of its covered-employee payroll 104.48% 84.26%
Plan fiduciary net position as a percentage of the total pension liability 80.39% 84.15%
*Information is presented for those years for which it is available until a full 10-year trend is compiled.The amounts presented for each fiscal year were determined as of June 30 of the previous year.
Schedule of University's Proportional Share of the Net Pension LiabilityArkansas Public Employees Retirement System
Last Two Fiscal Years*
2016 2015Contractually required contribution 5,122,338$ 4,316,084$
Contributions in relation to the contractually required contribution (5,122,338) (4,316,084)
Contribution deficiency (excess) $ 0 $ 0
University's covered-employee payroll 35,350,993$ 29,241,762$
Contributions as a percentage of covered-employee payroll 14.49% 14.76%
*Information is presented for those years for which it is available until a full 10-year trend is compiled.
Schedule of University ContributionsArkansas Public Employees Retirement System
Last Two Fiscal Years*
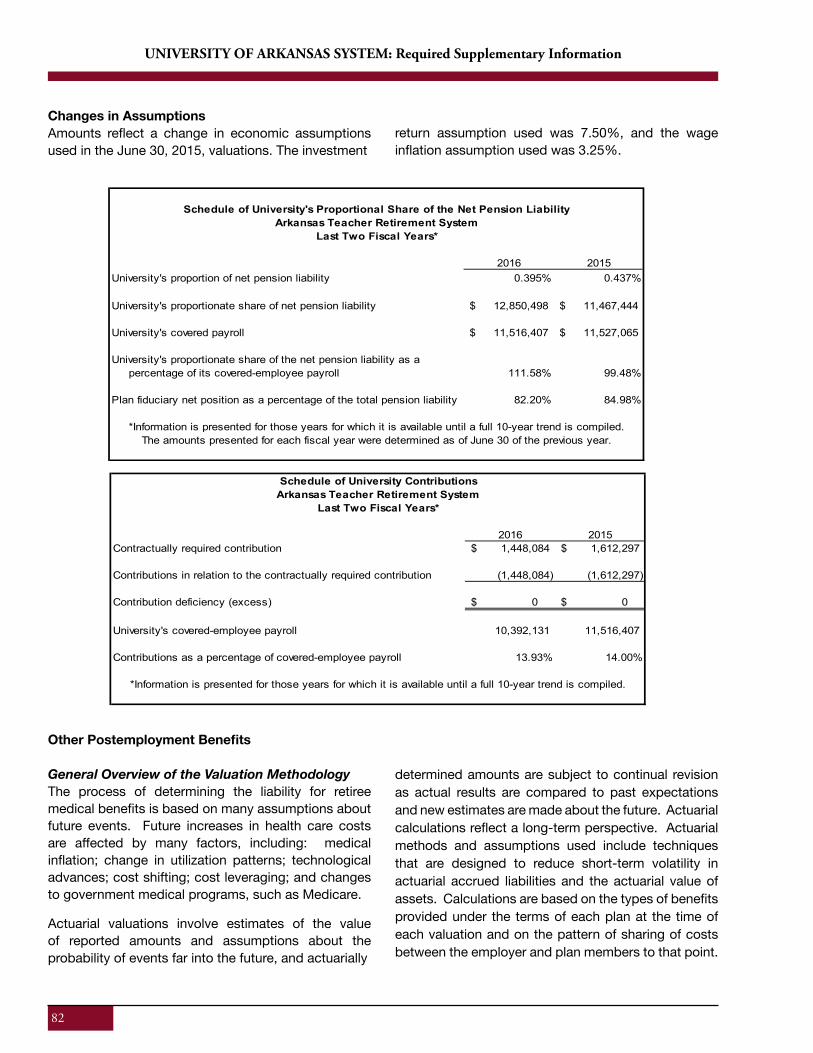
82
UNIVERSITY OF ARKANSAS SYSTEM: Required Supplementary Information
2016 2015University's proportion of net pension liability 0.395% 0.437%
University's proportionate share of net pension liability 12,850,498$ 11,467,444$
University's covered payroll 11,516,407$ 11,527,065$
University's proportionate share of the net pension liability as a percentage of its covered-employee payroll 111.58% 99.48%
Plan fiduciary net position as a percentage of the total pension liability 82.20% 84.98%
*Information is presented for those years for which it is available until a full 10-year trend is compiled.The amounts presented for each fiscal year were determined as of June 30 of the previous year.
Schedule of University's Proportional Share of the Net Pension LiabilityArkansas Teacher Retirement System
Last Two Fiscal Years*
Changes in AssumptionsAmounts reflect a change in economic assumptions used in the June 30, 2015, valuations. The investment
return assumption used was 7.50%, and the wage inflation assumption used was 3.25%.
Other Postemployment Benefits
General Overview of the Valuation MethodologyThe process of determining the liability for retiree medical benefits is based on many assumptions about future events. Future increases in health care costs are affected by many factors, including: medical inflation; change in utilization patterns; technological advances; cost shifting; cost leveraging; and changes to government medical programs, such as Medicare.
Actuarial valuations involve estimates of the value of reported amounts and assumptions about the probability of events far into the future, and actuarially
determined amounts are subject to continual revision as actual results are compared to past expectations and new estimates are made about the future. Actuarial calculations reflect a long-term perspective. Actuarial methods and assumptions used include techniques that are designed to reduce short-term volatility in actuarial accrued liabilities and the actuarial value of assets. Calculations are based on the types of benefits provided under the terms of each plan at the time of each valuation and on the pattern of sharing of costs between the employer and plan members to that point.
83
UNIVERSITY OF ARKANSAS SYSTEM: Required Supplementary Information
2016 2015University's proportion of net pension liability 0.395% 0.437%
University's proportionate share of net pension liability 12,850,498$ 11,467,444$
University's covered payroll 11,516,407$ 11,527,065$
University's proportionate share of the net pension liability as a percentage of its covered-employee payroll 111.58% 99.48%
Plan fiduciary net position as a percentage of the total pension liability 82.20% 84.98%
*Information is presented for those years for which it is available until a full 10-year trend is compiled.The amounts presented for each fiscal year were determined as of June 30 of the previous year.
Schedule of University's Proportional Share of the Net Pension LiabilityArkansas Teacher Retirement System
Last Two Fiscal Years*
2016 2015Contractually required contribution 1,448,084$ 1,612,297$
Contributions in relation to the contractually required contribution (1,448,084) (1,612,297)
Contribution deficiency (excess) $ 0 $ 0
University's covered-employee payroll 10,392,131 11,516,407
Contributions as a percentage of covered-employee payroll 13.93% 14.00%
*Information is presented for those years for which it is available until a full 10-year trend is compiled.
Schedule of University ContributionsArkansas Teacher Retirement System
Last Two Fiscal Years*
Changes in AssumptionsAmounts reflect a change in economic assumptions used in the June 30, 2015, valuations. The investment
return assumption used was 7.50%, and the wage inflation assumption used was 3.25%.
Other Postemployment Benefits
General Overview of the Valuation MethodologyThe process of determining the liability for retiree medical benefits is based on many assumptions about future events. Future increases in health care costs are affected by many factors, including: medical inflation; change in utilization patterns; technological advances; cost shifting; cost leveraging; and changes to government medical programs, such as Medicare.
Actuarial valuations involve estimates of the value of reported amounts and assumptions about the probability of events far into the future, and actuarially
determined amounts are subject to continual revision as actual results are compared to past expectations and new estimates are made about the future. Actuarial calculations reflect a long-term perspective. Actuarial methods and assumptions used include techniques that are designed to reduce short-term volatility in actuarial accrued liabilities and the actuarial value of assets. Calculations are based on the types of benefits provided under the terms of each plan at the time of each valuation and on the pattern of sharing of costs between the employer and plan members to that point.
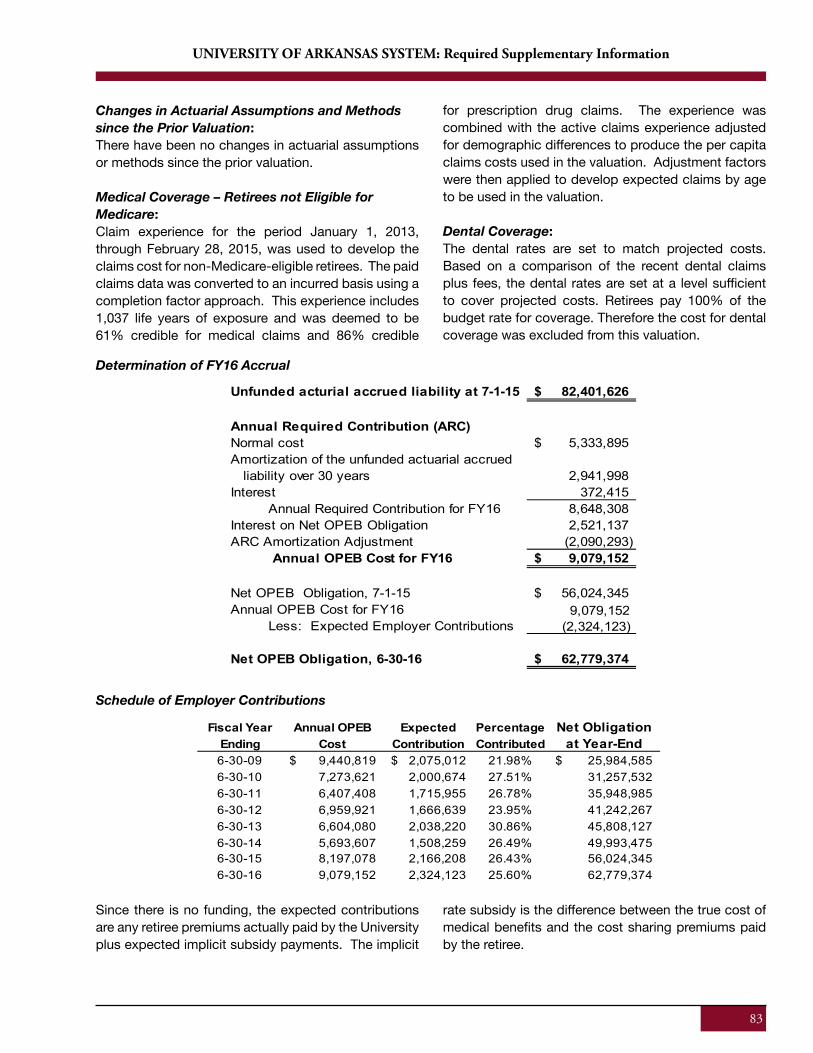
83
UNIVERSITY OF ARKANSAS SYSTEM: Required Supplementary Information
Changes in Actuarial Assumptions and Methods since the Prior Valuation: There have been no changes in actuarial assumptions or methods since the prior valuation.
Medical Coverage – Retirees not Eligible for Medicare:Claim experience for the period January 1, 2013, through February 28, 2015, was used to develop the claims cost for non-Medicare-eligible retirees. The paid claims data was converted to an incurred basis using a completion factor approach. This experience includes 1,037 life years of exposure and was deemed to be 61% credible for medical claims and 86% credible
for prescription drug claims. The experience was combined with the active claims experience adjusted for demographic differences to produce the per capita claims costs used in the valuation. Adjustment factors were then applied to develop expected claims by age to be used in the valuation.
Dental Coverage: The dental rates are set to match projected costs. Based on a comparison of the recent dental claims plus fees, the dental rates are set at a level sufficient to cover projected costs. Retirees pay 100% of the budget rate for coverage. Therefore the cost for dental coverage was excluded from this valuation.
Determination of FY16 Accrual
Schedule of Employer Contributions
Since there is no funding, the expected contributions are any retiree premiums actually paid by the University plus expected implicit subsidy payments. The implicit
rate subsidy is the difference between the true cost of medical benefits and the cost sharing premiums paid by the retiree.
Fiscal Year Annual OPEB Expected Percentage Net ObligationEnding Cost Contribution Contributed at Year-End6-30-09 9,440,819$ 2,075,012$ 21.98% 25,984,585$ 6-30-10 7,273,621 2,000,674 27.51% 31,257,532 6-30-11 6,407,408 1,715,955 26.78% 35,948,985 6-30-12 6,959,921 1,666,639 23.95% 41,242,267 6-30-13 6,604,080 2,038,220 30.86% 45,808,127 6-30-14 5,693,607 1,508,259 26.49% 49,993,475 6-30-15 8,197,078 2,166,208 26.43% 56,024,345 6-30-16 9,079,152 2,324,123 25.60% 62,779,374
83
UNIVERSITY OF ARKANSAS SYSTEM: Required Supplementary Information
Changes in Actuarial Assumptions and Methods since the Prior Valuation: There have been no changes in actuarial assumptions or methods since the prior valuation.
Medical Coverage – Retirees not Eligible for Medicare:Claim experience for the period January 1, 2013, through February 28, 2015, was used to develop the claims cost for non-Medicare-eligible retirees. The paid claims data was converted to an incurred basis using a completion factor approach. This experience includes 1,037 life years of exposure and was deemed to be 61% credible for medical claims and 86% credible
for prescription drug claims. The experience was combined with the active claims experience adjusted for demographic differences to produce the per capita claims costs used in the valuation. Adjustment factors were then applied to develop expected claims by age to be used in the valuation.
Dental Coverage: The dental rates are set to match projected costs. Based on a comparison of the recent dental claims plus fees, the dental rates are set at a level sufficient to cover projected costs. Retirees pay 100% of the budget rate for coverage. Therefore the cost for dental coverage was excluded from this valuation.
Determination of FY16 Accrual
Schedule of Employer Contributions
Since there is no funding, the expected contributions are any retiree premiums actually paid by the University plus expected implicit subsidy payments. The implicit
rate subsidy is the difference between the true cost of medical benefits and the cost sharing premiums paid by the retiree.
Unfunded acturial accrued liability at 7-1-15 82,401,626$
Annual Required Contribution (ARC)Normal cost 5,333,895$ Amortization of the unfunded actuarial accrued liability over 30 years 2,941,998 Interest 372,415 Annual Required Contribution for FY16 8,648,308 Interest on Net OPEB Obligation 2,521,137 ARC Amortization Adjustment (2,090,293) Annual OPEB Cost for FY16 9,079,152$
Net OPEB Obligation, 7-1-15 56,024,345$ Annual OPEB Cost for FY16 9,079,152 Less: Expected Employer Contributions (2,324,123)
Net OPEB Obligation, 6-30-16 62,779,374$
Fiscal Year Annual OPEB Expected Percentage Net ObligationEnding Cost Contribution Contributed at Year-End6-30-09 9,440,819$ 2,075,012$ 21.98% 25,984,585$ 6-30-10 7,273,621 2,000,674 27.51% 31,257,532 6-30-11 6,407,408 1,715,955 26.78% 35,948,985 6-30-12 6,959,921 1,666,639 23.95% 41,242,267 6-30-13 6,604,080 2,038,220 30.86% 45,808,127 6-30-14 5,693,607 1,508,259 26.49% 49,993,475 6-30-15 8,197,078 2,166,208 26.43% 56,024,345 6-30-16 9,079,152 2,324,123 25.60% 62,779,374
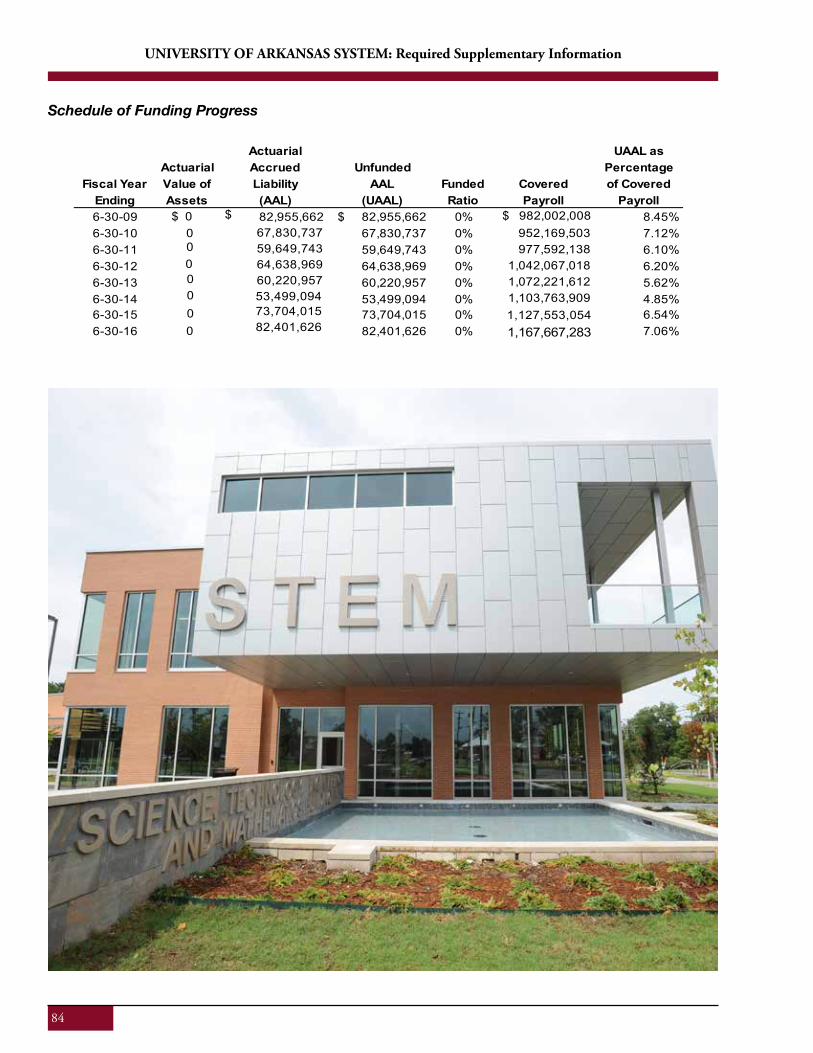
84
UNIVERSITY OF ARKANSAS SYSTEM: Required Supplementary Information
Schedule of Funding Progress
85
UNIVERSITY OF ARKANSAS SYSTEM: Required Supplementary Information
Schedule of Funding Progress
Actuarial UAAL asActuarial Accrued Unfunded Percentage
Fiscal Year Value of Liability AAL Funded Covered of CoveredEnding Assets (AAL) (UAAL) Ratio Payroll Payroll6-30-09 82,955,662 $ 82,955,662$ 0% 8.45%6-30-10 67,830,737 0% 7.12%6-30-11 59,649,743 0% 6.10%6-30-12 64,638,969 0% 6.20%6-30-13 60,220,957 0% 5.62%6-30-14 53,499,094 0% 4.85%6-30-15 73,704,015 0% 6.54%6-30-16
67,830,737 59,649,743 64,638,969 60,220,957 53,499,094 73,704,015 82,401,626 82,401,626 0%
$ 982,002,008 952,169,503 977,592,138 1,042,067,018 1,072,221,612 1,103,763,909 1,127,553,054 1,167,667,283 7.06%
$ 0 0 0
0 0 0 0 0
85
UNIVERSITY OF ARKANSAS SYSTEM: Supplemental Information - Campuses & Affilliates
The University of Arkansas System is a comprehensive, publicly-supported higher education system composed of unique institutions, units and divisions that share the singular goal of serving Arkansas residents and others by developing and sharing knowledge to impact an ever changing world. The System provides access to academic and professional education, and develops intellectual growth and cultural awareness in its students, staff and faculty. The System further promotes an atmosphere of excellence that honors the heritage and diversity of our state and nation, and provides students, researchers and professionals with tools to promote responsible stewardship of human, natural and financial resources at home and abroad.
Enrollment listed by campus are the preliminary official 11th-day headcounts as provided in September 2016 to the Arkansas Department of Higher Education for Fall 2016.
UNIVERSITY OF ARKANSAS, FAYETTEVILLE
Established: 1871Enrollment: 27,194www.uark.edu Founded in 1871, the University of Arkansas, Fayetteville (UAF) is the flagship institution of the University of Arkansas System. UAF is the state’s foremost partner, resource and catalyst for education and economic development and is a university for the integration of student engagement, scholarship, research and innovation that collectively transforms lives and inspires leadership for a global society.
As Arkansas’s first land-grant university, UAF has a mandate to teach, conduct research and perform outreach. The university offers baccalaureate, master’s, doctoral, professional and specialist degree programs, including a Juris Doctor degree and a LL.M. in Agriculture and Food Law. The Carnegie Foundation for the Advancement of Teaching places UAF in its highest category for research activity, a classification shared by only two percent of universities nationwide. Research activity is a significant academic element at the university and an economic engine for the state.
UNIVERSITY OF ARKANSAS AT FORT SMITH
Established: 1928Joined System: 2002Enrollment: 6,597www.uafs.edu
Originally established in 1928 as part of the local school system with college-parallel course offerings, the University of Arkansas at Fort Smith (UAFS) joined the UA System in 2002 and began transitioning from a two-year college to a four-year regional university.
With a mission and vision to connect education with careers and a focus on preparing students to succeed in an ever-changing global world while advancing economic development and quality of place, UAFS is renewing the focus on workforce development. Students are being prepared for careers in the “real world” traditional and cutting-edge technological fields such as robotics, information science technology, and cyber security. New degrees, such as a program focusing on the latest relational database management systems, are being developed to keep pace with changing business and industry needs.
UNIVERSITY OF ARKANSAS AT LITTLE ROCK
Established: 1927 Joined system: 1969Enrollment: 11,710 www.ualr.edu
The University of Arkansas at Little Rock (UALR), located in the state’s capital city, offers a comprehensive academic experience at the baccalaureate, master’s and doctoral levels; innovative research opportunities; a quality faculty educated from around the world; and a rich student life experience with athletics, housing, study abroad, Greek life and service learning.
From high school students and traditional residential and graduate degree seekers, to mid-life adults and senior citizens, UALR fulfills one of the state’s greatest
86
UNIVERSITY OF ARKANSAS SYSTEM: Supplemental Information - Campuses & Affilliates
needs by educating more college graduates. UALR’s faculty and staff in programs such as the Academic Success Center and the Mentoring Network provide students with extra help to be successful.
UALR has been selected by the Carnegie Foundation for the Advancement of Teaching for the Community Engagement classification – the only institution in Arkansas in this category. The university is widely recognized for its involvement in community issues such as race and ethnicity, criminal justice and pre-kindergarten to 12th grade education. UALR students, faculty and staff are actively involved in service-learning activities around the state through partnerships with the Clinton School of Public Service and the Shepherd Higher Education Consortium on Poverty.
UNIVERSITY OF ARKANSAS FOR MEDICAL SCIENCES Established: 1879 Enrollment: 2,869www.uams.edu and www.uamshealth.com The University of Arkansas for Medical Sciences in Little Rock (UAMS) is the only academic health sciences university in Arkansas. It is the state’s largest public employer with more than 10,000 employees in 73 of the state’s 75 counties. Clinical affiliates include Arkansas Children’s Hospital and the Central Arkansas Veterans Healthcare System.
With its combination of education, research and clinical programs, UAMS has a unique capacity to lead health care improvement in the state. Its assets include The University Hospital of Arkansas, regional programs (including Tele-education, Rural Hospital Program, and Area Health Education Centers located throughout the state), the Translational Research Institute, the Winthrop P. Rockefeller Cancer Institute, the Jackson T. Stephens Spine & Neurosciences Institute, the Donald W. Reynolds Institute on Aging, the Harvey & Bernice Jones Eye institute, the Psychiatric Research Institute and the Myeloma Institute for Research & Therapy.
UNIVERSITY OF ARKANSAS AT MONTICELLO
Established: 1909Joined System: 1971Enrollment: 3,925www.uamont.edu
Founded in 1909 as the Fourth District Agricultural School, the University of Arkansas at Monticello (UAM) is one of the region’s few remaining open admissions universities. Serving southeast Arkansas, UAM offers baccalaureate and master’s degree programs, as well as two-year associate degrees, technical certificates and certificates of proficiency. Colleges of Technology are located in Crossett and McGehee.
UAM has established a reputation for academic excellence in areas such as forestry, nursing, teacher education, pre-medicine, health-related sciences, business and social science. The university is home to the Arkansas Forest Resources Center, the Southeast Agriculture Research and Extension Center, and one of the South’s top exercise physiology laboratories.
UAM has also added a program in spatial information systems, popular programs in social work and criminal justice, a fast-track master’s degree program to place more teachers in the classroom, an online master’s degree program in Physical Education and Coaching, a Master of Fine Arts in Creative Writing, and an online Master of Music in Jazz Studies.
UNIVERSITY OF ARKANSAS AT PINE BLUFF
Established: 1873Joined System: 1972Enrollment: 2,821www.uapb.edu
An 1890 land-grant institution, the University of Arkansas at Pine Bluff (UAPB) is the second-oldest university and the only public historically black university in Arkansas. Though the main campus is in Pine Bluff, its reach is worldwide. With the addition of the Arkansas Research and Education Optical Network (ARE-ON) students can
87
UNIVERSITY OF ARKANSAS SYSTEM: Required Supplementary Information
engage in information exchange with others anywhere in the world. Since its establishment, the institution has worked to create an environment that inculcates learning, growth and productivity.
UAPB offers undergraduate programs, master’s degree programs, and a PhD program in Aquaculture & Fisheries, one of the country’s leading programs in aquaculture and fisheries. The master’s degree program in Computer Science and Technology offers the contemporary option of cyber security. The university’s bachelor degree program in regulatory science and master’s degree program in agricultural regulations are designated as Centers of Excellence by the U.S. Department of Agriculture. Other areas of emphasis at UAPB include teacher education, minority business development, student leadership development, and its Science, Technology, Engineering and Math (STEM) Academy.
UAPB research and extension programs support economic development in Arkansas by identifying solutions to problems faced by Arkansas aquaculture growers. Arkansas is the second-leading aquaculture producing state in the U.S., and aquaculture is the leading economic activity in several counties in Arkansas.
COSSATOT COMMUNITY COLLEGE OF THE UNIVERSITY OF ARKANSAS
Established: 1975 Joined System: 2001 Enrollment: 1,519 www.cccua.edu
Cossatot Community College of the University of Arkansas (CCCUA) is located in De Queen with classroom sites in Nashville, Ashdown, Lockesburg, Dierks and Foreman. In 2015 the financial website Wallet Hub ranked UA Cossatot the 48th best community college in the United States. The college offers both technical certification and associate’s degrees and collaborates with other colleges and universities to offer bachelor’s and master’s degrees. Accredited by the Higher Learning Commission of the North Central Association of Colleges and Schools, CCCUA is the only community college in the state supported by sales taxes in three separate counties and one city, and has the highest percentage of Hispanic students in Arkansas.
PHILLIPS COMMUNITY COLLEGE OF THE UNIVERSITY OF ARKANSAS
Established: 1964 Joined system: 1996 Enrollment: 1,755 www.pccua.edu
The first community college established in Arkansas, Phillips Community College of the University of Arkansas (PCCUA) is a multi-campus, two-year college serving Eastern Arkansas. Students are offered academic, occupational/technical and continuing education programs. PCCUA has campuses in DeWitt, Helena-W. Helena and Stuttgart. UNIVERSITY OF ARKANSAS COMMUNITY COLLEGE AT BATESVILLE
Established: 1975 Joined System: 1997 Enrollment: 1,347 www.uaccb.edu
The University of Arkansas Community College at Batesville (UACCB) serves a multi-county area in north central Arkansas, offering associate degrees, technical certificates, certificates of proficiency, adult education (GED and ESL) and kids’ college. Accredited by the Higher Learning Commission of the North Central Association of Colleges and Schools, the campus has expanded program offerings and student services in order to meet its student-focused mission. Supported by an Independence County sales tax, UACCB provides affordable access to technical education and college transfer programs that meet the diverse higher education needs of the citizens of Arkansas.
UNIVERSITY OF ARKANSAS COMMUNITY COLLEGE AT HOPE Year Established: 1965 Joined System: 1996 Enrollment: 1,531www.uacch.edu
Serving Southwest Arkansas, the University of Arkansas Community College at Hope (UACCH) offers the first two years of a traditional college education transferable to a four-year university, as well as an array of certificate programs to prepare students for
88
UNIVERSITY OF ARKANSAS SYSTEM: Required Supplementary Information
an ever-changing workforce. UACCH is an accredited, open-access institution that connects students and community partners to quality education and supports a culture of academic, occupational, personal growth and enrichment programs throughout Southwest Arkansas. UACCH is supported by a Hempstead County sales tax.
With the opening of UACCH-Texarkana Instructional Facility in 2012, UACCH became better prepared to be a regional contributor to the educational needs of southwest Arkansas, and has enabled the College to expand programs in both the technical and industrial areas, as well as the health professions. Through a partnership with the University of Arkansas at Little Rock (UALR), students are able to complete bachelor degrees. UNIVERSITY OF ARKANSAS COMMUNITY COLLEGE AT MORRILTON
Established: 1961 Joined system: 2001 Enrollment: 2, 032 www.uaccm.edu
The University of Arkansas Community College at Morrilton (UACCM) is a two-year institution offering university-transfer and career-specific training programs, adult education, workforce education and community outreach programs. UACCM offers associate of arts and associate of science degrees designed for university transfer, as well as associate of applied science degrees, technical certificates and certificates of proficiency designed for immediate entry into the job market. UACCM is supported by a Conway County sales tax.
UACCM has university partnerships to allow completion of bachelor’s degrees with students taking most of their classes on the campus or online.
ARKANSAS SCHOOL FOR MATHEMATICS, SCIENCES AND THE ARTS
Established: 1993 Joined System: 2004 asmsa.org
The Arkansas School for Mathematics, Sciences and the Arts (ASMSA) is the state’s premier public high school focusing on excellence in mathematics,
science and the arts. Located in historic downtown Hot Springs, ASMSA is one of sixteen residential high schools in the country specializing in the education of gifted and talented students who have an interest and aptitude for advanced careers in mathematics and science. All classes are taught at the college level, and the school offers courses for college credit. Each year, ASMSA further cultivates the talents of bright students, many of whom begin college at the sophomore level.
Beyond the residential experience, ASMSA’s outreach programs provide Saturday enrichment opportunities for motivated middle and early high school students. Digital learning programs like the Global Languages and Shared Societies (GLASS) Initiative and Arkansas STEM Pathways provide online instruction for students whose local school districts lack the resources for advanced instruction.
UNIVERSITY OF ARKANSAS CLINTON SCHOOL OF PUBLIC SERVICE
Established: 2004 www.clintonschool.uasys.edu
Located on the grounds of the William J. Clinton Presidential Center and Park in Little Rock, the University of Arkansas Clinton School of Public Service is the first graduate school in the nation to offer a Master of Public Service (MPS) degree, helping students further their careers in the areas of government, non-profit, volunteer and private sector service. As part of the school’s unique curriculum, students complete hands-on public service projects, including local work in Arkansas communities and international projects across the world. The school also hosts a renowned public lecture series, featuring leaders in government, politics, foreign policy, journalism and philanthropy.
The model is unique in higher education because most of the school’s financial investment is in scholarship and service and not in infrastructure and overhead. Little Rock’s River Market serves as its student union. The Central Arkansas Main Library is the school library. When there is a need for auditorium space, the school accesses the Clinton Library, the Statehouse Convention Center or the Ron Robinson Theater--all of which are in walking distance.
The school’s curriculum is enhanced with a national and international speaker series (www.clintonschoolspeakers.com) which brings in leaders
89
UNIVERSITY OF ARKANSAS SYSTEM: Required Supplementary Information
and scholars from the arts, business, education, government, international development, nonprofits, philanthropy and public service and are free and open to the public. The speakers have included United States presidents and ambassadors, Pulitzer Prize recipients, and Nobel Prize winners.
DIVISION OF AGRICULTURE
Established: 1959www.division.uaex.edu
The University of Arkansas System Division of Agriculture is the statewide research and extension agency serving Arkansas agriculture, communities, families and youth. The mission of the division is to discover new knowledge, incorporate it into practical applications and assist Arkansans in its application. The division is comprised of two principal units: the Agriculture Experiment Station and the Cooperative Extension Service. Division faculty and facilities are located on several university campuses, at regional research and extension centers, branch stations and other locations. An extension office is located in each county in cooperation with county governments.
The Division of Agriculture has earned patents in a variety of research programs in food science, biological and agricultural engineering, poultry science, crop, soil, and environmental sciences, and the Rice Research and Extension Center. Volunteers are an extremely important component of delivering Extension programs, particularly in 4-H, Extension Homemakers and Master Gardeners.
ARKANSAS ARCHEOLOGICAL SURVEY
Established: 1967 www.uark.edu/campus-resources/archinfo/
The mission of the Arkansas Archeological Survey is to study and protect the 13,000-year archeological heritage of Arkansas, to preserve and manage information and collections from archeological sites, and to communicate what is learned to the people of the state. The survey has research stations across the state, each with a full-time Ph.D. archeologist associated with regional higher education institutions and state parks.
The archeologists conduct research, assist other state and federal agencies to help promote the economic importance of the state’s heritage resources, and are available to local officials, landowners, educators and students, and citizens in need of information about archeology or archeological sites.
Arkansas Archeological Survey databases contain information on more than 48,000 archeological sites and 8,000 projects, available to qualified professional archeologists at state and federal agencies, colleges and universities, and federally recognized tribes. The Survey’s curation facility, managed jointly with the University of Arkansas Museum, provides a secure, state-of-the-art home for both Survey and University artifact collections. Students and teachers across Arkansas use the Survey’s educational websites to learn about our state’s prehistoric and historic cultural heritage.
CRIMINAL JUSTICE INSTITUTE
Established: 1988 www.cji.edu
The Criminal Justice Institute (CJI) is a campus of the University of Arkansas System that serves a unique population of non-traditional students—certified law enforcement professionals who are actively employed within the state’s law enforcement organizations. The Institute is committed to making communities safer by supporting law enforcement professionals through training, education, resources and collaborative partnerships.
Utilizing both online learning opportunities and classroom-based instruction, CJI provides an educational experience designed to enhance the performance and professionalism of law enforcement in progressive areas of policing, including law enforcement leadership and management, forensic sciences, computer technologies and related crimes, traffic safety, illicit drug investigations and school safety. In addition, the Institute develops and delivers curriculum in cyberterrorism and sexual assault management and investigation through the National Center for Rural Law Enforcement (NCRLE), a division of CJI committed to helping rural law enforcement agencies effectively combat crime in their communities.
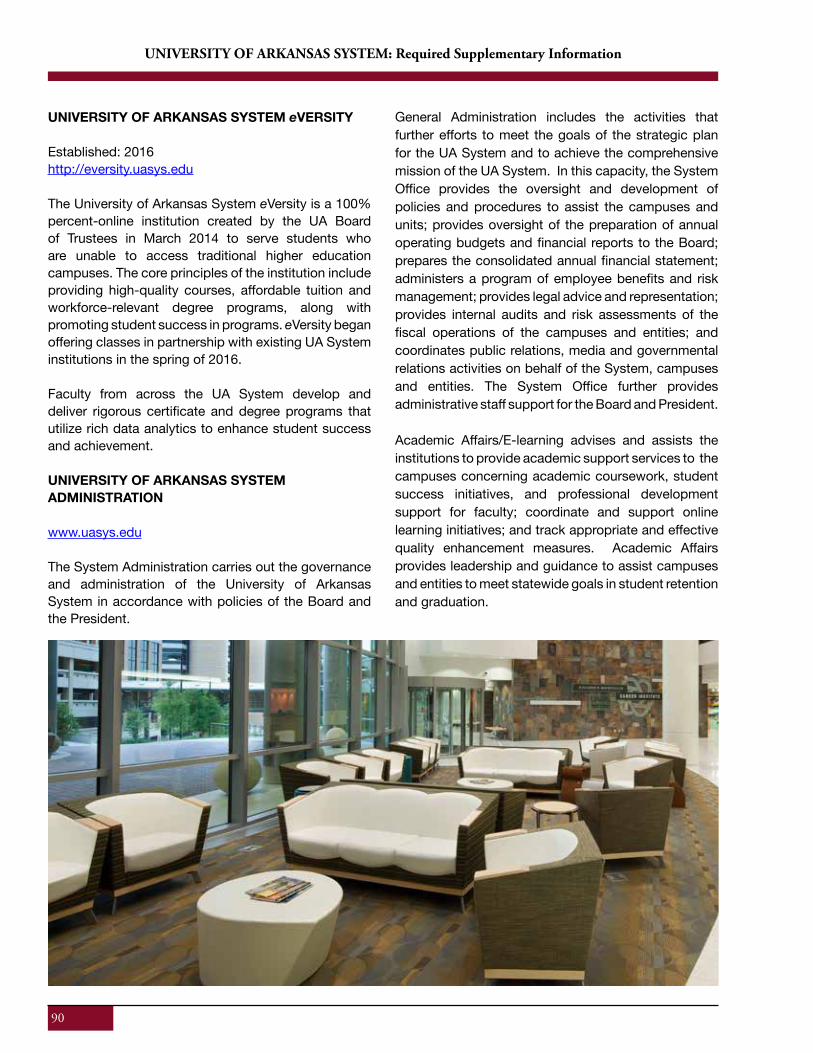
90
UNIVERSITY OF ARKANSAS SYSTEM: Required Supplementary Information
UNIVERSITY OF ARKANSAS SYSTEM eVERSITY
Established: 2016 http://eversity.uasys.edu
The University of Arkansas System eVersity is a 100% percent-online institution created by the UA Board of Trustees in March 2014 to serve students who are unable to access traditional higher education campuses. The core principles of the institution include providing high-quality courses, affordable tuition and workforce-relevant degree programs, along with promoting student success in programs. eVersity began offering classes in partnership with existing UA System institutions in the spring of 2016.
Faculty from across the UA System develop and deliver rigorous certificate and degree programs that utilize rich data analytics to enhance student success and achievement.
UNIVERSITY OF ARKANSAS SYSTEM ADMINISTRATION
www.uasys.edu
The System Administration carries out the governance and administration of the University of Arkansas System in accordance with policies of the Board and the President.
General Administration includes the activities that further efforts to meet the goals of the strategic plan for the UA System and to achieve the comprehensive mission of the UA System. In this capacity, the System Office provides the oversight and development of policies and procedures to assist the campuses and units; provides oversight of the preparation of annual operating budgets and financial reports to the Board; prepares the consolidated annual financial statement; administers a program of employee benefits and risk management; provides legal advice and representation; provides internal audits and risk assessments of the fiscal operations of the campuses and entities; and coordinates public relations, media and governmental relations activities on behalf of the System, campuses and entities. The System Office further provides administrative staff support for the Board and President. Academic Affairs/E-learning advises and assists the institutions to provide academic support services to the campuses concerning academic coursework, student success initiatives, and professional development support for faculty; coordinate and support online learning initiatives; and track appropriate and effective quality enhancement measures. Academic Affairs provides leadership and guidance to assist campuses and entities to meet statewide goals in student retention and graduation.
UNIVERSITY OF ARKANSAS, FAYETTEVILLEJoseph E. Steinmetz, Chancellor
Tim O’Donnell, Vice Chancellor for Finance and Administration
UNIVERSITY OF ARKANSAS AT FORT SMITHPaul Beran, Chancellor
Brad Sheriff, Vice Chancellor for Finance
UNIVERSITY OF ARKANSAS AT LITTLE ROCKJoel E. Anderson, Chancellor
Steve McClellan, Vice Chancellor for Finance and Administration
UNIVERSITY OF ARKANSAS AT MONTICELLOKarla Hughes, Chancellor
Jay Jones, Vice Chancellor for Finance and Administration
UNIVERSITY OF ARKANSAS FOR MEDICAL SCIENCESDaniel W. Rahn, Chancellor
William R. Bowes, Vice Chancellor for Finance & Chief Financial Officer
UNIVERSITY OF ARKANSAS AT PINE BLUFFLaurence Alexander, Chancellor
Carla Martin, Vice Chancellor for Finance and Administration
COSSATOT COMMUNITY COLLEGE OF THE UNIVERSITY OF ARKANSASSteve Cole, Chancellor
Charlotte Johnson, Vice Chancellor for Business and Financial Services
PHILLIPS COMMUNITY COLLEGE OF THE UNIVERSITY OF ARKANSASE. Keith Pinchback, Chancellor
Stan Sullivant, Vice Chancellor for Finance and Administration
UNIVERSITY OF ARKANSAS COMMUNITY COLLEGE AT BATESVILLEDeborah J. Frazier, Chancellor
Gayle Cooper, Vice Chancellor for Finance and Administration
UNIVERSITY OF ARKANSAS COMMUNITY COLLEGE AT HOPEChris Thomason, Chancellor
Belinda Aaron, Vice Chancellor for Finance and Administration
UNIVERSITY OF ARKANSAS COMMUNITY COLLEGE AT MORRILTONLarry D. Davis, Chancellor
Lisa Gunderman-Willenberg, Vice Chancellor for Finance
ARKANSAS SCHOOL FOR MATHEMATICS, SCIENCES & THE ARTSCorey Alderdice, Director
Ashley Smith, Director of Finance
UNIVERSITY OF ARKANSAS SYSTEM eVERSITYMichael Moore, Chief Academic Officer

This reporT was prepared by The office of The Vice presidenT for finance and is aVailable on The UniVersiTy of arkansas sysTem’s websiTe aT www.Uasys.edU