Embed Size (px)
Citation preview

University of Dundee
VAMPIRE® fundus image analysis algorithms
Cirla, Alessandro; Drigo, Michele; Ballerini, Lucia; Trucco, Emanuele; Barsotti, Giovanni
Published in:Veterinary Ophthalmology
DOI:10.1111/vop.12657
Publication date:2019
Document VersionPeer reviewed version
Link to publication in Discovery Research Portal
Citation for published version (APA):Cirla, A., Drigo, M., Ballerini, L., Trucco, E., & Barsotti, G. (2019). VAMPIRE® fundus image analysis algorithms:Validation and diagnostic relevance in hypertensive cats. Veterinary Ophthalmology, 22(6), 819-827.https://doi.org/10.1111/vop.12657
General rightsCopyright and moral rights for the publications made accessible in Discovery Research Portal are retained by the authors and/or othercopyright owners and it is a condition of accessing publications that users recognise and abide by the legal requirements associated withthese rights.
• Users may download and print one copy of any publication from Discovery Research Portal for the purpose of private study or research. • You may not further distribute the material or use it for any profit-making activity or commercial gain. • You may freely distribute the URL identifying the publication in the public portal.
Take down policyIf you believe that this document breaches copyright please contact us providing details, and we will remove access to the work immediatelyand investigate your claim.
Download date: 30. Nov. 2021

For Peer Review
1 VAMPIRE® fundus image analysis algorithms: validation and diagnostic relevance in
2 hypertensive cats
3
4 Alessandro Cirla,*,†DVM, PhD Michele Drigo,‡ DVM, PhD Lucia Ballerini,§ PhD Emanuele
5 Trucco§ PhD and Giovanni Barsotti† DVM, PhD
6
7 *Department of Ophthalmology, San Marco Veterinary Clinic and Laboratory – Veggiano, PD,
8 Italy; †Department of Veterinary Science, University of Pisa – S. Piero a Grado, PI, Italy;
9 ‡Department of Animal Medicine, Production and Health, University of Padova – Legnaro, PD,
10 Italy and § School of Computing, University of Dundee – Dundee, Scotland
11
12 The authors declare no financial interests with companies that manufacture products that are the
13 subject of the present research or with companies that manufacture competing products.
14
15 Corresponding author: Alessandro Cirla
16 San Marco Veterinary Clinic and Laboratory
17 Via dell’Industria 3, 35030 – Veggiano, PD, Italy
18 Tel.: +39-049-856-1098
19 Fax: +39-049-796-9254
20 e-mail: [email protected]
21
22
23
24
25
26
Page 1 of 22 Veterinary Ophthalmology
123456789101112131415161718192021222324252627282930313233343536373839404142434445464748495051525354555657585960
This is the peer reviewed version of the following article: "VAMPIRE® fundus image analysis algorithms: Validation and diagnostic relevance in hypertensive cats", Veterinary Ophthalmology (2019) which has been published in final form at https://doi.org/10.1111/vop.12657. This article may be used for non-commercial purposes in accordance with Wiley Terms and Conditions for Self-Archiving.

For Peer Review
27 Abstract
28 Objectives: To validate a retinal imaging software named VAMPIRE® (Vascular Assay and
29 Measurement Platform for Images of the Retina) in feline patients and test the clinical utility in
30 hypertensive cats.
31 Animals studied: One hundred and five healthy cats were enrolled. They represented the normal
32 dataset used in the validation (group 1). Forty-three hypertensive cats with no noticeable retinal
33 abnormalities were enrolled for the clinical validity of the software (group 2).
34 Procedures: Eleven points (4 veins, 4 arteries and 3 arterial bifurcations) were measured for each
35 digital image. Repeatability and reproducibility of measurements were assessed using two
36 independent operators. Data were statistically analyzed by the Mann-Whiney and Tukey box-plot.
37 Significance was considered when P<0.05.
38 Results: Two hundred and ten retinal images were analyzed for a total of 2310 measurements.
39 Total mean was 9.1 and 6.1 pixels for veins and arteries, respectively. First, second and third
40 arteriolar bifurcations angles were 73.6°, 76.9° and 85.4°, respectively. A comparison between
41 groups 1 and 2 showed a statistically significant reduction in arteriolar diameter (mean 3.3 pixels)
42 and branch angle (55°, 47.8° and 59.9°) associated with increasing vein diameter (mean 24.15
43 pixels). Conclusions: Current image analysis techniques used in human medicine were investigated
44 in terms of extending their use to veterinary medicine. The VAMPIRE® algorithm proved useful for
45 an objective diagnosis of retinal vasculature changes secondary to systemic hypertension in cats,
46 and could be an additional diagnostic test for feline systemic hypertension.
47
48 Key Words: cat, fundus, image analysis algorithms, software validation, retinal photography,
49 systemic hypertension
50
51
52
Page 2 of 22Veterinary Ophthalmology
123456789101112131415161718192021222324252627282930313233343536373839404142434445464748495051525354555657585960

For Peer Review
53 INTRODUCTION
54 Arterial systemic hypertension is a clinical condition in which the blood pressure in the arteries is
55 higher than its physiological values. Arterial hypertension is often correlated to systemic
56 pathologies and is increasingly considered a cause of morbidity and, in some cases, death, both in
57 humans and veterinary patients (1, 2, 3, 4, 5).
58 The eye, like the kidneys, heart and encephalon, is one of the target organs of the persistent
59 hypertensive state. (6, 7, 8, 9, 10, 11, 12, 13, 14) At the ocular and particularly the retinal level,
60 damage due to hypertension often causes sudden blindness although, at least in humans, this is
61 increasingly less frequent thanks to early diagnosis of the disease. (12, 13, 14, 15)
62 Systemic hypertension is commonly found in cats, and often causes secondary ocular lesions. (4, 6,
63 8, 13, 16, 17, 18) Characteristic ocular lesions are the result of the rupture of the retinal endothelial
64 barrier, and ischemia of the vascularisation of the choroid. The most common lesions associated with
65 hypertension include intra/subretinal oedema, retinal hemorrhages and retinal detachment. (1, 2, 3, 4,
66 6, 8, 11, 12, 13, 14, 16) The literature on the ocular manifestations of feline hypertension is based on
67 information and data derived from clinical practice. (1, 3, 4, 8, 10, 17) Inevitably the disease is already
68 in the advanced stages at the time of clinical presentation and diagnosis, and blindness is the most
69 evident clinical sign.
70 The retina is an excellent window for studying microcirculation both in physiological and
71 pathological conditions. Retinal vessels, which can easily be seen using non-invasive methods, also
72 share similar physiological characteristics to encephalic and cardiac microcirculation. (4, 6, 8,
73 12,16, 17) Therefore, recognizing the early signs of hypertensive retinopathy is key not only in
74 order to preserve the anatomical and functional integrity of the eye but also to shed light on a
75 complex system which affects other organs and vital systems.
76 Analysis of the retinal vascular structures provides a unique opportunity in that these are the only
77 components of the entire circulatory system that can be observed in a non-invasive manner. The
78 diagnosis of hypertensive retinopathy is qualitative and takes place via direct analysis of the fundus
Page 3 of 22 Veterinary Ophthalmology
123456789101112131415161718192021222324252627282930313233343536373839404142434445464748495051525354555657585960

For Peer Review
79 using ophthalmoscopes (direct and indirect). However, this diagnosis is subjective and consequently
80 lacking in reliability. This kind of analysis is clinical, whereas a better solution is automatic or
81 semiautomatic retinal image analysis. A fundus camera facilitates the collection of retinal images
82 which can then be analysed objectively. Photographing the fundus makes it possible to obtain high
83 resolution images of large retinal areas, including the microcirculation, and provides objective
84 documentation of the major retinal vessels and their bifurcations. (19) Defining an ideal instrument
85 (objective and non-invasive) for assessing retinal vessels in human medicine has long been linked
86 to using computer aided algorithms for measuring the properties of retinal vessels. (19, 20, 21, 22,
87 23, 24, 25, 26, 27, 28, 29) On the other hand, no such publications are available in recent veterinary
88 literature where the analysis of the retinal vasculature is typically still correlated to the subjectivity
89 of the observer.
90 The aim of this study was to verify whether Vascular Assessment and Measurement Platform for
91 Images of the Retina software (VAMPIRE®) can be validated in veterinary medicine, and can help
92 in the early diagnosis of retinal vasculature changes due to systemic hypertension in cats.
93
94 MATERIALS AND METHODS
95 This research was approved by the Agency for Animal Welfare of Pisa University (22/16) and
96 developed with the coordination of the Department of Veterinary Science (Pisa University), in
97 cooperation with the School of Computing (Dundee University, Scotland) and the Department of
98 Animal Medicine, Productions and Health (Padua University). All the patients enrolled were
99 examined in the same clinic (San Marco Veterinary Clinic and Laboratory, Padua).
100 Animal enrolment
101 One hundred and five clinically healthy cats (group 1) were enrolled for the validation of
102 VAMPIRE® during a one-year period and represented the normality dataset used for the validation.
103 Out of 159 hypertensive cats that underwent a complete ophthalmic examination, 43 cats with no
104 noticeable retinal abnormalities but clinically diagnosed with hypertension (group 2) were enrolled
Page 4 of 22Veterinary Ophthalmology
123456789101112131415161718192021222324252627282930313233343536373839404142434445464748495051525354555657585960

For Peer Review
105 for the assessment of the software potential clinical applications. Overall 116 cats were excluded
106 from the study because of hyphema (12/116), retinal hemorrhages (48/116), bullous (24/116) and
107 complete (32/116) retinal detachment.
108 Clinical examination group 1
109 All cats underwent a physical examination which included measurements of body temperature,
110 pulse, respiratory rate, hydration status, thoracic auscultation, abdominal palpation and palpation of
111 the ventral neck to detect enlarged thyroid gland. Systemic blood pressure was assessed using a
112 high-definition oscillometry (petMAP®, Ramsey Medical Inc, Tampa, Florida, United States). Each
113 cat was allowed 15 minutes to acclimatize to the clinic environment with the owner present, in a
114 setting with no stimuli, and systemic pressure was measured before performing any clinical
115 procedure. The appropriately sized cuff (size 3.0 cm) was applied at the base of the tail with the cat
116 in a sternal recumbent position. The same operator carried out three sequential measurements at
117 one-minute intervals. Blood pressure values (systolic and diastolic) were calculated as the
118 mathematical mean of the three measurements. The measurements taken in agitated or moving cats
119 were eliminated, as were those in which the heart rate measured with the instrument differed from
120 the heart rate measured manually by more than 50 beats per minute.
121 Anamnestic and clinical information were analysed in order to exclude current or prior systemic
122 diseases.
123 Clinical examination group 2
124 All the cats underwent a clinical examination using the procedure described above for group 1. Cats
125 with a systolic pressure equal to or higher than 160 mmHg and diastolic pressure equal to or higher
126 than 100 mmHg were considered hypertensive.
127 All the cats underwent diagnostic procedures including laboratory diagnostics to help reach a
128 diagnosis. All the blood samples were taken from the jugular vein. The urine samples were taken
129 via cystocentesis. All tests were carried out at the same clinic (San Marco Veterinary Clinic and
130 Laboratory) and always included:
Page 5 of 22 Veterinary Ophthalmology
123456789101112131415161718192021222324252627282930313233343536373839404142434445464748495051525354555657585960

For Peer Review
131 1. Complete blood count (CBC);
132 2. complete biochemical profile;
133 3. coagulation profile;
134 4. serum electrophoresis;
135 5. thyroid function tests (TSH, TT4 fT4);
136 6. urine test (urinary dipstick, specific gravity on refractometer, osmolality, urinary protein
137 to urinary creatine ratio, microscopic sediment).
138 To formulate a reliable etiological diagnosis, each cat underwent a cardiology consultation and,
139 where necessary, imaging diagnostic procedures such as thoracic radiographs, electrocardiography,
140 abdominal and thyroid ultrasound were performed.
141 Ophthalmic examination and photographic documentation of the fundus (groups 1 and 2)
142 Each cat underwent an ophthalmic examination, carried out in a dark room where there were no
143 stimuli, with minimal physical restriction. Complete ophthalmic examination always included
144 neurophthalmic examination (palpebral reflex, assessment of menace response, pupillary light and
145 dazzle reflexes), slit-lamp biomicroscopy (SL-15 portable Slit lamp, Kowa Company, Tokyo,
146 Japan) and indirect ophthalmoscopy (Heine Omega 500 Unplugged and Heine 30D lens; Heine
147 Instruments, Herrsching, Germany). Retention of corneal sodium fluorescein dye (HS Haag-Streit
148 International fluorescein, Switzerland) and intraocular pressure estimation (TonoPen Vet, Reichert
149 Inc, Depew, NY, USA) were performed.
150 For the photographic documentation of the fundus of the cats included in the study, a digital fundus
151 camera for veterinary use (Clearview, Optibrand LLc, Ft Collins, Columbia, United States) was
152 employed.
153 To prevent alteration of the anatomic characteristics of the retinal vasculature, both eyes were
154 always examined without pharmacological dilation. (29)
155 A standard image shot centered on the optic disc was also defined, to allow the correct visualisation
156 of the retinal vascular tree (arteries, veins and arteriolar bifurcations). The images obtained using
Page 6 of 22Veterinary Ophthalmology
123456789101112131415161718192021222324252627282930313233343536373839404142434445464748495051525354555657585960
For Peer Review
157 this technique needed to be free from defects caused by movement. The deliberate absence of all
158 identifying details prevented observers from recognising the images and, therefore, guaranteed a
159 more objective judgement.
160 Imagine analysing methods
161 The program used for this project is semi-automatic, modified and adapted for measuring the feline
162 fundus by the developers. The software algorithms are, therefore, able to calculate both vascular
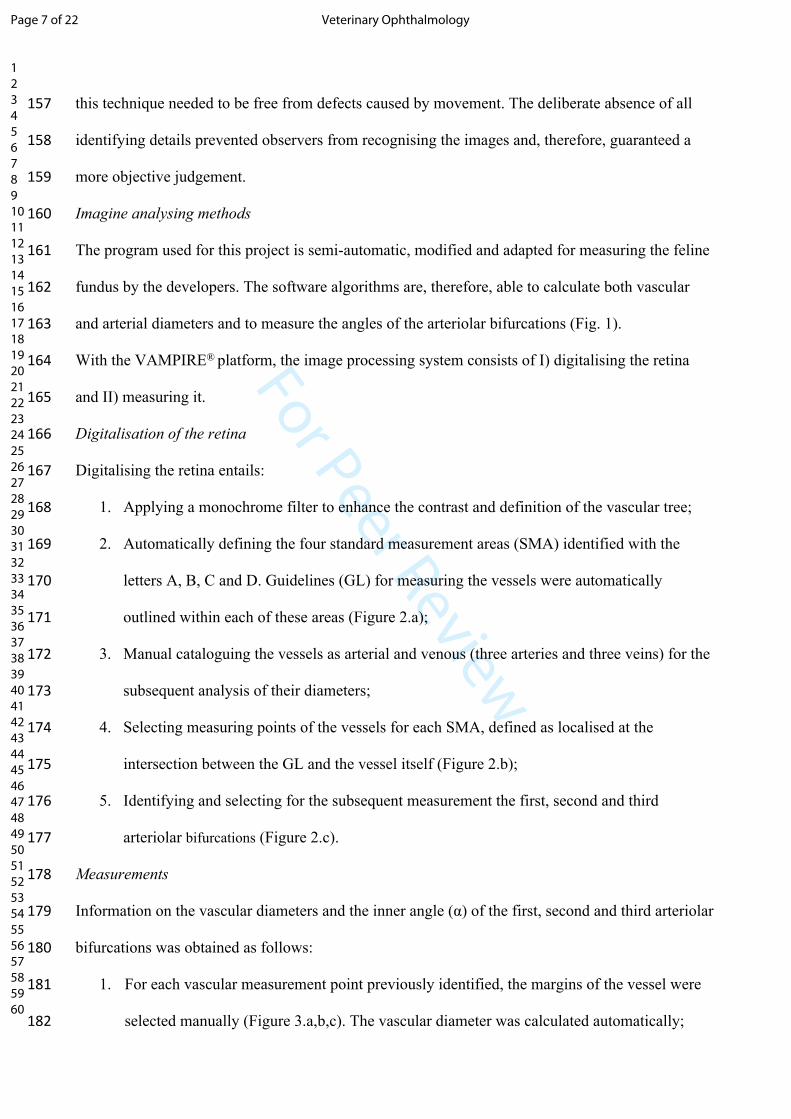
163 and arterial diameters and to measure the angles of the arteriolar bifurcations (Fig. 1).
164 With the VAMPIRE® platform, the image processing system consists of I) digitalising the retina
165 and II) measuring it.
166 Digitalisation of the retina
167 Digitalising the retina entails:
168 1. Applying a monochrome filter to enhance the contrast and definition of the vascular tree;
169 2. Automatically defining the four standard measurement areas (SMA) identified with the
170 letters A, B, C and D. Guidelines (GL) for measuring the vessels were automatically
171 outlined within each of these areas (Figure 2.a);
172 3. Manual cataloguing the vessels as arterial and venous (three arteries and three veins) for the
173 subsequent analysis of their diameters;
174 4. Selecting measuring points of the vessels for each SMA, defined as localised at the
175 intersection between the GL and the vessel itself (Figure 2.b);
176 5. Identifying and selecting for the subsequent measurement the first, second and third
177 arteriolar bifurcations (Figure 2.c).
178 Measurements
179 Information on the vascular diameters and the inner angle (α) of the first, second and third arteriolar
180 bifurcations was obtained as follows:
181 1. For each vascular measurement point previously identified, the margins of the vessel were
182 selected manually (Figure 3.a,b,c). The vascular diameter was calculated automatically;
Page 7 of 22 Veterinary Ophthalmology
123456789101112131415161718192021222324252627282930313233343536373839404142434445464748495051525354555657585960

For Peer Review
183 2. For each arteriolar branch measurement point previously identified (mother vessel), the
184 anatomical landmarks (daughter vessels) were selected manually for the subsequent
185 automatic calculation of the inner angle α (Figure 3.d,e,f).
186 Assessment of intra- and inter-operator variability
187 In order to validate the use of VAMPIRE® (semiautomatic) in terms of repeatability and
188 reproducibility, 35 healthy cats randomly selected from the 105 healthy cats were evaluated in
189 relation to the following parameters: vein and artery for every SMA, first, second and third
190 arteriolar bifurcations angle. Two observers (experiments) were used and three repetitions
191 (tests) were made of the same measurement. Research Randomizer (www.randomizer.org) was
192 used to randomly organise both the selection and the order of the images to analyse. It seems
193 unlikely that the images were memorized by the operators due to the long interval between the
194 different measuring sessions (three weeks) and the large number of vessels identified.
195 Repeatability and reproducibility were assessed in relation to their individual and combined
196 effects on the overall variability of the measurements taken.
197 Assessment of the software potential clinical application
198 To assess the software potential clinical application the measurements were compared by
199 analysing the photographic images from group 2 (hypertensive animals) and a subset from
200 group 1 (healthy cats). The same parameters considered in the validation of VAMPIRE® were
201 used to compare the group of 105 healthy cats and the group of 43 clinically hypertensive cats
202 without evident abnormalities of the fundus. For the comparison of healthy and hypertensive
203 cats the measurements were taken on the right eye only.
204 Statistical analysis
205 After testing the normality of the data, the non-parametric Mann-Whitney test was used to compare
206 the distribution of the values between healthy and hypertensive cats. Tukey box plot graphs were
207 produced for the graphic visualisation of these distributions.
208 The level of statistical importance was set for values of P<0.05.
Page 8 of 22Veterinary Ophthalmology
123456789101112131415161718192021222324252627282930313233343536373839404142434445464748495051525354555657585960

For Peer Review
209 RESULTS
210 The cats belonging to group 1 (clinically healthy cats) represented the normality dataset of the
211 retinal measurements taken. One hundred and five cats of the same breed (domestic short hair)
212 were used: 55 males and 50 females with a mean and median of 55 months (minimum 48,
213 maximum 78). A total of 210 retinal images (right and left eyes) were analysed. Eleven points
214 (four veins, four arteries and three arterial bifurcations) were recognised and measured for each
215 image, totalling 2310 measurements. No statistical difference was found for each of the
216 comparison assessed. Table 1 summarised the values of the measurements taken only on the
217 right eye.and represent the reference parameters for cats.
218 Group 2 was constituted by 43 hypertensive cats (24 males and 20 females) that met the criteria
219 for inclusion in the study. Mean and median age was 138 months (minimum 120, maximum 185).
220 Twenty-five cats were affected by chronic renal failure, 16 cats were affected by hyperthyroidism,
221 and 2 cats presented both these diseases.
222 Intra- and inter-operator variability (repeatability and reproducibility)
223 Repeatability (r) and reproducibility (R) were blind tested by two independent operators who
224 performed three series of measurements in a set consisting of 35 images at intervals of three weeks
225 (Figure 4). As no statistical difference was found between the measurements of the images of the
226 right eye (OD) and the left eye (OS), both observers assessed OD only. Each observer performed a
227 total of 1155 measurements (i.e. 35 images multiplied by 11 points of evaluation).
228 Lastly, the coefficient of variation (CV) was calculated, in terms of R and r, for every
229 measurement area (Table 2).
230 Comparison between the measurements taken in the two groups (healthy-hypertensive animals)
231 To assess the potential clinical applications of VAMPIRE®, 43 retinal images belonging to group 1
232 and group 2 were analysed. In hypertensive cats the statistical processing proved the existence of a
233 statistically significant reduction (P<0.001) in arterial vascular diameter (group 1 mean 6.1 +/- 0.8;
234 group 2 mean 3.3 +/- 1.4) and arteriolar branch angles (first arteriolar branch angle: group 1 mean
Page 9 of 22 Veterinary Ophthalmology
123456789101112131415161718192021222324252627282930313233343536373839404142434445464748495051525354555657585960

For Peer Review
235 73.3° +/- 19°; group 2 mean 54.7° +/- 20.5°. Second arteriolar branch angle: group 1 mean 77.1° +/-
236 17.1°; group 2 mean 54.7° +/- 20.5°. Third arteriolar branch angle: group 1 mean 83.9° +/-15.2°;
237 group 2 mean 59.9° +/- 24.7°) associated with an increase in vein diameter (group 1 9.1 +/- 1; group
238 2 16.1 +/- 4) as shown in Figure 5.
239
240 DISCUSSION
241 The results of the present study provide a validation of the semi-automatic software VAMPIRE® in
242 cats. Our results cannot be compared with the current veterinary literature as no studies have been
243 published in this field. In contrast, in human medicine some softwares for retinal imaging analysis
244 has been validated, and some publications demonstrate their utility in the early diagnosis of retinal
245 vasculature changes during systemic hypertension. (7,19, 20, 21, 23)
246 Our results showed that VAMPIRE® is consistent when giving interpretations. The results showed
247 an optimum R for vein measurements (Mean CV: 1.1%) and a very good R for artery
248 measurements (Mean CV: 3.1%) and bifurcation angles (Mean CV: 3.4%). In these last two
249 groups, the Mean Variation Coefficient was higher in the standard measuring area (SMA) B for
250 arterioles (Mean CV: 5%) and in the assessment of third arteriolar bifurcations (Mean CV: 9.3%).
251 In fact, in SMA B, there is a higher overlapping of arteries and veins which could generate possible
252 errors in clearly distinguishing and precisely identifying the arterial walls. The third arteriolar
253 bifurcation angle (Mean CV: 9.3%) in the digital image was the least clear and most peripheral
254 one, prone to more errors in interpretation.
255 Repeatability absorbs most of the total variability in measurements. Nevertheless, R shows that
256 these measurements tend to comprise the same centre of measurement. “Poor” r must be considered
257 in the light of the type of measurements taken, i.e. the possible discrepancy between these
258 measurements and the possible sphere of variation, which is very slight. In the comparison between
259 the two group measurements (clinically healthy and hypertensive cats), in the hypertensive cats
260 there was a statistically significant reduction in the arteriolar diameter (mean total: 3.5 pixels) and
Page 10 of 22Veterinary Ophthalmology
123456789101112131415161718192021222324252627282930313233343536373839404142434445464748495051525354555657585960

For Peer Review
261 branch angles (55°, 47.8° and 24.7°), associated with an increase in the vein diameter (mean total:
262 24.15 pixels).
263 Microvascular dysfunction has been suggested to be a pathogenic factor for the development of
264 systemic hypertension (5, 6). In human medicine retinal vascular calibre can be assessed non-
265 invasively from retinal photographs and computer-assisted approaches (20, 21, 22, 25, 27, 28),
266 while there is currently no data on the application of retinal imaging analysis software in veterinary
267 medicine.
268 There are intrinsic limitations to the method analysed: the measurements, although taken in
269 standardised anatomical landmarks, refer to very small anatomical structures; and errors in the
270 procedure are possible. Consequently, the operator is a variable. The results of our analysis were
271 based on a single-occasion retinal measurements, and lacks information on serial measurements.
272 VAMPIRE® is semi-automatic, thus the measurements have to be taken manually. To date, also in
273 human medicine most publications (20, 21, 27) on assessing the change in vascular changes
274 (vascular calibre and bifurcation angles) in fundus images still rely on a semi-automatic tool. Huang
275 et al. proposed an automatic quantitative width measurement for retinal blood vessels, validating
276 the technique by comparing the results with VAMPIRE®. (28)
277 Based on the observations from this study, the development of future automated algorithms for
278 medical veterinary imaging essentially entails collecting a larger dataset including both normal and
279 abnormal cases. An automatic retinal vessel measurement technique will enable fully quantitative
280 retinal vessel analyses in large-scale screening programs.
281 CONCLUSIONS
282 The image processing of color fundus images could potentially play a role in the diagnosis of
283 hypertensive retinopathy in cats. The findings of the retina image analysis offer a new method for
284 the early diagnosis of hypertension and objectively reflect the complex, but only partially
Page 11 of 22 Veterinary Ophthalmology
123456789101112131415161718192021222324252627282930313233343536373839404142434445464748495051525354555657585960

For Peer Review
285 understood, physiopathological mechanisms at the base of the initial stages of this syndrome, both
286 in cats and humans. The VAMPIRE® algorithm used to measure vascular diameters and angles of
287 the arteriolar bifurcations contributes to the objective diagnosis of early damage to the ocular
288 fundus as a result of systemic hypertension. It also facilitates an additional investigation into the
289 effect of microvascularisation on the physiopathology of this complex syndrome.
290
291
292
293
294
295
296
297
298
299
300
301
302
303
Page 12 of 22Veterinary Ophthalmology
123456789101112131415161718192021222324252627282930313233343536373839404142434445464748495051525354555657585960

For Peer Review
304 REFERENCES
305 1. Bijsmans ES, Jepson RE, Chang YM et al. Changes in systolic blood pressure over time
306 in healthy cats and cats with chronic kidney disease. Journal of Veterinary Internal
307 Medicine 2015; 29:855-861.
308 2. Chetboul V, Lefebvre HP, Pinhas C et al. Spontaneous feline hypertension: clinical and
309 echocardiographic abnormalities, and survival rate. Journal of Veterinary Internal
310 Medicine 2003; 17:89-95.
311 3. Kobayashi DL, Peterson ME, Graves TK et al. Hypertension in cats with chronic renal
312 failure or hyperthyroidism. Journal of Veterinary Internal Medicine 1990; 4:58-62.
313 4. Maggio F, De Francesco TC, Atkins CE et al. Ocular lesions associated with systemic
314 hypertension in cats: 69 cases (1985-1998). Journal of the American Veterinary
315 Medicine Association 2000; 217:695-702.
316 5. Oparil S. Zaman MA, Calhourn DA. Pathogenesis of hypertension. Annals of Internal
317 Medicine 2003; 139:761-776.
318 6. Attariwale R, Giebs CP, Glucksberg MR. The influence of elevated intraocular pressure
319 on vascular pressures in the cat retina. Investigative Ophthalmology and Visual Science
320 1994; 35:1019-1025.
321 7. Chew SK, Xie J, Wang JJ. Retinal arteriolar diameter and the prevalence and incidence
322 of hypertension: a systemic review and meta-analysis of their association. Current
323 Hypertension Reports 2012; 14:144-151.
324 8. Crispin SM, Mould JR. Systemic hypertensive disease and feline fundus. Veterinay
325 Ophthalmology 2001; 4(2):31-140.
326 9. De Venecia G, Jampol LM. The eye in accelerated hypertension. II. Localized serous
327 detachement of the retina in patients. Archives of Ophthalmology 1984;102(1):68-73.
Page 13 of 22 Veterinary Ophthalmology
123456789101112131415161718192021222324252627282930313233343536373839404142434445464748495051525354555657585960

For Peer Review
328 10. Henik R, Snyder P, Volk L. Treatment of systemic hypertension in cats with amlodipine
329 besylate. Journal of the American Animal Hospital Association 1997; 33:226-234.
330 11. Henik RA. Diagnosis and treatment of feline systemic hypertension. Compendium on
331 Continuing Educationfor the Practising Veterinarian 1997; 19:163-179.
332 12. Morgan GE, Mikhail MS, Murray MJ. Systemic hypertension in four cats: ocular and
333 medical findings. Journal of the American Animal Hospital Association 1986; 22:615-
334 621.
335 13. Sansom J, Barnett KC, Dunn KAet al. Ocular disease associated with hypertension in 16
336 cats. Journal of Small Animal Practice 1994; 35:604-611.
337 14. Sansom J, Bodey A. Ocular sign in four dogs with hypertension. Veterinary Record
338 1997; 140:593-598.
339 15. Connell JM, Davies E. The new biology of aldosterone. Journal of Endocrinology 2005;
340 186:1-20.
341 16. Brown S, Atkins C, Bagley R et al. Guidelines for the identification, evaluation, and
342 management of systemic hypertension in dogs and cats. Journal of Veterinary Internal
343 Medicine 2007; 21-542-558.
344 17. Carter JM, Irving AC, Bridges JPet al. The prevalence of ocular lesions associated with
345 hypertension in a population of geriatric cats in Auckland, New Zealand. New Zealand
346 Veterinary Journal 2014; 62:21-29.
347 18. Anderson DH, Guerin CJ, Erikson PA et al. Morphological recovery in the reattached
348 retina. Investigative Ophthalmology and Visual Science1986; 27:168-183.
349 19. Hubbard LD, Brothers RJ, King WN et al. Methods for evaluation of retinal
350 microvascular abnormalities associated with hypertension/sclerosis in the
351 Atherosclerosis Risk in Communities Study. Ophthalmology 1999; 106:2269-2280.
352 20. Abtamoff MD, Garvin MK, Sonka M. Retinal imaging and image analysis. IEEE Review
353 in Biomedical Engeneering 2010; 3:169-208.
Page 14 of 22Veterinary Ophthalmology
123456789101112131415161718192021222324252627282930313233343536373839404142434445464748495051525354555657585960

For Peer Review
354 21. Abtamoff MD, Garvin MK, Sonka M. Retinal imaging and image analysis. IEEE Review
355 in Biomedical Engeneering 2010; 3:169-208.
356 22. Bartling H, Wanger P, Martin L. Measurement of optic disc parameters on digital fundus
357 photographs: algorithm development and evaluation. Acta Ophthalmologica 2008;
358 86:837-841
359 23. Ikram MK, De Jong FJ, Vingerling JR et al. Are retinal arteriolar or venular diametes
360 associated with markers for cardiovascular disorders? The Rotterdam Study.
361 Investigative Ophthalmology and Visual Science 2004; 45:2129-2134.
362 24. Ikram MK, Janssen JA, Roos AM et al. Retinal vessel diameters and risk of impaired
363 fasting glucose or diabetes: the Rotterdam Study. Diabetes 2006; 55:506-510.
364 25. Knudston MD, Klein BE, Klein R et al. Variation associated with measurement of
365 retinal vessel diameters at different points in the puls cycle. British Journal of
366 Ophthalmology 2004; 88:57-61.
367 26. Mansour AM. Measuring fundus landmarks. Investigative Ophthalmology and Visual
368 Science 1990; 31:41-42.
369 27. Trucco E, Ruggieri A, Karnowski T et al. Validating retinal fundus image analysis
370 algorithms: issues and proposal. Investigative Ophthalmology and Visual Science 2013;
371 54:3546-3559.
372 28. Hunag F. Dashtbozorg B, Ka Shing Yeung A et al. A comparative study towards the
373 establishment of an automatic retinal vessel width measurement technique. In: Cardoso
374 M. et al. (eds) Fetal, Infant and Ophthalmic Medical Image Analysis. OMIA 2017,
375 FIFI 2017. Lecture Notes in Computer Science, vol 10554. Springer, Cham
376 29. Harazny JM, Scmieder RE, Welzenbach J et al. Local application of tropicamide 0.5%
377 reduces retinal capillary blood flow. Blood Pressure 2013; 22(6):371-376.
378
379
Page 15 of 22 Veterinary Ophthalmology
123456789101112131415161718192021222324252627282930313233343536373839404142434445464748495051525354555657585960

For Peer Review
380 TABLES
Table 1 – Vascular reference parameters in normal feline fundus (measurements from OD expressed
in px)
Mean Standard Deviation Median Min Max Percentile 25 Percentile 75
Vein A 9.0 0.6 8.9 7.7 11.8 8.6 9.1
Vein B 9.1 1.0 9.0 6.9 14.2 8.5 9.4
Vein C 9.1 0.8 9.2 7.1 11.8 8.5 9.4
Vein D 9.3 0.7 9.3 7.3 11.4 8.9 9.7
Artery A 6.3 0.8 6.3 4.6 8.6 5.7 6.8
Artery B 6.2 0.8 6.2 3.7 7.8 5.7 7.0
Artery C 6.1 1.0 6.1 2.9 10.2 5.5 6.6
Artery D 5.8 1.1 5.8 2.4 8.6 5.1 6.5
1st Angle 73.3 17.1 73.6 42.1 102.9 60.0 87.9
2nd Angle 77.1 19.0 76.9 9.5 125.0 65.4 87.6
3rd Angle 83.9 15.2 85.4 44.1 126.7 75.4 92.7381
382
Table 2 – Evaluation of R&r in each SMA (%)Arteries A B C D
CV R 2.8 5.0 2.5 2.6
CV r 7.7 5.6 8.9 11.1
Veins A B C D
CV R 0.4 0 0 0
CV r 4.7 3.8 4.2 3.6
Angles 1stGen 2ndGen 3rdGen
CV R 1.3 3.6 9.3
CV r 9.9 14.1 13.6383
384
385
Page 16 of 22Veterinary Ophthalmology
123456789101112131415161718192021222324252627282930313233343536373839404142434445464748495051525354555657585960

For Peer Review
386 FIGURES
387 Fig. 1. First (yellow square), second (green square) and third (blue square) arteriolar bifurcations (a) defined as
388 the junction between two daughter vessels (d1 and d2) and a mother vessel (M) (b). Fig. 1.b is a magnified image
389 belonging to Fig. 1.a.
390 Fig. 2. Definition of standard measurement areas (SMA) identified with letters and identification of
391 measurement guidelines (yellow lines) (a). Selection of the vessel measuring point for each SMA (arteries red
392 dots, veins light blue dots) (b). Identification of the first, second and third arteriolar bifurcations (red dots) (c).
393 Fig. 3. Semi-automatic measurement of the vascular diameters (a) and arteriolar bifurcations (d). Manual
394 selection of the vessel margins (b) and of the arteriolar branch (e) before automatic calculation of vascular
395 diameter (c) and the inner angle α (f).
396 Fig. 4. Repeatability and reproducibility summary plot in arterial (a), venous vessels (b) and arteriolar
397 bifurcations (c). The points traced in the graphs represent the deviations of the respective measurements from
398 the average measurement for each individual part. Each operator is represented by a square. The height of the
399 square represents an indication of the variability in measurements between tests. The length of the vertical lines
400 containing the points joins together the various tests carried out by the same operator for each part.
401
402 Fig. 5. Tukey box plots of the comparison of measurements of healthy and hypertensive cats. All these
403 comparisons are statistically significant at level P<0.001
Page 17 of 22 Veterinary Ophthalmology
123456789101112131415161718192021222324252627282930313233343536373839404142434445464748495051525354555657585960

For Peer Review
Fig. 1. First (yellow square), second (green square) and third (blue square) arteriolar bifurcations (a) defined as the junction between two daughter vessels (d1 and d2) and a mother vessel (M) (b). Fig. 1.b is a
magnified image belonging to Fig. 1.a.
Page 18 of 22Veterinary Ophthalmology
123456789101112131415161718192021222324252627282930313233343536373839404142434445464748495051525354555657585960

For Peer Review
Fig. 2. Definition of standard measurement areas (SMA) identified with letters and identification of measurement guidelines (yellow lines) (a). Selection of the vessel measuring point for each SMA (arteries red dots, veins light blue dots) (b). Identification of the first, second and third arteriolar bifurcations (red
dots) (c).
Page 19 of 22 Veterinary Ophthalmology
123456789101112131415161718192021222324252627282930313233343536373839404142434445464748495051525354555657585960

For Peer Review
Fig. 3. Semi-automatic measurement of the vascular diameters (a) and arteriolar bifurcations (d). Manual selection of the vessel margins (b) and of the arteriolar branch (e) before automatic calculation of vascular
diameter (c) and the inner angle α (f).
Page 20 of 22Veterinary Ophthalmology
123456789101112131415161718192021222324252627282930313233343536373839404142434445464748495051525354555657585960

For Peer Review
Fig. 4. Repeatability and reproducibility summary plot in arterial (a), venous vessels (b) and arteriolar bifurcations (c). The points traced in the graphs represent the deviations of the respective measurements from the average measurement for each individual part. Each operator is represented by a square. The
height of the square represents an indication of the variability in measurements between tests. The length of the vertical lines containing the points joins together the various tests carried out by the same operator for
each part.
51x86mm (300 x 300 DPI)
Page 21 of 22 Veterinary Ophthalmology
123456789101112131415161718192021222324252627282930313233343536373839404142434445464748495051525354555657585960

For Peer Review
Fig. 5. Tukey box plots of the comparison of measurements of healthy and hypertensive cats. All these comparisons are statistically significant at level P<0.001
78x20mm (300 x 300 DPI)
Page 22 of 22Veterinary Ophthalmology
123456789101112131415161718192021222324252627282930313233343536373839404142434445464748495051525354555657585960