Embed Size (px)
Citation preview
University of Groningen
Digital radiographic preoperative planning and postoperative monitoring of total hipreplacementsThe, Bertram
IMPORTANT NOTE: You are advised to consult the publisher's version (publisher's PDF) if you wish to cite fromit. Please check the document version below.
Document VersionPublisher's PDF, also known as Version of record
Publication date:2006
Link to publication in University of Groningen/UMCG research database
Citation for published version (APA):The, B. (2006). Digital radiographic preoperative planning and postoperative monitoring of total hipreplacements: techniques, validation and implementation0. s.n.
CopyrightOther than for strictly personal use, it is not permitted to download or to forward/distribute the text or part of it without the consent of theauthor(s) and/or copyright holder(s), unless the work is under an open content license (like Creative Commons).
The publication may also be distributed here under the terms of Article 25fa of the Dutch Copyright Act, indicated by the “Taverne” license.More information can be found on the University of Groningen website: https://www.rug.nl/library/open-access/self-archiving-pure/taverne-amendment.
Take-down policyIf you believe that this document breaches copyright please contact us providing details, and we will remove access to the work immediatelyand investigate your claim.
Downloaded from the University of Groningen/UMCG research database (Pure): http://www.rug.nl/research/portal. For technical reasons thenumber of authors shown on this cover page is limited to 10 maximum.
Download date: 14-12-2021
Digital Radiographic Preoperative Planning and Postoperative
Monitoring of Total Hip Replacements
- Techniques, Validation and Implementation -
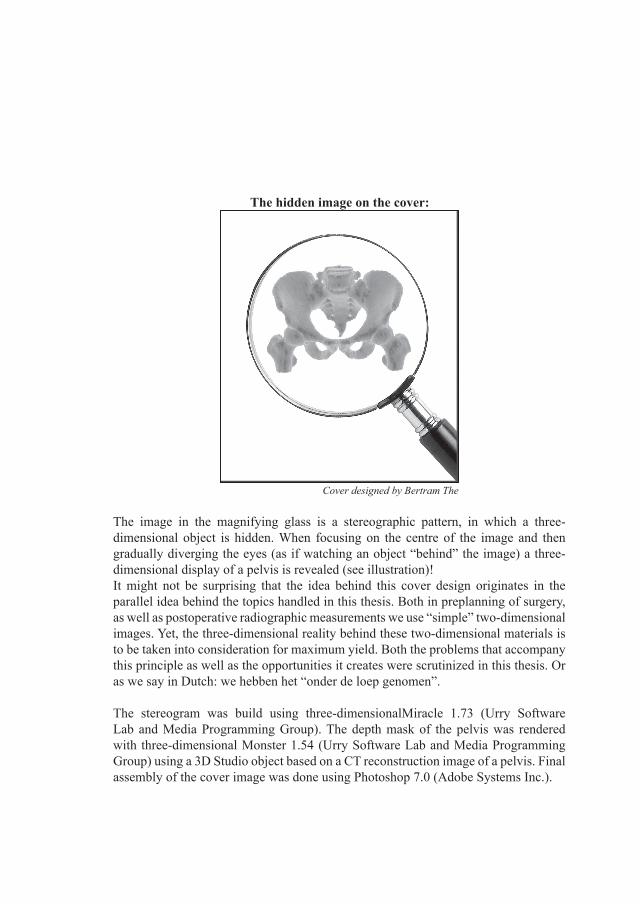
The image in the magnifying glass is a stereographic pattern, in which a three-dimensional object is hidden. When focusing on the centre of the image and then gradually diverging the eyes (as if watching an object “behind” the image) a three-dimensional display of a pelvis is revealed (see illustration)!It might not be surprising that the idea behind this cover design originates in the parallel idea behind the topics handled in this thesis. Both in preplanning of surgery, as well as postoperative radiographic measurements we use “simple” two-dimensional images. Yet, the three-dimensional reality behind these two-dimensional materials is to be taken into consideration for maximum yield. Both the problems that accompany this principle as well as the opportunities it creates were scrutinized in this thesis. Or as we say in Dutch: we hebben het “onder de loep genomen”.
The stereogram was build using three-dimensionalMiracle 1.73 (Urry Software Lab and Media Programming Group). The depth mask of the pelvis was rendered with three-dimensional Monster 1.54 (Urry Software Lab and Media Programming Group) using a 3D Studio object based on a CT reconstruction image of a pelvis. Final assembly of the cover image was done using Photoshop 7.0 (Adobe Systems Inc.).
The hidden image on the cover:
Cover designed by Bertram The
RIJKSUNIVERSITEIT GRONINGEN
Digital Radiographic Preoperative Planning and Postoperative
Monitoring of Total Hip Replacements
- Techniques, Validation and Implementation -
Proefschrift
ter verkrijging van het doctoraat in deMedische Wetenschappen
aan de Rijksuniversiteit Groningenop gezag van de
Rector Magnificus, dr. F. Zwarts,in het openbaar te verdedigen op
woensdag 8 november 2006om 16.15 uur
door
Bertram Thegeboren op 15 maart 1974
te Maastricht

Promotores:
Prof. Dr. R.L. Diercks Prof. Dr. J.R. van Horn
Copromotor:
Dr. Ir. N. Verdonschot Beoordelingscommissie:
Prof. Dr. R.G.T. Geesink Prof. Dr. M. Oudkerk Prof. Dr. R.P.H. Veth

Paranimfen:
Dr. Bas Knobben Ir. Thomas The

B. The ■ Digital Radiographic Preoperative Planning and Postoperative Monitoring of Total Hip Replacements - Techniques, Validation and ImplementationUniversity Medical Centre Groningen, the Netherlands © 2006
ISBN ■ 90 77113 47 9ISBN (electronic) ■ 90 77113 49 5Lay-out ■ Sioe Hoey The-Go
No part of this book may be reproduced by any mechanical, photographic or electronic process, nor may it be stored in a retrieval system, transmitted, or otherwise copied for public or private use, without written permission of the author.All published papers are reprinted with permission and with credit to their resource.

Publication of this thesis was financially supported by:
Nederlandse Orthopedische VerenigingOldelft Benelux / Rogan DelftDutch Arthritis AssociationAnna-stichtingBauerfeind BeneluxSynthes B.V.ConvaTecDePuy
Stellingen behorende bij dit proefschrift
1. Het proces dat leidt tot fouten bij wearmetingen door projectieverschillen tussen uitgangs- en follow-up röntgenopname is tot op grote hoogte mathematisch reversibel.
(Dit proefschrift)
2. Aannames zijn de achilleshiel van elk model. Virtuele simulaties zijn een krachtig middel om mogelijke consequenties ervan bloot te leggen.
(Dit proefschrift)
3. Preoperatieve planningen van totale heuparthroplastieken worden nauwkeuriger door betere correctie van de vergrotingsfactor, neutralisatie van de anteversie van het femur, en gebruik van planbare prothesecomponenten.
(Dit proefschrift)
4. Het preplannen van een totale arthroplastiek door iemand anders dan de operateur is bij de heupprothese van weinig waarde, maar levert bij de knieprothese een nauwkeurige voorspelling van de benodigde componentmaten op.
(Dit proefschrift)
5. De meetfout van slijtagemetingen aan polyethyleenkommen op individueel niveau is van groter belang dan op groepsniveau, omdat deze niet voorspelbaar is.
(Dit proefschrift)

6. Met de huidige stand van kennis, is het navigeren bij totale heuparthroplastieken als het navigeren met een kaart in het donker.
7. De keuze tussen “impact, fact, or impact factor” is niet altijd makkelijk te maken.
8. Power is voor optimisten, p-waarden voor pessimisten, betrouwbaarheidsintervallen voor realisten en promotie-onderzoek voor masochisten.
9. Waarom gaat, zodra de statistiek in beeld komt, niet alleen de data, maar ook het klinische denken in regressie?
10. De meest verwarrende taal is digitaal.
11. Er zou minder tussen bevolkingsgroepen en meer tussen de tanden moeten worden gestookt.
12. Your brain is like your stomach, in the sense that if it’s empty, you’re willing to put anything in there to fill it up.
(S. Adams)
13. Co-auteurschap is het smeergeld van de wetenschap.
14. Het gebrek aan opleidingsstructuur in promotietrajecten is geen promotie voor dergelijke trajecten.
15. Wetenschappers verdienen in Nederland niet wat ze verdienen.
16. No one believes forecasts, but we all want to hear them.(S. Hawking)

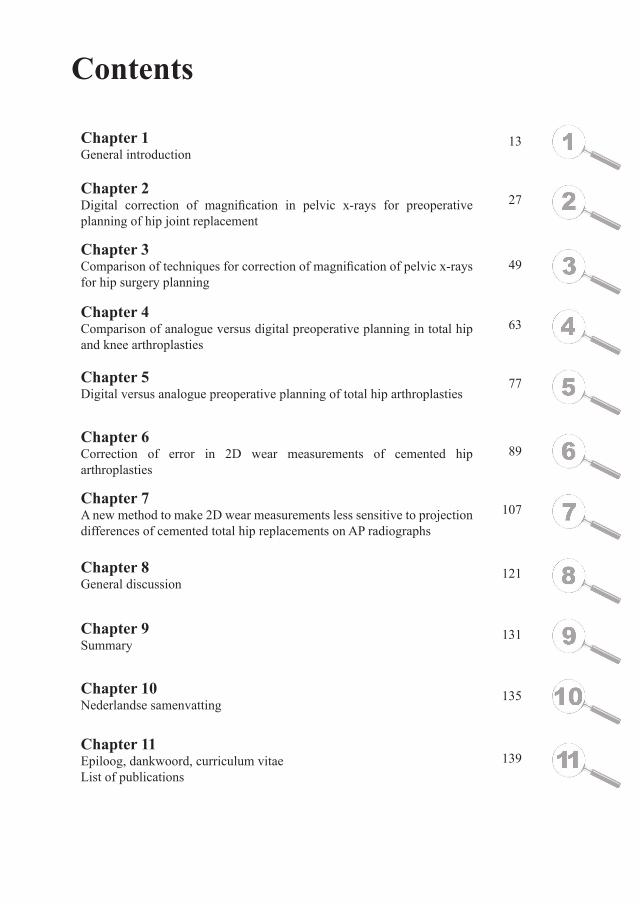
Contents
13
27
49
63
77
89
107
121
131
135
139
Chapter 1General introduction
Chapter 2Digital correction of magnification in pelvic x-rays for preoperative planning of hip joint replacement
Chapter 3Comparison of techniques for correction of magnification of pelvic x-rays for hip surgery planning
Chapter 4Comparison of analogue versus digital preoperative planning in total hip and knee arthroplasties
Chapter 5Digital versus analogue preoperative planning of total hip arthroplasties
Chapter 6Correction of error in 2D wear measurements of cemented hip arthroplasties
Chapter 7A new method to make 2D wear measurements less sensitive to projection differences of cemented total hip replacements on AP radiographs
Chapter 8General discussion
Chapter 9Summary
Chapter 10Nederlandse samenvatting
Chapter 11Epiloog, dankwoord, curriculum vitaeList of publications


General introduction

Chapter 1 - General introduction
14
Chapter 1 - General introduction
15
Historical background of the total hip arthroplasty
In 1923 the Norwegian-born American surgeon Marius Smith-Petersen from Boston, Massachusetts, implanted a prosthesis with a revolutionary philosophy. In contrast to other surgeons of his time his goal was neither to reach arthrodesis of the hip joint, neither to provide temporal relieve by covering discongruent femoral heads with perishable materials. The glass mould interposition he used was intended to provide bone-implant movement on both the acetabular and femoral side of the implant. As its name implies, the prosthesis was intended to guide natures repair so that defects would eventually be eliminated. Unfortunately, glass – and later also celluloid, Bakelite and Pyrex – proved to be too brittle for the in-vivo forces across the hip joint.1 In 1938, he implanted the first Vitallium mould after its recent introduction to the dentistry market.2 This device provided the first predictable result in interpositional hip arthroplasty.3
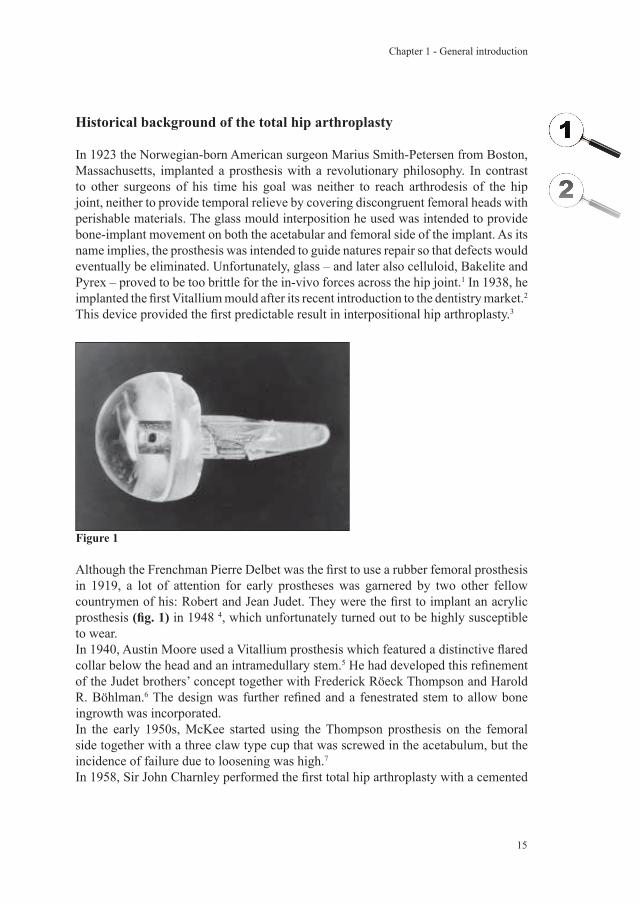
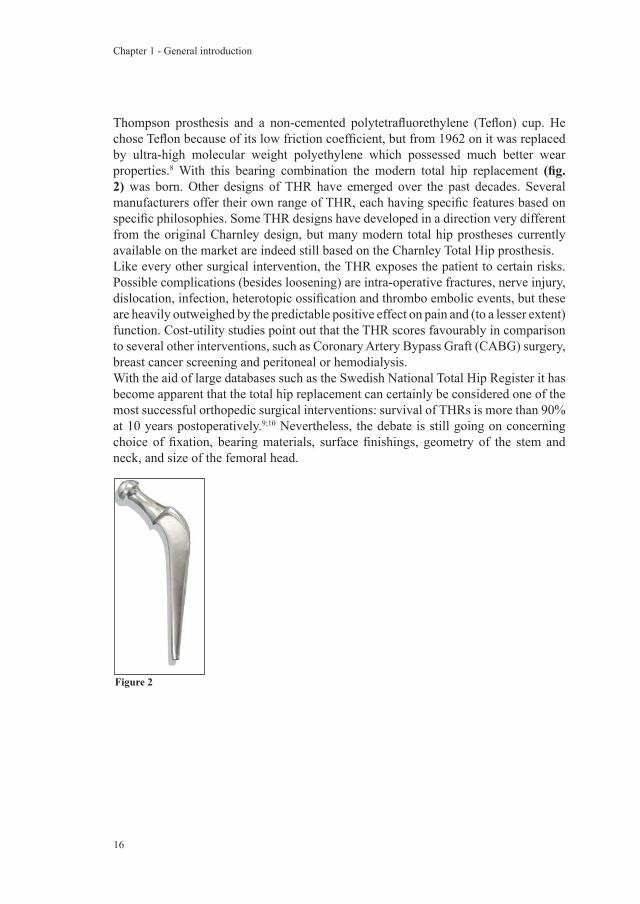
Although the Frenchman Pierre Delbet was the first to use a rubber femoral prosthesis in 1919, a lot of attention for early prostheses was garnered by two other fellow countrymen of his: Robert and Jean Judet. They were the first to implant an acrylic prosthesis (fig. 1) in 1948 4, which unfortunately turned out to be highly susceptible to wear.In 1940, Austin Moore used a Vitallium prosthesis which featured a distinctive flared collar below the head and an intramedullary stem.5 He had developed this refinement of the Judet brothers’ concept together with Frederick Röeck Thompson and Harold R. Böhlman.6 The design was further refined and a fenestrated stem to allow bone ingrowth was incorporated.In the early 1950s, McKee started using the Thompson prosthesis on the femoral side together with a three claw type cup that was screwed in the acetabulum, but the incidence of failure due to loosening was high.7
In 1958, Sir John Charnley performed the first total hip arthroplasty with a cemented
Figure 1
Chapter 1 - General introduction
16
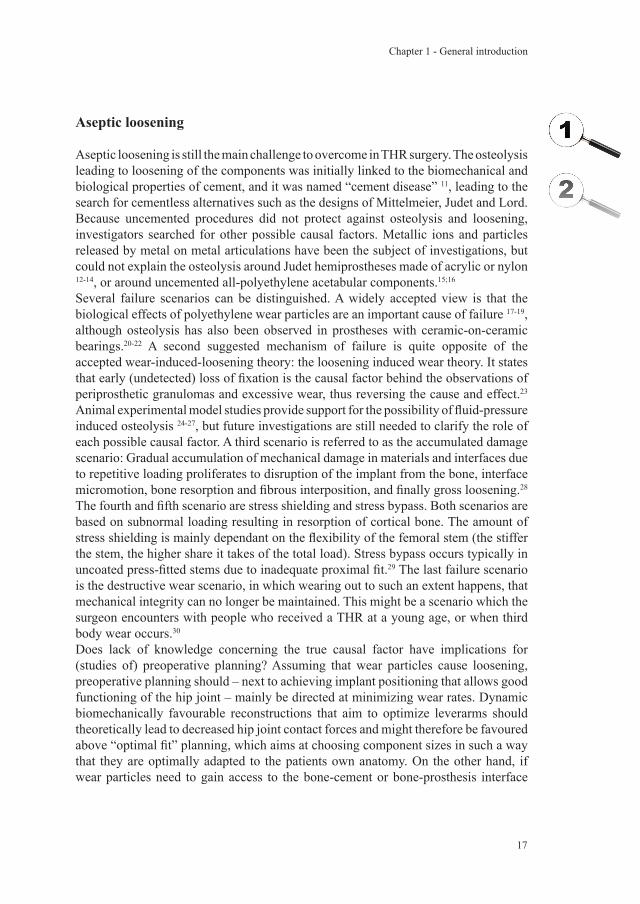
Thompson prosthesis and a non-cemented polytetrafluorethylene (Teflon) cup. He chose Teflon because of its low friction coefficient, but from 1962 on it was replaced by ultra-high molecular weight polyethylene which possessed much better wear properties.8 With this bearing combination the modern total hip replacement (fig. 2) was born. Other designs of THR have emerged over the past decades. Several manufacturers offer their own range of THR, each having specific features based on specific philosophies. Some THR designs have developed in a direction very different from the original Charnley design, but many modern total hip prostheses currently available on the market are indeed still based on the Charnley Total Hip prosthesis.Like every other surgical intervention, the THR exposes the patient to certain risks. Possible complications (besides loosening) are intra-operative fractures, nerve injury, dislocation, infection, heterotopic ossification and thrombo embolic events, but these are heavily outweighed by the predictable positive effect on pain and (to a lesser extent) function. Cost-utility studies point out that the THR scores favourably in comparison to several other interventions, such as Coronary Artery Bypass Graft (CABG) surgery, breast cancer screening and peritoneal or hemodialysis.With the aid of large databases such as the Swedish National Total Hip Register it has become apparent that the total hip replacement can certainly be considered one of the most successful orthopedic surgical interventions: survival of THRs is more than 90% at 10 years postoperatively.9;10 Nevertheless, the debate is still going on concerning choice of fixation, bearing materials, surface finishings, geometry of the stem and neck, and size of the femoral head.
Figure 2
Chapter 1 - General introduction
17
Aseptic loosening
Aseptic loosening is still the main challenge to overcome in THR surgery. The osteolysis leading to loosening of the components was initially linked to the biomechanical and biological properties of cement, and it was named “cement disease” 11, leading to the search for cementless alternatives such as the designs of Mittelmeier, Judet and Lord. Because uncemented procedures did not protect against osteolysis and loosening, investigators searched for other possible causal factors. Metallic ions and particles released by metal on metal articulations have been the subject of investigations, but could not explain the osteolysis around Judet hemiprostheses made of acrylic or nylon 12-14, or around uncemented all-polyethylene acetabular components.15;16
Several failure scenarios can be distinguished. A widely accepted view is that the biological effects of polyethylene wear particles are an important cause of failure 17-19, although osteolysis has also been observed in prostheses with ceramic-on-ceramic bearings.20-22 A second suggested mechanism of failure is quite opposite of the accepted wear-induced-loosening theory: the loosening induced wear theory. It states that early (undetected) loss of fixation is the causal factor behind the observations of periprosthetic granulomas and excessive wear, thus reversing the cause and effect.23 Animal experimental model studies provide support for the possibility of fluid-pressure induced osteolysis 24-27, but future investigations are still needed to clarify the role of each possible causal factor. A third scenario is referred to as the accumulated damage scenario: Gradual accumulation of mechanical damage in materials and interfaces due to repetitive loading proliferates to disruption of the implant from the bone, interface micromotion, bone resorption and fibrous interposition, and finally gross loosening.28 The fourth and fifth scenario are stress shielding and stress bypass. Both scenarios are based on subnormal loading resulting in resorption of cortical bone. The amount of stress shielding is mainly dependant on the flexibility of the femoral stem (the stiffer the stem, the higher share it takes of the total load). Stress bypass occurs typically in uncoated press-fitted stems due to inadequate proximal fit.29 The last failure scenario is the destructive wear scenario, in which wearing out to such an extent happens, that mechanical integrity can no longer be maintained. This might be a scenario which the surgeon encounters with people who received a THR at a young age, or when third body wear occurs.30
Does lack of knowledge concerning the true causal factor have implications for (studies of) preoperative planning? Assuming that wear particles cause loosening, preoperative planning should – next to achieving implant positioning that allows good functioning of the hip joint – mainly be directed at minimizing wear rates. Dynamic biomechanically favourable reconstructions that aim to optimize leverarms should theoretically lead to decreased hip joint contact forces and might therefore be favoured above “optimal fit” planning, which aims at choosing component sizes in such a way that they are optimally adapted to the patients own anatomy. On the other hand, if wear particles need to gain access to the bone-cement or bone-prosthesis interface
Chapter 1 - General introduction
18
to induce loosening, a preventative measurement would be to optimize the fixation at this interface which is the main philosophy of optimal fit planning and surgery. Scientific evidence to clearly support one or the other philosophy is currently lacking. It is our aim to eventually resolve this dillema. The first studies of this thesis were meant as a step towards clarification of some fundamental issues (see section below, “preoperative planning”). They are expected to guide future investigations leading to a definitive resolution of the above stated dilemma.Does lack of knowledge concerning the true causal factor of prosthetic loosening have implications for (studies of) postoperative measurements? Assuming that wear particles cause loosening, wear measurements should be able to directly quantify the magnitude of the source of the problem. Measurements regarding the dynamic biomechanics of the THR (for example, an unfavourable combination of lever arms and patient charachteristics) might identify a potential future problem of high wear rates of a cup, and measurements of cup migration or stem subsidence might aid in confirming loss of fixation. Assuming that high wear rates are not the cause but a result of early loss of fixation, wear measurements could still be valuable although the correlation between high wear rates and loosening of the prosthesis is probably not as high. The interpretation of high wear rates might not differ very much irrespective whether it is the cause or consequence of failure. If the micromotions directly lead to high wear rates, they will be present from early on and indicate a higher probability of the THR having suffered from loss of fixation. If they do not immediately lead to higher wear rates or if the loss of fixation occurs at a later stage – as in the accumulated damage scenario – increasing rates of wear on individual curves could be an indication of failed fixation. Measurements regarding the biomechanics of the THR might then be used to identify high risk THRs which are prone to loss of fixation due to high mechanical forces. Measurements of cup migration or stem subsidence may aid in confirming loss of fixation, although the micromotions following early loss of fixation may initially be too small to detect on standard radiographs. From a theoretical point of view, there seem to be many unanswered questions. From a practical point of view it is at least clear that valid and reliable measurement tools would be of value to the scientific and clinical orthopedic community. Our goal was to explore new possibilities of widely available measurement equipment in the era of digital radiographs. In other words: can the accuracy and reliability of two-dimensional radiographic measurements be enhanced with the use of more scientifically sophisticated digital tools (see section below, “postoperative measurements”)?
Chapter 1 - General introduction
19
Preoperative planning
In preoperative planning of a total hip replacement the surgeon searches for optimal fit of the hip implants and for the best technique to reconstruct leg length and the position of the centre of rotation, both of which are related to the chosen implant size and its positioning. It is thought to improve surgical precision, shorten the length of the procedure and reduce the incidence of complications.31-36 When preoperative planning is accurate, it might also provide the surgeon with a tool to ascertain that the correct prosthetic component sizes are available, and can be of assistance in logistic and stock management of the operation theatres (although it is not yet clear how much gain is to be expected from the latter).A three-dimensional planning would provide the surgeon with the most extensive information possible concerning the interaction between prosthesis and bony structures of the hip joint. CT-based solutions for this purpose have been developed and investigated 37-42, but in general it is not desirable to employ CT-scanning for routine primary total hip replacements.Most preoperative plans are performed using plastic templates on plain pelvic radiographs.43-45 When choosing this technique, the surgeon has to take the magnification factor into account. One possibility is to assume a standard magnification factor 46-48, but it has been shown that accuracy of preoperative planning might be jeopardized by this approach.49;50 Attempts to correct for the magnification factor more accurately have been described, although these methods rely on very rough estimations of the position of the centre of rotation of the hip.51;52 Since accurate knowledge regarding the magnification factor is a prerequisite for accurate preoperative planning, more research in this direction is needed.Preoperative planning is mostly described to be based on the restoration of certain biomechanical parameters, like the centre of rotation, femoral offset and leg length equalization.53-57 Several studies support this approach by providing evidence of a relation between these parameters and hip joint contact forces.58-67 Highly specialized non-CT-based three-dimensional-applications do exist, but have no place in daily practice since their burden in time and costs are considered too heavy.68;69 As mentioned before, it is not yet clear whether the most successful approach will employ linkage between the biomechanical parameters of the preoperatively planned reconstruction to a prediction of the resulting forces, or that the currently most popular approach of optimal fit planning should be maintained, or that these approached should be combined. In this thesis we would like to resolve two fundamental issues in order to set the stage for future studies which might resolve our dilemma of approaches.The first issue is the magnification factor of the hip joint on a standard pelvic radiograph. Is there a way to accurately correct for the magnification factor in order to be able to construct more accurate preoperative plans? (Chapter 2 and 3)The second issue concerns the potential advantage of digital preoperative planning above analogue planning. Is digital preoperative planning without changing concepts
Chapter 1 - General introduction
20
(i.e. optimal fit planning) more accurate than analogue preoperative planning? (Chapter 4 and 5)
Postoperative measurements
Postoperative measurements can be used for either diagnostic or prognostic purposes. For diagnosis of a loose THR, history and physical examination are used as indicators first in line, but additional imaging is routine and is used to confirm prosthetic loosening.70-74 However, measurements for prognostic purposes are much less integrated in clinical practice. Previous research has provided evidence that future failure or long-term success is related to parameters such as wear, cup migration and stem subsidence as measured on short term follow-up radiographs 75-78, although an accurate prediction model is still lacking. The advantages of two-dimensional measurements, such as wide applicability and low costs, cannot be denied, but neither should the disadvantages be. Although the introduction of digital radiographs might already have brought along an increase in precision, two-dimensional projectional effects (loosing the three-dimensional information of reality) are an unresolved threat to validity of postoperative measurements. Our goal was to seek solutions to deal with basic two-dimensional projectional effects as a first step to narrow the gap between validity and practical feasibility of employed measurement techniques in clinical practice. This brings us to the last question which we engage in this thesis: Can we mathematically enhance conventional linear wear measurements? (Chapter 6 and 7)
Summary of study questions
Can we accurately correct for the magnification factor? (Chapter 2 and 3)Is digital preoperative planning more accurate than analogue planning? (Chapter 4 and 5)Can we mathematically enhance wear measurements? (Chapter 6 and 7)
1.2.
3.
Chapter 1 - General introduction
21
Chapter 1 - General introduction
Reference List
1. Gomez PF, Morcuende JA. Early attempts at hip arthroplasty--1700s to 1950s. Iowa Orthop.J. 2005;25:25-29.
2. Smith-Petersen, MN. Arthroplasty of the hip. A new method. J Bone Joint Surg 1939;21(2), 269-288.
3. Smith-Petersen MN. The classic: Evolution of mould arthroplasty of the hip joint by MN Smith-Petersen, J. Bone Joint Surg. 30B:L:59, 1948. Clin.Orthop.Relat Res. 1978;5-11.
4. Judet J, Judet R. The use of an artificial femoral head for arthroplasty of the hip joint. J.Bone Joint Surg.Br. 1950;32-B:166-73.
5. The classic. Metal hip joint. A case report. By Austin T. Moore and Harold R. Bohlman. 1943. Clin.Orthop.Relat Res. 1983;3-6.
6. Thompson FR. Vitallium intramedullary hip prosthesis, preliminary report. N.Y.State J.Med. 1952;52:3011-20.
7. McKee GK, Watson-Farrar J. Replacement of arthritic hips by the McKee-Farrar prosthesis. J.Bone Joint Surg.Br. 1966;48:245-59.
8. Charnley J. Arthroplasty of the hip. A new operation. Lancet 1961;1:1129-32.9. Soderman P, Malchau H, Herberts P. Outcome after total hip arthroplasty: Part
I. General health evaluation in relation to definition of failure in the Swedish National Total Hip Arthoplasty register. Acta Orthop.Scand. 2000;71:354-59.
10. Bozic KJ, Saleh KJ, Rosenberg AG, Rubash HE. Economic evaluation in total hip arthroplasty: analysis and review of the literature. J.Arthroplasty 2004;19:180-89.
11. Jones LC, Hungerford DS. Cement disease. Clin.Orthop.Relat Res. 1987;192-206.
12. D’Aubigne RM, Postel M. Function al results of hip arthroplasty with acrylic prosthesis. J.Bone Joint Surg.Am. 1954;36-A:451-75.
13. Levy LJ, Lipscomb CP, McDonald HC, Jr. Complications of Judet arthroplasty due to foreign-body reaction to nylon prostheses. J.Bone Joint Surg.Am. 1954;36-A:1175-80.
14. Mittelmeier H, Singer L. Anatomical and histological studies on arthroplasty with plexiglass endoprosthesis; possibilities and limitations of reformation of joints. Arch.Orthop.Unfallchir. 1956;48:519-60.
15. Wilson-MacDonald J, Morscher E, Masar Z. Cementless uncoated polyethylene acetabular components in total hip replacement. Review of five- to 10-year results. J.Bone Joint Surg.Br. 1990;72:423-30.
16. Grigoris P, Roberts P, McMinn DJ. Failure of uncemented polyethylene acetabular components. J.Arthroplasty 1993;8:433-37.
17. Santavirta S, Hoikka V, Eskola A, Konttinen YT, Paavilainen T, Tallroth K. Aggressive granulomatous lesions in cementless total hip arthroplasty. J.Bone Joint Surg.Br. 1990;72:980-84.
Chapter 1 - General introduction
22
Chapter 1 - General introduction
18. Willert HG, Bertram H, Buchhorn GH. Osteolysis in alloarthroplasty of the hip. The role of ultra-high molecular weight polyethylene wear particles. Clin.Orthop.Relat Res. 1990;95-107.
19. Cooper RA, McAllister CM, Borden LS, Bauer TW. Polyethylene debris-induced osteolysis and loosening in uncemented total hip arthroplasty. A cause of late failure. J.Arthroplasty 1992;7:285-90.
20. Santavirta S, Hoikka V, Eskola A, Konttinen YT, Paavilainen T, Tallroth K. Aggressive granulomatous lesions in cementless total hip arthroplasty. J.Bone Joint Surg.Br. 1990;72:980-84.
21. Willert HG, Bertram H, Buchhorn GH. Osteolysis in alloarthroplasty of the hip. The role of ultra-high molecular weight polyethylene wear particles. Clin.Orthop.Relat Res. 1990;95-107.
23. Mjoberg B. Theories of wear and loosening in hip prostheses. Wear-induced loosening vs loosening-induced wear--a review. Acta Orthop.Scand. 1994.
24. De Man FH, Tigchelaar W, Marti RK, Van Noorden CJ, Van der Vis HM. Effects of mechanical compression of a fibrous tissue interface on bone with or without high-density polyethylene particles in a rabbit model of prosthetic loosening. J.Bone Joint Surg.Am. 2005;87:1522-33.
25. Skripitz R, Aspenberg P. Pressure-induced periprosthetic osteolysis: a rat model. J.Orthop.Res. 2000;18:481-84.
26. Van der Vis HM, Aspenberg P, Marti RK, Tigchelaar W, Van Noorden CJ. Fluid pressure causes bone resorption in a rabbit model of prosthetic loosening. Clin.Orthop.Relat Res. 1998;201-08.
27. Van der Vis H, Aspenberg P, De Kleine R, Tigchelaar W, Van Noorden CJ. Short periods of oscillating fluid pressure directed at a titanium-bone interface in rabbits lead to bone lysis. Acta Orthop.Scand. 1998;69:5-10.
28. Stauffer RN. Ten-year follow-up study of total hip replacement. J.Bone Joint Surg.Am. 1982;64:983-90.
29. Huiskes R. Failed innovation in total hip replacement. Diagnosis and proposals for a cure. Acta Orthop.Scand. 1993;64:699-716.
30. Saikko VO. Wear of polyethylene acetabular cups against alumina femoral heads. 5 prostheses compared in a hip simulator for 35 million walking cycles. Acta Orthop.Scand. 1993;64:507-12.
31. Muller ME. Lessons of 30 years of total hip arthroplasty. Clin.Orthop. 1992;12-21.
32. Capello WN. Preoperative planning of total hip arthroplasty. Instr.Course Lect. 1986;35:249-57.
33. Dore DD, Rubash HE. Primary total hip arthroplasty in the older patient: optimizing the results. Instr.Course Lect. 1994;43:347-57.
34. Haddad FS, Masri BA, Garbuz DS, Duncan CP. classification and preoperative planning. Instr.Course Lect. 2000;49:83-96.
Chapter 1 - General introduction
23
Chapter 1 - General introduction
35. Eggli S, Pisan M, Muller ME. TI - The value of preoperative planning for total hip arthroplasty. J.Bone Joint Surg.Br. 1998;80-B:382-90.
36. Blackley HR, Howell GE, Rorabeck CH. TI - Planning and management of the difficult primary hip replacement: preoperative planning and technical considerations. Instr.Course Lect. 2000;49:3-11.
37. Viceconti M, Lattanzi R, Antonietti B, Paderni S, Olmi R, Sudanese A et al. CT-based surgical planning software improves the accuracy of total hip replacement preoperative planning. Med.Eng Phys. 2003;25:371-77.
38. Lattanzi R, Viceconti M, Zannoni C, Quadrani P, Toni A. Hip-Op: an innovative software to plan total hip replacement surgery. Med.Inform.Internet.Med. 2002;27:71-83.
39. Gelalis LD, Xenakis TA, Hantes M, Vartziotis K, Soucacos PN. Three-dimensional computerized selection of hip prostheses in patients with congenital dislocated hips. Orthopedics 2001;24:1065-67.
40. Sugano N, Ohzono K, Nishii T, Haraguchi K, Sakai T, Ochi T. Computed-tomography-based computer preoperative planning for total hip arthroplasty. Comput.Aided Surg. 1998;3:320-24.
41. Jerosch J, von Hasselbach C, Filler T, Peuker E, Rahgozar M, Lahmer A. Increasing the quality of preoperative planning and intraoperative application of computer-assisted systems and surgical robots--an experimental study. Chirurg 1998;69:973-76.
42. Berman AT, McGovern KM, Paret RS, Yanicko DR, Jr. The use of preoperative computed tomography scanning in total hip arthroplasty. Clin.Orthop.Relat Res. 1987;190-96.
43. Della Valle AG, Padgett DE, Salvati EA. Preoperative planning for primary total hip arthroplasty. J.Am.Acad.Orthop.Surg. 2005;13:455-62.
44. Blackley HR, Howell GE, Rorabeck CH. Planning and management of the difficult primary hip replacement: preoperative planning and technical considerations. Instr.Course Lect. 2000;49:3-11.
45. Ramsperger R, Lubinus P. [Preoperative planning in hip endoprosthetics: presenting a computer-assisted system using CAD software]. Chirurg 1996;67:734-39.
46. Gonzalez Della Valle A, Slullitel G, Piccaluga F, Salvati EA. The precision and usefulness of preoperative planning for cemented and hybrid primary total hip arthroplasty. J.Arthroplasty 2005;20:51-58.
47. Eggli S, Pisan M, Muller ME. The value of preoperative planning for total hip arthroplasty. J.Bone Joint Surg.Br. 1998;80:382-90.
48. Cech O, Fassbender M, Kirschner P, Rozkydal Z. Preoperative planning and surgical technic in achieving stability and leg length equality in total hip joint arthroplasty. Acta Chir Orthop.Traumatol.Cech. 2002;69:362-68.
Chapter 1 - General introduction
24
Chapter 1 - General introduction
49. Linclau L, Dokter G, Peene P. Radiological aspects in preoperative planning and postoperative assessment of cementless total hip arthroplasty. Acta Orthop.Belg. 1993;59:163-67.
50. Knight JL, Atwater RD. Preoperative planning for total hip arthroplasty. Quantitating its utility and precision. J.Arthroplasty 1992;7 Suppl:403-09.
51. Gorski JM, Schwartz L. A device to measure X-ray magnification in preoperative planning for cementless arthroplasty. Clin.Orthop.Relat Res. 1986;302-06.
52. Conn KS, Clarke MT, Hallett JP. A simple guide to determine the magnification of radiographs and to improve the accuracy of preoperative templating. J.Bone Joint Surg.Br. 2002;84:269-72.
53. Schmalzried TP. Preoperative templating and biomechanics in total hip arthroplasty. Orthopedics 2005;28:s849-s851.
54. Maloney WJ, Keeney JA. Leg length discrepancy after total hip arthroplasty. J.Arthroplasty 2004;19:108-10.
55. Fessy MH, N’Diaye A, Carret JP, Fischer LP. Locating the center of rotation of the hip. Surg.Radiol.Anat. 1999;21:247-50.
56. Legal H, Ruder H. Biomechanically based planning for joint saving operation of the hip joint. Orthopade 1979;8:224-44.
57. Fessy MH, N’Diaye A, Carret JP, Fischer LP. Locating the center of rotation of the hip. Surg.Radiol.Anat. 1999;21:247-50.
58. Kleemann RU, Heller MO, Stoeckle U, Taylor WR, Duda GN. THA loading arising from increased femoral anteversion and offset may lead to critical cement stresses. J.Orthop.Res. 2003;21:767-74.
59. Carls J, Wirth CJ, Borner C, Pape A. [Changes of biomechanical parameters in dysplasia of the hip by total hip replacement]. Z.Orthop.Ihre Grenzgeb. 2002;140:527-32.
60. Lengsfeld M, Bassaly A, Boudriot U, Pressel T, Griss P. Size and direction of hip joint forces associated with various positions of the acetabulum. J.Arthroplasty 2000;15:314-20.
61. Doehring TC, Rubash HE, Shelley FJ, Schwendeman LJ, Donaldson TK, Navalgund YA. Effect of superior and superolateral relocations of the hip center on hip joint forces. An experimental and analytical analysis. J.Arthroplasty 1996;11:693-703.
62. McGrory BJ, Morrey BF, Cahalan TD, An KN, Cabanela ME. Effect of femoral offset on range of motion and abductor muscle strength after total hip arthroplasty. J.Bone Joint Surg.Br. 1995;77:865-69.
63. Vasavada AN, Delp SL, Maloney WJ, Schurman DJ, Zajac FE. Compensating for changes in muscle length in total hip arthroplasty. Effects on the moment generating capacity of the muscles. Clin.Orthop.Relat Res. 1994;121-33.
Chapter 1 - General introduction
25
Chapter 1 - General introduction
64. Karachalios T, Hartofilakidis G, Zacharakis N, Tsekoura M. A 12- to 18-year radiographic follow-up study of Charnley low-friction arthroplasty. The role of the center of rotation. Clin.Orthop.Relat Res. 1993;140-47.
65. Davey JR, O’Connor DO, Burke DW, Harris WH. Femoral component offset. Its effect on strain in bone-cement. J.Arthroplasty 1993;8:23-26.
66. Johnston RC, Brand RA, Crowninshield RD. Reconstruction of the hip. A mathematical approach to determine optimum geometric relationships. J.Bone Joint Surg.Am. 1979;61:639-52.
67. O’Toole RV, III, Jaramaz B, DiGioia AM, III, Visnic CD, Reid RH. Biomechanics for preoperative planning and surgical simulations in orthopaedics. Comput.Biol.Med. 1995;25:183-91.
68. Noble PC, Sugano N, Johnston JD, Thompson MT, Conditt MA, Engh CA, Sr. et al. Computer simulation: how can it help the surgeon optimize implant position? Clin.Orthop.Relat Res. 2003;242-52.
69. O’Toole RV, III, Jaramaz B, DiGioia AM, III, Visnic CD, Reid RH. Biomechanics for preoperative planning and surgical simulations in orthopaedics. Comput.Biol.Med. 1995;25:183-91.
70. Sochart DH. Relationship of acetabular wear to osteolysis and loosening in total hip arthroplasty. Clin.Orthop.Relat Res. 1999;135-50.
71. Krismer M, Biedermann R, Stockl B, Fischer M, Bauer R, Haid C. The prediction of failure of the stem in THR by measurement of early migration using EBRA-FCA. Einzel-Bild-Roentgen-Analyse-femoral component analysis. J.Bone Joint Surg.Br. 1999;81:273-80.
72. Stocks GW, Freeman MA, Evans SJ. Acetabular cup migration. Prediction of aseptic loosening. J.Bone Joint Surg.Br. 1995;77:853-61.
73. Walker PS, Mai SF, Cobb AG, Bentley G, Hua J. Prediction of clinical outcome of THR from migration measurements on standard radiographs. A study of cemented Charnley and Stanmore femoral stems. J.Bone Joint Surg.Br. 1995;77:705-14.
74. Temmerman OP, Raijmakers PG, Berkhof J, Hoekstra OS, Teule GJ, Heyligers IC. Accuracy of diagnostic imaging techniques in the diagnosis of aseptic loosening of the femoral component of a hip prosthesis: a meta-analysis. J.Bone Joint Surg.Br. 2005;87:781-85.
75. Sochart DH. Relationship of acetabular wear to osteolysis and loosening in total hip arthroplasty. Clin.Orthop.Relat Res. 1999;135-50.
76. Krismer M, Biedermann R, Stockl B, Fischer M, Bauer R, Haid C. The prediction of failure of the stem in THR by measurement of early migration using EBRA-FCA. Einzel-Bild-Roentgen-Analyse-femoral component analysis. J.Bone Joint Surg.Br. 1999;81:273-80.
77. Stocks GW, Freeman MA, Evans SJ. Acetabular cup migration. Prediction of aseptic loosening. J.Bone Joint Surg.Br. 1995;77:853-61.

Chapter 1 - General introduction
26
Chapter 1 - General introduction
78. Walker PS, Mai SF, Cobb AG, Bentley G, Hua J. Prediction of clinical outcome of THR from migration measurements on standard radiographs. A study of cemented Charnley and Stanmore femoral stems. J.Bone Joint Surg.Br. 1995;77:705-14.
Digital correction of magnification in pelvic x-rays
for preoperative planning of hip joint replacement
Theoretical development and clinical results of a new protocol
B. TheR.L. DiercksR.E. Stewart
P.M.A. van OoijenJ.R. van Horn
Medical Physics 2005 Augustus; 32(8): 2580-9

Chapter 2 - Digital correction of magnification in pelvic x-rays for preoperative planning
28
Chapter 2 - Digital correction of magnification in pelvic x-rays for preoperative planning
29
Abstract
IntroductionThe introduction of digital radiological facilities leads to the necessity of digital preoperative planning, which is an essential part of joint replacement surgery. To avoid errors in the preparation and execution of hip surgery, reliable correction of the magnification of the projected hip is a prerequisite. So far, no validated method exists to accomplish this.MethodsWe present validated geometrical models of the x-ray projection of spheres, relevant for the calibration procedure to correct for the radiographic magnification. With help of these models a new calibration protocol was developed. The validity and precision of this procedure was determined in clinical practice.ResultsMagnification factors could be predicted with a maximal margin of error of 1.5%. The new calibration protocol is valid and reliable. The clinical tests revealed that correction of magnification has a 95% margin of error of −3% to +3%.ConclusionFuture research might clarify if a strict calibration protocol, as presented in this study, results in more accurate preoperative planning of hip joint replacements.

Chapter 2 - Digital correction of magnification in pelvic x-rays for preoperative planning
30
Introduction
Preoperative planning for hip joint replacement is considered an essential part of the total surgical procedure. It forces the surgeon to think three-dimensionally and improves surgical precision. In addition, it shortens the operation time and greatly reduces the incidence of complications.1–4 Possible complications are fractures of the femur due to use of too large components, great leg length differences and disturbance of biomechanical properties of the hip joint, leading to excessive joint contact forces and limping. It is not without problems, however, to make preoperative plans on analogue plain radiographs.5;6 The main reason is that the magnification factor of the projected hip joint on the x-ray was not determined with sufficient precision. Most orthopedic surgeons assumed a standard magnification. The surgeons who tried to obtain a better estimate of the magnification used objects with known dimensions like coins or prosthetic femoral heads for calibration, but faced two problems: Accurate measurements on analogue radiographs were not possible with standard equipment, and the templates used in preoperative planning were only available in a very limitedrange of magnifications. Therefore, analogue planning was never a reliable method for deciding which component size had to be used.5–7 The ability to do so would add to the mentioned clinical advantages and provide a tool to control the stock of implants, having the potential of substantial cost reductions for hospitals and prosthesis manufacturers.New methods of digital planning on digital plain pelvic radiographs have the potential to accomplish this. In order to correct for the magnification factor digitally, a spherical object with known diameter, is placed between the legs of the patient when making the plain pelvic radiograph. Knowledge of the diameter of the object allows the computer to calculate the magnification factor, or to use it for calibration of measurements and preoperative planning procedures.The most important problem to overcome is correct positioning of the calibration object when making the radiograph. The calibration object should be positioned with the same distance to the x-ray source and plate as the patients own hip joint. This results in a preoperative pelvic radiograph including the projection of the calibration object. If it is accurately positioned, extrapolation of the calculated magnification to the hip joint is valid. For hip joint replacements in particular, this poses a difficult problem, since the position of the hip joint can only be estimated indirectly.If the calibration object and the patient’s own joint are both located in the same plane parallel to the x-ray plate, but their distance to the centre of the image is not the same, their magnification will differ and the calibration will not be optimal. A difference in magnification will also occur if they are not located in the same plane parallel to the x-ray plate when one object is located “higher” than the other.The purpose of our study was to first model the projection f the calibration object, then to quantify the errors in correction of magnification when the calibration object and hip joint are not positioned similarly with regard to the x-ray source and plate, and
Chapter 2 - Digital correction of magnification in pelvic x-rays for preoperative planning
31
finally to use this information to develop a clinical calibration protocol for preoperative planning of total hip arthroplasties.
Methods
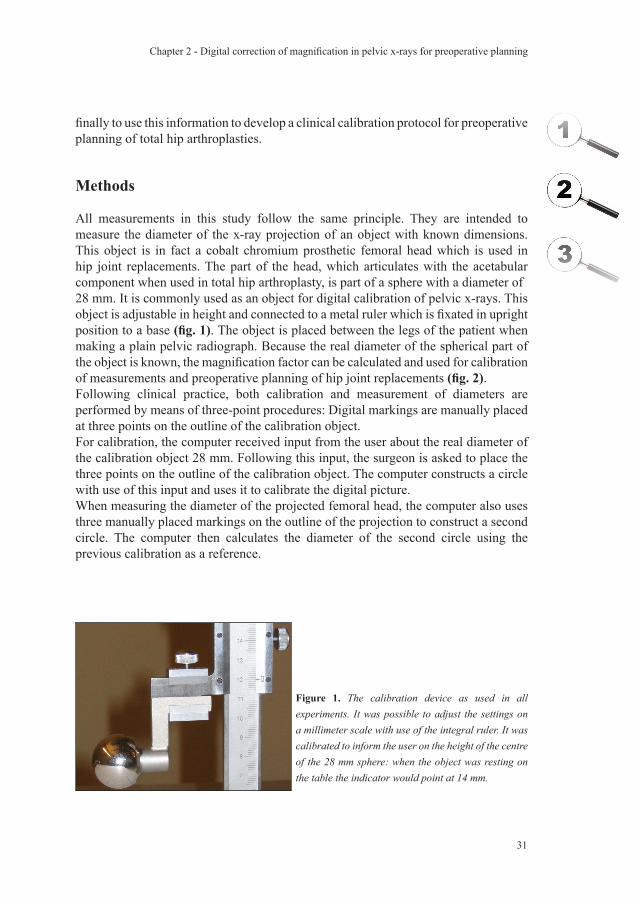
All measurements in this study follow the same principle. They are intended to measure the diameter of the x-ray projection of an object with known dimensions. This object is in fact a cobalt chromium prosthetic femoral head which is used in hip joint replacements. The part of the head, which articulates with the acetabular component when used in total hip arthroplasty, is part of a sphere with a diameter of28 mm. It is commonly used as an object for digital calibration of pelvic x-rays. This object is adjustable in height and connected to a metal ruler which is fixated in upright position to a base (fig. 1). The object is placed between the legs of the patient when making a plain pelvic radiograph. Because the real diameter of the spherical part of the object is known, the magnification factor can be calculated and used for calibration of measurements and preoperative planning of hip joint replacements (fig. 2).Following clinical practice, both calibration and measurement of diameters are performed by means of three-point procedures: Digital markings are manually placed at three points on the outline of the calibration object.For calibration, the computer received input from the user about the real diameter of the calibration object 28 mm. Following this input, the surgeon is asked to place the three points on the outline of the calibration object. The computer constructs a circle with use of this input and uses it to calibrate the digital picture.When measuring the diameter of the projected femoral head, the computer also uses three manually placed markings on the outline of the projection to construct a second circle. The computer then calculates the diameter of the second circle using the previous calibration as a reference.
Figure 1. The calibration device as used in all experiments. It was possible to adjust the settings on a millimeter scale with use of the integral ruler. It was calibrated to inform the user on the height of the centre of the 28 mm sphere: when the object was resting on the table the indicator would point at 14 mm.

Chapter 2 - Digital correction of magnification in pelvic x-rays for preoperative planning
32
A. Inter- and intraobserver precision of three-point measurementsTwo main experimental set-ups were used for the measurements: In the first experiment magnification due to vertical shift was investigated and only one calibration device was used. The calibration object was positioned on three different heights: 70 mm, 120 mm and 170 mm. For each height three radiographs were made after manual repositioning of the x-ray source by radiological personnel. This resulted in a total of nine radiographs. Three different observers measured the projected diameter of the calibration object on each radiograph. This series of measurements was performed three times by the same observers. This resulted in a total of 81 measurements, with three distinct sources of possible variance per height group: variance of measurements within observers, variance between observers and variance due to repositioning.To study the precision of the measurements, the differences due to the different heights were cancelled out by stratification. They are of interest when investigating the validity of the models (section B.2 of this chapter), and not when investigating the precision of the measurements.In the second experiment the influence of horizontal shift on magnification was investigated. Two calibration devices were used for each radiograph. The distance between the centres of both calibration objects was either 60 mm, 120 mm or 180 mm. For each distance three radiographs were made after manual repositioning of the x-ray source by radiological personnel. This resulted in nine radiographs. Three observers measured the projected diameter of the two calibration objects on each radiograph. This series of measurements was performed three times by the same observers. This resulted in a total of 162 measurements with three distinct sources of possible variance per distance group: variance of measurements within observers, variance between observers and variance due to repositioning.
Figure 2. A magnified part of a digital plain pelvic radiograph on which a preoperative plan for total hip arthroplasty has been constructed. The calibration object (arrow) is positioned between the legs of the patient.
Chapter 2 - Digital correction of magnification in pelvic x-rays for preoperative planning
33
To study the precision of the measurements, the differences due to the different distances were cancelled out by stratification. They are of interest when investigating the validity of the models (section C.2 of this chapter), and not when investigating the precision of the measurements.The standard deviation of the measured diameters was determined for each experimental set-up. The relative contribution of each potential sources of variance (variance between observers, variance within observers and variance due to repositioning) was quantified using statistical analysis of variance techniques.
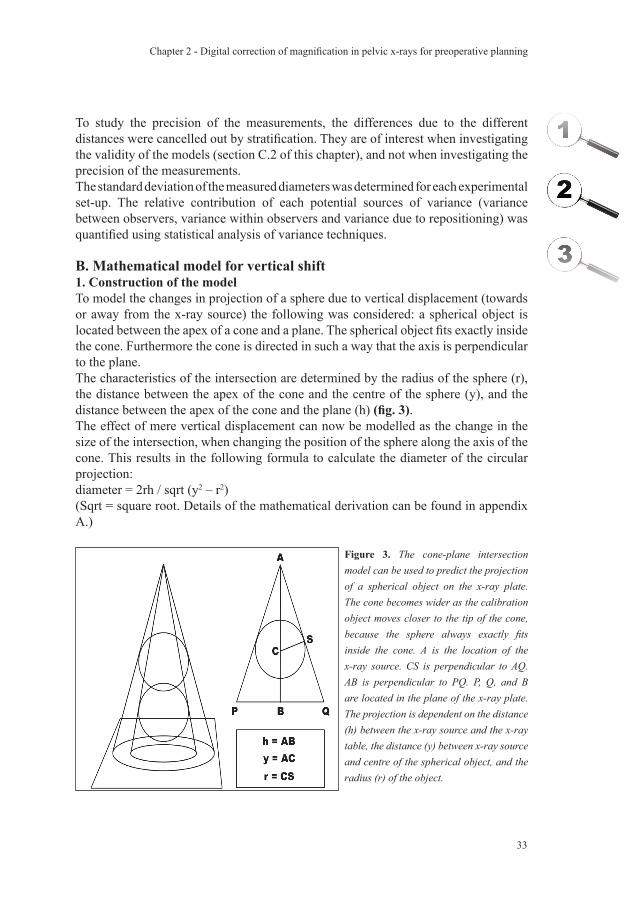
B. Mathematical model for vertical shift1. Construction of the modelTo model the changes in projection of a sphere due to vertical displacement (towards or away from the x-ray source) the following was considered: a spherical object is located between the apex of a cone and a plane. The spherical object fits exactly inside the cone. Furthermore the cone is directed in such a way that the axis is perpendicular to the plane.The characteristics of the intersection are determined by the radius of the sphere (r), the distance between the apex of the cone and the centre of the sphere (y), and the distance between the apex of the cone and the plane (h) (fig. 3).The effect of mere vertical displacement can now be modelled as the change in the size of the intersection, when changing the position of the sphere along the axis of the cone. This results in the following formula to calculate the diameter of the circular projection:diameter = 2rh / sqrt (y2 – r2)(Sqrt = square root. Details of the mathematical derivation can be found in appendix A.)
Figure 3. The cone-plane intersection model can be used to predict the projection of a spherical object on the x-ray plate. The cone becomes wider as the calibration object moves closer to the tip of the cone, because the sphere always exactly fits inside the cone. A is the location of the x-ray source. CS is perpendicular to AQ. AB is perpendicular to PQ. P, Q, and B are located in the plane of the x-ray plate.The projection is dependent on the distance (h) between the x-ray source and the x-ray table, the distance (y) between x-ray source and centre of the spherical object, and the radius (r) of the object.
Chapter 2 - Digital correction of magnification in pelvic x-rays for preoperative planning
34
2. Validation
To validate the constructed model, the first experimental set-up using only one calibration device was used as described in section A. The calibration object was positioned on three different heights: 70 mm, 120 mm and 170 mm. The mean measured diameter of the projection at the different heights was used to compare with the predicted diameters by the model.The model was then used to mimic a range of situations in which the patients femoral head and calibration object have different distances to the x-ray plate.
C. Mathematical model for horizontal shift1. Construction of the modelTo model the changes in projection of a sphere due to horizontal displacement (parallel to the x-ray plate) the following was considered: A spherical object is located between the apex of a cone and a plane. The spherical object fits exactly inside the cone. The starting point is the situation in which the cone is directed in such a way that the axis is perpendicular to the plane. Then the sphere is displaced parallel to the x-ray plate
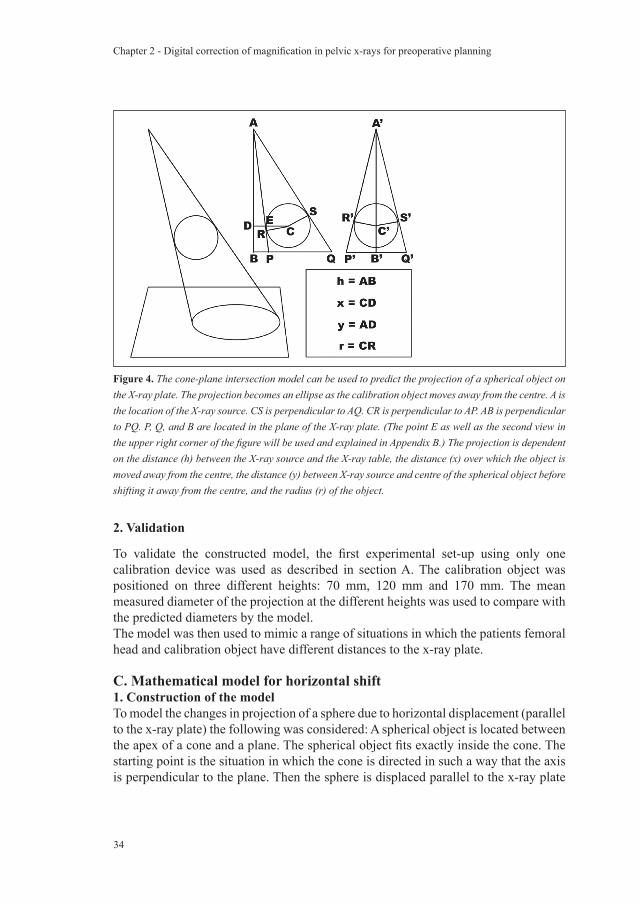
Figure 4. The cone-plane intersection model can be used to predict the projection of a spherical object on the X-ray plate. The projection becomes an ellipse as the calibration object moves away from the centre. A is the location of the X-ray source. CS is perpendicular to AQ. CR is perpendicular to AP. AB is perpendicular to PQ. P, Q, and B are located in the plane of the X-ray plate. (The point E as well as the second view in the upper right corner of the figure will be used and explained in Appendix B.) The projection is dependent on the distance (h) between the X-ray source and the X-ray table, the distance (x) over which the object is moved away from the centre, the distance (y) between X-ray source and centre of the spherical object before shifting it away from the centre, and the radius (r) of the object.
Chapter 2 - Digital correction of magnification in pelvic x-rays for preoperative planning
35
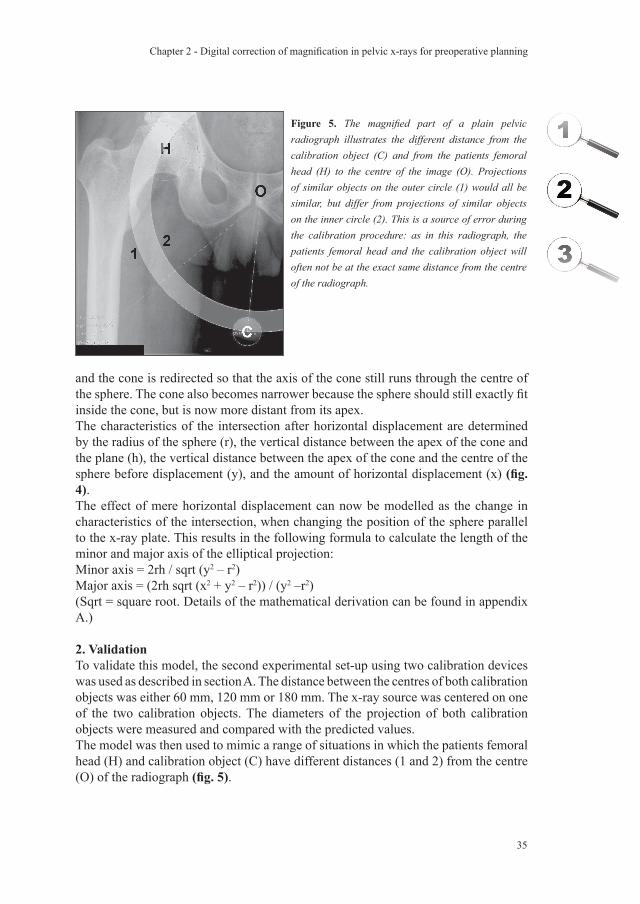
Figure 5. The magnified part of a plain pelvic radiograph illustrates the different distance from the calibration object (C) and from the patients femoral head (H) to the centre of the image (O). Projections of similar objects on the outer circle (1) would all be similar, but differ from projections of similar objects on the inner circle (2). This is a source of error during the calibration procedure: as in this radiograph, the patients femoral head and the calibration object will often not be at the exact same distance from the centre of the radiograph.
and the cone is redirected so that the axis of the cone still runs through the centre of the sphere. The cone also becomes narrower because the sphere should still exactly fit inside the cone, but is now more distant from its apex.The characteristics of the intersection after horizontal displacement are determined by the radius of the sphere (r), the vertical distance between the apex of the cone and the plane (h), the vertical distance between the apex of the cone and the centre of the sphere before displacement (y), and the amount of horizontal displacement (x) (fig. 4).The effect of mere horizontal displacement can now be modelled as the change in characteristics of the intersection, when changing the position of the sphere parallel to the x-ray plate. This results in the following formula to calculate the length of the minor and major axis of the elliptical projection:Minor axis = 2rh / sqrt (y2 – r2)Major axis = (2rh sqrt (x2 + y2 – r2)) / (y2 –r2)(Sqrt = square root. Details of the mathematical derivation can be found in appendix A.)
2. ValidationTo validate this model, the second experimental set-up using two calibration devices was used as described in section A. The distance between the centres of both calibration objects was either 60 mm, 120 mm or 180 mm. The x-ray source was centered on one of the two calibration objects. The diameters of the projection of both calibration objects were measured and compared with the predicted values. The model was then used to mimic a range of situations in which the patients femoral head (H) and calibration object (C) have different distances (1 and 2) from the centre (O) of the radiograph (fig. 5).
Chapter 2 - Digital correction of magnification in pelvic x-rays for preoperative planning
36
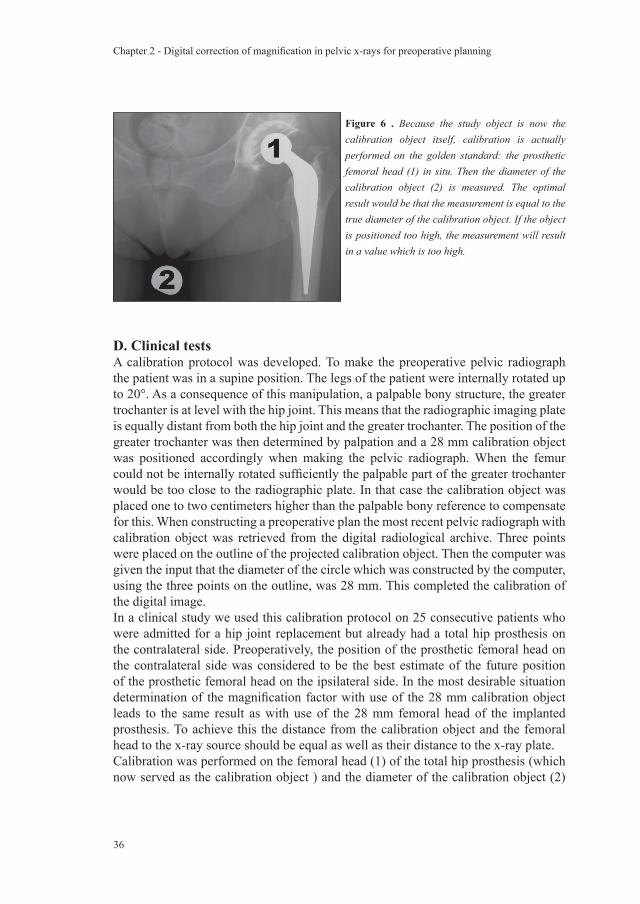
D. Clinical testsA calibration protocol was developed. To make the preoperative pelvic radiograph the patient was in a supine position. The legs of the patient were internally rotated up to 20°. As a consequence of this manipulation, a palpable bony structure, the greater trochanter is at level with the hip joint. This means that the radiographic imaging plate is equally distant from both the hip joint and the greater trochanter. The position of the greater trochanter was then determined by palpation and a 28 mm calibration object was positioned accordingly when making the pelvic radiograph. When the femur could not be internally rotated sufficiently the palpable part of the greater trochanter would be too close to the radiographic plate. In that case the calibration object was placed one to two centimeters higher than the palpable bony reference to compensate for this. When constructing a preoperative plan the most recent pelvic radiograph with calibration object was retrieved from the digital radiological archive. Three points were placed on the outline of the projected calibration object. Then the computer was given the input that the diameter of the circle which was constructed by the computer, using the three points on the outline, was 28 mm. This completed the calibration of the digital image.In a clinical study we used this calibration protocol on 25 consecutive patients who were admitted for a hip joint replacement but already had a total hip prosthesis on the contralateral side. Preoperatively, the position of the prosthetic femoral head on the contralateral side was considered to be the best estimate of the future position of the prosthetic femoral head on the ipsilateral side. In the most desirable situation determination of the magnification factor with use of the 28 mm calibration object leads to the same result as with use of the 28 mm femoral head of the implanted prosthesis. To achieve this the distance from the calibration object and the femoral head to the x-ray source should be equal as well as their distance to the x-ray plate. Calibration was performed on the femoral head (1) of the total hip prosthesis (which now served as the calibration object ) and the diameter of the calibration object (2)
Figure 6 . Because the study object is now the calibration object itself, calibration is actually performed on the golden standard: the prosthetic femoral head (1) in situ. Then the diameter of the calibration object (2) is measured. The optimal result would be that the measurement is equal to the true diameter of the calibration object. If the object is positioned too high, the measurement will result in a value which is too high.
Chapter 2 - Digital correction of magnification in pelvic x-rays for preoperative planning
37
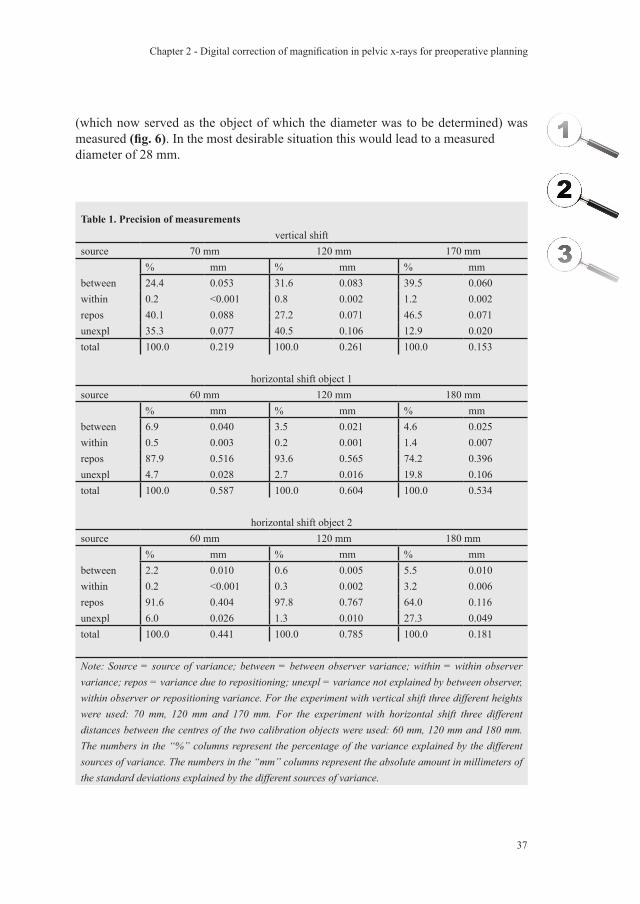
Table 1. Precision of measurementsvertical shift
source 70 mm 120 mm 170 mm% mm % mm % mm
between 24.4 0.053 31.6 0.083 39.5 0.060within 0.2 <0.001 0.8 0.002 1.2 0.002repos 40.1 0.088 27.2 0.071 46.5 0.071unexpl 35.3 0.077 40.5 0.106 12.9 0.020total 100.0 0.219 100.0 0.261 100.0 0.153
horizontal shift object 1source 60 mm 120 mm 180 mm
% mm % mm % mmbetween 6.9 0.040 3.5 0.021 4.6 0.025within 0.5 0.003 0.2 0.001 1.4 0.007repos 87.9 0.516 93.6 0.565 74.2 0.396unexpl 4.7 0.028 2.7 0.016 19.8 0.106total 100.0 0.587 100.0 0.604 100.0 0.534
horizontal shift object 2source 60 mm 120 mm 180 mm
% mm % mm % mmbetween 2.2 0.010 0.6 0.005 5.5 0.010within 0.2 <0.001 0.3 0.002 3.2 0.006repos 91.6 0.404 97.8 0.767 64.0 0.116unexpl 6.0 0.026 1.3 0.010 27.3 0.049total 100.0 0.441 100.0 0.785 100.0 0.181
Note: Source = source of variance; between = between observer variance; within = within observer variance; repos = variance due to repositioning; unexpl = variance not explained by between observer, within observer or repositioning variance. For the experiment with vertical shift three different heights were used: 70 mm, 120 mm and 170 mm. For the experiment with horizontal shift three different distances between the centres of the two calibration objects were used: 60 mm, 120 mm and 180 mm. The numbers in the “%” columns represent the percentage of the variance explained by the different sources of variance. The numbers in the “mm” columns represent the absolute amount in millimeters of the standard deviations explained by the different sources of variance.
(which now served as the object of which the diameter was to be determined) was measured (fig. 6). In the most desirable situation this would lead to a measured diameter of 28 mm.
Chapter 2 - Digital correction of magnification in pelvic x-rays for preoperative planning
38
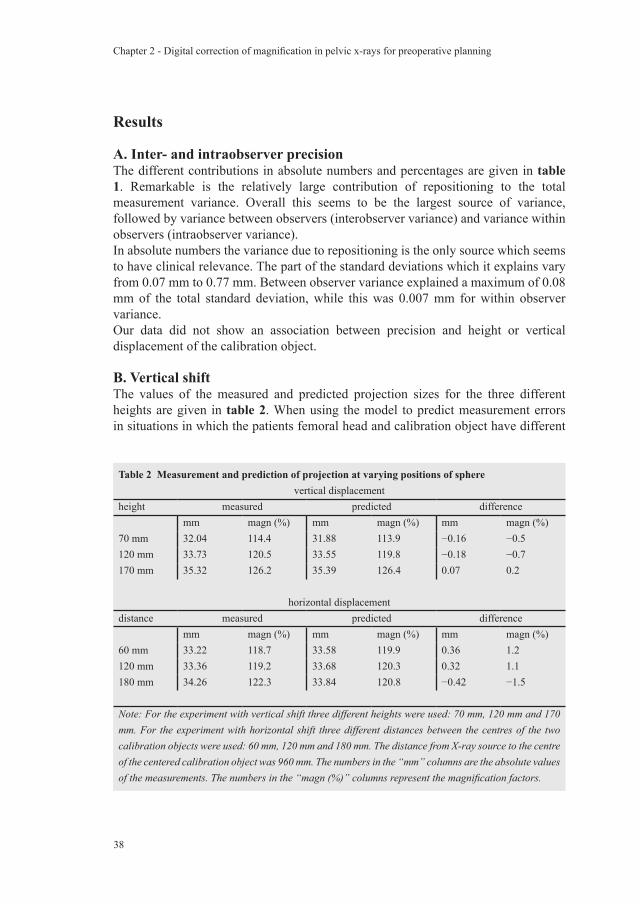
Table 2 Measurement and prediction of projection at varying positions of spherevertical displacement
height measured predicted differencemm magn (%) mm magn (%) mm magn (%)
70 mm 32.04 114.4 31.88 113.9 −0.16 −0.5120 mm 33.73 120.5 33.55 119.8 −0.18 −0.7170 mm 35.32 126.2 35.39 126.4 0.07 0.2
horizontal displacementdistance measured predicted difference
mm magn (%) mm magn (%) mm magn (%)60 mm 33.22 118.7 33.58 119.9 0.36 1.2120 mm 33.36 119.2 33.68 120.3 0.32 1.1180 mm 34.26 122.3 33.84 120.8 −0.42 −1.5
Note: For the experiment with vertical shift three different heights were used: 70 mm, 120 mm and 170 mm. For the experiment with horizontal shift three different distances between the centres of the two calibration objects were used: 60 mm, 120 mm and 180 mm. The distance from X-ray source to the centre of the centered calibration object was 960 mm. The numbers in the “mm” columns are the absolute values of the measurements. The numbers in the “magn (%)” columns represent the magnification factors.
Results
A. Inter- and intraobserver precisionThe different contributions in absolute numbers and percentages are given in table 1. Remarkable is the relatively large contribution of repositioning to the total measurement variance. Overall this seems to be the largest source of variance, followed by variance between observers (interobserver variance) and variance within observers (intraobserver variance).In absolute numbers the variance due to repositioning is the only source which seems to have clinical relevance. The part of the standard deviations which it explains vary from 0.07 mm to 0.77 mm. Between observer variance explained a maximum of 0.08 mm of the total standard deviation, while this was 0.007 mm for within observer variance.Our data did not show an association between precision and height or vertical displacement of the calibration object.
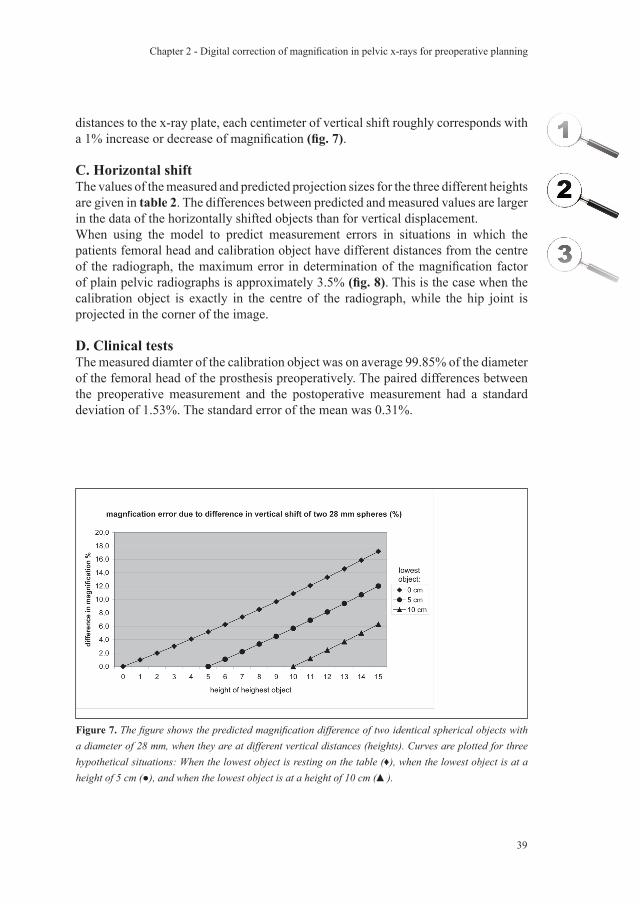
B. Vertical shiftThe values of the measured and predicted projection sizes for the three different heights are given in table 2. When using the model to predict measurement errors in situations in which the patients femoral head and calibration object have different
Chapter 2 - Digital correction of magnification in pelvic x-rays for preoperative planning
39
Figure 7. The figure shows the predicted magnification difference of two identical spherical objects with a diameter of 28 mm, when they are at different vertical distances (heights). Curves are plotted for three hypothetical situations: When the lowest object is resting on the table (♦), when the lowest object is at a height of 5 cm (●), and when the lowest object is at a height of 10 cm (▲).
distances to the x-ray plate, each centimeter of vertical shift roughly corresponds with a 1% increase or decrease of magnification (fig. 7).
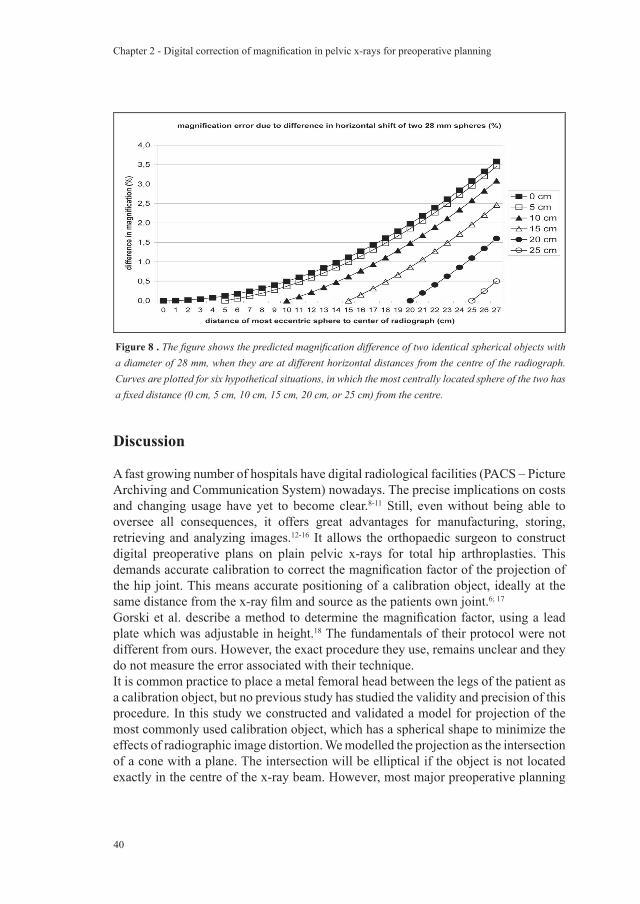
C. Horizontal shiftThe values of the measured and predicted projection sizes for the three different heights are given in table 2. The differences between predicted and measured values are larger in the data of the horizontally shifted objects than for vertical displacement. When using the model to predict measurement errors in situations in which the patients femoral head and calibration object have different distances from the centre of the radiograph, the maximum error in determination of the magnification factor of plain pelvic radiographs is approximately 3.5% (fig. 8). This is the case when the calibration object is exactly in the centre of the radiograph, while the hip joint is projected in the corner of the image.
D. Clinical testsThe measured diamter of the calibration object was on average 99.85% of the diameter of the femoral head of the prosthesis preoperatively. The paired differences between the preoperative measurement and the postoperative measurement had a standard deviation of 1.53%. The standard error of the mean was 0.31%.
Chapter 2 - Digital correction of magnification in pelvic x-rays for preoperative planning
40
Discussion
A fast growing number of hospitals have digital radiological facilities (PACS – Picture Archiving and Communication System) nowadays. The precise implications on costs and changing usage have yet to become clear.8-11 Still, even without being able to oversee all consequences, it offers great advantages for manufacturing, storing, retrieving and analyzing images.12-16 It allows the orthopaedic surgeon to construct digital preoperative plans on plain pelvic x-rays for total hip arthroplasties. This demands accurate calibration to correct the magnification factor of the projection of the hip joint. This means accurate positioning of a calibration object, ideally at the same distance from the x-ray film and source as the patients own joint.6; 17
Gorski et al. describe a method to determine the magnification factor, using a lead plate which was adjustable in height.18 The fundamentals of their protocol were not different from ours. However, the exact procedure they use, remains unclear and they do not measure the error associated with their technique.It is common practice to place a metal femoral head between the legs of the patient as a calibration object, but no previous study has studied the validity and precision of this procedure. In this study we constructed and validated a model for projection of the most commonly used calibration object, which has a spherical shape to minimize the effects of radiographic image distortion. We modelled the projection as the intersection of a cone with a plane. The intersection will be elliptical if the object is not located exactly in the centre of the x-ray beam. However, most major preoperative planning
Figure 8 . The figure shows the predicted magnification difference of two identical spherical objects with a diameter of 28 mm, when they are at different horizontal distances from the centre of the radiograph. Curves are plotted for six hypothetical situations, in which the most centrally located sphere of the two has a fixed distance (0 cm, 5 cm, 10 cm, 15 cm, 20 cm, or 25 cm) from the centre.
Chapter 2 - Digital correction of magnification in pelvic x-rays for preoperative planning
41
software packages make use of circles to determine the magnification factor, and we have accounted for this potential source of non-random error in the study design, as well as for sources of random error.This study has provided data on the different sources of random error, which the clinician will have to bear in mind when calibrating digital radiographs. Although the contribution to measurement variability of interobserver, intraobserver, and x-ray source repositioning variances could be quantified, it was not possible to quantify the variance due to patient repositioning in this experimental set-up. The error due to repositioning the x-ray source appears to be the most important – much more important than interobserver differences – and has induced errors of up to 2.7% in our experiments. Together with the variances in patient positioning, this could explain why total hip arthroplasties during follow-up appear to have quite some variance in magnification. The use of digital edge detection could diminish the error caused by intraobserver and interobserver variability, but has no effect on the greatest source of error: x-ray source positioning. When using calibration objects, the differences due to x-ray source positioning variances are cancelled out: for example, if the hip joint is projected “too large” because the x-ray source is positioned lower than in the standard set-up, the calibration object is also projected equally larger. Unfortunately, differences due to variance in patient positioning cannot be compensated for by any method. The magnitude of non-random error, due to the use of circles instead of ellipses for the calibration procedure, was also quantified. Although the magnitude of these errors (up to 1.5%) are small in comparison with the repositioning errors, they are substantial and provide an argument to abandon the classical way of calibrating radiographs.The models provided us with a tool to estimate the magnitude of errors we could expect when the calibration object was not in the same frontal or anteroposterior plane. This enabled us to develop a calibration protocol which we implemented in clinical practice. The models showed that differences between hip joint and calibration object regarding the distance to the centre of the image result in an error less than 1% as long as the difference is no more than 5 cm (which is a reasonable assumption in clinical practice).The models made clear that horizontal malpositioning (difference in distance to the centre of the radiograph) is – if not extreme – not responsible for large errors. However, it will certainly add to an already existing error caused by vertical malpositioning if the malpositioning is both in the frontal plane and in the anteroposterior direction. The models made clear that we had to be very cautious with the latter, and we considered how to handle this source of error. Using no more than a plain pelvic radiograph, the position of the hip joint out of the plane of the radiograph can only be measured indirectly using bony landmarks like the greater trochanter, or estimated with use of anatomical data of the average femoral anteversion in this specific population. The greater trochanter is most readily palpable when the femoral anteversion (the angular difference between axis of femoral neck and the transcondylar axis of the knee) is
Chapter 2 - Digital correction of magnification in pelvic x-rays for preoperative planning
42
neutralized by internal rotation of the leg.19 This way, the anteroposterior position of the hip joint can be estimated and used to position the calibration object. When making the plain pelvic radiograph, the same positioning of the patient is used. On average, the degree of internal rotation should be as much as 20º (which is not always possible in this population with osteoarthritic hip joints), as recommended by Blackley et al.4 How much internal rotation exactly is needed to neutralize the femoral anteversion can only be estimated, using data obtained in previous studies.20;
21 Several studies measuring femoral anteversion angles provide useful information. Measured average femoral anteversion varies from 10º ± 6.5º in cadavers 22 and 9.8º ± 8.5º in a study using 200 reconstructed skeletons.23 However, this concerns data of a population with normal hip joints, while our population of interest suffers from osteoarthritis of the hip joints.Osteoarthritic hip joints are known to have more femoral anteversion than normal hip joints. The measured average femoral anteversion varies from 17º to 20º ± 9º.20; 21 For both normal and osteoarthritic hip joints there is no difference between males and females.20-23 Bilateral differences can be expected to be quite large - up to 11.8º in 95% of a population with a normal distribution - 22, so this information cannot be used for more accurate positioning of the calibration object.When the lever arm of the palpable part of the greater trochanter to the centre of rotation of the hip joint is known, it is possible to tell how big the error in correction of magnification will be with undercorrections or overcorrections of anteversion. Using the extensive data of Maruyama et al.23 we can estimate an average lever arm of approximately 8 cm. This rough estimate resulted from the data of the average medial offset of the femoral head in a derotated femur, the average shaft-neck angles, and the assumption that the distance between the anatomical axis of the femoral shaft and the palpable part of the greater trochanter is equal to the diameter of the femoral neck.When using acetabular components, which are available in sizes with 2 mm variations in diameter, an error of 3% to 4% would lead to a projection error as big as the difference between two consecutive sizes. With a lever arm of 8 cm, one may undercorrect or overcorrect the femoral anteversion up to 7.2º without introducing a structural error above 1%, which should be possible if the soft tissue layer allows easy palpation of the greater trochanter.The clinical data we obtained after implementation of our calibration protocol were interesting in two ways. First of all, the positioning of the calibration object resulted on average in a close match with the magnification of the femoral head of the total hip prosthesis. The assumption that on average the object would be placed lower than the hip joint, because of insufficient endorotation in painful hips, was therefore proven to be incorrect. Placing the calibration object one to two centimeters higher than the trochanter in patients with limited endorotation has probably compensated for this.The magnification of the calibration object and the contralateral total hip arthroplasty in situ was equal, with a standard error of the mean of 0.31%. This means that the mean difference between magnification of the calibration object on the preoperative
Chapter 2 - Digital correction of magnification in pelvic x-rays for preoperative planning
43
radiograph and magnificationi of the prosthetic femoral head in situ on the postoperative measurements lies within a 95% confidence interval of -0.60% to +0.60%. The standard deviation of the differences was 1.53%. Thus the 95% reference range of the difference in magnification between the calibration object and the hip joint which has to be operated is -3.00% to +3.00%. Using the mathematical models we can translate this in a range of malpositioning in height from -3 to +3 cm, which reflects the margin of error in correction of magnification with the protocol. A possible explanation for this range of errors is that the greater trochanter is not always easily palpable, especially in obese patients. Another possible factor might be the variance in patient positioning. These data concerning the expected errors in calibration clarify that, despite the potential advantages over manual planning, digital preoperative planning brings on its own set of problems and demands great attention to the process of calibration. In conclusion, it was possible to predict magnification factors for different positions of the calibration object with a maximal margin of error of 1.5%. A strict calibration protocol is necessary to create acceptable conditions for digital preoperative planning of total hip arthroplasties on plain pelvic x-rays. We have developed and implemented an accurate and reliable calibration procedure. These first clinical results show that the orthopaedic surgeon should expect errors in correction of magnification to be in the range of –3% to +3% using our protocol.
Acknowledgements
Funds were received in partial support of the research of the study presented in this article from Biomet NL, Dordrecht, the Netherlands. The authors would like to thank Dr. D.A. Peterson and Dr. R.M. Scheek for construction of the mathematical models. We acknowledge the valuable contribution of Albert Evenhuis who build the calibration devices. We also thank Hylke van den Bosch and Jan Kooistra for providing radiographs for this study. The authors are also deeply indebted to Maureen Brouwer for her valuable support and her help in the initial setup of our study. Finally, the authors gratefully acknowledge the assistance of Sioe Hoey Go, Inge Scheek-v.d. Akker, and Inge Reininga for their support in performing part of the measurements, as well as Alette Spriensma, Paul Scholten, Natalie Boss, Dennis Kok and Prashant Komdeur for their support in the clinical implementation of the calibration protocol.
Chapter 2 - Digital correction of magnification in pelvic x-rays for preoperative planning
44
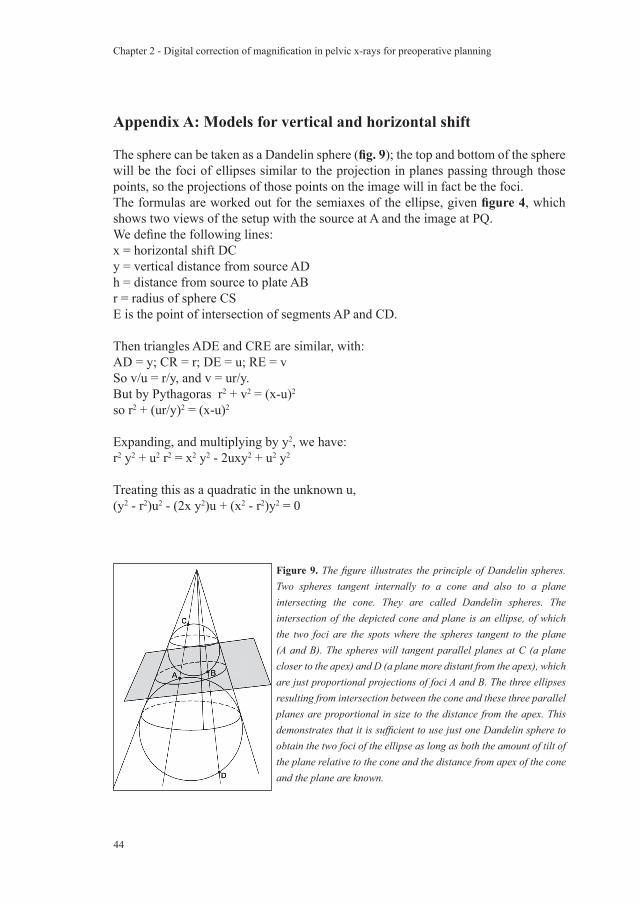
Appendix A: Models for vertical and horizontal shift
The sphere can be taken as a Dandelin sphere (fig. 9); the top and bottom of the sphere will be the foci of ellipses similar to the projection in planes passing through those points, so the projections of those points on the image will in fact be the foci.The formulas are worked out for the semiaxes of the ellipse, given figure 4, which shows two views of the setup with the source at A and the image at PQ.We define the following lines:x = horizontal shift DCy = vertical distance from source ADh = distance from source to plate ABr = radius of sphere CSE is the point of intersection of segments AP and CD.
Then triangles ADE and CRE are similar, with:AD = y; CR = r; DE = u; RE = vSo v/u = r/y, and v = ur/y.But by Pythagoras r2 + v2 = (x-u)2
so r2 + (ur/y)2 = (x-u)2
Expanding, and multiplying by y2, we have:r2 y2 + u2 r2 = x2 y2 - 2uxy2 + u2 y2
Treating this as a quadratic in the unknown u,(y2 - r2)u2 - (2x y2)u + (x2 - r2)y2 = 0
Figure 9. The figure illustrates the principle of Dandelin spheres. Two spheres tangent internally to a cone and also to a plane intersecting the cone. They are called Dandelin spheres. The intersection of the depicted cone and plane is an ellipse, of which the two foci are the spots where the spheres tangent to the plane (A and B). The spheres will tangent parallel planes at C (a plane closer to the apex) and D (a plane more distant from the apex), which are just proportional projections of foci A and B. The three ellipses resulting from intersection between the cone and these three parallel planes are proportional in size to the distance from the apex. This demonstrates that it is sufficient to use just one Dandelin sphere to obtain the two foci of the ellipse as long as both the amount of tilt of the plane relative to the cone and the distance from apex of the cone and the plane are known.

Chapter 2 - Digital correction of magnification in pelvic x-rays for preoperative planning
45
By the quadratic formula,
2x y2 +- sqrt (4x2 y4 - 4(y2 - r2)(x2 - r2)y2)u = ------------------------------------------------- 2(y2 - r2)
x y2 +- y sqrt (x2 y2 - x2 y2 + r2 y2 + r2 x2 - r4) = ------------------------------------------------------ y2 - r2
x y2 +- ry sqrt (y2 + x2 - r2) = ---------------------------------- y2 - r2
Now replacing E with E’, the intersection of AQ and CD (extended), the same quadratic equation is found, so that the two solutions in fact give the horizontal distances from D to both E and E’. And so the distance from E to E’ is the difference:
2ry sqrt (y2 + x2 - r2) u’-u = -------------------------------- y2 - r2
But the major axis PQ satisfies PQ/EE’ = h/y, so the major semiaxis is:
rh sqrt (x2 + y2 - r2)PQ/2 = ------------------------------- y2 - r2
For the minor semiaxis b = B’P’, consider similar triangles A’R’C and A’B’P’, which give the proportion r/b = y/A’P’. And since A’P’ = sqrt (b2 + h2), we get:
r sqrt (b2 + h2) = ybr2 (b2 + h2) = y2 b2
r2 h2 = (y2 - r2)b2
b = rh / sqrt (y2 - r2)
Since the short axis is not dependent on the horizontal shift (x), the diameter of the projected circle when the sphere is located directly below the x-ray source can be calculated by the formula for the minor axis.

Chapter 2 - Digital correction of magnification in pelvic x-rays for preoperative planning
46
In conclusion:After horizontal shift:major axis = 2rh sqrt (x2 + y2 - r2) / (y2 - r2)minor axis = 2rh / sqrt (y2 - r2)After vertical shift:diameter of circular projection = 2rh / sqrt (y2 - r2)
Chapter 2 - Digital correction of magnification in pelvic x-rays for preoperative planning
47
Chapter 2 - Digital correction of magnification in pelvic x-rays for preoperative planning
Reference List
1. Muller ME. Lessons of 30 years of total hip arthroplasty. Clin.Orthop. 1992;12-21.
2. Haddad FS, Masri BA, Garbuz DS, Duncan CP. Classification and preoperative planning. Instr.Course Lect. 2000;49:83-96.
3. Eggli S, Pisan M, Muller ME. The value of preoperative planning for total hip arthroplasty. J.Bone Joint Surg.Br. 1998;80-B:382-90.
4. Blackley HR, Howell GE, Rorabeck CH. Planning and management of the difficult primary hip replacement: preoperative planning and technical considerations. Instr.Course Lect. 2000;49:3-11.
5. Heal J, Blewitt N. Kinemax total knee arthroplasty: trial by template. J.Arthroplasty 2002;17:90-94.
6. Knight JL, Atwater RD. Preoperative planning for total hip arthroplasty. Quantitating its utility and precision. J.Arthroplasty 1992;7 Suppl:403-09.
7. Linclau L, Dokter G, Peene P. Radiological aspects in preoperative planning and postoperative assessment of cementless total hip arthroplasty. Acta Orthop.Belg. 1993;59:163-67.
8. Lee KR, Siegel EL, Templeton AW, Dwyer SJ, III, Murphey MD, Wetzel LH. State-of-the-art digital radiography. Radiographics 1991;11:1013-25.
9. Maass M, Kosonen M, Kormano M. Radiological image data migration. Practical experience and comparison of the costs of work. Acta Radiol. 2001;42:426-29.
10. Reiner BI, Siegel EL, Flagle C, Hooper FJ, Cox RE, Scanlon M. Effect of filmless imaging on the utilization of radiologic services. Radiology 2000;215:163-67.
11. Scholl E, Holm J, Eggli S. A new concept for integration of image databanks into a comprehensive patient documentation. Unfallchirurg 2001;104:420-25.
12. Dooley RL, Engel C, Muller ME. Automated scanning and digitizing of roentgenographs for documentation and research. Clin.Orthop. 1992;113-19.
13. Foord K. PACS: the second time around. Eur.J.Radiol. 1999;32:96-100.14. Gross-Fengels W, Miedeck C, Siemens P, Appel R, Muckner K, Finsterbusch J
et al. PACS: from project to reality. Report of experiences on full digitalisation of the radiology department of a major hospital. Radiologe 2002;42:119-24.
15. Pilling JR. Lessons learned from a whole hospital PACS installation. Picture Archiving and Communication System. Clin.Radiol. 2002;57:784-88.
16. Reiner BI, Siegel EL. Technologists’ productivity when using PACS: comparison of film-based versus filmless radiography. AJR Am.J.Roentgenol. 2002;179:33-37.
Chapter 2 - Digital correction of magnification in pelvic x-rays for preoperative planning
48
Chapter 2 - Digital correction of magnification in pelvic x-rays for preoperative planning
17. Conn KS, Clarke MT, Hallett JP. A simple guide to determine the magnification of radiographs and to improve the accuracy of preoperative templating. J.Bone Joint Surg.Br. 2002;84-B:269-72.
18. Gorski JM, Schwartz L. A device to measure X-ray magnification in preoperative planning for cementless arthroplasty. Clin.Orthop. 1986;302-06.
19. Ruwe PA, Gage JR, Ozonoff MB, DeLuca PA. Clinical determination of femoral anteversion. A comparison with established techniques. J.Bone Joint Surg.Am. 1992;74:820-30.
20. Reikeras O, Hoiseth A. Femoral neck angles in osteoarthritis of the hip. Acta Orthop.Scand. 1982;53:781-84.
21. Terjesen T, Benum P, Anda S, Svenningsen S. Increased femoral anteversion and osteoarthritis of the hip joint. Acta Orthop.Scand. 1982;53:571-75.
22. Reikeras O, Hoiseth A, Reigstad A, Fonstelien E. a specimen study with special regard to bilateral differences. Acta Orthop.Scand. 1982.
23. Maruyama M, Feinberg JR, Capello WN, D’Antonio JA. The Frank Stinchfield Award: Morphologic features of the acetabulum and femur: anteversion angle and implant positioning. Clin.Orthop. 2001;52-65.
Comparison of techniques for correction of magnification of
pelvic x-rays for hip surgery planning
B. TheJ.W.J. Kootstra
A.H. HosmanN. Verdonschot
C.L.E. GerritsmaR.L. Diercks
Accepted for publication in the Journal of Digital Imaging

Chapter 3 - Comparison of techniques for correction of magnification
50
Chapter 3 - Comparison of techniques for correction of magnification
51
Abstract
IntroductionThe aim of this study was to develop a more accurate method for correction of magnification of pelvic x-rays to enhance accuracy of hip surgery planning.MethodsAll investigated methods aim at estimating the anteroposterior location of the hip joint in supine position to correctly position a reference object for correction of magnification. The old method – which is currently used in clinical practice – is based on estimating the position of the hip joint by palpation of the greater trochanter. It is only moderately accurate and difficult to execute reliably in clinical practice. To develop a new method, 99 patients who already had a hip implant in situ were included; this enabled determining the true location of the hip joint deducted from the magnification of the prosthesis. Physical examination was used to obtain predictor variables possibly associated with the height of the hip joint. This included a simple dynamic hip joint examination in order to estimate the position of the centre of rotation. Prediction equations were then constructed using regression analysis. The performance of these prediction equations was compared with the performance of the old method.ResultsThe mean absolute error in predicting the height of the hip joint centre using the old method was 20 mm (range -79 mm to +46 mm). This was 11 mm for the new method (-32 mm to +39 mm). The prediction equation is: height (mm) = 34 + ½ Abdominal Circumference (cm).ConclusionThe newly developed prediction equation is a superior method for predicting the height of the hip joint centre for correction of magnification of pelvic x-rays. We recommend its implementation in departments of radiology and orthopedic surgery.
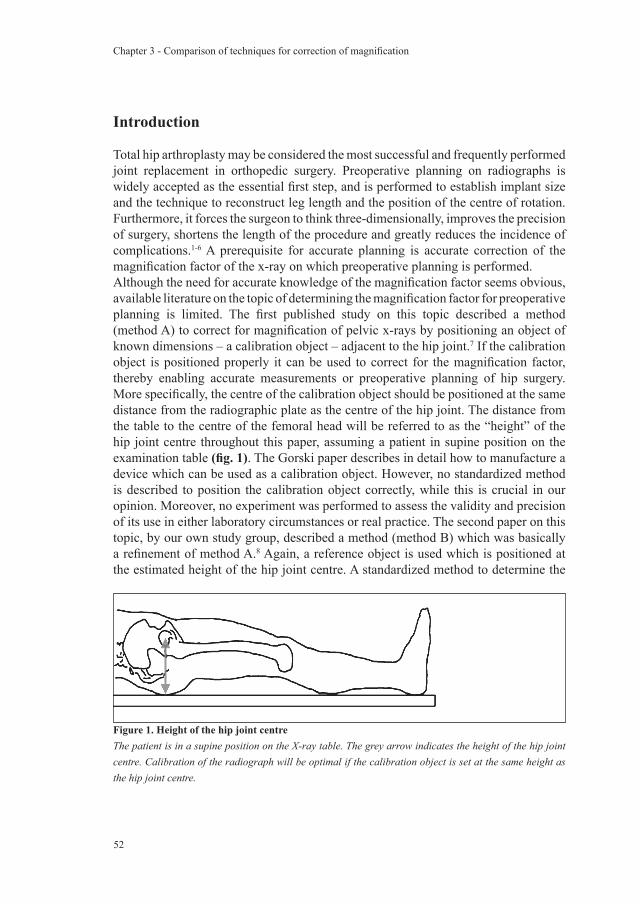
Chapter 3 - Comparison of techniques for correction of magnification
52
Introduction
Total hip arthroplasty may be considered the most successful and frequently performed joint replacement in orthopedic surgery. Preoperative planning on radiographs is widely accepted as the essential first step, and is performed to establish implant size and the technique to reconstruct leg length and the position of the centre of rotation. Furthermore, it forces the surgeon to think three-dimensionally, improves the precision of surgery, shortens the length of the procedure and greatly reduces the incidence of complications.1-6 A prerequisite for accurate planning is accurate correction of the magnification factor of the x-ray on which preoperative planning is performed.Although the need for accurate knowledge of the magnification factor seems obvious, available literature on the topic of determining the magnification factor for preoperative planning is limited. The first published study on this topic described a method (method A) to correct for magnification of pelvic x-rays by positioning an object of known dimensions – a calibration object – adjacent to the hip joint.7 If the calibration object is positioned properly it can be used to correct for the magnification factor, thereby enabling accurate measurements or preoperative planning of hip surgery. More specifically, the centre of the calibration object should be positioned at the same distance from the radiographic plate as the centre of the hip joint. The distance from the table to the centre of the femoral head will be referred to as the “height” of the hip joint centre throughout this paper, assuming a patient in supine position on the examination table (fig. 1). The Gorski paper describes in detail how to manufacture a device which can be used as a calibration object. However, no standardized method is described to position the calibration object correctly, while this is crucial in our opinion. Moreover, no experiment was performed to assess the validity and precision of its use in either laboratory circumstances or real practice. The second paper on this topic, by our own study group, described a method (method B) which was basically a refinement of method A.8 Again, a reference object is used which is positioned at the estimated height of the hip joint centre. A standardized method to determine the
Figure 1. Height of the hip joint centreThe patient is in a supine position on the X-ray table. The grey arrow indicates the height of the hip joint centre. Calibration of the radiograph will be optimal if the calibration object is set at the same height as the hip joint centre.

Chapter 3 - Comparison of techniques for correction of magnification
53
location of the hip joint by palpation of the greater trochanter with the legs in maximal internal rotation was provided. However, a study in which method B had been employed failed to show more accurate prediction of hip prosthesis component sizes when compared with using a standard magnification factor.9 This might be at least partly due to the errors in estimating the location of the hip joint centre of method B. We have to conclude that, despite the urgent need for an accurate method to determine the height of the hip joint centre for accurate positioning of calibration objects, no such method exists.At least two other approaches, besides estimation by palpation of bony structures, seem feasible in clinical practice, but have not been investigated: the first option would be to use easily obtainable patient variables (like hip circumference, body mass index and sex) to predict the height of the hip joint centre with the patient in supine position. The second option would be to use a dynamic hip joint examination (as is used in computer navigation-assisted surgery) to localise the centre of the hip joint by determining the centre of rotation of the upper leg. Regression analysis could be used to identify which combination of variables is capable of providing us with an accurate estimate.The first aim of this study was to determine the accuracy of method B. The second aim was to develop a method for more accurate prediction of the height of the hip joint centre using easily obtainable patient variables or dynamic hip joint examination.
Methods
Evaluation of method BFrom August 2001 to November 2004, 93 consecutive patients with one total hip replacement in situ, all with a 28 mm femoral head, were admitted to receive a total hip replacement on the other side. For the purpose of preoperative planning hip x-rays are not sufficient, so we chose to restrict ourselves to studying pelvic x-rays, which are the x-rays generally used in preoperative planning. The preoperative pelvic x-ray was made using method B, hence the patient was put in a supine position on the examination table. Both legs were maximally internally rotated, so that the greater trochanter was easy to palpate. The method assumes that, with internal rotation, the greater trochanter is approximately at the same level as the centre of rotation. A marking was placed on the skin at the centre of the area where the greater trochanter was palpable. The calibration device contained a prosthetic (28 mm diameter) femoral head (fig. 2) which was set at the height of the skin marking. Next, a pelvic radiograph including the calibration object (which is positioned between the legs of the patient to ensure it is completely on film) is taken. The tube-to-table distance was standardized at 108.5 cm, while the tube-to-bucky distance was 115.0 cm. The radiograph was then digitized with a Howtek MultiRAD 760 scanner (AZTEK Inc, Irvine) and was then calibrated by the computer using the projected
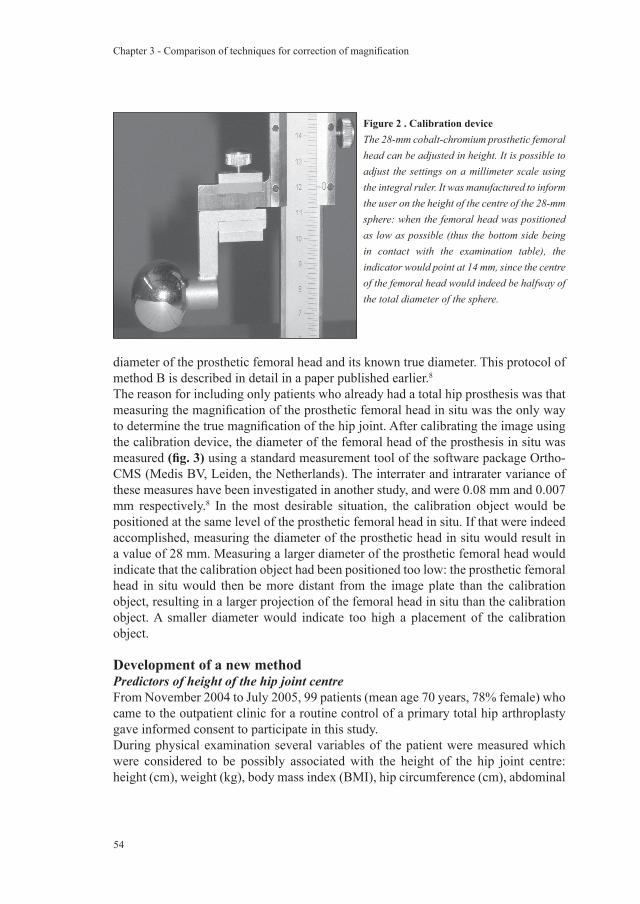
Chapter 3 - Comparison of techniques for correction of magnification
54
diameter of the prosthetic femoral head and its known true diameter. This protocol of method B is described in detail in a paper published earlier.8
The reason for including only patients who already had a total hip prosthesis was that measuring the magnification of the prosthetic femoral head in situ was the only way to determine the true magnification of the hip joint. After calibrating the image using the calibration device, the diameter of the femoral head of the prosthesis in situ was measured (fig. 3) using a standard measurement tool of the software package Ortho-CMS (Medis BV, Leiden, the Netherlands). The interrater and intrarater variance of these measures have been investigated in another study, and were 0.08 mm and 0.007 mm respectively.8 In the most desirable situation, the calibration object would be positioned at the same level of the prosthetic femoral head in situ. If that were indeed accomplished, measuring the diameter of the prosthetic head in situ would result in a value of 28 mm. Measuring a larger diameter of the prosthetic femoral head would indicate that the calibration object had been positioned too low: the prosthetic femoral head in situ would then be more distant from the image plate than the calibration object, resulting in a larger projection of the femoral head in situ than the calibration object. A smaller diameter would indicate too high a placement of the calibration object.
Development of a new methodPredictors of height of the hip joint centreFrom November 2004 to July 2005, 99 patients (mean age 70 years, 78% female) who came to the outpatient clinic for a routine control of a primary total hip arthroplasty gave informed consent to participate in this study. During physical examination several variables of the patient were measured which were considered to be possibly associated with the height of the hip joint centre: height (cm), weight (kg), body mass index (BMI), hip circumference (cm), abdominal
Figure 2 . Calibration deviceThe 28-mm cobalt-chromium prosthetic femoral head can be adjusted in height. It is possible to adjust the settings on a millimeter scale using the integral ruler. It was manufactured to inform the user on the height of the centre of the 28-mm sphere: when the femoral head was positioned as low as possible (thus the bottom side being in contact with the examination table), the indicator would point at 14 mm, since the centre of the femoral head would indeed be halfway of the total diameter of the sphere.

Chapter 3 - Comparison of techniques for correction of magnification
55
Figure 3 . Evaluation of the current protocolCalibration is performed on the calibration object (1). Then the diameter of the implanted femoral head (2) is measured. The optimal result would be that the measurement is equal to the true diameter of the calibration object. If the calibration object is positioned too high, measurement of the diameter of the prosthetic femoral head will result in a value which is too low, and vice versa.
circumference (cm), hip width (cm) and anteroposterior depth at hip level (cm). Hip circumference and abdominal circumference were determined at the widest point with a flexible tapeline. Hip width was determined using a caliper whereby the distance between the two most lateral margins of the patient’s hip was measured at its widest point. Thus no distinct bony landmarks were used for determining the superior-inferior level of measurement. This was arbitrarily judged to be the closest related to the height (distance from the table) at which the hip joint would be. In other words, it was deemed logical that the maximum volume of soft tissue near the hip joint was more important than the exact level at which the bulk of soft tissue was located. The size of the hip in anteroposterior direction was determined using a caliper whereby we measured the distance from the examination table to the anterior skin at the superior-inferior level of the pubic symphysis. This level of measurement was chosen to minimize the influence of soft tissue anteriorly of the hip joint. Lastly, a dynamic hip joint examination was performed to estimate the height of the hip joint centre (fig. 4).
Measurement of height of the hip joint centreFirst, the magnification factor of the hip joint is determined. The magnification factor would then be transformed into our variable of interest: height of the hip joint centre. The magnification factor itself is not a suitable outcome, since it is hospital-dependent: a patient will have radiographs with different magnification factors in different hospitals, because the settings of the radiological equipment will be different. Using a film-focus distance of 100 cm and a table-film distance of 10 cm will yield radiographs with greater magnification than using a film-focus distance of 120 cm or a table-film distance of 6 cm (fig. 5). A constant factor under all circumstances for the individual patient is the distance between the examination table and the centre of the prosthetic femoral head: the height of the hip joint centre. This distance corresponds with the height at which the calibration object should be set for the patient.All patients had a pelvic radiograph made on the day they visited the outpatient clinic,
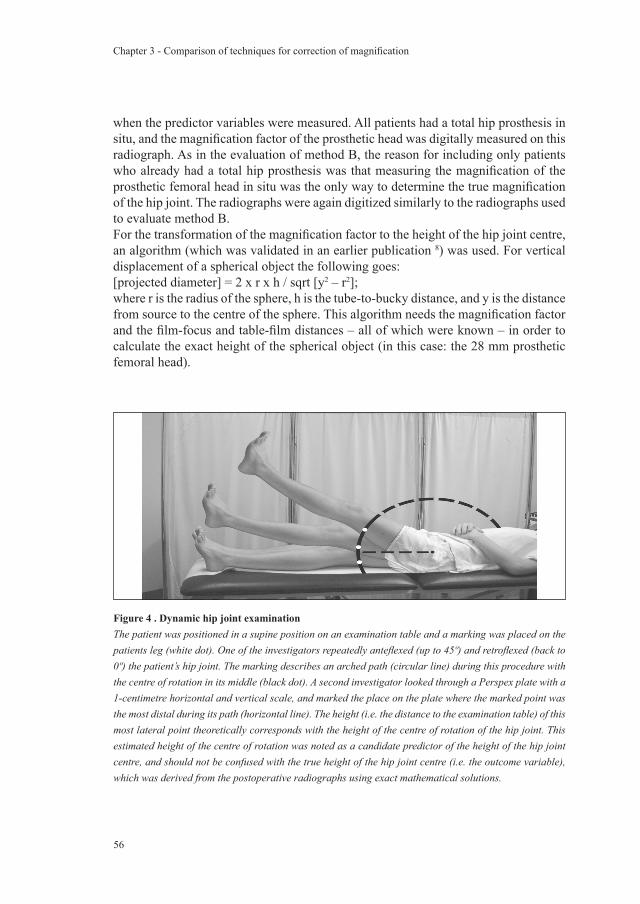
Chapter 3 - Comparison of techniques for correction of magnification
56
when the predictor variables were measured. All patients had a total hip prosthesis in situ, and the magnification factor of the prosthetic head was digitally measured on this radiograph. As in the evaluation of method B, the reason for including only patients who already had a total hip prosthesis was that measuring the magnification of the prosthetic femoral head in situ was the only way to determine the true magnification of the hip joint. The radiographs were again digitized similarly to the radiographs used to evaluate method B.For the transformation of the magnification factor to the height of the hip joint centre, an algorithm (which was validated in an earlier publication 8) was used. For vertical displacement of a spherical object the following goes:[projected diameter] = 2 x r x h / sqrt [y2 – r2];where r is the radius of the sphere, h is the tube-to-bucky distance, and y is the distance from source to the centre of the sphere. This algorithm needs the magnification factor and the film-focus and table-film distances – all of which were known – in order to calculate the exact height of the spherical object (in this case: the 28 mm prosthetic femoral head).
Figure 4 . Dynamic hip joint examinationThe patient was positioned in a supine position on an examination table and a marking was placed on the patients leg (white dot). One of the investigators repeatedly anteflexed (up to 45º) and retroflexed (back to 0º) the patient’s hip joint. The marking describes an arched path (circular line) during this procedure with the centre of rotation in its middle (black dot). A second investigator looked through a Perspex plate with a 1-centimetre horizontal and vertical scale, and marked the place on the plate where the marked point was the most distal during its path (horizontal line). The height (i.e. the distance to the examination table) of this most lateral point theoretically corresponds with the height of the centre of rotation of the hip joint. This estimated height of the centre of rotation was noted as a candidate predictor of the height of the hip joint centre, and should not be confused with the true height of the hip joint centre (i.e. the outcome variable), which was derived from the postoperative radiographs using exact mathematical solutions.
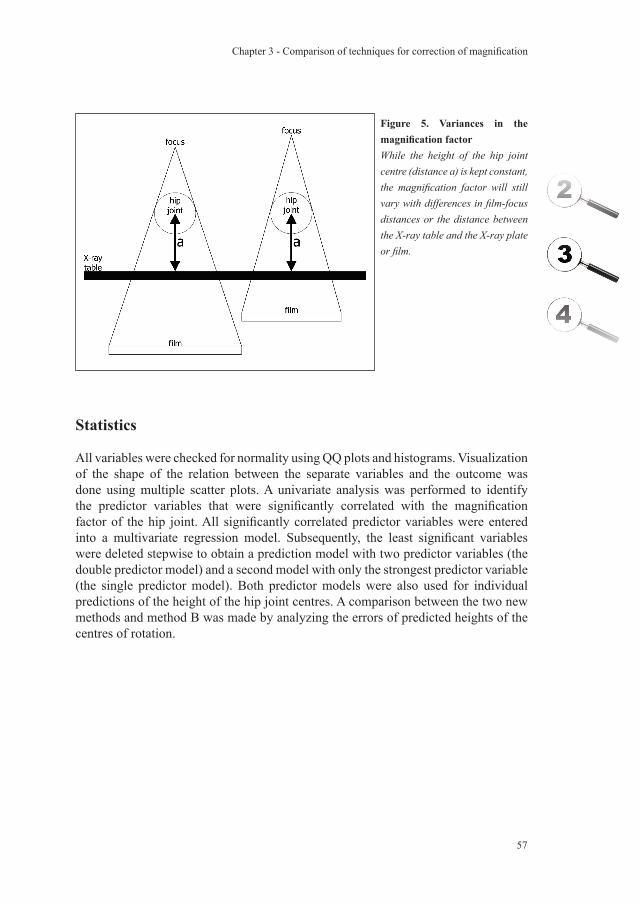
Chapter 3 - Comparison of techniques for correction of magnification
57
Figure 5. Variances in the magnification factorWhile the height of the hip joint centre (distance a) is kept constant, the magnification factor will still vary with differences in film-focus distances or the distance between the X-ray table and the X-ray plate or film.
Statistics
All variables were checked for normality using QQ plots and histograms. Visualization of the shape of the relation between the separate variables and the outcome was done using multiple scatter plots. A univariate analysis was performed to identify the predictor variables that were significantly correlated with the magnification factor of the hip joint. All significantly correlated predictor variables were entered into a multivariate regression model. Subsequently, the least significant variables were deleted stepwise to obtain a prediction model with two predictor variables (the double predictor model) and a second model with only the strongest predictor variable (the single predictor model). Both predictor models were also used for individual predictions of the height of the hip joint centres. A comparison between the two new methods and method B was made by analyzing the errors of predicted heights of the centres of rotation.
Chapter 3 - Comparison of techniques for correction of magnification
58
Results
The baseline characteristics of the study population are summarized in table 1. A total of five out of ten variables had a p-value below 0.05 and were selected for use in linear regression analysis (table 2). These were used for constructing the single and double predictor models. Using method B resulted in a range of errors from -79 mm to +46 mm (i.e. –9.64% to +6.43%) in estimating the height of the hip joint centre, while this was reduced to a range of errors from -32 mm to +34 mm (i.e. –3.13% to +3.45%) using the double predictor model (H = 10 + Hip Width + ⅓ Abdominal Circumference). The single predictor model (H = 34 + ½ Abdominal Circumference) had a range of errors from -32 mm to +39 mm (i.e. –3.69% to 4.13%). Mean absolute error in magnification was 20 mm (i.e. 2.39%) when using method B. This was reduced to 11 mm (1.08%) when using either the single or double predictor model (table 3). It should be mentioned that the predictive power of the dynamic hip joint examination was less than expected, which is the reason why it was deleted from the final predictor models.
Discussion
A new method to achieve accurate correction of magnification for pelvic x-rays was developed to enable accurate planning of hip surgery. The new method proved to be more accurate than the old method (method B) in estimating the height of the hip joint centre to enable accurate calibration of pelvic x-rays.This is the second study to validate a method for correction of magnification of pelvic x-rays. The first paper focused on the theoretical development of method B and used a small population for validation which was only a secondary aim, while the results of using method B in another study were disappointing. Therefore, we deemed it necessary to duplicate the validation part of the first study with a larger population before continuing to develop a new method.We have not attempted to develop a method which directly estimates the magnification factor. There are two clear advantages of using reference objects instead of direct estimates: first, the magnification factor is dependent on variables such as the distance between the x-ray table and the x-ray plate (which might differ between hospitals), while the height of the hip joint centre is not. The second advantage is that variances induced by manual positioning of the x-ray source are eliminated by using a reference object, while the absolute magnification factor will be affected by it. Hence if the calibration object is correctly positioned, correction of the magnification factor will be accurate with any film-focus and table-film distances. Nonetheless, validation of the new method in other hospitals would still be valuable, especially if it concerns populations which differ in baseline characteristics from ours.It is quite obvious that the height of the hip joint centre is related to determinants
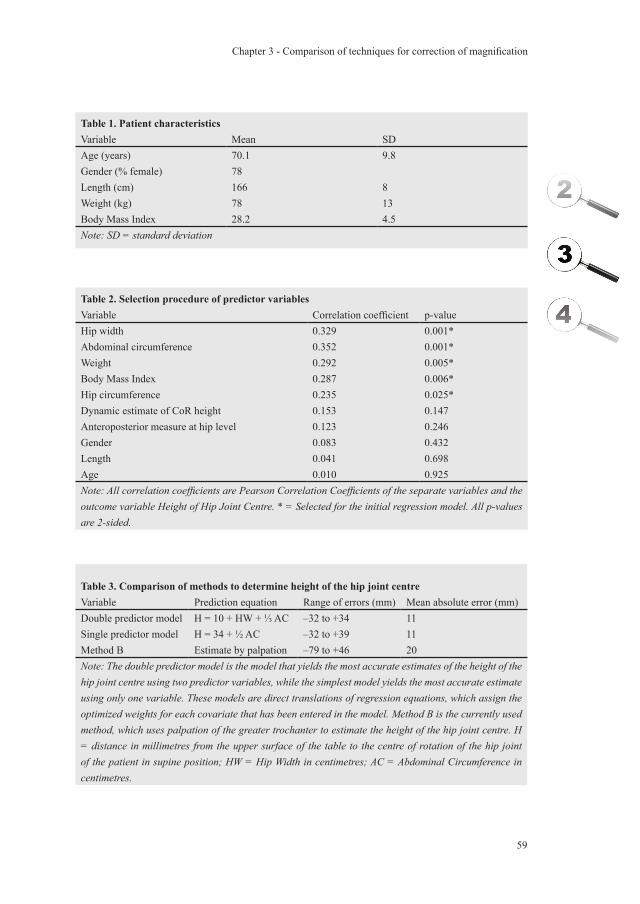
Chapter 3 - Comparison of techniques for correction of magnification
59
Table 3. Comparison of methods to determine height of the hip joint centreVariable Prediction equation Range of errors (mm) Mean absolute error (mm)Double predictor model H = 10 + HW + ⅓ AC –32 to +34 11Single predictor model H = 34 + ½ AC –32 to +39 11Method B Estimate by palpation –79 to +46 20Note: The double predictor model is the model that yields the most accurate estimates of the height of the hip joint centre using two predictor variables, while the simplest model yields the most accurate estimate using only one variable. These models are direct translations of regression equations, which assign the optimized weights for each covariate that has been entered in the model. Method B is the currently used method, which uses palpation of the greater trochanter to estimate the height of the hip joint centre. H = distance in millimetres from the upper surface of the table to the centre of rotation of the hip joint of the patient in supine position; HW = Hip Width in centimetres; AC = Abdominal Circumference in centimetres.
Table 2. Selection procedure of predictor variablesVariable Correlation coefficient p-valueHip width 0.329 0.001*Abdominal circumference 0.352 0.001*Weight 0.292 0.005*Body Mass Index 0.287 0.006*Hip circumference 0.235 0.025*Dynamic estimate of CoR height 0.153 0.147Anteroposterior measure at hip level 0.123 0.246Gender 0.083 0.432Length 0.041 0.698Age 0.010 0.925Note: All correlation coefficients are Pearson Correlation Coefficients of the separate variables and the outcome variable Height of Hip Joint Centre. * = Selected for the initial regression model. All p-values are 2-sided.
Table 1. Patient characteristicsVariable Mean SDAge (years) 70.1 9.8Gender (% female) 78Length (cm) 166 8Weight (kg) 78 13Body Mass Index 28.2 4.5Note: SD = standard deviation
Chapter 3 - Comparison of techniques for correction of magnification
60
associated with the geometry of the pelvis and fat distribution. The newly-developed predictor models utilize the ability of these variables to predict the height of the hip joint centre. Additionally, a dynamic hip joint examination was performed to estimate the location of the centre of rotation of the hip joint. This was thought to provide us with a predictor variable, which is most directly linked to the location of the hip joint centre. Unfortunately, this appeared not to be the case. This might be explained by the unreliability of the measurement method. To make the measurement suitable for use in clinical practice, we only used simple equipment (like a Perspex plate) and simple techniques (visual determination of the arched path, described by a marking on the skin). It seems that the trade-off between reliability and feasibility of the measurement method was not favorable in this study.It is known that accuracy of preoperative plans for total hip arthroplasties is only moderate. Agreement between planning and actual intraoperative choice of component sizes is between 40% and 50%.10;11 Digital preoperative plans were expected to perform better than conventional analog plans, but so far only small differences in accuracy were found. This is in contrast with planning of knee joint replacements, in which digital planning is clearly superior to analog planning.9 An important difference between the two joints is that it is easy to estimate the true position of the knee joint (thereby enabling correct positioning of a calibration object), but it is difficult to estimate the true position of the hip joint. The results of this study provide an accurate and easy to employ method to estimate the true position of the hip joint and to use it for more accurate correction for radiographic magnification of the hip joint. Although the double predictor equation was more accurate than the single predictor equation, the differences were only small. We therefore recommend implementation of the single predictor equation for accurate positioning of calibration objects and accurate correction of the magnification factor: height (mm) = 34 + ½ Abdominal Circumference (cm). Future investigations are necessary to quantify how much improvement in accuracy of preoperative planning is actually achieved using this new technique.
Acknowledgements
Funds were received in partial support of the research of the study presented in this article from Biomet NL, Dordrecht, the Netherlands.The authors wish to thank Maurits Sietsma for his support in the logistics of the study. They also wish to acknowledge Dennis Stant for his valuable support with the statistical analysis of the data.
Chapter 3 - Comparison of techniques for correction of magnification
61
Chapter 3 - Comparison of techniques for correction of magnification
Reference List
1. Muller ME. Lessons of 30 years of total hip arthroplasty. Clin.Orthop. 1992;12-21.
2. Capello WN. Preoperative planning of total hip arthroplasty. Instr.Course Lect. 1986;35:249-57.
3. Dore DD, Rubash HE. Primary total hip arthroplasty in the older patient: optimizing the results. Instr.Course Lect. 1994;43:347-57.
4. Haddad FS, Masri BA, Garbuz DS, Duncan CP. classification and preoperative planning. Instr.Course Lect. 2000;49:83-96.
5. Eggli S, Pisan M, Muller ME. TI - The value of preoperative planning for total hip arthroplasty. J.Bone Joint Surg.Br. 1998;80-B:382-90.
6. Blackley HR, Howell GE, Rorabeck CH. TI - Planning and management of the difficult primary hip replacement: preoperative planning and technical considerations. Instr.Course Lect. 2000;49:3-11.
7. Gorski JM, Schwartz L. A device to measure X-ray magnification in preoperative planning for cementless arthroplasty. Clin.Orthop. 1986;302-06.
8. The B, Diercks RL, Stewart RE, van Ooijen PM, van Horn JR. Digital correction of magnification in pelvic x-rays for preoperative planning of hip joint replacements: theoretical development and clinical results of a new protocol. Med.Phys. 2005;32:2580-89.
9. The B, Diercks RL, van Ooijen PM, van Horn JR. Comparison of analog and digital preoperative planning in total hip and knee arthroplasties. A prospective study of 173 hips and 65 total knees. Acta Orthop. 2005;76:78-84.
10. Carter LW, Stovall DO, Young TR. Determination of accuracy of preoperative templating of noncemented femoral prostheses. J.Arthroplasty 1995;10:507-13.
11. Knight JL, Atwater RD. Preoperative planning for total hip arthroplasty. Quantitating its utility and precision. J.Arthroplasty 1992;7 Suppl:403-09.

Chapter 3 - Comparison of techniques for correction of magnification
62
Chapter 3 - Comparison of techniques for correction of magnification
Acta Orthopaedica 2005 February; 76(1): 78-84
Comparison of analogue versus digital preoperative planning in
total hip and knee arthroplasties
B. TheR.L. Diercks
P.M.A. van OoijenJ.R. van Horn
A prospective study of 173 total hip arthroplasties and 65 total knee arthroplasties

Chapter 4 - Comparison of analogue versus digital preoperative planning in total hip and knee arthroplasties
64
Chapter 4 - Comparison of analogue versus digital preoperative planning in total hip and knee arthroplasties
65
Abstract
IntroductionDigital correction of the magnification factor is expected to yield more accurate and reliable preoperative plans. We hypothesised that digital templating is more accurate than manual templating for total hip and knee arthroplasties.MethodsFirst, we established the interobserver and intraobserver reliability of the templating procedure. The accuracy and reliability of digital and analogue plans were measured in a series of 238 interventions, which were all planned using both techniques. ResultsInterobserver reliability was good for planning the knee arthroplasty (κ-values 0.63−0.75), but not more than moderate for planning the hip arthroplasty (κ-values 0.22−0.54). Analogue plans of the knee arthroplasty systematically underestimated the component sizes (1.1 size on average), while the digital procedure proved to be accurate (0.1−0.4 size too small on average). Digital templating of the hip arthroplasty was less frequently correct (error of one size allowed: cemented cup and stem: 72% and 79%; uncemented cup and stem: 52% and 66%) than analogue planning (cemented cup and stem: 73% and 89%; uncemented cup and stem: 64% and 52%). ConclusionPlanning component sizes for total knee arthroplasties is an accurate procedure, when performed digitally. The independent digital preoperative plans for total hip arthroplasties were less reliable than analogue plans.
Chapter 4 - Comparison of analogue versus digital preoperative planning in total hip and knee arthroplasties
66
Introduction
Preoperative planning is an important part of the surgical procedure. The technical goals of preoperative planning of the total knee arthroplasty are to achieve accurate prosthetic seating with proper axial alignment.1 During the process of planning a total hip arthroplasty, the surgeon searches for optimal fit and the technique to reconstruct leg length and the position of the centre of rotation, both of which are dependent on the implant size. This procedure forces the surgeon to think three-dimensionally, improves the precision of surgery, shortens the length of the procedure and reduces the incidence of complications.2-7 Preoperative planning also provides the surgeon with a tool to ascertain that the correct prosthetic component sizes are available.The inability to accurately determine the magnification factor of the radiograph is one of the major problems in analogue preoperative planning of total hip and knee arthroplasties. In addition, the use of templates with standard magnifications do not allow for accurate correction of the magnification factor.8-10 One way to handle this problem could be the use of CT images.11-16 Routine use of CT scans results in more exposure of the patient to radiographs and creates a greater demand on the radiology department, and increased costs. Digital planning on plain radiographs is worth considering for these reasons, as well as the fact that digital radiographs replace conventional radiographs in a growing extent. The two problems to overcome are the correction of magnification and working with a two-dimensional projection of a three-dimensional structure.We determined the accuracy of digital preoperative plans for primary total hip and knee arthroplasties compared with analogue planning.
Patients and methods
Patients 182 Primary total hip arthroplasties were performed in the period between January 2002 and March 2003. 117 Patients underwent an arthroplasty with a cemented total hip prosthesis and 65 patients received an uncemented primary total hip prosthesis. 70 Patients had a total knee prosthesis operation. This yielded 252 interventions available for inclusion. All interventions were primary arthroplasties for osteoarthrosis. Patients with a history of previous surgery on the region of interest were excluded, when the operation had disturbed the normal bony anatomy. A substantial number of patients did not have radiographs with calibration objects on the day of admission. In most cases it was possible to make new radiographs to correct this. Otherwise, the patient was excluded from the study. In total, 112 cemented hip arthroplasties (5 patients excluded) and 61 uncemented hip arthroplasties (4 excluded) were available for planning, yielding a total of 173 preoperative plans. After exclusion of 5 interventions, 65 knee arthroplasties were planned.
Chapter 4 - Comparison of analogue versus digital preoperative planning in total hip and knee arthroplasties
67
For the knee arthroplasty, a full-leg length standing radiograph with knees in full extension as well as non-weight bearing anteroposterior and lateral knee images were obtained. The calibration object, a 28 mm femoral head, was positioned at the estimated height of the centre of the joint.For the planning of total hip arthroplasties, a plain pelvic radiograph in supine position and both legs in maximum internal rotation was made. The calibration object was positioned between the legs of the patient at the level of the greater trochanter. This bony structure is best palpable when the femoral anteversion is neutralised with the legs in 20º endorotation.7;17 If the patient was unable to endorotate this much, the calibration object was placed 1 to 2 cm higher than the greater trochanter.
ProsthesesThe Mallory Head prosthesis with a metal backed cup was used for uncemented total hip arthroplasties, the Scientific Hip Prosthesis (SHP) with a non-metal backed cup was used for all cemented total hip arthroplasties, and the Anatomic Graduated Components Knee Prosthesis (AGC) was used for all primary total knee arthroplasties.The Mallory Head cups were available in 10 sizes and the stems were available in 8 sizes. Both the SHP cups and stems were available in 7 sizes. The AGC femoral component was available in 6 sizes and the tibial component was available in 7 sizes.
Preoperative planningThe day before surgery, the orthopedic surgeon planned the arthroplasty with analogue templates on conventional radiographs. Templates of the hip prosthesis had a 115% magnification factor, those of the knee 110%. The chosen implant sizes were noted in the patient’s medical record, to make it easy to retrieve in the operation room.The digital preoperative plan was performed by the first author without knowledge of the analogue plan. The digitally chosen implant sizes were stored in a database. We used the preoperative planning software HyperORTHO™ (Rogan-Delft B.V., Veenendaal, the Netherlands).
Interobserver and intraobserver reliabilityPreoperative planning on radiographs of five patients of each group (the cemented total hip arthroplasty, the uncemented total hip arthroplasty and the total knee arthroplasty) was performed by five different surgeons to determine interobserver reliability. The same radiographs were evaluated a second time by the same surgeons after approximately three weeks to measure the intraobserver reliability of preoperative planning. None of these surgeons were involved in the actual surgery of these patients. Although all plans were made on analogue images, these measures of reliability apply to both digital and analogue methods since they differ only in correction of magnification, which only affects the accuracy and not the reliability of the plans. Accuracy of these analogue plans was determined by assessing the differences with
Chapter 4 - Comparison of analogue versus digital preoperative planning in total hip and knee arthroplasties
68
the actual implant sizes used. Methodologically, this is comparable with the digital plans that were also performed by someone else than the actual surgeon and which were not incorporated into the rest of the surgical procedure.
Statistics
To be able to detect systematic errors, the mean differences of either type of plan relative to the used implant sizes were measured. The success rates of the digital and analogue preoperative plans were measured using two cut-off points defining a correct plan: exact matching and matching allowing for a difference of one size. The t-test for paired observations was used for analysis of the differences between the analogue and the digital plans in the mean absolute differences between planned and implanted component sizes. The weighted kappa was used to measure the chance corrected interobserver and intraobserver reliability. While no absolute definitions are possible, we will rate the strength of agreement with scores of 0.20 or less as ‘poor’, 0.21 to 0.40 as ‘fair’, 0.41 to 0.60 as ‘moderate’, 0.61 to 0.80 as ‘good’ and 0.81 to 1.00 as ‘very good’.18
Results
Mean differencesThe mean differences between the planned and implanted component sizes are summarized in table 1. For most components the average difference between planned and used sizes was no more than half a size. Only the analogue and digital plans for the uncemented stem as well as the analogue plans for the femoral and tibial knee components tended to be approximately one size too small.Absolute differences for the hipBoth the digital and the analogue preoperative plans for the total hip arthroplasties were in exact agreement with the implanted component sizes in less than 40% of the
Table 1. Mean differences between the planned and implanted component sizesmean error SHP C SHP S MH C MH S AGC F AGC Tdig 0.0 -0.5 0.3 -0.7 -0.1 -0.4ana 0.4 0.0 -0.3 -1.0 -1.1 -1.1indep ana 1.0 1.2 0.8 0.7 -1.0 -0.2Note: C = cup; S = stem; F = femoral component; T = tibial component; dig = digital planning not by actual surgeon; ana = analogue planning by actual surgeon; indep ana = analogue planning not by actual surgeon. The mean error in component size is shown per component and per type of preoperative plan. Negative values indicate that the planned size was smaller than the implanted size.
Chapter 4 - Comparison of analogue versus digital preoperative planning in total hip and knee arthroplasties
69
times (table 2). When considering a deviation of one size as a correct plan, the success percentages rise to approximately 60% for both uncemented components, 70% for the cemented cups and 80% or more for the cemented stems.The mean absolute differences in deviation between planned component sizes and implanted component sizes are summarised in table 3. For the preoperative plans of the total hip arthroplasty, analogue planning of the SHP stem was more accurate (mean difference 0.2; p<0.02), as was analogue planning of the Mallory Head cup (mean difference 0.6; p<0.001). The analogue series, measured by independent surgeons, was too small to draw solid conclusions from, but suggests a tendency to be less accurate than both the analogue and digital plans of the main series.
Absolute differences for the kneeFor the total knee arthroplasties, the analogue plans scored poorly concerning exact agreement (table 2). Even the results when allowing for one size difference were disappointing. The digital plans for both components scored better with more than 50% exact agreements and more than 90% agreements when allowing margins of one component size.The absolute differences between the preoperative plans for the total knee arthroplasty and implanted component sizes were significantly smaller for digital planning for both the femoral component (mean difference 0.6; p<0.001) and the tibial component (mean difference 1.1; p<0.001) (table 3).
Table 2. Cumulative percentage of correct plans allowing for different margins of errormargin of error prosthesis component ana (%) dig (%)none SHP cup 23 36
stem 37 35MH cup 34 16
stem 30 34AGC femoral 8 55
tibial 14 52one size SHP cup 73 72
stem 89 79MH cup 64 52
stem 52 66AGC femoral 64 92
tibial 69 94Note: ana = analogue plan; dig = digital plan. The cumulative percentage of correct plans are shown, comparing the analogue with the digital plans. The upper half of the table summarizes the results when the match between the planned component size and the implanted component size has to be perfect. The lower half of the table displays the results when one size difference between planned and used component size is allowed.
Chapter 4 - Comparison of analogue versus digital preoperative planning in total hip and knee arthroplasties
70
Interobserver and intraobserver reliabilityInterobserver and intraobserver reliability measurements for the planning procedure are summarized in table 4. The standard deviations were consistently smaller than one size, except for the Mallory Head cup. This was a result of having more component sizes to choose from, and is corrected for in the weighted κ-score. These scores clarify that planning the Mallory Head was actually done with a higher degree of reliability than planning the SHP. It has a ‘moderate’ strength of agreement, as opposed to a ‘fair’ agreement for planning the SHP components. The variability in planning the AGC component sizes was even lower. This could not be explained by having less sizes to choose from, as can be derived from the κ-scores which are substantially higher than for the hip measurements and indicate a good strength of agreement. Intraobserver reliability was higher than interobserver reliability for planning each of the components. The strengths of agreement were moderate for planning the SHP, good for the Mallory Head and very good for the AGC.
Discussion
A growing number of hospitals have digital radiological facilities (PACS – Picture Archiving and Communication System) nowadays. The precise implications on costs and changed routines are unclear.19-22 But even without being able to oversee all consequences, this seems to offer great advantages in terms of manufacturing, storing, retrieving and analysing images.23-27 It also allows the orthopaedic surgeon to carry out digital preoperative planning for total hip and knee arthroplasties. This study is the first to investigate and compare the results of digital and analogue preoperative plans.With the use of calibration objects the digital images can be corrected for the magnification factor. This is generally assumed to be an advantage, but if the position
Table 3. Mean absolute differences between planned and implanted component sizesabsolute error SHP C SHP S MH C MH S AGC F AGC Tdig 1.1 0.9 1.8 1.3 0.6 0.3ana 1.2 0.7 1.2 1.5 1.2 1.4p-value 0.6 0.02 0.001 0.2 < 0.001 < 0.001indep ana 1.4 1.4 1.8 1.5 1.0 0.5Note: C = cup; S = stem; F = femoral component; T = tibial component; dig = digital planning not by actual surgeon; ana = analogue planning by actual surgeon; indep ana = analogue planning not by actual surgeon. The mean absolute differences between planned component sizes and used component sizes are shown. The first row contains the results for digital planning (not performed by the actual surgeon). The second row contains the results for analogue planning by the actual surgeon.The third row contains the p-values of the difference between the results in the first and the second row. The fourth row contains the results for analogue planning by others than the actual surgeon.
Chapter 4 - Comparison of analogue versus digital preoperative planning in total hip and knee arthroplasties
71
of the calibration object differs too much from the region of interest, it will lead to a structural error in digital correction of magnification. The position of the knee joint can be estimated accurately through physical examination, but the hip joint is difficult to assess. Its position can only be estimated indirectly, which could in theory be a source of errors. The calibration protocol used in this investigation was validated in a recent yet unpublished study conducted by The et al. In 95% of the cases, variability in positioning of the calibration object can be expected to result in an error of correction of the magnification ranging from -3% to +3%.Both plans for the uncemented stem, as well as the analogue plans for the knee components, were on average one size too small. This can be explained by the variability of the data, considering the plans of the uncemented stems. For the analogue plans of the knee prostheses, an actual systematic error in planning seems plausible. The best explanation is that the 110% magnification of the templates, although it is the smallest available, is on average still too large. This type of error is an implicit danger of analogue planning in general, but is not always recognised as such. In theory it could also arise in digital planning when the calibration protocol is not accurate or not accurately executed.The reliability of the knee plans was good, but the plans for the uncemented hip were only moderately reliable and the cemented hip plans even less. The uncemented stem uses more clear bony references for planning, which may explain the lower variability. For the cups however this explanation is not valid. Taking into account the possibility of using cement as a buffer may have caused the observers to allow for less strict planning.The fact that planning this knee prosthesis uses clear bony landmarks as well as the fact that the sizes differ 4 mm for the tibial component and even 5 mm for the femoral component can probably account for the small variability. Intraobserver reliability had consistently higher κ-scores than interobserver reliability. This means that it is on average more reliable to leave the choice of component sizes to the surgeon himself, which is consistent with the philosophy that the preoperative planning is part of the
Table 4. Interobserver and intraobserver reliability of preoperative planningSHP C SHP S MH C MH S AGC F AGC T
SD inter 0.9 0.8 1.4 0.9 0.3 0.4κ(w) inter 0.22 0.26 0.53 0.54 0.75 0.63SD intra 0.5 0.5 0.5 0.6 0.1 0.1κ(w) intra 0.49 0.48 0.79 0.64 0.82 0.88Note: C = cup; S = stem; F = femoral component; T = tibial component; SD inter = standard deviation interobserver measurements; SD intra = standard deviation intraobserver measurements; κ(w) inter = weighted kappa-score for interobserver measurements; κ(w) intra = weighted kappa-score for intraobserver measurements. The standard deviations are expressed in component size and are an indication of the difference between or within observer measurements. The weighted kappa-scores are a measure of the chance-corrected proportional agreement between or within observers.
Chapter 4 - Comparison of analogue versus digital preoperative planning in total hip and knee arthroplasties
72
entire surgical procedure.Planning the component sizes of the knee prostheses was far more accurate than planning the components of the hip prostheses. This information is most useful from an economical point of view, since the high success percentages of prediction of component sizes provide us with a tool for stock control. However, the clinical value of such a tool for total knee arthroplasties is limited. Determining the correct size for the components of the knee prosthesis can be done under direct vision of the bony landmarks intra-operatively. The more essential planning of correction of axial alignment could not be performed in this developmental phase of HyperORTHO™ and was left out of the present study.One must bear in mind that the value of preoperative planning decreases when it is not integrated into the complete process of surgery. The analogue plans were made by the same surgeon who would perform the arthroplasty the next day, and the data of these plans were available in the operation room. The digital plans were not made by the operating surgeon, nor was the data available to him. The results of the small series in which independent surgeons performed analogue planning for the total hip arthroplasties suggest that this might have influenced the results in the main series in favour of the analogue procedure. On the other hand, the analogue preoperative plans have been made using templates with a standard magnification factor. We chose this approach because it is common practice in most hospitals, but the calibration object does provide the surgeon with the possibility of getting an estimate of the magnification merely by measuring the diameter of its projection. Choosing between the templates with a 110%, 115% or 120% magnification factor could be done using that information. This would have been of little help when planning the knee arthroplasties though. The smallest available magnification for knee templates had been used and was on average still too large, giving rise to the above-mentioned systematic underestimation of component sizes.It was also noted that the radiographic result of the arthroplasties sometimes gave rise to criticism concerning the choice of component sizes or otherwise. In this respect, it can be argued that the reference of correct planning should not be the components that have been used. If the surgeon who performed the arthroplasty recognises that a different component size could and should have been used, the reference should be adjusted likewise.Another interesting question is how much gain can be obtained in clinical outcome when digital preoperative planning becomes full-fledged with added digital applications to enable biomechanical planning. Possibly leg-length correction, reconstruction of the centre of rotation and offset, reduction of operation time along with potential benefits like lower infection rates, and reduction of complications like perioperative fractures, may all be positively influenced. Future investigations are needed to determine these potential effects.
Chapter 4 - Comparison of analogue versus digital preoperative planning in total hip and knee arthroplasties
73
Acknowledgements
Funds were received in partial support of the research of the study presented in this article from the following Dutch based companies: Biomet NL (Dordrecht), Oldelft Benelux (Delft) and Rogan-Delft B.V. (Veenendaal).The authors wish to thank R.E. Stewart for his support with the statistical analyses. The authors gratefully acknowledge the assistance of A. Spriensma, D. Kok, P. Komdeur, B.A.S. Knobben, H.R. van den Bosch and J. Kooistra, and would like to thank them for providing clinical as well as technical support for this study. They are also deeply appreciative of the help of A.L. Boerboom, P.G.M. Maathuis, M.P. Arnold, P.C. Jutte, J.P.A.H. Onderwater, J.A. Niewold, T.F.S. Cheung, R. Boer and N.P. Kort for performing additional measurements necessary for this study.
Chapter 4 - Comparison of analogue versus digital preoperative planning in total hip and knee arthroplasties
74
Chapter 4 - Comparison of analogue versus digital preoperative planning in total hip and knee arthroplasties
Reference List
1. Krackow KA. Total knee arthroplasty: technical planning and surgical aspects. Instr.Course Lect. 1986;35:272-82.
2. Muller ME. Lessons of 30 years of total hip arthroplasty. Clin.Orthop. 1992;12-21.
3. Capello WN. Preoperative planning of total hip arthroplasty. Instr.Course Lect. 1986;35:249-57.
4. Dore DD, Rubash HE. Primary total hip arthroplasty in the older patient: optimizing the results. Instr.Course Lect. 1994;43:347-57.
5. Haddad FS, Masri BA, Garbuz DS, Duncan CP. classification and preoperative planning. Instr.Course Lect. 2000;49:83-96.
6. Eggli S, Pisan M, Muller ME. The value of preoperative planning for total hip arthroplasty. J.Bone Joint Surg.Br. 1998;80-B:382-90.
7. Blackley HR, Howell GE, Rorabeck CH. Planning and management of the difficult primary hip replacement: preoperative planning and technical considerations. Instr.Course Lect. 2000;49:3-11.
8. Heal J, Blewitt N. Kinemax total knee arthroplasty: trial by template. J.Arthroplasty 2002;17:90-94.
9. Linclau L, Dokter G, Peene P. Radiological aspects in preoperative planning and postoperative assessment of cementless total hip arthroplasty. Acta Orthop.Belg. 1993;59:163-67.
10. Knight JL, Atwater RD. Preoperative planning for total hip arthroplasty. Quantitating its utility and precision. J.Arthroplasty 1992;7 Suppl:403-09.
11. Barmeir E, Dubowitz B, Roffman M. Computed tomography in the assessment and planning of complicated total hip replacement. Acta Orthop.Scand. 1982;53:597-604.
12. Kerschbaumer F. “Numerical imaging, operation planning, simulation, navigation, robotics”. Do the means determine the end?. Orthopade 2000;29:597-98.
13. Starker M, Thumler P, Weipert A, Hanusek S. Computer-assisted prosthesis selection and implantation control. Orthopade 2000;29:627-35.
14. O’Toole RV, III, Jaramaz B, DiGioia AM, III, Visnic CD, Reid RH. Biomechanics for preoperative planning and surgical simulations in orthopaedics. comput biol med 1995;25:183-91.
15. Sugano N, Ohzono K, Nishii T, Haraguchi K, Sakai T, Ochi T. Computed-tomography-based computer preoperative planning for total hip arthroplasty. Comput.Aided Surg. 1998;3:320-24.
16. Schiffers N, Schkommodau E, Portheine F, Radermacher K, Staudte HW. Planning and performance of orthopedic surgery with the help of individual templates. Orthopade 2000;29:636-40.
Chapter 4 - Comparison of analogue versus digital preoperative planning in total hip and knee arthroplasties
75
Chapter 4 - Comparison of analogue versus digital preoperative planning in total hip and knee arthroplasties
17. Reikeras O, Hoiseth A. Femoral neck angles in osteoarthritis of the hip. Acta Orthop.Scand. 1982;53:781-84.
18. Altmann DG. Practical statistics for medical research, first ed. Chapman & Hall; 1991.
19. Lee KR, Siegel EL, Templeton AW, Dwyer SJ, III, Murphey MD, Wetzel LH. State-of-the-art digital radiography. Radiographics 1991;11:1013-25.
20. Maass M, Kosonen M, Kormano M. Radiological image data migration. Practical experience and comparison of the costs of work. Acta Radiol. 2001;42:426-29.
21. Reiner BI, Siegel EL, Flagle C, Hooper FJ, Cox RE, Scanlon M. Effect of filmless imaging on the utilization of radiologic services. Radiology 2000;215:163-67.
22. Scholl E, Holm J, Eggli S. A new concept for integration of image databanks into a comprehensive patient documentation. Unfallchirurg 2001;104:420-25.
23. Dooley RL, Engel C, Muller ME. Automated scanning and digitizing of roentgenographs for documentation and research. Clin.Orthop. 1992;113-19.
24. Foord K. PACS: the second time around. Eur.J.Radiol. 1999;32:96-100.25. Gross-Fengels W, Miedeck C, Siemens P, Appel R, Muckner K, Finsterbusch J
et al. PACS: from project to reality. Report of experiences on full digitalisation of the radiology department of a major hospital. Radiologe 2002;42:119-24.
26. Pilling JR. Lessons learned from a whole hospital PACS installation. Picture Archiving and Communication System. Clin.Radiol. 2002;57:784-88.
27. Reiner BI, Siegel EL. Technologists’ productivity when using PACS: comparison of film-based versus filmless radiography. AJR Am.J.Roentgenol. 2002;179:33-37.

Chapter 4 - Comparison of analogue versus digital preoperative planning in total hip and knee arthroplasties
76
Chapter 4 - Comparison of analogue versus digital preoperative planning in total hip and knee arthroplasties
B. TheN. Verdonschot
J.R. van HornP.M.A. van Ooijen
R.L. Diercks
Accepted for publication in the Journal of Arthroplasty
Digital versus analogue preoperative planning of total
hip arthroplastiesA randomized clinical trial of 210 total hip arthroplasties

Chapter 5 - Digital versus analogue preoperative planning of total hip arthroplasties
78
Chapter 5 - Digital versus analogue preoperative planning of total hip arthroplasties
79
Abstract
IntroductionThe objective of this randomized clinical trial was to compare clinical and technical results of digital preoperative plans for primary total hip arthroplasties with analogue planning.MethodsTwo hundred and ten total hip arthroplasties were randomized. All plans were constructed on standardized radiographs by the surgeon who performed the arthroplasty the next day. The main outcome was accuracy of the preoperative plan. Secondary outcomes were operation time and a radiographic assessment of the arthroplasty.ResultsDigital preoperative plans were more accurate in planning the cup (p < 0.05), and scored higher on the postoperative radiological assessment of cemented cup (p = 0.03) and stem (p < 0.01) components. None of the other comparisons reached statistical significance.ConclusionWe conclude that digital plans slightly outperform analogue plans.
Chapter 5 - Digital versus analogue preoperative planning of total hip arthroplasties
80
Introduction
Preoperative planning of a total hip arthroplasty is an important part of the surgical procedure. During this process, the surgeon searches for optimal fit of the hip implants and for the best technique to reconstruct leg length and the position of the centre of rotation, both of which are dependent on the implant size and positioning. Preoperative planning forces the surgeon to think three-dimensionally and is thought to improve surgical precision, shorten the length of the procedure and reduce the incidence of complications.1-6 Preoperative planning also provides the surgeon with a tool to ascertain that the correct prosthetic component sizes are available, and can be of assistance in logistic and stock management or the operation theatres.The potential difficulty to accurately determine the magnification factor of the radiograph is one of the problems in analogue preoperative planning of total hip arthroplasties. In addition, the use of templates with standard magnifications does not always allow for accurate correction of the magnification factor.7-9 Digital radiographs are replacing conventional radiographs to a growing extent. This allows the orthopaedic surgeon to perform the planning on screen using specialized software. These applications enable the surgeon to correct the magnification factor with more accuracy and reliability. Although this might sound appealing, it is unclear what the actual advantages of digital preplanning are. The objective of this randomized clinical trial was to compare both clinical and technical results of digital preoperative plans for primary total hip arthroplasties with analogue planning. Our first hypothesis was: Digital preoperative planning is more accurate than analogue preoperative planning in predicting intraoperatively implanted component sizes of the cup and stem in primary total hip arthroplasty (primary outcome). Our second hypothesis was: using digital preoperative planning results in shorter operation times, fewer leg length differences, and higher scores on radiographic evaluation (secondary outcome).
Methods
A sample size calculation was performed. A minimum of 182 patients would be required for 80% power to detect a difference in success rate of 20% in order to predict the correct component size (assuming a success percentage of 60% in the analogue group versus 80% in the digital group).The day before surgery an independent observer evaluated for inclusion all patients who were admitted for a primary total hip arthroplasty. All primary total hip arthroplasties performed in the period between March 2003 and April 2005 were eligible for inclusion. Exclusion criteria were fractures, a history of previous surgery on the pelvis or proximal femur with disturbance of the bony anatomy of the hip joint (such as pelvic osteotomies, Girdlestone procedures, revision surgery, etc.) and
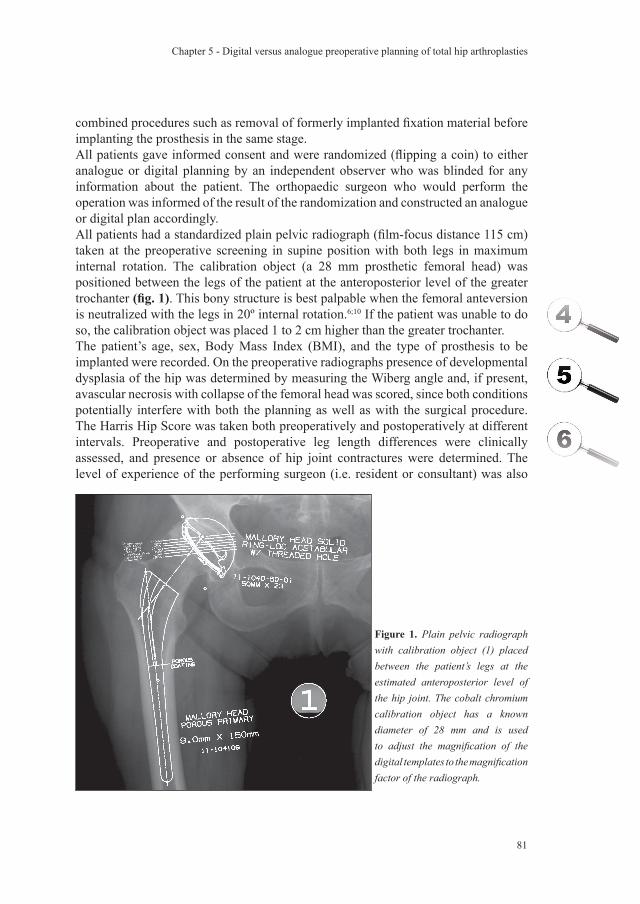
Chapter 5 - Digital versus analogue preoperative planning of total hip arthroplasties
81
combined procedures such as removal of formerly implanted fixation material before implanting the prosthesis in the same stage.All patients gave informed consent and were randomized (flipping a coin) to either analogue or digital planning by an independent observer who was blinded for any information about the patient. The orthopaedic surgeon who would perform the operation was informed of the result of the randomization and constructed an analogue or digital plan accordingly.All patients had a standardized plain pelvic radiograph (film-focus distance 115 cm) taken at the preoperative screening in supine position with both legs in maximum internal rotation. The calibration object (a 28 mm prosthetic femoral head) was positioned between the legs of the patient at the anteroposterior level of the greater trochanter (fig. 1). This bony structure is best palpable when the femoral anteversion is neutralized with the legs in 20º internal rotation.6;10 If the patient was unable to do so, the calibration object was placed 1 to 2 cm higher than the greater trochanter.The patient’s age, sex, Body Mass Index (BMI), and the type of prosthesis to be implanted were recorded. On the preoperative radiographs presence of developmental dysplasia of the hip was determined by measuring the Wiberg angle and, if present, avascular necrosis with collapse of the femoral head was scored, since both conditions potentially interfere with both the planning as well as with the surgical procedure. The Harris Hip Score was taken both preoperatively and postoperatively at different intervals. Preoperative and postoperative leg length differences were clinically assessed, and presence or absence of hip joint contractures were determined. The level of experience of the performing surgeon (i.e. resident or consultant) was also
Figure 1. Plain pelvic radiograph with calibration object (1) placed between the patient’s legs at the estimated anteroposterior level of the hip joint. The cobalt chromium calibration object has a known diameter of 28 mm and is used to adjust the magnification of the digital templates to the magnification factor of the radiograph.
Chapter 5 - Digital versus analogue preoperative planning of total hip arthroplasties
82
recorded, as well as the presence of rheumatoid arthritis or a total hip prosthesis on the contralateral side. All above mentioned measurements and observations were performed by an independent observer, who was not aware of the group to which the patient was allocated.The Mallory Head prosthesis with a metal-backed cup was used for all non-cemented total hip arthroplasties, while the Scientific Hip Prosthesis (SHP) with an all-polyethylene cup was used for all cemented total hip arthroplasties (Biomet NL, Dordrecht, the Netherlands). The Mallory Head cups were available in ten sizes and the stems were available in eight sizes. Both the SHP cups and stems were available in seven sizes. Analogue or digital plans were constructed by the surgeon who performed the arthroplasty the next day. For analogue planning the projected diameter of the 28 mm calibration object on the pelvic radiograph was measured with a calliper. A standardized table was then used to determine which magnification (110%, 115% or 120%) of templates should be used. If the arthroplasty was allocated to digital planning, the orthopaedic surgeon used digital calibration of the digital radiograph with the same calibration object. The preoperative plan was constructed using the commercially available software package HyperORTHO™ (Rogan-Delft B.V., Veenendaal, the Netherlands). After completing the analogue or digital preoperative plan, the chosen implant sizes were recorded in the patient’s medical record. The analogue and digital groups were compared on several outcomes. The main outcome was accuracy of the preoperative plan to predict the correct size of the implant. A margin of error of one component size was allowed. A comparison was also performed to see if the choice of planning procedure had any effect on operation times, as recorded by the anaesthesiologist. To conclude, a radiographic assessment of the arthroplasty was performed by the surgeon on the 5-day postoperative standardized plain pelvic x-ray. Scoring was performed on radiographic result of the arthroplasty with respect to cup and stem size (evidently too small or too big), position of the stem (evident varus or valgus) and reconstruction of desired leg length (more than 1 cm difference between desired and resulting leg length). Additionally, intraobserver reliability of digital preoperative planning was determined. Eight different orthopaedic surgeons performed the planning procedure twice on a series of 34 radiographs (21 cemented and 13 non-cemented arthroplasties). The period between the two consecutive measurements was 4 weeks. To determine interobserver reliability, all 34 radiographs were used again for construction of a preoperative plan by eight different orthopaedic surgeons who did not make the first plan. None of these surgeons were involved in the actual surgery of these patients. For continuous variables a univariate analysis was performed using the Student t-test for independent samples. The Chi-square and Fisher’s exact test were used to analyze categorical variables. The weighted kappa was used to measure chance-corrected interobserver and intraobserver reliability. While no absolute definitions are possible,
Chapter 5 - Digital versus analogue preoperative planning of total hip arthroplasties
83
we rated the strength of agreement with scores of 0.20 or less as “poor”, 0.21 to 0.40 as “fair”, 0.41 to 0.60 as “moderate”, 0.61 to 0.80 as “good” and 0.81 to 1.00 as “very good” 11. All statistics were performed using SPSS version 12.0 (SPSS Inc, Chicago).
Results
Two hundred and ten primary total hip arthroplasties were included in the study. All interventions were primary arthroplasties for osteoarthritis. The characteristics of the patients in the analogue and digital groups are summarized in table 1.With regard to the primary outcome, digital preoperative plans performed only better on accuracy of planning of the cup (p = 0.042) (table 2a). The secondary endpoint comparisons of postoperative radiological assessment of the choice of implanted cemented cup (p = 0.03) and stem (p < 0.01) components were statistically significant and both in favour of digital planning. None of the other variables reached statistical significance, but it was striking that all scored favourably for digital preoperative planning, except for the presence of a postoperative leg length difference (table 2b). Three intraoperative complications were recorded in the analogue group: one intra-operative femoral shaft fracture, one procedure where cement entered the cup, and one procedure with more than 2 litres blood loss. The two complications in the digital group were: more than 2 litres blood loss and a lesion of the sciatic nerve with persistent symptoms.
Table 1. Patient DemographicsVariable Analogue DigitalNumber of patients 106 104Age (SD) 65 (13.5) 65 (14.9)Female gender 77/106 (73%) 67/104 (64%)Planning & operation by resident 53/106 (50%) 63/104 (61%)Cemented (# of cemented procedures) 79/106 (75%) 73/104 (70%)Operated side (% left) 50/106 (47%) 44/104 (42%)BMI (SD) 27.7 (4.5) 27.7 (4.7)Rheumatoid Arthritis 8/106 (8%) 16/104 (15%)AFN 31/106 (29%) 37/104 (36%)Contralateral prosthesis 25/106 (24%) 27/104 (26%)Wiberg angle (SD) 37 (13.9) 40 (11.5)Preoperative HHS 51 (22.4) 49 (21.2)Preoperative LLD 29/106 (27%) 27/104 (31%)Presence of contracture 23/106 (22%) 17/104 (16%)SD = standard deviation; BMI = body mass index; AFN = avascular necrosis of the femoral head; HHS = Harris Hip Score; LLD = leg length difference
Chapter 5 - Digital versus analogue preoperative planning of total hip arthroplasties
84
Tabl
e 2a
. Pri
mar
y O
utco
me
Out
com
eTo
tal
Cem
ente
dN
on-c
emen
ted
anal
ogdi
gita
lp
anal
ogdi
gita
lp
anal
ogdi
gita
lP
Cor
rect
cup
73 /
106
(69%
)84
/ 10
4 (8
1%)
0.04
755
/ 79
(70%
)58
/ 73
(80%
)0.
166
18 /
27 (6
7%)
26 /
31 (8
4%)
0.12
7C
orre
ct st
em72
/ 10
6 (6
8%)
79 /
104
(76%
)0.
195
57 /
79 (7
2%)
61 /
73 (8
4%)
0.09
215
/ 27
(56%
)18
/ 31
(58%
)0.
847
Tabl
e 2b
. Sec
onda
ry O
utco
me
Out
com
eTo
tal
Cem
ente
dN
on-c
emen
ted
anal
ogdi
gita
lp
anal
ogdi
gita
lp
anal
ogdi
gita
lp
OT
(SD
)11
1 m
in (3
1)10
6 (2
4)0.
162
114
(31)
112
(24)
0.58
110
1 (2
9)91
(17)
0.10
1ED
PS3
/ 106
(3%
)2
/ 104
(2%
)1.
000*
3 / 7
9 (4
%)
1 / 7
3 (1
%)
0.62
1*0%
0%–
LLD
> 1
cm
20 /
106
(19%
)23
/ 10
4 (2
2%)
0.56
013
/ 79
(16%
)17
/ 73
(23%
)0.
290
7 / 2
7 (2
6%)
6 / 3
1 (2
1%)
0.54
9D
ev X
-cup
6 / 1
06 (6
%)
3 / 1
04 (3
%)
0.49
8*6
/ 79
(8%
)0%
0.02
9*0%
3 / 3
1 (1
0%)
0.24
0*D
ev X
-ste
m7
/ 106
(7%
)2
/ 104
(2%
)0.
170*
8 / 7
9 (1
0%)
0%0.
007*
0%1
/ 31
(3%
)1.
000*
OT
= o
pera
tion
time;
SD
= st
anda
rd d
evia
tion;
ED
PS =
evi
dent
dev
ianc
e in
pos
ition
of t
he st
em (e
ither
var
us o
r val
gus)
; LLD
> 1
cm
= p
osto
pera
tive
leg
leng
th d
iffer
ence
of 1
cm
or
mor
e; D
ev X
-cup
= e
vide
nt u
nder
sizi
ng o
r ov
ersi
zing
of c
up c
ompo
nent
on
post
oper
ativ
e ra
diog
raph
; Dev
X-s
tem
= e
vide
nt
unde
rsiz
ing
or o
vers
izin
g of
stem
com
pone
nt o
n po
stop
erat
ive
radi
ogra
ph; *
= F
ishe
r’s e
xact
test
use
d.
Tabl
e 3.
Intr
a an
d in
ter
obse
rver
rel
iabi
lity
of p
reop
erat
ive
plan
ning
Pros
thes
isC
ompo
nent
Intra
Inte
rN
on-c
emen
ted
Cup
0.71
0.69
Stem
0.77
0.44
Cem
ente
dC
up0.
420.
33St
em0.
640.
29In
tra
= in
trao
bser
ver m
easu
rem
ents
; Int
er =
inte
robs
erve
r mea
sure
men
ts.
All v
alue
s are
wei
ghte
d ka
ppas
.
Chapter 5 - Digital versus analogue preoperative planning of total hip arthroplasties
85
Interobserver and intraobserver reliability measurements for the planning procedure are summarized in table 3. The planning of non-cemented prostheses has a higher kappa value on average than the planning of cemented prostheses. Using the ratings given in the Materials section, the non-cemented Mallory Head scores three times “good” and one time “moderate” (interobserver reliability of planning the stem). The cemented SHP scores two times “fair” (interobserver reliability of both cup and stem), one time “moderate” (intraobserver reliability of planning the cup) and one time “good” (intraobserver reliability of planning the stem).
Discussion
A previous study we conducted also compared digital versus analogue preoperative planning.12 At that time the digital preoperative plans could not be constructed by the orthopaedic surgeon himself because the software package was in an early developmental phase. Considering both the fact that the results of that study were very similar for digital and analogue planning, and the possible source for confounding in favour of analogue plans, we deemed it necessary to conduct a randomized clinical trial. The protocol we use to correct for the magnification in digital preoperative planning has been validated.13 It was proven to be accurate, but a margin of error of -3% to +3% was to be expected (95% range of radiographs). Still, this margin of error is just reflecting clinical practice and is therefore not a source of bias. A point of discussion in this study is that it does not enable us to draw conclusions on potential long-term beneficiary effects of more accurate planning. We decided that long-term effects would be investigated if large differences were found on the main outcome measures of the current study. Although we found significant differences in favour of digital preplanning, the actual differences were not large, so before clinical benefits at long-term follow-up resulting from digital preoperative planning can be expected, more fundamental research should be done to improve the accuracy first.Another issue of debate is the choice of our primary endpoint. We considered a preoperative plan successful if it predicted the correct component sizes. From the perspective of improving stock control of hospitals and manufacturers, this is certainly a preferable endpoint. To obtain optimal fit op the prosthetic components it also seems to be a correct choice. Although optimal fit also relates to a biomechanical aspect of successful hip replacement, it could be debated from a broader biomechanical point of view that the endpoint should be based on how favourable the artificial joint is in terms of hip joint contact forces, or similar biomechanical quantities. It would be valuable if future research would address this issue. Although this endpoint is commonly used, it could in theory be biased by the surgeon’s confidence in his planning technique. We judged this not to be the case in our hospital, since both techniques had been employed interchangeably prior to this study.
Chapter 5 - Digital versus analogue preoperative planning of total hip arthroplasties
86
It might be debated whether or not the postoperative radiographic evaluation of the THR should have been standardized. It was considered that some surgeons may maximize the size of the cup to maximize polyethylene thickness while other surgeons may settle for a smaller size cup. This might have led to problems if this was not taken into consideration at the postoperative evaluation. In our opinion, standardization of the evaluation procedure would never sufficiently allow for these differences between surgeons to be taken into account. We have therefore specifically chosen for the operating surgeon to also perform the postoperative evaluation. Although the evaluation was therefore not blinded, the surgeon’s evaluation was not accessible to others than the data manager in order to encourage the surgeon to be as objective as possible in his evaluation.The kappa values of the interobserver and intraobserver reliability measurements of the preoperative plans were never “very good” (0.81 to 1.00). The inter observer reliability of cemented components scored worst and was graded only to be “fair”. In an attempt to explain the figures, it is very probable that differences between surgeons will become more pronounced since the cement mantle provides an extra variable to consider, leading to a decrease in inter observer reliability. Preplanning of non-cemented components had overall higher kappa values than preplanning of cemented components. Planning of non-cemented components is dependent on the use of clear bony landmarks, which adds to both the interobserver and intraobserver reliability. The fact that the intraobserver reliability is always better than the interobserver reliability has at least one clear implication: preoperative planning should always be done by the operating surgeon himself. The accuracy of preoperative templating has been the subject of other studies.5;9;14 As far as the authors are aware of, this study is the first randomized clinical study to investigate the difference between digital and analogue preoperative planning. Possible confounders which were known, such as experience of the surgeon, were measured to enable us to detect failure of randomisation and to keep the possibility of adjustment for confounding in the analysis if necessary (which turned out not to be necessary). The type of prosthesis (cemented or non-cemented) was considered to be a plausible effect modifier and was treated as such in the analysis. The most relevant effect modification was induced by the type of stem (cemented or non-cemented) as previously described.9
We conclude that digital preoperative plans tend to outperform analogue plans. Statistical significant differences were found for accuracy of planning of the cup, and the radiological assessment on the postoperative radiograph concerning the implanted cemented cup and stem components. Future research should address the value of digital preoperative planning from a more biomechanical perspective
Chapter 5 - Digital versus analogue preoperative planning of total hip arthroplasties
87
Chapter 5 - Digital versus analogue preoperative planning of total hip arthroplasties
Acknowledgements
Funds were received in partial support of the research of the study presented in this article from Biomet NL, Dordrecht, the Netherlands.
Chapter 5 - Digital versus analogue preoperative planning of total hip arthroplasties
88
Chapter 5 - Digital versus analogue preoperative planning of total hip arthroplasties
Reference List
1. Muller ME. Lessons of 30 years of total hip arthroplasty. Clin.Orthop. 1992;12-21.
2. Capello WN. Preoperative planning of total hip arthroplasty. Instr.Course Lect. 1986;35:249-57.
3. Dore DD, Rubash HE. Primary total hip arthroplasty in the older patient: optimizing the results. Instr.Course Lect. 1994;43:347-57.
4. Haddad FS, Masri BA, Garbuz DS, Duncan CP. Classification and preoperative planning. Instr.Course Lect. 2000;49:83-96.
5. Eggli S, Pisan M, Muller ME. The value of preoperative planning for total hip arthroplasty. J.Bone Joint Surg.Br. 1998;80-B:382-90.
6. Blackley HR, Howell GE, Rorabeck CH. Planning and management of the difficult primary hip replacement: preoperative planning and technical considerations. Instr.Course Lect. 2000;49:3-11.
7. Heal J, Blewitt N. Kinemax. Total knee arthroplasty: trial by template. J.Arthroplasty 2002;17:90-94.
8. Linclau L, Dokter G, Peene P. Radiological aspects in preoperative planning and postoperative assessment of cementless total hip arthroplasty. Acta Orthop.Belg. 1993;59:163-67.
9. Knight JL, Atwater RD. Preoperative planning for total hip arthroplasty. Quantitating its utility and precision. J.Arthroplasty 1992;7 Suppl:403-09.
10. Reikeras O, Hoiseth A. Femoral neck angles in osteoarthritis of the hip. Acta Orthop.Scand. 1982;53:781-84.
11. Altmann DG. Practical statistics for medical research, first ed. Chapman & Hall; 1991.
12. The B, Diercks RL, van Ooijen PM, van Horn JR. Comparison of analog and digital preoperative planning in total hip and knee arthroplasties. A prospective study of 173 hips and 65 total knees. Acta Orthop.Scand. 2005;76:78-84.
13. The B, Diercks RL, Stewart RE, van Ooijen PM, van Horn JR. Digital correction of magnification in pelvic x-rays for preoperative planning of hip joint replacements: theoretical development and clinical results of a new protocol. Med.Phys. 2005;32:2580-89.
14. Carter LW, Stovall DO, Young TR. Determination of accuracy of preoperative templating of noncemented femoral prostheses. J.Arthroplasty 1995;10:507-13.
Correction of error in two-dimensional wear measurements
of cemented hip arthroplasties
B. TheL. Mol
R.L. DiercksP.M.A. van Ooijen
N. Verdonschot
Clinical Orthopaedics and Related Research 2006 January; 442: 180-6

Chapter 6 - Correction of error in 2D wear measurements of cemented hip arthroplasties
90
Chapter 6 - Correction of error in 2D wear measurements of cemented hip arthroplasties
91
Abstract
IntroductionThe irregularity of individual wear patterns of total hip prostheses seen during patient follow up may partially result from differences in radiographic projection of the components between different radiographs. A method to adjust for this source of error would highly increase the value of individual wear curves. We developed and tested a method to correct for this source of error.MethodsThe influence of patient position on validity of wear measurements was investigated with controlled manipulation of a cadaveric pelvis.ResultsWithout correction the error exceeded 0.2 mm if differences in cup projection were as small as 5°. When using the described correction method, cup positioning differences could be more than 20° before introducing an error exceeding 0.2 mm.ConclusionFor individual patient follow up in clinical practice, we recommend using the correction method to enhance accuracy of the results.
Chapter 6 - Correction of error in 2D wear measurements of cemented hip arthroplasties
92
Introduction
Wear is an important factor in failure of total hip arthroplasties.4, 9, 10, 20, 21, 22, 35 Wear measurements using manual methods, sometimes combined with a digital analysis of the manually placed markings are reported in a number of publications although surprisingly little is published about their validity and precision in clinical practice. 5, 6, 11, 13, 18, 28, 29, 32 Modern and more reliable fully digital measurements have become the standard for two-dimensional wear measurements. Reported mean errors, as a measure of validity, vary between 0.01 mm and 0.5 mm, while reported precision is between 0.2 mm and 0.4 mm (95% confidence intervals). The large variation in these reported figures is probably at least partly due to differences in measurement methods.3, 8, 9, 14, 19, 23, 30, 31, 36, 37 Another potential source of errors in two-dimensional wear measurements in a clinical setting is the variability in projections of the artificial joint on the radiographs. The irregular wear patterns often seen for individual patients are probably the result of this and limit the value of individual measurements. A method to adjust for error because of these variations in clinical practice would be very valuable.Characterization of the cup projection is most easily performed on all polyethylene cups with a circular metal ring around the mouth of the cup. Although most orthopedic surgeons restrict all polyethylene cups to elderly patients in which the problem of wear might be considered less relevant, other orthopedic surgeons use them in younger patients with good results.15, 25, 26, 33 Others have used the metal ring of all polyethylene cups to perform wear measurements, but their methods differed slightly from the technique applied in this study.12, 29 However, regardless of purpose, measurement errors caused by projection differences apply to both metal backed and all polyethylene cups.The three aims of this study are:First, to determine validity and precision of the measurement method. Second, to determine how much validity and precision are diminished when the cup is increasingly projected out of the plane of wear. And last, to show that validity diminishes less with projections of the cup out of the plane of wear after application of a geometrics based correction method.
Methods
We first describe the measurement method which is used throughout the paper. Second, we explain the correction method. The effect of differences in patient positioning on validity of two-dimensional-wear measurements are investigated with and without application of the correction method. These measurements are performed on a cadaver, which was manipulated to produce different projections of an implanted total hip prosthesis (Scientific Hip Prosthesis, Biomet NL, Dordrecht, The Netherlands).
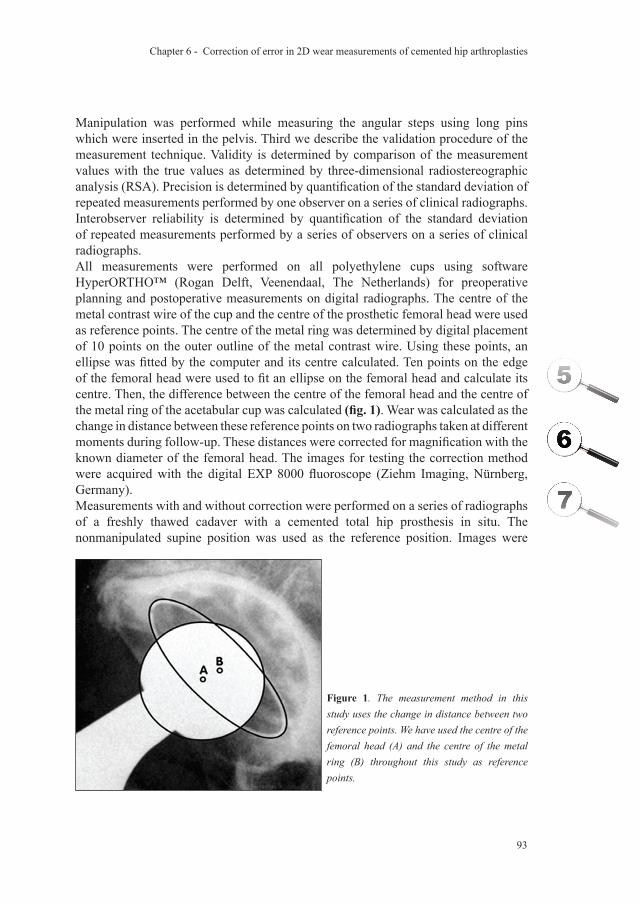
Chapter 6 - Correction of error in 2D wear measurements of cemented hip arthroplasties
93
Manipulation was performed while measuring the angular steps using long pins which were inserted in the pelvis. Third we describe the validation procedure of the measurement technique. Validity is determined by comparison of the measurement values with the true values as determined by three-dimensional radiostereographic analysis (RSA). Precision is determined by quantification of the standard deviation of repeated measurements performed by one observer on a series of clinical radiographs. Interobserver reliability is determined by quantification of the standard deviation of repeated measurements performed by a series of observers on a series of clinical radiographs. All measurements were performed on all polyethylene cups using software HyperORTHO™ (Rogan Delft, Veenendaal, The Netherlands) for preoperative planning and postoperative measurements on digital radiographs. The centre of the metal contrast wire of the cup and the centre of the prosthetic femoral head were used as reference points. The centre of the metal ring was determined by digital placement of 10 points on the outer outline of the metal contrast wire. Using these points, an ellipse was fitted by the computer and its centre calculated. Ten points on the edge of the femoral head were used to fit an ellipse on the femoral head and calculate its centre. Then, the difference between the centre of the femoral head and the centre of the metal ring of the acetabular cup was calculated (fig. 1). Wear was calculated as the change in distance between these reference points on two radiographs taken at different moments during follow-up. These distances were corrected for magnification with the known diameter of the femoral head. The images for testing the correction method were acquired with the digital EXP 8000 fluoroscope (Ziehm Imaging, Nürnberg, Germany).Measurements with and without correction were performed on a series of radiographs of a freshly thawed cadaver with a cemented total hip prosthesis in situ. The nonmanipulated supine position was used as the reference position. Images were
Figure 1. The measurement method in this study uses the change in distance between two reference points. We have used the centre of the femoral head (A) and the centre of the metal ring (B) throughout this study as reference points.
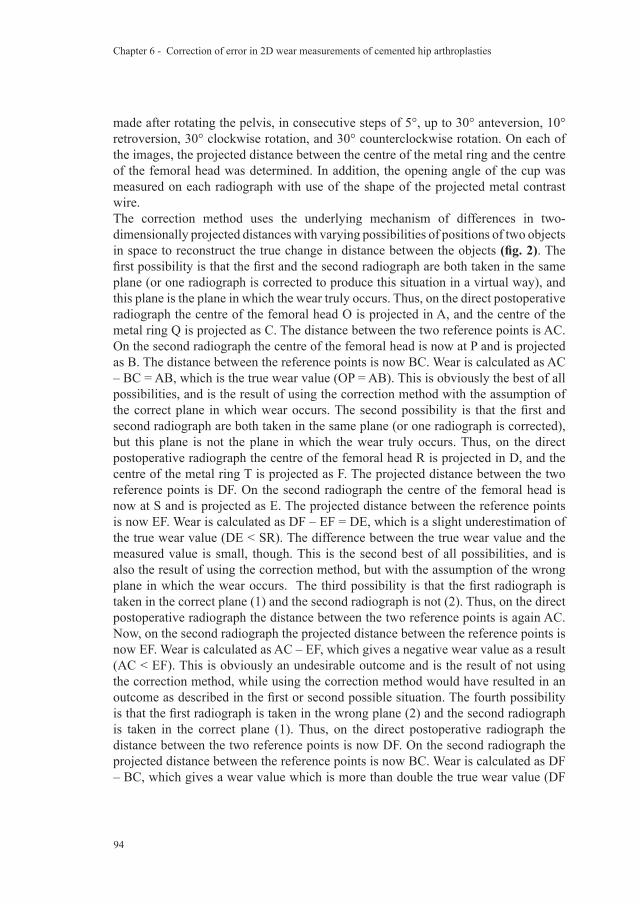
Chapter 6 - Correction of error in 2D wear measurements of cemented hip arthroplasties
94
made after rotating the pelvis, in consecutive steps of 5°, up to 30° anteversion, 10° retroversion, 30° clockwise rotation, and 30° counterclockwise rotation. On each of the images, the projected distance between the centre of the metal ring and the centre of the femoral head was determined. In addition, the opening angle of the cup was measured on each radiograph with use of the shape of the projected metal contrast wire.The correction method uses the underlying mechanism of differences in two-dimensionally projected distances with varying possibilities of positions of two objects in space to reconstruct the true change in distance between the objects (fig. 2). The first possibility is that the first and the second radiograph are both taken in the same plane (or one radiograph is corrected to produce this situation in a virtual way), and this plane is the plane in which the wear truly occurs. Thus, on the direct postoperative radiograph the centre of the femoral head O is projected in A, and the centre of the metal ring Q is projected as C. The distance between the two reference points is AC. On the second radiograph the centre of the femoral head is now at P and is projected as B. The distance between the reference points is now BC. Wear is calculated as AC – BC = AB, which is the true wear value (OP = AB). This is obviously the best of all possibilities, and is the result of using the correction method with the assumption of the correct plane in which wear occurs. The second possibility is that the first and second radiograph are both taken in the same plane (or one radiograph is corrected), but this plane is not the plane in which the wear truly occurs. Thus, on the direct postoperative radiograph the centre of the femoral head R is projected in D, and the centre of the metal ring T is projected as F. The projected distance between the two reference points is DF. On the second radiograph the centre of the femoral head is now at S and is projected as E. The projected distance between the reference points is now EF. Wear is calculated as DF – EF = DE, which is a slight underestimation of the true wear value (DE < SR). The difference between the true wear value and the measured value is small, though. This is the second best of all possibilities, and is also the result of using the correction method, but with the assumption of the wrong plane in which the wear occurs. The third possibility is that the first radiograph is taken in the correct plane (1) and the second radiograph is not (2). Thus, on the direct postoperative radiograph the distance between the two reference points is again AC. Now, on the second radiograph the projected distance between the reference points is now EF. Wear is calculated as AC – EF, which gives a negative wear value as a result (AC < EF). This is obviously an undesirable outcome and is the result of not using the correction method, while using the correction method would have resulted in an outcome as described in the first or second possible situation. The fourth possibility is that the first radiograph is taken in the wrong plane (2) and the second radiograph is taken in the correct plane (1). Thus, on the direct postoperative radiograph the distance between the two reference points is now DF. On the second radiograph the projected distance between the reference points is now BC. Wear is calculated as DF – BC, which gives a wear value which is more than double the true wear value (DF
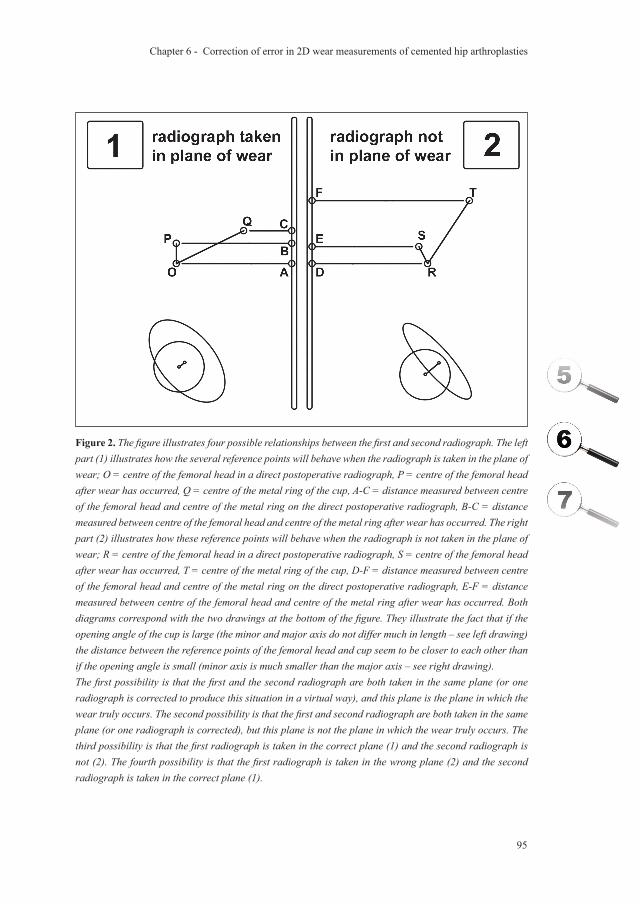
Chapter 6 - Correction of error in 2D wear measurements of cemented hip arthroplasties
95
Figure 2. The figure illustrates four possible relationships between the first and second radiograph. The left part (1) illustrates how the several reference points will behave when the radiograph is taken in the plane of wear; O = centre of the femoral head in a direct postoperative radiograph, P = centre of the femoral head after wear has occurred, Q = centre of the metal ring of the cup, A-C = distance measured between centre of the femoral head and centre of the metal ring on the direct postoperative radiograph, B-C = distance measured between centre of the femoral head and centre of the metal ring after wear has occurred. The right part (2) illustrates how these reference points will behave when the radiograph is not taken in the plane of wear; R = centre of the femoral head in a direct postoperative radiograph, S = centre of the femoral head after wear has occurred, T = centre of the metal ring of the cup, D-F = distance measured between centre of the femoral head and centre of the metal ring on the direct postoperative radiograph, E-F = distance measured between centre of the femoral head and centre of the metal ring after wear has occurred. Both diagrams correspond with the two drawings at the bottom of the figure. They illustrate the fact that if the opening angle of the cup is large (the minor and major axis do not differ much in length – see left drawing) the distance between the reference points of the femoral head and cup seem to be closer to each other than if the opening angle is small (minor axis is much smaller than the major axis – see right drawing).The first possibility is that the first and the second radiograph are both taken in the same plane (or one radiograph is corrected to produce this situation in a virtual way), and this plane is the plane in which the wear truly occurs. The second possibility is that the first and second radiograph are both taken in the same plane (or one radiograph is corrected), but this plane is not the plane in which the wear truly occurs. The third possibility is that the first radiograph is taken in the correct plane (1) and the second radiograph is not (2). The fourth possibility is that the first radiograph is taken in the wrong plane (2) and the second radiograph is taken in the correct plane (1).
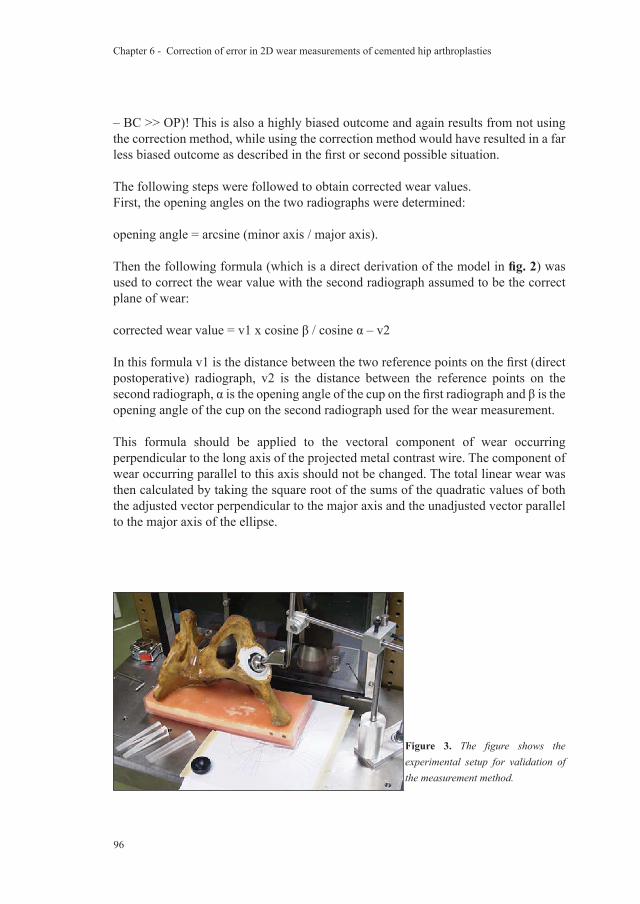
Chapter 6 - Correction of error in 2D wear measurements of cemented hip arthroplasties
96
– BC >> OP)! This is also a highly biased outcome and again results from not using the correction method, while using the correction method would have resulted in a far less biased outcome as described in the first or second possible situation.
The following steps were followed to obtain corrected wear values.First, the opening angles on the two radiographs were determined:
opening angle = arcsine (minor axis / major axis).
Then the following formula (which is a direct derivation of the model in fig. 2) was used to correct the wear value with the second radiograph assumed to be the correct plane of wear:
corrected wear value = v1 x cosine β / cosine α – v2
In this formula v1 is the distance between the two reference points on the first (direct postoperative) radiograph, v2 is the distance between the reference points on the second radiograph, α is the opening angle of the cup on the first radiograph and β is the opening angle of the cup on the second radiograph used for the wear measurement.
This formula should be applied to the vectoral component of wear occurring perpendicular to the long axis of the projected metal contrast wire. The component of wear occurring parallel to this axis should not be changed. The total linear wear was then calculated by taking the square root of the sums of the quadratic values of both the adjusted vector perpendicular to the major axis and the unadjusted vector parallel to the major axis of the ellipse.
Figure 3. The figure shows the experimental setup for validation of the measurement method.
Chapter 6 - Correction of error in 2D wear measurements of cemented hip arthroplasties
97
Validation of our measurement method was assessed by three parameters: Validity, precision and interobserver reliability. The measurements were performed on 300 dpi digitized radiographs (Howtek MultiRAD 760 Scanning Device, Aztek Digital Imaging, Irvine, USA) of an all polyethylene cup with a metal wire marker implanted in one specimen of a cadaveric pelvis. The femoral component was an Exeter stem with a 28 mm femoral head (Stryker-Howmedica, Mahwah, New Jersey) and was manually pressed in the cup and fixated mechanically (fig. 3). The acetabular cup consisted of two parts: the outer (cemented) part and an inner interchangeable inlay. An eccentric defect was machined in one of the inlays to produce a certain amount of wear, while another inlay was used without machining, simulating a situation without any wear (fig. 4). The exact amount and direction of the defect were not determined otherwise than by RSA which served as the gold standard. Radiographs of the pelvis were made in anterior-posterior direction focused on the symphysis. The distance between the radiographic tube and the plate was kept constant at 100 cm for all radiographs. The two-dimensional wear measurement results were compared with results obtained with RSA. This is a method with which change of position of bony or artificial (prosthetic) structures in relation to each other can be measured very accurately. Several tantalum balls need to be incorporated in the objects of interest for this measurement technique. A stereoradiographic approach provides a computer with the necessary data to calculate the relative displacement of interest.34
The precision was determined by measuring wear 10 times by the same observer on a series of radiographs. The observer was always blinded for his previous measurements. The interobserver reliability was determined by measuring the same radiograph by 10 different observers. They were blinded for each other’s measurements. Since it was noticed, that precision seemed to decrease when the metal ring was projected with a narrow opening (or in extreme: as a line), we decided to perform a second investigation on precision. One hundred twenty-three plain pelvic direct digital radiographs (150 dpi) of patients with a Scientific Hip Prosthesis (Biomet, Dordrecht, The Netherlands) were randomly sampled. All radiographs were direct digital images and were taken in a standardized way. The patients were in a supine position with their legs 10 degrees
Figure 4. On this image the two inlays that are used in the experimental setup are shown. The left inlay is without wear, while the right one is machined to simulate a situation with wear.
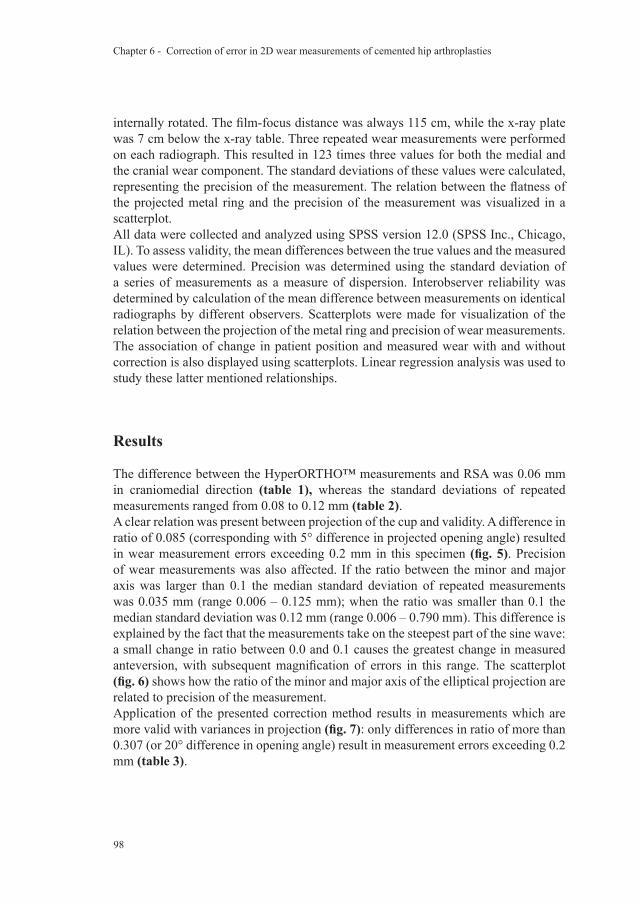
Chapter 6 - Correction of error in 2D wear measurements of cemented hip arthroplasties
98
internally rotated. The film-focus distance was always 115 cm, while the x-ray plate was 7 cm below the x-ray table. Three repeated wear measurements were performed on each radiograph. This resulted in 123 times three values for both the medial and the cranial wear component. The standard deviations of these values were calculated, representing the precision of the measurement. The relation between the flatness of the projected metal ring and the precision of the measurement was visualized in a scatterplot.All data were collected and analyzed using SPSS version 12.0 (SPSS Inc., Chicago, IL). To assess validity, the mean differences between the true values and the measured values were determined. Precision was determined using the standard deviation of a series of measurements as a measure of dispersion. Interobserver reliability was determined by calculation of the mean difference between measurements on identical radiographs by different observers. Scatterplots were made for visualization of the relation between the projection of the metal ring and precision of wear measurements. The association of change in patient position and measured wear with and without correction is also displayed using scatterplots. Linear regression analysis was used to study these latter mentioned relationships.
Results
The difference between the HyperORTHO™ measurements and RSA was 0.06 mm in craniomedial direction (table 1), whereas the standard deviations of repeated measurements ranged from 0.08 to 0.12 mm (table 2).A clear relation was present between projection of the cup and validity. A difference in ratio of 0.085 (corresponding with 5° difference in projected opening angle) resulted in wear measurement errors exceeding 0.2 mm in this specimen (fig. 5). Precision of wear measurements was also affected. If the ratio between the minor and major axis was larger than 0.1 the median standard deviation of repeated measurements was 0.035 mm (range 0.006 – 0.125 mm); when the ratio was smaller than 0.1 the median standard deviation was 0.12 mm (range 0.006 – 0.790 mm). This difference is explained by the fact that the measurements take on the steepest part of the sine wave: a small change in ratio between 0.0 and 0.1 causes the greatest change in measured anteversion, with subsequent magnification of errors in this range. The scatterplot (fig. 6) shows how the ratio of the minor and major axis of the elliptical projection are related to precision of the measurement. Application of the presented correction method results in measurements which are more valid with variances in projection (fig. 7): only differences in ratio of more than 0.307 (or 20° difference in opening angle) result in measurement errors exceeding 0.2 mm (table 3).
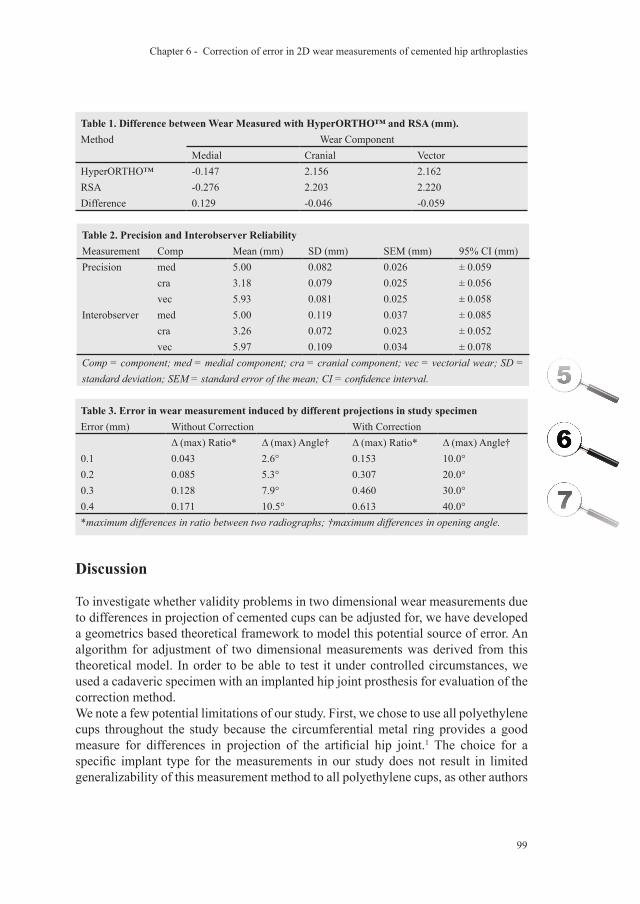
Chapter 6 - Correction of error in 2D wear measurements of cemented hip arthroplasties
99
Table 1. Difference between Wear Measured with HyperORTHO™ and RSA (mm).Method Wear Component
Medial Cranial VectorHyperORTHO™ -0.147 2.156 2.162RSA -0.276 2.203 2.220Difference 0.129 -0.046 -0.059
Table 2. Precision and Interobserver ReliabilityMeasurement Comp Mean (mm) SD (mm) SEM (mm) 95% CI (mm)Precision med 5.00 0.082 0.026 ± 0.059
cra 3.18 0.079 0.025 ± 0.056vec 5.93 0.081 0.025 ± 0.058
Interobserver med 5.00 0.119 0.037 ± 0.085cra 3.26 0.072 0.023 ± 0.052vec 5.97 0.109 0.034 ± 0.078
Comp = component; med = medial component; cra = cranial component; vec = vectorial wear; SD = standard deviation; SEM = standard error of the mean; CI = confidence interval.
Table 3. Error in wear measurement induced by different projections in study specimenError (mm) Without Correction With Correction
Δ (max) Ratio* Δ (max) Angle† Δ (max) Ratio* Δ (max) Angle†0.1 0.043 2.6° 0.153 10.0°0.2 0.085 5.3° 0.307 20.0°0.3 0.128 7.9° 0.460 30.0°0.4 0.171 10.5° 0.613 40.0°*maximum differences in ratio between two radiographs; †maximum differences in opening angle.
Discussion
To investigate whether validity problems in two dimensional wear measurements due to differences in projection of cemented cups can be adjusted for, we have developed a geometrics based theoretical framework to model this potential source of error. An algorithm for adjustment of two dimensional measurements was derived from this theoretical model. In order to be able to test it under controlled circumstances, we used a cadaveric specimen with an implanted hip joint prosthesis for evaluation of the correction method.We note a few potential limitations of our study. First, we chose to use all polyethylene cups throughout the study because the circumferential metal ring provides a good measure for differences in projection of the artificial hip joint.1 The choice for a specific implant type for the measurements in our study does not result in limited generalizability of this measurement method to all polyethylene cups, as other authors
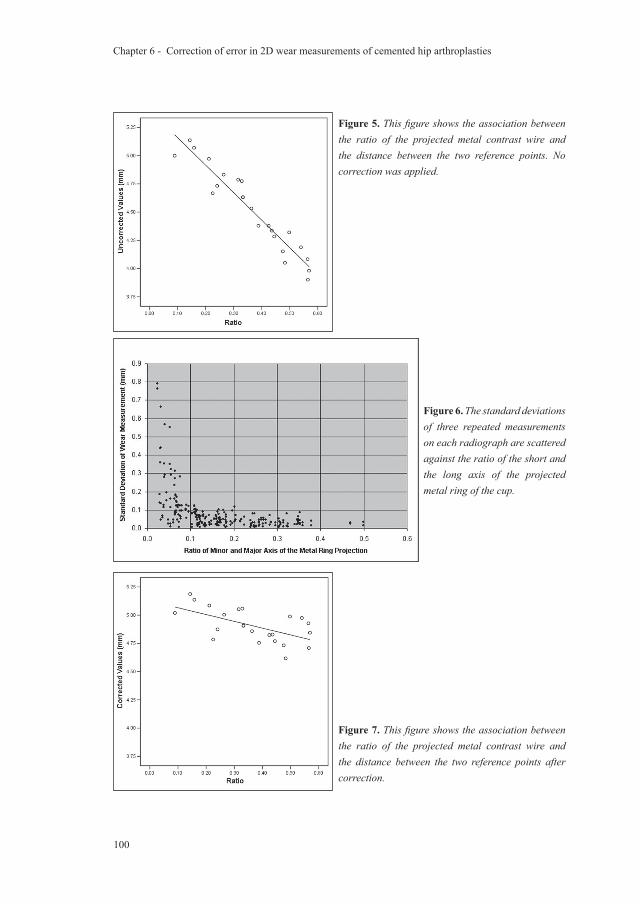
Chapter 6 - Correction of error in 2D wear measurements of cemented hip arthroplasties
100
Figure 7. This figure shows the association between the ratio of the projected metal contrast wire and the distance between the two reference points after correction.
Figure 6. The standard deviations of three repeated measurements on each radiograph are scattered against the ratio of the short and the long axis of the projected metal ring of the cup.
Figure 5. This figure shows the association between the ratio of the projected metal contrast wire and the distance between the two reference points. No correction was applied.
Chapter 6 - Correction of error in 2D wear measurements of cemented hip arthroplasties
101
who have used the same principle to measure the orientation of the cup also stated.1 The underlying mechanism of the apparent change in distance between two reference points (one being the centre of the femoral head; the other being either the centre of the metal ring or the centre of the metal backed cup) is universally applicable. The fact that – in a zero wear situation – the centre of a metal backed cup coincides with the centre of the femoral head, in contrast with the centre of the metal ring, does not alter this principle, although the impact on the absolute error reduction is expected to be different for different implant designs. Second, when the beam is centered over the hip, anteversion can be measured accurately but this observation does not apply to our study because parallax error caused by an x-ray beam centered on the symphysis pubis is the same for all of the radiographs of a single patient. Third, we do not distinguish between wear and creep in our study. The latter can certainly be a relevant source of additional penetration of the femoral head into the polyethylene. It is thought to mostly add to penetration rates in the first years after implantation and has been the specific subject of study in several papers.2, 16, 27 Although our correction method cannot directly distinguish creep from wear, it does offer the possibility of estimating the amount of creep in individual cases because it makes reliable individual wear curves possible. In our formula, we chose to use the second radiograph as the assumed plane in which wear occurs. This is partially arbitrary, but it does have a theoretical advantage: since we do not know the true plane of wear, the link between opening angle and distance of reference points is the most accurate in the first postoperative radiograph. Correction of the opening angle (and therefore the projected distance) is sure to be exact on the first radiograph, while a correction on other radiographs can slightly overcorrect or undercorrect. The method of correction needs an assumption considering the plane in which the wear occurs. It has been shown that this is approximately in the plane of the radiograph in 95% of the patients.37 Therefore, it seems reasonable to choose the plane of one of the radiographs which are used for the measurements. It is also possible to choose a different plane, such as the average of the two radiographic planes. Even without knowing the true plane in which the wear occurs, it is beneficial to apply this method. Series of measurements of individual patients might still slightly underestimate or overestimate the true wear value, but no excessive bias (like a negative wear value) can be present anymore. In all cases, correction of the measurement values will be toward the chosen plane in which wear is assumed to occur.We did not assume that wear occurs only in a craniomedial direction, since this assumption is not met in a substantial fraction of our patients. This necessitates a step by which the correction is only applied on the vectoral component perpendicular to the major axis of the elliptical projection of the metal ring as described in the Materials section. Not following these guidelines might result in overcorrection of the measurement values.Several papers have described the implications of using two-dimensional rather
Chapter 6 - Correction of error in 2D wear measurements of cemented hip arthroplasties
102
than three-dimensional wear measurements using simple radiographs.17, 24, 37 In contrast to our approach, all three-dimensional methods require lateral radiographs. Although high correlations (r2 varying from 0.78 to 0.93) between the two types of measurements have repeatedly been found when comparing follow-up series on group level, the irregularity of wear curves during individual patient follow up have never been investigated to our knowledge. It is commonly accepted that two-dimensional measurements underestimate the three-dimensional wear value (mean differences varying from 0.07 mm to 0.46 mm) 7, 17, 24, 37, but again, the fact that the amount of underestimation might vary within individual radiographic series has never been investigated to our knowledge. The measurement method presented in this paper is the first two-dimensional measurement to account for this source of error.Unadjusted digital two dimensional wear measurements on all polyethylene cups are valid under strict (laboratory) conditions, demanding comparability of radiographs, which cannot always be attained in clinical practice. Therefore, we recommend implementation of this correction method in the now widely available orthopaedic software packages to obtain valid wear measurements, even when patient positioning varies throughout clinical evaluations over time.
Acknowledgements
Funds were received in partial support of the research of the study presented in this article from Biomet NL, Dordrecht, the Netherlands.
Chapter 6 - Correction of error in 2D wear measurements of cemented hip arthroplasties
103
Chapter 6 - Correction of error in 2D wear measurements of cemented hip arthroplasties
Reference List
1. Ackland MK, Bourne WB, Uhthoff HK. Anteversion of the acetabular cup. Measurement of angle after total hip replacement. J Bone Joint Surg Br 1986 May;68(3):409-13.
2. Atkinson JR, Cicek RZ. Silane crosslinked polyethylene for prosthetic applications. II. Creep and wear behaviour and a preliminary moulding test. Biomaterials 1984 November;5(6):326-35.
3. Bankston AB, Cates H, Ritter MA, Keating EM, Faris PM. Polyethylene wear in total hip arthroplasty. Clin Orthop 1995 August;(317):7-13.
4. Barrack RL, Castro FP, Jr., Szuszczewicz ES, Schmalzried TP. Analysis of retrieved uncemented porous-coated acetabular components in patients with and without pelvic osteolysis. Orthopedics 2002 December;25(12):1373-8.
5. Callaghan JJ, Pedersen DR, Olejniczak JP, Goetz DD, Johnston RC. Radiographic measurement of wear in 5 cohorts of patients observed for 5 to 22 years. Clin Orthop 1995 August;(317):14-8.
6. Charnley J, Halley DK. Rate of wear in total hip replacement. Clin Orthop 1975 October;(112):170-9.
7. Devane PA, Bourne RB, Rorabeck CH, Hardie RM, Horne JG. Measurement of polyethylene wear in metal-backed acetabular cups. I. Three-dimensional technique. Clin Orthop 1995;(319):303-16.
8. Devane PA, Horne JG. Assessment of polyethylene wear in total hip replacement. Clin Orthop 1999;(369):59-72.
9. Dowd JE, Sychterz CJ, Young AM, Engh CA. Characterization of long-term femoral-head-penetration rates. Association with and prediction of osteolysis. J Bone Joint Surg Am 2000 August;82-A(8):1102-7.
10. Dumbleton JH, Manley MT, Edidin AA. A literature review of the association between wear rate and osteolysis in total hip arthroplasty. J Arthroplasty 2002 August;17(5):649-61.
11. Ebramzadeh E, Normand PL, Sangiorgio SN et al. Long-term radiographic changes in cemented total hip arthroplasty with six designs of femoral components. Biomaterials 2003 August;24(19):3351-63.
12. Eggli S, z’Brun S, Gerber C, Ganz R. Comparison of polyethylene wear with femoral heads of 22 mm and 32 mm. A prospective, randomised study. J Bone Joint Surg Br 2002 April;84(3):447-51.
13. Griffith MJ, Seidenstein MK, Williams D, Charnley J. Socket wear in Charnley low friction arthroplasty of the hip. Clin Orthop 1978 November;(137):37-47.
14. Hardinge K, Porter ML, Jones PR, Hukins DW, Taylor CJ. Measurement of hip prostheses using image analysis. The maxima hip technique. J Bone Joint Surg Br 1991 September;73(5):724-8.
Chapter 6 - Correction of error in 2D wear measurements of cemented hip arthroplasties
104
Chapter 6 - Correction of error in 2D wear measurements of cemented hip arthroplasties
15. Havelin LI, Engesaeter LB, Espehaug B, Furnes O, Lie SA, Vollset SE. The Norwegian Arthroplasty Register: 11 years and 73,000 arthroplasties. Acta Orthop Scand 2000 August;71(4):337-53.
16. Huber J, Walter A, Plitz W, Refior HJ. Effect of the manufacturing process on creep and wear properties of UHMWPE (ultra-high molecular weight polyethylene). Biomed Tech (Berl) 1995 April;40(4):88-92.
17. Hui AJ, McCalden RW, Martell JM, MacDonald SJ, Bourne RB, Rorabeck CH. Validation of two and three-dimensional radiographic techniques for measuring polyethylene wear after total hip arthroplasty. J Bone Joint Surg Am 2003 March;85-A(3):505-11.
18. Ilchmann T, Mjoberg B, Wingstrand H. Measurement accuracy in acetabular cup wear. Three retrospective methods compared with Roentgen stereophotogrammetry. J Arthroplasty 1995 October;10(5):636-42.
19. Jones PR, Taylor CJ, Hukins DW, Porter ML, Hardinge K. Prosthetic hip failure: retrospective radiograph image analysis of the acetabular cup. J Biomed Eng 1989 May;11(3):253-7.
20. Kadoya Y, Kobayashi A, Ohashi H. Wear and osteolysis in total joint replacements. Acta Orthop Scand Suppl 1998 February;278:1-16.
21. Looney RJ, Boyd A, Totterman S et al. Volumetric computerized tomography as a measurement of periprosthetic acetabular osteolysis and its correlation with wear. Arthritis Res 2002;4(1):59-63.
22. Maloney WJ, Schmalzried T, Harris WH. Analysis of long-term cemented total hip arthroplasty retrievals. Clin Orthop 2002 December;(405):70-8.
23. Martell JM, Berdia S. Determination of polyethylene wear in total hip replacements with use of digital radiographs. J Bone Joint Surg Am 1997 November;79(11):1635-41.
24. Martell JM, Berkson E, Berger R, Jacobs J. Comparison of two and three-dimensional computerized polyethylene wear analysis after total hip arthroplasty. J Bone Joint Surg Am 2003 June;85-A(6):1111-7.
25. McAuley JP, Szuszczewicz ES, Young A, Engh CA, Sr. Total hip arthroplasty in patients 50 years and younger. Clin Orthop Relat Res 2004 January;(418):119-25.
26. McCombe P, Williams SA. A comparison of polyethylene wear rates between cemented and cementless cups. A prospective, randomised trial. J Bone Joint Surg Br 2004 April;86(3):344-9.
27. McDonald MD, Bloebaum RD. Distinguishing wear and creep in clinically retrieved polyethylene inserts. J Biomed Mater Res 1995 January;29(1):1-7.
28. Nashed RS, Becker DA, Gustilo RB. Are cementless acetabular components the cause of excess wear and osteolysis in total hip arthroplasty? Clin Orthop 1995 August;(317):19-28.
29. Ohlin A, Selvik G. Socket wear assessment. A comparison of three different radiographic methods. J Arthroplasty 1993 August;8(4):427-31.
Chapter 6 - Correction of error in 2D wear measurements of cemented hip arthroplasties
105
Chapter 6 - Correction of error in 2D wear measurements of cemented hip arthroplasties
30. Pedersen DR, Brown TD, Hillis SL, Callaghan JJ. Prediction of long-term polyethylene wear in total hip arthroplasty, based on early wear measurements made using digital image analysis. J Orthop Res 1998 September;16(5):557-63.
31. Phillips NJ, Stockley I, Wilkinson JM. Direct plain radiographic methods versus EBRA-Digital for measuring implant migration after total hip arthroplasty. J Arthroplasty 2002 October;17(7):917-25.
32. Pollock D, Sychterz CJ, Engh CA. A clinically practical method of manually assessing polyethylene liner thickness. J Bone Joint Surg Am 2001 December;83-A(12):1803-9.
33. Schreurs BW, Busch VJ, Welten ML, Verdonschot N, Slooff TJ, Gardeniers JW. Acetabular reconstruction with impaction bone-grafting and a cemented cup in patients younger than fifty years old. J Bone Joint Surg Am 2004 November;86-A(11):2385-92.
34. Selvik G. Röntgen stereophotogrammetry. A method for the study of the kinematics of the skeletal system. Acta Orthop Scand Suppl 1989;232:1-51.
35. Sethi RK, Neavyn MJ, Rubash HE, Shanbhag AS. Macrophage response to cross-linked and conventional UHMWPE. Biomaterials 2003 July;24(15):2561-73.
36. Shaver SM, Brown TD, Hillis SL, Callaghan JJ. Digital edge-detection measurement of polyethylene wear after total hip arthroplasty. J Bone Joint Surg Am 1997 May;79(5):690-700.
37. Sychterz CJ, Yang AM, McAuley JP, Engh CA. Two-dimensional versus three-dimensional radiographic measurements of polyethylene wear. Clin Orthop 1999 August;(365):117-23.

Chapter 6 - Correction of error in 2D wear measurements of cemented hip arthroplasties
106
Chapter 6 - Correction of error in 2D wear measurements of cemented hip arthroplasties
A new method to make two-dimensional wear measurements
less sensitive to projection differences of cemented total hip replacements on AP radiographs
B. TheG. Flivik
R.L. DiercksN. Verdonschot
Submitted to the Journal of Orthopaedic Research

Chapter 7 - A new method to make 2D wear measurements less sensitive to projection differences
108
Chapter 7 - A new method to make 2D wear measurements less sensitive to projection differences
109
Abstract
IntroductionIndividual wear curves of patients often show unexplained patterns of irregularity, or even impossible values such as negative wear. We postulated that the errors of two-dimensional wear measurements are mainly the result of projection differences between the measured radiographs.Our aim was to test a new method which makes two-dimensional wear measurements less sensitive for X-ray projection differences of cemented Total Hip Replacements (THR) on AP radiographs.MethodsThe measurement errors which occur when projecting a three-dimensional THR as a two-dimensional image were geometrically modelled. Based on this model a method was developed to reverse this process. This correction method results in approximations of the three-dimensional linear wear which are much less sensitive for radiographic projection differences.An error analysis was performed by virtually simulating 144 wear measurements under varying conditions with and without application of the correction.For clinical validation RSA was performed on 47 patients with a THR to determine the true wear at 1, 2 and 5 years postoperatively. Then, the wear was measured on conventional radiographs with and without the correction.ResultsIn the virtual error analysis the mean absolute error of raw measurements was reduced from 1.8 mm (range 0 - 4.51 mm) to 0.11 mm (0 - 0.27 mm) by application of the correction. The largest error of 0.27 mm occurred when an extreme failure of meeting the model assumptions was introduced.In the clinical series, the occurrence of errors greater than 0.2 mm was reduced from 35% to 15% by application of the correction.ConclusionWear measurements are less sensitive to differences in two-dimensional projection of the THR when using the correction method.
Chapter 7 - A new method to make 2D wear measurements less sensitive to projection differences
110
Introduction
Wear is considered an important factor in failure of total hip replacements (THR).1-7 Manual measurement methods using pencils, plastic templates of circles and callipers on films are being abandoned in favour of more accurate methods. Nowadays, digital measurement techniques have become the standard for two-dimensional wear measurements. Although the precision of these techniques has substantially improved, reported mean errors are still up to 0.5 mm. The variation in the reported figures is probably partly due to differences in study design.8-16 A potential source of errors in two-dimensional wear measurements in a clinical setting are the differences between the two-dimensional projection of the THR on the directly postoperative and follow-up radiographs. The irregular wear patterns, as well as the occurrence of impossible values, such as negative wear, which are seen in individual wear curves may be the result of this. This jeopardizes the applicability of measurements on the level of the individual patient, and a method to eliminate this source of error is therefore desirable.In a previous study we developed a geometrical framework to model the wear measurement errors due to projection differences of a THR.17 Based on this model an algorithm was developed which adjusted the raw two-dimensional measurements to more accurate values. This adjustment was accomplished by mathematically reversing the causal chain leading to the two-dimensional measurement error, and then converting the measurement value to approximate the true linear wear. This approximation is accomplished by using the differences in projection between the radiographs to extract additional information on the wear pattern. In other words, the source of errors (differences in projection) is now being used to create more accurate linear wear estimates. This correction method was tested in a laboratory setting and yielded promising preliminary results.17
Although the results showed a clear improvement in validity of measurement values in that specific specimen in a no-wear situation in a laboratory setting, it remains unclear how the correction method would perform in different individuals in a clinical setting. It is also not clear how the correction method is affected if the assumption of the model (knowledge of the true plane of wear) is not met. This assumption can never be met in clinical practice. The correction method thus needs to be robust: it should still be accurate, even if the model assumption is not ideally met. Otherwise, the correction could cause additional errors instead of eliminating them.The first aim of this study was to subject the correction method to an error analysis. A large series of simulations of mild to extreme degrees of failure to meet the model assumption was performed, and the accuracy of the correction in these circumstances was quantified. The second aim was to determine the accuracy of wear measurements with and without application of the correction method with use of Radiostereometric Analysis (RSA) in a clinical series of patients.
Chapter 7 - A new method to make 2D wear measurements less sensitive to projection differences
111
Methods
Error analysis144 wear measurements with and without application of the correction method (see Appendix) were simulated virtually by a computer analysis under varying conditions: the projection difference of the cup between the reference and follow-up radiograph was varied from 10º to 30º, absolute cup anteversions were varied from 0º to 70º, while the true amount of linear wear was set at 2.0 mm. The model on which the correction method is based assumes that it is known what the true plane of wear is. We simulated failures to meet this assumption by introducing errors of the assumed true plane of wear from –30º to +30º. In other words, if the wear would be assumed to occur in the plane of the radiograph, the true direction of wear was simulated to be at an angle between –30º (posteriorly) to +30º (anteriorly) relative to the radiograph.The computer calculated how the centre of the femoral head would be projected on film relative to the metal ring on both the reference and follow-up radiograph. The raw two-dimensional linear wear was calculated as the projected shift of the femoral head relative to the metal ring. The difference between the raw two-dimensional linear wear and the true wear (2.0 mm) was recorded. Then the correction was applied (see Appendix) and the resulting difference between the approximated three-dimensional linear wear and the true linear wear was recorded.
Clinical validationA cohort of 47 patients who received a ScanHip system with Opticup (Biomet, UK) in the period September 1995 to October 1998 in the University Hospital of Lund, Sweden, was used for the clinical validation of the correction method. All patients were analyzed with Radiostereometric Analysis (RSA), the gold standard for in vivo wear measurements. RSA is a method with which change of position of bony or artificial (prosthetic) structures in relation to each other can be measured very accurately. A stereoradiographic approach provides a computer with the necessary data to calculate the relative displacement of interest.18-22
For this study, the cups (sizes of 46 to 56 mm) had been marked with 7–9 tantalum markers by the manufacturer. RSA examinations were done by a uniplanar technique 18;23, with the patient in supine position. The two x-ray sources were fixed (mounted to the ceiling). We used a type-41 calibration cage (Tilly Medical, Lund, Sweden) and the computer software UmRSA version 5.0 (RSA Biomedical, Umeå, Sweden). The reference examination was done within 1 week of the operation and the follow-up examinations at 1, 2 and 5 years postoperatively. Conventional hip x-rays were taken on the same day as the RSA examinations. The RSA wear measurements were done by point motion and calculation of the resultant three-dimensional vector of the head migration into the cup.All raw measurements (thus without correction) were performed on 150 dpi digitized radiographs using the not-commercially available software application Hip,
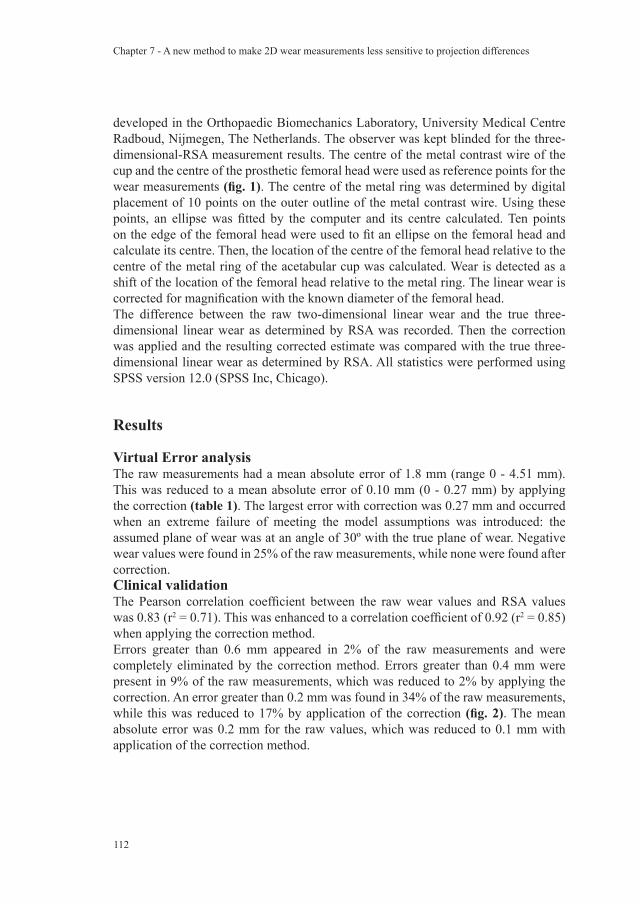
Chapter 7 - A new method to make 2D wear measurements less sensitive to projection differences
112
developed in the Orthopaedic Biomechanics Laboratory, University Medical Centre Radboud, Nijmegen, The Netherlands. The observer was kept blinded for the three-dimensional-RSA measurement results. The centre of the metal contrast wire of the cup and the centre of the prosthetic femoral head were used as reference points for the wear measurements (fig. 1). The centre of the metal ring was determined by digital placement of 10 points on the outer outline of the metal contrast wire. Using these points, an ellipse was fitted by the computer and its centre calculated. Ten points on the edge of the femoral head were used to fit an ellipse on the femoral head and calculate its centre. Then, the location of the centre of the femoral head relative to the centre of the metal ring of the acetabular cup was calculated. Wear is detected as a shift of the location of the femoral head relative to the metal ring. The linear wear is corrected for magnification with the known diameter of the femoral head.The difference between the raw two-dimensional linear wear and the true three-dimensional linear wear as determined by RSA was recorded. Then the correction was applied and the resulting corrected estimate was compared with the true three-dimensional linear wear as determined by RSA. All statistics were performed using SPSS version 12.0 (SPSS Inc, Chicago).
Results
Virtual Error analysisThe raw measurements had a mean absolute error of 1.8 mm (range 0 - 4.51 mm). This was reduced to a mean absolute error of 0.10 mm (0 - 0.27 mm) by applying the correction (table 1). The largest error with correction was 0.27 mm and occurred when an extreme failure of meeting the model assumptions was introduced: the assumed plane of wear was at an angle of 30º with the true plane of wear. Negative wear values were found in 25% of the raw measurements, while none were found after correction.Clinical validationThe Pearson correlation coefficient between the raw wear values and RSA values was 0.83 (r2 = 0.71). This was enhanced to a correlation coefficient of 0.92 (r2 = 0.85) when applying the correction method.Errors greater than 0.6 mm appeared in 2% of the raw measurements and were completely eliminated by the correction method. Errors greater than 0.4 mm were present in 9% of the raw measurements, which was reduced to 2% by applying the correction. An error greater than 0.2 mm was found in 34% of the raw measurements, while this was reduced to 17% by application of the correction (fig. 2). The mean absolute error was 0.2 mm for the raw values, which was reduced to 0.1 mm with application of the correction method.
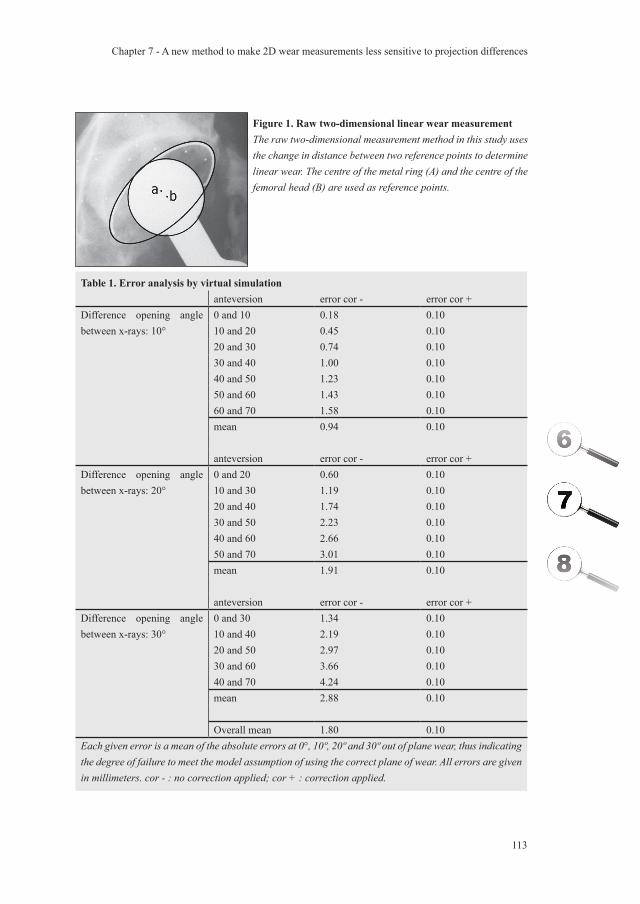
Chapter 7 - A new method to make 2D wear measurements less sensitive to projection differences
113
Table 1. Error analysis by virtual simulationanteversion error cor - error cor +
Difference opening angle between x-rays: 10°
0 and 10 0.18 0.1010 and 20 0.45 0.1020 and 30 0.74 0.1030 and 40 1.00 0.1040 and 50 1.23 0.1050 and 60 1.43 0.1060 and 70 1.58 0.10mean 0.94 0.10
anteversion error cor - error cor +Difference opening angle between x-rays: 20°
0 and 20 0.60 0.1010 and 30 1.19 0.1020 and 40 1.74 0.1030 and 50 2.23 0.1040 and 60 2.66 0.1050 and 70 3.01 0.10mean 1.91 0.10
anteversion error cor - error cor +Difference opening angle between x-rays: 30°
0 and 30 1.34 0.1010 and 40 2.19 0.1020 and 50 2.97 0.1030 and 60 3.66 0.1040 and 70 4.24 0.10mean 2.88 0.10
Overall mean 1.80 0.10Each given error is a mean of the absolute errors at 0°, 10º, 20º and 30º out of plane wear, thus indicating the degree of failure to meet the model assumption of using the correct plane of wear. All errors are given in millimeters. cor - : no correction applied; cor + : correction applied.
Figure 1. Raw two-dimensional linear wear measurementThe raw two-dimensional measurement method in this study uses the change in distance between two reference points to determine linear wear. The centre of the metal ring (A) and the centre of the femoral head (B) are used as reference points.
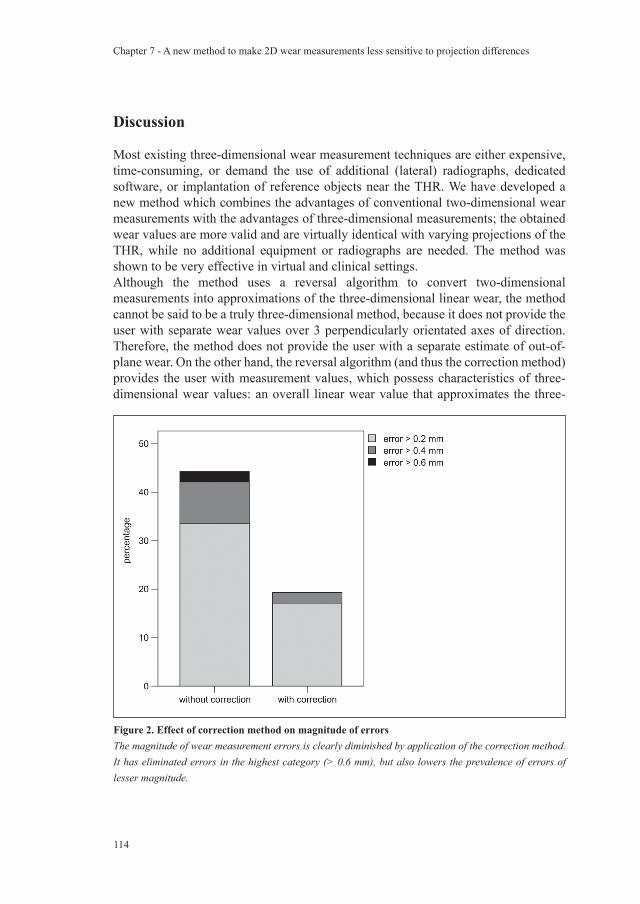
Chapter 7 - A new method to make 2D wear measurements less sensitive to projection differences
114
Discussion
Most existing three-dimensional wear measurement techniques are either expensive, time-consuming, or demand the use of additional (lateral) radiographs, dedicated software, or implantation of reference objects near the THR. We have developed a new method which combines the advantages of conventional two-dimensional wear measurements with the advantages of three-dimensional measurements; the obtained wear values are more valid and are virtually identical with varying projections of the THR, while no additional equipment or radiographs are needed. The method was shown to be very effective in virtual and clinical settings.Although the method uses a reversal algorithm to convert two-dimensional measurements into approximations of the three-dimensional linear wear, the method cannot be said to be a truly three-dimensional method, because it does not provide the user with separate wear values over 3 perpendicularly orientated axes of direction. Therefore, the method does not provide the user with a separate estimate of out-of-plane wear. On the other hand, the reversal algorithm (and thus the correction method) provides the user with measurement values, which possess characteristics of three-dimensional wear values: an overall linear wear value that approximates the three-
Figure 2. Effect of correction method on magnitude of errorsThe magnitude of wear measurement errors is clearly diminished by application of the correction method. It has eliminated errors in the highest category (> 0.6 mm), but also lowers the prevalence of errors of lesser magnitude.
Chapter 7 - A new method to make 2D wear measurements less sensitive to projection differences
115
dimensional linear wear value, and values which are not as sensitive to radiographic projection differences as conventional two-dimensional wear measurement values.We have focused the research on wear measurements of cemented THR for two reasons. First of all, the circumferential metal ring of all polyethylene cups enables accurate measurement of projection differences of the THR 24, which is a basic step in the correction method. Second, the expected gain in validity is highest in measurements on all poly-ethylene cups. The reason for this is that the centre of the metal ring and the centre of the femoral head do not coincide, but are approximately 2 to 7 mm (depending on the type of cup) apart in a zero wear situation. The greater this distance, the greater the expected gain is from using the correction method. We used a THR type with only a small distance (2 mm) between the reference points, which means that the results, when using other types of THR, in (possible) future replicate studies might be even better.When applying the correction method in this study, we chose to use the second radiograph as the assumed plane in which the true wear occurs. This is partially arbitrary since we cannot really know the true plane of wear, but it does have a theoretical advantage: the link between opening angle and two-dimensional projected distance of reference points is the most accurate in the first postoperative radiograph (because no wear has yet occurred). Correction of the opening angle (and therefore the projected distance) is sure to be exact on the first radiograph, while a correction on other radiographs can slightly over- or undercorrect. Since this error is not expected to be very large, an alternative method to choose the reference plane – such as the average of the opening angles – is also defendable, and perhaps even preferable, when more than two follow-up radiographs are available; the consideration of more radiographs might be expected to produce a better estimate of the true plane of wear. Nonetheless, the error analysis in this study has clarified the fact that exact knowledge of the true plane of wear is not necessary: even when assuming a wrong plane of wear, it is beneficial to apply the correction method.We did not assume that wear always occurs in pure cranial or craniomedial direction, since the direction of wear is craniolateral in a substantial fraction of our patients. This necessitates a step by which the correction is only applied on the vectoral component perpendicular to the major axis of the elliptical projection of the metal ring as described in the Appendix. Not following these guidelines might result in overcorrection of the measurement values.We do not distinguish between wear and creep in our study. The latter can certainly be a relevant source of additional penetration of the femoral head into the polyethylene. It is thought to mostly add to penetration rates in the first year after implantation and has been the specific subject of study in several papers.25-27 Although our correction method – similarly to all other methods – cannot directly distinguish creep from wear, it does offer the possibility of estimating the amount of creep in individual cases because it makes reliable individual wear curves possible. Several papers have been published about the implications of using two-dimensional
Chapter 7 - A new method to make 2D wear measurements less sensitive to projection differences
116
versus three-dimensional wear measurements. It is commonly accepted that two-dimensional measurements on average (thus on a group level) underestimate the three-dimensional wear value (mean differences varying from 0.07 mm to 0.46 mm).16;28-
30 In addition, wear curves of individual patients measured with two-dimensional techniques can be unstable as is illustrated in an earlier publication.34 This publication created the theoretical foundation for the correction method and showed promising preliminary results in a cadaver study. The current study has provided essential data to ensure that application of this method is safe, even under extreme conditions, by performing an extensive error analysis. And finally, the RSA validation performed in this study has demonstrated its superior performance in a clinical setting in comparison with raw (i.e. uncorrected) measurements. We therefore recommend implementation of the correction method in all two-dimensional orthopedic software packages.
Appendix
The correction method uses the underlying mechanism of differences in two-dimensionally projected distances with varying positions of two objects in space to construct a three-dimensional linear wear approximation.17 The following formula is used for correction of the raw wear measurement, assuming the second radiograph to be the true plane of wear:
corrected wear = v1 x cosine β / cosine α – v2
In this formula v1 is the distance between the two reference points on the first (direct postoperative) radiograph, v2 is the distance between the reference points on the second radiograph, α is the opening angle of the cup on the first radiograph and β is the opening angle of the cup on the second radiograph used for the wear measurement. The opening angles are calculated with the following formula: opening angle = arcsine (minor axis / major axis).This formula should be applied to the vectoral component of wear occurring perpendicular to the long axis of the projected metal contrast wire. The component of wear occurring parallel to this axis should not be changed. The total linear wear is then calculated by taking the square root of the sums of the quadratic values of both the adjusted vector perpendicular to the major axis and the unadjusted vector parallel to the major axis of the ellipse.
Acknowledgements
Funds were received in partial support of the research of the study presented in this rticle from Biomet NL, Dordrecht, the Netherlands.
Chapter 7 - A new method to make 2D wear measurements less sensitive to projection differences
117
Chapter 7 - A new method to make 2D wear measurements less sensitive to projection differences
Reference List
1. Barrack RL, Castro FP, Jr., Szuszczewicz ES, Schmalzried TP. Analysis of retrieved uncemented porous-coated acetabular components in patients with and without pelvic osteolysis. Orthopedics 2002;25:1373-78.
2. Dowd JE, Sychterz CJ, Young AM, Engh CA. Characterization of long-term femoral-head-penetration rates. Association with and prediction of osteolysis. J.Bone Joint Surg.Am. 2000;82-A:1102-07.
3. Dumbleton JH, Manley MT, Edidin AA. A literature review of the association between wear rate and osteolysis in total hip arthroplasty. J.Arthroplasty 2002;17:649-61.
4. Kadoya Y, Kobayashi A, Ohashi H. Wear and osteolysis in total joint replacements. Acta Orthop.Scand.Suppl 1998;278:1-16.
5. Looney RJ, Boyd A, Totterman S, Seo GS, Tamez-Pena J, Campbell D et al. Volumetric computerized tomography as a measurement of periprosthetic acetabular osteolysis and its correlation with wear. Arthritis Res. 2002;4:59-63.
6. Maloney WJ, Schmalzried T, Harris WH. Analysis of long-term cemented total hip arthroplasty retrievals. Clin.Orthop. 2002;70-78.
7. Sethi RK, Neavyn MJ, Rubash HE, Shanbhag AS. Macrophage response to cross-linked and conventional UHMWPE. Biomaterials 2003;24:2561-73.
8. Bankston AB, Cates H, Ritter MA, Keating EM, Faris PM. Polyethylene wear in total hip arthroplasty. Clin.Orthop. 1995;7-13.
9. Devane PA, Horne JG. Assessment of polyethylene wear in total hip replacement. Clin Orthop. 1999;59-72.
10. Hardinge K, Porter ML, Jones PR, Hukins DW, Taylor CJ. Measurement of hip prostheses using image analysis. The maxima hip technique. J.Bone Joint Surg.Br. 1991;73:724-28.
11. Jones PR, Taylor CJ, Hukins DW, Porter ML, Hardinge K. Prosthetic hip failure: retrospective radiograph image analysis of the acetabular cup. J.Biomed.Eng 1989;11:253-57.
12. Martell JM, Berdia S. Determination of polyethylene wear in total hip replacements with use of digital radiographs. J.Bone Joint Surg.Am. 1997;79:1635-41.
13. Pedersen DR, Brown TD, Hillis SL, Callaghan JJ. Prediction of long-term polyethylene wear in total hip arthroplasty, based on early wear measurements made using digital image analysis. J.Orthop.Res. 1998;16:557-63.
14. Phillips NJ, Stockley I, Wilkinson JM. Direct plain radiographic methods versus EBRA-Digital for measuring implant migration after total hip arthroplasty. J.Arthroplasty 2002;17:917-25.
Chapter 7 - A new method to make 2D wear measurements less sensitive to projection differences
118
Chapter 7 - A new method to make 2D wear measurements less sensitive to projection differences
15. Shaver SM, Brown TD, Hillis SL, Callaghan JJ. Digital edge-detection measurement of polyethylene wear after total hip arthroplasty. J.Bone Joint Surg.Am. 1997;79:690-700.
16. Sychterz CJ, Yang AM, McAuley JP, Engh CA. Two-dimensional versus three-dimensional radiographic measurements of polyethylene wear. Clin.Orthop. 1999;117-23.
17. The B, Mol L, Diercks RL, Ooijen PM, Verdonschot N. Correction of Error in Two-dimensional Wear Measurements of Cemented Hip Arthroplasties. Clin.Orthop.Relat Res. 2006;442:180-86.
18. Selvik G. Roentgen stereophotogrammetry. A method for the study of the kinematics of the skeletal system. Acta Orthop.Scand.Suppl 1989;232:1-51.
19. Bragdon CR, Estok DM, Malchau H, Karrholm J, Yuan X, Bourne R et al. Comparison of two digital radiostereometric analysis methods in the determination of femoral head penetration in a total hip replacement phantom. J.Orthop.Res. 2004;22:659-64.
20. Ilchmann T. Radiographic assessment of cup migration and wear after hip replacement. Acta Orthop.Scand.Suppl 1997;276:1-26.
21. Ostgaard SE, Gottlieb L, Toksvig-Larsen S, Lebech A, Talbot A, Lund B. Roentgen stereophotogrammetric analysis using computer-based image-analysis. J.Biomech. 1997;30:993-95.
22. Valstar ER, Vrooman HA, Toksvig-Larsen S, Ryd L, Nelissen RG. Digital automated RSA compared to manually operated RSA. J.Biomech. 2000;33:1593-99.
23. Karrholm J, Herberts P, Hultmark P, Malchau H, Nivbrant B, Thanner J. Radiostereometry of hip prostheses. Review of methodology and clinical results. Clin.Orthop. 1997;94-110.
24. Ackland MK, Bourne WB, Uhthoff HK. Anteversion of the acetabular cup. Measurement of angle after total hip replacement. J.Bone Joint Surg.Br. 1986;68:409-13.
25. McDonald MD, Bloebaum RD. Distinguishing wear and creep in clinically retrieved polyethylene inserts. J.Biomed.Mater.Res. 1995;29:1-7.
26. Atkinson JR, Cicek RZ. Silane crosslinked polyethylene for prosthetic applications. II. Creep and wear behaviour and a preliminary moulding test. Biomaterials 1984;5:326-35.
27. Huber J, Walter A, Plitz W, Refior HJ. Effect of the manufacturing process on creep and wear properties of UHMWPE (ultra-high molecular weight polyethylene). Biomed.Tech.(Berl) 1995;40:88-92.
28. Devane PA, Bourne RB, Rorabeck CH, Hardie RM, Horne JG. Measurement of polyethylene wear in metal-backed acetabular cups. I. Three-dimensional technique. Clin Orthop. 1995;303-16.
Chapter 7 - A new method to make 2D wear measurements less sensitive to projection differences
119
Chapter 7 - A new method to make 2D wear measurements less sensitive to projection differences
29. Hui AJ, McCalden RW, Martell JM, MacDonald SJ, Bourne RB, Rorabeck CH. Validation of two and three-dimensional radiographic techniques for measuring polyethylene wear after total hip arthroplasty. J.Bone Joint Surg.Am. 2003;85-A:505-11.
30. Martell JM, Berkson E, Berger R, Jacobs J. Comparison of two and three-dimensional computerized polyethylene wear analysis after total hip arthroplasty. J.Bone Joint Surg.Am. 2003;85-A:1111-17.

Chapter 7 - A new method to make 2D wear measurements less sensitive to projection differences
120
Chapter 7 - A new method to make 2D wear measurements less sensitive to projection differences

General Discussion

Chapter 8 - General discussion
122
Chapter 8 - General discussion
123
General discussion
The aim of this thesis was to create a scientific foundation for studying the possibilities of preoperative planning and postoperative measurements on total hip replacements. A common theme in all our studies was the possibility to implement the results in daily practice of orthopedic surgeons (in both specialized and non-specialized centres). Therefore, the measurements were performed on a standard PC and commonly available radiographs. We have made the choice to perform all studies using digital radiographs (either digitized or direct) in the light of the current trend towards digitalization of radiological departments throughout the medical community. A survey in the Netherlands estimated the percentage of hospitals using a PACS at 37% in 2003 1, while a survey in 2005 even estimated that 80% of the hospitals in the USA with more than 500 beds were using a PACS system.2 Using digital equipment has given us the opportunity to investigate more possibilities of preoperative planning and postoperative measurements, which are unpractical or unfeasible without digital tools.Most currently available software packages, including the ones we have used, (HyperOrtho, OrthoView, Q Bone Planner, MediCAD) are still in development or early versions, and few have been scientifically assessed. For this reason orthopedic software development should at least partly be science-driven. Vice-versa, scientific research in this field should be directed in such a way that the final result is implementable in practical solutions, such as improvement of software applications. Using digital environments that were still in an early phase of development has resulted in less desirable research conditions. At the start of the study the University Medical Centre Groningen did not have acces to direct digital radiographs, which forced us to work with digitized x-ray films. Theoretically, a loss of image quality can be expected, and we have tried to minimize this effect by using the highest resolution possible without overloading the capacity of the available workstations. A drawback of working with experimental software was the weak user interface, thus leading to a low level of user-friendliness. This has had implications on the practical execution of at least one study (Chapter 4). Fortunately, we were able to replicate the study in the final phase of this research project with most of the software problems solved (Chapter 5). An intuitive endpoint in studies concerning optimizing preplanning and development of predictive measurements on THR is survival of the implant. Because of obvious time limitations of the studies in this particular project, we could not study survival rates. We have thus used early endpoints such as correct preoperative prediction of implanted component sizes, direct postoperative evaluations (leg length discrepancies, positioning of implants), and focussed on optimization of measurement of wear rates which have a close relation to failure of THRs. 3-7
We have dedicated two studies to preoperative planning of THRs (Chapters 4 and 5). Although the first study showed comparable results for digital and analogue planning,
Chapter 8 - General discussion
124
it was deemed possible that a source of bias had influenced the digital plannings in a negative way. A second, randomized clinical trial on the same topic showed trends in favour of digital planning (and in any case no adverse effects).The difference in results with preoperative planning of TKRs was striking: Accuracy of digital planning of TKR was superior in comparison with analogue planning. The fact that THR planning was less successful in predicting the component sizes might be explained by several factors. A first possibility is a difference in prosthetic determinants. The differences in size between components was greater for TKRs than for THRs, which made the distinction between well or ill-fitting components more clear for TKRs. Although this determinant is capable of affecting the measured accuracy of preoperative planning, it does not cause the decrease in accuracy itself. It merely potentiates or weakens true causes of inaccuracy: using small differences in sizes will enable the detection of small problems with accuracy. So, this determinant is of no concern to research aimed at increasing accuracy of preoperative planning. It should merely be kept in mind, when comparing figures of accuracy concerning different types of prostheses. A second possibility is a difference in functional anatomic determinants. More specifically, the femoral anteversion of the femur is an extra factor to be taken into account in THRs. It is attempted to be neutralized in the standardized pelvic radiographs, but might still account for some of the difference in accuracy between preoperative planning of TKRs and THRs. Since it is not clear if this is really a relevant source of errors, future studies should be aimed at quantifying its role. The third possibility is a difference in radiographic determinants. Correct positioning of the calibration object is less of a problem in knee radiographs than pelvic radiographs. This was considered a potentially important factor and led us to direct our research toward a fundamental issue: magnification factor of radiographic projections of the hip joint for preoperative planning. Following common practice had seemed to be a reasonable starting point, since other scientific papers 8;9, expert opinion 10, and logical reasoning seemed to form a foundation for it. This assumption proved to be false, and we decided to explore other possibilities to enhance the accuracy of correcting for the magnification factor (Chapter 2 and 3).We have focused on enhancing wear measurement methods only of all-polyethylene cups since the all-polyethylene tool was the only available wear measurement tool during the project. This has led to a scientific challenge of a different kind than enhancement of measurements on metal backed cups: The problem to be solved with metal backed cups is detection of the metal shell and reproducible conversion into a reference for wear measurements. This is an issue of reliability and can for the most part be solved by software adjustments as others have shown. 11 With all-polyethylene cups, the problem is validity: projection differences potentially result in a distortion of the relationship between reference markers used for wear measurements. A mathematical solution for this problem was developed and proved to be successful (Chapter 6 and 7). It has resulted in a two-dimensional wear measurement method
Chapter 8 - General discussion
125
which is no longer as sensitive to differences in two-dimensional projection of the hip joint as conventional measurements. The basic idea which was the foundation for our approach will hopefully be valuable for constructing solutions for other measurements.
Future research 1
The question remains if preplanning to obtain an optimal fit of the prosthetic components as we have done so far, should not be replaced by planning with the primary aim to biomechanically optimize the geometrical relations of the hip joint for favourable dynamic loads (i.e. seeking for a combination of lever arms in the artificial hip joint that lead to low hip joint contact forces). The choice to first explore “optimal fit” planning had two reasons: The first reason is that the current way of preoperative planning mostly resembles “optimal fit” planning. Sizing of the prosthetic components is primarily determined by the shape of the acetabulum and proximal femoral medullary canal, which puts optimization of the dynamic biomechanical relations – such as constructing the most favourable lever arms – of the hip joint to second place. This seems to be a wise choice since analogue preoperative planning lacked the accuracy to justify more rigorous primarily biomechanically based reconstructions. After all, most orthopedic surgeons who engage in preoperative planning value it mostly because they regard it as an essential pre-theatre preparation of surgery to prevent intra-operative surprises, and not because of exact prediction of outcome. The second reasons is that – even if accuracy of preoperative planning is substantially increased – the choice for “optimal fit” planning makes sense. Seeking to optimize the bone-implant interface by choosing the best fitting implant with the least destruction of bony structures is thought to be desirable, and correlates with good long-term follow-up results.12;13
On the other hand, it can be reasoned that strength and quality of the interface are just one factor in a multifactorial mechanism which determines the success or failure of an implant. Favourable biomechanics of the artificial joint might be just as important or even more important. It could reduce the forces acting upon the interfaces and reduce the velocity of wearing out of the cup. Despite the attractiveness of this approach, it remains to be clarified what is actually favourable and what is unfavourable? Should the orthopedic surgeon try to restore the patients’ own anatomy, or perhaps try to copy the geometric relations of the contralateral side 10;14, or is the fact that the patient already has developed arthrosis of the hip an indication that his own anatomy should not serve as a reference? Can the orthopedic surgeon use a set of rules of thumb, such as medialization of the cup, preventing cranialisation of the centre of rotation, and restoration of the femoral offset 15-21, or should he be using individualized modelling techniques to define the optimal balance of several parameters in each patient?22-24 And if so, how can widely implementable two-dimensional biomechanical plans be extracted from the complex three-dimensional reality? With this approach the
Chapter 8 - General discussion
126
preoperative planning seems to evolve more and more into an exact science, although the ability of the orthopedic surgeon to translate this exact science into exact results remains an uncertain factor. Surgery with the aid of navigation systems aim to solve this 25;26, but before we know the answer to the questions posed above, how do we know in which direction we should navigate?
Future research 2.
While the accuracy of preoperative planning increases, the question arises if they could be used for the purpose of stock control in order to reduce the financial burden for hospitals and society of the growing stocks.27;28 The main purpose would then be to accurately predict the type of implant (for example lateralized versus non-lateralized stems) and component sizes which are needed. Cost reduction through this route is dependent on several factors. On the level of the manufacturer it depends on the percentage of clients which participate in standard preplanning of components. On the level of the hospital it depends on the type of agreement on implant supply between manufacturer and clinic and indirect costs such as inventory space and insurance policies, as well as the price reduction which the manufacturer is willing to offer for participation in a preplanning programme. In conclusion, the study question that is to be answered is: how much cost reduction at the various levels can be achieved by implementation of different stock control strategies?
Future research 3.
It would be valuable to enhance the reliability and validity of other measurements than wear of all-polyethylene cups. A necessary next step would be to explore the possibilities of wear measurements on metal backed cups. In these cups the validity of the measurements is not as much an issue as in all-polyethylene cups, but the reliability of the measurements certainly is. Automatic edge detection algorithms might prove to be valuable in enhancing the reliability of the results.29 Other measurements which deserve the attention are cup migration, stem subsidence and osteolysis measurements, since they also are related to long term success of the THR.30-38 Of these, the migration and subsidence measurements might be approached using similar models as have been used in our studies for enhancing validity of wear measurements, since the main threat to validity is again posed by radiographic two-dimensional projection differences. Enabling digital osteolysis measurements using conventional radiographs is probably the most challenging of all, but may be a solution to the low reliability of human visual assessments.39 First of all, only part of the osteolysis can be visualized on a two-dimensional projection.40 Secondly, differences in intensity of radiation and radiation absorbing tissues would probably force us to implement a new kind of calibration
Chapter 8 - General discussion
127
tool. With the extension of reliable and valid measurements it might be possible to construct more accurate prediction and diagnostic models for survival or failure of an implant, which is of interest to both the scientific community, and to the clinician involved in individual patient care.
Conclusions
1. We can correct for the magnification factor of pelvic x-rays with good accuracy (Chapters 2 and 3). We have reduced the width of range of errors from 16% to 6% using the most recent study results, although we think there still is room for improvement.
2. Digital preoperative planning compared slightly favourable to analogue planning (Chapters 4 and 5). The differences were only small, but it should be kept in mind that these results have been obtained using the first calibration protocol, which had a 95% margin of error of 6% to 12%.
3. Two-dimensional wear measurements on all-polyethylene cups can mathematically be enhanced (Chapters 6 and 7). Using the algorithm which was developed during this study alters conventional linear wear measurements in such a way that they are no longer greatly affected by projectional differences of the THR at reference and follow-up radiographs.
Chapter 8 - General discussion
128
Chapter 8 - General discussion
Reference List
1. Sector Health Sciences. Elektronische patiëntendossiers in Nederlandse ziekenhuizen. Available at: http://www.ey.nl/download/publicatie/elektronische-patientendossiers.pdf. Accessed May 6, 2006.
2. Healthcare Informatics Online. An action PACS-market. Available at: http://www.healthcare-informatics.com/issues/2005/11_05/cover_baldwin.htm. Accessed May 6, 2006.
3. Amstutz HC, Campbell P, Kossovsky N, Clarke IC. Mechanism and clinical significance of wear debris-induced osteolysis. Clin.Orthop. 1992;7-18.
4. Dowd JE, Sychterz CJ, Young AM, Engh CA. Characterization of long-term femoral-head-penetration rates. Association with and prediction of osteolysis. J.Bone Joint Surg.Am. 2000;82-A:1102-07.
5. Kobayashi S, Terayama K. Factors influencing survival of the socket after primary low-friction arthroplasty of the hip. Arch.Orthop.Trauma Surg. 1993;112:56-60.
6. Orishimo KF, Claus AM, Sychterz CJ, Engh CA. Relationship between polyethylene wear and osteolysis in hips with a second-generation porous-coated cementless cup after seven years of follow-up. J.Bone Joint Surg.Am. 2003;85-A:1095-99.
7. Sochart DH. Relationship of acetabular wear to osteolysis and loosening in total hip arthroplasty. Clin.Orthop.Relat Res. 1999;135-50.
8. Gorski JM, Schwartz L. A device to measure X-ray magnification in preoperative planning for cementless arthroplasty. Clin.Orthop. 1986;302-06.
9. Conn KS, Clarke MT, Hallett JP. A simple guide to determine the magnification of radiographs and to improve the accuracy of preoperative templating. J.Bone Joint Surg.Br. 2002;84-B:269-72.
10. Capello WN. Preoperative planning of total hip arthroplasty. Instr.Course Lect. 1986;35:249-57.
11. Pedersen DR, Brown TD, Hillis SL, Callaghan JJ. Prediction of long-term polyethylene wear in total hip arthroplasty, based on early wear measurements made using digital image analysis. J.Orthop.Res. 1998;16:557-63.
12. Kadoya Y, Kobayashi A, Ohashi H. Wear and osteolysis in total joint replacements. Acta Orthop.Scand.Suppl 1998;278:1-16.
13. Manley MT, D’Antonio JA, Capello WN, Edidin AA. Osteolysis: a disease of access to fixation interfaces. Clin.Orthop. 2002;129-37.
14. Schmalzried TP. Preoperative templating and biomechanics in total hip arthroplasty. Orthopedics 2005;28:s849-s851.
15. Lengsfeld M, Bassaly A, Boudriot U, Pressel T, Griss P. Size and direction of hip joint forces associated with various positions of the acetabulum. J.Arthroplasty 2000;15:314-20.
Chapter 8 - General discussion
129
Chapter 8 - General discussion
16. Antolic V, Iglic A, Herman S, Srakar F, Iglic VK, Lebar AM et al. The required resultant abductor force and the available resultant abductor force after operative changes in hip geometry. Acta Orthop.Belg. 1994;60:374-77.
17. Davey JR, O’Connor DO, Burke DW, Harris WH. Femoral component offset. Its effect on strain in bone-cement. J.Arthroplasty 1993;8:23-26.
18. Doehring TC, Rubash HE, Shelley FJ, Schwendeman LJ, Donaldson TK, Navalgund YA. Effect of superior and superolateral relocations of the hip center on hip joint forces. An experimental and analytical analysis. J.Arthroplasty 1996;11:693-703.
19. Iglic A, Antolic V, Srakar F. Biomechanical analysis of various operative hip joint rotation center shifts. Arch.Orthop.Trauma Surg. 1993;112:124-26.
20. Lengsfeld M, Bassaly A, Boudriot U, Pressel T, Griss P. Size and direction of hip joint forces associated with various positions of the acetabulum. J.Arthroplasty 2000;15:314-20.
21. Rosler J, Perka C. The effect of anatomical positional relationships on kinetic parameters after total hip replacement. Int.Orthop. 2000;24:23-27.
22. Heller MO, Bergmann G, Deuretzbacher G, Durselen L, Pohl M, Claes L et al. Musculo-skeletal loading conditions at the hip during walking and stair climbing. J.Biomech. 2001;34:883-93.
23. Iglic A, Kralj-Iglic V, Daniel M, Macek-Lebar A. Computer determination of contact stress distribution and size of weight bearing area in the human hip joint. Comput.Methods Biomech.Biomed.Engin. 2002;5:185-92.
24. Ipavec M, Brand RA, Pedersen DR, Mavcic B, Kralj-Iglic V, Iglic A. Mathematical modelling of stress in the hip during gait. J.Biomech. 1999;32:1229-35.
25. Kalteis T, Handel M, Herold T, Perlick L, Baethis H, Grifka J. Greater accuracy in positioning of the acetabular cup by using an image-free navigation system. Int.Orthop. 2005;29:272-76.
26. Nogler M, Kessler O, Prassl A, Donnelly B, Streicher R, Sledge JB et al. Reduced variability of acetabular cup positioning with use of an imageless navigation system. Clin.Orthop.Relat Res. 2004;159-63.
27. Healy WL, Iorio R, Ko J, Appleby D, Lemos DW. Impact of cost reduction programs on short-term patient outcome and hospital cost of total knee arthroplasty. J.Bone Joint Surg.Am. 2002;84-A:348-53.
28. Iorio R, Healy WL, Kirven FM, Patch DA, Pfeifer BA. Knee implant standardization: an implant selection and cost reduction program. Am.J.Knee.Surg. 1998;11:73-79.
29. Shaver SM, Brown TD, Hillis SL, Callaghan JJ. Digital edge-detection measurement of polyethylene wear after total hip arthroplasty. J.Bone Joint Surg.Am. 1997;79:690-700.
30. Freeman MA. Acetabular cup migration: prediction of aseptic loosening. J.Bone Joint Surg.Br. 1997;79:342-43.
Chapter 8 - General discussion
130
Chapter 8 - General discussion
31. Karrholm J, Borssen B, Lowenhielm G, Snorrason F. Does early micromotion of femoral stem prostheses matter? 4-7-year stereoradiographic follow-up of 84 cemented prostheses. J.Bone Joint Surg.Br. 1994;76:912-17.
32. Krismer M, Stockl B, Fischer M, Bauer R, Mayrhofer P, Ogon M. Early migration predicts late aseptic failure of hip sockets. J.Bone Joint Surg.Br. 1996;78:422-26.
33. Krismer M, Biedermann R, Stockl B, Fischer M, Bauer R, Haid C. The prediction of failure of the stem in THR by measurement of early migration using EBRA-FCA. Einzel-Bild-Roentgen-Analyse-femoral component analysis. J.Bone Joint Surg.Br. 1999;81:273-80.
34. Stocks GW, Freeman MA, Evans SJ. Acetabular cup migration. Prediction of aseptic loosening. J.Bone Joint Surg.Br. 1995;77:853-61.
35. Walker PS, Mai SF, Cobb AG, Bentley G, Hua J. Prediction of clinical outcome of THR from migration measurements on standard radiographs. A study of cemented Charnley and Stanmore femoral stems. J.Bone Joint Surg.Br. 1995;77:705-14.
36. Amstutz HC, Campbell P, Kossovsky N, Clarke IC. Mechanism and clinical significance of wear debris-induced osteolysis. Clin.Orthop. 1992;7-18.
37. Chiang PP, Burke DW, Freiberg AA, Rubash HE. Osteolysis of the pelvis: evaluation and treatment. Clin.Orthop.Relat Res. 2003;164-74.
38. Cooper RA, McAllister CM, Borden LS, Bauer TW. Polyethylene debris-induced osteolysis and loosening in uncemented total hip arthroplasty. A cause of late failure. J.Arthroplasty 1992;7:285-90.
39. Engh CA, Jr., Sychterz CJ, Young AM, Pollock DC, Toomey SD, Engh CA, Sr. Interobserver and intraobserver variability in radiographic assessment of osteolysis. J.Arthroplasty 2002;17:752-59.
40. Claus AM, Engh CA, Jr., Sychterz CJ, Xenos JS, Orishimo KF, Engh CA, Sr. Radiographic definition of pelvic osteolysis following total hip arthroplasty. J.Bone Joint Surg.Am. 2003;85-A:1519-26.

Summary
Chapter 9 - Summary
132
The total hip replacement can be considered one of the most successful orthopedic surgical interventions: survival of total hip replacements is more than 90% at 10 years follow-up. If the immediate postoperative phase is successful, (aseptic) loosening is still the main challenge to overcome. Advances in preoperative planning and postoperative monitoring may aid in further optimization of clinical results of the total hip replacement.
For accurate preoperative planning of hip surgery, accurate correction of the magnification of hip and pelvic radiographs is a prerequisite. So far, no validated method exists to accomplish this.In Chapter 2 we present the validation of geometrical models of the x-ray projection of spheres, relevant to modelling the calibration procedure to correct for the radiographic magnification. Using the geometrical models, magnification factors could be predicted with a maximum margin of error of 1.5%. With help of these models a calibration protocol was developed. The validity and precision of this procedure was determined in a preliminary clinical series (N = 25), and resulted in correction of magnification with a 95% margin of error of –3% to +3%.This was judged to be accurate enough to implement the calibration protocol in clinical practice. However, the clinical results of two large series for the studies on preoperative planning gave rise to doubt whether the calibration protocol was as effective as in the small validation series. In Chapter 3 this calibration protocol was reassessed and a more accurate method for correction of magnification of pelvic x-rays was developed.The old method is based on estimating the position of the hip joint by palpation of the greater trochanter. Its 95% margin of error was shown to be -8% to +5% in this larger series (N = 99). In addition it was experienced to be difficult to execute reliably in clinical practice.A new method, based on predictor variables obtained at physical examination, was developed. Prediction equations were constructed using regression analysis. The mean absolute error in predicting the height of the hip joint centre using the old method was 20 mm (range -79 mm to +46 mm). This was 11 mm for the new method (-32 mm to +39 mm).It was concluded that the newly developed prediction equation is a more accurate method for predicting the height of the hip joint centre for correction of magnification of pelvic x-rays. Future studies will have to quantify a possible gain in accuracy of preoperative planning.
In Chapter 4 we describe a study comparing the accuracy of digital with analogue preoperative plans for 173 primary total hip and 65 knee arthroplasties. The calibration protocol for correction of magnification as developed in Chapter 2 was used in this study. Digital plans of total knee replacements proved to be reliable (κ-values 0.63
Chapter 9 - Summary
133
to 0.75) and superior in accuracy when compared with analogue plans (percentage correct digital plans for femoral and tibial component: 92% and 94%; percentage correct analogue plans for femoral and tibial component: 64% and 69%). For total hip replacements the results of digital planning were less reliable (κ-values 0.22 to 0.54) and failed to outperform analogue plans (percentage correct digital plans for cemented cup and stem: 72% and 79%; uncemented cup and stem: 52% and 66%; percentage correct analogue plans for cemented cup and stem: 73% and 89%; uncemented cup and stem: 64% and 52%). An explanation of these results could follow from a limitation of this study, as a consequence of software problems: the analogue plans were made by the operating surgeon, while the digital plans were not, nor was the data available to him. This might have influenced the results in the main series in favour of the analogue procedure.
After further development of the software, conduction of a randomized clinical trial was possible. In Chapter 5 the RCT comparing both clinical and technical results of digital preoperative plans for primary total hip arthroplasties with the results after analogue planning is reported.All plans, either digital or analogue, were constructed on standardized radiographs by the surgeon who performed the arthroplasty the next day. The main outcome was accuracy of the preoperative plan in terms of predicting the correct sizing. Secondary outcomes were operation time and a radiographic assessment of the arthroplasty.Digital preoperative plans were more accurate in planning the cup (81% vs. 69%) and scored higher on the postoperative radiological assessment of cemented cup and stem components (0% vs. 10% unsatisfactory results). The other comparisons did not reach statistical significance. We can conclude that digital plans slightly outperform analogue plans, although the difference is not as large as in planning of total knee replacements. In future studies more accurate calibration methods (such as the method developed in Chapter 3) should be used. Room for improvement might also be found in better neutralization of femoral anteversion and implant dependent factors.
In Chapter 6 a first exploration of possibilities to make two-dimensional radiographic wear measurements of all-polyethylene cups more accurate is described. The irregularity of wear patterns seen during individual patient follow up may result from differences in radiographic projection of the components between different radiographs.The measurement errors which occur when projecting a three-dimensional prosthesis as a two-dimensional image were geometrically modelled. Based on this model a method was developed to reverse this process.The influence of pelvic position on validity of wear measurements was investigated in a study using a cadaveric pelvis. Without correction measurement errors exceeded 0.2 mm if differences in cup projection were as small as 5°. When using the described correction method, cup positioning differences could be more than 20° before introducing measurement errors exceeding 0.2 mm.
Chapter 9 - Summary
134
Chapter 9 - Summary
We conclude that the correction method results in wear measurements which are less sensitive to radiographic projection differences.
In Chapter 7 the correction method as described in chapter 6 was tested in a virtual computer simulation and used in a clinical series of patients. An error analysis was performed by virtually simulating 144 wear measurements with and without application of the correction. The mean absolute error of raw measurements was reduced from 1.8 mm (range 0 to 4.51 mm) to 0.11 mm (range 0 to 0.27 mm), while failure to meet the model assumptions did not result in large errors. For clinical validation RSA was performed on 47 patients with a THR to determine the true wear at 1, 2 and 5 years postoperatively. Then, the wear was measured on conventional radiographs with and without the correction. In this clinical series, the occurrence of errors greater than 0.2 mm was reduced from 35% to 15% by application of the correction method.In conclusion, we have developed a technique that results in measurement values that are both more valid and less sensitive to differences in two-dimensional projection of the prosthesis. The technique is easily implementable in all existing two-dimensional wear measurement applications.
The aim of this thesis was to create a scientific foundation for studying the possibilities of preoperative planning and postoperative measurements on total hip replacements. A common theme in all our studies was the possibility to implement the results in daily practice of both specialized and non-specialized orthopedic centres. In other words, the results of this study can be used in clinical settings just using a standard PC and commonly available radiographs.
We conclude that:1. We can correct for the magnification factor of pelvic x-rays with good accuracy,
although there still is room and need for improvement.2. Digital preoperative planning compared slightly favourable to analogue
planning, although the differences were only small.3. two-dimensional wear measurements on all-polyethylene cups can
mathematically be enhanced. Using a correction method alters conventional linear wear measurements in such a way that they are no longer greatly affected by projectional differences of the prosthesis at reference and follow-up radiographs.

Nederlandse samenvatting
Chapter 10 - Nederlandse samenvatting
136
De totale heuparthroplastiek mag worden beschouwd als een van de meest succesvolle orthopedische chirurgische ingrepen: overleving van de totale heupprothese is 10 jaar postoperatief meer dan 90%. Als de direct postoperatieve fase succesvol verloopt, is (aseptische) loslating het te overkomen probleem op langere termijn. Verbeteringen in preoperatieve planning en postoperatieve monitoring kunnen bijdragen aan optimalisatie van de resultaten van THA.Voor een nauwkeurige preoperatieve planning van heupchirurgie is een nauwkeurige correctie van de vergrotingsfactor van het heupgewricht op bekkenoverzichtsopnames een voorwaarde. Tot op heden was hiervoor geen gevalideerde methode beschikbaar.In Hoofdstuk 2 presenteren wij de validatie van geometrische modellen van de röntgenprojectie van bolvormige objecten, waarmee het calibratieproces bestudeerd kan worden. De vergrotingsfactor kon met de geometrische modellen worden voorspeld met een maximale fout van 1,5%. Met behulp van deze modellen werd een nieuw calibratieprotocol ontwikkeld. De validiteit en precisie van dit protocol werden onderzocht in een klinische serie (N = 25) had een 95% foutmarge van –3% tot +3%.Dit werd voldoende nauwkeurig geacht voor implementatie in de klinische praktijk. De klinische resultaten van twee grote series over preoperatieve planningen waren echter aanleiding tot twijfel over de effectiviteit van het protocol. Mogelijkerwijs is de foutmarge van het protocol onderschat in de kleine validatieserie.
In Hoofdstuk 3 werd het calibratieprotocol in een grotere serie (N = 99) geëvalueerd en vervolgens werd een nauwkeurigere methode te ontwikkeld.Het oude protocol is gebaseerd op het schatten van de anteroposterieure positie van het heupgewricht door palpatie van de trochanter major. In deze grotere serie bleek de 95% foutmarge –8% tot +5% te zijn. Tevens is het protocol niet eenvoudig om betrouwbaar uit te voeren in de klinische praktijk.Er werd een nieuwe methode ontwikkeld die gebaseerd is op voorspellende variabelen welke uit het lichamelijk onderzoek kunnen worden verkregen. Voorspellende vergelijkingen werden geconstrueerd met behulp van regressie-analyse. De gemiddelde absolute fout in voorspelling van de positie van het centrum van het heupgewricht met de oude methode was 20 mm (range –79 mm tot +46 mm). Dit werd teruggebracht tot 11 mm (range –32 mm tot +39 mm) met de nieuwe methode.Geconcludeerd kan worden dat de nieuwe methode op basis van voorspellende vergelijkingen betrouwbaarder is dan de huidige methode. Verder onderzoek moet uitwijzen of dit leidt tot een toename van nauwkeurigheid in preoperatieve planningen.
In Hoofdstuk 4 beschrijven we een studie waarmee de nauwkeurigheid word bepaald van digitale versus analoge preoperatieve planningen van totale knie arthroplastieken en totale heup arthroplastieken.De digitale planningen van de totale knie arthroplastieken bleken betrouwbaar (κ-waarden 0,63 tot 0,75) en nauwkeuriger dan de analoge planningen (percentage
Chapter 10 - Nederlandse samenvatting
137
correct voor femur- en tibiacomponent: 92% en 94%; percentage correct voor femur- en tibiacomponent: 64% en 69%). Digitale planningen van de totale heuparthroplastieken waren minder betrouwbaar (κ-waarden 0,22 tot 0,54) en waren niet beter dan de analoge planningen (percentage correct voor gecementeerde kom en steel: 72% en 79%; ongecementeerde kom en steel: 52% en 66%; percentage correct voor gecementeerde kom en steel: 73% en 89%; ongecementeerde kom en steel: 64% en 52%). De verklaring voor dit laatste resultaat ligt allicht in een tekortkoming van deze studie: het analoge plan werd gemaakt door de opererende orthopeed, terwijl het digitale plan door iemand buiten het opererende team werd gemaakt en deze data niet beschikbaar was voor de orthopeed. Dit kan de resultaten ten gunste van de analoge procedure hebben beïnvloed.
Na verdere ontwikkeling van de software was het mogelijk deze in te zetten in een gerandomiseerde klinische trial. In Hoofdstuk 5 wordt deze studie beschreven waarbij klinische en technische resultaten werden vergeleken van primaire totale heuparthroplastieken die ofwel digitaal ofwel analoog waren gepland.Alle planningen, zowel digitaal als analoog, werden gemaakt op gestandaardiseerde röntgenfoto’s door de opererende orthopedisch chirurg. Het primaire eindpunt was de nauwkeurigheid van het preoperatieve plan. Secundaire eindpunten waren operatietijd en een radiologische evaluatie van de arthroplastiek.Digitale preoperatieve planningen waren nauwkeuriger in het plannen van de heupkom (81% vs. 69%) en scoorden hoger op de postoperatieve radiologische evaluatie wat betreft de gecementeerde prothesen (0% vs. 10% slecht resultaat). De overige vergelijkingen leverden geen statistische significantie op.We concluderen dat digitale planningen wel nauwkeuriger zijn dan analoge planningen, hoewel de grootte van het verschil niet zo duidelijk is als bij knieprothesen. Bij toekomstige studies dienen nauwkeurigere calibratieprotocollen (zoals beschreven in Hoofdstuk 3) gebruikt te worden. Verdere verbetering van resultaten kan verkregen worden door betere neutralisatie van anteversie van het femur en via implantaat-gerelateerde factoren.
In Hoofdstuk 6 worden de mogelijkheden onderzocht om tweedimensionale radiologische slijtagemetingen aan polyethyleenkommen nauwkeuriger te maken. De onregelmatigheid in de slijtagepatronen bij individuele follow-up van totale heupprotheses kan geweten worden aan verschillen in radiografische projecties van de prothese bij verschillende röntgenfoto’s. In dit hoofdstuk wordt beschreven hoe een correctiemethode om deze bron van fouten aan te pakken werd ontwikkeld en getest. De meetfouten die optreden bij projectieverschillen doordat de prothese verschillend wordt gepositioneerd, werden gemodelleerd. Op basis van dit model werd een methode ontwikkeld dat in staat is dit fout-inducerende proces om te keren.De invloed van positionering van de patiënt op validiteit van slijtagemetingen werd onderzocht in een kadaverstudie. Meetfouten groter dan 0.2 mm kwamen voor, als de
Chapter 10 - Nederlandse samenvatting
138
Chapter 10 - Nederlandse samenvatting
cups met 5° verschil werden gepositioneerd. Met toepassing van de correctiemethode was een positioneringsverschil groter dan 20° mogelijk, voordat een fout van 0,2 mm optrad.Concluderend resulteerde de correctiemethode in slijtagemetingen die minder gevoelig waren voor radiografische projectieverschillen.
In Hoofdstuk 7 wordt de correctiemethode zoals beschreven in hoofdstuk 6 getest in een computersimulatie en gebruikt in een klinische patiëntenserie.144 slijtagemetingen werden virtueel gesimuleerd met en zonder toepassing van de correctie. De gemiddelde absolute fout werd met de correctiemethode gereduceerd van 1,8 mm (interval 0 tot 4,51) naar 0,11 mm (interval 0 tot 0,27), terwijl het niet voldoen aan de modelaannames zelfs in extreme omstandigheden slechts leidde tot kleine fouten. Voor de klinische validatie van de correctiemethode werd een RSA-serie van 47 patiënten met een totale heuparthroplastiek gebruikt, waarbij de slijtage 1, 2 en 5 jaar postoperatief werd gemeten. Geblindeerd voor deze meetresultaten werd de lineaire tweedimensionale slijtage gemeten op conventionele bekkenoverzichtsopnames met en zonder toepassen van de correctie. Het optreden van meetfouten groter dan 0,2 mm werd teruggebracht van 35% naar 15% door toepassing van de correctie.Concluderend hebben we een techniek ontwikkeld die leidt tot meetresultaten die meer valide en minder gevoelig zijn voor verschillen in two-dimensional projectie van de prothese. De techniek is eenvoudig te implementeren in de bestaande two-dimensional slijtage meetapplicaties.
Het doel van dit proefschrift was om een wetenschappelijke basis te creëren voor het bestuderen van mogelijkheden van preoperatieve planningen en postoperatieve monitoring van totale heuparthroplastieken. Een gemeenschappelijk thema in elke studie in dit proefschrift was de mogelijkheid om de resultaten in de dagelijkse praktijk van elke orthopeed (zowel in gespecialiseerde als reguliere centra) te implementeren. Met andere woorden, de studieresultaten kunnen worden gebruikt door een ieder met een standaard PC en algemeen beschikbare röntgenfoto’s.
We kunnen concluderen dat:1. We kunnen nauwkeurig corrigeren voor de vergrotingsfactor van
bekkenoverzichtsopnames, hoewel er nog steeds ruimte voor en behoefte aan verbetering is.
2. Digitale preoperatieve planningen zijn enigszins nauwkeuriger dan analoge planningen van totale heuparthroplastieken, hoewel de verschillen klein zijn.
3. Lineaire slijtagemetingen aan polyethyleenkunstheupkommen kunnen mathematisch worden verbeterd. Het toepassen van het correctie-algoritme waarvan de ontwikkeling en validatie in dit proefschrift word beschreven leidt tot slijtagemetingen die nauwelijks gevoelig zijn voor projectieverschillen tussen uitgangs- en follow-up röntgenfoto.

EpiloogDankwoord
Curriculum Vitae
Chapter 11 - Epiloog, dankwoord, curriculum vitae
140
Van Java naar RotterdamNadat mijn ouders vanuit Indonesië via Duitsland naar Nederland waren gekomen, kwam ik op 15 maart 1974 in Maastricht ter wereld. Al op jonge leeftijd wist ik het: ik zou thorax-chirurg worden (ik was 8 jaar). Ik woonde toen in Nijmegen, maar we zouden snel weer verkassen. Aanvankelijk was het plan om te emigreren naar Australië, maar het werd toch Venlo (Tja…). Ik doorliep daar het gymnasium en vertrok naar Rotterdam om geneeskunde te studeren.
De orthopedische paradoxTijdens de studie kreeg ik de kans om een dagje met een orthopedisch chirurg mee te lopen. Ik trof een orthopeed die met onverhulde desinteresse voor zijn patiënten en hun pathologie de dag als een zak bananen op zijn poli-stoeltje uitzat. Orthopedie was na deze desillusie het eerste vak dat ik van mijn lijstje afstreepte.Na de co-schappen werkte ik kort op de Spoedeisende Hulp in Zwijndrecht en later als zaalarts op de Traumatologie van het LUMC in Leiden. Ik nam een sabbatical om helder te krijgen welk vak ik wilde uitoefenen. Het werkte: ik zou m’n pijlen tòch richten op de Orthopedische Chirurgie.Ik stuurde open sollicitatiebrieven naar heel orthopedisch Nederland. De eerste die reageerde was professor Van Horn van het Academisch Ziekenhuis Groningen…
GroningenEen week later hadden we een gesprek en bood hij me de kans om een jaar fulltime onderzoek te doen. De professor was heel duidelijk: hij zou me na dat jaar vertellen of het een promotie-onderzoek kon worden, of – de keerzijde – dat ik zou moeten vertrekken (het letterlijke citaat was nog iets duidelijker). Professor Van Horn, bedankt voor de mogelijkheid die ik kreeg met dit promotieonderzoek, en voor het vertrouwen dat leidde tot een opleidingsplek in de Orthopedie!
LotgenotenIk kwam op een kamer met Gerben Bulthuis en later Inge Scheek en Bas Knobben. Ik zal Gerben tijdens m’n opleiding nog meemaken als oudere arts-assistent. Ik koester enige hoop dat hij dan nog steeds diezelfde aardige kerel is.Inge Scheek was een bewegingswetenschapper die de rechterhand werd van de andere bewegingswetenschapper en onderzoeks-chef van de Orthopedie, Martin Stevens. Samen bewaken zij de “software”-lijn (gedragsmatige determinanten) van het orthopedische onderzoek.Bas Knobben maakte deel uit van de orthopedische “hardware”-lijn (protheses en infecties). Ironisch genoeg was zijn eigen hardware op zeker moment nergens meer te bekennen; de diefstal van zijn laptop en memorystick (kortom, zijn promotie) kreeg hem niet op de knieën. Hij wist op markante wijze zijn promotie alsnog op tijd af te ronden. Het gebeurt niet vaak dat een promovendus de landelijke dagbladen en het NOS journaal haalt. Bas, het was grandioos om samen met Lars paranimf bij je
Chapter 11 - Epiloog, dankwoord, curriculum vitae
141
promotie te zijn. De beurt is nu aan jou!
PromoverenHet promotie-onderzoek bleek geen saaie, maar wel een taaie kluif. Ik kon me gelukkig beroepen op de inzet en interesse van Ron Diercks. Het leek mij niet mogelijk: een orthopedisch chirurg, zelf in de aanloop naar een eigen leerstoel, die ruime tijd besteed aan het begeleiden van een promovendus? Toch heb je dat voor elkaar gekregen. Ron, ik vind het geweldig dat ik – sinds je aanstelling als bijzonder hoogleraar Sportgeneeskunde – de eerste promovendus ben die jij tot aan de finishlijn van het doctoraat hebt gecoached.Halverwege mijn promotie voegde een biomechanicus, Nico Verdonschot, zich bij mijn promotieteam. Ik las eens een stukje over techneuten (waartoe ik jou ook reken): “Technical people respond to questions in two ways: “It is technically impossible” (meaning: I don’t feel like doing it), or “It depends” (meaning: abandon all hope of a useful answer)”(Scott Adams) Dit gaat níet op voor jou! Onze discussies in huiselijke danwel ziekenhuiselijke sfeer resulteerden altijd in bruikbare extra inzichten. Hadden we dat maar vaker kunnen doen! Nico, het was me een waar genoegen om met een techneut en onderzoeker-pur-sang te hebben samengewerkt.
The BrainiacsMijn tijd in het Brain Center van de orthopedie was een succes. M’n collegae / kamergenoten hadden een belangrijk aandeel in het geheel: Inge Reininga (samen met de andere Inge helaas door een Brain Cel-deling verhuisd), de NP3 (Alette, Natalie en Paul), Oscar en Barbara. Het was gezellig en leerzaam. Ook omdat ik me niet 100% (maar wel 36 uur per week, natuurlijk) blind heb gestaard op mijn eigen onderzoek.Professor Van Horn deelde dezelfde visie en gaf mij zijn fiat om een MSc-opleiding “Clinical Epidemiology” bij het NIHES in Rotterdam te volgen. Opeens belandde ik weer in de collegebanken met twee wannabe kinderartsen, een blonde geneeskundewhizzkid, een wat drukke Zwitserse bijna-internist en een Chinees-Indonesische thoraxchirurg uit Duitsland. Jolt, Brita, Miranda, Michael en Yanto: ik heb een toptijd met jullie gehad!
En opeens was het klaar…De vier jaren vlogen om. Het manuscript werd na een grondige inspectie door de drie heren van de beoordelingscommissie, goedgekeurd. Prof. dr. R.G.T. Geesink, prof. dr. R.P.H. Veth en prof. dr. M. Oudkerk: hartelijk dank voor de inspanningen!Dit was zo’n onderzoek waarbij je aan het einde van de rit pas het gevoel krijgt dat je in de goede versnelling zit. Het 1e jaar had ik vaak het gevoel dat de versnelling in z’n achteruit was beland. Het duurde zelfs anderhalf jaar voordat m’n eerste wetenschappelijke stuk gereed was voor inzending ter publicatie. De oogst daarna kwam exponentieel op gang en betekende keer op keer een kleine overwinning.Wat begonnen was als een verplicht nummertje is nu een dierbare herinnering. Met
Chapter 11 - Epiloog, dankwoord, curriculum vitae
142
veel plezier heb ik het onderzoek (en mezelf als onderzoeker) volwassen zien worden. Met veel plezier heb ik dit proefschrift gestalte gegeven.Inmiddels ben ik alweer doorgeschoven naar een volgende baan. Ik werk op de Algemene Chirurgie van het Martini Ziekenhuis, alwaar de sfeer gelukkig altijd te snijden is.
Tot slotEen aantal andere mensen wil ik nog noemen. Paul J., we hebben wat afgelachen! Niet alleen het ontwikkelen van de prediction rule, maar ook Sander werkte altijd goed op onze lachspieren. Sander, bedankt daarvoor, en tevens succes met het voortzetten van “mijn” onderzoek; je bent de juiste man om het onderzoek verder te tillen. Dennis, we ruilen van werkplek, dus allicht dat we wat kennis van zaken kunnen uitwisselen. Succes met je promotie! Geert, we hebben succesvol een Brug weten te slaan tussen het BME en het Brain Center. We zetten dit gewoon voort in het Martini!
Beste Johan, Anton en Lieske, ik ben een hoop studenten op m’n pad tegengekomen, maar de samenwerking met jullie drie afzonderlijk is me bijgebleven. De betrokkenheid en vasthoudendheid die jullie ieder ten toon hebben gespreid, is ongeëvenaard. Succes met jullie eigen carrièrezetten!
Gunnar Flivik and Håkan Leijon, going to Lund and working at the biomechanics lab was a surprisingly nice change of my daily routine. The little town, the surroundings, but mostly the Swedish people were amazing! I remember a waitress who translated the whole restaurant menu (twice) in flawless English because it was printed in Swedish; where else can you still find this kindness?? It was a pleasure to collaborate with your group!
Prof. Kralj-Iglic, because of time limitations we did not have the chance to finish the paper on biomechanic parameters and wear rates for which you have generously given your time and expertise. I’m confident that by the time you receive this PhD thesis, we will have made substantial progress with the paper.
Maurits Sietsma, we hebben het laatste anderhalf jaar een goede samenwerking gehad bij het bedenken, vormgeven en op papier zetten van enkele onderzoeken. Het waren geen studies voor dit proefschrift, maar het heeft geholpen om mijn horizon te verbreden. Succes met de zware taak die je te wachten staat om je werk als orthopedisch chirurg te combineren met het voltooien van je eigen promotie!
René van der Venne, Linda Mol, Peter van Ooijen, Wisnumurti Kristanto, Roy Stewart, Paola Borzi, Carina Gerritsma, Lex Boerboom, Patrick Maathuis, Robert Wagenmakers, Albert Veldhuizen, Marco Arnold en Sjoerd Bulstra, alsmede de dames van het secretariaat, Els en Jenny, jullie hebben allemaal op verschillende manieren
Chapter 11 - Epiloog, dankwoord, curriculum vitae
143
bijgedragen aan het tot stand komen van dit proefschrift. Bedankt!
Pap, mam, Thomas, Bieke, Barbarosso, Dino, Beau en Tucky, er is een hoop gebeurd in mijn promotietijd; trouwerijen, opstarten van een eigen bedrijf, komst van de 1e kleinzoon. Thomas, terwijl ik een goed moment afwachtte om je te vragen als mijn paranimf, was je me voor: jij en Bieke gaven Sioe Hoey en mij de onverwachte eer om de peetouders van jullie eerste kind te worden. Hopelijk kunnen we aan dit rijtje gedenkwaardigheden over enkele jaren het welverdiende pensioen van een kinderarts en de specialisatie van een orthopedisch chirurg toevoegen!Ik wil jullie en ook mijn schoonfamilie bedanken voor de vanzelfsprekendheid waarmee jullie altijd omgaan met de onmogelijkheden die dit werk soms met zich meebrengt.
Zowel in een auteurslijst, als in een dankwoord is de laatste naamsvermelding een erevermelding. En in dit dankwoord is deze plek voor mijn vrouw, Sioe Hoey. Van 2002 tot 2004 heb je door onze verhuizing naar Groningen voortdurend uit een weekendtas geleefd: twee dagen in Groningen werken, dan twee dagen voor je eigen tandheelkundige specialisatie naar Amsterdam, dan weer een dag in Groningen werken, en in het weekend weer elders in het land. En dat allemaal (bijna) zonder te klagen.Aspiraties om zelf onderzoek te doen had je niet, en ook mijn onderzoeksverhalen konden jouw hart niet sneller doen kloppen. Uiteindelijk ben je zeer betrokken geraakt bij de totstandkoming van dit proefschrift: je hebt de lay-out van dit boekje vakkundig voor je rekening genomen. Je had geen ervaring met de software, zodat het vaak tot na middernacht doorwerken geblazen was. Je viel zelfs eens in slaap tijdens het typen, maar het resultaat is prachtig. Dankjewel!Inmiddels hebben we gelukkig onze rust kunnen vinden. Een eigen huis, luieren in de zitkuil, duiken, tennissen, golfen of pingelen op de piano. Maar van alleen maar rust wordt jij eigenlijk niet gelukkig. Daarom worden nu alweer plannen gesmeed om een jaar naar Australië te gaan. Lijkt me fantastisch: we gaan weer met z’n tweeën op avontuur uit!
Chapter 11 - Epiloog, dankwoord, curriculum vitae
144
List of publications
B. The, L. Mol, R.L. Diercks, P.M.A. van Ooijen, N. VerdonschotCorrection of error in two-dimensional wear measurements of cemented hip arthroplasties.Clin Orthop Relat Res. 2006 Jan;442:180-6.
B. The, R.L. Diercks, R.E. Stewart, P.M.A. van Ooijen, J.R. van HornDigital correction of magnification in pelvic x-rays for preoperative planning of hip joint replacements: Theoretical development and clinical results of a new protocol.Med Phys. 2005 Aug;32(8):2580-9.
B. The, R.L. Diercks, P.M.A. van Ooijen, J.R. van HornComparison of analog and digital preoperative planning in total hip and knee arthroplasties: A prospective study of 173 hips and 65 total knees.Acta Orthop. 2005 Feb;76(1):78-84.
B. The, N. Verdonschot, J.R. van Horn, P.M.A. van Ooijen, R.L. DiercksDigital versus analogue preoperative planning of total hip arthroplasties: A randomized clinical trial of 210 total hip arthroplasties.Accepted for publication in the Journal of Arthroplasty
B. The, G. Flivik, R.L. Diercks, N. VerdonschotA new method to make two-dimensional wear measurements less sensitive to projection differences of cemented total hip replacements on AP radiographsSubmitted to the Journal of Orthopaedic Research
B. The, J.W.J. Kootstra, A.H. Hosman, N. Verdonschot, C.L.E. Gerritsma, R.L. DiercksPrediction of magnification of plain pelvic X-rays for preoperative planning of hip joint surgeryAccepted for publication in the Journal of Digital Imaging
B. The, A.H. Hosman, J.W.J. Kootstra, N.Verdonschot, R.L. Diercks, V. Kralj-IglicThe influence of radiographic biomechanical determinants and RSA-measured wear rates in total hip arthroplastiesSubmitted to the Journal of Biomechanics
P.C. Jutte, S. Wuite, B. ThePrediction of Deformity in Spinal TuberculosisAccepted for publication in Clinical Orthopaedics and Related Research
Chapter 11 - Epiloog, dankwoord, curriculum vitae
145
W.T. Ploeg, A.G. Veldhuizen, B. The, M.S. SietsmaPercutaneous vertebroplasty as a treatment for osteoporotic vertebral compression fractures: A systematic review Accepted for publication in the European Spine Journal
W. Kristanto, P.M.A. van Ooijen, B. The, H. Duifhuis, T.R. Mengko, M. OudkerkDesign and Implementation of Gradient Vector Flow Snake to Detect a Reference Object in Pelvic X-Rays for Preoperative Total Hip Arthroplasty Planning ApplicationAccepted for publication in the Journal of Digital Imaging
The Goran Selvik Award was granted by the European Orthopaedic Research Society to:B. The, G. Flivik, R.L. Diercks, N. VerdonschotA new technique to make two-dimensional wear measurements insensitive to radiographic differences of cemented total hip prostheses: From development to validation.

NORTHERN CENTER for HEALTHCARE RESEARCH (NCH)
This thesis is published within the research program Public Health and Public Health Services Research of the Northern Center for Healthcare Research. More information regarding the institute and its research can be obtained from our internetsite: www.med.rug.nl/nch.
Previous dissertations from the program Public Health and Public Health Services Research:
Jutte PC (2006) Spinal tuberculosis, a Dutch perspective; special reference to surgery.
PROMOTOR: prof dr JR van HornCOPROMOTORES: dr JH van Loenhout-Rooyackers, dr AG Veldhuizen
Leertouwer H (2006) Het heil van de gezonden zij onze hoogste wet; de geschiedenis van de medische afdeling bij de arbeidsinspectie
PROMOTORES: prof dr JW Groothoff, prof dr MJ van Lieburg, prof dr D Post
Jansen DEMC (2006) Integrated care for intellectual disability and multilpe sclerose.
PROMOTORES: prof dr D Post, prof dr JW GroothoffCOPROMOTOR: dr B Krol
Ham I van (2006) De arbeidssatisfactie van de Nederlandse huisartsPROMOTORES: prof dr J de Haan, prof dr JW GroothoffCOPROMOTOR: dr KH Groenier
Jansen GJ (2005) The attitude of nurses towards inpatient aggression in psychiatric care: the development of an instrument.
PROMOTORES: prof dr SA Reijneveld, prof dr ThWN DassenCOPROMOTOR: dr LJ Middel
Post M (2005) Return to work in the first year of sickness absence; an evaluation of the Gatekeeper Improvement Act.
PROMOTOR: prof dr JW Groothoff, prof dr D PostCOPROMOTOR: dr B Krol
Landsman-Dijkstra JJA (2005) Building an effective short healthpromotion intervention; theory driven development, implementation and evaluation of a body awareness program for chronic a-specific psychosomatic symptoms.
PROMOTOR: prof dr JW GroothoffCOPROMOTOR: dr R van Wijck
Bakker RH (2005) De samenwerking tussen huisarts en bedrijfsarts.PROMOTOR: prof dr JW GroothoffCOPROMOTORES: dr B Krol, dr JWJ van der Gulden

Nagyová I (2005) Self-rated health and quality of life in Slovak rheumatoid arthritis patients.
PROMOTOR: prof dr WJA van den HeuvelCOPROMOTOR: dr JP van Dijk
Gerritsma-Bleeker CLE (2005) Long-term follow-up of the SKI knee prosthesis.PROMOTORES: prof dr JR van Horn, prof dr RL DiercksCOPROMOTOR: dr NJA Tulp
Vries M de (2005) Evaluatie Zuidoost-Drenthe HARTstikke goed!; mogelijkheden van community-based preventie van hart-en vaatziekten in Nederland.
PROMOTORES: prof dr D Post, prof dr JW GroothoffCOPROMOTOR: dr JP van Dijk
Jungbauer FHW (2004) Wet work in relation to occupational dermatitis.PROMOTORES: prof dr PJ Coenraads, prof dr JW Groothoff
Post J (2004) Grootschalige huisartsenzorg buiten kantooruren. PROMOTOR: prof dr J de HaanReneman MF (2004) Functional capacity evaluation in patients with chronic low back pain; reliability and validity. PROMOTORES: prof dr JW Groothoff, prof dr JHB Geertzen
COPROMOTOR: dr PU DijkstraBâra-Ionilã C-A (2003) The Romanian health care system in transition from the users’ perspective. PROMOTORES: prof dr WJA van den Heuvel, prof dr JAM Maarse COPROMOTOR: dr JP van DijkLege W de (2002) Medische consumptie in de huisartspraktijk op Urk.
PROMOTORES: prof dr D Post, prof dr JW GroothoffHoekstra EJ (2002) Arbeidsbemiddeling met behulp van Supported Employment als interventie bij de reïntegratie van chronisch zieken; de rol van de arbeidsbemiddelaar, chronisch zieke en werkgever. PROMOTORES: prof dr JW Groothoff, prof dr K Sanders, prof dr WJA van
den Heuvel, prof dr D PostEnk JG van (2002) Determinants of use of healthcare services in childhood.
PROMOTORES: prof dr D Post, prof dr AJP Veerman, prof dr WJA van den Heuvel
Gecková A (2002) Inequality in health among Slovak adolescents. . PROMOTORES: prof dr D Post, prof dr JW Groothoff REFERENT: dr JP van DijkDijk JP van (2001) Gemeentelijk gezondheidsbeleid; omvang en doelgerichtheid.
PROMOTORES: prof dr D Post, prof dr M Herweijer, prof dr JW GroothoffMiddel LJ (2001) Assessment of change in clinical evaluation.
PROMOTOR: prof dr WJA van den HeuvelREFERENT: dr MJL de Jongste

Bijsterveld HJ (2001) Het ouderenperspectief op thuiszorg; wensen en behoeften van ouderen ten aanzien van de thuis(zorg)situatie in Friesland. PROMOTORES: prof dr D Post, prof dr B Meyboom-de Jong
REFERENT: dr J GreidanusDijkstra GJ (2001) De indicatiestelling voor verzorgingshuizen en verpleeghuizen.
PROMOTORES: prof dr D Post, prof dr JW GroothoffDalen IV van (2001) Second opinions in orhopaedic surgery: extent, motives, and consequences.
PROMOTORES: prof dr JR van Horn, prof dr PP Groenewegen, prof dr JW Groothoff
Beltman H (2001) Buigen of barsten? Hoofdstukken uit de geschiedenis van de zorg aan mensen met een verstandelijke handicap in Nederland 1945-2000.
PROMOTORES: prof dr D Post, prof dr AThG van GennepPal TM (2001) Humidifiers disease in synthetic fiber plants: an occupational health study.
PROMOTORES: prof dr JGR de Monchy, prof dr D Post, prof dr JW Groothoff
Goossen WTF (2000) Towards strategic use of nursing information in the Netherlands.
PROMOTORES: prof dr WJA van den Heuvel, prof dr ThWN Dassen, prof dr ir A Hasman
Hospers JJ (1999) Allergy and airway hyperresponsiveness: risk factors for mortality.
PROMOTORES: prof dr D Post, prof dr DS Postma, prof dr ST WeissWijk P van der (1999) Economics: Charon of Medicine? PROMOTORES: prof dr WJA van den Heuvel, prof dr L Koopmans, prof dr
FFH RuttenREFERENT: dr J Bouma
Dijkstra A (1998) Care dependency: an assessment instrument for use in long-term care facilities.
PROMOTORES: prof dr WJA van den Heuvel, prof dr ThWN DassenTuinstra J (1998) Health in adolescence: an empirical study of social inequality in health, health risk behaviour and decision making styles. PROMOTORES: prof dr D Post, prof dr WJA van den Heuvel
COPROMOTOR: dr JW GroothoffMink van der Molen AB (1997) Carpale letsels: onderzoek naar de verzuimaspecten ten gevolgen van carpale letsels in Nederland 1990-1993. PROMOTORES: prof dr PH Robinson, prof WH Eisma COPROMOTOR: dr JW Groothoff
REFERENT: dr GJP VisserMulder HC (1996) Het medisch kunnen: technieken, keuze en zeggenschap in de moderne geneeskunde.

PROMOTOR: prof dr WJA van den HeuvelDekker GF (1995) Rugklachten-management-programma bij de Nederlandse Aardolie Maatschappij B.V.: ontwerp, uitvoering en evaluatie. PROMOTORES: prof dr D Post, prof WH Eisma
COPROMOTOR: dr JW GroothoffPuttiger PHJ (1994) De medische keuring bij gebruik van persluchtmaskers.
PROMOTORES: prof dr D Post, prof dr WJA GoedhardCOPROMOTOR: dr JW Groothoff
Engelsman C & Geertsma A (1994) De kwaliteit van verwijzingen. PROMOTORES: prof dr WJA van den Heuvel, prof dr FM Haaijer-Ruskamp, prof dr B Meyboom-de Jong
Lucht F van der (1992) Sociale ongelijkheid en gezondheid bij kinderen. PROMOTOR : prof dr WJA van den Heuvel
REFERENT: dr JW Groothoff