Embed Size (px)
Citation preview

University of Groningen
Long-Term Neurodevelopmental Outcomes in Children with Biliary AtresiaRodijk, Lyan; Heijer, den, Anne; Hulscher, Jan B.F.; Ziad Alizadeh, Behrooz; Kleine, de,Ruben; Verkade, Henkjan; Bruggink, JannekePublished in:The Journal of Pediatrics
DOI:10.1016/j.jpeds.2019.10.054
IMPORTANT NOTE: You are advised to consult the publisher's version (publisher's PDF) if you wish to cite fromit. Please check the document version below.
Document VersionFinal author's version (accepted by publisher, after peer review)
Publication date:2020
Link to publication in University of Groningen/UMCG research database
Citation for published version (APA):Rodijk, L., Heijer, den, A., Hulscher, J. B. F., Ziad Alizadeh, B., Kleine, de, R., Verkade, H., & Bruggink, J.(2020). Long-Term Neurodevelopmental Outcomes in Children with Biliary Atresia. The Journal ofPediatrics, 217, 118-124.e3. https://doi.org/10.1016/j.jpeds.2019.10.054
CopyrightOther than for strictly personal use, it is not permitted to download or to forward/distribute the text or part of it without the consent of theauthor(s) and/or copyright holder(s), unless the work is under an open content license (like Creative Commons).
The publication may also be distributed here under the terms of Article 25fa of the Dutch Copyright Act, indicated by the “Taverne” license.More information can be found on the University of Groningen website: https://www.rug.nl/library/open-access/self-archiving-pure/taverne-amendment.
Take-down policyIf you believe that this document breaches copyright please contact us providing details, and we will remove access to the work immediatelyand investigate your claim.
Downloaded from the University of Groningen/UMCG research database (Pure): http://www.rug.nl/research/portal. For technical reasons thenumber of authors shown on this cover page is limited to 10 maximum.
Download date: 06-02-2022

1
Long-term neurodevelopmental outcomes in children with biliary atresia
Lyan H. Rodijk 1, MD, Anne E. den Heijer 2, MSc, Jan B.F. Hulscher 1, MD, PhD, Behrooz Z. Alizadeh 3, MD, PhD, Henkjan J. Verkade 2, MD, PhD, Ruben H.J. de Kleine 4, MD, Janneke L.M. Bruggink 1,
MD, PhD 1Section of Pediatric Surgery, Department of Surgery, 2Department of Pediatrics, Beatrix Children’s
Hospital, 3Department of Epidemiology, 4Section of Hepatobiliary Surgery and Liver Transplantation,
Department of Surgery, University of Groningen, University Medical Center Groningen, The
Netherlands
Corresponding author and reprint request author:
J.L.M. Bruggink, MD, PhD
University Medical Center Groningen
Department of Surgery, Division of Pediatric Surgery
Hanzeplein 1
PO Box 30.001
9700 RB Groningen
The Netherlands
Tel: +31 50 3612306
E-mail: [email protected]
Short running title: Neurodevelopmental outcomes in biliary atresia
Key words: liver disease; liver transplantation; motor skills; cognition; IQ; behavior
Funding source: Supported by a grant from the Dutch Digestive Foundation (Maag Lever Darm
Stichting, MLDS).
Financial Disclosure: The authors have no financial relationships relevant to this article to disclose.
Potentional Conflict of Interest: The authors have no conflicts of interest relevant to this article to
disclose.
Prior presentation of study data:
- Oral presentation at the British Association of Paedatric Surgeons (BAPS) Congress 2019
- Oral presentation at the International Liver Transplantation Society (ILTS) Congress 2019
- Poster presentation at the The European Society for Paediatric Gastroenterology Hepatology and
Nutrition (ESPGHAN) Annual Meeting 2019
Abbreviations:
BA – Biliary atresia
IQ – Intelligence quotient
KPE – Kasai porto-enterostomy
LTx – Liver transplantation
2
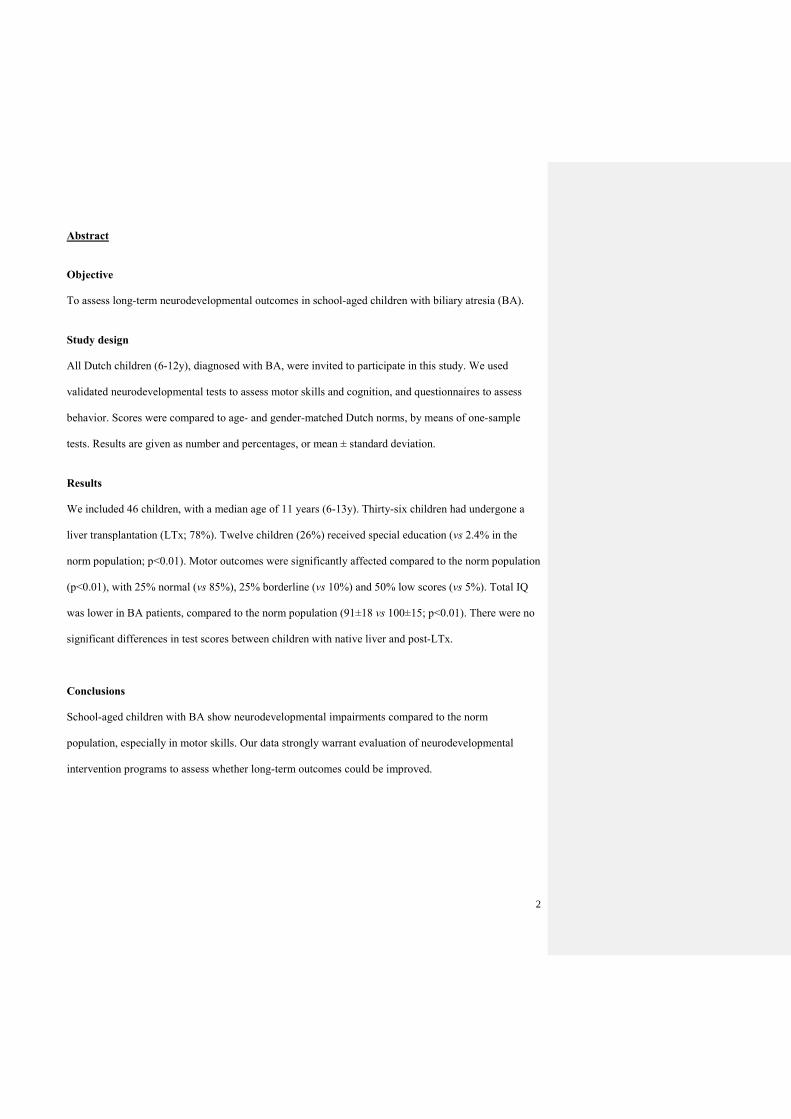
Abstract
Objective
To assess long-term neurodevelopmental outcomes in school-aged children with biliary atresia (BA).
Study design
All Dutch children (6-12y), diagnosed with BA, were invited to participate in this study. We used
validated neurodevelopmental tests to assess motor skills and cognition, and questionnaires to assess
behavior. Scores were compared to age- and gender-matched Dutch norms, by means of one-sample
tests. Results are given as number and percentages, or mean ± standard deviation.
Results
We included 46 children, with a median age of 11 years (6-13y). Thirty-six children had undergone a
liver transplantation (LTx; 78%). Twelve children (26%) received special education (vs 2.4% in the
norm population; p<0.01). Motor outcomes were significantly affected compared to the norm population
(p<0.01), with 25% normal (vs 85%), 25% borderline (vs 10%) and 50% low scores (vs 5%). Total IQ
was lower in BA patients, compared to the norm population (91±18 vs 100±15; p<0.01). There were no
significant differences in test scores between children with native liver and post-LTx.
Conclusions
School-aged children with BA show neurodevelopmental impairments compared to the norm
population, especially in motor skills. Our data strongly warrant evaluation of neurodevelopmental
intervention programs to assess whether long-term outcomes could be improved.

3
Introduction
Biliary atresia (BA) is a rare liver disease of unknown etiology, manifesting in infants within the
first weeks after birth. BA is characterized by obliteration and fibrosis of bile ducts, resulting in
obstructive cholestasis. It is surgically treated by re-establishing the continuity between the portal bile
ducts and the intestine via a Kasai porto-enterostomy (KPE). Despite a successful operation, however,
liver cirrhosis is inevitable in most of the patients, making BA the leading indication for liver
transplantation (LTx) in children.[1–3] BA is increasingly being considered a chronic disease with a
necessity for more knowledge of long-term functional outcomes.
Adequate neurodevelopment is essential for daily functioning and school performance. As early
childhood is a time of critical brain growth, severe liver diseases as BA during this specific age-period
could interfere with neurodevelopment.[4] In addition to the liver disease itself, other factors related to
BA such as surgery, exposure to immunosuppressant treatments and repeated general anesthesia in early
childhood are possibly related to impaired neurodevelopment.[5–7] Moreover, growth deficits and
impaired nutritional status may influence the developing brain.[4,8] This could result in impaired
neurodevelopmental outcomes in several areas of neurodevelopment, such as cognition, behavior and
motor outcome.[4] As recently highlighted, studies on the neurodevelopment of children with chronic
disease are needed to understand the nature of these impairments.[9] Still little is known about the
neurodevelopmental sequelae of BA and possible risk factors for impaired neurodevelopmental
outcomes. Recently, results from the Childhood Liver Disease Research Network showed that infants
with BA, surviving with native liver, had impaired neurodevelopmental outcomes at 12 and 24 months
of age.[10] However, studies on long-term neurodevelopmental outcomes, exclusively including
children with BA, are scarce. Especially data on school performance and motor skills are lacking.
Therefore, the first aim of this study was to assess long-term neurodevelopmental outcomes in Dutch
children with BA at school age; to determine which areas of neurodevelopment are affected and to what

4
degree. The second aim was to identify risk factors associated with impaired neurodevelopmental
outcomes.
Patients and Methods
In the Netherlands, the care for all infants with (congenital) liver disease is centralized in our
center nowadays. Children were selected using the Dutch nationwide database known as Netherlands
Study group of Biliary Atresia, the NeSBAR. All parents/guardians of school-aged children aged 6 to 12
years at time of invitation, who have been diagnosed with BA, were asked to participate in this study.
We choose to include all eligible children with BA, including children with BA who were born
prematurely and children with a history of intracranial hemorrhage, to provide a complete overview of
this patient group. The inclusion period spanned from 2015 to 2018. All children had undergone a KPE
between 2002 and 2012, in one of the seven Dutch academic pediatric surgical centers that performed
this type of surgery at that time. Exclusion criteria for this study were insufficient command of the
Dutch language or no child assent. This study was carried out in accordance with the Declaration of
Helsinki and approved by the ethics committee (METc UMCG 2011/185).
Data collection
After obtaining written informed consent of both parents/guardians, and of children of 12 years
of age, children were scheduled for a neurodevelopmental assessment. A history was taken for each
child, including whether the child had study delay or attended special education and whether the child
had received neurodevelopmental intervention (physiotherapy, speech language therapy, psychology).
For each child, the following parameters were reported: birth weight, history of intracranial hemorrhage,
Biliary Atresia Splenic Malformation syndrome yes/no, age at KPE, clearance (serum bilirubin
concentration <20 µmol/L within 6 months after KPE) yes/no, highest bilirubin level pre-KPE and
during screening LTx, LTx yes/no, age at LTx, major complication after LTx, minimum total times of

5
general anesthetics, already diagnosed psychomotor retardation yes/no, level of education, history of
neurodevelopmental intervention, as well as history of growth failure (SD<2) and growth and weight Z-
scores at time of test assessment. In addition, demographic information on parents was reported, such as
ethnicity and level of education.
Neurodevelopmental outcome measures
We used a carefully selected a validated test battery for the patient, and parental questionnaires,
to assess neurodevelopmental outcomes. The selected tests and questionnaires are widely used in
neuropsychology, both in the Netherlands, as well as worldwide.[4] Multidimensional data on motor
skills, cognition, behavior, and social-emotional development, were assessed by two trained test-
assistants. The Movement Assessment Battery for Children (M-ABC) was applied to assess motor
skills.[11] To assess cognitive outcomes, we used subtests of the Wechsler Intelligence Scale for
Children, 3rd edition in Dutch, as the 4th edition was not available in Dutch (WISC-III-NL; total
intelligence quotient (IQ), verbal IQ and performance IQ).[12] In addition, we used the Test of
Everyday Attention for Children (TEA-Ch; selective attention and inhibition control),[13] Auditory
Verbal Learning Test (AVLT; auditory memory),[14] Beery-Buktenice Developmental Test of Visual-
Motor Integration, 6th edition, (Beery-VMI-6; visuomotor integration),[15] Test of Visual Perceptual
Skills, 3rd edition (TVPS; visual-perceptual abilities),[16] and for children > 8 years of age also the
Behavioural Assessment of the Dysexecutive Syndrome for Children (BADS-C; executive functioning;
planning and strategy formation).[17] The psychometric qualities of all tests are satisfactory.[18–24]
Moreover, to obtain additional information about behavior and executive functioning of the children, the
following parental questionnaires were used: the ADHD questionnaire (ADHD-vragenlijst, AVL, in
Dutch),[25] the Child Behavior Checklist (CBCL) for Children aged 6-18 (internalizing and
externalizing problems),[26] and the Behavior Rating Inventory of Executive Function (BRIEF)

6
questionnaire (executive functions).[27] Children with a known psychomotor retardation, who were not
able to perform neurodevelopmental tests, were included in categorical variables as ‘low’ score.
Data analysis
Data on the measured parameters were investigated for their distribution using standard
descriptive analyses. When data was not normally distributed, the parameter was described by either
medians and its corresponding range of min to max, or percentiles for categorical data. Raw scores were
transformed to age and gender corrected percentiles or Z-scores based on norm data, as supplied by the
test manuals.[11–17,25–27] To provide one outcome for the two TVPS subtests, the mean Z-score was
calculated. In addition, scores were classified as normal (IQ>85; percentile >15), borderline (IQ 70-85;
percentile 6-16) or low (IQ<70; percentile <6), based on the Dutch norm population, in accordance with
the test manual.(9-18) IQ scores and Z-scores were compared to the norm population (IQ 100 ± 15; Z-
score 0 ± 1) by means of either the one-sample T-test for normally distributed data, or the one-sample
Kolmogorov Smirnov test for non-normally distributed data. The categorized outcomes were compared
to the norm population using the chi-square or the Fisher exact test.
To investigate the relation between total IQ or motor score percentile and risk factors, either the
independent sample T-test for dichotomous variables or correlation analysis for continuous variables
was performed in addition to univariate regression analyses. Risk factors with a p-value <0.20 were
included in a multivariate backward stepwise regression analysis. Linear regression analysis was used
for total IQ. As data on motor skills did not fulfil assumptions for linear regression, a logistic regression
model was built for normal/borderline vs low motor scores. Results were checked after multiple
imputations (overall missing data 3%). Effect sizes were calculated by describing the mean difference in
SD of children with BA with that of the general populations [(meanBA-meannorm)/SD].[28] Effect sizes
and study power were calculated using the G*Power program, version 3. An observed p<0.05 was
considered statistically significant. Data was analyzed using IBM SPSS version 23.
7
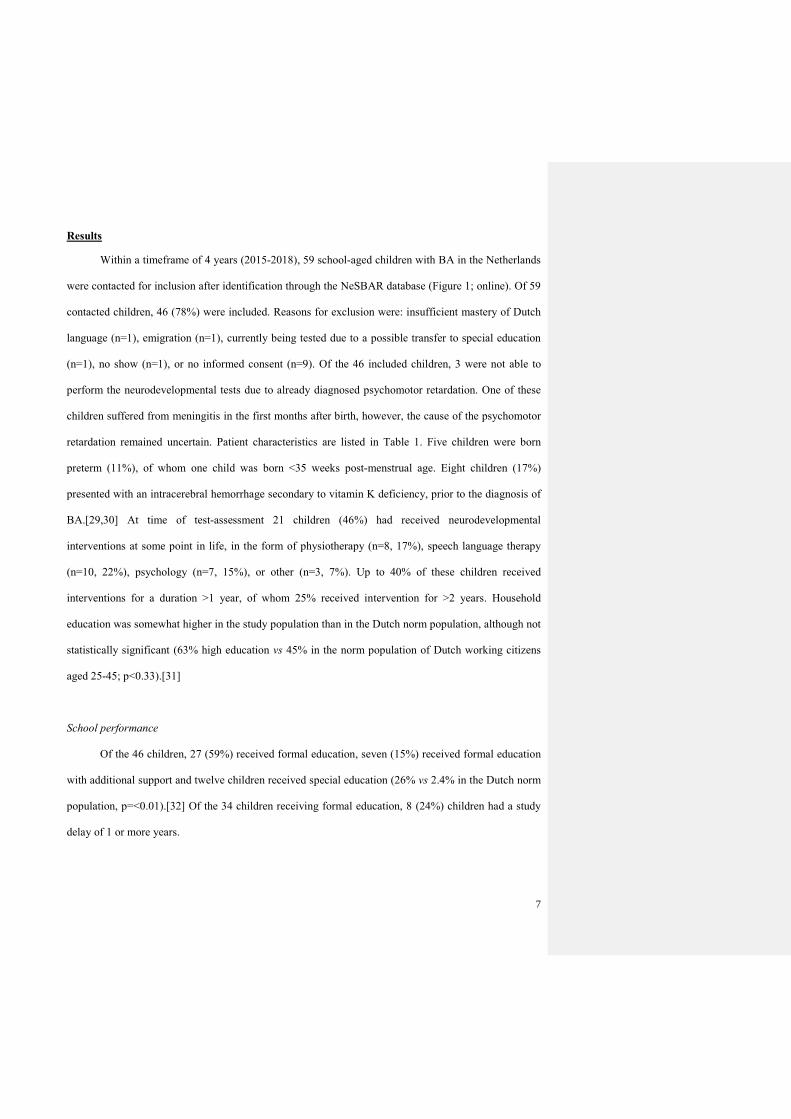
Results
Within a timeframe of 4 years (2015-2018), 59 school-aged children with BA in the Netherlands
were contacted for inclusion after identification through the NeSBAR database (Figure 1; online). Of 59
contacted children, 46 (78%) were included. Reasons for exclusion were: insufficient mastery of Dutch
language (n=1), emigration (n=1), currently being tested due to a possible transfer to special education
(n=1), no show (n=1), or no informed consent (n=9). Of the 46 included children, 3 were not able to
perform the neurodevelopmental tests due to already diagnosed psychomotor retardation. One of these
children suffered from meningitis in the first months after birth, however, the cause of the psychomotor
retardation remained uncertain. Patient characteristics are listed in Table 1. Five children were born
preterm (11%), of whom one child was born <35 weeks post-menstrual age. Eight children (17%)
presented with an intracerebral hemorrhage secondary to vitamin K deficiency, prior to the diagnosis of
BA.[29,30] At time of test-assessment 21 children (46%) had received neurodevelopmental
interventions at some point in life, in the form of physiotherapy (n=8, 17%), speech language therapy
(n=10, 22%), psychology (n=7, 15%), or other (n=3, 7%). Up to 40% of these children received
interventions for a duration >1 year, of whom 25% received intervention for >2 years. Household
education was somewhat higher in the study population than in the Dutch norm population, although not
statistically significant (63% high education vs 45% in the norm population of Dutch working citizens
aged 25-45; p<0.33).[31]
School performance
Of the 46 children, 27 (59%) received formal education, seven (15%) received formal education
with additional support and twelve children received special education (26% vs 2.4% in the Dutch norm
population, p=<0.01).[32] Of the 34 children receiving formal education, 8 (24%) children had a study
delay of 1 or more years.

8
Motor outcomes
Motor outcome was significantly lower (p<0.001) compared to the norm population with 25%
normal (vs 85%), 25% borderline (vs 10%) and 50% low scores (vs 5%). All tested motor domains were
significantly affected, e.g. fine skills, ball skills and balance. Figure 2 shows the motor outcomes
expressed in normal, borderline and low scores. Table 5 (online) provides effect sizes and study power.
Cognitive outcomes
The mean total IQ of children with BA was 91±18, and significantly lower (p=0.002) than in the
Dutch norm population (mean IQ 100±15). The mean performance IQ was 88±18 (p<0.001), and the
mean verbal IQ was 96±17 (p=0.09). When divided into normal, borderline and low scores, children
scored significantly lower when compared to the norm population (Figure 2).
In other cognitive domains, children with BA scored significantly lower on both subtests of
attention (selective attention, Z-score -0.64; p=0.001, and inhibition control, Z-score -0.41; p=0.01),
visuomotor integration (Z-score -0.59; p<0.001), perceptual ability (Z-score -0.40; p=0.01), and
planning (Z-score -0.42; p=0.002). There were no significant differences in verbal short- and long-term
memory, or strategy formation. Age- and gender-matched Z-scores, based on the Dutch norm
population, are displayed in Figure 3.
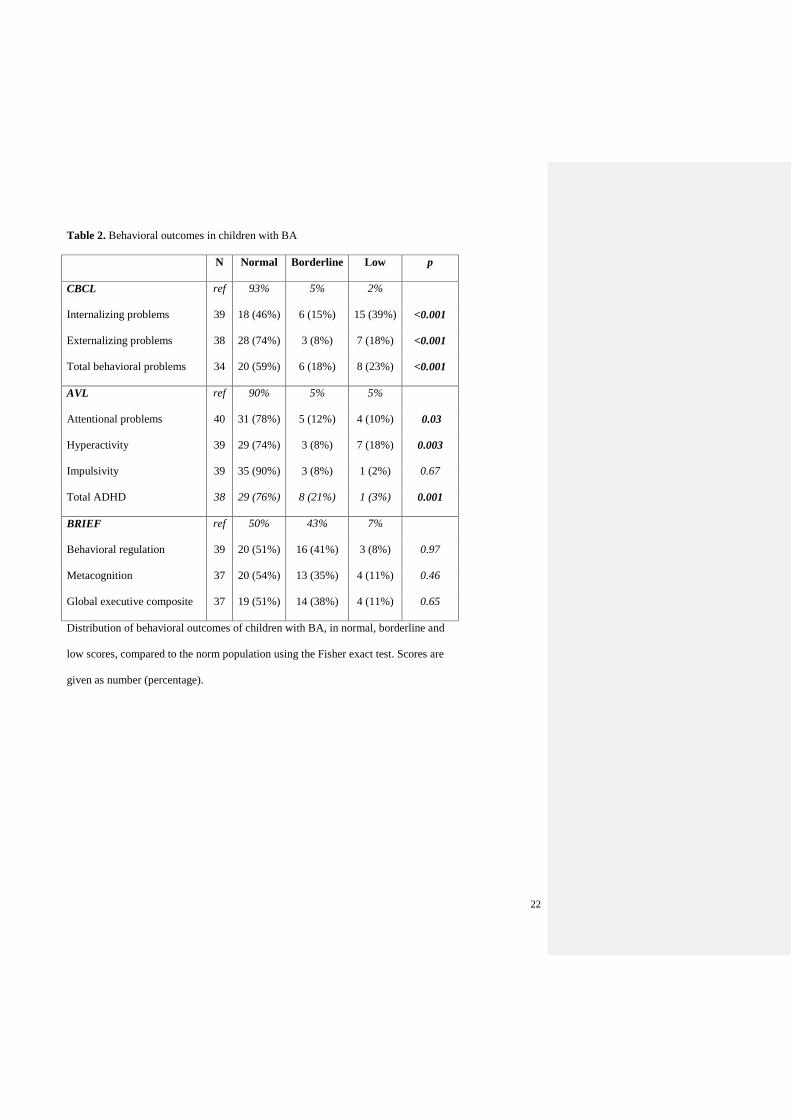
Behavioral outcomes
The parent-reported questionnaires showed significantly more behavioral problems in BA
children, compared to the norm population (Table 2). Parents of children with BA reported a
significantly higher prevalence of overall behavioral difficulties (23% vs norm 2%; p<0.001), attentional
problems (10% vs norm 5%; p=0.005) and hyperactivity (18% vs norm 5%; p=0.003). There were no
significant differences in the impulsivity domain or in executive functioning.

9
Risk factors
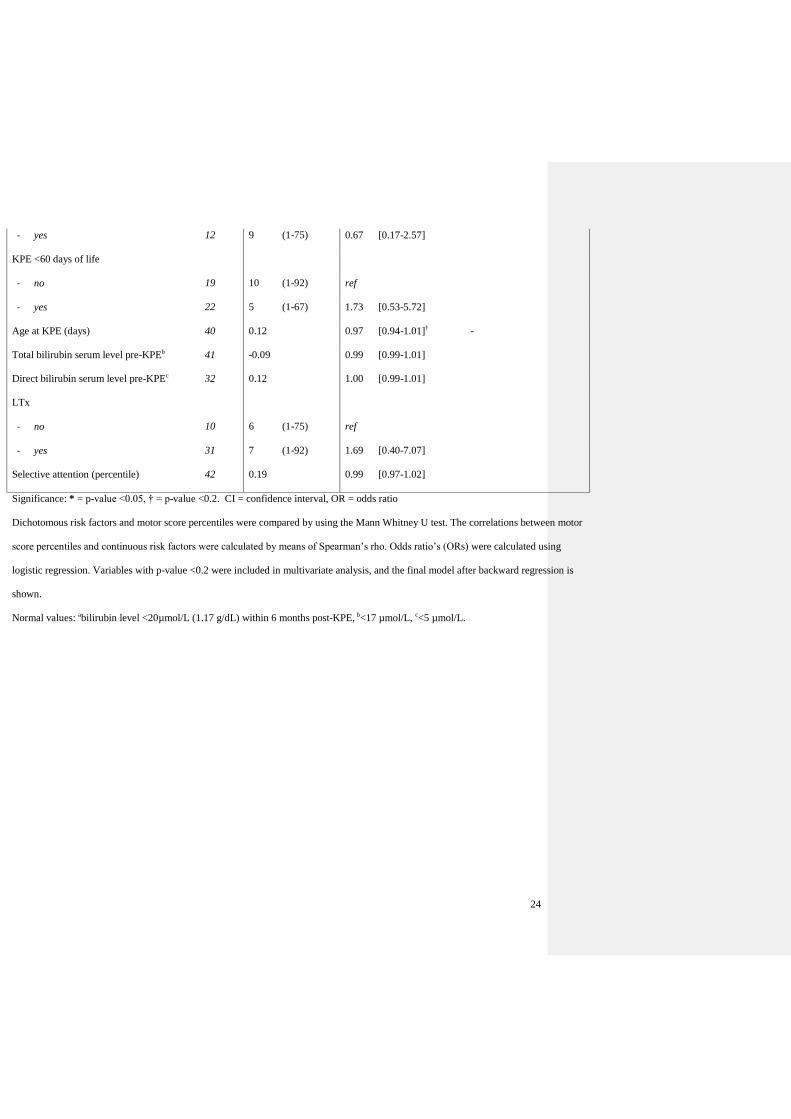
Data on the regression analyses of motor skills are shown in Table 3 (online). Univariate analysis
revealed a significant effect of male gender (OR 4.91, 95% CI 1.33, 18.21; p=0.017) on low motor
skills. The final model after multivariate analysis showed low odds for impaired motor skills in children
with an history of intracranial hemorrhage, although not statistically significant (OR 0.20, 95% CI 0.03,
1.30; p=0.09), and high odds for male gender (OR 5.74, 95% CI 1.45, 22.81; p=0.013).
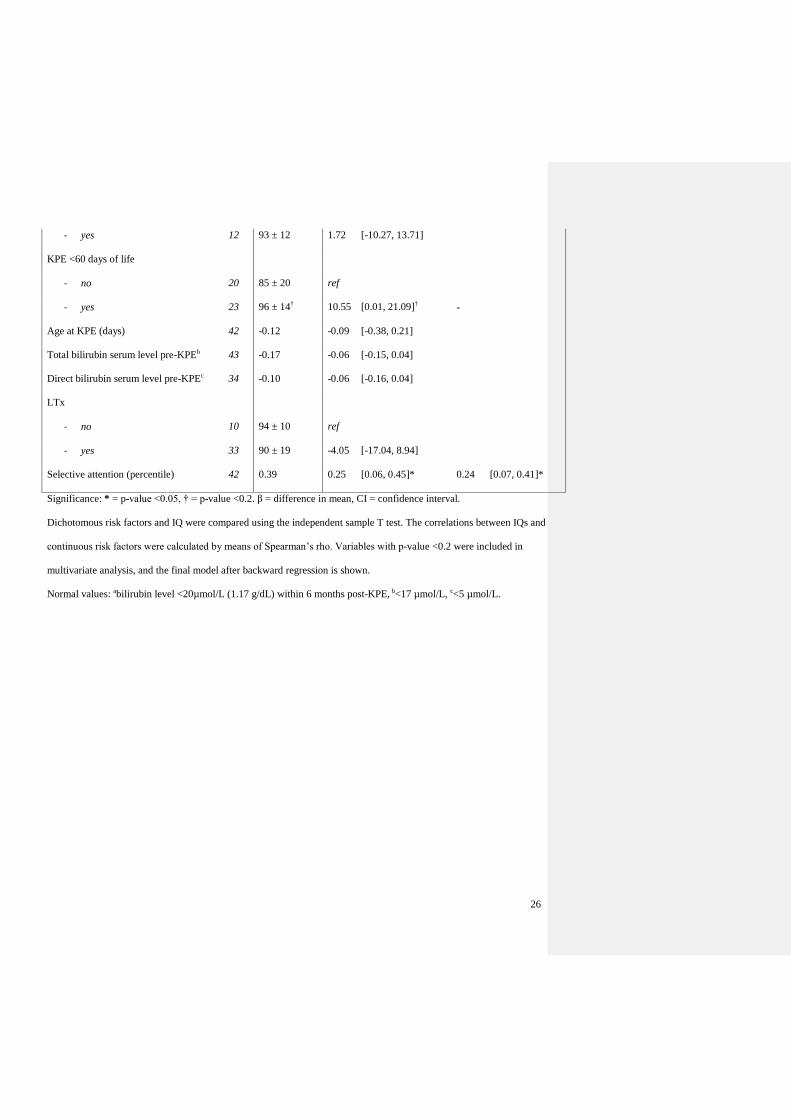
The regression model of total IQ is shown in Table 4 (online). Univariate analysis showed a
significant effect of selective attention abilities (mean difference (β) 0.25, 95% CI 0.06, 0.45; p=0.012)
and history of neurodevelopmental intervention (β -15.60, 95% CI -25.50, -5.70; p=0.003) on total IQ.
Both variables remained significant after multivariate regression analysis. Results did not differ after
multiple imputations of missing data (data not shown).
Overall, there were no significant differences between children with native liver and children
after LTx. Children with native liver had a mean total IQ of 94±10 vs a mean total IQ of 90±19 after
LTx (p=0.533). All 8 children with ‘low’ IQ score had undergone a LTx. In motor outcomes, 4/10
(40%) children with native liver scored ‘low’ vs 18/34 (53%) children after LTx (p=0.46). Concerning
school performance, 4/10 (40%) children with native liver received special education vs 8/36 (22%)
children after LTx (p=0.29). Gestational age was not significantly associated with lower IQ or abnormal
motor skills.
Discussion
The first aim of this study was to assess neurodevelopmental outcomes in Dutch children with
BA at school age, to determine which areas of neurodevelopment are affected and to what degree. We
found significantly impaired neurodevelopmental outcomes compared to the norm population. These
impairments were present in all neurodevelopmental domains, i.e. motor skills, cognition, and behavior.
Motor outcomes were most affected, with even up to half of the children scoring ‘low’ on motor skills.
10
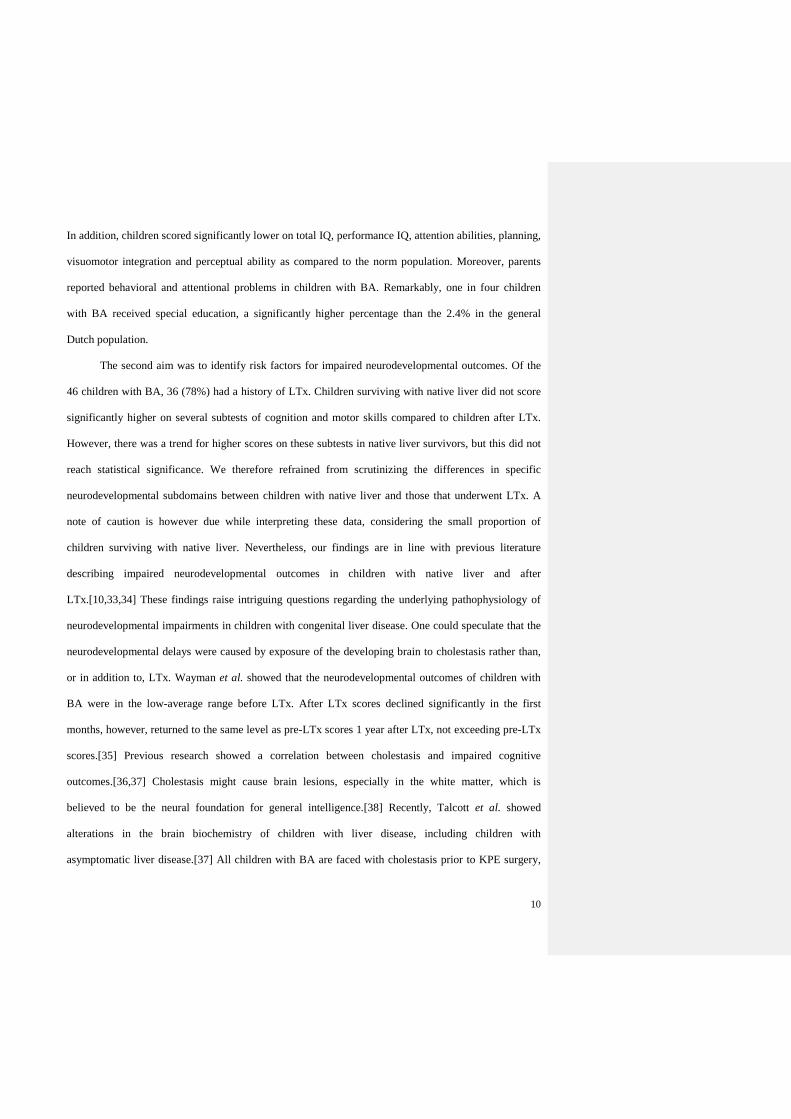
In addition, children scored significantly lower on total IQ, performance IQ, attention abilities, planning,
visuomotor integration and perceptual ability as compared to the norm population. Moreover, parents
reported behavioral and attentional problems in children with BA. Remarkably, one in four children
with BA received special education, a significantly higher percentage than the 2.4% in the general
Dutch population.
The second aim was to identify risk factors for impaired neurodevelopmental outcomes. Of the
46 children with BA, 36 (78%) had a history of LTx. Children surviving with native liver did not score
significantly higher on several subtests of cognition and motor skills compared to children after LTx.
However, there was a trend for higher scores on these subtests in native liver survivors, but this did not
reach statistical significance. We therefore refrained from scrutinizing the differences in specific
neurodevelopmental subdomains between children with native liver and those that underwent LTx. A
note of caution is however due while interpreting these data, considering the small proportion of
children surviving with native liver. Nevertheless, our findings are in line with previous literature
describing impaired neurodevelopmental outcomes in children with native liver and after
LTx.[10,33,34] These findings raise intriguing questions regarding the underlying pathophysiology of
neurodevelopmental impairments in children with congenital liver disease. One could speculate that the
neurodevelopmental delays were caused by exposure of the developing brain to cholestasis rather than,
or in addition to, LTx. Wayman et al. showed that the neurodevelopmental outcomes of children with
BA were in the low-average range before LTx. After LTx scores declined significantly in the first
months, however, returned to the same level as pre-LTx scores 1 year after LTx, not exceeding pre-LTx
scores.[35] Previous research showed a correlation between cholestasis and impaired cognitive
outcomes.[36,37] Cholestasis might cause brain lesions, especially in the white matter, which is
believed to be the neural foundation for general intelligence.[38] Recently, Talcott et al. showed
alterations in the brain biochemistry of children with liver disease, including children with
asymptomatic liver disease.[37] All children with BA are faced with cholestasis prior to KPE surgery,

11
and many also after KPE, making this a possible cause for neurodevelopmental impairments. Major
surgery in young children itself may also be a possible risk factor for impaired neurodevelopment.
Physiological stress and anesthesia can be harmful in the period of early brain development.[5,39] On
the other hand, Davidson et al. stated that general anesthesia in infants has no significant effect on
neurodevelopmental outcomes at 2 years of age, although in relatively minor surgery.[6]
In line with previous studies, boys had higher odds of neurodevelopmental impairments,
especially motor skills.[40–42] Both sex hormones and sex chromosome genes may influence brain
function, for example, the Y-chromosome gene is suggested to be a male-specific risk factor for
neurodevelopmental disorders.[41] Surprisingly, prematurity was not a risk factor for
neurodevelopmental impairments at school age in our cohort. Moreover, our data showed no difference
in IQ, and even better motor skills, in children with a history of intracranial hemorrhage, compared to
children without a history of intracranial hemorrhage.
Exact pathophysiology and age at onset of the neurodevelopmental impairments remain unclear.
Data on neurodevelopmental outcomes at earlier age are scarce, though required to further investigate
age at onset and underlying pathophysiology of these impairments. Moreover, longitudinal follow-up is
essential to explore the long-term neurodevelopmental trajectory in children with BA.
At time of test assessment, 46% of children had already received some type of
neuropsychological intervention. However, this was not integrated in standard care. Children with a
history of neuropsychological intervention had significantly lower scores on motor skills and IQ. The
effectiveness of these neuropsychological interventions remains uncertain; however, we can conclude
that they were not sufficient to fully recover the impairments. Previous studies have shown that, in
preterm infants, early intervention programs have a positive effect on motor development in infancy,
and cognitive development up to preschool age, compared to standard medical follow-up.[43] Early
identification of infants with BA at risk for neurodevelopmental impairments may allow the start

12
targeting intervention programs at early age, focusing on infant development and parent-infant
relationship, e.g. in the form of physiotherapy, speech language therapy and psychological intervention.
A chronic disease, as BA, might also influence health- related quality of life. Existing data on quality of
life in children with BA is contradictory, with some studies describing lower health-related quality of
life, whereas others describe similar quality of life.[44,45] Further research is needed to investigate
whether impaired neurodevelopmental outcomes negatively affect the health-related quality of life in
children with BA.
We are aware that our study has some limitations. As BA is a rare disease, the sample size was
relatively small, especially regarding children surviving with native liver. The sample size might have
masked differences between subgroups of children, e.g. children with native liver and after LTx, or
some previously recognized associations between risk factors and neurodevelopmental outcomes.
Furthermore, most of the children displayed problems with hyperactivity and attention. Univariate
analysis showed that selective attention abilities were associated with IQ scores, however, not with
motor skills. Moreover, the cross-sectional study design limits exploration of neurodevelopmental
outcomes over time. In addition, we did not receive informed consent from 11 of the invited children. It
is unknown whether these children reflect either the highest or lowest scoring children. Nevertheless, the
inclusion ratio was high (78%) and, therefore, we feel that our cohort provides an adequate overview of
children with BA from the Netherlands.
In conclusion, this study shows impaired outcomes in several very important fields of
neurodevelopment in school-aged children with BA, e.g. motor skills, cognition and behavior.
Moreover, 27% of children received special education. Our data strongly warrant evaluation of
neurodevelopmental intervention programs to assess whether long-term outcomes could be improved.
International collaboration and pooling of data is highly desirable to further investigate the underlying
pathophysiology and risk factors for these neurodevelopmental impairments in children with BA.

13
Acknowledgments:
We thank M.J. Hokken, MSc, for her assistance with the neurodevelopmental tests, and T.D.
Habtewold, MSc, for his assistance with the statistical analyses (both have no financial relationships or
conflict of interest relevant to this article to disclose). We would also like to thank all children for their
participation in this study.

14
References
[1] Lind RC, de Vries W, Keyzer-Dekker CMG, Peeters P, Verkade HJ, Hoekstra-Weebers J, et al.
Health Status and Quality of Life in Adult Biliary Atresia Patients Surviving with Their Native
Livers. Eur J Pediatr Surg 2015;25:60–5.
[2] De Vries W, De Langen ZJ, Groen H, Scheenstra R, Peeters PMJG, Hulscher JBF, et al. Biliary
atresia in the Netherlands: Outcome of patients diagnosed between 1987 and 2008. J Pediatr
2012;160:638–44.
[3] Hartley J, Davenport M, Kelly D. Biliary atresia. Lancet 2009;374:1704–13.
[4] Rodijk LH, den Heijer AE, Hulscher JB, Verkade HJ, de Kleine RHJ, Bruggink JLM.
Neurodevelopmental Outcomes in Children With Liver Diseases: a systematic review. J Pediatr
Gastroenterol Nutr 2018;67:1.
[5] Reddy SV. Effect of general anesthetics on the developing brain. J Anaesthesiol Clin Pharmacol
2012;28:6–10.
[6] Davidson AJ, Disma N, De Graaff JC, Withington DE, Dorris L, Bell G, et al.
Neurodevelopmental outcome at 2 years of age after general anaesthesia and awake-regional
anaesthesia in infancy (GAS): An international multicentre, randomised controlled trial. Lancet
2016;387:239–50.
[7] Stolwijk LJ, Lemmers PMA, Harmsen M, Groenendaal F, de Vries LS, van der Zee DC, et al.
Neurodevelopmental Outcomes After Neonatal Surgery for Major Noncardiac Anomalies.
Pediatrics 2016;137.
[8] John CC, Black MM, Nelson CA. Neurodevelopment: The Impact of Nutrition and Inflammation
During Early to Middle Childhood in Low-Resource Settings. Pediatrics 2017;139:S59–71.
[9] Welch TR. The Editors’ Perspectives: Threats to the developing brain. J Pediatr 2019;211:1–3.
[10] Ng VL, Sorensen LG, Alonso EM, Fredericks EM, Ye W, Moore J, et al. Neurodevelopmental
Outcome of Young Children with Biliary Atresia and Native Liver: Results from the ChiLDReN

15
Study. J Pediatr 2018;196:139–47.
[11] Smits-Engelsman BCM editor. Dutch manual of the Movement Assessment Battery for Children.
Lisse, the Netherlands: Swets & Zeitlinger; 1998.
[12] Wechsler D. WISC-III-NL: Wechsler intelligence scale for children [Dutch version]. 3rd ed.
Amsterdam, the Netherlands: Pearson.; 2005.
[13] Schittekatte M, Groenvynck H, Fontaine J, Al. E. Aanvullend psychometrisch onderzoek met de
Test of Everyday Attention for Children (TEA-Ch). Additional psychometric evaluation of the
Test of Everyday Attention for Children. Manual: Norms, validity and reliability measures for
Dutch and Flemish children. Amsterdam: Harcourt Assessment; 2007.
[14] van den Burg W, Kingma A. Performance of 225 Dutch school children on Rey’s Auditory
Verbal Learning Test (AVLT ): parallel test-retest reliabilities with an interval of 3 months and
normative data. Arch Clin Neuropsychol 1999;14:545-59.
[15] Beery KE, Beery NA, Buktenica NA. The Beery–Buktenica Developmental Test of Visual–
Motor Integration: Administration, Scoring and Teaching Manual. 5th edition. Minneapolis, MN:
NCS Pearson; 2004.
[16] Martin N, Gardner MF. Test of Visual Perceptual Skills. 3rd ed. Novato, CA: Academic Therapy
Publications; 2006.
[17] Emslie H, Wilsond FC, Burden V, Al. E. Behavioural Assessment of the Dysexecutive Syndrome
for Children (BADS-C). Amsterdam: Harcourt; 2006.
[18] Cools W, Martelaer K de, Samaey C, Andries C. Movement skill assessment of typically
developing preschool children: A review of seven movement skill assessment tools. J Sport Sci
Med 2009.
[19] van Ool JS, Hurks PPM, Snoeijen-Schouwenaars FM, Tan IY, Schelhaas HJ, Klinkenberg S, et
al. Accuracy of WISC-III and WAIS-IV short forms in patients with neurological disorders. Dev
Neurorehabil 2018.

16
[20] Manly T, Anderson V, Nimmo-Smith I, Turner A, Watson P, Robertson IH. The differential
assessment of children’s attention: The Test of Everyday Attention for Children (TEA-Ch),
normative sample and ADHD performance. J Child Psychol Psychiatry Allied Discip 2001.
[21] Harvey EM, Leonard-Green TK, Mohan KM, Kulp MT, Davis AL, Miller JM, et al. Interrater
and test-retest reliability of the beery visual-motor integration in schoolchildren. Optom Vis Sci
2017.
[22] Martin N, Gardner M. Test of visual perceptual skills. 3rd ed. Novato, CA: Academic Therapy
Publications 2006.
[23] van der Elst W, van Boxtel MPJ, van Breukelen GJP, Jolles J. Rey’s verbal learning test:
Normative data for 1855 healthy participants aged 24-81 years and the influence of age, sex,
education, and mode of presentation. J Int Neuropsychol Soc 2005.
[24] Engel-Yeger B, Josman N, Rosenblum S. Behavioural Assessment of the Dysexecutive
Syndrome for Children (BADS-C): An examination of construct validity. Neuropsychol Rehabil
2009.
[25] Scholte EM, van der Ploeg JD. ADHD-vragenlijst (AVL) handleiding. Houten, the Netherlands:
Bohn Stafleu van Loghum 2005.
[26] Verhulst F, van der Ende J. Manual for the Child Behavior Checklist: 4–18 (CBCL, in Dutch).
Achenbach System of Emperically Based Asessments (ASEBA) 2000.
[27] Smidts D, Huizinga M. BRIEF: Executieve functies Gedragsvragenlijst. (Behavior Rating
Inventory of Executive Functions — Dutch version). Amsterdam, the Netherlands: Hogrefe
Uitgevers B.V. 2009.
[28] Cohen J. Statistical Power Analysis for the Behavioural Science (2nd Edition). Stat. Power
Anaylsis Behav. Sci 1988.
[29] van Hasselt PM, de Koning TJ, Kvist N, de Vries E, Lundin CR, Berger R, et al. Prevention of
Vitamin K Deficiency Bleeding in Breastfed Infants: Lessons From the Dutch and Danish Biliary

17
Atresia Registries. Pediatrics 2008;121:857–63.
[30] Witt M, Kvist N, Jorgensen MH, Hulscher JBF, Verkade HJ. Prophylactic Dosing of Vitamin K
to Prevent Bleeding. Pediatrics 2016;137.
[31] Centraal Bureau voor de Statistiek (CBS). Standaard Onderwijsindeling. Den Haag 2006.
[32] Centraal bureau voor de statistiek (CBS). (Speciaal) basisonderwijs en speciale scholen;
leerlingen, schoolregio. Den Haag/Heerlen 2018.
[33] Caudle SE, Katzenstein JM, Karpen SJ, McLin VA. Language and Motor Skills Are Impaired in
Infants with Biliary Atresia Before Transplantation. J Pediatr 2010;156.
[34] Almaas R, Jensen U, Loennecken MC, Tveter AT, Sanengen T, Scholz T, et al. Impaired motor
competence in children with transplanted liver. J Pediatr Gastroenterol Nutr 2015;60:723–8.
[35] Wayman KI, Cox KL, Esquivel CO. Neurodevelopmental outcome of young children with
extrahepatic biliary atresia 1 year after liver transplantation. J Pediatr 1997;131:894–8.
[36] Newton JL, Hollingsworth KG, Taylor R, El-Sharkawy AM, Khan ZU, Pearce R, et al. Cognitive
impairment in primary biliary cirrhosis: Symptom impact and potential etiology. Hepatology
2008;48:541–9.
[37] Talcott JB, Beath S V., Patel T, Griffiths G, Kelly DA. Long-Term Effects of Cholestatic Liver
Disease in Childhood on Neuropsychological Outcomes and Neurochemistry. J Pediatr
Gastroenterol Nutr 2019.
[38] Penke L, Maniega SM, Bastin ME, Valdés Hernández MC, Murray C, Royle NA, et al. Brain
white matter tract integrity as a neural foundation for general intelligence. Mol Psychiatry
2012;17:1026–30.
[39] Walker K, Loughran-Fowlds A, Halliday R, Holland AJ, Stewart J, Sholler GF, et al.
Developmental outcomes at 3 years of age following major non-cardiac and cardiac surgery in
term infants: A population-based study. J Paediatr Child Health 2015;51:1221–5.
[40] Hintz SR, Kendrick DE, Vohr BR, Poole WK, Higgins RD. Gender differences in

18
neurodevelopmental outcomes among extremely preterm, extremely-low-birthweight infants.
Acta Paediatr Int J Paediatr 2006;95:1239-48.
[41] Pinares-Garcia P, Stratikopoulos M, Zagato A, Loke H, Lee J. Sex: A significant risk factor for
neurodevelopmental and neurodegenerative disorders. Brain Sci 2018;8.
[42] Nishimura T, Takei N, Tsuchiya KJ, Asano R, Mori N. Identification of neurodevelopmental
trajectories in infancy and of risk factors affecting deviant development: A longitudinal birth
cohort study. Int J Epidemiol 2016;45:543-53.
[43] Spittle A, Orton J, Anderson PJ, Boyd R, Doyle LW. Early developmental intervention
programmes provided post hospital discharge to prevent motor and cognitive impairment in
preterm infants. Cochrane Database Syst Rev 2015.
[44] Howard ER, MacLean G, Nio M, Donaldson N, Singer J, Ohi R. Survival patterns in biliary
atresia and comparison of quality of life of long-term survivors in Japan and England. J Pediatr
Surg 2001;36:892-7.
[45] Sundaram SS, Alonso EM, Haber B, Magee JC, Fredericks E, Kamath B, et al. Health related
quality of life in patients with biliary atresia surviving with their native liver. J Pediatr
2013;163:1052-1057.

19
Figure 1. Flow chart of the inclusion process.
Figure 2. Distribution of motor scores (n=44) and IQ (n=46) in children with biliary atresia compared to
reference values based on the Dutch norm population (age- and gender-matched).
Significance: * = p < 0.001 using the Fisher exact test.
Figure 3. Boxplot of (age- and gender-matched) Z-scores of neurodevelopmental outcomes in children
with biliary atresia compared to the Dutch norm population (Z-score 0, SD 1).
Significance: * = p < 0.05 using the one-sample Kolmogorov Smirnov test.
IM-ABC (n=42), IIWISC-III-NL (n=43), IIITEA-Ch (n=42), IVAVLT (n=41), VBEERY-VMI-VI (n=42),
V1TVPS-III (n=41), VIIBADS-C (n=24).
20
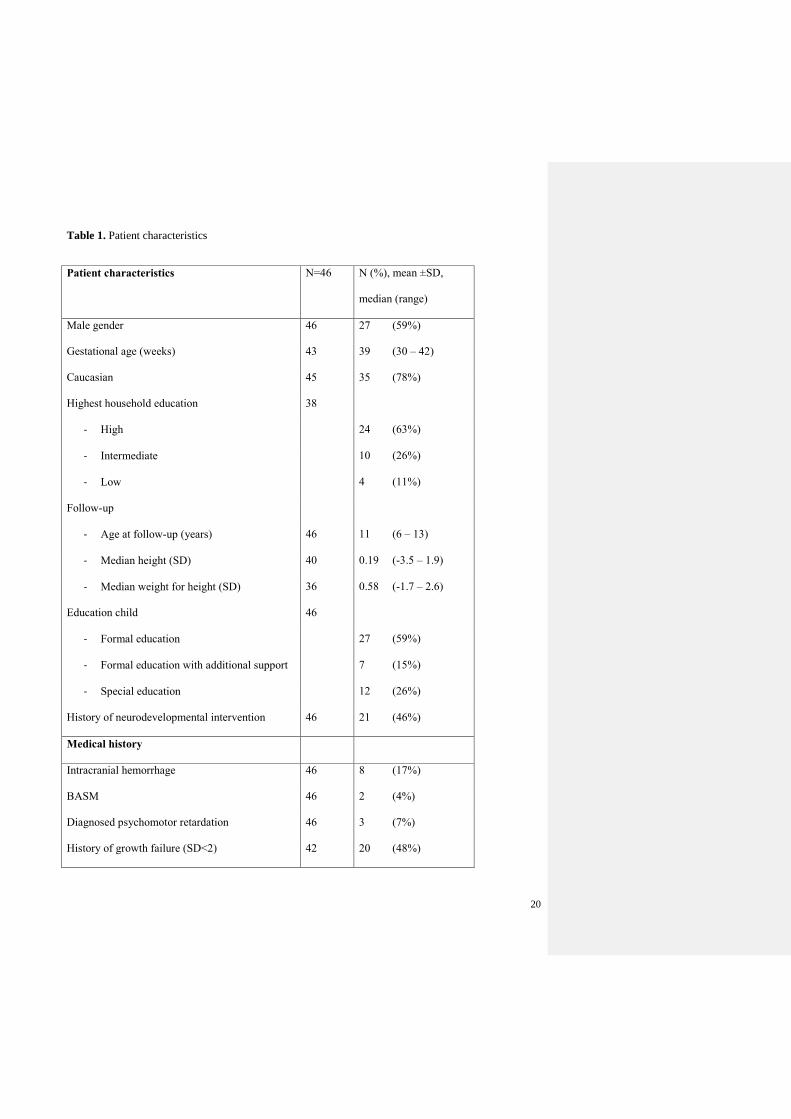
Table 1. Patient characteristics
Patient characteristics N=46 N (%), mean ±SD,
median (range)
Male gender 46 27 (59%)
Gestational age (weeks) 43 39 (30 – 42)
Caucasian 45 35 (78%)
Highest household education 38
- High 24 (63%)
- Intermediate 10 (26%)
- Low 4 (11%)
Follow-up
- Age at follow-up (years) 46 11 (6 – 13)
- Median height (SD) 40 0.19 (-3.5 – 1.9)
- Median weight for height (SD) 36 0.58 (-1.7 – 2.6)
Education child 46
- Formal education 27 (59%)
- Formal education with additional support 7 (15%)
- Special education 12 (26%)
History of neurodevelopmental intervention 46 21 (46%)
Medical history
Intracranial hemorrhage 46 8 (17%)
BASM 46 2 (4%)
Diagnosed psychomotor retardation 46 3 (7%)
History of growth failure (SD<2) 42 20 (48%)

21
KPE 45 (98%)
Age at KPE (days) 45 60 ±18
KPE <60 days of life 46 24 (52%)
Total bilirubin serum level pre-KPEa 44 179 (78 – 339)
Direct bilirubin serum level pre-KPEb 42 135 (41 – 308)
Successful KPEc 45 12 (27%)
LTx 36 (78%)
Age at LTx (months) 35 11 (4 – 149)
Time since LTx (years) 35 9 (1 – 12)
Living related LTx 33 12 (36%)
Hospitalization after LTx (days) 32 33 (12 – 159)
Major complicationd 33 23 (70%)
Total bilirubin level screening LTxa 35 161 (12 – 584)
Direct bilirubin level screening LTxb 34 133 (4 – 427)
Data are given as numbers (percentage), mean ± SD, or as median (minimum-
maximum). Normal values: a<17 µmol/L, b<5 µmol/L, cbilirubin level <20µmol/L (1.17
g/dL) within 6 months post-KPE, dgrade III-V of Clavien-Dindo Classification.
22
Table 2. Behavioral outcomes in children with BA
N Normal Borderline Low p
CBCL ref 93% 5% 2%
Internalizing problems 39 18 (46%) 6 (15%) 15 (39%) <0.001
Externalizing problems 38 28 (74%) 3 (8%) 7 (18%) <0.001
Total behavioral problems 34 20 (59%) 6 (18%) 8 (23%) <0.001
AVL ref 90% 5% 5%
Attentional problems 40 31 (78%) 5 (12%) 4 (10%) 0.03
Hyperactivity 39 29 (74%) 3 (8%) 7 (18%) 0.003
Impulsivity 39 35 (90%) 3 (8%) 1 (2%) 0.67
Total ADHD 38 29 (76%) 8 (21%) 1 (3%) 0.001
BRIEF ref 50% 43% 7%
Behavioral regulation 39 20 (51%) 16 (41%) 3 (8%) 0.97
Metacognition 37 20 (54%) 13 (35%) 4 (11%) 0.46
Global executive composite 37 19 (51%) 14 (38%) 4 (11%) 0.65
Distribution of behavioral outcomes of children with BA, in normal, borderline and
low scores, compared to the norm population using the Fisher exact test. Scores are
given as number (percentage).

23
Table 3. The association between motor skills and risk factors
Motor skills
(percentile)
Low score motor skills
(percentile < 5)
Descriptives Univariate Multivariate
N=43 Median (range)
or rho
OR [95% CI] OR [95% CI]
Gender
- Girls 19 11 (2-92) ref ref
- Boys 27 3 (1-25) * 4.91 [1.33, 18.21]* 5.74 [1.45, 22.81]*
Ethnicity
- Caucasian 32 6.5 (1-92) ref
1.80 [0.43, 7.59]
- Non-Caucasian 9 4 (1-67)
Highest household education
- Low/intermediate 18 6.5 (1-92) ref
- High 23 6 (1-75) 1.00 [0.31, 3.28]
Gestational age (weeks) 38 -0.05 1.05 [0.82, 1.35]
Intracranial hemorrhage
ref
0.20 [0.03, 1.30]†
- no 34 5 (1-92) ref
- yes 7 19 (1-67)† 0.27 [0.05, 1.50]†
History of growth failure (SD<2)
- no 20 7.5 (1-92) ref
- yes 18 8.5 (1-75) 1.50 [0.43-5.25]
History of neurodevelopmental intervention
- no 22 9 (1-92) ref
- yes 19 2 (1-67)* 2.10 [0.63-7.03]
Successful KPEa
- no 28 6.5 (1-92) ref
Commented [RL(1]: Online only
24
- yes 12 9 (1-75) 0.67 [0.17-2.57]
KPE <60 days of life
- no 19 10 (1-92) ref
- yes 22 5 (1-67) 1.73 [0.53-5.72]
Age at KPE (days) 40 0.12 0.97 [0.94-1.01]† -
Total bilirubin serum level pre-KPEb 41 -0.09 0.99 [0.99-1.01]
Direct bilirubin serum level pre-KPEc 32 0.12 1.00 [0.99-1.01]
LTx
- no 10 6 (1-75) ref
- yes 31 7 (1-92) 1.69 [0.40-7.07]
Selective attention (percentile) 42 0.19 0.99 [0.97-1.02]
Significance: * = p-value <0.05, † = p-value <0.2. CI = confidence interval, OR = odds ratio
Dichotomous risk factors and motor score percentiles were compared by using the Mann Whitney U test. The correlations between motor
score percentiles and continuous risk factors were calculated by means of Spearman’s rho. Odds ratio’s (ORs) were calculated using
logistic regression. Variables with p-value <0.2 were included in multivariate analysis, and the final model after backward regression is
shown.
Normal values: abilirubin level <20µmol/L (1.17 g/dL) within 6 months post-KPE, b<17 µmol/L, c<5 µmol/L.

25
Table 4. The association between total IQ and risk factors
Total IQ (absolute number)
Descriptives Univariate Multivariate
N=43 Mean ± SD
or rho
β [95% CI] β [95% CI]
Gender
- Girls 19 96 ± 12 ref
- Boys 24 88 ± 21† -8.04 [-18.85, 2.77]† -
Ethnicity
- Caucasian 34 94 ± 15 ref
- Non-Caucasian 9 82 ± 24† -11.92 [-24.95, 1.10]† -
Highest household education
- Low/intermediate
- High
20 87 ± 15
95 ± 19†
ref
8.12 [-2.64, 18.88]†
23 -
Gestational age 40 0.02 -0.11 [-2.52, 2.30]
Intracranial hemorrhage
ref
2.12 [-12.82, 17.03]
- no 36 91 ± 19
- yes 7 93 ± 9
History of growth failure (SD<2)
ref
-6.01 [-16.62, 4.60]
- no
- yes
22
18
92 ± 17
86 ± 16
History of neurodevelopmental
intervention
ref
- no 23 98 ± 13 ref
- yes 20 83 ± 19† -15.60 [-25.50, -5.70]* -15.84 [-25.14, -6.55]*
Successful KPEa
ref
- no 30 91 ± 19
Commented [RL(2]: Online only
26
- yes 12 93 ± 12 1.72 [-10.27, 13.71]
KPE <60 days of life
ref
10.55 [0.01, 21.09]†
- no 20 85 ± 20
96 ± 14†
- yes 23 -
Age at KPE (days) 42 -0.12 -0.09 [-0.38, 0.21]
Total bilirubin serum level pre-KPEb 43 -0.17 -0.06 [-0.15, 0.04]
Direct bilirubin serum level pre-KPEc 34 -0.10 -0.06 [-0.16, 0.04]
LTx
- no 10 94 ± 10 ref
- yes 33 90 ± 19 -4.05 [-17.04, 8.94]
Selective attention (percentile) 42 0.39 0.25 [0.06, 0.45]* 0.24 [0.07, 0.41]*
Significance: * = p-value <0.05, † = p-value <0.2. β = difference in mean, CI = confidence interval.
Dichotomous risk factors and IQ were compared using the independent sample T test. The correlations between IQs and
continuous risk factors were calculated by means of Spearman’s rho. Variables with p-value <0.2 were included in
multivariate analysis, and the final model after backward regression is shown.
Normal values: abilirubin level <20µmol/L (1.17 g/dL) within 6 months post-KPE, b<17 µmol/L, c<5 µmol/L.

27
Table 5. Effect sizes and study power
Outcomes Effect size Study power
Cohen’s d
Total motor skills 1.38 1.00
Total IQ 0.49 0.94
Performance IQ 0.72 1.00
Verbal IQ 0.37 0.77
Selective attention 0.64 0.99
Inhibition control 0.41 0.83
Short-term memory 0.02 0.06
Long-term memory 0.20 0.34
Visuomotor integration 0.59 0.98
Perceptual ability 0.40 0.81
Planning 0.42 0.64
Strategy formation 0.19 0.23
Multivariate model - IQ f2
Total model 0.45 0.97
Multivariate model - motor skills f2
Total model 0.45 0.92
Cohen’s effect sizes are interpreted as small (d=0.20 or f2=0.02), medium
(d=0.50 or f2=0.15), and large (d=0.80 or f2=0.35). Effect sizes and study
power were calculated using the G*Power program, version 3.