Embed Size (px)
Citation preview
UNIVERSITY OF NAIROBI
DEPARTMENT OF MECHANICAL ENGINEERING
DENNIS KHAEMBA MASUNGO
F56/76054/2014
PROJECT REPORT
MSc. (ENG) Energy Management
TITLE: Energy Efficiency Assessment of Cooling Water System
Using Variable Speed Drives at Tetra Pak Converting Factory-
Nairobi
Submitted in partial fulfilment for the Degree of Master of Science in Energy Management
This Project Report is available for Library use on the understanding that it is copyright material and that no
quotation from the Report may be published without proper acknowledgement
i
Declaration
A. Student’s Declaration
I declare that this project report is my original work and it has not been submitted to any other
College or University for academic credit.
Signed ____________________________ Date______________________
Dennis Khaemba Masungo F56/76054/2014
B. Supervisors Declaration
I confirm that the above student carried out this project work under my supervision for the
entire period of the project.
Signed ____________________________ Date_________________________
Prof. Cyrus Wekesa Project Supervisor
I confirm that the above student carried out this project work under my supervision for the
entire period of the project.
Signed ____________________________ Date_________________________
Dr. Reuben Kivindu Project Supervisor
ii
Abstract
This project assessed the potential of implementing electrical variable speed drives in flow
control on a pumping system of a cooling system. Various studies have documented the energy
savings from retrofitting variable speed drives in pumping systems. This formed the basis for
the need to evaluate a cooling system with thermostatic mixing control and throttling on
pumping system running full capacity. Thereby regulating the flow of chilled water and
eliminating the need for throttle valves in chilled water line.
The study was conducted at Tetra Pak Limited a packaging manufacturing plant in Nairobi’s
industrial area. The focus of the study was narrowed to four pumps, three supplying water to
the cooling loads (laminators 1, 2 and 3) labelled pump 1, 2, 3 (all rated 22 kW) and the other
(pump 4, 30 kW) circulating water between the cooling tower and the chiller condenser which
was water cooled.
The research objective of establishing energy and related cost losses from the current installed
system was met by following laid out procedures in the methodology. The key steps that
followed were; establishment of energy consumption of the existing cooling system,
determination of load variance and energy saving and economic analysis of the project. Data
was collected through measurement and historic data recorded manually and electronically
through a SCADA (Supervisory Control And Data Acquisition) system.
The findings from the project showed that application of variable speed drives would result in
substantial saving in the three water pumps supplying the laminators due to the variance in the
cooling load. Pump 1 was observed to have a potential of 48.3 per cent energy savings, Pump
2 was observed to have a potential of 61.8 per cent savings, Pump 3 was observed to have the
highest saving potential of 72.9 per cent savings. Pump 4 did not have any potential for
application of the variable speed drive. Detailed analysis is provided in the report.

iii
Acknowledgement
I wish to extend my sincere gratitude to the following; first to the Almighty God for giving me
the opportunity to study at the University of Nairobi without which this project would not have
been possible.
I would like to acknowledge with appreciation my supervisors the Prof. Cyrus Wekesa and Dr.
Reuben Kivindu for their guidance throughout my project.
I would also like to thank Tetra Pak Ltd management for allowing me to conduct my research
project at their company and time to advance my studies.
I extend my gratitude to my colleagues at work Mr. Jude Songok, George Omondi and
Chrispinus Obilo for going out of their busy schedules to facilitate me in taking measurements,
answering questions and providing details for the plant equipments.
Finally, yet importantly, I am indebted to my family for their support in my master’s studies.
iv
Table of Contents
Declaration ................................................................................................................... i
Abstract ........................................................................................................................ ii
Acknowledgement ........................................................................................................ iii
Table of Contents ......................................................................................................... iv
List of Tables .............................................................................................................. vii
List of Figures .............................................................................................................. ix
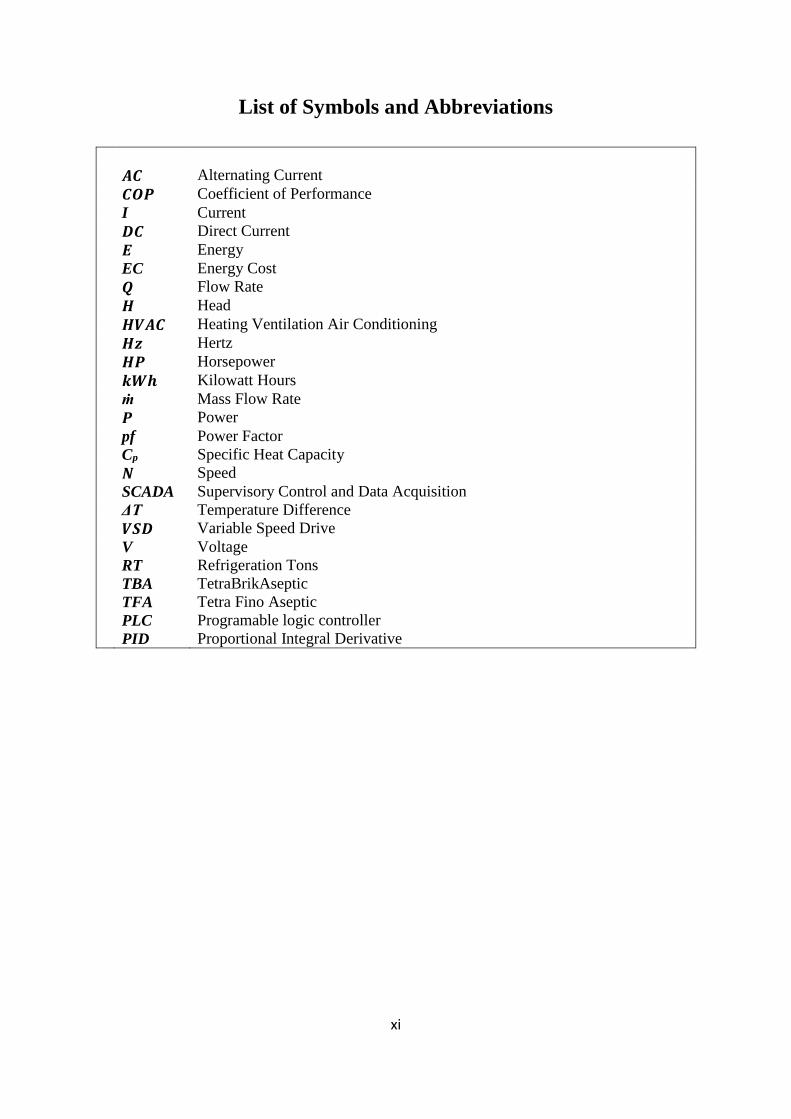
List of Symbols and Abbreviations ................................................................................. xi
CHAPTER 1 ................................................................................................................ 1
Introduction ................................................................................................................. 1
1.1 Project Site and Packaging Paper Manufacturing ................................................ 1
1.2 Cooling Plant .................................................................................................. 2
1.3 Problem Statement ........................................................................................... 4
1.4 Research Objectives ......................................................................................... 4
CHAPTER 2 ................................................................................................................ 5
Literature Review ......................................................................................................... 5
2.1 Introduction .................................................................................................... 5
2.2 Pumping and Flow control ................................................................................ 5
2.2.1 Throttling Control .......................................................................................... 5
2.2.2 Variable Speed Control ................................................................................... 6
2.2.3 Application of Variable Speed Drives ............................................................... 8
2.2.4 Variable Speed Drive Control Loops ................................................................ 9
2.2.5 Variable Speed Drives in Cooling Systems ..................................................... 10
2.3 Justification of Saving ........................................................................................ 12
2.4 Performance of Cooling System........................................................................... 12
2.5 Performance of a Chiller ..................................................................................... 13
v
2.6 Chiller Design Limitation .................................................................................... 14
CHAPTER 3 .............................................................................................................. 15
Methodology .............................................................................................................. 15
3.1 Introduction .................................................................................................. 15
3.2 Characteristics of existing cooling pumping system. .......................................... 15
3.3 To establish energy consumption of the existing cooling pumping system. .......... 15
3.4 To determine load variance and energy saving .................................................. 17
3.5 Implementation of VSD on the system using 4-20mA Siemens 30hp VFD Box, 6SL3710-
1BJ24-5AR0. .......................................................................................................... 18
3.6 Economic Analysis ........................................................................................ 18
3.7 Assumptions ................................................................................................. 19
CHAPTER 4 .............................................................................................................. 20
Technical Analysis ...................................................................................................... 20
4.1. Introduction .................................................................................................. 20
4.2. Data Set 1 obtained between 15-10-2018 and 19-10-2018 running TFA packaging
material Results ....................................................................................................... 20
4.2.1. Pump 1 ...................................................................................................... 20
Summary of data analysis for laminator 1 .................................................................. 23
4.2.2. Pump 2 ...................................................................................................... 25
Summary of data analysis for laminator 2. .................................................................. 27
4.2.3. Pump 3 ...................................................................................................... 27
Summary of data analysis for laminator 3. .................................................................. 29
4.3. Data Set 2 obtained between 06/11/2018 and 09/11/2018 running TBA packaging
material Results. ...................................................................................................... 30
4.3.1. Pump 1 ...................................................................................................... 30
Summary of data analysis for laminator 1. .................................................................. 32
4.3.2. Pump 2 ...................................................................................................... 33
vi
Summary of data analysis for laminator 2. .................................................................. 34
4.3.3. Pump 3 ...................................................................................................... 35
Summary of data analysis for laminator 3. .................................................................. 37
4.4. Results of pump 4- Circulating water between condenser unit and cooling tower .. 38
4.5. Results of Chiller Performance ........................................................................ 39
4.6 Discussion Summary .......................................................................................... 41
CHAPTER 5 .............................................................................................................. 45
Economic Analysis ..................................................................................................... 45
5.1 Determination of energy cost and saving .............................................................. 45
5.2 Summary of energy and cost savings for laminator 2. ............................................. 46
5.3 Summary of energy and cost savings for laminator 3. ............................................. 46
CHAPTER 6 .............................................................................................................. 48
Conclusion and Recommendations ............................................................................... 48
6.1 Future work recommendations ........................................................................ 49
Appendices ................................................................................................................ 52
Appendix 1: Laminator 1 valve output, inlet, outlet, pre-set temperatures Data Set 1 ..... 52
Appendix 2: Laminator 2 valve output, inlet, outlet, pre-set temperatures Data Set 1 ...... 56
Appendix 3: Laminator 3 valve output, inlet, outlet, pre-set temperatures Data Set 1 ...... 60
Appendix 4: Laminator 1 valve output, inlet, outlet, pre-set temperatures Data Set 2 ...... 64
Appendix 5: Laminator 2 valve output, inlet, outlet, pre-set temperatures Data Set 2 ...... 68
Appendix 6: Laminator 3 valve output, inlet, outlet, pre-set temperatures Data Set 2 ...... 72
Appendix 7: Pump 4 flow rate .................................................................................. 76
Appendix 8: Chiller average inlet/outlet temperature ................................................... 85
vii
List of Tables
Table 2.1: Trend of speed control by varying frequency against power………………… 10
Table 3.1: Sample SCADA data parameters……………………………………………………….17
Table 4.1: Laminator 1 valve output, inlet, outlet, pre-set temperatures ................................. 22
Table 4.2: Laminator 1 operation frequency distribution ........................................................ 23
Table 4.3: Laminator 1 flow rate analysis ............................................................................... 24
Table 4.4: Summarized data on weighted power at different bins .......................................... 25
Table 4.5: Laminator 1 power analysis .................................................................................... 25
Table 4.6: Laminator 2 valve output, inlet, outlet, pre-set temperatures ................................. 25
Table 4.7: Laminator 2 operation frequency distribution and power analysis ........................ 27
Table 4.8: Laminator 3 valve output, inlet, outlet, pre-set temperatures ................................. 28
Table 4.9: Laminator 3 operation frequency distribution and power analysis ........................ 30
Table 4.10: Laminator 1 valve output, inlet, outlet, pre-set temperatures ............................... 30
Table 4.11: Laminator 1 operation frequency distribution and power analysis ...................... 32
Table 4.12: Laminator 1 savings .............................................................................................. 32
Table 4.13: Laminator 2 valve output, inlet, outlet, pre-set temperatures ............................... 33
Table 4.14: Laminator 2 operation frequency distribution and power analysis ...................... 35
Table 4.15: Laminator 2 savings .............................................................................................. 35
Table 4.16: Laminator 3 valve output, inlet, outlet, pre-set temperatures ............................... 35
Table 4.17: Laminator 3 operation frequency distribution and power analysis ...................... 37
Table 4.18: Laminator 3 savings .............................................................................................. 37
Table 4.19: Pump 4 inlet/outlet temperatures .......................................................................... 38
Table 4.20: Pump 4 flow rate ................................................................................................... 39
Table 4.21: Chiller average inlet/outlet temperature ............................................................... 40
Table 4.22: Pumps power analysis ........................................................................................... 41
viii
Table 4.23: Pumps duty ........................................................................................................... 42
Table 4.24: Laminators average inlet/outlet temperatures ....................................................... 42
Table 4.25: Pumps power savings based on data set 1 .......................................................... 423
Table 5.1: August - October 2018 power bills 45 .................................................................. 425
Table 5.2: Laminator 1 savings ................................................................................................ 425
Table 5.3: Laminator 1 savings ................................................................................................ 436
Table 5.4: Laminator 1 savings ................................................................................................ 436
ix
List of Figures
Figure 1.1: Packaging material machinery layout.. ................................................................... 2
Figure 1.2: Laminators cooling system.. .................................................................................... 2
Figure 1.2: Laminators cooling system as installed. .................................................................. 3
Figure 2.1: Throttling head against flow chart........................................................................... 6
Figure 2.2: Speed control head pressure against flow chart. ..................................................... 7
Figure 2.3: Typical Q-H curves for a centrifugal pump.. .......................................................... 7
Figure 2.4: Measured data for the operating power of a water pump at a valve opening of
100%.. ...................................................................................................................................... 10
Figure 2.5: Flow and pressure head versus operating speed.. ................................................ 111
Figure 2.6: Characteristics of FW temperature leaving the 3-way valve and the 3-way valve
opening position. ...................................................................................................................... 11
Figure 2.7: Optimised cooling design. ..................................................................................... 13
Figure 2.8: Chillers COP curve. Source: (Tetra Pak, 2016) .................................................... 14
Figure 3.1: Power logger taking readings from the pump circuit. ........................................... 16
Figure 3.2: Flexim Ultrasonic Flow meter clamped on water line to cooling tower. .............. 16
Figure 3.3: SCADA system. .................................................................................................... 17
Figure 4.1: Laminator 1 Temperature Profile .......................................................................... 21
Figure 4.2: Laminator 1 Temperature and Valve Output Profile ............................................. 22
Figure 4.3: Valve 1 Output Histogram .................................................................................... 23
Figure 4.4: Laminator 2 Temperature Profile ........................................................................ 266
Figure 4.5: Laminator 2 Temperature and Valve Output Profile ........................................... 266
Figure 4.6: Valve 2 Output Histogram .................................................................................... 27
Figure 4.7: Laminator 3 Temperature Profile ........................................................................ 288
Figure 4.8: Laminator 3 Temperature and Valve Output Profile ............................................. 29
x
Figure 4.9: Valve 3 Output Histogram .................................................................................... 29
Figure 4.10: Laminator 1 Temperature Profile ........................................................................ 31
Figure 4.11: Laminator 1 Temperature and Valve Output Profile ........................................... 32
Figure 4.12: Valve 1 Output Histogram .................................................................................. 33
Figure 4.13: Laminator 2 Temperature Profile ........................................................................ 34
Figure 4.14: Laminator 2 Temperature and Valve Output Profile ......................................... 344
Figure 4.15: Valve 2 Output Histogram ................................................................................ 344
Figure 4.16: Laminator 3 Temperature Profile ...................................................................... 366
Figure 4.17: Laminator 3 Temperature and Valve Output Profile ......................................... 366
Figure 4.18: Valve 3 Output Histogram ................................................................................ 377
Figure 4.19: Cooling Tower Temperature Profile ................................................................... 38
Figure 4.20: Volumetric Flow Rate ......................................................................................... 39
Figure 5.1: Flow against power ............................................................................................... 42
Figure 5.2: Laminator 2 Temperature and Valve Output Profile ............................................. 43
Figure 5.3: Laminator 2 Temperature and Valve Output Profile ............................................. 44
xi
List of Symbols and Abbreviations
𝑨𝑪 Alternating Current
𝑪𝑶𝑷 Coefficient of Performance
I Current
𝑫𝑪 Direct Current
𝑬 Energy
EC Energy Cost
𝑸 Flow Rate
𝑯 Head
𝑯𝑽𝑨𝑪 Heating Ventilation Air Conditioning
𝑯𝒛 Hertz
𝑯𝑷 Horsepower
𝒌𝑾𝒉 Kilowatt Hours
ṁ Mass Flow Rate
𝑷 Power
pf Power Factor
Cp Specific Heat Capacity
𝑵 Speed
SCADA Supervisory Control and Data Acquisition
ΔT Temperature Difference
𝑽𝑺𝑫 Variable Speed Drive
V
RT
Voltage
Refrigeration Tons
TBA
TFA
PLC
PID
TetraBrikAseptic
Tetra Fino Aseptic
Programable logic controller
Proportional Integral Derivative
1
CHAPTER 1
Introduction
This chapter describes the project site and operations, the cooling plant under study, overview
of variable speed drives, project problem statement and research objectives.
1.1 Project Site and Packaging Paper Manufacturing
The research project was conducted at Tetra Pak Limited located on Likoni/Enterprise Road
Industrial area Nairobi, Kenya. Tetra Pak deals in packaging materials for use in food
industries. The packaging is mainly for dairy products, juices and nectars, ice cream, cheese,
food and vegetables. To realise its manufacturing and business objectives, Tetra Pak has
invested in machinery for production processes which demand a range of utilities. These
utilities include; electricity, water, natural gas and compressed air. The utilities drive process
motors, fans, pumps, air compressors, refrigeration, as well as building lighting and HVAC
systems. Some of the energy consuming machines and equipment are cooling towers, chillers,
general lighting, printers, laminators, slitters, doctors, shrink tunnels, stretch wrappers,
ventilation fans and conveyors. The key raw material is paper delivered as rolls. First, the paper
undergoes printing as desired, then creased/punched to reduce stiffness thereby improving
folding. Thereafter, lamination is done to ensure the paper does not experience any leakage nor
will the packaged product be exposed to sunlight UV radiation. This protection is achieved by
using aluminium foil for protection. Finally, the packing material is slit and sized as per the
consumer requirement, at this point the packaging material is ready for dispatch.
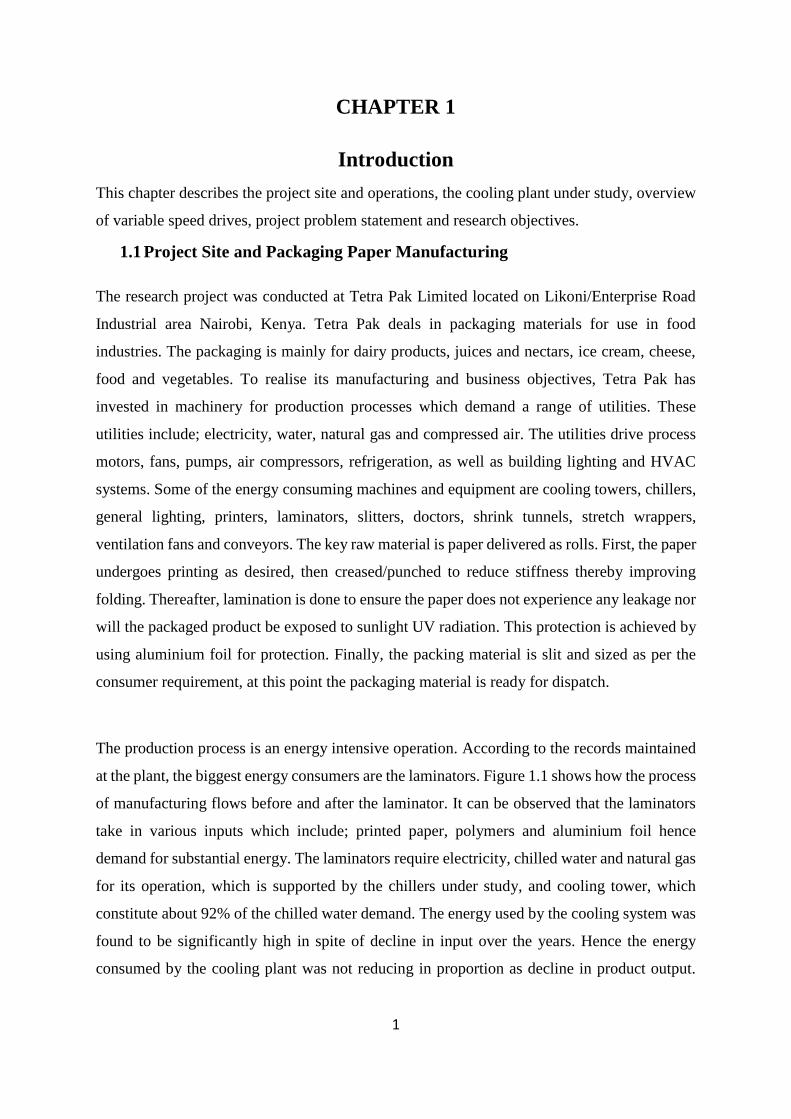
The production process is an energy intensive operation. According to the records maintained
at the plant, the biggest energy consumers are the laminators. Figure 1.1 shows how the process
of manufacturing flows before and after the laminator. It can be observed that the laminators
take in various inputs which include; printed paper, polymers and aluminium foil hence
demand for substantial energy. The laminators require electricity, chilled water and natural gas
for its operation, which is supported by the chillers under study, and cooling tower, which
constitute about 92% of the chilled water demand. The energy used by the cooling system was
found to be significantly high in spite of decline in input over the years. Hence the energy
consumed by the cooling plant was not reducing in proportion as decline in product output.
2
This necessitated a study to be commissioned on the cooling plant to establish what needs to
be improved.
Figure 1.1: Packaging material machinery layout [1].
1.2 Cooling Plant
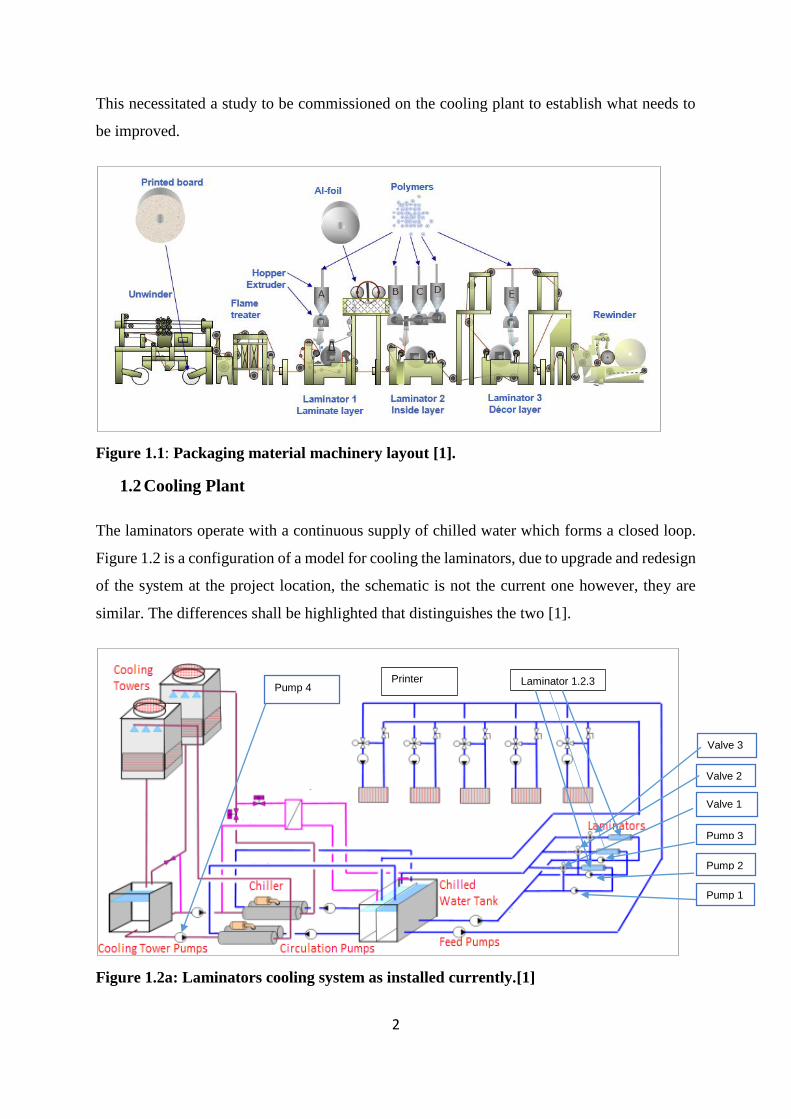
The laminators operate with a continuous supply of chilled water which forms a closed loop.
Figure 1.2 is a configuration of a model for cooling the laminators, due to upgrade and redesign
of the system at the project location, the schematic is not the current one however, they are
similar. The differences shall be highlighted that distinguishes the two [1].
Figure 1.2a: Laminators cooling system as installed currently.[1]
Pump 1
Pump 2
Pump 3
Valve 3
Valve 2
Valve 1
Pump 4 Printer Laminator 1,2,3
3
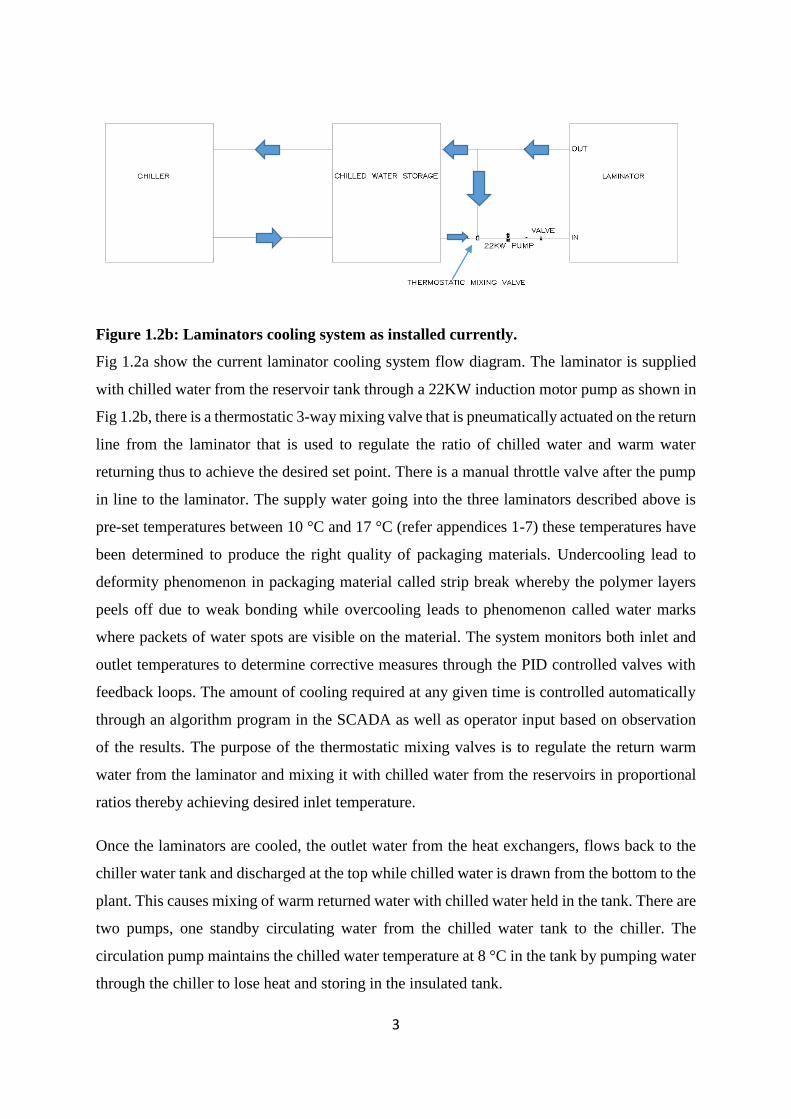
Figure 1.2b: Laminators cooling system as installed currently.
Fig 1.2a show the current laminator cooling system flow diagram. The laminator is supplied
with chilled water from the reservoir tank through a 22KW induction motor pump as shown in
Fig 1.2b, there is a thermostatic 3-way mixing valve that is pneumatically actuated on the return
line from the laminator that is used to regulate the ratio of chilled water and warm water
returning thus to achieve the desired set point. There is a manual throttle valve after the pump
in line to the laminator. The supply water going into the three laminators described above is
pre-set temperatures between 10 °C and 17 °C (refer appendices 1-7) these temperatures have
been determined to produce the right quality of packaging materials. Undercooling lead to
deformity phenomenon in packaging material called strip break whereby the polymer layers
peels off due to weak bonding while overcooling leads to phenomenon called water marks
where packets of water spots are visible on the material. The system monitors both inlet and
outlet temperatures to determine corrective measures through the PID controlled valves with
feedback loops. The amount of cooling required at any given time is controlled automatically
through an algorithm program in the SCADA as well as operator input based on observation
of the results. The purpose of the thermostatic mixing valves is to regulate the return warm
water from the laminator and mixing it with chilled water from the reservoirs in proportional
ratios thereby achieving desired inlet temperature.
Once the laminators are cooled, the outlet water from the heat exchangers, flows back to the
chiller water tank and discharged at the top while chilled water is drawn from the bottom to the
plant. This causes mixing of warm returned water with chilled water held in the tank. There are
two pumps, one standby circulating water from the chilled water tank to the chiller. The
circulation pump maintains the chilled water temperature at 8 °C in the tank by pumping water
through the chiller to lose heat and storing in the insulated tank.
4
The screw compressor chiller installed is a water-cooled type thereby operates with a cooling
tower to extract heat from the condenser. The pump is rated 30 kW with an average flow rate
of 161 m3/hr.
1.3 Problem Statement
While, production industries cannot control the rise of energy prices, they can control the
consumption of energy by adapting various energy conservation techniques in their plants. The
current operational cooling system at Tetra Pak is such that the pumps, fans and motors run at
full capacity throughout the operation period whereas the cooling load varies with production.
Scientifically, this nature of operation expends energy that could be saved by implementing
variable speed control mechanism with feedback loops from the cooling loads thus varying
performance of the motors subsequently energy demand.
In light of the established findings of energy conservation in modern motor-process control,
this research aims at reviewing the current cooling system for the laminators and establish the
impact of retrofitting the existing control mechanism operating on pneumatically controlled
throttling valves on the chilled water supply line with electrical variable speed drive for the
motor pump.
1.4 Research Objectives
The main objective of this project is to assess the existing cooling system and establish energy
and related cost losses due to throttling valve flow control mechanism while proposing
application of electrical variable speed drive. The specific objectives are:
1. To establish energy consumption of the existing pumping system on the laminator
cooling circuits.
2. To determine energy savings in retrofitting electrical variable speed drives on pumps
and eliminating throttle valves.
3. To determine payback period of the retrofit project
5
CHAPTER 2
Literature Review
2.1 Introduction
This chapter presents detailed literature on industrial pumping and flow control mechanisms,
application of variable speed drives on pumping systems, performance of cooling systems, and
economic analysis.
2.2 Pumping and Flow control
Industrial pumps can be categorised in two broad categories i.e positive displacement pumps
and dynamic (centrifugal) pumps. The positive displacement pumps apply mechanical means
to vary the size (or move) of the fluid chamber to cause the fluid to flow. On the other hand,
centrifugal pumps impart momentum on the fluid by rotating impellers immersed in the fluid.
This momentum hence produces an increase in pressure or flow at the pump outlet [2].
The other characteristic of positive displacement pumps is that they have a constant torque
profile, while centrifugal pumps have a variable torque. Rockwell Automation corporation
highlights the two common methods applied in varying flow in centrifugal pumps. The first is
throttling which changes the system curve by use of a control or throttling valve and the other
is to vary the speed of the pump, which modifies the pump curve. [2]
2.2.1 Throttling Control
Throttling controls flow by obstructing fluid flowing thereby increasing the head pressure. This
is shown on Figure 2.1, which shows the performance curve of a throttled system and a fully
open system [2].

6
Figure 2.1: Throttling head against flow chart. [2]
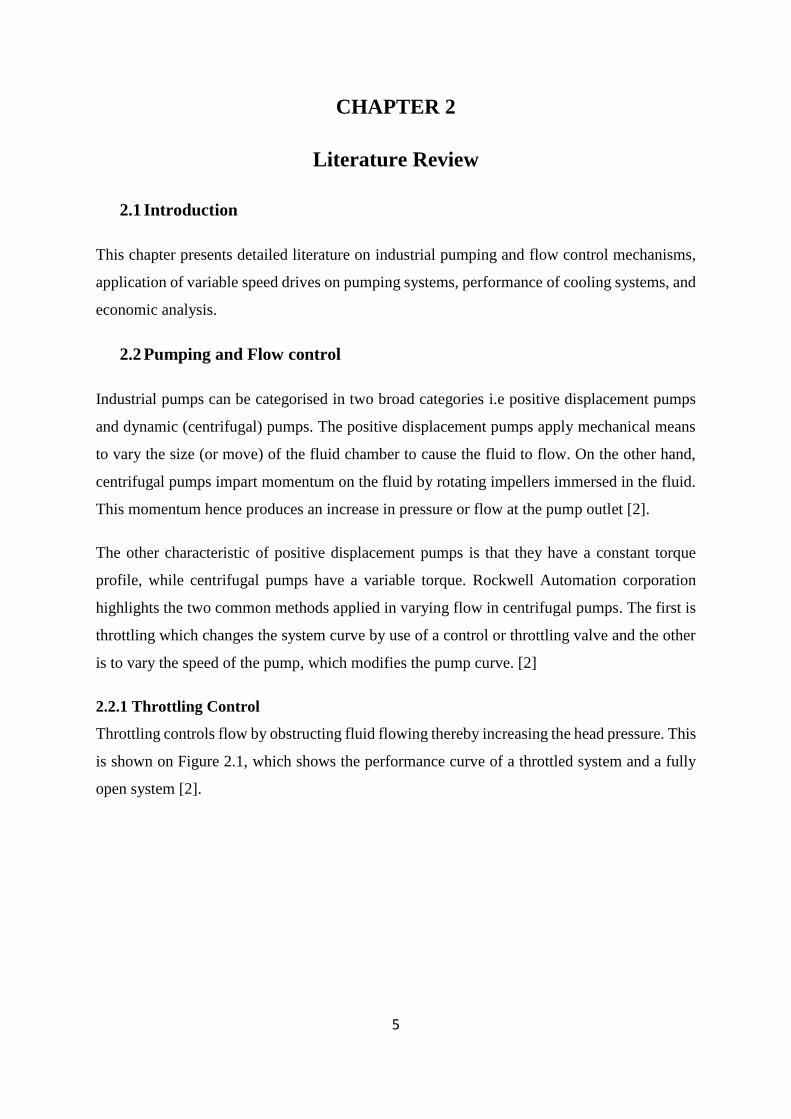
2.2.2 Variable Speed Control
Variable speed drives also referred to as variable frequency drives are electronic motor speed
controllers that facilitate the variance of AC induction motor speed. Considering the constant
motor speed in various applications, response to changing process conditions would result in
energy wastage if the same is not matched by altering the motor speed. In applications where
induction motors are prime movers of pumps, fans and compressors, the mechanical power
required for operation is cube of the fluid flow rate.
Therefore, a reduction of flow to 80% of the nominal value would half the mechanical power
to meet the demand. Conventional mechanisms of flow control like dampers or valves result in
loss of the energy savings, whereas application of variable speed drives would enable
proportional response to changing flow continuously thereby translating to direct energy and
cost savings [3].
As it was noted by Rockwell Automation on the impact of variable speed on centrifugal pumps,
Figure 2.2 demonstrates the changes in the head with speed variance. The variable speed
system takes advantage of the change in pump characteristics that occur when the impeller
speed is changed [2,3].
7
Figure 2.2: Speed Control Head Pressure against Flow chart. [2]
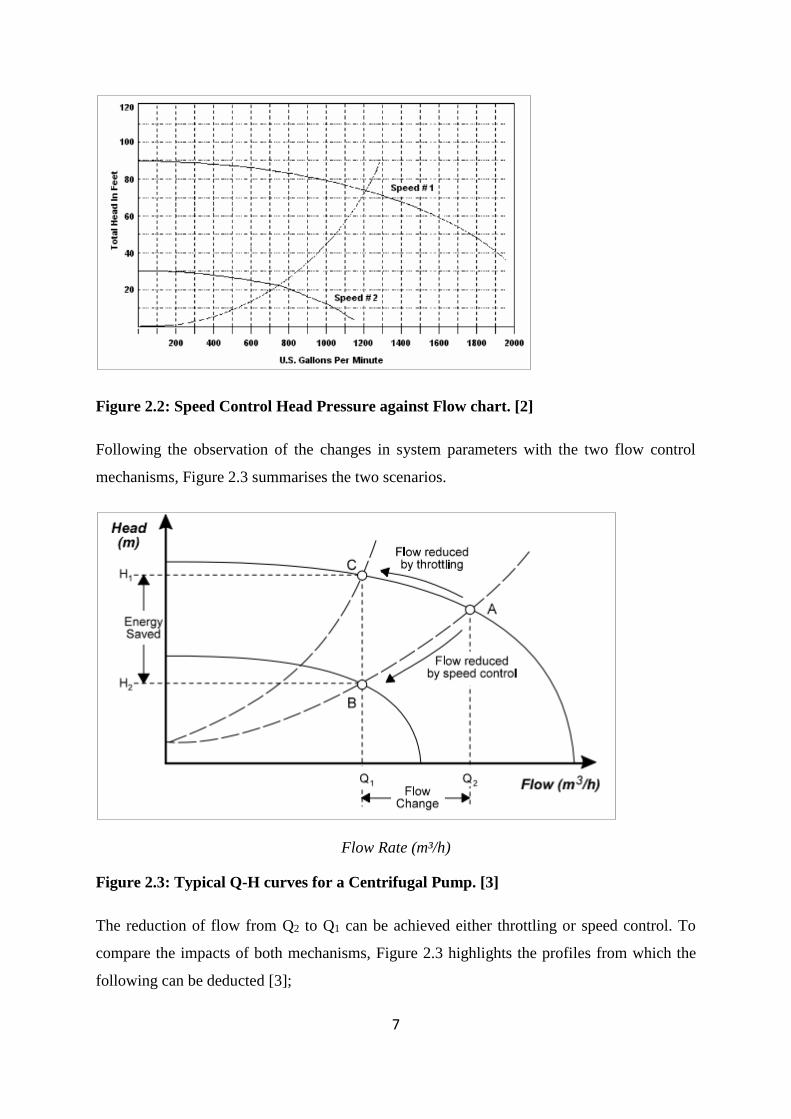
Following the observation of the changes in system parameters with the two flow control
mechanisms, Figure 2.3 summarises the two scenarios.
Flow Rate (m³/h)
Figure 2.3: Typical Q-H curves for a Centrifugal Pump. [3]
The reduction of flow from Q2 to Q1 can be achieved either throttling or speed control. To
compare the impacts of both mechanisms, Figure 2.3 highlights the profiles from which the
following can be deducted [3];
8
1. Speed control, flow decreases along the curve A–B and to a point on another Q–H
curve. As the speed falls, the pressure/head reduces mainly due to the reduction of
friction in the pipes. A new stable flow of Q1 m3/h is reached at point B and results in a
head of H2.
2. Throttle control, an upstream valve is partially closed to restrict the flow. As the
pressure/head is increased by the valve, the flow decreases along the curve A–C. The
new stable flow of Q1 m3/h is reached at point C and results in a head of H1.
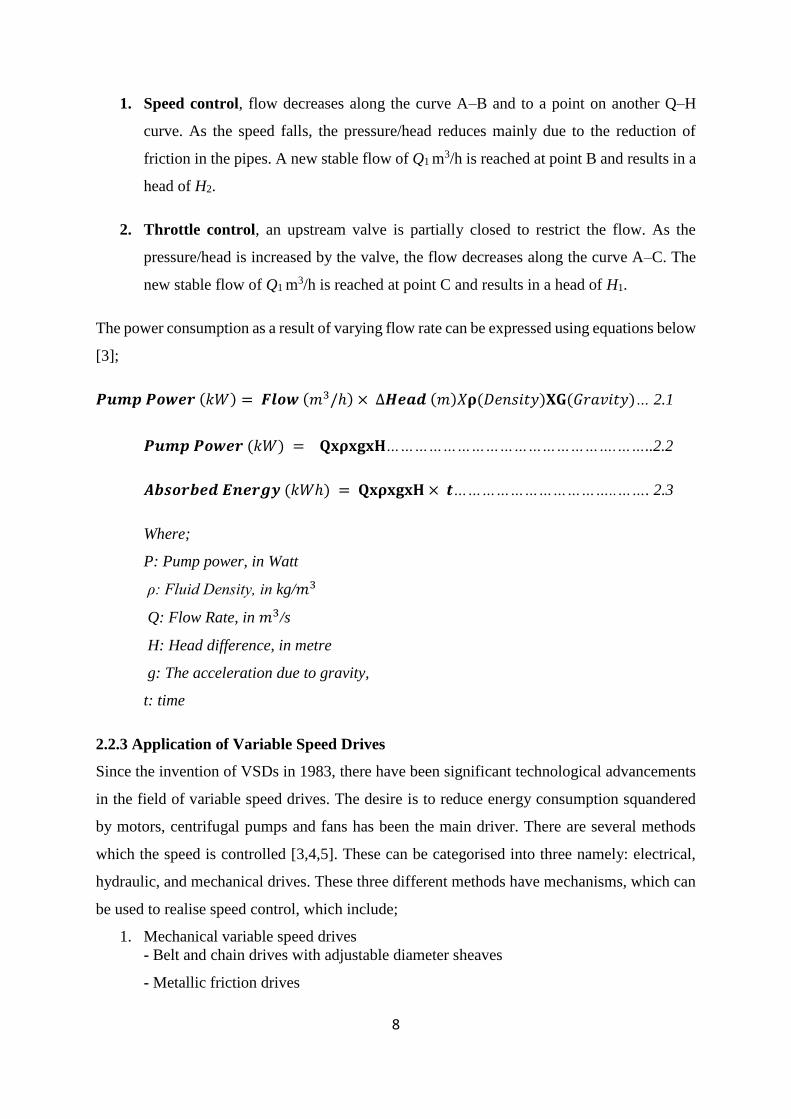
The power consumption as a result of varying flow rate can be expressed using equations below
[3];
𝑷𝒖𝒎𝒑 𝑷𝒐𝒘𝒆𝒓 (𝑘𝑊) = 𝑭𝒍𝒐𝒘 (𝑚3/ℎ) × ∆𝑯𝒆𝒂𝒅 (𝑚)𝑋𝛒(𝐷𝑒𝑛𝑠𝑖𝑡𝑦)𝐗𝐆(𝐺𝑟𝑎𝑣𝑖𝑡𝑦)… 2.1
𝑷𝒖𝒎𝒑 𝑷𝒐𝒘𝒆𝒓 (𝑘𝑊) = 𝐐𝐱𝛒𝐱𝐠𝐱𝐇………………………………………….……..2.2
𝑨𝒃𝒔𝒐𝒓𝒃𝒆𝒅 𝑬𝒏𝒆𝒓𝒈𝒚 (𝑘𝑊ℎ) = 𝐐𝐱𝛒𝐱𝐠𝐱𝐇 × 𝒕……………………………..……. 2.3
Where;
P: Pump power, in Watt
ρ: Fluid Density, in kg/𝑚3
Q: Flow Rate, in 𝑚3/s
H: Head difference, in metre
g: The acceleration due to gravity,
t: time
2.2.3 Application of Variable Speed Drives
Since the invention of VSDs in 1983, there have been significant technological advancements
in the field of variable speed drives. The desire is to reduce energy consumption squandered
by motors, centrifugal pumps and fans has been the main driver. There are several methods
which the speed is controlled [3,4,5]. These can be categorised into three namely: electrical,
hydraulic, and mechanical drives. These three different methods have mechanisms, which can
be used to realise speed control, which include;
1. Mechanical variable speed drives
- Belt and chain drives with adjustable diameter sheaves
- Metallic friction drives
9
2. Hydraulic variable speed drives
- Hydrodynamic types
- Hydrostatic types
3. Electrical variable speed drives
- Schrage motor (AC commutator motor)
- Ward-Leonard system (AC motor – DC generator – DC motor)
- Variable voltage DC converter with DC motor
- Variable voltage variable frequency converter with AC motor
- Slip control with wound rotor induction motor (slip-ring motor)
- Cycloconverter with AC motor
- Electromagnetic coupling or ‘Eddy Current’ coupling
- Positioning drives (servo and stepper motors)
The variable speed drives are best suited for control of flow and pressure in systems driven by
AC induction motors. This is based on the correlation between flow and speed of the motor.
Such systems include;
1. Fans and pumps: In applications where the flow of fluid is variable, considerable
energy savings can be achieved by replacing existing throttling valves and dampers
with VSDs.
2. Conveyors: For conveyors with varying speed or with varying material flow, a VSD
can adjust to the changing load requirements.
3. Compressors and chillers: In the same manner as fans and pumps, compressors can
take advantage of the energy saving that is achieved by varying the flow with a VSD.
2.2.4 Variable Speed Drive Control Loops
A drive that controls both voltage and frequency is referred to as variable voltage variable
frequency (VVVF) controller. The digital control system therefore automates the process. The
type of control used in a variable speed drive system influences the accuracy and response of
the system to the changing variable. There are three main types of control loops that can be
adopted [3]. These are:
1. Simple open-loop control, no feedback from the process
2. Closed-loop control, feedback of a process variable
3. Cascade closed-loop control, feedback from more than one variable
10
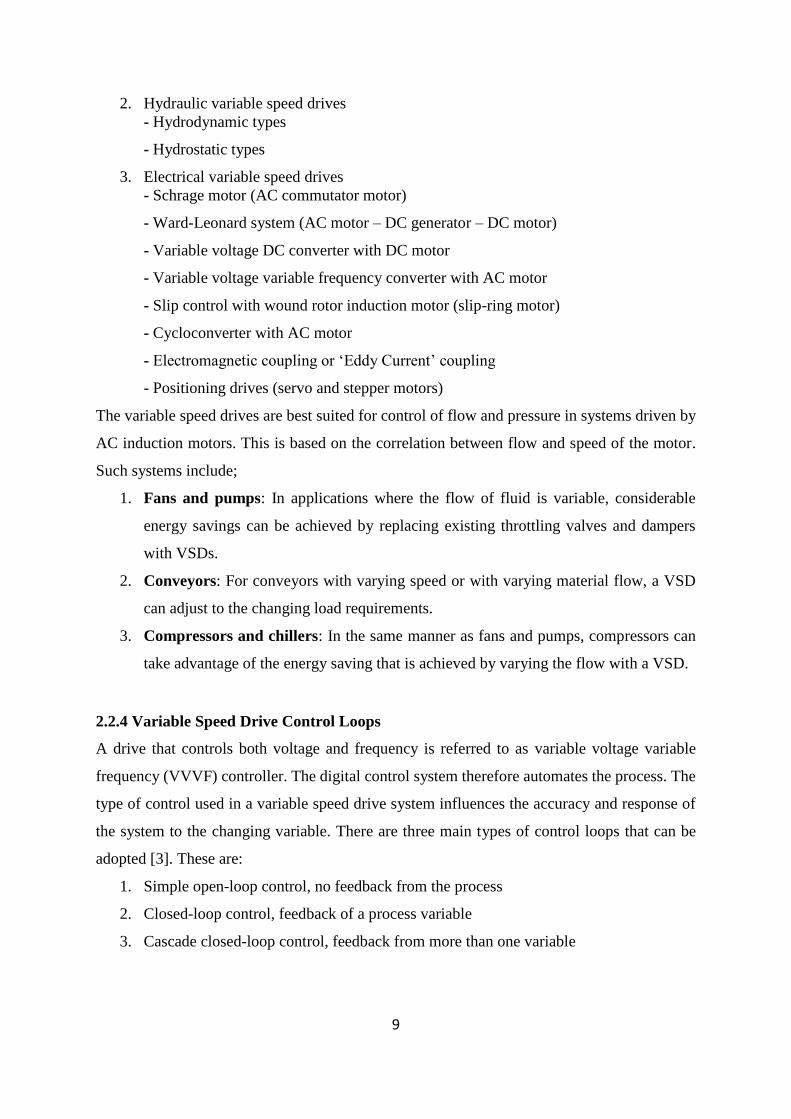
2.2.5 Variable Speed Drives in Cooling Systems
Various studies have shown that application of variable speed drives reduce energy
consumption. In a study conducted by Song and Zhao in 2017, application of variable speed
drive on a closed system show that by keeping the throttling valve fully open and regulating
the flow using a speed drive reduced the power demand of a 2.2 kW motor substantially. Table
2.1 show the trend of speed control by varying frequency against power [5].
Table 2.1: Trend of speed control by varying frequency against power [5]
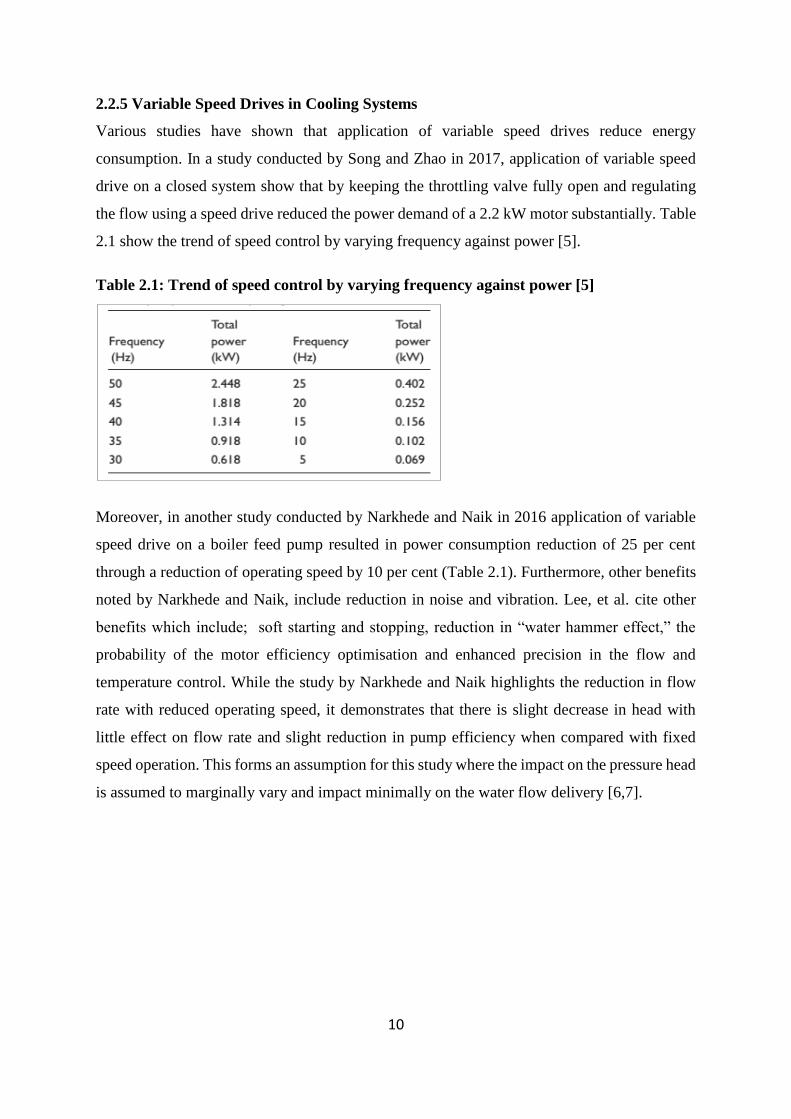
Moreover, in another study conducted by Narkhede and Naik in 2016 application of variable
speed drive on a boiler feed pump resulted in power consumption reduction of 25 per cent
through a reduction of operating speed by 10 per cent (Table 2.1). Furthermore, other benefits
noted by Narkhede and Naik, include reduction in noise and vibration. Lee, et al. cite other
benefits which include; soft starting and stopping, reduction in “water hammer effect,” the
probability of the motor efficiency optimisation and enhanced precision in the flow and
temperature control. While the study by Narkhede and Naik highlights the reduction in flow
rate with reduced operating speed, it demonstrates that there is slight decrease in head with
little effect on flow rate and slight reduction in pump efficiency when compared with fixed
speed operation. This forms an assumption for this study where the impact on the pressure head
is assumed to marginally vary and impact minimally on the water flow delivery [6,7].
11
Figure 2.4: Power without and with VFD v/s Pump operating speed % [6].
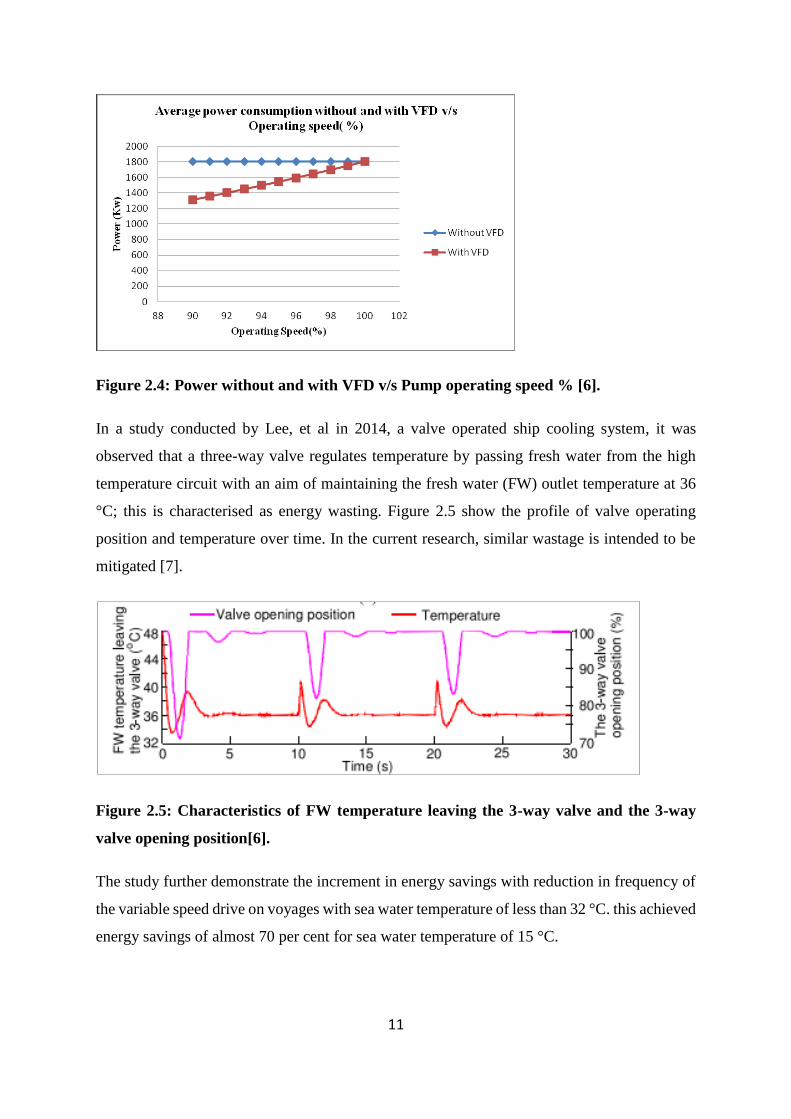
In a study conducted by Lee, et al in 2014, a valve operated ship cooling system, it was
observed that a three-way valve regulates temperature by passing fresh water from the high
temperature circuit with an aim of maintaining the fresh water (FW) outlet temperature at 36
°C; this is characterised as energy wasting. Figure 2.5 show the profile of valve operating
position and temperature over time. In the current research, similar wastage is intended to be
mitigated [7].
Figure 2.5: Characteristics of FW temperature leaving the 3-way valve and the 3-way
valve opening position[6].
The study further demonstrate the increment in energy savings with reduction in frequency of
the variable speed drive on voyages with sea water temperature of less than 32 °C. this achieved
energy savings of almost 70 per cent for sea water temperature of 15 °C.
12
Considering the constant motor speed in various applications, response to changing process
conditions would result in energy wastage if the same is not matched by altering the motor
speed. In applications where induction motors are prime movers of pumps, fans and
compressors, the mechanical power required for operation is cube of the fluid flow rate.
Therefore, a reduction of flow to 80% of the nominal value would half the mechanical power
to meet the demand. Conventional mechanisms of flow control like dampers or valves result in
loss of the energy savings, whereas application of electrical variable speed drives would enable
proportional response to changing flow continuously thereby translating to direct energy and
cost savings.
According to a report by Natural Resources Canada on variable frequency drives, a case study
at a dairy facility where a vacuum pump whose control mechanism was through bleeding air
to the atmosphere was retrofitted with VFD demonstrated significant savings. The project
involved replacement of existing motor with a high efficiency one with lower rating and a
VFD. This resulted in 30% saving of the system’s total capacity without any reducing vacuum
pressure nor system capacity. Through the project implementation, there was a saving of
$5,520 and 55,000 kWh at a cost of $8,200 which paid back in 1.5 years. [9].
2.3 Justification of Saving
According to a research performed, a 20 HP motor operating 24 hours, 365 days a year at 100%
speed assuming Rs. 5/kWh would result in an operating cost of Rs. 653,496. Considering the
pump load schedule is: 20% of the time at 50% full speed; 50% of the time at 80% full speed;
and 30% of the time at 100% full speed, installing a VFD would result in a saving of Rs.
273,816 which is equivalent to 42% cost savings [4].
2.4 Performance of Cooling System
Fans like pumps follow affinity laws. This means that the air flow is proportional to the speed.
The fan's power usage is half when speed is reduced by 20% and cooling capacity is reduced
to 87%. A similar case is demonstrated on pump study shown on Figure 2.6. The savings
realised using variable speed drives follows affinity laws. The laws are expressed in equation
2.4: [10]
𝑄1
𝑄2=
𝑁1
𝑁2 𝑜𝑟
𝐻1
𝐻2= [
𝑁1
𝑁2]
2𝑜𝑟
𝑃1
𝑃2= [
𝑁1
𝑁2]
3…………………………… 2. 4
13
Where;
Q = flow rate
N = Speed
H = Head
P = Power
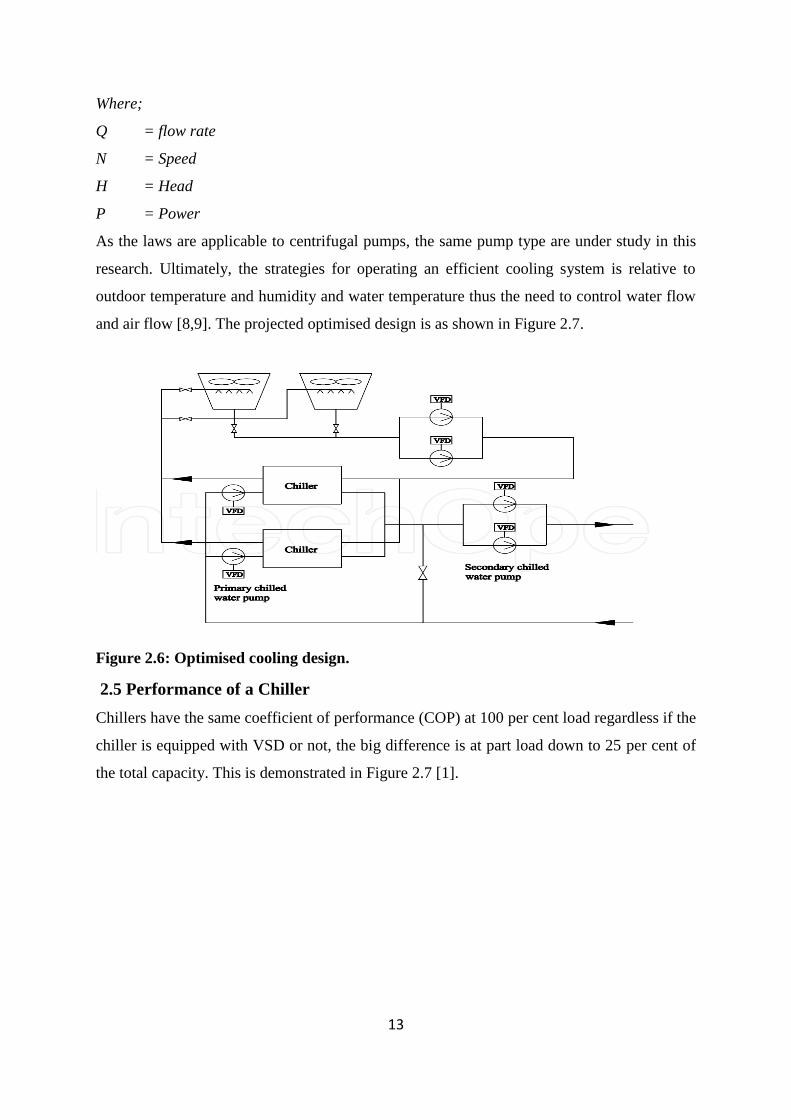
As the laws are applicable to centrifugal pumps, the same pump type are under study in this
research. Ultimately, the strategies for operating an efficient cooling system is relative to
outdoor temperature and humidity and water temperature thus the need to control water flow
and air flow [8,9]. The projected optimised design is as shown in Figure 2.7.
Figure 2.6: Optimised cooling design.
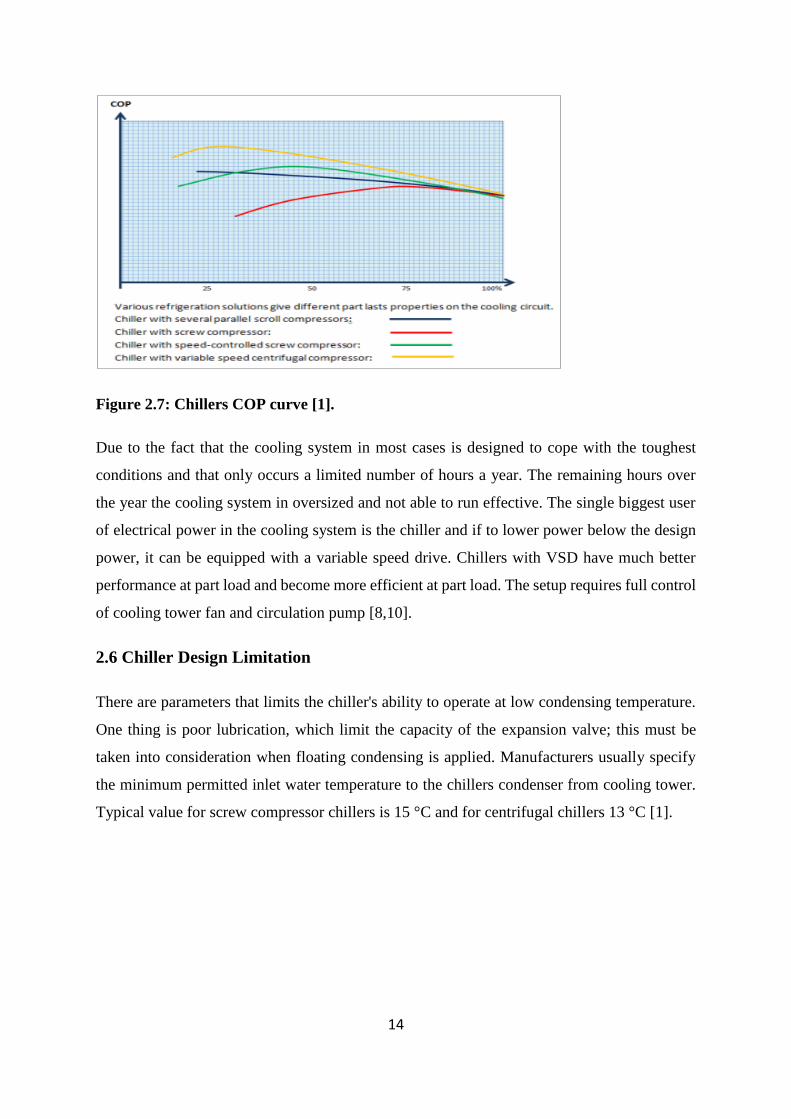
2.5 Performance of a Chiller
Chillers have the same coefficient of performance (COP) at 100 per cent load regardless if the
chiller is equipped with VSD or not, the big difference is at part load down to 25 per cent of
the total capacity. This is demonstrated in Figure 2.7 [1].
14
Figure 2.7: Chillers COP curve [1].
Due to the fact that the cooling system in most cases is designed to cope with the toughest
conditions and that only occurs a limited number of hours a year. The remaining hours over
the year the cooling system in oversized and not able to run effective. The single biggest user
of electrical power in the cooling system is the chiller and if to lower power below the design
power, it can be equipped with a variable speed drive. Chillers with VSD have much better
performance at part load and become more efficient at part load. The setup requires full control
of cooling tower fan and circulation pump [8,10].
2.6 Chiller Design Limitation
There are parameters that limits the chiller's ability to operate at low condensing temperature.
One thing is poor lubrication, which limit the capacity of the expansion valve; this must be
taken into consideration when floating condensing is applied. Manufacturers usually specify
the minimum permitted inlet water temperature to the chillers condenser from cooling tower.
Typical value for screw compressor chillers is 15 °C and for centrifugal chillers 13 °C [1].
15
CHAPTER 3
Methodology
3.1 Introduction
This chapter describes the procedures that were applied towards realisation of the project
objectives. This study analysed energy consumption of the cooling system and performance,
which was used to determine benefits that could be realised by implementing a VSD controlled
pumping.
Measurements and analysis of the key operational parameters of the cooling system were
therefore evaluated. Engineering calculations based on the equations (2.1-3.3) assumptions
(see section 3.5) and established scientific data were applied to determine energy consumption,
savings and performance. The outcome was quantified in monetary terms to determine viability
of the project. The cooling system was evaluated under steady state conditions to establish
consumption of electricity and performance.
3.2 Characteristics of existing cooling pumping system.
The laminators 1,2 and 3 are supplied with cooling water from identical pumps which are
coupled to motors rated 22kW. The motors have a constant speed of 2940 rpm with star
connections.
3.3 To establish energy consumption of the existing cooling pumping system.
Energy consumption was derived from electrical energy that was drawn for the pumps
supplying chilled water to the laminators;
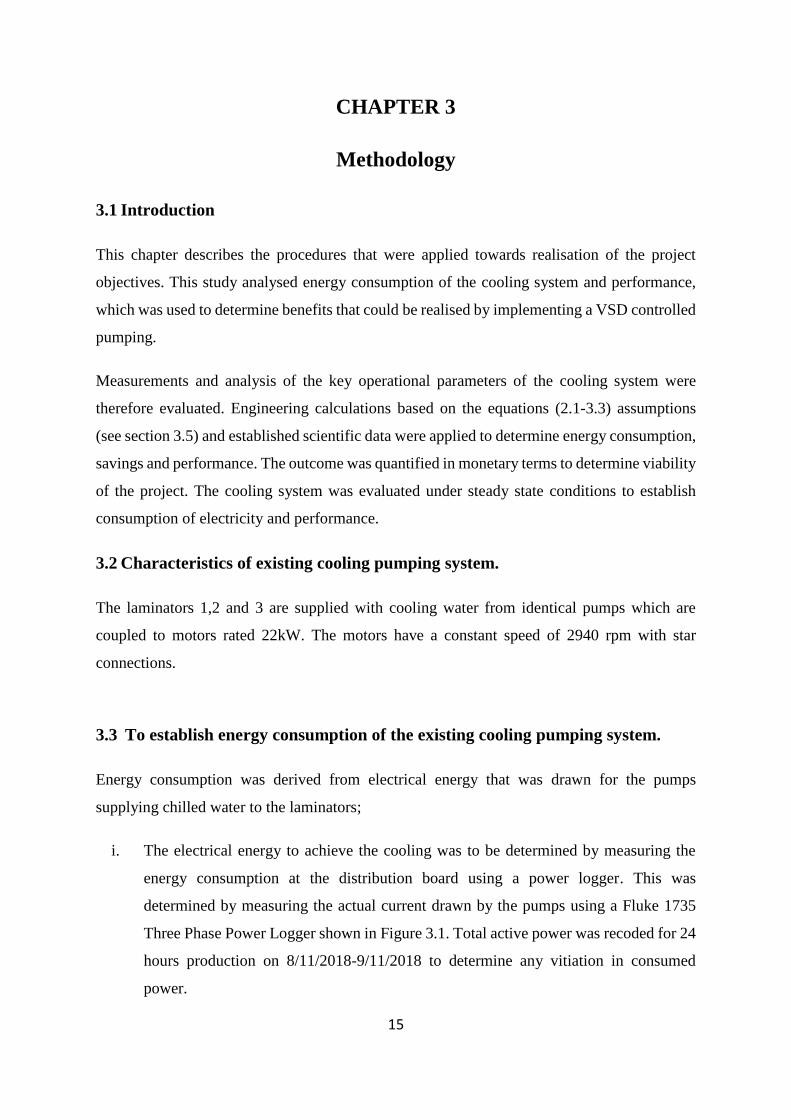
i. The electrical energy to achieve the cooling was to be determined by measuring the
energy consumption at the distribution board using a power logger. This was
determined by measuring the actual current drawn by the pumps using a Fluke 1735
Three Phase Power Logger shown in Figure 3.1. Total active power was recoded for 24
hours production on 8/11/2018-9/11/2018 to determine any vitiation in consumed
power.
16
Figure 3.1: Power logger taking readings from the pump circuit.
The main specifications of the power logger are:
• Fluke 1735 Three Phase Power Logger
• Error due to power factor PF
• Maximum range with voltage range 830 V delta connection and 3000 A current range
Intrinsic error ± (0.7 % of m.v. + 15 digit)
Resolution 1 kW
Operating error ± (1.5 % of m.v. + 20 digit)
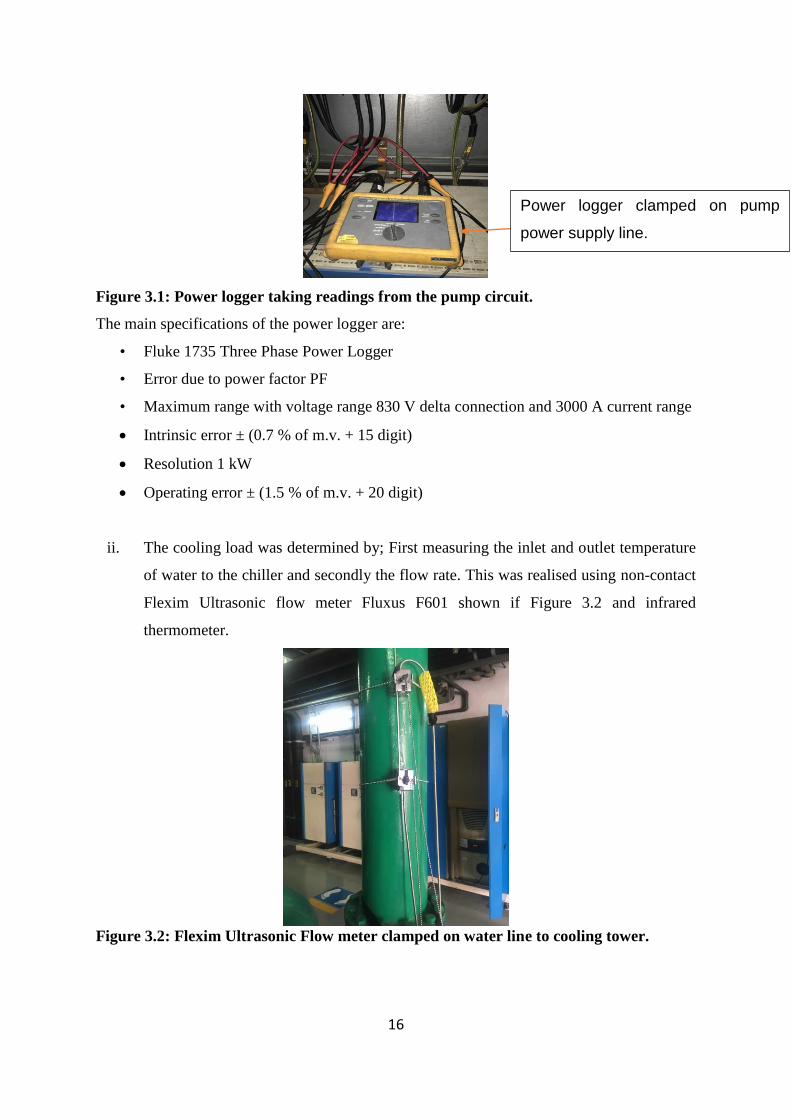
ii. The cooling load was determined by; First measuring the inlet and outlet temperature
of water to the chiller and secondly the flow rate. This was realised using non-contact
Flexim Ultrasonic flow meter Fluxus F601 shown if Figure 3.2 and infrared
thermometer.
Figure 3.2: Flexim Ultrasonic Flow meter clamped on water line to cooling tower.
Power logger clamped on pump
power supply line.
17
The main specifications of the ultrasonic meter are:
• Transmitter type-F601
• Quantities of measurement- Volume flow, mass flow
• Accuracy-0.01m/s
• Range-0.01-25m/s
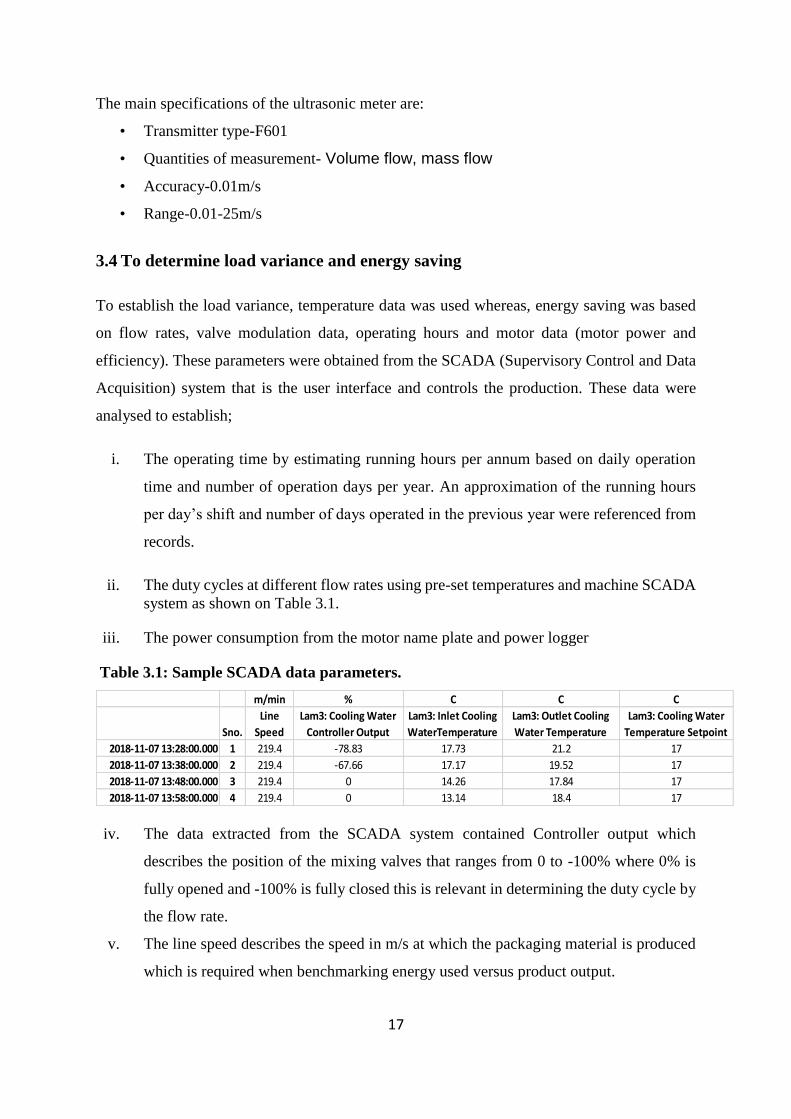
3.4 To determine load variance and energy saving
To establish the load variance, temperature data was used whereas, energy saving was based
on flow rates, valve modulation data, operating hours and motor data (motor power and
efficiency). These parameters were obtained from the SCADA (Supervisory Control and Data
Acquisition) system that is the user interface and controls the production. These data were
analysed to establish;
i. The operating time by estimating running hours per annum based on daily operation
time and number of operation days per year. An approximation of the running hours
per day’s shift and number of days operated in the previous year were referenced from
records.
ii. The duty cycles at different flow rates using pre-set temperatures and machine SCADA
system as shown on Table 3.1.
iii. The power consumption from the motor name plate and power logger
Table 3.1: Sample SCADA data parameters.
iv. The data extracted from the SCADA system contained Controller output which
describes the position of the mixing valves that ranges from 0 to -100% where 0% is
fully opened and -100% is fully closed this is relevant in determining the duty cycle by
the flow rate.
v. The line speed describes the speed in m/s at which the packaging material is produced
which is required when benchmarking energy used versus product output.
m/min % C C C
Sno.
Line
Speed
Lam3: Cooling Water
Controller Output
Lam3: Inlet Cooling
WaterTemperature
Lam3: Outlet Cooling
Water Temperature
Lam3: Cooling Water
Temperature Setpoint
2018-11-07 13:28:00.000 1 219.4 -78.83 17.73 21.2 17
2018-11-07 13:38:00.000 2 219.4 -67.66 17.17 19.52 17
2018-11-07 13:48:00.000 3 219.4 0 14.26 17.84 17
2018-11-07 13:58:00.000 4 219.4 0 13.14 18.4 17
18
vi. Inlet cooling water in ºC into the cooling drums of the laminator, while outlet is the
temperature at with the water leaves the cooling drums.
vii. The Data obtained from the SCADA is recorded at 10mins interval. The intervals are
pre-set in the program algorithm.
3.5 Implementation of VSD on the system using 4-20mA Siemens 30hp VFD Box,
6SL3710-1BJ24-5AR0.
From equation 2.4, the relationship between speed and flow rate is a direct proportional
relationship. Therefore, reduction of pump speed will result in reduction of fluid flow to an
equal proportion. The speed of the pumps was observed using a Tachometer to establish if it
conforms with the rated specifications on the nameplate.
To implement the VSDS on the system, Various parameters from the calculated load variance
and duty cycle will be used. A PLC output from the controller will be configured to give
analogue signal of 4-20mA that can be used to regulate the speed of the motor.
These outputs will be assigned as follows.
I. The VSD will operate with 4-20 mA signal from the PLC Analogue output
II. 4mA will be equivalent to 0 rpm or 0% flow rate and 20mA will be equivalent to 2940
rpm or 100% flow rate.
III. Analysis of the output will be based on calculated theoretical values from affinity law.
IV. Once the proposal is implemented the energy consumption will be evaluated by taking
measurements of power consumptions on each drive and comparisons made with
current status.
3.6 Economic Analysis
The economic analysis was performed based on the outcomes of technical assessment and
feasibility;
i. The energy savings on a motor system is determined using three main parameter
Motor power consumed, operating hours and duty cycle.
ii. Equation 3.1 below is used to determine the savings;[4]
𝐸 = 𝑃 × 𝑇 × 𝑁 ……….……………………………………3.1
Therefore, to establish the resulting cost savings, equation 3.2 is applied;
19
𝐸𝐶 = 𝑃 × 𝑇 × 𝑁 × 𝐶……………………….……….……. 3.2
Where;
E = energy
P = power
T = operating time
N = pump duty
C = unit energy cost
EC = total energy cost
iii. The energy saved is computed by determining the difference in energy consumed
without a VSD and with a VSD. The resulting energy saved is multiplied by unit
energy cost to establish the energy cost savings. To determine the payback period
within which the initial investment (includes cost of cables, VSD and installation)
is recouped, Equation 3.3 is used;[4]
Payback period =Cost of Investment
Annual savings…………………………………….…3.3
iv. Determining electricity price per kWh based on the average unit price for the past
3 months (August, September and October 2018).
v. Total energy cost while using modulating valves and VSD and subsequent cost
saving.
vi. Investment cost of the project inclusive of cost of VSD, installation and auxiliaries.
vii. Determining payback period of the project.
3.7 Assumptions
Due to uncertainties, the following assumptions were taken into consideration while
conducting the research;
i. Electric energy conversion within the system has limited losses.
ii. The heat exchange surfaces were fairly free from fouling
iii. Steady state conditions
iv. The factory is in production 24 hours a day (2 shifts), each shift is 8hours 300 days in
a year = 4800 hours
20
CHAPTER 4
Technical Analysis
4.1. Introduction
This chapter details the outcomes of the research findings. The objectives of the study are met
through quantification of cost, power and energy usage in pumping with and without variable
speed drive following the methodology outlined and calculations based on the equations in
literature review.
The four pumps on site were analysed independently where three had similar characteristics
therefore analysis was performed using the same approach. The three similar pumps operating
with throttling valves as flow control mechanism have been referred to as pump 1 (for laminator
1), pump 2 (for laminator 2), pump 3 (for laminator 3) and the other as pump 4 (for cooling
tower). The measured full flow rate from the pump was found to be 80m³
To acquire a broad range of data to analyse the pumps, two data sets for each of the similar
pumps were taken for October and November 2018 under similar operating conditions. These
have been analysed in depth below. Calculation on how the results were arrived at have been
done for pump 1 and pump 4 while the rest have been evaluated in a similar fashion.
4.2. Data Set 1 obtained between 15-10-2018 and 19-10-2018 running TFA
packaging material Results
4.2.1. Pump 1
The temperature profiles of inlet water, outlet water and set point at laminator 1 were reviewed
to establish variance due to the control mechanism in place. The profile was as shown on Figure
4.1. The time scale is numbered to represent time in intervals of 10 minutes between 2018-10-
18 09:21am for designation 1 and 145 for 2018-10-19 08:41am the parameters were recorded
in the PLC. The data presented in this chapter is summarised from actual data that is recorded
in Appendices 1-7.
21
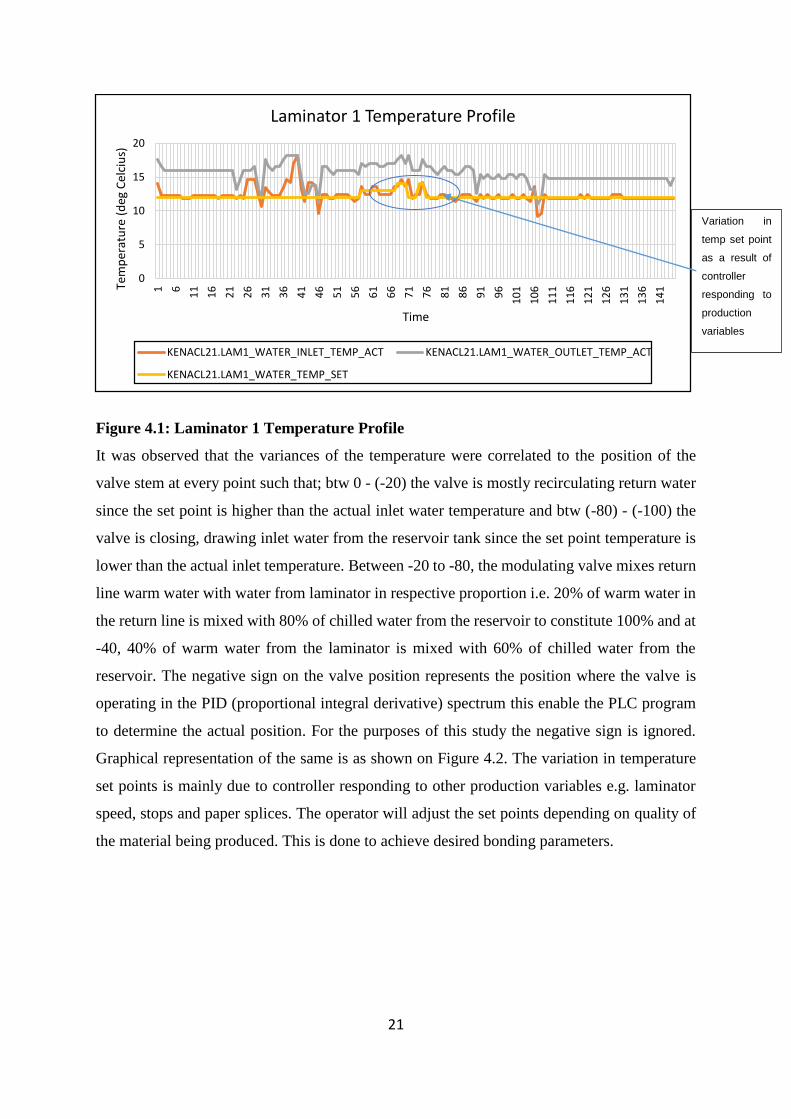
Figure 4.1: Laminator 1 Temperature Profile
It was observed that the variances of the temperature were correlated to the position of the
valve stem at every point such that; btw 0 - (-20) the valve is mostly recirculating return water
since the set point is higher than the actual inlet water temperature and btw (-80) - (-100) the
valve is closing, drawing inlet water from the reservoir tank since the set point temperature is
lower than the actual inlet temperature. Between -20 to -80, the modulating valve mixes return
line warm water with water from laminator in respective proportion i.e. 20% of warm water in
the return line is mixed with 80% of chilled water from the reservoir to constitute 100% and at
-40, 40% of warm water from the laminator is mixed with 60% of chilled water from the
reservoir. The negative sign on the valve position represents the position where the valve is
operating in the PID (proportional integral derivative) spectrum this enable the PLC program
to determine the actual position. For the purposes of this study the negative sign is ignored.
Graphical representation of the same is as shown on Figure 4.2. The variation in temperature
set points is mainly due to controller responding to other production variables e.g. laminator
speed, stops and paper splices. The operator will adjust the set points depending on quality of
the material being produced. This is done to achieve desired bonding parameters.
0
5
10
15
201 6
11
16
21
26
31
36
41
46
51
56
61
66
71
76
81
86
91
96
10
1
10
6
11
1
11
6
12
1
12
6
13
1
13
6
14
1Tem
per
atu
re (
deg
Cel
ciu
s)
Time
Laminator 1 Temperature Profile
KENACL21.LAM1_WATER_INLET_TEMP_ACT KENACL21.LAM1_WATER_OUTLET_TEMP_ACT
KENACL21.LAM1_WATER_TEMP_SET
Variation in
temp set point
as a result of
controller
responding to
production
variables
22
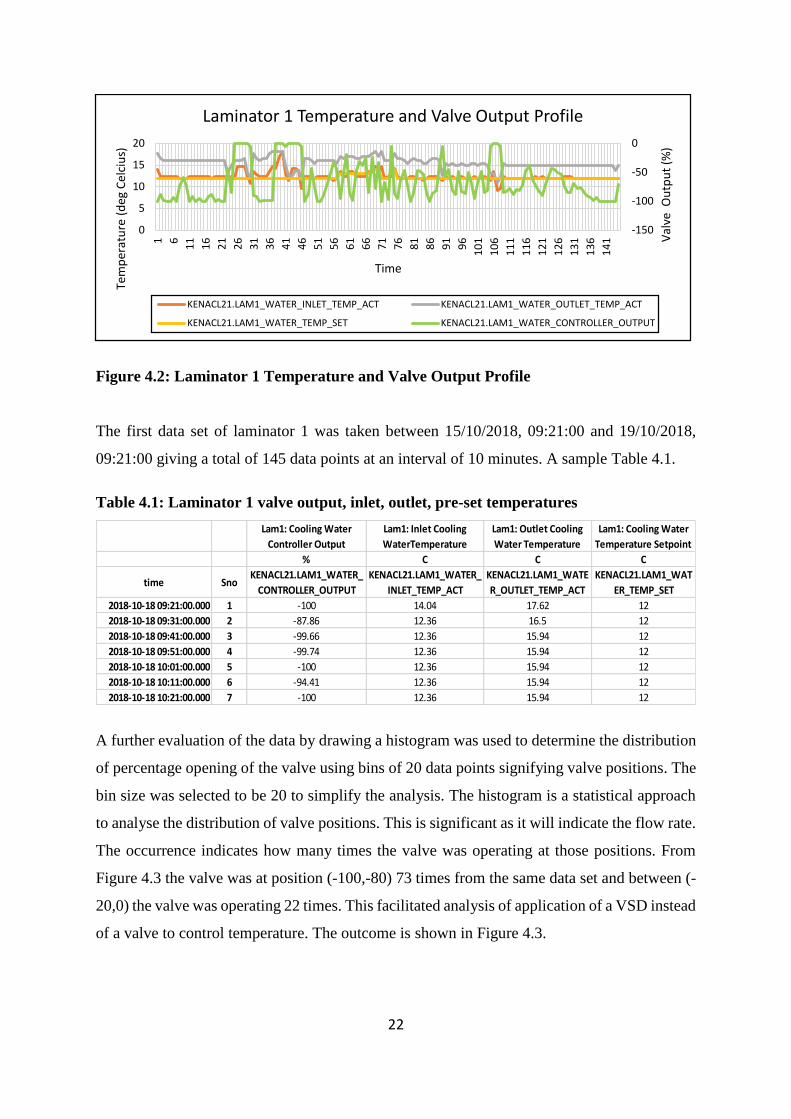
Figure 4.2: Laminator 1 Temperature and Valve Output Profile
The first data set of laminator 1 was taken between 15/10/2018, 09:21:00 and 19/10/2018,
09:21:00 giving a total of 145 data points at an interval of 10 minutes. A sample Table 4.1.
Table 4.1: Laminator 1 valve output, inlet, outlet, pre-set temperatures
A further evaluation of the data by drawing a histogram was used to determine the distribution
of percentage opening of the valve using bins of 20 data points signifying valve positions. The
bin size was selected to be 20 to simplify the analysis. The histogram is a statistical approach
to analyse the distribution of valve positions. This is significant as it will indicate the flow rate.
The occurrence indicates how many times the valve was operating at those positions. From
Figure 4.3 the valve was at position (-100,-80) 73 times from the same data set and between (-
20,0) the valve was operating 22 times. This facilitated analysis of application of a VSD instead
of a valve to control temperature. The outcome is shown in Figure 4.3.
-150
-100
-50
0
0
5
10
15
201 6
11
16
21
26
31
36
41
46
51
56
61
66
71
76
81
86
91
96
10
1
10
6
11
1
11
6
12
1
12
6
13
1
13
6
14
1 Val
ve O
utp
ut
(%)
Tem
per
atu
re (
deg
Cel
ciu
s)
Time
Laminator 1 Temperature and Valve Output Profile
KENACL21.LAM1_WATER_INLET_TEMP_ACT KENACL21.LAM1_WATER_OUTLET_TEMP_ACT
KENACL21.LAM1_WATER_TEMP_SET KENACL21.LAM1_WATER_CONTROLLER_OUTPUT
Lam1: Cooling Water
Controller Output
Lam1: Inlet Cooling
WaterTemperature
Lam1: Outlet Cooling
Water Temperature
Lam1: Cooling Water
Temperature Setpoint
% C C C
time SnoKENACL21.LAM1_WATER_
CONTROLLER_OUTPUT
KENACL21.LAM1_WATER_
INLET_TEMP_ACT
KENACL21.LAM1_WATE
R_OUTLET_TEMP_ACT
KENACL21.LAM1_WAT
ER_TEMP_SET
2018-10-18 09:21:00.000 1 -100 14.04 17.62 12
2018-10-18 09:31:00.000 2 -87.86 12.36 16.5 12
2018-10-18 09:41:00.000 3 -99.66 12.36 15.94 12
2018-10-18 09:51:00.000 4 -99.74 12.36 15.94 12
2018-10-18 10:01:00.000 5 -100 12.36 15.94 12
2018-10-18 10:11:00.000 6 -94.41 12.36 15.94 12
2018-10-18 10:21:00.000 7 -100 12.36 15.94 12
23
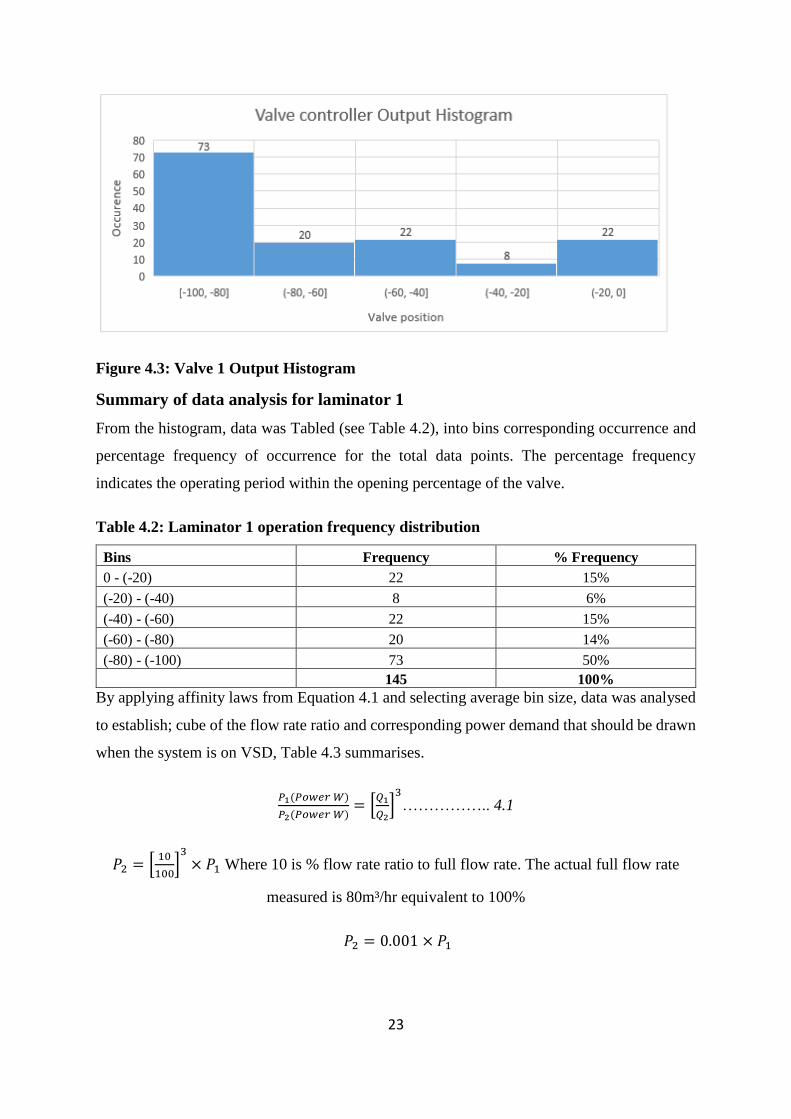
Figure 4.3: Valve 1 Output Histogram
Summary of data analysis for laminator 1
From the histogram, data was Tabled (see Table 4.2), into bins corresponding occurrence and
percentage frequency of occurrence for the total data points. The percentage frequency
indicates the operating period within the opening percentage of the valve.
Table 4.2: Laminator 1 operation frequency distribution
Bins Frequency % Frequency
0 - (-20) 22 15%
(-20) - (-40) 8 6%
(-40) - (-60) 22 15%
(-60) - (-80) 20 14%
(-80) - (-100) 73 50%
145 100%
By applying affinity laws from Equation 4.1 and selecting average bin size, data was analysed
to establish; cube of the flow rate ratio and corresponding power demand that should be drawn
when the system is on VSD, Table 4.3 summarises.
𝑃1(𝑃𝑜𝑤𝑒𝑟 𝑊)
𝑃2(𝑃𝑜𝑤𝑒𝑟 𝑊)= [
𝑄1
𝑄2]
3
…………….. 4.1
𝑃2 = [10
100]
3
× 𝑃1 Where 10 is % flow rate ratio to full flow rate. The actual full flow rate
measured is 80m³/hr equivalent to 100%
𝑃2 = 0.001 × 𝑃1
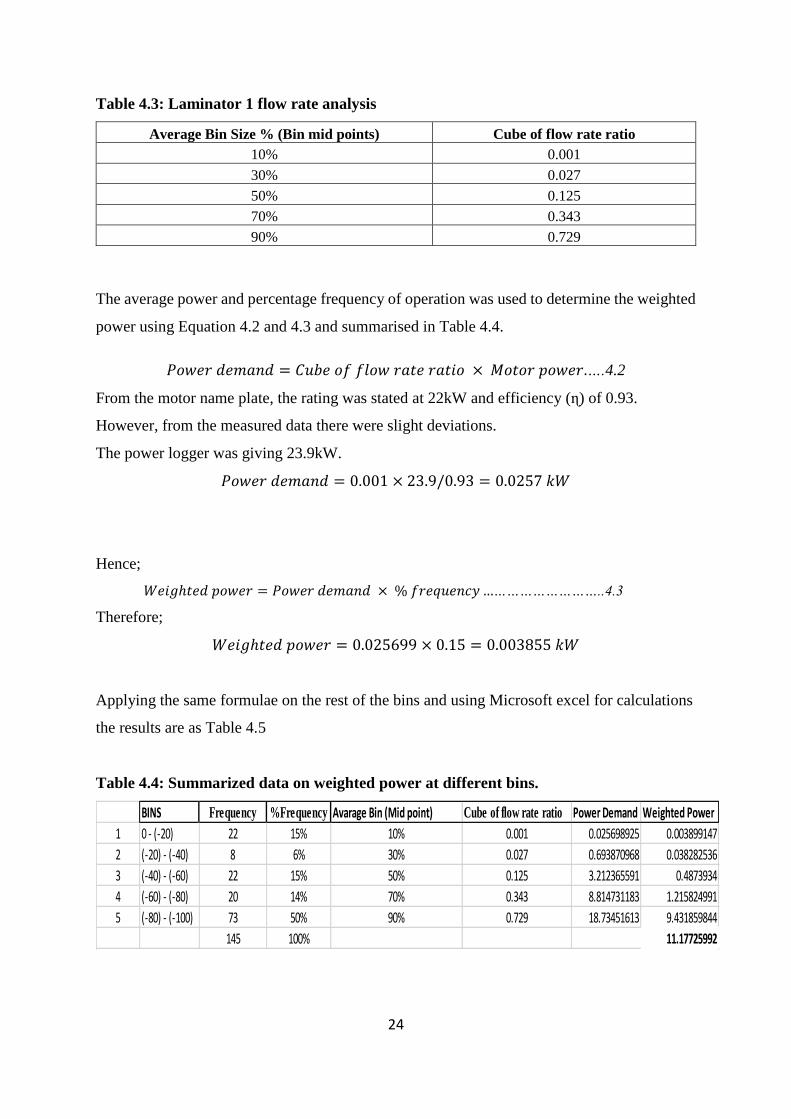
24
Table 4.3: Laminator 1 flow rate analysis
Average Bin Size % (Bin mid points) Cube of flow rate ratio
10% 0.001
30% 0.027
50% 0.125
70% 0.343
90% 0.729
The average power and percentage frequency of operation was used to determine the weighted
power using Equation 4.2 and 4.3 and summarised in Table 4.4.
𝑃𝑜𝑤𝑒𝑟 𝑑𝑒𝑚𝑎𝑛𝑑 = 𝐶𝑢𝑏𝑒 𝑜𝑓 𝑓𝑙𝑜𝑤 𝑟𝑎𝑡𝑒 𝑟𝑎𝑡𝑖𝑜 × 𝑀𝑜𝑡𝑜𝑟 𝑝𝑜𝑤𝑒𝑟.….4.2
From the motor name plate, the rating was stated at 22kW and efficiency (ɳ) of 0.93.
However, from the measured data there were slight deviations.
The power logger was giving 23.9kW.
𝑃𝑜𝑤𝑒𝑟 𝑑𝑒𝑚𝑎𝑛𝑑 = 0.001 × 23.9/0.93 = 0.0257 𝑘𝑊
Hence;
𝑊𝑒𝑖𝑔ℎ𝑡𝑒𝑑 𝑝𝑜𝑤𝑒𝑟 = 𝑃𝑜𝑤𝑒𝑟 𝑑𝑒𝑚𝑎𝑛𝑑 × % 𝑓𝑟𝑒𝑞𝑢𝑒𝑛𝑐𝑦 ………………………..4.3
Therefore;
𝑊𝑒𝑖𝑔ℎ𝑡𝑒𝑑 𝑝𝑜𝑤𝑒𝑟 = 0.025699 × 0.15 = 0.003855 𝑘𝑊
Applying the same formulae on the rest of the bins and using Microsoft excel for calculations
the results are as Table 4.5
Table 4.4: Summarized data on weighted power at different bins.
BINS Frequency %Frequency Avarage Bin (Mid point) Cube of flow rate ratio Power Demand Weighted Power
1 0 - (-20) 22 15% 10% 0.001 0.025698925 0.003899147
2 (-20) - (-40) 8 6% 30% 0.027 0.693870968 0.038282536
3 (-40) - (-60) 22 15% 50% 0.125 3.212365591 0.4873934
4 (-60) - (-80) 20 14% 70% 0.343 8.814731183 1.215824991
5 (-80) - (-100) 73 50% 90% 0.729 18.73451613 9.431859844
145 100% 11.17725992
25
Table 4.5: Laminator 1 power analysis
% Frequency Power demand Weighted power
15% 0.025699 0.003899
6% 0.693871 0.038283
15% 3.212366 0.487393
14% 8.814731 1.215825
50% 18.73452 9.43186
100% 11.17726
The weighted power of 11.17726kW represents the theoretical total power that will be drawn
by the system based on the data collected when fitted with VSD.
4.2.2. Pump 2
The first data set of laminator 2 was taken between 18/10/2018, 09:21:00 and 19/10/2018,
09:21:00 giving a total of 145 data points at an interval of 10 minutes. Table 4. 6 highlights the
sample data; actual data is recorded in appendix 2. Using the same method of analysis as in
pump 1. The following results were achieved.
Table 4.6: Laminator 2 valve output, inlet, outlet, pre-set temperatures
Cooling Water
Valve Controller
Output
Inlet Cooling
Water Temperature
Outlet Cooling
Water Temperature
Inlet Cooling Water
Temperature Set point
Time % °C °C °C
2018-10-18 09:21:00.000 -5 12.25 14.26 15
2018-10-18 09:31:00.000 -5 13.37 17.62 15
2018-10-18 09:41:00.000 -78.3 15.04 17.06 15
2018-10-18 09:51:00.000 -42.82 14.49 16.5 15
2018-10-18 10:01:00.000 -98.92 15.6 17.62 15
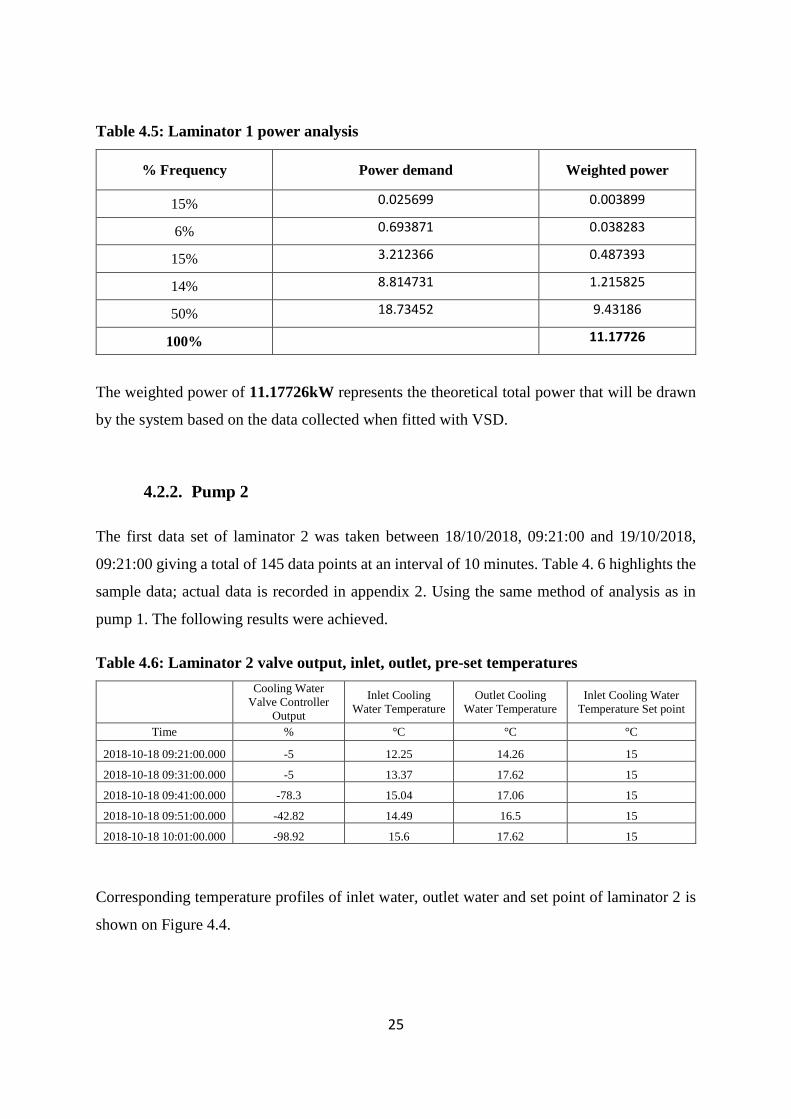
Corresponding temperature profiles of inlet water, outlet water and set point of laminator 2 is
shown on Figure 4.4.
26
Figure 4.4: Laminator 2 Temperature Profile
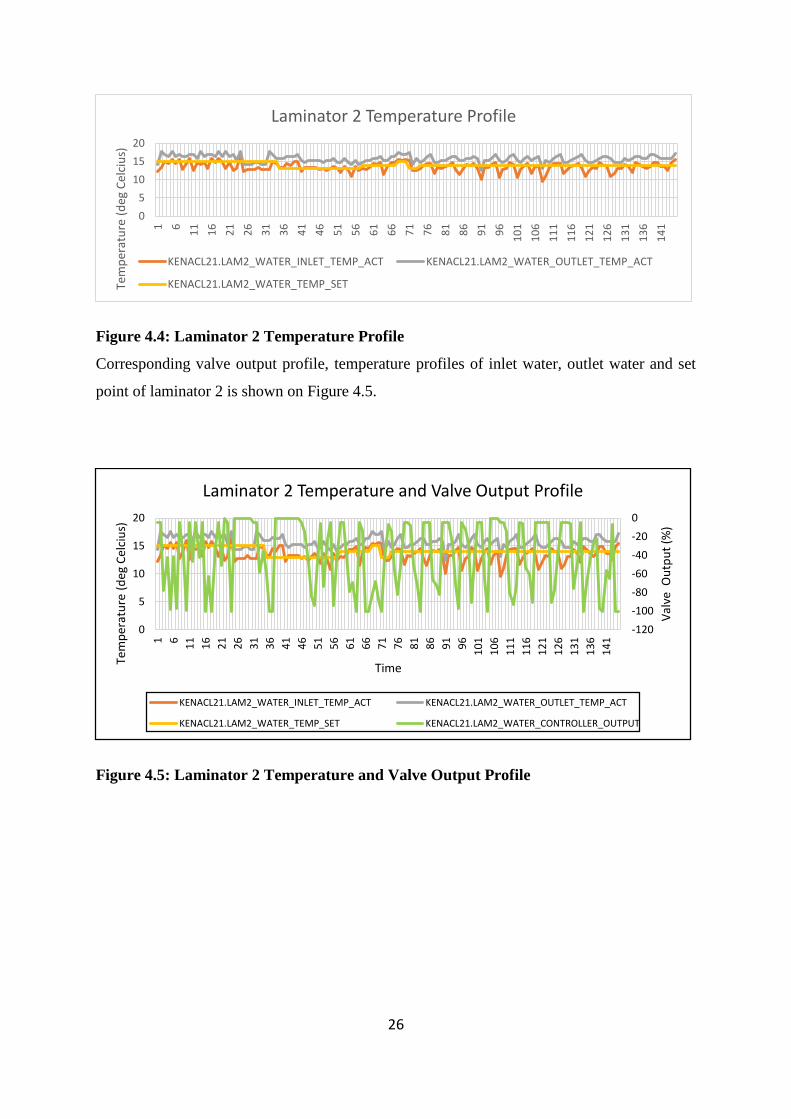
Corresponding valve output profile, temperature profiles of inlet water, outlet water and set
point of laminator 2 is shown on Figure 4.5.
Figure 4.5: Laminator 2 Temperature and Valve Output Profile
0
5
10
15
201 6
11
16
21
26
31
36
41
46
51
56
61
66
71
76
81
86
91
96
10
1
10
6
11
1
11
6
12
1
12
6
13
1
13
6
14
1
Tem
per
atu
re (
deg
Cel
ciu
s)Laminator 2 Temperature Profile
KENACL21.LAM2_WATER_INLET_TEMP_ACT KENACL21.LAM2_WATER_OUTLET_TEMP_ACT
KENACL21.LAM2_WATER_TEMP_SET
-120
-100
-80
-60
-40
-20
0
0
5
10
15
20
1 6
11
16
21
26
31
36
41
46
51
56
61
66
71
76
81
86
91
96
10
1
10
6
11
1
11
6
12
1
12
6
13
1
13
6
14
1
Val
ve O
utp
ut
(%)
Tem
per
atu
re (
deg
Cel
ciu
s)
Time
Laminator 2 Temperature and Valve Output Profile
KENACL21.LAM2_WATER_INLET_TEMP_ACT KENACL21.LAM2_WATER_OUTLET_TEMP_ACT
KENACL21.LAM2_WATER_TEMP_SET KENACL21.LAM2_WATER_CONTROLLER_OUTPUT
27
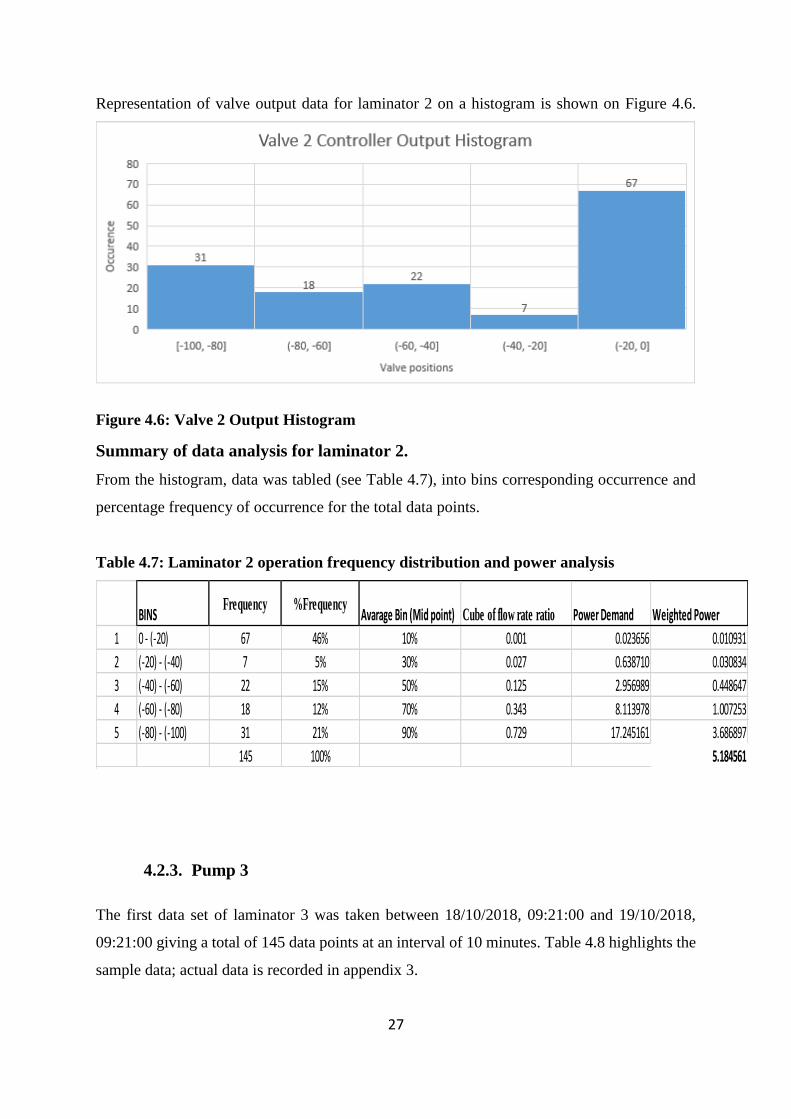
Representation of valve output data for laminator 2 on a histogram is shown on Figure 4.6.
Figure 4.6: Valve 2 Output Histogram
Summary of data analysis for laminator 2.
From the histogram, data was tabled (see Table 4.7), into bins corresponding occurrence and
percentage frequency of occurrence for the total data points.
Table 4.7: Laminator 2 operation frequency distribution and power analysis
4.2.3. Pump 3
The first data set of laminator 3 was taken between 18/10/2018, 09:21:00 and 19/10/2018,
09:21:00 giving a total of 145 data points at an interval of 10 minutes. Table 4.8 highlights the
sample data; actual data is recorded in appendix 3.
BINSFrequency %Frequency
Avarage Bin (Mid point) Cube of flow rate ratio Power Demand Weighted Power
1 0 - (-20) 67 46% 10% 0.001 0.023656 0.010931
2 (-20) - (-40) 7 5% 30% 0.027 0.638710 0.030834
3 (-40) - (-60) 22 15% 50% 0.125 2.956989 0.448647
4 (-60) - (-80) 18 12% 70% 0.343 8.113978 1.007253
5 (-80) - (-100) 31 21% 90% 0.729 17.245161 3.686897
145 100% 5.184561
28
Table 4.8: Laminator 3 valve output, inlet, outlet, pre-set temperatures
Cooling Water
Controller Output
Inlet Cooling Water
Temperature
Outlet Cooling
Water Temperature
Cooling Water
Temperature Set point
Time % °C °C °C
2018-10-18 09:21:00.000 0 12.81 16.05 17
2018-10-18 09:31:00.000 0 14.37 18.29 17
2018-10-18 09:41:00.000 -49.9 17.17 19.97 17
2018-10-18 09:51:00.000 0 16.05 21.09 17
2018-10-18 10:01:00.000 -21.46 16.61 19.97 17
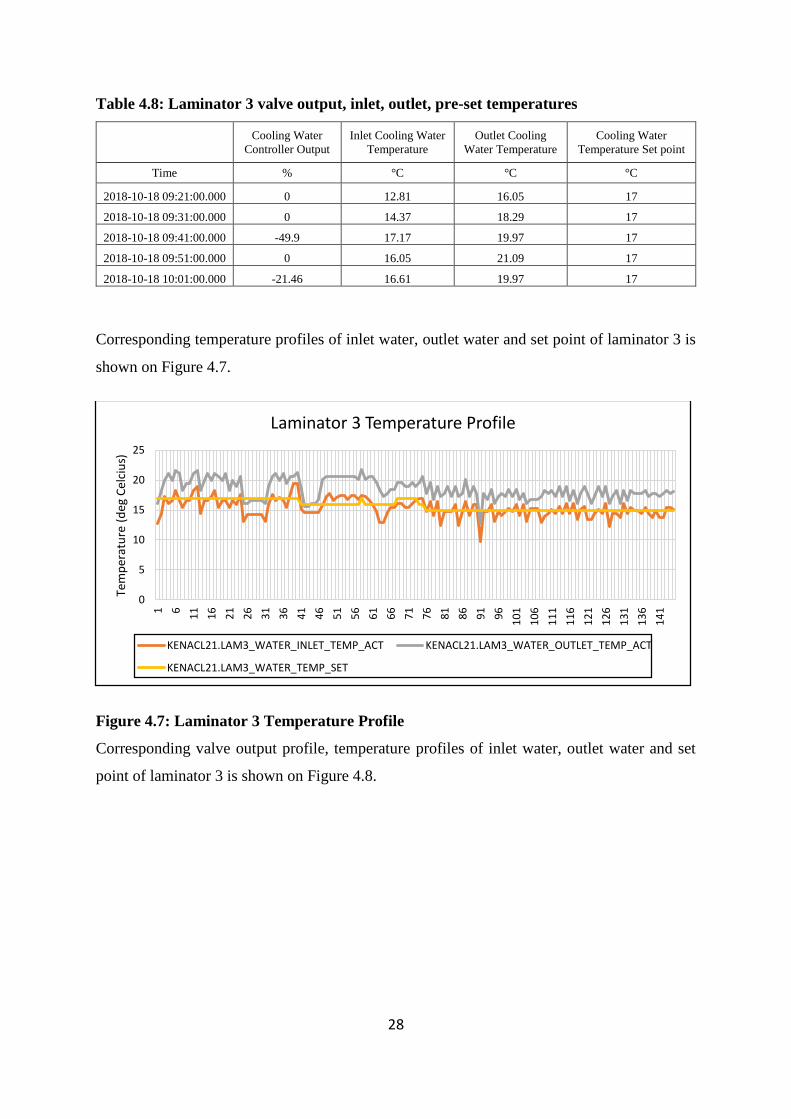
Corresponding temperature profiles of inlet water, outlet water and set point of laminator 3 is
shown on Figure 4.7.
Figure 4.7: Laminator 3 Temperature Profile
Corresponding valve output profile, temperature profiles of inlet water, outlet water and set
point of laminator 3 is shown on Figure 4.8.
0
5
10
15
20
25
1 6
11
16
21
26
31
36
41
46
51
56
61
66
71
76
81
86
91
96
10
1
10
6
11
1
11
6
12
1
12
6
13
1
13
6
14
1
Tem
per
atu
re (
deg
Cel
ciu
s)
Laminator 3 Temperature Profile
KENACL21.LAM3_WATER_INLET_TEMP_ACT KENACL21.LAM3_WATER_OUTLET_TEMP_ACT
KENACL21.LAM3_WATER_TEMP_SET
29
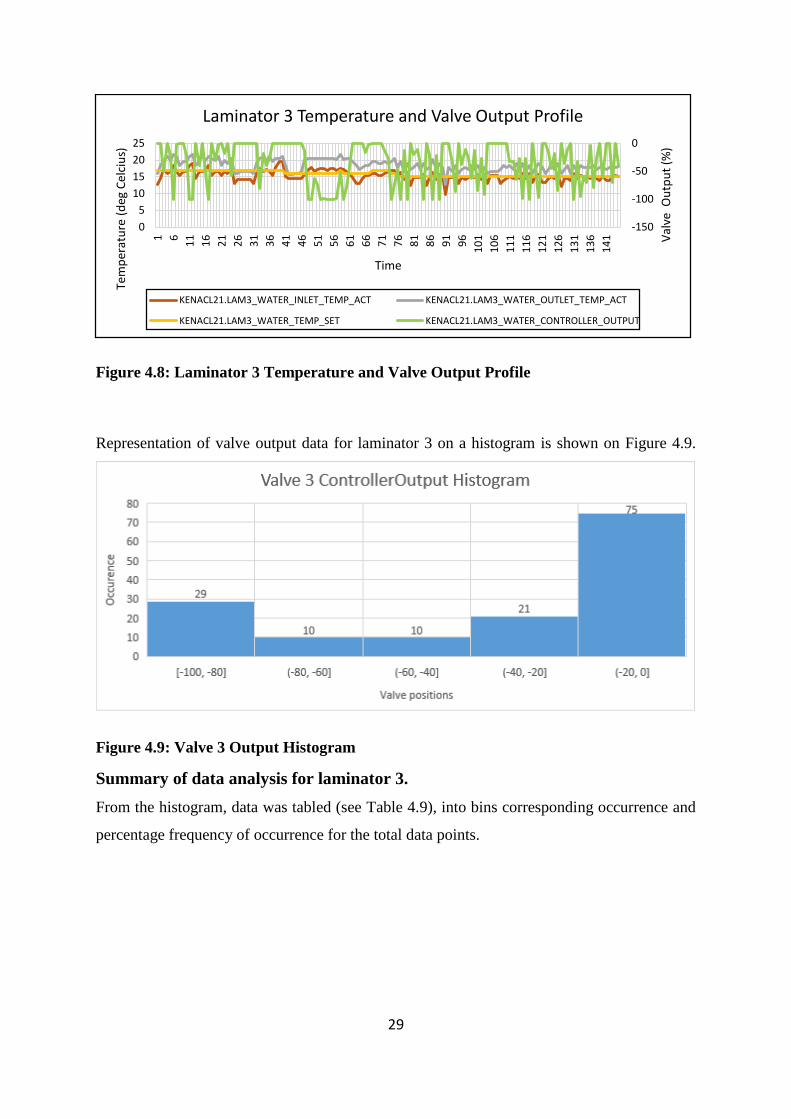
Figure 4.8: Laminator 3 Temperature and Valve Output Profile
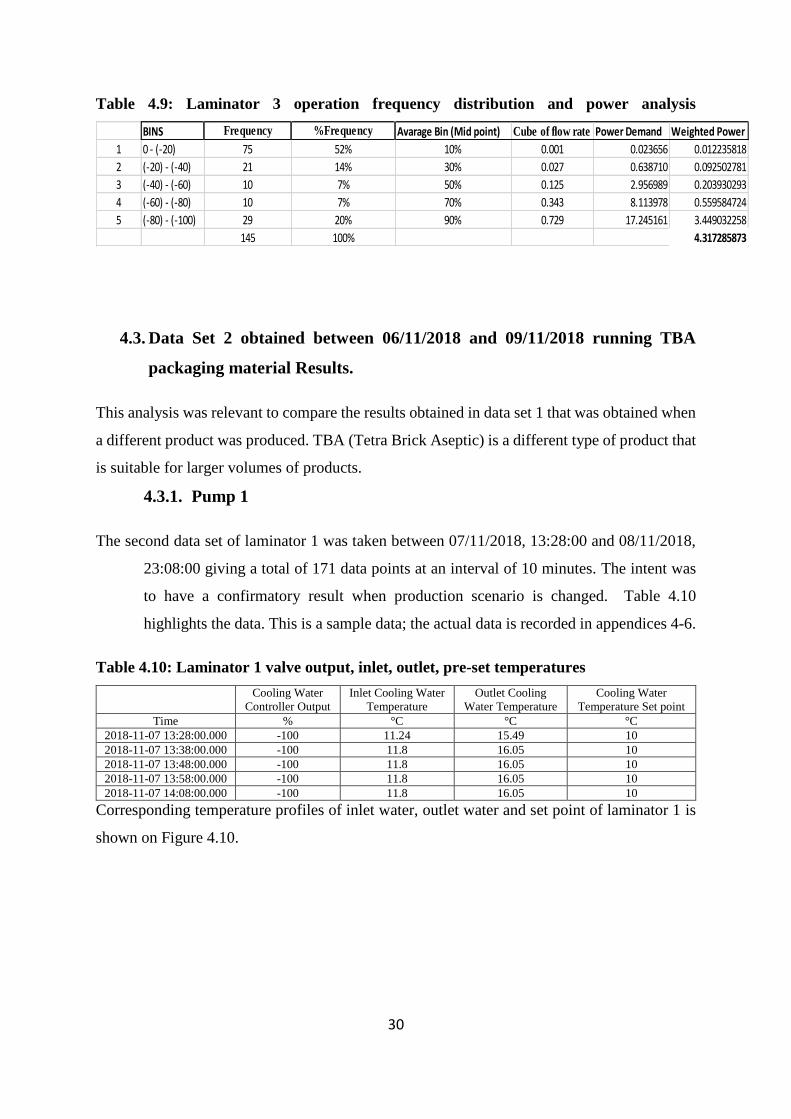
Representation of valve output data for laminator 3 on a histogram is shown on Figure 4.9.
Figure 4.9: Valve 3 Output Histogram
Summary of data analysis for laminator 3.
From the histogram, data was tabled (see Table 4.9), into bins corresponding occurrence and
percentage frequency of occurrence for the total data points.
-150
-100
-50
0
0
5
10
15
20
251 6
11
16
21
26
31
36
41
46
51
56
61
66
71
76
81
86
91
96
10
1
10
6
11
1
11
6
12
1
12
6
13
1
13
6
14
1 Val
ve O
utp
ut
(%)
Tem
per
atu
re (
deg
Cel
ciu
s)
Time
Laminator 3 Temperature and Valve Output Profile
KENACL21.LAM3_WATER_INLET_TEMP_ACT KENACL21.LAM3_WATER_OUTLET_TEMP_ACT
KENACL21.LAM3_WATER_TEMP_SET KENACL21.LAM3_WATER_CONTROLLER_OUTPUT
30
Table 4.9: Laminator 3 operation frequency distribution and power analysis
4.3. Data Set 2 obtained between 06/11/2018 and 09/11/2018 running TBA
packaging material Results.
This analysis was relevant to compare the results obtained in data set 1 that was obtained when
a different product was produced. TBA (Tetra Brick Aseptic) is a different type of product that
is suitable for larger volumes of products.
4.3.1. Pump 1
The second data set of laminator 1 was taken between 07/11/2018, 13:28:00 and 08/11/2018,
23:08:00 giving a total of 171 data points at an interval of 10 minutes. The intent was
to have a confirmatory result when production scenario is changed. Table 4.10
highlights the data. This is a sample data; the actual data is recorded in appendices 4-6.
Table 4.10: Laminator 1 valve output, inlet, outlet, pre-set temperatures
Cooling Water
Controller Output
Inlet Cooling Water
Temperature
Outlet Cooling
Water Temperature
Cooling Water
Temperature Set point
Time % °C °C °C
2018-11-07 13:28:00.000 -100 11.24 15.49 10
2018-11-07 13:38:00.000 -100 11.8 16.05 10
2018-11-07 13:48:00.000 -100 11.8 16.05 10
2018-11-07 13:58:00.000 -100 11.8 16.05 10
2018-11-07 14:08:00.000 -100 11.8 16.05 10
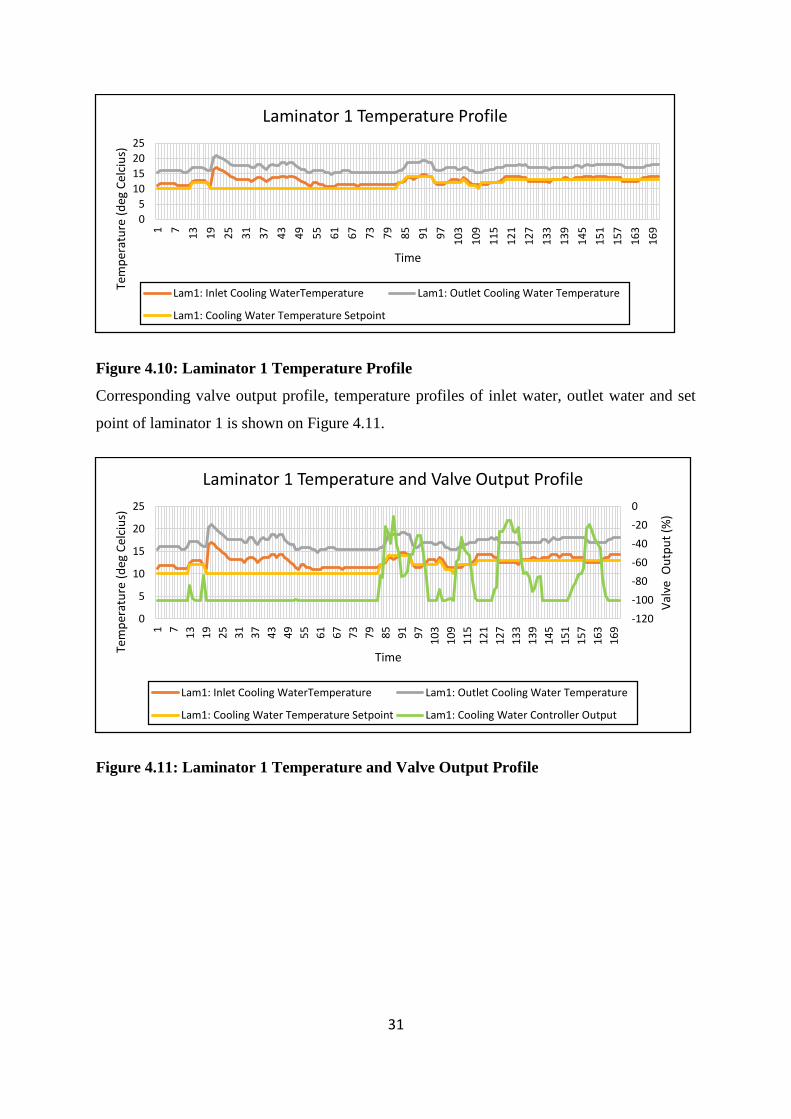
Corresponding temperature profiles of inlet water, outlet water and set point of laminator 1 is
shown on Figure 4.10.
BINS Frequency %Frequency Avarage Bin (Mid point) Cube of flow rate ratioPower Demand Weighted Power
1 0 - (-20) 75 52% 10% 0.001 0.023656 0.012235818
2 (-20) - (-40) 21 14% 30% 0.027 0.638710 0.092502781
3 (-40) - (-60) 10 7% 50% 0.125 2.956989 0.203930293
4 (-60) - (-80) 10 7% 70% 0.343 8.113978 0.559584724
5 (-80) - (-100) 29 20% 90% 0.729 17.245161 3.449032258
145 100% 4.317285873
31
Figure 4.10: Laminator 1 Temperature Profile
Corresponding valve output profile, temperature profiles of inlet water, outlet water and set
point of laminator 1 is shown on Figure 4.11.
Figure 4.11: Laminator 1 Temperature and Valve Output Profile
0
5
10
15
20
251 7
13
19
25
31
37
43
49
55
61
67
73
79
85
91
97
10
3
10
9
11
5
12
1
12
7
13
3
13
9
14
5
15
1
15
7
16
3
16
9
Tem
per
atu
re (
deg
Cel
ciu
s)
Time
Laminator 1 Temperature Profile
Lam1: Inlet Cooling WaterTemperature Lam1: Outlet Cooling Water Temperature
Lam1: Cooling Water Temperature Setpoint
-120
-100
-80
-60
-40
-20
0
0
5
10
15
20
25
1 7
13
19
25
31
37
43
49
55
61
67
73
79
85
91
97
10
3
10
9
11
5
12
1
12
7
13
3
13
9
14
5
15
1
15
7
16
3
16
9
Val
ve O
utp
ut
(%)
Tem
per
atu
re (
deg
Cel
ciu
s)
Time
Laminator 1 Temperature and Valve Output Profile
Lam1: Inlet Cooling WaterTemperature Lam1: Outlet Cooling Water Temperature
Lam1: Cooling Water Temperature Setpoint Lam1: Cooling Water Controller Output
32
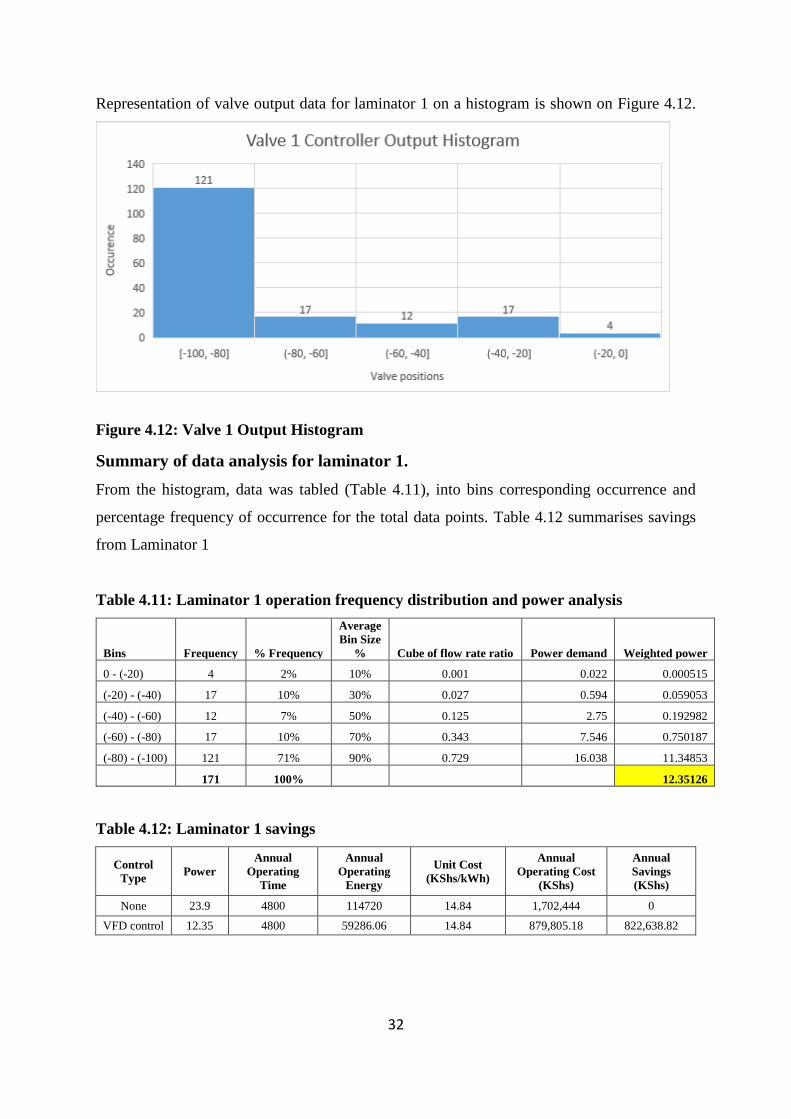
Representation of valve output data for laminator 1 on a histogram is shown on Figure 4.12.
Figure 4.12: Valve 1 Output Histogram
Summary of data analysis for laminator 1.
From the histogram, data was tabled (Table 4.11), into bins corresponding occurrence and
percentage frequency of occurrence for the total data points. Table 4.12 summarises savings
from Laminator 1
Table 4.11: Laminator 1 operation frequency distribution and power analysis
Bins Frequency % Frequency
Average
Bin Size
% Cube of flow rate ratio Power demand Weighted power
0 - (-20) 4 2% 10% 0.001 0.022 0.000515
(-20) - (-40) 17 10% 30% 0.027 0.594 0.059053
(-40) - (-60) 12 7% 50% 0.125 2.75 0.192982
(-60) - (-80) 17 10% 70% 0.343 7.546 0.750187
(-80) - (-100) 121 71% 90% 0.729 16.038 11.34853
171 100% 12.35126
Table 4.12: Laminator 1 savings
Control
Type Power
Annual
Operating
Time
Annual
Operating
Energy
Unit Cost
(KShs/kWh)
Annual
Operating Cost
(KShs)
Annual
Savings
(KShs)
None 23.9 4800 114720 14.84 1,702,444 0
VFD control 12.35 4800 59286.06 14.84 879,805.18 822,638.82
33
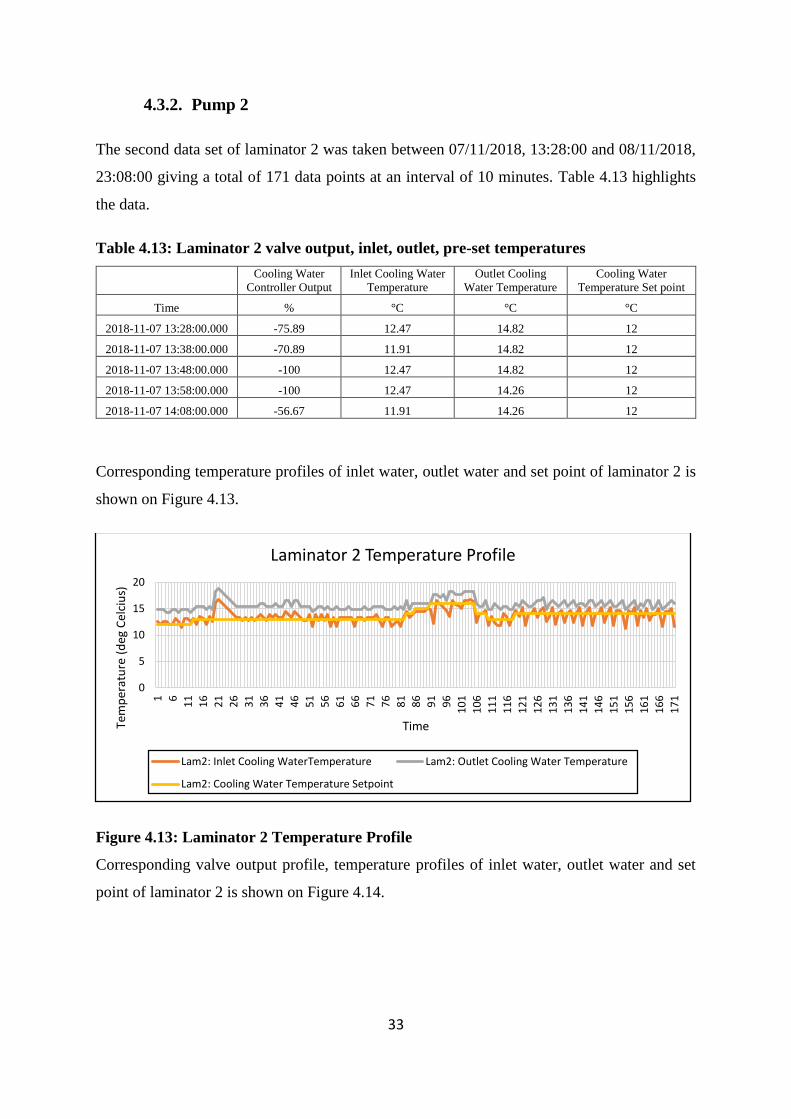
4.3.2. Pump 2
The second data set of laminator 2 was taken between 07/11/2018, 13:28:00 and 08/11/2018,
23:08:00 giving a total of 171 data points at an interval of 10 minutes. Table 4.13 highlights
the data.
Table 4.13: Laminator 2 valve output, inlet, outlet, pre-set temperatures
Cooling Water
Controller Output
Inlet Cooling Water
Temperature
Outlet Cooling
Water Temperature
Cooling Water
Temperature Set point
Time % °C °C °C
2018-11-07 13:28:00.000 -75.89 12.47 14.82 12
2018-11-07 13:38:00.000 -70.89 11.91 14.82 12
2018-11-07 13:48:00.000 -100 12.47 14.82 12
2018-11-07 13:58:00.000 -100 12.47 14.26 12
2018-11-07 14:08:00.000 -56.67 11.91 14.26 12
Corresponding temperature profiles of inlet water, outlet water and set point of laminator 2 is
shown on Figure 4.13.
Figure 4.13: Laminator 2 Temperature Profile
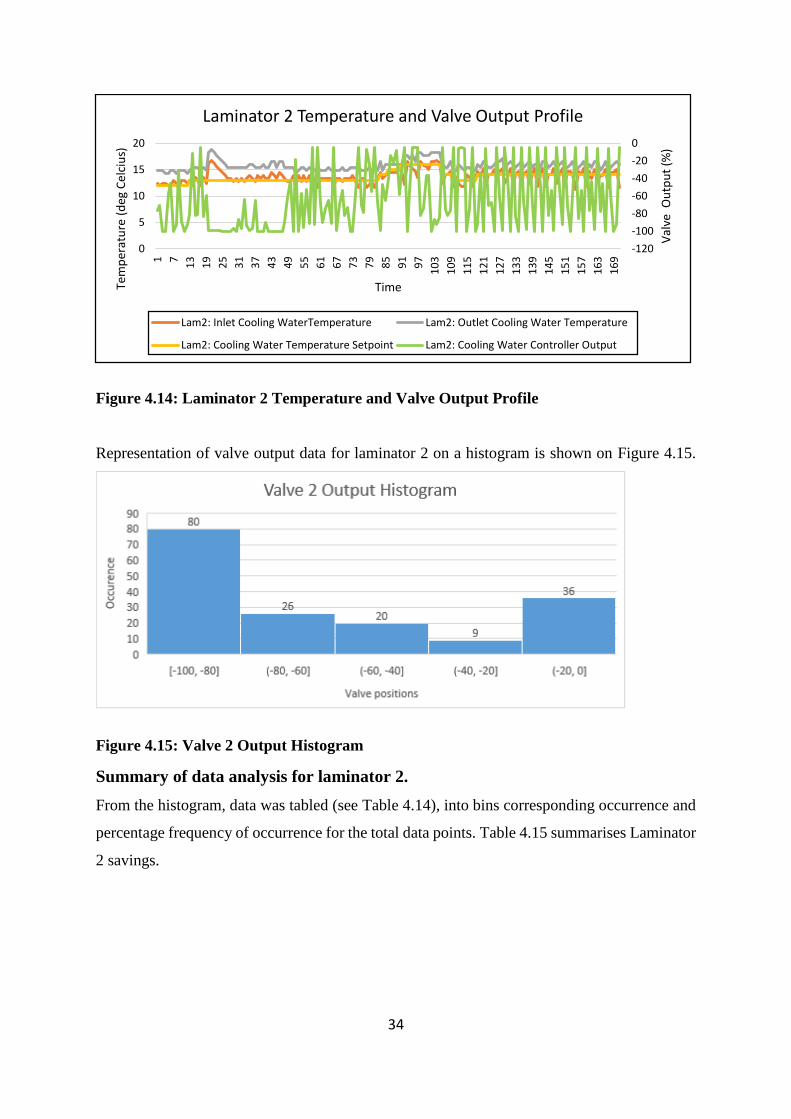
Corresponding valve output profile, temperature profiles of inlet water, outlet water and set
point of laminator 2 is shown on Figure 4.14.
0
5
10
15
20
1 6
11
16
21
26
31
36
41
46
51
56
61
66
71
76
81
86
91
96
10
1
10
6
11
1
11
6
12
1
12
6
13
1
13
6
14
1
14
6
15
1
15
6
16
1
16
6
17
1
Tem
per
atu
re (
deg
Cel
ciu
s)
Time
Laminator 2 Temperature Profile
Lam2: Inlet Cooling WaterTemperature Lam2: Outlet Cooling Water Temperature
Lam2: Cooling Water Temperature Setpoint
34
Figure 4.14: Laminator 2 Temperature and Valve Output Profile
Representation of valve output data for laminator 2 on a histogram is shown on Figure 4.15.
Figure 4.15: Valve 2 Output Histogram
Summary of data analysis for laminator 2.
From the histogram, data was tabled (see Table 4.14), into bins corresponding occurrence and
percentage frequency of occurrence for the total data points. Table 4.15 summarises Laminator
2 savings.
-120
-100
-80
-60
-40
-20
0
0
5
10
15
201 7
13
19
25
31
37
43
49
55
61
67
73
79
85
91
97
10
3
10
9
11
5
12
1
12
7
13
3
13
9
14
5
15
1
15
7
16
3
16
9
Val
ve O
utp
ut
(%)
Tem
per
atu
re (
deg
Cel
ciu
s)
Time
Laminator 2 Temperature and Valve Output Profile
Lam2: Inlet Cooling WaterTemperature Lam2: Outlet Cooling Water Temperature
Lam2: Cooling Water Temperature Setpoint Lam2: Cooling Water Controller Output

35
Table 4.14: Laminator 2 operation frequency distribution and power analysis
Bins Frequency % Frequency
Average
Bin Size % Cube of flow rate ratio Power demand
Weighted
power
0 - (-20) 36 21% 10% 0.001 0.022 0.004632
(-20) - (-40) 9 5% 30% 0.027 0.594 0.031263
(-40) - (-60) 20 12% 50% 0.125 2.75 0.321637
(-60) - (-80) 26 15% 70% 0.343 7.546 1.147345
(-80) - (-100) 80 47% 90% 0.729 16.038 7.503158
171 100% 9.008035
Table 4.15: Laminator 2 savings
Control
Type Power
Annual
Operating
Time
Annual
Operating
Energy
Unit Cost
(KShs/kWh)
Annual
Operating Cost
(KShs)
Annual
Savings
(KShs)
None 22 4800 105600 14.84 1,567,104 0
VFD control 9.008 4800 43238.56 14.84 641,660.36 925,443.64
4.3.3. Pump 3
The second data set of laminator 3 was taken between 07/11/2018, 13:28:00 and 08/11/2018,
23:08:00 giving a total of 171 data points at an interval of 10 minutes. Table 4.16 highlights
the data.
Table 4.16: Laminator 3 valve output, inlet, outlet, pre-set temperatures
Cooling Water
Controller Output
Inlet Cooling Water
Temperature
Outlet Cooling
Water Temperature
Cooling Water
Temperature Set point
Time % °C °C °C
2018-11-07 13:28:00.000 -78.83 17.73 21.2 17
2018-11-07 13:38:00.000 -67.66 17.17 19.52 17
2018-11-07 13:48:00.000 0 14.26 17.84 17
2018-11-07 13:58:00.000 0 13.14 18.4 17
2018-11-07 14:08:00.000 0 15.38 21.2 17
Corresponding temperature profiles of inlet water, outlet water and set point of laminator 3 is
shown on Figure 4.16.
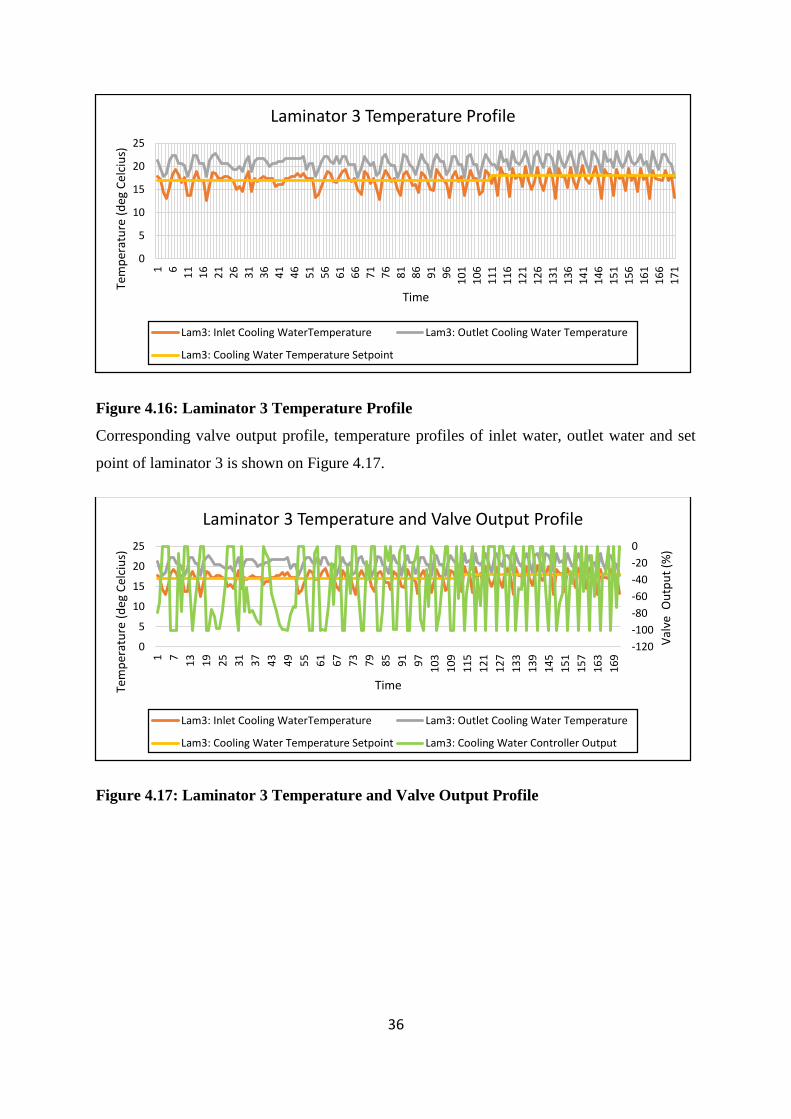
36
Figure 4.16: Laminator 3 Temperature Profile
Corresponding valve output profile, temperature profiles of inlet water, outlet water and set
point of laminator 3 is shown on Figure 4.17.
Figure 4.17: Laminator 3 Temperature and Valve Output Profile
0
5
10
15
20
251 6
11
16
21
26
31
36
41
46
51
56
61
66
71
76
81
86
91
96
10
1
10
6
11
1
11
6
12
1
12
6
13
1
13
6
14
1
14
6
15
1
15
6
16
1
16
6
17
1
Tem
per
atu
re (
deg
Cel
ciu
s)
Time
Laminator 3 Temperature Profile
Lam3: Inlet Cooling WaterTemperature Lam3: Outlet Cooling Water Temperature
Lam3: Cooling Water Temperature Setpoint
-120
-100
-80
-60
-40
-20
0
0
5
10
15
20
25
1 7
13
19
25
31
37
43
49
55
61
67
73
79
85
91
97
10
3
10
9
11
5
12
1
12
7
13
3
13
9
14
5
15
1
15
7
16
3
16
9
Val
ve O
utp
ut
(%)
Tem
per
atu
re (
deg
Cel
ciu
s)
Time
Laminator 3 Temperature and Valve Output Profile
Lam3: Inlet Cooling WaterTemperature Lam3: Outlet Cooling Water Temperature
Lam3: Cooling Water Temperature Setpoint Lam3: Cooling Water Controller Output
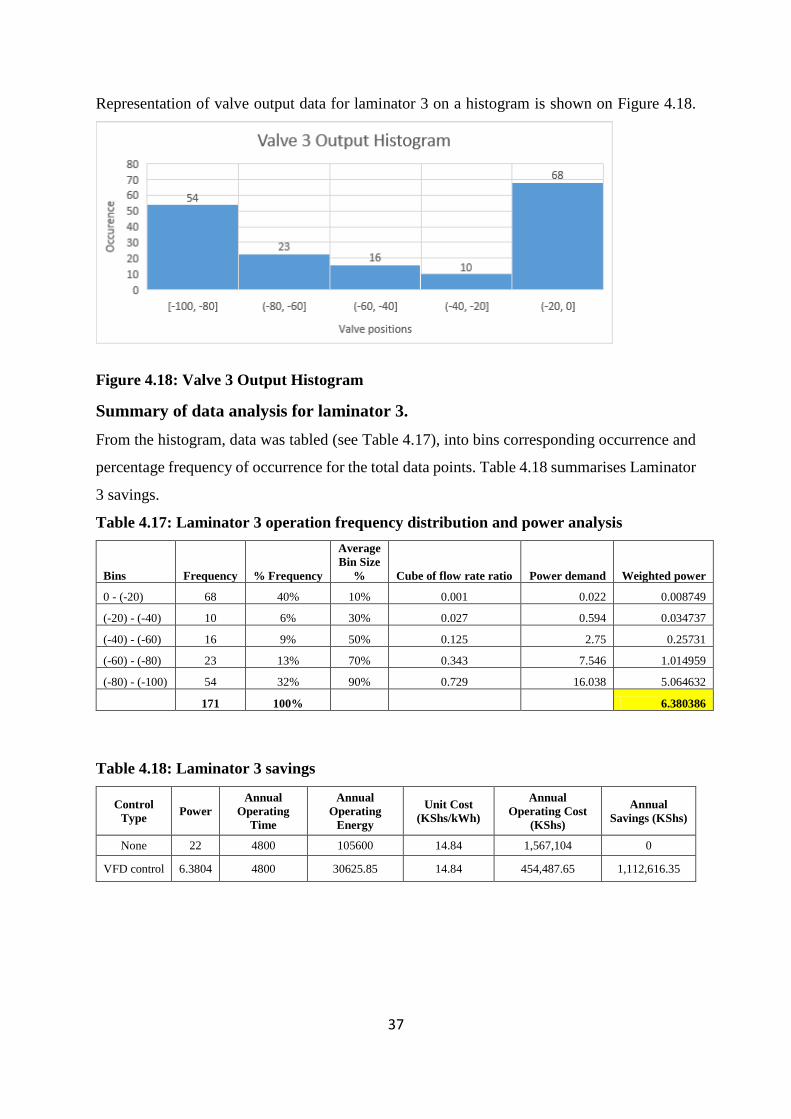
37
Representation of valve output data for laminator 3 on a histogram is shown on Figure 4.18.
Figure 4.18: Valve 3 Output Histogram
Summary of data analysis for laminator 3.
From the histogram, data was tabled (see Table 4.17), into bins corresponding occurrence and
percentage frequency of occurrence for the total data points. Table 4.18 summarises Laminator
3 savings.
Table 4.17: Laminator 3 operation frequency distribution and power analysis
Bins Frequency % Frequency
Average
Bin Size
% Cube of flow rate ratio Power demand Weighted power
0 - (-20) 68 40% 10% 0.001 0.022 0.008749
(-20) - (-40) 10 6% 30% 0.027 0.594 0.034737
(-40) - (-60) 16 9% 50% 0.125 2.75 0.25731
(-60) - (-80) 23 13% 70% 0.343 7.546 1.014959
(-80) - (-100) 54 32% 90% 0.729 16.038 5.064632
171 100% 6.380386
Table 4.18: Laminator 3 savings
Control
Type Power
Annual
Operating
Time
Annual
Operating
Energy
Unit Cost
(KShs/kWh)
Annual
Operating Cost
(KShs)
Annual
Savings (KShs)
None 22 4800 105600 14.84 1,567,104 0
VFD control 6.3804 4800 30625.85 14.84 454,487.65 1,112,616.35
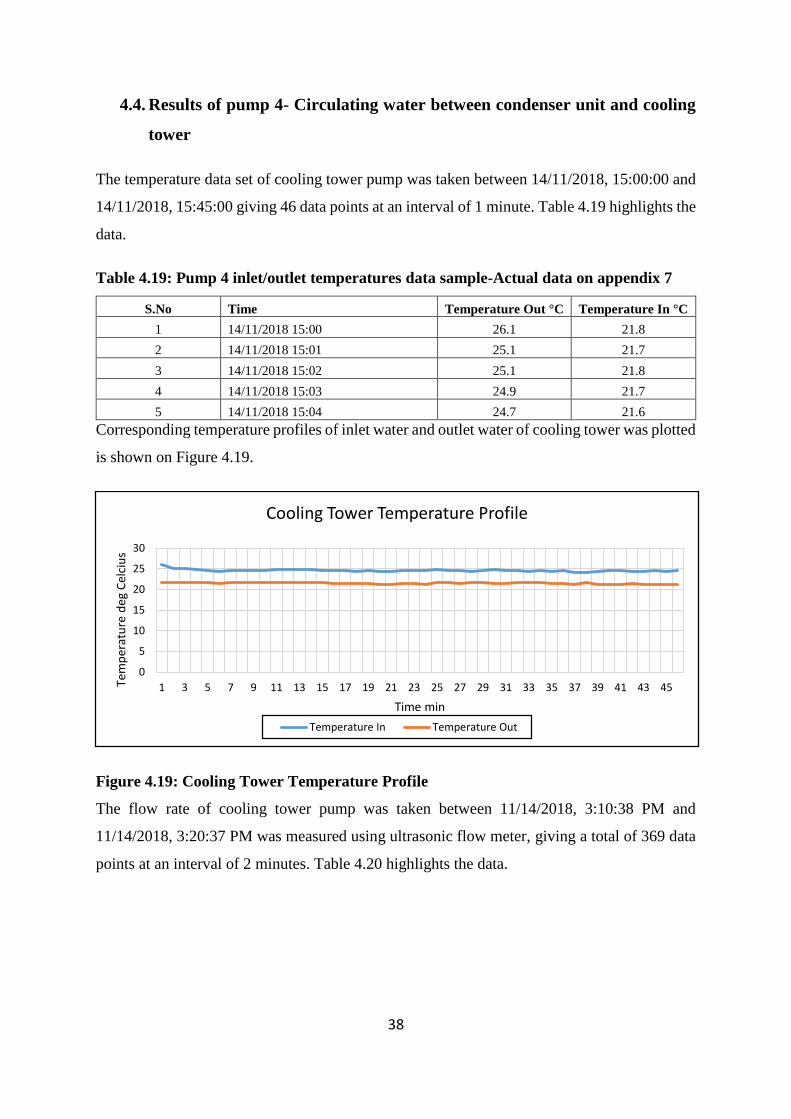
38
4.4. Results of pump 4- Circulating water between condenser unit and cooling
tower
The temperature data set of cooling tower pump was taken between 14/11/2018, 15:00:00 and
14/11/2018, 15:45:00 giving 46 data points at an interval of 1 minute. Table 4.19 highlights the
data.
Table 4.19: Pump 4 inlet/outlet temperatures data sample-Actual data on appendix 7
S.No Time Temperature Out °C Temperature In °C
1 14/11/2018 15:00 26.1 21.8
2 14/11/2018 15:01 25.1 21.7
3 14/11/2018 15:02 25.1 21.8
4 14/11/2018 15:03 24.9 21.7
5 14/11/2018 15:04 24.7 21.6
Corresponding temperature profiles of inlet water and outlet water of cooling tower was plotted
is shown on Figure 4.19.
Figure 4.19: Cooling Tower Temperature Profile
The flow rate of cooling tower pump was taken between 11/14/2018, 3:10:38 PM and
11/14/2018, 3:20:37 PM was measured using ultrasonic flow meter, giving a total of 369 data
points at an interval of 2 minutes. Table 4.20 highlights the data.
0
5
10
15
20
25
30
1 3 5 7 9 11 13 15 17 19 21 23 25 27 29 31 33 35 37 39 41 43 45Tem
per
atu
re d
eg C
elci
us
Time min
Cooling Tower Temperature Profile
Temperature In Temperature Out
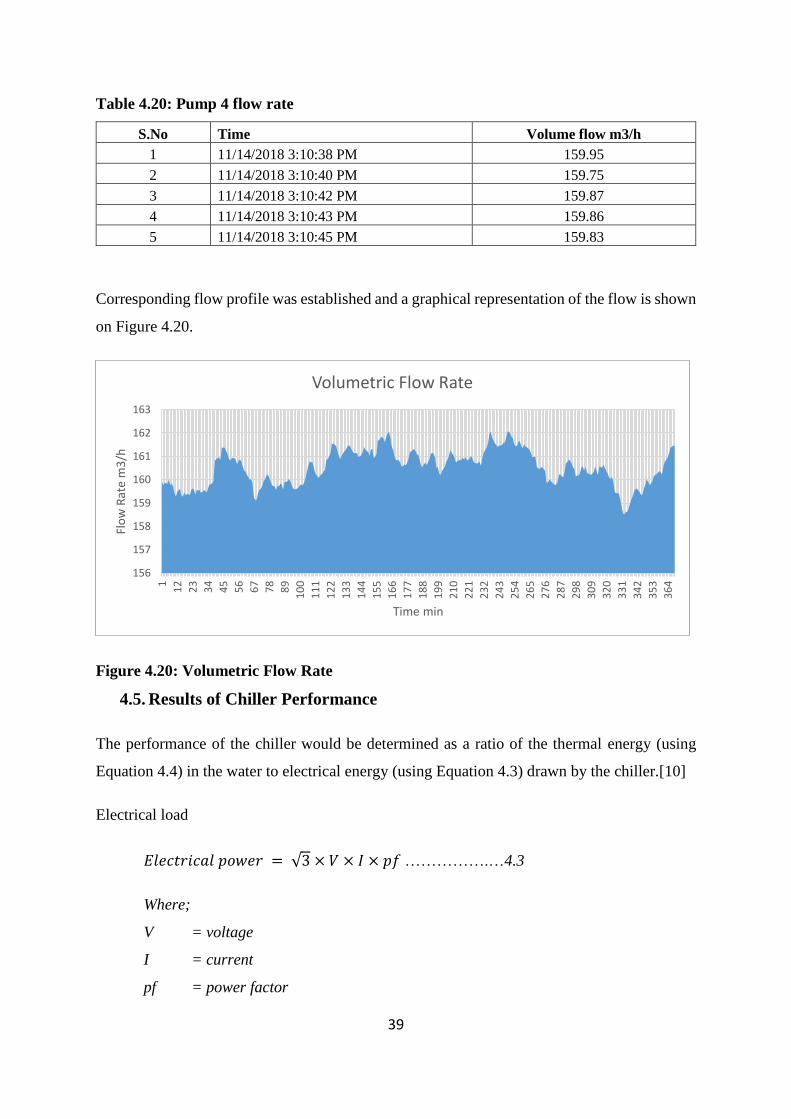
39
Table 4.20: Pump 4 flow rate
S.No Time Volume flow m3/h
1 11/14/2018 3:10:38 PM 159.95
2 11/14/2018 3:10:40 PM 159.75
3 11/14/2018 3:10:42 PM 159.87
4 11/14/2018 3:10:43 PM 159.86
5 11/14/2018 3:10:45 PM 159.83
Corresponding flow profile was established and a graphical representation of the flow is shown
on Figure 4.20.
Figure 4.20: Volumetric Flow Rate
4.5. Results of Chiller Performance
The performance of the chiller would be determined as a ratio of the thermal energy (using
Equation 4.4) in the water to electrical energy (using Equation 4.3) drawn by the chiller.[10]
Electrical load
𝐸𝑙𝑒𝑐𝑡𝑟𝑖𝑐𝑎𝑙 𝑝𝑜𝑤𝑒𝑟 = √3 × 𝑉 × 𝐼 × 𝑝𝑓 …………….…4.3
Where;
V = voltage
I = current
pf = power factor
156
157
158
159
160
161
162
163
1
12
23
34
45
56
67
78
89
10
0
11
1
12
2
13
3
14
4
15
5
16
6
17
7
18
8
19
9
21
0
22
1
23
2
24
3
25
4
26
5
27
6
28
7
29
8
30
9
32
0
33
1
34
2
35
3
36
4
Flo
w R
ate
m3
/h
Time min
Volumetric Flow Rate
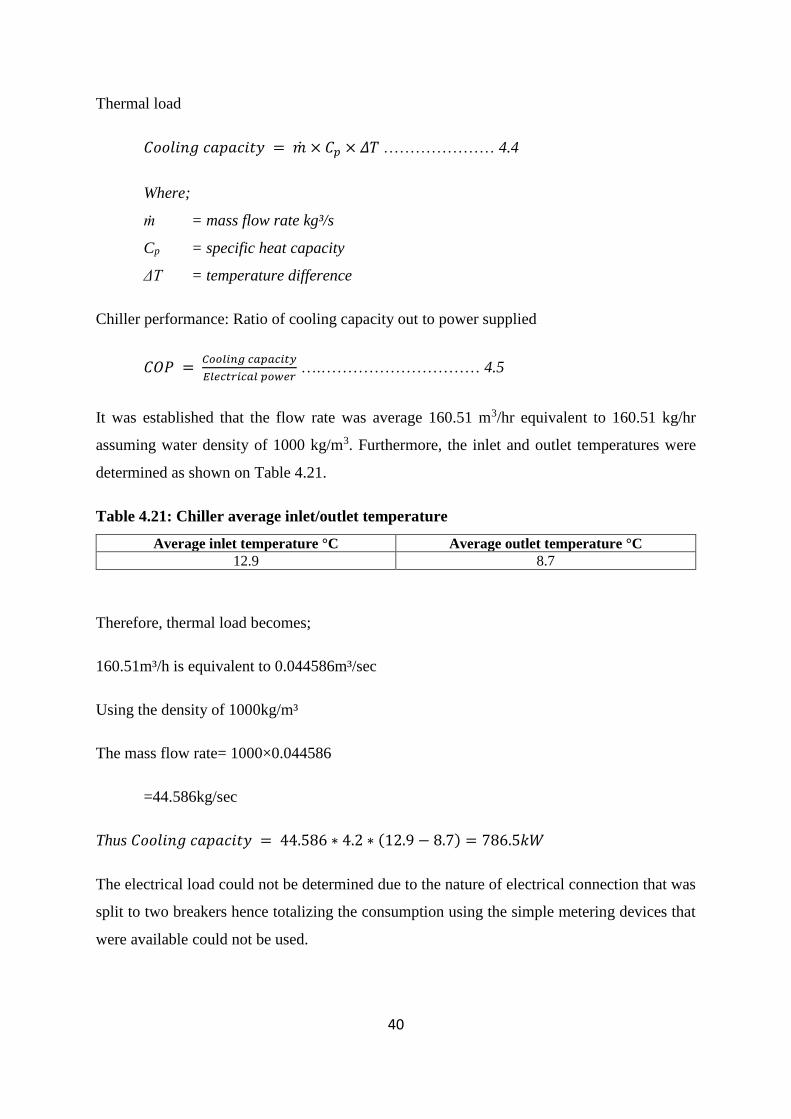
40
Thermal load
𝐶𝑜𝑜𝑙𝑖𝑛𝑔 𝑐𝑎𝑝𝑎𝑐𝑖𝑡𝑦 = �̇� × 𝐶𝑝 × 𝛥𝑇 ………………… 4.4
Where;
ṁ = mass flow rate kg³/s
Cp = specific heat capacity
ΔT = temperature difference
Chiller performance: Ratio of cooling capacity out to power supplied
𝐶𝑂𝑃 = 𝐶𝑜𝑜𝑙𝑖𝑛𝑔 𝑐𝑎𝑝𝑎𝑐𝑖𝑡𝑦
𝐸𝑙𝑒𝑐𝑡𝑟𝑖𝑐𝑎𝑙 𝑝𝑜𝑤𝑒𝑟 ….………………………… 4.5
It was established that the flow rate was average 160.51 m3/hr equivalent to 160.51 kg/hr
assuming water density of 1000 kg/m3. Furthermore, the inlet and outlet temperatures were
determined as shown on Table 4.21.
Table 4.21: Chiller average inlet/outlet temperature
Average inlet temperature °C Average outlet temperature °C
12.9 8.7
Therefore, thermal load becomes;
160.51m³/h is equivalent to 0.044586m³/sec
Using the density of 1000kg/m³
The mass flow rate= 1000×0.044586
=44.586kg/sec
Thus 𝐶𝑜𝑜𝑙𝑖𝑛𝑔 𝑐𝑎𝑝𝑎𝑐𝑖𝑡𝑦 = 44.586 ∗ 4.2 ∗ (12.9 − 8.7) = 786.5𝑘𝑊
The electrical load could not be determined due to the nature of electrical connection that was
split to two breakers hence totalizing the consumption using the simple metering devices that
were available could not be used.
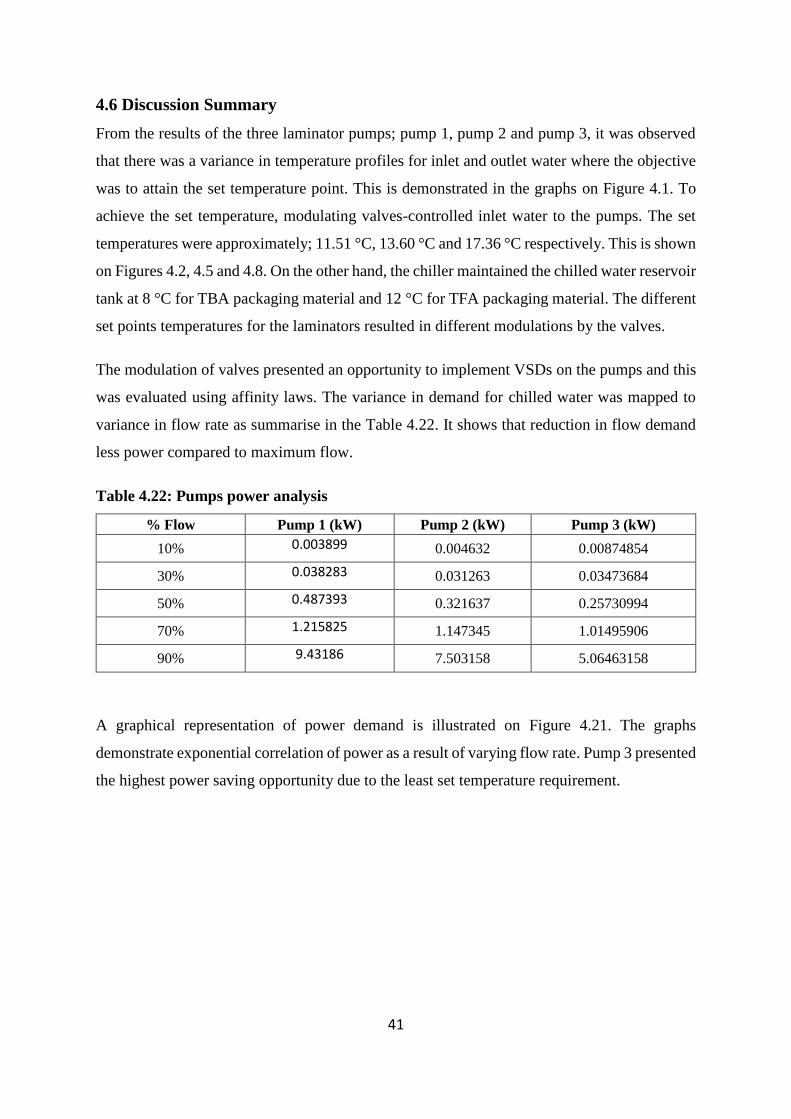
41
4.6 Discussion Summary
From the results of the three laminator pumps; pump 1, pump 2 and pump 3, it was observed
that there was a variance in temperature profiles for inlet and outlet water where the objective
was to attain the set temperature point. This is demonstrated in the graphs on Figure 4.1. To
achieve the set temperature, modulating valves-controlled inlet water to the pumps. The set
temperatures were approximately; 11.51 °C, 13.60 °C and 17.36 °C respectively. This is shown
on Figures 4.2, 4.5 and 4.8. On the other hand, the chiller maintained the chilled water reservoir
tank at 8 °C for TBA packaging material and 12 °C for TFA packaging material. The different
set points temperatures for the laminators resulted in different modulations by the valves.
The modulation of valves presented an opportunity to implement VSDs on the pumps and this
was evaluated using affinity laws. The variance in demand for chilled water was mapped to
variance in flow rate as summarise in the Table 4.22. It shows that reduction in flow demand
less power compared to maximum flow.
Table 4.22: Pumps power analysis
% Flow Pump 1 (kW) Pump 2 (kW) Pump 3 (kW)
10% 0.003899 0.004632 0.00874854
30% 0.038283 0.031263 0.03473684
50% 0.487393 0.321637 0.25730994
70% 1.215825 1.147345 1.01495906
90% 9.43186 7.503158 5.06463158
A graphical representation of power demand is illustrated on Figure 4.21. The graphs
demonstrate exponential correlation of power as a result of varying flow rate. Pump 3 presented
the highest power saving opportunity due to the least set temperature requirement.
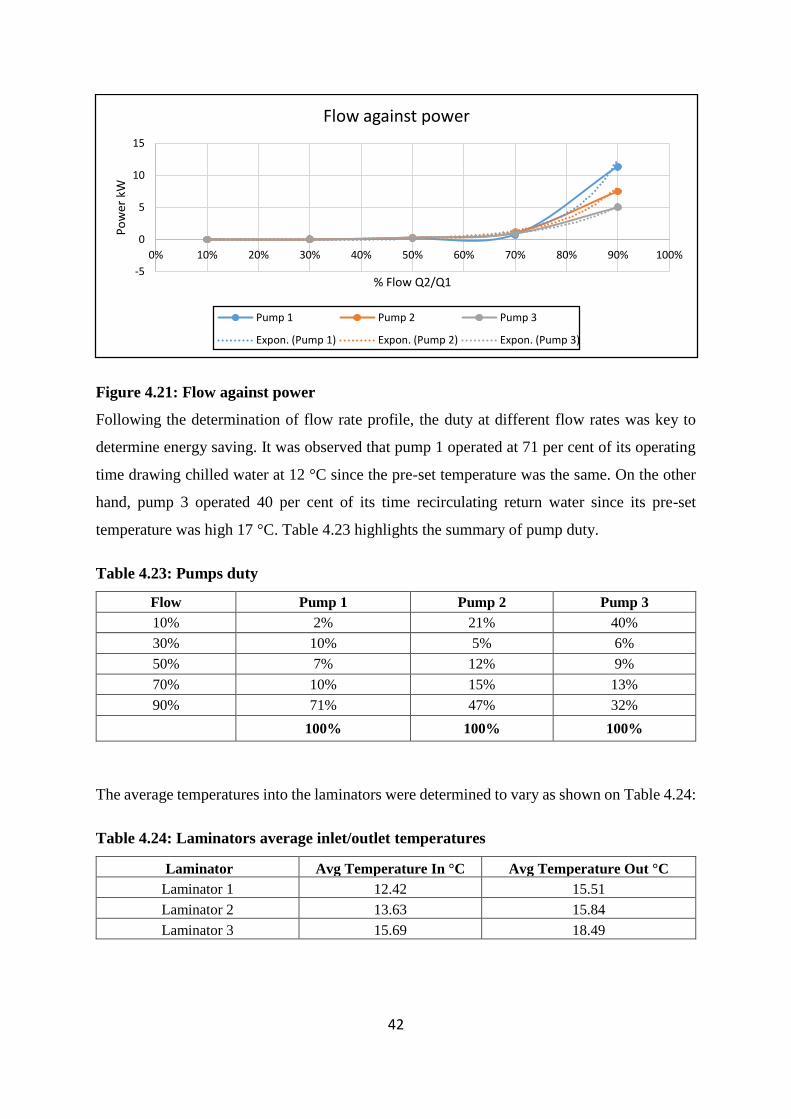
42
Figure 4.21: Flow against power
Following the determination of flow rate profile, the duty at different flow rates was key to
determine energy saving. It was observed that pump 1 operated at 71 per cent of its operating
time drawing chilled water at 12 °C since the pre-set temperature was the same. On the other
hand, pump 3 operated 40 per cent of its time recirculating return water since its pre-set
temperature was high 17 °C. Table 4.23 highlights the summary of pump duty.
Table 4.23: Pumps duty
Flow Pump 1 Pump 2 Pump 3
10% 2% 21% 40%
30% 10% 5% 6%
50% 7% 12% 9%
70% 10% 15% 13%
90% 71% 47% 32%
100% 100% 100%
The average temperatures into the laminators were determined to vary as shown on Table 4.24:
Table 4.24: Laminators average inlet/outlet temperatures
Laminator Avg Temperature In °C Avg Temperature Out °C
Laminator 1 12.42 15.51
Laminator 2 13.63 15.84
Laminator 3 15.69 18.49
-5
0
5
10
15
0% 10% 20% 30% 40% 50% 60% 70% 80% 90% 100%
Po
wer
kW
% Flow Q2/Q1
Flow against power
Pump 1 Pump 2 Pump 3
Expon. (Pump 1) Expon. (Pump 2) Expon. (Pump 3)
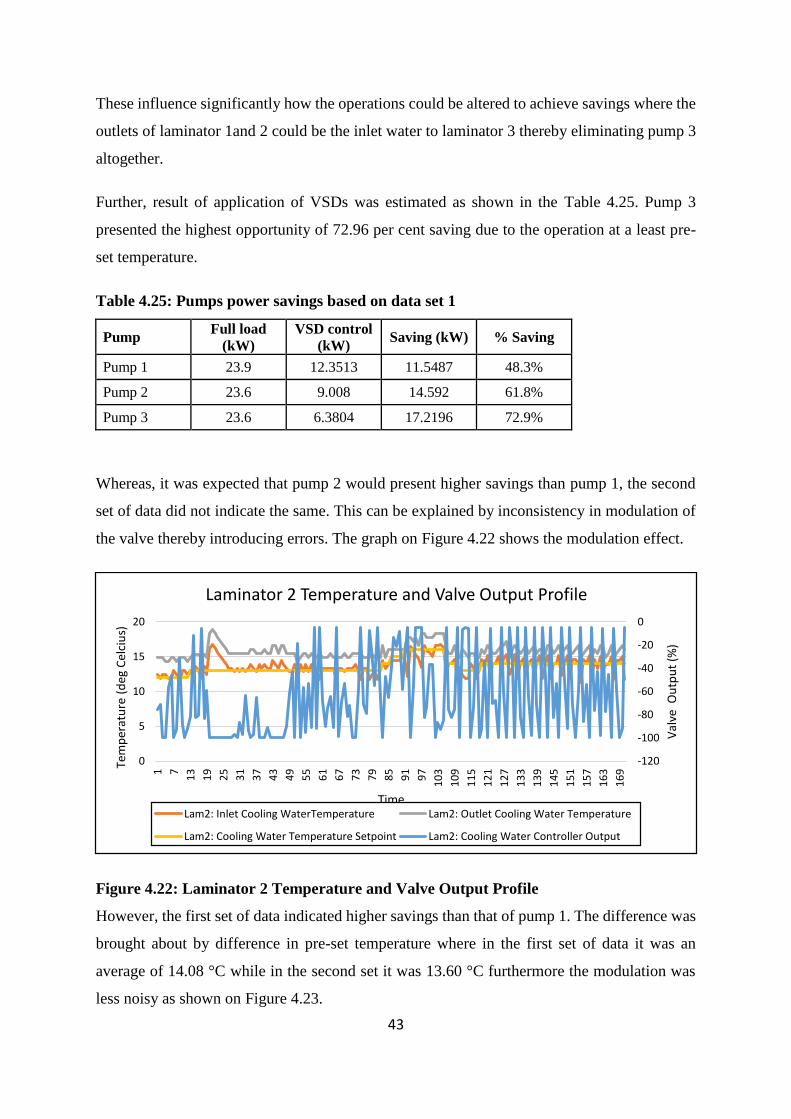
43
These influence significantly how the operations could be altered to achieve savings where the
outlets of laminator 1and 2 could be the inlet water to laminator 3 thereby eliminating pump 3
altogether.
Further, result of application of VSDs was estimated as shown in the Table 4.25. Pump 3
presented the highest opportunity of 72.96 per cent saving due to the operation at a least pre-
set temperature.
Table 4.25: Pumps power savings based on data set 1
Pump Full load
(kW)
VSD control
(kW) Saving (kW) % Saving
Pump 1 23.9 12.3513 11.5487 48.3%
Pump 2 23.6 9.008 14.592 61.8%
Pump 3 23.6 6.3804 17.2196 72.9%
Whereas, it was expected that pump 2 would present higher savings than pump 1, the second
set of data did not indicate the same. This can be explained by inconsistency in modulation of
the valve thereby introducing errors. The graph on Figure 4.22 shows the modulation effect.
Figure 4.22: Laminator 2 Temperature and Valve Output Profile
However, the first set of data indicated higher savings than that of pump 1. The difference was
brought about by difference in pre-set temperature where in the first set of data it was an
average of 14.08 °C while in the second set it was 13.60 °C furthermore the modulation was
less noisy as shown on Figure 4.23.
-120
-100
-80
-60
-40
-20
0
0
5
10
15
20
1 7
13
19
25
31
37
43
49
55
61
67
73
79
85
91
97
10
3
10
9
11
5
12
1
12
7
13
3
13
9
14
5
15
1
15
7
16
3
16
9
Val
ve O
utp
ut
(%)
Tem
per
atu
re (
deg
Cel
ciu
s)
Time
Laminator 2 Temperature and Valve Output Profile
Lam2: Inlet Cooling WaterTemperature Lam2: Outlet Cooling Water Temperature
Lam2: Cooling Water Temperature Setpoint Lam2: Cooling Water Controller Output
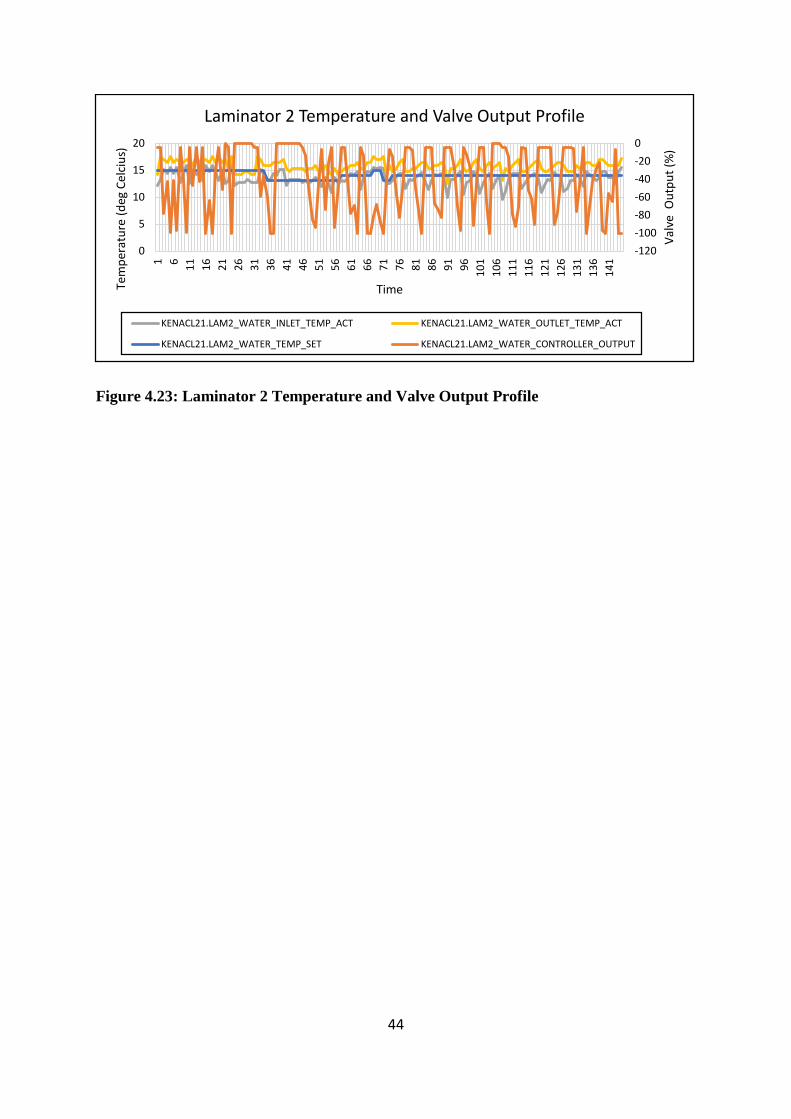
44
Figure 4.23: Laminator 2 Temperature and Valve Output Profile
-120
-100
-80
-60
-40
-20
0
0
5
10
15
201 6
11
16
21
26
31
36
41
46
51
56
61
66
71
76
81
86
91
96
10
1
10
6
11
1
11
6
12
1
12
6
13
1
13
6
14
1
Val
ve O
utp
ut
(%)
Tem
per
atu
re (
deg
Cel
ciu
s)
Time
Laminator 2 Temperature and Valve Output Profile
KENACL21.LAM2_WATER_INLET_TEMP_ACT KENACL21.LAM2_WATER_OUTLET_TEMP_ACT
KENACL21.LAM2_WATER_TEMP_SET KENACL21.LAM2_WATER_CONTROLLER_OUTPUT
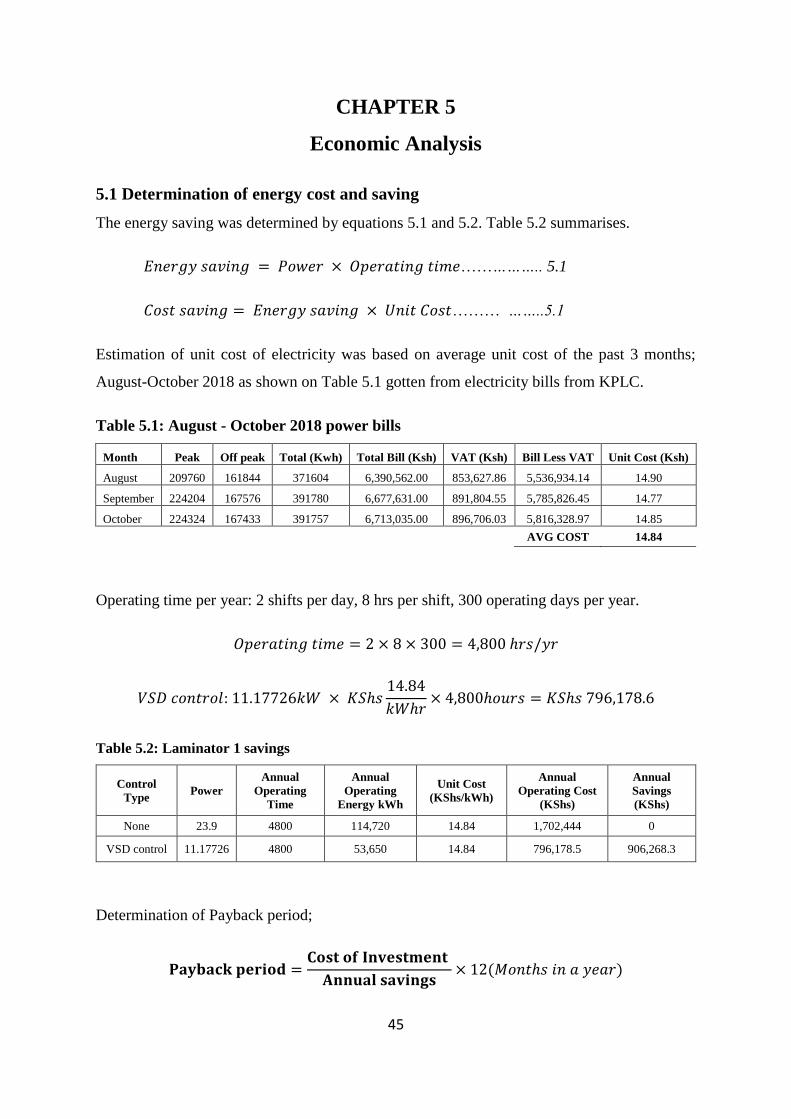
45
CHAPTER 5
Economic Analysis
5.1 Determination of energy cost and saving
The energy saving was determined by equations 5.1 and 5.2. Table 5.2 summarises.
𝐸𝑛𝑒𝑟𝑔𝑦 𝑠𝑎𝑣𝑖𝑛𝑔 = 𝑃𝑜𝑤𝑒𝑟 × 𝑂𝑝𝑒𝑟𝑎𝑡𝑖𝑛𝑔 𝑡𝑖𝑚𝑒…………….. 5.1
𝐶𝑜𝑠𝑡 𝑠𝑎𝑣𝑖𝑛𝑔 = 𝐸𝑛𝑒𝑟𝑔𝑦 𝑠𝑎𝑣𝑖𝑛𝑔 × 𝑈𝑛𝑖𝑡 𝐶𝑜𝑠𝑡……… ……..5.1
Estimation of unit cost of electricity was based on average unit cost of the past 3 months;
August-October 2018 as shown on Table 5.1 gotten from electricity bills from KPLC.
Table 5.1: August - October 2018 power bills
Month Peak Off peak Total (Kwh) Total Bill (Ksh) VAT (Ksh) Bill Less VAT Unit Cost (Ksh)
August 209760 161844 371604 6,390,562.00 853,627.86 5,536,934.14 14.90
September 224204 167576 391780 6,677,631.00 891,804.55 5,785,826.45 14.77
October 224324 167433 391757 6,713,035.00 896,706.03 5,816,328.97 14.85
AVG COST 14.84
Operating time per year: 2 shifts per day, 8 hrs per shift, 300 operating days per year.
𝑂𝑝𝑒𝑟𝑎𝑡𝑖𝑛𝑔 𝑡𝑖𝑚𝑒 = 2 × 8 × 300 = 4,800 ℎ𝑟𝑠/𝑦𝑟
𝑉𝑆𝐷 𝑐𝑜𝑛𝑡𝑟𝑜𝑙: 11.17726𝑘𝑊 × 𝐾𝑆ℎ𝑠14.84
𝑘𝑊ℎ𝑟× 4,800ℎ𝑜𝑢𝑟𝑠 = 𝐾𝑆ℎ𝑠 796,178.6
Table 5.2: Laminator 1 savings
Control
Type Power
Annual
Operating
Time
Annual
Operating
Energy kWh
Unit Cost
(KShs/kWh)
Annual
Operating Cost
(KShs)
Annual
Savings
(KShs)
None 23.9 4800 114,720 14.84 1,702,444 0
VSD control 11.17726 4800 53,650 14.84 796,178.5 906,268.3
Determination of Payback period;
𝐏𝐚𝐲𝐛𝐚𝐜𝐤 𝐩𝐞𝐫𝐢𝐨𝐝 =𝐂𝐨𝐬𝐭 𝐨𝐟 𝐈𝐧𝐯𝐞𝐬𝐭𝐦𝐞𝐧𝐭
𝐀𝐧𝐧𝐮𝐚𝐥 𝐬𝐚𝐯𝐢𝐧𝐠𝐬× 12(𝑀𝑜𝑛𝑡ℎ𝑠 𝑖𝑛 𝑎 𝑦𝑒𝑎𝑟)
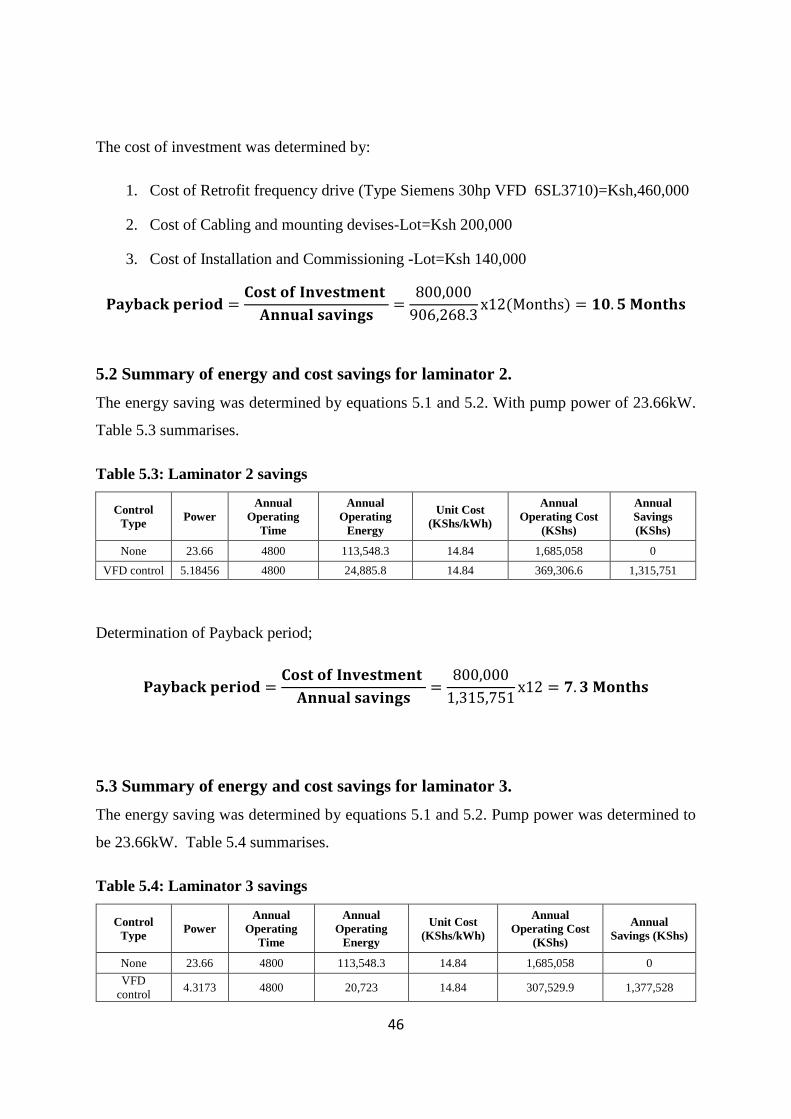
46
The cost of investment was determined by:
1. Cost of Retrofit frequency drive (Type Siemens 30hp VFD 6SL3710)=Ksh,460,000
2. Cost of Cabling and mounting devises-Lot=Ksh 200,000
3. Cost of Installation and Commissioning -Lot=Ksh 140,000
𝐏𝐚𝐲𝐛𝐚𝐜𝐤 𝐩𝐞𝐫𝐢𝐨𝐝 =𝐂𝐨𝐬𝐭 𝐨𝐟 𝐈𝐧𝐯𝐞𝐬𝐭𝐦𝐞𝐧𝐭
𝐀𝐧𝐧𝐮𝐚𝐥 𝐬𝐚𝐯𝐢𝐧𝐠𝐬=
800,000
906,268.3x12(Months) = 𝟏𝟎. 𝟓 𝐌𝐨𝐧𝐭𝐡𝐬
5.2 Summary of energy and cost savings for laminator 2.
The energy saving was determined by equations 5.1 and 5.2. With pump power of 23.66kW.
Table 5.3 summarises.
Table 5.3: Laminator 2 savings
Control
Type Power
Annual
Operating
Time
Annual
Operating
Energy
Unit Cost
(KShs/kWh)
Annual
Operating Cost
(KShs)
Annual
Savings
(KShs)
None 23.66 4800 113,548.3 14.84 1,685,058 0
VFD control 5.18456 4800 24,885.8 14.84 369,306.6 1,315,751
Determination of Payback period;
𝐏𝐚𝐲𝐛𝐚𝐜𝐤 𝐩𝐞𝐫𝐢𝐨𝐝 =𝐂𝐨𝐬𝐭 𝐨𝐟 𝐈𝐧𝐯𝐞𝐬𝐭𝐦𝐞𝐧𝐭
𝐀𝐧𝐧𝐮𝐚𝐥 𝐬𝐚𝐯𝐢𝐧𝐠𝐬=
800,000
1,315,751x12 = 𝟕. 𝟑 𝐌𝐨𝐧𝐭𝐡𝐬
5.3 Summary of energy and cost savings for laminator 3.
The energy saving was determined by equations 5.1 and 5.2. Pump power was determined to
be 23.66kW. Table 5.4 summarises.
Table 5.4: Laminator 3 savings
Control
Type Power
Annual
Operating
Time
Annual
Operating
Energy
Unit Cost
(KShs/kWh)
Annual
Operating Cost
(KShs)
Annual
Savings (KShs)
None 23.66 4800 113,548.3 14.84 1,685,058 0
VFD
control 4.3173 4800 20,723 14.84 307,529.9 1,377,528

47
Determination of Payback period;
𝐏𝐚𝐲𝐛𝐚𝐜𝐤 𝐩𝐞𝐫𝐢𝐨𝐝 =𝐂𝐨𝐬𝐭 𝐨𝐟 𝐈𝐧𝐯𝐞𝐬𝐭𝐦𝐞𝐧𝐭
𝐀𝐧𝐧𝐮𝐚𝐥 𝐬𝐚𝐯𝐢𝐧𝐠𝐬=
800,000
1,377,528x12 = 𝟕 𝐌𝐨𝐧𝐭𝐡𝐬
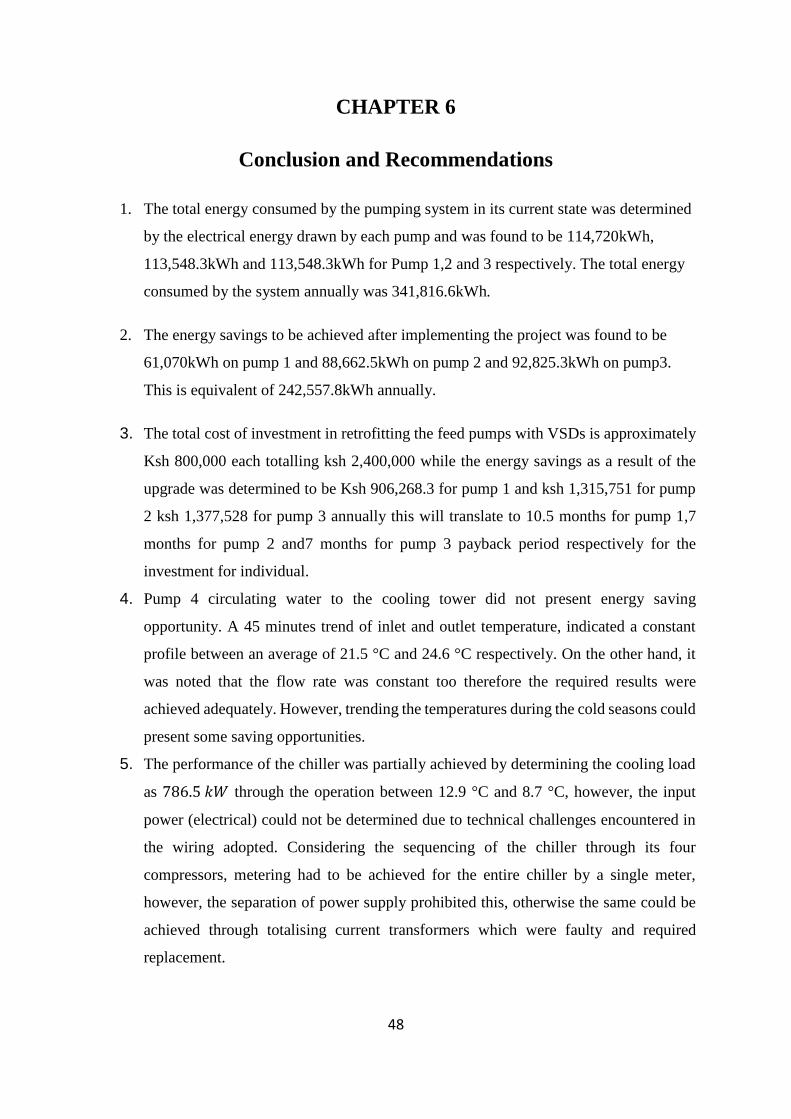
48
CHAPTER 6
Conclusion and Recommendations
1. The total energy consumed by the pumping system in its current state was determined
by the electrical energy drawn by each pump and was found to be 114,720kWh,
113,548.3kWh and 113,548.3kWh for Pump 1,2 and 3 respectively. The total energy
consumed by the system annually was 341,816.6kWh.
2. The energy savings to be achieved after implementing the project was found to be
61,070kWh on pump 1 and 88,662.5kWh on pump 2 and 92,825.3kWh on pump3.
This is equivalent of 242,557.8kWh annually.
3. The total cost of investment in retrofitting the feed pumps with VSDs is approximately
Ksh 800,000 each totalling ksh 2,400,000 while the energy savings as a result of the
upgrade was determined to be Ksh 906,268.3 for pump 1 and ksh 1,315,751 for pump
2 ksh 1,377,528 for pump 3 annually this will translate to 10.5 months for pump 1,7
months for pump 2 and7 months for pump 3 payback period respectively for the
investment for individual.
4. Pump 4 circulating water to the cooling tower did not present energy saving
opportunity. A 45 minutes trend of inlet and outlet temperature, indicated a constant
profile between an average of 21.5 °C and 24.6 °C respectively. On the other hand, it
was noted that the flow rate was constant too therefore the required results were
achieved adequately. However, trending the temperatures during the cold seasons could
present some saving opportunities.
5. The performance of the chiller was partially achieved by determining the cooling load
as 786.5 𝑘𝑊 through the operation between 12.9 °C and 8.7 °C, however, the input
power (electrical) could not be determined due to technical challenges encountered in
the wiring adopted. Considering the sequencing of the chiller through its four
compressors, metering had to be achieved for the entire chiller by a single meter,
however, the separation of power supply prohibited this, otherwise the same could be
achieved through totalising current transformers which were faulty and required
replacement.
49
6.1 Future work recommendations
Recommendations for further research and improvement of this work include;
1. Deploying VSDs on pumps in other sections of utilities will greatly reduce energy
consumption in the plant.
2. The set points on laminator 3 were found to be higher than the return lines from
laminator 1 and Laminator 2. Therefore, feeding Lam 3 with return lines from lam 1
and 2 will negate the need for the pump 3 nor VSD lowering the cost even further,
this should be investigated and matched with production requirements.
3. Automation of the chiller unit and Colling tower fans
4. During the course of the study it was observed that the chiller is in operation
regardless of whether production has started, there is need to investigate energy
wasted as a result of this anomaly against the time required to cool the water in the
reservoir. The argument of the personnel in the ground that it took a lot of time to
attain required temperatures in the reservoir before start of production resulting in
lower production time utilisation (PTU).
50
References
[1] Tetra Pak, “Energy guideline – sustainability program” website, www.tetrapak.com
viewed on 13th September 2018.
[2] Rockwell Automation. (2004, April). Drive Engineering Handbook. Publication 1300-
DEH-10 - April 2004 © 2004 Rockwell International Corporation.
[3] Barnes, M. (2003). Practical Variable Speed Drives and Power Electronics. 1st Edition
published 2003 Newnes Linacre house, Jordan hill Oxford Ox2 8DP
[4] John, N., R, M., & Rajappan, S. C. (2013, March). Energy Saving Mechanism Using
Variable Frequency Drives. International Journal of Emerging Technology and
Advanced Engineering, 784-790 Volume 3, Issue 12, December 2013)
[5] Song, Y., & Zhao, J. (2017). Operating characteristics of the variable frequency speed-
regulating system for a single pump in a closed system. Journal of Building Services
Engineering Research & Technology 38(3), 309–317. Building Serv. Eng. Res.
Technol. 2017, Vol. 38(3) 309–317 The Chartered Institution of Building Services
Engineers 2016
[6] Narkhede, J., & Naik, S. (2016, April). Boiler Feed Pump Control Using Variable
Frequency Drive. International Research Journal of Engineering and Technology (IRJET),
2444 - 2449. Volume: 03 Issue: 04 | April-2016
[7] Lee, C.-H., Liu, Z.-W., Chen, C.-N., Cho, M.-Y., Lin, F.-T., & Jiang, J.-A. An Energy-
Savings Evaluation Method for Variable-Frequency-Drive Applications on Ship
Central Cooling Systems. VOL. 50, NO. 2, MARCH/APRIL 2014
[8] Marchi, A., Simpson, A. R., & Ertugrul, N. (2012, July 4). Assessing variable speed pump
efficiency in water distribution systems. School of Electrical and Electronic
Engineering, The University of Adelaide, SA 5005, Australia. 25 January 2012 –
Published in Drink. Water Eng. Sci. Discuss.: 15 March 2012
Revised: 23 May 2012 – Accepted: 11 June 2012 – Published: 4 July 2012
51
[9] Natural Resources Canada. (2009). Variable Frequency Drives Energy Efficiency
Reference Guide.
[10] R. Keith Mobley, L. R. (2008). Maintenance engineering handbook (7th edition ed.)
Copyright © 2008, 2002, 1995, 1988, 1977, 1966, 1957 by The McGraw-Hill
Companies.
[11] Kenya Electricity Regulatory Board, “Retail Electricity Tariffs Review Policy” 2005.
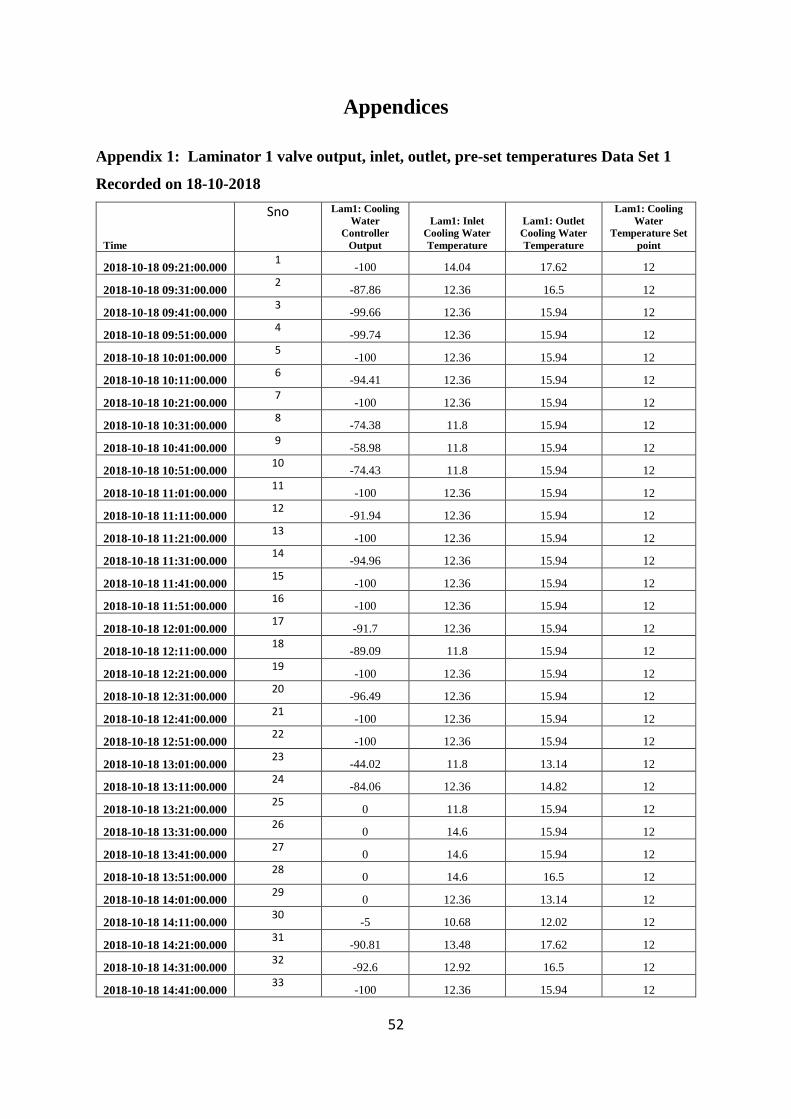
52
Appendices
Appendix 1: Laminator 1 valve output, inlet, outlet, pre-set temperatures Data Set 1
Recorded on 18-10-2018
Time
Sno
Lam1: Cooling
Water
Controller
Output
Lam1: Inlet
Cooling Water
Temperature
Lam1: Outlet
Cooling Water
Temperature
Lam1: Cooling
Water
Temperature Set
point
2018-10-18 09:21:00.000 1
-100 14.04 17.62 12
2018-10-18 09:31:00.000 2
-87.86 12.36 16.5 12
2018-10-18 09:41:00.000 3
-99.66 12.36 15.94 12
2018-10-18 09:51:00.000 4
-99.74 12.36 15.94 12
2018-10-18 10:01:00.000 5
-100 12.36 15.94 12
2018-10-18 10:11:00.000 6
-94.41 12.36 15.94 12
2018-10-18 10:21:00.000 7
-100 12.36 15.94 12
2018-10-18 10:31:00.000 8
-74.38 11.8 15.94 12
2018-10-18 10:41:00.000 9
-58.98 11.8 15.94 12
2018-10-18 10:51:00.000 10
-74.43 11.8 15.94 12
2018-10-18 11:01:00.000 11
-100 12.36 15.94 12
2018-10-18 11:11:00.000 12
-91.94 12.36 15.94 12
2018-10-18 11:21:00.000 13
-100 12.36 15.94 12
2018-10-18 11:31:00.000 14
-94.96 12.36 15.94 12
2018-10-18 11:41:00.000 15
-100 12.36 15.94 12
2018-10-18 11:51:00.000 16
-100 12.36 15.94 12
2018-10-18 12:01:00.000 17
-91.7 12.36 15.94 12
2018-10-18 12:11:00.000 18
-89.09 11.8 15.94 12
2018-10-18 12:21:00.000 19
-100 12.36 15.94 12
2018-10-18 12:31:00.000 20
-96.49 12.36 15.94 12
2018-10-18 12:41:00.000 21
-100 12.36 15.94 12
2018-10-18 12:51:00.000 22
-100 12.36 15.94 12
2018-10-18 13:01:00.000 23
-44.02 11.8 13.14 12
2018-10-18 13:11:00.000 24
-84.06 12.36 14.82 12
2018-10-18 13:21:00.000 25
0 11.8 15.94 12
2018-10-18 13:31:00.000 26
0 14.6 15.94 12
2018-10-18 13:41:00.000 27
0 14.6 15.94 12
2018-10-18 13:51:00.000 28
0 14.6 16.5 12
2018-10-18 14:01:00.000 29
0 12.36 13.14 12
2018-10-18 14:11:00.000 30
-5 10.68 12.02 12
2018-10-18 14:21:00.000 31
-90.81 13.48 17.62 12
2018-10-18 14:31:00.000 32
-92.6 12.92 16.5 12
2018-10-18 14:41:00.000 33
-100 12.36 15.94 12
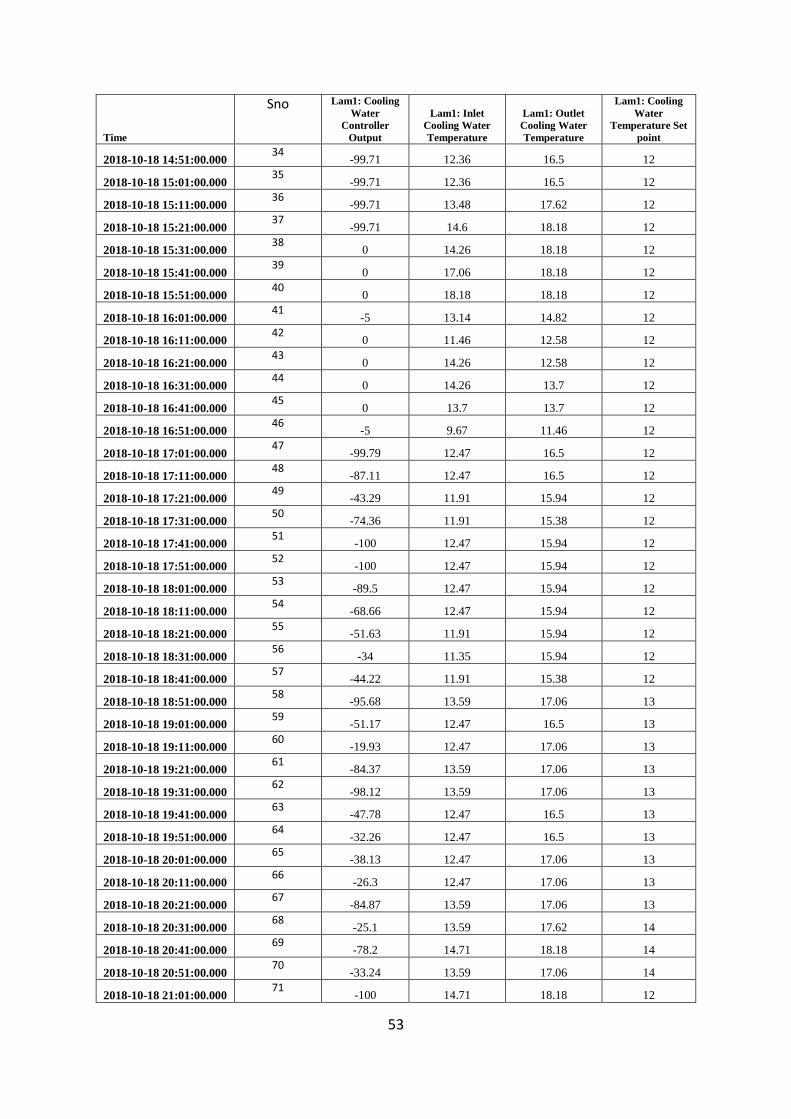
53
Time
Sno
Lam1: Cooling
Water
Controller
Output
Lam1: Inlet
Cooling Water
Temperature
Lam1: Outlet
Cooling Water
Temperature
Lam1: Cooling
Water
Temperature Set
point
2018-10-18 14:51:00.000 34
-99.71 12.36 16.5 12
2018-10-18 15:01:00.000 35
-99.71 12.36 16.5 12
2018-10-18 15:11:00.000 36
-99.71 13.48 17.62 12
2018-10-18 15:21:00.000 37
-99.71 14.6 18.18 12
2018-10-18 15:31:00.000 38
0 14.26 18.18 12
2018-10-18 15:41:00.000 39
0 17.06 18.18 12
2018-10-18 15:51:00.000 40
0 18.18 18.18 12
2018-10-18 16:01:00.000 41
-5 13.14 14.82 12
2018-10-18 16:11:00.000 42
0 11.46 12.58 12
2018-10-18 16:21:00.000 43
0 14.26 12.58 12
2018-10-18 16:31:00.000 44
0 14.26 13.7 12
2018-10-18 16:41:00.000 45
0 13.7 13.7 12
2018-10-18 16:51:00.000 46
-5 9.67 11.46 12
2018-10-18 17:01:00.000 47
-99.79 12.47 16.5 12
2018-10-18 17:11:00.000 48
-87.11 12.47 16.5 12
2018-10-18 17:21:00.000 49
-43.29 11.91 15.94 12
2018-10-18 17:31:00.000 50
-74.36 11.91 15.38 12
2018-10-18 17:41:00.000 51
-100 12.47 15.94 12
2018-10-18 17:51:00.000 52
-100 12.47 15.94 12
2018-10-18 18:01:00.000 53
-89.5 12.47 15.94 12
2018-10-18 18:11:00.000 54
-68.66 12.47 15.94 12
2018-10-18 18:21:00.000 55
-51.63 11.91 15.94 12
2018-10-18 18:31:00.000 56
-34 11.35 15.94 12
2018-10-18 18:41:00.000 57
-44.22 11.91 15.38 12
2018-10-18 18:51:00.000 58
-95.68 13.59 17.06 13
2018-10-18 19:01:00.000 59
-51.17 12.47 16.5 13
2018-10-18 19:11:00.000 60
-19.93 12.47 17.06 13
2018-10-18 19:21:00.000 61
-84.37 13.59 17.06 13
2018-10-18 19:31:00.000 62
-98.12 13.59 17.06 13
2018-10-18 19:41:00.000 63
-47.78 12.47 16.5 13
2018-10-18 19:51:00.000 64
-32.26 12.47 16.5 13
2018-10-18 20:01:00.000 65
-38.13 12.47 17.06 13
2018-10-18 20:11:00.000 66
-26.3 12.47 17.06 13
2018-10-18 20:21:00.000 67
-84.87 13.59 17.06 13
2018-10-18 20:31:00.000 68
-25.1 13.59 17.62 14
2018-10-18 20:41:00.000 69
-78.2 14.71 18.18 14
2018-10-18 20:51:00.000 70
-33.24 13.59 17.06 14
2018-10-18 21:01:00.000 71
-100 14.71 18.18 12
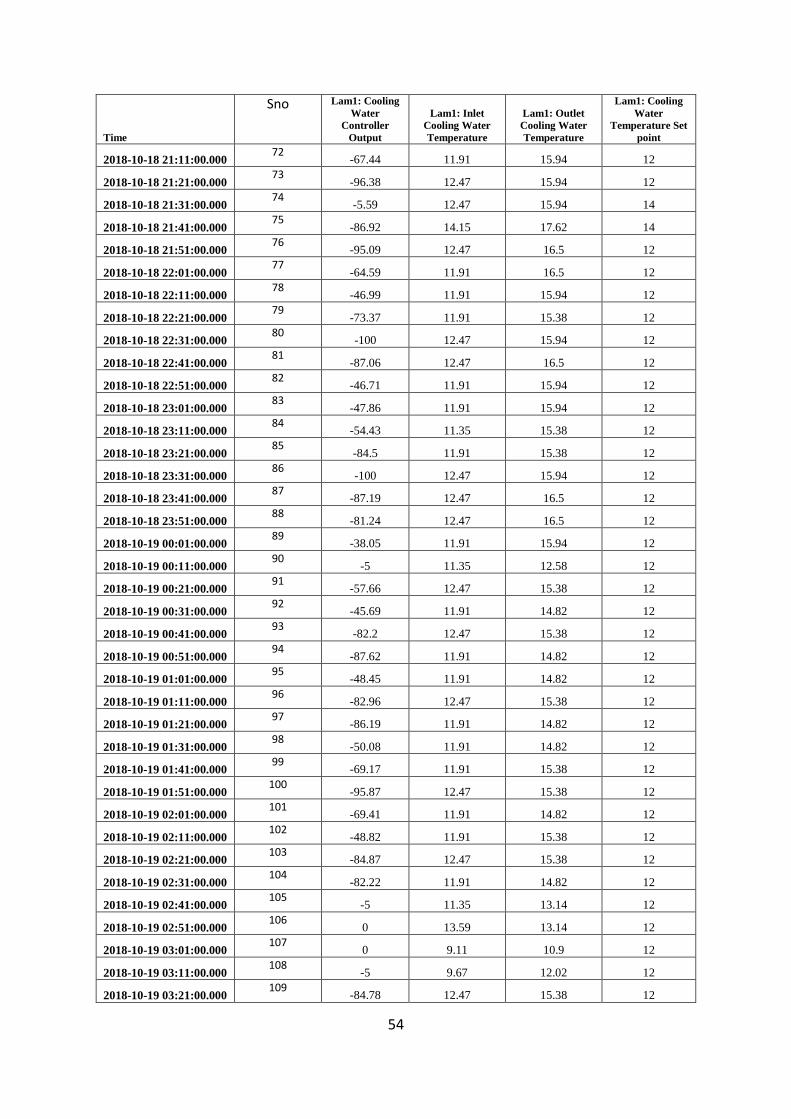
54
Time
Sno
Lam1: Cooling
Water
Controller
Output
Lam1: Inlet
Cooling Water
Temperature
Lam1: Outlet
Cooling Water
Temperature
Lam1: Cooling
Water
Temperature Set
point
2018-10-18 21:11:00.000 72
-67.44 11.91 15.94 12
2018-10-18 21:21:00.000 73
-96.38 12.47 15.94 12
2018-10-18 21:31:00.000 74
-5.59 12.47 15.94 14
2018-10-18 21:41:00.000 75
-86.92 14.15 17.62 14
2018-10-18 21:51:00.000 76
-95.09 12.47 16.5 12
2018-10-18 22:01:00.000 77
-64.59 11.91 16.5 12
2018-10-18 22:11:00.000 78
-46.99 11.91 15.94 12
2018-10-18 22:21:00.000 79
-73.37 11.91 15.38 12
2018-10-18 22:31:00.000 80
-100 12.47 15.94 12
2018-10-18 22:41:00.000 81
-87.06 12.47 16.5 12
2018-10-18 22:51:00.000 82
-46.71 11.91 15.94 12
2018-10-18 23:01:00.000 83
-47.86 11.91 15.94 12
2018-10-18 23:11:00.000 84
-54.43 11.35 15.38 12
2018-10-18 23:21:00.000 85
-84.5 11.91 15.38 12
2018-10-18 23:31:00.000 86
-100 12.47 15.94 12
2018-10-18 23:41:00.000 87
-87.19 12.47 16.5 12
2018-10-18 23:51:00.000 88
-81.24 12.47 16.5 12
2018-10-19 00:01:00.000 89
-38.05 11.91 15.94 12
2018-10-19 00:11:00.000 90
-5 11.35 12.58 12
2018-10-19 00:21:00.000 91
-57.66 12.47 15.38 12
2018-10-19 00:31:00.000 92
-45.69 11.91 14.82 12
2018-10-19 00:41:00.000 93
-82.2 12.47 15.38 12
2018-10-19 00:51:00.000 94
-87.62 11.91 14.82 12
2018-10-19 01:01:00.000 95
-48.45 11.91 14.82 12
2018-10-19 01:11:00.000 96
-82.96 12.47 15.38 12
2018-10-19 01:21:00.000 97
-86.19 11.91 14.82 12
2018-10-19 01:31:00.000 98
-50.08 11.91 14.82 12
2018-10-19 01:41:00.000 99
-69.17 11.91 15.38 12
2018-10-19 01:51:00.000 100
-95.87 12.47 15.38 12
2018-10-19 02:01:00.000 101
-69.41 11.91 14.82 12
2018-10-19 02:11:00.000 102
-48.82 11.91 15.38 12
2018-10-19 02:21:00.000 103
-84.87 12.47 15.38 12
2018-10-19 02:31:00.000 104
-82.22 11.91 14.82 12
2018-10-19 02:41:00.000 105
-5 11.35 13.14 12
2018-10-19 02:51:00.000 106
0 13.59 13.14 12
2018-10-19 03:01:00.000 107
0 9.11 10.9 12
2018-10-19 03:11:00.000 108
-5 9.67 12.02 12
2018-10-19 03:21:00.000 109
-84.78 12.47 15.38 12
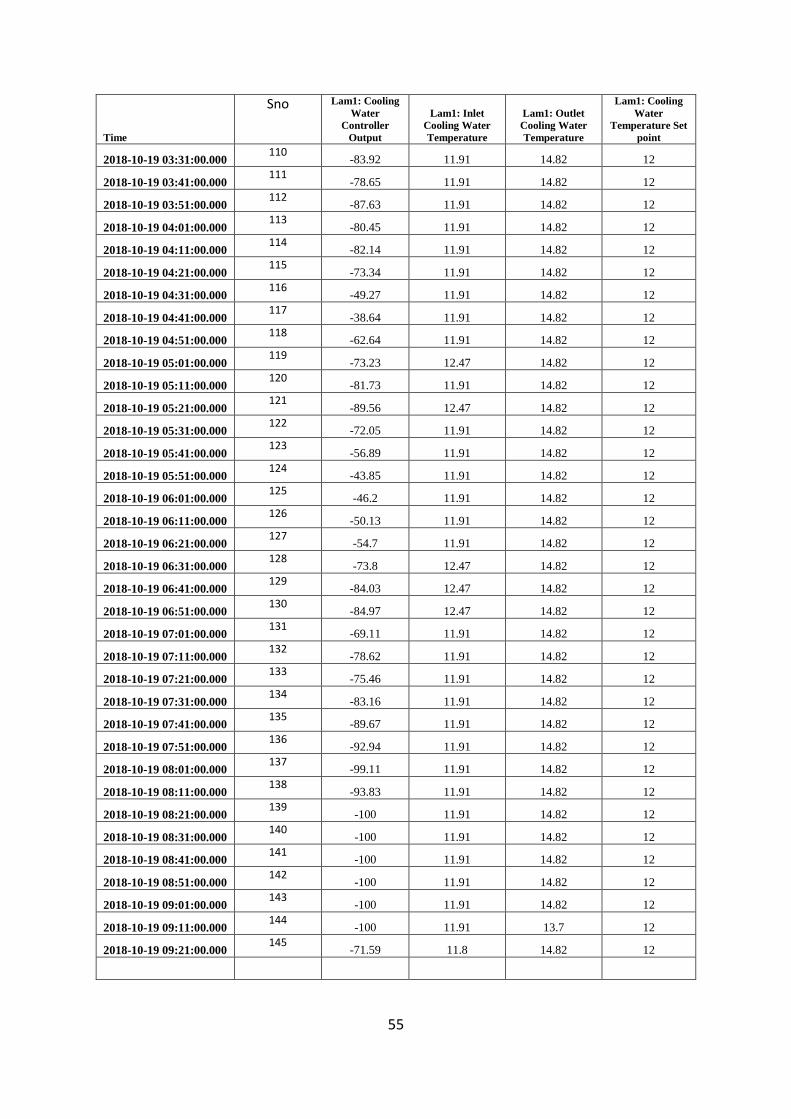
55
Time
Sno
Lam1: Cooling
Water
Controller
Output
Lam1: Inlet
Cooling Water
Temperature
Lam1: Outlet
Cooling Water
Temperature
Lam1: Cooling
Water
Temperature Set
point
2018-10-19 03:31:00.000 110
-83.92 11.91 14.82 12
2018-10-19 03:41:00.000 111
-78.65 11.91 14.82 12
2018-10-19 03:51:00.000 112
-87.63 11.91 14.82 12
2018-10-19 04:01:00.000 113
-80.45 11.91 14.82 12
2018-10-19 04:11:00.000 114
-82.14 11.91 14.82 12
2018-10-19 04:21:00.000 115
-73.34 11.91 14.82 12
2018-10-19 04:31:00.000 116
-49.27 11.91 14.82 12
2018-10-19 04:41:00.000 117
-38.64 11.91 14.82 12
2018-10-19 04:51:00.000 118
-62.64 11.91 14.82 12
2018-10-19 05:01:00.000 119
-73.23 12.47 14.82 12
2018-10-19 05:11:00.000 120
-81.73 11.91 14.82 12
2018-10-19 05:21:00.000 121
-89.56 12.47 14.82 12
2018-10-19 05:31:00.000 122
-72.05 11.91 14.82 12
2018-10-19 05:41:00.000 123
-56.89 11.91 14.82 12
2018-10-19 05:51:00.000 124
-43.85 11.91 14.82 12
2018-10-19 06:01:00.000 125
-46.2 11.91 14.82 12
2018-10-19 06:11:00.000 126
-50.13 11.91 14.82 12
2018-10-19 06:21:00.000 127
-54.7 11.91 14.82 12
2018-10-19 06:31:00.000 128
-73.8 12.47 14.82 12
2018-10-19 06:41:00.000 129
-84.03 12.47 14.82 12
2018-10-19 06:51:00.000 130
-84.97 12.47 14.82 12
2018-10-19 07:01:00.000 131
-69.11 11.91 14.82 12
2018-10-19 07:11:00.000 132
-78.62 11.91 14.82 12
2018-10-19 07:21:00.000 133
-75.46 11.91 14.82 12
2018-10-19 07:31:00.000 134
-83.16 11.91 14.82 12
2018-10-19 07:41:00.000 135
-89.67 11.91 14.82 12
2018-10-19 07:51:00.000 136
-92.94 11.91 14.82 12
2018-10-19 08:01:00.000 137
-99.11 11.91 14.82 12
2018-10-19 08:11:00.000 138
-93.83 11.91 14.82 12
2018-10-19 08:21:00.000 139
-100 11.91 14.82 12
2018-10-19 08:31:00.000 140
-100 11.91 14.82 12
2018-10-19 08:41:00.000 141
-100 11.91 14.82 12
2018-10-19 08:51:00.000 142
-100 11.91 14.82 12
2018-10-19 09:01:00.000 143
-100 11.91 14.82 12
2018-10-19 09:11:00.000 144
-100 11.91 13.7 12
2018-10-19 09:21:00.000 145
-71.59 11.8 14.82 12
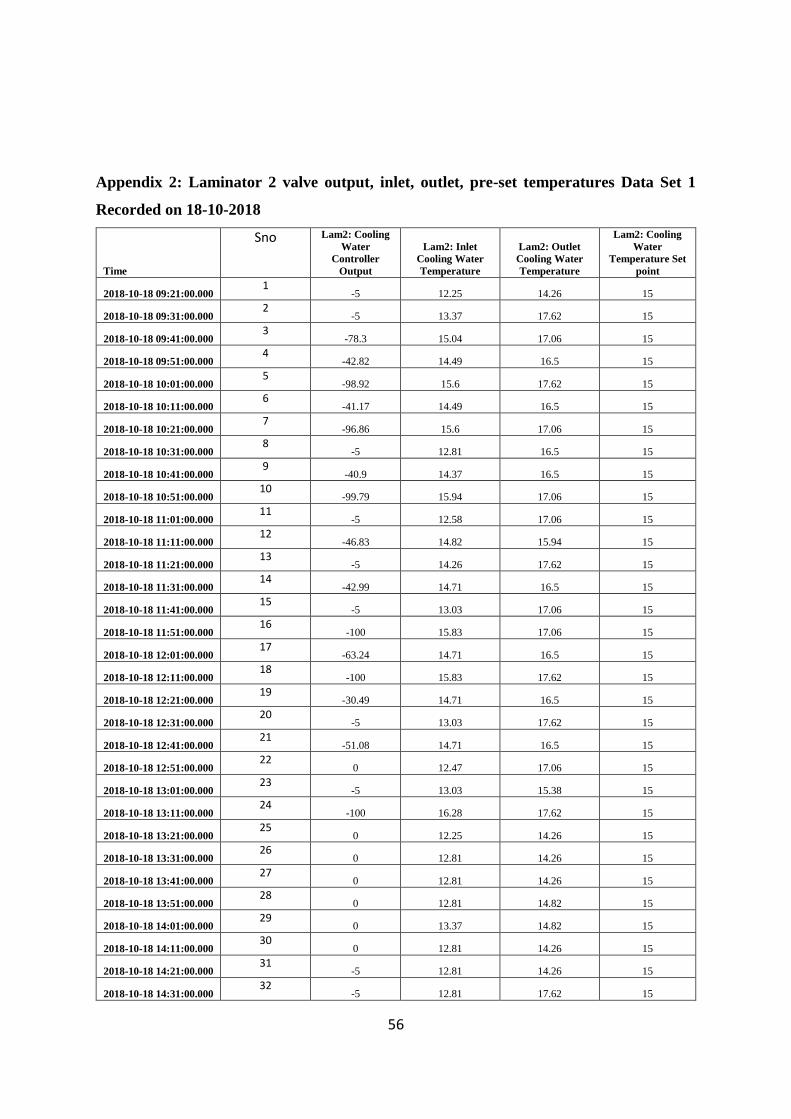
56
Appendix 2: Laminator 2 valve output, inlet, outlet, pre-set temperatures Data Set 1
Recorded on 18-10-2018
Time
Sno
Lam2: Cooling
Water
Controller
Output
Lam2: Inlet
Cooling Water
Temperature
Lam2: Outlet
Cooling Water
Temperature
Lam2: Cooling
Water
Temperature Set
point
2018-10-18 09:21:00.000 1
-5 12.25 14.26 15
2018-10-18 09:31:00.000 2
-5 13.37 17.62 15
2018-10-18 09:41:00.000 3
-78.3 15.04 17.06 15
2018-10-18 09:51:00.000 4
-42.82 14.49 16.5 15
2018-10-18 10:01:00.000 5
-98.92 15.6 17.62 15
2018-10-18 10:11:00.000 6
-41.17 14.49 16.5 15
2018-10-18 10:21:00.000 7
-96.86 15.6 17.06 15
2018-10-18 10:31:00.000 8
-5 12.81 16.5 15
2018-10-18 10:41:00.000 9
-40.9 14.37 16.5 15
2018-10-18 10:51:00.000 10
-99.79 15.94 17.06 15
2018-10-18 11:01:00.000 11
-5 12.58 17.06 15
2018-10-18 11:11:00.000 12
-46.83 14.82 15.94 15
2018-10-18 11:21:00.000 13
-5 14.26 17.62 15
2018-10-18 11:31:00.000 14
-42.99 14.71 16.5 15
2018-10-18 11:41:00.000 15
-5 13.03 17.06 15
2018-10-18 11:51:00.000 16
-100 15.83 17.06 15
2018-10-18 12:01:00.000 17
-63.24 14.71 16.5 15
2018-10-18 12:11:00.000 18
-100 15.83 17.62 15
2018-10-18 12:21:00.000 19
-30.49 14.71 16.5 15
2018-10-18 12:31:00.000 20
-5 13.03 17.62 15
2018-10-18 12:41:00.000 21
-51.08 14.71 16.5 15
2018-10-18 12:51:00.000 22
0 12.47 17.06 15
2018-10-18 13:01:00.000 23
-5 13.03 15.38 15
2018-10-18 13:11:00.000 24
-100 16.28 17.62 15
2018-10-18 13:21:00.000 25
0 12.25 14.26 15
2018-10-18 13:31:00.000 26
0 12.81 14.26 15
2018-10-18 13:41:00.000 27
0 12.81 14.26 15
2018-10-18 13:51:00.000 28
0 12.81 14.82 15
2018-10-18 14:01:00.000 29
0 13.37 14.82 15
2018-10-18 14:11:00.000 30
0 12.81 14.26 15
2018-10-18 14:21:00.000 31
-5 12.81 14.26 15
2018-10-18 14:31:00.000 32
-5 12.81 17.62 15
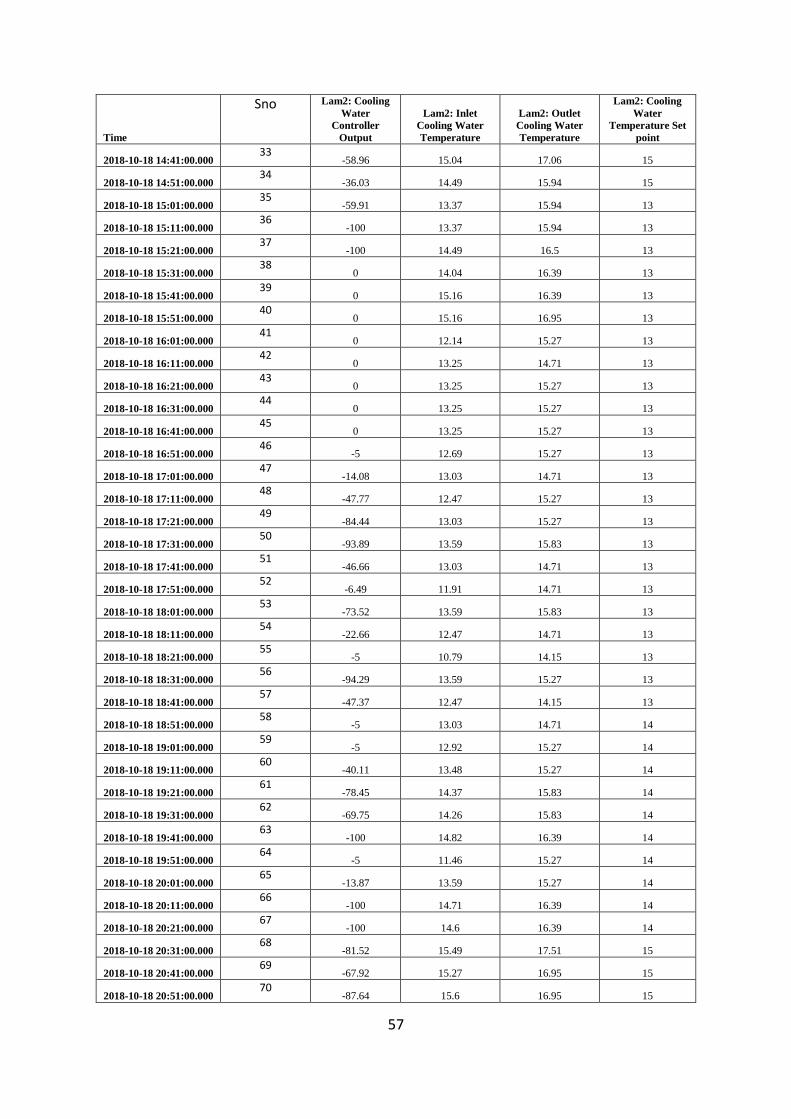
57
Time
Sno
Lam2: Cooling
Water
Controller
Output
Lam2: Inlet
Cooling Water
Temperature
Lam2: Outlet
Cooling Water
Temperature
Lam2: Cooling
Water
Temperature Set
point
2018-10-18 14:41:00.000 33
-58.96 15.04 17.06 15
2018-10-18 14:51:00.000 34
-36.03 14.49 15.94 15
2018-10-18 15:01:00.000 35
-59.91 13.37 15.94 13
2018-10-18 15:11:00.000 36
-100 13.37 15.94 13
2018-10-18 15:21:00.000 37
-100 14.49 16.5 13
2018-10-18 15:31:00.000 38
0 14.04 16.39 13
2018-10-18 15:41:00.000 39
0 15.16 16.39 13
2018-10-18 15:51:00.000 40
0 15.16 16.95 13
2018-10-18 16:01:00.000 41
0 12.14 15.27 13
2018-10-18 16:11:00.000 42
0 13.25 14.71 13
2018-10-18 16:21:00.000 43
0 13.25 15.27 13
2018-10-18 16:31:00.000 44
0 13.25 15.27 13
2018-10-18 16:41:00.000 45
0 13.25 15.27 13
2018-10-18 16:51:00.000 46
-5 12.69 15.27 13
2018-10-18 17:01:00.000 47
-14.08 13.03 14.71 13
2018-10-18 17:11:00.000 48
-47.77 12.47 15.27 13
2018-10-18 17:21:00.000 49
-84.44 13.03 15.27 13
2018-10-18 17:31:00.000 50
-93.89 13.59 15.83 13
2018-10-18 17:41:00.000 51
-46.66 13.03 14.71 13
2018-10-18 17:51:00.000 52
-6.49 11.91 14.71 13
2018-10-18 18:01:00.000 53
-73.52 13.59 15.83 13
2018-10-18 18:11:00.000 54
-22.66 12.47 14.71 13
2018-10-18 18:21:00.000 55
-5 10.79 14.15 13
2018-10-18 18:31:00.000 56
-94.29 13.59 15.27 13
2018-10-18 18:41:00.000 57
-47.37 12.47 14.15 13
2018-10-18 18:51:00.000 58
-5 13.03 14.71 14
2018-10-18 19:01:00.000 59
-5 12.92 15.27 14
2018-10-18 19:11:00.000 60
-40.11 13.48 15.27 14
2018-10-18 19:21:00.000 61
-78.45 14.37 15.83 14
2018-10-18 19:31:00.000 62
-69.75 14.26 15.83 14
2018-10-18 19:41:00.000 63
-100 14.82 16.39 14
2018-10-18 19:51:00.000 64
-5 11.46 15.27 14
2018-10-18 20:01:00.000 65
-13.87 13.59 15.27 14
2018-10-18 20:11:00.000 66
-100 14.71 16.39 14
2018-10-18 20:21:00.000 67
-100 14.6 16.39 14
2018-10-18 20:31:00.000 68
-81.52 15.49 17.51 15
2018-10-18 20:41:00.000 69
-67.92 15.27 16.95 15
2018-10-18 20:51:00.000 70
-87.64 15.6 16.95 15

58
Time
Sno
Lam2: Cooling
Water
Controller
Output
Lam2: Inlet
Cooling Water
Temperature
Lam2: Outlet
Cooling Water
Temperature
Lam2: Cooling
Water
Temperature Set
point
2018-10-18 21:01:00.000 71
-100 15.38 17.51 13
2018-10-18 21:11:00.000 72
-43.23 12.47 14.15 13
2018-10-18 21:21:00.000 73
-6.98 12.47 15.83 13
2018-10-18 21:31:00.000 74
-14.29 13.03 14.71 14
2018-10-18 21:41:00.000 75
-56.77 13.93 15.27 14
2018-10-18 21:51:00.000 76
-82.51 14.49 16.39 14
2018-10-18 22:01:00.000 77
-51.64 14.37 16.95 14
2018-10-18 22:11:00.000 78
-5.19 11.58 14.71 14
2018-10-18 22:21:00.000 79
-5.14 13.25 14.71 14
2018-10-18 22:31:00.000 80
-8.24 13.14 15.27 14
2018-10-18 22:41:00.000 81
-49.49 13.59 15.27 14
2018-10-18 22:51:00.000 82
-73.52 14.04 15.83 14
2018-10-18 23:01:00.000 83
-100 14.6 16.39 14
2018-10-18 23:11:00.000 84
-5 12.69 16.39 14
2018-10-18 23:21:00.000 85
-5 11.46 15.27 14
2018-10-18 23:31:00.000 86
-5 13.14 15.27 14
2018-10-18 23:41:00.000 87
-66.52 14.15 15.83 14
2018-10-18 23:51:00.000 88
-72.31 14.04 15.83 14
2018-10-19 00:01:00.000 89
-82.6 14.37 16.39 14
2018-10-19 00:11:00.000 90
-5 13.03 15.83 14
2018-10-19 00:21:00.000 91
-5 10.01 12.47 14
2018-10-19 00:31:00.000 92
-5.16 13.25 15.27 14
2018-10-19 00:41:00.000 93
-27.9 13.25 15.27 14
2018-10-19 00:51:00.000 94
-70.11 14.15 15.83 14
2018-10-19 01:01:00.000 95
-97.59 14.71 16.95 14
2018-10-19 01:11:00.000 96
-5 10.57 15.27 14
2018-10-19 01:21:00.000 97
-12.66 12.69 14.71 14
2018-10-19 01:31:00.000 98
-27.58 13.14 15.27 14
2018-10-19 01:41:00.000 99
-91.32 14.71 16.39 14
2018-10-19 01:51:00.000 100
-44.21 14.15 16.95 14
2018-10-19 02:01:00.000 101
-5 10.68 15.27 14
2018-10-19 02:11:00.000 102
-5 12.81 14.71 14
2018-10-19 02:21:00.000 103
-64.51 13.93 15.83 14
2018-10-19 02:31:00.000 104
-100 14.49 16.39 14
2018-10-19 02:41:00.000 105
0 11.69 15.27 14
2018-10-19 02:51:00.000 106
0 13.37 15.83 14
2018-10-19 03:01:00.000 107
0 13.93 16.39 14
2018-10-19 03:11:00.000 108
-5 9.56 13.03 14
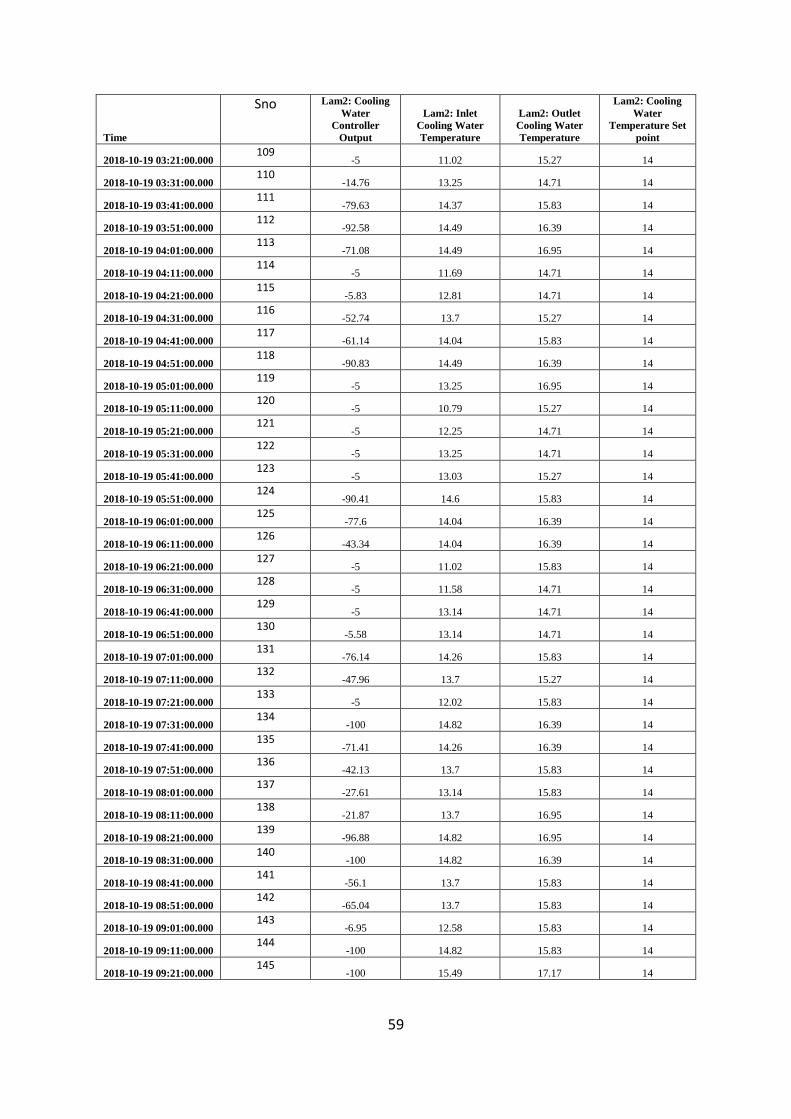
59
Time
Sno
Lam2: Cooling
Water
Controller
Output
Lam2: Inlet
Cooling Water
Temperature
Lam2: Outlet
Cooling Water
Temperature
Lam2: Cooling
Water
Temperature Set
point
2018-10-19 03:21:00.000 109
-5 11.02 15.27 14
2018-10-19 03:31:00.000 110
-14.76 13.25 14.71 14
2018-10-19 03:41:00.000 111
-79.63 14.37 15.83 14
2018-10-19 03:51:00.000 112
-92.58 14.49 16.39 14
2018-10-19 04:01:00.000 113
-71.08 14.49 16.95 14
2018-10-19 04:11:00.000 114
-5 11.69 14.71 14
2018-10-19 04:21:00.000 115
-5.83 12.81 14.71 14
2018-10-19 04:31:00.000 116
-52.74 13.7 15.27 14
2018-10-19 04:41:00.000 117
-61.14 14.04 15.83 14
2018-10-19 04:51:00.000 118
-90.83 14.49 16.39 14
2018-10-19 05:01:00.000 119
-5 13.25 16.95 14
2018-10-19 05:11:00.000 120
-5 10.79 15.27 14
2018-10-19 05:21:00.000 121
-5 12.25 14.71 14
2018-10-19 05:31:00.000 122
-5 13.25 14.71 14
2018-10-19 05:41:00.000 123
-5 13.03 15.27 14
2018-10-19 05:51:00.000 124
-90.41 14.6 15.83 14
2018-10-19 06:01:00.000 125
-77.6 14.04 16.39 14
2018-10-19 06:11:00.000 126
-43.34 14.04 16.39 14
2018-10-19 06:21:00.000 127
-5 11.02 15.83 14
2018-10-19 06:31:00.000 128
-5 11.58 14.71 14
2018-10-19 06:41:00.000 129
-5 13.14 14.71 14
2018-10-19 06:51:00.000 130
-5.58 13.14 14.71 14
2018-10-19 07:01:00.000 131
-76.14 14.26 15.83 14
2018-10-19 07:11:00.000 132
-47.96 13.7 15.27 14
2018-10-19 07:21:00.000 133
-5 12.02 15.83 14
2018-10-19 07:31:00.000 134
-100 14.82 16.39 14
2018-10-19 07:41:00.000 135
-71.41 14.26 16.39 14
2018-10-19 07:51:00.000 136
-42.13 13.7 15.83 14
2018-10-19 08:01:00.000 137
-27.61 13.14 15.83 14
2018-10-19 08:11:00.000 138
-21.87 13.7 16.95 14
2018-10-19 08:21:00.000 139
-96.88 14.82 16.95 14
2018-10-19 08:31:00.000 140
-100 14.82 16.39 14
2018-10-19 08:41:00.000 141
-56.1 13.7 15.83 14
2018-10-19 08:51:00.000 142
-65.04 13.7 15.83 14
2018-10-19 09:01:00.000 143
-6.95 12.58 15.83 14
2018-10-19 09:11:00.000 144
-100 14.82 15.83 14
2018-10-19 09:21:00.000 145
-100 15.49 17.17 14

60
Appendix 3: Laminator 3 valve output, inlet, outlet, pre-set temperatures Data Set 1
Recorded on 18-10-2018
Time
Sno
Lam3: Cooling
Water
Controller
Output
Lam3: Inlet
Cooling Water
Temperature
Lam3: Outlet
Cooling Water
Temperature
Lam3: Cooling
Water
Temperature Set
point
2018-10-18 09:21:00.000 1
0 12.81 16.05 17
2018-10-18 09:31:00.000 2
0 14.37 18.29 17
2018-10-18 09:41:00.000 3
-49.9 17.17 19.97 17
2018-10-18 09:51:00.000 4
0 16.05 21.09 17
2018-10-18 10:01:00.000 5
-21.46 16.61 19.97 17
2018-10-18 10:11:00.000 6
-100 18.29 21.65 17
2018-10-18 10:21:00.000 7
-1.54 16.61 21.09 17
2018-10-18 10:31:00.000 8
0 15.49 18.29 17
2018-10-18 10:41:00.000 9
0 16.61 19.41 17
2018-10-18 10:51:00.000 10
-21.49 16.61 19.41 17
2018-10-18 11:01:00.000 11
-100 18.29 21.09 17
2018-10-18 11:11:00.000 12
-100 18.85 21.65 17
2018-10-18 11:21:00.000 13
0 14.37 18.29 17
2018-10-18 11:31:00.000 14
-38.9 16.61 19.97 17
2018-10-18 11:41:00.000 15
-1.11 16.61 21.09 17
2018-10-18 11:51:00.000 16
-52.73 17.17 19.97 17
2018-10-18 12:01:00.000 17
-100 18.29 21.09 17
2018-10-18 12:11:00.000 18
0 15.49 20.53 17
2018-10-18 12:21:00.000 19
-28.39 16.61 19.97 17
2018-10-18 12:31:00.000 20
-2.21 16.61 21.09 17
2018-10-18 12:41:00.000 21
0 15.49 18.29 17
2018-10-18 12:51:00.000 22
-17.57 16.61 19.97 17
2018-10-18 13:01:00.000 23
0 15.94 18.85 17
2018-10-18 13:11:00.000 24
-57.02 17.62 20.53 17
2018-10-18 13:21:00.000 25
0 13.14 16.05 17
2018-10-18 13:31:00.000 26
0 14.26 16.05 17
2018-10-18 13:41:00.000 27
0 14.26 16.61 17
2018-10-18 13:51:00.000 28
0 14.26 16.61 17
2018-10-18 14:01:00.000 29
0 14.26 16.61 17
2018-10-18 14:11:00.000 30
0 14.26 16.61 17
2018-10-18 14:21:00.000 31
0 13.14 16.05 17
2018-10-18 14:31:00.000 32
-0.75 15.94 18.85 17
2018-10-18 14:41:00.000 33
-80.26 17.62 20.53 17
2018-10-18 14:51:00.000 34
-17.96 16.5 21.09 17
2018-10-18 15:01:00.000 35
-40.58 17.06 19.97 17
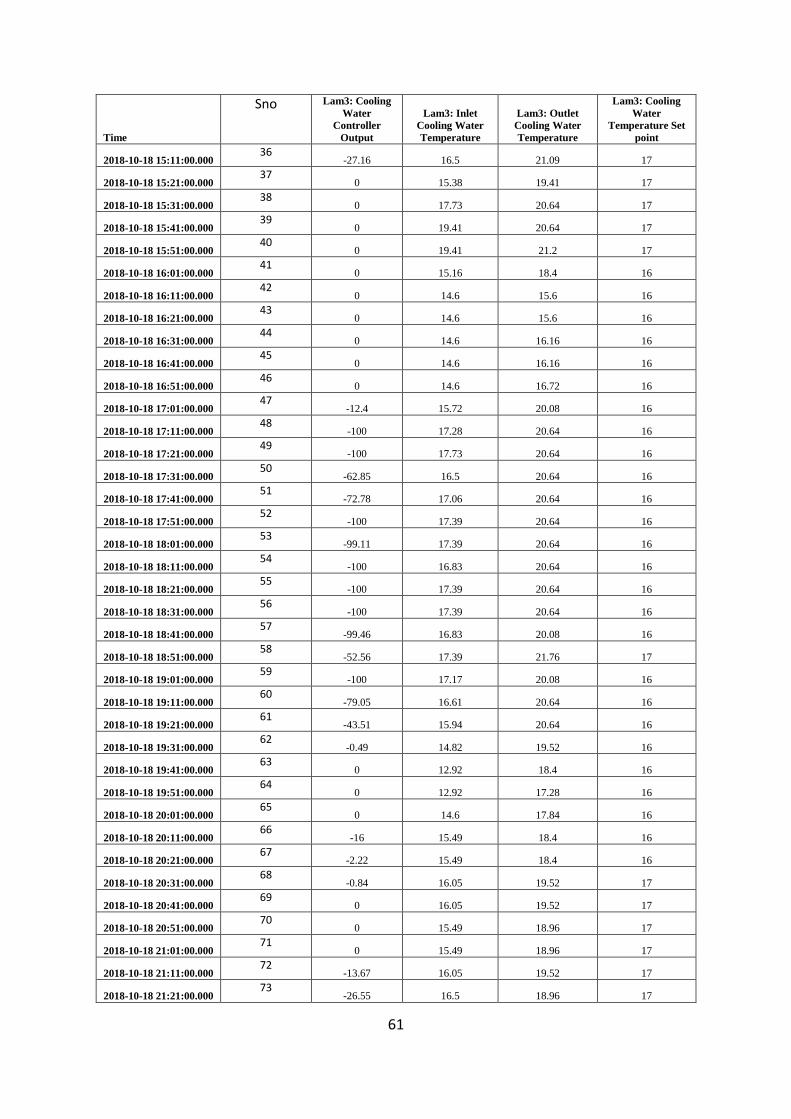
61
Time
Sno
Lam3: Cooling
Water
Controller
Output
Lam3: Inlet
Cooling Water
Temperature
Lam3: Outlet
Cooling Water
Temperature
Lam3: Cooling
Water
Temperature Set
point
2018-10-18 15:11:00.000 36
-27.16 16.5 21.09 17
2018-10-18 15:21:00.000 37
0 15.38 19.41 17
2018-10-18 15:31:00.000 38
0 17.73 20.64 17
2018-10-18 15:41:00.000 39
0 19.41 20.64 17
2018-10-18 15:51:00.000 40
0 19.41 21.2 17
2018-10-18 16:01:00.000 41
0 15.16 18.4 16
2018-10-18 16:11:00.000 42
0 14.6 15.6 16
2018-10-18 16:21:00.000 43
0 14.6 15.6 16
2018-10-18 16:31:00.000 44
0 14.6 16.16 16
2018-10-18 16:41:00.000 45
0 14.6 16.16 16
2018-10-18 16:51:00.000 46
0 14.6 16.72 16
2018-10-18 17:01:00.000 47
-12.4 15.72 20.08 16
2018-10-18 17:11:00.000 48
-100 17.28 20.64 16
2018-10-18 17:21:00.000 49
-100 17.73 20.64 16
2018-10-18 17:31:00.000 50
-62.85 16.5 20.64 16
2018-10-18 17:41:00.000 51
-72.78 17.06 20.64 16
2018-10-18 17:51:00.000 52
-100 17.39 20.64 16
2018-10-18 18:01:00.000 53
-99.11 17.39 20.64 16
2018-10-18 18:11:00.000 54
-100 16.83 20.64 16
2018-10-18 18:21:00.000 55
-100 17.39 20.64 16
2018-10-18 18:31:00.000 56
-100 17.39 20.64 16
2018-10-18 18:41:00.000 57
-99.46 16.83 20.08 16
2018-10-18 18:51:00.000 58
-52.56 17.39 21.76 17
2018-10-18 19:01:00.000 59
-100 17.17 20.08 16
2018-10-18 19:11:00.000 60
-79.05 16.61 20.64 16
2018-10-18 19:21:00.000 61
-43.51 15.94 20.64 16
2018-10-18 19:31:00.000 62
-0.49 14.82 19.52 16
2018-10-18 19:41:00.000 63
0 12.92 18.4 16
2018-10-18 19:51:00.000 64
0 12.92 17.28 16
2018-10-18 20:01:00.000 65
0 14.6 17.84 16
2018-10-18 20:11:00.000 66
-16 15.49 18.4 16
2018-10-18 20:21:00.000 67
-2.22 15.49 18.4 16
2018-10-18 20:31:00.000 68
-0.84 16.05 19.52 17
2018-10-18 20:41:00.000 69
0 16.05 19.52 17
2018-10-18 20:51:00.000 70
0 15.49 18.96 17
2018-10-18 21:01:00.000 71
0 15.49 18.96 17
2018-10-18 21:11:00.000 72
-13.67 16.05 19.52 17
2018-10-18 21:21:00.000 73
-26.55 16.5 18.96 17
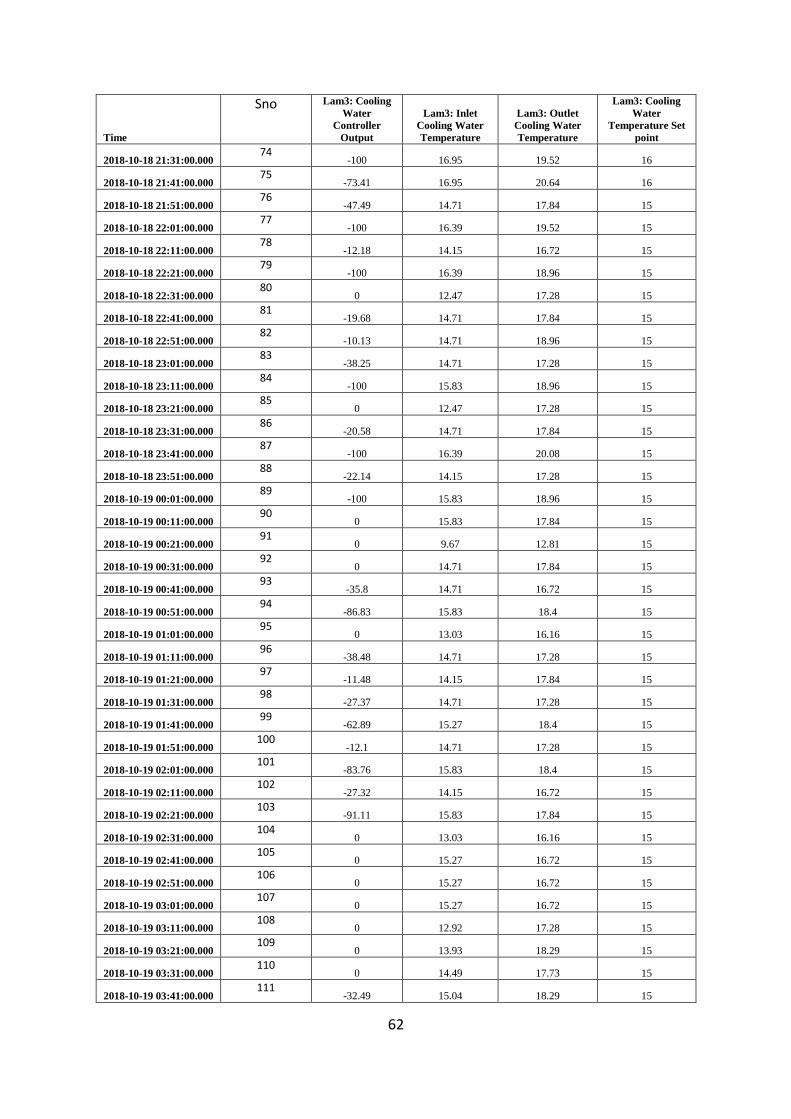
62
Time
Sno
Lam3: Cooling
Water
Controller
Output
Lam3: Inlet
Cooling Water
Temperature
Lam3: Outlet
Cooling Water
Temperature
Lam3: Cooling
Water
Temperature Set
point
2018-10-18 21:31:00.000 74
-100 16.95 19.52 16
2018-10-18 21:41:00.000 75
-73.41 16.95 20.64 16
2018-10-18 21:51:00.000 76
-47.49 14.71 17.84 15
2018-10-18 22:01:00.000 77
-100 16.39 19.52 15
2018-10-18 22:11:00.000 78
-12.18 14.15 16.72 15
2018-10-18 22:21:00.000 79
-100 16.39 18.96 15
2018-10-18 22:31:00.000 80
0 12.47 17.28 15
2018-10-18 22:41:00.000 81
-19.68 14.71 17.84 15
2018-10-18 22:51:00.000 82
-10.13 14.71 18.96 15
2018-10-18 23:01:00.000 83
-38.25 14.71 17.28 15
2018-10-18 23:11:00.000 84
-100 15.83 18.96 15
2018-10-18 23:21:00.000 85
0 12.47 17.28 15
2018-10-18 23:31:00.000 86
-20.58 14.71 17.84 15
2018-10-18 23:41:00.000 87
-100 16.39 20.08 15
2018-10-18 23:51:00.000 88
-22.14 14.15 17.28 15
2018-10-19 00:01:00.000 89
-100 15.83 18.96 15
2018-10-19 00:11:00.000 90
0 15.83 17.84 15
2018-10-19 00:21:00.000 91
0 9.67 12.81 15
2018-10-19 00:31:00.000 92
0 14.71 17.84 15
2018-10-19 00:41:00.000 93
-35.8 14.71 16.72 15
2018-10-19 00:51:00.000 94
-86.83 15.83 18.4 15
2018-10-19 01:01:00.000 95
0 13.03 16.16 15
2018-10-19 01:11:00.000 96
-38.48 14.71 17.28 15
2018-10-19 01:21:00.000 97
-11.48 14.15 17.84 15
2018-10-19 01:31:00.000 98
-27.37 14.71 17.28 15
2018-10-19 01:41:00.000 99
-62.89 15.27 18.4 15
2018-10-19 01:51:00.000 100
-12.1 14.71 17.28 15
2018-10-19 02:01:00.000 101
-83.76 15.83 18.4 15
2018-10-19 02:11:00.000 102
-27.32 14.15 16.72 15
2018-10-19 02:21:00.000 103
-91.11 15.83 17.84 15
2018-10-19 02:31:00.000 104
0 13.03 16.16 15
2018-10-19 02:41:00.000 105
0 15.27 16.72 15
2018-10-19 02:51:00.000 106
0 15.27 16.72 15
2018-10-19 03:01:00.000 107
0 15.27 16.72 15
2018-10-19 03:11:00.000 108
0 12.92 17.28 15
2018-10-19 03:21:00.000 109
0 13.93 18.29 15
2018-10-19 03:31:00.000 110
0 14.49 17.73 15
2018-10-19 03:41:00.000 111
-32.49 15.04 18.29 15
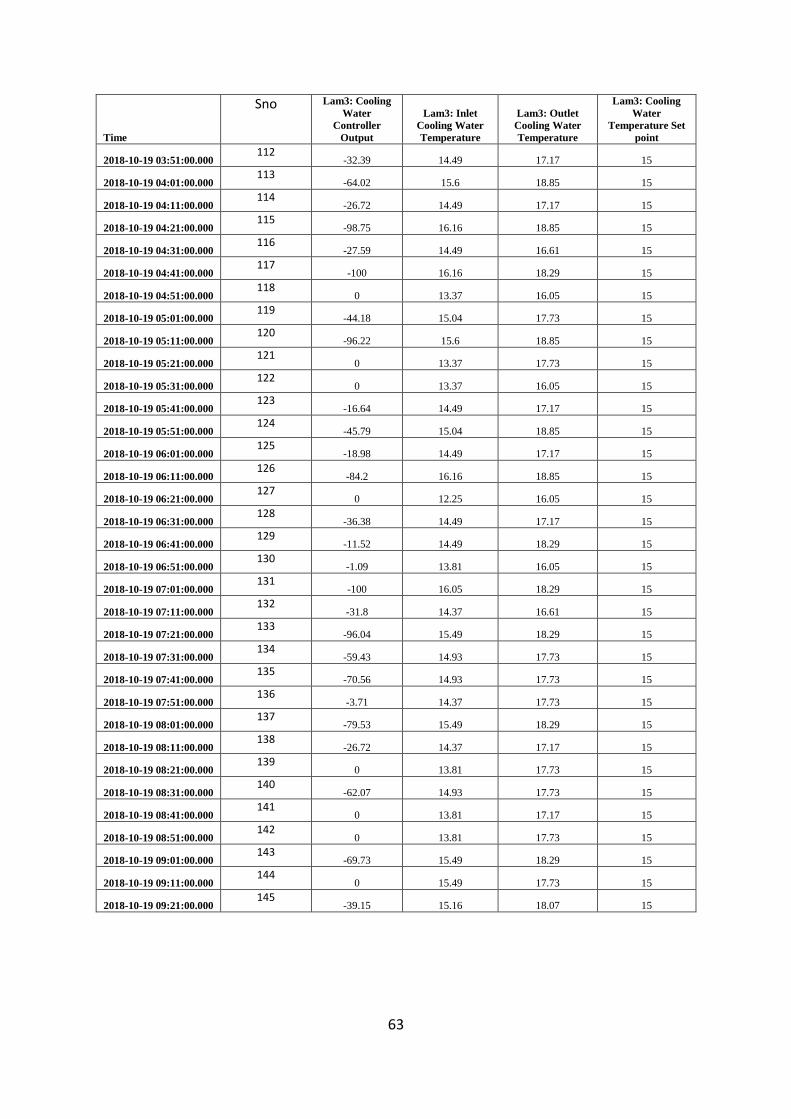
63
Time
Sno
Lam3: Cooling
Water
Controller
Output
Lam3: Inlet
Cooling Water
Temperature
Lam3: Outlet
Cooling Water
Temperature
Lam3: Cooling
Water
Temperature Set
point
2018-10-19 03:51:00.000 112
-32.39 14.49 17.17 15
2018-10-19 04:01:00.000 113
-64.02 15.6 18.85 15
2018-10-19 04:11:00.000 114
-26.72 14.49 17.17 15
2018-10-19 04:21:00.000 115
-98.75 16.16 18.85 15
2018-10-19 04:31:00.000 116
-27.59 14.49 16.61 15
2018-10-19 04:41:00.000 117
-100 16.16 18.29 15
2018-10-19 04:51:00.000 118
0 13.37 16.05 15
2018-10-19 05:01:00.000 119
-44.18 15.04 17.73 15
2018-10-19 05:11:00.000 120
-96.22 15.6 18.85 15
2018-10-19 05:21:00.000 121
0 13.37 17.73 15
2018-10-19 05:31:00.000 122
0 13.37 16.05 15
2018-10-19 05:41:00.000 123
-16.64 14.49 17.17 15
2018-10-19 05:51:00.000 124
-45.79 15.04 18.85 15
2018-10-19 06:01:00.000 125
-18.98 14.49 17.17 15
2018-10-19 06:11:00.000 126
-84.2 16.16 18.85 15
2018-10-19 06:21:00.000 127
0 12.25 16.05 15
2018-10-19 06:31:00.000 128
-36.38 14.49 17.17 15
2018-10-19 06:41:00.000 129
-11.52 14.49 18.29 15
2018-10-19 06:51:00.000 130
-1.09 13.81 16.05 15
2018-10-19 07:01:00.000 131
-100 16.05 18.29 15
2018-10-19 07:11:00.000 132
-31.8 14.37 16.61 15
2018-10-19 07:21:00.000 133
-96.04 15.49 18.29 15
2018-10-19 07:31:00.000 134
-59.43 14.93 17.73 15
2018-10-19 07:41:00.000 135
-70.56 14.93 17.73 15
2018-10-19 07:51:00.000 136
-3.71 14.37 17.73 15
2018-10-19 08:01:00.000 137
-79.53 15.49 18.29 15
2018-10-19 08:11:00.000 138
-26.72 14.37 17.17 15
2018-10-19 08:21:00.000 139
0 13.81 17.73 15
2018-10-19 08:31:00.000 140
-62.07 14.93 17.73 15
2018-10-19 08:41:00.000 141
0 13.81 17.17 15
2018-10-19 08:51:00.000 142
0 13.81 17.73 15
2018-10-19 09:01:00.000 143
-69.73 15.49 18.29 15
2018-10-19 09:11:00.000 144
0 15.49 17.73 15
2018-10-19 09:21:00.000 145
-39.15 15.16 18.07 15
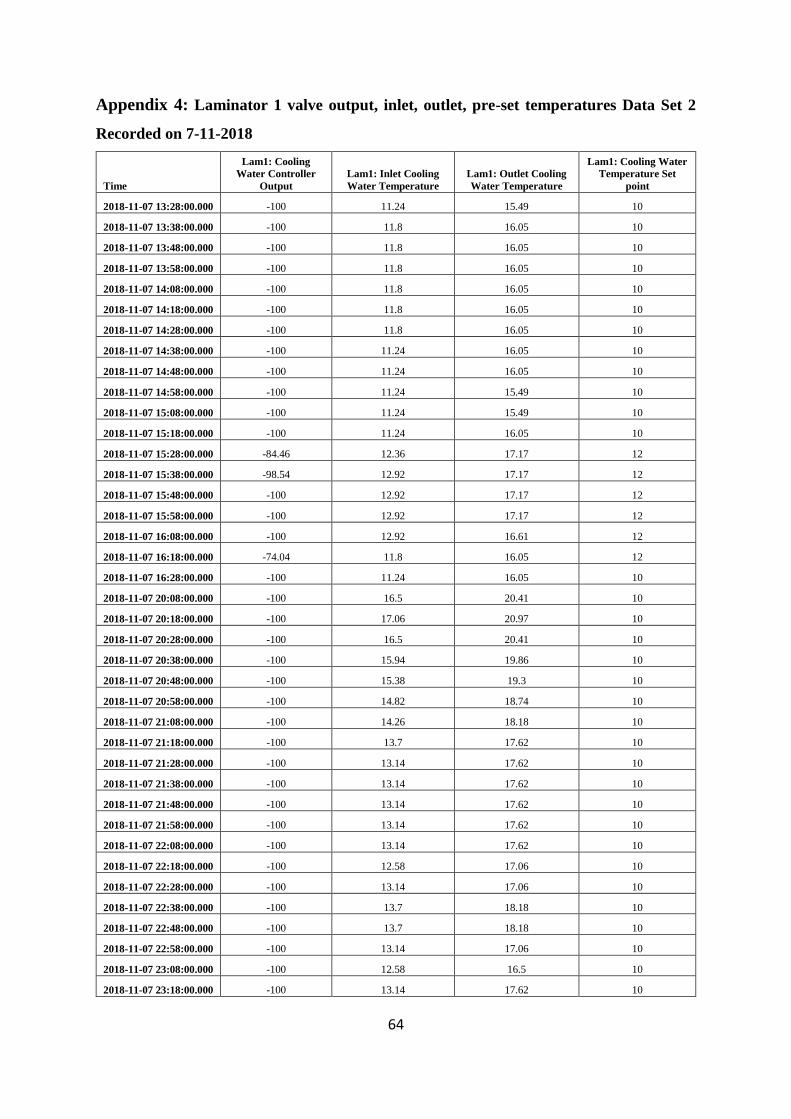
64
Appendix 4: Laminator 1 valve output, inlet, outlet, pre-set temperatures Data Set 2
Recorded on 7-11-2018
Time
Lam1: Cooling
Water Controller
Output
Lam1: Inlet Cooling
Water Temperature
Lam1: Outlet Cooling
Water Temperature
Lam1: Cooling Water
Temperature Set
point
2018-11-07 13:28:00.000 -100 11.24 15.49 10
2018-11-07 13:38:00.000 -100 11.8 16.05 10
2018-11-07 13:48:00.000 -100 11.8 16.05 10
2018-11-07 13:58:00.000 -100 11.8 16.05 10
2018-11-07 14:08:00.000 -100 11.8 16.05 10
2018-11-07 14:18:00.000 -100 11.8 16.05 10
2018-11-07 14:28:00.000 -100 11.8 16.05 10
2018-11-07 14:38:00.000 -100 11.24 16.05 10
2018-11-07 14:48:00.000 -100 11.24 16.05 10
2018-11-07 14:58:00.000 -100 11.24 15.49 10
2018-11-07 15:08:00.000 -100 11.24 15.49 10
2018-11-07 15:18:00.000 -100 11.24 16.05 10
2018-11-07 15:28:00.000 -84.46 12.36 17.17 12
2018-11-07 15:38:00.000 -98.54 12.92 17.17 12
2018-11-07 15:48:00.000 -100 12.92 17.17 12
2018-11-07 15:58:00.000 -100 12.92 17.17 12
2018-11-07 16:08:00.000 -100 12.92 16.61 12
2018-11-07 16:18:00.000 -74.04 11.8 16.05 12
2018-11-07 16:28:00.000 -100 11.24 16.05 10
2018-11-07 20:08:00.000 -100 16.5 20.41 10
2018-11-07 20:18:00.000 -100 17.06 20.97 10
2018-11-07 20:28:00.000 -100 16.5 20.41 10
2018-11-07 20:38:00.000 -100 15.94 19.86 10
2018-11-07 20:48:00.000 -100 15.38 19.3 10
2018-11-07 20:58:00.000 -100 14.82 18.74 10
2018-11-07 21:08:00.000 -100 14.26 18.18 10
2018-11-07 21:18:00.000 -100 13.7 17.62 10
2018-11-07 21:28:00.000 -100 13.14 17.62 10
2018-11-07 21:38:00.000 -100 13.14 17.62 10
2018-11-07 21:48:00.000 -100 13.14 17.62 10
2018-11-07 21:58:00.000 -100 13.14 17.62 10
2018-11-07 22:08:00.000 -100 13.14 17.62 10
2018-11-07 22:18:00.000 -100 12.58 17.06 10
2018-11-07 22:28:00.000 -100 13.14 17.06 10
2018-11-07 22:38:00.000 -100 13.7 18.18 10
2018-11-07 22:48:00.000 -100 13.7 18.18 10
2018-11-07 22:58:00.000 -100 13.14 17.06 10
2018-11-07 23:08:00.000 -100 12.58 16.5 10
2018-11-07 23:18:00.000 -100 13.14 17.62 10
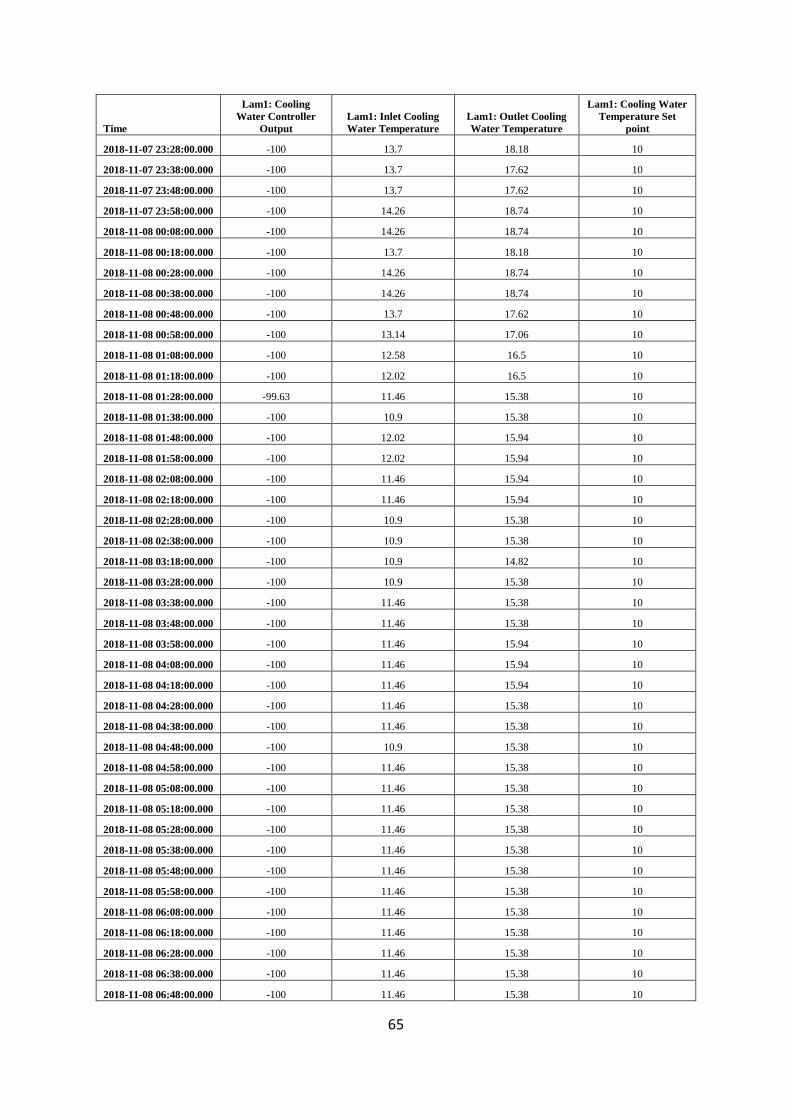
65
Time
Lam1: Cooling
Water Controller
Output
Lam1: Inlet Cooling
Water Temperature
Lam1: Outlet Cooling
Water Temperature
Lam1: Cooling Water
Temperature Set
point
2018-11-07 23:28:00.000 -100 13.7 18.18 10
2018-11-07 23:38:00.000 -100 13.7 17.62 10
2018-11-07 23:48:00.000 -100 13.7 17.62 10
2018-11-07 23:58:00.000 -100 14.26 18.74 10
2018-11-08 00:08:00.000 -100 14.26 18.74 10
2018-11-08 00:18:00.000 -100 13.7 18.18 10
2018-11-08 00:28:00.000 -100 14.26 18.74 10
2018-11-08 00:38:00.000 -100 14.26 18.74 10
2018-11-08 00:48:00.000 -100 13.7 17.62 10
2018-11-08 00:58:00.000 -100 13.14 17.06 10
2018-11-08 01:08:00.000 -100 12.58 16.5 10
2018-11-08 01:18:00.000 -100 12.02 16.5 10
2018-11-08 01:28:00.000 -99.63 11.46 15.38 10
2018-11-08 01:38:00.000 -100 10.9 15.38 10
2018-11-08 01:48:00.000 -100 12.02 15.94 10
2018-11-08 01:58:00.000 -100 12.02 15.94 10
2018-11-08 02:08:00.000 -100 11.46 15.94 10
2018-11-08 02:18:00.000 -100 11.46 15.94 10
2018-11-08 02:28:00.000 -100 10.9 15.38 10
2018-11-08 02:38:00.000 -100 10.9 15.38 10
2018-11-08 03:18:00.000 -100 10.9 14.82 10
2018-11-08 03:28:00.000 -100 10.9 15.38 10
2018-11-08 03:38:00.000 -100 11.46 15.38 10
2018-11-08 03:48:00.000 -100 11.46 15.38 10
2018-11-08 03:58:00.000 -100 11.46 15.94 10
2018-11-08 04:08:00.000 -100 11.46 15.94 10
2018-11-08 04:18:00.000 -100 11.46 15.94 10
2018-11-08 04:28:00.000 -100 11.46 15.38 10
2018-11-08 04:38:00.000 -100 11.46 15.38 10
2018-11-08 04:48:00.000 -100 10.9 15.38 10
2018-11-08 04:58:00.000 -100 11.46 15.38 10
2018-11-08 05:08:00.000 -100 11.46 15.38 10
2018-11-08 05:18:00.000 -100 11.46 15.38 10
2018-11-08 05:28:00.000 -100 11.46 15.38 10
2018-11-08 05:38:00.000 -100 11.46 15.38 10
2018-11-08 05:48:00.000 -100 11.46 15.38 10
2018-11-08 05:58:00.000 -100 11.46 15.38 10
2018-11-08 06:08:00.000 -100 11.46 15.38 10
2018-11-08 06:18:00.000 -100 11.46 15.38 10
2018-11-08 06:28:00.000 -100 11.46 15.38 10
2018-11-08 06:38:00.000 -100 11.46 15.38 10
2018-11-08 06:48:00.000 -100 11.46 15.38 10
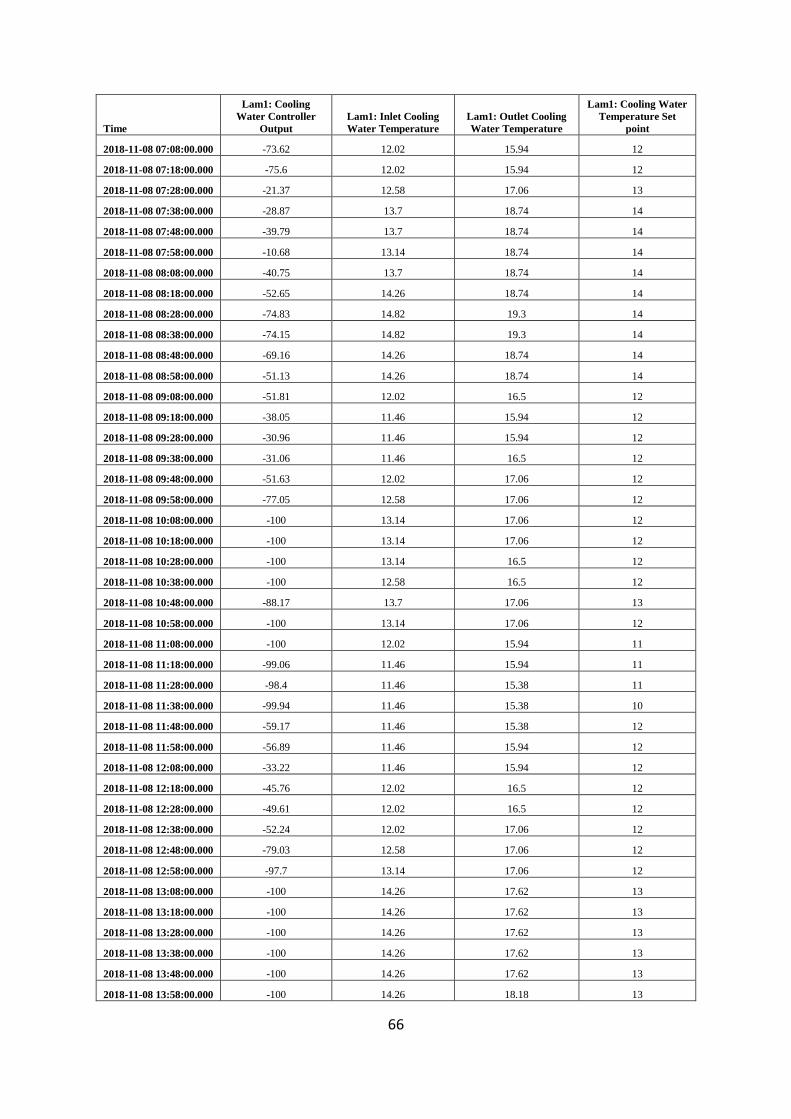
66
Time
Lam1: Cooling
Water Controller
Output
Lam1: Inlet Cooling
Water Temperature
Lam1: Outlet Cooling
Water Temperature
Lam1: Cooling Water
Temperature Set
point
2018-11-08 07:08:00.000 -73.62 12.02 15.94 12
2018-11-08 07:18:00.000 -75.6 12.02 15.94 12
2018-11-08 07:28:00.000 -21.37 12.58 17.06 13
2018-11-08 07:38:00.000 -28.87 13.7 18.74 14
2018-11-08 07:48:00.000 -39.79 13.7 18.74 14
2018-11-08 07:58:00.000 -10.68 13.14 18.74 14
2018-11-08 08:08:00.000 -40.75 13.7 18.74 14
2018-11-08 08:18:00.000 -52.65 14.26 18.74 14
2018-11-08 08:28:00.000 -74.83 14.82 19.3 14
2018-11-08 08:38:00.000 -74.15 14.82 19.3 14
2018-11-08 08:48:00.000 -69.16 14.26 18.74 14
2018-11-08 08:58:00.000 -51.13 14.26 18.74 14
2018-11-08 09:08:00.000 -51.81 12.02 16.5 12
2018-11-08 09:18:00.000 -38.05 11.46 15.94 12
2018-11-08 09:28:00.000 -30.96 11.46 15.94 12
2018-11-08 09:38:00.000 -31.06 11.46 16.5 12
2018-11-08 09:48:00.000 -51.63 12.02 17.06 12
2018-11-08 09:58:00.000 -77.05 12.58 17.06 12
2018-11-08 10:08:00.000 -100 13.14 17.06 12
2018-11-08 10:18:00.000 -100 13.14 17.06 12
2018-11-08 10:28:00.000 -100 13.14 16.5 12
2018-11-08 10:38:00.000 -100 12.58 16.5 12
2018-11-08 10:48:00.000 -88.17 13.7 17.06 13
2018-11-08 10:58:00.000 -100 13.14 17.06 12
2018-11-08 11:08:00.000 -100 12.02 15.94 11
2018-11-08 11:18:00.000 -99.06 11.46 15.94 11
2018-11-08 11:28:00.000 -98.4 11.46 15.38 11
2018-11-08 11:38:00.000 -99.94 11.46 15.38 10
2018-11-08 11:48:00.000 -59.17 11.46 15.38 12
2018-11-08 11:58:00.000 -56.89 11.46 15.94 12
2018-11-08 12:08:00.000 -33.22 11.46 15.94 12
2018-11-08 12:18:00.000 -45.76 12.02 16.5 12
2018-11-08 12:28:00.000 -49.61 12.02 16.5 12
2018-11-08 12:38:00.000 -52.24 12.02 17.06 12
2018-11-08 12:48:00.000 -79.03 12.58 17.06 12
2018-11-08 12:58:00.000 -97.7 13.14 17.06 12
2018-11-08 13:08:00.000 -100 14.26 17.62 13
2018-11-08 13:18:00.000 -100 14.26 17.62 13
2018-11-08 13:28:00.000 -100 14.26 17.62 13
2018-11-08 13:38:00.000 -100 14.26 17.62 13
2018-11-08 13:48:00.000 -100 14.26 17.62 13
2018-11-08 13:58:00.000 -100 14.26 18.18 13
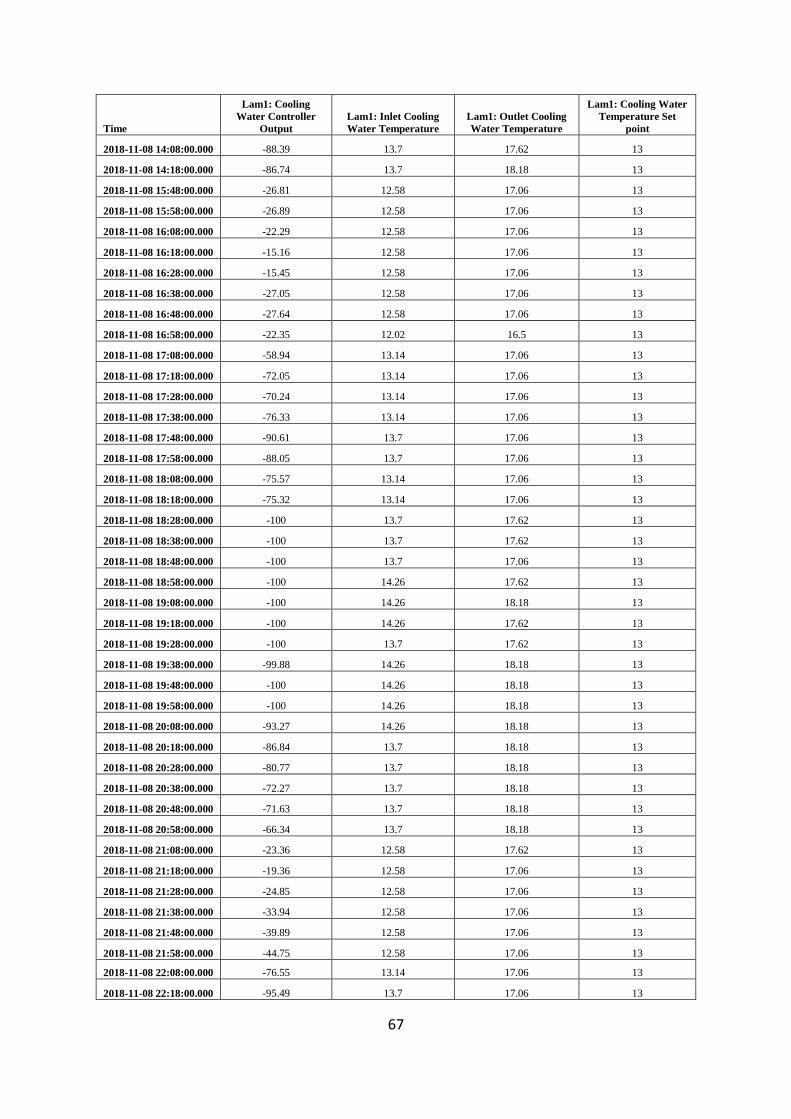
67
Time
Lam1: Cooling
Water Controller
Output
Lam1: Inlet Cooling
Water Temperature
Lam1: Outlet Cooling
Water Temperature
Lam1: Cooling Water
Temperature Set
point
2018-11-08 14:08:00.000 -88.39 13.7 17.62 13
2018-11-08 14:18:00.000 -86.74 13.7 18.18 13
2018-11-08 15:48:00.000 -26.81 12.58 17.06 13
2018-11-08 15:58:00.000 -26.89 12.58 17.06 13
2018-11-08 16:08:00.000 -22.29 12.58 17.06 13
2018-11-08 16:18:00.000 -15.16 12.58 17.06 13
2018-11-08 16:28:00.000 -15.45 12.58 17.06 13
2018-11-08 16:38:00.000 -27.05 12.58 17.06 13
2018-11-08 16:48:00.000 -27.64 12.58 17.06 13
2018-11-08 16:58:00.000 -22.35 12.02 16.5 13
2018-11-08 17:08:00.000 -58.94 13.14 17.06 13
2018-11-08 17:18:00.000 -72.05 13.14 17.06 13
2018-11-08 17:28:00.000 -70.24 13.14 17.06 13
2018-11-08 17:38:00.000 -76.33 13.14 17.06 13
2018-11-08 17:48:00.000 -90.61 13.7 17.06 13
2018-11-08 17:58:00.000 -88.05 13.7 17.06 13
2018-11-08 18:08:00.000 -75.57 13.14 17.06 13
2018-11-08 18:18:00.000 -75.32 13.14 17.06 13
2018-11-08 18:28:00.000 -100 13.7 17.62 13
2018-11-08 18:38:00.000 -100 13.7 17.62 13
2018-11-08 18:48:00.000 -100 13.7 17.06 13
2018-11-08 18:58:00.000 -100 14.26 17.62 13
2018-11-08 19:08:00.000 -100 14.26 18.18 13
2018-11-08 19:18:00.000 -100 14.26 17.62 13
2018-11-08 19:28:00.000 -100 13.7 17.62 13
2018-11-08 19:38:00.000 -99.88 14.26 18.18 13
2018-11-08 19:48:00.000 -100 14.26 18.18 13
2018-11-08 19:58:00.000 -100 14.26 18.18 13
2018-11-08 20:08:00.000 -93.27 14.26 18.18 13
2018-11-08 20:18:00.000 -86.84 13.7 18.18 13
2018-11-08 20:28:00.000 -80.77 13.7 18.18 13
2018-11-08 20:38:00.000 -72.27 13.7 18.18 13
2018-11-08 20:48:00.000 -71.63 13.7 18.18 13
2018-11-08 20:58:00.000 -66.34 13.7 18.18 13
2018-11-08 21:08:00.000 -23.36 12.58 17.62 13
2018-11-08 21:18:00.000 -19.36 12.58 17.06 13
2018-11-08 21:28:00.000 -24.85 12.58 17.06 13
2018-11-08 21:38:00.000 -33.94 12.58 17.06 13
2018-11-08 21:48:00.000 -39.89 12.58 17.06 13
2018-11-08 21:58:00.000 -44.75 12.58 17.06 13
2018-11-08 22:08:00.000 -76.55 13.14 17.06 13
2018-11-08 22:18:00.000 -95.49 13.7 17.06 13
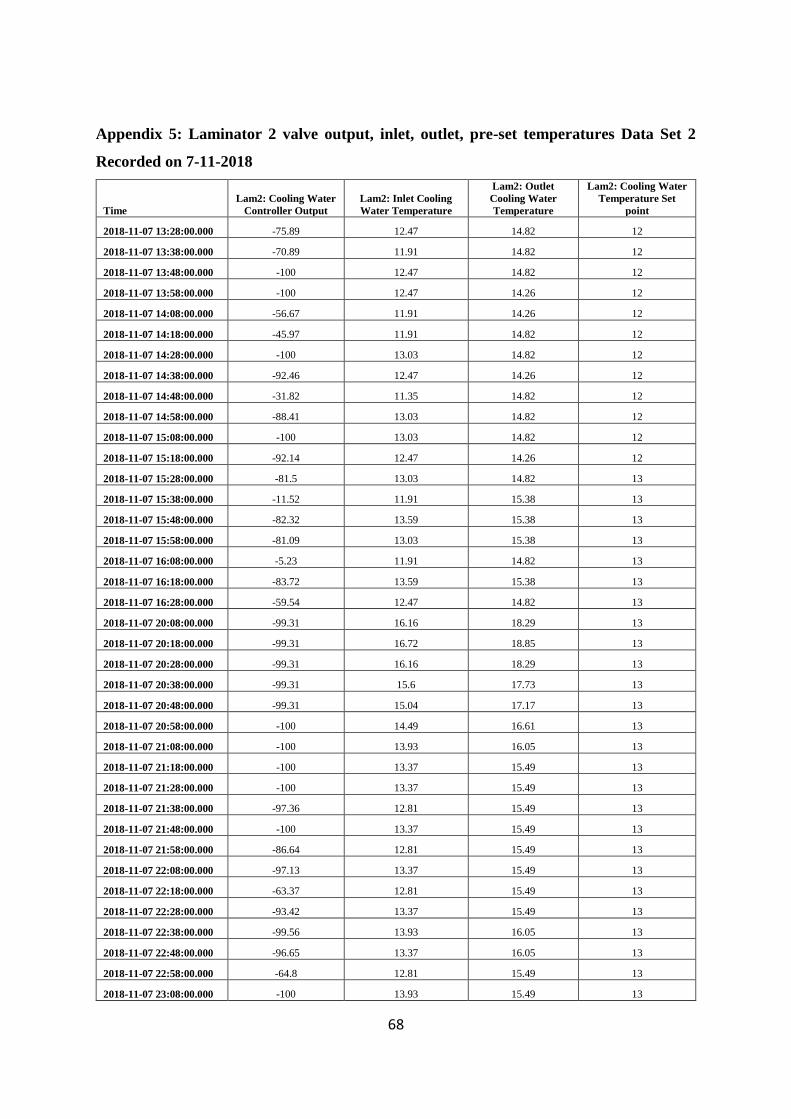
68
Appendix 5: Laminator 2 valve output, inlet, outlet, pre-set temperatures Data Set 2
Recorded on 7-11-2018
Time
Lam2: Cooling Water
Controller Output
Lam2: Inlet Cooling
Water Temperature
Lam2: Outlet
Cooling Water
Temperature
Lam2: Cooling Water
Temperature Set
point
2018-11-07 13:28:00.000 -75.89 12.47 14.82 12
2018-11-07 13:38:00.000 -70.89 11.91 14.82 12
2018-11-07 13:48:00.000 -100 12.47 14.82 12
2018-11-07 13:58:00.000 -100 12.47 14.26 12
2018-11-07 14:08:00.000 -56.67 11.91 14.26 12
2018-11-07 14:18:00.000 -45.97 11.91 14.82 12
2018-11-07 14:28:00.000 -100 13.03 14.82 12
2018-11-07 14:38:00.000 -92.46 12.47 14.26 12
2018-11-07 14:48:00.000 -31.82 11.35 14.82 12
2018-11-07 14:58:00.000 -88.41 13.03 14.82 12
2018-11-07 15:08:00.000 -100 13.03 14.82 12
2018-11-07 15:18:00.000 -92.14 12.47 14.26 12
2018-11-07 15:28:00.000 -81.5 13.03 14.82 13
2018-11-07 15:38:00.000 -11.52 11.91 15.38 13
2018-11-07 15:48:00.000 -82.32 13.59 15.38 13
2018-11-07 15:58:00.000 -81.09 13.03 15.38 13
2018-11-07 16:08:00.000 -5.23 11.91 14.82 13
2018-11-07 16:18:00.000 -83.72 13.59 15.38 13
2018-11-07 16:28:00.000 -59.54 12.47 14.82 13
2018-11-07 20:08:00.000 -99.31 16.16 18.29 13
2018-11-07 20:18:00.000 -99.31 16.72 18.85 13
2018-11-07 20:28:00.000 -99.31 16.16 18.29 13
2018-11-07 20:38:00.000 -99.31 15.6 17.73 13
2018-11-07 20:48:00.000 -99.31 15.04 17.17 13
2018-11-07 20:58:00.000 -100 14.49 16.61 13
2018-11-07 21:08:00.000 -100 13.93 16.05 13
2018-11-07 21:18:00.000 -100 13.37 15.49 13
2018-11-07 21:28:00.000 -100 13.37 15.49 13
2018-11-07 21:38:00.000 -97.36 12.81 15.49 13
2018-11-07 21:48:00.000 -100 13.37 15.49 13
2018-11-07 21:58:00.000 -86.64 12.81 15.49 13
2018-11-07 22:08:00.000 -97.13 13.37 15.49 13
2018-11-07 22:18:00.000 -63.37 12.81 15.49 13
2018-11-07 22:28:00.000 -93.42 13.37 15.49 13
2018-11-07 22:38:00.000 -99.56 13.93 16.05 13
2018-11-07 22:48:00.000 -96.65 13.37 16.05 13
2018-11-07 22:58:00.000 -64.8 12.81 15.49 13
2018-11-07 23:08:00.000 -100 13.93 15.49 13
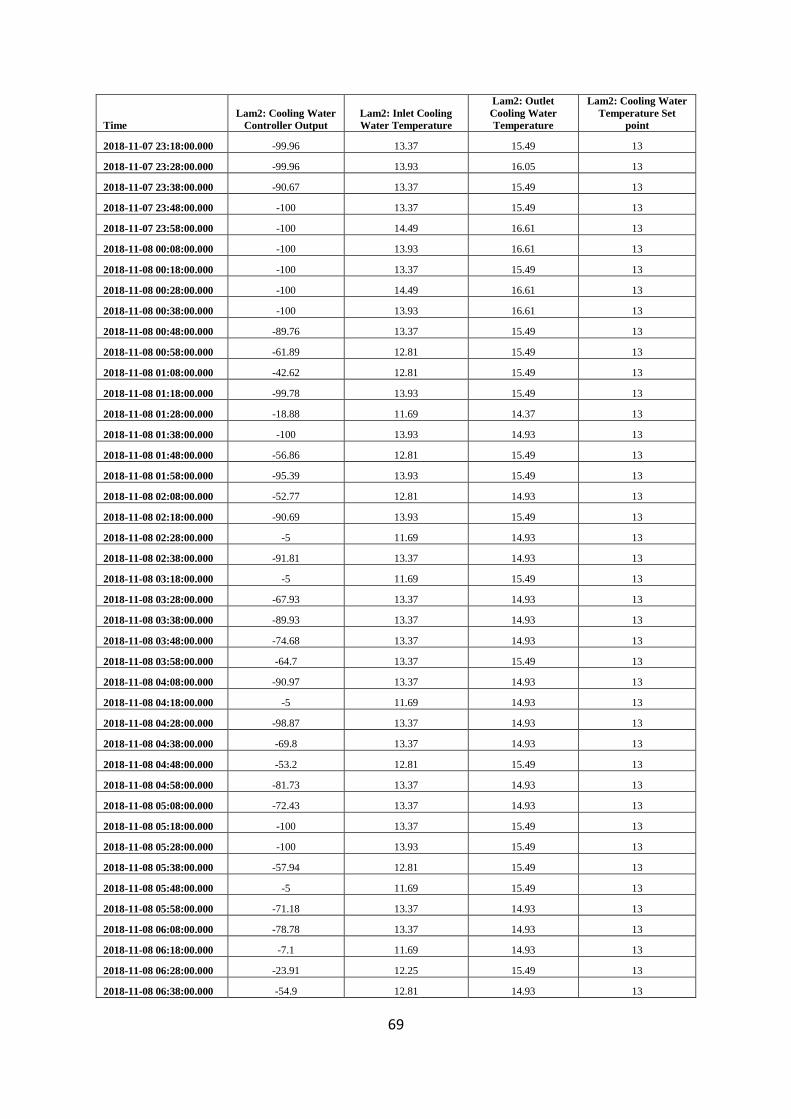
69
Time
Lam2: Cooling Water
Controller Output
Lam2: Inlet Cooling
Water Temperature
Lam2: Outlet
Cooling Water
Temperature
Lam2: Cooling Water
Temperature Set
point
2018-11-07 23:18:00.000 -99.96 13.37 15.49 13
2018-11-07 23:28:00.000 -99.96 13.93 16.05 13
2018-11-07 23:38:00.000 -90.67 13.37 15.49 13
2018-11-07 23:48:00.000 -100 13.37 15.49 13
2018-11-07 23:58:00.000 -100 14.49 16.61 13
2018-11-08 00:08:00.000 -100 13.93 16.61 13
2018-11-08 00:18:00.000 -100 13.37 15.49 13
2018-11-08 00:28:00.000 -100 14.49 16.61 13
2018-11-08 00:38:00.000 -100 13.93 16.61 13
2018-11-08 00:48:00.000 -89.76 13.37 15.49 13
2018-11-08 00:58:00.000 -61.89 12.81 15.49 13
2018-11-08 01:08:00.000 -42.62 12.81 15.49 13
2018-11-08 01:18:00.000 -99.78 13.93 15.49 13
2018-11-08 01:28:00.000 -18.88 11.69 14.37 13
2018-11-08 01:38:00.000 -100 13.93 14.93 13
2018-11-08 01:48:00.000 -56.86 12.81 15.49 13
2018-11-08 01:58:00.000 -95.39 13.93 15.49 13
2018-11-08 02:08:00.000 -52.77 12.81 14.93 13
2018-11-08 02:18:00.000 -90.69 13.93 15.49 13
2018-11-08 02:28:00.000 -5 11.69 14.93 13
2018-11-08 02:38:00.000 -91.81 13.37 14.93 13
2018-11-08 03:18:00.000 -5 11.69 15.49 13
2018-11-08 03:28:00.000 -67.93 13.37 14.93 13
2018-11-08 03:38:00.000 -89.93 13.37 14.93 13
2018-11-08 03:48:00.000 -74.68 13.37 14.93 13
2018-11-08 03:58:00.000 -64.7 13.37 15.49 13
2018-11-08 04:08:00.000 -90.97 13.37 14.93 13
2018-11-08 04:18:00.000 -5 11.69 14.93 13
2018-11-08 04:28:00.000 -98.87 13.37 14.93 13
2018-11-08 04:38:00.000 -69.8 13.37 14.93 13
2018-11-08 04:48:00.000 -53.2 12.81 15.49 13
2018-11-08 04:58:00.000 -81.73 13.37 14.93 13
2018-11-08 05:08:00.000 -72.43 13.37 14.93 13
2018-11-08 05:18:00.000 -100 13.37 15.49 13
2018-11-08 05:28:00.000 -100 13.93 15.49 13
2018-11-08 05:38:00.000 -57.94 12.81 15.49 13
2018-11-08 05:48:00.000 -5 11.69 15.49 13
2018-11-08 05:58:00.000 -71.18 13.37 14.93 13
2018-11-08 06:08:00.000 -78.78 13.37 14.93 13
2018-11-08 06:18:00.000 -7.1 11.69 14.93 13
2018-11-08 06:28:00.000 -23.91 12.25 15.49 13
2018-11-08 06:38:00.000 -54.9 12.81 14.93 13
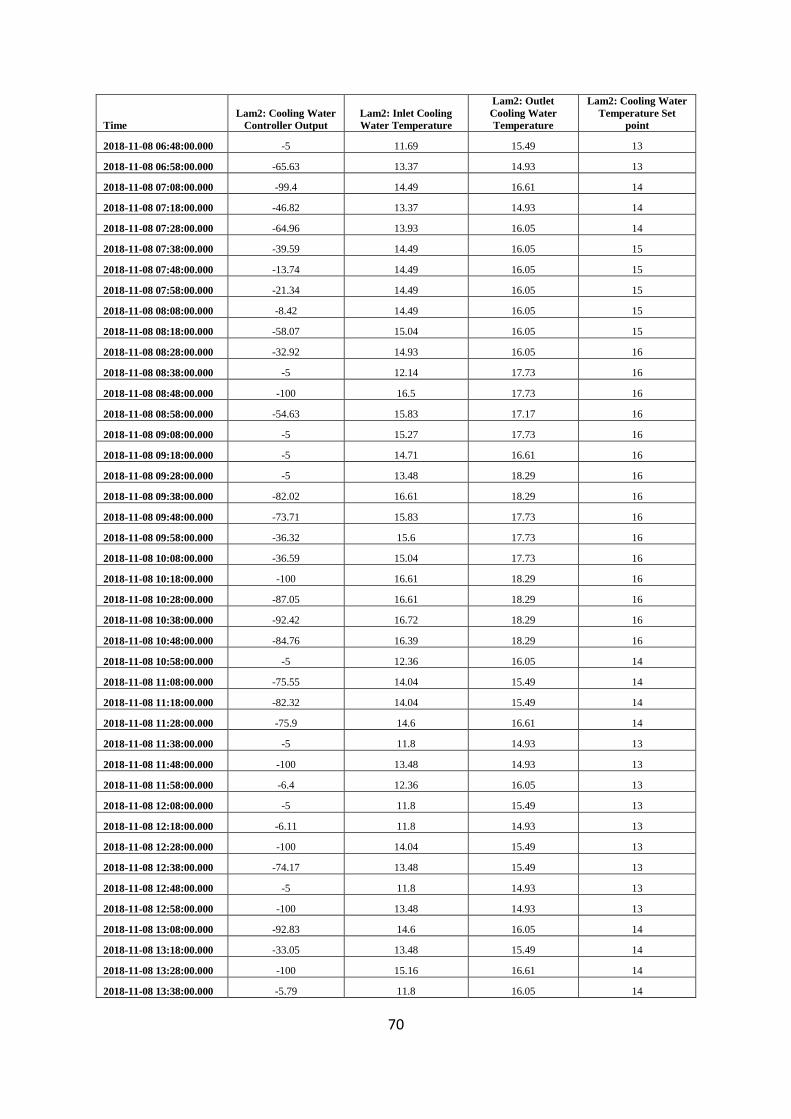
70
Time
Lam2: Cooling Water
Controller Output
Lam2: Inlet Cooling
Water Temperature
Lam2: Outlet
Cooling Water
Temperature
Lam2: Cooling Water
Temperature Set
point
2018-11-08 06:48:00.000 -5 11.69 15.49 13
2018-11-08 06:58:00.000 -65.63 13.37 14.93 13
2018-11-08 07:08:00.000 -99.4 14.49 16.61 14
2018-11-08 07:18:00.000 -46.82 13.37 14.93 14
2018-11-08 07:28:00.000 -64.96 13.93 16.05 14
2018-11-08 07:38:00.000 -39.59 14.49 16.05 15
2018-11-08 07:48:00.000 -13.74 14.49 16.05 15
2018-11-08 07:58:00.000 -21.34 14.49 16.05 15
2018-11-08 08:08:00.000 -8.42 14.49 16.05 15
2018-11-08 08:18:00.000 -58.07 15.04 16.05 15
2018-11-08 08:28:00.000 -32.92 14.93 16.05 16
2018-11-08 08:38:00.000 -5 12.14 17.73 16
2018-11-08 08:48:00.000 -100 16.5 17.73 16
2018-11-08 08:58:00.000 -54.63 15.83 17.17 16
2018-11-08 09:08:00.000 -5 15.27 17.73 16
2018-11-08 09:18:00.000 -5 14.71 16.61 16
2018-11-08 09:28:00.000 -5 13.48 18.29 16
2018-11-08 09:38:00.000 -82.02 16.61 18.29 16
2018-11-08 09:48:00.000 -73.71 15.83 17.73 16
2018-11-08 09:58:00.000 -36.32 15.6 17.73 16
2018-11-08 10:08:00.000 -36.59 15.04 17.73 16
2018-11-08 10:18:00.000 -100 16.61 18.29 16
2018-11-08 10:28:00.000 -87.05 16.61 18.29 16
2018-11-08 10:38:00.000 -92.42 16.72 18.29 16
2018-11-08 10:48:00.000 -84.76 16.39 18.29 16
2018-11-08 10:58:00.000 -5 12.36 16.05 14
2018-11-08 11:08:00.000 -75.55 14.04 15.49 14
2018-11-08 11:18:00.000 -82.32 14.04 15.49 14
2018-11-08 11:28:00.000 -75.9 14.6 16.61 14
2018-11-08 11:38:00.000 -5 11.8 14.93 13
2018-11-08 11:48:00.000 -100 13.48 14.93 13
2018-11-08 11:58:00.000 -6.4 12.36 16.05 13
2018-11-08 12:08:00.000 -5 11.8 15.49 13
2018-11-08 12:18:00.000 -6.11 11.8 14.93 13
2018-11-08 12:28:00.000 -100 14.04 15.49 13
2018-11-08 12:38:00.000 -74.17 13.48 15.49 13
2018-11-08 12:48:00.000 -5 11.8 14.93 13
2018-11-08 12:58:00.000 -100 13.48 14.93 13
2018-11-08 13:08:00.000 -92.83 14.6 16.05 14
2018-11-08 13:18:00.000 -33.05 13.48 15.49 14
2018-11-08 13:28:00.000 -100 15.16 16.61 14
2018-11-08 13:38:00.000 -5.79 11.8 16.05 14

71
Time
Lam2: Cooling Water
Controller Output
Lam2: Inlet Cooling
Water Temperature
Lam2: Outlet
Cooling Water
Temperature
Lam2: Cooling Water
Temperature Set
point
2018-11-08 13:48:00.000 -70.42 14.04 15.49 14
2018-11-08 13:58:00.000 -67.48 14.04 15.49 14
2018-11-08 14:08:00.000 -100 15.04 16.05 14
2018-11-08 14:18:00.000 -5 13.37 16.61 14
2018-11-08 15:48:00.000 -60.02 14.71 16.61 14
2018-11-08 15:58:00.000 -99.58 15.27 17.17 14
2018-11-08 16:08:00.000 -5 12.47 14.93 14
2018-11-08 16:18:00.000 -36.94 13.59 16.05 14
2018-11-08 16:28:00.000 -100 15.27 16.61 14
2018-11-08 16:38:00.000 -5 11.91 16.05 14
2018-11-08 16:48:00.000 -82.75 14.15 15.49 14
2018-11-08 16:58:00.000 -100 14.71 16.05 14
2018-11-08 17:08:00.000 -5 12.36 16.61 14
2018-11-08 17:18:00.000 -64.66 14.04 15.49 14
2018-11-08 17:28:00.000 -97.74 14.6 16.05 14
2018-11-08 17:38:00.000 -5 12.36 16.61 14
2018-11-08 17:48:00.000 -70.85 14.04 15.49 14
2018-11-08 17:58:00.000 -100 15.16 16.05 14
2018-11-08 18:08:00.000 -5 11.8 16.05 14
2018-11-08 18:18:00.000 -47.89 14.04 15.49 14
2018-11-08 18:28:00.000 -100 15.16 16.61 14
2018-11-08 18:38:00.000 -5 11.8 16.61 14
2018-11-08 18:48:00.000 -82.14 14.04 15.49 14
2018-11-08 18:58:00.000 -53.28 14.04 16.05 14
2018-11-08 19:08:00.000 -99.61 15.16 16.61 14
2018-11-08 19:18:00.000 -5 12.36 15.49 14
2018-11-08 19:28:00.000 -50.28 14.04 16.05 14
2018-11-08 19:38:00.000 -91.95 15.16 16.61 14
2018-11-08 19:48:00.000 -5 11.8 15.49 14
2018-11-08 19:58:00.000 -71.13 14.6 15.49 14
2018-11-08 20:08:00.000 -100 14.6 16.05 14
2018-11-08 20:18:00.000 -59.68 14.04 16.61 14
2018-11-08 20:28:00.000 -5 11.24 14.93 14
2018-11-08 20:38:00.000 -85.69 14.6 15.49 14
2018-11-08 20:48:00.000 -54.15 14.04 16.05 14
2018-11-08 20:58:00.000 -100 15.16 16.61 14
2018-11-08 21:08:00.000 -5 11.8 14.93 14
2018-11-08 21:18:00.000 -76.65 14.6 16.05 14
2018-11-08 21:28:00.000 -43.18 13.37 15.49 14
2018-11-08 21:38:00.000 -98.29 15.04 16.61 14
2018-11-08 21:48:00.000 -5.64 12.81 16.61 14
2018-11-08 21:58:00.000 -77.34 13.93 14.93 14
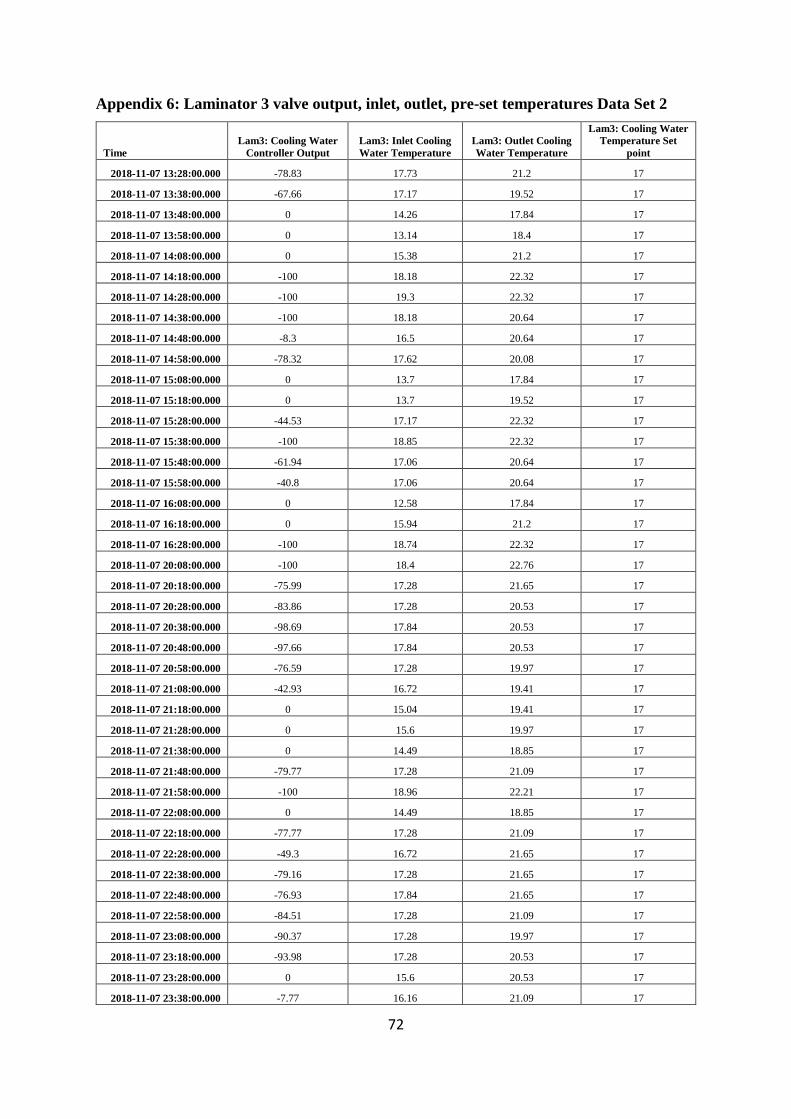
72
Appendix 6: Laminator 3 valve output, inlet, outlet, pre-set temperatures Data Set 2
Time
Lam3: Cooling Water
Controller Output
Lam3: Inlet Cooling
Water Temperature
Lam3: Outlet Cooling
Water Temperature
Lam3: Cooling Water
Temperature Set
point
2018-11-07 13:28:00.000 -78.83 17.73 21.2 17
2018-11-07 13:38:00.000 -67.66 17.17 19.52 17
2018-11-07 13:48:00.000 0 14.26 17.84 17
2018-11-07 13:58:00.000 0 13.14 18.4 17
2018-11-07 14:08:00.000 0 15.38 21.2 17
2018-11-07 14:18:00.000 -100 18.18 22.32 17
2018-11-07 14:28:00.000 -100 19.3 22.32 17
2018-11-07 14:38:00.000 -100 18.18 20.64 17
2018-11-07 14:48:00.000 -8.3 16.5 20.64 17
2018-11-07 14:58:00.000 -78.32 17.62 20.08 17
2018-11-07 15:08:00.000 0 13.7 17.84 17
2018-11-07 15:18:00.000 0 13.7 19.52 17
2018-11-07 15:28:00.000 -44.53 17.17 22.32 17
2018-11-07 15:38:00.000 -100 18.85 22.32 17
2018-11-07 15:48:00.000 -61.94 17.06 20.64 17
2018-11-07 15:58:00.000 -40.8 17.06 20.64 17
2018-11-07 16:08:00.000 0 12.58 17.84 17
2018-11-07 16:18:00.000 0 15.94 21.2 17
2018-11-07 16:28:00.000 -100 18.74 22.32 17
2018-11-07 20:08:00.000 -100 18.4 22.76 17
2018-11-07 20:18:00.000 -75.99 17.28 21.65 17
2018-11-07 20:28:00.000 -83.86 17.28 20.53 17
2018-11-07 20:38:00.000 -98.69 17.84 20.53 17
2018-11-07 20:48:00.000 -97.66 17.84 20.53 17
2018-11-07 20:58:00.000 -76.59 17.28 19.97 17
2018-11-07 21:08:00.000 -42.93 16.72 19.41 17
2018-11-07 21:18:00.000 0 15.04 19.41 17
2018-11-07 21:28:00.000 0 15.6 19.97 17
2018-11-07 21:38:00.000 0 14.49 18.85 17
2018-11-07 21:48:00.000 -79.77 17.28 21.09 17
2018-11-07 21:58:00.000 -100 18.96 22.21 17
2018-11-07 22:08:00.000 0 14.49 18.85 17
2018-11-07 22:18:00.000 -77.77 17.28 21.09 17
2018-11-07 22:28:00.000 -49.3 16.72 21.65 17
2018-11-07 22:38:00.000 -79.16 17.28 21.65 17
2018-11-07 22:48:00.000 -76.93 17.84 21.65 17
2018-11-07 22:58:00.000 -84.51 17.28 21.09 17
2018-11-07 23:08:00.000 -90.37 17.28 19.97 17
2018-11-07 23:18:00.000 -93.98 17.28 20.53 17
2018-11-07 23:28:00.000 0 15.6 20.53 17
2018-11-07 23:38:00.000 -7.77 16.16 21.09 17
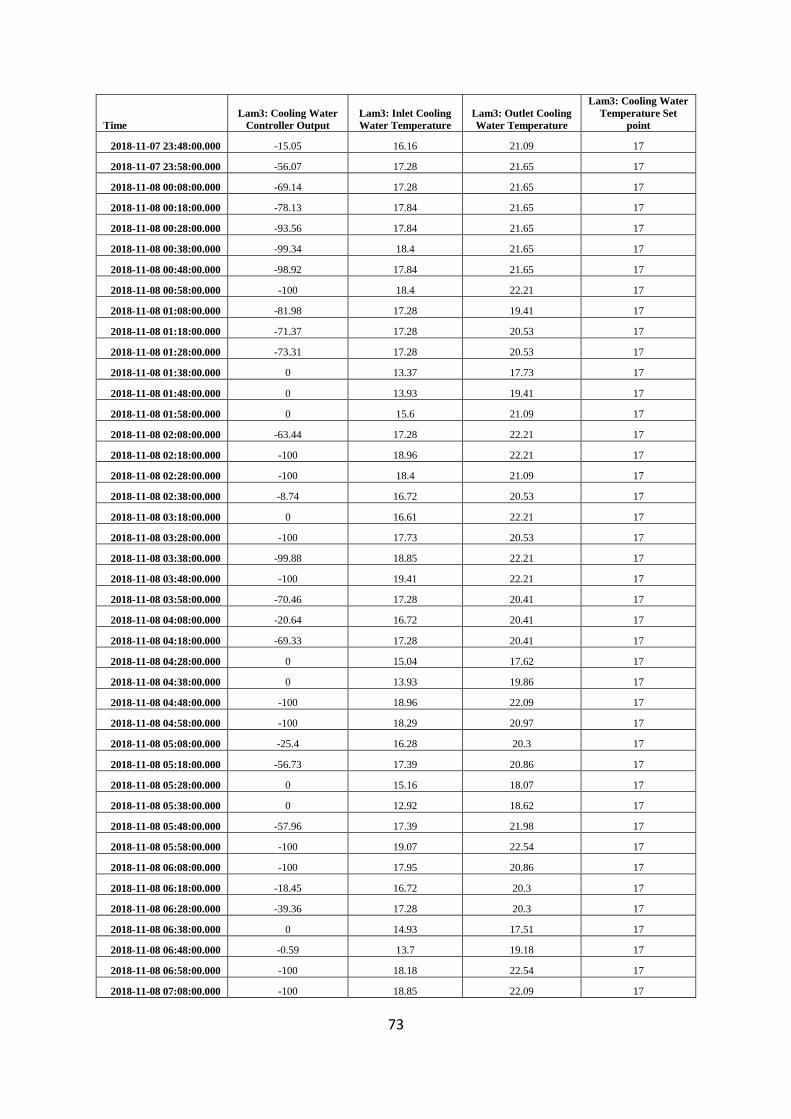
73
Time
Lam3: Cooling Water
Controller Output
Lam3: Inlet Cooling
Water Temperature
Lam3: Outlet Cooling
Water Temperature
Lam3: Cooling Water
Temperature Set
point
2018-11-07 23:48:00.000 -15.05 16.16 21.09 17
2018-11-07 23:58:00.000 -56.07 17.28 21.65 17
2018-11-08 00:08:00.000 -69.14 17.28 21.65 17
2018-11-08 00:18:00.000 -78.13 17.84 21.65 17
2018-11-08 00:28:00.000 -93.56 17.84 21.65 17
2018-11-08 00:38:00.000 -99.34 18.4 21.65 17
2018-11-08 00:48:00.000 -98.92 17.84 21.65 17
2018-11-08 00:58:00.000 -100 18.4 22.21 17
2018-11-08 01:08:00.000 -81.98 17.28 19.41 17
2018-11-08 01:18:00.000 -71.37 17.28 20.53 17
2018-11-08 01:28:00.000 -73.31 17.28 20.53 17
2018-11-08 01:38:00.000 0 13.37 17.73 17
2018-11-08 01:48:00.000 0 13.93 19.41 17
2018-11-08 01:58:00.000 0 15.6 21.09 17
2018-11-08 02:08:00.000 -63.44 17.28 22.21 17
2018-11-08 02:18:00.000 -100 18.96 22.21 17
2018-11-08 02:28:00.000 -100 18.4 21.09 17
2018-11-08 02:38:00.000 -8.74 16.72 20.53 17
2018-11-08 03:18:00.000 0 16.61 22.21 17
2018-11-08 03:28:00.000 -100 17.73 20.53 17
2018-11-08 03:38:00.000 -99.88 18.85 22.21 17
2018-11-08 03:48:00.000 -100 19.41 22.21 17
2018-11-08 03:58:00.000 -70.46 17.28 20.41 17
2018-11-08 04:08:00.000 -20.64 16.72 20.41 17
2018-11-08 04:18:00.000 -69.33 17.28 20.41 17
2018-11-08 04:28:00.000 0 15.04 17.62 17
2018-11-08 04:38:00.000 0 13.93 19.86 17
2018-11-08 04:48:00.000 -100 18.96 22.09 17
2018-11-08 04:58:00.000 -100 18.29 20.97 17
2018-11-08 05:08:00.000 -25.4 16.28 20.3 17
2018-11-08 05:18:00.000 -56.73 17.39 20.86 17
2018-11-08 05:28:00.000 0 15.16 18.07 17
2018-11-08 05:38:00.000 0 12.92 18.62 17
2018-11-08 05:48:00.000 -57.96 17.39 21.98 17
2018-11-08 05:58:00.000 -100 19.07 22.54 17
2018-11-08 06:08:00.000 -100 17.95 20.86 17
2018-11-08 06:18:00.000 -18.45 16.72 20.3 17
2018-11-08 06:28:00.000 -39.36 17.28 20.3 17
2018-11-08 06:38:00.000 0 14.93 17.51 17
2018-11-08 06:48:00.000 -0.59 13.7 19.18 17
2018-11-08 06:58:00.000 -100 18.18 22.54 17
2018-11-08 07:08:00.000 -100 18.85 22.09 17
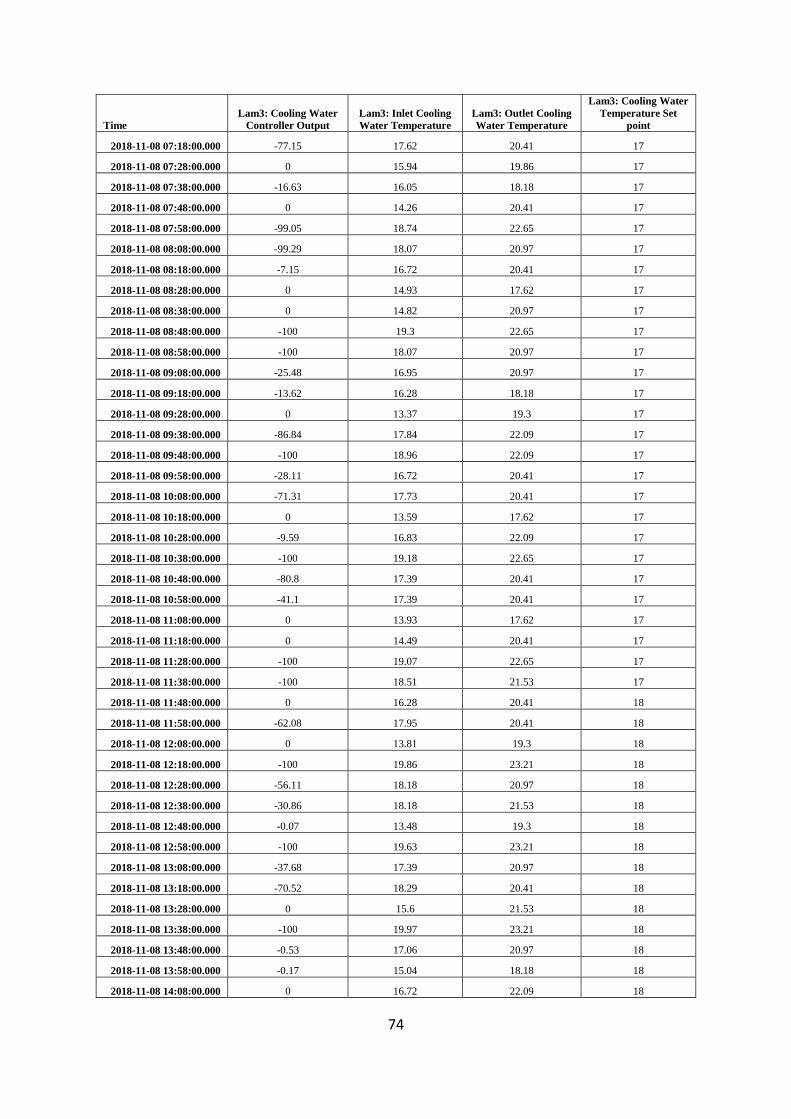
74
Time
Lam3: Cooling Water
Controller Output
Lam3: Inlet Cooling
Water Temperature
Lam3: Outlet Cooling
Water Temperature
Lam3: Cooling Water
Temperature Set
point
2018-11-08 07:18:00.000 -77.15 17.62 20.41 17
2018-11-08 07:28:00.000 0 15.94 19.86 17
2018-11-08 07:38:00.000 -16.63 16.05 18.18 17
2018-11-08 07:48:00.000 0 14.26 20.41 17
2018-11-08 07:58:00.000 -99.05 18.74 22.65 17
2018-11-08 08:08:00.000 -99.29 18.07 20.97 17
2018-11-08 08:18:00.000 -7.15 16.72 20.41 17
2018-11-08 08:28:00.000 0 14.93 17.62 17
2018-11-08 08:38:00.000 0 14.82 20.97 17
2018-11-08 08:48:00.000 -100 19.3 22.65 17
2018-11-08 08:58:00.000 -100 18.07 20.97 17
2018-11-08 09:08:00.000 -25.48 16.95 20.97 17
2018-11-08 09:18:00.000 -13.62 16.28 18.18 17
2018-11-08 09:28:00.000 0 13.37 19.3 17
2018-11-08 09:38:00.000 -86.84 17.84 22.09 17
2018-11-08 09:48:00.000 -100 18.96 22.09 17
2018-11-08 09:58:00.000 -28.11 16.72 20.41 17
2018-11-08 10:08:00.000 -71.31 17.73 20.41 17
2018-11-08 10:18:00.000 0 13.59 17.62 17
2018-11-08 10:28:00.000 -9.59 16.83 22.09 17
2018-11-08 10:38:00.000 -100 19.18 22.65 17
2018-11-08 10:48:00.000 -80.8 17.39 20.41 17
2018-11-08 10:58:00.000 -41.1 17.39 20.41 17
2018-11-08 11:08:00.000 0 13.93 17.62 17
2018-11-08 11:18:00.000 0 14.49 20.41 17
2018-11-08 11:28:00.000 -100 19.07 22.65 17
2018-11-08 11:38:00.000 -100 18.51 21.53 17
2018-11-08 11:48:00.000 0 16.28 20.41 18
2018-11-08 11:58:00.000 -62.08 17.95 20.41 18
2018-11-08 12:08:00.000 0 13.81 19.3 18
2018-11-08 12:18:00.000 -100 19.86 23.21 18
2018-11-08 12:28:00.000 -56.11 18.18 20.97 18
2018-11-08 12:38:00.000 -30.86 18.18 21.53 18
2018-11-08 12:48:00.000 -0.07 13.48 19.3 18
2018-11-08 12:58:00.000 -100 19.63 23.21 18
2018-11-08 13:08:00.000 -37.68 17.39 20.97 18
2018-11-08 13:18:00.000 -70.52 18.29 20.41 18
2018-11-08 13:28:00.000 0 15.6 21.53 18
2018-11-08 13:38:00.000 -100 19.97 23.21 18
2018-11-08 13:48:00.000 -0.53 17.06 20.97 18
2018-11-08 13:58:00.000 -0.17 15.04 18.18 18
2018-11-08 14:08:00.000 0 16.72 22.09 18

75
Time
Lam3: Cooling Water
Controller Output
Lam3: Inlet Cooling
Water Temperature
Lam3: Outlet Cooling
Water Temperature
Lam3: Cooling Water
Temperature Set
point
2018-11-08 14:18:00.000 -100 19.74 23.21 18
2018-11-08 15:48:00.000 0 16.5 20.97 18
2018-11-08 15:58:00.000 0 14.82 19.86 18
2018-11-08 16:08:00.000 -14.84 17.62 22.65 18
2018-11-08 16:18:00.000 -100 19.52 22.65 18
2018-11-08 16:28:00.000 -11.31 17.51 21.53 18
2018-11-08 16:38:00.000 0 13.03 18.18 18
2018-11-08 16:48:00.000 -100 19.63 23.21 18
2018-11-08 16:58:00.000 -49.98 17.84 20.97 18
2018-11-08 17:08:00.000 -52.03 17.73 19.86 18
2018-11-08 17:18:00.000 0 15.38 21.53 18
2018-11-08 17:28:00.000 -100 19.86 23.21 18
2018-11-08 17:38:00.000 0 16.95 20.97 18
2018-11-08 17:48:00.000 0 15.27 18.18 18
2018-11-08 17:58:00.000 -19.85 17.51 22.65 18
2018-11-08 18:08:00.000 -100 20.19 23.21 18
2018-11-08 18:18:00.000 -1.09 17.28 20.97 18
2018-11-08 18:28:00.000 0 16.39 18.74 18
2018-11-08 18:38:00.000 -48.68 18.07 23.21 18
2018-11-08 18:48:00.000 -100 19.97 22.65 18
2018-11-08 18:58:00.000 0 17.17 20.97 18
2018-11-08 19:08:00.000 -0.58 13.14 18.74 18
2018-11-08 19:18:00.000 -100 19.3 23.21 18
2018-11-08 19:28:00.000 -68.44 18.29 20.97 18
2018-11-08 19:38:00.000 -56.17 18.18 21.53 18
2018-11-08 19:48:00.000 0 13.81 19.86 18
2018-11-08 19:58:00.000 -100 19.41 23.21 18
2018-11-08 20:08:00.000 -29.56 17.39 20.97 18
2018-11-08 20:18:00.000 -44.06 17.73 19.86 18
2018-11-08 20:28:00.000 0 14.71 20.97 18
2018-11-08 20:38:00.000 -100 19.52 23.21 18
2018-11-08 20:48:00.000 0 17.06 20.97 18
2018-11-08 20:58:00.000 -53.93 18.07 20.41 18
2018-11-08 21:08:00.000 0 14.6 20.97 18
2018-11-08 21:18:00.000 -100 19.52 22.65 18
2018-11-08 21:28:00.000 -10.56 17.17 20.41 18
2018-11-08 21:38:00.000 -59.46 17.73 20.97 18
2018-11-08 21:48:00.000 0 13.14 18.74 18
2018-11-08 21:58:00.000 -100 19.18 23.21 18
2018-11-08 22:08:00.000 -33.15 17.28 20.97 18
2018-11-08 22:18:00.000 -33 17.17 19.3 18
2018-11-08 22:28:00.000 0 16.95 22.65 18
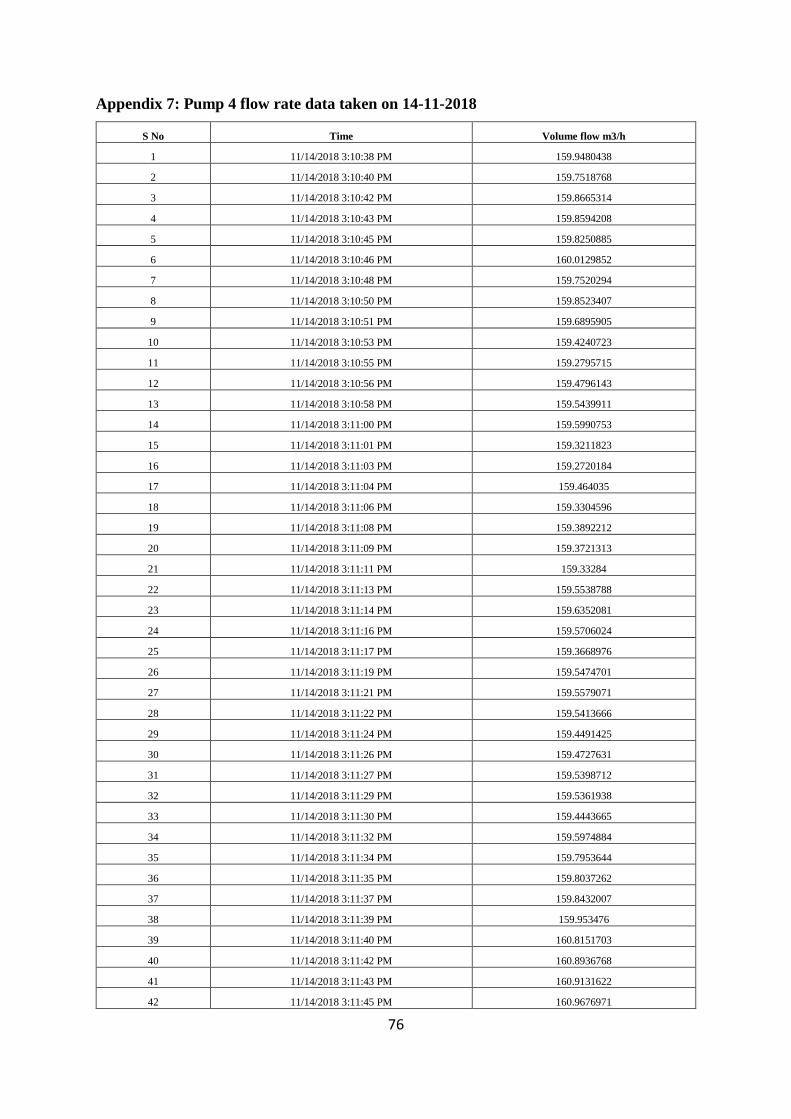
76
Appendix 7: Pump 4 flow rate data taken on 14-11-2018
S No Time Volume flow m3/h
1 11/14/2018 3:10:38 PM 159.9480438
2 11/14/2018 3:10:40 PM 159.7518768
3 11/14/2018 3:10:42 PM 159.8665314
4 11/14/2018 3:10:43 PM 159.8594208
5 11/14/2018 3:10:45 PM 159.8250885
6 11/14/2018 3:10:46 PM 160.0129852
7 11/14/2018 3:10:48 PM 159.7520294
8 11/14/2018 3:10:50 PM 159.8523407
9 11/14/2018 3:10:51 PM 159.6895905
10 11/14/2018 3:10:53 PM 159.4240723
11 11/14/2018 3:10:55 PM 159.2795715
12 11/14/2018 3:10:56 PM 159.4796143
13 11/14/2018 3:10:58 PM 159.5439911
14 11/14/2018 3:11:00 PM 159.5990753
15 11/14/2018 3:11:01 PM 159.3211823
16 11/14/2018 3:11:03 PM 159.2720184
17 11/14/2018 3:11:04 PM 159.464035
18 11/14/2018 3:11:06 PM 159.3304596
19 11/14/2018 3:11:08 PM 159.3892212
20 11/14/2018 3:11:09 PM 159.3721313
21 11/14/2018 3:11:11 PM 159.33284
22 11/14/2018 3:11:13 PM 159.5538788
23 11/14/2018 3:11:14 PM 159.6352081
24 11/14/2018 3:11:16 PM 159.5706024
25 11/14/2018 3:11:17 PM 159.3668976
26 11/14/2018 3:11:19 PM 159.5474701
27 11/14/2018 3:11:21 PM 159.5579071
28 11/14/2018 3:11:22 PM 159.5413666
29 11/14/2018 3:11:24 PM 159.4491425
30 11/14/2018 3:11:26 PM 159.4727631
31 11/14/2018 3:11:27 PM 159.5398712
32 11/14/2018 3:11:29 PM 159.5361938
33 11/14/2018 3:11:30 PM 159.4443665
34 11/14/2018 3:11:32 PM 159.5974884
35 11/14/2018 3:11:34 PM 159.7953644
36 11/14/2018 3:11:35 PM 159.8037262
37 11/14/2018 3:11:37 PM 159.8432007
38 11/14/2018 3:11:39 PM 159.953476
39 11/14/2018 3:11:40 PM 160.8151703
40 11/14/2018 3:11:42 PM 160.8936768
41 11/14/2018 3:11:43 PM 160.9131622
42 11/14/2018 3:11:45 PM 160.9676971
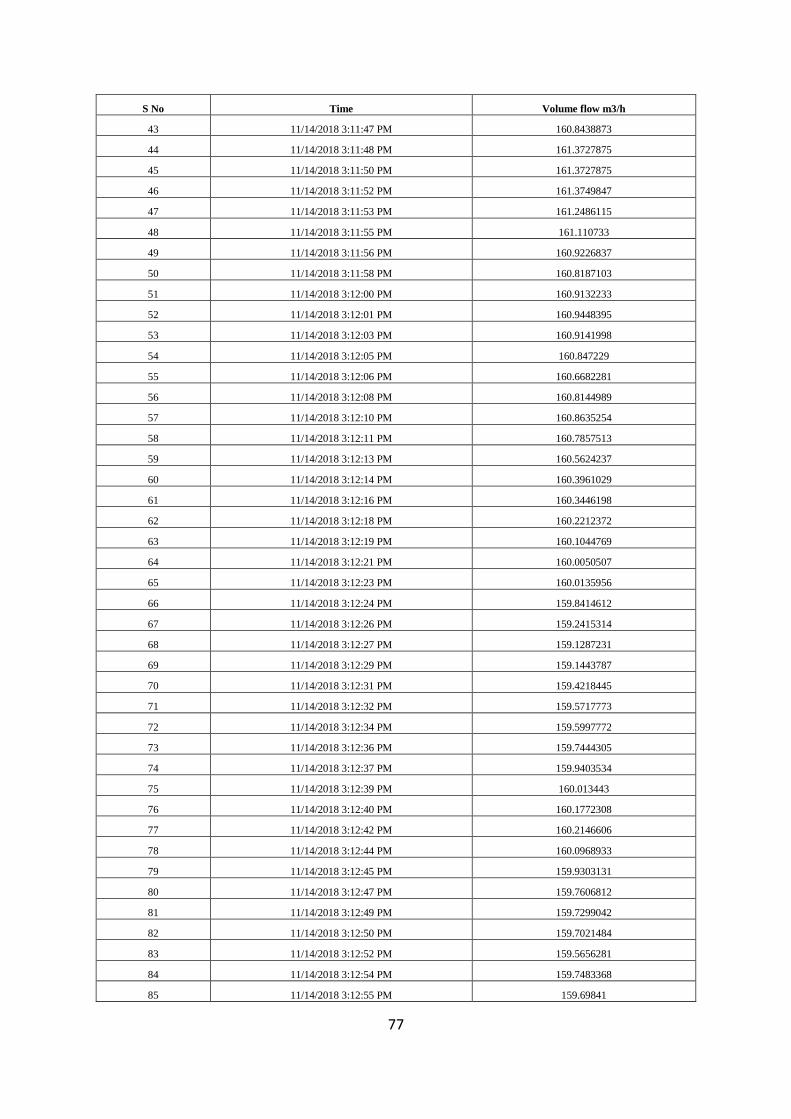
77
S No Time Volume flow m3/h
43 11/14/2018 3:11:47 PM 160.8438873
44 11/14/2018 3:11:48 PM 161.3727875
45 11/14/2018 3:11:50 PM 161.3727875
46 11/14/2018 3:11:52 PM 161.3749847
47 11/14/2018 3:11:53 PM 161.2486115
48 11/14/2018 3:11:55 PM 161.110733
49 11/14/2018 3:11:56 PM 160.9226837
50 11/14/2018 3:11:58 PM 160.8187103
51 11/14/2018 3:12:00 PM 160.9132233
52 11/14/2018 3:12:01 PM 160.9448395
53 11/14/2018 3:12:03 PM 160.9141998
54 11/14/2018 3:12:05 PM 160.847229
55 11/14/2018 3:12:06 PM 160.6682281
56 11/14/2018 3:12:08 PM 160.8144989
57 11/14/2018 3:12:10 PM 160.8635254
58 11/14/2018 3:12:11 PM 160.7857513
59 11/14/2018 3:12:13 PM 160.5624237
60 11/14/2018 3:12:14 PM 160.3961029
61 11/14/2018 3:12:16 PM 160.3446198
62 11/14/2018 3:12:18 PM 160.2212372
63 11/14/2018 3:12:19 PM 160.1044769
64 11/14/2018 3:12:21 PM 160.0050507
65 11/14/2018 3:12:23 PM 160.0135956
66 11/14/2018 3:12:24 PM 159.8414612
67 11/14/2018 3:12:26 PM 159.2415314
68 11/14/2018 3:12:27 PM 159.1287231
69 11/14/2018 3:12:29 PM 159.1443787
70 11/14/2018 3:12:31 PM 159.4218445
71 11/14/2018 3:12:32 PM 159.5717773
72 11/14/2018 3:12:34 PM 159.5997772
73 11/14/2018 3:12:36 PM 159.7444305
74 11/14/2018 3:12:37 PM 159.9403534
75 11/14/2018 3:12:39 PM 160.013443
76 11/14/2018 3:12:40 PM 160.1772308
77 11/14/2018 3:12:42 PM 160.2146606
78 11/14/2018 3:12:44 PM 160.0968933
79 11/14/2018 3:12:45 PM 159.9303131
80 11/14/2018 3:12:47 PM 159.7606812
81 11/14/2018 3:12:49 PM 159.7299042
82 11/14/2018 3:12:50 PM 159.7021484
83 11/14/2018 3:12:52 PM 159.5656281
84 11/14/2018 3:12:54 PM 159.7483368
85 11/14/2018 3:12:55 PM 159.69841
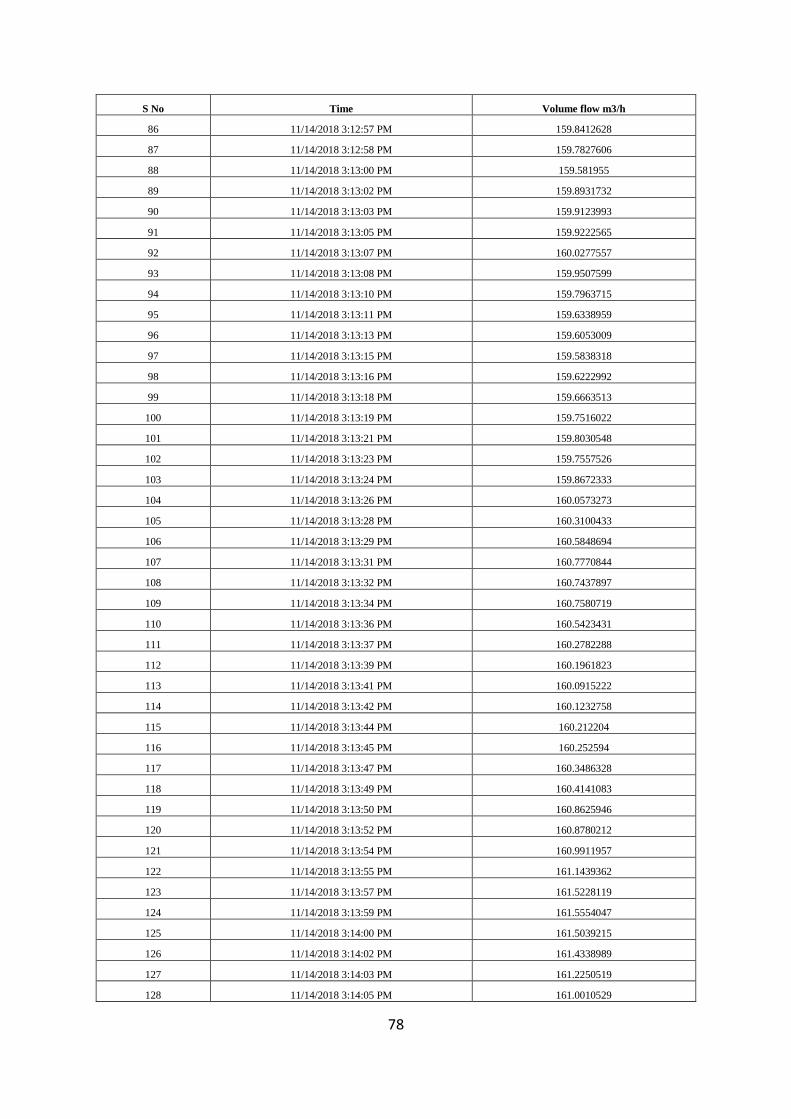
78
S No Time Volume flow m3/h
86 11/14/2018 3:12:57 PM 159.8412628
87 11/14/2018 3:12:58 PM 159.7827606
88 11/14/2018 3:13:00 PM 159.581955
89 11/14/2018 3:13:02 PM 159.8931732
90 11/14/2018 3:13:03 PM 159.9123993
91 11/14/2018 3:13:05 PM 159.9222565
92 11/14/2018 3:13:07 PM 160.0277557
93 11/14/2018 3:13:08 PM 159.9507599
94 11/14/2018 3:13:10 PM 159.7963715
95 11/14/2018 3:13:11 PM 159.6338959
96 11/14/2018 3:13:13 PM 159.6053009
97 11/14/2018 3:13:15 PM 159.5838318
98 11/14/2018 3:13:16 PM 159.6222992
99 11/14/2018 3:13:18 PM 159.6663513
100 11/14/2018 3:13:19 PM 159.7516022
101 11/14/2018 3:13:21 PM 159.8030548
102 11/14/2018 3:13:23 PM 159.7557526
103 11/14/2018 3:13:24 PM 159.8672333
104 11/14/2018 3:13:26 PM 160.0573273
105 11/14/2018 3:13:28 PM 160.3100433
106 11/14/2018 3:13:29 PM 160.5848694
107 11/14/2018 3:13:31 PM 160.7770844
108 11/14/2018 3:13:32 PM 160.7437897
109 11/14/2018 3:13:34 PM 160.7580719
110 11/14/2018 3:13:36 PM 160.5423431
111 11/14/2018 3:13:37 PM 160.2782288
112 11/14/2018 3:13:39 PM 160.1961823
113 11/14/2018 3:13:41 PM 160.0915222
114 11/14/2018 3:13:42 PM 160.1232758
115 11/14/2018 3:13:44 PM 160.212204
116 11/14/2018 3:13:45 PM 160.252594
117 11/14/2018 3:13:47 PM 160.3486328
118 11/14/2018 3:13:49 PM 160.4141083
119 11/14/2018 3:13:50 PM 160.8625946
120 11/14/2018 3:13:52 PM 160.8780212
121 11/14/2018 3:13:54 PM 160.9911957
122 11/14/2018 3:13:55 PM 161.1439362
123 11/14/2018 3:13:57 PM 161.5228119
124 11/14/2018 3:13:59 PM 161.5554047
125 11/14/2018 3:14:00 PM 161.5039215
126 11/14/2018 3:14:02 PM 161.4338989
127 11/14/2018 3:14:03 PM 161.2250519
128 11/14/2018 3:14:05 PM 161.0010529
79
S No Time Volume flow m3/h
129 11/14/2018 3:14:07 PM 160.8955231
130 11/14/2018 3:14:08 PM 161.0260468
131 11/14/2018 3:14:10 PM 161.1299896
132 11/14/2018 3:14:11 PM 161.2177887
133 11/14/2018 3:14:13 PM 161.2875671
134 11/14/2018 3:14:15 PM 161.3925476
135 11/14/2018 3:14:16 PM 161.4824371
136 11/14/2018 3:14:18 PM 161.4332123
137 11/14/2018 3:14:20 PM 161.3067169
138 11/14/2018 3:14:21 PM 161.2012177
139 11/14/2018 3:14:23 PM 161.1327515
140 11/14/2018 3:14:25 PM 161.1394806
141 11/14/2018 3:14:26 PM 161.1425934
142 11/14/2018 3:14:28 PM 160.9776154
143 11/14/2018 3:14:29 PM 161.0018463
144 11/14/2018 3:14:31 PM 161.0542755
145 11/14/2018 3:14:33 PM 161.1611481
146 11/14/2018 3:14:34 PM 161.3961029
147 11/14/2018 3:14:36 PM 161.2939911
148 11/14/2018 3:14:37 PM 161.2380524
149 11/14/2018 3:14:39 PM 161.1893463
150 11/14/2018 3:14:41 PM 161.0185089
151 11/14/2018 3:14:42 PM 161.2795563
152 11/14/2018 3:14:44 PM 161.319046
153 11/14/2018 3:14:46 PM 160.9371948
154 11/14/2018 3:14:47 PM 160.9832764
155 11/14/2018 3:14:49 PM 161.092392
156 11/14/2018 3:14:51 PM 161.6880951
157 11/14/2018 3:14:52 PM 161.6880951
158 11/14/2018 3:14:54 PM 161.7994843
159 11/14/2018 3:14:55 PM 161.8440857
160 11/14/2018 3:14:57 PM 161.7542114
161 11/14/2018 3:14:59 PM 161.6064301
162 11/14/2018 3:15:00 PM 161.8369293
163 11/14/2018 3:15:02 PM 161.9825897
164 11/14/2018 3:15:04 PM 162.0489655
165 11/14/2018 3:15:05 PM 161.7849579
166 11/14/2018 3:15:07 PM 161.4163818
167 11/14/2018 3:15:08 PM 161.2628937
168 11/14/2018 3:15:10 PM 160.9917908
169 11/14/2018 3:15:12 PM 160.8557281
170 11/14/2018 3:15:13 PM 160.8260956
171 11/14/2018 3:15:15 PM 160.8508759
80
S No Time Volume flow m3/h
172 11/14/2018 3:15:17 PM 160.7300262
173 11/14/2018 3:15:18 PM 160.5685425
174 11/14/2018 3:15:20 PM 160.5828857
175 11/14/2018 3:15:22 PM 160.6507111
176 11/14/2018 3:15:23 PM 160.6191101
177 11/14/2018 3:15:25 PM 160.7206268
178 11/14/2018 3:15:26 PM 160.8874512
179 11/14/2018 3:15:28 PM 161.1824493
180 11/14/2018 3:15:30 PM 161.2202911
181 11/14/2018 3:15:31 PM 161.2683258
182 11/14/2018 3:15:33 PM 161.3135529
183 11/14/2018 3:15:35 PM 161.2315216
184 11/14/2018 3:15:36 PM 161.1026764
185 11/14/2018 3:15:38 PM 161.0433807
186 11/14/2018 3:15:39 PM 160.8686371
187 11/14/2018 3:15:41 PM 160.5873871
188 11/14/2018 3:15:43 PM 160.5429382
189 11/14/2018 3:15:44 PM 160.6608429
190 11/14/2018 3:15:46 PM 160.7342377
191 11/14/2018 3:15:48 PM 160.6250458
192 11/14/2018 3:15:49 PM 160.7570038
193 11/14/2018 3:15:51 PM 160.8829498
194 11/14/2018 3:15:53 PM 161.1006927
195 11/14/2018 3:15:54 PM 161.1551666
196 11/14/2018 3:15:56 PM 161.1155396
197 11/14/2018 3:15:58 PM 160.9492645
198 11/14/2018 3:15:59 PM 160.4958038
199 11/14/2018 3:16:01 PM 160.5526123
200 11/14/2018 3:16:02 PM 160.2547455
201 11/14/2018 3:16:04 PM 160.2046814
202 11/14/2018 3:16:06 PM 160.3673248
203 11/14/2018 3:16:07 PM 160.4645233
204 11/14/2018 3:16:09 PM 160.5465546
205 11/14/2018 3:16:11 PM 160.7608185
206 11/14/2018 3:16:12 PM 160.8519135
207 11/14/2018 3:16:14 PM 161.0140228
208 11/14/2018 3:16:16 PM 161.272171
209 11/14/2018 3:16:17 PM 161.1561127
210 11/14/2018 3:16:19 PM 161.0668182
211 11/14/2018 3:16:20 PM 160.9520721
212 11/14/2018 3:16:22 PM 160.7420349
213 11/14/2018 3:16:24 PM 160.7885284
214 11/14/2018 3:16:25 PM 160.8290863
81
S No Time Volume flow m3/h
215 11/14/2018 3:16:27 PM 160.8347473
216 11/14/2018 3:16:29 PM 160.8614197
217 11/14/2018 3:16:30 PM 160.9388428
218 11/14/2018 3:16:32 PM 160.8677063
219 11/14/2018 3:16:34 PM 160.9645386
220 11/14/2018 3:16:35 PM 160.8408051
221 11/14/2018 3:16:37 PM 160.8413849
222 11/14/2018 3:16:38 PM 160.9437103
223 11/14/2018 3:16:40 PM 161.0124359
224 11/14/2018 3:16:42 PM 160.8939514
225 11/14/2018 3:16:43 PM 160.7381744
226 11/14/2018 3:16:45 PM 160.7105713
227 11/14/2018 3:16:47 PM 160.6898041
228 11/14/2018 3:16:48 PM 160.7353668
229 11/14/2018 3:16:50 PM 160.7585297
230 11/14/2018 3:16:51 PM 160.5999603
231 11/14/2018 3:16:53 PM 160.9408875
232 11/14/2018 3:16:55 PM 161.1693115
233 11/14/2018 3:16:56 PM 161.27388
234 11/14/2018 3:16:58 PM 161.3684845
235 11/14/2018 3:17:00 PM 161.5361786
236 11/14/2018 3:17:01 PM 161.9486389
237 11/14/2018 3:17:03 PM 162.0671234
238 11/14/2018 3:17:05 PM 161.7944794
239 11/14/2018 3:17:06 PM 161.6904755
240 11/14/2018 3:17:08 PM 161.562027
241 11/14/2018 3:17:09 PM 161.4852905
242 11/14/2018 3:17:11 PM 161.384201
243 11/14/2018 3:17:13 PM 161.4789886
244 11/14/2018 3:17:14 PM 161.4548492
245 11/14/2018 3:17:16 PM 161.4877777
246 11/14/2018 3:17:17 PM 161.5700226
247 11/14/2018 3:17:19 PM 161.5789032
248 11/14/2018 3:17:21 PM 161.7910309
249 11/14/2018 3:17:22 PM 162.0345306
250 11/14/2018 3:17:24 PM 162.0745087
251 11/14/2018 3:17:26 PM 161.9590912
252 11/14/2018 3:17:27 PM 161.8265533
253 11/14/2018 3:17:29 PM 161.752182
254 11/14/2018 3:17:31 PM 161.4974823
255 11/14/2018 3:17:32 PM 161.4271393
256 11/14/2018 3:17:34 PM 161.4645233
257 11/14/2018 3:17:35 PM 161.6488647
82
S No Time Volume flow m3/h
258 11/14/2018 3:17:37 PM 161.6331635
259 11/14/2018 3:17:39 PM 161.4273224
260 11/14/2018 3:17:40 PM 161.3465729
261 11/14/2018 3:17:42 PM 161.5186462
262 11/14/2018 3:17:43 PM 161.4232025
263 11/14/2018 3:17:45 PM 161.3846436
264 11/14/2018 3:17:47 PM 161.3392944
265 11/14/2018 3:17:48 PM 161.2683563
266 11/14/2018 3:17:50 PM 161.1246948
267 11/14/2018 3:17:52 PM 160.9647369
268 11/14/2018 3:17:53 PM 160.979538
269 11/14/2018 3:17:55 PM 160.979538
270 11/14/2018 3:17:56 PM 160.5730133
271 11/14/2018 3:17:58 PM 160.476181
272 11/14/2018 3:18:00 PM 160.4593811
273 11/14/2018 3:18:01 PM 160.5206451
274 11/14/2018 3:18:03 PM 160.5346832
275 11/14/2018 3:18:05 PM 160.461731
276 11/14/2018 3:18:06 PM 160.3827057
277 11/14/2018 3:18:08 PM 159.8777313
278 11/14/2018 3:18:09 PM 159.8796539
279 11/14/2018 3:18:11 PM 160.0063324
280 11/14/2018 3:18:13 PM 159.961853
281 11/14/2018 3:18:14 PM 159.8906708
282 11/14/2018 3:18:16 PM 159.829483
283 11/14/2018 3:18:18 PM 159.7808075
284 11/14/2018 3:18:19 PM 159.7900848
285 11/14/2018 3:18:21 PM 159.9146881
286 11/14/2018 3:18:23 PM 160.2246857
287 11/14/2018 3:18:24 PM 160.2215729
288 11/14/2018 3:18:26 PM 160.1494598
289 11/14/2018 3:18:27 PM 160.1000214
290 11/14/2018 3:18:29 PM 160.336319
291 11/14/2018 3:18:31 PM 160.7033386
292 11/14/2018 3:18:32 PM 160.758316
293 11/14/2018 3:18:34 PM 160.8620453
294 11/14/2018 3:18:36 PM 160.8086395
295 11/14/2018 3:18:37 PM 160.6983795
296 11/14/2018 3:18:39 PM 160.5410767
297 11/14/2018 3:18:40 PM 160.4572754
298 11/14/2018 3:18:42 PM 160.1394196
299 11/14/2018 3:18:44 PM 160.1753998
300 11/14/2018 3:18:45 PM 160.1714478
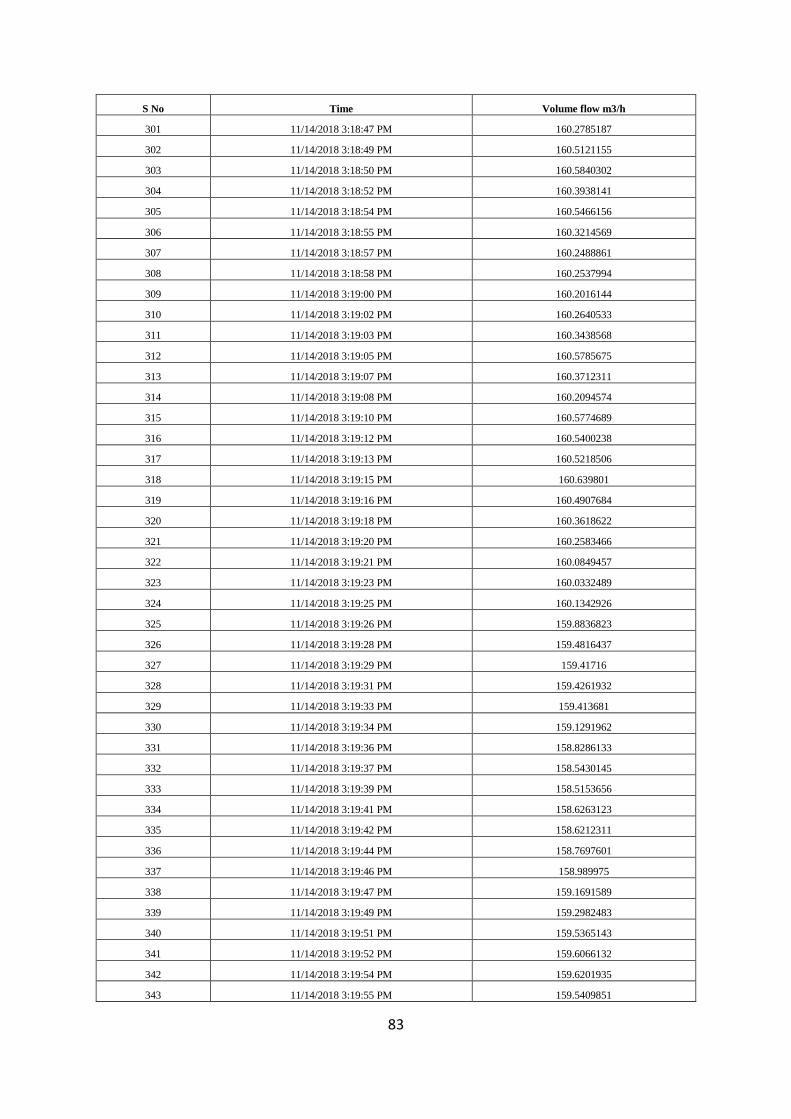
83
S No Time Volume flow m3/h
301 11/14/2018 3:18:47 PM 160.2785187
302 11/14/2018 3:18:49 PM 160.5121155
303 11/14/2018 3:18:50 PM 160.5840302
304 11/14/2018 3:18:52 PM 160.3938141
305 11/14/2018 3:18:54 PM 160.5466156
306 11/14/2018 3:18:55 PM 160.3214569
307 11/14/2018 3:18:57 PM 160.2488861
308 11/14/2018 3:18:58 PM 160.2537994
309 11/14/2018 3:19:00 PM 160.2016144
310 11/14/2018 3:19:02 PM 160.2640533
311 11/14/2018 3:19:03 PM 160.3438568
312 11/14/2018 3:19:05 PM 160.5785675
313 11/14/2018 3:19:07 PM 160.3712311
314 11/14/2018 3:19:08 PM 160.2094574
315 11/14/2018 3:19:10 PM 160.5774689
316 11/14/2018 3:19:12 PM 160.5400238
317 11/14/2018 3:19:13 PM 160.5218506
318 11/14/2018 3:19:15 PM 160.639801
319 11/14/2018 3:19:16 PM 160.4907684
320 11/14/2018 3:19:18 PM 160.3618622
321 11/14/2018 3:19:20 PM 160.2583466
322 11/14/2018 3:19:21 PM 160.0849457
323 11/14/2018 3:19:23 PM 160.0332489
324 11/14/2018 3:19:25 PM 160.1342926
325 11/14/2018 3:19:26 PM 159.8836823
326 11/14/2018 3:19:28 PM 159.4816437
327 11/14/2018 3:19:29 PM 159.41716
328 11/14/2018 3:19:31 PM 159.4261932
329 11/14/2018 3:19:33 PM 159.413681
330 11/14/2018 3:19:34 PM 159.1291962
331 11/14/2018 3:19:36 PM 158.8286133
332 11/14/2018 3:19:37 PM 158.5430145
333 11/14/2018 3:19:39 PM 158.5153656
334 11/14/2018 3:19:41 PM 158.6263123
335 11/14/2018 3:19:42 PM 158.6212311
336 11/14/2018 3:19:44 PM 158.7697601
337 11/14/2018 3:19:46 PM 158.989975
338 11/14/2018 3:19:47 PM 159.1691589
339 11/14/2018 3:19:49 PM 159.2982483
340 11/14/2018 3:19:51 PM 159.5365143
341 11/14/2018 3:19:52 PM 159.6066132
342 11/14/2018 3:19:54 PM 159.6201935
343 11/14/2018 3:19:55 PM 159.5409851
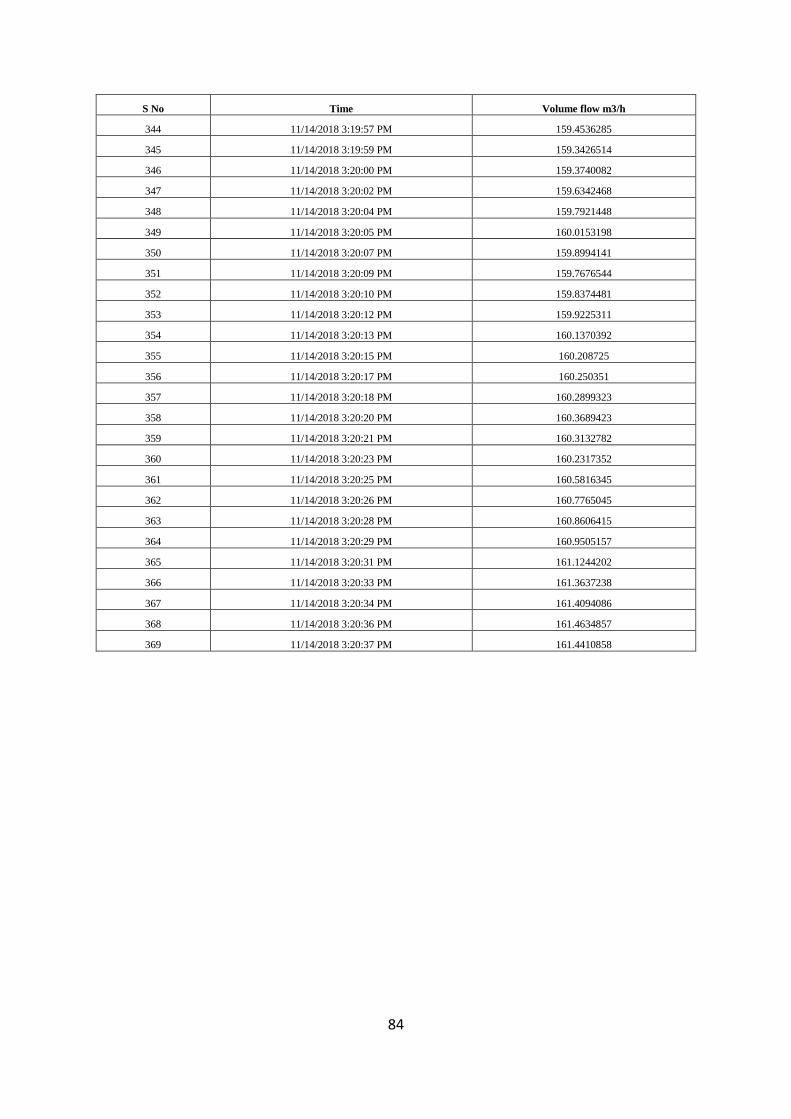
84
S No Time Volume flow m3/h
344 11/14/2018 3:19:57 PM 159.4536285
345 11/14/2018 3:19:59 PM 159.3426514
346 11/14/2018 3:20:00 PM 159.3740082
347 11/14/2018 3:20:02 PM 159.6342468
348 11/14/2018 3:20:04 PM 159.7921448
349 11/14/2018 3:20:05 PM 160.0153198
350 11/14/2018 3:20:07 PM 159.8994141
351 11/14/2018 3:20:09 PM 159.7676544
352 11/14/2018 3:20:10 PM 159.8374481
353 11/14/2018 3:20:12 PM 159.9225311
354 11/14/2018 3:20:13 PM 160.1370392
355 11/14/2018 3:20:15 PM 160.208725
356 11/14/2018 3:20:17 PM 160.250351
357 11/14/2018 3:20:18 PM 160.2899323
358 11/14/2018 3:20:20 PM 160.3689423
359 11/14/2018 3:20:21 PM 160.3132782
360 11/14/2018 3:20:23 PM 160.2317352
361 11/14/2018 3:20:25 PM 160.5816345
362 11/14/2018 3:20:26 PM 160.7765045
363 11/14/2018 3:20:28 PM 160.8606415
364 11/14/2018 3:20:29 PM 160.9505157
365 11/14/2018 3:20:31 PM 161.1244202
366 11/14/2018 3:20:33 PM 161.3637238
367 11/14/2018 3:20:34 PM 161.4094086
368 11/14/2018 3:20:36 PM 161.4634857
369 11/14/2018 3:20:37 PM 161.4410858

85
Appendix 8: Chiller average inlet/outlet temperature
S No Time Temperature Out Temperature In
1 14/11/2018 15:00 26.1 21.8
2 14/11/2018 15:01 25.1 21.7
3 14/11/2018 15:02 25.1 21.8
4 14/11/2018 15:03 24.9 21.7
5 14/11/2018 15:04 24.7 21.6
6 14/11/2018 15:05 24.3 21.5
7 14/11/2018 15:06 24.6 21.7
8 14/11/2018 15:07 24.7 21.6
9 14/11/2018 15:08 24.7 21.7
10 14/11/2018 15:09 24.7 21.7
11 14/11/2018 15:10 24.8 21.6
12 14/11/2018 15:11 24.8 21.6
13 14/11/2018 15:12 24.8 21.7
14 14/11/2018 15:13 24.8 21.6
15 14/11/2018 15:14 24.7 21.7
16 14/11/2018 15:15 24.6 21.4
17 14/11/2018 15:16 24.5 21.4
18 14/11/2018 15:17 24.4 21.4
19 14/11/2018 15:18 24.6 21.4
20 14/11/2018 15:19 24.4 21.3
21 14/11/2018 15:20 24.4 21.3
22 14/11/2018 15:21 24.5 21.4
23 14/11/2018 15:22 24.5 21.4
24 14/11/2018 15:23 24.5 21.3
25 14/11/2018 15:24 24.8 21.7
26 14/11/2018 15:25 24.6 21.6
27 14/11/2018 15:26 24.7 21.5
28 14/11/2018 15:27 24.4 21.6
29 14/11/2018 15:28 24.6 21.6
30 14/11/2018 15:29 24.8 21.5
31 14/11/2018 15:30 24.5 21.5
32 14/11/2018 15:31 24.6 21.6
33 14/11/2018 15:32 24.4 21.7
34 14/11/2018 15:33 24.5 21.6
35 14/11/2018 15:34 24.4 21.5
36 14/11/2018 15:35 24.6 21.4
37 14/11/2018 15:36 24.0 21.3
38 14/11/2018 15:37 24.2 21.6
39 14/11/2018 15:38 24.4 21.3
40 14/11/2018 15:39 24.6 21.3
41 14/11/2018 15:40 24.5 21.3
42 14/11/2018 15:41 24.4 21.4
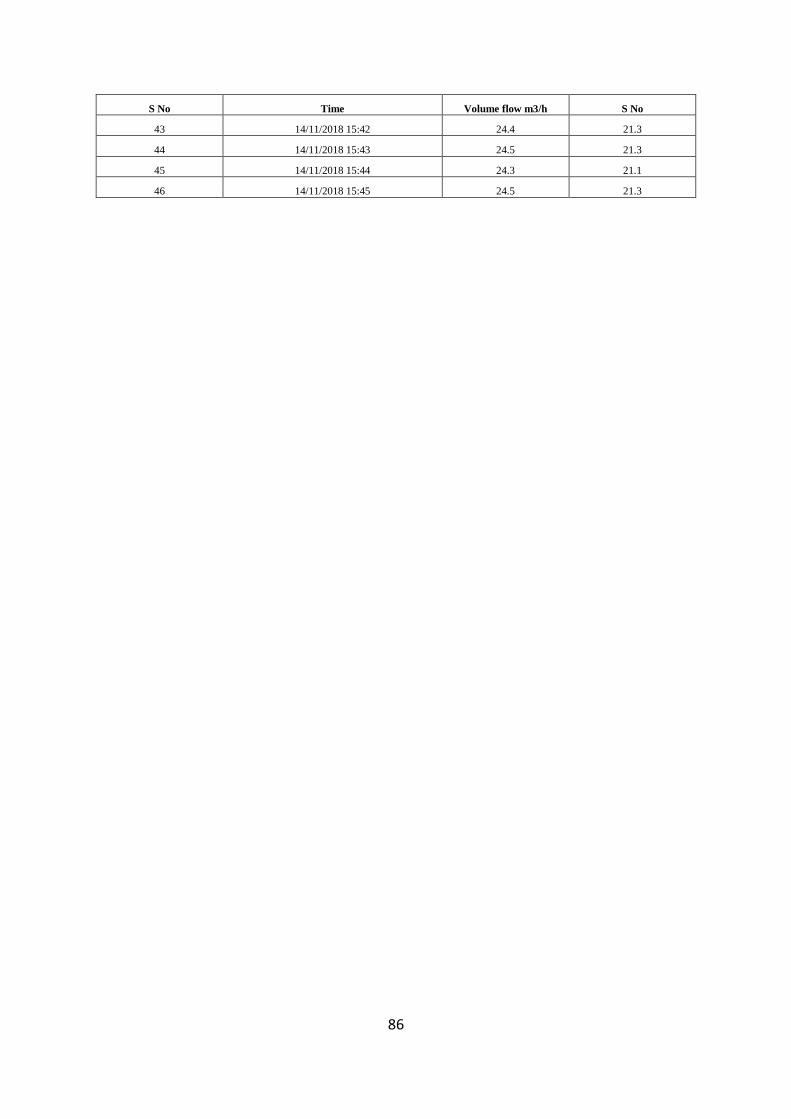
86
S No Time Volume flow m3/h S No
43 14/11/2018 15:42 24.4 21.3
44 14/11/2018 15:43 24.5 21.3
45 14/11/2018 15:44 24.3 21.1
46 14/11/2018 15:45 24.5 21.3