Embed Size (px)
Citation preview
University of Strathclyde
Department of Mechanical Engineering
Energy Systems Research Unit (ESRU)
Hydrogen production from biogas:
A model for the H2 SEED Project
by
André Martins de Martini
A thesis presented in fulfilment of the requirements for the degree of
MSc in Energy Systems and the Environment
2007

The copyright of this thesis belongs to the author under the terms of the United
Kingdom Copyright Acts as qualified by University of Strathclyde Regulation 3.49.
Due acknowledgement must always be made of the use of any material contained in,
or derived from, this thesis

André Martins de Martini MSc in Energy Systems and the Environment
I
Acknowledgements
I would like to thank my colleagues from University of Strathclyde:
- My supervisor, Dr. Nicolas Kelly, for his constant support and guidance
throughout the development of this project.
- Dr. Paul Strachan, representing all members of staff for their help and kindness
- Arnaud Eté for his patience, his tutorial and valuable help with TRNSYS
I would also like to express my special admiration and gratefulness to people that
supported this project in Western Isles:
- Dr. Neil Finlayson and Donald Macritchie representing the whole team of
Greenspace Research Institute, for the unrestricted support, enthusiasm and initial
suggestion of the theme of this project.
- Martyn Tulloch, representing Comhairle nan Eilean Siar, for his interest and help
- Donnie Macmillan and Kenny John Macleod, representing Creed Waste
Management, for their attention and for valuable information that supported the
study
- James Morrison, John Macbeth and Christine Macintosh, representing many
friends that I made in my short stay in Stornoway
I could not forget to thank my family and friends:
- All my classmates and my best friends in Glasgow: I will carry you forever in my
heart
- My family, for their presence, care, attention and support
- My best friends in Brazil and colleagues at Promon
Finally, I would like to express my deepest gratitude to the Foreign and
Commonwealth Office, BG Group and University of Strathclyde for sponsoring my
scholarship. With this support, that old dream now it is true.

André Martins de Martini MSc in Energy Systems and the Environment
II

André Martins de Martini MSc in Energy Systems and the Environment
III
“I believe that water will one day be employed as fuel, that hydrogen and oxygen which
constitute it, used singly or together, will furnish an inexhaustible source of heat and light, of
an intensity of which coal is not capable.”
Jules Verne, The Mysterious Island (1874)
André Martins de Martini MSc in Energy Systems and the Environment
IV
Table of Contents
ABSTRACT ...........................................................................................................................................XI
1 INTRODUCTION ......................................................................................................................... 1
1.1 MOTIVATION .......................................................................................................................... 1 1.2 PROJECT OUTLINE................................................................................................................... 2 1.3 MAIN OBJECTIVES................................................................................................................... 2 1.4 ORGANISATION OF THIS DISSERTATION.................................................................................. 2
2 HYDROGEN TECHNOLOGY ................................................................................................... 4
2.1 OVERVIEW: HYDROGEN AS AN ENERGY CARRIER AND THE “HYDROGEN ECONOMY”........... 4 2.2 HYDROGEN PRODUCTION ....................................................................................................... 5
2.2.1 Thermal Processes ............................................................................................................ 6 2.2.2 Electrolytic Processes....................................................................................................... 8 2.2.3 Photolytic Processes ....................................................................................................... 10
2.3 STORAGE .............................................................................................................................. 10 2.3.1 Compressed gas .............................................................................................................. 11 2.3.2 Liquid hydrogen .............................................................................................................. 11 2.3.3 Materials-based storage ................................................................................................. 11
2.4 HYDROGEN TRANSPORT AND DISTRIBUTION....................................................................... 13 2.5 FUEL CELLS .......................................................................................................................... 14
2.5.1 Polymer Electrolyte Membrane Fuel Cells (PEM)........................................................ 15 2.5.2 Direct Methanol Fuel Cells (DMFC)............................................................................. 15 2.5.3 Alkaline Fuel Cells.......................................................................................................... 16 2.5.4 Phosphoric Acid Fuel Cells (PAFC) .............................................................................. 16 2.5.5 Molten Carbonate Fuel Cells (MCFC) .......................................................................... 17 2.5.6 Solid Oxide Fuel Cells (SOFC) ...................................................................................... 17 2.5.7 Main fuel cell applications ............................................................................................. 19
2.6 INTERNAL COMBUSTION ENGINES AND OTHER HYDROGEN COMBUSTION APPLICATIONS ... 20 2.7 ECONOMIC ASPECTS ............................................................................................................. 21
2.7.1 Hydrogen Production ..................................................................................................... 21 2.7.2 Hydrogen storage............................................................................................................ 22 2.7.3 Transport and distribution.............................................................................................. 23 2.7.4 Fuel Cells ........................................................................................................................ 25
2.8 CURRENT DEMONSTRATION PROJECTS ................................................................................. 27 2.8.1 Utsira Island and HyNor, Norway ................................................................................. 27 2.8.2 Prince Edward Island Hydrogen Village, Canada ........................................................ 28
André Martins de Martini MSc in Energy Systems and the Environment
V
2.8.3 West Beacon Farm (Crest, Loughborough University) ................................................. 29 2.8.4 Iceland............................................................................................................................. 30 2.8.5 PURE (Promoting Unst Renewable Energy) ................................................................. 30 2.8.6 Chewonki Renewable Hydrogen Project........................................................................ 31 2.8.7 Xcel –NREL Wind2H2 Project ....................................................................................... 32
3 PROJECT BACKGROUND...................................................................................................... 33
3.1 THE OUTER HEBRIDES.......................................................................................................... 33 3.2 HEBRIDEAN HYDROGEN PARK............................................................................................. 38
4 BIOGAS AND HYDROGEN TECHNOLOGIES................................................................... 41
5 PROJECT DESCRIPTION ....................................................................................................... 43
5.1 METHODOLOGY.................................................................................................................... 43 5.2 SIMULATION ......................................................................................................................... 43
5.2.1 The importance of simulation ......................................................................................... 43 5.2.2 Homer.............................................................................................................................. 44 5.2.3 TRNSYS ........................................................................................................................... 45
6 SYSTEM DESCRIPTION AND MODELLING ..................................................................... 45
6.1 SYSTEM DESCRIPTION – CREED PARK WASTE MANAGEMENT FACILITY ........................... 45 6.2 SYSTEM DESCRIPTION – H2 SEED PROJECT........................................................................ 49 6.3 MODEL DEVELOPMENT ........................................................................................................ 51
6.3.1 Energy balance ............................................................................................................... 51 6.3.2 Model in Homer .............................................................................................................. 53 6.3.3 Model in TRNSYS............................................................................................................ 55
6.4 RESULTS FOR REFERENCE CASE............................................................................................ 58 6.5 ANALYSIS OF DIFFERENT OPERATIONAL CONDITIONS.......................................................... 65
6.5.1 Increase in biogas production following current operation profile .............................. 66 6.5.2 Increase in biogas production reaching maximum capacity of the plant...................... 67
6.6 ALTERNATIVE CONFIGURATION ........................................................................................... 71 6.6.1 Introduction..................................................................................................................... 71 6.6.2 Model description and assumptions ............................................................................... 73 6.6.3 Results ............................................................................................................................. 75
7 OVERALL ANALYSIS .............................................................................................................. 80
7.1 CONCLUSIONS....................................................................................................................... 80 7.2 ALTERNATIVE CONFIGURATIONS ......................................................................................... 82 7.3 RECOMMENDATIONS FOR FURTHER RESEARCH.................................................................... 83 7.4 RECOMMENDATIONS FOR FURTHER DEVELOPMENT IN THE REGION .................................... 83

André Martins de Martini MSc in Energy Systems and the Environment
VI
8 BIBLIOGRAPHY........................................................................................................................ 86
APPENDIXES ....................................................................................................................................... 92
APPENDIX 1 SCOTLAND’S ONSHORE WIND POWER RESOURCE ........................................................ 93 APPENDIX 2 SCOTLAND’S OFFSHORE WIND POWER RESOURCE ....................................................... 94 APPENDIX 3 SCOTLAND’S WAVE POWER RESOURCE ........................................................................ 95 APPENDIX 4 SCOTLAND’S TIDAL POWER RESOURCE ........................................................................ 96
André Martins de Martini MSc in Energy Systems and the Environment
VII
List of Figures
FIGURE 1: SCHEMATIC REPRESENTATION OF AN ELETROLYSER ................................................................ 8 FIGURE 2: STATUS OF HYDROGEN STORAGE TECHNOLOGIES. PRESENTED COSTS EXPRESSED IN US$. [ 8]
........................................................................................................................................................ 11 FIGURE 3: METHODS FOR HYDROGEN DISTRIBUTION [ 9]......................................................................... 13
FIGURE 4:SCHEMATIC DIAGRAM OF A PEM FUEL CELL [ 3] .................................................................... 15 FIGURE 5:SCHEMATIC DIAGRAM OF A DMFC ......................................................................................... 15 FIGURE 6:SCHEMATIC DIAGRAM OF AN ALKALINE FUEL CELL [ 3]........................................................... 16
FIGURE 7:SCHEMATIC DIAGRAM OF A ALKALINE FUEL CELL [ 3]............................................................. 16
FIGURE 8:SCHEMATIC DIAGRAM OF A MOLTEN CARBONATE FUEL CELL [ 3] ........................................... 17
FIGURE 9:SCHEMATIC DIAGRAM OF A MOLTEN CARBONATE FUEL CELL [ 3] .......................................... 17 FIGURE 10: COST OF HYDROGEN FROM DIFFERENT TECHNOLOGIES, COMPARED TO TRADITIONAL FOSSIL
FUELS. VALUES IN POUNDS (£) PER GJ OF ANNUAL CAPACITY [ 13- 14- 5- 15- 16] ........................... 21
FIGURE 11: VARIATION OF COST AGAINST SIZE OF COMPRESSOR (COSTS IN 2007 £) [ 17]...................... 22
FIGURE 12: COMPARISON BETWEEN COST OF HYDROGEN AND NATURAL GAS PIPELINES [ 19] ............... 24 FIGURE 13: COST BREAKDOWN OF CURRENT COST ESTIMATE OF MANUALLY PRODUCED PEM FUEL
CELLS [ 5] ........................................................................................................................................ 25
FIGURE 14: EQUIPMENTS OF UTSIRA DEMONSTRATION PROJECT [ 21] .................................................... 27 FIGURE 15: SEVEN NODES IN A SOUTHERN NECKLACE CONSTITUTING THE PROJECTED NORWEGIAN
HYDROGEN HIGHWAY [ 22] ............................................................................................................. 28
FIGURE 16: INTEGRATED SYSTEM OF WEST BEACON FARM [ 24]............................................................ 29
FIGURE 17: SCHEMATIC DIAGRAM OF PURE PROJECT [ 26] .................................................................... 30
FIGURE 18: ARTISTIC VIEW OF CHEWONKI HYDROGEN PROJECT [ 27].................................................... 31
FIGURE 19: CONFIGURATION OF XCEL-NREL WIND2H2 PROJECT [ 28] ................................................ 32 FIGURE 20: MAP OF WESTERN ISLES ....................................................................................................... 33 FIGURE 21: POPULATION PROJECTION FOR THE HEBRIDES [ 29] .............................................................. 34
FIGURE 22: EMPLOYMENT BY ECONOMIC SECTOR [ 30] ........................................................................... 34
FIGURE 23: ENERGY DEMAND BY FUEL [ 35]............................................................................................ 35
FIGURE 24: ENERGY DEMAND BY ECONOMIC SECTOR [ 29] ..................................................................... 35 FIGURE 25: ELECTRICITY AND RENEWABLE ENERGY MAP OF WESTERN ISLES...................................... 36 FIGURE 26: HYDROGEN LAB AT LEWS CASTLE COLLEGE [ 36] ............................................................... 39 FIGURE 27: SCHEMATIC DIAGRAM OF THE H2 SEED PROJECT ............................................................... 40
André Martins de Martini MSc in Energy Systems and the Environment
VIII
FIGURE 28: TECHNOLOGICAL PATHWAYS WITH BIOGAS AND HYDROGEN TECHNOLOGIES..................... 41 FIGURE 29: 3D MODEL OF 1MW BIOGAS-POWERED FUEL CELL INSTALLATION [ 37].............................. 42
FIGURE 30: PICTURE OF THE INSTALLATION LOCATED IN RENTON, WA [ 37]......................................... 42
FIGURE 31: IMPACT OF CHANGES ACROSS PROJECT DEVELOPMENT [ 38] ................................................ 43
FIGURE 32: THE “BIG BOILER” ENERGY SYSTEM MODEL [ 39] ................................................................. 44 FIGURE 33: DAILY BIOGAS PRODUCTION PROFILE ................................................................................... 47 FIGURE 34: WEEKLY ELECTRICITY CONSUMPTION PROFILE.................................................................... 48 FIGURE 35: WEEKLY ELECTRICITY CONSUMPTION PROFILE, WITH DAILY VARIATION IN DETAIL........... 48 FIGURE 36: LOGIC DIAGRAM FOR BIOGAS ENGINE OPERATION ............................................................... 49 FIGURE 37: SCHEMATIC DIAGRAM OF THE H2 SEED PROJECT ............................................................... 50 FIGURE 38: LOGIC DIAGRAM FOR THE H2 SEED PROJECT ...................................................................... 51 FIGURE 39: SIMPLIFIED ENERGY BALANCE IN HOMER............................................................................. 52 FIGURE 40: DETAILED RESULTS FOR A SIMPLIFIED ENERGY BALANCE IN HOMER .................................. 53 FIGURE 41: COMPONENTS CONSIDERED IN HOMER MODEL..................................................................... 53 FIGURE 42: LOAD PROFILE GENERATOR IN HOMER ................................................................................. 54 FIGURE 43: TRNSYS MODEL OF THE H2 SEED PROJECT ....................................................................... 55 FIGURE 44: ENGINE OPERATION AND BIOGAS STORAGE LEVEL............................................................... 59 FIGURE 45: RESULTS FOR REFERENCE CASE ............................................................................................ 60 FIGURE 46: CURVES FOR HYDROGEN PRODUCTION AND CONSUMPTION................................................. 61 FIGURE 47: NUMBER OF HOURS OF GENERATOR AND ELECTROLYSER OPERATION................................. 62 FIGURE 48: NUMBER OF ON-OFF OF GENERATOR AND ELECTROLYSER .................................................. 62 FIGURE 49: RESULTS FOR MODIFIED REFERENCE CASE, WITH ELECTROLYSER OPERATING IN IDLING
POWER ............................................................................................................................................ 63 FIGURE 50: NUMBER OF HOURS OF GENERATOR AND ELECTROLYSER OPERATION IN THE MODIFIED
REFERENCE CASE............................................................................................................................ 64 FIGURE 51: SOURCE OF ENERGY SUPPLYING IDLING POWER TO THE ELECTROLYSER ............................. 64 FIGURE 52: NUMBER OF ON-OFF CYCLES OF GENERATOR AND ELECTROLYSER IN THE MODIFIED
REFERENCE CASE............................................................................................................................ 64 FIGURE 53: CURVES FOR HYDROGEN PRODUCTION AND CONSUMPTION FOR THE MODIFIED REFERENCE
CASE ............................................................................................................................................... 65 FIGURE 54: RESULTS FOR THE CONSTANT INCREASE IN BIOGAS PRODUCTION........................................ 67 FIGURE 55: ASSUMED CURVE OF BIOGAS PRODUCTION IN FULL CAPACITY............................................. 68 FIGURE 56: ASSUMED CURVE OF ELECTRICITY CONSUMPTION OF THE PLAN IN FULL CAPACITY............ 68 FIGURE 57: BIOGAS LEVEL AND GENERATOR BEHAVIOUR FOR PLANT OPERATING IN FULL CAPACITY .. 69 FIGURE 58: RESULTS FOR PLANT OPERATING IN FULL CAPACITY............................................................ 70 FIGURE 59: PERFORMANCE OF GENERATOR AND ELECTROLYSER FOR PLANT OPERATING IN FULL
CAPACITY ....................................................................................................................................... 70

André Martins de Martini MSc in Energy Systems and the Environment
IX
FIGURE 60: NUMBER OF ON-OFF CYCLES FOR PLANT OPERATING IN FULL CAPACITY............................. 71 FIGURE 61: DIAGRAM OF ALTERNATIVE CONFIGURATION ...................................................................... 72 FIGURE 62: TRNSYS MODEL FOR THE H2SEED PROJECT USING AN ALTERNATIVE CONFIGURATION
WITH A REFORMER.......................................................................................................................... 74 FIGURE 63: RESULTS OBTAINED FOR THE ALTERNATIVE CONFIGURATION WITH REFORMER.................. 76 FIGURE 64: RESULTS FOR REFERENCE CASE WITH THE SAME PARAMETERS AS THE ALTERNATIVE
CONFIGURATION............................................................................................................................. 76 FIGURE 65: PERFORMANCE OF GENERATOR AND REFORMER .................................................................. 77 FIGURE 66: NUMBER OF ON-OFF CYLES FOR ALTERNATIVE CONFIGURATION WITH REFORMER ............. 77 FIGURE 67: FIGURE 68: PERFORMANCE OF GENERATOR AND ELECTROLYSER WITH THE SAME
PARAMETERS AS THE ALTERNATIVE CONFIGURATION ................................................................... 78 FIGURE 69: NUMBER OF ON-OFF CYLES FOR REFERENCE CASE USING THE SAME PARAMETERS AS THE
ALTERNATIVE CONFIGURATION...................................................................................................... 78 FIGURE 70: HYDROGEN PRODUCTION OF REFORMER AND ELECTROLYSER............................................. 79 FIGURE 71: BIOGAS CONSUMPTION FOR REFERENCE AND ALTERNATIVE CASES..................................... 79
André Martins de Martini MSc in Energy Systems and the Environment
X
List of Tables
TABLE 1: COMPARATIVE PROPERTIES OF HYDROGEN AND FUELS (ADAPTED FROM [ 2]).......................... 4
TABLE 2: CHARACTERISTICS OF EXISTING AND ADVANCED ELECTROLYSERS [ 5]..................................... 9
TABLE 3: KEY PROPERTIES OF MAIN METAL HYDRIDES [ 5] ..................................................................... 12
TABLE 4: COMPARISON CHART OF FUEL CELL TECHNOLOGIES [ 11] ........................................................ 18
TABLE 5: EFFICIENCY OF TYPICAL COMPRESSION UNITS [ 18] ................................................................. 23
TABLE 6: COST BREAKDOWN OF MCFCS AND SOFCS [ 5]...................................................................... 26 TABLE 7: SET POINTS FOR ENGINE OPERATION........................................................................................ 49 TABLE 8: DESCRIPTION OF COMPONENTS OF TRNSYS MODEL .............................................................. 56 TABLE 9: EQUATIONS USED IN THE CONTROL LOOP OF THE BIOGAS ENGINE .......................................... 57 TABLE 10: VARIABLES FOR THE EQUATIONS USED IN THE CONTROL LOOP OF THE BIOGAS ENGINE ....... 58 TABLE 11: DEFINITION OF HYDROGEN DEMAND THAT CAN BE MET BY THE SYSTEM.............................. 61 TABLE 12: SET POINTS FOR FULL CAPACITY OF BIOGAS PRODUCTION .................................................... 69 TABLE 13: EQUATIONS USED IN THE SIMULATION OF THE REFORMER .................................................... 75 TABLE 14: VARIABLES FOR THE EQUATIONS USED IN THE SIMULATION OF THE REFORMER................... 75

André Martins de Martini MSc in Energy Systems and the Environment
XI
Abstract
The release of greenhouse gases generated by humankind since the Industrial
Revolution seems to be irreversibly affecting the equilibrium of the whole planet.
Considering this scenario, many initiatives are under analysis to curb the emissions
of Greenhouse gases and at least try to mitigate the “dangerous anthropogenic
interference with the climate system”, as stated in Kyoto Protocol.
Among many options, hydrogen is one of the most attractive choices.
The main objective of this project is to simulate the H2 SEED project that will be
installed in Stornoway, Isle of Lewis. Stornoway is the main city of the Outer
Hebrides, a set of islands located in North-West of Scotland. This region is well
known by its unrivalled natural resources, especially for wind and marine power.
In this project, hydrogen will be produced from biogas, for supply to a small filling
station and also to fill cylinders for a variety of applications and demonstration
projects in the region.
A model in TRNSYS was developed to simulate different operational conditions of
the plant and to explore alternative configurations.
The model showed that the system is feasible and can produce enough hydrogen to
meet the demands of the local council. The model also showed that alternative
configurations could be implemented.

Andre Martins de Martini MSc In Energy Systems and the Environment
1
1 Introduction
1.1 Motivation
Global warming and climate change have become topics of quotidian discussion.
Once mere speculation of some scientists, the latest wave of extreme climate across
the world possibly indicate that humankind is facing the biggest environmental
challenge in its history.
The release of greenhouse gases generated by humankind since Industrial Revolution
seems to be irreversibly affecting the equilibrium of the whole planet.
Considering this scenario, many initiatives are under analysis to curb the emissions
of Greenhouse gases and at least try to mitigate the “dangerous anthropogenic
interference with the climate system”, as stated in Kyoto Protocol.
The most important measure to reduce the levels of CO2 and other harmful gases in
atmosphere is the substitution of fossil fuels. Taking into account the public
objection against nuclear power and its inherent risks, the only alternative to
traditional fuels are renewables.
The majority of renewable energy technologies are still under development but some
recent research shows promising results: among the many options, hydrogen is one
of the most attractive choices in long term, since it can be obtained from an abundant
resource and it almost does not generate any emission.
Nevertheless, some challenges must to be overcome before hydrogen can be used
without restrictions. Most of hydrogen technologies are in the early stages of
development; thus, lifetime, efficiency and reliability are issues for commercial
applications.
The biggest barrier for hydrogen is cost. Not only the cost of a new distribution
infrastructure but also the cost of electricity generation are too prohibitive when
compared to traditional sources in a business as usual scenario.
Recent studies show that hydrogen can achieve remarkable penetration in some
sectors within 20 or 30 years given appropriate regulatory incentives and considering
economies stemming from mass production and technology learning.
Andre Martins de Martini MSc In Energy Systems and the Environment
2
1.2 Project outline
This project is supported by Greenspace Research Institute from Lews Castle College
in cooperation with University of Strathclyde. This project is one small element of
significant hydrogen research being undertaken in the Outer Hebrides and seeks to
contribute to further developments and future projects in the region.
1.3 Main objectives
The focus of this project is to analyse the H2 SEED project and propose alternative
configurations for this kind of system. This system will produce hydrogen from
biogas produced from organic municipal waste in Outer Hebrides.
Within the scope of this project is included:
- modelling of the H2 SEED Project as a reference case
- proposition of alternative configurations to the system
- comparison of different technologies
- suggestion of several technological pathways to the establishment of hydrogen
infrastructure in Outer Hebrides.
It is intended that this project can provide support for several future initiatives under
development in Outer Hebrides.
1.4 Organisation of this dissertation
This dissertation is organised as follows. Chapter 2 presents a broad review of
hydrogen technology, addressing status, potential for further development and
economic aspects. It also lists some demonstration projects around the world.
Chapter 3 outlines the background of the project, especially the conditions in the
Outer Hebrides that motivated several initiatives under development in the region.
Chapter 4 present the technological pathways to hydrogen from biogas, detailing a
demonstration project. Chapter 5 details the objectives of the project, defines the
methodology and describes the tools that were used to develop the model. On
Chapter 6, the details of system are presented and the simulation is described. The
main assumptions, basic data and results obtained for the reference case and
alternative scenarios are also presented in this section. Chapter 7 presents the overall

Andre Martins de Martini MSc In Energy Systems and the Environment
3
analysis of the results, addressing main conclusions, alternative configurations for
the system, recommendation for further research and suggestions of new projects for
the region. Chapter 8 presents the references that supported this study. In the last
section, some support material is included as Appendixes.
Andre Martins de Martini MSc In Energy Systems and the Environment
4
2 Hydrogen Technology
2.1 Overview: Hydrogen as an energy carrier and the “hydrogen economy”
Hydrogen was first recognised as a distinct substance in 1766 by Henry Cavendish.
Since then and especially over the last 50 years, industry has used large amounts of
hydrogen as an industrial chemical and as an aerospace fuel. However, among the
general public, hydrogen has a misleading reputation stemmed from the spectacular
fire that destroyed the German dirigible Hindenburg in 1937. Nevertheless, an
investigation in 1990 blamed the doped material covering the outer layer of the
airship’s envelope as the main cause of the accident.[1]
Recently, environmental awareness and climate change has increased the interest in
hydrogen as an energy source. It is considered by many as the fuel of the future.
Hydrogen, however, is not a primary source of energy, since it does not t occur free
in natural in considerable quantities. Therefore, it is referred as an energy carrier or
energy vector, just like electricity.
Combustion of hydrogen with oxygen produces only water; with air and some
nitrogen oxides. Hydrogen, thus, is virtually carbon free, depending on the primary
resource used for its production.
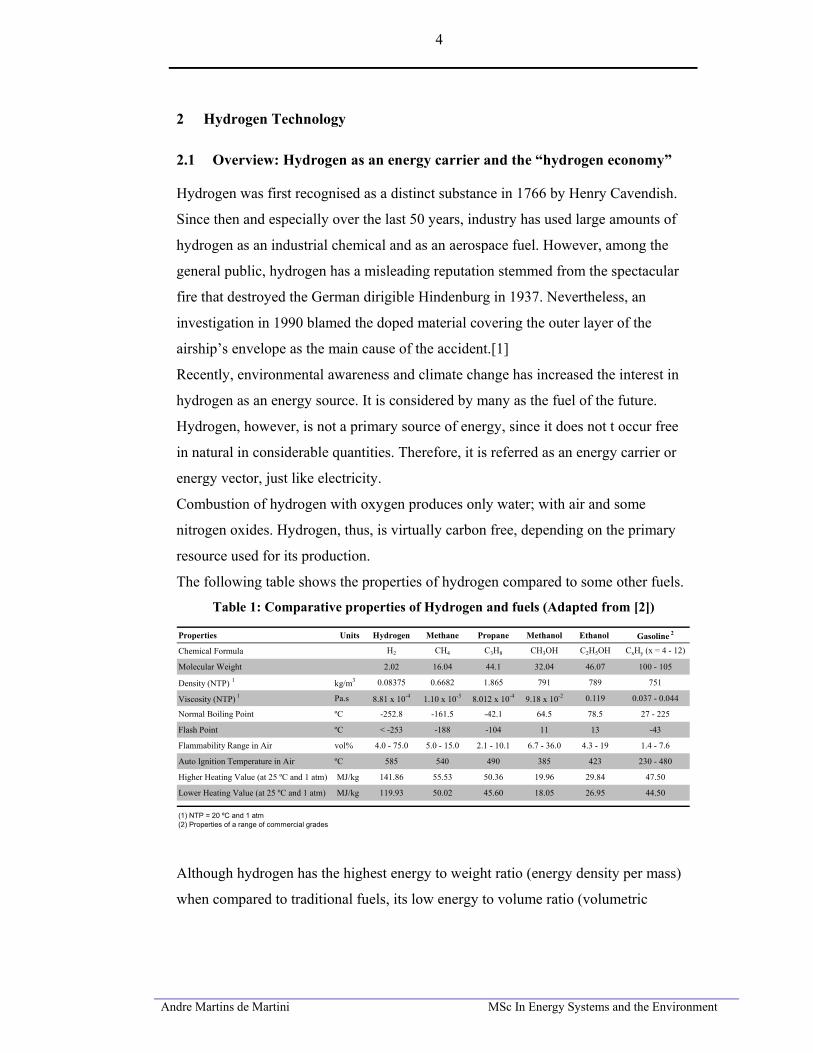
The following table shows the properties of hydrogen compared to some other fuels.
Table 1: Comparative properties of Hydrogen and fuels (Adapted from [2])
Properties Units Hydrogen Methane Propane Methanol Ethanol Gasoline 2
Chemical Formula H2 CH4 C3H8 CH3OH C2H5OH CxHy (x = 4 - 12)
Molecular Weight 2.02 16.04 44.1 32.04 46.07 100 - 105
Density (NTP) 1 kg/m3 0.08375 0.6682 1.865 791 789 751
Viscosity (NTP) 1 Pa.s 8.81 x 10⁻⁴ 1.10 x 10⁻³ 8.012 x 10⁻⁴ 9.18 x 10⁻² 0.119 0.037 - 0.044
Normal Boiling Point ºC -252.8 -161.5 -42.1 64.5 78.5 27 - 225
Flash Point ºC < -253 -188 -104 11 13 -43
Flammability Range in Air vol% 4.0 - 75.0 5.0 - 15.0 2.1 - 10.1 6.7 - 36.0 4.3 - 19 1.4 - 7.6
Auto Ignition Temperature in Air ºC 585 540 490 385 423 230 - 480
Higher Heating Value (at 25 ºC and 1 atm) MJ/kg 141.86 55.53 50.36 19.96 29.84 47.50
Lower Heating Value (at 25 ºC and 1 atm) MJ/kg 119.93 50.02 45.60 18.05 26.95 44.50
(1) NTP = 20 ºC and 1 atm(2) Properties of a range of commercial grades
Although hydrogen has the highest energy to weight ratio (energy density per mass)
when compared to traditional fuels, its low energy to volume ratio (volumetric
Andre Martins de Martini MSc In Energy Systems and the Environment
5
energy density) constitutes a major setback for further development. For example, to
deliver the same amount of energy of 1 litre of gasoline, it would be necessary
approximately 20 litres of compressed hydrogen or 3.6 litres of liquid hydrogen.
Many researches are currently looking at alternative technologies to store hydrogen
in a more efficient way. More details about hydrogen storage will be explored in
section 2.3.
The prognosis of a clean source of energy produced from an omnipresent resource –
water - coined the term “hydrogen economy”. The hydrogen economy is a
hypothetical scenario where hydrogen plays a major role in the energy systems,
substituting all fossil fuels by renewables, hydrogen and electrical systems.
More than a vision of Jules Verne, this term is derived from the potential represented
by the widespread use of hydrogen technologies. Hydrogen technologies have the
following main benefits:
- reduction of carbon emissions: hydrogen can be carbon neutral when produced
form renewables
- energy diversity and security of supply, with reduction of dependence on oil or
biofuels, whose production is inexorably concentrated in few countries
- increased efficiency: besides less pollutant than the traditional internal
combustion engines (ICE) running on fossil fuels, fuel cells can be much more
efficient. That is the reason why all big automotive companies are investing
considerable amount of resources on fuel cells development
- boost to renewables: hydrogen storage can minimise the intermittency and
unreliability of renewable sources
- growing interest for portable power: small hydrogen systems can provide
electricity, heat and water even for portable applications.
2.2 Hydrogen production
The vast majority of current world production of hydrogen, around 500 billion cubic
meters, is generated from fossil sources, mainly natural gas and oil, or obtained as
by-product from chemical industries.
Andre Martins de Martini MSc In Energy Systems and the Environment
6
The method of production of hydrogen dictates the life cycle emissions of a
hydrogen system: hydrogen is truly carbon free only if it is produced form a
renewable primary source of energy.
2.2.1 Thermal Processes
2.2.1.1 Steam Reforming
Steam reforming is an endothermic catalytic conversion of light hydrocarbons in the
presence of steam. The main reactions in this process are:
Step 1: CH4 +H2O ⇒ ∆
.cat CO + 3H2
Step 2: CO + H2O ⇒ CO2 + H2
The resulting mixture from the reaction is separated by adsorption, producing high-
purity hydrogen.
Most of the hydrogen nowadays in the world is produced through this process. This
is the most energy-efficient and cost-effective commercial technology, when applied
to large, constant loads.
Steam reforming can also be used to produce hydrogen from ethanol and bio-oils
obtained from biomass. The following reaction represents the steam reforming of
ethanol:
C2H5OH + H2O ⇒ ∆
.cat 2CO + 4H2
In stationary fuel cells, the process responsible for the generation of electricity from
methane is also reforming.
Methane can be obtained from natural gas or produced by anaerobic digestion of
sewage, waste or biomass. In this process, micro-organisms decompose organic
matter, producing a gas mixture called biogas, composed mainly by methane and
carbon dioxide. Even though this gas has small concentration of hydrogen, it can be
used directly in advance High Temperature Fuel Cell (MCFC) or Solid Oxide Fuel
Cells (SOFC) to produce electricity directly. In this case, the reforming of methane
occurs directly at the electrode due to the high operational temperature. The presence
Andre Martins de Martini MSc In Energy Systems and the Environment
7
of CO2 is beneficial since it accelerates the reforming of methane.
2.2.1.2 Partial oxidation
Partial oxidation is the thermal conversion of hydrocarbons and alcohols with or
without the presence of catalyst into hydrogen. This reaction is exothermic and
requires lower temperatures, which makes the process less energy and cost intensive
than steam reforming. Researches in progress are trying to develop catalysts that are
more efficient, with higher selectivity and more resistance to high temperatures. [3]
The reaction of partial oxidation of methane is:
CH4 + 21 O2 ⇒
cat.
CO + 3H2
2.2.1.3 Plasma-arc process
The Norwegian company Kvaerner has been developing since 80’s the plasma arc
process which at temperatures of 1,600°C, splits hydrocarbons into pure carbon and
hydrogen. The process has high efficiencies, produces no significant emissions and
requires along with the primary energy source, cooling water and electricity.
A pilot plant is operating since 1992 and a large-scale plant is planned to be built,
with a capacity of 100,000Nm3/h of hydrogen. [4]
2.2.1.4 Biomass and Coal Gasification
The gasification process is carried out under high temperature and pressure in the
presence of steam and a controlled amount of oxygen.
The reaction for coal gasification can be represented as:
10CH0.8 + 2
17 O2 + 2H2O ⇒ 5CO + 5CO2 + 6H2
A similar process is used to gasify biomass. Since biomass has highly variable
composition and complexity, the complete gasification process takes one more step,
in order to reform the gaseous hydrocarbons generated in the first stage.
2.2.1.5 Solar and Nuclear Thermal Splitting
High temperature can be used to produce hydrogen. Temperatures between 500 to
2000 ºC drive a series of chemical reactions in which the reactants are recycled, in a
Andre Martins de Martini MSc In Energy Systems and the Environment
8
closed loop that consumes only water.
Next generation nuclear reactors under development, reaching up to 1000 º C, or
solar concentrators, reaching up to 2000 º C, could supply the heat needed to drive
this kind of reaction.
Researchers have identified more than 200 possible cycles with different substances.
These are two examples:
- Zinc Oxide in a solar concentration at 1900ºC
2ZnO ⇒ ∆
2Zn + O2
2Zn + 2H2O ⇒ 2ZnO + 2H2
- Sulphur-iodine cycle with the help of a nuclear reactor
2H2SO4 ⇒= C850 ∆ o
2H2O + 2SO2 + O2
4H2O + 2SO2 + 2I2 ⇒ 2H2SO4 + 4HI
4HI ⇒= C003 ∆ o
2I2 + 2H2
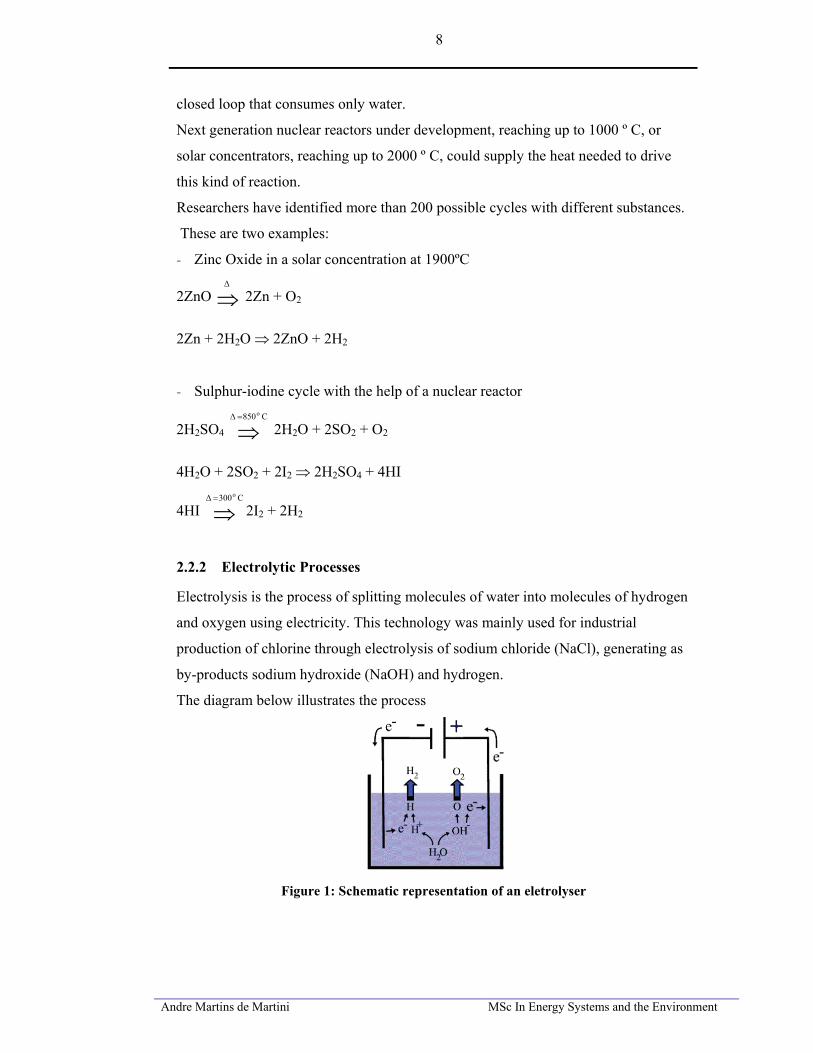
2.2.2 Electrolytic Processes
Electrolysis is the process of splitting molecules of water into molecules of hydrogen
and oxygen using electricity. This technology was mainly used for industrial
production of chlorine through electrolysis of sodium chloride (NaCl), generating as
by-products sodium hydroxide (NaOH) and hydrogen.
The diagram below illustrates the process
Figure 1: Schematic representation of an eletrolyser
Andre Martins de Martini MSc In Energy Systems and the Environment
9
These are the main technologies for electrolysis:
- PEM Electrolysers: The Polymer Electrolyte Membrane (PEM) electrolysers use
a solid plastic membrane as electrolyte;
- Alkaline Electrolyser: similar to PEM electrolysers, these equipment use an
alkaline solution as the electrolyte;
- Solid Oxide Electrolyser: use a solid ceramic material that selectively transmits
negative charged oxygen ions at around 500 to 800 ºC.
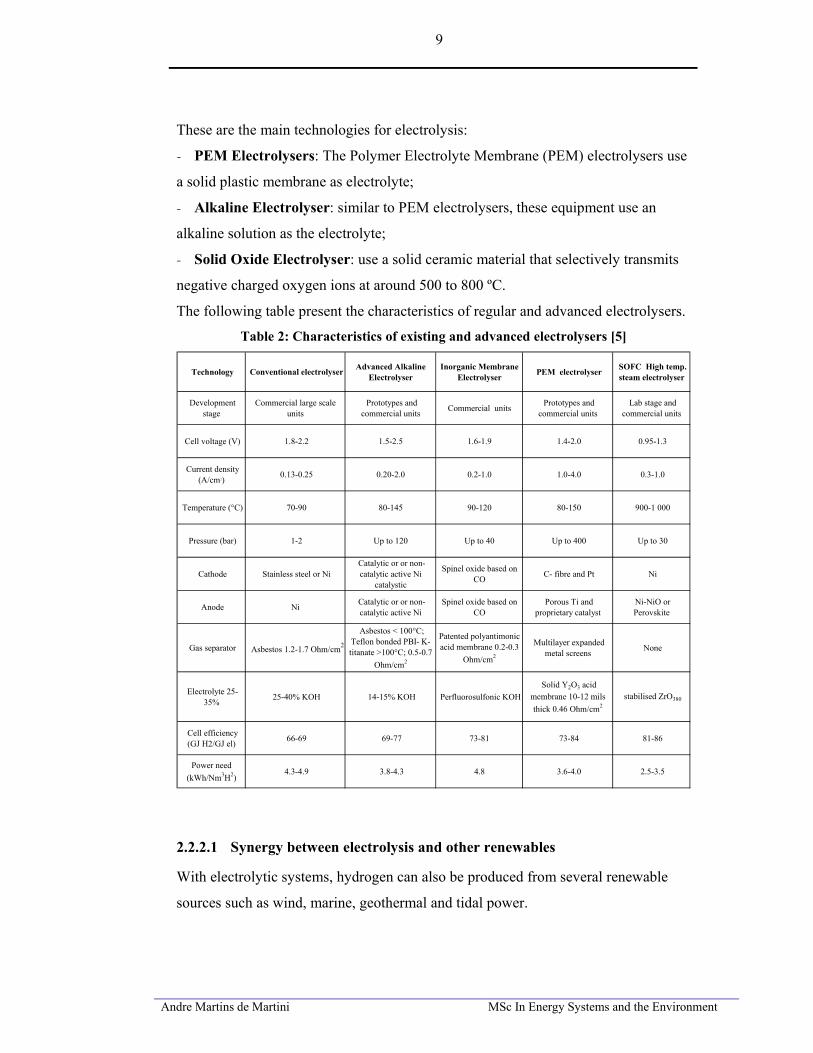
The following table present the characteristics of regular and advanced electrolysers.
Table 2: Characteristics of existing and advanced electrolysers [5]
Technology Conventional electrolyser Advanced Alkaline Electrolyser
Inorganic Membrane Electrolyser PEM electrolyser SOFC High temp.
steam electrolyser
Development stage
Commercial large scale units
Prototypes and commercial units Commercial units Prototypes and
commercial units Lab stage and
commercial units
Cell voltage (V) 1.8-2.2 1.5-2.5 1.6-1.9 1.4-2.0 0.95-1.3
Current density (A/cm2) 0.13-0.25 0.20-2.0 0.2-1.0 1.0-4.0 0.3-1.0
Temperature (°C) 70-90 80-145 90-120 80-150 900-1 000
Pressure (bar) 1-2 Up to 120 Up to 40 Up to 400 Up to 30
Cathode Stainless steel or Ni Catalytic or or non-catalytic active Ni
catalystic
Spinel oxide based on CO C- fibre and Pt Ni
Anode Ni Catalytic or or non-catalytic active Ni
Spinel oxide based on CO
Porous Ti and proprietary catalyst
Ni-NiO or Perovskite
Gas separator Asbestos 1.2-1.7 Ohm/cm2
Asbestos < 100°C; Teflon bonded PBI- K-titanate >100°C; 0.5-0.7
Ohm/cm2
Patented polyantimonic acid membrane 0.2-0.3
Ohm/cm2
Multilayer expanded metal screens None
Electrolyte 25-35% 25-40% KOH 14-15% KOH Perfluorosulfonic KOH
Solid Y2O3 acid membrane 10-12 mils thick 0.46 Ohm/cm2
stabilised ZrO380
Cell efficiency (GJ H2/GJ el) 66-69 69-77 73-81 73-84 81-86
Power need (kWh/Nm3H2)
4.3-4.9 3.8-4.3 4.8 3.6-4.0 2.5-3.5
2.2.2.1 Synergy between electrolysis and other renewables
With electrolytic systems, hydrogen can also be produced from several renewable
sources such as wind, marine, geothermal and tidal power.
Andre Martins de Martini MSc In Energy Systems and the Environment
10
In this pathway, hydrogen is produced and stored as a way to minimise the
intermittency and unavailability of the renewable energies. In a connected system, a
renewable power plant would dispatch electricity to the grid in normal operation; in
periods of excess of electricity available in the grid, the electricity would be
redirected to an electrolyser, producing hydrogen for storage. This hydrogen then can
be used to generate electricity in a fuel cell in periods of unavailability or shortage of
the renewable resource.
It is worth mentioning that the control of this system is complex and further
development is needed to achieve commercial operation.
2.2.3 Photolytic Processes
Some researches are looking at biological hydrogen production, where special kinds
of bacteria or algae produce hydrogen directly as a by-product of their metabolic
processes. This can constitute in the future one of the most important resources for
hydrogen production, but there is need for great progress. By now, the main
challenges to be addressed are the low hydrogen yield per gram of organic matter,
long recovery time between cycles of production and high cost of construction
materials. [6-7]
Photoelectrochemical water splitting is also under research, in which hydrogen is
produced from water using light and special semiconductors called
photoelectrochemical materials.
2.3 Storage
Hydrogen storage is a key enabling technology. Not only as the potential application
as an energy buffer substituting large scale battery systems but also to make transport
application commercially feasible.
The key challenge is to develop storage methods with higher energy densities, which
can provide considerable amounts of energy in a safer and cheaper way. The main
current technologies are compressed gas, liquid hydrogen and materials-based
storage.
The following chart illustrates a comprehensive view of the status in terms of weight,
volume and cost of various hydrogen storage technologies.

Andre Martins de Martini MSc In Energy Systems and the Environment
11
Figure 2: Status of hydrogen storage technologies. Presented costs expressed in US$. [8]
2.3.1 Compressed gas
The storage as a compressed gas is the most mature technology. Mobile application
requires high-pressure tanks, typically from 300 to 700bar, due to lack of space
aboard a vehicle. Some carbon fibre reinforced tanks are under development but the
cost of material and conformability are issues that still need to be addressed. [8]
2.3.2 Liquid hydrogen
The liquid hydrogen storage is a well-understood technology. It presents higher
density than compressed gas but requires cryogenic tanks, since the boiling point of
hydrogen is -252.8ºC (around 20K).
The main barriers are large evaporative losses, volume, weight and tank cost, and
especially the energy intensity of liquefaction: typically, 30% of the heating value of
hydrogen is consumed in the process.
Hybrid tanks, called cryo-compressed tanks, combine high pressure and cryogenic
technology. These vessels are lighter than hydrides and more compact than
compressed tanks. Furthermore, the process is less energy intensive than liquefaction
and present less evaporative losses. [5]
2.3.3 Materials-based storage
Hydrogen can be stored in materials by absorption, adsorption or chemical reaction.
Andre Martins de Martini MSc In Energy Systems and the Environment
12
The main methods of materials-based storage are metal hydrides, chemical hydrides
and carbon based materials
- Metal hydrides: they present on-board reversibility and can release hydrogen at
low temperatures and pressures. Current hydrides present gravimetric capacity from
1.3 to 4 wt% but some complex hydrides can potentially achieve 10wt%. [8]
Although not providing much higher storage density than compressed gases (around
200bar), metal hydrides are particularly interesting by conformability and safety,
since they operate under low temperatures and pressures, but currently present
problems with degradability, weight and cost. Some manufacturers are already using
this technology in the tanks of their hydrogen hybrid vehicles.
Table 3: Key properties of main metal hydrides [5]
Max. theoretical storage density H2 release temperaturewt% °C
AlanatesLiAlH4 10.6 190NaAlH4 7.5 100MgAlH4 9.3 140CaAlH4 7.8 >230
BorohydridesLiBH4 18.5 300NaBH4 10.6 350KBH4 7.4 125Be(BH4)2 20.8 125Mg(BH4)2 14.9 320Ca(BH4)2 11.6 260
- Chemical hydrides: also called chemical hydrogen storage, is the generic term
that describe processes in which hydrogen is generated through chemical reactions,
most commonly using chemical hydrides with water or alcohols. In most cases, the
reactions are not easily reversible and the regeneration must be carried out off-board.
The following reaction is one example of this kind of process:
NaBH4 + 2H2O = NaBO2 + 4H2
This sodium tetrahydridoborate system has gravimetric capacity of about 4% but
presents the common problems of this technological route: necessity of regeneration
Andre Martins de Martini MSc In Energy Systems and the Environment
13
off-board, regeneration energy requirements, system volume and weight, complexity
and water availability and storage.
Similar systems under development use MgH2 with water, conversion of decalin
(C10H18) under moderate temperatures to naphthalene, or ammonia borane materials
(Na3BH3).
- Carbon based materials: carbon nanotubes and fullerenes promise to
revolutionise the hydrogen storage technology in the future. Although some initial
experiments had some problems of replicability, there is potential that this
technology would lead to a capacity from 3 to 6 wt% at room temperature. [8]
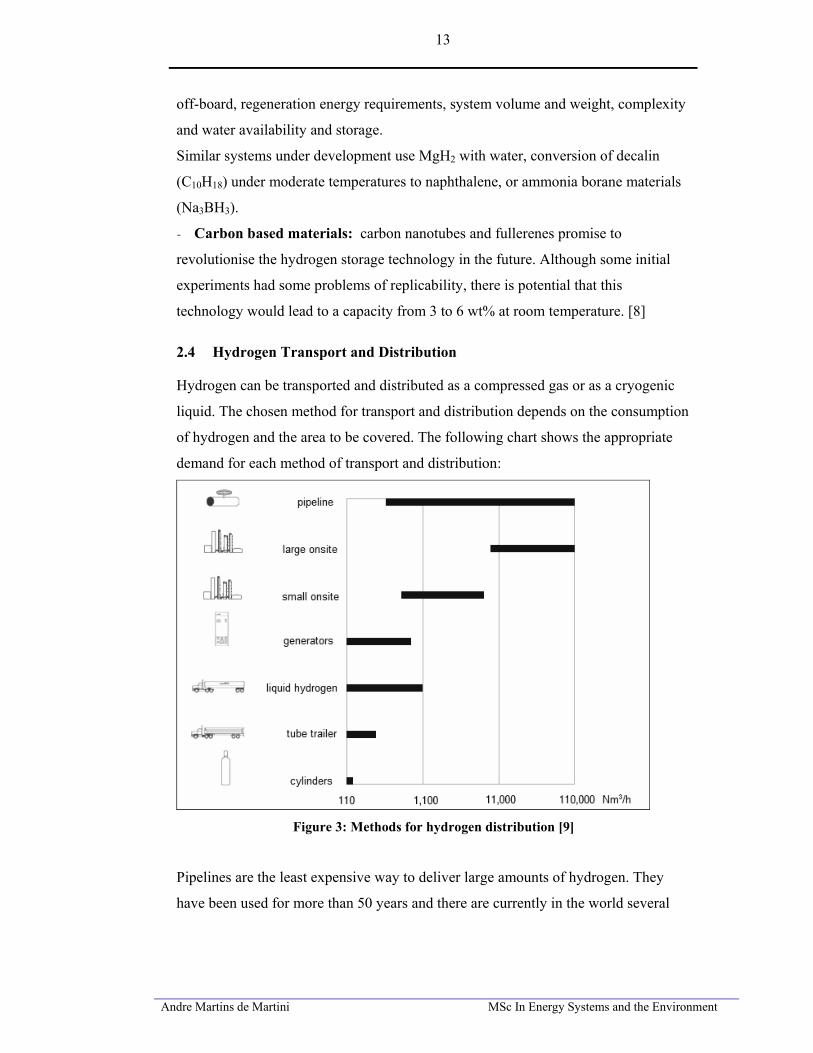
2.4 Hydrogen Transport and Distribution
Hydrogen can be transported and distributed as a compressed gas or as a cryogenic
liquid. The chosen method for transport and distribution depends on the consumption
of hydrogen and the area to be covered. The following chart shows the appropriate
demand for each method of transport and distribution:
Figure 3: Methods for hydrogen distribution [9]
Pipelines are the least expensive way to deliver large amounts of hydrogen. They
have been used for more than 50 years and there are currently in the world several
Andre Martins de Martini MSc In Energy Systems and the Environment
14
thousands of kilometres of hydrogen pipelines. These pipelines do not constitute a
network, in the sense that they were built solely to supply hydrogen for refineries and
chemical plants. Current hydrogen pipelines operate at a pressure of 10-20 bar, but
pressures up to 100 bar can be used.
Hydrogen pipelines must be made of non-porous materials, such as stainless steel.
The hydrogen molecules are so small that they would be able to permeate porous
materials, resulting in gas losses and making the pipeline materials brittle. The main
consequence of this problem is that most of the natural gas network cannot be used
for hydrogen.
Transporting compressed hydrogen gas over the road in high-pressure tube trailers is
expensive and used primarily for short distances; it becomes cost prohibitive when
transporting farther than about 200 miles from the point of production. As long as
liquid hydrogen has a higher energy density, cryogenic tankers are the preferred
method for delivering hydrogen over long distances.
Since hydrogen pipeline transport has limited availability and high capital cost for
development, hydrogen is often transported in cryogenic tankers and then vaporised
at the point of consumption.
2.5 Fuel Cells
A fuel cell is a device that uses hydrogen and oxygen to produce electricity,
generating as by-products heat and water. Fuel cells can potentially substitute with
advantages several applications that use combustion-based technologies, mainly in
transport. In this way, a myriad of applications are envisaged, from systems as large
as utilities power stations to small appliances as a computer. Fuel cells are basically
classified by the electrolyte employed.
Andre Martins de Martini MSc In Energy Systems and the Environment
15
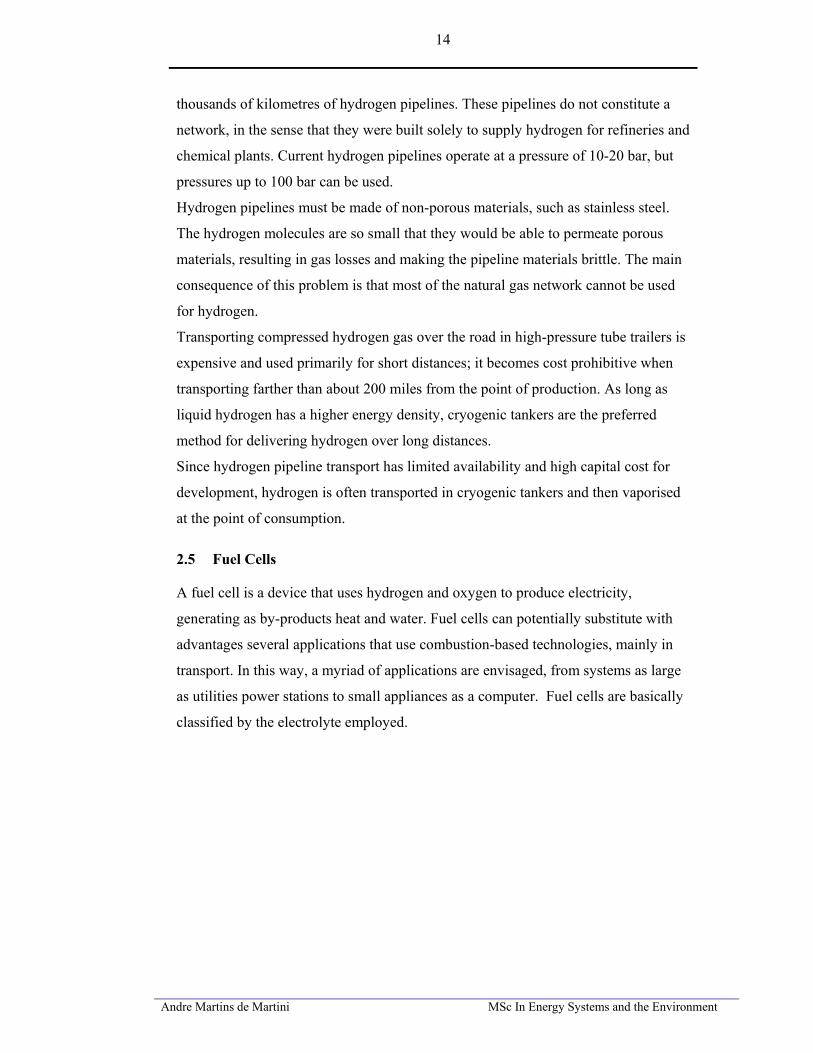
2.5.1 Polymer Electrolyte Membrane Fuel Cells (PEM)
Figure 4:Schematic diagram
of a PEM Fuel Cell [3]
This model is also called proton exchange fuel cells.
They deliver high power density and present lower
weight and volume when compared to other fuel cells.
These fuel cells use a solid polymer as the electrolyte
and porous carbon electrodes containing platinum
catalyst.
They operate in low temperatures (around 80 ºC) and
use pure hydrogen. The catalyst is especially sensitive
to CO poisoning, requiring hydrogen with high
degrees of purity. [3]
For vehicles application, their lifetime is around 2,000 hours. For stationary
applications, they may reach 30,000 hours. [10]
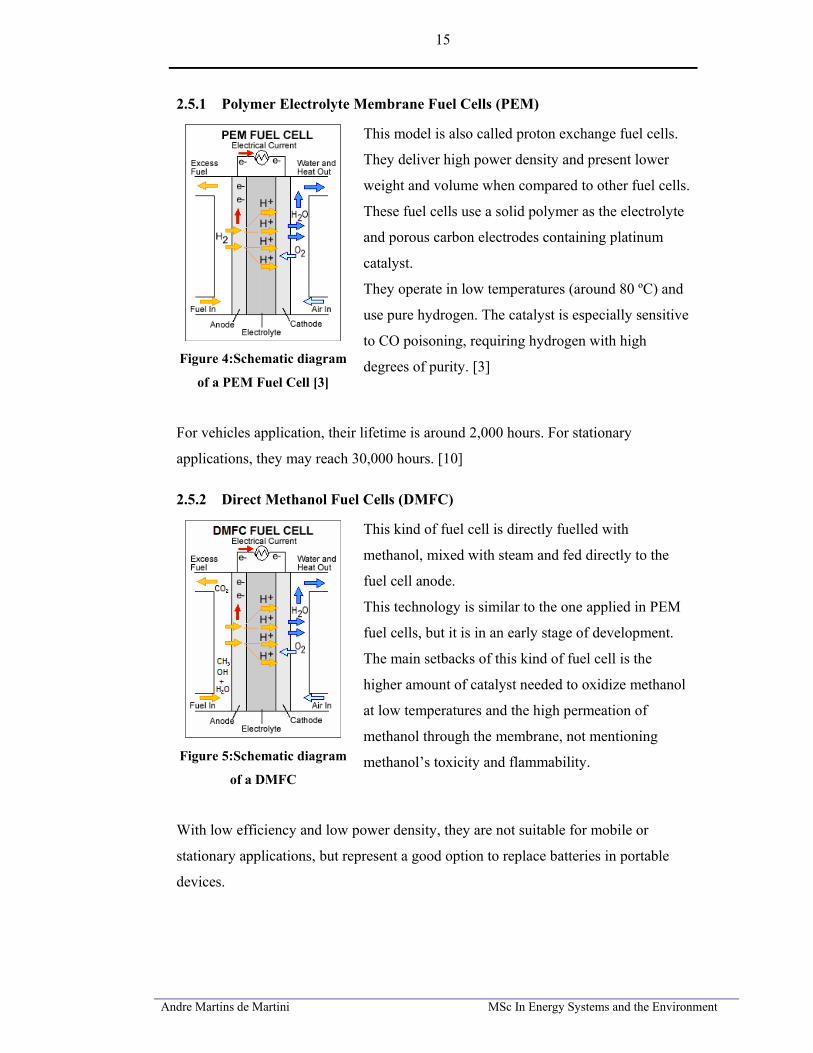
2.5.2 Direct Methanol Fuel Cells (DMFC)
Figure 5:Schematic diagram
of a DMFC
This kind of fuel cell is directly fuelled with
methanol, mixed with steam and fed directly to the
fuel cell anode.
This technology is similar to the one applied in PEM
fuel cells, but it is in an early stage of development.
The main setbacks of this kind of fuel cell is the
higher amount of catalyst needed to oxidize methanol
at low temperatures and the high permeation of
methanol through the membrane, not mentioning
methanol’s toxicity and flammability.
With low efficiency and low power density, they are not suitable for mobile or
stationary applications, but represent a good option to replace batteries in portable
devices.
Andre Martins de Martini MSc In Energy Systems and the Environment
16
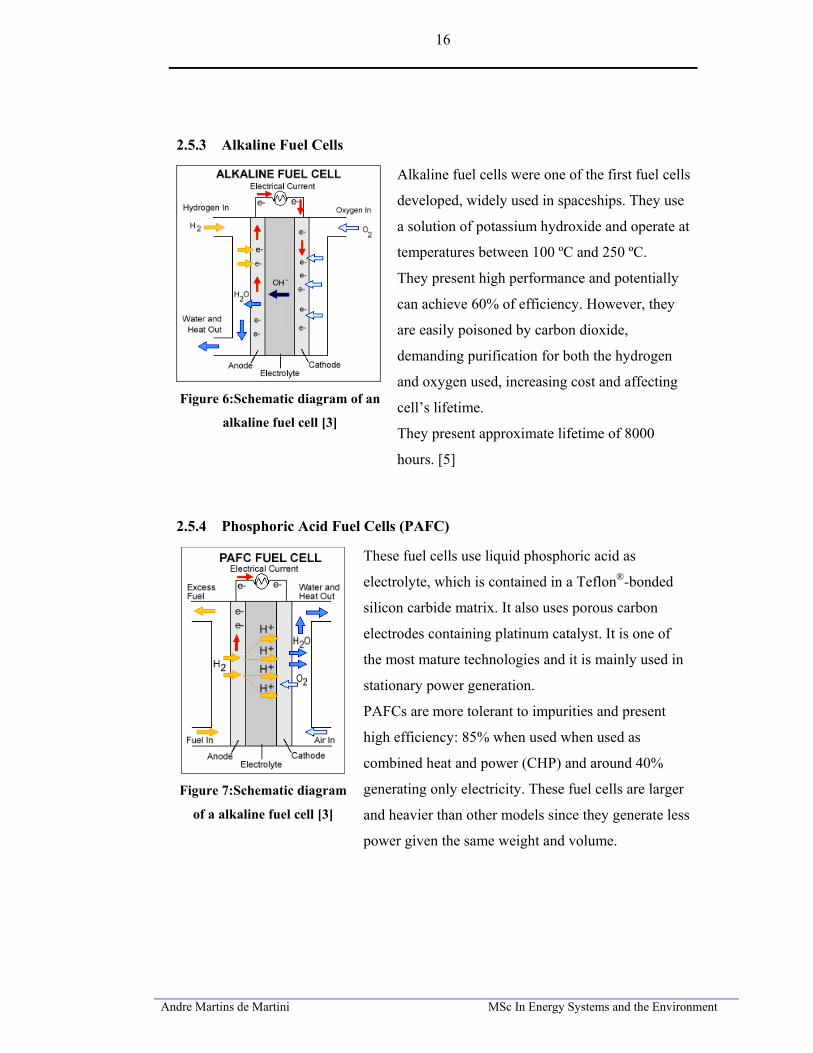
2.5.3 Alkaline Fuel Cells
Figure 6:Schematic diagram of an
alkaline fuel cell [3]
Alkaline fuel cells were one of the first fuel cells
developed, widely used in spaceships. They use
a solution of potassium hydroxide and operate at
temperatures between 100 ºC and 250 ºC.
They present high performance and potentially
can achieve 60% of efficiency. However, they
are easily poisoned by carbon dioxide,
demanding purification for both the hydrogen
and oxygen used, increasing cost and affecting
cell’s lifetime.
They present approximate lifetime of 8000
hours. [5]
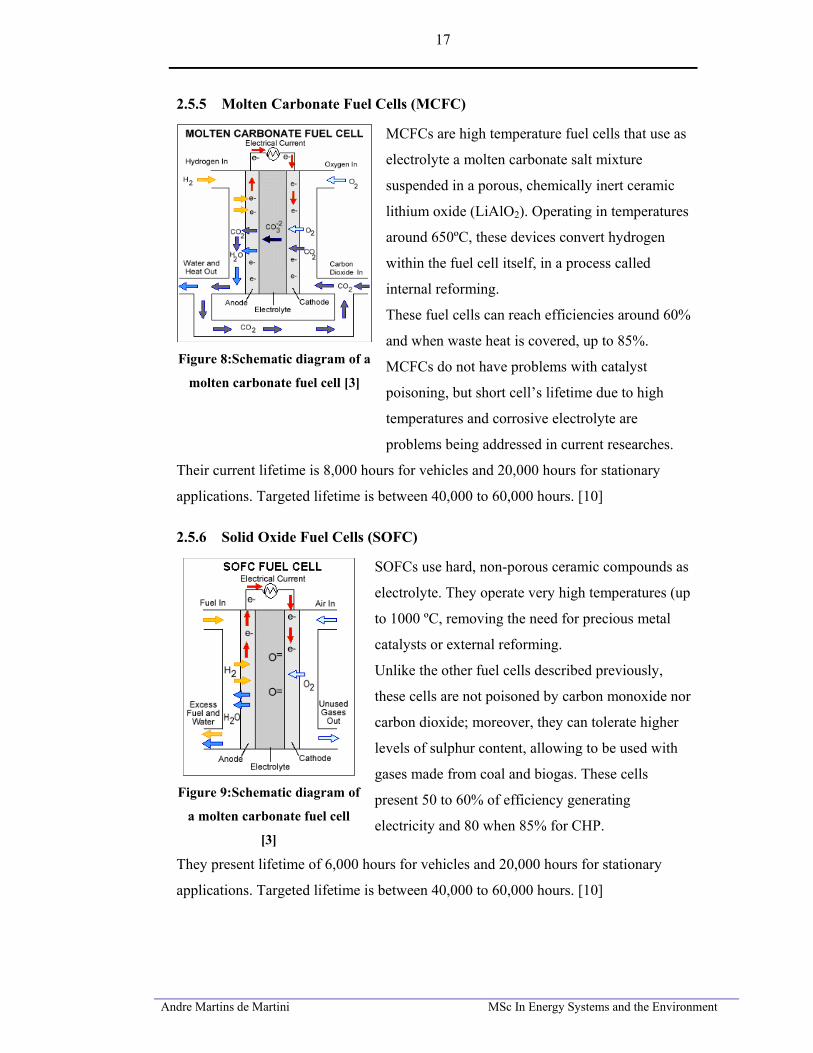
2.5.4 Phosphoric Acid Fuel Cells (PAFC)
Figure 7:Schematic diagram
of a alkaline fuel cell [3]
These fuel cells use liquid phosphoric acid as
electrolyte, which is contained in a Teflon®-bonded
silicon carbide matrix. It also uses porous carbon
electrodes containing platinum catalyst. It is one of
the most mature technologies and it is mainly used in
stationary power generation.
PAFCs are more tolerant to impurities and present
high efficiency: 85% when used when used as
combined heat and power (CHP) and around 40%
generating only electricity. These fuel cells are larger
and heavier than other models since they generate less
power given the same weight and volume.
Andre Martins de Martini MSc In Energy Systems and the Environment
17
2.5.5 Molten Carbonate Fuel Cells (MCFC)
Figure 8:Schematic diagram of a
molten carbonate fuel cell [3]
MCFCs are high temperature fuel cells that use as
electrolyte a molten carbonate salt mixture
suspended in a porous, chemically inert ceramic
lithium oxide (LiAlO2). Operating in temperatures
around 650ºC, these devices convert hydrogen
within the fuel cell itself, in a process called
internal reforming.
These fuel cells can reach efficiencies around 60%
and when waste heat is covered, up to 85%.
MCFCs do not have problems with catalyst
poisoning, but short cell’s lifetime due to high
temperatures and corrosive electrolyte are
problems being addressed in current researches.
Their current lifetime is 8,000 hours for vehicles and 20,000 hours for stationary
applications. Targeted lifetime is between 40,000 to 60,000 hours. [10]
2.5.6 Solid Oxide Fuel Cells (SOFC)
Figure 9:Schematic diagram of
a molten carbonate fuel cell
[3]
SOFCs use hard, non-porous ceramic compounds as
electrolyte. They operate very high temperatures (up
to 1000 ºC, removing the need for precious metal
catalysts or external reforming.
Unlike the other fuel cells described previously,
these cells are not poisoned by carbon monoxide nor
carbon dioxide; moreover, they can tolerate higher
levels of sulphur content, allowing to be used with
gases made from coal and biogas. These cells
present 50 to 60% of efficiency generating
electricity and 80 when 85% for CHP.
They present lifetime of 6,000 hours for vehicles and 20,000 hours for stationary
applications. Targeted lifetime is between 40,000 to 60,000 hours. [10]
Andre Martins de Martini MSc In Energy Systems and the Environment
18
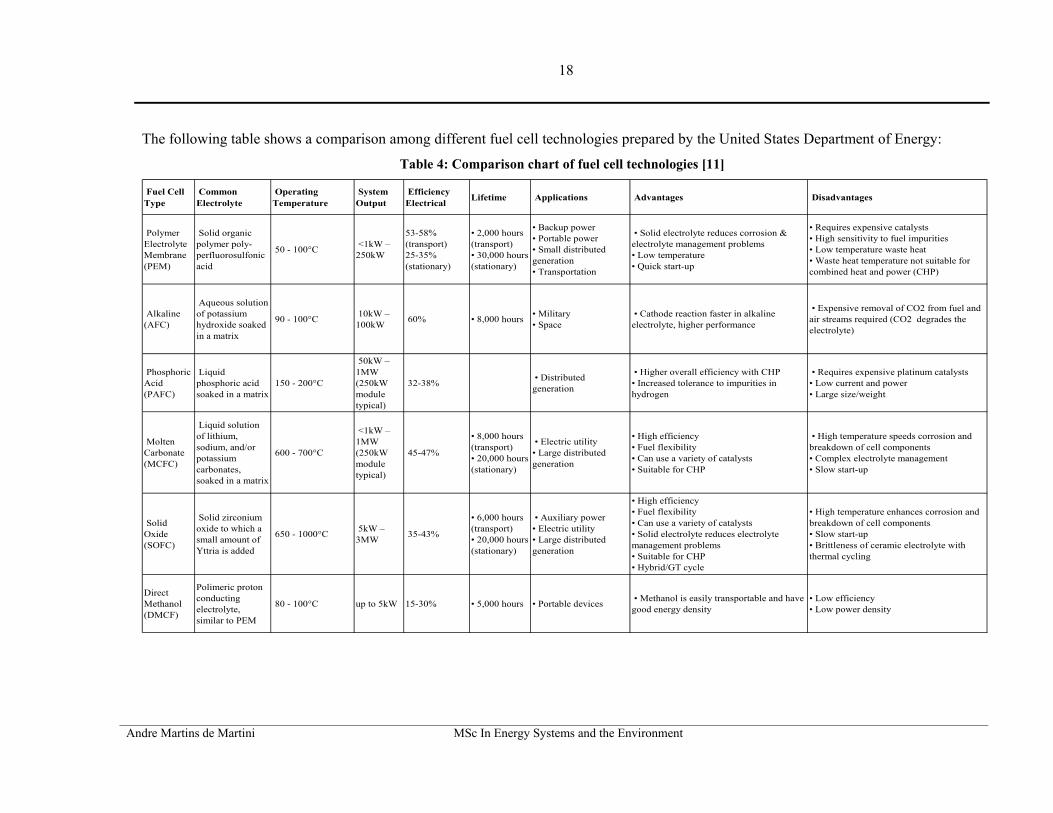
The following table shows a comparison among different fuel cell technologies prepared by the United States Department of Energy:
Table 4: Comparison chart of fuel cell technologies [11]
Fuel Cell Type
Common Electrolyte
Operating Temperature
System Output
Efficiency Electrical Lifetime Applications Advantages Disadvantages
Polymer Electrolyte Membrane (PEM)
Solid organic polymer poly-perfluorosulfonic acid
50 - 100°C <1kW – 250kW
53-58% (transport)25-35% (stationary)
• 2,000 hours (transport)• 30,000 hours (stationary)
• Backup power • Portable power• Small distributed generation• Transportation
• Solid electrolyte reduces corrosion & electrolyte management problems• Low temperature• Quick start-up
• Requires expensive catalysts• High sensitivity to fuel impurities• Low temperature waste heat• Waste heat temperature not suitable for combined heat and power (CHP)
Alkaline(AFC)
Aqueous solution of potassium hydroxide soaked in a matrix
90 - 100°C 10kW – 100kW 60% • 8,000 hours • Military
• Space • Cathode reaction faster in alkaline electrolyte, higher performance
• Expensive removal of CO2 from fuel and air streams required (CO2 degrades the electrolyte)
Phosphoric Acid(PAFC)
Liquid phosphoric acid soaked in a matrix
150 - 200°C
50kW – 1MW (250kW module typical)
32-38% • Distributed generation
• Higher overall efficiency with CHP• Increased tolerance to impurities in hydrogen
• Requires expensive platinum catalysts• Low current and power• Large size/weight
Molten Carbonate(MCFC)
Liquid solution of lithium, sodium, and/or potassium carbonates, soaked in a matrix
600 - 700°C
<1kW – 1MW (250kW module typical)
45-47%
• 8,000 hours (transport)• 20,000 hours (stationary)
• Electric utility• Large distributed generation
• High efficiency• Fuel flexibility• Can use a variety of catalysts• Suitable for CHP
• High temperature speeds corrosion and breakdown of cell components• Complex electrolyte management• Slow start-up
Solid Oxide(SOFC)
Solid zirconium oxide to which a small amount of Yttria is added
650 - 1000°C 5kW – 3MW 35-43%
• 6,000 hours (transport)• 20,000 hours (stationary)
• Auxiliary power• Electric utility• Large distributed generation
• High efficiency• Fuel flexibility• Can use a variety of catalysts• Solid electrolyte reduces electrolyte management problems• Suitable for CHP• Hybrid/GT cycle
• High temperature enhances corrosion and breakdown of cell components• Slow start-up• Brittleness of ceramic electrolyte with thermal cycling
Direct Methanol(DMCF)
Polimeric proton conducting electrolyte, similar to PEM
80 - 100°C up to 5kW 15-30% • 5,000 hours • Portable devices • Methanol is easily transportable and have good energy density
• Low efficiency• Low power density
André Martins de Martini MSc in Energy Systems and the Environment
19
2.5.7 Main fuel cell applications
The possibility to generate clean energy with high efficiency and in a sustainable
way made fuel cell development the focus of research of many industries.
Fuel cells have broad application potential in both transport and electrical power
generation.
All multinational vehicle manufacturers are investing considerable amounts of
money in hydrogen-fuelled vehicles, perceiving low emissions, high efficiency, low
level and vibration noises as perfect features for vehicle applications.
Many manufacturers consider a period of 5 to 10 years as a reasonable timescale for
a commercial availability of fuel cell fuelled cars. Nevertheless, some prototypes of
passenger cars and buses are already available.
The main setbacks for vehicle applications are reliability, mileage range, hazard due
to hydrogen leakages in enclosed spaces and vehicle lifetime.
Marine propulsion is also considered as an application for fuel cells. The efficiency
of electric generation and the stealth capabilities of future fuel cell powered ships
have called the attention of navies. Nevertheless, the same barriers encountered in
fuel cells for vehicles are also present here.
Fuel cells can also play an interesting role in stationary power generation. They can
be used in backup power units, grid management (to produce electricity from stored
hydrogen, for example), to generate power for remote locations and stand-alone
systems, cogeneration for buildings and public premises.
The most promising fuel cell technologies for larger systems are molten carbonate
and solid oxide fuel cells; phosphoric acid ones are already in use for large scale
applications but have been losing market during the last few years. Small domestic
CHP systems seem to be one of the most feasible applications for fuel cells,
considering that steady supply can be provided properly.
Considering portable power generation, fuel cells have the potential to deliver
electrical power for much longer periods than batteries. Small portable electronic and
electrical equipment can be a niche for further development. Nowadays for example,
some electric wheelchairs already use PEM fuel cells.
André Martins de Martini MSc in Energy Systems and the Environment
20
2.6 Internal combustion engines and other hydrogen combustion applications
Internal combustion hydrogen engines are considered a stepping-stone towards fuel
cell powered vehicles. This technology can be developed faster and with more
reliability that fuel cells, since it only requires modifications to an existing well-
developed technology.
As long as hydrogen has wider flammability range and lower ignition energy, some
modifications in the engine must be made in order to prevent pre-ignition.
Vehicles using internal combustion engines are now in demonstration phase and
present good efficiency and low emissions.
Although the fact that hydrogen combustion does not produce any CO2, when
burning hydrogen with air some NOx compounds are produced. These nitrogen
oxides are created due to the high temperatures encountered in the combustion
chamber during combustion. These emissions are controlled by the increase of
air/fuel ratio in these engines, with a consequent power loss. [12]
Another approach to internal combustion engines is the use of hydrogen as an
additive to hydrocarbon fuels. The addition of hydrogen in general has a
disproportionate effect on emissions and overall efficiency. “Hydrogen’s low
ignition energy limit and high burning speed makes the hydro-gen/hydrocarbon
mixture easier to ignite, reducing misfire and thereby improving emissions,
performance and fuel economy. Regarding power output, hydrogen augments the
mixture’s energy density at lean mixtures by increasing the hydrogen-to-carbon ratio,
and thereby improves torque at wide-open throttle conditions.” [12]
The most common blend of hydrogen is with compressed natural gas, since they can
be stored in the same vessel. If used with different fuels, in most cases hydrogen has
to be stored separated and mixed in gaseous state immediately before ignition.
One commercially available blend is a gas mixture called Hytane®, containing 20%
of hydrogen and 80% of natural gas. The most interesting aspect of this blend is that
no modifications are required to the engine.
Hydrogen can potentially be used as a combustion fuel for industrial furnaces and
domestic cooking or heating. Considering its different properties, an adaptation for
hydrogen would require at least a complete new burner unit. Although theoretically
André Martins de Martini MSc in Energy Systems and the Environment
21
possible, there is no commercial experience of hydrogen as cooking fuel or for
domestic boiler operation
2.7 Economic aspects
Even with the high efficiencies and low emissions of its technologies, hydrogen
economy will turn into reality when the production and operation costs match the
cost levels of current and competing technologies.
In many articles, authors refer to the “chicken-or-egg” dilemma of hydrogen
infrastructure: technologies would achieve commercial feasibility with a good and
low cost distribution network but a distribution network would only be feasible with
available market and demand.
Recent studies show that hydrogen applications can take more than 30 years to
achieve expressive penetration, considering favourable conditions. The main
assumptions for this forecast are the adoption of CO2 restriction policies and
significant cost reduction in basic technologies. [5]
2.7.1 Hydrogen Production
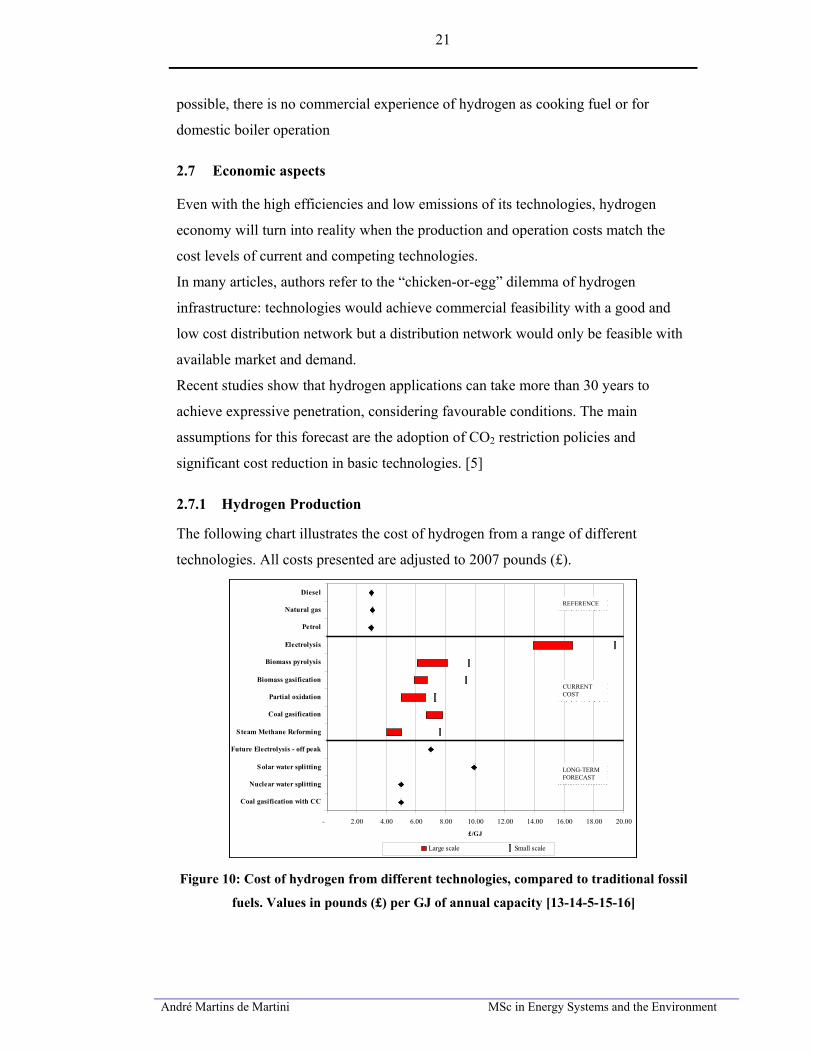
The following chart illustrates the cost of hydrogen from a range of different
technologies. All costs presented are adjusted to 2007 pounds (£).
- 2.00 4.00 6.00 8.00 10.00 12.00 14.00 16.00 18.00 20.00
Coal gasification with CC
Nuclear water splitting
Solar water splitting
Future Electrolysis - off peak
Steam Methane Reforming
Coal gasification
Partial oxidation
Biomass gasification
Biomass pyrolysis
Electrolysis
Petrol
Natural gas
Diesel
£/GJ
Large scale Small scale
REFERENCEREFERENCE
LONG-TERM FORECAST
LONG-TERM FORECAST
CURRENT COST
CURRENT COST
- 2.00 4.00 6.00 8.00 10.00 12.00 14.00 16.00 18.00 20.00
Coal gasification with CC
Nuclear water splitting
Solar water splitting
Future Electrolysis - off peak
Steam Methane Reforming
Coal gasification
Partial oxidation
Biomass gasification
Biomass pyrolysis
Electrolysis
Petrol
Natural gas
Diesel
£/GJ
Large scale Small scale
REFERENCEREFERENCE
LONG-TERM FORECAST
LONG-TERM FORECAST
CURRENT COST
CURRENT COST
Figure 10: Cost of hydrogen from different technologies, compared to traditional fossil
fuels. Values in pounds (£) per GJ of annual capacity [13-14-5-15-16]
André Martins de Martini MSc in Energy Systems and the Environment
22
As can be seen in the graph, large plants can reach cheaper production due to
economies of scale, not reaching the cost levels of traditional fossil fuels though.
For both Steam Reforming and Partial oxidation, the main cost driver is the
feedstock: the cost of methane or natural gas accounts for over than 50% of the total
cost.
With reference to coal gasification, cost of feedstock and solid waste disposal are the
most significant costs. This cost can increase if carbon dioxide capture is considered.
Biomass based technologies present the same dependence upon the cost of feedstock.
Finally, electrolysis presents the higher cost both for large and small scale. The cost
of production is heavily influenced by electrical efficiency of the conversion and the
cost of electricity.
2.7.2 Hydrogen storage
For each technology considered, cost of processing (compression or liquefaction, for
instance) and vessels must be considered.
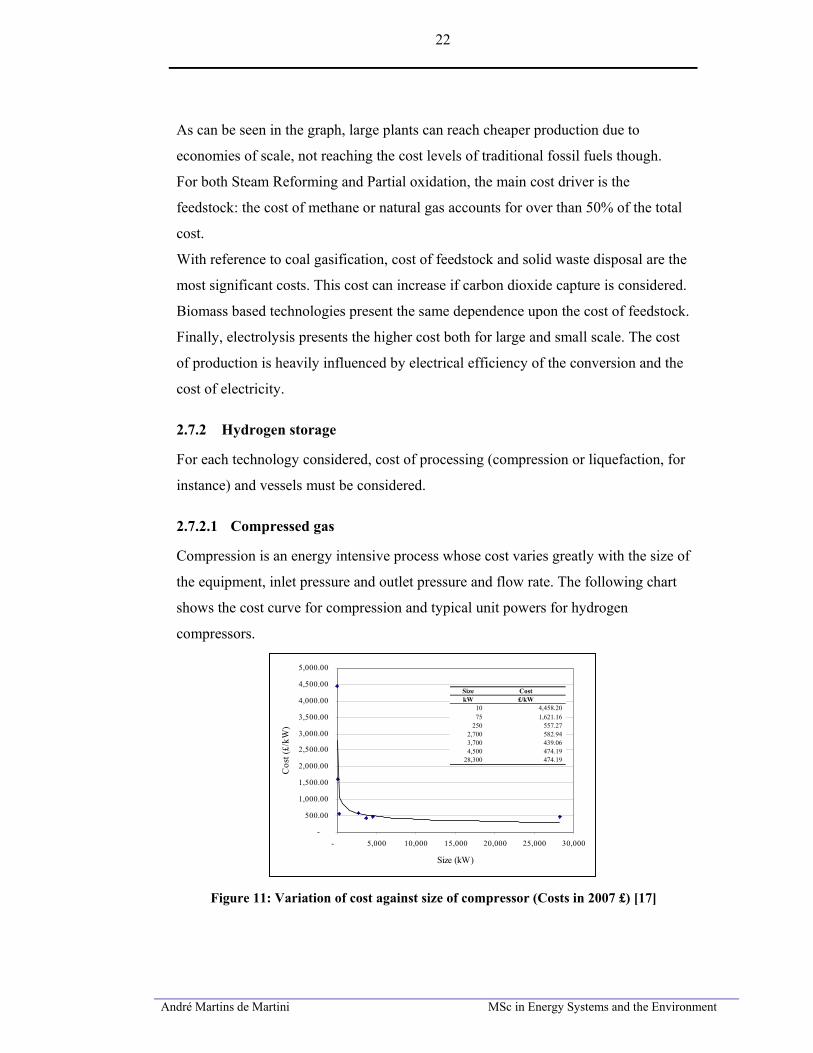
2.7.2.1 Compressed gas
Compression is an energy intensive process whose cost varies greatly with the size of
the equipment, inlet pressure and outlet pressure and flow rate. The following chart
shows the cost curve for compression and typical unit powers for hydrogen
compressors.
-
500.00
1,000.00
1,500.00
2,000.00
2,500.00
3,000.00
3,500.00
4,000.00
4,500.00
5,000.00
- 5,000 10,000 15,000 20,000 25,000 30,000
Size (kW)
Cos
t (£/
kW)
Size CostkW £/kW
10 4,458.20 75 1,621.16
250 557.27 2,700 582.94 3,700 439.06 4,500 474.19
28,300 474.19
-
500.00
1,000.00
1,500.00
2,000.00
2,500.00
3,000.00
3,500.00
4,000.00
4,500.00
5,000.00
- 5,000 10,000 15,000 20,000 25,000 30,000
Size (kW)
Cos
t (£/
kW)
Size CostkW £/kW
10 4,458.20 75 1,621.16
250 557.27 2,700 582.94 3,700 439.06 4,500 474.19
28,300 474.19
Figure 11: Variation of cost against size of compressor (Costs in 2007 £) [17]
André Martins de Martini MSc in Energy Systems and the Environment
23
The table below presents the efficiency of typical units
Table 5: Efficiency of typical compression units [18]
Inlet-Outlet (psig) Inlet-Outlet (bar) Adiabatic Efficiency Compression Energy300 - 1,000 20 - 70 70-80% 0.6 -0.7 kWhe/kg100 - 7,000 7 - 480 50-70% 2.6 -3.6 kWhe/kg
The cost of vessels is proportional to the quantity of material and typical values are
around £1100/kg H2 to £1600/kg H2. [5]
2.7.2.2 Liquid hydrogen
By far the compression is the largest operating expense for liquefaction. It is an
energy intensive process, demanding from 11kWh/kg, around 30% of its energy
content. [17]
Cost of liquefaction varies greatly in the literature. These costs are high, but
significant economies of scale can be achieved.
Liquefaction investment cost is assumed in 2005 as £73.5/GJ of annual capacity.
However, very large systems (over 30PJ/yr) can achieve £3.45/GJ. [5]
Although operating under low pressures, liquid hydrogen vessels have high capital
costs due to the insulation required to minimise boil-off. Small vessels can be quite
expensive, besides having greater hydrogen losses. The cost of cryogenic storage can
vary from 13 to 500 £/kg of hydrogen of capacity, depending on the size of the
vessel. [17]
2.7.3 Transport and distribution
The investment cost for hydrogen pipelines of a given diameter is about twice that of
natural gas pipelines. Considering the difference of energy density between hydrogen
and natural gas, a hydrogen pipeline would cost six times the cost of a natural gas
pipeline with the same energy capacity.
The following chart illustrates a comparison between natural gas and hydrogen
pipelines.
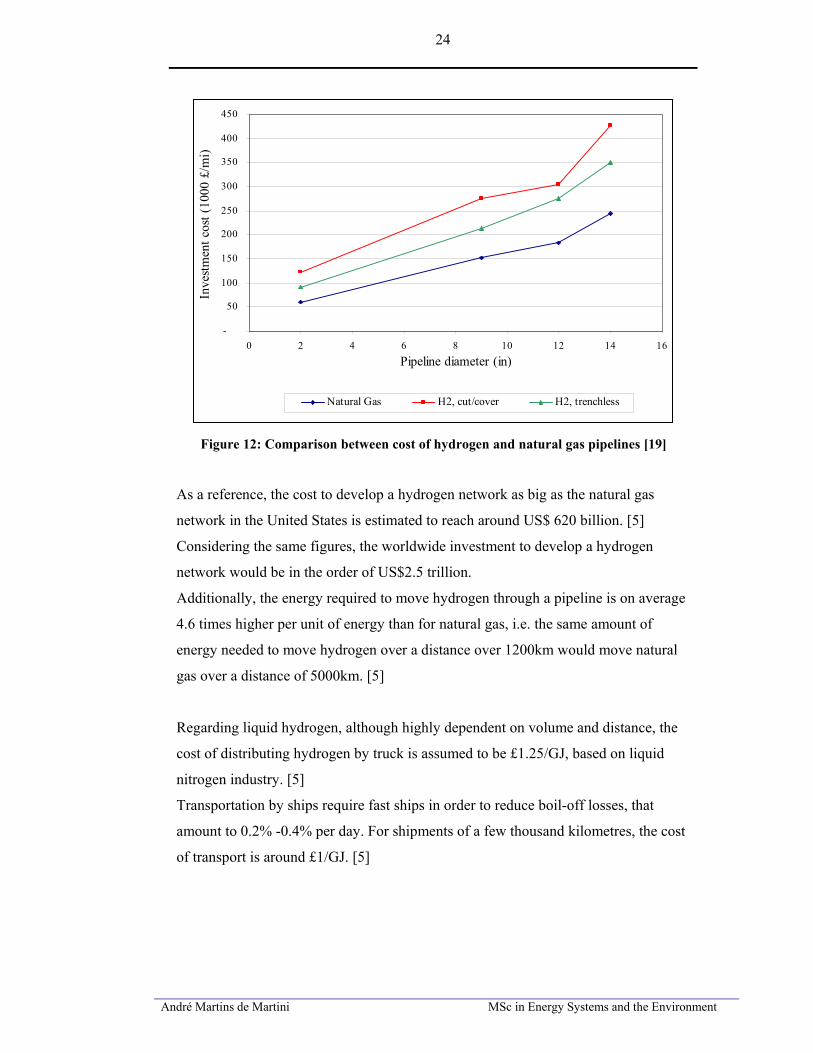
André Martins de Martini MSc in Energy Systems and the Environment
24
-
50
100
150
200
250
300
350
400
450
0 2 4 6 8 10 12 14 16Pipeline diameter (in)
Inve
stmen
t cos
t (10
00 £
/mi)
Natural Gas H2, cut/cover H2, trenchless
Figure 12: Comparison between cost of hydrogen and natural gas pipelines [19]
As a reference, the cost to develop a hydrogen network as big as the natural gas
network in the United States is estimated to reach around US$ 620 billion. [5]
Considering the same figures, the worldwide investment to develop a hydrogen
network would be in the order of US$2.5 trillion.
Additionally, the energy required to move hydrogen through a pipeline is on average
4.6 times higher per unit of energy than for natural gas, i.e. the same amount of
energy needed to move hydrogen over a distance over 1200km would move natural
gas over a distance of 5000km. [5]
Regarding liquid hydrogen, although highly dependent on volume and distance, the
cost of distributing hydrogen by truck is assumed to be £1.25/GJ, based on liquid
nitrogen industry. [5]
Transportation by ships require fast ships in order to reduce boil-off losses, that
amount to 0.2% -0.4% per day. For shipments of a few thousand kilometres, the cost
of transport is around £1/GJ. [5]
André Martins de Martini MSc in Energy Systems and the Environment
25
2.7.4 Fuel Cells
According to the latest report from the International Energy Agency [5], to achieve
commercial feasibility, fuel cell for vehicles must achieve 10 to 50 times cost
reduction, while stationary fuel cells need 5 to 10 times cost reduction. This
ambitious target can be achieved, if possible, by economies of scale and mass
production, technology learning and development of new materials and concepts.
For vehicle applications, current prototypes reached the cost of £1000/kW, which
would potentially lead to a cost of £50/kW to £100/kW in mass production.[5]
These figures, however, are far from cost target: the current cost of ICE engines,
approximately £25/kW.
The main cost of maintenance is the replacement of fuel cell stack after its lifetime.
As a rule of thumb, a fuel cell stack costs one third of a complete fuel cell. [20]
2.7.4.1 PEM fuel cell
In general, the cost of a PEM fuel cell can be split into fuel cell stack and auxiliary
equipment that is necessary for fuel cell operation.
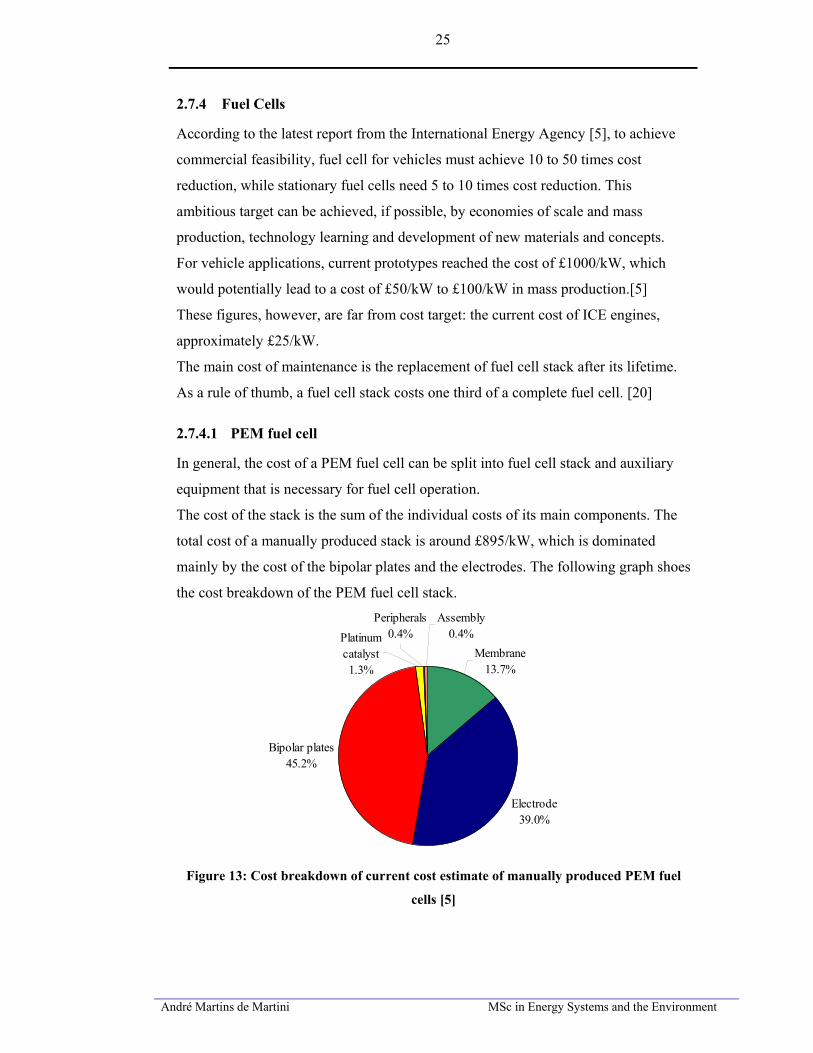
The cost of the stack is the sum of the individual costs of its main components. The
total cost of a manually produced stack is around £895/kW, which is dominated
mainly by the cost of the bipolar plates and the electrodes. The following graph shoes
the cost breakdown of the PEM fuel cell stack.
Electrode39.0%
Bipolar plates45.2%
Assembly0.4%Platinum
catalyst1.3%
Membrane13.7%
Peripherals0.4%
Figure 13: Cost breakdown of current cost estimate of manually produced PEM fuel
cells [5]
André Martins de Martini MSc in Energy Systems and the Environment
26
Mass production and further improvements can lower this value for approximately
£50/kW. [5]
The auxiliary system comprises the power electronics required for operation of the
fuel cell: AC/DC converters, inverters, control electronics, etc. The cost of this
system is estimated from £500/kW to £750kW, but dramatic reductions are expected
with mass production. [5]
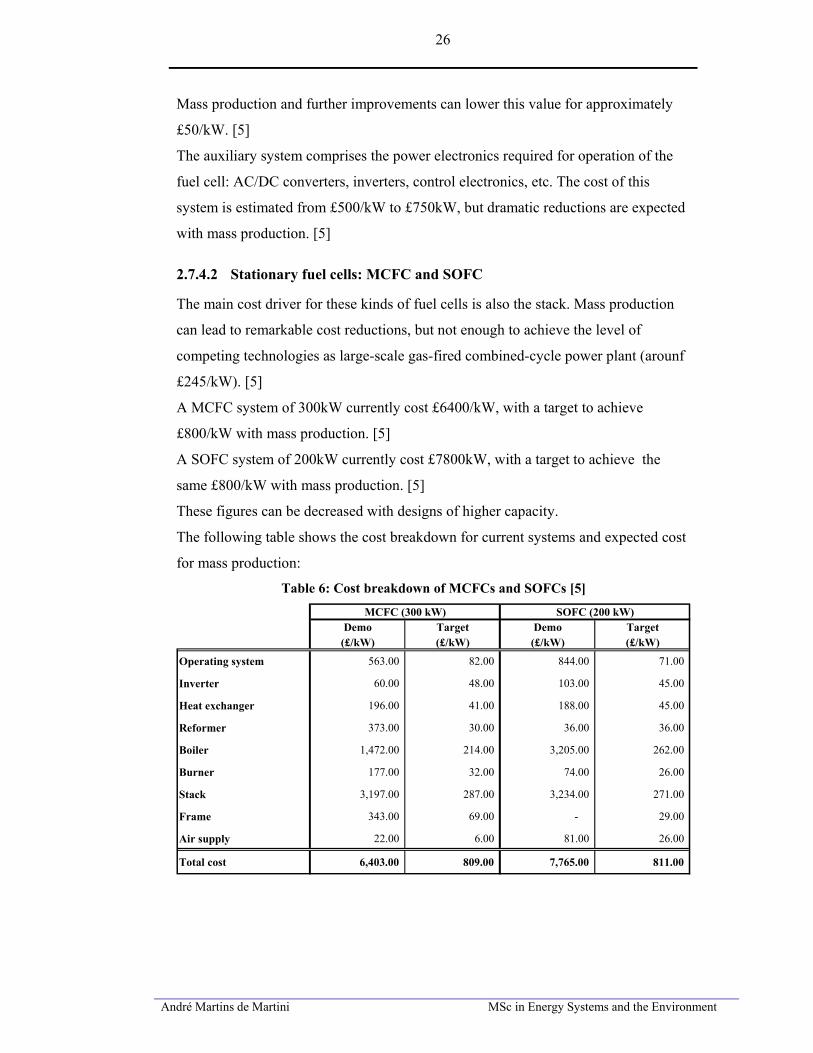
2.7.4.2 Stationary fuel cells: MCFC and SOFC
The main cost driver for these kinds of fuel cells is also the stack. Mass production
can lead to remarkable cost reductions, but not enough to achieve the level of
competing technologies as large-scale gas-fired combined-cycle power plant (arounf
£245/kW). [5]
A MCFC system of 300kW currently cost £6400/kW, with a target to achieve
£800/kW with mass production. [5]
A SOFC system of 200kW currently cost £7800kW, with a target to achieve the
same £800/kW with mass production. [5]
These figures can be decreased with designs of higher capacity.
The following table shows the cost breakdown for current systems and expected cost
for mass production:
Table 6: Cost breakdown of MCFCs and SOFCs [5]
MCFC (300 kW) SOFC (200 kW)Demo Target Demo Target
(£/kW) (£/kW) (£/kW) (£/kW)
Operating system 563.00 82.00 844.00 71.00
Inverter 60.00 48.00 103.00 45.00
Heat exchanger 196.00 41.00 188.00 45.00
Reformer 373.00 30.00 36.00 36.00
Boiler 1,472.00 214.00 3,205.00 262.00
Burner 177.00 32.00 74.00 26.00
Stack 3,197.00 287.00 3,234.00 271.00
Frame 343.00 69.00 - 29.00
Air supply 22.00 6.00 81.00 26.00
Total cost 6,403.00 809.00 7,765.00 811.00
André Martins de Martini MSc in Energy Systems and the Environment
27
2.8 Current demonstration projects
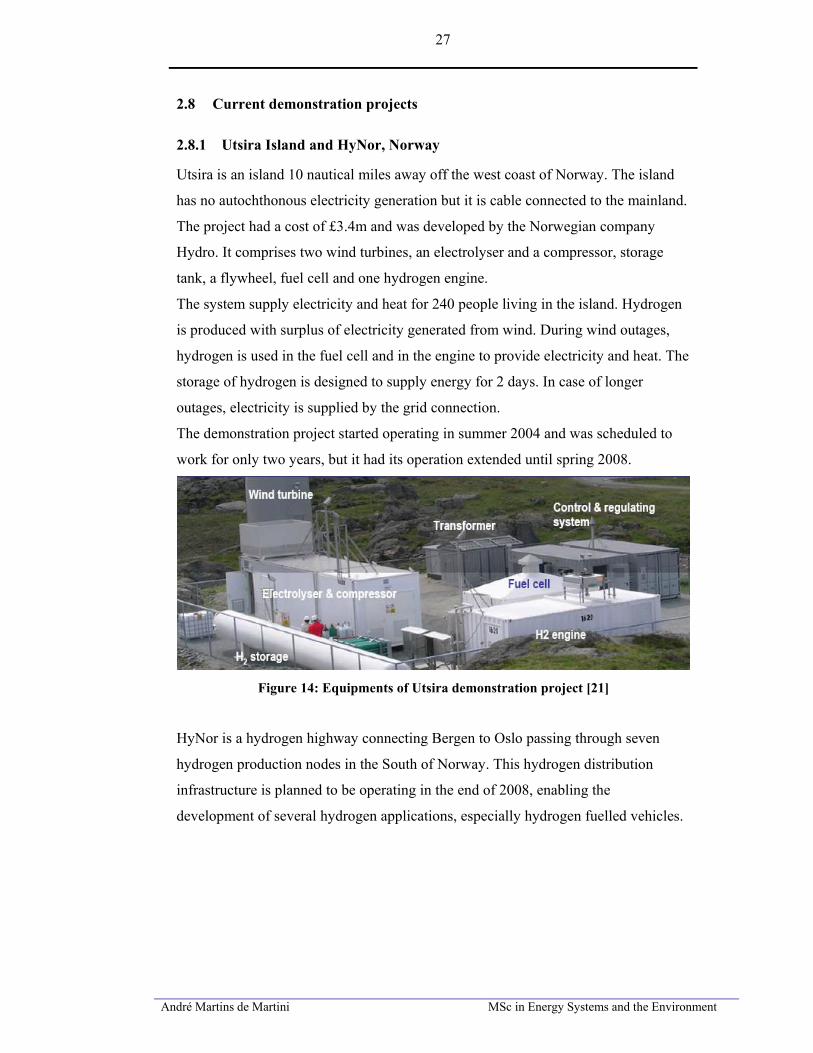
2.8.1 Utsira Island and HyNor, Norway
Utsira is an island 10 nautical miles away off the west coast of Norway. The island
has no autochthonous electricity generation but it is cable connected to the mainland.
The project had a cost of £3.4m and was developed by the Norwegian company
Hydro. It comprises two wind turbines, an electrolyser and a compressor, storage
tank, a flywheel, fuel cell and one hydrogen engine.
The system supply electricity and heat for 240 people living in the island. Hydrogen
is produced with surplus of electricity generated from wind. During wind outages,
hydrogen is used in the fuel cell and in the engine to provide electricity and heat. The
storage of hydrogen is designed to supply energy for 2 days. In case of longer
outages, electricity is supplied by the grid connection.
The demonstration project started operating in summer 2004 and was scheduled to
work for only two years, but it had its operation extended until spring 2008.
Figure 14: Equipments of Utsira demonstration project [21]
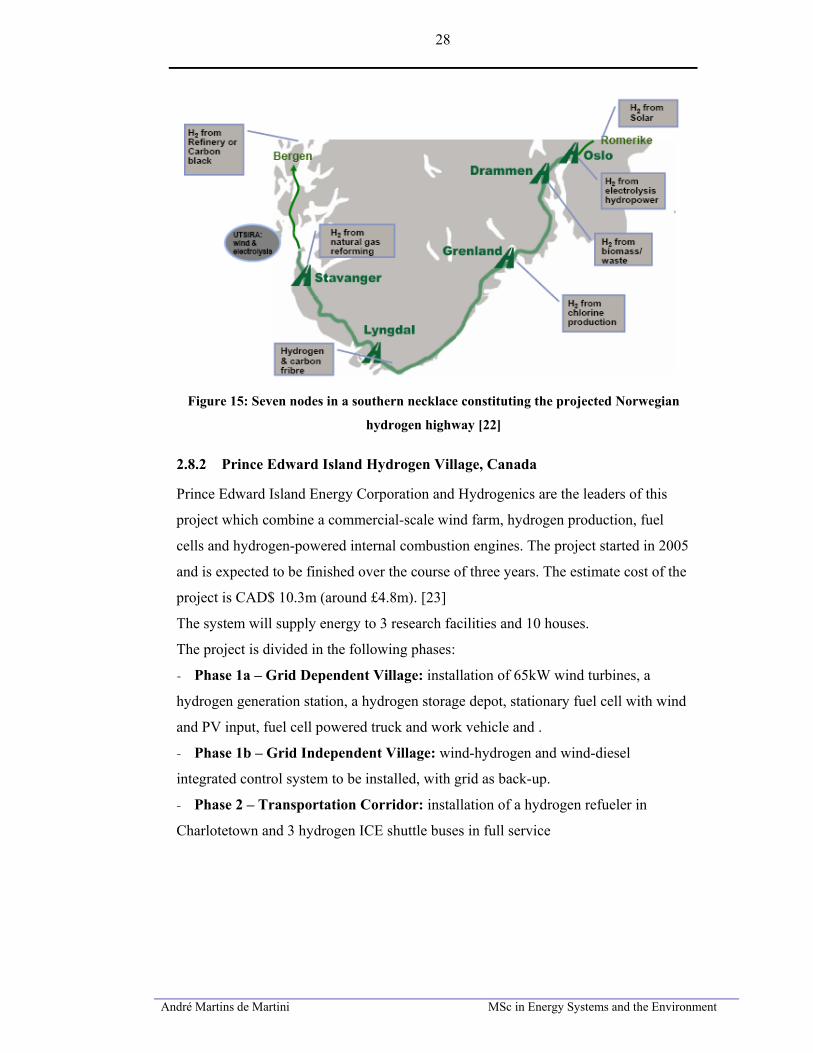
HyNor is a hydrogen highway connecting Bergen to Oslo passing through seven
hydrogen production nodes in the South of Norway. This hydrogen distribution
infrastructure is planned to be operating in the end of 2008, enabling the
development of several hydrogen applications, especially hydrogen fuelled vehicles.
André Martins de Martini MSc in Energy Systems and the Environment
28
Figure 15: Seven nodes in a southern necklace constituting the projected Norwegian
hydrogen highway [22]
2.8.2 Prince Edward Island Hydrogen Village, Canada
Prince Edward Island Energy Corporation and Hydrogenics are the leaders of this
project which combine a commercial-scale wind farm, hydrogen production, fuel
cells and hydrogen-powered internal combustion engines. The project started in 2005
and is expected to be finished over the course of three years. The estimate cost of the
project is CAD$ 10.3m (around £4.8m). [23]
The system will supply energy to 3 research facilities and 10 houses.
The project is divided in the following phases:
- Phase 1a – Grid Dependent Village: installation of 65kW wind turbines, a
hydrogen generation station, a hydrogen storage depot, stationary fuel cell with wind
and PV input, fuel cell powered truck and work vehicle and .
- Phase 1b – Grid Independent Village: wind-hydrogen and wind-diesel
integrated control system to be installed, with grid as back-up.
- Phase 2 – Transportation Corridor: installation of a hydrogen refueler in
Charlotetown and 3 hydrogen ICE shuttle buses in full service
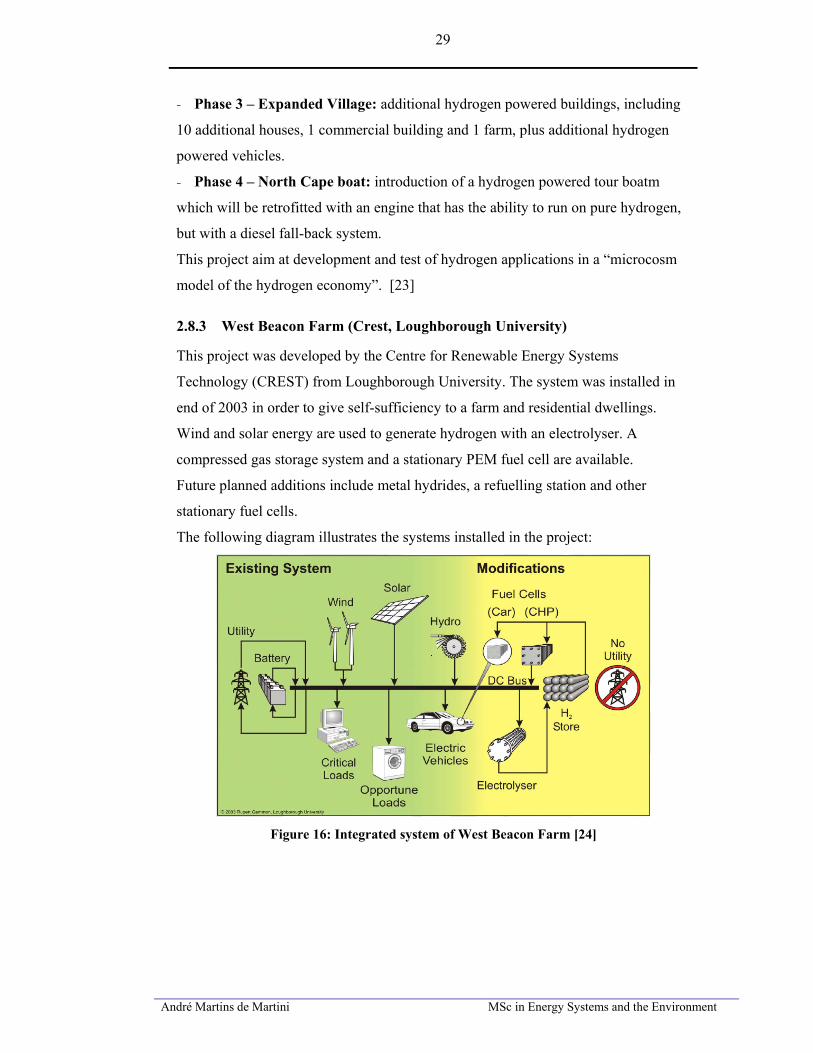
André Martins de Martini MSc in Energy Systems and the Environment
29
- Phase 3 – Expanded Village: additional hydrogen powered buildings, including
10 additional houses, 1 commercial building and 1 farm, plus additional hydrogen
powered vehicles.
- Phase 4 – North Cape boat: introduction of a hydrogen powered tour boatm
which will be retrofitted with an engine that has the ability to run on pure hydrogen,
but with a diesel fall-back system.
This project aim at development and test of hydrogen applications in a “microcosm
model of the hydrogen economy”. [23]
2.8.3 West Beacon Farm (Crest, Loughborough University)
This project was developed by the Centre for Renewable Energy Systems
Technology (CREST) from Loughborough University. The system was installed in
end of 2003 in order to give self-sufficiency to a farm and residential dwellings.
Wind and solar energy are used to generate hydrogen with an electrolyser. A
compressed gas storage system and a stationary PEM fuel cell are available.
Future planned additions include metal hydrides, a refuelling station and other
stationary fuel cells.
The following diagram illustrates the systems installed in the project:
Figure 16: Integrated system of West Beacon Farm [24]
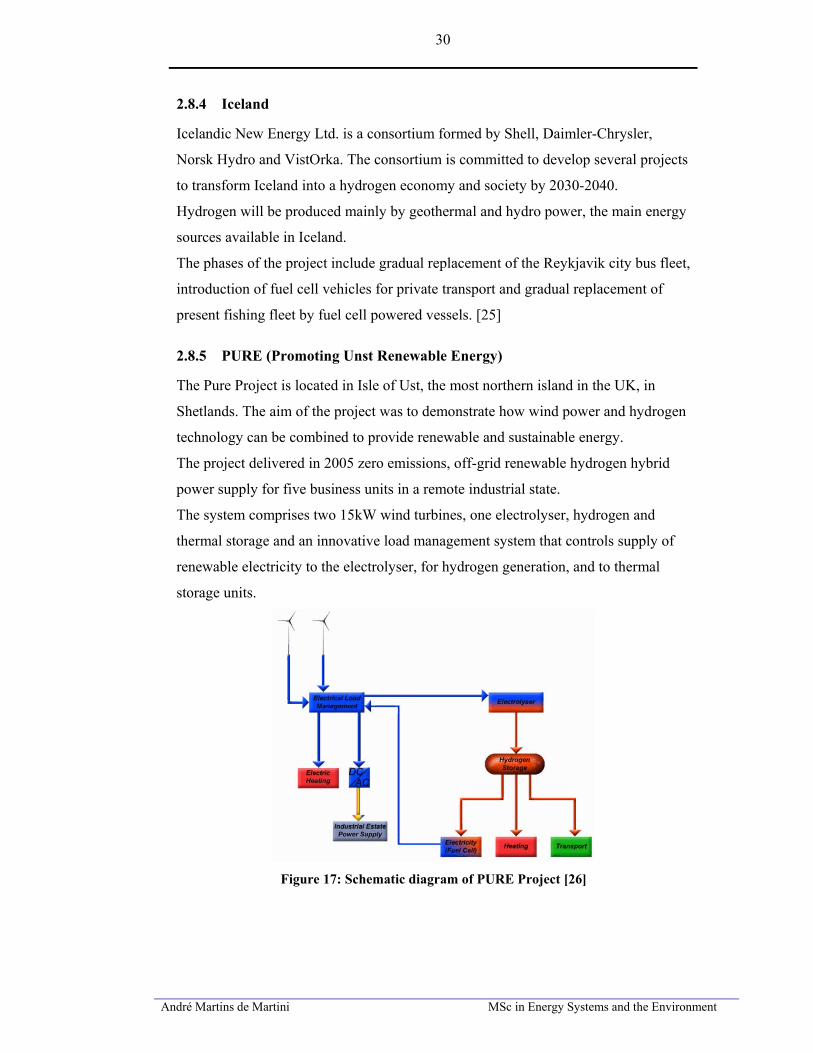
André Martins de Martini MSc in Energy Systems and the Environment
30
2.8.4 Iceland
Icelandic New Energy Ltd. is a consortium formed by Shell, Daimler-Chrysler,
Norsk Hydro and VistOrka. The consortium is committed to develop several projects
to transform Iceland into a hydrogen economy and society by 2030-2040.
Hydrogen will be produced mainly by geothermal and hydro power, the main energy
sources available in Iceland.
The phases of the project include gradual replacement of the Reykjavik city bus fleet,
introduction of fuel cell vehicles for private transport and gradual replacement of
present fishing fleet by fuel cell powered vessels. [25]
2.8.5 PURE (Promoting Unst Renewable Energy)
The Pure Project is located in Isle of Ust, the most northern island in the UK, in
Shetlands. The aim of the project was to demonstrate how wind power and hydrogen
technology can be combined to provide renewable and sustainable energy.
The project delivered in 2005 zero emissions, off-grid renewable hydrogen hybrid
power supply for five business units in a remote industrial state.
The system comprises two 15kW wind turbines, one electrolyser, hydrogen and
thermal storage and an innovative load management system that controls supply of
renewable electricity to the electrolyser, for hydrogen generation, and to thermal
storage units.
Figure 17: Schematic diagram of PURE Project [26]
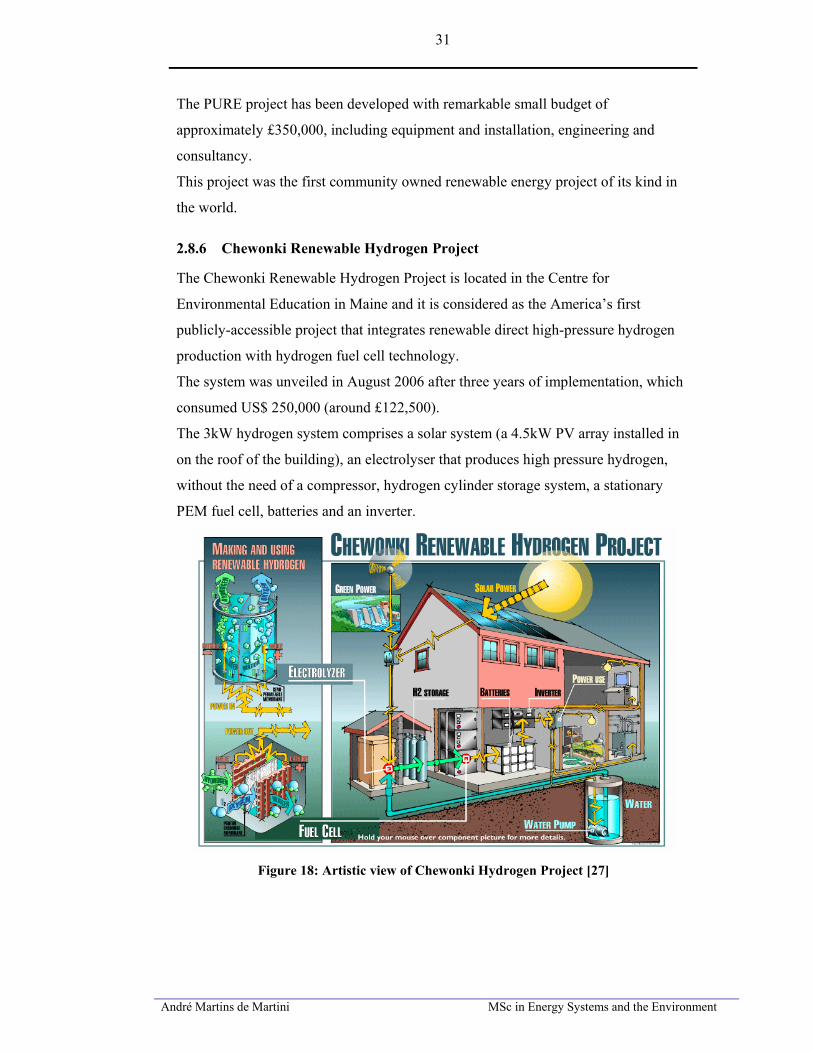
André Martins de Martini MSc in Energy Systems and the Environment
31
The PURE project has been developed with remarkable small budget of
approximately £350,000, including equipment and installation, engineering and
consultancy.
This project was the first community owned renewable energy project of its kind in
the world.
2.8.6 Chewonki Renewable Hydrogen Project
The Chewonki Renewable Hydrogen Project is located in the Centre for
Environmental Education in Maine and it is considered as the America’s first
publicly-accessible project that integrates renewable direct high-pressure hydrogen
production with hydrogen fuel cell technology.
The system was unveiled in August 2006 after three years of implementation, which
consumed US$ 250,000 (around £122,500).
The 3kW hydrogen system comprises a solar system (a 4.5kW PV array installed in
on the roof of the building), an electrolyser that produces high pressure hydrogen,
without the need of a compressor, hydrogen cylinder storage system, a stationary
PEM fuel cell, batteries and an inverter.
Figure 18: Artistic view of Chewonki Hydrogen Project [27]
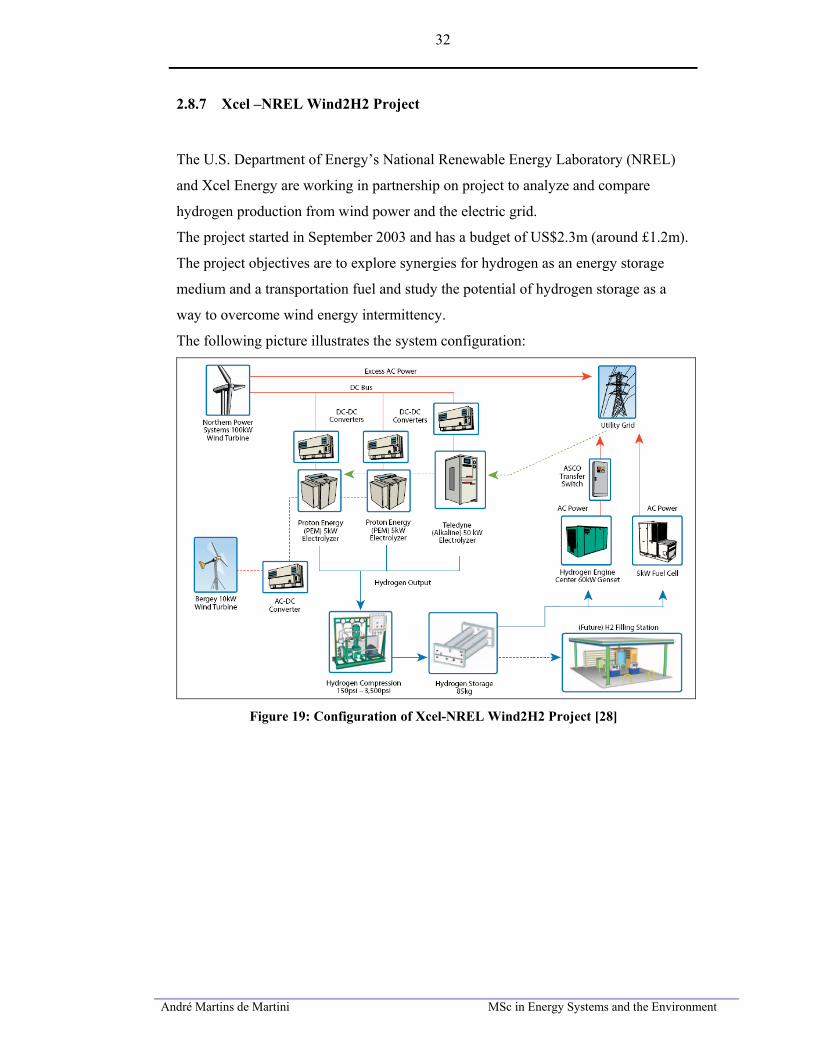
André Martins de Martini MSc in Energy Systems and the Environment
32
2.8.7 Xcel –NREL Wind2H2 Project
The U.S. Department of Energy’s National Renewable Energy Laboratory (NREL)
and Xcel Energy are working in partnership on project to analyze and compare
hydrogen production from wind power and the electric grid.
The project started in September 2003 and has a budget of US$2.3m (around £1.2m).
The project objectives are to explore synergies for hydrogen as an energy storage
medium and a transportation fuel and study the potential of hydrogen storage as a
way to overcome wind energy intermittency.
The following picture illustrates the system configuration:
Figure 19: Configuration of Xcel-NREL Wind2H2 Project [28]
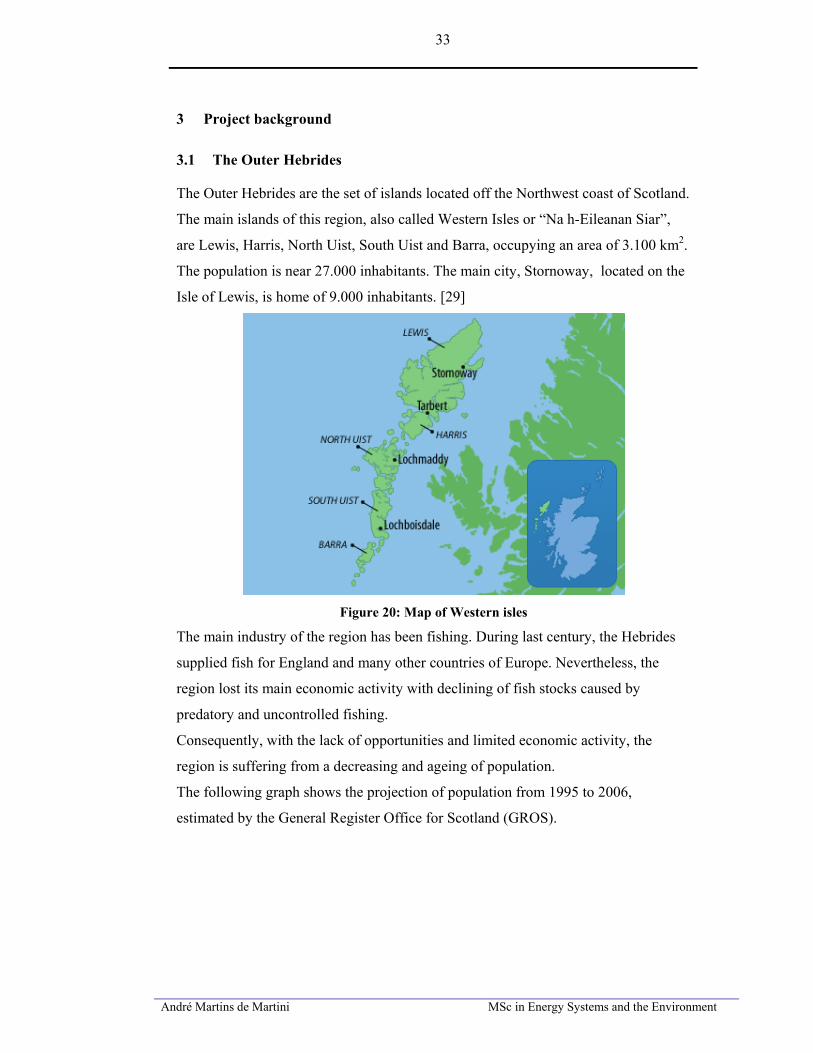
André Martins de Martini MSc in Energy Systems and the Environment
33
3 Project background
3.1 The Outer Hebrides
The Outer Hebrides are the set of islands located off the Northwest coast of Scotland.
The main islands of this region, also called Western Isles or “Na h-Eileanan Siar”,
are Lewis, Harris, North Uist, South Uist and Barra, occupying an area of 3.100 km2.
The population is near 27.000 inhabitants. The main city, Stornoway, located on the
Isle of Lewis, is home of 9.000 inhabitants. [29]
Figure 20: Map of Western isles
The main industry of the region has been fishing. During last century, the Hebrides
supplied fish for England and many other countries of Europe. Nevertheless, the
region lost its main economic activity with declining of fish stocks caused by
predatory and uncontrolled fishing.
Consequently, with the lack of opportunities and limited economic activity, the
region is suffering from a decreasing and ageing of population.
The following graph shows the projection of population from 1995 to 2006,
estimated by the General Register Office for Scotland (GROS).
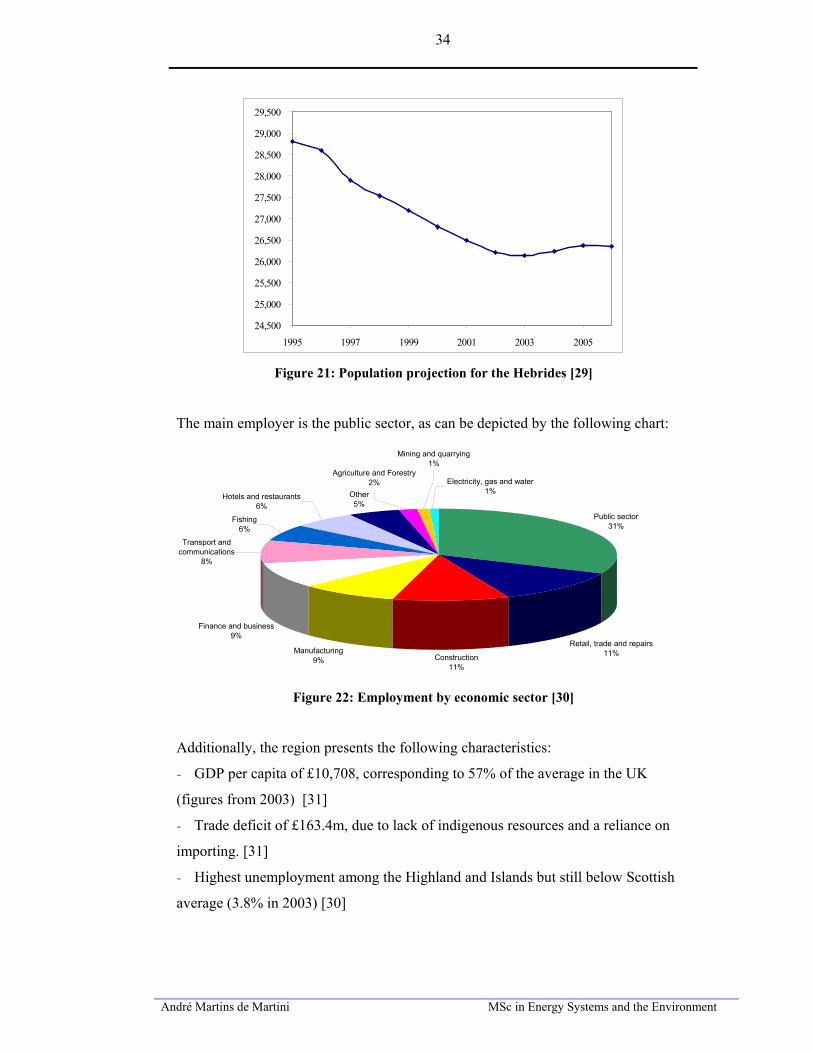
André Martins de Martini MSc in Energy Systems and the Environment
34
24,500
25,000
25,500
26,000
26,500
27,000
27,500
28,000
28,500
29,000
29,500
1995 1997 1999 2001 2003 2005
Figure 21: Population projection for the Hebrides [29]
The main employer is the public sector, as can be depicted by the following chart:
Public sector31%
Retail, trade and repairs11%Construction
11%
Manufacturing9%
Finance and business9%
Transport and communications
8%
Fishing6%
Hotels and restaurants6%
Other5%
Agriculture and Forestry2%
Mining and quarrying1%
Electricity, gas and water1%
Figure 22: Employment by economic sector [30]
Additionally, the region presents the following characteristics:
- GDP per capita of £10,708, corresponding to 57% of the average in the UK
(figures from 2003) [31]
- Trade deficit of £163.4m, due to lack of indigenous resources and a reliance on
importing. [31]
- Highest unemployment among the Highland and Islands but still below Scottish
average (3.8% in 2003) [30]
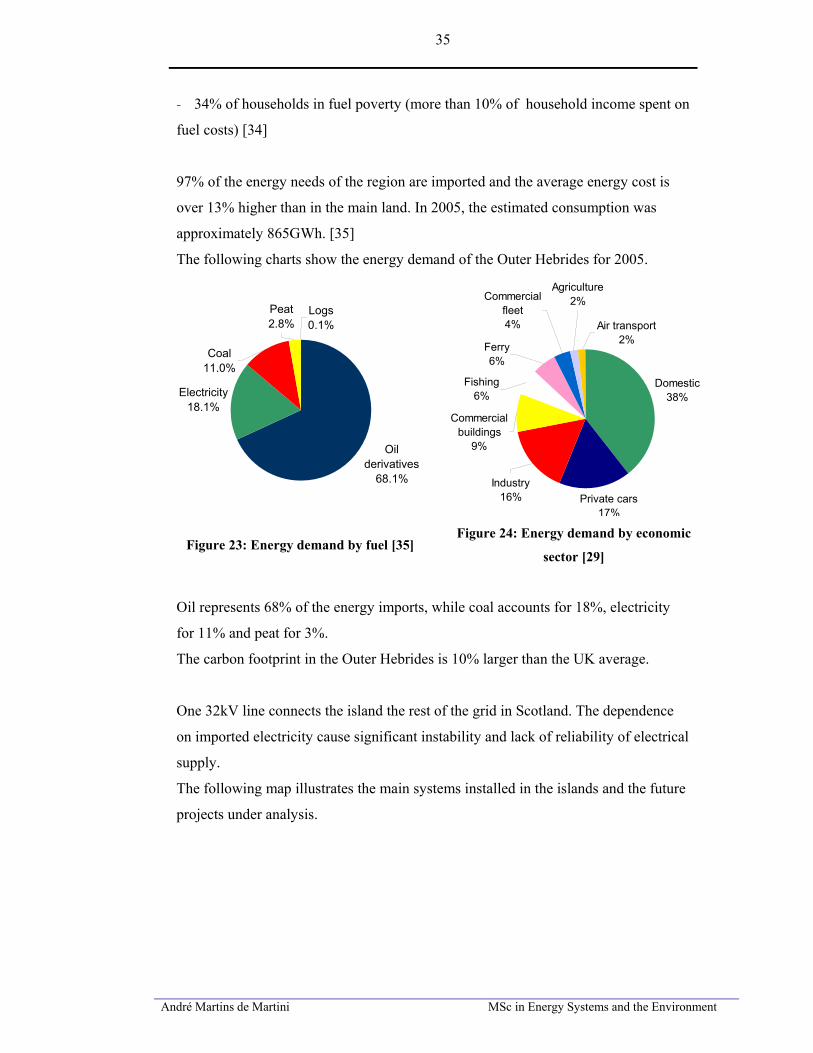
André Martins de Martini MSc in Energy Systems and the Environment
35
- 34% of households in fuel poverty (more than 10% of household income spent on
fuel costs) [34]
97% of the energy needs of the region are imported and the average energy cost is
over 13% higher than in the main land. In 2005, the estimated consumption was
approximately 865GWh. [35]
The following charts show the energy demand of the Outer Hebrides for 2005.
Oil derivatives
68.1%
Electricity18.1%
Coal11.0%
Peat2.8%
Logs0.1%
Domestic38%
Private cars17%
Commercial fleet4%
Ferry6%
Fishing6%
Commercial buildings
9%
Industry16%
Air transport2%
Agriculture2%
Figure 23: Energy demand by fuel [35] Figure 24: Energy demand by economic
sector [29]
Oil represents 68% of the energy imports, while coal accounts for 18%, electricity
for 11% and peat for 3%.
The carbon footprint in the Outer Hebrides is 10% larger than the UK average.
One 32kV line connects the island the rest of the grid in Scotland. The dependence
on imported electricity cause significant instability and lack of reliability of electrical
supply.
The following map illustrates the main systems installed in the islands and the future
projects under analysis.

André Martins de Martini MSc in Energy Systems and the Environment
36
Figure 25: Electricity and Renewable Energy map of Western Isles
In the map, some of the large-scale wind farms proposed for the region were
indicated as green-shaded areas. Those controversial projects try to take advantage of
the huge renewable energy potential present in Outer Hebrides.
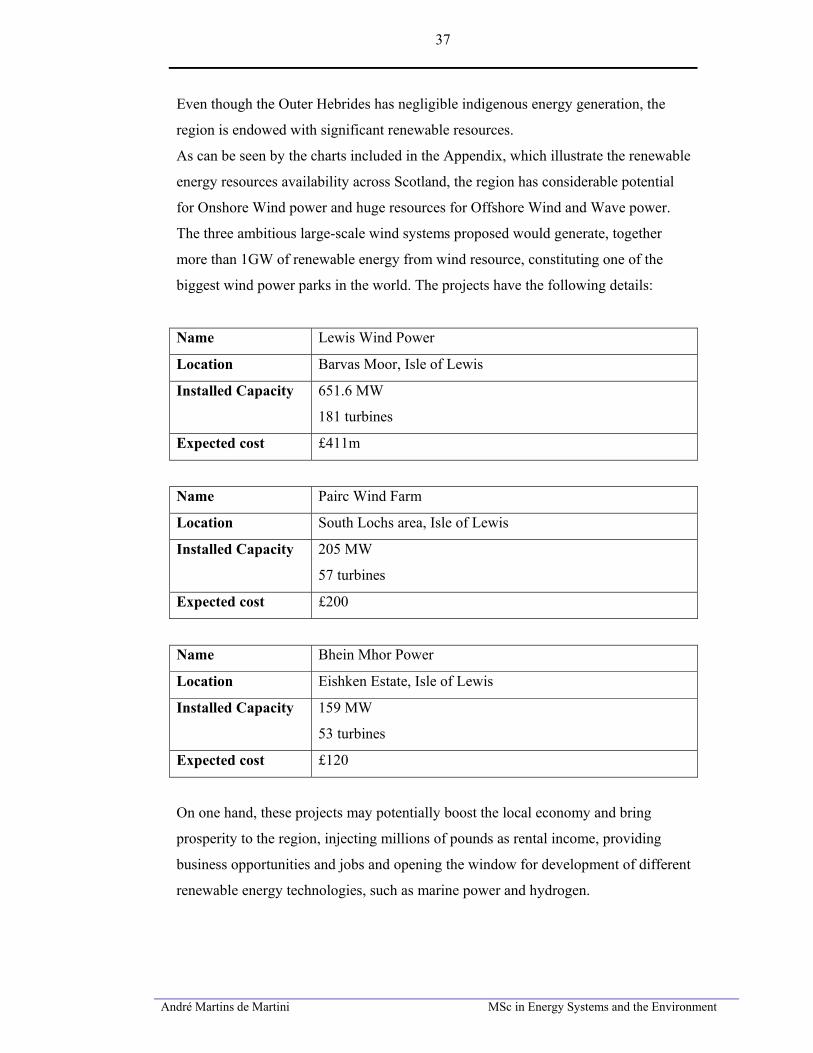
André Martins de Martini MSc in Energy Systems and the Environment
37
Even though the Outer Hebrides has negligible indigenous energy generation, the
region is endowed with significant renewable resources.
As can be seen by the charts included in the Appendix, which illustrate the renewable
energy resources availability across Scotland, the region has considerable potential
for Onshore Wind power and huge resources for Offshore Wind and Wave power.
The three ambitious large-scale wind systems proposed would generate, together
more than 1GW of renewable energy from wind resource, constituting one of the
biggest wind power parks in the world. The projects have the following details:
Name Lewis Wind Power
Location Barvas Moor, Isle of Lewis
Installed Capacity 651.6 MW
181 turbines
Expected cost £411m
Name Pairc Wind Farm
Location South Lochs area, Isle of Lewis
Installed Capacity 205 MW
57 turbines
Expected cost £200
Name Bhein Mhor Power
Location Eishken Estate, Isle of Lewis
Installed Capacity 159 MW
53 turbines
Expected cost £120
On one hand, these projects may potentially boost the local economy and bring
prosperity to the region, injecting millions of pounds as rental income, providing
business opportunities and jobs and opening the window for development of different
renewable energy technologies, such as marine power and hydrogen.

André Martins de Martini MSc in Energy Systems and the Environment
38
On the other hand, these projects have been facing severe barriers since the first
proposals. Local communities are afraid of landscape degradation and loss of cultural
identity and environmentalists created objections due to the impact on moorlands and
bird life, especially golden eagles.
Moreover, these projects can only be implemented if a major grid interconnection to
the mainland is installed, most likely via sub sea cable, demanding further massive
investment.
3.2 Hebridean Hydrogen Park
The Hebridean Hydrogen Park is a structural program that plans to provide solid
foundation for the development of a hydrogen economy, positioning the Outer
Hebrides at a good position to take advantage of opportunities in the emerging
hydrogen market. This program is complimentary to the Energy Innovation Zone
Initiative.
The fundamental idea of the Energy Zone Initiative is to take advantage of nature
resources available in the region to develop an international centre of excellence for
renewable energy research and innovation. The vision of this programme is to
transform the Western Isles in the renewable energy capital of Europe.
The Hebridean Hydrogen Park is organised in three distinct but inter-related phases:
- Phase 1: Capacity building and skills development
- Phase 2: Infrastructure and development projects
- Phase 3: Development of hydrogen markets
The phase 1 aim at the promotion of hydrogen technologies and the development of
necessary skills as a background to support other initiatives. The main initiatives
included in this phase are:
- Hydrogen Schools Education Project: the main objective of this initiative is to
provide schools with equipment for practical demonstration of hydrogen basic
technology and to promote the inclusion of hydrogen in the normal curriculum.
- Hydrogen teaching and research facility: installation of a complete hydrogen
laboratory at Lews Castle College. The main objective of the facility is to enable
research and development of hydrogen technologies. As can be seen in the following

André Martins de Martini MSc in Energy Systems and the Environment
39
picture, the laboratory is equipped with several hydrogen demonstration units,
including fuel cells, CHP systems and hydrogen fuelled portable devices.
Figure 26: Hydrogen Lab at Lews Castle College [36]
- Broadband Project: this project will develop a hydrogen UPS that will offer
superior performance compared to traditional battery based UPS systems.
The Phase 2 of the project will develop hydrogen infrastructure and support several
demonstration projects. The initiatives of this phase are organised and managed in
the H2 SEED project.
The H2 SEED project is a complete and self-sustained hydrogen system that will
generate hydrogen from biogas, which is produced in an anaerobic digester from
organic waste. The installation will have an electrolyser, one compressor, hydrogen
storage, a vehicle filling station and a cylinder refuelling system. This project will
supply hydrogen to fuel two demonstration vehicles and several hydrogen
demonstration projects, including the hydrogen lab at Lews Castle College.
The following diagram shows the main units of the system:
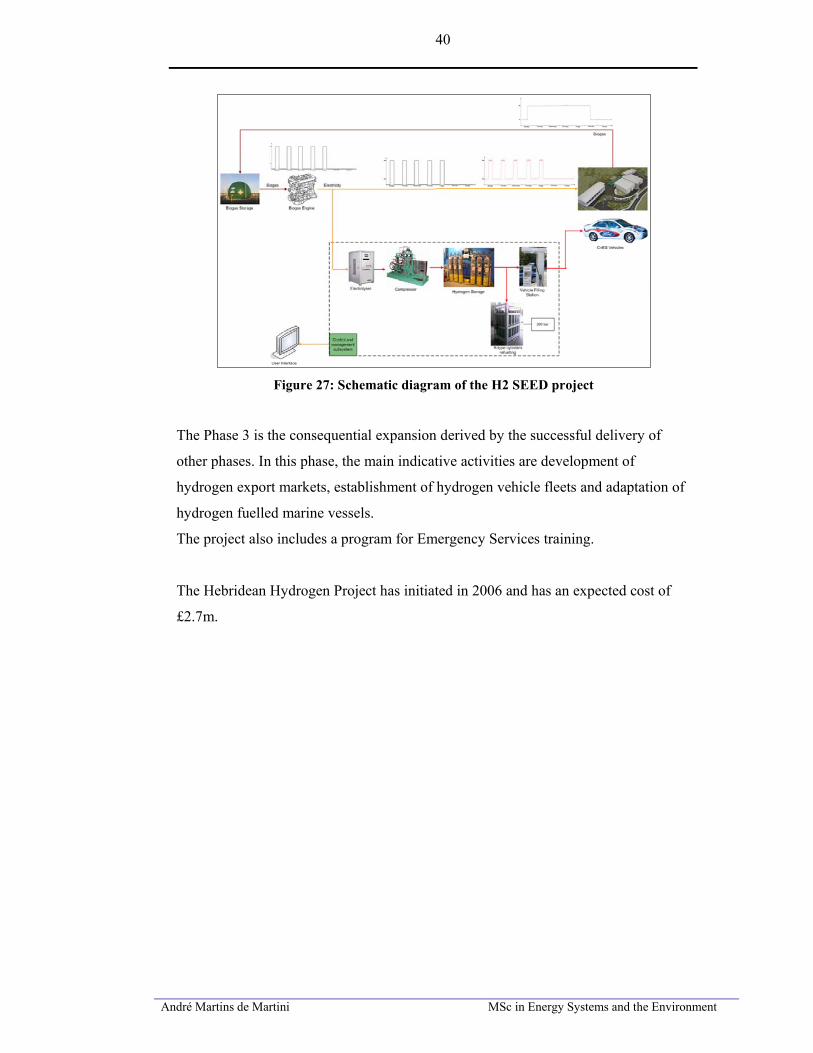
André Martins de Martini MSc in Energy Systems and the Environment
40
Figure 27: Schematic diagram of the H2 SEED project
The Phase 3 is the consequential expansion derived by the successful delivery of
other phases. In this phase, the main indicative activities are development of
hydrogen export markets, establishment of hydrogen vehicle fleets and adaptation of
hydrogen fuelled marine vessels.
The project also includes a program for Emergency Services training.
The Hebridean Hydrogen Project has initiated in 2006 and has an expected cost of
£2.7m.
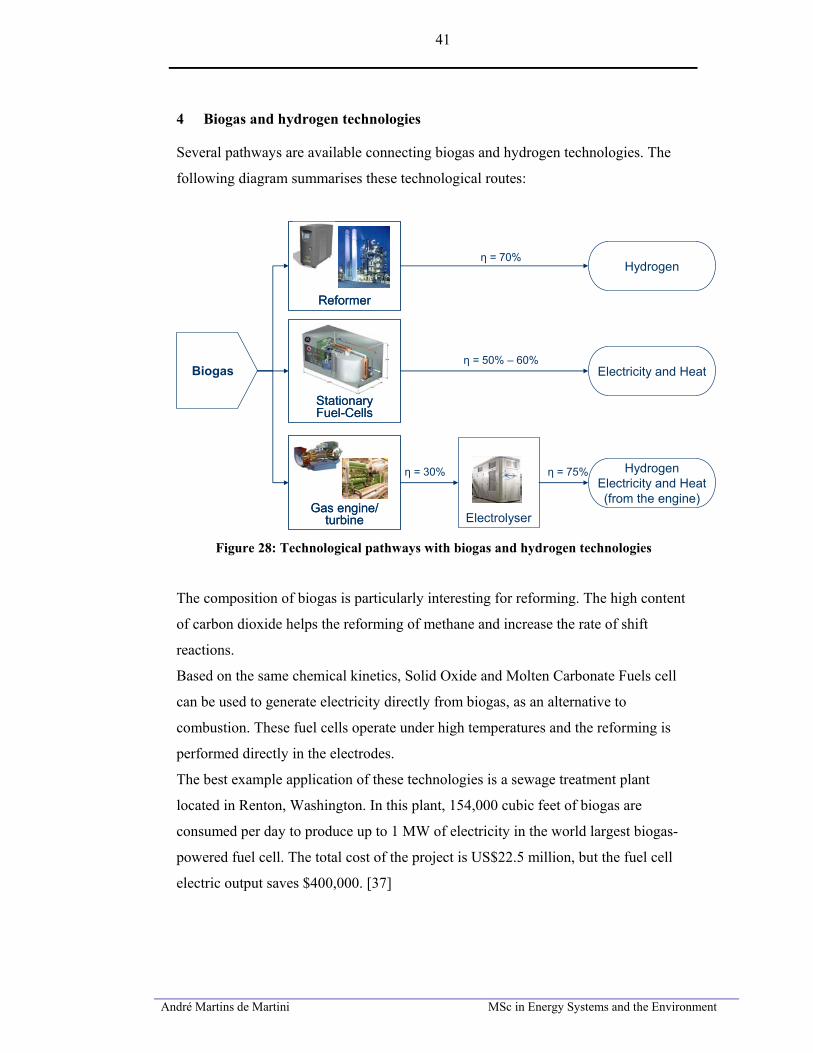
André Martins de Martini MSc in Energy Systems and the Environment
41
4 Biogas and hydrogen technologies
Several pathways are available connecting biogas and hydrogen technologies. The
following diagram summarises these technological routes:
Biogas
ReformerReformer
Stationary Fuel-CellsStationary Fuel-Cells
Gas engine/ turbine
Gas engine/ turbine
Hydrogen
Electrolyser
Electricity and Heat
HydrogenElectricity and Heat (from the engine)
η = 70%
η = 50% – 60%
η = 30% η = 75%
Figure 28: Technological pathways with biogas and hydrogen technologies
The composition of biogas is particularly interesting for reforming. The high content
of carbon dioxide helps the reforming of methane and increase the rate of shift
reactions.
Based on the same chemical kinetics, Solid Oxide and Molten Carbonate Fuels cell
can be used to generate electricity directly from biogas, as an alternative to
combustion. These fuel cells operate under high temperatures and the reforming is
performed directly in the electrodes.
The best example application of these technologies is a sewage treatment plant
located in Renton, Washington. In this plant, 154,000 cubic feet of biogas are
consumed per day to produce up to 1 MW of electricity in the world largest biogas-
powered fuel cell. The total cost of the project is US$22.5 million, but the fuel cell
electric output saves $400,000. [37]
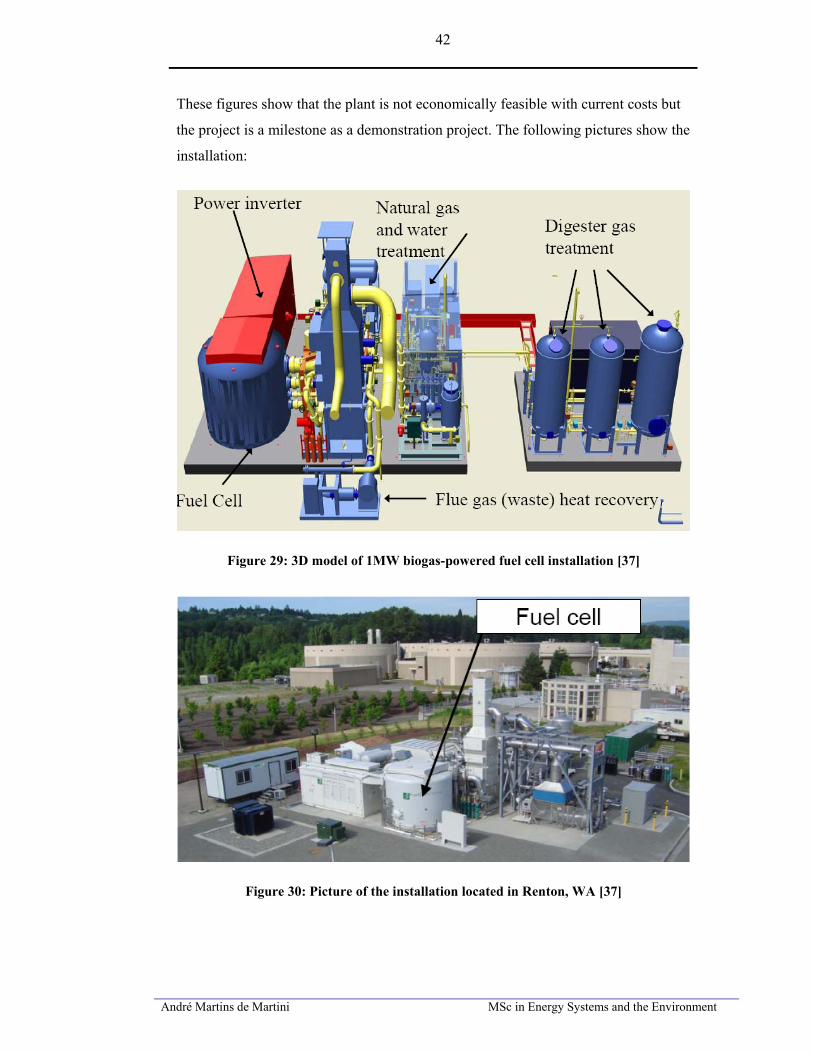
André Martins de Martini MSc in Energy Systems and the Environment
42
These figures show that the plant is not economically feasible with current costs but
the project is a milestone as a demonstration project. The following pictures show the
installation:
Figure 29: 3D model of 1MW biogas-powered fuel cell installation [37]
Figure 30: Picture of the installation located in Renton, WA [37]
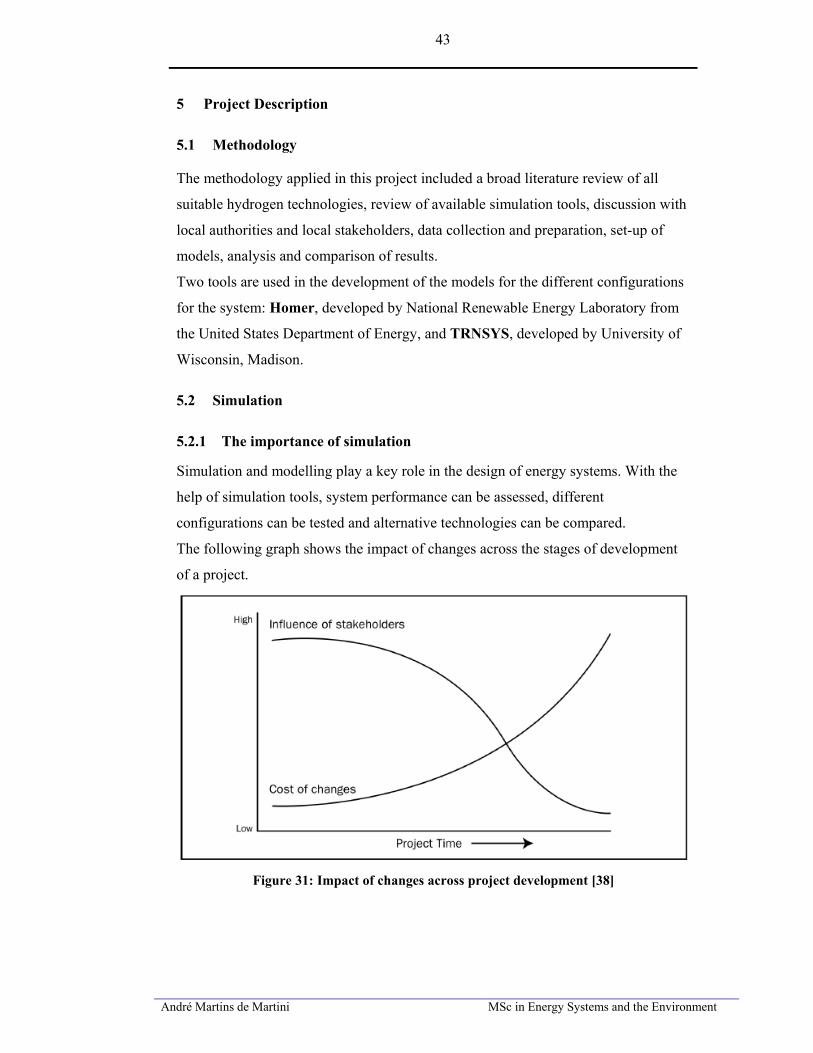
André Martins de Martini MSc in Energy Systems and the Environment
43
5 Project Description
5.1 Methodology
The methodology applied in this project included a broad literature review of all
suitable hydrogen technologies, review of available simulation tools, discussion with
local authorities and local stakeholders, data collection and preparation, set-up of
models, analysis and comparison of results.
Two tools are used in the development of the models for the different configurations
for the system: Homer, developed by National Renewable Energy Laboratory from
the United States Department of Energy, and TRNSYS, developed by University of
Wisconsin, Madison.
5.2 Simulation
5.2.1 The importance of simulation
Simulation and modelling play a key role in the design of energy systems. With the
help of simulation tools, system performance can be assessed, different
configurations can be tested and alternative technologies can be compared.
The following graph shows the impact of changes across the stages of development
of a project.
Figure 31: Impact of changes across project development [38]
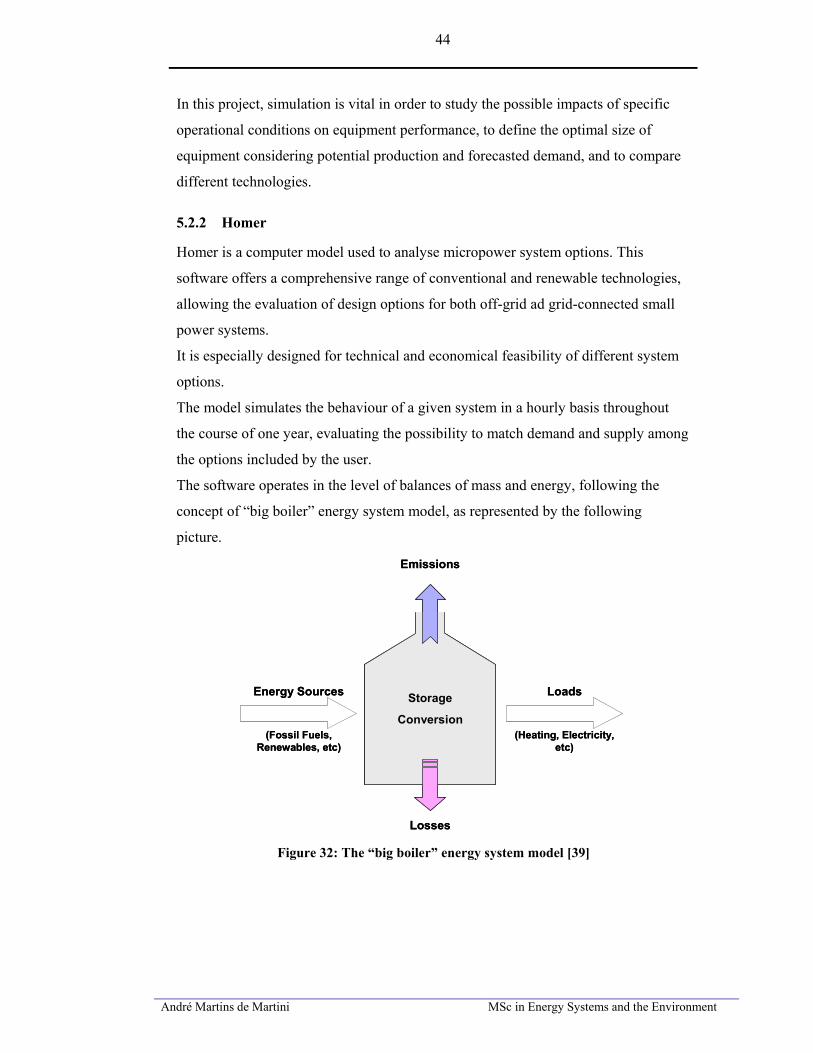
André Martins de Martini MSc in Energy Systems and the Environment
44
In this project, simulation is vital in order to study the possible impacts of specific
operational conditions on equipment performance, to define the optimal size of
equipment considering potential production and forecasted demand, and to compare
different technologies.
5.2.2 Homer
Homer is a computer model used to analyse micropower system options. This
software offers a comprehensive range of conventional and renewable technologies,
allowing the evaluation of design options for both off-grid ad grid-connected small
power systems.
It is especially designed for technical and economical feasibility of different system
options.
The model simulates the behaviour of a given system in a hourly basis throughout
the course of one year, evaluating the possibility to match demand and supply among
the options included by the user.
The software operates in the level of balances of mass and energy, following the
concept of “big boiler” energy system model, as represented by the following
picture.
Losses
Energy Sources Loads
(Heating, Electricity, etc)
(Fossil Fuels, Renewables, etc)
Emissions
Storage
Conversion
Losses
Energy Sources Loads
(Heating, Electricity, etc)
(Fossil Fuels, Renewables, etc)
Emissions
Storage
Conversion
Figure 32: The “big boiler” energy system model [39]
André Martins de Martini MSc in Energy Systems and the Environment
45
Homer also has an optimization and sensitivity analysis tool, with a variety of reports
and outputs. Detailed technical analysis and simple economic performance can be
evaluated for every option simulated.
5.2.3 TRNSYS
TRNSYS stands for Transient System simulation. “It recognizes a system description
language in which the user specifies the components that constitute the system and
the manner in which they are connected. The TRNSYS library includes many of the
components commonly found in thermal and electrical energy systems, as well as
component routines to handle input of weather data or other time-dependent forcing
functions and output of simulation results. The modular nature of TRNSYS
facilitates the addition to the program of mathematical models not included in the
standard TRNSYS library.” [40]
In this project, it was used version 16.01 of TRNSYS, which has the Hydrogen
components integrated in the main libraries.
6 System description and Modelling
6.1 System Description – Creed Park Waste Management Facility
The Creed Waste Management plant was commissioned in the end of 2006. The
plant can process up to 9,500,000 tonnes per annum of organic waste, which
represents 30% of the waste generated in the Western Isles. The organic matter is
processed in an anaerobic digester, producing up to 1.382.400 Nm3/year of biogas,
which contains at least 60% of methane.
Biogas is used to feed an engine that produce electricity and heat to supply the plant
needs. The plant is connected to the grid and it can export surplus electricity
generated by the biogas engine. When the engine is not running, the grid connection
supplies electricity to the plant.
The system had German design and the anaerobic digester can be considered an
operational success. The compost produced has high standard, with no traces of
micro-organisms or heavy metals, allowing to be used in landfill recuperation and as
André Martins de Martini MSc in Energy Systems and the Environment
46
fertiliser. The quality and composition of the biogas produced are steady and present
negligible variation along the year.
Nevertheless, the current engine is overrated, due to overestimate of organic waste
collection during design phase.
Educational programs are under development to increase the public awareness of the
importance of proper selection of organic waste. Regular garbage, which also arrives
at the plant, still contains considerable amount of organic matter that would boost
biogas production.
It is technically possible to feed into the digester the regular waste, but this would
lower the standard of the compost produced. There are strict regulations regarding
use of compost and any kind of contamination (micro-organisms, heavy metals, etc)
would prevent its application for landfill recuperation and for food production,
restricting its market and depleting its commercial value.
Consequently, the engine consumes more biogas than the plant can currently
produce. The solution adopted by the management of the plant was to operate the
engine during some hours along the day at 100% capacity and then ramp it down
according to the level of the biogas storage. This operational condition was
considered “less harmful” than a longer operation in low capacity.
As long as this kind of engine is designed to operate at maximum capacity 24 hours a
day, this operation profile will certainly bring some maintenance problems in the
near future and it will decrease its lifetime.
A survey was performed in the plant to investigate technical specification of the
equipment and operational conditions. The following data were obtained:
Biogas plant
Technology licenser: Linde AG
Main Contractor: Earth Tech
Operation: only weekdays, from 8:00 to 18:00
Production: on average, approximately 50Nm3/h (ranging from 35 to 75 Nm3/h).
During weekends, waste is not fed into the digester and biogas production declines to
10 Nm3/h.
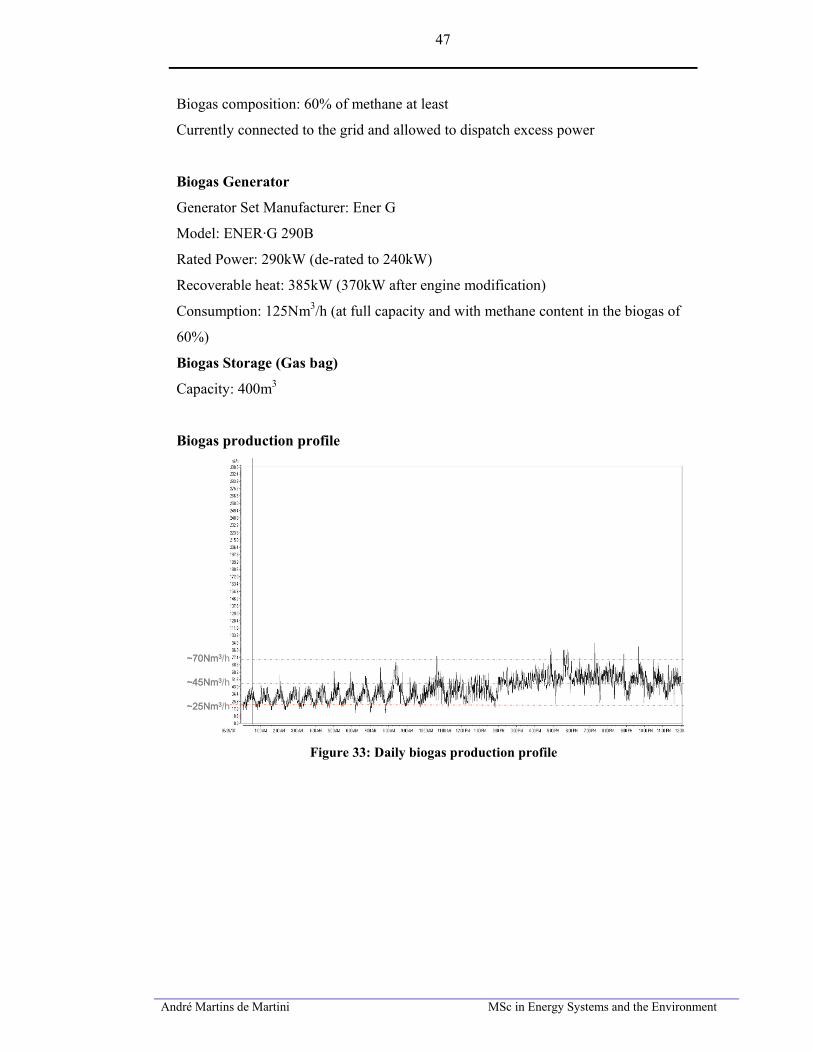
André Martins de Martini MSc in Energy Systems and the Environment
47
Biogas composition: 60% of methane at least
Currently connected to the grid and allowed to dispatch excess power
Biogas Generator
Generator Set Manufacturer: Ener G
Model: ENER·G 290B
Rated Power: 290kW (de-rated to 240kW)
Recoverable heat: 385kW (370kW after engine modification)
Consumption: 125Nm3/h (at full capacity and with methane content in the biogas of
60%)
Biogas Storage (Gas bag)
Capacity: 400m3
Biogas production profile
~70Nm3/h
~25Nm3/h
~45Nm3/h
~70Nm3/h
~25Nm3/h
~45Nm3/h
Figure 33: Daily biogas production profile
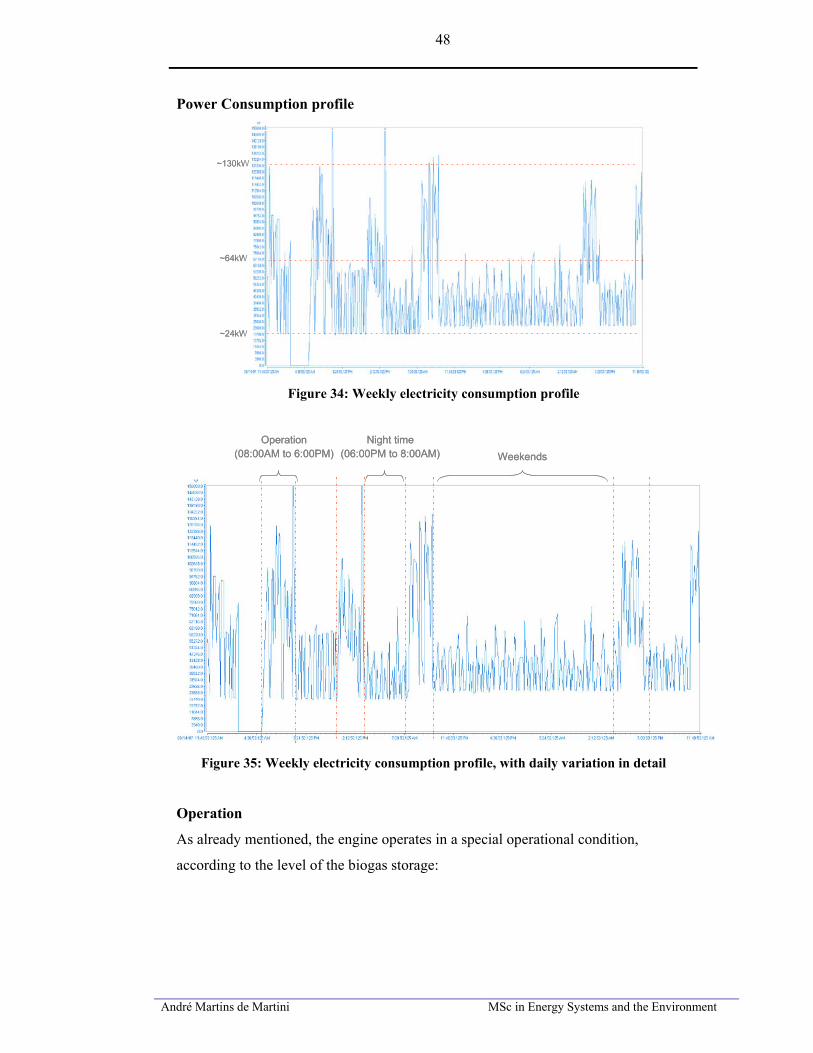
André Martins de Martini MSc in Energy Systems and the Environment
48
Power Consumption profile
~130kW
~64kW
~24kW
~130kW
~64kW
~24kW
Figure 34: Weekly electricity consumption profile
WeekendsOperation
(08:00AM to 6:00PM)Night time
(06:00PM to 8:00AM) WeekendsOperation
(08:00AM to 6:00PM)Night time
(06:00PM to 8:00AM)
Figure 35: Weekly electricity consumption profile, with daily variation in detail
Operation
As already mentioned, the engine operates in a special operational condition,
according to the level of the biogas storage:
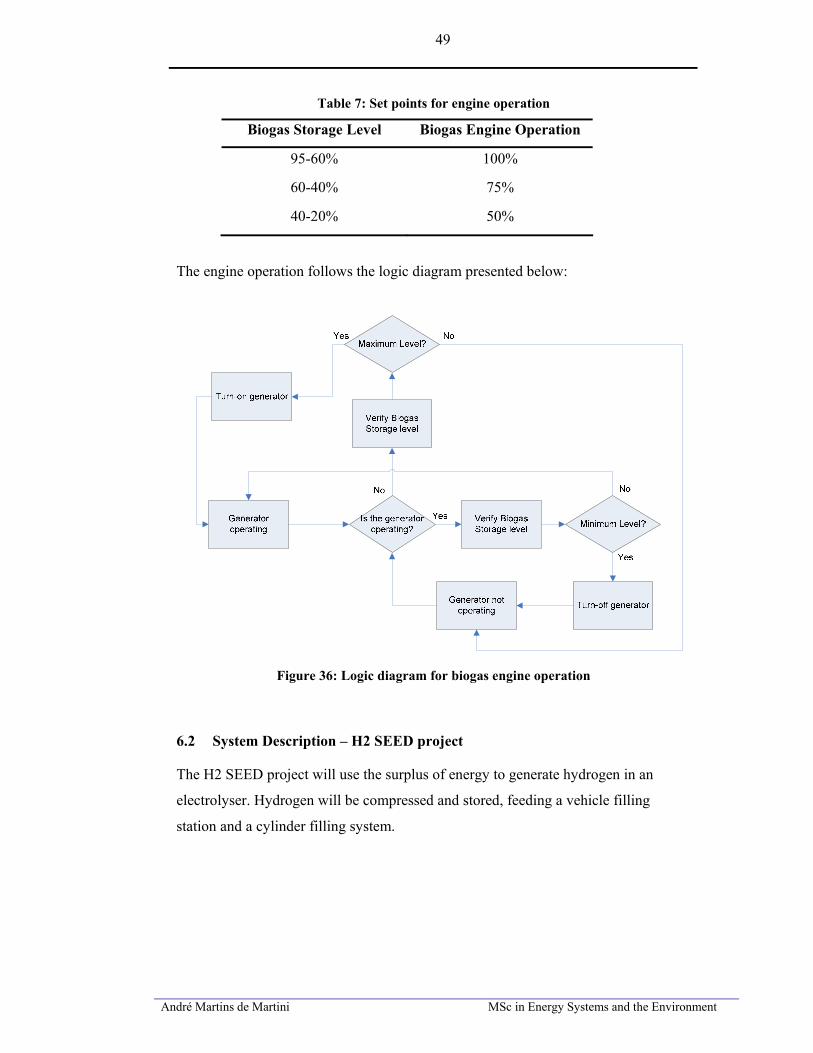
André Martins de Martini MSc in Energy Systems and the Environment
49
Table 7: Set points for engine operation
Biogas Storage Level Biogas Engine Operation
95-60% 100%
60-40% 75%
40-20% 50%
The engine operation follows the logic diagram presented below:
Figure 36: Logic diagram for biogas engine operation
6.2 System Description – H2 SEED project
The H2 SEED project will use the surplus of energy to generate hydrogen in an
electrolyser. Hydrogen will be compressed and stored, feeding a vehicle filling
station and a cylinder filling system.
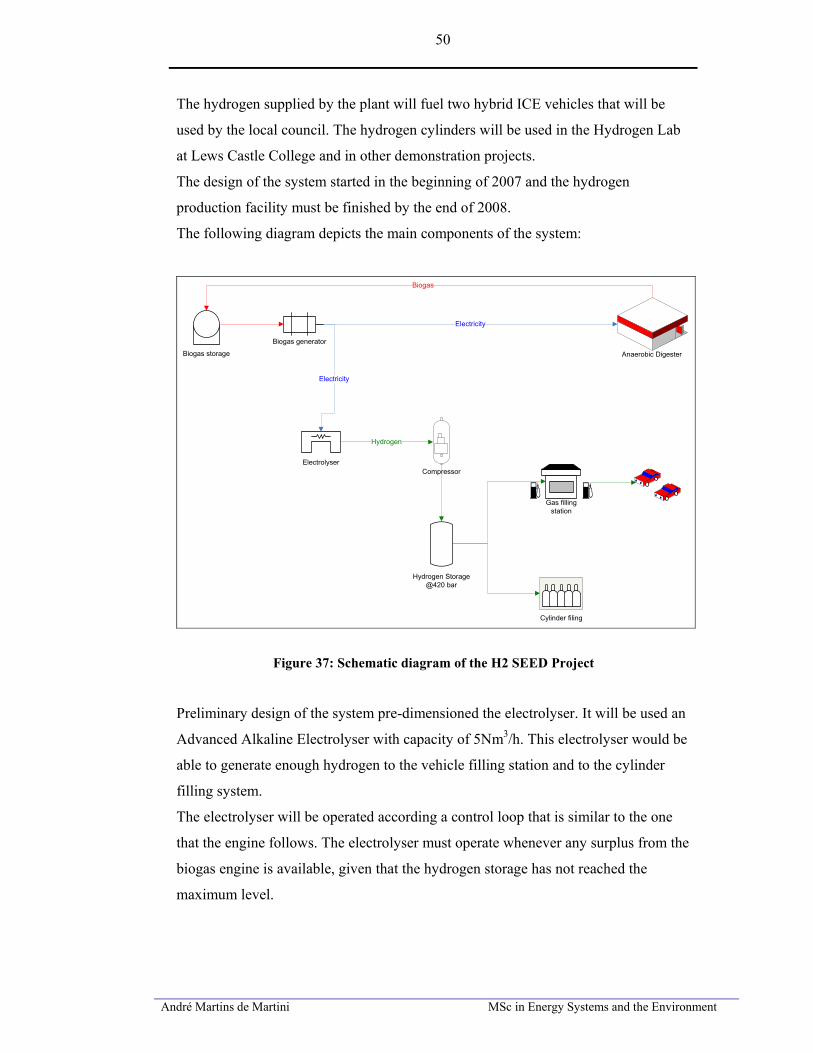
André Martins de Martini MSc in Energy Systems and the Environment
50
The hydrogen supplied by the plant will fuel two hybrid ICE vehicles that will be
used by the local council. The hydrogen cylinders will be used in the Hydrogen Lab
at Lews Castle College and in other demonstration projects.
The design of the system started in the beginning of 2007 and the hydrogen
production facility must be finished by the end of 2008.
The following diagram depicts the main components of the system:
Electricity
Biogas storage
Gas filling station
Anaerobic Digester
ElectrolyserCompressor
Biogas generator
Hydrogen
Electricity
Biogas
Hydrogen Storage@420 bar
Cylinder filing
Figure 37: Schematic diagram of the H2 SEED Project
Preliminary design of the system pre-dimensioned the electrolyser. It will be used an
Advanced Alkaline Electrolyser with capacity of 5Nm3/h. This electrolyser would be
able to generate enough hydrogen to the vehicle filling station and to the cylinder
filling system.
The electrolyser will be operated according a control loop that is similar to the one
that the engine follows. The electrolyser must operate whenever any surplus from the
biogas engine is available, given that the hydrogen storage has not reached the
maximum level.
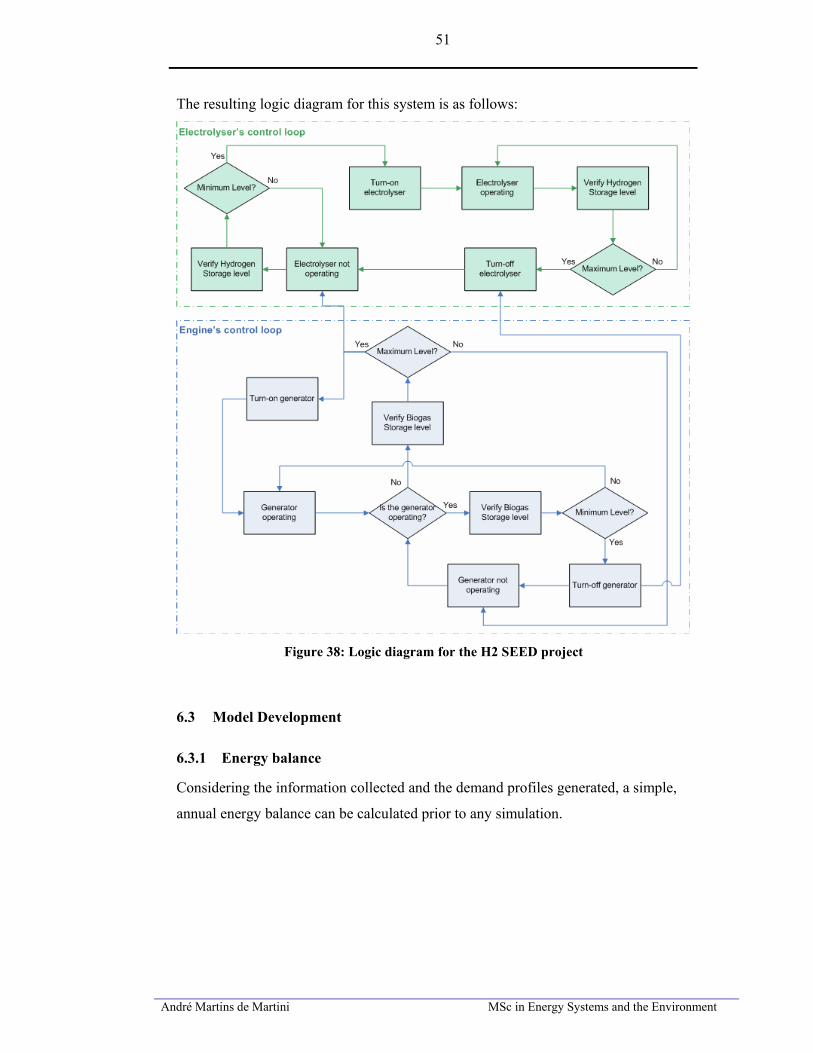
André Martins de Martini MSc in Energy Systems and the Environment
51
The resulting logic diagram for this system is as follows:
Figure 38: Logic diagram for the H2 SEED project
6.3 Model Development
6.3.1 Energy balance
Considering the information collected and the demand profiles generated, a simple,
annual energy balance can be calculated prior to any simulation.
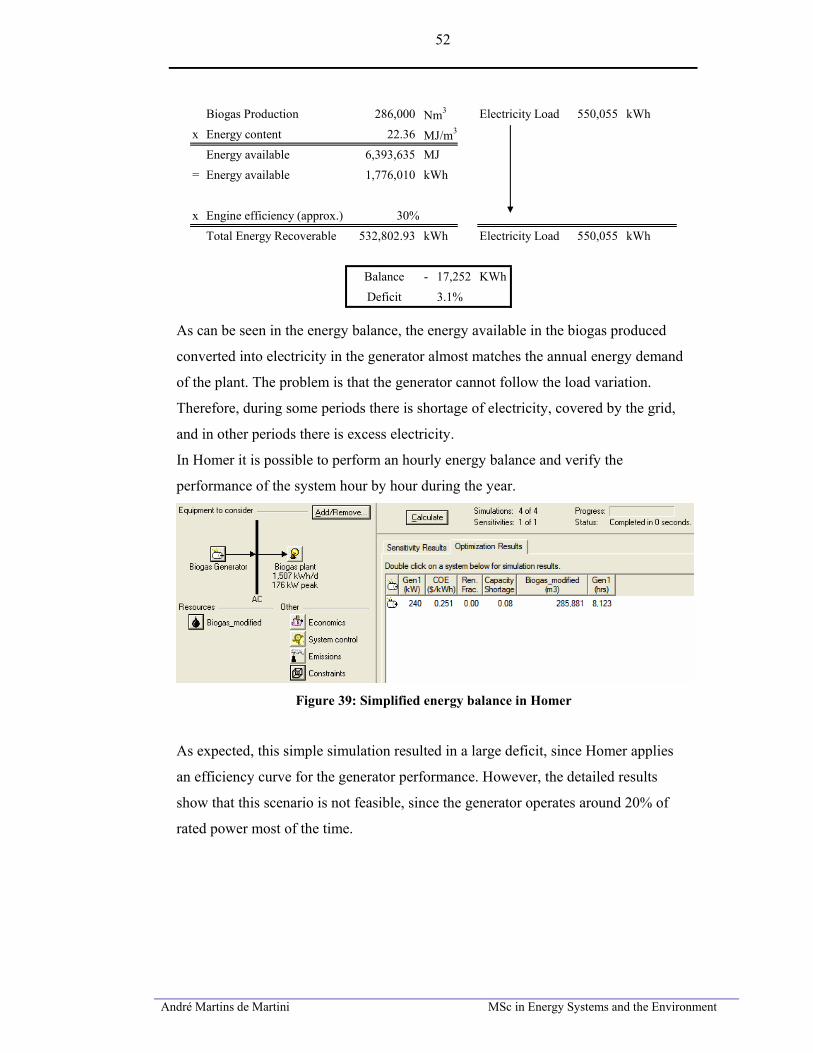
André Martins de Martini MSc in Energy Systems and the Environment
52
Biogas Production 286,000 Nm3 Electricity Load 550,055 kWhx Energy content 22.36 MJ/m3
Energy available 6,393,635 MJ= Energy available 1,776,010 kWh
x Engine efficiency (approx.) 30%Total Energy Recoverable 532,802.93 kWh Electricity Load 550,055 kWh
Balance 17,252- KWhDeficit 3.1%
As can be seen in the energy balance, the energy available in the biogas produced
converted into electricity in the generator almost matches the annual energy demand
of the plant. The problem is that the generator cannot follow the load variation.
Therefore, during some periods there is shortage of electricity, covered by the grid,
and in other periods there is excess electricity.
In Homer it is possible to perform an hourly energy balance and verify the
performance of the system hour by hour during the year.
Figure 39: Simplified energy balance in Homer
As expected, this simple simulation resulted in a large deficit, since Homer applies
an efficiency curve for the generator performance. However, the detailed results
show that this scenario is not feasible, since the generator operates around 20% of
rated power most of the time.
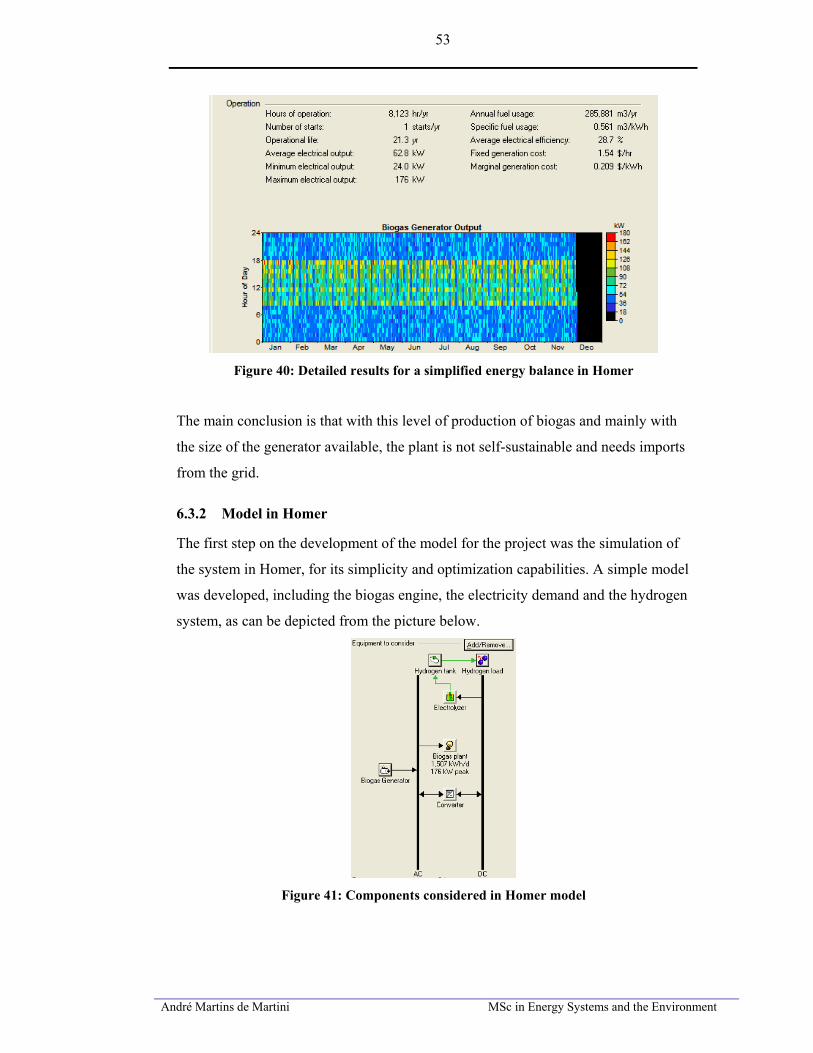
André Martins de Martini MSc in Energy Systems and the Environment
53
Figure 40: Detailed results for a simplified energy balance in Homer
The main conclusion is that with this level of production of biogas and mainly with
the size of the generator available, the plant is not self-sustainable and needs imports
from the grid.
6.3.2 Model in Homer
The first step on the development of the model for the project was the simulation of
the system in Homer, for its simplicity and optimization capabilities. A simple model
was developed, including the biogas engine, the electricity demand and the hydrogen
system, as can be depicted from the picture below.
Figure 41: Components considered in Homer model
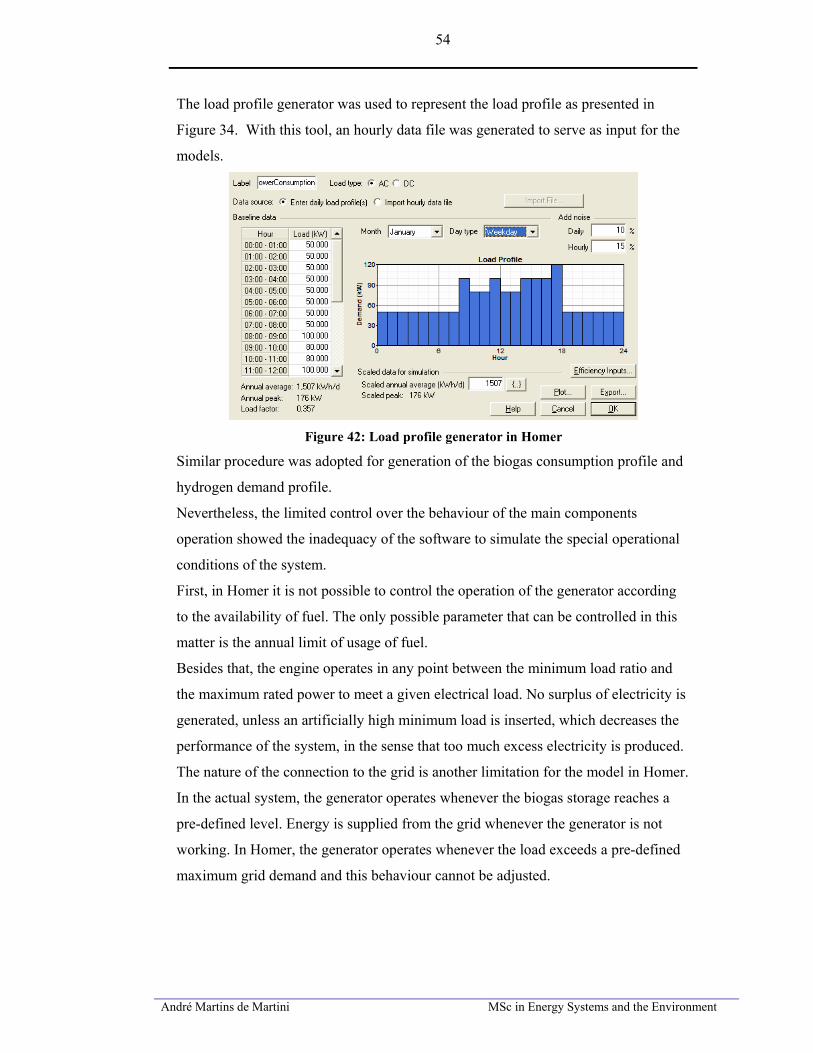
André Martins de Martini MSc in Energy Systems and the Environment
54
The load profile generator was used to represent the load profile as presented in
Figure 34. With this tool, an hourly data file was generated to serve as input for the
models.
Figure 42: Load profile generator in Homer
Similar procedure was adopted for generation of the biogas consumption profile and
hydrogen demand profile.
Nevertheless, the limited control over the behaviour of the main components
operation showed the inadequacy of the software to simulate the special operational
conditions of the system.
First, in Homer it is not possible to control the operation of the generator according
to the availability of fuel. The only possible parameter that can be controlled in this
matter is the annual limit of usage of fuel.
Besides that, the engine operates in any point between the minimum load ratio and
the maximum rated power to meet a given electrical load. No surplus of electricity is
generated, unless an artificially high minimum load is inserted, which decreases the
performance of the system, in the sense that too much excess electricity is produced.
The nature of the connection to the grid is another limitation for the model in Homer.
In the actual system, the generator operates whenever the biogas storage reaches a
pre-defined level. Energy is supplied from the grid whenever the generator is not
working. In Homer, the generator operates whenever the load exceeds a pre-defined
maximum grid demand and this behaviour cannot be adjusted.
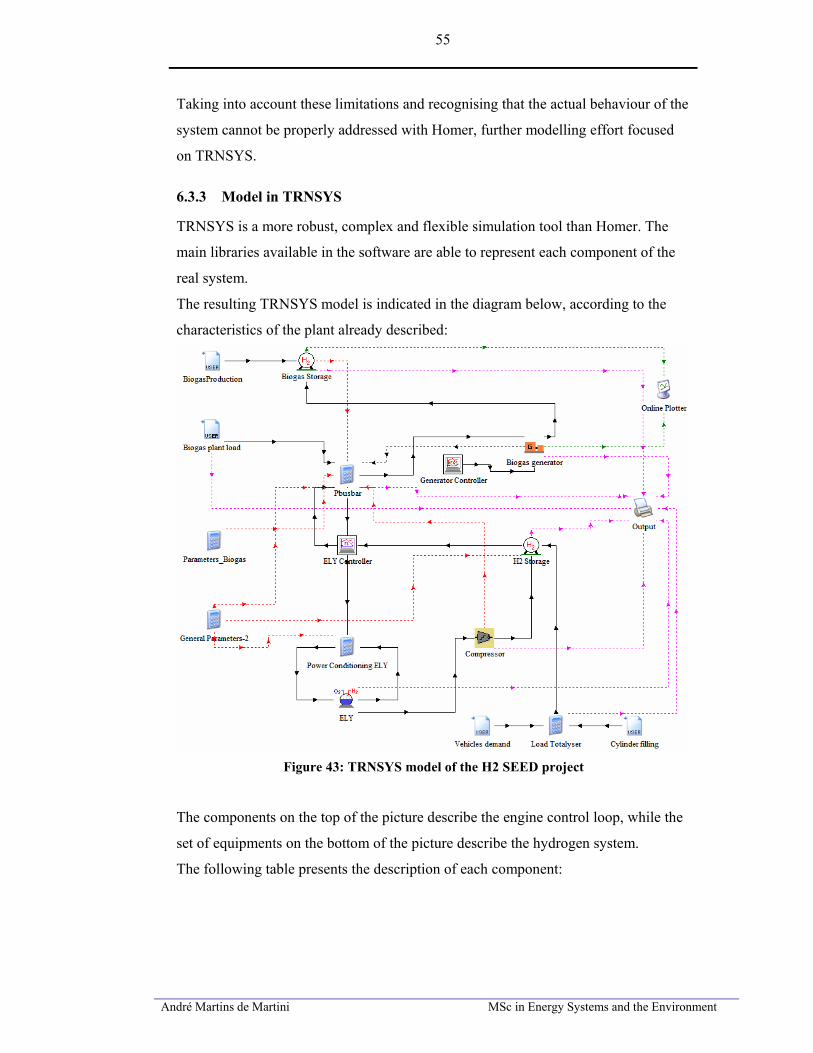
André Martins de Martini MSc in Energy Systems and the Environment
55
Taking into account these limitations and recognising that the actual behaviour of the
system cannot be properly addressed with Homer, further modelling effort focused
on TRNSYS.
6.3.3 Model in TRNSYS
TRNSYS is a more robust, complex and flexible simulation tool than Homer. The
main libraries available in the software are able to represent each component of the
real system.
The resulting TRNSYS model is indicated in the diagram below, according to the
characteristics of the plant already described:
Figure 43: TRNSYS model of the H2 SEED project
The components on the top of the picture describe the engine control loop, while the
set of equipments on the bottom of the picture describe the hydrogen system.
The following table presents the description of each component:
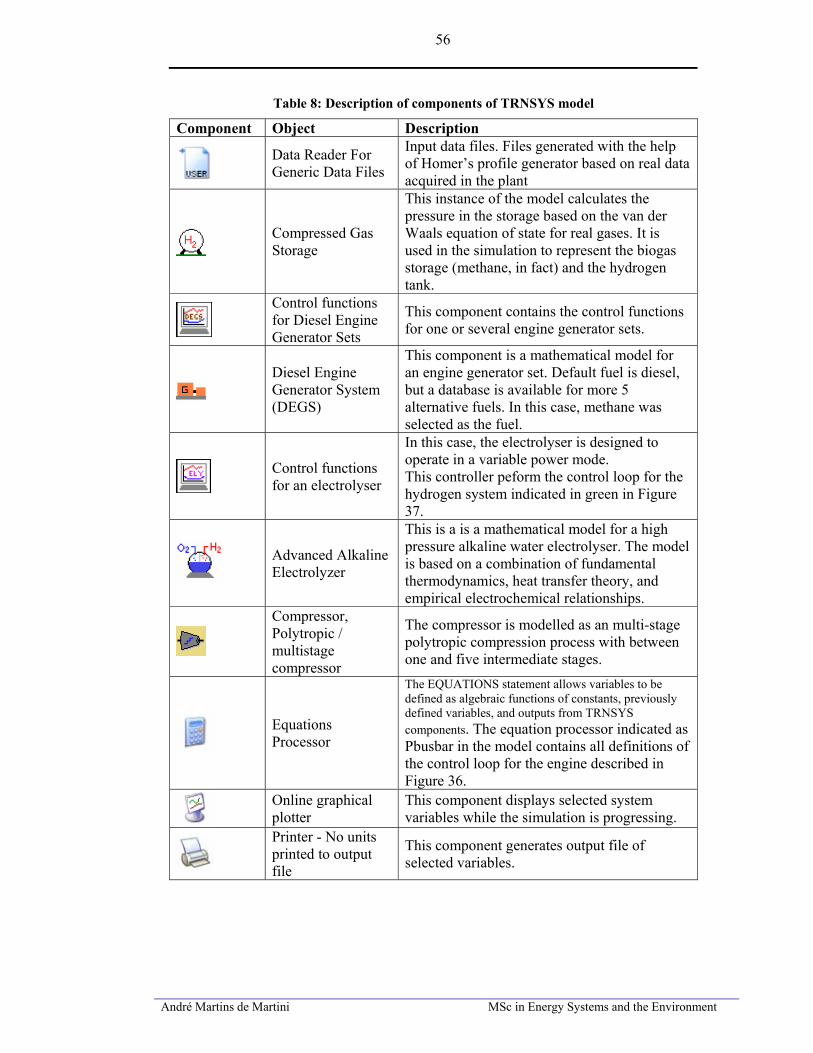
André Martins de Martini MSc in Energy Systems and the Environment
56
Table 8: Description of components of TRNSYS model
Component Object Description
Data Reader For Generic Data Files
Input data files. Files generated with the help of Homer’s profile generator based on real data acquired in the plant
Compressed Gas Storage
This instance of the model calculates the pressure in the storage based on the van der Waals equation of state for real gases. It is used in the simulation to represent the biogas storage (methane, in fact) and the hydrogen tank.
Control functions for Diesel Engine Generator Sets
This component contains the control functions for one or several engine generator sets.
Diesel Engine Generator System (DEGS)
This component is a mathematical model for an engine generator set. Default fuel is diesel, but a database is available for more 5 alternative fuels. In this case, methane was selected as the fuel.
Control functions for an electrolyser
In this case, the electrolyser is designed to operate in a variable power mode. This controller peform the control loop for the hydrogen system indicated in green in Figure 37.
Advanced Alkaline Electrolyzer
This is a is a mathematical model for a high pressure alkaline water electrolyser. The model is based on a combination of fundamental thermodynamics, heat transfer theory, and empirical electrochemical relationships.
Compressor, Polytropic / multistage compressor
The compressor is modelled as an multi-stage polytropic compression process with between one and five intermediate stages.
Equations Processor
The EQUATIONS statement allows variables to be defined as algebraic functions of constants, previously defined variables, and outputs from TRNSYS components. The equation processor indicated as Pbusbar in the model contains all definitions of the control loop for the engine described in Figure 36.
Online graphical plotter
This component displays selected system variables while the simulation is progressing.
Printer - No units printed to output file
This component generates output file of selected variables.
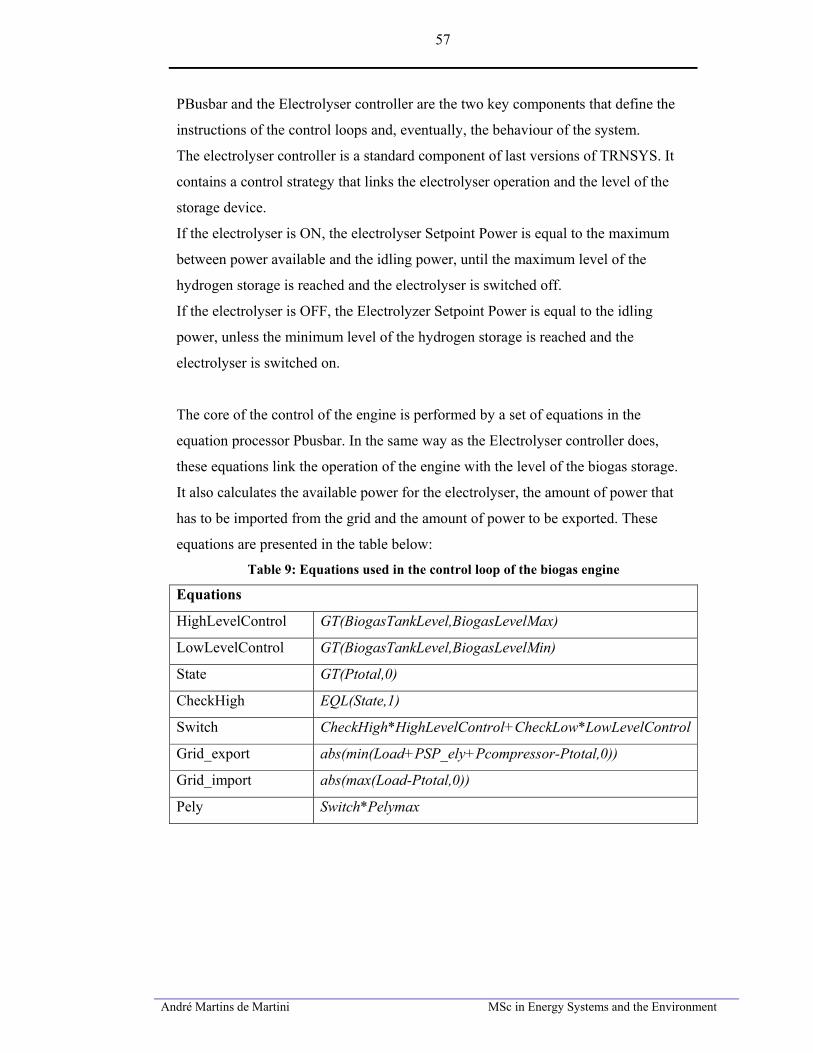
André Martins de Martini MSc in Energy Systems and the Environment
57
PBusbar and the Electrolyser controller are the two key components that define the
instructions of the control loops and, eventually, the behaviour of the system.
The electrolyser controller is a standard component of last versions of TRNSYS. It
contains a control strategy that links the electrolyser operation and the level of the
storage device.
If the electrolyser is ON, the electrolyser Setpoint Power is equal to the maximum
between power available and the idling power, until the maximum level of the
hydrogen storage is reached and the electrolyser is switched off.
If the electrolyser is OFF, the Electrolyzer Setpoint Power is equal to the idling
power, unless the minimum level of the hydrogen storage is reached and the
electrolyser is switched on.
The core of the control of the engine is performed by a set of equations in the
equation processor Pbusbar. In the same way as the Electrolyser controller does,
these equations link the operation of the engine with the level of the biogas storage.
It also calculates the available power for the electrolyser, the amount of power that
has to be imported from the grid and the amount of power to be exported. These
equations are presented in the table below:
Table 9: Equations used in the control loop of the biogas engine
Equations
HighLevelControl GT(BiogasTankLevel,BiogasLevelMax)
LowLevelControl GT(BiogasTankLevel,BiogasLevelMin)
State GT(Ptotal,0)
CheckHigh EQL(State,1)
Switch CheckHigh*HighLevelControl+CheckLow*LowLevelControl
Grid_export abs(min(Load+PSP_ely+Pcompressor-Ptotal,0))
Grid_import abs(max(Load-Ptotal,0))
Pely Switch*Pelymax
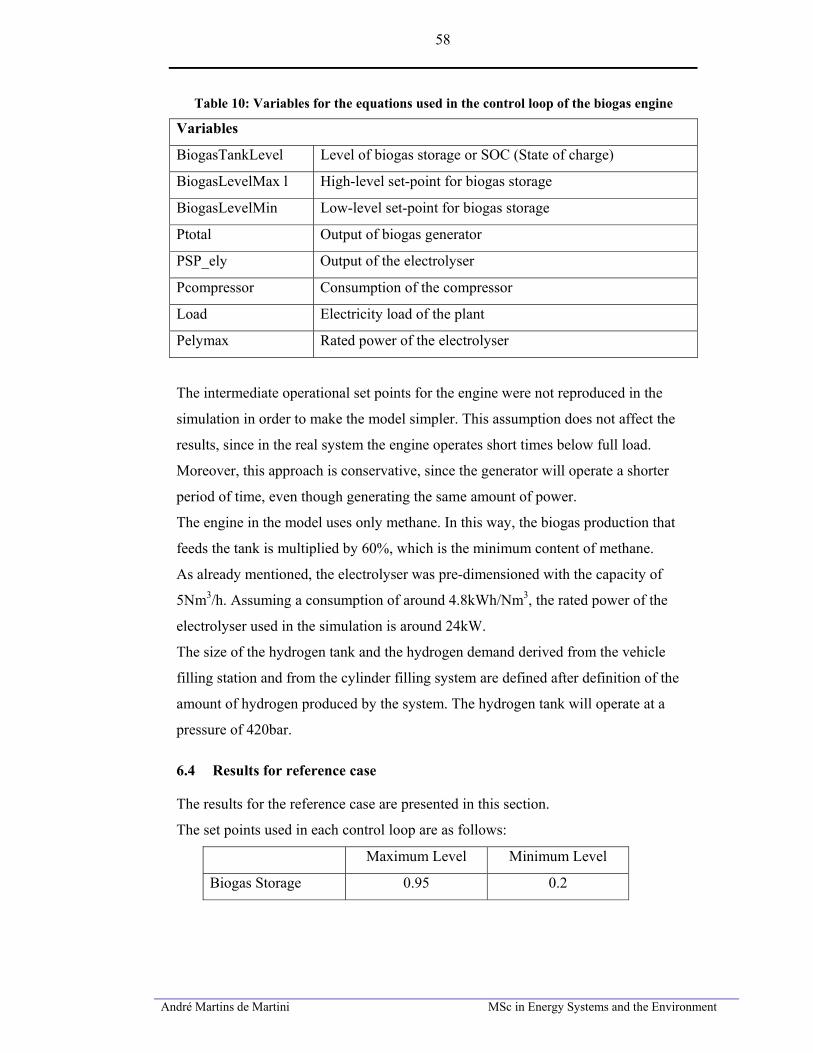
André Martins de Martini MSc in Energy Systems and the Environment
58
Table 10: Variables for the equations used in the control loop of the biogas engine
Variables
BiogasTankLevel Level of biogas storage or SOC (State of charge)
BiogasLevelMax l High-level set-point for biogas storage
BiogasLevelMin Low-level set-point for biogas storage
Ptotal Output of biogas generator
PSP_ely Output of the electrolyser
Pcompressor Consumption of the compressor
Load Electricity load of the plant
Pelymax Rated power of the electrolyser
The intermediate operational set points for the engine were not reproduced in the
simulation in order to make the model simpler. This assumption does not affect the
results, since in the real system the engine operates short times below full load.
Moreover, this approach is conservative, since the generator will operate a shorter
period of time, even though generating the same amount of power.
The engine in the model uses only methane. In this way, the biogas production that
feeds the tank is multiplied by 60%, which is the minimum content of methane.
As already mentioned, the electrolyser was pre-dimensioned with the capacity of
5Nm3/h. Assuming a consumption of around 4.8kWh/Nm3, the rated power of the
electrolyser used in the simulation is around 24kW.
The size of the hydrogen tank and the hydrogen demand derived from the vehicle
filling station and from the cylinder filling system are defined after definition of the
amount of hydrogen produced by the system. The hydrogen tank will operate at a
pressure of 420bar.
6.4 Results for reference case
The results for the reference case are presented in this section.
The set points used in each control loop are as follows:
Maximum Level Minimum Level
Biogas Storage 0.95 0.2
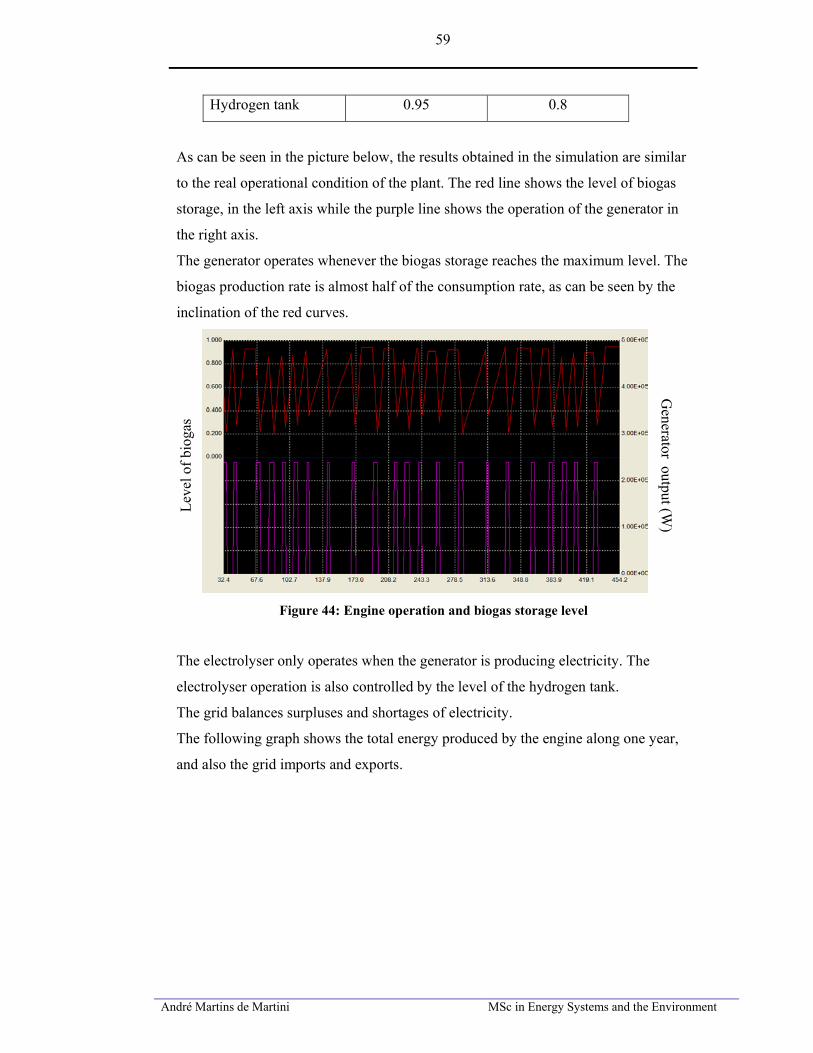
André Martins de Martini MSc in Energy Systems and the Environment
59
Hydrogen tank 0.95 0.8
As can be seen in the picture below, the results obtained in the simulation are similar
to the real operational condition of the plant. The red line shows the level of biogas
storage, in the left axis while the purple line shows the operation of the generator in
the right axis.
The generator operates whenever the biogas storage reaches the maximum level. The
biogas production rate is almost half of the consumption rate, as can be seen by the
inclination of the red curves.
Leve
l of b
ioga
s
Generator output (W
)
Figure 44: Engine operation and biogas storage level
The electrolyser only operates when the generator is producing electricity. The
electrolyser operation is also controlled by the level of the hydrogen tank.
The grid balances surpluses and shortages of electricity.
The following graph shows the total energy produced by the engine along one year,
and also the grid imports and exports.
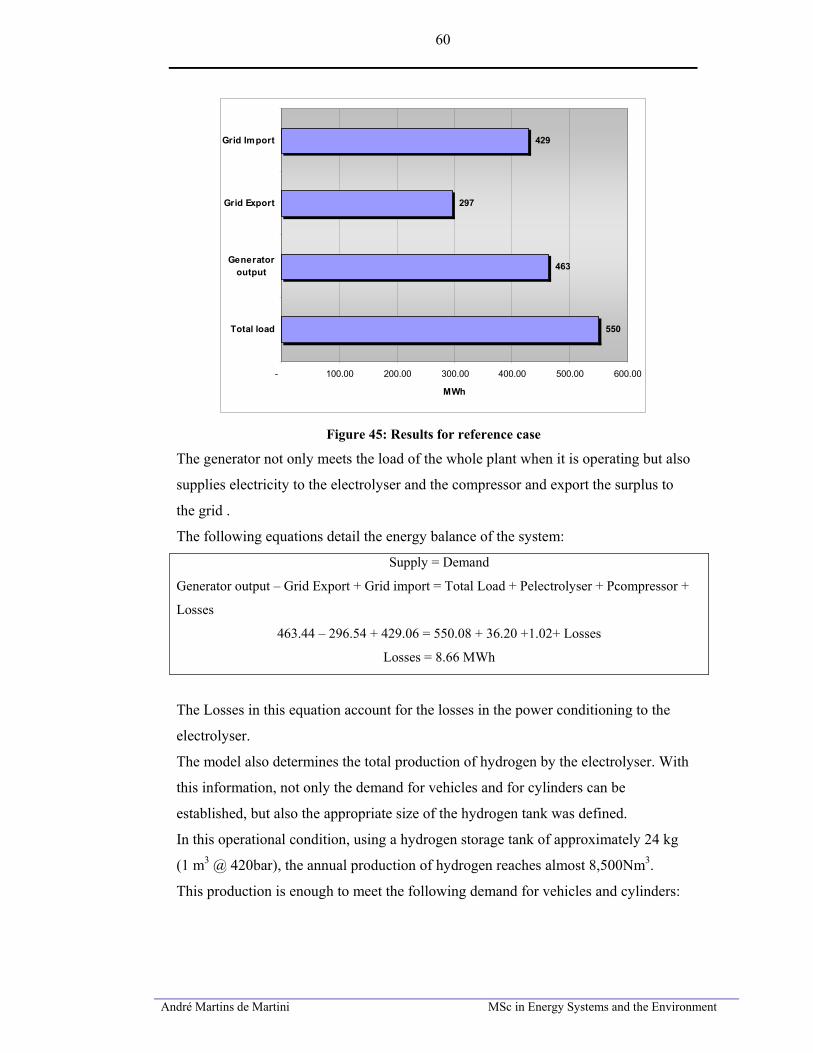
André Martins de Martini MSc in Energy Systems and the Environment
60
550
463
297
429
- 100.00 200.00 300.00 400.00 500.00 600.00
Total load
Generatoroutput
Grid Export
Grid Import
MWh
Figure 45: Results for reference case
The generator not only meets the load of the whole plant when it is operating but also
supplies electricity to the electrolyser and the compressor and export the surplus to
the grid .
The following equations detail the energy balance of the system:
Supply = Demand
Generator output – Grid Export + Grid import = Total Load + Pelectrolyser + Pcompressor +
Losses
463.44 – 296.54 + 429.06 = 550.08 + 36.20 +1.02+ Losses
Losses = 8.66 MWh
The Losses in this equation account for the losses in the power conditioning to the
electrolyser.
The model also determines the total production of hydrogen by the electrolyser. With
this information, not only the demand for vehicles and for cylinders can be
established, but also the appropriate size of the hydrogen tank was defined.
In this operational condition, using a hydrogen storage tank of approximately 24 kg
(1 m3 @ 420bar), the annual production of hydrogen reaches almost 8,500Nm3.
This production is enough to meet the following demand for vehicles and cylinders:
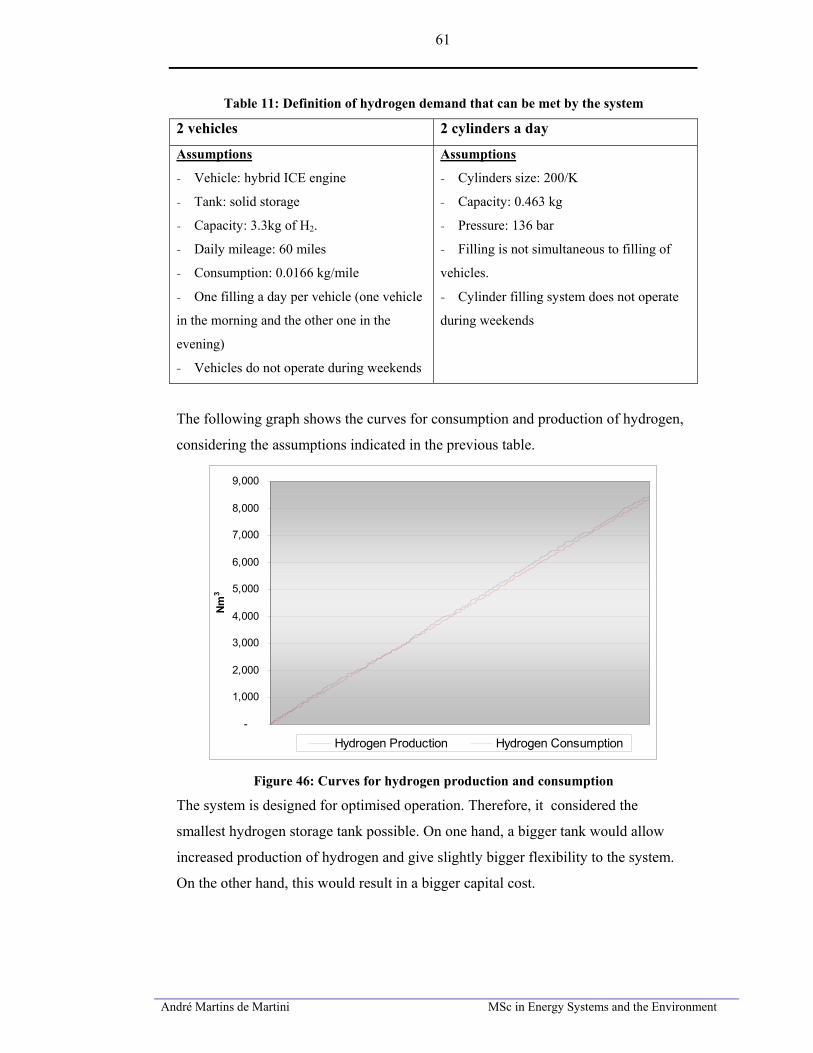
André Martins de Martini MSc in Energy Systems and the Environment
61
Table 11: Definition of hydrogen demand that can be met by the system
2 vehicles 2 cylinders a day
Assumptions
- Vehicle: hybrid ICE engine
- Tank: solid storage
- Capacity: 3.3kg of H2.
- Daily mileage: 60 miles
- Consumption: 0.0166 kg/mile
- One filling a day per vehicle (one vehicle
in the morning and the other one in the
evening)
- Vehicles do not operate during weekends
Assumptions
- Cylinders size: 200/K
- Capacity: 0.463 kg
- Pressure: 136 bar
- Filling is not simultaneous to filling of
vehicles.
- Cylinder filling system does not operate
during weekends
The following graph shows the curves for consumption and production of hydrogen,
considering the assumptions indicated in the previous table.
-
1,000
2,000
3,000
4,000
5,000
6,000
7,000
8,000
9,000
Nm3
Hydrogen Production Hydrogen Consumption
Figure 46: Curves for hydrogen production and consumption
The system is designed for optimised operation. Therefore, it considered the
smallest hydrogen storage tank possible. On one hand, a bigger tank would allow
increased production of hydrogen and give slightly bigger flexibility to the system.
On the other hand, this would result in a bigger capital cost.
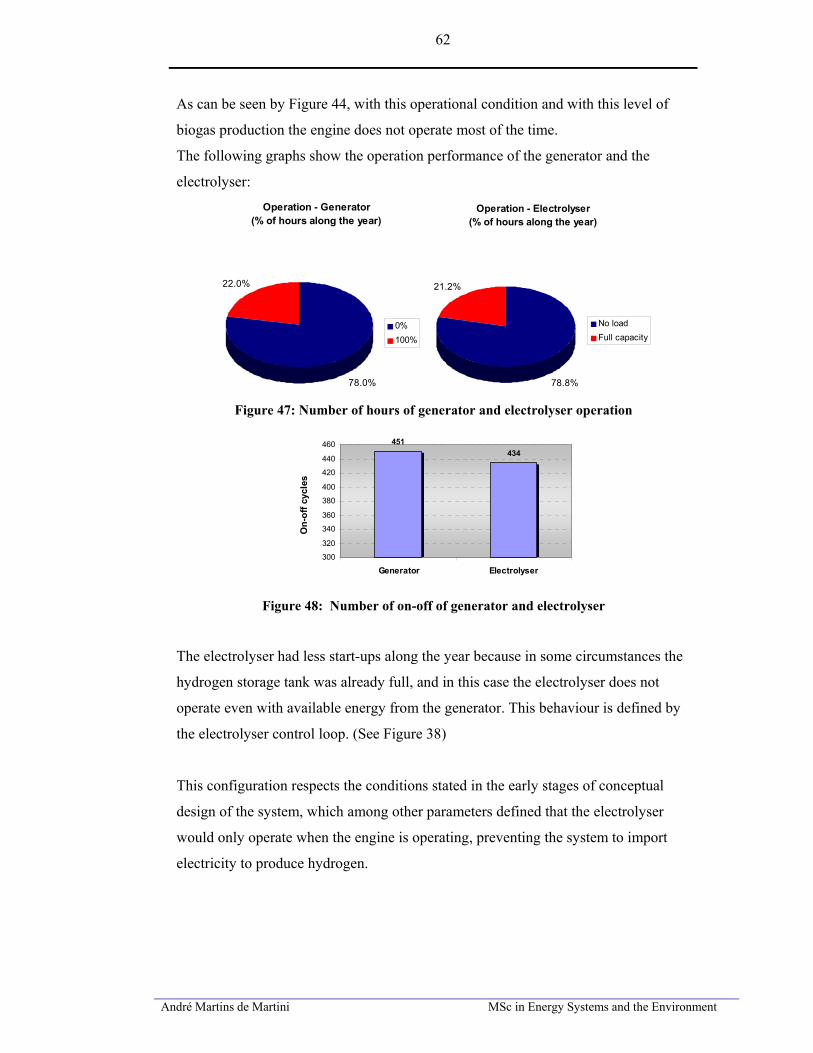
André Martins de Martini MSc in Energy Systems and the Environment
62
As can be seen by Figure 44, with this operational condition and with this level of
biogas production the engine does not operate most of the time.
The following graphs show the operation performance of the generator and the
electrolyser: Operation - Generator
(% of hours along the year)
78.0%
22.0%
0%100%
Operation - Electrolyser(% of hours along the year)
78.8%
21.2%
No loadFull capacity
Figure 47: Number of hours of generator and electrolyser operation
451434
300
320
340
360
380
400
420
440
460
Generator Electrolyser
On-
off c
ycle
s
Figure 48: Number of on-off of generator and electrolyser
The electrolyser had less start-ups along the year because in some circumstances the
hydrogen storage tank was already full, and in this case the electrolyser does not
operate even with available energy from the generator. This behaviour is defined by
the electrolyser control loop. (See Figure 38)
This configuration respects the conditions stated in the early stages of conceptual
design of the system, which among other parameters defined that the electrolyser
would only operate when the engine is operating, preventing the system to import
electricity to produce hydrogen.
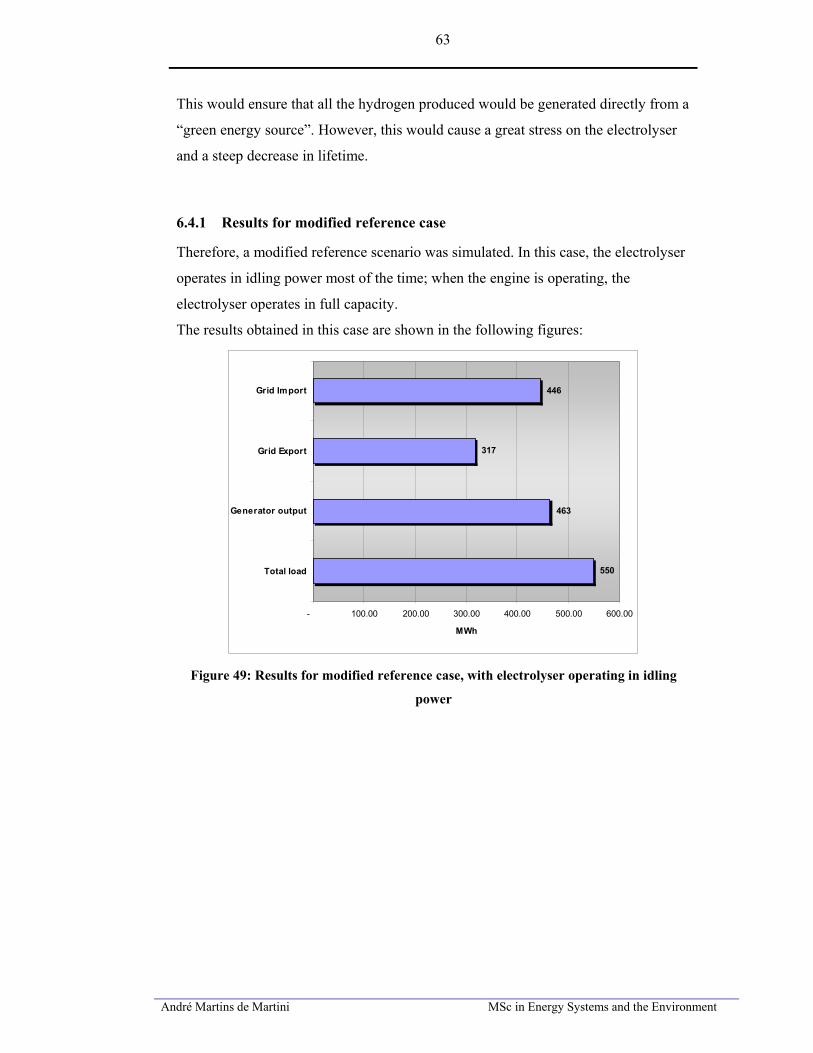
André Martins de Martini MSc in Energy Systems and the Environment
63
This would ensure that all the hydrogen produced would be generated directly from a
“green energy source”. However, this would cause a great stress on the electrolyser
and a steep decrease in lifetime.
6.4.1 Results for modified reference case
Therefore, a modified reference scenario was simulated. In this case, the electrolyser
operates in idling power most of the time; when the engine is operating, the
electrolyser operates in full capacity.
The results obtained in this case are shown in the following figures:
550
463
317
446
- 100.00 200.00 300.00 400.00 500.00 600.00
Total load
Generator output
Grid Export
Grid Import
MWh
Figure 49: Results for modified reference case, with electrolyser operating in idling
power
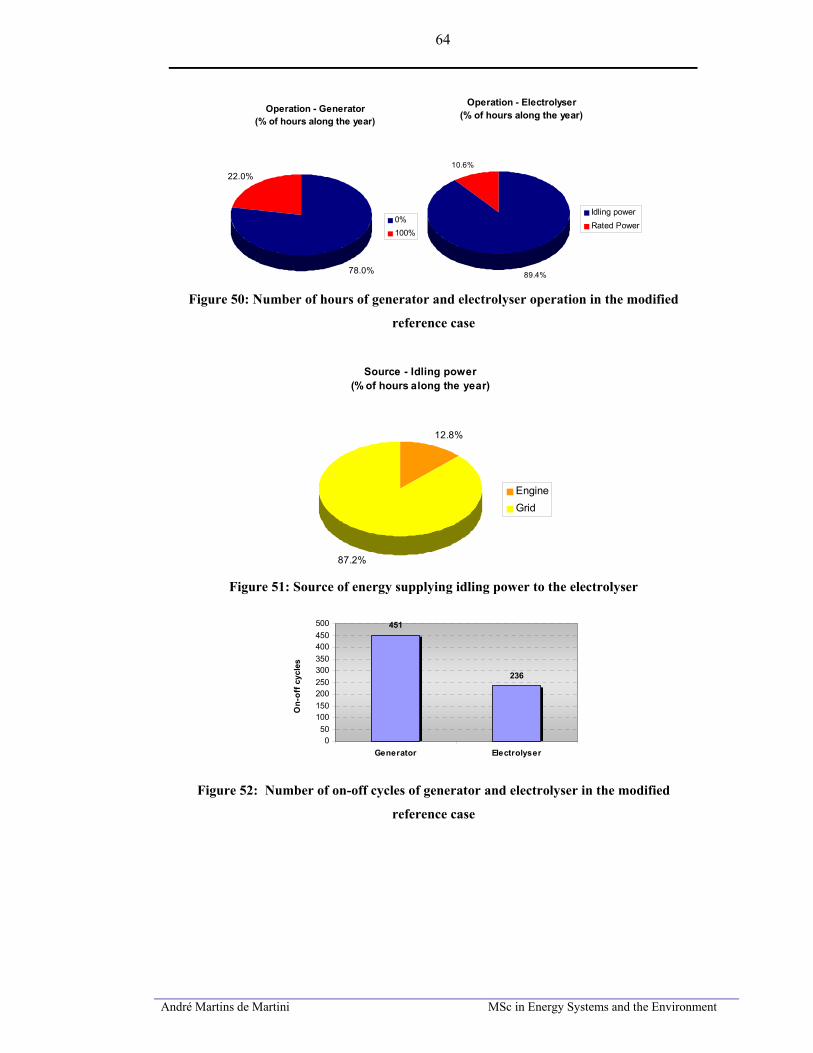
André Martins de Martini MSc in Energy Systems and the Environment
64
Operation - Generator(% of hours along the year)
78.0%
22.0%
0%100%
Operation - Electrolyser(% of hours along the year)
89.4%
10.6%
Idling powerRated Power
Figure 50: Number of hours of generator and electrolyser operation in the modified
reference case
Source - Idling power
(% of hours along the year)
12.8%
87.2%
EngineGrid
Figure 51: Source of energy supplying idling power to the electrolyser
451
236
050
100150200250300350400450500
Generator Electrolyser
On-
off c
ycle
s
Figure 52: Number of on-off cycles of generator and electrolyser in the modified
reference case
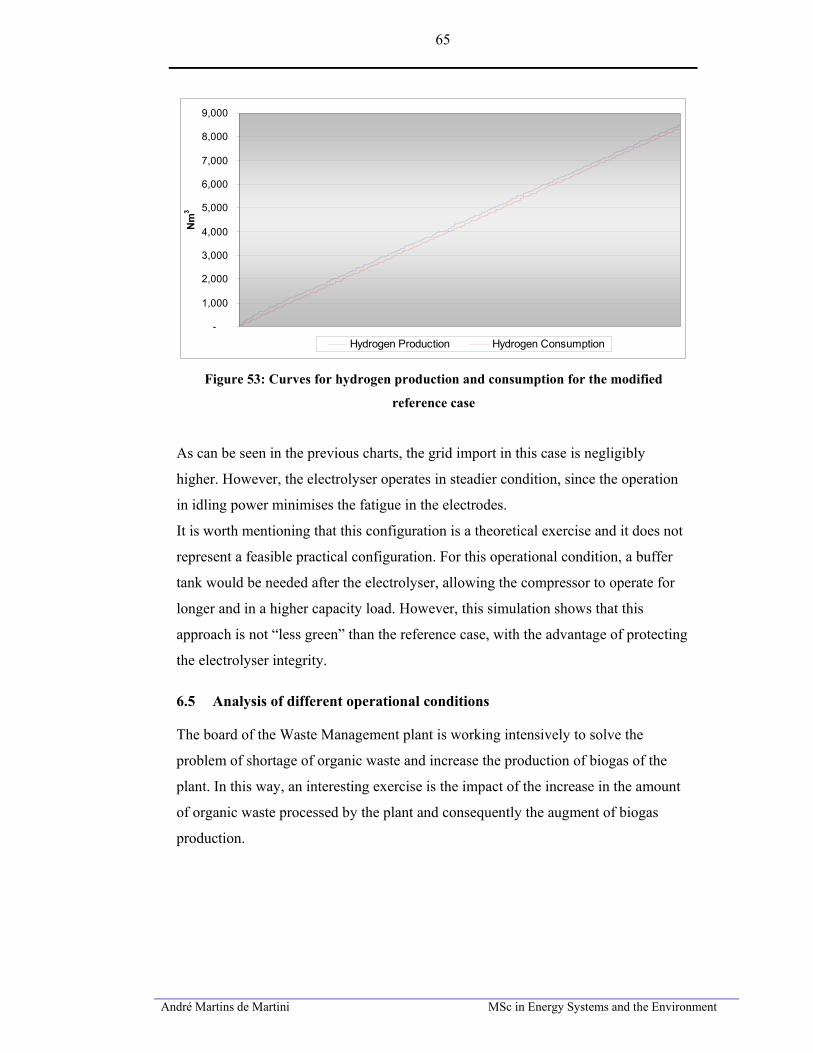
André Martins de Martini MSc in Energy Systems and the Environment
65
-
1,000
2,000
3,000
4,000
5,000
6,000
7,000
8,000
9,000
Nm
3
Hydrogen Production Hydrogen Consumption
Figure 53: Curves for hydrogen production and consumption for the modified
reference case
As can be seen in the previous charts, the grid import in this case is negligibly
higher. However, the electrolyser operates in steadier condition, since the operation
in idling power minimises the fatigue in the electrodes.
It is worth mentioning that this configuration is a theoretical exercise and it does not
represent a feasible practical configuration. For this operational condition, a buffer
tank would be needed after the electrolyser, allowing the compressor to operate for
longer and in a higher capacity load. However, this simulation shows that this
approach is not “less green” than the reference case, with the advantage of protecting
the electrolyser integrity.
6.5 Analysis of different operational conditions
The board of the Waste Management plant is working intensively to solve the
problem of shortage of organic waste and increase the production of biogas of the
plant. In this way, an interesting exercise is the impact of the increase in the amount
of organic waste processed by the plant and consequently the augment of biogas
production.
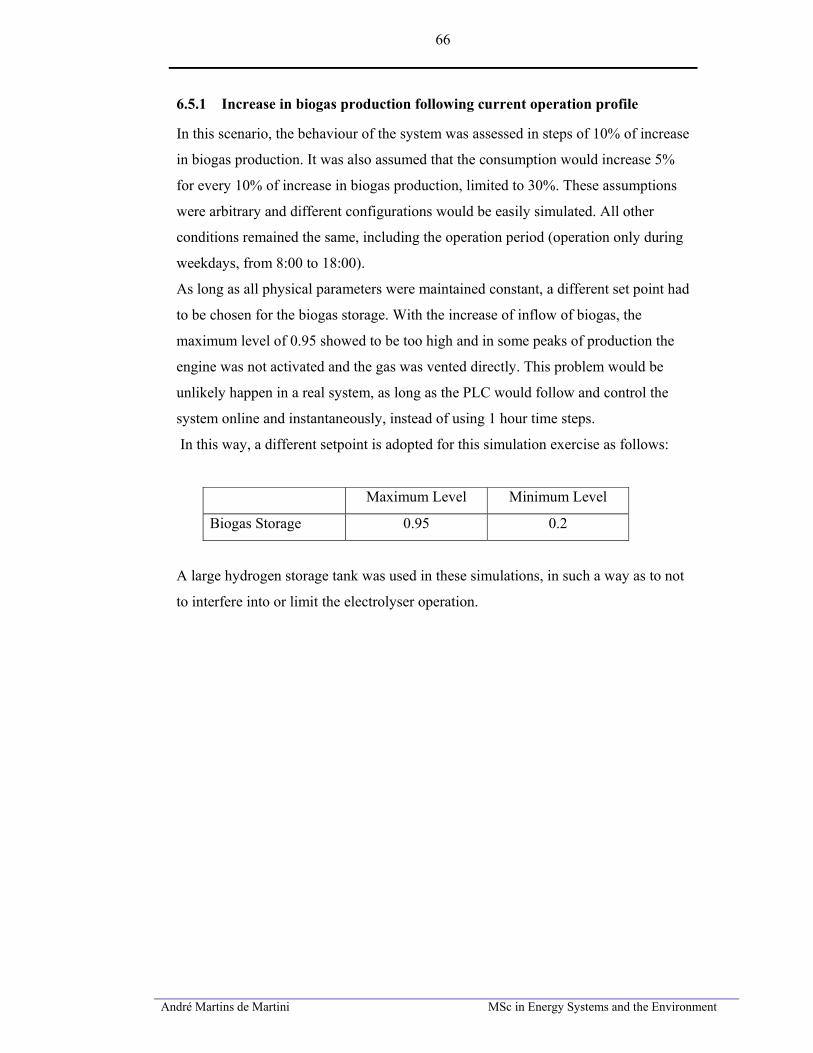
André Martins de Martini MSc in Energy Systems and the Environment
66
6.5.1 Increase in biogas production following current operation profile
In this scenario, the behaviour of the system was assessed in steps of 10% of increase
in biogas production. It was also assumed that the consumption would increase 5%
for every 10% of increase in biogas production, limited to 30%. These assumptions
were arbitrary and different configurations would be easily simulated. All other
conditions remained the same, including the operation period (operation only during
weekdays, from 8:00 to 18:00).
As long as all physical parameters were maintained constant, a different set point had
to be chosen for the biogas storage. With the increase of inflow of biogas, the
maximum level of 0.95 showed to be too high and in some peaks of production the
engine was not activated and the gas was vented directly. This problem would be
unlikely happen in a real system, as long as the PLC would follow and control the
system online and instantaneously, instead of using 1 hour time steps.
In this way, a different setpoint is adopted for this simulation exercise as follows:
Maximum Level Minimum Level
Biogas Storage 0.95 0.2
A large hydrogen storage tank was used in these simulations, in such a way as to not
to interfere into or limit the electrolyser operation.
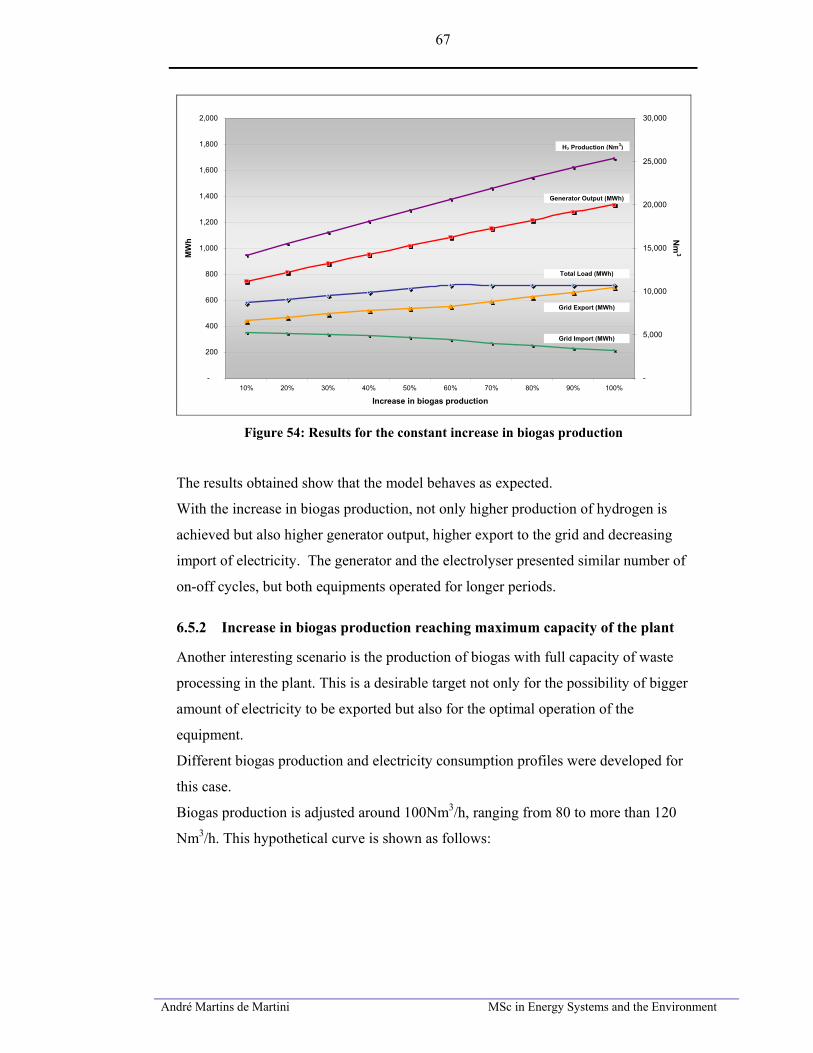
André Martins de Martini MSc in Energy Systems and the Environment
67
-
200
400
600
800
1,000
1,200
1,400
1,600
1,800
2,000
10% 20% 30% 40% 50% 60% 70% 80% 90% 100%
Increase in biogas production
MW
h
-
5,000
10,000
15,000
20,000
25,000
30,000
Nm
3
H2 Production (Nm3)
Generator Output (MWh)
Total Load (MWh)
Grid Export (MWh)
Grid Import (MWh)
Figure 54: Results for the constant increase in biogas production
The results obtained show that the model behaves as expected.
With the increase in biogas production, not only higher production of hydrogen is
achieved but also higher generator output, higher export to the grid and decreasing
import of electricity. The generator and the electrolyser presented similar number of
on-off cycles, but both equipments operated for longer periods.
6.5.2 Increase in biogas production reaching maximum capacity of the plant
Another interesting scenario is the production of biogas with full capacity of waste
processing in the plant. This is a desirable target not only for the possibility of bigger
amount of electricity to be exported but also for the optimal operation of the
equipment.
Different biogas production and electricity consumption profiles were developed for
this case.
Biogas production is adjusted around 100Nm3/h, ranging from 80 to more than 120
Nm3/h. This hypothetical curve is shown as follows:
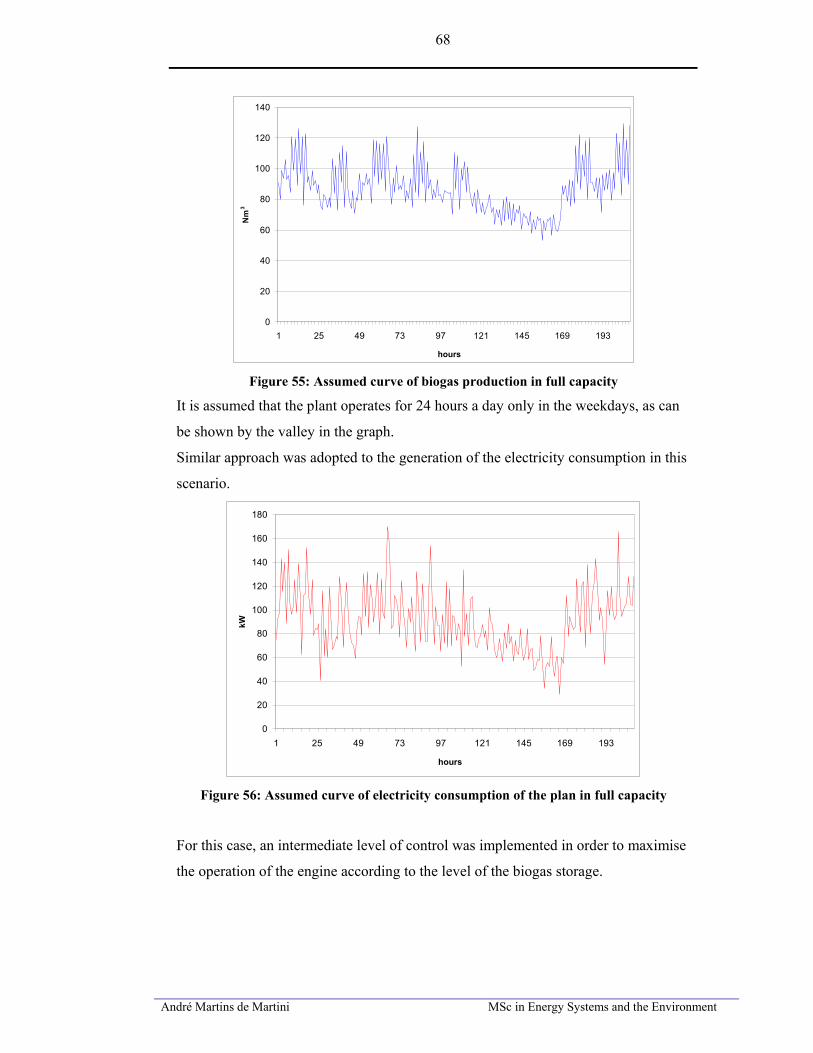
André Martins de Martini MSc in Energy Systems and the Environment
68
0
20
40
60
80
100
120
140
1 25 49 73 97 121 145 169 193
hours
Nm
3
Figure 55: Assumed curve of biogas production in full capacity
It is assumed that the plant operates for 24 hours a day only in the weekdays, as can
be shown by the valley in the graph.
Similar approach was adopted to the generation of the electricity consumption in this
scenario.
0
20
40
60
80
100
120
140
160
180
1 25 49 73 97 121 145 169 193
hours
kW
Figure 56: Assumed curve of electricity consumption of the plan in full capacity
For this case, an intermediate level of control was implemented in order to maximise
the operation of the engine according to the level of the biogas storage.
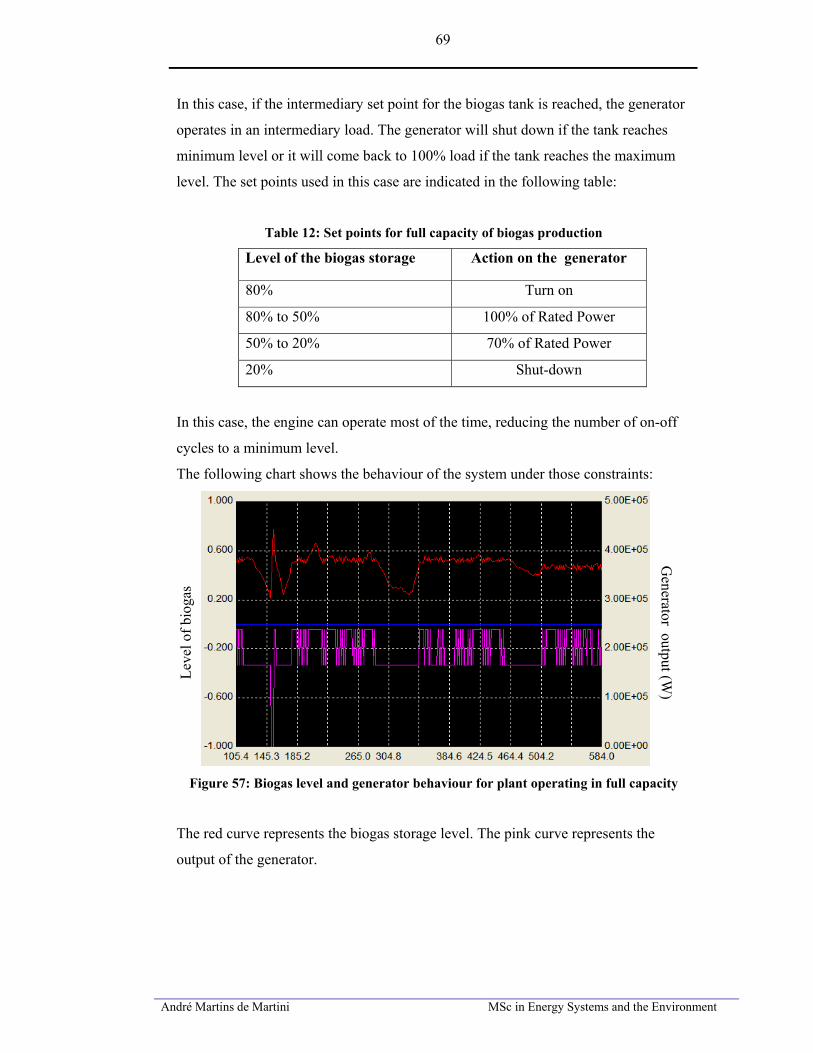
André Martins de Martini MSc in Energy Systems and the Environment
69
In this case, if the intermediary set point for the biogas tank is reached, the generator
operates in an intermediary load. The generator will shut down if the tank reaches
minimum level or it will come back to 100% load if the tank reaches the maximum
level. The set points used in this case are indicated in the following table:
Table 12: Set points for full capacity of biogas production
Level of the biogas storage Action on the generator
80% Turn on
80% to 50% 100% of Rated Power
50% to 20% 70% of Rated Power
20% Shut-down
In this case, the engine can operate most of the time, reducing the number of on-off
cycles to a minimum level.
The following chart shows the behaviour of the system under those constraints:
Leve
l of b
ioga
s
Generator output (W
)
Figure 57: Biogas level and generator behaviour for plant operating in full capacity
The red curve represents the biogas storage level. The pink curve represents the
output of the generator.
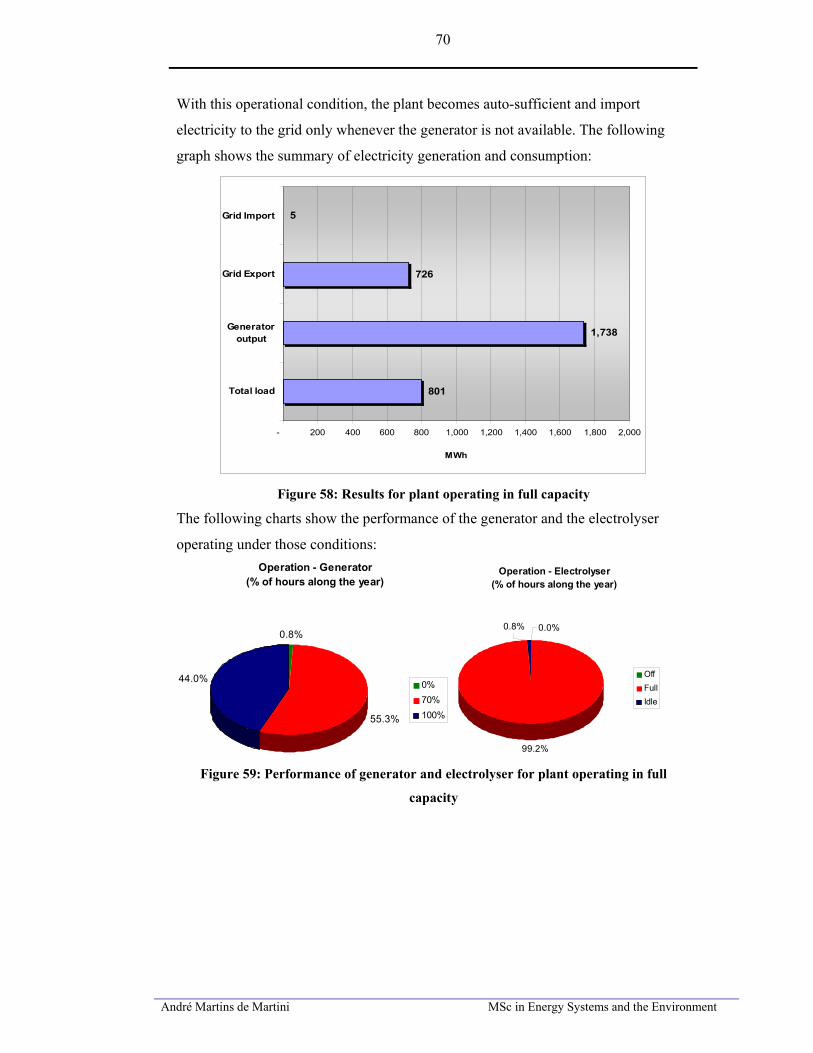
André Martins de Martini MSc in Energy Systems and the Environment
70
With this operational condition, the plant becomes auto-sufficient and import
electricity to the grid only whenever the generator is not available. The following
graph shows the summary of electricity generation and consumption:
801
1,738
726
5
- 200 400 600 800 1,000 1,200 1,400 1,600 1,800 2,000
Total load
Generatoroutput
Grid Export
Grid Import
MWh
Figure 58: Results for plant operating in full capacity
The following charts show the performance of the generator and the electrolyser
operating under those conditions: Operation - Generator
(% of hours along the year)
0.8%
55.3%
44.0% 0%70%100%
Operation - Electrolyser(% of hours along the year)
99.2%
0.8% 0.0%
OffFullIdle
Figure 59: Performance of generator and electrolyser for plant operating in full
capacity
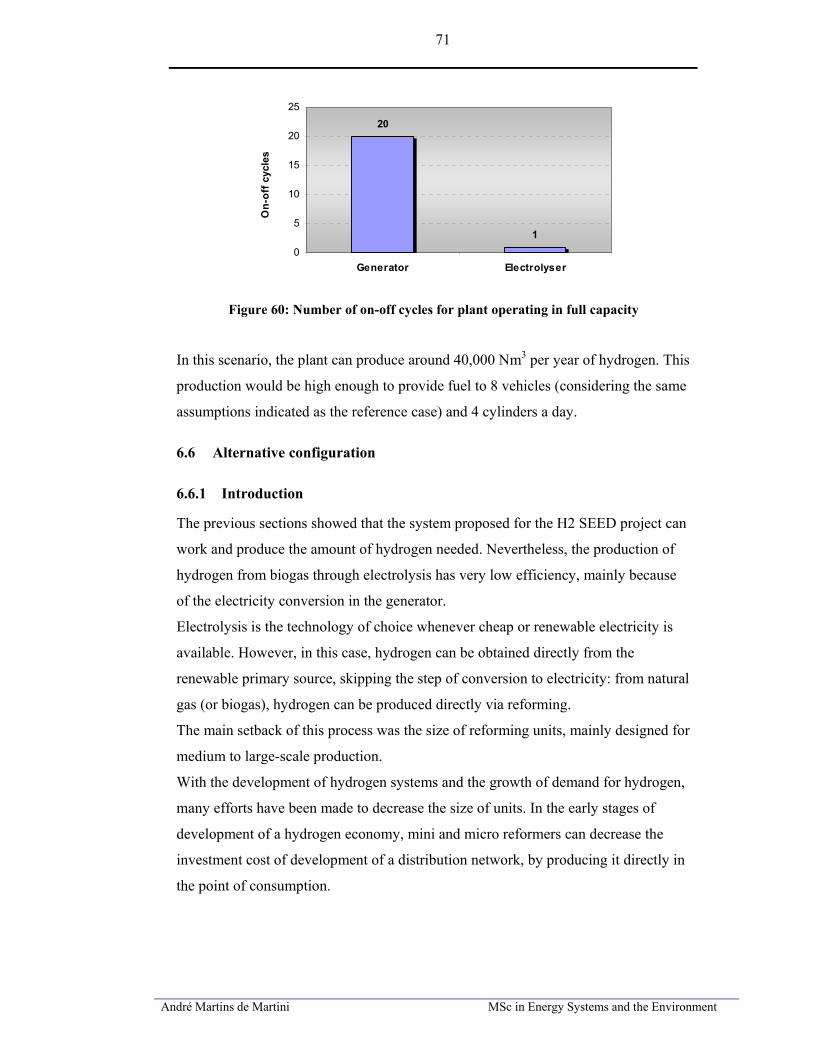
André Martins de Martini MSc in Energy Systems and the Environment
71
20
10
5
10
15
20
25
Generator ElectrolyserO
n-of
f cyc
les
Figure 60: Number of on-off cycles for plant operating in full capacity
In this scenario, the plant can produce around 40,000 Nm3 per year of hydrogen. This
production would be high enough to provide fuel to 8 vehicles (considering the same
assumptions indicated as the reference case) and 4 cylinders a day.
6.6 Alternative configuration
6.6.1 Introduction
The previous sections showed that the system proposed for the H2 SEED project can
work and produce the amount of hydrogen needed. Nevertheless, the production of
hydrogen from biogas through electrolysis has very low efficiency, mainly because
of the electricity conversion in the generator.
Electrolysis is the technology of choice whenever cheap or renewable electricity is
available. However, in this case, hydrogen can be obtained directly from the
renewable primary source, skipping the step of conversion to electricity: from natural
gas (or biogas), hydrogen can be produced directly via reforming.
The main setback of this process was the size of reforming units, mainly designed for
medium to large-scale production.
With the development of hydrogen systems and the growth of demand for hydrogen,
many efforts have been made to decrease the size of units. In the early stages of
development of a hydrogen economy, mini and micro reformers can decrease the
investment cost of development of a distribution network, by producing it directly in
the point of consumption.
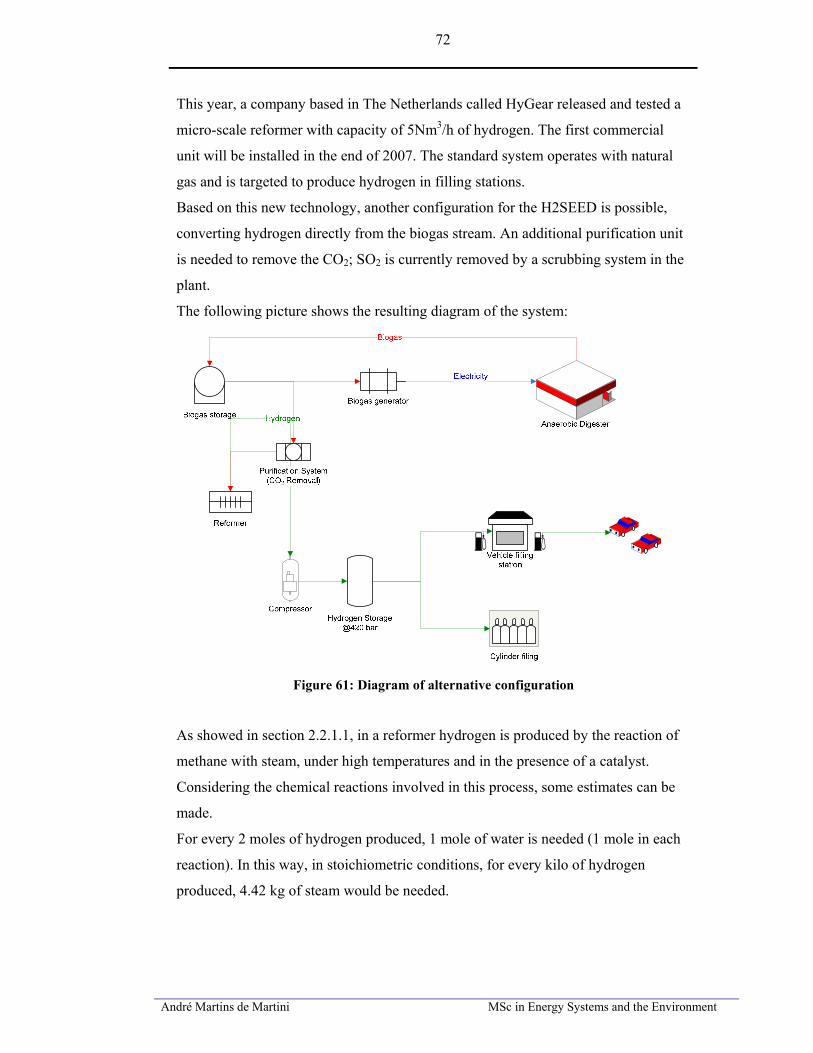
André Martins de Martini MSc in Energy Systems and the Environment
72
This year, a company based in The Netherlands called HyGear released and tested a
micro-scale reformer with capacity of 5Nm3/h of hydrogen. The first commercial
unit will be installed in the end of 2007. The standard system operates with natural
gas and is targeted to produce hydrogen in filling stations.
Based on this new technology, another configuration for the H2SEED is possible,
converting hydrogen directly from the biogas stream. An additional purification unit
is needed to remove the CO2; SO2 is currently removed by a scrubbing system in the
plant.
The following picture shows the resulting diagram of the system:
Figure 61: Diagram of alternative configuration
As showed in section 2.2.1.1, in a reformer hydrogen is produced by the reaction of
methane with steam, under high temperatures and in the presence of a catalyst.
Considering the chemical reactions involved in this process, some estimates can be
made.
For every 2 moles of hydrogen produced, 1 mole of water is needed (1 mole in each
reaction). In this way, in stoichiometric conditions, for every kilo of hydrogen
produced, 4.42 kg of steam would be needed.

André Martins de Martini MSc in Energy Systems and the Environment
73
Considering the difference of enthalpy between water and steam, the energy required
for a given flow rate of hydrogen can be easily determined, as showed in the
following mass and energy balance:
Enthalpy - H2O @ 20oC 506,609.00 J/kg (a)Enthalpy - H2O @ 800oC 4,157,410.00 J/kg (b)(b) - (a) 3,650,801.00 J/kg
Consumption of steam 4.42 kg of H2O/kg H2
Heat required 16,124,371.08 J/kg H2
orHeat required 1,449,580.96 J/m3 of H2
Considering the capacity of the reformer as 5Nm3/h, the power needed for the steam
generator is expressed as follows:
Hydrogen Flow rate 5 Nm3/h
Power 7,247,904.80 J/hPower (kW) 2.01 kW
Efficiency - steam generator 50%Heat consumed 4.03 kW
Waste heat from the generator can be used to generate steam to run the reaction,
since excess heat is currently available.
6.6.2 Model description and assumptions
In order to verify the feasibility of the alternative configuration, a simple model was
prepared in TRNSYS. A set of equations were inserted representing the new
reformer in the level of mass and energy balance. A future improvement of this
model is the development of a component for reformer units in TRNSYS, as will be
discussed in section 7.3.
All the results obtained are presented in comparison to the reference configuration,
using the same parameters.
The main assumptions in this model are:
- The reformer only works during normal operating hours of the plant
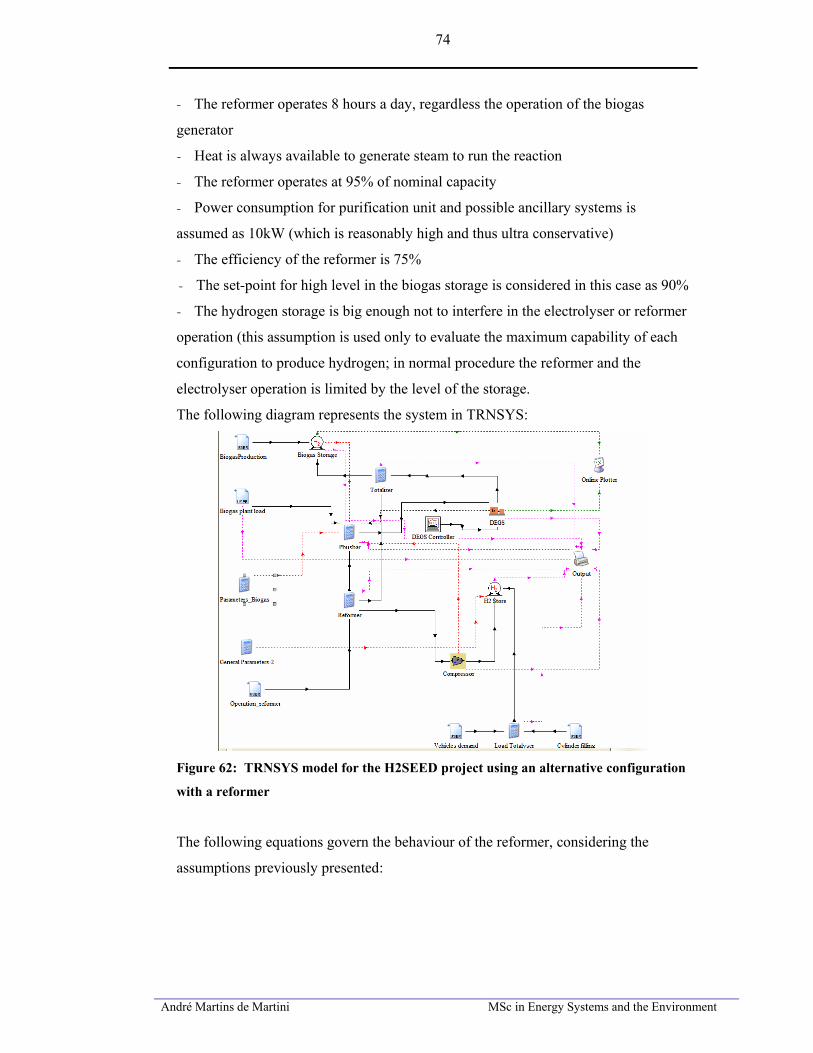
André Martins de Martini MSc in Energy Systems and the Environment
74
- The reformer operates 8 hours a day, regardless the operation of the biogas
generator
- Heat is always available to generate steam to run the reaction
- The reformer operates at 95% of nominal capacity
- Power consumption for purification unit and possible ancillary systems is
assumed as 10kW (which is reasonably high and thus ultra conservative)
- The efficiency of the reformer is 75%
- The set-point for high level in the biogas storage is considered in this case as 90%
- The hydrogen storage is big enough not to interfere in the electrolyser or reformer
operation (this assumption is used only to evaluate the maximum capability of each
configuration to produce hydrogen; in normal procedure the reformer and the
electrolyser operation is limited by the level of the storage.
The following diagram represents the system in TRNSYS:
Figure 62: TRNSYS model for the H2SEED project using an alternative configuration
with a reformer
The following equations govern the behaviour of the reformer, considering the
assumptions previously presented:
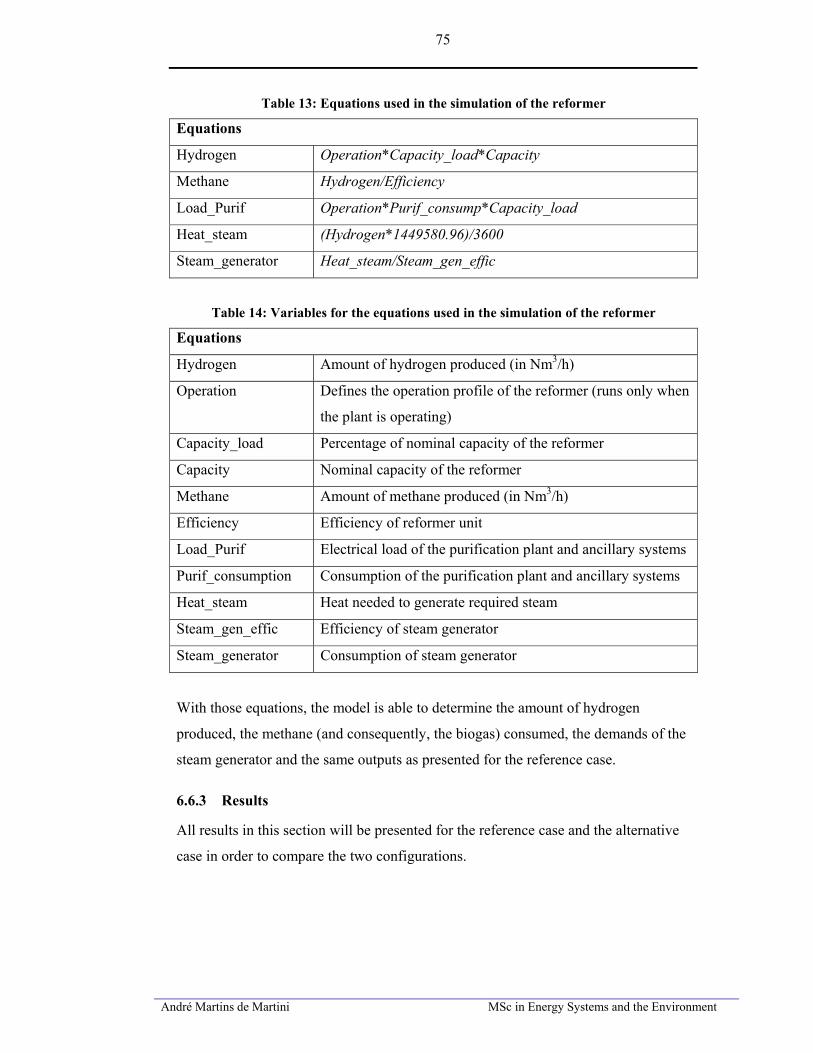
André Martins de Martini MSc in Energy Systems and the Environment
75
Table 13: Equations used in the simulation of the reformer
Equations
Hydrogen Operation*Capacity_load*Capacity
Methane Hydrogen/Efficiency
Load_Purif Operation*Purif_consump*Capacity_load
Heat_steam (Hydrogen*1449580.96)/3600
Steam_generator Heat_steam/Steam_gen_effic
Table 14: Variables for the equations used in the simulation of the reformer
Equations
Hydrogen Amount of hydrogen produced (in Nm3/h)
Operation Defines the operation profile of the reformer (runs only when
the plant is operating)
Capacity_load Percentage of nominal capacity of the reformer
Capacity Nominal capacity of the reformer
Methane Amount of methane produced (in Nm3/h)
Efficiency Efficiency of reformer unit
Load_Purif Electrical load of the purification plant and ancillary systems
Purif_consumption Consumption of the purification plant and ancillary systems
Heat_steam Heat needed to generate required steam
Steam_gen_effic Efficiency of steam generator
Steam_generator Consumption of steam generator
With those equations, the model is able to determine the amount of hydrogen
produced, the methane (and consequently, the biogas) consumed, the demands of the
steam generator and the same outputs as presented for the reference case.
6.6.3 Results
All results in this section will be presented for the reference case and the alternative
case in order to compare the two configurations.
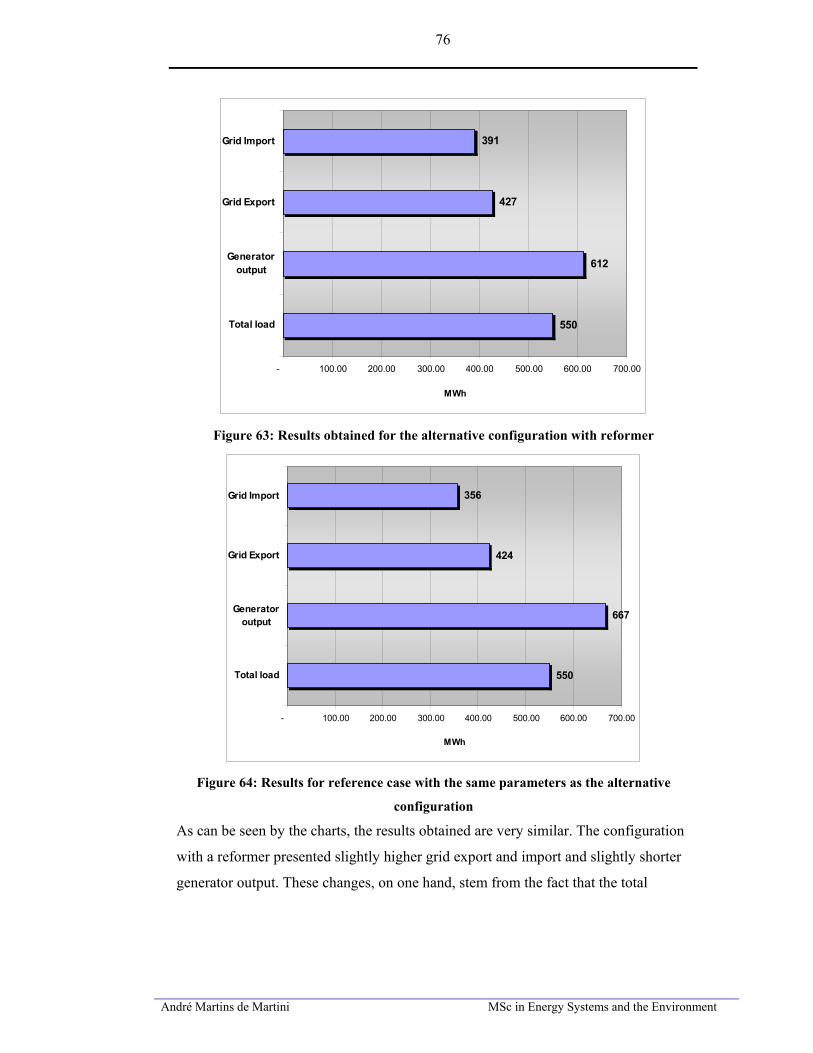
André Martins de Martini MSc in Energy Systems and the Environment
76
550
612
427
391
- 100.00 200.00 300.00 400.00 500.00 600.00 700.00
Total load
Generatoroutput
Grid Export
Grid Import
MWh
Figure 63: Results obtained for the alternative configuration with reformer
550
667
424
356
- 100.00 200.00 300.00 400.00 500.00 600.00 700.00
Total load
Generatoroutput
Grid Export
Grid Import
MWh
Figure 64: Results for reference case with the same parameters as the alternative
configuration
As can be seen by the charts, the results obtained are very similar. The configuration
with a reformer presented slightly higher grid export and import and slightly shorter
generator output. These changes, on one hand, stem from the fact that the total
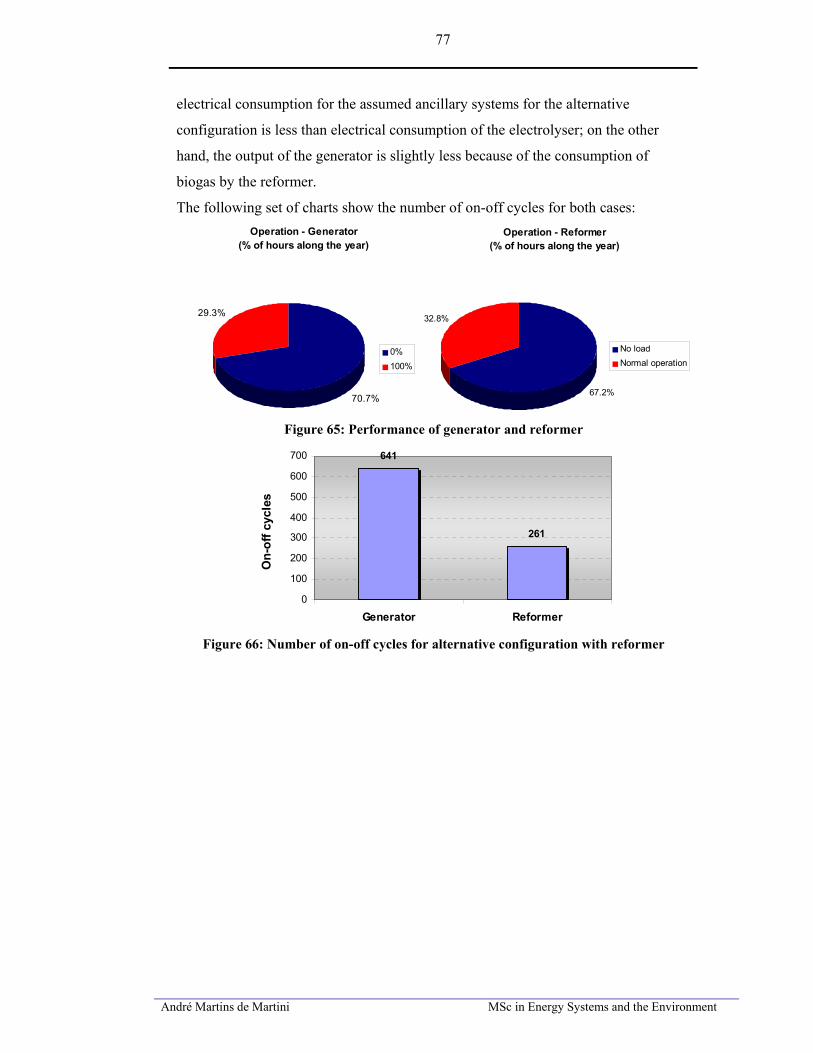
André Martins de Martini MSc in Energy Systems and the Environment
77
electrical consumption for the assumed ancillary systems for the alternative
configuration is less than electrical consumption of the electrolyser; on the other
hand, the output of the generator is slightly less because of the consumption of
biogas by the reformer.
The following set of charts show the number of on-off cycles for both cases:
Operation - Generator(% of hours along the year)
70.7%
29.3%
0%100%
Operation - Reformer(% of hours along the year)
67.2%
32.8%
No loadNormal operation
Figure 65: Performance of generator and reformer
641
261
0
100
200
300
400
500
600
700
Generator Reformer
On-
off c
ycle
s
Figure 66: Number of on-off cycles for alternative configuration with reformer
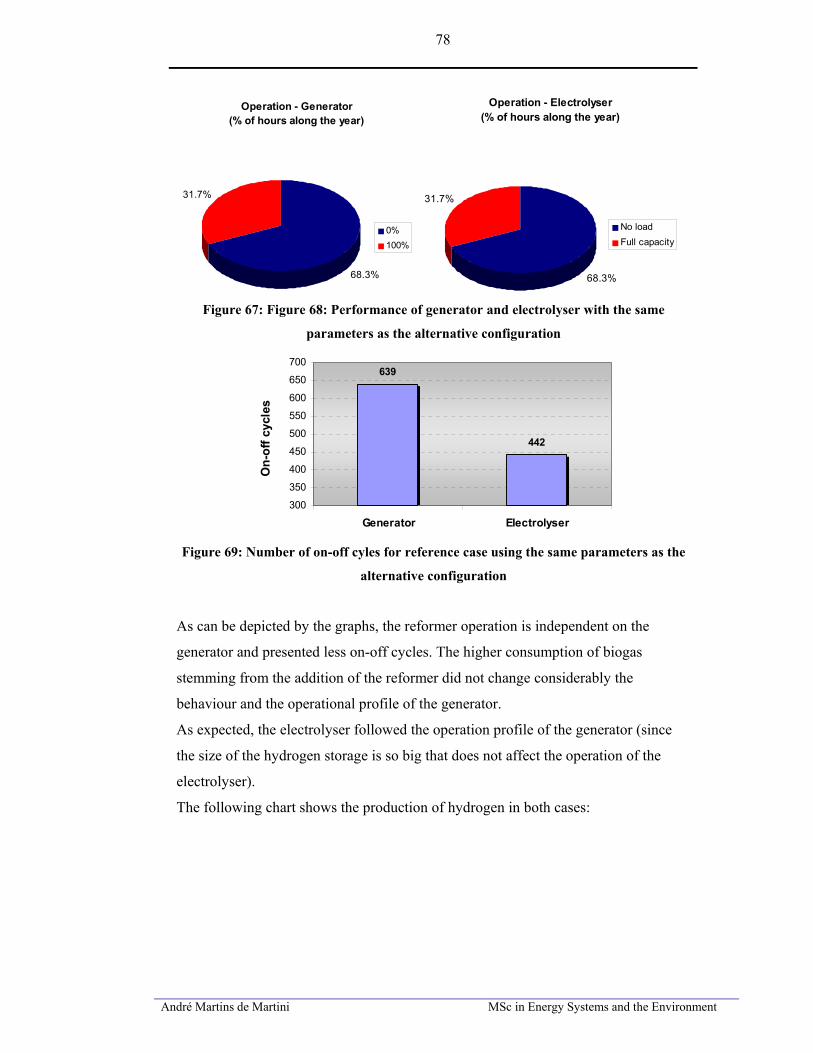
André Martins de Martini MSc in Energy Systems and the Environment
78
Operation - Generator(% of hours along the year)
68.3%
31.7%
0%100%
Operation - Electrolyser(% of hours along the year)
68.3%
31.7%
No loadFull capacity
Figure 67: Figure 68: Performance of generator and electrolyser with the same
parameters as the alternative configuration
639
442
300
350
400
450
500
550
600
650
700
Generator Electrolyser
On-
off c
ycle
s
Figure 69: Number of on-off cyles for reference case using the same parameters as the
alternative configuration
As can be depicted by the graphs, the reformer operation is independent on the
generator and presented less on-off cycles. The higher consumption of biogas
stemming from the addition of the reformer did not change considerably the
behaviour and the operational profile of the generator.
As expected, the electrolyser followed the operation profile of the generator (since
the size of the hydrogen storage is so big that does not affect the operation of the
electrolyser).
The following chart shows the production of hydrogen in both cases:
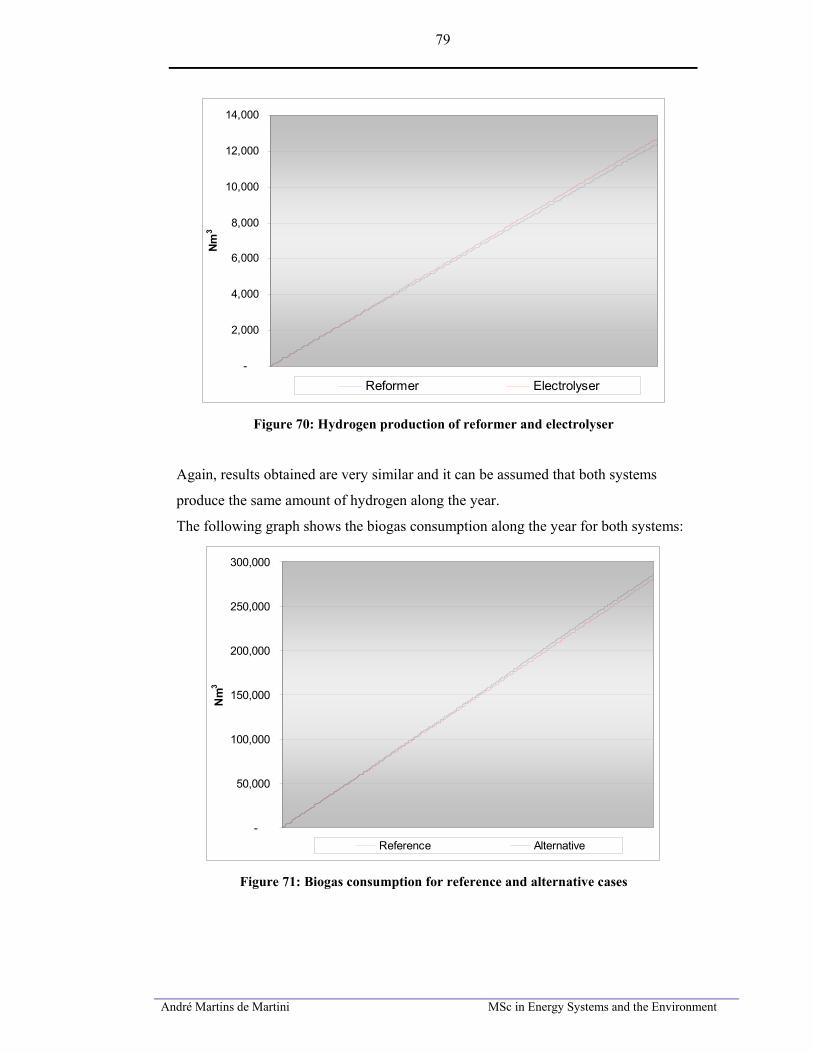
André Martins de Martini MSc in Energy Systems and the Environment
79
-
2,000
4,000
6,000
8,000
10,000
12,000
14,000
Nm
3
Reformer Electrolyser
Figure 70: Hydrogen production of reformer and electrolyser
Again, results obtained are very similar and it can be assumed that both systems
produce the same amount of hydrogen along the year.
The following graph shows the biogas consumption along the year for both systems:
-
50,000
100,000
150,000
200,000
250,000
300,000
Nm
3
Reference Alternative
Figure 71: Biogas consumption for reference and alternative cases
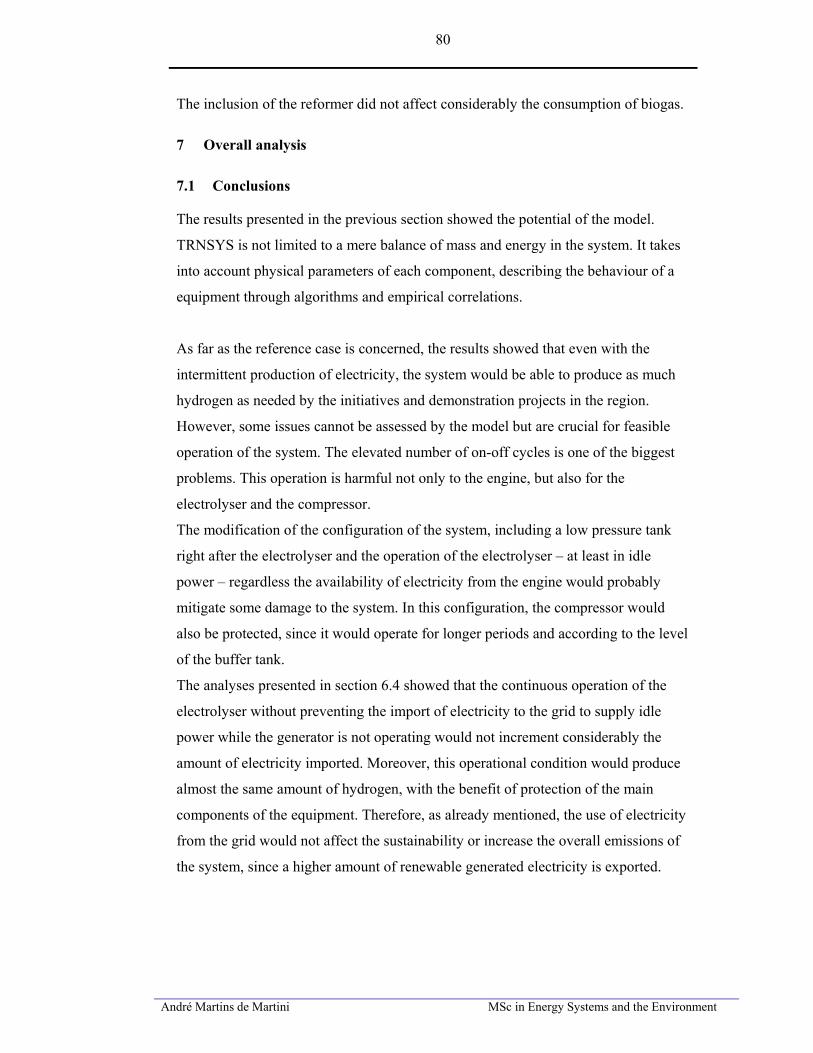
André Martins de Martini MSc in Energy Systems and the Environment
80
The inclusion of the reformer did not affect considerably the consumption of biogas.
7 Overall analysis
7.1 Conclusions
The results presented in the previous section showed the potential of the model.
TRNSYS is not limited to a mere balance of mass and energy in the system. It takes
into account physical parameters of each component, describing the behaviour of a
equipment through algorithms and empirical correlations.
As far as the reference case is concerned, the results showed that even with the
intermittent production of electricity, the system would be able to produce as much
hydrogen as needed by the initiatives and demonstration projects in the region.
However, some issues cannot be assessed by the model but are crucial for feasible
operation of the system. The elevated number of on-off cycles is one of the biggest
problems. This operation is harmful not only to the engine, but also for the
electrolyser and the compressor.
The modification of the configuration of the system, including a low pressure tank
right after the electrolyser and the operation of the electrolyser – at least in idle
power – regardless the availability of electricity from the engine would probably
mitigate some damage to the system. In this configuration, the compressor would
also be protected, since it would operate for longer periods and according to the level
of the buffer tank.
The analyses presented in section 6.4 showed that the continuous operation of the
electrolyser without preventing the import of electricity to the grid to supply idle
power while the generator is not operating would not increment considerably the
amount of electricity imported. Moreover, this operational condition would produce
almost the same amount of hydrogen, with the benefit of protection of the main
components of the equipment. Therefore, as already mentioned, the use of electricity
from the grid would not affect the sustainability or increase the overall emissions of
the system, since a higher amount of renewable generated electricity is exported.

André Martins de Martini MSc in Energy Systems and the Environment
81
As far as the alternative configuration is concerned, the simulation showed that a
micro-reformer would also be suitable for the H2 SEED project. Even with the ultra-
conservative assumptions adopted, the system with a reformer produced satisfactory
amount of hydrogen in order to meet the forecasted demand.
The higher efficiency of the conversion in the reformer did no affect considerably the
results, since the hydrogen production unit and the load involved in its operation for
both cases are too small when compared to the generator output and the load of the
plant.
The benefits brought by the reformer rely on lifetime and investment cost.
The reformer unit seems to be less sensitive to the number of on-off cycles than an
electrolyser, even thus this operation is not ideal for the equipment either. The
demand for CO2 removal on biogas stream does not seem to be a setback, since a
scrubbing system for sulphur removal is already installed and operating.
Considering the investment costs, the preliminary estimates for both systems
presented similar values.
Therefore, the simulation did not show any remarkable advantage in any of the
systems studied. In order to select the preferred system, a more accurate and detailed
design would be needed.
Given that the engine is available, installed and working, the cheaper and most
effective approach to increase the performance of the system is the increase of
organic waste and consequently the increase in biogas production. A set of smaller
engines that would operate in higher capacity load for longer periods of time would
be more suitable for the profile of fuel availability and load variation, not mentioning
the benefits from redundancy and back-up operation. Nevertheless, the investment
commitment to implement this modification would be too high, even considering the
possible damage that this operational profile can cause in the current engine.
Several alternative sources of organic matter are under analysis in order to increase
biogas production. Among several possibilities, possible sources are:

André Martins de Martini MSc in Energy Systems and the Environment
82
- Increase of segregation of organic waste from the community, arising from
educational program and environmental awareness
- organic waste from neighbour regions that do not have digester or incineration
facilities
- sludge from wastewater treatment from the local council
- residues from fish farming and fish industry
- vegetable waste from food processing
The main reasoning for the project at first was the fact that in early stages of
operation electricity was not exported to the grid. With the availability of a free
surplus of electricity, the production of hydrogen was one of the obvious answers.
However, the research and development prospects with a project like this are benefits
that cannot be measured in terms of pay-back period and investment cost. This
project can be a landmark on hydrogen technologies in the region, putting the
Western Isles in the avant-garde of renewable energy development.
7.2 Alternative configurations
Considering the current technological development, several options are available to
this system. The rationale behind the choice of a gas engine to provide electricity and
heat relies on economical factors and maturity of technology.
A good alternative to the engine would be a stationary fuel cell. Solid oxide and
molten carbonate fuel cells can produce electricity directly from biogas. The high
content of carbon dioxide helps the internal reforming of methane. The overall
efficiency of the system is higher and the emissions considerably lower.
However, these technologies are under development yet.
As a result, the capital investment of a system of this size would exceed many times
the cost of the engine. Moreover, short lifetime is still an issue. Purification of the
biogas would be also be required.
André Martins de Martini MSc in Energy Systems and the Environment
83
7.3 Recommendations for further research
This study can be easily expanded due to the flexibility of the model and the different
alternatives that can be tested not only for the hydrogen plant but also for the
anaerobic digester. The following topics are considered motivating challenges for
future research:
- Development of TRNSYS components for reforming systems and stationary fuel
cells
- Study in detail the constraints and equipment characteristics of the system and
propose the optimal design for systems with the same features of H2 SEED.
- Analysis of the impact of different feedstocks into the digester performance
- Comparison of efficiency and life cycle costs of reforming, fuel cell and
electrolyser systems from biogas
- Logistics and economic study of alternative sources of organic waste that would
improve the production of biogas.
7.4 Recommendations for further development in the region
The unrivalled renewable resources in Western Isles allow the development of
several initiatives with no parallel across the UK. Natural resources allied to the
energy and enthusiasm of young researchers and entrepreneurs can transform the
region into the centre of excellence of renewable technology in the UK.
Besides the wind energy projects and prospects for wave and tidal energy, the
Hebridean Hydrogen Park can lay the groundwork for the development of one of the
most promising hydrogen industries in Europe.
In this section, some complimentary projects are indicated in order to contribute to
this vision. This is not an exhaustive and ultimate review; the technologies described
here, however, can accelerate the development of hydrogen market predicted in the
third phase of the Hebridean Hydrogen Park Program.

André Martins de Martini MSc in Energy Systems and the Environment
84
Small CHP systems
This is the most prominent contribution of hydrogen to the built environment.
Currently, the maturity of technology allows the usage of small CHP systems in
domestic sectors. The barriers for development is hydrogen availability and
establishment of a distribution network of hydrogen and cost.
Systems like this can achieve great efficiencies with no emissions and can substitute
gas or diesel based systems with several advantages.
Once established the initial hydrogen production, incentives can be created for
application of small hydrogen CHP systems in new developments and
refurbishments in domestic, industrial and commercial sectors.
Hybrid stand-alone systems
Some remote areas across the Western Isles would benefit from the construction of
small stand-alone systems that would be able to provide all the energy needs of small
communities.
The PURE project developed in Shetlands is an example of the feasibility of these
systems. The availability of plentiful wind resources and hydrogen storage would
allow the implementation of similar system that would decrease the dependence on
fossil fuels from small isolated communities and potentially could decrease the
energy poverty in the region.
Development of hydrogen fuelled public fleet
The size of the public fleet in the Hebrides can be considered small enough to be
completely supplied by renewable technologies. Hydrogen or blends of hydrogen and
gas can be used to fuel buses and taxis in the region.
Research on marine propulsion devices
The Western Isles is connected to the mainland mainly by marine transport. The
constant supply of goods from mainland and people transportation is primarily done
by ferry. Annual energy demand for this sector is not negligible.

André Martins de Martini MSc in Energy Systems and the Environment
85
In this way, the region has the potential to be a testbed for development of renewable
marine technologies. Partnerships can be formed with bigger research institutions to
use the Hebrides as case study.
André Martins de Martini MSc in Energy Systems and the Environment
86
8 Bibliography
1. Hydrogen fact sheets – Hydrogen Safety. The National Hydrogen Association.
[homepage on the Internet]. Available from:
http://www.hydrogenassociation.org/general/factSheet_safety.pdf (Accessed 26
July 2007).
2. Comparative Properties of Hydrogen and Fuels. Hydrogen Analysis Resource
Center. [homepage on the Internet]. Last update: 18 January 2006. Available
from: http://hydrogen.pnl.gov/cocoon/morf/hydrogen/article/716 (Accessed 26
July 2007)
3. U.S. Department of Energy. Hydrogen, Fuel Cells and Infrastructure
Technologies Program. Fuel Cells. Available from:
http://www1.eere.energy.gov/hydrogenandfuelcells/fuelcells/current_technology
.html (Accessed 27 July 2007)
4. Cross industry developments , Energy Focus, Issue 3, 2004
5. International Energy Agency. Prospects for Hydrogen and Fuel Cells. Energy
Technology Analysis. Paris. December 2005
6. Ghirardi ML, Amos WD. Renewable hydrogen from green algae. BioCycle;
May 2004; 45, 5; ABI/INFORM Global pg. 59
7. U.S. Department of Energy. Hydrogen Program. A Prospectus for Biological H2
Production
8. U.S. Department of Energy. HFCIT Hydrogen Storage: Status of Hydrogen
Storage Technologies. Available from:
http://www1.eere.energy.gov/hydrogenandfuelcells/storage/tech_status.html
(Acessed 08 August 2007)
9. Distribution Options. Air Products and Chemicals, Inc. Available from:
http://www.airproducts.com/Products/LiquidBulkGases/Hydrogen/Distribution/
DistributionOptions.htm. (Acessed 31 July 2007)
10. International Energy Agency. Energy Technology Essentials – Fuel Cells. April
2007
André Martins de Martini MSc in Energy Systems and the Environment
87
11. U.S. Department of Energy. Hydrogen, Fuel Cells and Infrastructure
Technologies Program. Types of Fuel Cells. Available from:
http://www1.eere.energy.gov/hydrogenandfuelcells/fuelcells/pdfs/fc_compariso
n_chart.pdf (Accessed 27 July 2007)
12. Lanz, A et all. Module 3: Hydrogen use in internal combustion engines.
Hydrogen, Fuel Cells and Infrastructure Technologies Program: Technology
Validation. Revision 0 - December 2001, Available from:
http://www1.eere.energy.gov/hydrogenandfuelcells/tech_validation/pdfs/fcm03r
0.pdf (Accessed 26 July 2007)
13. Padró CEG, Putsche V. Survey of the economics of hydrogen technologies,
NREL Technical Report NREL/TP-570-27079, 1999
14. Dutton AG. A review of potential hydrogen production and delivery costs.
H2NET - Hydrogen Energy Systems. May 2002
15. Ivy J. Summary of Electrolytic Hydrogen Production - Milestone Completion
Report. NREL/MP-560-36734. National Renewable Energy Laboratory
(NREL). September 2004.
16. Kauffman M. Electrolysis Development and Hydrogen Infrastructure. U.S.
Department of Energy. Available from:
http://www1.eere.energy.gov/hydrogenandfuelcells/pdfs/euiw_a10_electricity_
mtg.pdf (Acessed 31 July 2007)
17. Amos WA. Costs of Storing and Transporting Hydrogen. NREL/TP-570-25106.
National Renewable Energy Laboratory (NREL). November 1998
18. Drnevich R. Hydrogen Delivery - Liquefaction & Compression. Strategic
Initiatives for Hydrogen Delivery Workshop. May 2003.Available from:
http://www1.eere.energy.gov/hydrogenandfuelcells/pdfs/liquefaction_comp_pre
s_praxair.pdf (Acessed 31 July 2007)
19. Minz M, Folga S, Molburg J, Gillete J, Cost of some Hydrogen Fuel
Infrastructure Options. Transportation Research Board paper. Argonne National
Laboratory. Transportation Technology R&D Center,16 January 2002.
20. Stationary and portable fuel cells information resource - Information Resource
for Highlands & Islands Enterprise. Hi-Energy: Renewable Energy &
André Martins de Martini MSc in Energy Systems and the Environment
88
Alternative Energy in Scotland. Available from: http://www.hi-
energy.org.uk/hydrogen/2-Stationary-and-portable-fuel-cells-information-
resource.pdf. (Acessed 31 July 2007)
21. Hexeberg I. Utsira Wind-Hydrogen System. Hydro – Oil & Energy. May 2005.
Available from: https://www.hfpeurope.org/uploads/699/808/UTSIRA.pdf .
(Acessed 31 July 2007)
22. HyNor – The Norwegian Hydrogen Highway. June 2007. Available from:
http://www.hynor.no/pdf/engelsk-hynor-presentation.pdf . (Acessed 31 July
2007)
23. Island to be Microcosm Model of the Hydrogen Economy. North Cape, Prince
Edward Island. May 17, 2005. Available from: http://www.renewable
energyaccess.com. (Acessed 08 August 2007)
24. Gammon R. The Hydrogen and Renewables Integration (HARI) Project.
H2NET Summer Conference, RAL, 14 July 2004.
25. Skúlason JB. The Icelandic hydrogen society. H2Net Seminar. 2001.
26. Gazey R. Promoting Unst Renewable Energy Project in Scotland's Northern
Isles. Available from:
http://www.hydrogenassociation.org/newsletter/ad93sref.asp . (Acessed 08
August 2007)
27. Chewonki Renewable Hydrogen Project. Available from
http://www.chewonkih2.org/. (Acessed 08 August 2007)
28. Wind-to-Hydrogen Demonstration Project. Xcel Energy. Available from:
http://www.xcelenergy.com/docs/W2H23FactSheetFINAL.pdf (Acessed 08
August 2007)
29. Comhairle nan Eilean Siar. Population Fact File. Available from:
http://www.cne-siar.gov.uk/factfile/population/index.htm (Acessed 08 August
2007)
30. Comhairle nan Eilean Siar. Economy Fact File. Available from http://www.cne-
siar.gov.uk/factfile/economy/index.htm . (Acessed 08 August 2007)
31. Comhairle nan Eilean Siar. Hebridean H2 SEED: Hebridean Hydrogen SEED.
Project Description. July 2007
André Martins de Martini MSc in Energy Systems and the Environment
89
32. Comhairle Nan Eilean Siar . Regional Accounts 2003. Available from:
http://www.cne-siar.gov.uk/factfile/economy/mluri2/coreRegionalAnalysis.htm.
(Acessed 31 July 2007)
33. Highlands and Island Enterprise. Economic Update. October 2003. Available
from http://www.hie.co.uk/HIE-western-isles-area-profile-2003.pdf (Acessed 31
July 2007).
34. Comhairle Nan Eilean Siar. Western Isles Fuel Poverty Strategy. Final Draft. 30
June 2005
35. Comhairle nan Eilean Siar. Alternative / Renewable Energy Schemes. Available
from: http://www.cne-siar.gov.uk/cxdir/altenergy/hebH2Park.htm . (Acessed 08
August 2007)
36. Comhairle nan Eilean Siar. Hebridean Hydrogen Park - Business Plan: 2006-
2008. Draft V.2.4. 14 August 2006
37. Bush, G. Lessons Learned from the World’s Largest Digester Gas Fuel Cell.
Washington State Recycling Association –Spokane. May, 2006
38. A guide to the project management body of knowledge: PMBOK® guide. – 3rd
ed. ANSI/PMI 99-001-2004. Project Management Institute. 2004. USA
39. Bakken BH, Wolfgang O, Røynstrand J, Frydenlund F, Skjelbred HI. eTransport
- A novel tool for energy system planning - Preliminary version. December
2005.
40. TRNSYS Primary. Available from http://sel.me.wisc.edu/trnsys . (Acessed 08
August 2007)
41. Scottish Executive. Matching Renewable Electricity Generation with Demand -
Full Report. University of Edinburgh. February 2006
42. Avadikyan A, Cohendet P, Hèraud JA. The Economic Dynamics of Fuel Cell
Technologies. Berlin: Springer. 2003.
43. Cloonan M. Energy from Waste on the Isle of Mull: A Feasibility Study of an
Anaerobic Digestion Plant. University of Strathclyde. September 2003
44. Comhairle nan Eilean Siar. Hebridean H2 SEED: Hebridean Hydrogen SEED.
Project Summary. March 2007
André Martins de Martini MSc in Energy Systems and the Environment
90
45. Comhairle nan Eilean Siar. Windpower Applications. Available from:
http://www.w-isles.gov.uk/lewiswindpower/index.htm . (Acessed 08 August
2007)
46. Department for Business, Enterprise and Regulatory Reform.. A strategic
framework for hydrogen energy in the UK - Final report. December 2004.
47. Ete A. Optimization of the HARI stand-alone energy system with TRNSYS.
University of Strathclyde. September 2006.
48. European Commission. Hydrogen Energy and Fuel Cells - A vision of our
future. Final Report of the High Level Group. EUR 20719 EN. 2003
49. Hance WA. The Fishing Industry of the Outer Hebrides.
Economic Geography. 1953 Apr. Vol. 29, No. 2, pp. 168-182
50. Highlands and Islands Enterprise. The Western Isles – Electricity and
Renewable Energy map. 2006
51. Homer – Analysis of micropower system options. Available from:
http://www.nrel.gov/homer/default.asp . (Acessed 08 August 2007)
52. Hydrogen Refuelling and Storage - Information Resource for Highlands &
Islands Enterprise. Hi-Energy: Renewable Energy &Alternative Energy in
Scotland. Available from: http://www.hi-energy.org.uk/hydrogen/3b-
Hydrogen%20refuelling%20and%20storage%20infrastructure.pdf (Accessed 26
July 2007)
53. Introduction to hydrogen energy projects - Information Resource for Highlands
& Islands Enterprise. Hi-Energy: Renewable Energy &Alternative Energy in
Scotland. Available from: http://www.hi-energy.org.uk/hydrogen/1-
Introduction-to-hydrogen-energy-projects.pdf (Accessed 26 July 2007)
54. Kroposki B. Renewable Electrolysis Integrated System Development and
Testing. 16 May 2006. 2006 DOE Hydrogen, Fuel Cells & Infrastructure
Technologies Program Review.
55. Lanz, A et all. Module 0: Hydrogen Properties. Hydrogen, Fuel Cells and
Infrastructure Technologies Program: Technology Validation. Revision 0 -
December 2001. College of the Desert, USA. Available from:
André Martins de Martini MSc in Energy Systems and the Environment
91
http://www1.eere.energy.gov/hydrogenandfuelcells/tech_validation/pdfs/fcm01r
0.pdf (Accessed 26 July 2007)
56. Leposky, G. Fuel Cell Uses – Biogas from Sewage to Generate Electricity.
Available from: http://www.gradingandexcavation.com/de_0511_fuel.html
(Acessed 08 August 2007)
57. PEI Wind-Hydrogen Village – Initial Public forum. North Cape. 22 April 2005.
Available from:
http://www.hydrogenics.com/pdf/PEI_Wind_Hydrogen_Village.pdf . (Acessed
31 July 2007)
58. Scottish Executive - The Hydrogen Energy Group. Hydrogen and Fuel Cell
Opportunities for Scotland. August, 2006.
59. Stationary and portable fuel cells information resource - Information Resource
for Highlands & Islands Enterprise. Hi-Energy: Renewable Energy &Alternative
Energy in Scotland. Available from: http://www.hi-energy.org.uk/hydrogen/2-
Stationary-and-portable-fuel-cells-information-resource.pdf (Accessed 26 July
2007)
60. Syed MT, Sherif SA, Veziroblu TN and Sheffield J W. Economic analysis of
three hydrogen liquefaction systems. Int. J. Hydrogen Energy, Vol. 23, No. I:
pp. 565-576, 1998.
61. The European Hydrogen and Fuel Cell Technology (HFP). HFP Infotools.
Available from: http://www.infotools.hfpeurope.org/ (Accessed 26 July 2007)
62. U.S. Department of Energy. Hydrogen, Fuel Cells and Infrastructure
Technologies Program. Available from:
http://www1.eere.energy.gov/hydrogenandfuelcells/ (Accessed 26 July 2007)
63. U.S. Department of Energy. National Hydrogen Energy Roadmap - Production •
Delivery • Storage • Conversion • Applications • Public Education and
Outreach. November 2002

André Martins de Martini MSc in Energy Systems and the Environment
92
Appendixes
André Martins de Martini MSc in Energy Systems and the Environment
93
Appendix 1 Scotland’s Onshore Wind Power Resource
[41]
André Martins de Martini MSc in Energy Systems and the Environment
94
Appendix 2 Scotland’s Offshore Wind Power Resource
[41]
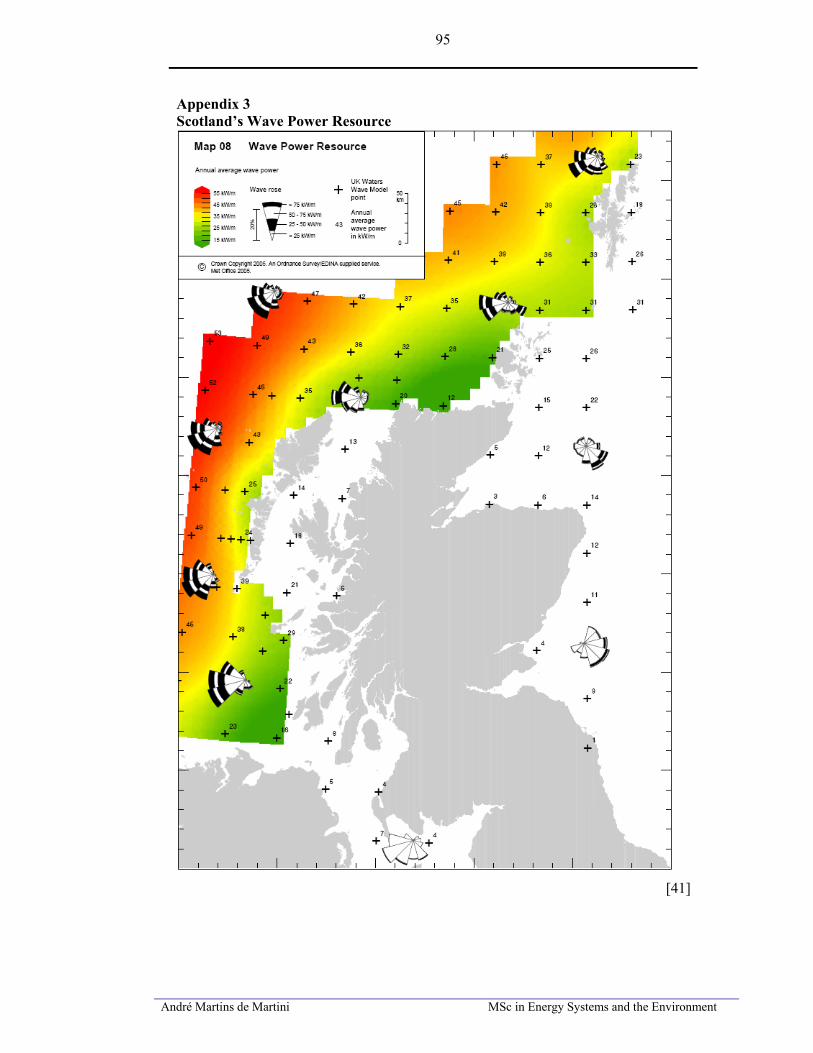
André Martins de Martini MSc in Energy Systems and the Environment
95
Appendix 3 Scotland’s Wave Power Resource
[41]

André Martins de Martini MSc in Energy Systems and the Environment
96
Appendix 4 Scotland’s Tidal Power Resource
[41]


![TheLifeof Galileo - luther.edu of his life.”[1] During his time in Venice, Galileo lived off of the slim means of the university and the patents to several mechanical inventions](https://img.pdfslide.net/doc/110x75/5b46c2947f8b9a40638b7e7e/thelifeof-galileo-of-his-life1-during-his-time-in-venice-galileo-lived.jpg)