Embed Size (px)
Citation preview
University of Washington EMBA Program
Marketing Management
“Direct Marketing”
Instructor: Elizabeth Stearns
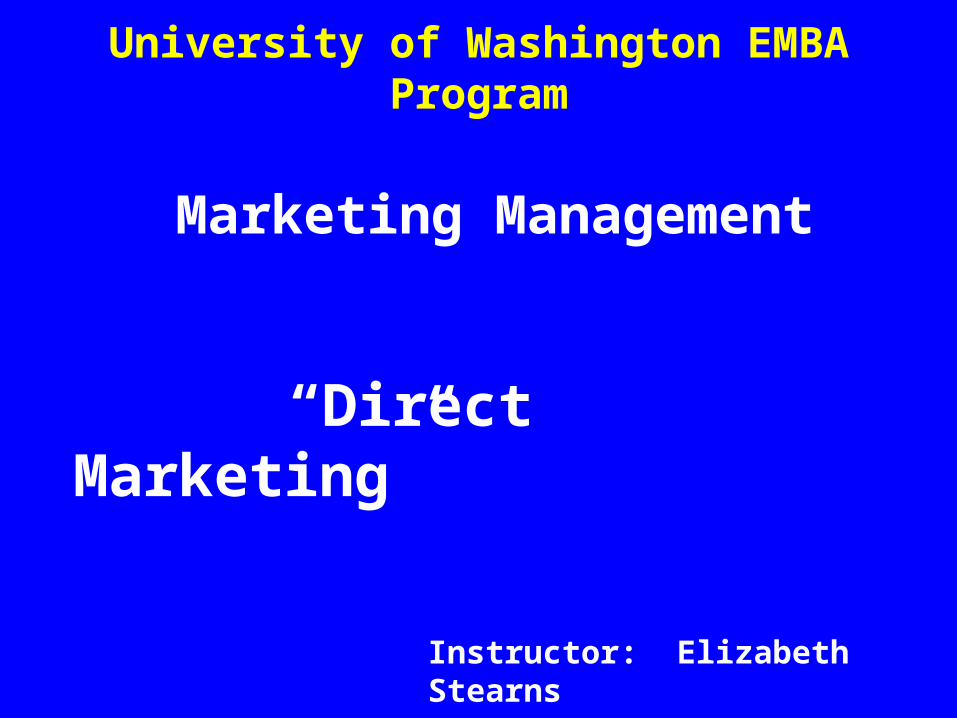
Marketing Plan Review
Analysis of promotional program situation
Analysis of the communication process
Budget Determination
Develop integrated marketing communications program
Advertising Direct Marketing Sales Promotion PR/ Publicity Personal Selling
•Create Awareness
•Develop Attitudes
•Change Attitudes
•Inform
•Persuade
•Generate a Sale
•Generate a Lead
•Qualify a Lead
•Enhance a db
•Relationship
Building
•Create Excitement
•Stimulate
demand/sales(short
term)
•Support sales
force/trade/customer
(selling and buying)
•Fostering
Goodwill between
co. and publics•Brand Awareness•Build Attitudes•Encourage
purchase behavior
•Influence purchase needs•Educate consumers•Provide Product usage/marketing assistance/•After sale service and support
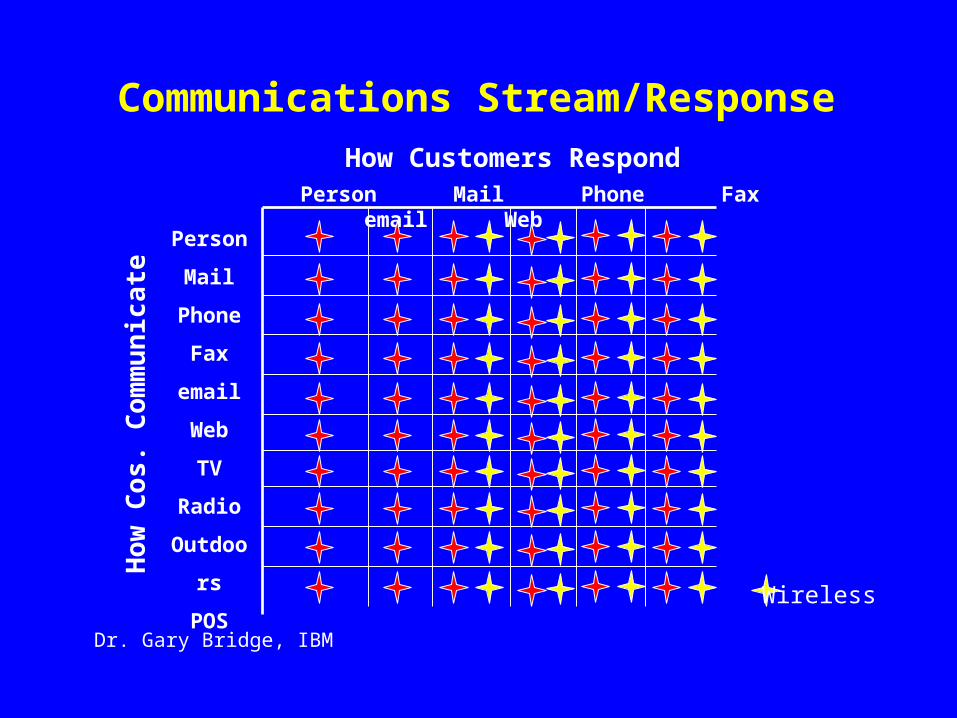
Communications Stream/Response
Person
Phone
Fax
Web
TV
Radio
Outdoors
POS
Person Mail Phone Fax email Web
How
Cos
. Com
mu
nic
ate
How Customers Respond
Dr. Gary Bridge, IBM
Wireless
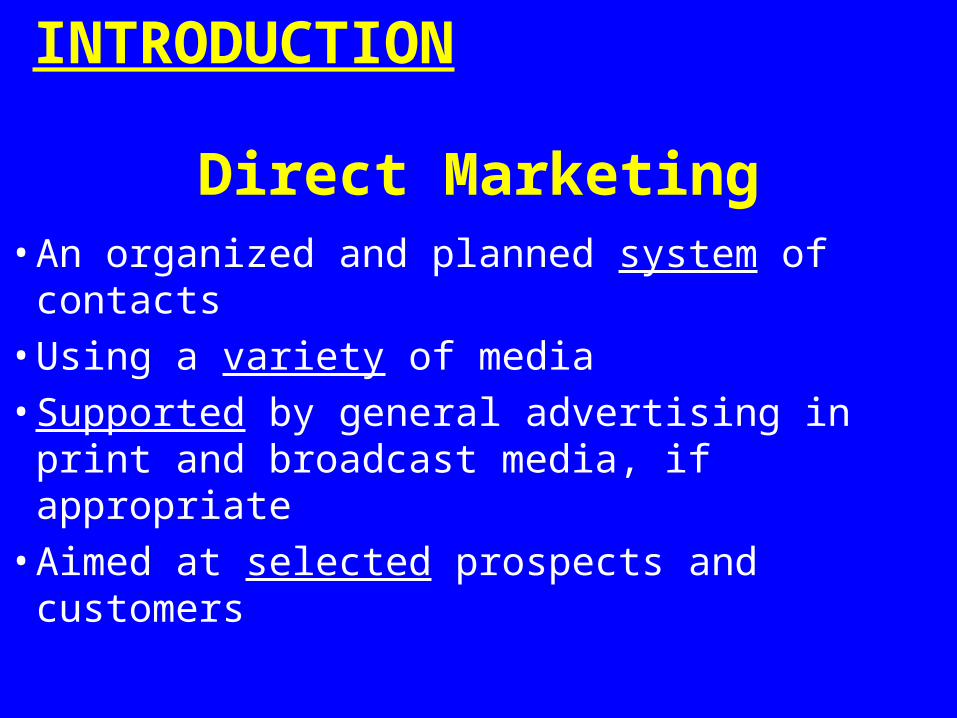
Direct Marketing• An organized and planned system of contacts
• Using a variety of media
• Supported by general advertising in print and broadcast media, if appropriate
• Aimed at selected prospects and customers
INTRODUCTION
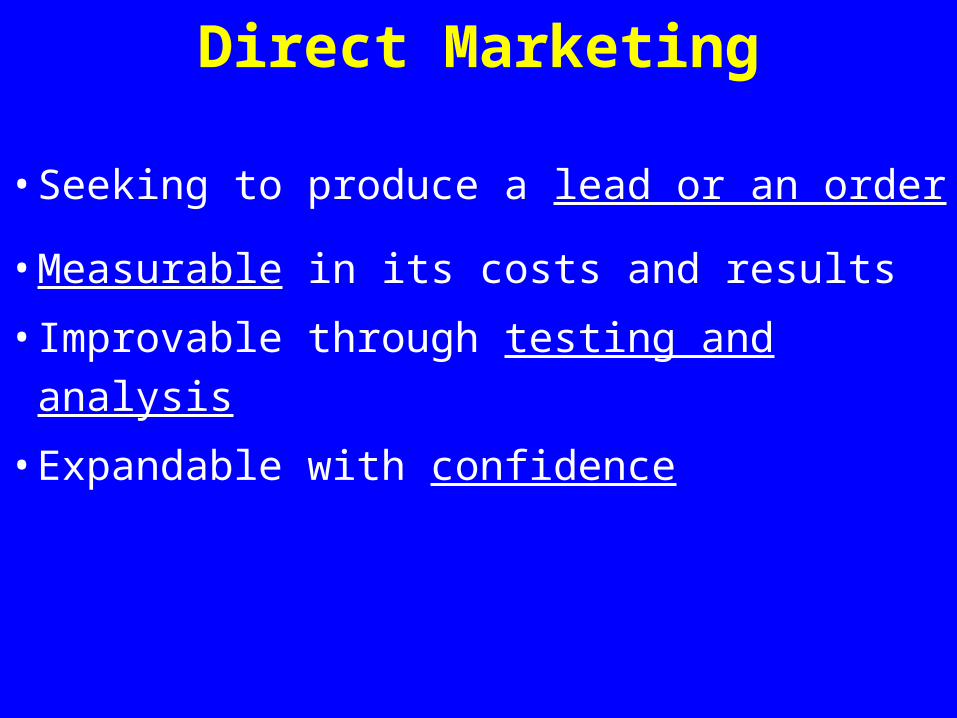
Direct Marketing
• Seeking to produce a lead or an order
• Measurable in its costs and results
• Improvable through testing and analysis
• Expandable with confidence
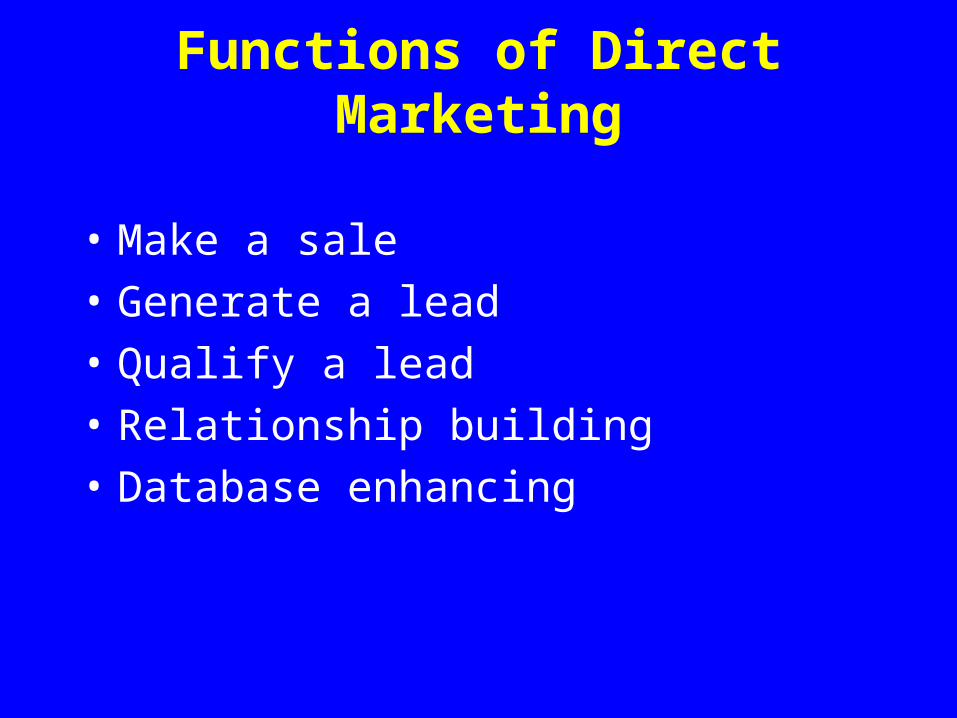
Functions of Direct Marketing
• Make a sale
• Generate a lead
• Qualify a lead
• Relationship building
• Database enhancing
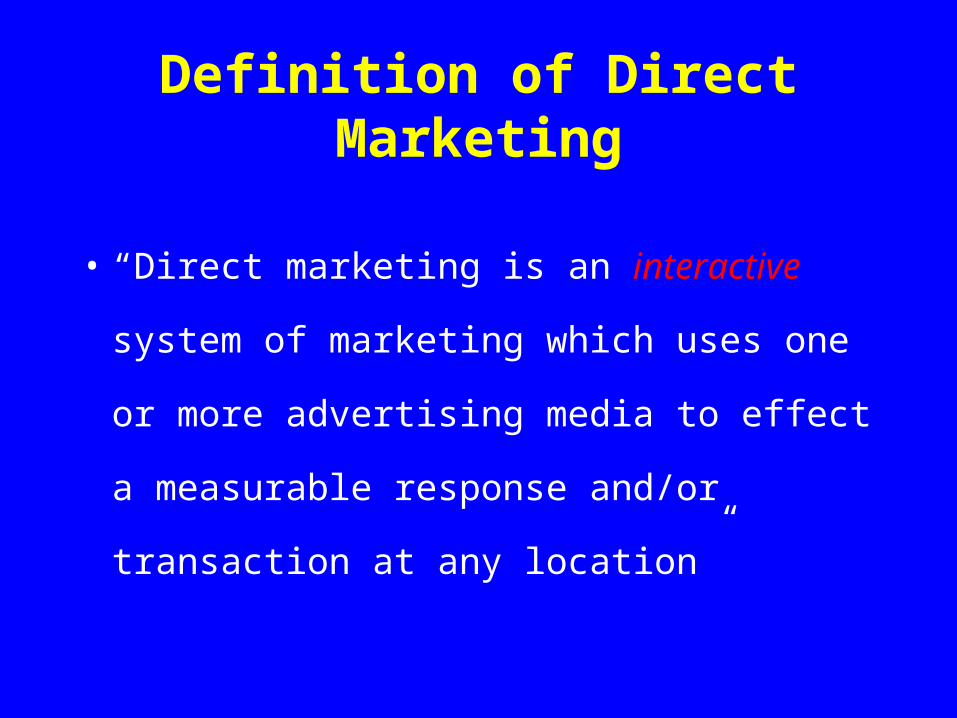
Definition of Direct Marketing
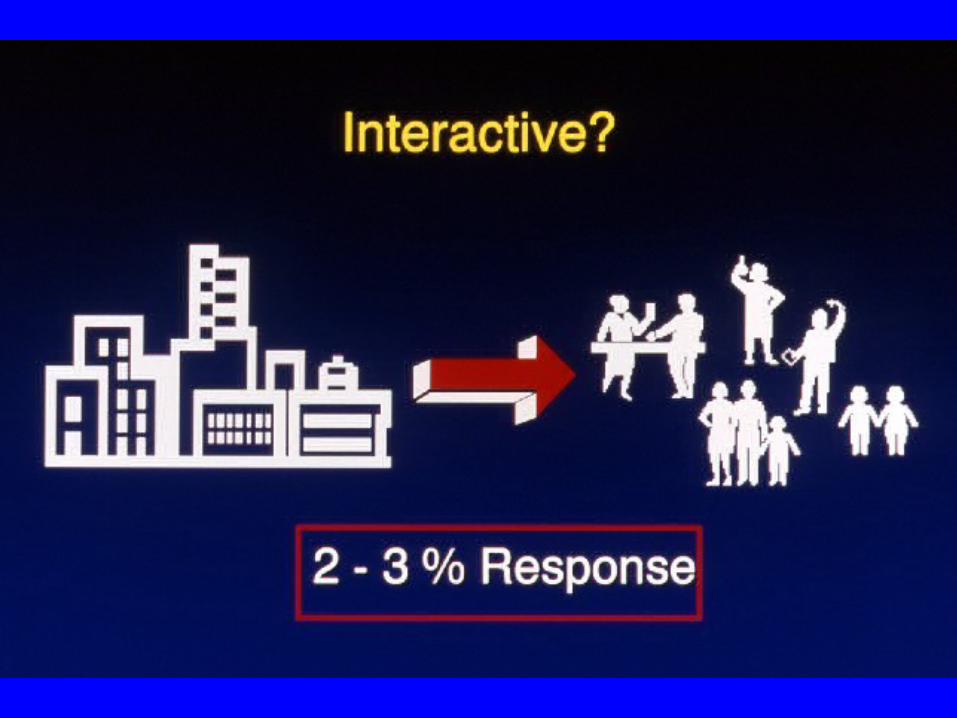
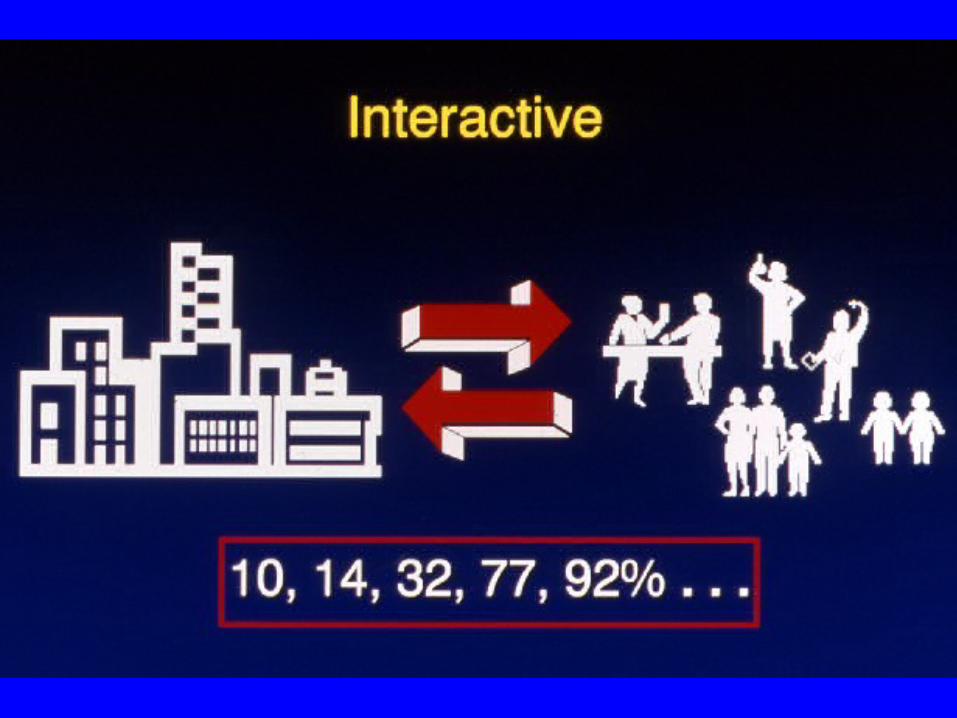
• “Direct marketing is an interactive system
of marketing which uses one or more
advertising media to effect a measurable
response and/or transaction at any location”
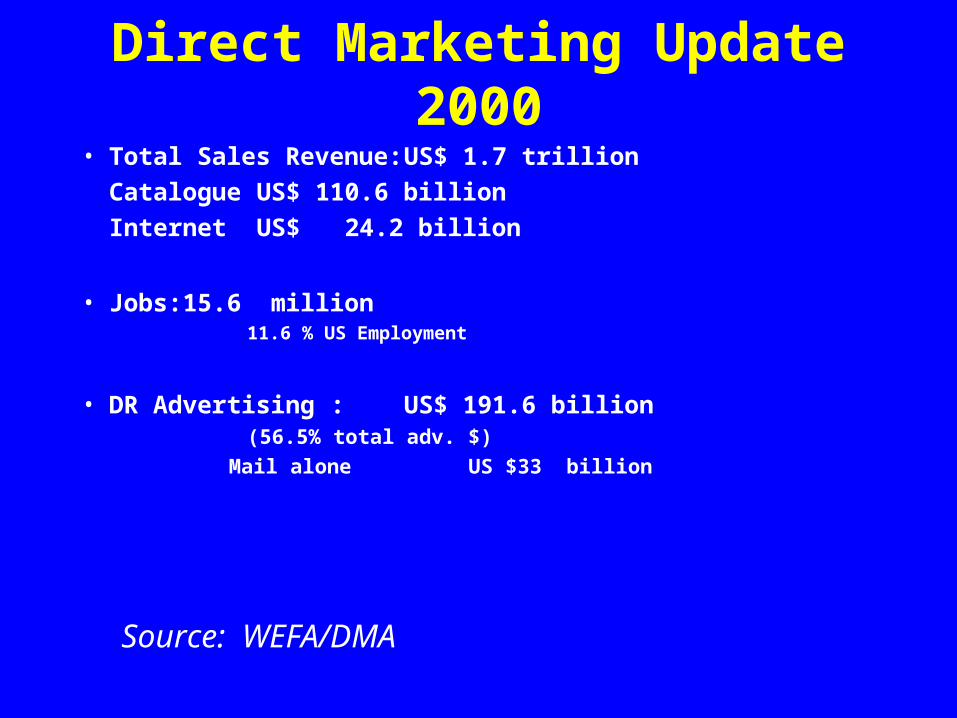
Direct Marketing Update 2000• Total Sales Revenue: US$ 1.7 trillion
Catalogue US$ 110.6 billion
Internet US$ 24.2 billion
• Jobs: 15.6 million11.6 % US Employment
• DR Advertising : US$ 191.6 billion(56.5% total adv. $)
Mail alone US $33 billion
Source: WEFA/DMA
Image Response
• Connectivity between all communications
• Maximizing budgets
• Not distruptive of other efforts
Available Media
• Brochures or catalogs sent by mail
• Radio and TV ads
• Television Shopping Networks/Programs
• Telephone
• Newspaper and magazine ads, preprints, bind-ins, etc.
• Statement inserts
• Cooperative mailings
Available Media
• Package and bag stuffers
• Take-ones
• Cereal boxes, egg and milk cartons, matchbooks, etc.
• Interactive cable
• Worldwide Web/Internet
The Role of Media
• Media planning is concerned with how to
use advertising time and space most
effectively (and efficiently) to contribute
to the achievement of marketing
objectives.
The Role of Media• Media provides a bridge that delivers the
right message (and offer) to the right target. In this respect, media decisions that deliver both image/awareness are the same for direct response efforts.
• Media planning that is involved with generating a direct response, goes steps further in analyzing previous results and projecting future response.
Media’s Role in Direct Marketing
• The “accountable” nature of direct
marketing is the crucial determining
factor used to plan each media campaign.
Historical response analysis is the
foundation and starting point for the
overall planning process.
Media’s Role in Direct Marketing
• Front-end Response
-% response
-Orders per thousand
-Cost per order
Media’s Role in Direct Marketing
• Back-end Response
-The quality of the customer is primarily measured by total sales (net of bad pay) per customer, but related measures are also used such as: conversion %, renewal rate and upgrade %, cross promotion sales, credit card usage, and ultimately a “Lifetime Customer Value” Index.
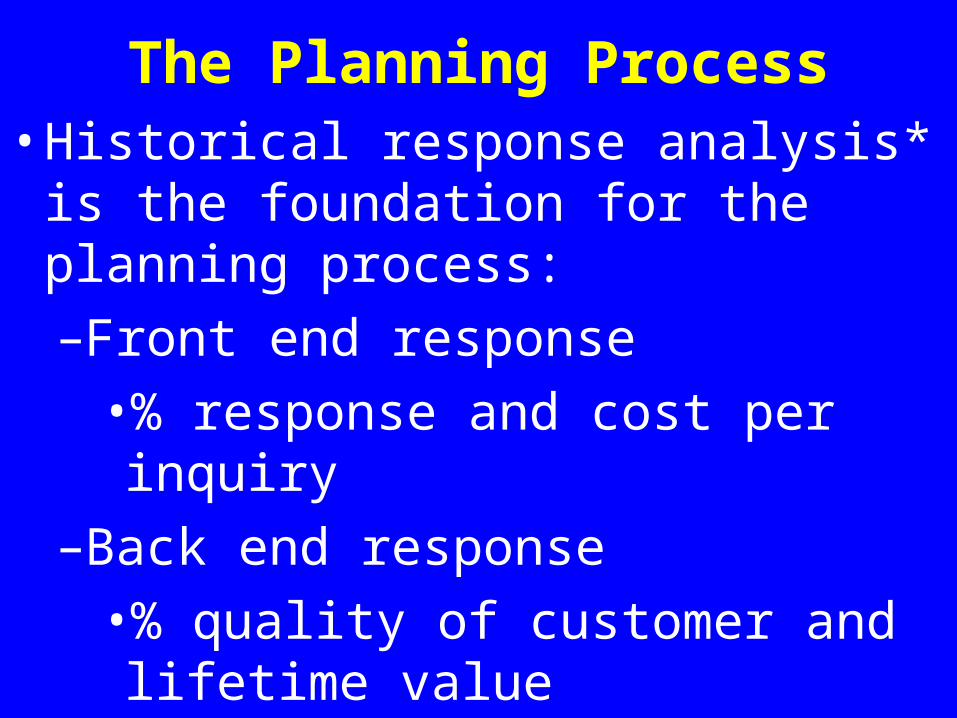
The Planning Process• Historical response analysis* is the
foundation for the planning process:
–Front end response
•% response and cost per inquiry
–Back end response
•% quality of customer and lifetime value
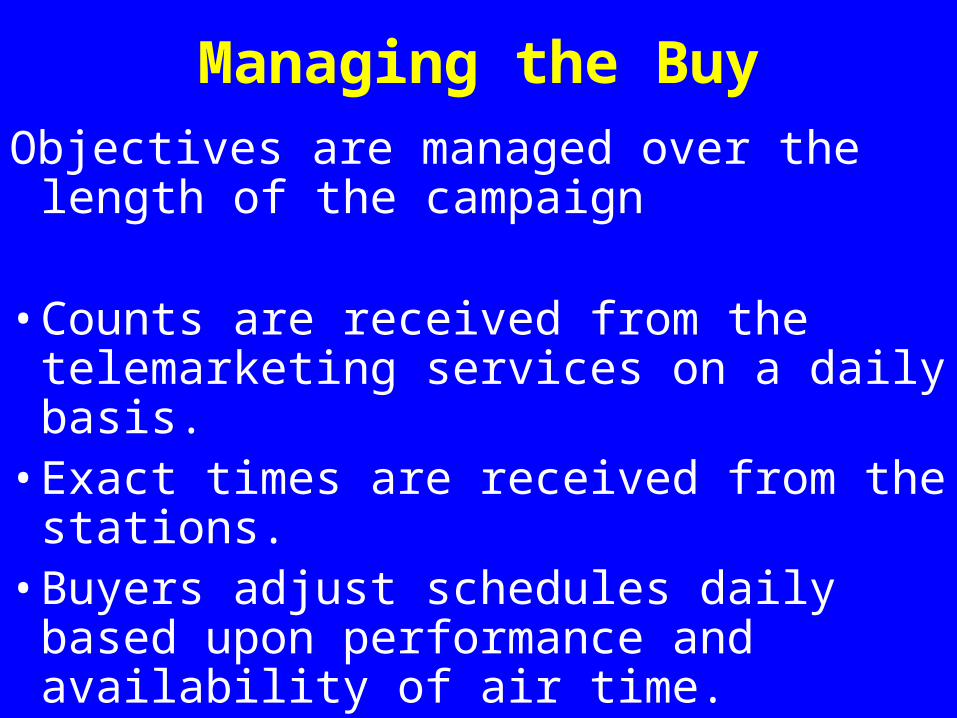
Managing the Buy
Objectives are managed over the length of the campaign
• Counts are received from the telemarketing services on a daily basis.
• Exact times are received from the stations.
• Buyers adjust schedules daily based upon performance and availability of air time.

Managing the Buy
Responsiveness on a daily basis
• Rates are renegotiated.• “No-charges” are negotiated.• Ineffective/inefficient dayparts are
eliminated.• Spending is increased on well-performing
stations.• Poor stations are eliminated.• New stations are recommended.
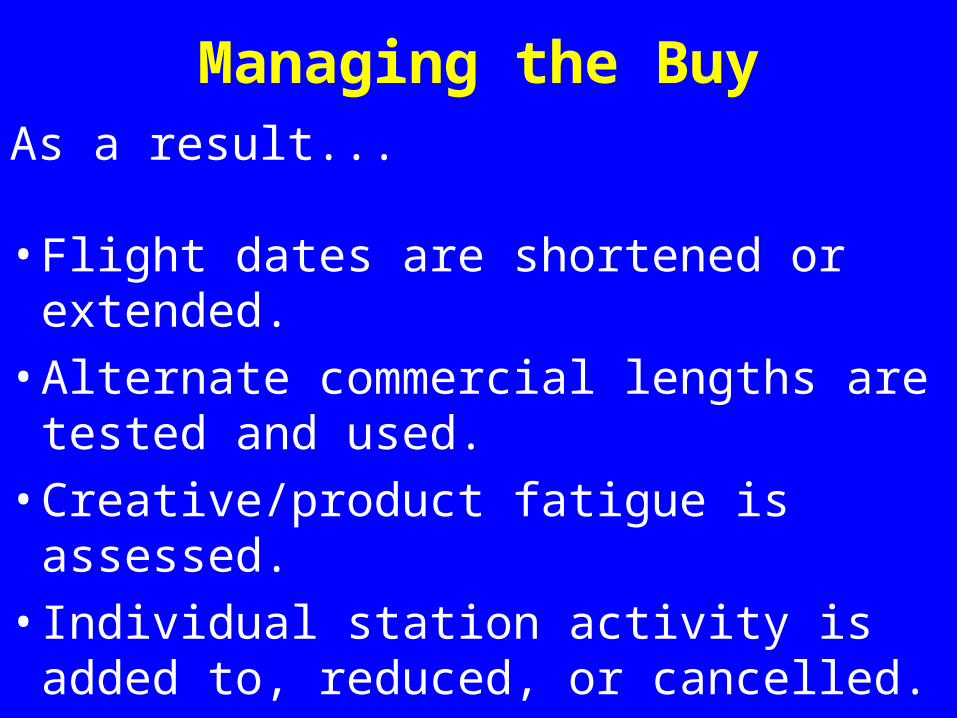
Managing the Buy
As a result...
• Flight dates are shortened or extended.
• Alternate commercial lengths are tested and used.
• Creative/product fatigue is assessed.
• Individual station activity is added to, reduced, or cancelled.
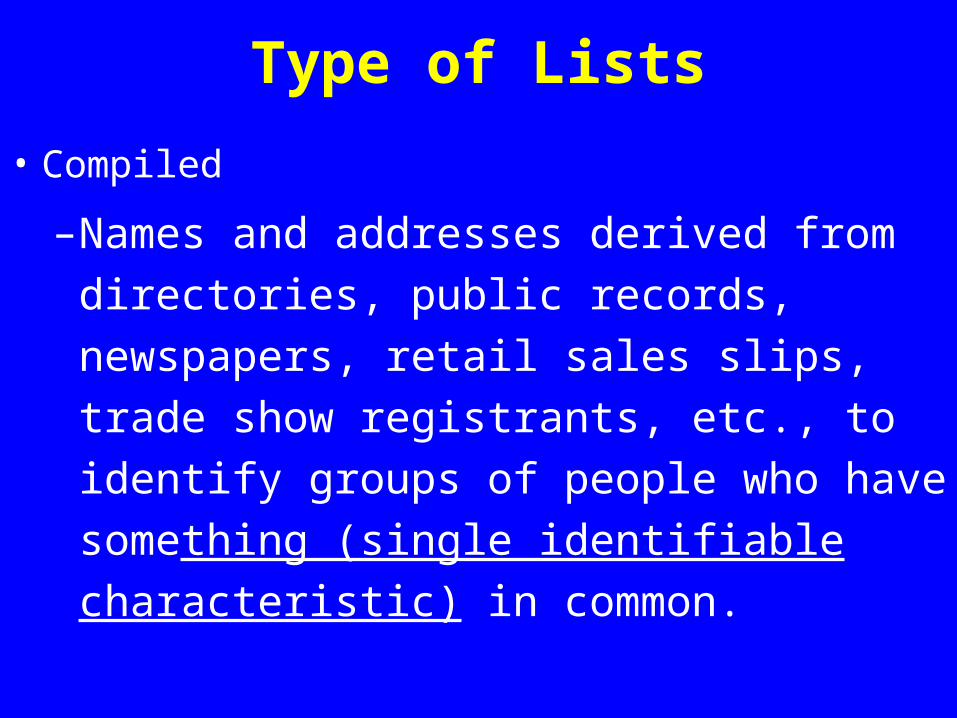
Type of Lists
• Compiled
– Names and addresses derived from
directories, public records, newspapers,
retail sales slips, trade show registrants, etc.,
to identify groups of people who have
something (single identifiable characteristic)
in common.
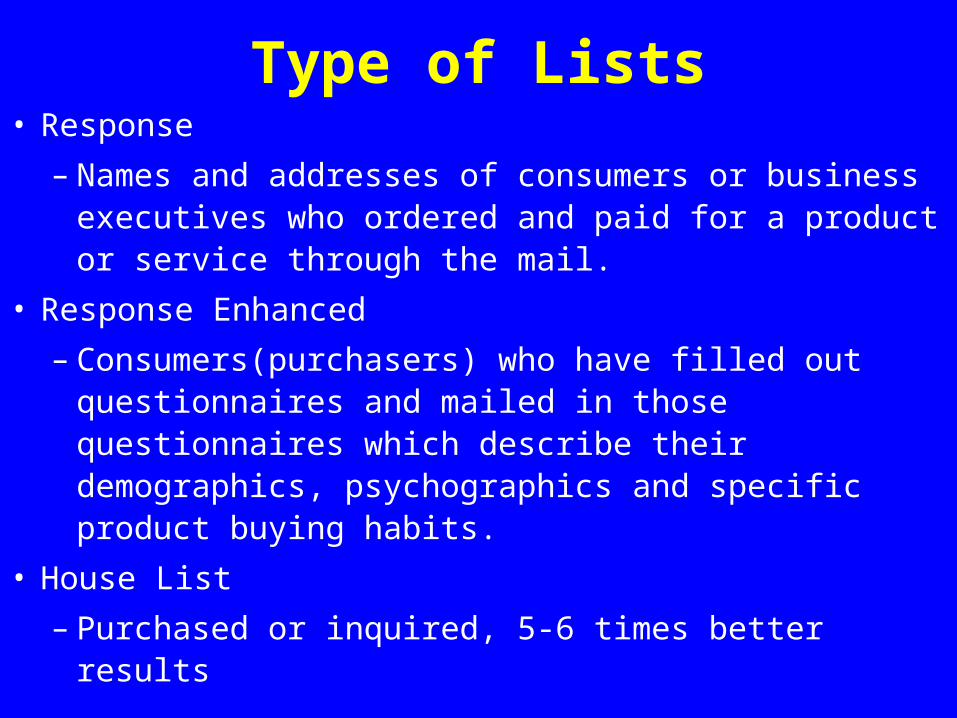
Type of Lists• Response
– Names and addresses of consumers or business executives who ordered and paid for a product or service through the mail.
• Response Enhanced
– Consumers(purchasers) who have filled out questionnaires and mailed in those questionnaires which describe their demographics, psychographics and specific product buying habits.
• House List
– Purchased or inquired, 5-6 times better results
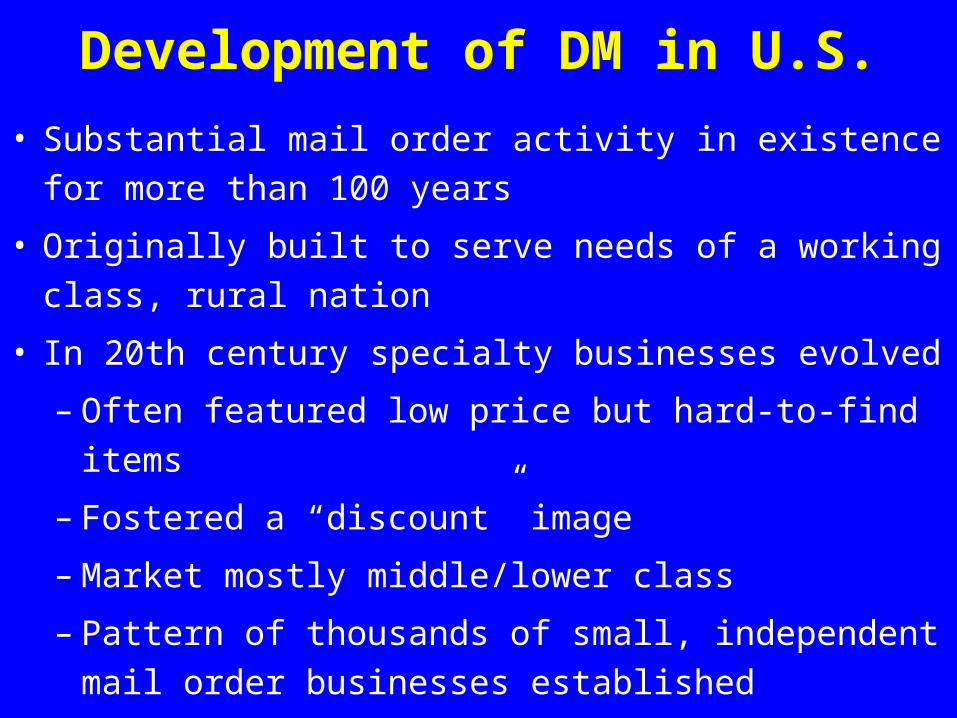
Development of DM in U.S.
• Substantial mail order activity in existence for more than
100 years
• Originally built to serve needs of a working class, rural
nation
• In 20th century specialty businesses evolved
– Often featured low price but hard-to-find items
– Fostered a “discount” image
– Market mostly middle/lower class
– Pattern of thousands of small, independent mail order
businesses established

1950
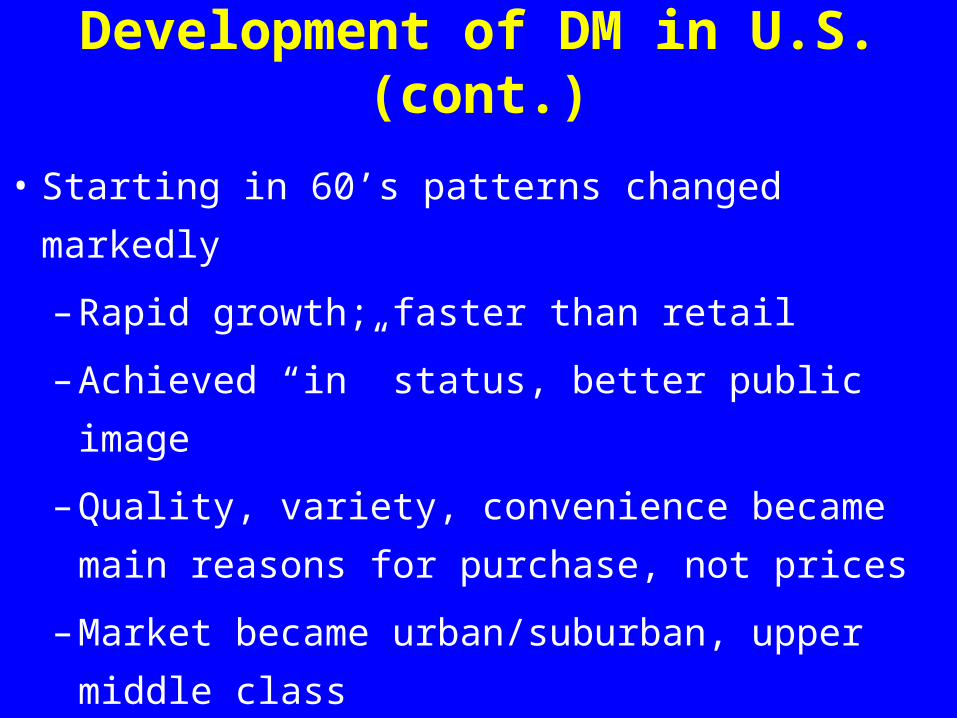
Development of DM in U.S. (cont.)
• Starting in 60’s patterns changed markedly
– Rapid growth; faster than retail
– Achieved “in” status, better public image
– Quality, variety, convenience became main
reasons for purchase, not prices
– Market became urban/suburban, upper middle
class


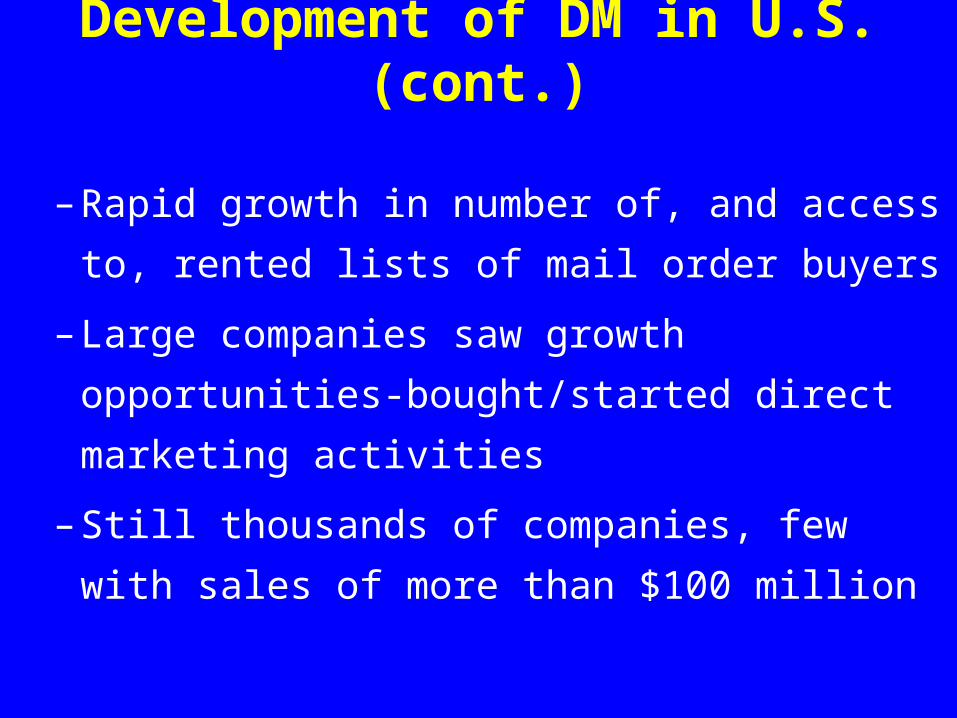
Development of DM in U.S. (cont.)
– Rapid growth in number of, and access to, rented
lists of mail order buyers
– Large companies saw growth opportunities-
bought/started direct marketing activities
– Still thousands of companies, few with sales of
more than $100 million
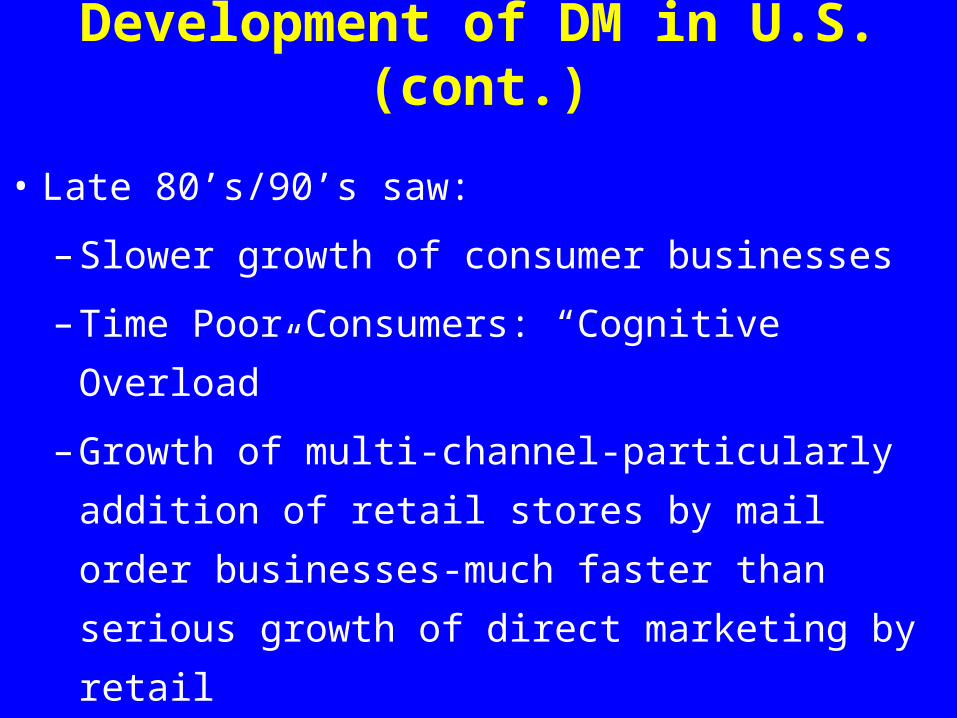
Development of DM in U.S. (cont.)
• Late 80’s/90’s saw:
– Slower growth of consumer businesses
– Time Poor Consumers: “Cognitive Overload”
– Growth of multi-channel-particularly addition of
retail stores by mail order businesses-much faster
than serious growth of direct marketing by retail
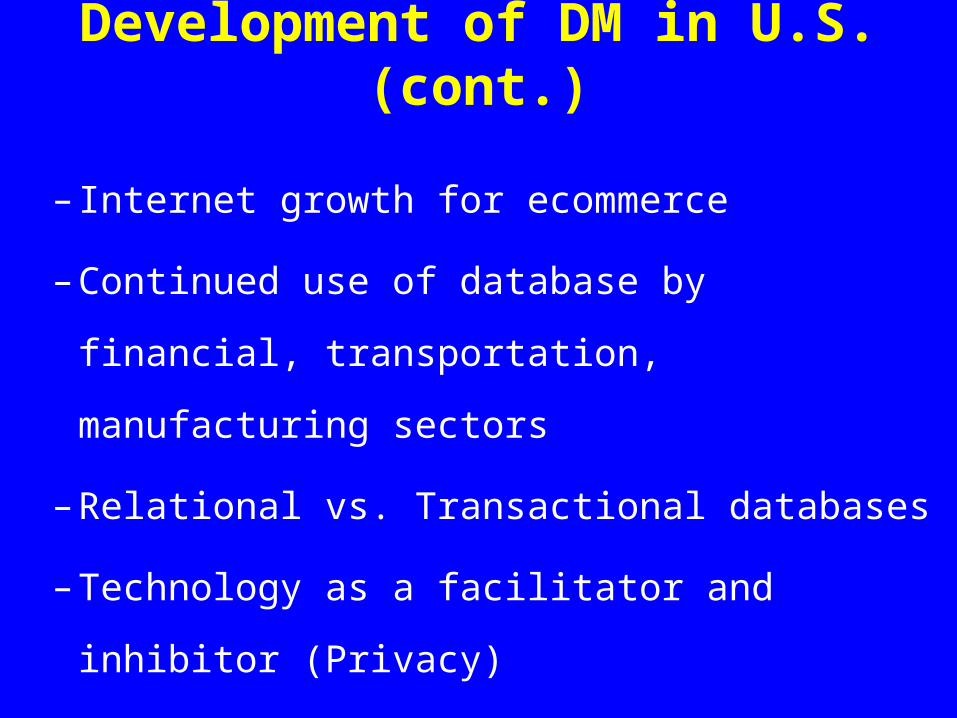
Development of DM in U.S. (cont.)
– Internet growth for ecommerce
– Continued use of database by financial,
transportation, manufacturing sectors
– Relational vs. Transactional databases
– Technology as a facilitator and inhibitor (Privacy)
Development of DM in US (cont.)
• 21st Century
– Real time customer
– Mandatory multi channel-customer choice
– Privacy needs/remedies confused,-self regulation and gov’t involved
– Fulfillment & database essential skill sets-often not resident at ecommerce companies
– CRM: hot topic! Myth or Reality
Using technology to understand your customer
“Hug Me”
Your customers will shop and purchase as is convenient/appropriate for them (hint: not you!)
Set up your systems to capture behavior to get a complete look at your customer.
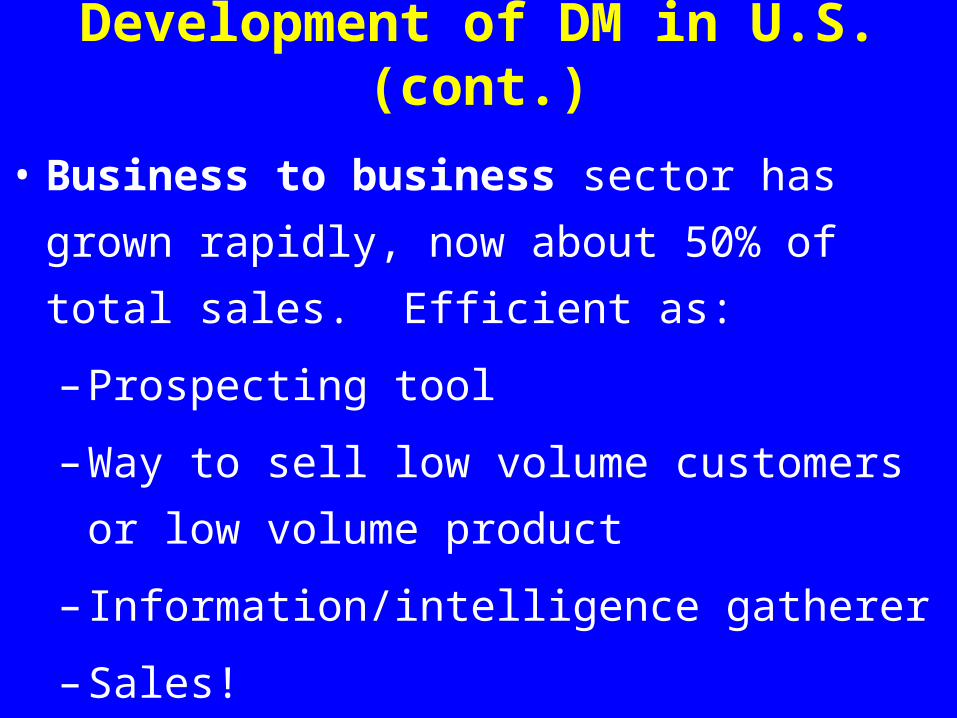
Development of DM in U.S. (cont.)
• Business to business sector has grown rapidly, now
about 50% of total sales. Efficient as:
– Prospecting tool
– Way to sell low volume customers or low volume
product
– Information/intelligence gatherer
– Sales!
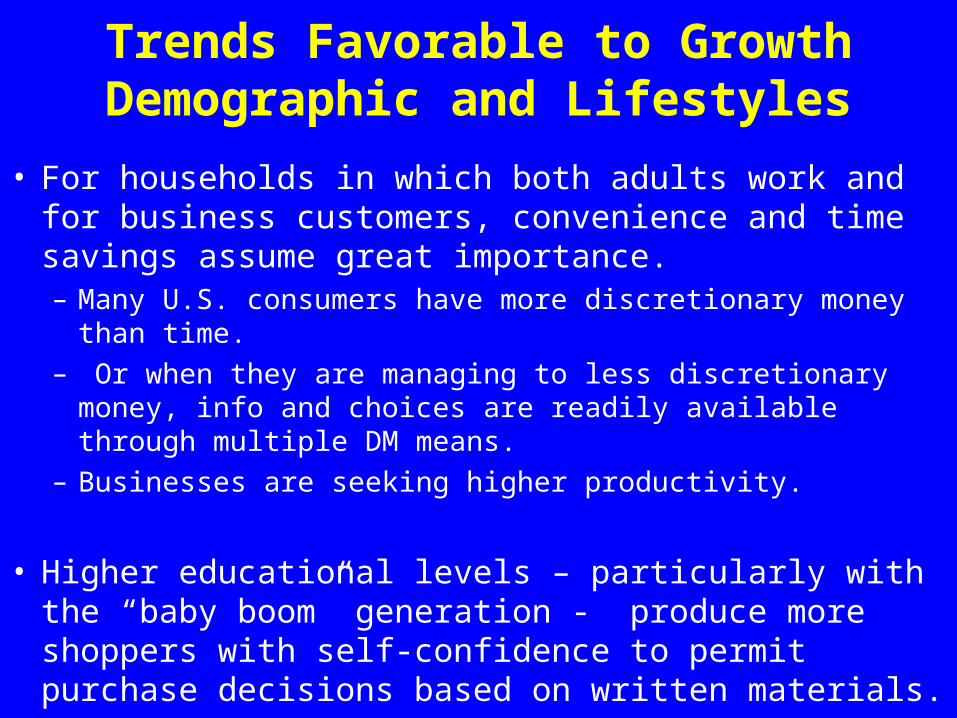
Trends Favorable to GrowthDemographic and Lifestyles
• For households in which both adults work and for business customers, convenience and time savings assume great importance.– Many U.S. consumers have more discretionary money than time.
– Or when they are managing to less discretionary money, info and choices are readily available through multiple DM means.
– Businesses are seeking higher productivity.
• Higher educational levels – particularly with the “baby boom” generation - produce more shoppers with self-confidence to permit purchase decisions based on written materials.

Trends Favorable to GrowthDemographic and Lifestyles (cont.)
• Retail shopping less often provides an enriching or
self-gratifying experience.
• Individual consumer’s values/needs can be
recognized in personalized or interactive direct
marketing communications that replace the physical
one to one contact that is no longer affordable.
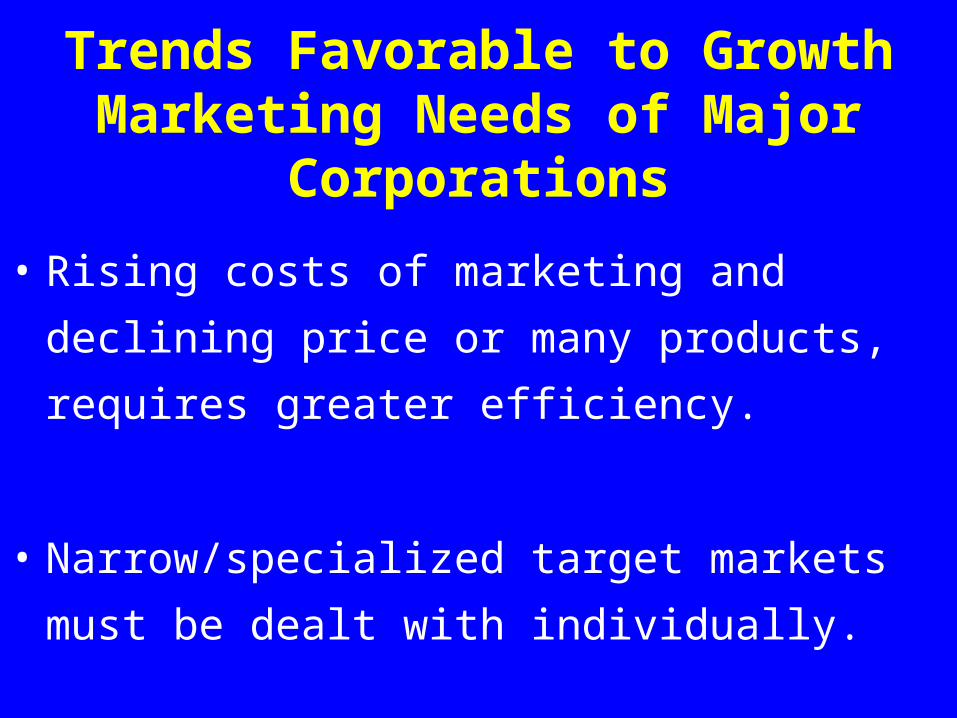
Trends Favorable to GrowthMarketing Needs of Major Corporations
• Rising costs of marketing and declining price or
many products, requires greater efficiency.
• Narrow/specialized target markets must be dealt
with individually.
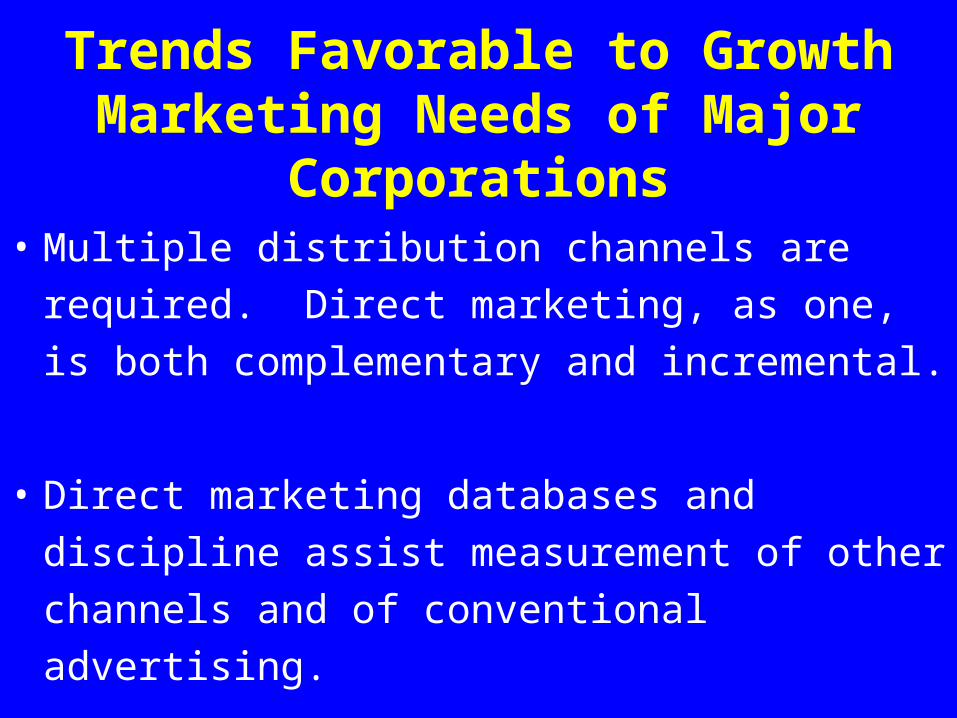
Trends Favorable to GrowthMarketing Needs of Major Corporations
• Multiple distribution channels are required. Direct
marketing, as one, is both complementary and
incremental.
• Direct marketing databases and discipline assist
measurement of other channels and of conventional
advertising.
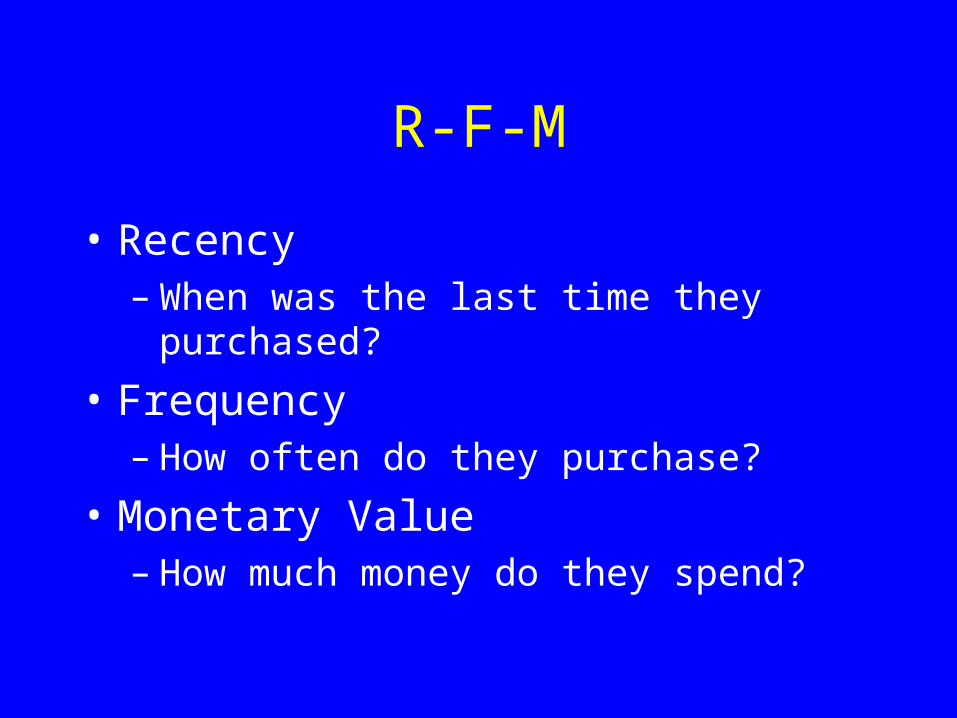
R-F-M
• Recency– When was the last time they purchased?
• Frequency– How often do they purchase?
• Monetary Value – How much money do they spend?
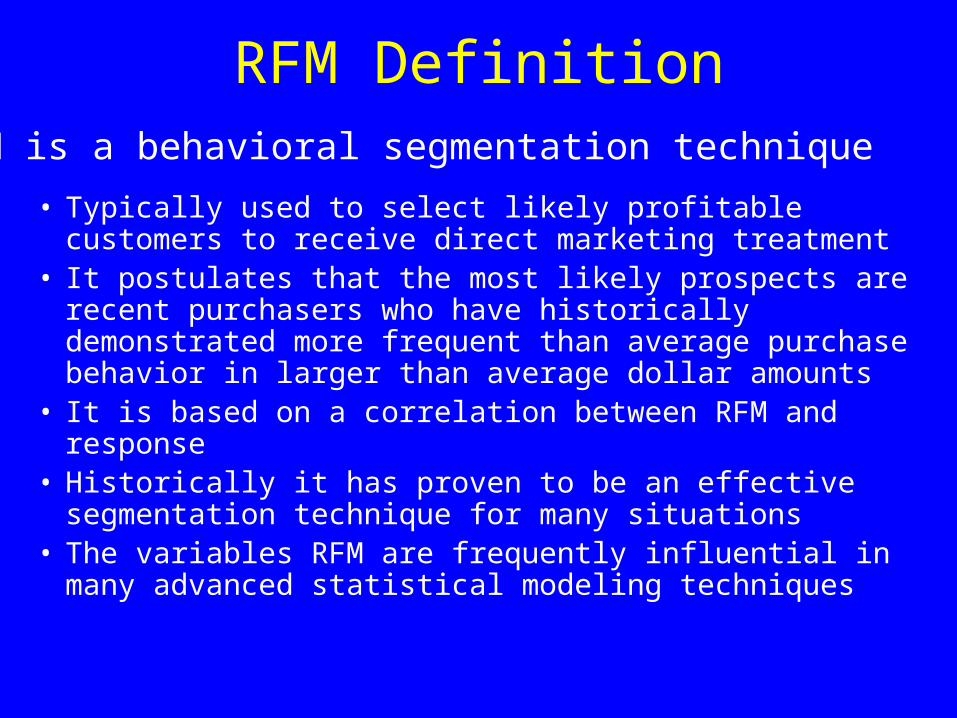
• Typically used to select likely profitable customers to receive direct marketing treatment
• It postulates that the most likely prospects are recent purchasers who have historically demonstrated more frequent than average purchase behavior in larger than average dollar amounts
• It is based on a correlation between RFM and response• Historically it has proven to be an effective segmentation
technique for many situations• The variables RFM are frequently influential in many
advanced statistical modeling techniques
RFM DefinitionRFM is a behavioral segmentation technique
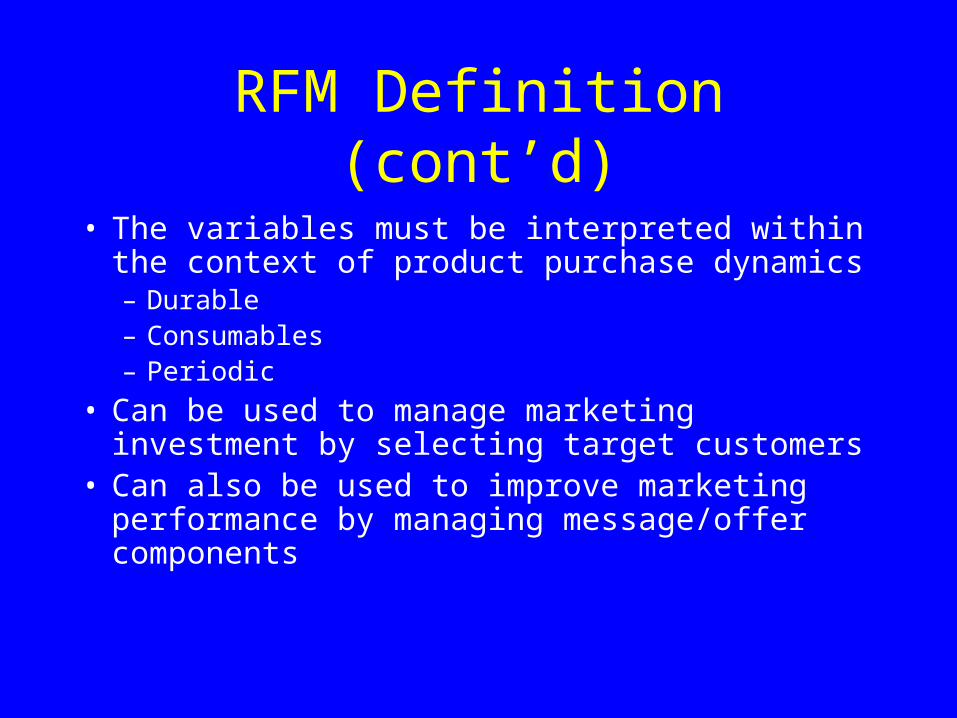
RFM Definition (cont’d)
• The variables must be interpreted within the context of product purchase dynamics– Durable– Consumables– Periodic
• Can be used to manage marketing investment by selecting target customers
• Can also be used to improve marketing performance by managing message/offer components
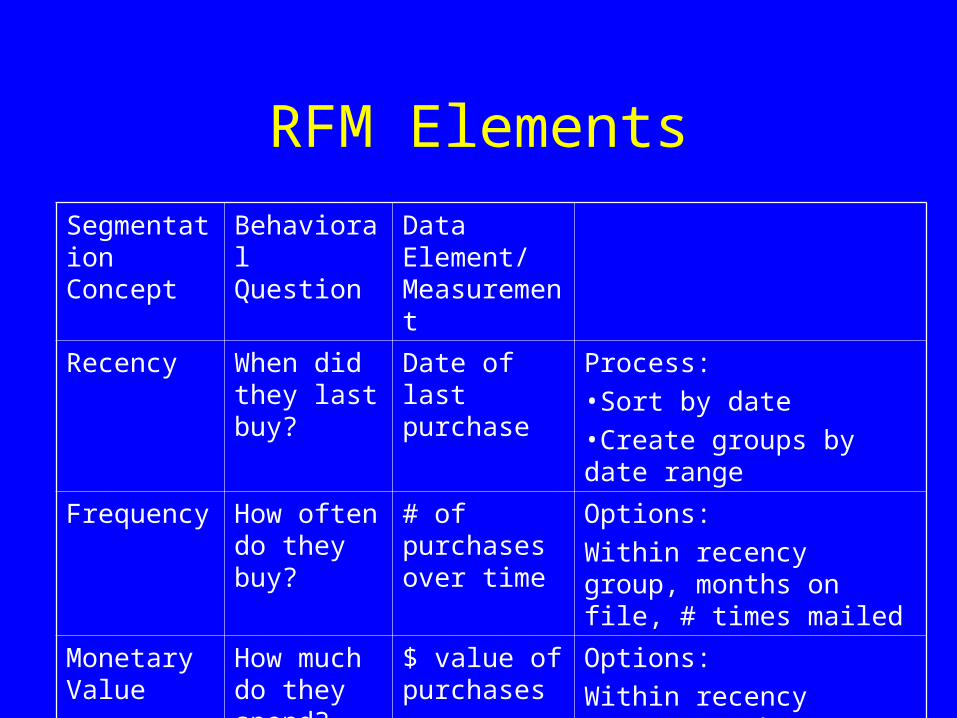
RFM Elements
Segmentation Concept
Behavioral Question
Data Element/ Measurement
Recency When did they last buy?
Date of last purchase
Process:
•Sort by date
•Create groups by date range
Frequency How often do they buy?
# of purchases over time
Options:
Within recency group, months on file, # times mailed
Monetary Value
How much do they spend?
$ value of purchases
Options:
Within recency group, months on file, # times mailed
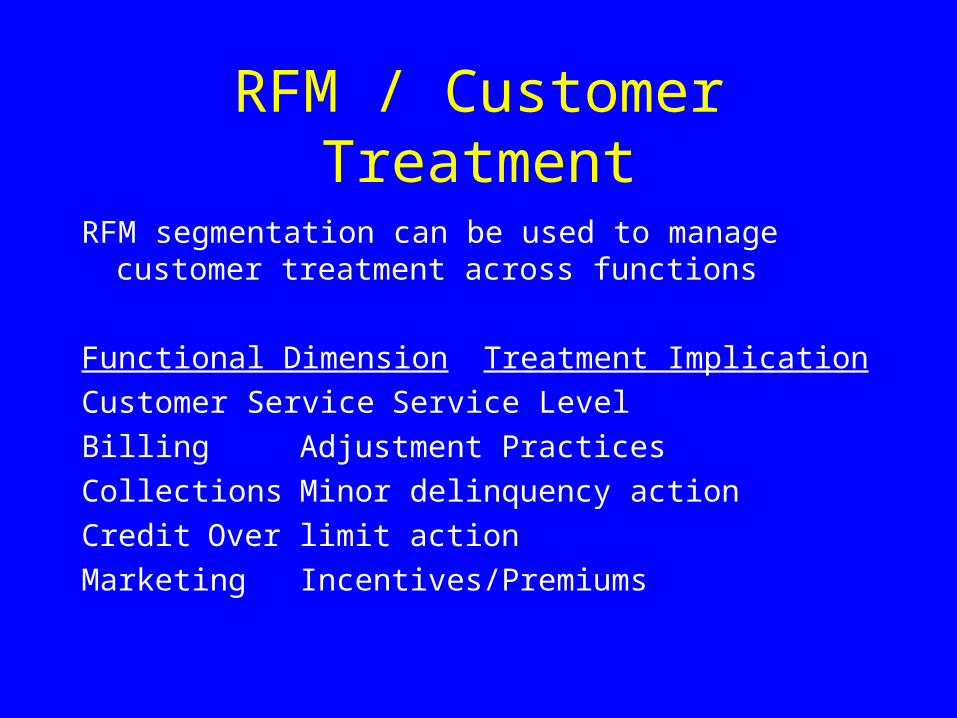
RFM / Customer Treatment
RFM segmentation can be used to manage customer treatment across functions
Functional Dimension Treatment Implication
Customer Service Service Level
Billing Adjustment Practices
Collections Minor delinquency action
Credit Over limit action
Marketing Incentives/Premiums
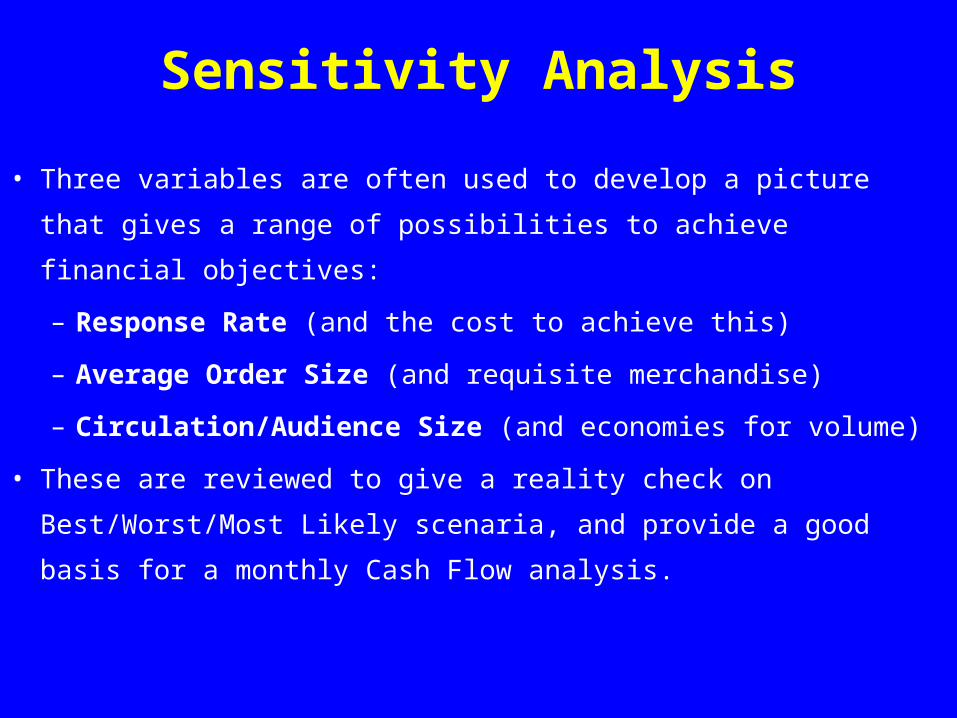
Sensitivity Analysis
• Three variables are often used to develop a picture that gives a
range of possibilities to achieve financial objectives:
– Response Rate (and the cost to achieve this)
– Average Order Size (and requisite merchandise)
– Circulation/Audience Size (and economies for volume)
• These are reviewed to give a reality check on Best/Worst/Most
Likely scenaria, and provide a good basis for a monthly Cash Flow
analysis.
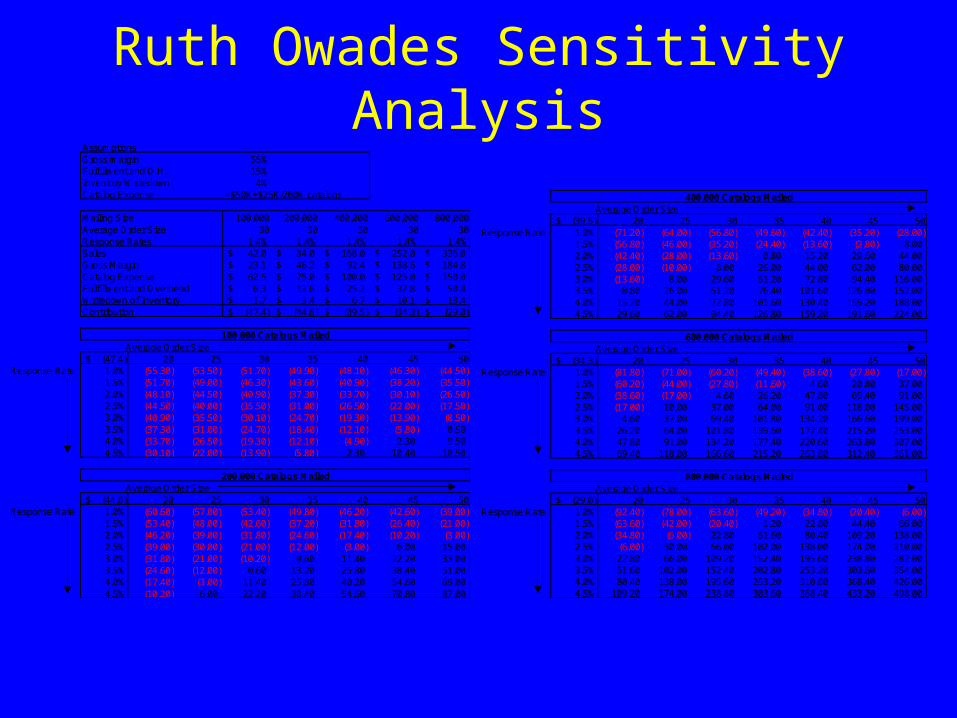
Ruth Owades Sensitivity AnalysisAssumptionsGross margin 55%Fulfillment and O.H. 15%Inventory Writedown 4%Catalog Expense =$50K+$25K/200K catalogs
Mailing Size 100,000 200,000 400,000 600,000 800,000Average Order Size 30 30 30 30 30Response Rates 1.4% 1.4% 1.4% 1.4% 1.4%Sales 42.0$ 84.0$ 168.0$ 252.0$ 336.0$ Gross Margin 23.1$ 46.2$ 92.4$ 138.6$ 184.8$ Catalog Expense 62.5$ 75.0$ 100.0$ 125.0$ 150.0$ Fulfillment and Overhead 6.3$ 12.6$ 25.2$ 37.8$ 50.4$ Writedown of Inventory 1.7$ 3.4$ 6.7$ 10.1$ 13.4$ Contribution (47.4)$ (44.8)$ (39.5)$ (34.3)$ (29.0)$
(47.4)$ 20 25 30 35 40 45 50Response Rate 1.0% (55.30) (53.50) (51.70) (49.90) (48.10) (46.30) (44.50)
1.5% (51.70) (49.00) (46.30) (43.60) (40.90) (38.20) (35.50)2.0% (48.10) (44.50) (40.90) (37.30) (33.70) (30.10) (26.50)2.5% (44.50) (40.00) (35.50) (31.00) (26.50) (22.00) (17.50)3.0% (40.90) (35.50) (30.10) (24.70) (19.30) (13.90) (8.50)3.5% (37.30) (31.00) (24.70) (18.40) (12.10) (5.80) 0.504.0% (33.70) (26.50) (19.30) (12.10) (4.90) 2.30 9.504.5% (30.10) (22.00) (13.90) (5.80) 2.30 10.40 18.50
(44.8)$ 20 25 30 35 40 45 50Response Rate 1.0% (60.60) (57.00) (53.40) (49.80) (46.20) (42.60) (39.00)
1.5% (53.40) (48.00) (42.60) (37.20) (31.80) (26.40) (21.00)2.0% (46.20) (39.00) (31.80) (24.60) (17.40) (10.20) (3.00)2.5% (39.00) (30.00) (21.00) (12.00) (3.00) 6.00 15.003.0% (31.80) (21.00) (10.20) 0.60 11.40 22.20 33.003.5% (24.60) (12.00) 0.60 13.20 25.80 38.40 51.004.0% (17.40) (3.00) 11.40 25.80 40.20 54.60 69.004.5% (10.20) 6.00 22.20 38.40 54.60 70.80 87.00
100,000 Catalogs Mailed Average Order Size
200,000 Catalogs Mailed Average Order Size
(39.5)$ 20 25 30 35 40 45 50Response Rate 1.0% (71.20) (64.00) (56.80) (49.60) (42.40) (35.20) (28.00)
1.5% (56.80) (46.00) (35.20) (24.40) (13.60) (2.80) 8.002.0% (42.40) (28.00) (13.60) 0.80 15.20 29.60 44.002.5% (28.00) (10.00) 8.00 26.00 44.00 62.00 80.003.0% (13.60) 8.00 29.60 51.20 72.80 94.40 116.003.5% 0.80 26.00 51.20 76.40 101.60 126.80 152.004.0% 15.20 44.00 72.80 101.60 130.40 159.20 188.004.5% 29.60 62.00 94.40 126.80 159.20 191.60 224.00
(34.3)$ 20 25 30 35 40 45 50Response Rate 1.0% (81.80) (71.00) (60.20) (49.40) (38.60) (27.80) (17.00)
1.5% (60.20) (44.00) (27.80) (11.60) 4.60 20.80 37.002.0% (38.60) (17.00) 4.60 26.20 47.80 69.40 91.002.5% (17.00) 10.00 37.00 64.00 91.00 118.00 145.003.0% 4.60 37.00 69.40 101.80 134.20 166.60 199.003.5% 26.20 64.00 101.80 139.60 177.40 215.20 253.004.0% 47.80 91.00 134.20 177.40 220.60 263.80 307.004.5% 69.40 118.00 166.60 215.20 263.80 312.40 361.00
(29.0)$ 20 25 30 35 40 45 50Response Rate 1.0% (92.40) (78.00) (63.60) (49.20) (34.80) (20.40) (6.00)
1.5% (63.60) (42.00) (20.40) 1.20 22.80 44.40 66.002.0% (34.80) (6.00) 22.80 51.60 80.40 109.20 138.002.5% (6.00) 30.00 66.00 102.00 138.00 174.00 210.003.0% 22.80 66.00 109.20 152.40 195.60 238.80 282.003.5% 51.60 102.00 152.40 202.80 253.20 303.60 354.004.0% 80.40 138.00 195.60 253.20 310.80 368.40 426.004.5% 109.20 174.00 238.80 303.60 368.40 433.20 498.00
800,000 Catalogs Mailed Average Order Size
400,000 Catalogs Mailed Average Order Size
600,000 Catalogs Mailed Average Order Size
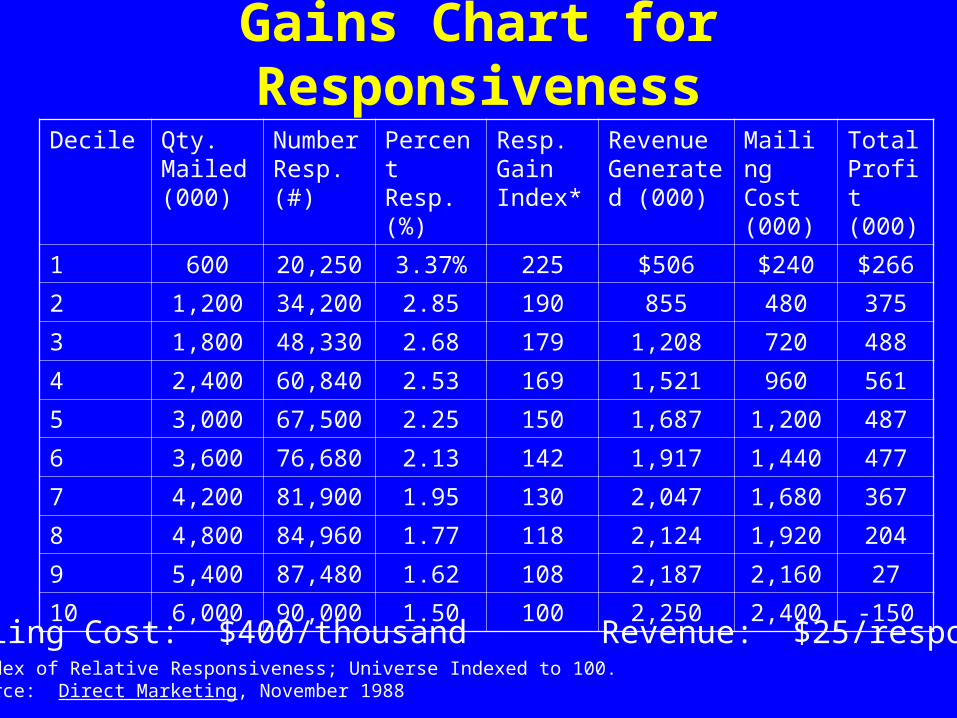
Gains Chart for Responsiveness
Decile Qty. Mailed (000)
Number Resp. (#)
Percent Resp. (%)
Resp. Gain Index*
Revenue Generated (000)
Mailing Cost (000)
Total Profit (000)
1 600 20,250 3.37% 225 $506 $240 $266
2 1,200 34,200 2.85 190 855 480 375
3 1,800 48,330 2.68 179 1,208 720 488
4 2,400 60,840 2.53 169 1,521 960 561
5 3,000 67,500 2.25 150 1,687 1,200 487
6 3,600 76,680 2.13 142 1,917 1,440 477
7 4,200 81,900 1.95 130 2,047 1,680 367
8 4,800 84,960 1.77 118 2,124 1,920 204
9 5,400 87,480 1.62 108 2,187 2,160 27
10 6,000 90,000 1.50 100 2,250 2,400 -150
Mailing Cost: $400/thousand Revenue: $25/response*Index of Relative Responsiveness; Universe Indexed to 100.Source: Direct Marketing, November 1988
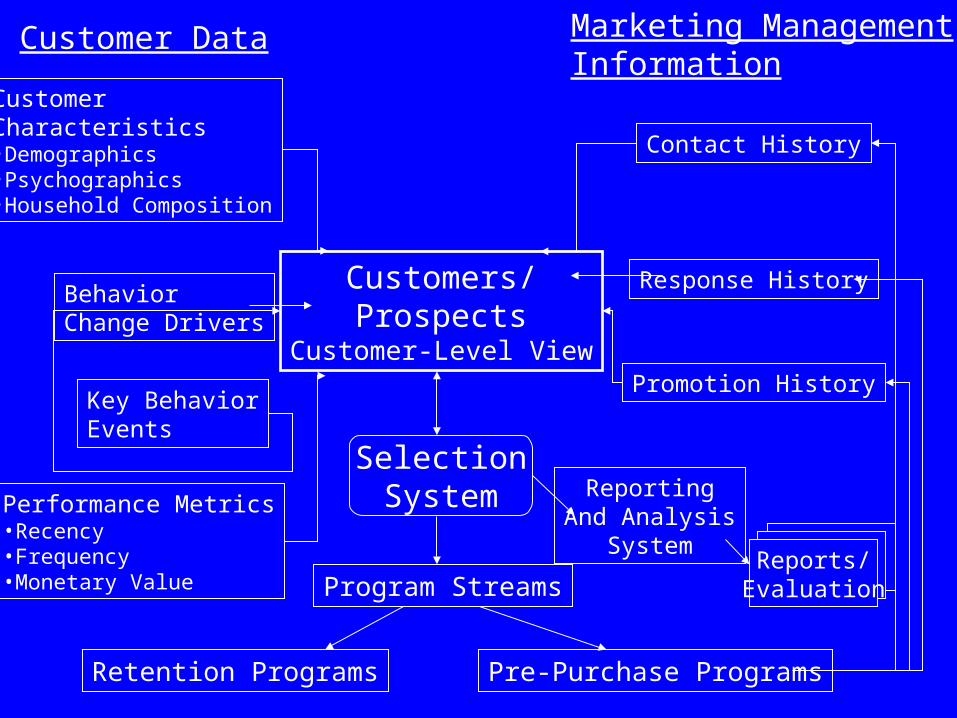
Customer Data
CustomerCharacteristics•Demographics•Psychographics•Household Composition
BehaviorChange Drivers
Key BehaviorEvents
Performance Metrics•Recency•Frequency•Monetary Value
Marketing ManagementInformation
Contact History
Response History
Promotion History
Customers/Prospects
Customer-Level View
SelectionSystem
Program Streams
Pre-Purchase ProgramsRetention Programs
ReportingAnd Analysis
SystemReports/
Evaluation

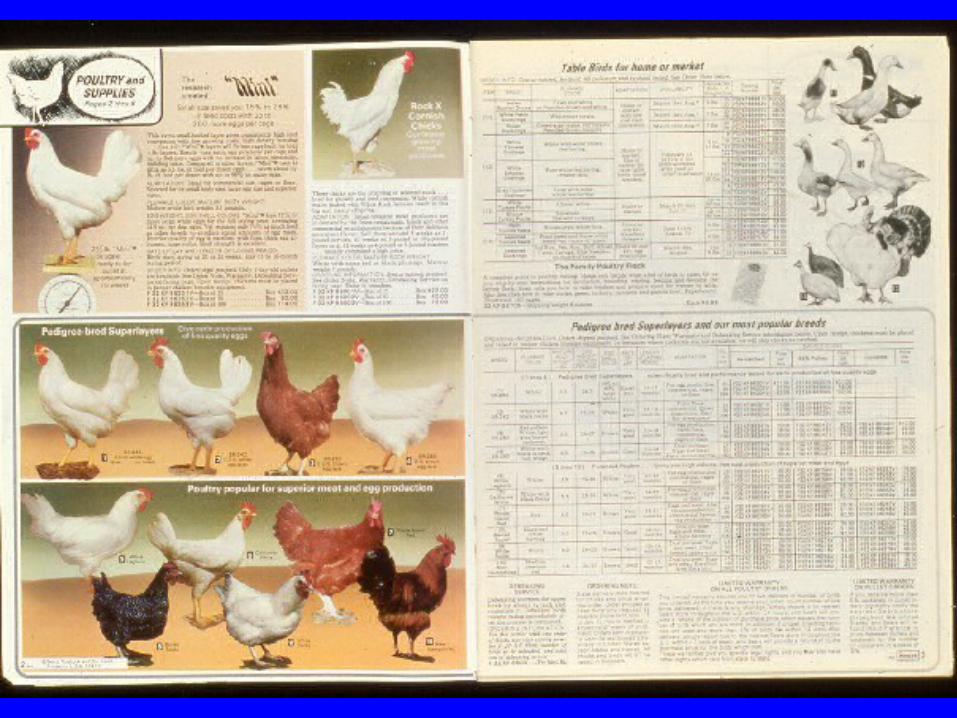
CATALOG
A complete enumeration of items arranged systematically with descriptive details – a pamphlet or book that contains such a list.
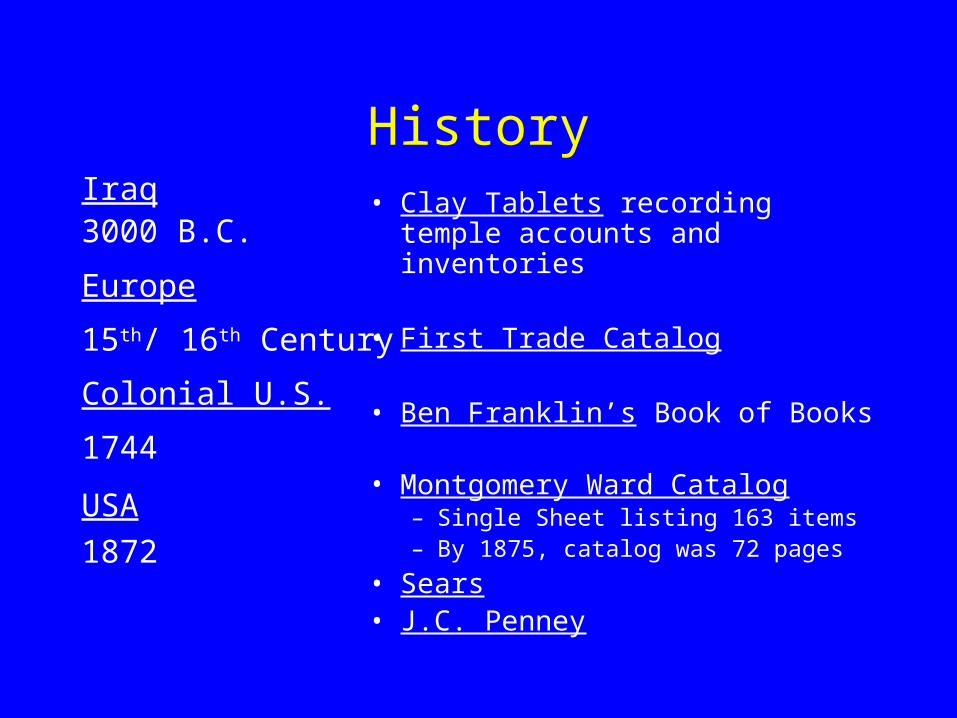
HistoryIraq3000 B.C.
Europe
15th/ 16th Century
Colonial U.S.
1744
USA
1872
• Clay Tablets recording temple accounts and inventories
• First Trade Catalog
• Ben Franklin’s Book of Books
• Montgomery Ward Catalog– Single Sheet listing 163 items– By 1875, catalog was 72 pages
• Sears• J.C. Penney


Thank You!


![EXECUTIVE MBA [EMBA] - esic.edu · TOP 50 EXECUTIVE MBA según el Ranking de Youth ... Finanzas internacionales. 3. Marketing ... tativa del claustro de profesores del EMBA de ESIC](https://img.pdfslide.net/doc/110x75/5be0421309d3f294578c3107/executive-mba-emba-esicedu-top-50-executive-mba-segun-el-ranking-de-youth.jpg)