Embed Size (px)
Citation preview

FocusUniversity of Wisconsin–MadisonInstitute for Research on Poverty
Volume 18
Number 2
Fall/Winter 1996–97
ISSN: 0195–5705
Immigration and social policy: New interest inan old issue 1
Legal immigrants and welfare: Some definitions 11
Immigration provisions in the new welfare law 14
Surveying immigrant communities 19
Immigration and the changing geographyof poverty 24
Immigration and labor market outcomes fornative workers 30
Forging mobility in a low-wage environment:Mexican immigrants in Chicago’s Little Villageneighborhood 35
Public assistance use by immigrants:What can the U.S. Census tell us? 41
Immigrants and welfare: Evidence from theSurvey of Income and Program Participation 47
Elderly immigrants on welfare 50
Medicaid use by children of immigrants 54
The use of food assistance programs by elderlyHispanic immigrants in Massachusetts 57
Food insecurity and hunger: Poverty policyissues for the 1990s and beyond 61
Welfare reform and the poor children ofworking parents 65
Immigration has once again become a subject of national public policy. During the summer of 1996, the rights and obligations ofmillions of legal immigrants were radically altered by new welfare law and by changes in immigration law. The first articles in thisissue of Focus summarize these legal changes and suggest possible consequences. Following articles examine the data and definitionaldifficulties that have characterized much study of immigrants; explore the large differences among present-day immigrant groups andthe interactions between immigration and the internal migration of poor native-born families; and analyze immigrant use of welfareprograms. Partial support for this issue came from the Office of the Assistant Secretary for Planning and Evaluation in the U.S.Department of Health and Human Services, and from the Joyce Foundation and Helen Bader Foundation through the project,“Informing the Welfare Debate.” The opinions expressed are those of the authors, not the sponsoring organizations.
Immigration and social policy: New interestin an old issueThomas J. Espenshade, Michael Fix, Wendy Zimmerman,and Thomas Corbett
In 1984, reviewing existing research into the economicand fiscal effects of immigrants upon the United States,Douglas Massey concluded:
A critical lack of information remains one of thehallmarks of the immigration field, and anyonewho works in the area for a little while soon real-izes its role in fomenting controversy, disagree-ment, and ultimately, inaction. Accurate informa-tion is a prerequisite to effective policy, and it is anecessary, though not a sufficient, ingredient ofconsensus.1
A 1985 issue of Focus subsequently reported the primaryconclusions of a two-year research effort that was di-rected by Marta Tienda.2 Using 1980 Census data toexamine the experience of immigrants in the U.S. laborforce and their dependency, if any, on public welfareprograms, the researchers concluded the following:
1. Immigrants had not displaced native labor; instead,native and foreign-born workers were “complementsrather than substitutes in production.” This general con-clusion obtained, with some qualifications, regardless ofwhether the dependent variable analyzed was earnings,earnings growth, or labor force participation rates.

2
2. Immigrants were, other things equal, considerably lesslikely than natives to receive welfare. Moreover, with theexception of Asian groups, allegations that recent immi-grants participated in welfare programs at rates higherthan earlier arrivals were not empirically supported.
Eleven years and another U.S. census later, immigrationhas once again become a controversial issue at the fore-front of domestic policy debates. Conclusions drawnover a decade ago may have little relevance today.Whether or not circumstances have changed, the charac-ter of the debate surely has. Thomas Espenshade hasobserved that “Anti-immigrant sentiment and fiscal con-servatism have coalesced to form a new fiscal politics ofimmigration. Immigrants are viewed as part of the reasonfor the high cost of social services and are especiallyvulnerable to current attempts to reduce government ex-penditures.”3 These sentiments are reflected in publicopinion polls; one survey taken at the time of the 1996presidential election found that over two-thirds of allrespondents felt that President Clinton should “putstricter limits on legal immigration.”4
In immigration policy making, perception is often morecompelling than reality, and dispassionate analysis is allthe more critical. Compared to the mid-1980s, there nowexists a diverse scholarly literature that explores the rela-tive costs and benefits associated with recent immigra-tion into the United States.5 This issue of Focus cannotsummarize that literature. Rather, it offers a sampling ofrecent research, seeking to illuminate the difficult dataand conceptual issues associated with the serious studyof the consequences of immigration, above all for the so-cial safety net. This introductory article reviews the his-torical context of the immigration debate, explores recentchanges in public and political attitudes toward immigra-tion, and considers some legal and equity aspects of thelegislative changes made in the summer of 1996.
An immigration policy, but no immigrantpolicy?
U.S. immigration policy has attempted to achieve mul-tiple goals that have been weighted differently over timeand that have not always proved mutually compatible:6
• economic objectives, such as increasing the supply oflabor either overall, in the early years, or where skilldeficits exist or natives are reluctant to perform cer-tain tasks;
• humanitarian objectives, such as reuniting families;
• cultural objectives, such as promoting ethnic and ra-cial diversity, the latter emerging as important inreaction to earlier policies which favored immigrantsof European origins;
• political objectives, such as permitting certain politi-cal refugees into the country or, conversely, restrict-
ing access where it would create undesired economicor social consequences.
Balancing diverse objectives is seldom easy. As early asthe late eighteenth and early nineteenth centuries, tensionexisted between a desire to attract newcomers to anemerging nation and worries about attracting those whocould not (or would not) avail themselves of opportuni-ties. On the one hand, as Stanley Engerman points out,over half of all colonial immigrants arrived in an inden-tured status, or otherwise had their relocation subsi-dized.7 On the other, since the colonies had adopted theEnglish Poor Laws, which made local public authoritiesultimately responsible for the care of the destitute, new-comers often were subject to rigorous scrutiny. Some-times they were required to show evidence that theywould not become a burden to the community, have asponsor who would accept financial responsibility, post abond or other evidence of financial security, or have ajob or other means of support. Those “at-risk” of becom-ing public burdens were often discouraged from settlingin the community.
The number of immigrants grew from around 100,000newcomers in the 1820s to 1.7 million in the 1840s. Afterthe Civil War, immigration once again surged, from 2.8million in the 1870s to 5.2 million in the 1880s, and thesources of immigration changed, as large numbers ofsouthern Europeans and Chinese began arriving. In thesame period, the United States underwent two majorwaves of welfare reform, first in the 1840s and again inthe 1880s. “Outdoor” relief—the provision of cash tofamilies in their own homes—came to be considered amajor contributor to the social and personal disorganiza-tion often associated with poor, non-native families.Various reforms called for the substitution of “indoor”(e.g., workhouses) for “outdoor” relief, or the substitu-tion of counseling and moral suasion for cash help, or thewidespread removal of children from “improper” (oftenurban immigrant) families and their placement in ruralhouseholds where they would learn discipline and beremoved from harm’s way.
An apparent temporal link between increases in the mag-nitude of immigration and the increase in sentiments for
This introductory article has benefited materi-ally from the discussions of immigration issuesin papers by Thomas J. Espenshade of the Officeof Population Research, Princeton University(“Fiscal Impacts of Immigrants and the Shrink-ing Welfare State”) and Michael Fix and WendyZimmermann of the Urban Institute (“WhenShould Immigrants Receive Public Benefits,”and “Immigrant Families and Public Policy: ADeepening Divide”); and from IRP Acting Direc-tor Thomas Corbett’s analyses of the role of wel-fare in American society. The editor is gratefulfor their contributions.

3
welfare reform may be coincidental, not causal. Politicalaction during the 1880s suggests, however, growinganxiety about immigration. True national immigrationlegislation began in 1882 with passage of the ChineseExclusion Act, which suspended the immigration of Chi-nese laborers for 10 years, limited Chinese naturaliza-tion, and provided for the deportation of illegal Chineseimmigrants. The Immigration Act of 1891 established thefirst overall framework for controlling immigration and afederal bureaucracy within the Department of the Trea-sury for administering the laws. The Immigration andNaturalization Act of 1924, following the great surge ofimmigration at the beginning of the century, imposed thefirst permanent quotas on immigration and establishedpreferences for immigrants of northern and western Eu-ropean origins. The foreign-born population subse-quently declined, from almost 15 million in the late1920s to less than 10 million in the late 1960s.
National immigration policy changed again in 1965 withpassage of the Immigration and Nationality Act Amend-ments, which established the ground rules for the shiftaway from European immigration that subsequently oc-curred. The ensuing period has been marked by severaltrends:
Scope and magnitude. Recently, about 1.1 million immi-grants have been coming to the United States each yearand staying.8 Table 1 gives the numbers of immigrantsadmitted from 1987 to 1995 by the immigration categoryunder which they were admitted. In 1994, the share of theU.S. population that was foreign-born was 8.5 percent, afigure well below the historic high of 1910, when 14.7percent of the population was foreign-born, and belowcomparable figures found in other developed, English-speaking nations. For example, in 1991, 22.7 percent ofAustralian residents and 15.6 percent of Canadian resi-dents were foreign-born.9
Pace. The rate of immigration has increased recently, theshare of the population that is foreign-born having in-
creased by almost 80 percent in the last quarter century.This has been driven by everything from the conse-quences of U.S. foreign policy (e.g., Vietnam) to eco-nomic and political dislocation in Mexico and CentralAmerica. Over half of all immigrants in the United Stateshave arrived since 1980.
Diversity and heterogeneity. Newer waves of immigrantsare no longer coming primarily from a select few north-ern and western European countries. Between 1970 and1990 the number of sending countries with at least100,000 residents in the United States doubled, from 21to 41. Immigration patterns also changed. From 1961 to1970, over one-third of all immigrants came from Eu-rope, and fewer than 13 percent from the Asian conti-nent. Between 1981 and 1990, these percentages werealmost reversed: fewer than 17 percent of immigrantscame from Europe, over 37 percent from Asia. Table 2provides a snapshot of the foreign-born population, bothimmigrants and naturalized citizens, in 1994. The largestnumber of foreign-born (approximately 6.2 million)comes from Mexico; the next largest group (approxi-mately 1 million) comes from the Philippines. Between1990 and 1994, the Asian and Pacific Islander populationof the United States increased from 7.3 to 8.8 million;about 86 percent of this growth was due to immigration.The Hispanic population of the United States increasedby 28 percent, to 27 million, 39 percent of whom wereforeign-born.10
Concentration. Nearly three-quarters of all immigrantsto the United States live in just seven states—over one-third of them in California (see Figure 1)11—and over-whelmingly reside in urban areas. Indeed, about half ofall immigrants entering during the 1980s were living, atthe time of the 1990 Census, in eight metropolitan areas:Los Angeles, Anaheim, and San Francisco on the WestCoast, New York, Washington, D.C., and Miami on theEast Coast, Chicago, and Houston.
Table 1Immigrants Admitted to the United States by the Immigration and Naturalization Service, 1987–1995
Type and Class of Admission 1987 1988 1989 1990 1991 1992 1993 1994 1995
Total, all immigrants 601,516 643,025 1,090,924 1,536,483 1,827,167 973,977 904,292 804,416 720,461IRCA legalizeda — — 478,814 880,372 1,123,162 163,342 24,278 6,022 4,267Preference immigrants 269,328 259,499 274,833 272,742 275,613 329,321 373,788 335,252 323,458
Family-sponsored 211,809 200,772 217,092 214,550 216,088 213,123 226,776 211,961 238,122Employment-basedb 57,519 58,727 57,741 58,192 59,525 116,198 147,012 123,291 85,336
Immediate relatives of U.S. citizens218,575 219,340 217,514 231,680 237,103 235,484 255,059 249,764 222,254Refugees and asylees 91,840 81,719 84,288 97,364 139,079 117,037 127,343 121,434 114,664Otherc 21,773 82,467 35,475 54,325 52,210 128,793 123,824 91,944 61,979
Source: U.S. Immigration and Naturalization Service, Statistical Yearbook of the Immigration and Naturalization Service, 1994 (Washington, D.C.:U.S. Government Printing Office, 1996), p. 32. Figures for 1995 from INS site on the World Wide Web (http://www.usdoj.gov/ins/, Immigration tothe United States in Fiscal Year 1995, Table 2, Immigrants Admited by Major Category of Admission: Fiscal Years 1993–96.aAdmitted under the Immigration Reform and Control Act of 1986 (see this issue, p. 12).bIncludes spouses and children.cThis category includes a wide variety of immigrants admitted in different circumstances and in different periods, e.g., Amerasians, Cubans/Haitians,nationals of adversely affected or underrepresented countries.

4
California (34.30%)Remainder of States (27.90%)
Florida (9.20%)
New York (8.40%)
Massachusetts (2.60%)
New Jersey (4.80%)
Illinois (4.80%)
Texas (8.00%)
Targeted assistance programs for legal immigrants
In 1995, Michael Fix and Wendy Zimmermann, of theUrban Institute’s Immigrant Policy Program, reviewedexisting federal assistance programs for immigrants andestimated some potential impacts of various legislativeproposals then pending.12 Over the past 30 years, stateFix and Zimmermann, the federal government has had aninclusive immigration policy, directed in large part to-ward family reunification, but has largely had a laissez-faire, hands-off immigrant policy. Public responsibilityfor incorporating newcomers and their families hasfallen, mostly by default, to state and local govern-ments.13
U.S. immigrant policy consists of targeted immigrantpolicies aimed exclusively or largely at newcomers; leg-islatively or administratively set eligibility rules formainstream social welfare and education programs; andthe rights of aliens as they have been defined in thecourts, often interpreting constitutional doctrines.
Assistance programs have included the following: (1)programs that provide health, public assistance, job
training, and social services to refugees and asylees; (2)programs directed at elementary and secondary schoolstudents and adults of limited English proficiency; (3)policies and resources intended to deter discrimination inemployment on the basis of selected alien and nationalorigin characteristics; (4) resources provided to state andlocal governments to offset the fiscal impacts of specific
Table 2Characteristics of the Native and Foreign-Born Population of the United States in 1994
Foreign-born _Naturalized Year of Entry _
Characteristic Native Total Citizen Not a citizen Before 1970 1970–79 1980–89 1990–94
Total (in 000) 237,184 22,568 6,975 15,593 4,974 4,781 8,311 4,502Age
Under 5 yrs 8.5% 1.3% 0.4% 1.7% 0.0% 0.0% 0.3% 6.1%5–17 yrs 19.9 9.7 3.5 12.5 0.0 1.8 14.5 20.018–64 yrs 60.0 77.3 72.8 79.3 62.5 92.0 81.3 70.565+ yrs 11.9 11.7 23.3 6.5 37.5 6.1 3.9 3.4
SexMale 48.8 49.3 49.9 50.8 43.5 48.5 52.7 50.4Female 51.2 50.7 54.1 49.2 56.5 51.5 47.3 49.6
Race & Hispanic originWhite 84.2 68.4 68.1 68.5 86.7 64.0 62.4 63.7Black 13.3 7.1 4.9 8.0 4.0 7.2 8.9 7.0Asian or Pacific Islander 1.2 20.5 24.4 18.8 7.8 24.6 24.0 24.0Hispanic origin 6.9 45.5 27.0 53.8 31.4 48.8 53.0 43.8
Educational attainment,among persons 25+ yrs
Not HS graduate 17.1 36.0 24.3 42.6 32.0 37.8 39.1 33.3HS grad/some college 60.8 41.0 48.8 36.5 48.3 40.1 38.1 34.3Bachelor’s degree 14.7 14.9 17.4 13.5 11.8 14.9 15.0 20.9Graduate or prof. degree 7.4 8.2 9.5 7.5 7.9 7.2 7.8 11.5
In the civilian labor force,for those 16+ yrs
Employed 93.2 90.9 94.1 89.3 94.4 91.6 89.9 87.8Unemployed 6.8 9.1 5.9 10.7 5.6 8.4 10.1 12.2
Median income in 1993,for those 16+ yrs $15,876 $12,179 $16,103 $10,930 $14,473 $15,121 $11,580 $8,393Poverty statusa
In poverty 14.4 23.0 10.1 28.7 10.8 16.3 26.4 37.3Not in poverty 85.6 77.0 89.9 71.3 89.2 83.7 73.6 62.7
Source: K. Hansen and A. Bachu, The Foreign-Born Population: 1994, U.S. Census Bureau Current Population Report P20-486, August 1995, p. 5.Note: Percentages have been rounded. Persons of Hispanic origin may be of any race.aPersons for whom poverty status is determined.
Figure 1. Foreign-born population, by state of residence.
Source: K. A. Hansen and A. Bachu, The Foreign-Born Population:1994, U.S. Census Bureau Current Population Report P-20-486, Au-gust 1995, p. 1.

5
immigrant groups (e.g., the Emergency Immigrant Edu-cation Act and programs to reimburse states for the costof incarcerating criminal aliens, discussed below); (5)efforts made by federal, state, and local governments tohelp immigrants naturalize.
Almost the only federal program that explicitly addressesthe broad adaptation of immigrant families to Americansociety is for refugees and asylees, who have been con-sidered a special case. The Refugee Resettlement Pro-gram, established by the 1980 Refugee Act, providesfunds for income support, health services, job training,and social services. Funding for this program fell from$7,400 per refugee to $2,100 (in inflation-adjusted dol-lars) between fiscal years 1984 and 1994.14
Federal funding for targeted immigrant programs is lim-ited and has declined. The federal government spendsroughly $300 million combined on the two principallanguage acquisition programs, bilingual education forelementary and secondary students and English as a Sec-ond Language for adults. Between 1985 and 1992, thenumber of limited-English-proficient children in thenation’s schools rose by 65 percent, to about 2.5 million.During that same period, real increases in federal spend-ing on bilingual education rose by only 4 percent. As acomparison, in FY 1991, the state of California spent$282 million on state adult education programs; federalspending, despite the percentage increase, totaled only$201 million.
Aid distributed under the Emergency Immigrant Educa-tion Act is intended to offset state costs for foreign-bornstudents who have less than three complete academicyears in U.S. schools. In 1994, there were 700,000 suchstudents, and the aid available amounted to approxi-mately $50 per immigrant child. The program to offsetstate costs of incarcerating criminal aliens, in contrast,will provide approximately $12,000 per prisoner in im-pact aid in FY 1996.
A new nativism?
It was earlier noted that nativism has long historical rootsin the United States. The attitudes of native-born Ameri-cans toward each new wave of immigrants have shiftedamong tolerance, ambivalence, and outright rejection.Now, as in earlier periods when patterns of immigrationchanged visibly, isolationist sentiment seems once againto have become a political force in the United States. Thepresent isolationism is characterized by a turning inward,by attempts to protect one’s family, community, andnation from unwanted outside influences. This inward-turning, anti-immigrant mood has found public expres-sion in the demands for restricting legal immigration andin the “English-only” movement. Over 20 states havepassed legislation making English the only official lan-guage of state business, and federal legislation to the
same end was introduced into Congress in 1995.15 At thesame time, movements for welfare reform gathered mo-mentum. But are present-day demands for both nationalimmigration reform and for welfare reform linked, and ifso, how?
Following World War II, the American public hadadopted a somewhat more liberal perspective on interna-tional migration than had existed earlier. This changewas sparked in part by an expanding economy, by na-tional acceptance of the role of the United States as aworld superpower with a special responsibility to refu-gees, and by reduced ethnic, religious, and racial preju-dice. One consequence of these more generous attitudeswas the 1965 immigration legislation that effectivelyeliminated country-of-origin quotas for immigrants andestablished new principles based in part on family reuni-fication. Thereafter, U.S. immigration policies and lawsgoverning the rights of immigrants were steadily liberal-ized. Rooted in the American civil rights movement, thisrights-based liberalism included, for example, deporta-tion hearings and appeal rights for apprehended undocu-mented immigrants and asylum seekers, and a SupremeCourt decision that guaranteed undocumented immigrantchildren the right to public school education (Plyer v.Doe, 1982).
But public opposition to the attitudes represented in thesemore generous policies began to intensify even as thelegislation was being implemented. In a 1981 survey,two out of three respondents believed that levels of im-migration to the United States should be reduced; theproportion was twice as large as that detected in 1965.16
A number of reasons have been offered for this change inattitudes. One was a growing sense of economic insecu-rity and anxiety over shrinking employment opportuni-ties and a declining standard of living. These were per-ceived to be a result of stagnant wages, decline in U.S.manufacturing powerhouses such as autos and steel, andcorporate downsizing that led to white-collar layoffs forthe first time since the Great Depression. The recentdebate over passage of the North American Free TradeAgreement (NAFTA) evoked a deep fear that further joblosses would follow if manufacturing and service jobswere exported overseas at an even faster rate. That fearfound expression in protectionist and isolationist senti-ments.
Added to economic uncertainty was mounting concernabout both legal and illegal immigration. In absoluteterms, the volume of legal immigration is now the largestin U.S. history. Roughly 20 percent of the foreign-bornhave arrived in the last five years, suggesting to manypeople that the tempo of immigration is accelerating, andthat it threatens the jobs of native-born workers andpresages radical change in the racial and ethnic composi-tion of the U.S. population.17 Opposition to bilingualinstruction for non-English-speaking children in the

6
schools is not new but has again moved into mainstreampolitical discussion. Concern about legal immigration isintensified by illegal immigration, which is a continuingsore point in heavily affected states such as California.The perceived costs of illegal immigration fall primarilyon state and local governments, provoking the publicanger that found expression in California’s Proposition187. In 1986 Congress passed the Immigration Reformand Control Act (IRCA), which was expected to reducethe flow of illegal immigrants. It did so only temporarily,and the federal government is trying again, with legisla-tion passed in September 1996 that will almost doublethe size of the Border Patrol, greatly expand the capacityof the Immigration and Naturalization Service to investi-gate illegal immigrants in the workforce, and increasepenalties for visa violations.18
Figure 2 presents recent trends in immigration attitudesand the annual U.S. unemployment rate. The two seriesare in general highly correlated, suggesting that anti-immigrant sentiments may be related to economic con-cerns and income insecurity. A June 1993 poll by theNew York Times–CBS News that asked questions aboutthe performance of the president, the state of the U.S.economy, and attitudes toward foreigners and immigra-tion also demonstrated a clear link between isolationism,economic protectionism, and restrictionist views on im-migration. For instance, respondents who believed thatthe U.S. economy was deteriorating held significantly
more negative opinions about immigrants and immigra-tion than did persons who felt the economy was improv-ing. Those who thought that trading with Japan and othercountries was bad for the United States, who opposedNAFTA, and who felt that foreign products were inferiorto those made in the United States generally also pre-ferred lower levels of immigration.19
Anti-immigrant sentiment has intersected with anothertrend. The federal budget deficit grew to unprecedentedsize in the early 1980s, engendering what has been calleda “balanced-budget conservatism,” defined as “omni-present political focus on deficits, spending cuts, and taxavoidance.” This suggests, first, that the size of the defi-cit, and not the health of the macro economy, has becomethe yardstick for measuring congressional budgetingpolicy, and second, that groups see themselves as beingpitted against each other in competition for shrinkinggovernment resources.20 It is plausible that a growingfiscal conservatism, reinforced by economic and socialinsecurity, has given rise to initiatives curtailing the sizeand generosity of government. The welfare legislationending entitlement to public assistance is only the mostprominent example.
Together, nativism and fiscal conservatism have broughtabout legislation that seeks to reduce the public costs ofimmigration by extending to legal immigrants the restric-tions on the receipt of social services that have customar-
Wanting Fewer Immigrants (Y1) Unemployed (Y2)
1945 1955 1965 1975 1985 1995
30
40
50
60
70
2.5
3.5
4.5
5.5
6.5
7.5
8.5
9.5
Figure 2. Percentage of American public who want immigration decreased, and trend in U.S. unemployment rate.
Source: T. J. Espenshade, “Fiscal Impacts of Immigrants and the Shrinking Welfare State,” Working Paper No. 96-1, Princeton University, Office ofPopulation Research, p. 9.

7
ily applied only to illegal immigrants. Within this newfiscal politics of immigration, legal aliens came to beviewed as part of the reason for the high cost of socialservices. Having little or no voice in the electorate, theybecame an attractive and vulnerable target.
Legal immigrants and welfare reform
The confluence of pressure for a minimalist governmentand a general concern about immigration is reflected inseveral provisions of the Personal Responsibility andWork Opportunity Reconciliation Act of 1996, the fed-eral legislation establishing a new federal–state relation-ship in the design, management, and financing of publicassistance for poor Americans. Among other things, theact replaces Aid to Families with Dependent Children(AFDC) with Temporary Assistance to Needy Families(TANF). Unlike AFDC, TANF establishes no individualentitlement to benefits and delegates a great deal of pro-gram authority to the states regarding the design andmanagement of program specifics. But the legislationcontains logical inconsistencies, attempting to shift con-trol over welfare to the states while influencing a numberof state choices.
Title IV of the act, containing several provisions thataffect both legal and illegal immigrants, reflects thesephilosophical inconsistencies. By denying federallyfunded public benefits to newly arrived legal immigrantsfor the first five years they are in the country (albeit withindividual and program exceptions), the welfare legisla-tion makes a sharp distinction between U.S. citizens andnoncitizens, irrespective of their legal right to reside inthe United States. (Policy makers have hitherto made fewdistinctions between legal permanent residents and citi-zens, instead drawing a line between legal and illegalimmigrants.) There are several arguments made in sup-port of this set of policies. First is that the generosity ofthe U.S. social safety net serves as a magnet to the disad-vantaged of other nations, particularly those countrieswith underdeveloped economies and public sectors. Inconsequence, excessive immigration results in stagnatingreal wages and destructive job competition in the second-ary labor market, as well as increased tax burdens stem-ming from greater demand for services, from educationto welfare.21 It is also claimed that the sponsors of immi-grants have been shirking their responsibility to providefinancial support; this trend would be reversed if thegovernment did not provide assistance. And the sameargument that has ended entitlement of native-born fami-lies to welfare is directed against immigrants: that publicassistance becomes a crutch that inhibits immigrantsfrom adapting more quickly to the nation’s culture andfrom seeking productive work.
Testing the validity of the arguments advanced on bothsides is difficult. There is a dearth of solid and unam-biguous information about the economic consequences
of immigration. The consequences of interest are usuallysorted into two categories: labor market effects and fiscaleffects. The first have received the most attention fromeconomists, who have been concerned with how in-creased supplies of foreign workers in domestic marketsaffect the earnings and employment opportunities of na-tive workers. The fiscal effects of immigrants have onlyrecently become a topic of consequence among econo-mists. It is by no means clear how much immigrants payin taxes to federal, state, and local governments, howlarge are the benefits they receive in return, and how thetwo amounts compare within various jurisdictions.
Some potential effects of the new law
Consequences for the states
Testifying on H.R. 4, the House-Senate conference billthat was the precursor to the present welfare legislation,Virginia State Delegate Karen Darner expressed the con-cerns of the National Conference of State Legislatures(NCSL):
State legislators are deeply troubled by proposals tofinance federal welfare reform by eliminating ben-efits for legal immigrants. The federal govern-ment’s abdication of its responsibility to those itadmits to the country does not eliminate immi-grants’ needs, and state and local budgets and tax-payers will bear the burden.
NCSL has three principal concerns regarding pro-posed welfare reform (H.R. 4) and its effect onimmigrant policy in the states: they shift costs tostates; they create constitutional problems; andthey impose administrative burdens on the states.22
The large cutbacks under the new law (described in thearticle by Wendell Primus, pp. 14–18) will presumablyhave the greatest effects on the six or seven states whereimmigrants are concentrated, and on two states in par-ticular, California and New York, where about 52 per-cent of noncitizens live (see Figure 1). Because bothstates have higher rates of immigrant welfare use andhigher payment levels, they accounted for two-thirds ofthe excluded AFDC recipients and three-quarters ofAFDC savings that were expected from H.R. 4. Califor-nia state officials have now estimated that, as a result ofthe reductions in aid to immigrants mandated by the newwelfare law, the state stands to lose some $5.9 billion infederal aid to noncitizens over the next six years.23
The welfare reform bill creates distinct eligibility rulesfor natives, legal immigrants now in the United States,and those arriving after the law’s enactment. The ad-ministration of these complicated, multiple regulatoryregimes will fall to a host of federal, state, local, andperhaps nongovernmental organizations with quite dif-fering levels of administrative capacity. Among otherthings, they will be compelled to determine the nativityand legal status of applicants, determine which immi-

8
grants are sponsored, the sponsor’s income, the numberof quarters the immigrant has worked, and the wages andtaxes paid during those quarters. The rules now requirethat the incomes of immigrants’ sponsors be deemedavailable for their support in many more programs thanpreviously, and over very long periods of time; this alonewill place a heavy burden upon program administrators.Experience with child support enforcement demonstratesthat enforcing the affidavit of support will raise difficultadministrative questions, especially when the benefitsprovided are not expensive, are hard to price, and theprovider’s administrative capacity is limited.
Equity issues and the legal rights of immigrants
Fix and Zimmermann argue that the new welfare lawrisks a variety of negative social consequences by re-stricting immigrants’ access to services. It has been saidthat it is appropriate to limit the access of legal immi-grants to benefits received by citizens, because legalaliens who choose not to become citizens are demonstrat-ing a questionable commitment to the United States. But,say Fix and Zimmermann, making citizenship the gate-way to public benefits creates a motive to naturalizewhich has far more to do with self-interest than with anycommitment of allegiance to an adopted country. Citi-zenship not only guarantees the right to vote, but willprotect immigrants from the consequences of cuts ineligibility for public assistance and make it easier forthem to bring close family members to join them in theUnited States. Among immigrant communities, indeed,there has been a surge in applications for naturalization.In FY 1996, at a time when more restrictive immigrationand welfare measures were being widely discussed,nearly 1.1 million immigrants became citizens; the previ-ous record was 445,853 naturalizations, set in 1995.24
Legal immigrants incur the main legal obligations ofcitizenship: they pay taxes, and young immigrant mencan be and have been drafted in time of war. To restrictaccess to public benefits for an extended period duringwhich those obligations exist is to remove rights thathave traditionally accompanied the obligations. By re-stricting eligibility for immigrants who have not worked40 quarters in qualifying employment, the new law linkstheir eligibility to the duration and level of taxes theyhave paid in a manner that is not applied to citizens, andfails to take into account the sales, property, and othertaxes that immigrants also pay. By requiring that spon-sors’ incomes be deemed in a wide range of public assis-tance programs, the law imposes on immigrant families acontingent liability to reimburse public costs that is notimposed on native families. That liability may last indefi-nitely in the case of those for whom naturalization isdifficult or impossible to achieve. In effect, immigrantparticipation in social welfare programs is conditioned,in the same way that participation in social insuranceprograms such as Social Security is conditioned. Suchpolicies of immigrant exceptionalism reinforce the dis-
tinction between “citizens” and “aliens” in ways that maysharpen already existing social divisions and anti-immi-grant feeling.
There is also some question whether Congress can del-egate to the states the discretion to discriminate againstlegal immigrants in granting access to public benefitsand services, whether federal- or state-funded.25 Legalchallenges to the new welfare law are already under way.Some 22 states have language in their constitutions thataddresses the state’s obligation to protect the poor. Op-ponents of the new restrictions are expected to argue thatthis constitutional obligation bars states from implement-ing the prohibitions on legal immigrants in the welfarebill, and that the bill itself unconstitutionally discrimi-nates against a class of people—immigrants who havenot become citizens—when it cuts off public assistancebenefits.26
Concerns and contradictions
Ultimately, however, the issues that welfare reform posesfor the rights of lawful permanent resident aliens andtheir continued eligibility for public assistance are morephilosophical than legal or empirical.27 At their root, thelegal changes in welfare and immigration policy raisequestions about the meaning of membership in U.S. soci-ety. Robert Pear put the matter succinctly: “Despite thecountry’s history as a nation of immigrants, popularopinion in the United States has continually vacillated onthe question of whom the Government is meant to serve:its people, or just its citizens.”28
Two main strains of opinion over this issue haveemerged. In a 1994 report, the U.S. Commission on Im-migration Reform, though advocating a reduction in thenumbers of immigrants admitted under different visa cat-egories, supported a broadly inclusive interpretation ofthe government’s mandate and recommended against“any broad, categorical denial of public benefits to legalimmigrants” on the ground that legal immigrants whohave been accepted for permanent residence in theUnited States should be protected by a social safety netafforded citizens. Supporters of an inclusionary defini-tion ask: “Should not all individuals who are members(i.e., permanent residents) of a liberal society be ac-corded the full panoply of rights (social and political aswell as civil) enjoyed by those who are citizens?”29 Theirposition is backed by the Constitution, which speaks of“We the People of the United States,” not “We the Citi-zens” and by the Bill of Rights, which is designed toprotect the interests of people, not citizens. To makecitizenship a necessary prerequisite for receiving publicassistance, opponents of the new laws argue, is to contra-vene traditions that run deep in American political cul-ture. These constitutional arguments are reinforced byeconomic ones. In all probability, eliminating the eligi-bility of immigrants for federal benefits will have ad-verse effects upon the economic well-being of immi-

9
grants and of their children, many of whom are citizens,and will impose additional costs on states and localities.
But far more restrictive interpretations of the centralgovernment’s responsibilities have gained ground.30 Inthe United States, recent judicial rules and legislativeacts have diminished some of the rights and protectionspreviously accorded immigrants. Under the immigrationlaw of September 1996, those requesting asylum in theUnited States will face streamlined exclusion proceduresand narrower opportunities to make their case for legalresidence.
It is far too early to measure any specific effects upon thelegal immigrant population of the major changes in wel-fare policy now being implemented. Will the new restric-tions deter those who might have been encouraged toimmigrate by the existence of public benefits? It is notclear, in the first place, how many do immigrate for thisreason. Unless and until data on these kinds of behavioralresponses become available, the effects of the changeswill be very hard to predict. Satisfactory answers to eventhe most basic questions are hampered by inadequatedata, methodological differences, and conceptual incon-sistencies, as articles in this issue of Focus suggest. n
1Immigration: Issues and Policies, ed. Vernon Briggs and MartaTienda (Salt Lake City: Olympus Publishing Co., 1984), p. 135.
2“Immigrants, Work, and Welfare,” Focus 8, no. 3 (Fall-Winter1985), pp. 14–23.
3T. J. Espenshade, “Fiscal Impacts of Immigrants and the ShrinkingWelfare State,” Working Paper No. 96-1, Princeton University, Of-fice of Population Research, p. 1.
4Based on a poll taken by the Princeton Survey Research Associatesfor Newsweek as reported in The Polling Report 12, no. 2, Washing-ton D.C., November 1996.
5A comparison of labor market studies is provided by M. Fix and J. S.Passel, Immigration and Immigrants: Setting the Record Straight(Washington, D.C.: Urban Institute, 1994), appendix tables. Anothercomparison and review of studies of the fiscal aspects of immigrationis G. Vernez and K. F. McCarthy, The Costs of Immigration toTaxpayers: Analytical and Policy Issues (Santa Monica, CA: RAND,1996).
6For review and commentary on these issues, see Immigration,Economy, and Policy in America, the proceedings of a policy forumheld on May 3, 1996, at the Jerome Levy Economics Institute of BardCollege (Blithewood, Annandale-on-Hudson, N.Y., 1996).
7In Immigration, Economy, and Policy in America, p. 15.
8This is a gross immigration number. An estimated 200,000 immi-grants die each year and another 200,000 emigrate.
9R. M. Friedberg and J. Hunt, “The Impact of Immigrants on HostCountry Wages, Employment and Growth,” Journal of EconomicPerspectives 9, no. 2 (Spring 1995): 24.
10Estimates both of the numbers of the foreign-born and the size ofdifferent ethnic or racial categories differ because of different datacollection and estimating procedures and sampling errors. For ex-ample, estimates of the Asian and Pacific Islander population as ofMarch 1994 range from 7.4 million to 8.8 million. See Bureau of the
Census, The Nation’s Asian and Pacific Islander Population—1994,Statistical Brief 95–24, November 1995, and The Nation’s HispanicPopulation—1994, Statistical Brief 95–25, September 1995; K. A.Hansen and A. Bachu, The Foreign-Born Population: 1994, Bureauof the Census, Current Population Reports P20–486, August 1995.
11Urban Institute tabulations from the 1990 Census differ for Califor-nia (38 percent), New York (14 percent), and Florida (8 percent) (Fixand Passel, Immigration and Immigrants, p. 29). The heavy geo-graphical and urban concentration of immigrants today differs verylittle from residential patterns observed during the great wave ofimmigration at the beginning of the twentieth century.
12M. Fix and W. Zimmermann, “When Should Immigrants ReceivePublic Benefits?” (May 1995) and “Immigrant Families and PublicPolicy: A Deepening Divide” (November 1995), Urban Institute,Washington, D.C. The provisions of H.R. 4 regarding the eligibilityof legal immigrants for public assistance closely tracked the provi-sions of the welfare law approved in August 1996.
13State governments in states heavily impacted by immigration havesued the federal government for reimbursement of costs arising fromfederal immigration policy. See, e.g., Vernez and McCarthy, TheCosts of Immigration to Taxpayers, pp. 49–51.
14Refugees and asylees constitute 10–15 percent of annual immigra-tion levels. The U.S. refugee admissions ceiling for 1996 is 90,000. In1995, about 150,000 asylum petitions were filed; in January 1996,there were 468,896 pending asylum cases, according to the U.N. HighCommissioner for Refugees (information from the UNHCR WorldWide Web site, http://www.unhcr.ch/ world/amer/, October 7, 1996).Welfare use is higher among refugee communities than among otherimmigrant groups, at least in their earlier years of residence. Evi-dence from Wisconsin, for instance, shows that, in 1993, Asian fami-lies, mostly Hmong refugees, constituted 31 percent of the two-parentfamilies receiving benefits under AFDC-UP, compared to 4 percent in1983. See M. Cancian and D. Meyer, “A Profile of the AFDCCaseload in Wisconsin: Addendum,” report to the Wisconsin Councilon Children and Families, July 1996, figs. 1, 2.
15The “English-only” movement promotes the enactment of legisla-tion that restricts or prohibits the use of languages other than Englishby government agencies and, in some cases, by private businesses.For the first time in the nation’s history, an English LanguageAmendment to the Constitution has been proposed. Eighteen senatorsand about 200 members of the House were cosponsors of one bill tomake English the official language of the United States.
16E. Harwood, “American Public Opinion and U.S. ImmigrationPolicy,” in Immigration and American Public Policy, ed. R. J. Simon,Vol. 487 of the Annals of the American Academy of Political andSocial Science (Beverly Hills: Sage Publications, 1986).
17The intensity of these feelings outside the heavily impacted stateslike California should not be overstated. For example, when the U.S.Conference of Mayors surveyed officials in 78 cities to identify keyissues in immigrant policy for city officials, two out of three citiesreported that they had benefitted from the presence of immigrants,citing the development of immigrant-owned small businesses whichhad contributed to neighborhood revitalization and increased the taxbase, the increased availability of skilled and unskilled labor, andsocial and cultural contributions to the community (Immigrant PolicyIssues for America’s Cities: A 78-City Survey, U.S. Conference ofMayors, Washington, D.C., June 1994). In fact, numbers of immi-grants have now begun to decline as the provisions of the 1990 acttake hold (see Table 1).
18The INS estimates that between 1988 and 1992, just under 300,000illegal immigrants entered the country each year (INS World WideWeb Site, Immigration Fact Sheet, November 13, 1996). BeforeIRCA was passed, estimates of net undocumented immigration intothe United States increased from 23,000 annually in 1970 to 112,000annually by 1980; see G. Vernez, “The United States ImmigrationReform and Control Act of 1986: Implementation and Effects,” in

10
Migration Policies in Europe and the United States, ed. G. Luciani(Dordrecht, The Netherlands: Kluwer Academic Publishers, 1993;also available as RAND Reprint RP-265). On September 25, 1996,the House approved a bill aimed at reducing illegal immigration andreducing access of legal immigrants to welfare. In the Senate, theimmigration bill was included in a spending proposal needed to fundgovernment operations, which was passed on September 30, 1996,and signed into law immediately.
19T. J. Espenshade and K. Hempstead, “Contemporary American Atti-tudes toward U.S. Immigration,” International Migration Review,forthcoming.
20S. Plotkin and W. E. Scheuerman, Private Interest, Public Spend-ing: Balanced-Budget Conservatism and the Fiscal Crisis (Boston:South End Press, 1994), p. 6.
21Congressional Budget Office, Immigration and Welfare Reform,CBO Papers, February 1995.
22National Conference of State Legislatures, Immigrant PolicyProject, State and Local Coalition on Immigration, Immigrant PolicyNews 3, no. 2 (March 27, 1996), p. 4. H.R. 4 was vetoed by PresidentClinton in January 1996.
23Elizabeth Shogren, “Clinton’s Signature Launches Historic Over-haul of Welfare,” Los Angeles Times, August 23, 1996.
24S. H. Verhovek, “Immigrants’ Anxieties Spur a Surge in Naturaliza-tions,” New York Times, September 13, 1996. According to MigrationNews 3, no. 10 (October 1996), about 8 million immigrants in theUnited States are eligible to seek naturalization. The most frequentlycited instance of the rise in anti-immigrant sentiment is CaliforniaState Proposition 187, approved by state voters in 1994, which soughtto withhold education and health care benefits from illegal immi-grants. The proposition was immediately challenged in the courts,and many of its provisions were struck down in U.S. District Court inNovember 1995.
25It is settled constitutional doctrine that they may not discriminate inthose programs without an explicit federal authorization. In Grahamv. Richardson, 403 U.S. 365, 29 L.Ed. 2d 534, 91 S.Ct 1848 (1971),the U.S. Supreme Court invalidated two state laws barring immi-grants from both federal- and state-funded public benefit programs,holding that the federal government had an overriding interest inmatters affecting immigration and alien status, rejecting state argu-ments that the restrictions were needed to conserve state resources.The court, relying in part on equal protection analysis, held that stateclassifications on the basis of alienage (alien status) for the allocationof federal public benefits were unconstitutional.
26Judith Havemann and Barbara Vobejda, “Groups Prepare WelfareLaw Challenge,” Washington Post, September 30, 1996; MigrationNews 3, no. 10 (October 1996). Under the 14th Amendment to theConstitution, the “equal protection under the law” amendment, gov-ernments may not discriminate on the basis of, inter alia, nationalorigin.
27The Congress can, if it wishes, deny welfare and other federalbenefits to legal immigrants, citing its plenary authority over immi-gration.
28New York Times, November 27, 1994, p. E5.
29W. Cornelius, P. L. Martin, and J. F. Hollifield, “Introduction: TheAmbivalent Quest for Immigration Control,” in Controlling Immigra-tion: A Global Perspective, ed. W. Cornelius, P. L. Martin, and J. F.Hollifield (Stanford, CA: Stanford University Press, 1994), p. 10.
30European states that also have traditions of liberal immigrationpolicy but that are now facing, or fearing that they will face, unprec-edented numbers of immigrants have reacted with restrictive policies.For example, in an effort to discourage immigration, France in 1993removed automatic citizenship from children born on French soil toforeign parents.
Fellowships and PostdoctoralPositions Available
The Irving B. Harris Graduate School of PublicPolicy Studies, University of Chicago, is pleased toannounce the Harris Fellowships in Child Policy. Theprogram offers a one-year Master of Public Policydegree for students with at least a Master’s degree inearly childhood development or a related field. Tu-ition and stipend provided. Deadline for applicationsis January 15, 1997. For application and information,contact Nancy O’Connor, Dean of Students, Irving B.Harris Graduate School of Public Policy Studies, TheUniversity of Chicago, 1115 E. 60th Street, Chicago,IL 60637; phone 773 702-8401 (note new area code);Bitnet address: [email protected]
The School of Social Work at the University ofMichigan, with support from the National Institute ofMental Health, has established a Research and Devel-opment Center on Poverty, Risk, and Mental Health.The Center is seeking applicants for one-year or two-year postdoctoral Research Associate positions. As-sociates will attend seminars, have the opportunity tocollaborate with Center faculty, and conduct theirown research. Applicants should have a Ph.D. in So-cial Work or Social Welfare and research interests inthe relationship between poverty and mental health.Applicants should send a CV, a writing sample, and aletter describing their research interests and plans tothe Center at 540 E. Liberty, Ann Arbor, MI 48104-2210. Applicants should also have three letters ofreference sent directly to the Center. Deadline for the1997–1998 year is January 31, 1997.
The Northwestern University/University of Chi-cago Joint Center for Poverty Research announcesits Visiting Scholars program, for untenured or juniorresearchers who have completed doctoral degrees.Each campus will have one Visiting Scholar in resi-dence. Candidates are invited to express a preferencefor one of the two universities.
Applicants must be actively involved in research di-rectly relevant to poverty in the United States. Prefer-ence will be given to scholars who can spend an entireacademic year in residence and who will particularlybenefit from interaction with the affiliated faculty inone or both universities. Maximum salary is $40,000for the academic year, plus benefits and some researchsupport. There is no teaching requirement for thisposition. Applicants with partial funding from othersources are welcome. Ph.D. graduates of Northwest-ern University or the University of Chicago are ineli-gible to apply.
For application information, contact Kate Houston,Joint Center for Poverty Research, 2046 SheridanRd., Northwestern University, Evanston, IL 60208-4105; phone 847 491-4145; fax 847 467-2459; [email protected]

11
Legal immigrants and welfare: Some definitions
To clarify the discussions of immigrants and the welfaresystem in this issue of Focus, we first define relevantterms in common use and briefly describe the majorimmigration laws.1 We also provide a brief description ofthe rules governing the eligibility of legal immigrants forpublic assistance as they existed before passage of thePersonal Responsibility and Work Opportunity Recon-ciliation Act in August 1996. The provisions of the act,and its potential consequences, are analyzed in the twoarticles that follow, “Immigration Provisions in the NewWelfare Law” and “Potential Effects of the New WelfareLaw upon Immigrants.”
Terms used by the U.S. Immigration andNaturalization Service (INS)
An alien is any person not a citizen of the United States.
An immigrant is an alien admitted to the United States asa lawful permanent resident. Immigrants may be issuedvisas by the Department of State overseas or may be“adjusted” to legal permanent resident status by the INSin the United States. Immigrants become eligible forvisas under different circumstances and through differentlegal routes, the most important of which are describedbelow. The foreign-born who are in the United Statesillegally may be termed “illegal aliens,” “illegal immi-grants,” or “undocumented workers.”
Children born to noncitizens living, legally or illegally,in the United States are automatically citizens, with allrights of citizenship, including the right to public assis-tance. Foreign-born children of legal immigrants auto-matically become citizens when their parents do, if thechildren are under age 18.
Refugees or asylees are persons judged admissible “be-cause of persecution or a well-founded fear of persecu-tion in their countries of nationality, based on race, reli-gion, nationality, membership in a particular socialgroup, or political opinion.” The distinction betweenrefugees and asylees is based on where individuals are atthe time they apply. Refugees are those outside theircountry of nationality who apply for admission to theUnited States. Asylees are already in the United Stateswhen they request asylum. Refugees are exempt fromany numerical limitation, though worldwide ceilings areset annually by the president. Both refugees and asyleesare eligible to adjust to lawful permanent resident statusafter one year of continuous residence in the UnitedStates. The number of asylees who may adjust each yearis limited to 10,000.
A sponsor is a person who offers a guarantee of financialresponsibility for a new immigrant. The sponsor must be18 years of age or older, “of good moral character,” andeither a citizen or a legal permanent resident of theUnited States. Under the new law, the person who peti-tions for the entry of a relative must also be a sponsor.The sponsor need not, however, be a family member. Ifthe relative petitioning for entry does not meet incomerequirements, then another person who does may sign theaffidavit of support. For an immigrant under 18, thesponsor assumes legal custody; for all sponsored immi-grants, the sponsor guarantees such financial support asis necessary to maintain the family of which the alien is amember at a level equal to at least 125 percent of thecurrent official poverty line.2 Sponsors are not requiredfor all immigrants, only for those who might otherwisebecome public charges. About half of all legal immi-grants were sponsored under the previous rules.
In calculating eligibility for means-tested programs un-der the former law, the income of an immigrant’s sponsorwas “deemed” to be available to that immigrant for aperiod of three or five years and was therefore includedin the total. For immigrants with affidavits under the newlaws, the sponsor’s responsibility lasts until citizenship(see p. 15). Under the former law, the sponsor’s declara-tion of financial responsibility was not legally enforce-able; the immigrant had no right to sue for support prom-ised but not delivered. Now, either the immigrant or thefederal or state agency involved has the power to sue thesponsor.3
In addition to the major categories of immigrants de-scribed above, there are various special circumstancesunder which the foreign-born may be admitted as tempo-rary or permanent immigrants to the United States. Somerelevant categories for this discussion are given here.
Immediate relatives of U.S. citizens are those who, be-cause of their close relationship to U.S. citizens, areexempt from the numerical limitations imposed on immi-gration to the United States. Immediate relatives arespouses, children (under 21 years of age), parents ofcitizens 21 years of age or older, and orphans adopted bycitizens who are at least 21 years of age.
Legalization dependents. In each of fiscal years 1992–94, a maximum of 55,000 visas were issued to spousesand children of aliens legalized under the provisions ofthe Immigration Reform and Control Act of 1986 (seebelow).
Noncitizens permanently residing under color of law(PRUCOL) are persons awaiting a determination of asy-lum, or for other reasons granted permanent or condi-

12
tional residence, though not classified in the category of“legal permanent residents.”
Special Agricultural Workers (SAW) are foreign-bornworkers who performed labor in perishable agriculturalcommodities for a minimum of 90 days over the threeyears preceding May 1, 1986. Up to 350,000 were eli-gible for temporary resident status under a provision ofthe Immigration Reform and Control Act of 1986 (seebelow). Others who were eligible but applied after the350,000 limit was met also acquired temporary residentstatus, but had to wait longer for permanent status. Ad-justment to permanent resident status was essentially au-tomatic for both groups; the process was completed byDecember 1990.
Temporary Protected Status (TPS). Under a provision ofthe Immigration Act of 1990, the Attorney General maydesignate nationals of a foreign state as eligible for “tem-porary protected status” on the ground that conditions inthat country pose a danger to personal safety because ofongoing armed conflict or an environmental disaster.Grants of TPS are initially made for periods of 6–18months and may be extended, depending on the situation.The legislation designated El Salvador as the first coun-try to qualify for this program. Deportation proceedingsare suspended against aliens while they are in TPS.
Naturalization procedures. “Green card” holders whoare at least 18 years old and have been lawful permanentresidents of the United States for five years, or who havebeen married to and residing with a U.S. citizen for threeyears, may apply to become citizens.4 There are twoeducational requirements for citizenship: ability to readand write simple English and knowledge of basic factsabout U.S. history and government, demonstratedthrough an oral or a written examination. The require-ment to understand English may be waived for those whoare disabled, or who are 50 years of age or older and havebeen lawful permanent residents of the United States formore than 20 years (or who are over 55, and have beenresidents for more than 15 years). Applicants for natural-ization who meet these criteria must still be tested fortheir knowledge of U.S. history and government, but maytake the test in their native language.
The major immigration legislation
Current policy regarding immigrants is grounded essen-tially in the 1965 amendments to the Immigration andNationality Act, which abolished the long-standing sys-tem of numerical quotas for immigrants based on na-tional origin, race, or ancestry, and established the allo-cation of immigrant visas on a first-come, first-servedbasis. Preference was, however, given to two main cat-egories of immigrants: those who had close family mem-bers residing permanently in the United States (called“family reunification” entrants), and those who had oc-
cupational skills in particular demand (called “occupa-tional preference” entrants). Numerical limits were set:170,000 (20,000 per country) for immigrants from theEastern Hemisphere, and 120,000 for those from theWestern Hemisphere (the 20,000 per country limit wasextended to the Western Hemisphere in 1976). EffectiveOctober 1978, the separate hemisphere limits were abol-ished in favor of a worldwide limit of 290,000. This limitwas lowered to 280,000 for fiscal year 1980, and to270,000 for fiscal years 1981–91 (for current limits, seebelow). Immediate relatives of U.S. citizens were exemptfrom these limitations.
The Refugee Act of 1980 provided the first permanentand systematic procedure for the admission of refugeesand asylees and established a comprehensive program fortheir domestic resettlement. It expanded the definition of“refugee” beyond those fleeing from Communist coun-tries and entitled refugees to certain federally reimburs-able social and medical services. Like the 1965 law, itincreased the representation of non-European countriesin the immigration flow. Unlike other classes of immi-grants, refugees are not subject to the public charge re-quirements under immigration law or the income deem-ing requirements under benefit laws.
Two pieces of legislation since 1985 have markedly af-fected immigration to the United States. The most con-troversial has been the Immigration Reform and ControlAct (IRCA) of 1986, which permitted immigrants whohad been living in the country illegally since 1982 toapply for amnesty and permanent status, created a newclass of “special agricultural worker” described above,increased enforcement at U.S. borders, and created sanc-tions prohibiting employers from “knowingly hiring . . .aliens not authorized to work in the United States.” Un-der IRCA, 2.7 million immigrants legalized their status,and some family members have since joined them; the1990 Immigration Act authorized the admission of somespouses and children of the newly amnestied workers(“legalization dependents”).5 A significant portion of therecent large increases in the number of legal permanentresidents seeking naturalization is due to these immi-grants, who can be reunited with spouses and childrenoutside the numeric limitations when they become citi-zens.
The present level and nature of immigration to the UnitedStates are currently determined by the Immigration Act of1990, a major piece of “housekeeping” legislation. Theact increased total immigration ceilings by 40 percent,setting an overall flexible cap of 675,000 immigrants,beginning in fiscal year 1995. Of these immigrants,480,000 were to be family-sponsored, 140,000 employ-ment-based, and 55,000 were classified as “diversity im-migrants”—immigrants from countries identified as hav-ing been “adversely affected” by the categoriesestablished under the 1965 act. Not only did the actincrease the proportion of occupationally preferred im-

13
migrants, it reserved nearly all such visas for profession-als and skilled labor, leaving only some 10,000 availablefor unskilled labor.
Immigrants and the welfare system beforepassage of the welfare reform legislation
Illegal immigrants were ineligible for major entitlementbenefits, except for emergency medical care under Med-icaid. Because some other programs did not restrict eligi-bility on the basis of immigration status, illegal immi-grants were also eligible for some programs such asWomen, Infants, and Children (WIC) nutrition benefits.
Immigrants legalized under IRCA were barred from mostfederally funded public assistance programs for fiveyears after legalization. This ban has now lapsed for mostof these immigrants.6
Immigrants granted temporary protected status werebarred from most federal benefit programs.
Many legal permanent residents were effectively barredfrom receiving most cash assistance during their earlyresidence in the United States, because the income oftheir sponsors, as noted above, was “deemed” to be theirswhen determining eligibility for benefits. Programs inwhich eligibility was restricted by deeming were AFDC,Food Stamps, and SSI. Medicaid itself had no deemingperiod, though eligibility was in many cases tied to eligi-bility for AFDC and SSI. Immigrants who used publicassistance during their first five years in the countrytheoretically ran the risk of being deported as a “publiccharge” and were likely to experience greater difficultyin bringing relatives into the country, an effective deter-rent.
Refugees and asylees were eligible to participate broadlyin welfare programs from date of entry. The strong ethi-cal and practical case for doing so was that refugees werefleeing persecution, their departure was often unplanned,and they were more likely to arrive traumatized andwithout financial resources.
Most, though not all PRUCOL immigrants were eligiblefor some programs, such as AFDC and Medicaid, but notfor others, such as Food Stamps.
With passage of the welfare reform legislation in August1996, the long-established rules and understandings gov-erning public assistance for immigrants underwent al-most complete reversal. The specifics of the legalchanges, and the potential consequences, are discussed inthe articles that follow. n
1Note that the Immigration and Naturalization Service is within theDepartment of Justice and hence under the authority of the AttorneyGeneral of the United States. For the numbers admitted in eachimmigration category, see Table 1, p. 3.
2Immigration and Naturalization Act, Section 204.
3The availability of federal programs to different classes of immi-grants is described by M. Fix and W. Zimmerman, “Immigrant Fami-lies and Public Policy: A Deepening Divide” (Washington, D.C.:Urban Institute, 1995), pp. 8–17.
4The “green card” (it is now actually pink) is the verification cardissued to aliens lawfully residing in the United States.
5A useful summary of the consequences of IRCA is G. Vernez, “TheUnited States Immigration Reform and Control Act of 1986: Imple-mentation and Effects” in Migration Policies in Europe and theUnited States, ed. G. Luciani (Dordrecht, The Netherlands: Kluwer,1993), pp. 83–96; also available as RAND reprint RP-265.
6On some consequences for public assistance programs, see Congres-sional Budget Office, Immigration and Welfare Reform, CBO Papers,February 1995, p. 17.
FOCUS is a Newsletter put out three times a year by the
Institute for Research on Poverty1180 Observatory Drive3412 Social Science BuildingUniversity of WisconsinMadison, Wisconsin 53706(608) 262-6358Fax (608) 265-3119
The Institute is a nonprofit, nonpartisan, university-based research center. As such it takes no stand on publicpolicy issues. Any opinions expressed in its publicationsare those of the authors and not of the Institute.
The purpose of Focus is to provide coverage of poverty-related research, events, and issues, and to acquaint alarge audience with the work of the Institute by means ofshort essays on selected pieces of research. A subscrip-tion form with rates for our Discussion Papers and Re-prints is on the back inside cover. Nonsubscribers maypurchase individual papers from the Institute at $3.50 fora Discussion Paper and $2.00 for a Reprint.
Focus is free of charge, although contributions to theU.W. Foundation–IRP Fund sent to the above address insupport of Focus are encouraged.
Edited by Jan Blakeslee.
Copyright © 1996 by the Regents of the University ofWisconsin System on behalf of the Institute for Researchon Poverty. All rights reserved.

14
Immigration provisions in the new welfare lawWendell Primus
Wendell Primus recently resigned as Deputy AssistantSecretary for Human Services Policy in the U.S. Depart-ment of Health and Human Services. He now serves as aconsultant to the Center on Budget and Policy Priorities,the Brookings Institution, the Urban Institute, and othersin Washington, D.C.
Since the passage of the Social Security Act in 1935,legal immigrants have been able to receive benefits fromfederal insurance and public assistance programs. Ifthese immigrants became unemployed or needy, theywere able to receive means-tested benefits on the samebasis as citizens. With the passage of the new welfare billin August 1996, the rules changed dramatically. Ratherthan merely curtailing the number of elderly immigrantsor requiring more income support from sponsors for im-migrants entering the country, the new legislation takesaway retrospectively a system of support that many law-fully and permanently resident immigrant families cur-rently rely upon. According to the Congressional BudgetOffice, cuts in benefits paid to legal immigrants consti-tute almost one-half, or $23.8 million, of the savings inthe new welfare bill.
Subject to immigration quotas and policies, we tradi-tionnally allowed those in search of better opportunitiesto enter the United States, regardless of need. As a resultof this policy and of the 1965 changes in the ImmigrationAct that emphasized family unification, the number ofparents of U.S. citizens admitted annually doubled be-tween 1980 and 1990. And from 1986 to 1996, the num-ber of noncitizens receiving Supplemental Security In-come (SSI) benefits rose from slightly over 244,000 in1986 to almost 800,000 in 1996—an increase of about230 percent.1 By 1995, slightly more than half the SSIbenefits provided to the elderly were collected by non-citizens. These numbers and the desire for large budget-ary savings drove the debate surrounding immigrant eli-gibility for welfare benefits. The debate did not accountfor the fact that AFDC and food stamp data show thatimmigrants who are not refugees have welfare utilizationrates equal to or lower than those of the native-born.
President Clinton stated when signing the welfare billthat he was “deeply disappointed that this legislationwould deny Federal assistance to legal immigrants andtheir children” and vowed “to work with Congress tocorrect the provisions in this legislation that go too far.”This article addresses the impact of these decisions, andconcludes with a discussion of why the reforms were sopunitive and phased in so rapidly.2
Provisions
The eligibility rules for cash assistance, Medicaid, andfood stamps have been changed by the new welfare law.3
The rules are different for legal immigrants who were inthe country prior to enactment of the law on August 22,1996, and legal immigrants who enter on or after thatdate. With certain exceptions, specified below, those en-tering the country after the date the bill was signed willbe denied aid until they become citizens. Most immi-grants who are already in the country at this time will becut from the SSI and food stamp rolls within one year.Responsibility for assistance to needy immigrants hasbeen shifted from the federal government to sponsorsand/or state and local governments. Unlike prior law,states will have considerable discretion about which ser-vices to provide to immigrants and whether to use statefunds to offset federal program reductions for immi-grants.
For the purposes of the act, immigrants fall into two maincategories: “qualified aliens” and “not-qualified aliens.”“Qualified” aliens are legal permanent residents; refu-gees, asylees, and persons granted withholding of depor-tation; persons paroled by the INS into the country for atleast one year; and certain battered women and children.All others are “not qualified,” even if in the United Stateslegally. They are ineligible for federal government con-tracts, loans, grants, and commercial or professional li-censes. They are also ineligible for benefits for retire-ment, welfare, health, disability, public or assistedhousing, postsecondary education, food assistance, orunemployment when the assistance is provided by a fed-eral agency or where federal funds were appropriated topay the assistance. The great bulk of immigrants in thecategory of “not-qualified aliens” are illegal immigrantswho, as has frequently been noted, were already barredfrom the majority of public assistance programs. Alsoincluded in this category are people in the United Stateswith temporary student or work visas.
Temporary Assistance for Needy Families (TANF)
The welfare bill authorizes states “to determine the eligi-bility” of qualified immigrants for the TANF and SocialServices (Title XX) block grants. Immigrants who werereceiving assistance on August 22, 1996, retain coverageuntil January 1, 1997. Most immigrants who enter afterAugust 22, 1996, will be barred from these benefits forfive years. States can provide or deny TANF or SocialServices to current “qualified” immigrants who are notexempt and to future immigrants after the five-year bar.Block grants are based on past funding, and since previ-ous years included funding for immigrants, the federalgrants should be sufficient to continue covering thispopulation. States can also provide state-funded services

15
to immigrants who are ineligible for services under thefederal block grant.
SSI and food stamp bars
Among the most severe provisions are those that willaffect immigrants receiving SSI and food stamps. Thelegislation makes all legal immigrants entering theUnited States on or after August 22, 1996, ineligible forthese programs until they become U.S. citizens, withthree exceptions. The exceptions are: refugees andasylees during their first five years in the country, thosewho have served in the Armed Forces and their depen-dents, and those with substantial work histories—whocan demonstrate 40 quarters of covered employment.Legal immigrants receiving food stamps or SSI on Au-gust 22, 1996, remain eligible until April 1, 1997 (foodstamps) and mid-1997 (SSI) if they meet other programrequirements. They will lose eligibility by August 22,1997, unless they fall into one of the excepted categories.Legal immigrants not receiving benefits on August 22,1996, may not be added to the rolls unless they also meetone of the exceptions.
Medicaid
States have the option of continuing to provide Medicaidfor most categories of legal immigrants already in theUnited States prior to August 22, 1996. Those receivingbenefits prior to this date, however, cannot be terminatedbefore January 1, 1997. Save for the excepted groups,immigrants who enter the country after the date the billwas signed will be ineligible for Medicaid for five years.States have the option to extend this Medicaid ban for alonger period. Most of these individuals are likely tohave no other health insurance and will not be able toafford expensive private insurance policies.
Other programs
Most immigrants who enter the country after August 22,1996, are barred from “federal means-tested public ben-efits” for their first five years in the United States. Al-though the law does not define this term, legislativehistory suggests it should be limited to entitlement pro-grams. Regulations will determine if this will apply tohousing programs. Some programs are explicitly exemptfrom the five-year bar: emergency Medicaid, SchoolLunch Act programs, WIC, Foster Care, Head Start, JobTraining Partnership Act, higher education loans andgrants, and immunization.
Deeming provisions
Compounding the effect of these unprecedented legalrestrictions on eligibility are strict new deeming provi-sions.4 Immigrants entering the country after August 22,1996, will be barred from the programs mentioned abovefor at least five years. After this period, many of theseimmigrants will still be disqualified from federal benefitsunder the new federal deeming rules, whereby all of the
income and resources of an immigrant’s sponsor arecounted in the immigrant’s establishment of eligibilityfor benefits. This rule could disqualify an immigrantfrom benefits even if she and her sponsor’s family wereliving at the poverty level. The new immigration law thatwas passed after the welfare bill added a minimum in-come requirement for sponsors, as well as limited ex-emptions from these rules.5 In order for an immigrant toenter, the sponsor must accept responsibility for all ex-penses, including the high cost of medical care. With thisrestriction, it will be much more difficult to enter thecountry.
Nearly all immigrants who enter the United States be-cause of family ties will have to fill out a newly designed,legally enforceable affidavit of support, starting some-time between January and March of 1997. Only immi-grants who enter using these new affidavits of supportare subject to the new deeming rules.
Reporting and verification provisions
The act requires agencies that administer SSI, TANF, orhousing assistance to report quarterly to the INS thenames of individuals who they know are unlawfully inthe United States. No state or local government agency,or any government employee, may be prohibited or re-stricted from communicating such information to theINS.6 Under previous law, health and welfare workerswere in general prohibited from reporting illegal immi-grants to law enforcement agencies.
Within 18 months of enactment, the Attorney General,with the Secretary of Health and Human Services, mustissue regulations requiring the verification that any im-migrant applying for federal public benefits is an eli-gible, qualified alien. States administering federal ben-efits must comply within two years of the adoption ofsuch regulations.
Estimated impact of the new welfare law
Nearly half a million elderly and disabled beneficiarieswho are legal immigrants will be terminated from the SSIprogram and almost a million immigrants will lose foodstamps in the months ahead (see Table 1). States mustdecide whether to fill this gap created by the withdrawalof income assistance under SSI. In many states, theseimmigrants are eligible for general assistance. On aver-age, however, these grants are considerably lower thanSSI grants and are even temporary in some states. Thiswill cause a great burden on many states and localities,particularly those with high immigrant populations. Un-doubtedly, some will feel the pressure to further restrictor eliminate safety net programs, although the fiscal andpublic health consequences of denying subsistence in-come, nutrition, and health care to these immigrants mayoutweigh any short-term savings. These pressures will be

16
particularly acute when economic growth slows, or thereis a recession.
States have a strong incentive to maximize the number ofimmigrants who can participate in the federal Medicaidprogram. The federal government reimburses states forbetween 50 and 70 percent of their Medicaid costs. IfMedicaid coverage is lost, the states, counties, or otherproviders will need to pay for 100 percent of these costs.The Congressional Budget Office predicts that if allstates banned Medicaid to current immigrants, over $11billion in federal Medicaid funds would be lost to thestates in just six years. The states could save another $2billion if they banned all current and legal immigrantsfrom TANF services.
The poverty studies conducted by the Clinton adminis-tration and by the Urban Institute vividly illustrate theimpact of these immigrant provisions. The Urban Insti-tute study estimates that 2.6 million persons will bepushed into poverty by the welfare bill, and that of these,the immigrant welfare provisions will be responsible for1.2 million. Legal immigrants, therefore, make up almosthalf of all persons whose incomes may now fall belowthe poverty line due to the new legislation. Additionally,of the 1.1 million children who may become poor as aresult of the bill, 450,000 will be pushed into poverty bythe immigrant provisions in the act. The Urban Institutestates in its report that more persons will be pushed intopoverty by the immigrant cuts than by any other singleprovision of the welfare bill.7
The impact will not be felt equally across states. In Cali-fornia, for example, 320,000 immigrants are receivingSSI. California contains 41 percent of the immigrantswho will lose benefits. Another state that will be hard hitis New York, which is home to 15 percent of the immi-grants receiving SSI. New York and California will needsubstantially more resources than other states such asAlabama, Maine, and Nebraska, which all contain lessthan 1 percent of the SSI immigrant caseload.
One way to mitigate the damage caused to noncitizens isto encourage them to naturalize. Of the immigrants re-ceiving SSI, 80–90 percent have been in the UnitedStates for at least five years and are probably qualified to
become U.S. citizens. Already in 1996, a record num-ber—almost 1.1 million—have become citizens. Butmany older immigrants continue to face significant barri-ers to naturalization, such as language requirements. Ifstates choose to assist legal immigrants to negotiate thefederal naturalization process, the need for state assis-tance will be less, and federal dollars will continue toflow to the states.
Analysis of the new welfare law
What led to these provisions? Elected officials were un-able to defend immigrant use of welfare, particularly SSI,against the calls for curtailment of government expendi-tures on public assistance in general and on immigrantsin particular. Immigrants’ continued eligibility was con-sidered politically unsustainable in the face of statisticsclaiming that over 30 percent of the aged beneficiaries ofSSI were noncitizens, that over 50 percent of the dollarsfor elderly SSI recipients were going to aliens, and thatmany immigrants were applying for benefits immedi-ately after the three-year deeming provision ended (seeTable 2). The desire for large budgetary savings alsodrove the policy debate. Table 3 demonstrates that in theAFDC, Food Stamp and Medicaid programs, noncitizenshad higher participation rates—but that naturalized citi-zens had lower participation rates—than the native-born.This table includes refugees as noncitizens. If refugeesare subtracted, there is little, if any, significant differencein utilization rates between immigrants and the native-born in the AFDC and Food Stamp programs. In the SSIprogram, however, both noncitizens and naturalized citi-zens had higher participation rates than native-born citi-zens.
The case for the reform is stated succinctly in the 1996Green Book: “Public Law 104-193 [the welfare reform
Table 1Number of Immigrants Losing Benefits and Federal Savings
Number ofFederal Benefit Immigrants Federal SavingsPrograms Losing Benefits (over six years)
SSI 500,000 $13.3 billionFood Stamps 900,000 to 1,000,000 $3.7 billionNon-Emergency Medicaid 635,000 (in FY 2002) $5.3 billion
Source: Congressional Budget Office, “Federal Budgetary Implica-tions of H.R. 3734, The Personal Responsibility and Work Opportu-nity Reconciliation Act of 1996,” August 9, 1996.
Table 2Aliens Receiving SSI Payments, by Length of Time between
Entering the United States and Application for Benefits
Months between Residency Legal Aliens Receiving SSIand Application for SSI No. %
Total 634,8100–11 96,610 15.212–23 32,720 5.224–35 30,910 4.936–47 131,550 20.748–59 44,910 7.160–71 34,600 5.572–83 27,270 4.384 and over 225,840 35.6
Source: Social Security Administration, SSI 10 percent sample, De-cember 1993.
Note: December 1993 data on applications made after 1980. The totalincludes 10,400 with unknown residence. Percentages have beenrounded.

17
bill] returns American policy on welfare for noncitizensto its roots by barring most noncitizens who arrive in thefuture from receiving welfare benefits. Current residentnoncitizens face changes only in those programs subjectto abuse or with a significant State financial commit-ment.” But this new law is historic in that, for the firsttime since these benefit programs began, lawmakers havedecided to exclude people from assistance solely becauseof their status as legal immigrants, even if their need forbenefits and services is exactly the same as a citizen’s.This is a significant departure from the interpretation of“public charge” (see p.13) that has prevailed in ourcountry’s modern history. Nothing in immigration lawhas ever explicitly prevented legal immigrants from be-ing eligible for public benefits. The concept of “publiccharge” has been used primarily to exclude immigrantsfrom entry into the United States—and indeed, the latestestimates by the Department of State show that approxi-mately 25,000 immigrants each year are denied requestsfor entry because they cannot establish that they are notlikely to become “public charges.” However, once animmigrant has been granted legal residence, it has beenthis country’s long-standing policy to recognize that mis-fortune can occur equally to citizens and legal immi-grants, and that an individual’s eligibility for benefitsshould not be based solely on citizenship or immigrantstatus. Further, making a determination of “publiccharge” for the purpose of deporting an immigrant hasgenerally been limited to determining whether the immi-grant had fraudulently obtained benefits.
The changes in sponsors’ responsibilities and legislativeprovision for enforcement of these responsibilities weresteps in the right direction. Arguably, a central tenet ofsocial policy was violated when the rules were appliedretrospectively. Retirement benefits are not changed forthose about to retire, nor are tax provisions relating toinvestment altered after the investments have been made.In the case of the immigrant provisions of the welfarebill, this approach was rejected because the budgetary
savings in the bill are derived substantially from cuttingcurrent recipients off the rolls. Immigrants are a largecomponent of current recipients in some programs, andapplying the rules only to new legal immigrants enteringthe country would have yielded very small savings.
Critics of the welfare restrictions argue that completebans on eligibility do not recognize the reality that theneeds of the immigrants may change unexpectedly andbe beyond the sponsor’s ability to meet, and that spon-sors themselves may lose income due to disability, unem-ployment, or other circumstances beyond their control.As it turned out, neither the political parties nor theadministration were prepared to expend political capitalon this issue.
This was an extremely difficult issue to analyze. Thereare many different classifications of immigrants, eachclassification with different implications for treatmentunder each of the safety net programs. Within the broadgeneral class of immigrants there are work-sponsoredversus relative-sponsored immigrants, refugees andasylees (see pp. 11–12). It was not easily established howmany legal immigrants were actually on welfare rolls.Preparing cost estimates for a variety of deeming op-tions, some prospective only and some with applicationto current beneficiaries, was difficult at best.
How should the concept of the public charge be en-forced? The most difficult aspect was the provision ofmedical care. Most of us would be unable to promise thatour 75-year-old parents, for example, would not becomepublic charges, given the expensive nature of health andlong-term care institutions in this country. Individualmedical insurance for the elderly is expensive and hard toget. The complete bars on SSI and food stamp receiptrender deeming somewhat irrelevant: the provision thatrequires all, rather than merely part, of the income of thesponsor to be deemed available to the legal immigrantmay mean that even immigrants whose sponsors havebecome poor in the interim will be ineligible for assis-tance. But we do not yet know how the laws will affectnaturalizations, and there is no bar on eligibility for natu-ralized citizens.
The increased flexibility given to states to discriminateagainst legal immigrants by restructuring access to pro-grams is especially problematic. Medical care, in particu-lar, is extremely expensive. If immigrants or state legis-lators perceive that more generous Medicaid and welfareeligibility provisions will create a welfare magnet forimmigrants, states will be tempted to introduce morestringent requirements.
Conclusions
The immigrant provisions are among the most onerous inthe welfare bill. There was little need for reform of laws
Table 3Percentage of Citizens by Birth, Naturalized Citizens, andNoncitizens Receiving Various Welfare Benefits in 1994
Citizen NaturalizedWelfare Program by Birth Citizen Noncitizen
SSI 2 3 3Under age 65 2 2 2Age 65 and older 4 7 23
AFDC 5 2 6State Assistance 1 (too small) 2Food Stamps 12 7 16Medicaid 8 3 11
Source: U.S. House of Representatives, Ways and Means Committee,Overview of Entitlement Programs: 1996 Green Book (Washington,D.C.: U.S. Government Printing Office, 1996), p. 1308; M. J.O’Grady, Native and Naturalized Citizens and Non-Citizens: AnAnalysis of Poverty Status, Welfare Benefits, and Other Factors(Washington, D.C.: Congressional Research Service, 1995).

18
and regulations governing immigrants’ eligibility forwelfare, except for the SSI program. In other programs,welfare receipt by immigrants was not disproportionatelyout of balance with welfare receipt by citizens. The pub-lic backlash against SSI might have been avoided hadimmigrant policies earlier been coordinated with welfarepolicies.
The poverty statistics which clearly showed the likelyimpact of the immigrant provisions in the welfare billwere never utilized to push a more moderate set of pro-posals. Given the tenor of the debate, the large sums ofmoney that would be needed to fix the immigrant provi-sions, and the unwillingness to sacrifice political capital,there is little evidence to suggest that these provisionswill soon be ameliorated. This will be particularly true inearly 1997, when the first order of business is likely to bebalancing the federal budget. n
1E. Ponce and C. Scott, Aliens Who Receive SSI Payments (Washing-ton, DC: Social Security Administration, 1995).
2I would like to thank my research assistant, Margery Ditto, for herwork on this article and David Nielsen for his comments.
3The section borrows heavily from The New Welfare Law, printed bythe Center on Budget and Policy Priorities, and Immigrants and the‘96 Welfare Law: A Resource Manual, printed by the National Immi-gration Law Center. Another useful source is an unpublished descrip-tion of Conference Agreement 3437, The Personal Responsibility andWork Opportunity Act of 1996, prepared by Susan Golonka of theNational Governors’ Association and Sheri Steisel of the NationalConference of State Legislatures, August 9, 1996 (pp. 16–18). Thespecific provisions of the prior laws regarding immigrants’ eligibilityfor welfare are described in “Legal immigrants and welfare: somedefinitions” (this issue, pp. 11–13).
4In 1980, Congress had begun the concept of deeming in the SSIprogram. A certain portion of income after allowances for thesponsor’s family was deemed to the individual applying for assis-tance. This curtailed eligibility significantly, but only for three years.This was later lengthened to five years and broadened to include otherprograms. Deeming was extended to AFDC in 1981.
5The Omnibus Consolidated Appropriations Act, 1997 (H.R. 4278),reinforced the restrictions on the access of legal immigrants to wel-fare benefits contained in the welfare law. Furthermore, rules forsponsorship were tightened. Previously, the poverty level was used asa guideline for accepting sponsors’ promises of support. Under thenew immigration law, U.S. citizens who wish to bring spouses andminor children into the United States, for example, must have in-comes that equal 125 percent of the poverty line.
6Mayor Rudolph Giuliani of New York City has filed a lawsuitagainst this provision and, in conjunction with other big-city mayors,is contemplating broader action against the immigrant clauses of thewelfare bill (New York Times, Oct. 1, 1996; see also Washington Post,Sept. 30, 1996, for a report of other pending lawsuits).
7S. Zedlewski, S. Clark, E. Meier, and K. Watson, “Potential Effectsof Congressional Welfare Reform Legislation on Family Incomes,”Urban Institute, July 26, 1996.

19
Surveying immigrant communitiesGeorges Vernez, Kevin F. McCarthy, and Julie DaVanzo
Georges Vernez is Director of the Center for Research onImmigration Policy, Kevin F. McCarthy is a Senior So-cial Scientist, and Julie DaVanzo is Director of the Cen-ter for the Study of the Family in Economic Develop-ment, RAND, Santa Monica, California.
Facing difficult questions in a highly charged publicatmosphere, policy makers and researchers alike arehandicapped by the lack of reliable information aboutimmigrant families: their socioeconomic characteristics,their use of public services, the costs of providing thoseservices, the revenue sources to which immigrants con-tribute, and the amounts of those contributions.1
In the absence of hard information on these critical pa-rameters, researchers have made differing assumptionsthat not only affect the magnitude of their estimates, butalso the direction of the net cost estimates. Most studies,for example, have assumed that immigrants’ use of ser-vices is proportional to their numbers, regardless of theirsocioeconomic and immigrant status. But the RAND pi-lot study of Los Angles County reported here suggeststhat use of public services is generally not affected byimmigration status (including illegal status), but is af-fected by family income and family size, particularly thepresence of children under age 5. Tax payments andpayroll deductions, however, do vary significantly withimmigration status: illegal immigrants have the lowestincidence of payroll tax deducted and of federal and stateincome tax filing.
Definitional difficulties
Analysts have not yet agreed on a uniform accountingframework for determining (a) which public services andwhich revenues, hence costs, ought to be included in thecosts of immigration; (b) how to define and categorizeimmigrants; and (c) how to select an appropriate ac-counting unit and measure costs, and over which periodof time.
What services should be included?
Most studies agree that all services provided directly toindividuals (e.g., education, nutrition, and social ser-vices) should be included. But what about major catego-ries of federal expenditures such as general governmentand administrative expenditures or social insurance pro-grams? As just one example: The implicit argument forexcluding social insurance programs such as Social Se-
curity—that these programs are self-funded—ignores theredistributive function that provides benefits to low-in-come individuals that are higher than the amount of theircontributions. Even when the decision is made to includesocial insurance expenditures, should they be allocatedon a current, intergenerational, or even lifetime basis?Because most recent immigrants are young and will notbe eligible to receive social insurance benefits for severalyears, the cost allocation approach that is used can resultin as much as a tenfold difference in the estimate ofcosts.2
Who is an “immigrant”?
Researchers have agreed that foreign-born noncitizensshould be classified as immigrants. But they have dis-agreed about how to treat naturalized immigrants and thenative-born children of legal or illegal immigrants. ByU.S. law, both groups are citizens, and so from a legalperspective they are not immigrants. From a pragmaticperspective, however, it is arguable that they should becounted with immigrants rather than with the native-born: their presence here is a consequence of federalimmigration policy.
The categories used to group immigrants have importantcost estimating and policy implications. Some studiesfocus on immigrants in the aggregate. Others group im-migrants into three categories: currently illegal, thosewho have received amnesty under the 1986 act, and otherimmigrants. But these broad groupings fail to capture thediversity of immigrants or provide an adequate basis forpolicy. More appropriate criteria would distinguish im-migrants based on the categories used by the Immigra-tion and Naturalization Service: refugee status, familyreunification, or employment, for example. These andother more specific characteristics, such as educationlevels, skills, and work experience, would provide a bet-ter understanding of which immigrants are more likely tobe high consumers of public services, what kinds ofservices, and their economic impact on the labor market.
What is the appropriate accounting unit?
Should studies of the immigrant population use thehousehold, the family, or the individual as the accountingunit? Depending on this choice, conclusions may differmaterially.3 Moreover, many immigrant families containa mixture of native and foreign-born individuals, andalso individuals of different immigration status—illegal,amnestied, legally resident. Is an “immigrant family” onein which only the household head is foreign-born, or thespouse of the head, or any family member?
Focusing on the net fiscal costs of immigration in a givenyear is appropriate for those concerned with balancingbudgets from one year to the next. But immigrants’ use
20
of services and contributions to revenues are likely tovary over time as immigrants assimilate. Many servicesprovided immigrants, especially education and healthservices, can appropriately be regarded as investmentsmade in this generation, in the expectation of a return inthe next generation.
Without better data, there are many questions for whichwe can only surmise or estimate answers. Among thosemost relevant to the low-income population are:
Do immigrants help meet critical labor shortages? Dothey create more jobs or displace native workers fromexisting jobs?
Do immigrants use public support to get on their feetinitially or do they become dependent upon it?
What fiscal burden does immigration create and how is itshared among levels of government, the immigrantsthemselves, and others?
How do immigrants move into better paying, more stablejobs? How do they invest in education and other skills?
How do the number and composition of immigrants andchanges in economic conditions affect the answers to thequestions outlined above?
Limitations of existing data
Four major substantive and methodological limitationshave plagued studies of immigrants to the United States.First, studies using data sets of national scope (e.g., de-cennial Census, Current Population Survey, Survey ofIncome and Program Participation) generally have notfocused on immigrant policy issues and provide limitedinformation about the characteristics, needs, and behav-ior of immigrants because they do not adequately iden-tify the population. Often, the numbers of immigrantsincluded are too small for useful analyses.
Second, surveys typically have not distinguished legalfrom undocumented immigrants, nor have they collecteddata on immigrant status among legal permanent resi-dents—whether, for instance, they are refugees.4 Restric-tions on the use of some public services by immigrantsmay affect expectations, needs, and use of health, educa-tion, welfare, legal, and social services.
Third, studies have typically not collected longitudinal orretrospective data that permit examinations of changesover time, especially from one generation to the next.Data are needed on cohort effects (differences betweenwaves of immigrants entering the United States at differ-ent periods); individual changes (changes over time ex-perienced by each immigrant); and generational changes(differences between immigrants and their offspring).For example, longitudinal data or repeated cross-sectionsare necessary if we are to resolve the much debated
question of whether recent immigrants are faring morepoorly than previous cohorts because of the increasingdifferences in human capital between immigrants andnative-born, because of changes in the labor market, orperhaps just because they are at a different stage of theimmigrant experience.
Fourth, most national data sets that have been majorsources of information about immigrants (e.g., the de-cennial Census) have not used appropriate translations ofsurvey instruments; their surveys may yield data of un-certain quality from immigrant groups with limited En-glish and may not provide comparable informationacross different immigrant groups.
The Los Angeles Community Survey
To see whether such problems could be overcome, theRAND Center for Research on Immigration Policy un-dertook in 1991 to conduct a pilot study: the Los AngelesCommunity Survey (LACS) of Salvadorans and Filipi-nos. On a smaller scale, the pilot survey faced many ofthe same challenges that a national survey would con-front: deciding which immigrant populations to survey,recruiting and training bilingual staff, identifying neigh-borhoods where populations of interest are concentrated,developing and testing culturally appropriate survey in-struments that can answer questions of concern, includ-ing such potentially sensitive questions as immigrationstatus, and dealing with issues that arise when attemptingto conduct the same survey in several different immi-grant communities.
Salvadorans and Filipinos were chosen because they rep-resent the two continents from which most immigrantsnow come to the United States, because these popula-tions are expected to grow, because they include recentarrivals as well as long-time residents, and because theyhave not been extensively studied.
The survey focused on ascertaining and documenting thefollowing: immigration status (i.e., undocumented, tem-porary protected status, IRCA legalized, legal permanentresident),5 employment experiences, public and socialservice needs and use, tax contributions, family composi-tion, language ability and use, and educational expecta-tions and achievements.
Eligible households for the pilot study were identifiedusing a short screening questionnaire in five Los AngelesCounty neighborhoods that had high concentrations ofSalvadorans and Filipinos, according to data from the1980 Census (1990 Census data were not then available).About 6,300 households were screened between May andJune 1991 to identify eligible respondents, defined asadults aged 18 to 64 who were born in El Salvador or thePhilippines; 1,161 eligible respondents were identified.In August and September 1991, 35 bilingual interviewers

21
completed interviews, each lasting approximately anhour, with 655 respondents, 382 Salvadorans and 273Filipinos. The pilot survey successfully enlisted the co-operation of its selected respondents (refusal rates were 5percent for the Salvadoran and 8 percent for the Filipinosample, rates comparable to those for personal interviewsin urban settings). Because of the extensive training ofinterviewers, testing and retesting of the survey instru-ments, and error checking after the interviews, research-ers are confident that the survey was successful in elicit-ing reliable data, including responses to sensitivequestions, on the main issues investigated. The pilot alsorevealed several critical research issues that are peculiarto surveys of immigrant populations:
1. Choosing immigrant communities to study and identi-fying an appropriate sample. The difficulties experi-enced by the 1990 U.S. Census and the lawsuits to whichthese gave rise underscore the complexity of these deci-
sions, particularly where poor, densely crowded, inner-city neighborhoods are concerned. In the pilot project,interviewers found that the “hidden” apartments missedby the original lister often contained undocumented im-migrants.
2. Developing and testing questionnaires suitable foradministration with different immigrant groups. This istime-consuming; in the pilot project, it required closecollaboration between the design team, highly skilledtranslators, and outside consultants, and extensive pre-testing in the language in which it was to be adminis-tered.
3. Recruiting and retaining a high-quality bilingual fieldstaff. Researchers offered the interviewers extensivetraining on the purpose of the study and aggressivelysolicited feedback from them; they stressed the impor-tance of the project to the community and gave strongassurances of confidentiality.
4. Obtaining high survey participation and retentionrates. Many immigrants, particularly in low-incomecommunities, are highly mobile. Many inner-city fami-lies live in large apartment buildings where access forinterviewers may be difficult or denied. Many have notelephone. Surmounting such obstacles requires a highlevel of effort.
5. Designing effective field management procedures forbilingual staffs for whom English may not be the firstlanguage, and who are typically inexperienced inter-viewers.
Findings from the Los Angeles Community Survey
Significant differences immediately emerged betweenthe two groups of immigrants surveyed by the pilot pro-gram—most notably in their level of education and mas-tery of English, but also in their immigration status atentry, labor market characteristics, and family income(see Table 1). These differences are reflected in the na-ture and extent of public services, including transfer pro-grams and health services, that immigrants reported us-ing (see Table 2). The relatively high income of Filipinoimmigrants rendered them ineligible for income-testedprograms such as AFDC, general relief, and food stamps.In contrast, at least one in ten Salvadoran immigrantfamilies had received AFDC at least once in the pastyear, one in five received food stamps, and one in threebenefited from the Women, Infants, and Children (WIC)program, a special supplemental food program that pro-vides food, vitamins, counseling, and health care refer-rals to pregnant women and to children under the age offive. Salvadoran immigrants were three times as likely asFilipinos to rely on public hospitals and on county andfree clinics, three times less likely to be enrolled in ahealth maintenance organization or to have consulted adentist (private or public). Undocumented immigrantsnot eligible for AFDC or food stamps benefited indi-rectly from these programs, either through their eligible
Table 1The Los Angeles County Survey:
Characteristics of Salvadoran and Filipino Immigrants
Characteristics Salvadorans Filipinos
EducationSix years or less (%) 44 14Some college (%) 3 70Median years of schooling 7 15
LanguageUnderstand English well (%) 42 97Read English well (%) 33 95
Age18–29 years (%) 47 1950–64 years (%) 6 28
Female (%) 55 54Marital Statusa
Married (%) 62 75Spouse absent (%) 3 15Never married (%) 28 19
Ten Years or More in U.S. (%) 26 56Immigration Status at Entry
Undocumented (%) 89 5Permanent resident (%) 4 72Otherb (%) 7 22
Reasons for EntryFamily reunification (%) 12 45Enhanced opportunities (%) 57 51Safety reasons (%) 26 1Other (%) 5 3
Labor Market CharacteristicsMedian family income ($/year) 11, 484 47,323Employed (men/women) (%) 80/69 85/78Occupation (men/women) (%)
Managerial, professional, tech. 6/6 45/63support, admin. support
Precision product, craft, 73/24 33/14assemblers, laborers
Private household service 0/42 0/1
aRespondents were more likely to be married than the general Salva-doran and Filipino immigrant population in Los Angeles County (62vs. 48 percent and 75 vs. 62 percent, respectively).
bVarious types of temporary visas, including student and tourist visas.

22
citizen children or through eligible relatives. This factreinforces the accumulating evidence that immigrantfamilies contain members with different immigration sta-tuses, ranging from undocumented to temporary or per-manent residents, and naturalized citizens.6
Often ignored is the dynamic nature of immigrant status:by the time of the survey, for instance, nearly all of thosewho had entered on a visitor’s or temporary visa hadbecome permanent residents, qualifying either throughthe family reunification or employment-based catego-ries. Although the distinction between undocumentedand legal permanent immigration is an important legalconstruct, the two are not independent flows, and today’sundocumented immigrant may well be tomorrow’s per-manent resident; their U.S.-born children, at least underpresent law, will be citizens. Thus denying access toeducation and preventive health care, for instance, mayhave questionable social validity.
Despite the survey’s many enlightening insights, it hasclear limitations in answering policy questions. From thedata provided by one interview, no matter how thorough,the reasons for the different economic status and differ-ent impacts of these two groups cannot be asserted withany certainty. Are the Filipino immigrants more prosper-ous because they are better educated, or because theyhave been in the country longer? Where did they acquiretheir education? Many Salvadorans came in flight from
civil war, but the U.S. government was long reluctant torecognize this fact, for political reasons; does the demo-graphic profile of the Salvadorans, then, more closely fitthat of refugees rather than immigrants? Have the Salva-doran immigrants taken skilled or unskilled blue-collarjobs at the expense of native American workers?
The Los Angeles Community Survey has demonstratedthe feasibility of conducting detailed surveys of immi-grant communities and the importance of the informationthat they provide. Such studies are not cheap: based onthe costs of their pilot survey, researchers estimated thatpreparing the initial interview for a national survey of9,000 immigrants in nine urban sites would cost about $6million (in 1994 dollars). The passage of welfare reformlegislation, with its major changes in the eligibility oflegal immigrants for public assistance, has added a newand very urgent set of questions to the traditional onesabout the costs and contributions of immigrants; answerswill require reliable information of a kind imperfectlyavailable in existing data sources. Only national longitu-dinal studies that follow particular immigrant groupsover time and set them in historical context can illumi-nate the kinds of policies—whether immigration policiesor social services—that are best suited to the rapid andsuccessful incorporation of immigrants into Americansociety. n
Table 2The Los Angeles County Survey: Use of Public Services by Salvadoran and Filipino Immigrants
Salvadoran Immigrants _ Filipino Immigrants _Temporary Permanent Permanent
Percentage Using Undocumented TPSa Visa Resident All Resident Citizen All
Transfer ProgramsAFDC 14 10 13 6 9 2 1 1Food stamps 22 17 18 14 17 4 1 2WIC 33 28 34 20 26 6 0 2Unemployment compensation 8 8 8 10 9 13 8 10Workers’ compensation 4 6 0 8 6 3 3 3
Health ServicesPublic hospital 30 24 29 21 25 10 10 10County, free, or family clinics 52 50 53 35 45 16 10 12Prenatal clinics 17 20 16 14 16 6 4 4Private doctor or clinic 31 48 39 51 45 52 62 58HMO 8 13 8 21 15 38 51 47Private dentist 7 25 18 28 22 61 75 69
Health Insurance StatusAny insurance 39 40 37 44 41 87 90 88Govt. program 35 28 32 22 28 26 26 26Private insurance 3 7 11 15 10 56 58 57HMO 7 10 3 18 12 40 53 49Payer
Employer or union 6 10 11 19 14 77 83 81Privately purchased 0 0 3 2 2 7 5 6
Average income ($/year) 10,250 10,800 11,250 13,000 37,630 50,000
aTPS means Temporary Protected Status (see p. 12).

23
1This article summarizes two reports from the RAND Center forResearch on Immigration Policy: G. Vernez and K. F. McCarthy, TheCosts of Immigration to Taxpayers: Analytical and Policy Issues(Santa Monica, CA: RAND, 1996); reviews recent estimates of thenet costs of immigration that have been widely cited in public debateover the issue. J. Davanzo, J. Hawes-Dawson, R. Burciaga Valdez,and G. Vernez, Surveying Immigrant Communities: Policy Impera-tives and Technical Challenges (Santa Monica, CA: RAND, 1994),analyzes deficiencies in the existing sources of data regarding immi-grants, puts the case for a new national survey, and reports upon thepilot study of Los Angeles County immigrant populations that testedthe methodologies that such a survey would demand.
2Immigrants who came to the United States between 1990 and 1994have a median age of 26. The median age of all foreign-born personsin the United States (37 years) is, however, higher than the medianage for natives (33 years). Naturalized citizens are older (48 years).See K. A. Hansen and A. Bachu, “The Foreign-Born Population,”U.S. Census Bureau, Current Population Report P20-486, August1995.
3This issue is addressed in the article by Frank Bean and colleagues,in this issue.
4The U.S. Census, for example, does not collect information on visastatus.
5These terms are explained on pp. 11–12.
6In 1990, 24.3 percent of adults and 80.1 percent of children living inimmigrant households were native-born (J. V.W. Van Hook, J. E.Glick, and F. D. Bean, “Nativity Differences in Public AssistanceReceipt: What Difference Does the Unit of Analysis Make?” unpub-lished ms., University of Texas at Austin, Population Research Cen-ter, May 1996).
Conference Announcement/Callfor Abstracts
The Northwestern University/University of Chi-cago Joint Center for Poverty Research announcesits First Annual Poverty Center Research Confer-ence, entitled “Evaluating State Policy: The Effec-tive Use of Administrative Data,” on June 16–17,1997, at Northwestern University. The two-dayprogram will bring together researchers and statedata officials to discuss the possibilities and prob-lems involved in the use of state administrativedata.
Two-page abstracts are solicited from researcherscurrently utilizing state administrative data toevaluate social policy and engaged in research thatdiscusses methodological issues associated with itsuse. Abstracts must be received no later than March21, 1997. Researchers whose abstracts are acceptedfor inclusion in the program will be expected tosubmit a completed paper by June 1, 1997.
Abstracts should be submitted to Research Confer-ence, Joint Center for Poverty Research, 2046Sheridan Rd., Northwestern University, Evanston,IL 60208-4105. For further information, write tothe same address or, by e-mail, to [email protected]
Order forms for Focus and
other Institute publications are
at the back.
Subscribe now to our Discussion Paper
Series and Reprint Series.
Please let us know if you change
your address so we can continue to
send you Focus.

24
California
-6
-4
-2
0
2
4
6 Immigration
New York
-6
-4
-2
0
2
4
6Internal
MigrationImmigration
Texas
-6
-4
-2
0
2
4
6
Massachusetts
-6
-4
-2
0
2
4
6
New Jersey
-6
-4
-2
0
2
4
6
Illinois
-6
-4
-2
0
2
4
6
1985-90 1990-95
InternalMigration Internal
MigrationImmigration
InternalMigration
Immigration InternalMigration
Immigration InternalMigration
Immigration
Immigration and the changing geography of povertyWilliam H. Frey
William H. Frey is a demographer and research scientistat the Population Studies Center, University of Michigan,Ann Arbor.
Immigration to the United States since 1965 has beenheavily drawn from developing countries in LatinAmerica and Asia, and has consisted disproportionatelyof the less well-off and the relatively unskilled. Thus thedebate over U.S. immigration has focused primarily onits near-term economic consequences for native-bornworkers, taxpayers, and government programs. Largelyoverlooked is an equally important long-term conse-quence for the nation: sharper social and demographicdivisions that, if unaltered, portend a “demographicbalkanization” of the United States. Across broad regionsand metropolitan areas, separate immigration and domes-tic migration patterns are becoming apparent. They con-sist of:
1. Highly focused state and metropolitan-area destina-tions of immigrants, whose racial/ethnic and skill-levelprofiles differ sharply from the rest of the population.
2. Much different migration patterns among lower-in-come or poor domestic migrants, who gravitate to statesand metropolitan areas that are not attracting immi-grants.1
3. An apparent “immigrant push” of domestic migrantsaway from areas of high immigration, which is mostevident among less-skilled and lower-income long-termresidents and their children.
My colleagues and I have explored aspects of these pro-cesses in research using census data and, for the years1990–1995, the annual Current Population Surveys.2
Here I briefly review evidence regarding the extent towhich immigration to a few port-of-entry states is influ-encing the composition and internal migration of thepoor, and indicate some consequences of that immigra-tion for the geography of poverty, especially child pov-erty.
Figure 1. Immigration and internal migration rates for high-immigration states, 1985–95.
Source: U.S. Census, 1990, and U.S. Census postcensal estimates.

25
Immigrants and internal migrants
Immigration and internal migration are driven by verydifferent motivations. Research suggests that immigra-tion from foreign countries tends to occur in “chains”which link family members and friends to common desti-nations. This is especially the case for lower-skilled im-migrants, who are much more dependent upon those in-formal networks to find jobs and shelter in traditionalport-of-entry areas. Internal migrants, in contrast to im-migrants from abroad, have tended to be less constrainedin their destinations, more apt to respond to pushes andpulls of the labor market. They also have tended to bedrawn from the segment of the labor force that has highincomes, high education, and higher-skilled, more spe-cialized occupations—the group most responsive to na-tional income and employment opportunities. This pat-tern of internal migration has been characterized as a“circulation of elites,” in which employment-gainingstates attract higher rates of nonpoor than of poor mi-grants, and population-losing states lose residents dis-proportionately from among their younger nonpoor andcollege-graduate populations.
High-immigration states may, of course, also be high-internal-migration states. For most of this century, theport-of-entry areas for immigrants were also attractiveemployment centers for internal migrants, so that theseareas grew from both sources of migration. In the pastdecade, this has changed. Between 1985 and 1995, thesix states with the highest numbers of new immigrants—California, New York, Texas, Illinois, New Jersey, andMassachusetts—have undergone major outmigration ofthe native-born population (see Figure 1). Moreover, do-mestic migration from states receiving high numbers ofimmigrants has not conformed to the traditional “circula-tion of elites” pattern.3 Instead, it disproportionately oc-curred among high school graduates, high school drop-
outs, and lower-income residents. And it occurred inhigh-immigration states that were doing relatively welleconomically and that in some cases were attractingmore highly educated, highly skilled domestic migrants.This was true, for example, in California in the late1980s, before the 1989–92 recession and the downturn indefense-related industries, and in Texas in the early1990s, after the recovery from the oil-related recession(see Table 1).4 Internal migration has nevertheless re-mained very sensitive to economic ebbs and flows, as isclear when one looks at the high-immigration metro ar-eas. Los Angeles, for instance, was especially hard hit inthe early 1990s by recession, defense cutbacks, and natu-ral and human disasters and the net outmigration thatbegan in the late 1980s accelerated from 1992 to 1995; inHouston, however, the economy rebounded in the early1990s, leading to domestic migration gains.
Is there an “immigrant push”?
The observation that poor internal migrants are dispro-portionately leaving high-immigration states is not byitself sufficient to prove that immigrants are “pushingout” low-income workers. A number of researchers haveargued that relatively low-skilled immigrants competewith low-skilled and less-well-educated native-bornworkers for jobs, bidding down wages and taking awayemployment opportunities. Indeed, outmigration fromhigh-immigration states is most pronounced among poormen and women in the prime labor-force years, ages 25to 54, and among children aged 5–14, moving with theirfamilies. Some possible consequences of large immi-grant flows for the low-wage workforce are discussed inthe following article by Franklin Wilson. But labor mar-ket competition may not be the only reason that lower-income residents show a propensity to move away fromhigh-immigration areas. Their decision to leave may rep-
Table 1Net Internal Migration Rates of the Native-Born for High-Immigration States, by Selected Social and Demographic Categories
California _ New York _ Texas _ Illinois _ New Jersey _ Massachusetts _Categories 1985–90 1990–94 1985–90 1990–94 1985–90 1990–94 1985–90 1990–94 1985–90 1990–94 1985–90 1990–94
RaceAll races 0.7 -2.3 -4.8 -5.0 -2.1 0.9 -3.2 -0.3 -2.7 -3.2 -1.7 -2.2Non-Hispanic
whites 0.7 -4.2 -4.4 -4.1 -2.6 1.3 -3.1 0.1 -3.4 -3.1 -2.3 -1.9Blacks 1.1 4.6 -5.7 -7.8 0.5 -1.6 -3.8 0.6 -1.1 -3.8 1.0 3.4
Educationa
Less than HS -0.8 -2.1 -3.7 -6.7 -1.9 0.5 -2.5 -0.3 -2.1 -4.6 -1.7 -3.7HS graduate -1.4 -4.5 -4.5 -3.8 -2.6 1.8 -2.7 -0.1 -2.6 -1.7 -2.8 -1.1College graduate 3.4 -2.3 -5.9 -3.7 -1.8 3.3 -2.6 -1.8 0.8 -0.6 -2.1 -1.7
Poverty StatusNot in poverty 0.8 -2.5 -4.8 -4.7 -2.1 1.5 -2.6 -0.6 -1.5 -2.6 -2.2 -2.0In poverty -1.7 -1.5 -4.7 -6.8 -2.3 -2.1 -5.2 1.5 -10.1 -8.3 -0.4 -3.3
Source: Compiled by author from special 1990 U.S. Census migration tabulations (1985–90) and from single-year migration tabulations of the U.S.Census Current Population Survey, 1990–1995.
aAged 25 and above.

26
Table 2Characteristics of Foreign-Born Residents of High-Immigration
U.S. Metropolitan Areas, 1995 (in percentages)
Los New 10 High-Angeles York Immigr. Rest
Characteristic CMSA CMSA CMSAs of U.S.
EducationCollege graduate 21 20 20 8Some college 25 23 21 5HS graduate 21 24 18 4Less than HS 56 38 38 7
Family IncomeTop 25% 23 15 17 5Second 25% 34 29 25 4Third 25% 47 34 34 6Bottom 25% 61 47 45 9
Occupation: MenMgr. & prof. 19 20 17 5Clerical & sales 31 23 22 4Service 55 36 40 7Precision prod. 48 30 30 5Blue-collar 58 41 40 7
Occupation: WomenMgr. & prof. 20 18 16 4Clerical & sales 22 17 17 3Service 51 41 38 6Precision prod 52 65 41 6Blue-collar 71 66 53 8
Total aged 18 or over 38 28 27 6
Source: Compiled by the author from U.S. Census Bureau CurrentPopulation Survey data for 1995.
Note: Area definitions for these metro areas are consistent with Of-fice of Management and Budget standards of June 1990. Educationpercentages for population aged 25–64; family income for those aged18 and above; occupation for those aged 16 and above.
resent a response to the perceived higher social costs ordisruption associated with rapid demographic changeand the increased racial and ethnic diversity of theseareas. Correctly or not, longer-term residents in high-immigration states may hold the perception that the newimmigrants contribute to a variety of social costs—higher crime rates, heavily impacted services, and in-creased taxes, bearing most heavily on lower- andmiddle-class residents. Racial and ethnic prejudice mayplay a role, replicating, on a metropolitan or statewidescale, the kind of exodus to the suburbs precipitated byearlier waves of immigration and the migration of Afri-can Americans from the South to the cities of the North.
The belief that immigration “push” is a factor in domes-tic migration of the poor finds support in the extent towhich the six high-immigration states have continued todominate the net national outmigration of poor familiesin the 1990s.5 In our multivariate analyses of internalmigration patterns for metropolitan areas, we introducedinto the analysis such relevant economic and “amenity”variables as manufacturing and service growth, the un-employment level, income per capita, level of publicassistance benefits, and rate of violent crimes. Neverthe-less, the size of immigration from abroad still exerted asignificant effect on net domestic outmigration that isstrongest for persons in poverty and for those with lessthan a college education. For example, New Jersey is ahigh-immigration state which experienced a netoutmigration among the nonimmigrant population in theearly 1990s: among the poor population, net outmigra-tion was 8.3 percent, among the nonpoor, 2.6 percent.Using education rather than poverty status as a marker,we find similar patterns: white persons with less than ahigh school education showed a net outmigration rate of3.3 percent, compared with a net outmovement amongcollege graduates of less than 1 percent.
There are other possible explanations for theoutmigration of the poor from high-immigration areas. Ithas, for instance, been argued that the negative relation-ship between immigration and internal migration that isvisible in large metropolitan areas like New York andLos Angeles simply reflects global structural forces atwork. These cities, the argument proposes, have becomecenters of the advanced financial and business servicesthat play a key integrating role in the new globaleconomy and that are highly polarized in their wagestructures. At the same time, the cities have seen dra-matic declines in traditional production-oriented manu-facturing. Thus native workers leave in response to theloss of high-wage manufacturing jobs, whereas immi-grants arrive in response to the growth of low-wage un-skilled service jobs. This theory rests heavily on theassumption that immigration responds fairly freely tochanges in the demand for low-wage labor. Illegal immi-gration to the United States may do so, but legal immi-gration is constrained, to a large degree, by the presenceand location of already resident family members.6 More-
over, the greatest declines in manufacturing jobs in thesemetropolitan areas occurred during the 1970s and early1980s, yet low-wage workers and the poverty populationcontinued to leave in subsequent years.
Another explanation for patterns of internal migrationamong the poor that competes with the “immigrant push”theory has been “welfare magnet pull”—that poor peopleare attracted to states with generous welfare benefits.There is some evidence for this. The six highest welfarebenefit states between 1985 and 1990 were Vermont,Wisconsin, Washington, Minnesota, Oregon, and Utah.7
Three of them, Washington, Oregon, and Wisconsin, areamong the top ten gainers of poor migrants, and all threeattracted more poor than nonpoor migrants. High welfarebenefit states do not dominate, but they gain more poorthan nonpoor whites and African Americans.8 Our analy-ses found that high welfare benefits exercised an attrac-tive effect, especially upon poor female migrants of allages, though the least effect was for women with thelowest levels of education. But the overall contributionof these benefits in explaining the destination choices ofpoor migrants appeared to be minimal, compared to otherpossible reasons. To take just one example: racial or eth-nic similarity had a much more significant attractive

27
effect, especially for poor American Indians and forAsian and Hispanic poor migrants of low educationalstatus.
In general, however, the number of destination stateschosen by the poor population leaving high-immigrationstates was relatively large and diffuse. The labor marketand climate were both significant factors, as they werefor the nonpoor. States that gained internal migrants fromthe poor population were a mix among those with arelatively high growth in service industry employment—Florida, North Carolina, Georgia, Tennessee—and retire-ment magnets. Some migration reflected a spillovermovement to nearby states of poor migrants leaving Cali-fornia (for Washington, Oregon, and Arizona) or Illinois(for Wisconsin). Some choices may have signaled a re-turn to places of origin. Poor African Americans andwhites made rather different destination choices, whichreflect, in part, the different geographic concentrationand historic roots of the two races. Poor African Ameri-cans, for example, were more likely to relocate to theSouth Atlantic region, especially Georgia and NorthCarolina. These findings tend to confirm research thatsuggests that because poor people are more apt to relyupon informal channels of information about jobs, thepresence of friends and relatives may be at least as im-portant as more formal and more national channels of jobsearch in their decisions about where to move.9
Effects of differential migration patterns
One important, and very new, consequence of the differ-ent patterns of immigration and internal migration is theemergence of entire metropolitan areas or labor marketregions that are distinct in their racial, ethnic, and demo-graphic makeup from the rest of the country. Over two-thirds of all immigrants since 1985 have located in 10metropolitan areas, where some 60 percent of the for-eign-born but less than 25 percent of all Americans nowlive.10 For these metros, the 1995 foreign-born popula-tion comprised a disproportionate share of persons with-out high school degrees, in the lowest quartile of familyincome, and of workers in service and unskilled blue-collar occupations (see Table 2). The imbalance is mostpronounced in the Los Angeles metropolitan area where,for example, foreign-born residents comprise three-fifthsof those whose family incomes fall into the bottomquartile, and hold over half the service and unskilledblue-collar jobs, but account for no more than one-fifthof managerial and professional jobs.
For the high-immigration states themselves, the scale andnature of foreign immigration and the outmigration oflow-income families, both native-born or longer-termimmigrants, have large consequences for social welfareprograms. Between 1985 and 1990, 34 states receivedmore poor migrants through immigration than they didthrough net internal migration. California, in particular,
gained approximately nine times as many poor migrantsfrom abroad as it lost through internal migration to otherstates.
Two consequences are noteworthy. The first is the directcontribution of immigrants to the volume of poverty inthe United States because of their own relatively highlevels of poverty. The second is the demographic dis-placement taking place among the poor population. Bothare most clearly visible when one examines povertyamong children. In 24 states, 1990 census data show,foreign immigration either added to the state’s popula-tion of poor children, or maintained existing levels ofchild poverty that would otherwise have diminished inthe state through internal migration to another state.11 Forexample, in New York from 1985 to 1990, 33,724 poorchildren moved to other states, and 32,699 poor immi-grant children moved in. Thus the population of poorchildren declined by only 1,025.
To give fuller understanding of the significance of thesechanges, Table 3 shows California’s experience from
Table 3Contribution of 1985–90 Immigration and Net Internal Migra-
tion to Child Poverty Population in California, 1990
Demographic Immigration Net InternalCategories from Abroad Migration
Total 8.4 -1.3Race/Ethnicity
Whites 5.2 -6.8Blacks 0.9 -1.2Hispanics 9.3 -0.7Asians 20.2 7.2
Family TypeMarried couple 13.5 -1.3Male head 7.5 -1.6Female head 3.2 -1.3
English LanguageEnglish not good 24.7 1.4English good 9.8 0.8Only English at home 0.7 -4.3
NativityNative-born, native parent — -3.9Native-born, foreign parent — 0.2Foreign-born 39.0 1.8
Hispanics Native-born, native parent — -1.0
Native-born, foreign parent — -0.7Foreign-born 35.9 -0.4
AsianNative-born, native parent — -3.1Native-born, foreign parent — 7.7Foreign-born 37.8 7.3
Source: 1990 U.S. Census.
Note: Poverty status of migrants and residents was determined from1989 incomes, as reported in the 1990 U.S. Census. Each gain or lossis shown as a percentage of each group’s population in 1990. Thetotal number of poor immigrant children arriving in California be-tween 1985 and 1990 was 100,754. Over that five-year period Cali-fornia suffered a net loss of 16,004 poor children throughoutmigration to other states.

28
1985 to 1990. The data make it clear that the demo-graphic displacement of California’s child poverty popu-lation affects race and ethnicity, English-language profi-ciency, nativity, and family type. Poor children who areleaving are predominantly white, English-speaking, andnative-born with native-born parents. The new immi-grant population of poor children is dominated by His-panic and Asian children who speak a language otherthan English at home. They are also more likely to live intwo-parent than in single-parent families. These differ-ences are a strong argument against one-size-fits-all so-cial welfare policies and in favor of localized programs,which in some areas might concentrate on assimilationand bilingual education in the schools, and in others onthe problems of female-headed families who need accessto jobs and schooling. n
1By “poor,” I mean those individuals or families whose incomes placethem at or below the relevant federal poverty level. Census data allowus to determine poverty only at one point in time. Thus individuals inpoverty during the year preceding the Census are not necessarily poorthroughout the entire period.
2W. H. Frey, “Immigration Impacts on Internal Migration of the Poor:1990 Census Evidence for the US States,” International Journal ofPopulation Geography, 1, no. 1 (1995): 51–67 (also available as IRPReprint 733); W. H. Frey, K.-L. Liaw, Y. Xie, and M. J. Carlson,“Interstate Migration of the US Poverty Population: Immigration‘Pushes’ and Welfare Magnet ‘Pulls,’” Population and Environment17, no. 6 (July 1996): 491–538; W. H. Frey, “Immigration, WelfareMagnets, and the Geography of Child Poverty in the United States,”Population Studies Center Research Report 95-339, University ofMichigan, November 1995; W. H. Frey, “Immigration, Internal Out-Movement, and Demographic Balkanization in America: New Evi-dence for the 1990s,” Population Studies Center Research Report 96-364, University of Michigan, April 1996; W. H. Frey and K.-L. Liaw,“The Impact of Recent Immigration on Population Redistributionwithin the United States,” Population Studies Center Research Re-port, University of Michigan, forthcoming.
3Internal migration among the nonpoor has continued to follow thistraditional pattern: states gaining nonpoor residents have tended tohave growing economies, states losing nonpoor residents to havedeclining economies. For instance, Virginia and Maryland, in theprosperous South Atlantic region, were among the top ten magnetsfor the nonpoor population in 1990, and the economically dynamicstate of Georgia ranked second to Florida in attracting nonpoor resi-dents. Among states losing nonpoor populations were Michigan andOhio, in the then deindustrializing rust belt, Oklahoma, which wasexperiencing oil industry difficulties, and Iowa, with farming down-turns during this period. One possible explanation for the differentmigration patterns of the nonpoor and the poor populations is thatthey are operating in a somewhat different labor market where theeffects of recent immigration may actually complement rather thancompete with their employment opportunities (Frey et al., “InterstateMigration of the US Poverty Population,” pp. 500–501; Frey, “Immi-gration Impacts,” p. 53).
4Florida, though a high-immigration state, is excluded from the defi-nition, because internal migration rather than immigration dominatesits population gain. Between 1990 and 1995, for instance, Floridareceived 245,482 immigrants, making it the fourth largest receivingstate for immigrants, but it also received 615,670 internal migrants,making it the largest destination state for internal migration.
5See, in particular, Frey, “Immigration, Internal Out-Movement, andDemographic Balkanization,” appendix tables.
6P. Martin and E. Midgley, “Immigration to the United States: Jour-ney to an Uncertain Destination,” Population Bulletin 49(2), Sept.1994.
7Based on average combined annual AFDC and Food Stamp benefits,1985–88, adjusted for state variations in cost of living, and excludingNew York and California, two high-immigration states, and Alaskaand Hawaii.
8Among Hispanics and Asians, the greatest gaining and losing statesfor the poor population are not distinctly different from those for thenonpoor population. Patterns do not appear to reflect the influencesof either immigrant “pushes” or welfare benefit “pulls” as much asthey do for blacks and whites. For native-born and longer-termAsians and their families, California represents the dominant destina-tion, for Hispanics, Florida.
9Nonpoor migrants, in contrast, were disproportionately attracted toeconomically prosperous and mainly coastal states—a true migration“pull.”
10High-immigration metropolitan statistical areas (MSAs) in 1990–95were Los Angeles, New York, San Francisco, Chicago, Miami, Wash-ington, D.C., Houston, San Diego, Boston, and Dallas. Historically,the disproportionate concentration of immigrants to the United Statesin a few ports of entry is nothing new. There is, however, someevidence that the kinds of dispersion to other parts of the country thatoccurred when previous immigrant flows assimilated is less likely tooccur with the present-day immigrant groups. See, e.g., Figure 1 inFrey and Liaw, “The Impact of Recent Immigration.”
11See Frey, “Immigration, Welfare Magnets, and the Geography ofChild Poverty,” Appendix Table A.

29
Two new studies of immigration by the National Research Council
The Health and Adjustment of Immigrant Children and Families: A study committee of the Board on Children,Youth, and Families
More than a million foreign-born children came to the United States from 1987 to 1990. What were their health careneeds, and how were they met? Immigrant children and their families tend to receive a patchwork of health careservices, with eligibility dependent upon the conditions under which they entered the United States. Amid growingefforts in some states to pare back available public health care benefits (including prenatal care and immunizations)for immigrants, the health status of immigrant children and their families has become an issue of considerable interestto policy makers and practitioners.
In this context, the Board on Children and Families is convening a committee that will conduct a study thatsynthesizes data and develops a framework for clarifying what is known about differential health outcomes of variousimmigrant groups, the varying trajectories that now characterize the development of immigrant children, and theeffective delivery of health and mental health services to these groups. Over 24 months, the project will synthesizethe relevant research literature and support the secondary analysis of existing datasets (e.g., the 1990 Census) tosupplement the available research on immigrant children and families, as well as assess the adequacy of existing dataand make recommendations for new data collection and research needed to inform and improve public policy andprograms.
The study is presently sponsored by the U.S. Department of Health and Human Services, the National Institute ofChild Health and Human Development, the Rockefeller Foundation, the W. T. Grant Foundation, and the CarnegieCorporation of New York. For further information, contact Donald J. Hernandez, study director, at (phone) 202-334-3829 or (e-mail) [email protected]
The Demographic and Economic Impacts of Immigration: A panel study by the Committee on Population andthe Committee on National Statistics
The Immigration Act of 1990 created the U.S. Commission on Immigration Reform, which is mandated to submit afinal report in 1997 that assesses U.S. immigration policy and makes recommendations regarding its implementationand effects. To assist in formulating its recommendations, the Commission asked the two NRC committees to studythree interrelated issues: (1) the effect of legal and illegal immigration on the future size, composition, andgeographic distribution of the resident population; (2) the impact of immigration on the economy, in particular onnational and regional labor markets; and (3) the fiscal impacts of immigration on federal, state, and local govern-ments. The final report is expected to be released in late May 1997. For further information, contact BarryEdmonston, study director, or Joel Rosenquist, administrative assistant, at (phone) 202-334-3167 or (e-mail)[email protected]
Previous studies by the Committee on Population and the Committee on National Statistics for the U.S. Commissionon Immigration Reform may be ordered from the National Academy Press, 2101 Constitution Avenue NW, Washing-ton, D.C. 20418, or by calling (800) 624-6242.
Barry Edmonston, ed., Statistics on U.S. Immigration: An Assessment of Data Needs for Future Research. Washing-ton, D.C.: National Academy Press, 1996.
This report summarizes the discussions and conclusions from a two-day workshop on the collection and preparationof data dealing with immigration in the United States. The report deals with trends in U.S. immigration, social effectsof immigration and assimilation, labor force issues, family and immigration networks, immigration data needs, andthe potential for longitudinal studies of immigrants.
Barry Edmonston and Ronald Lee, eds., Local Fiscal Effects of Illegal Immigration: Report of a Workshop.Washington, D.C.: National Academy Press, 1996.
This report summarizes the discussions at a one-day workshop held at the request of the U.S. Commission onImmigration Reform. The report reviews six recent case studies that assess the net fiscal impact of illegal immigrationon state and local public services, considering the assumptions about the number and characteristics of illegalimmigrants, about estimates of the fiscal effects of selected public services for illegal immigrants, and about thepossible employment displacement effect of illegal immigrants on residents.

30
Immigration and labor market outcomesfor native workersFranklin D. Wilson and Gerald Jaynes
Franklin D. Wilson is Professor of Sociology at the Uni-versity of Wisconsin–Madison and Gerald Jaynes is Pro-fessor of African-American Studies and Economics atYale University
Repeated surveys indicate that most Americans believethat immigrants take jobs from natives and force wagesdown. But as with so many other facets of immigration,the evidence on this issue is at best uncertain. Most cross-sectional studies of intermetropolitan variation in theemployment and earnings of natives have found few orno adverse effects from immigration. There is no evi-dence that the labor market status of white-collar andskilled blue-collar workers has been adversely affectedby the influx of immigrant workers. But the story may bedifferent for unskilled workers. David Jaeger estimatedthat the increase in immigrants’ share of the labor forceduring the 1980s accounted for 6 percent of the increasein the difference between the wages of high schoolgraduates and those of college graduates. George Borjasand his colleagues concluded that immigrants with lowereducational attainment were partly responsible for therelative decline in the wages of native workers with simi-lar levels of education; Borjas also concluded that theskill levels of recent immigrants have declined substan-tially, leading him to suggest that these wage effects maybe long-term.1
There are a number of reasons that immigration mightaffect unskilled native labor differently from skilled la-bor. First, the demand for skilled workers has continuedto increase, allowing skilled immigrants to be absorbedinto labor markets. Second, skilled native workers, fluentin the English language and familiar with the customsand culture of the U.S. workplace, enjoy a decisive ad-vantage over most immigrants in the labor market—anadvantage reinforced by apprenticeship, certification,and licensing requirements. Finally, there is some evi-dence that, because immigrants increase the demand forgoods and services, their arrival can increase employ-ment opportunities for skilled native workers.2
Little or no training is required for unskilled jobs. Thusimmigrants are more easily substituted for unskilled na-tive workers. And given that employment opportunitiesfor unskilled blue-collar workers have declined, immi-grants have some potential advantages. One explanationfor this lies with employer preferences, another with
worker preferences.3 The first posits that immigrants maybe willing to work for less than native-born workers; theyare also presumed to be less militant about labor issuessuch as wages, benefits, and working conditions, becausethey have fewer alternative means of support and theirexpectations about pay are lower than those of native-born workers. Moreover, once immigrants establish apresence in an industry or occupational niche, their num-bers tend to increase through referral and networking. Inthis context, immigrants may become preferred workers,particularly in industries with low profit margins and fewoptions for employers to relocate, such as construction orjanitorial services.
The second explanation for immigrant advantages in thelow-skilled labor market is that immigrants are willing totake jobs that natives will not take, because wages are toolow and working conditions too onerous, and they haveother resources. At least partial support for this explana-tion exists in the high joblessness found among nativeworkers in cities where blue-collar manufacturing jobshave declined but low-wage service jobs have increasedand have been taken by immigrants (Los Angeles is aprime example).
Analyses of immigrants’ labor market effects have beenbased on a simple idea. If immigration has negative ef-fects, then employment conditions for native workersshould be worse in areas with relatively more immigrantworkers, when other economic factors are held constant.Much research, therefore, has compared the wages ofnative workers in labor markets with few immigrants tothose in labor markets with many immigrants. But fewstudies have reported reductions in wages or increasedjoblessness among native workers of more than 2 per-cent.4
The article in this issue by William Frey suggests onereason for this: native workers whose wages or employ-ment would have been worsened by immigrant competi-tion are leaving high-immigration areas. If this is so, thecomparative model has underestimated the effects of im-migration, for two reasons. First, the average employ-ment conditions of native workers in high-immigrationareas rise when the most severely affected leave. Second,those leaving high-immigration areas may increase thelabor supply and worsen employment conditions in theirareas of destination. Estimates of the effects of immigra-tion on native workers must, therefore, explicitly takeinto account domestic migration also. Poorly educatedand unskilled native workers can also migrate and com-pete effectively against long-term residents who havesimilar skills and experience.

31
The U.S. labor market is highly diverse, segregated byethnicity and gender as well as by education. We should,therefore, expect that ethnically heterogeneous immi-grant flows would have differential effects on the variednative workforce. But much existing work on the labormarket effects of immigrants has relied on highly aggre-gated data that conceal those structural features of labormarkets that influence intergroup competition. Immi-grant workers, for example, seldom identify or organizethemselves in social networks as “immigrants.” Rather,they organize within ethnic or national categories, form-ing Korean, or Pakistani, or Salvadoran networks thatplay an important role in determining where and for whatjobs their members compete. The existence of such net-works suggests that many immigrant and native-borngroups may not compete with each other at all, whereasother groups may be quite competitive. The wages andemployment of the native-born members of noncompet-ing groups may be unaffected or even enhanced, andthose of competing groups may be worsened. Statisticalanalyses of the effects of the composite category “immi-grants” on the composite category “native-born” may, onaverage, find no effect, precisely because the averagesconceal important differences among groups. ThomasEspenshade, for example, found that “immigrants” hadno effect on the wages of African Americans in NewJersey, but that Puerto Ricans did.5 To capture the trueeffects, estimates of the effects of immigration must dis-aggregate the data by ethnic group, region, and industry.
In this article, we report the results of research that usedethnic/immigrant and occupational categories as a basicelement in the analysis.6 By combining 1980 and 1990census data with data from other sources such as theSurvey of Income and Program Participation (1984 and1987 panels) and Census Bureau estimates of immigra-tion and net internal migration, we computed the effectsof immigration on native workers, and the effects ofinternal migration on both native and immigrant workers.Specifically, we estimated the contribution of immigra-tion to variation in joblessness and wages for six ethnicand immigrant groups within industry and occupationalgroupings in 52 major metropolitan areas. We used na-tive-born Asian, non-Hispanic black, non-Hispanicwhite, and Hispanic ethnic groups, and two immigrantgroups: immigrants who have been in the United Statesfor less than 11 years, and long-term immigrants—thosein the United States for more than 10 years. Concentra-tions of the foreign-born vary within industries and occu-pations; of necessity, we used fairly broad categories forboth. Our three major industrial sector categories are(1) construction and manufacturing; (2) transportation,utilities, wholesale and retail trade, entertainment andpersonal services; and (3) finance, insurance, real estate,business services, professional services, and public ad-ministration. Our four major occupational categories areskilled and semi-skilled white-collar workers, and skilledand semi-skilled blue-collar workers. Competition be-tween natives and immigrants, and the subsequent dis-
placement of native workers, cannot occur unless mem-bers of the two groups work in similar industries andoccupations. Thus we expected joblessness and wages tobe lower among immigrants than among native workersin industrial sectors in which immigrants were highlyconcentrated or where their percentage of the workforcewas increasing.7
Metropolitan areas differ in the share of their populationheld by ethnic-minority groups and in the origin andcomposition of immigrant groups. So native workersmay encounter immigrants of very different origins withvery different migration histories, and these attributesform part of the context within which they interact inlocal labor markets. We selected metropolitan areas thathad at least 1,000 respondents who were native-bornAfrican Americans, Hispanics, or Asians in the 1990Census 5 percent Public Use Microdata Samples, that hadat least 500 foreign-born respondents, and for which ourother data sources also provided information. We ex-pected to find that in particular metropolitan areas, highlevels of net in-migration by African Americans, Hispan-ics, and Asians—both internal migrants and immi-grants—would increase the level of joblessness amongnative workers and would lower their wages.
Jobs. Table 1 presents the mean probability of jobless-ness for ethnic/immigrant groups in the four occupa-tional categories in 1990; it also estimates the extent towhich joblessness increased between 1980 and 1990.Both gross means and net means are given; the net meansrepresent the effect of group membership, net of differ-ences in human capital and demographic attributes. Inthree occupational categories, skilled and semi-skilledwhite-collar work and skilled blue-collar work, recentimmigrants are the most disadvantaged. Their situation iscomparatively better only in the lowest-income category,semi-skilled blue-collar workers; in this category, Afri-can Americans, closely followed by Hispanics andAsians, had the highest levels of joblessness. Between1980 and 1990, the gross probability of joblessness in-creased for some groups in all occupational categoriesexcept for skilled white-collar workers; African Ameri-cans especially saw increased joblessness in three out ofthe four occupational groups. Yet net mean joblessnessdeclined substantially for all occupations and ethnicgroups, indicating that, whatever the causes of the in-creased joblessness, it had little to do with immigrantcompetition.
Wages. Table 2 reports gross and net mean hourly wages,by ethnic group and immigrant category, for 1990, andthe changes between 1980 and 1990. The gross hourlywages of recent immigrants are the lowest of all groupsin three of the four occupational categories (excludingskilled white-collar workers). The pattern is not nearly sodistinct for net wages, where the variation within theoccupational groups is not great. Between 1980 and1990, the gross hourly wages of blue-collar workers,

32
particularly immigrants, declined. The decline in netwages was greater than in gross wages, indicating thatwages were less responsive to group membership thanthey were to other factors known to affect wages
Are immigrants a substitute labor supply?
The results in Tables 1 and 2 present a mixed picture.Asians and whites, on average, are the most advantagedgroups, African Americans, Hispanics, and recent immi-grants the least advantaged, when it comes to employ-ment and wages. But are the relative fortunes of thesegroups linked through changes in local labor marketstructure and conditions? Is there evidence that immi-grants are a substitute labor supply, or that immigration,as a major source of change in the labor supply of localareas, worsens employment outcomes for native work-ers?
Specifically, we explored whether three factors—(1)changes in the white population, (2) net migration andimmigration flows, and (3) changing concentrations offoreign-born workers in an industry sector—affected thedifference in joblessness and in hourly wage rates be-tween native and foreign-born workers in metropolitanareas. Do such effects vary across occupational groups,as previous research has suggested?
1. In metropolitan areas where the white population in-creased, joblessness decreased among all groups of His-panic and Asian workers, and among immigrant skilledwhite-collar workers. For all other groups, except forskilled white-collar African Americans, it was stable.8
Metropolitan areas with growing white populations arelikely to be areas of economic growth, perhaps sufficientto absorb nontraditional workers who possess the skillsthat are in demand.
2. With two notable exceptions, neither net minority mi-gration nor the immigrant share of that migration affected
Table 1Mean Probability of Joblessness by Occupation and Ethnicity:
1990 and 1980–90 Change
Occupational Category Mean Probability ofand Ethnic/Immigrant Joblessness: 1990 _1990/1980 RatioGroup Gross Net Gross Net
Skilled White-CollarNon-Hispanic White .079 .040 .929 .645Non-Hispanic Black .092 .041 .893 .506Hispanic .089 .053 .937 .757Asian .072 .035 .947 .583Immigrant<11 yrs .131 .100 .949 .578Immigrant >10 yrs .075 .046 1.000 .568
Semi-skilled White-CollarNon-Hispanic White .144 .056 .878 .615Non-Hispanic Black .202 .068 1.069 .602Hispanic .175 .064 .967 .674Asian .142 .048 1.127 .676Immigrant <11 yrs .165 .101 .959 .584Immigrant >10 yrs .140 .055 1.000 .524
Skilled Blue-CollarNon-Hispanic White .107 .050 .907 .510Non-Hispanic Black .181 .075 1.023 .475Hispanic .145 .067 1.051 .620Asian .104 .046 .946 .460Immigrant <11 yrs .121 .082 .877 .594Immigrant > 10 yrs .119 .078 1.072 .582
Semi-skilled Blue-CollarNon-Hispanic White .161 .073 1.376 .594Non-Hispanic Black .231 .092 1.041 .548Hispanic .208 .086 1.051 .657Asian .180 .081 1.132 .596Immigrant < 11 yrs .164 .074 .937 .451Immigrant > 10 yrs .170 .078 1.043 .614
Source: 1980, 1990 PUMS. Values are averages for 52 MetropolitanStatistical Areas and three major industrial sectors. Net values aretransformations of coefficients obtained from estimated equationswhich included other variables known to affect joblessness andhourly wages, such as education, experience, marital status, gender,and work-related disability.
Table 2Mean Hourly Wages by Occupation and Ethnicity:
1990 and 1980–90 Change
Occupational Category Mean Hourlyand Ethnic/Immigrant Wages ($) _ 1990/1980 RatioGroup Gross Net Gross Net
Skilled White-CollarNon-Hispanic White 14.418 2.983 1.025 .767Non-Hispanic Black 12.361 2.753 1.029 .786Hispanic 11.444 2.744 1.024 .751Asian 14.366 3.094 1.044 .750Immigrant< 11 yrs 12.021 2.848 .995 .687Immigrant > 10 yrs 14.938 3.106 1.016 .792
Semi-skilled White-CollarNon-Hispanic White 8.860 2.285 1.034 .744Non-Hispanic Black 7.679 2.105 1.040 .768Hispanic 7.487 2.144 1.032 .732Asian 9.147 2.369 1.038 .744Immigrant < 11 yrs 6.562 2.029 .946 .705Immigrant > 10 yrs 8.413 2.151 .991 .747
Skilled Blue-CollarNon-Hispanic White 11.670 2.457 .948 .727Non-Hispanic Black 10.081 2.191 1.013 .744Hispanic 9.759 2.249 .976 .739Asian 12.363 2.639 .970 .849Immigrant < 11 yrs 7.420 2.230 .898 .722Immigrant > 10 yrs 10.599 2.275 .883 .667
Semi-skilled Blue-CollarNon-Hispanic White 8.907 2.062 .858 .684Non-Hispanic Black 8.016 1.936 .949 .729Hispanic 7.558 1.959 .948 .704Asian 8.784 2.008 .925 .663Immigrant < 11 yrs 5.849 1.845 .879 .671Immigrant > 10 yrs 7.767 1.905 .876 .628
Source: 1980, 1990 PUMs. Values are averages for 52 MetropolitanStatistical Areas and three major industrial sectors. Net values aretransformations of coefficients obtained from estimated equationswhich included other variables known to affect joblessness andhourly wages, such as education, experience, marital status, gender,and work-related disability.
33
changes in joblessness within ethnic groups and occupa-tional categories. The two exceptions both involve immi-grant white-collar workers. As internal migration andimmigration increased, long-term immigrants who wereskilled white-collar workers faced a higher likelihood ofjoblessness; as immigration alone increased, recent im-migrants who were semi-skilled white-collar workersfaced a lower likelihood of joblessness. We found noevidence to support the hypothesis that internal or inter-national migration affects employment outcomes for na-tive workers in metropolitan areas. In particular, nativeblue-collar workers experienced no increase in the risk ofjoblessness in those metropolitan areas that saw largeinflows of immigrants and internal migrants.
3. Analysis of immigrant flows will capture only part ofthe effect of immigration. Another potentially importantsource of immigrant effect is the extent to which theforeign-born are concentrated in particular industries; itis there that displacement and declining wages may oc-cur.
Jobs. We examined the effects on employment of in-creasing concentrations of the foreign-born in three ma-jor industrial sectors. For white-collar workers, the ef-fects were marginal and mixed. For blue-collar workers,there were clear effects, though they were not all in thesame direction. In general, increases in the concentrationof foreign-born workers in an industry sector between1980 and 1990 increased the odds of joblessness forblue-collar workers who were white, African American,Asian, and long-term immigrants, but decreased the riskfor those who were Hispanic and for recent immigrants.
Note that the findings for blue-collar workers point togeneral increases in joblessness among some groups ofnative workers not in response to immigration flows intoa metropolitan area, but as a result of rising concentra-tions of foreign-born workers in an industrial sector.These findings suggest that immigrants are indeed a sub-stitute labor supply that can displace native workers,once their concentration in an industrial sector is suffi-cient to change the structure of employment relations inthat sector through wages, work conditions, or networkrecruitment patterns.9
Wages. Intermetropolitan variation in wages was respon-sive to both the internal migration and immigration thatoccurred between 1980 and 1990. The wages of white-collar and skilled blue-collar workers were unaffected byincreases in either net internal migration or immigration.The wage effects for semi-skilled blue-collar workerswere clear, but again they were mixed. As the flows ofimmigrants to metropolitan areas increased, wages in-creased appreciably for whites and Hispanics, decreasedfor Asians and immigrants, and were unaffected in thecase of African Americans. But increasing concentra-tions of the foreign-born in particular industry sectors
did not affect the wages of semi-skilled blue-collar work-ers in any of the ethnic or immigrant groups.
Conclusions
Public beliefs notwithstanding, the interactions amongimmigration and internal migration, joblessness, andwages of native and foreign-born workers present nosimple or straightforward story, when one begins to teaseapart the broad categories of “immigrant” and “native-born” into more precise regional, occupational, and in-dustrial categories. As one example of this complexity,consider the wages of semi-skilled blue-collar workers.These were affected by both the internal migration andthe immigration of minority workers. But the wages ofwhites went up in response to net internal migration,whereas those of native-born Asians went down. Andwhereas net immigration of minorities raised the wagesof whites and Hispanics, it lowered those of immigrantsand Asians.
The results associated with the effects of industry con-centrations of immigrants on joblessness and wagesamong native workers require further study, using morerefined measures of industrial concentration. Our mea-sure of concentration based on industrial sectors is sim-ply too broad to apply a theoretically based substantiveinterpretation. These preliminary results, however, sug-gest the importance of this line of research and we arecurrently continuing it. The results for employment areconsistent with the hypothesis that the presence of immi-grants reduces opportunities for native workers. But im-migration and industry concentrations of foreign-bornworkers both have positive effects on wages, and this iscontrary to what one would expect under a displacementmodel.
Clearly, there is much to be learned about the impact ofthe cumulative concentration of the foreign-born in se-lected industries, both as owners and workers. For in-stance, are the labor market dynamics generated whenimmigrant entrepreneurs employ other immigrants dif-ferent from those generated by immigrants who secureemployment in industries in which members of theirgroup have historically been underrepresented? Any as-sessment of the influence of immigration on labor marketoutcomes must consider the many possible channelsthrough which that influence may be transmitted. n
1G. Borjas, “The Economics of Immigration,” Journal of EconomicLiterature 32 (1994): 1667–1717; G. Borjas, R. B. Freeman, and L.Katz, “On the Labor Force Effect of Immigration and Trade,” inImmigration and the Work Force, ed. G. Borjas and R. B. Freeman(Chicago: University of Chicago Press, 1992), pp. 213–44; D. A.Jaeger, “Skill Differences and the Effect of Immigrants on the Wages

34
A conference on internationalmigration to the United States
In 1994 the Social Science Research Council, withsupport from the Andrew W. Mellon Foundation,established a Committee on International Migra-tion to address the fundamental issues influencingimmigration to the United States. The goal of thecommittee was to reach beyond contemporarypolicy debates to provide clear understanding ofthe factors and processes that shape internationalmigration and its social consequences.
The first act of the committee was to take stock ofthe theoretical and empirical basis of contemporaryimmigration study. The stocktaking took place at aconference held on Sanibel Island, Florida, fromJanuary 18–21, 1996. Called “Becoming Ameri-can/America Becoming,” the conference exploredthe origins, outcomes, and processes of immigra-tion to the United States, including the economicconsequences both for immigrants and for the na-tive-born low-income population. Papers by Tho-mas Espenshade, Franklin Wilson, and MartaTienda and Rebecca Raijman that are summarizedin this issue of Focus were first presented at theconference. The conference proceedings are re-ported and assessed in Josh DeWind and CharlesHirschman, “Becoming American/America Be-coming,” Items, 50, nos. 2–3 (June–September1996): 41–47. A volume based upon conferencepapers will be published by the Russell Sage Foun-dation. Papers are available from the authors. Forfurther information, contact Josh DeWind, programdirector of the International Migration Program,Social Science Research Council, 810 Seventh Av-enue, New York, NY 10019.
of Natives,” Washington, D.C., U.S. Department of Labor, Bureau ofLabor Statistics, 1995.
2T. Muller and T. Espenshade, The Fourth Wave: California’s NewestImmigrants (Washington, D.C.: The Urban Institute, 1985).
3See, for instance, J. Kirschenman and K. Neckerman, “We’d Love toHire Them But...,” in The Urban Underclass, ed. C. Jencks and P.Peterson (Washington, D.C.: Brookings Institution, 1991).
4See Borjas, “The Economics of Immigration.”
5Puerto Ricans are not “immigrants” by legal status, but the character-istics of those migrating from the island to the mainland are verysimilar to those of many Hispanic immigrants. See T. Espenshade,“Immigrants, Puerto Ricans, and the Earnings of Native BlackMales,” in Immigration and Race, ed. G. Jaynes (New Haven: YaleUniversity Press, forthcoming).
6The research reported in this article is discussed in detail in F. D.Wilson and G. Jaynes, “Immigration and Labor Market Outcomes forNative Workers,” paper presented at a conference on U.S. immigra-tion, “Becoming America/America Becoming,” held by the SocialScience Research Council at Sanibel Island, Florida, January 18–21,1996.
7“Joblessness” includes both those unemployed and those not partici-pating in the labor market.
8We can offer no explanation for the increased joblessness of skilledblack workers.
9We cannot, however, exclude the possibility that we are observingthe replacement of a labor supply that may have voluntarily leftemployment in certain industry sectors in search of other alternatives.

35
Forging mobility in a low-wage environment: Mexicanimmigrants in Chicago’s Little Village neighborhoodMarta Tienda and Rebecca Raijman
Marta Tienda is a Professor of Sociology in the Depart-ment of Sociology at the University of Chicago andRebecca Raijman is Lecturer in the Department of Soci-ology at the University of Haifa, Israel.
Over a million and a half legal immigrants arrived in theUnited States from Mexico during the 1980s, more thanfrom any other country. Mexicans come as economicmigrants, often, at first, on a temporary basis, and oftenundocumented. They are young, with the lowest educa-tion levels of all immigrants, averaging only 7.5 years ofgraded schooling. For historical reasons, the Mexicanimmigrant population is highly geographically concen-trated in five southwestern states and Illinois. Like mostimmigrant groups, Mexicans are an urban population.The great majority of those now living in the UnitedStates are not citizens.1
Mexican immigrants are a topic of particular interest asthe new welfare eligibility and immigration laws begin totake effect. Without significant federal support for lan-guage instruction, employment training, and social pro-grams to help them adjust, without access to the socialsafety net available to citizens, how will they fare in anaustere economic environment that offers ever more lim-ited opportunities for unskilled workers? As a low-skilled, minority population, they face greater employ-ment instability than non-Hispanic whites. There isevidence that between 1980 and 1990 wage deteriorationwas particularly severe for young Hispanic men, andMexicans constitute by far the largest Hispanic group.
Optimistic assessments about immigrant socioeconomicintegration, made in the 1970s on the heels of a very longperiod of sustained economic growth in the UnitedStates, have been challenged by later research that ques-tions whether immigrants can ever reach parity with theirnative-born counterparts.2 The evidence suggests that un-skilled immigrants coming after the early 1970s haveexperienced little or no wage mobility, although there isno agreement on the reasons for this. Are low-skilledimmigrants merely sharing in the general decline of op-portunities in the low wage market, or are they faringworse than the native-born? Has the social and economicsignificance of ascribed traits such as nativity increasedas competition for jobs has intensified? Or have the eco-nomic fortunes of immigrants been slowed by the con-tinuing flow of unskilled new arrivals? These debates are
unlikely to be settled conclusively without longitudinaldata that enables us to trace the wage growth of cohortsof immigrants. Studies of immigrants’ economic pro-gress have, of necessity, been based on cross-sectionaldata that are unable to represent changes in economicstatus, particularly during a period of rapid economicchange.
To illustrate how recent cohorts of immigrants are forg-ing a livelihood in low-wage labor markets, we under-took a study of Mexican immigrants in Chicago, which,like many large, northern industrial centers, experiencedmassive job losses during the past two decades. Theimmigration population of Chicago nevertheless contin-ued to increase. In our study, we sought to integratesurvey research methods with the case study methodtraditionally employed by urban anthropologists. Believ-ing that conventional labor force categories are inad-equate for representing the myriad economic activitiespursued by unskilled workers, we broadened our con-cepts of labor force activity to include multiple job hold-ing in both formal and informal arrangements and whatwe have called “quasi-employment”—largely informalwork undertaken by people who would formally be de-fined as “out of the labor force.” We also focused on“family labor supply,” considering that individuals forma less appropriate economic unit than the immigrant fam-ily households within which economic decision makingoccurs.3
The Little Village Study
The Little Village community is one of two Mexicanimmigrant neighborhoods on the southwest side of Chi-cago. It has become a magnet for recent immigrants ofMexican origin who look for jobs in nearby, small tomoderate-sized, nondurable-goods factories that employimmigrant workers at low wages. Its main shoppingstreet is populated by small businesses that serve thissteady stream of new immigrants.
Table 1 provides a snapshot of the adult population ofLittle Village based upon the household survey that weundertook.4 We obtained basic demographic and socio-economic information for all individuals living in thedwellings that we sampled. We made special efforts todetect all forms of income generation and economic ac-tivity for all household members, tracing sources ofhousehold income, assets, and household consumptionpatterns. One set of questions was designed to learn howfamilies manage economic difficulties.

36
Although Table 1 gives useful information about thelabor market status of Little Village residents, this con-ventional approach to immigrant incorporation, basedupon a single activity at a single point in time, fails tocapture many activities that determine the economicwell-being of immigrants. For instance, 1990 Censusdata from the PUMS 5 percent sample indicate that 2.9percent of Mexican men and 1.5 percent of Mexicanwomen in the Chicago SMSA are self-employed. Usingthe same definition of employment, 7.0 percent of menand 1.1 percent of women in our Little Village sample
were self-employed. But this measure disregards theprevalence of multiple job holding among relatively un-skilled immigrants. A modified employment status distri-bution that takes into account both multiple job holdingand informal employment (Table 2) illustrates how theconventional labor force definitions understate the extentand nature of labor force activity among immigrants. Thecategory “quasi-employed,” for example, reveals thateconomic activities pursued in particular by women arenot captured by the standard measure. Even thoughsingle-job holding remains the predominant mode, be-
Table 1Characteristics of the Respondents and Working-Age Household Members in the Little Village Study
(means or percentages)
All Household Members _ Respondents Only _Characteristic Males Females Males Females
Marital StatusMarried 51.1 53.8 67.8 59.2Cohabiting 7.6 8.0 7.7 9.8Widowed 0.7 5.5 0.7 6.5Divorced/Separated 3.9 9.3 6.3 15.8Never married 36.7 24.3 17.5 8.7
Age (yrs) 33.4 (13.9) 34.3 (15.4) 38.0 (13.5) 37.8 (14.7)Country of birth
United States 21.7 26.6 14.0 23.9Mexico 76.5 70.7 84.6 72.9Other 0.8 2.7 1.4 3.2
Tenure (foreign-born only)In U.S. (yrs) 13.4 (8.9) 13.8 (10.7) 15.2 (9.5) 15.0 (10.4)In Little Village NA NA 11.3 (8.0) 10.8 (8.2)
English proficiency(% not proficient)Speaking NA NA 53.0 68.4Writing NA NA 61.2 69.2
EducationYears in school 8.9 (3.7) 8.6 (3.7) 8.4 (4.0) 8.5 (3.9)Level of schooling completed
No degree or diploma 71.2 70.7 71.6 68.7High school diploma or equiv. 20.5 22.5 18.4 22.5Some postsecondary degree 3.4 4.5 5.6 5.4Other (nonacademic) 1.9 2.3 4.3 3.3
OccupationManagerial/Professional 3.5 5.4 3.8 9.5Technical/Sales/ Administrative 11.7 34.8 9.9 31.0Service 12.8 15.2 9.9 11.9Farming 3.7 — 4.6 —Precision production/Craft/ Repair 19.7 5.4 26.8 4.8Operators/Fabricators/Laborers 48.6 39.2 45.0 42.9
Industry NA NAAgriculturea 3.4 —Construction 5.9 —Manufacturing 51.2 51.2Transportation 7.6 3.8Wholesale trade 4.2 1.3Retail trade 12.6 13.7Business and repair services 3.3 2.5Personal services 3.4 7.5Professional related services 6.7 17.5Public administration 1.7 2.5
N 460 440 143 184
Source: Little Village Household Survey. Note: Standard deviations in parentheses. NA = not available.
aIncludes landscaping and gardening work.
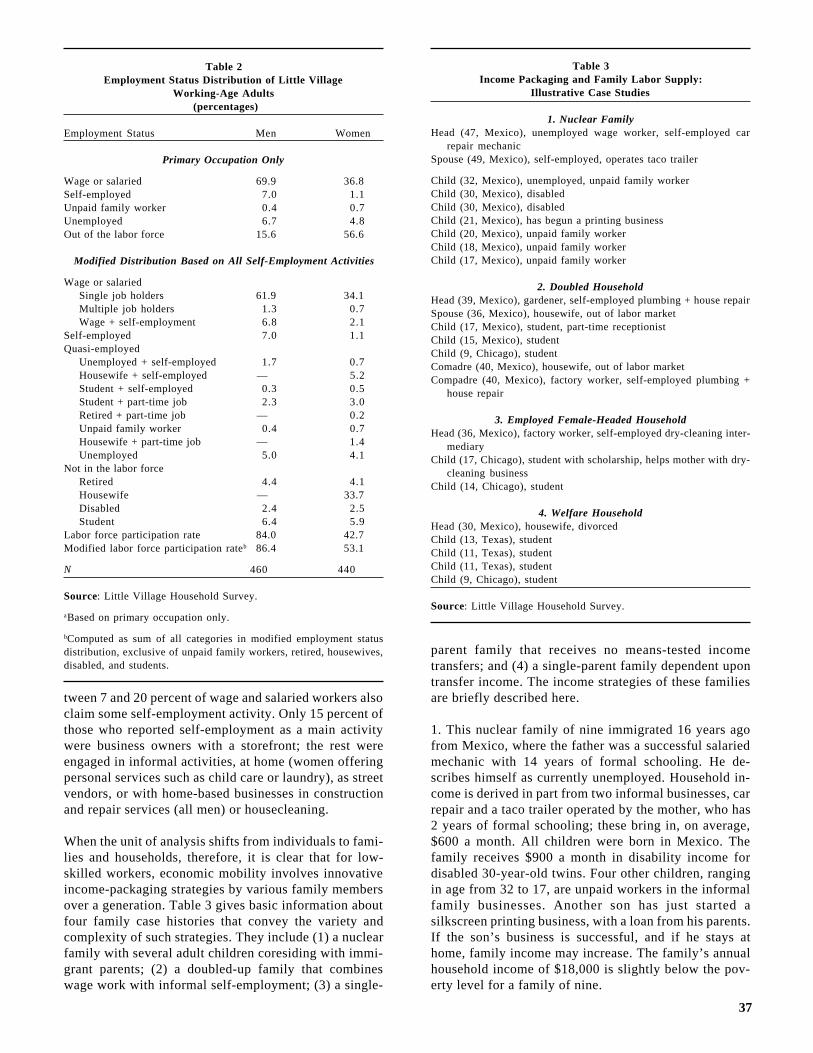
37
tween 7 and 20 percent of wage and salaried workers alsoclaim some self-employment activity. Only 15 percent ofthose who reported self-employment as a main activitywere business owners with a storefront; the rest wereengaged in informal activities, at home (women offeringpersonal services such as child care or laundry), as streetvendors, or with home-based businesses in constructionand repair services (all men) or housecleaning.
When the unit of analysis shifts from individuals to fami-lies and households, therefore, it is clear that for low-skilled workers, economic mobility involves innovativeincome-packaging strategies by various family membersover a generation. Table 3 gives basic information aboutfour family case histories that convey the variety andcomplexity of such strategies. They include (1) a nuclearfamily with several adult children coresiding with immi-grant parents; (2) a doubled-up family that combineswage work with informal self-employment; (3) a single-
parent family that receives no means-tested incometransfers; and (4) a single-parent family dependent upontransfer income. The income strategies of these familiesare briefly described here.
1. This nuclear family of nine immigrated 16 years agofrom Mexico, where the father was a successful salariedmechanic with 14 years of formal schooling. He de-scribes himself as currently unemployed. Household in-come is derived in part from two informal businesses, carrepair and a taco trailer operated by the mother, who has2 years of formal schooling; these bring in, on average,$600 a month. All children were born in Mexico. Thefamily receives $900 a month in disability income fordisabled 30-year-old twins. Four other children, rangingin age from 32 to 17, are unpaid workers in the informalfamily businesses. Another son has just started asilkscreen printing business, with a loan from his parents.If the son’s business is successful, and if he stays athome, family income may increase. The family’s annualhousehold income of $18,000 is slightly below the pov-erty level for a family of nine.
Table 2Employment Status Distribution of Little Village
Working-Age Adults (percentages)
Employment Status Men Women
Primary Occupation Only
Wage or salaried 69.9 36.8Self-employed 7.0 1.1Unpaid family worker 0.4 0.7Unemployed 6.7 4.8Out of the labor force 15.6 56.6
Modified Distribution Based on All Self-Employment Activities
Wage or salariedSingle job holders 61.9 34.1Multiple job holders 1.3 0.7Wage + self-employment 6.8 2.1
Self-employed 7.0 1.1Quasi-employed
Unemployed + self-employed 1.7 0.7Housewife + self-employed — 5.2Student + self-employed 0.3 0.5Student + part-time job 2.3 3.0Retired + part-time job — 0.2Unpaid family worker 0.4 0.7Housewife + part-time job — 1.4Unemployed 5.0 4.1
Not in the labor forceRetired 4.4 4.1Housewife — 33.7Disabled 2.4 2.5Student 6.4 5.9
Labor force participation rate 84.0 42.7Modified labor force participation rateb 86.4 53.1
N 460 440
Source: Little Village Household Survey.
aBased on primary occupation only.
bComputed as sum of all categories in modified employment statusdistribution, exclusive of unpaid family workers, retired, housewives,disabled, and students.
Table 3Income Packaging and Family Labor Supply:
Illustrative Case Studies
1. Nuclear FamilyHead (47, Mexico), unemployed wage worker, self-employed car
repair mechanicSpouse (49, Mexico), self-employed, operates taco trailer
Child (32, Mexico), unemployed, unpaid family workerChild (30, Mexico), disabledChild (30, Mexico), disabledChild (21, Mexico), has begun a printing businessChild (20, Mexico), unpaid family workerChild (18, Mexico), unpaid family workerChild (17, Mexico), unpaid family worker
2. Doubled HouseholdHead (39, Mexico), gardener, self-employed plumbing + house repairSpouse (36, Mexico), housewife, out of labor marketChild (17, Mexico), student, part-time receptionistChild (15, Mexico), studentChild (9, Chicago), studentComadre (40, Mexico), housewife, out of labor marketCompadre (40, Mexico), factory worker, self-employed plumbing +
house repair
3. Employed Female-Headed HouseholdHead (36, Mexico), factory worker, self-employed dry-cleaning inter-
mediaryChild (17, Chicago), student with scholarship, helps mother with dry-
cleaning businessChild (14, Chicago), student
4. Welfare HouseholdHead (30, Mexico), housewife, divorcedChild (13, Texas), studentChild (11, Texas), studentChild (11, Texas), studentChild (9, Chicago), student
Source: Little Village Household Survey.

38
Table 4Annual Income Packaging Strategies of Little Village Households
Income Source Amount ($) C.V. % Household Income % Households That Receive
Labor IncomeRespondent’s primary activity 10,123 1.0 43.2 62.6Other member's primary activity (mainly spouse) 8,601 1.2 36.7 54.2Informal self-employment + part-time jobsa 584 3.4 2.5 14.0Subtotal 19,308 82.4
Nonlabor IncomeMeans-testedb 691 3.1 2.9 17.9Other transfersc 1,927 2.1 8.2 25.9Rentd 1,231 2.5 5.2 23.6Interest 153 8.8 0.6 2.9Othere 141 4.6 0.6 7.7Subtotal 4,143 17.5
Total income 23,451 0.55 100.0
N 313
Source: Little Village Household Survey.
Note: C.V. = coefficient of variation.
aDerived from responses to “other ways of making money.”
bIncludes AFDC, food stamps, public assistance, and WIC.
cIncludes social security, disability, SSI, alimony, veterans’ benefits, educational grants and scholarships, and unemployment compensation.
dIncludes rent from apartments or rooms.
eIncludes gifts from friends and family residing elsewhere, contributions from community organizations, and nonsalary contributions of others in thehousehold.
2. The doubled-up family consists of parents with theirthree children and the children’s godparents. The parents(gardener with five years of schooling and housewifewith no formal schooling) and two older children immi-grated from Mexico 11 years ago; their youngest son isan American citizen. The godparents (factory worker andhousewife) arrived from Mexico 15 years ago. Both menwork together in an informal plumbing and home repairbusiness. The families share a house, but not a budget.When actively working as a gardener (employment ishighly seasonal), the father earns $1,000 a month; heestimates about $800 a month from the informal busi-ness, which provides a measure of income smoothingover the course of the year. The family receives $200 amonth in rent from the godparents. One daughter workspart-time as a receptionist. Annual income is just abovethe poverty threshold for a family of five.
3. The mother in this female-headed, self-sufficient fam-ily came from Mexico 18 years earlier; she has six yearsof formal schooling. She has a wage factory job and aninformal dry-cleaning business that involves pickup anddelivery for an established dry-cleaning business ownedby a friend in another suburb. Customers come throughfriend and family networks. One daughter helps in thisbusiness and also has an educational scholarship.Monthly income from the wage job is $1,500 (about$9.40 an hour). The dry-cleaning business provides an-other $50, the scholarship $167 a month. This income
places the family well above the poverty threshold for athree-person family.
4. The mother in this welfare-dependent family of fivedivorced one year ago and moved to Little Village to benear her brother. She came from Mexico 13 years earlier,and has six years of formal schooling. After the divorce,she began to receive AFDC to support her four childrenunder age 18 (all were born in the United States). Hermonthly stipend is $828; she receives $200 in foodstamps, but no housing subsidy. She receives no childsupport payments. She does not work, and one of thedaughters is ill. Her $12,336 annual income falls wellbelow the poverty threshold for a family of five.
These brief case studies reaffirm the importance of con-sidering various forms of self-employment and multiplejob holding when studying the economic well-being ofimmigrants. The vignettes do not, however, reveal howtypical is this kind of income packaging in the commu-nity. In Table 4, therefore, we list the multiple sources ofimmigrant household incomes, classified by labor andnonlabor origins. The mean household income of$23,415 supports 4.5 persons, on average. The rich vari-ety of nonlabor income sources is noteworthy: in particu-lar, rental income averages 5 percent of the family in-come package, and almost a quarter of the householdsdeclare this income source. Income from informal self-employment and part-time jobs represents a very small

39
share of average household income, but for the familiesinvolved in such activities, that income often means thedifference between being above or below the povertyline.
Immigrants’ use of transfer income is a subject of par-ticular interest in the light of the recent changes in eligi-bility. About one in four households in Little Villagereceived non-means-tested income transfers; less than 20percent received any sort of means-tested income.Means-tested transfers represent about 3 percent of totalhousehold income, other transfers (disability, social se-curity, alimony, scholarships, and the like) about 8 per-cent. To put the scale of transfer income into perspective,Table 5 disaggregates such income by source. Most ofthe households classified as receiving means-tested ben-efits only received food stamps (15 percent) and WIC (9percent), and the average amounts received were rela-tively low, $197 and $94, respectively. Over one-third ofall households received publicly subsidized medical ser-vices, but only 3 percent participated in AFDC, and 6percent received other public assistance. Participation innon-means-tested programs was lower, but monthly sti-pends were appreciably higher.
The average income of the households involved in infor-mal activities is similar to that of the general popula-tion—around $23,000 in 1994—and so is the share oftheir household income derived from labor. But the inter-nal distribution among the various labor sources differs.Households involved in informal activities derive rela-tively lower incomes from the formal labor market andseek informal opportunities to compensate. At the sametime, they are slightly more likely to receive means-tested income (20.5 versus 17.9 percent), and the averagetransfer is almost twice that of the total population($1,157 versus $691).
Conclusions
Conventional labor market approaches that assume onlyone job arrangement per worker obscure the role of infor-mal-sector work (especially informal self-employment)for earning a living. These activities were not capturedwhen we administered the conventional labor force statusquestions in our survey, suggesting that immigrant eco-nomic activities are underreported in most national sur-veys that rely exclusively on these types of measures. Ofparticular interest for understanding immigrants’ pros-pects for economic mobility is the linkage between infor-mal activities and small business ownership; it may bethat experience gained in informal work for compatriotsis an important stage in the path toward entrepreneurship.We are investigating this question in ongoing work.
For families involved in informal activities, nontrivialshares of total income are produced outside the formallabor market. This implies that, in national data sources,the household incomes of a subset of immigrant familiesmay be biased downward. Future data collection effortsshould consider how to capture such activities and theincome they generate when portraying family incomepackaging strategies. Annualized calculations presumerelatively stable employment, but in low-wage marketsnothing could be further from the truth, as we learnedfrom our follow-up calls to families in Little Village.
Data collection also needs to portray consumption rela-tive to the number of income producers—consumptionand production are not necessarily equivalent withinhouseholds. And analysts need to consider the extent towhich complex households—even family households—may or may not pool income. Our analyses were able toreveal highly complex income packaging strategies, butthey could not ascertain under which circumstances in-come pooling occurs, or when complex living arrange-ments justify the assumption that individuals share facili-t ies solely to benefit from economies of scale.Developing constructs that lend themselves to the studyof family labor supply is an essential prerequisite toanswering simple questions such as, “How do immi-grants make it in America?” n
1Of the 22.5 million foreign-born persons living in the United Statesin March 1994, 6.2 million came from Mexico. From 1990 censusdata, the median age of Mexican immigrants in the United States is 30years; the median age of all persons of Mexican origin is 24 years. OnMexican immigration to the United States, see also R. G. Rumbaut,“Origins and Destinies: Immigration, Race, and Ethnicity in Contem-porary America,” in Origins and Destinies, ed. S. Pedraza and R. G.Rumbaut (Belmont , CA: Wadsworth, 1996), pp. 21–42.
Studies of legalization authorized by the Immigration Reform andControl Act (IRCA) of 1986 indicate that 70 percent of those legal-ized under the amnesty program were of Mexican origin (M. Tienda,G. J. Borjas, H. Cordero-Guzmán, K. Neuman, and M. Romero, “The
Table 5Transfer Income Participation Rates: Little Village
Mean monthlyIncome Source % Participating payment ($)
Social security 15.4 614 (280)Disability 2.2 1,040 (679)SSI 1.9 368 (11)Alimony 1.9 378 (337)AFDC 3.1 412 (97)Subsidized housing — —Food Stamps 14.7 197 (127)Public assistance 5.9 267 (202)Unemployment compensation 5.3 722 (430)WIC 9.2 94 (72)Educational grants 6.2 520 (771)Medicaid/Medicare 37.5 NA
N 327
Note: Standard deviation in parentheses.

40
Demography of Legalization,” Final Report to the Office of the Assis-tant Secretary for Planning and Evaluation, U.S. Department ofHealth and Human Services, 1991; available as University of ChicagoPopulation Research Center Working Paper 91-4. Estimates of thenumbers of the undocumented are necessarily imprecise and weresometimes highly exaggerated. More than 3 million applications foramnesty were submitted to the Immigration and Naturalization Ser-vice by the end of the IRCA amnesty period in late 1988; see G.Vernez, “The United States Immigration Reform and Control Act of1986: Implementation and Effects,” in Migration Policies in Europeand the United States, ed. Giacomo Luciani (Dordrecht: Kluwer,1993), also available as RAND reprint RP-265. The INS estimatesthat there were 3.2 million illegal aliens in the United States inOctober 1992; 1 million of them were Mexican (INS, ImmigrationFact Sheet on World Wide Web site, November 13, 1996).
As for naturalization rates, U.S. Census figures for 1990 showapproximately 4.3 million persons of Mexican birth in the UnitedStates, 3.3 million of whom were not citizens (INS, Immigration FactSheet on the World Wide Web site, November 13, 1996). For avariety of reasons, including fear of loss of property rights in Mexico(under Mexican law, those who became citizens elsewhere lost theirMexican citizenship; this changed in December 1996), Mexicanshave traditionally been among the slowest immigrant groups to applyfor citizenship.
2Barry R. Chiswick, for example, using data from the 1970 Census(the first to include a question about year of immigration), concludedthat immigrants’ earnings would exceed those of comparably skillednatives within a generation; see “The Economic Progress of Immi-grants: Some Apparently Universal Patterns,” in Contemporary Eco-nomic Problems, ed. W. Fellner (Washington, D.C.: American Enter-prise Institute, 1979). George Borjas has criticized Chiswick’s view,arguing that relative educational differences between immigrants andnatives makes even parity unlikely; see, e.g., his Friends or Strang-ers: The Impact of Immigration on the U.S. Economy (New York:Basic Books, 1990).
3The research summarize here is reported in the following papers: M.Tienda and R. Raijman, “Forging Mobility: Immigrants’ Socioeco-nomic Progress in a Low-Wage Environment,” paper prepared for“America Becoming/Becoming American,” Social Science ResearchCouncil conference on immigration, Sanibel Island, FL, January 17–21, 1996; a briefer version of this paper is “Forging Mobility in a LowWage Environment: Mexican Immigrants in Chicago’s ‘Little Vil-lage’,” May 1996, Department of Sociology, University of Chicago.See also M. J. Rosenfeld and M. Tienda, “Labor Market Implicationsof Mexican Migration: Economies of Scale, Innovation, and Entre-preneurship,” unpublished paper, June 1996, Department of Sociol-ogy, University of Chicago.
4Chicago’s 1990 population was 40 percent African American, 20percent Hispanic, and 40 percent other races. The Little Villageneighborhood contained about 81,000 residents. Because there wereno preexisting listings of households, we first canvassed the entireneighborhood and then surveyed households taken from a completelisting of dwellings (N = 2104) in blocks drawn randomly from aclustered sample. From a sample size of 450 households, our bilin-gual interviewers completed 330 interviews. In contrast to most so-cial surveys, where upwards of 70 percent of respondents are women,44 percent of these respondents were men.
41
Public assistance use by immigrants: What can theU.S. Census tell us?Frank D. Bean, Jennifer W. W. Van Hook, and JenniferE. Glick
Frank D. Bean, Jennifer W. W. Van Hook, and JenniferE. Glick are in the Population Research Center at theUniversity of Texas at Austin.
U.S. immigration policy is explicitly designed to refuseimmigrant visas to persons likely to become “publiccharges.” Research that has found higher rates of welfarereceipt among immigrants than among natives has, there-fore, been taken as evidence of shortcomings in immigra-tion policies or welfare policies—and most likely inboth. It is of utmost concern that measurements of immi-grant and native welfare receipt accurately reflect realdifferences between these two groups and actually showwhich immigrants account for any differences observed.Yet such measurements, dogged by inadequate data, in-consistent definitions, and insufficient disaggregation,have themselves become the subject of controversy, asresearchers have resorted to estimations based upon dif-ferent and often challenged assumptions.
In a recent series of articles, we have elucidated both thedifficulties and the untapped possibilities of using censusdata and offered some solutions. Here we briefly de-scribe the methodology we have developed and reportthe conclusions we have reached regarding welfarerecipiency among immigrants.
Besides the lack of comprehensive and reliable data, wefind three reasons that comparisons of welfare receiptamong immigrants and natives may fail accurately tocapture the meaningful differences:
1. Census data are missing important information: theydo not, for instance, identify directly the program inwhich public assistance recipients are enrolled. Further-more, the reliability of the data is an issue: if, for in-stance, members of a group are systematically less likelyto report public assistance income or to be included in apopulation sample, then welfare receipt by that groupwill be undercounted.
2. Estimates of differences between immigrants and na-tives in welfare receipt may be influenced by varyingdefinitions of who is counted as an immigrant or a publicassistance recipient and by the choice of the unit ofanalysis. Should it be the household, the family, or theindividual?
3. The magnitude of differences between immigrants andnatives in welfare receipt depends upon the kind of im-migrant. Unless immigrants are disaggregated, the policyimplications cannot be meaningfully discerned.
How reliable are Census-based measures ofwelfare recipiency?
Data from the U.S. Census are critical to the study ofimmigrant populations, for most other data sources donot contain large enough samples of immigrants for reli-able analysis. This is especially so if immigrants aredisaggregated by national origin—an essential strategy,given the varying modes of entry and socioeconomicdifferences among immigrant groups.1 (We discuss thisfurther below.)
The usefulness of estimates based on the Census de-pends, first, upon their accuracy: the extent to whichcensus data are affected by reporting error, omissions, oruneven and incomplete coverage and response. Second,it depends upon whether it is possible to determine theparticular program in which an immigrant family or indi-vidual is enrolled from census data which lump togethercash income from the three main welfare programs, Aidto Families with Dependent Children (AFDC), Supple-mental Security Income (SSI), and General Assistance(GA).
The bulk of welfare recipients receive transfer paymentsfrom one of two programs, AFDC or SSI, which havedifferent sets of eligibility requirements. We have devel-oped and tested a procedure for using these eligibilitycriteria as a basis for classifying welfare recipients underone of the three public assistance programs. Because ofthe small size of the GA population and the great varia-tion in state programs, we focused primarily on estimat-ing AFDC and SSI recipiency.
AFDC. To estimate AFDC recipiency with census data,we used the presence of children in the recipient’s imme-diate family as a marker for AFDC receipt. Because in allstates some married couples are eligible for AFDC andbecause caretakers of foster children may receive AFDC,we did not limit recipients to single parents, nor did werequire that the children in the recipient’s family be therecipient’s own children.
SSI. SSI is limited to the elderly poor, the blind, and thedisabled. Thus we classified recipients who were eitherdisabled or over 65 as receiving SSI.

42
To validate these procedures, we relied upon data ob-tained from smaller sources with more detailed informa-tion about public assistance receipt: the National Longi-tudinal Survey of Youth (NLSY), the Survey of Incomeand Program Participation (SIPP), and the Current Popu-lation Survey (CPS). We used the 1989 wave of theNLSY and the 1988 panel of the SIPP to acquire informa-tion about the timing of AFDC and SSI receipt, respec-tively. We used data on AFDC and SSI receipt from the1990 and 1994 March CPS supplements to assess ourCensus-based estimates. Beginning in 1994, the CPSasked questions about nativity, thus allowing us to com-pare the accuracy of the Census-based estimates for bothnatives and immigrants.
Further, assuming that administrative records obtaineddirectly from the agencies that manage state and federalwelfare programs are relatively free of measurement er-ror, we compared the Census-based estimates with fed-eral administrative records of the numbers of recipients.We found that federal administrative reports of the num-bers and characteristics of recipients differed systemati-cally in a number of ways from the Census-based esti-mates of public assistance. We therefore madeadjustments to Census estimates to make them compa-rable with the administrative records. For example, ad-ministrative records of the number of AFDC and SSIrecipients include child recipients, but in the Census,children younger than 15 are not identified as recipientsof public assistance income. To adjust for this discrep-ancy, we classified as AFDC recipients those child de-pendents who lived in households where the residentialadult was an AFDC recipient.2 A second problem is thatAFDC recipients tend to receive payment for short spells,many lasting less than a year. Thus we adjusted theCensus estimates of the number receiving AFDC, usingtotal public assistance income for the year and calcula-tions from NLSY data for 1989 to estimate averagemonths of AFDC recipiency. But the characteristics ofage or disability that rendered SSI recipients eligible inthe first place are unlikely to change. Once on SSI, theyare unlikely to leave; thus census data do not need to beadjusted for differences in the time period of measure-ment, in order to be compared with administrative data.In both programs, a final adjustment was made for Cen-sus undercount, but in neither case did this representmore than a trivial change.
How did the adjusted estimates produced from censusdata compare with administrative estimates? For AFDC,SSI, and GA combined, data from the 1990 Census 5 per-cent Public Use Microdata Samples (PUMS) identifyabout 84 percent of the adult recipients and 63 percent ofthe child recipients and dependents identified from ad-ministrative data. For AFDC, the Census-basedrecipiency measure detects about 69 percent of adultrecipients in 1989: 55 percent of black recipients, 59 and69 percent of Hispanic and Asian recipients, respec-tively, and about 80 percent of non-Hispanic whites. The
average is only about half a percentage point less than theactual percentage of recipients in the U.S. population.For SSI, the Census estimates capture 96 percent of thepeople who, according to administrative data, receivedSSI in 1989.
Thus the Census appears to provide particularly goodapproximations for SSI recipiency, less so for AFDC.But although the AFDC measure does not provide a veryadequate assessment of the levels of recipiency, it isnonetheless useful for studying group differentials andtrends over time.3
Nativity differences in public assistancereceipt: Does it matter what the unit ofanalysis is?
Estimates of the difference in public assistance use be-tween the native-born and immigrants are materially af-fected by the varying definitions used. We comparedimmigrant and native rates of public assistancerecipiency using the three common units of analysis: thehousehold, the family, and the individual. We furtherestimated the amount of the differential in household-and family-level recipiency that is due to differences inindividual rates between immigrants and natives. Usingthe techniques described above, we also made estimatesseparately for AFDC and SSI.
The unit of analysis
Research clearly shows that welfare receipt by immigranthouseholds has surpassed that of native households overthe last three decades. Such research has typically de-fined a “recipient household” as a household containingone or more recipients, and an “immigrant household” asone headed by an immigrant. Use of the household or the“family-household” as the unit of analysis is in part dic-tated by the nature of the data.4 In the large datasets onwhich researchers into immigration issues must rely—the Census, the CPS, the SIPP—a single person in thehousehold is asked to provide information about otherhousehold members. This person may mistakenly believethat public assistance is being received by only one per-son, when in fact several household members may do so.The Census does not record whether children under 15are welfare recipients, and this is also likely to result inan underestimate of the number of individual recipients.Thus the household has seemed the most reliable unit,and the most conceptually appropriate one; householdsand families are usually the relevant consumption unit,and families rather than individuals constitute the unitused to determine eligibility for AFDC.
There are several problematic aspects of analysis at thehousehold or family level. Differentials in welfare use atthese levels derive not only from differences in indi-vidual rates of use, but also from differences in house-

43
hold or family size and in the extent to which recipientscluster within these units. Thus analyses that comparewelfare receipt of immigrant and native populations atthe household or family level may yield conclusions con-tradictory to those reached by individual-level compari-sons.
Our comparisons of welfare receipt using these threeunits of analysis are made for 1980–1995, years duringwhich the household differential increased dramatically.We do not use the “family-household” definition. In-stead, we count the householder’s family and subfamiliesliving in multifamily households as separate familyunits.
Another definitional issue is the classification of native-born children of immigrants. It is not immediately clearwhether classifying them as immigrants will raise orlower the immigrant–native differential, so we make twoestimates. In the first estimate, native-born children arecounted as natives—they are U.S. citizens and entitled toall benefits of that status, including public assistance. Inthe second estimate, the children are counted as immi-grants—their presence in the United States and subse-quent welfare receipt are a direct result of their parents’migration, and the benefits for which they are eligiblealso support the immigrant parents who are legally re-sponsible for them.
Household, family, and individual recipiency
If two groups experience the same individual level ofwelfare receipt, the group that has its population clus-tered into larger households will have a higher house-hold-level rate. In comparing immigrant with native lev-els of receipt, the household size of immigrants ismeasured as the average number of immigrants perhousehold and the household size of natives as the aver-
age number of natives per household. Using this defini-tion of household size, immigrant households are smallerthan those of natives.5 This difference alone may makeimmigrant household recipiency lower than that of na-tives. However, if the welfare recipients in one group areheavily clustered within households, that group willshow a lower household-level rate than one in which theyare more evenly distributed. Thus household size andclustering of recipients have counteracting effects. Immi-grants tend to have lower levels of recipient clusteringthan natives.6 This difference will lead to higher levels ofhousehold recipiency among immigrants and may coun-terbalance the effect of the nativity difference in house-hold size.
Table 1 shows rates of public assistance receipt amongimmigrants and natives for the years 1979, 1989, and1993–94. For all public assistance combined, the differ-ential is largest for households and moderate for families,but negative or close to zero for individuals. Moreover,over the years the household and family differentialsgrew many times larger, whereas the individual differen-tial scarcely changed. In considering particular pro-grams, we see that at each point in time, immigrant levelsof welfare use are highest when the household is the unitof analysis, lowest when the individual is used. Thechoice of the unit of analysis clearly affects evaluation ofimmigrant welfare receipt, though more strongly forAFDC than for SSI.
Our calculations further suggest that for welfare use ingeneral and for AFDC, the comparatively high immi-grant household-level rates can be explained entirely bydifferences in household size and recipient clustering.These differences are so large that the observed house-hold-level differential masks the fact that immigrantshave lower individual rates of welfare use. For AFDC,
Table 1Household, Family, and Individual Rates of Public Assistance Receipt among Immigrants and Natives
(in percentages)
All Cash Welfare _ AFDC _ SSI _Year and Unit of Analysis Immigrant Native Immigrant Native Immigrant Native
1980 CensusHousehold 8.0 7.7 2.7 3.4 5.1 3.9Family 7.1 7.1 2.2 3.1 4.6 3.6Individual 5.3 5.5 2.2 3.7 2.9 1.6
1990 CensusHousehold 8.7 7.5 3.4 3.2 5.1 4.0Family 6.9 6.7 2.6 2.9 4.1 3.5Individual 5.4 5.6 2.5 3.8 2.7 1.7
1994/95 March CPSHousehold 10.6 8.1 4.6 3.8 4.9 3.8Family 9.2 7.6 4.0 3.5 4.3 3.4Individual 7.6 7.3 3.7 4.9 3.1 2.1
Source: 1980 and 1990 U.S. Census 1 percent Public Use Microdata Samples, 1994 and 1995 March Current Population Surveys.
Note: Children are counted according to their own country of birth, not that of their parents.
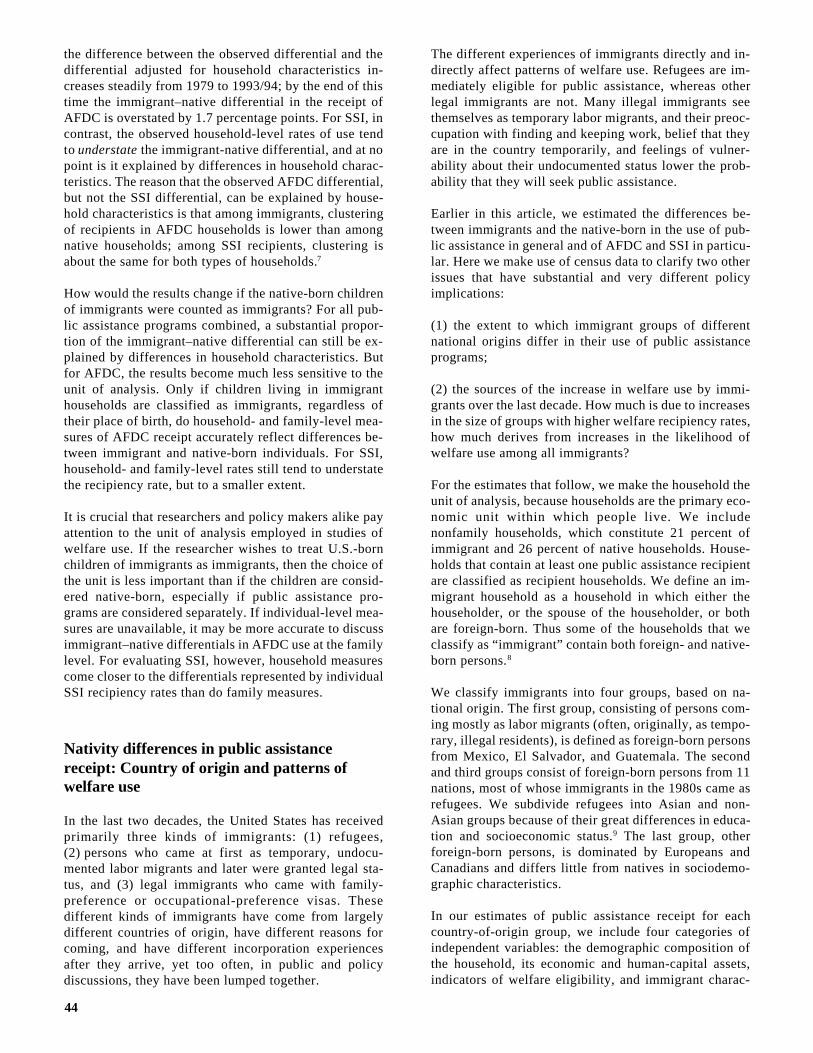
44
the difference between the observed differential and thedifferential adjusted for household characteristics in-creases steadily from 1979 to 1993/94; by the end of thistime the immigrant–native differential in the receipt ofAFDC is overstated by 1.7 percentage points. For SSI, incontrast, the observed household-level rates of use tendto understate the immigrant-native differential, and at nopoint is it explained by differences in household charac-teristics. The reason that the observed AFDC differential,but not the SSI differential, can be explained by house-hold characteristics is that among immigrants, clusteringof recipients in AFDC households is lower than amongnative households; among SSI recipients, clustering isabout the same for both types of households.7
How would the results change if the native-born childrenof immigrants were counted as immigrants? For all pub-lic assistance programs combined, a substantial propor-tion of the immigrant–native differential can still be ex-plained by differences in household characteristics. Butfor AFDC, the results become much less sensitive to theunit of analysis. Only if children living in immigranthouseholds are classified as immigrants, regardless oftheir place of birth, do household- and family-level mea-sures of AFDC receipt accurately reflect differences be-tween immigrant and native-born individuals. For SSI,household- and family-level rates still tend to understatethe recipiency rate, but to a smaller extent.
It is crucial that researchers and policy makers alike payattention to the unit of analysis employed in studies ofwelfare use. If the researcher wishes to treat U.S.-bornchildren of immigrants as immigrants, then the choice ofthe unit is less important than if the children are consid-ered native-born, especially if public assistance pro-grams are considered separately. If individual-level mea-sures are unavailable, it may be more accurate to discussimmigrant–native differentials in AFDC use at the familylevel. For evaluating SSI, however, household measurescome closer to the differentials represented by individualSSI recipiency rates than do family measures.
Nativity differences in public assistancereceipt: Country of origin and patterns ofwelfare use
In the last two decades, the United States has receivedprimarily three kinds of immigrants: (1) refugees,(2) persons who came at first as temporary, undocu-mented labor migrants and later were granted legal sta-tus, and (3) legal immigrants who came with family-preference or occupational-preference visas. Thesedifferent kinds of immigrants have come from largelydifferent countries of origin, have different reasons forcoming, and have different incorporation experiencesafter they arrive, yet too often, in public and policydiscussions, they have been lumped together.
The different experiences of immigrants directly and in-directly affect patterns of welfare use. Refugees are im-mediately eligible for public assistance, whereas otherlegal immigrants are not. Many illegal immigrants seethemselves as temporary labor migrants, and their preoc-cupation with finding and keeping work, belief that theyare in the country temporarily, and feelings of vulner-ability about their undocumented status lower the prob-ability that they will seek public assistance.
Earlier in this article, we estimated the differences be-tween immigrants and the native-born in the use of pub-lic assistance in general and of AFDC and SSI in particu-lar. Here we make use of census data to clarify two otherissues that have substantial and very different policyimplications:
(1) the extent to which immigrant groups of differentnational origins differ in their use of public assistanceprograms;
(2) the sources of the increase in welfare use by immi-grants over the last decade. How much is due to increasesin the size of groups with higher welfare recipiency rates,how much derives from increases in the likelihood ofwelfare use among all immigrants?
For the estimates that follow, we make the household theunit of analysis, because households are the primary eco-nomic unit within which people live. We includenonfamily households, which constitute 21 percent ofimmigrant and 26 percent of native households. House-holds that contain at least one public assistance recipientare classified as recipient households. We define an im-migrant household as a household in which either thehouseholder, or the spouse of the householder, or bothare foreign-born. Thus some of the households that weclassify as “immigrant” contain both foreign- and native-born persons.8
We classify immigrants into four groups, based on na-tional origin. The first group, consisting of persons com-ing mostly as labor migrants (often, originally, as tempo-rary, illegal residents), is defined as foreign-born personsfrom Mexico, El Salvador, and Guatemala. The secondand third groups consist of foreign-born persons from 11nations, most of whose immigrants in the 1980s came asrefugees. We subdivide refugees into Asian and non-Asian groups because of their great differences in educa-tion and socioeconomic status.9 The last group, otherforeign-born persons, is dominated by Europeans andCanadians and differs little from natives in sociodemo-graphic characteristics.
In our estimates of public assistance receipt for eachcountry-of-origin group, we include four categories ofindependent variables: the demographic composition ofthe household, its economic and human-capital assets,indicators of welfare eligibility, and immigrant charac-

45
teristics and race or ethnicity. Table 2, which reportspublic assistance trends among the different immigrantgroups, shows that the rise in public assistance receipt isconcentrated among Asian refugees and Mexican/Cen-tral American immigrants. Over 90 percent of the in-crease during the decade is due to sharply rising numbersof Asian refugees and Mexican/Central American immi-grants rather than to changes in the prevalence of welfareuse within these groups. Among immigrants in the“other” category, use in fact declines.
We have already seen that the immigrant–native differ-ential in welfare receipt widened for both AFDC and SSI.Table 2 also includes estimates for these two programsby country of origin. Again, increases in AFDCrecipiency are largely due to increases in the numbers ofMexican/Central American immigrants and Asian refu-gees rather than to large changes in recipiency withinthese groups. Levels of SSI receipt declined for all immi-grant subgroups except the two refugee groups, thoughthe dramatic increases in the relative size of the Mexican/Central American immigrant group and the Asian refu-gee group contributed to the increase in total SSI levels.
How much of the nativity difference in recipiency isexplained by nativity differences in characteristics? Ouranalyses have suggested that if immigrants had the samesociodemographic characteristics as natives, the AFDCrecipiency rate for all groups would be below the rate for
native-born households in both 1979 and 1989. For SSI,the recipiency rate would be lower in 1979, but not in1989. The contribution of Mexican/Central Americangroups to the higher SSI rates derives from force ofnumbers, but the proclivity of Asian refugees to use SSImore than doubles between 1980 and 1990.
Conclusions
These findings suggest that blanket restrictions on U.S.immigration may be an inappropriate tool for copingwith increases in immigrant welfare recipiency. The risein immigrant welfare recipiency during the 1980s derivesin most part from larger numbers of Asian refugees in-creasingly receiving SSI; to the extent that this representsa problem, it is a problem of refugee policy or SSI eligi-bility, rather than of U.S. policies for legal immigration.
The results also demonstrate how sheer force of numberscan affect public assistance changes. The policy implica-tions of this depend upon where the increase appears.Mexican/Central American immigrants, for example,perhaps because of their history as undocumented labormigrants, are not especially welfare-prone; their usage ofwelfare does not increase over the 1980s. But eventhough they are less likely than statistically comparablenatives to use AFDC, the increase in their numbers overthe 1980s raised overall welfare recipiency. This result
Table 2Public Assistance Recipiency among Immigrant Households by Region of Origin
1980 Census _ 1990 Census _ Part of Change due to Change inProgram and % of All % Receiving % of All % Receiving Rate of PublicCountry-of-Origin Immigrant Public Immigrant Public AssistanceGroup Households Assistance Households Assistance Group Size Recipiency
All Cash Public AssistanceMexican, Guatemalan, and
Salvadoran immigrants 13.6 12.0 20.0 11.7 0.75 -0.06Asian refugees 0.8 28.7 2.5 32.7 0.54 0.07Non-Asian refugees 12.4 10.1 10.8 11.8 -0.18 0.20Other immigrants 73.2 6.7 66.8 6.5 -0.42 -0.14All immigrant households 100.0 8.0 100.0 8.7 0.69 0.07
AFDCMexican, Guatemalan, and
Salvadoran immigrants 2.7 6.7 0.41 0.10Asian refugees 6.1 22.8 0.39 0.01Non-Asian refugees 22.1 2.3 -0.03 0.07Other immigrants 1.7 2.0 -0.13 0.00All immigrant households 2.0 3.5 0.64 0.18
SSIMexican, Guatemalan, and
Salvadoran immigrants 5.9 5.0 0.35 -0.15Asian refugees 5.9 13.6 0.17 0.13Non-Asian refugees 8.0 9.3 -0.14 0.16Other immigrants 4.4 4.2 -0.28 -0.15All immigrant households 5.1 5.1 0.10 -0.02
Source: 1980 and 1990 U.S. Census 1 percent Public Use Microdata Samples. Percentages may not add because of rounding.
Note: Children are counted according to their own country of birth, not that of their parents.

46
could as readily point toward a need to reform bordercontrol and employment policies as to reduce levels oflegal immigration. For example, better border manage-ment and increased enforcement of employer sanctionsmight limit undocumented migration and the kinds oflegal immigration that derive from it, such as familyreunification after legalization, thus reducing welfare us-age as numbers decline.10 Curtailing undocumented mi-gration, however, is a far cry from calls for more generalrestrictions upon immigration. n
1The research summarized in this article is reported in J. V. W. VanHook, F. D. Bean, and J. E. Glick, “The Development and Assessmentof Census-Based Measures of AFDC and SSI Recipiency,” Journal ofEconomic and Social Measurement 22 (1996): 1–23; J. V. W. VanHook, J. E. Glick, and F. D. Bean, “Nativity Differences in PublicAssistance Receipt: What Difference Does the Unit of AnalysisMake?” unpublished ms., University of Texas at Austin, PopulationResearch Center, May 1996; F. D. Bean, J. V. W. Van Hook, and J. E.Glick, “Country-of-Origin, Type of Public Assistance and Patterns ofWelfare Recipiency among U.S. Immigrants and Natives,” SocialScience Quarterly, forthcoming.
2Disabled children under 15 are not identified as disabled, so somechild recipients of SSI will be wrongly classified as AFDC recipients.This results in slight overestimates of AFDC recipients in the 1990Census data, but large underestimates of SSI child recipients. Theproblem is not critical for 1989, but since then, the number of childrecipients of SSI has increased dramatically.
3As an example: unadjusted levels of AFDC receipt in 1989 are 3.5percent for immigrant households, 3.2 percent for native house-holds—a difference of 0.3 percent. Adjustments for race/ethnic dif-ferences in reporting and for duration of receipt increase that differ-ential to 0.5 percent; final adjusted estimates from census data show4.3 percent of immigrant households and 3.8 percent of native house-holds as AFDC recipients.
4“Family-households” exclude households consisting of single indi-viduals or unrelated adults.
5In the 1980 Census, the size of the average immigrant household was1.7, of the native-born household, 2.7 persons. In the 1990 Census,average immigrant household size was 2.0, native-born 2.5 persons(authors’ calculations from the 1980 and 1990 Census 1 percentPUMS).
6In 1980, immigrant recipient households contained an average of 1.1immigrant recipients, whereas native recipient households containedan average of 1.9 native recipients. The corresponding figures in1989 were 1.2 for immigrants and 1.9 for natives, and in 1994–95, 1.4for immigrants and 2.2 for natives.
7In the 1994/95 CPS data, immigrant households averaged 1.6 AFDCrecipients per recipient household, native households averaged 3.2recipients. For SSI, comparable figures were 1.2 and 1.4 recipientsper recipient household for immigrants and natives, respectively.
8Because foreign students tend to be temporary resident aliens, weexclude households in which the head is both foreign-born and en-rolled in postsecondary school.
9“Refugee” countries are the former U.S.S.R., Poland, Romania, Iran,Ethiopia, Afghanistan, Vietnam, Laos, Cambodia, Cuba, and Nicara-gua. Almost 90 percent of all refugee arrivals to the United States inthe 1980s came from these 11 countries, and over 91 percent ofpersons coming from these countries came as refugees.
10Provisions of the September 1996 immigration legislation called forexpanded efforts at border control but few changes in the area ofemployer enforcement.

47
Immigrants and welfare: Evidence from theSurvey of Income and Program ParticipationGeorge J. Borjas and Lynette Hilton
George J. Borjas is a Professor of Public Policy in theJohn F. Kennedy School of Government at Harvard Uni-versity; Lynette Hilton is an economist at Micronomics,Inc., Los Angeles.
In 1970, when the U.S. Census first reported whetherhouseholds receive cash welfare benefits, immigranthouseholds were slightly less likely than native house-holds to receive such benefits.1 In 1990, however, 9.1percent of immigrant households enumerated in the Cen-sus received cash public assistance, compared to only 7.4percent of native households. Such findings have fueledpublic anxieties over immigration policy and played alarge part in the provisions excluding legal immigrantsfrom federal welfare programs that were included in thewelfare reform bill signed by President Clinton in August1996.
The difference in immigrant–native rates of participationin cash welfare benefits is not numerically large. TheCensus, however, does not provide information on non-cash transfers such as food stamps, Medicaid, and hous-ing subsidies, and it reports only whether a householdreceived cash benefits during a given calendar year. Thusit cannot tell us whether the higher immigrant recipiencyrates that it shows result from a higher incidence ofimmigrants on welfare, or from immigrants havinglonger spells on welfare. The distinction is important: thepolicy implications of an immigrant population in whichmany households are long-term welfare recipients differsubstantially from the implications of an immigrantpopulation with a high probability of short-term welfarereceipt.
In recent research, we used the Survey of Income andProgram Participation (SIPP) to provide a more completepicture of immigrant participation in the wide array ofmeans-tested entitlement programs that have, over thelast thirty years, constituted the American welfare state.The SIPP is a panel survey that interviews each partici-pant every four months about his or her economic experi-ences, including income received from means-testedbenefit programs. It also asks where each respondent wasborn and, if born abroad, the year of arrival in the UnitedStates. In our analysis, we classified as immigrants allpersons born abroad, whether naturalized citizens of theUnited States or not (all others are classified as natives).2
We restricted our analysis to those who were household-
ers in the first month of the sample, and followed thehousehold’s welfare participation history over the 32months for which it participated in the sample. The datawe drew upon are pooled 1984–85 and 1990–91 panelsof the SIPP.
We reached three conclusions: First, research that fo-cuses upon cash benefits gives a misleading picture ofthe extent to which immigrants receive benefits. The“welfare gap” between immigrants and natives is muchlarger when other programs are included. Second, immi-grant households experience more and longer welfarespells, spending a relatively larger fraction of their timeparticipating in some means-tested programs than do na-tive households. Third, the types of welfare benefits re-ceived by earlier immigrant waves influence the types ofbenefits received by newly arrived immigrants, suggest-ing the existence of networks of information within eth-nic communities about the availability of particular typesof benefits to new immigrants.
Immigrant participation in means-testedprograms
Immigrant households, we found, were more likely toparticipate in almost all the major means-tested pro-grams, both noncash and cash. In the early 1990s, forinstance, 20.7 percent of immigrant households receivedeither cash benefits, Medicaid, vouchers (mainly foodstamps), or housing subsidies, compared with 14.1 per-cent of native households. The data also reveal that theimmigrant–native welfare gap rose rapidly during thelast half of the 1980s. In the mid-1980s, 8.4 percent ofnative households and 11 percent of immigrant house-holds participated in Medicaid—a gap of 2.6 percentagepoints. By the early 1990s, the gap had widened to 6percentage points. Table 1 compares use by immigrantand native households of particular welfare programs.We used the household as the unit of analysis partlybecause the benefits received in some welfare programsare reported in the SIPP only at the household level, andalso because country of birth, and hence immigrationstatus, is identified only for persons aged 15 or over.Immigrant households, however, are slightly larger thannative households, averaging 3.2 persons compared to2.6 persons for native households. Thus the probabilitythat a particular immigrant household is “welfare-prone”could be large even if the probability of welfare use doesnot differ greatly between native-born and immigrantindividuals.3

48
Cost of benefits received
The SIPP reports the dollar value of cash benefits andvouchers received, but there is no information on thevalue of Medicaid services, housing subsidies, or schoolmeal subsidies. We used state and national administra-tive data to impute a dollar amount received by a house-hold under each of these programs. To calculate the valueof the benefits received under Medicaid, for example, wemultiplied the number of persons in the household cov-ered under Medicaid by state estimates of the cost perrecipient. In the early 1990s, immigrant households con-tained 8.8 percent of all persons in the country yet, basedupon SIPP data, they accounted for 13.8 percent of thecosts of AFDC, Supplemental Security Income (SSI), theFood Stamp program, Medicaid, and subsidized schoolmeals.
Differences among immigrant households
From the SIPP data, some immigrant groups showed amuch higher propensity to use welfare than others. About36 percent of households originating in Mexico, 42 per-cent of those in the former Soviet Union, and 50 percentof those originating in the Dominican Republic receivedsome type of benefit (cash benefits, Medicaid, vouchers,or housing subsidies). Among native groups with highparticipation rates, 33 percent of Hispanic natives and 39percent of black natives participated in some welfareprogram.
Does the difference between refugee and nonrefugeehouseholds explain the high welfare usage rates? TheSIPP data do not report whether a particular householdentered the United States with a refugee visa; thus weassumed that immigrants originating in the main refugee-sending countries were refugees.4 Rates for refugeeswere certainly higher: of the 312 households so identi-
fied in the 1990–91 SIPP, 29.9 percent were receiving atleast one of the cash or noncash benefits, compared to25.5 percent of nonrefugee immigrants (2,137 house-holds). Both rates are substantially larger than the 14.1percent of native households that participated in somewelfare program.
Time spent on welfare
Using a definition of welfare that included cash benefits,Medicaid, and vouchers, we found, from the 1990–91SIPP data, that 68.7 percent of immigrant households didnot participate in any of these programs at any timeduring the 32-month period they were included in thepanel. Among native households, 77.3 percent never par-ticipated. Moreover, 10.3 percent of the immigranthouseholds received welfare benefits throughout the en-tire 32-month period, as compared to only 7.3 percent ofnative households. We also calculated that in the early1990s, immigrant households had a 24.2 percent prob-ability of experiencing one spell of welfare, and a 7.2percent probability of experiencing at least two spells;the probabilities for native households were 17.8 percentand 5.9 percent, respectively. Thus immigrants weremore likely to be exposed to the welfare system and alsomore likely to become long-term recipients.
Analyzing the differences between immigrants andnatives
Do differences in observable demographic characteris-tics between native and immigrant households in theSIPP explain the welfare gap and the growth in immi-grant recipiency between the mid 1980s and early 1990s?We estimated that differences in household composition,including the age and gender of its members, account for1–2 percentage points of the gap. Adding variables forsocioeconomic background, including the age, educa-tion, and gender of the householder, helps explain an-other 2–3 percentage points. In other words, the immi-grant households tended to receive more welfare notbecause they were immigrants, but because their socio-economic characteristics were highly correlated withwelfare use. When the unemployment rate of the immi-grant household’s state of residence, and the race andnational origin of household members were incorporatedinto the analysis, the welfare gap between immigrant andnative households was reduced, in sum, by about 5 per-centage points.
Analyzing the differences among immigrant groups
Although differences in observable socioeconomic char-acteristics explain why the “typical” immigrant house-hold is more likely to receive welfare than the “typical”native household, there are, as already noted, many dif-ferences within the immigrant population. Earlier re-search with synthetic cohorts created from census datahas suggested that more recent immigrant cohorts aremore likely to participate in welfare programs than ear-lier cohorts and also that immigrants in a particular co-
Table 1Average Monthly Probability that Household
Is Receiving Benefits (in percentages)
1984–85 _ 1990–91 _Benefit Native Immigrant Native Immigrant
Cash BenefitsAFDC 2.8 2.6 2.9 4.4SSI 3.7 5.1 3.7 6.5General Assistance 0.9 1.0 0.6 0.8
Noncash ProgramsMedicaid 8.4 11.0 9.4 15.4Food stamps 6.6 7.6 6.5 9.2WIC 1.4 1.8 2.0 3.0Energy assistance 2.9 2.8 2.3 2.1Housing assistance 4.0 5.7 4.4 5.6School meals 5.7 10.1 6.2 12.5
No. of households 12,630 914 25,340 2,449
Source: Survey of Income and Program Participation, 1984, 1985,1990, and 1991.

49
hort are more likely to receive benefits the longer theyhave lived in the United States.5 These trends were alsoobservable among immigrant households in the SIPP. Wefound, first, that the welfare participation rate of thosewho migrated after 1985 exceeded the welfare participa-tion rate of those who entered the United States in theearly 1970s by about 15 percentage points. Second, theprobability of welfare receipt among immigrant house-holds increased by about 4 percentage points, relative tothe native-born, over the five-year period during whichthe family was followed. Finally, immigrant householdsthat arrived in the United States at a later point in the lifecycle were more likely to receive welfare benefits.6
These differences remained even after demographiccharacteristics such as household size and composition,the householder’s socioeconomic characteristics, state ofresidence, race, and national origin were taken into con-sideration. We concluded that changes in such character-istics accounted for only about half of the cohort effectsseen between the early 1960s and early 1980s.
The trend among recent immigrants toward greater wel-fare participation was strongest for Medicaid. The prob-ability of Medicaid coverage for immigrants who arrivedafter 1985 exceeded the probability for immigrants whoarrived between 1970 and 1974 by 15.8 percent. Therealso existed an aging effect: relative to natives, the prob-ability that an immigrant household received Medicaidbenefits increased by 4.9 percent over a five-year period.
Networks, national origin, and welfareparticipation
The SIPP data show that some immigrant groups appearto be disproportionately represented in particular pro-grams. For example, even though Mexican immigrantswere 50 percent more likely to receive energy assistancethan Cuban immigrants, Cuban immigrants were morelikely to receive housing subsidies. Anecdotal evidencesuggest that ethnic communities transmit some informa-tion regarding welfare programs to potential or newlyarrived immigrants. We investigated this possibility byexamining the extent to which the participation of newlyarrived immigrants in particular programs dependedupon the participation history of the existing immigrantstock of the same national origin. There existed positiveand significant correlations: after holding constant thehousehold’s demographic background, the overall pro-pensity of the national-origin group to receive some typeof welfare benefit, and the generosity of the state ofresidence, we found that the more “exposed” a group hadbeen to participation in a particular program in the past,the larger the likelihood that new immigrants from thesame group were also participating in that program. Theevidence from the SIPP suggests that a 10-percentage-point increase in the fraction of the immigrant stock whoreceive a particular program implies about a 10-percent-age-point increase in the probability that a newly arrived
immigrant also receives benefits from that program. Thenetworks of job information and hiring practices withinethnic communities have long been a familiar part of theAmerican scene. Even granted the difficulty of allowingfor all the possible factors that might affect a recentimmigrant household’s decision to apply for a particularprogram, these findings are consistent with the existenceof networks of welfare information within the immigrantcommunity, organized along ethnic lines.
Limitations of the SIPP data
The empirical evidence reported here has clear policyimplications, but it has limitations. The short sampleperiod in the SIPP precludes a full analysis of the dynam-ics of welfare dependency among both immigrant andnative households. Little is known, moreover, about eco-nomic and social outcomes, and hence welfare depen-dency, among second-generation Americans. Nor did weanalyze the net economic impact of immigrant welfarerecipiency; such “accounting exercises” are largely be-side the point. To assess the net impacts of the trends inimmigrant receipt of welfare, one must account for thelong-run benefits of such programs as subsidized mealsor the Women, Infants and Children nutrition program(WIC) in improving the health of immigrant children. Atthe same time, it is necessary to determine whether wel-fare programs reduce the work incentives of current im-migrants or change the nature of the immigrant flow byinfluencing the migration decisions of potential immi-grants. n
1This article summarizes the paper by George J. Borjas and LynetteHilton, “Immigration and the Welfare State: Immigrant Participationin Means-Tested Entitlement Programs,” Quarterly Journal of Eco-nomics 111, no. 2 (May 1996): 575–604, which is used here bypermission.
2From Table 2, on p. 4, about 31 percent of the foreign-born werenaturalized citizens in 1994.
3To determine the sensitivity of their results to the choice of unit, wealso calculated participation rates for individuals. The SIPP reportswhether a person was covered by AFDC, SSI, GA, other cash ben-efits, Medicaid, WIC, and the Food Stamp program. For the sample ofindividuals over 15, the probability that a person was covered by atleast one of these programs was 11.9 percent for immigrants and 7.7percent for natives. Neither attrition rates from the sample (23.1 forimmigrants and 22.3 for natives) nor the inclusion of “split-off”households (households formed from existing households in thesample) were found significantly to change the welfare gap.
For another discussion of the differences that follow from choos-ing either the household, the family, or the individual as the unit ofanalysis, see the article by Bean and colleagues, this issue, pp. 40–45.
4Those identified in the SIPP are Cuba, the former Czechoslovakiaand U.S.S.R., Hungary, Poland, and Vietnam.
5See, for example, George Borjas, “Immigration and Welfare, 1970–1990,” Research in Labor Economics 14 (1995): 251–280.
6On this same subject, see also the following article by Wei-Yin Hu.

50
0%
5%
10%
15%
20%
Per
cent
on
Wel
fare
20 25 30 35 40 45 50 55 60 65 70 75 80 85 90Age
Immigrants
Natives
Elderly immigrants on welfareWei-Yin Hu
Wei-Yin Hu is an Assistant Professor of Economics atUCLA.
Among immigrants to the United States, welfare use ismost heavily concentrated among those over 65.1 In1989, welfare participation rates among individuals aged18–64 were 3.8 percent for natives, 3.9 percent for immi-grants; but among those 65 and older, participation rateswere 6.9 for natives and 13.6 percent for immigrants.2
Welfare participation takes a discrete jump at age 65,suggesting that welfare use by the elderly is a phenom-enon distinct from welfare use by the working-age popu-lation (see Figure 1). Moreover, elderly immigrants forma rapidly growing portion of the welfare population. Inthe 1980s and early 1990s, the total number of elderlyrecipients of Supplemental Security Income (SSI)—themain federal cash welfare program for the elderly—re-mained essentially stable, but the number of noncitizenrecipients, both aged and disabled, rose from 127,000 in1982 to 738,140 in 1994.3 These facts alone call for ananalysis of immigrant welfare participation that focuseson the elderly. The topic is the more urgent because, aspart of the welfare reform legislation passed in August1996, most elderly immigrants who are not naturalizedcitizens will be denied eligibility for welfare programssuch as SSI.
use welfare after they turn 65 and become “elderly” thanis the typical immigrant who arrives during prime work-ing years. The effect of age at arrival is not explainedaway by differences in social security benefits betweenimmigrants who arrived when young and those who ar-rived when old. Nor is increased welfare use simply afunction of poverty per se, whether because of low in-come or poor labor market performance. Although lowincomes are necessary to qualify for welfare benefits, thedecision to take up benefits is an important element.Finally, I found that the sharp rise in elderly immigrants’use of welfare during the 1980s was mostly due to higherwelfare participation rates of new immigrants.
The analysis looks at welfare use by all elderly immi-grants included in the 5 percent Public Use Samples(PUMS) of the Census, and compares them with a 1 in 10sample of natives.4 Use of census data presents somedifficulties. For example, the Census asks only whenindividuals came to stay in the United States and groupsthe possible responses within year ranges—before 1950,1950–59, 1960–64, and so on. Thus it may not accuratelymeasure how long an immigrant has actually been in theUnited States. Indeed, anecdotal evidence suggests thatmany immigrants from nearby countries, particularlyseasonal agricultural workers, go back and forth fre-quently.5 I calculated date and age of arrival by assigningthe midpoint of the time interval chosen by the respon-dent. Nor does the Census distinguish between refugees/asylees and landed immigrants. I defined an immigrant asa refugee if more than 50 percent of those who arrivedfrom the same country of birth in the same cohort wereclassified as refugees by the Immigration and National-ization Service. The Census asks only how much publicassistance income an individual received in the preced-ing year; it neither identifies the program nor providesinformation on in-kind benefits such as food stamps andMedicaid. I defined a couple as “on welfare” if eithermember reported welfare income. Among the elderly, theevidence suggests that the vast majority on welfare arereceiving SSI; for example, data from the 1990 panel ofthe Survey of Income and Program Participation (SIPP),which does give information about the separate sourcesof public assistance income, show that 80 percent ofthose elderly who reported receiving means-tested ben-efits were SSI recipients.
From Table 1, it is immediately clear that any study ofwelfare use by immigrants must distinguish betweenrefugees and landed immigrants. Elderly refugees havehigher rates of welfare recipiency and receive largeramounts; elderly immigrants, in turn, have higherrecipiency rates than natives. Several hypotheses might
Using data from the 1980 and 1990 censuses, I examinedthe reasons for the higher use of welfare by elderly immi-grants and for the growth in their welfare use during the1980s. The evidence clearly indicates that immigrantswho arrive after age 55 are significantly more likely to
Figure 1. Welfare receipt by immigrants and natives in 1990, by age.
Source: U.S. Census 5 percent PUMS 1990.

51
explain the gap between elderly natives and elderly im-migrants:
1. Immigrants might be attracted to the United States byits welfare benefits for the elderly, which are more gener-ous than the pension schemes of those countries in whichmost immigrants to the United States originate.
2. Recent immigrants might lack earnings histories longenough to qualify them for social security benefits,which require a record showing 40 quarters of coveredemployment. Many might also have incomes low enoughto qualify them for SSI.
3. Selective outmigration by successful immigrantsmight leave poorer elderly immigrants in the UnitedStates.
4. Elderly immigrants may have intended to rely on fam-ily sources of support, but these income sources are orbecome inadequate, making the immigrant eligible forSSI.
The first two hypotheses suggest that age at arrival mayhave a strong influence on welfare participation. First,immigrants who come to the United States intending torely upon SSI would be more likely to wait till nearretirement age to move. Second, immigrants who cometo the United States after the age of 55 will typically notwork the full ten years necessary to qualify for socialsecurity. From Table 2, it can be seen that, in 1990,nonrefugee immigrants who came to the United Statesafter age 55 are 20 percentage points more likely to be onwelfare than those who immigrated at younger ages. Thefraction that immigrated at an older age was slightlylarger than in 1980.
Analyses of the assimilation of elderly immigrants intothe welfare system that are based upon the census datashow a large jump in welfare participation after fiveyears in the United States, for both nonrefugees andrefugees (see Figure 2A). This effect is quite possiblydue to the end of the period during which the incomes ofsponsors of immigrants are no longer deemed applicable
to their eligibility for welfare. Beyond the first ten yearsin the United States, however, nonrefugee immigrantsexperience very little assimilation into or out of the wel-fare system, whereas welfare participation drops sub-stantially for immigrants from refugee countries. Age atarrival has a very large effect, as in the earlier calcula-tions: in the regressions, immigrants who enter theUnited States after age 55 are 5–13 percentage pointsmore likely to be on welfare than those who come beforeage 55.
It is easier to observe the size of the age-at-arrival effectthan to explain it. Among potential explanations:
1. Those who immigrate at older ages are more likely tocome under some form of family preference visa thanunder occupational preference categories, which heavilyfavor immigrants in professional and skilled occupa-tions. They are thus less likely to come with assets orearnings potential that would render them ineligible forwelfare (see Table 1, p. 3). Indeed, if the analysis ofwelfare participation takes into account factors that af-fect labor market performance, such as age, race or eth-nic minority status, and education, elderly immigrantsappear to have lower propensities to use welfare than doelderly natives. But such relatively simple analyses donot help answer many more complicated life-cycle ques-tions. For example, did immigrants’ use of welfare riseduring the 1980s because earlier immigrants “aged into”the welfare system or because of new immigrants withhigher welfare propensities? It is, moreover, important tounderstand the assimilat ion process in welfarerecipiency: immigrants selected for such characteristicsas high educational attainment do not necessarily stay offthe welfare rolls, and immigrants whose poor educationor lack of skills put them in early need of welfare assis-tance may quite rapidly leave the welfare system (seeFigure 2B).
2. As already noted, immigrants who come after age 55are unlikely to work long enough to qualify for socialsecurity and Medicare; does the substitution of SSI forsocial security retirement income explain the age-at-ar-
Table 1Elderly Couples and Individuals
Receiving Welfare Benefits
Immigration 1980 on Average 1990 on AverageStatus Welfare Benefita Welfare Benefita
Natives 10.7% $3,325 8.6% $3,716
All Immigrants 12.6 3,873 15.3 4,319Nonrefugees 12.7 3,850 14.9 4,182Refugees 11.8 4,078 18.4 5,144
Source: U.S. Census 5 percent PUMS, 1980 and 1990.
Note: “Welfare” refers to cash benefits only. “Elderly” includespopulation over age 65.
aAverage received among those who received any benefits. Dollaramounts in constant 1989 dollars.
Table 2Welfare Participation among Elderly Immigrants,
by Age at Arrival
% on Welfare _Immigration % Migrated Migrated MigratedStatus after Age 55 before Age 55 after Age 55
1980Nonrefugees 17.4 10.4 24.0Refugees 17.7 7.0 34.5
1990Nonrefugees 17.4 11.3 32.2Refugees 26.3 7.3 49.4
Source: U.S. Census 5 percent PUMS, 1980 and 1990.
Note: “Welfare” refers to cash benefits only. “Elderly” includespopulation over age 65.

52
0%
5%
10%
15%
20%
25%C
hang
e in
Wel
fare
Par
ticip
atio
n
5 10 15 20 25 30 35 40 45 50Years Since Arrival
Refugees
A
Nonrefugees
0%
5%
10%
15%
20%
25%
30%
Cha
nge
in W
elfa
re P
artic
ipat
ion
5 10 15 20 25 30 35 40 45 50Years Since Arrival
No High School
Any College
HS Dropout
HS Graduate
B
No High School
0%
5%
10%
15%
20%
25%
30%
35%
Cha
nge
in W
elfa
re P
artic
ipat
ion
5 10 15 20 25 30 35 40 45 50Years Since Arrival
European
Latin American
Asian C
rival effect? Under the hypothesis that age at arrival ismerely a proxy for social security benefits, adding socialsecurity benefits to the analysis should reduce the age-at-arrival effect. This does not, however, occur.
3. Do immigrants who arrive after age 55 live in high-benefit states? There are substantial differences in statesupplements of the federal SSI benefit; thus an immi-grant who lives in a high-benefit state will be more likelyto qualify for welfare than a native with the same incomewho lives in a less generous state. Roughly two-thirds ofelderly immigrants live in six states—California, NewYork, Florida, Texas, Illinois, and New Jersey. I includedin the analysis the combined federal and state monthlybenefit, state unemployment rate, state fixed effects, anda variety of household characteristics, including marital
status, size of household, number of adults and children,and presence of disability. None of the analyses sug-gested that immigrants who arrive after age 55 choose tolive in higher-benefit states than does the average elderlyimmigrant.
The age-at-arrival effect is large for all groups, and can-not be remedied by simple immigration policies based oneducation or country of origin. Although educationalattainment among successive groups of immigrants hasrisen, it has not kept pace with rising attainment amongthe native-born. We might hypothesize two effects fromthis increasing education gap. First, it may increase im-migrants’ reliance on welfare programs relative to thenative-born. Second, the degree of assimilation may dif-fer among immigrant groups of different educational lev-els: for example, college-educated immigrants may moverapidly into very good jobs whereas less-educated immi-grants are at a disadvantage because of their limited skillsor English-language proficiency. Yet, surprisingly,analysis of welfare status by education group showedthat migration after age 55 had a large effect on welfareparticipation for all education groups (Figure 2B): thedifference in welfare participation among college-edu-cated elderly immigrants as opposed to those with nohigh school education is only 6 percentage points (it is 10percentage points among natives).
Country of origin proves to be an equally inadequateexplanation. An increasing share of new immigrantscome from Asia and Latin America. We might hypoth-esize that some immigrant groups are able to assimilatein a way that reduces their reliance on welfare programs.Certainly, separate analyses for immigrants (includingrefugees) from different continents of origin show largedifferences across groups (see Figure 2C). After the first10 to 15 years, however, the assimilation profile withineach group is once again flat.
Welfare participation consists of two components: eligi-bility and takeup. The jump in immigrants’ participationin welfare after five years’ residence is, as already noted,most likely because they become eligible. Whether or notimmigrants apply for welfare for which they have be-come eligible may in part be a matter of cultural atti-tudes—in some countries there is less stigma attached toreceiving government benefits than in others. LimitedEnglish skills and lack of familiarity with the welfaresystem may, however, impede takeup of welfare benefitsby some of the eligible population.
Estimating takeup rates, from the imperfect data avail-able, can produce only approximate answers. SSI im-poses an asset limit for eligibility.6 The Census does notprovide information regarding assets, but the SIPP does;it also, as noted, identifies the program in which a wel-fare recipient is enrolled. Table 3 compares estimates ofimputed eligibility and takeup rates for the elderly basedupon the SIPP and upon census data. The SIPP is known
Figure 2. Welfare participation among immigrants over 65: Esti-mated participation profiles in 1990. A: By refugee status; B. Byeducation; C. By continent of origin.
Source: Author’s calculations from 1980 and 1990 Census 5 percentPUMS.

53
to overestimate the eligibility for welfare of immigrantssubject to income deeming, illegal immigrants, and im-migrants amnestied after 1986 under IRCA (such immi-grants were excluded from most welfare programs duringthe first five years). But neither this nor other differencesin the immigrant sample help explain the discrepanciesbetween the SIPP and the census data. The SIPP datashow no difference in takeup rates between immigrantsand natives in 1990; the census data, for which eligibilityis imputed from annual income, show a 6-percentage-point difference. The SIPP results suggest that the highertakeup rate in the Census may not be accurate.
Do takeup rates change as immigrants assimilate, or withage at arrival? The 1990 SIPP panel yields 307 elderlyimmigrant couples or individuals, thus only a few dozenimmigrant welfare households—far too small a sample toallow us to disentangle assimilation, age-at-arrival, co-hort, and time effects. But some useful insights can bedrawn from the census data. Imputed takeup rates jumpafter the first five years, probably because five years isthe income deeming period. Refugees, as in the earlierfindings, show substantial assimilation out of the welfaresystem after ten years or so. Age at arrival once again haslarge effects, suggesting that immigrants who come laterin life have higher welfare participation rates both be-cause they have lower incomes and because they have ahigher propensity to apply for benefits if eligible.
Table 3Imputed SSI Eligibility and Takeup Rates among the Elderly
Statusa Natives Immigrants
SIPP 1990: Asset test appliedEligible 8.1% 11.6%Takeup rate 55.5 57.1
SIPP 1990: Asset test ignoredEligible 11.1 18.7Takeup rate 41.8 40.6
Census 1980b
Eligible 27.6 36.3Takeup rate 29.4 28.8
Census 1990b
Eligible 21.0 38.2Takeup rate 29.1 35.0
Source: U.S. Census 1980 and 1990 5 percent PUMS. SIPP: 1990panel.
Note: “Elderly” includes those over age 65, some of whom may bereceiving SSI-disabled. The SIPP excludes 6 percent of the elderlywho are institutionalized. Analysis of the 1990 Census sample showsthat the institutionalized have no higher welfare participation ratesthan the noninstitutionalized. They do have higher imputed eligibil-ity rates, but not enough to account for the discrepancy between theSIPP and the Census.
aEligibility determined according to benefit level in the state of resi-dence in January 1991.
bAsset information not available in Census data. Imputed eligibilityrates use annual income.
How much of the change in elderly immigrants’ partici-pation in welfare between 1980 and 1990 is due to as-similation by immigrants who were here in 1980, howmuch to those older immigrants who arrived after 1980?Immigrants who were aged 55–64 in 1980 had a welfareparticipation rate of 13.5 percent in 1990—almost thesame as the rate for older immigrants who came before1980.7 In contrast, immigrants who entered in the 1980sand were elderly in 1990 had a welfare participation rateof 30.8. It is clear that these new arrivals were respon-sible for the bulk of the increase.8
The vast majority of immigrants come before or duringthe prime work years of 25–55; only 19 percent of eld-erly immigrants in 1990 came to the United States afterage 55. Nonetheless, this group is up to 15 percentagepoints more likely to be on welfare than elderly immi-grants who arrived when young, and they represent adisproportionately large share of the welfare costs ofimmigrants—32 percent of benefits received by all eld-erly immigrants go to those who arrived late in life. Butthe size of this effect should not be exaggerated: thosewho migrated after age 55 account for just 4.5 percent ofthe U.S. elderly welfare caseload, and 5.6 percent of allcash welfare expenses for the elderly. n
1The research summarized in this article is fully reported in Wei-YinHu, “Elderly Immigrants on Welfare,” Department of EconomicsWorking Paper no. 750, UCLA, March 1996.
2These figures were calculated by the author from the 1990 U.S.Census 5 percent PUMS sample. “Welfare” refers to cash welfare; thecensus data do not include information on other kinds of welfarereceipt. “Immigrant” is understood to include all foreign-born,whether or not they are naturalized citizens. Throughout the article,the term “elderly” is used to refer to those over the age of 65. In thecase of couples, either member may be over 65.
3SSI recipients classified as disabled accounted for 36,000 recipientsin 1982 and 298,140 recipients in 1994. The elderly constituted1,530,289 of SSI recipients in 1984 and 1,474,852 in 1993: U.S.House of Representatives, Ways and Means Committee, Overview ofEntitlement Programs: 1994 Green Book (Washington, D.C.: U.S.Government Printing Office, 1994), Table 6.1.
4SSI participation is calculated either for elderly couples or unmar-ried elderly individuals.
5On this issue, see M. Ellis and R. Wright, “When Immigrants AreNot Migrants: Counting Arrivals of the Foreign-Born Using the U.S.Census,” Nelson A. Rockefeller Center for the Social Sciences Work-ing Paper 2, Dartmouth College, March 1996.
6Under SSI, the asset limits are $3,000 for a couple and $2,000 for anindividual, excluding home equity and the value of an automobile upto $4,500.
7Analysis of the group of immigrants who were both elderly in 1980and in the United States by 1980 showed that assimilation, not educa-tion, race or ethnicity, or cohort effects, was the biggest factor inincreasing their welfare participation.
8On the same subject, see also M. Fix and J. S. Passel, Immigrationand Immigrants: Setting the Record Straight (Washington, D.C.: TheUrban Institute, 1994), pp. 63–65. Their calculations from the 1990Census indicates that 25 percent of immigrant individuals who areover 65 and who arrived after 1980 are recipients of public assistance.

54
Medicaid use by children of immigrantsJanet Currie
Janet Currie is a Professor of Economics at UCLA.
Medicaid, the public health insurance program for low-income families, consumes two-thirds of all federalspending on public assistance; in 1994, federal Medicaidexpenditures were approximately $79 billion.1 It is notclear what part of these costs is attributable to use bylegal immigrants. In 1994, Rebecca Clark, of the UrbanInstitute, estimated that total Medicaid expenditures forimmigrants were $16.6 billion annually.2 A year later, theCongressional Budget Office (CBO) estimated that ex-cluding most legal immigrants from Medicaid wouldsave $7.7 billion in federal welfare benefits between1996 and 2000. This amount is nearly one-third of all thesavings that the CBO projected from a ban on publicassistance to immigrants. Yet in its analysis the CBOdevoted barely one-third of a page to Medicaid, com-menting that there were no data on immigration status forMedicaid recipients who were not also receiving cashpayments, nor for immigrants’ use of emergency medicalcare under Medicaid. By comparing the demographiccharacteristics of people receiving cash and noncash ben-efits, CBO estimated that 6.5 percent of all Medicaidrecipients might be legal immigrants. This percentage,said the CBO authors, would translate into approxi-mately 2.4 million people in 1996.3 George Borjas andLynette Hilton, using 1990–91 data from the Survey ofIncome and Program Participation, estimated that, onaverage, 15.4 percent of immigrant households were onMedicaid in any month during this period (see their ar-ticle in this Focus, p. 47).
Under the welfare bill signed in August 1996, states maybar most current legal immigrants from Medicaid; cur-rent recipients are eligible to continue receiving benefitsuntil January 1, 1997. New immigrants will not be eli-gible for Medicaid until five years after their arrival, andthe states have the option to extend that ban until citizen-ship. (Emergency medical care and essential publichealth services such as immunizations will still be pro-vided.) Given widely disparate estimates and a dearth ofsolid data, policy makers can only speculate about thepossible consequences, both for access to essential healthcare services and for the public costs of providing healthcare.
One of the very few sources of available information isthe National Health Interview Survey (NHIS), which in-terviews a large, nationally representative cross-sectionof American families each year.4 Beginning in 1989, the
NHIS asked all foreign-born adults how long they hadlived in the United States, grouping the responses intothe same time ranges as the Census does. In a recentstudy, I used data from the 1989 and 1992 waves of thesurvey to examine the differences between the use ofMedicaid by children of immigrants and children of thenative-born, a matter of particular interest given the rapidexpansion in Medicaid coverage of children that oc-curred over the 1980s.5 The Medicaid eligibility of eachchild was evaluated using family circumstances and thevariation among states in eligibility thresholds, in theyear in which coverage was expanded, and in the age ofchildren covered. Table 1 summarizes the NHIS data onMedicaid use—both formal coverage and utilization ofcare—among children of immigrant and native-bornfamilies. It presents nationwide data and data for statesthat are absorbing a disproportionately high share ofimmigrant inflows: Arizona, California, Florida, Texas,New Mexico, and New York.6 Sixty-four percent of thechildren of immigrants in the sample lived in these sixstates, as opposed to only 27 percent of the children ofthe native-born.
Table 1 shows that children of immigrants are less likelythan children of the native-born to have private healthinsurance and more likely to be eligible for Medicaid.7
According to these estimates, 35 percent of the childrenof immigrants were eligible for Medicaid over this timeperiod, compared to only 21 percent of the children ofthe native-born. Nearly half of all children of “new”immigrants (those who had arrived within the previousten years) were judged to be eligible. Average takeuprates were, however, lower among eligible immigrants:approximately 50 percent of Medicaid-eligible childrenof immigrants actually had formal Medicaid coverage,compared to 66 percent of eligible children of the native-born (from Table 1, rows 2 and 3). Becoming eligible forMedicaid increased the probability of coverage for allchildren by between 13 and 21 percentage points. Thatprobability was smallest for children of new immigrants,those in the United States less than ten years.
Among immigrant families, though not among familiesof the native-born, the probability that the family has noinsurance rises with eligibility for Medicaid, suggestingthat some families may drop or lose private insurancecoverage without formally taking up Medicaid cover-age.8 Dropping private insurance may be a rational re-sponse if the health of one’s children is not thereby put atrisk. The utilization figures discussed below suggest thatthis may be the case. Low-income immigrant parentsmay be more likely than the native-born to work forsmall employers who offer insurance at less favorablerates than large companies, if they offer it at all. Theeffect is particularly pronounced among new immigrants,

55
who have the lowest rates of private insurance of allfamilies in the sample and for whom formal enrollmentmay present the most formidable hurdles of language anddocumentation. It is also large in high-inflow states. Be-cause of this crowding-out effect, my estimates suggestthat, although the costs of providing the additional ser-vices consumed by the newly eligible are small (as dis-cussed below), as much as one-quarter of the costs ofservices that were already being provided to immigrantchildren may have been shifted from private to publicinsurers.
The large difference in the probability of having healthinsurance coverage was not, however, associated withlarge differences in utilization of care. Becoming eligiblefor Medicaid dramatically reduced the probability, forboth immigrants and nonimmigrants, that a child wentwithout a doctor’s visit in the previous year. For childrenof immigrants, the effect was twice as large as fornonimmigrants; eligibility among immigrant childrenwas associated with a 29–39-percentage-point reductionin the probability of no doctor’s visit in the previousyear. (Pediatric guidelines recommend at least one visit ayear for most children; thus the absence of such a visitsuggests that the family has a problem with access tomedical care.) For basic preventive health care, the firstvisit to a doctor is probably the most important; absentactual illness, the marginal benefits of care are likely todecrease with successive visits, as the total cost of careincreases. I also found that eligibility had no significanteffect on the number of doctor visits among children ofeither immigrants or native-born (see Table 1).9 Thus, interms of the utilization of care, the main effect of becom-
ing eligible for Medicaid was to induce children who hadpreviously received no care to have one doctor’s visit.
Why do coverage and utilization show different patterns?Perhaps because it is often possible for eligible childrento obtain acute services even if they are not formallycovered under Medicaid. There is considerable evidencethat hospitals are able to determine relatively quicklywhether someone is likely to be Medicaid-eligible andthat Medicaid-eligible patients, like patients with insur-ance, receive better care (with greater certainty).10 Ifimmigrants face higher “transaction costs” of enrollingin Medicaid, then they may choose to forgo those costsand remain uncovered, knowing that acute care will beprovided under the program as necessary. And immi-grant parents may indeed face higher “costs”: difficultiesin supplying the necessary supporting documents, lan-guage difficulties that complicate following proceduresand keeping appointments, residential segregation thatmay make it difficult to get to an enrollment center, andfear of harassment by the authorities if other members ofthe family are undocumented, even though the childrenthemselves may be native-born.
From these analyses, it is possible to draw two conclu-sions.
First, there are systematic differences between coverageand utilization that have not previously been noted.These differences suggest that using administrative dataon Medicaid coverage and average Medicaid costs perchild enrolled in the program are likely to give mislead-ing estimates of the probable effects of curtailing—or
Table 1Children under 15 Years of Age in the National Health Interview Survey: Eligibility, Coverage, and Utilization of Care
Immigrated within High-inflow Statesa
Insurance Status and Utilization of Care All Native-born All Immigrants Last 10 Years Native-born Immigrants
N 44,665 8,256 2,898 11,966 5,295
Insurance Status (%)Medicaid-eligible 21 35 47 23 42Medicaid coverage 13 17 22 15 20Private health insurance 72 56 46 68 49No insurance 13 25 30 16 30Eligible in child’s st./age/year 25 28 30 27 29
Utilization of Medical CareMedicaid-eligible
No visit in past year (%) 17 20 20 16 20No. of doctor visits last year, if any visitsb 4.30 3.57 3.49 4.33 3.41
(3.66) (4.12) (5.18) (4.61) (4.85)Not Medicaid-eligible
No visit in past year (%) 18 20 19 18 22No. of doctor visits last year, if any visitsb 3.97 3.39 3.68 4.14 3.27
(1.90) (3.29) (6.16) (4.61) (4.33)
Source: National Health Interview Survey, 1989 and 1992 panels.
aArizona, California, Florida, Texas, New Mexico, and New York.
bStandard errors in parentheses. Means calculated using annual weights.

56
expanding—Medicaid eligibility for children of immi-grants. They also suggest that it is important to distin-guish between types of utilization.
Second, restricting the Medicaid eligibility of immigrantchildren might reduce public costs by shifting more ofthe burden of providing insurance for acute care to pri-vate insurers. But if the Medicaid expansions that arestudied here are any guide, such a shift would also in-crease the number of immigrant children going withoutany basic medical care, and it might not have a largeimpact on the total public costs of providing medicalcare, if acute care continues to be provided on the basisof need. n
1For a general review of Medicaid, see Barbara Wolfe, “A MedicaidPrimer,” Focus 17, no. 3 (Spring 1996): 1–6.
2R. Clark, “The Costs of Providing Public Assistance and Educationto Immigrants,” Urban Institute, Washington, D.C., May 1994. Clarkestimated that since two-thirds of Medicaid expenditures are for theelderly, costs for children amounted to about $5.5 billion.
3CBO estimated $23.4 billion in savings of federal benefit paymentsfrom the four biggest federal programs, AFDC, SSI, Food Stamps,and Medicaid. Congressional Budget Office, “Immigration and Wel-fare Reform,” February 1995, pp. 27, 32.
4The data cover approximately 100,000 individuals and 30,000 chil-dren less than 15 years of age. The survey identified whether or notparents were born outside the United States and, if foreign-born,when they arrived. It did not identify naturalization status or whetherchildren were foreign- or native-born. Immigrant families were largerand were more likely to include other adult relatives, both male andfemale. A comparison of the characteristics of immigrant and native-born sample members shows the following:
Native-born Immigrant
Black 17% 9%Hispanic 5% 43%Female-headed family 22% 16%Family size 2.26 2.56Family income <$10,000 11% 14%Education < high school
Fathers 15% 37%Mothers 18% 42%
ResidenceCentral city 23% 46%Rural 26% 7%
5“Do Children of Immigrants Make Differential Use of Public HealthInsurance?” RAND Labor and Population Program Working Paper96-13, July 1996.
6“High inflow” states are defined as states in which a higher percent-age of total state population is foreign-born—hence the inclusion ofstates such as New Mexico, where absolute numbers of immigrantsare relatively small.
7This result is consistent with research showing that children of immi-grants are more likely to be eligible for cash assistance programs suchas AFDC because immigrants tend to be poorer than the native-born,e.g., G. Borjas, Friends or Strangers: The Impact of Immigrants onthe U.S. Economy (New York: Basic Books, 1990); M. Tienda and L.Jensen, “Immigration and Public Assistance Participation: Dispellingthe Myth of Dependency,” Social Science Research 15 (December1986): 372–400; S. Trejo, “Immigrant Welfare Recipiency: Recent
Trends and Future Implications,” Contemporary Policy Issues 10(April 1992): 44–53.
8OLS estimates suggest a small negative effect for the native-born, alarger one for immigrants. TSLS estimates are positive for the native-born, but remain negative for immigrant families. The circumstancesunder which expansions of Medicaid coverage are likely to “crowdout” private insurance coverage have been examined by D. Cutler andJ. Gruber, “Does Public Insurance Crowd Out Private Insurance?”Quarterly Journal of Economics 7, no. 2 (May 1996): 391–430.
9Hospitalizations are much more expensive than doctors’ visits, butonly about 3–5 percent of children are hospitalized in any year,compared to the approximately 80 percent who see a doctor; thusinferences about differences in hospitalization rates between childrenof immigrants and the native-born would be based upon very smallsample sizes.
10Evidence from before the Medicaid expansions suggests that Medic-aid takeup among children on AFDC was high, but that only aboutone-quarter of children eligible for other reasons actually took upcoverage. For a summary of research on the effects of the Medicaidexpansions themselves, see “Expanding Eligibility for Medicaid:What Does It Accomplish?” Focus 17, no. 3 (Spring 1996): 16–22.

57
The use of food assistance programs by elderlyHispanic immigrants in MassachusettsLuis M. Falcón, Odilia Bermudez, and Katherine Tucker
Luis Falcón is Associate Professor of Sociology atNortheastern University; Odilia Bermudez is a ResearchAssociate and Katherine Tucker an Associate Professorat the USDA Human Nutrition Research Center at TuftsUniversity. Professor Falcón was an IRP Small Grantsrecipient in 1995–96.
In 1994, 38.5 percent of Hispanics in the United Stateswere foreign-born, and only about two in ten were citi-zens. Moreover, the Hispanic population accounts for asignificant proportion of the poor, especially among theelderly.1 How seriously will they be affected by the pas-sage of laws excluding immigrants from most forms ofpublic assistance?2
The Massachusetts Hispanic Elders Study (MAHES) be-gan in 1992, and continues to produce social and epide-miological data on the living circumstances, income,health, and nutritional status of a sample of the Hispanicpopulation of Massachusetts aged 60 and above. We usedMAHES data to examine poverty, health status, and useof public assistance programs among Puerto Ricans, Do-minicans, and a sample of other Hispanics, comparedwith non-Hispanic whites from the same neighborhoods.Although the sample size is a small one, this work breaksnew ground, for most of the meager existing research onthe Hispanic elderly has focused upon the Mexican popu-lation. This article summarizes some basic findings, es-pecially about the Dominicans. Of this group, 98 percentwere foreign-born, and their average length of residencein the United States was 13.6 years at the time of thesurvey.3
Demographic characteristics
Table 1 presents the characteristics of the Dominicansand other Hispanics in the sample. About a third of eachof the Hispanic groups were not married and living withothers. Many of these were elder heads of householdswho were the sole caregivers of children or grandchil-dren. Surprisingly high percentages in all groups wereliving alone. Close to 90 percent of all the Hispanicelders in the sample were heads of households. The Do-minicans, especially the women, have very low educa-tional levels and also low English-language skills (nearly100 percent of them live in households where Spanish is
normally used at home).4 Thus there exist formidablelanguage barriers in the way of their communication withhealth care agencies and other service providers. Thisconstitutes a potentially serious problem for an olderpopulation in which two-thirds rated their own health as“fair” or “poor.” 5
Income
The vast majority of these elderly Dominicans were lastemployed in blue-collar and service occupations or inagriculture. Notably, almost one-third of the women hadnever worked outside the home. Dominicans were themost impoverished: their per capita income levels($5,753) lagged well behind those of the non-Hispanicwhites in the same neighborhoods, many of whom hadprivate pensions ($17,411; and see Figure 1).Wages werestill an important source for the Dominicans, the young-est group, and both they and the “other Hispanics” wereless likely to be receiving social security or Supplemen-tal Security Income (SSI) than were the Puerto Ricanelders, who also had the highest proportion of incomefrom welfare. Late arrival was a significant factor inpoverty status: Hispanics who arrived after age 40 inMassachusetts were about twice as likely to be in povertyas those who had arrived at younger ages.6
Use of in-kind benefits
In examining the use of public assistance, our analysesfocused upon the use of food assistance programs, inparticular Food Stamps and the Food Commodity, Con-gregate Meals, and Meals on Wheels programs, all feder-ally funded.7
Food Stamps. Among the Dominicans, about a quarter ofboth men and women were receiving food stamps; onlythe Puerto Ricans had higher recipiency rates. Ethnicityproved to be far less significant in explaining the higherlikelihood of food stamp use among these groups thandid their lower education, lower income from sourcessuch as pensions and social security, and greater poverty.
Food Commodity Program. Eligibility for the program isbased upon a household income at or below 130 percentof the federal poverty line. Among the elderly Domini-cans in the MAHES study, 83 percent were eligible, yetjust 9 percent participated. Among non-Hispanic whites,

58
fewer than 50 percent of households were eligible, yetthis group had the highest participation rate (14 percent).Our interviews suggest that cultural preferences regard-ing food play a role in the low use of this program, but sotoo does lack of information about how to participate orhow to get to centers where food is distributed.
Congregate Meals and Meals on Wheels programs.These programs were designed not only to improve thenutritional status of older Americans but also to increasetheir social contacts. Here, too, participation is loweramong Hispanics: about 6 percent, compared to between9 and 11 percent of non-Hispanic whites, are enrolled inCongregate Meals and in Meals on Wheels (which servesthe homebound). The Dominicans are an exception inthat only 1.5 percent report using the Meals on Wheelsprogram.
Given the low use of food programs and the high povertyand disability rates reported by the elderly Hispanics, we
Table 1Characteristics of Elderly Hispanics in the MAHES Survey
Characteristic Non-Hispanic Whites Puerto Ricans Dominicans Other Hispanics
Age60–64 14.4 29.2 33.8 26.765–74 47.5 43.9 42.7 42.675 and older 38.1 26.9 23.5 30.7
Living ArrangementsMarried with spouse 25.0 32.1 46.4 34.0Not married, with others 15.6 35.4 34.8 30.0Not married, lives alone 59.4 32.5 18.8 36.0
EducationMales
0–6 years 8.6 69.4 65.2 47.67–11 years 37.1 21.6 26.1 19.112 or more years 54.9 9.0 8.7 33.3
Females0–6 years 4.1 80.0 80.0 71.27–11 years 41.8 11.3 15.4 8.512 or more years 54.1 8.8 4.4 20.4
Occupationa
MalesProf/tech 16.7 2.9 0.0 12.5Clerical/sales 11.1 3.8 11.1 3.1Service 11.1 25.7 38.9 34.4Blue-collar 51.9 44.8 38.9 50.0Agriculture 3.7 19.0 11.1 0.0Never worked 5.6 3.8 0.0 0.0
FemalesProf/tech 16.3 2.6 2.5 2.5Clerical/sales 28.3 3.9 5.0 10.4Service 28.3 27.5 20.0 39.6Blue-collar 17.4 34.6 42.5 22.9Agriculture 0.0 9.2 0.0 0.0Never worked 9.8 22.2 30.0 25.0
N 155 271 69 101
Source: Data from the Massachusetts Hispanic Elders Study (MAHES); authors’ calculations.
aSector of last occupation.
also examined their level of food insecurity—whether ornot they had skipped meals for lack of food or moneyduring the previous month. The rates were approximatelythe same for non-Hispanic whites and for the other His-panics: about 2 percent reported having skipped mealsduring the previous month. Among the Puerto Ricans andthe Dominicans the rate was much higher: 8.1 percentand 7.5 percent, respectively.
The convergence of unstable work histories, poor healthand impaired mobility, and limited sources of incomecombine to create a serious situation for many Hispanicelders. This is especially true for those who arrived atolder ages, most commonly to reunite with family.8 Evenwithin the limited MAHES sample, Hispanics are a veryheterogeneous population: their social and economiccharacteristics and their level of participation in publicassistance vary considerably. Nevertheless, for many inthis group of the elderly, the restrictions imposed uponeligibility for federally funded benefits may well worsen

59
0%
20%
40%
60%
80%
100%
Inco
me
Sou
rce
(% o
f tot
al)
Non-Hispanic White Puerto Ricans Dominicans Other Hispanic
Resp/Spouse Wages Wages to Others Soc. Sec. SSI
Pension Welfare Disability
the already high poverty levels and poor health circum-stances they experience. n
1See K. A. Hansen and A. Bachu, The Foreign-Born Population:1994, U.S. Bureau of the Census, Current Population Report P20-486, August 1995, and The Nation’s Hispanic Population—1994,U.S. Bureau of the Census Statistical Brief, September 1995. Hispan-ics aged 60 and above now compose about 5 percent of the total U.S.population over 60, and the Hispanic elderly population is expectedto grow faster than the general elderly population during the next fewdecades. The age structure also varies among Hispanic groups: 6.1percent of Mexicans, but 25 percent of Cubans, are over 60.
Among householders 65 years and over in 1994, 17.6 percent ofHispanics but only 4.6 percent of non-Hispanic whites were poor.Hispanic women over 75 had a poverty rate of 30.1 percent in 1990,almost twice that of non-Hispanic white women in the same agegroup. The 1994 Current Population Survey data show that povertylevels varied greatly among the various Hispanic groups, from a lowof 17.6 percent among Cubans to a high of 35.4 percent among PuertoRicans.
2In 1994, there were 10.2 million foreign-born Hispanics in theUnited States and only about 1.9 million were citizens. Some 8.3million Hispanics, therefore, are potentially subject to the exclusions.
3In Massachusetts, Hispanics now constitute at least 10 percent of thepopulation in 7 out of the 17 largest cities, and over 30 percent of thepopulation in three cities (Holyoke, Lawrence, and Chelsea). TheHispanic elders in the MAHES study form a cluster stratified sampleof the Hispanic population aged 59 and above enumerated in the 1990Census. Just over 600 were interviewed in the MAHES survey: 271Puerto Ricans, 69 Dominicans, and 101 other Hispanics. We alsointerviewed 155 non-Hispanic whites selected as neighborhood con-
trols. The MAHES survey has been extended and will ultimatelyinclude detailed interviews with over 900 subjects. As citizens,Puerto Ricans do not face the immediate cutbacks in public assistancefaced by immigrants; they are present in the table for comparativepurposes but are only incidentally discussed here. In general, theirsocioeconomic characteristics resemble those of the Dominicans. The“other Hispanics” consist of a mix of Cubans and Central/SouthAmericans, including both long-term residents and some who arrivedafter the 1970s; 22 percent are native born, and they include a higherproportion of better-educated people with more secure economic sta-tus. Interviewers did not question participants about their immigra-tion status.
Full details of this research appear in an IRP Discussion Paper: L.M. Falcón, O. Bermudez, and K. Tucker, “Correlates of Poverty andParticipation in Food Assistance Programs among Hispanic Elders inMassachusetts,” forthcoming.
4Data in the 1990 PUMS also show that, among Dominicans 60 andover, about 71 percent did not speak English well, if at all.
5Mobility and self-care limitations were measured using the Activi-ties of Daily Living (ADL) scale. Over all, about 20 percent of theDominican immigrants had some mobility or self-care limitations,and over half reported limitations on physical mobility. The worsthealth status among this group was reported by Puerto Ricans, amongwhom about 38 percent reported mobility or self-care limitations.
6For many of the elderly Dominicans, Massachusetts was their firstplace of arrival in the United States.
7Under the new welfare legislation, immigrants are ineligible for allfederal food assistance programs.
8About 35 percent of the Hispanics who arrived in Massachusettsafter age 59, and about 20 percent of those who arrived after age 40,reported that they did so in order to be closer to their children, about9 percent in order to be closer to other family members.
Figure 1. Sources of income for elderly Hispanics in the MAHES study. Note: “Wages to Others” means wages to person(s) other than the respondentor spouse and who appear in the household roster, such as children or other relatives.

60
Highlights of Food Stamp Provisionsin the Federal Welfare Reform Bill of 1996
Eligibility Changes
Unless they are engaged in work or work programs, able-bodied adults aged 18 to 50 without dependents are eligibleto receive food stamps for only three months in every 36-month period.1
Most legal immigrants are no longer eligible to receive food stamps.2
Program Simplification
The law allows states greater flexibility by relaxing a number of administrative requirements. It also authorizes aSimplified Food Stamp Program, through which states can employ a single set of rules for their cash assistanceprograms and the Food Stamp program, provided several features in the national Food Stamp program are maintainedor addressed.
State Waiver Authority
The states are given broad authority to request waivers of program rules for purposes of experimentation, providedthat the experimental project “is consistent with the goal of the food stamp program of providing food assistance toraise levels of nutrition among low-income individuals,” and provided that “the project includes an evaluation todetermine the effects of the project.”
Identified “permissible projects” under the new waiver authority are those designed to improve program administra-tion, “increase the self-sufficiency of food stamp recipients,” test “innovative welfare reform strategies,” and “allowgreater conformity with the rules of other programs.”
New waiver projects face some restrictions; for instance, they may not provide benefits in the form of cash.
Child Support
States may disqualify individuals who are delinquent in any court-ordered payment for support of a child, and theymay require custodial parents to cooperate with state child support enforcement agencies as a condition of food stampeligibility.
Expenditure Reduction
The bill reduces maximum benefit levels from 103 percent to 100 percent of the U.S. Department of Agriculture’sThrifty Food Plan (but maintains indexing), freezes the standard deduction at the 1995 level, and makes otherchanges in deduction and income-calculation rules, all of which reduce total expenditures on the program. The billalso specifies that Food Stamp benefits are not to increase as a result of benefit reductions in other programs, if thebenefit reductions stem from “the failure of a member of the household to perform an action required under the law orprogram.” The Congressional Budget Office has estimated that directs cuts in the Food Stamp program will amount to$26.8 billion over the period 1997-2002.3
_____________________
1“Work” is defined as participation in work or a work program at least 20 hours or more a week, averaged monthly. Qualifying work programsinclude those under the Job Training Partnership Act or the Trade Adjustment Assistance Act, state or local programs approved by the state’sgovernor, and workfare. Job search or job search training programs do not qualify.
2Exempt from this provision are refugees and asylees during their first five years in the United States, veterans or active-duty military and theirfamilies, individuals who have worked for 40 quarters. Sponsored immigrants will have all of the sponsor’s income and resources deemed to bepart of the immigrant’s resources in determining eligibility. Current recipients will lose eligibility upon case redeterminations within a year,starting April 1, 1997; all immigrant applicants became ineligible on August 22, 1996, unless they met one or more of the exemption criteria.The Congressional Budget Office has estimated that of the two million legal aliens receiving food stamps, all but 800,000 will lose coverage(CBO, “Federal Budgetary Implications of H.R. 3734, The Personal Responsibility and Work Opportunity Reconciliation Act of 1996,”August 9, 1996, p. 15).
3These include $23.1 billion resulting from program changes and $3.7 billion resulting from loss of benefits by immigrants. See CBO, “FederalBudgetary Implications,” pp. 15, 19.

61
Food insecurity and hunger: Poverty policy issues forthe 1990s and beyondChristine M. Olson
Christine Olson is Professor of Nutrition in the Divisionof Nutritional Sciences, Cornell University, and a mem-ber of the Cornell Hunger and Food Insecurity Measure-ment Group. She spent the academic year 1995–96 at theUniversity of Wisconsin–Madison.
The long-term decline in real wages among U.S. workersin the lower portion of the income distribution, coupledwith major cuts in the Food Stamp program recentlylegislated by the federal welfare reform bill (see boxp. 60), will likely bring food insecurity and hunger onceagain to public attention. But the first steps in gettingfood insecurity and hunger on the public policy agendaare to arrive at consensus on what these phenomena areand to estimate the extent to which they exist. PeterEisinger, an IRP affiliate and political scientist at theUniversity of Wisconsin–Madison, points out that “Ifsociety is to help the needy, then society needs a numberin order to establish the magnitude of its task and the callon its resources.”1 In addition, food insecurity and hun-ger need to be widely perceived as public problems andsome rationale must be constructed for government inter-vention concerning them. This article describes theprogress that has been made over the past ten to fifteenyears in defining and measuring hunger and summarizesresearch indicating that these are public problems worthyof government intervention.
In the early 1980s, mayors of almost all major cities inthe United States observed an unprecedented growth indemand for food at food banks and soup kitchens,prompting the U.S. Conference of Mayors in 1982 tostart collecting data on such demands in urban areas. In1984, the President’s Task Force on Food Assistancereported that it could not document the extent of theproblem of hunger because there was no good measurefor it, and concluded: “We have not been able to substan-tiate allegations of rampant hunger.”2 Throughout thelatter half of the 1980s, policy makers, researchers, andadvocacy organizations were in agreement that the lackof an operational definition of hunger was a major barrierto progress in monitoring and addressing the issue.
Defining the terms
In the face of this stalemate, or vacuum—the preferredterm depends on one’s perspective on the existence of
hunger—an Expert Panel convened by the American In-stitute of Nutrition in 1989 characterized the problem offood deprivation that Americans were experiencing as“food insecurity”—a condition that exists “whenever theavailability of nutritionally adequate and safe foods orthe ability to acquire acceptable foods in socially accept-able ways is limited or uncertain.”3 Noting that hunger(the painful and uneasy sensation caused by lack of food)and malnutrition were potential though not necessaryconsequences of food insecurity, the panel designatedfood insecurity as a central indicator of nutritional statusthat should be measured in surveys.
We might reasonably ask why it is necessary to develop anew term to describe food deprivation. If it is necessary,why select a term that has less emotional and politicalappeal than hunger? In the global society in which welive, most citizens have seen pictures of starving childrenfrom poorer countries of the world; this has become theirimage of hunger. The image is not, however, appropriatefor food deprivation as experienced in the United States,where, generally speaking, overt clinical and biochemi-cal symptoms of malnutrition are seen primarily amongthose suffering from disease. The nature of food depriva-tion in this country is graphically captured by a partici-pant in one of our projects. After talking about being“hungry, hungry” as having absolutely nothing to eat,she said
going hungry is when you have to eat the samething all week long and you have no variation fromit and you know sooner or later you’re going to runout of that, too, because it’s only gonna go so far.So each day you cut the portions down a little bitsmaller and a little bit smaller. . . . And you have atendency to send your kid off to play with some-body else so that they’re there at mealtimes so theydo eat. 4
This woman, like the others interviewed in the study,made a clear distinction between hunger in its narrowestsense—as having absolutely nothing to eat for days at atime—and hunger in a broader sense—encompassing de-pleted household food supplies, having to eat unsuitablefoods, uncertainty and anxiety about the availability offood, and obtaining food in socially unacceptable ways.It is this broader sense of hunger that the Expert Paneldefined as food insecurity.
Using a definition very similar to that of the ExpertPanel, our research in the Cornell Hunger and Food Inse-curity Measurement Group has found food insecurity tobe a managed process experienced at both the householdand the individual levels in a reasonably predictable se-quence—a continuum progressing from uncertainty and

62
anxiety about the household’s food supplies throughdepletion of those supplies and altered eating patterns foradults in the household to the extreme condition of hun-ger among children, when food supplies are exhausted.Using the descriptions of 32 women from upstate NewYork (including the one quoted above) who were chosenfor interviews in 1987 because they had reported experi-encing hunger, we constructed survey items to measureeach of the salient dimensions of food insecurity at thehousehold and individual levels and field tested themamong a sample of 189 low-income women from thesame geographical area. This research provided both themajor conceptual underpinnings of food insecurity asexperienced by women with children and a set of specificitems for measuring food insecurity. The latter, devel-oped by Kathy Radimer, are known as the Radimer/Cornell measures of food insecurity and hunger. Thisresearch and that of the Community Childhood HungerIdentification Project (CCHIP), which has fielded sur-veys of hunger across the nation, made it possible tobegin developing questionnaire-based measures of foodinsecurity and hunger capable of being administered na-tionally.5
Developing national measures
In 1993, the National Nutrition Monitoring and RelatedResearch Program provided further impetus for con-structing national measures of food insecurity and hun-ger. Under this comprehensive ten-year plan, the Foodand Consumer Service (FCS) in the Department of Agri-culture and the National Center for Health Statistics(NCHS) in the Centers for Disease Control and Preven-tion were empowered to develop and recommend stan-dardized, nationally applicable methods for defining andobtaining data on the prevalence of “food insecurity” or“food insufficiency” in the United States.6
In January 1994, a national conference of researchers,convened by FCS and NCHS from among the private andpublic sectors, government decision-makers, and advo-cates, demonstrated two important facts: consensus pre-vailed on the technical means for measuring food insecu-rity and hunger and the feasibility of doing so, and strongsupport existed for developing a national measure forfood insecurity and hunger.7 Immediately thereafter, FCSentered into an interagency agreement with the U.S. Bu-reau of the Census to develop, test, and refine a foodsecurity questionnaire for inclusion as a special supple-ment to the bureau’s April 1995 Current Population Sur-vey. The Food Security and Hunger Supplement wasadministered to 45,000 households in April 1995, and thedata are currently being analyzed by Abt Associates, aprivate firm.
Although we cannot yet address the validity of the wholebank of questions included in the supplement (that is atask for Abt Associates), we can describe the validation
studies that have been done of the Radimer/Cornell mea-sures, which were included in the special supplement tothe April 1995 CPS. We used data from a stratified,random sample survey of women with children living ina rural county in New York State.8 The results showedthat as food insecurity worsened, there was a significantand progressive increase in the percentage of subjectsparticipating in food assistance programs and having lowincome, education, and employment, and a significantdecline in the average availability of food in the house-hold, as measured by a complete household food inven-tory. Fruit and vegetable consumption decreased as foodinsecurity worsened. These results support the validity ofthe Radimer/Cornell questionnaire-based measures anddemonstrate their ability to differentiate among groupsof households that evidence different behaviors attribut-able to increasingly severe food insecurity and hunger.As a first step, it seemed most important to have detaileddata on potential criterion variables (demographic anddietary characteristics that might be expected to vary byfood-insecurity status), but it is clearly highly desirableto conduct further validation studies among more diversepopulation groups.
Using additional information in the same data set, Ed-ward Frongillo and colleagues at Cornell developed adefinitive measure for food insecurity and compared theclassification of individual households using this mea-sure with classifications based on the Radimer/Cornellquestions and the CCHIP questions.9 This research dem-onstrated that the Radimer/Cornell measure and theCCHIP measure were able correctly to identify, respec-tively, 89 and 86 percent of the households classified asfood insecure by the definitive measure. Furthermore,the Radimer/Cornell and the CCHIP measures agreed onthe classification of 85 percent of households. This studypresents the strongest evidence to date that question-naire-based measures are valid for the assessment of foodinsecurity and hunger in households in the general popu-lation of families with children. The finding is important,because questionnaire-based methods that directly mea-sure the experience of food insecurity and hunger areprobably the only feasible approach to measuring fooddeprivation in population groups in the United States.Questionnaires are relatively easy to administer and aremore cost effective and accurate than traditional mea-sures of nutritional status.10
Food insecurity and hunger as publicproblems
With valid national measures in sight, policy discussionscan now move to whether hunger and food insecurity arepublic problems worthy of government action. The ex-tent of citizen involvement in private, charitable foodbanks and soup kitchens suggests that the general publicrecognizes the issue. But would the public support gov-ernment involvement in alleviating these conditions?

63
Strong arguments can be made for defining food insecu-rity and hunger as problems of legitimate governmentconcern rather than as individual misfortunes deservingof charity.
Childhood hunger
Adequate nutrition in early life, beginning in the prenatalperiod and onward through early childhood, is stronglyand consistently related to cognitive development andlearning. More practically speaking, with older children,a hungry child cannot take full advantage of classroomopportunities and may, by classroom behavior, interferewith other children’s learning.11 From the perspective ofhuman dignity, it can be argued that no child should haveeducational opportunities and achievements compro-mised by hunger and food insecurity, experiences overwhich she or he has little control. The human and finan-cial costs to society of this “hunger handicap” in theeducational arena are likely to be much greater than thecost of preventing food insecurity and hunger.
Hunger among the elderly
Food insecurity made it difficult for low-income elderlypeople whom we interviewed to follow medically recom-mended diets for such health problems as high bloodpressure.12 For older persons with diabetes, food insecu-rity made it nearly impossible to eat the required regularmeals in synchrony with needed insulin injections. Oneelderly woman with diabetes told us: “This past year inJune, I just didn’t have the money so I didn’t have thefood to eat. I eat a little, but it wasn’t enough. Then I hada lot of low blood sugar spells. They had to take me to theemergency room.” Pragmatically considered, this type offood insecurity results in greater health care expendituresby the federal government. And as with child hunger, itcan be considered an affront to the human dignity of theelderly.
The federal government has had a history of involvementin this area since the 1930s and 1940s, when many of themajor federal food assistance programs began, motivatedin part by the need to find a market for surplus agricul-tural commodities. The FCS mission statement itself con-firms this longstanding commitment: “To alleviate hun-ger and to safeguard the health and well-being of thenation through the administration of nutrition educationand domestic food assistance programs.”
The recently enacted federal welfare reform packagetakes nearly half of its cost savings from the Food Stampprogram, and may seriously compromise the ability ofFCS to achieve its mission. Mark Lino has demonstratedthe extent to which poor families in the United Statesdepend on the program.13 He found food stamps to be themost common income source among poor families withchildren: 69 percent of poor households with children inthe 1990–92 Consumer Expenditure Survey receivedfood stamps, which provided one-fifth of their annual
household income. Our research has found that the insuf-ficiency of food stamp allotments is a major risk factorfor food insecurity.14 Since such allotments are not ad-justed for family composition, it follows that they aremost likely to be insufficient for household types withthe greatest nutrition needs, especially two-adult house-holds with older children. Such households have greateraggregate nutrient requirements than households withone adult and three small children, but the food stampallotments are the same for both.
Failure to address food insecurity and hunger throughpublic action carries a high financial cost, both directlyand through a negative effect on seemingly unaffectedcitizens. Food insecurity and hunger compromise humandignity in ways that are inconsistent with American val-ues. These are public issues that go beyond private char-ity.
Broad welfare versus specific food insecurityinterventions
Food insecurity and hunger, which represent deprivationof one of life’s basic necessities, can certainly be influ-enced by broader policy and program interventions di-rected at poverty. In our research, many of the expectedsociodemographic variables such as low income, loweducational level, being a single parent, and being with-out savings were strongly related to food insecurity, indi-cating that more general interventions aimed at povertywould also have an effect on food insecurity. But theycan also be addressed by quite specific interventionsaimed at expanding availability of and access to food.Food insecure households spent less on food and theywere more likely to have unexpected expenses that de-creased what they could spend on food. In addition, thoserural households in our research sample that engaged invegetable gardening and/or received milk and eggs freefrom friends and neighbors or as in-kind payment foragricultural work were more food secure than compa-rable families that did not do so.
In the present era of welfare policy experimentation, it issurely prudent to maintain public interventions as effec-tive as the federal food assistance programs. Thecountry’s long involvement in providing food assistanceto its most vulnerable citizens and the public’s concernabout the human and financial costs of food insecurityand hunger are likely to keep them on the public policyagenda. Enormous progress has been made over the lastten years in defining food insecurity and hunger aspolicy-relevant concepts and in measuring the extent towhich they exist across the U.S. population. Policy ana-lysts, researchers, and government decision-makers nowhave the research tools to allow them to develop moreeffective programs and policies. n

64
1P. Eisinger, “Measuring Hunger in the United States,” La FollettePolicy Report 6, no. 2 (Fall 1994): 17.
2Report of the President’s Task Force on Food Assistance (Washing-ton, D.C.: The White House, January 1984).
3S. A. Anderson, “Core Indicators of Nutritional Status for Difficult-to-Sample Populations,” Journal of Nutrition 120 (1990): 1559–1600(quotation, p. 1576).
4K. Radimer, C. Olson, J. Greene, C. Campbell, and J-P. Habicht,“Understanding Hunger and Developing Indicators to Assess It inWomen and Children,” Journal of Nutrition Education 24 (1992):38S.
5Kathy Radimer, “Understanding Hunger and Developing Indicatorsto Assess It,” Ph.D. dissertation, Cornell University, August 1990.CCHIP was developed by the Food Research and Action Center, aprivate advocacy organization, in response to the growing concernover hunger in the 1980s.
6Department of Health and Human Services and Department of Agri-culture, “Ten Year Comprehensive Plan for the National NutritionMonitoring and Related Research Program,” Federal Register 58, no.111 (1993): 32772.
7U.S. Department of Agriculture and Department of Health and Hu-man Services, “Proceedings of the Food Security Measurement andResearch Conference,” unpublished report, January 1994.
8A. Kendall, C. Olson and E. Frongillo, Jr., “Validation of theRadimer/Cornell Measures of Hunger and Food Insecurity,” Journalof Nutrition 125 (1995): 2793–2801. This sample is not the same asthe sample of 189 women discussed earlier.
Access to IRP information via computer:the World Wide Web site
IRP has a World Wide Web site that offers easy access to Institute publications. The Institute site includespublications indexes, updated quarterly, information on IRP publications, and ordering information. It provides basicinformation about the Institute’s staff, research interests, and activities such as working groups, conferences,workshops, and seminars. The Web site also includes an annotated list of affiliates, with their particular areas ofexpertise. It offers an extensive set of links to poverty-related sites and data elsewhere.
Publications available on the Web site include files of formatted text of Focus articles, and selected Discussion Papersand Special Reports in both unformatted (ASCII) versions and formatted (Adobe Acrobat or Postscript) files. Fromthe Web site, charts and graphs are available for immediate viewing and for downloading and printing.
IRP’s home page on the Web can be found at: http://www.ssc.wisc.edu/irp/
9E. Frongillo, Jr., B. Rauschenbach, C. Olson, A. Kendall, and A.Colmenares, “Estimating the Prevalence of Hunger and Food Insecu-rity: The Validity of Questionnaire-Based Measures for the Identifi-cation of Households,” Institute for Research on Poverty DiscussionPaper no. 1083-96, University of Wisconsin–Madison.
10Direct measurement of hunger and food insecurity in a food-richenvironment presents challenges to scientific study. Rather than di-rectly measuring hunger and food insecurity in populations, nutri-tionists have traditionally relied on measures of nutritional statussuch as anthropometric, clinical, or biochemical measurements thatare associated with malnutrition in developing countries. However, indeveloped countries, obesity, rather than stunting and wasting, isoften associated with poverty, and anthropometric measures have notproven useful.
11J. L. Brown and E. Pollitt, “Malnutrition, Poverty, and IntellectualDevelopment,” Scientific American, February 1996, pp. 38–43.
12C. Olson, A. Kendall, W. Wolfe, and E. Frongillo, Jr., “Understand-ing the Measurement of Hunger and Food Insecurity in the Elderly,”Institute for Research on Poverty Discussion Paper no. 1088-96,University of Wisconsin–Madison, p. 12.
13M. Lino, “Income and Spending of Poor Households with Chil-dren,” Family Economics and Nutrition Review 9, no. 1 (1996): 2–13.
14C. Olson, B. Rauschenbach, E. Frongillo, Jr., and A. Kendall, “Fac-tors Contributing to Food Insecurity in a Rural Upstate New YorkCounty,” Institute for Research on Poverty Discussion Paperno. 1107-96, University of Wisconsin–Madison.

65
Welfare reform and the poor children of workingparentsDaniel T. Lichter and Erica L. Gardner
Daniel T. Lichter is Professor of Sociology and Directorof the Population Research Institute and Erica L. Gardneris a graduate student in the Department of Sociology atthe Pennsylvania State University.
The Welfare Reform Task Force created by PresidentClinton shortly after he took office argued for reform thatresonated with the basic American values of work, fam-ily, responsibility, and opportunity. The Personal Re-sponsibility and Work Opportunity Reconciliation Actpassed in August 1996 sought to embody these themes ina radically altered social welfare system. Now that theend of welfare “as we know it” has been accomplished,cash assistance will be administered at the state levelthrough the mechanism of federal block grants. Capshave been placed on the length of time that welfarerecipients can receive public assistance (e.g., two yearsconsecutively and five years total). And work has beenmade a condition for the receipt of public assistance.
For poor mothers receiving public assistance, welfarereform means that staying home and taking care of chil-dren is no longer regarded as acceptable behavior. Un-married mothers will no longer be counted among the“deserving poor”—that is, deserving of public assis-tance. Although the empirical evidence is unclear, thebelief still persists that welfare itself creates incentivesfor out-of-wedlock childbearing and undermines tradi-tional married couple families.1 Welfare presumably pro-vides poor women with an economic alternative to mar-riage—a “surrogate husband.” It is not surprising, then,that supporting the American values of economic self-sufficiency and strong families is a central goal of cur-rent welfare reform legislation. Across the political spec-trum, the consensus is that welfare should provide tem-porary relief in a time of need; it should not be a way oflife. The program that is replacing Aid to Families withDependent Children will be known as Temporary Aid toNeedy Families.
The underlying assumption, of course, is that promotingwork among single parents will help reduce welfare de-pendence by ameliorating poverty among women andtheir children. This article asks why the unmarried moth-ers of poor children are now targets of welfare reformlegislation that promotes parental employment. It thenevaluates whether parental work alone will be an effec-tive short-run panacea for child poverty. The discussion
concludes with several behavioral and demographic im-plications of the current welfare reforms that may in thelong term reduce child poverty rates.2
Why is workfare targeted at single mothers?
Much of the welfare debate has centered on poor non-working women with children. One view is that poormothers are being made scapegoats for society’s prob-lems. Another view—a demographic one—is more san-guine. Simply, welfare reform has targeted single moth-ers because a disproportionate share are poor, arereceiving public assistance, and are not employed. In-deed, Table 1 shows that, in 1990, 29.1 percent of allpoor children, but only 6.8 percent of all children, livedwith a single mother who was not working. More impor-tantly, 84.1 percent of poor children lived in families inwhich at least one parent was not employed or was em-ployed part time. Stated differently, this means that overfour-fifths—an overwhelming majority—of American
Table 1Percentage of All and Poor Children under Age 18, by Family
Living Arrangements and Parental Work Patterns
Metro. _ Nonmetro._ Total _All Poor All Poor All Poor
Living with both parentsBoth full-time 24.9 3.4 26.1 4.5 25.1 3.7Father full-time,
mother part-time 17.3 4.2 17.0 5.6 17.2 4.6Father part-time,
mother full-time 2.4 1.5 2.8 1.9 2.5 1.6Both part-time 2.0 2.6 2.7 3.5 2.1 2.8Father full-time only 23.0 13.1 21.4 16.4 22.7 14.0Father part-time only 2.5 5.6 3.4 7.0 2.7 6.0Mother full-time only 1.0 1.1 1.3 1.3 1.1 1.1Mother part-time only 0.5 1.2 0.8 1.6 0.6 1.3Neither in labor force 1.6 5.5 2.3 6.4 1.8 5.8
Living with fatherFull-time 2.9 2.2 2.7 2.1 2.8 2.2Part-time 0.8 1.7 0.9 1.8 0.8 1.7Not in labor force 0.5 1.7 0.6 1.7 0.5 1.7
Living with motherFull-time 9.0 10.0 7.2 9.9 8.6 10.0Part-time 4.5 14.8 4.7 13.7 4.6 14.5Not in labor force 7.0 31.5 6.2 22.6 6.8 29.1
Total 100.0 100.0 100.0 100.0 100.0 100.0
Source: 1990 U.S.Census, 5% Public Use Microdata Sample (3.2million children). Note: Percentages have been rounded.

66
41%
53%
6%
Full-time
Not in labor force
Part-time
19%
54%
27%
Living with both parents
Living with Mother Living with Father
Full-time
Not in labor force
Part-time
40%
30%
30%
poor children lived with parents who, if not disabled,could conceivably work more.
Figure 1 shows that 53 percent of poor children lived in asingle-mother family; only 19 percent of these mothersworked full time, whereas 43 percent of all single moth-ers, poor and nonpoor, did so (not shown in Figure 1).Among children living in poor married-couple families,only 9 percent had two full-time working parents. Theimplication is clear: the large majority of poor children,regardless of whether they live with one parent or two,have co-residential parents who could conceivably workmore.
Table 2 disaggregates these analyses of parental workpatterns for racial and spatial groups for all and for poorchildren. The differences between racial groups of chil-dren, poor or not, are very large. For example, only 6.9percent of all metropolitan African-American childrenlived in a traditional married-couple family with a malebreadwinner and female homemaker, compared withabout 25 percent of their white and Latino counterparts.
Over 50 percent of all African-American children livedin female-headed families, and more of them lived with anonworking single mother than in any other living ar-rangement.
Not surprisingly, low rates of parental employment fig-ure prominently in the analysis of poor children (Table2). In metropolitan areas, 80.3 percent of poor African-American children but only 46 percent of poor whitechildren lived with single mothers. Over one-half of theAfrican-American mothers were not in the labor forceand only 17 percent worked full time. About 20 percentof the white children lived with a mother who workedfull time.
From a strictly demographic perspective, welfare reformthat promotes economic self-sufficiency arguably is ap-propriately targeted at the disproportionately large shareof parents of poor children who are not now working orwho are only marginally attached to the labor force. Ofcourse, these data say nothing about an equally compel-ling question: whether the failure of many poor parents to
Figure 1. Percentage of poor children under 18, by family living arrangements.
Source: 1990 U.S. Census, 5 percent Public Use Microdata Sample.

67
work is a matter of choice, of limited job skills, of limitedopportunity or whether they would still be poor even ifthe parents did work.
Will parental work significantly reduce childpoverty?
From a policy standpoint, the implications of these re-sults seem straightforward: promoting work among cur-rently poor or welfare-dependent mothers will contributeto lower poverty rates while increasing economic self-sufficiency.3 Table 3 shows that the benefits of parentalwork are potentially enormous in reducing child poverty.For metropolitan white children, for example, the pov-erty rate of those living with two full-time working par-ents was only 1.6 percent. This rate is substantially lowerthan the overall poverty rate for metropolitan white chil-dren, 9.9 percent. At the other extreme, 86.5 percent ofnonmetropolitan African-American children living witha single, nonworking mother were poor. Clearly, parentalwork benefits children, if measured strictly in economicterms.
What would be the poverty rate of children if all co-residential parents, single or married, worked full time?The most optimistic employment scenario would be onewhere parents who are currently not employed or workonly part time instead worked full time and experienced
Table 2Percentage of All and Poor Children under Age 18, by Family
Living Arrangements and Parental Work Patterns
All Children _ Poor Children _ Metro. _ Nonmetro. _ Metro. _ Nonmetro. _White Black Latino White Black Latino White Black Latino White Black Latino
Living with both parentsBoth full-time 26.9 18.1 20.2 27.7 17.0 17.9 4.3 1.5 4.2 5.2 2.6 4.1Father full-time,
mother part-time 20.4 6.5 11.0 18.4 7.1 12.5 5.5 1.8 4.8 6.4 2.9 5.9Father part-time,
mother full-time 2.4 2.4 2.8 2.9 2.7 2.6 1.7 0.8 2.0 2.0 1.5 1.6Both part-time 1.9 1.5 2.5 2.7 2.0 3.5 3.2 1.3 3.1 3.9 1.9 4.4Father full-time only 25.9 6.9 23.0 22.7 7.6 25.4 16.4 3.4 19.0 18.7 5.8 23.9Father part-time only 2.4 1.5 4.3 3.4 1.7 5.6 7.1 1.9 7.4 8.2 2.2 8.9Mother full-time only 1.0 1.3 1.1 1.3 1.4 1.2 1.4 0.7 1.0 1.5 0.9 1.2Mother part-time only 0.5 0.6 0.7 0.8 0.9 1.2 1.6 0.7 1.1 1.8 1.0 1.7Neither in labor force 1.5 1.4 2.5 2.2 1.8 3.4 7.9 2.3 5.1 7.7 2.7 5.9
Living with fatherFull-time 2.5 3.4 4.2 2.6 2.9 3.5 2.0 1.5 3.2 2.1 1.9 2.8Part-time 0.5 1.4 1.4 0.8 1.3 1.2 1.6 1.6 2.0 1.9 1.4 1.8Not in labor force 0.3 1.3 0.8 0.5 1.2 0.9 1.5 2.0 1.5 1.7 1.7 1.6
Living with motherFull-time 7.2 19.7 8.7 6.1 17.4 6.5 9.1 13.4 7.5 8.2 16.2 6.9Part-time 2.9 13.3 5.0 3.5 14.8 5.3 12.4 22.8 9.3 11.5 22.4 9.4Not in labor force 3.7 20.8 11.6 4.4 20.3 9.4 24.5 44.1 28.8 19.0 34.8 20.0
Total 100.0 100.0 100.0 100.0 100.0 100.0 100.0 100.0 100.0 100.0 100.0 100.0
Source: 1990 U.S. Census, 5 percent Public Use Microdata Sample (3.2 million children). Note: Percentages have been rounded.
the low poverty rates of children whose parents are cur-rently working full time. A relatively simple mathemati-cal exercise demonstrates this scenario: we can weightthe poverty rates of children with full-time workingparent(s) for each of the other family types by the propor-tion of children in the various family statuses, and thusestimate a weighted or implied overall poverty rate forchildren.
For example, in the case of metropolitan white children,this involves summing the following products: the pov-erty rate of children with two working parents (1.6)weighted by the proportion of white metropolitan chil-dren living with two parents (.83); the poverty rate ofchildren with one working female parent (12.4) weightedby the proportion of white metropolitan children livingwith a single mother (.14); and the poverty rate of chil-dren with one working male parent (8.0) weighted by theproportion of white metropolitan children living with asingle father (.03). This exercise implies that the povertyrate for white metropolitan children would drop to 3.5percent, compared with the current rate of 9.9 percent, ifthe children’s co-residential parents worked full time andreceived earnings similar to those of current workers.These calculations suggest that poverty rates would bereduced by two-thirds under this full-employment sce-nario. Of course, full employment is unrealistic; more-over, current labor force nonparticipants and the unem-ployed, were they to be employed, would be unlikely toearn as much as those currently employed.

68
As a heuristic devise, our approach is nevertheless usefulbecause it provides upper-bound estimates of reductionsin child poverty using the most optimistic assumptionsregarding changes in parental employment. For ex-ample, for poor African-American children in metropoli-tan areas, the implied poverty rate would be 25.2 percentif the children’s parents worked full time—a reduction of33 percent from the observed rate of 37.7 (Table 3). Fornonmetropolitan whites, the poverty rate would dropfrom 17.4 to 8.1 under the assumption of full employ-ment, and among nonmetropolitan blacks, the rate woulddrop from 50.3 to 29.6 percent. These implied rates pro-vide a straightforward but important lesson: even underthe best of scenarios, full-time work alone will not elimi-nate the disproportionately high poverty rates amongAmerican children.
Finally, the data in Table 3 support three additional con-clusions. First, nonmetropolitan children (regardless ofparental work patterns) have higher poverty rates thanmetropolitan children. To be sure, rural parents sufferfrom a deficit of human capital, which depresses wages.Yet rural educational levels increased over the past de-cade, while poverty rates climbed among nonmetro-politan workers.4 Paradoxically, work is now regarded asthe best solution to the poverty problem, but the relation-ship between work and poverty continues to weaken.
Second, even under the most optimistic assumptions(that is, mothers working full time), poverty rates amongchildren raised in families headed by unmarried womenwill remain very high. For example, in nonmetropolitan
areas, the poverty rate of white children living with asingle mother working full time was 23.3 percent—a rateof poverty roughly double the national average. Amongtheir African-American counterparts, the poverty ratewas 46.9 percent, even when their mothers worked fulltime. Parental work may help some children, but manyalso will remain impoverished economically, and per-haps more impoverished emotionally, if their motherswork full time.
Third, racial inequality among metropolitan andnonmetropolitan children cannot be explained away byracial differences in parental employment.5 In nonmetro-politan areas, white children living with a single motherwho worked full time had a rate of poverty that was veryhigh, but substantially lower than their black counter-parts (23.3 versus 46.9 percent). White children living intraditional families, with a breadwinner father and home-maker mother, had a poverty rate of 14.3 percent. Thecomparable rates among black and Latino children were38.8 and 36.2 percent, respectively.
These results should not be misconstrued. Parental workdoes matter in children’s lives. There is a very strongrelationship, as we have noted, between parental failureto work and child poverty. Work incentives should in-stead be regarded as one of many possible solutions towelfare dependency and poverty, including those thataddress the issues of low wages (e.g., minimum wagelegislation or negative income taxes), child support as-surance, human resource development (e.g., job trainingand education), and family stability.
Table 3Poverty Rates of Children under Age 18, by
Family Living Arrangements and Parental Work Patterns, 1990
Metro. _ Nonmetro. _White Black Latino White Black Latino
Living with both parentsBoth full-time 1.6 3.1 6.4 3.3 7.7 8.9Father full-time, mother part-time 2.7 10.7 13.5 6.1 20.8 18.3Father part-time, mother full-time 7.0 12.3 22.0 12.1 28.5 23.2Both part-time 16.3 33.1 37.5 25.1 48.6 48.6Father full-time only 6.3 18.6 25.6 14.3 38.8 36.2Father part-time only 29.3 49.3 52.9 41.5 65.5 61.3Mother full-time only 13.6 20.8 28.2 19.5 32.0 39.5Mother part-time only 30.7 47.0 46.1 40.0 55.5 55.6Neither in labor force 52.1 62.2 62.6 59.9 73.8 65.6
Living with fatherFull-time 8.0 16.6 23.5 14.0 32.6 31.2Part-time 28.7 43.4 45.3 42.5 57.2 57.8Not in labor force 46.1 58.0 56.4 58.5 69.4 69.2
Living with motherFull-time 12.4 25.7 26.6 23.3 46.9 40.4Part-time 42.0 64.7 58.3 57.6 76.3 68.5Not in labor force 65.6 79.9 76.8 74.8 86.5 81.5
Total 9.9 37.7 31.0 17.4 50.3 38.5
Source: 1990 U.S. Census, 5 percent Public Use Microdata Sample (3.2 million children). Note: Percentages have been rounded.
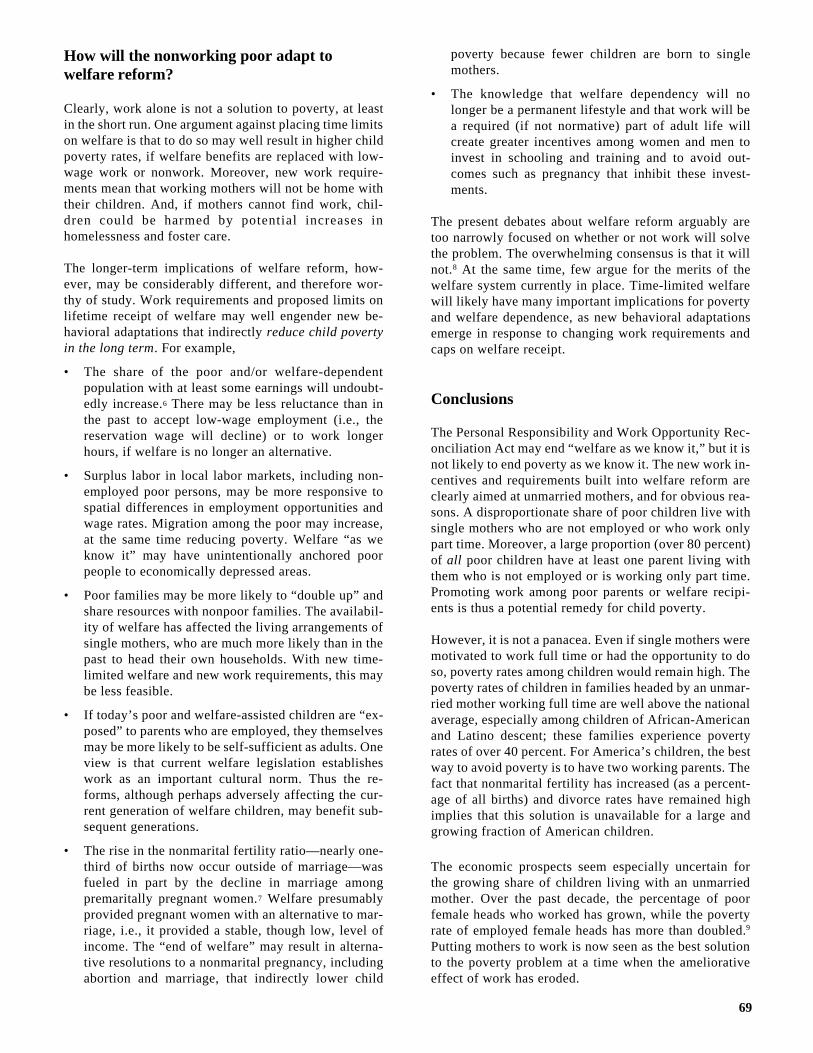
69
How will the nonworking poor adapt towelfare reform?
Clearly, work alone is not a solution to poverty, at leastin the short run. One argument against placing time limitson welfare is that to do so may well result in higher childpoverty rates, if welfare benefits are replaced with low-wage work or nonwork. Moreover, new work require-ments mean that working mothers will not be home withtheir children. And, if mothers cannot find work, chil-dren could be harmed by potential increases inhomelessness and foster care.
The longer-term implications of welfare reform, how-ever, may be considerably different, and therefore wor-thy of study. Work requirements and proposed limits onlifetime receipt of welfare may well engender new be-havioral adaptations that indirectly reduce child povertyin the long term. For example,
• The share of the poor and/or welfare-dependentpopulation with at least some earnings will undoubt-edly increase.6 There may be less reluctance than inthe past to accept low-wage employment (i.e., thereservation wage will decline) or to work longerhours, if welfare is no longer an alternative.
• Surplus labor in local labor markets, including non-employed poor persons, may be more responsive tospatial differences in employment opportunities andwage rates. Migration among the poor may increase,at the same time reducing poverty. Welfare “as weknow it” may have unintentionally anchored poorpeople to economically depressed areas.
• Poor families may be more likely to “double up” andshare resources with nonpoor families. The availabil-ity of welfare has affected the living arrangements ofsingle mothers, who are much more likely than in thepast to head their own households. With new time-limited welfare and new work requirements, this maybe less feasible.
• If today’s poor and welfare-assisted children are “ex-posed” to parents who are employed, they themselvesmay be more likely to be self-sufficient as adults. Oneview is that current welfare legislation establisheswork as an important cultural norm. Thus the re-forms, although perhaps adversely affecting the cur-rent generation of welfare children, may benefit sub-sequent generations.
• The rise in the nonmarital fertility ratio—nearly one-third of births now occur outside of marriage—wasfueled in part by the decline in marriage amongpremaritally pregnant women.7 Welfare presumablyprovided pregnant women with an alternative to mar-riage, i.e., it provided a stable, though low, level ofincome. The “end of welfare” may result in alterna-tive resolutions to a nonmarital pregnancy, includingabortion and marriage, that indirectly lower child
poverty because fewer children are born to singlemothers.
• The knowledge that welfare dependency will nolonger be a permanent lifestyle and that work will bea required (if not normative) part of adult life willcreate greater incentives among women and men toinvest in schooling and training and to avoid out-comes such as pregnancy that inhibit these invest-ments.
The present debates about welfare reform arguably aretoo narrowly focused on whether or not work will solvethe problem. The overwhelming consensus is that it willnot.8 At the same time, few argue for the merits of thewelfare system currently in place. Time-limited welfarewill likely have many important implications for povertyand welfare dependence, as new behavioral adaptationsemerge in response to changing work requirements andcaps on welfare receipt.
Conclusions
The Personal Responsibility and Work Opportunity Rec-onciliation Act may end “welfare as we know it,” but it isnot likely to end poverty as we know it. The new work in-centives and requirements built into welfare reform areclearly aimed at unmarried mothers, and for obvious rea-sons. A disproportionate share of poor children live withsingle mothers who are not employed or who work onlypart time. Moreover, a large proportion (over 80 percent)of all poor children have at least one parent living withthem who is not employed or is working only part time.Promoting work among poor parents or welfare recipi-ents is thus a potential remedy for child poverty.
However, it is not a panacea. Even if single mothers weremotivated to work full time or had the opportunity to doso, poverty rates among children would remain high. Thepoverty rates of children in families headed by an unmar-ried mother working full time are well above the nationalaverage, especially among children of African-Americanand Latino descent; these families experience povertyrates of over 40 percent. For America’s children, the bestway to avoid poverty is to have two working parents. Thefact that nonmarital fertility has increased (as a percent-age of all births) and divorce rates have remained highimplies that this solution is unavailable for a large andgrowing fraction of American children.
The economic prospects seem especially uncertain forthe growing share of children living with an unmarriedmother. Over the past decade, the percentage of poorfemale heads who worked has grown, while the povertyrate of employed female heads has more than doubled.9
Putting mothers to work is now seen as the best solutionto the poverty problem at a time when the ameliorativeeffect of work has eroded.

70
Welfare policies that create maternal incentives to workor that include new work requirements may help reduce,but will not end, child poverty. They also mean thatwomen and children may be required adopt new behav-ioral responses, such as migration or doubling up, thatimpose other hardships on children. Promoting workshould thus be regarded as only one component of acomprehensive welfare program. Minimum wage legis-lation, child support compliance and assurance, and ex-panded earned income tax credits may provide familyincome supports that are especially beneficial to poorchildren. n
1R. A. Moffitt, “The Effect of the Welfare System on NonmaritalChildbearing,” in Department of Health and Human Services, Reportto Congress on Out-of-Wedlock Childbearing (Washington, D.C.:GPO, 1995), pp. 167–76; D. T. Lichter, “The Retreat From Marriageand the Rise in Nonmarital Fertility,” in Report to Congress on Out-of-Wedlock Childbearing, pp. 137–46.
2Support for this research was provided by a cooperative agreementfrom the Economic Research Service, United States Department ofAgriculture, and from the Russell Sage Foundation. This research wasalso supported by core funding (P30 HD28263-01) from the NationalInstitute of Child Health and Human Development to the PopulationResearch Institute, Pennsylvania State University. The assistance ofRobert Anderson, Edith Ericson, and Wendy Manning is greatly ap-preciated.
The analysis is based on the 5 percent sample of the 1990 PublicUse Microdata Sample (PUMS) and is limited to children aged under18, living with at least one parent. Each child is represented by arecord which includes information (e.g., employment status) on eachco-residential parent. The sample size is 3.1 million children.
3There can be little debate over whether labor force nonparticipationor unemployment is strongly associated with poverty. For example,the poverty rate among full-time workers was only 2.4 percent in1989, whereas the poverty rate among nonworkers (aged 15 andolder) was 20.7 percent. The poverty rate among nonworking femaleheads was 53.7 percent. See U.S. Bureau of the Census, MoneyIncome and Poverty Status in the United States: 1989, Series P-60,no. 168 (Washington, D.C.: GPO, 1990).
4D. T. Lichter, G. M. Johnston, and D. K. McLaughlin, “ChangingLinkages Between Work and Poverty in Rural America.” Rural Soci-ology 59(1994): 395–415.
5D. T. Lichter and N. Landale, “Parental Work, Family Structure, andPoverty Among Latino Children.” Journal of Marriage and the Fam-ily 57(1995): 346–354.
6R. Lerman, “Increasing the Employment and Earnings of WelfareRecipients,” in Welfare Reform: An Analysis of the Issues, ed. IsabelV. Sawhill (Washington, D.C.: Urban Institute, 1995), pp. 17–20.
7W. D. Manning, “Marriage and Cohabitation Following PremaritalConception,” Journal of Marriage and the Family 55(1993): 839-850.
8See Sawhill, Welfare Reform: An Analysis of the Issues, especiallythe chapter by S. K. Danziger and S. Danziger, “Will Welfare Recipi-ents Find Work When Welfare Ends?”
9See Lichter, Johnston, and McLaughlin, “Changing Linkages.”

71
Order form for FOCUS NEWSLETTER (free of charge)
Send to: FOCUSInstitute for Research on Poverty1180 Observatory Drive3412 Social Science BuildingUniversity of WisconsinMadison, WI 53706(Fax: 608-265-3119)
Name:_________________________________________________________________________________________
Address:_______________________________________________________________________________________
______________________________________________________________________________________________ City State Zip
(Multiple copies of any issue: $1.00 each)
Focus articles also appear on the IRP World Wide Web site, http://www.ssc.wisc.edu/irp/
Order form for Institute DISCUSSION PAPERS and REPRINTS
Prepayment required. Make checks payable to the Institute for Research on Poverty in U.S. dollars only.
SUBSCRIPTIONS: July 1–June 30o Discussion Papers and Reprints ($70.00)
INDIVIDUAL PUBLICATIONS: (Please fill in number or title and author)
Discussion Papers ($3.50)________________________________________________________________________
Reprints ($2.00)________________________________________________________________________________
Special Reports (prices vary)______________________________________________________________________
Send to: Institute for Research on Poverty1180 Observatory Drive3412 Social Science BuildingUniversity of WisconsinMadison, WI 53706
Name:_________________________________________________________________________________________
Address:_______________________________________________________________________________________
______________________________________________________________________________________________ City State Zip
o Please indicate here if this is a change of address.

72
Focus1180 Observatory Drive3412 Social Science BuildingUniversity of Wisconsin–MadisonMadison, Wisconsin 53706


![Digital natives&digital immigrants[1]](https://img.pdfslide.net/doc/110x75/5589de9bd8b42a77778b45ff/digital-nativesdigital-immigrants1.jpg)