Embed Size (px)
Citation preview
NOPAUnlocking the Power of the Seed
Unlocking the Power of the Seed NOPA
NOPA.org
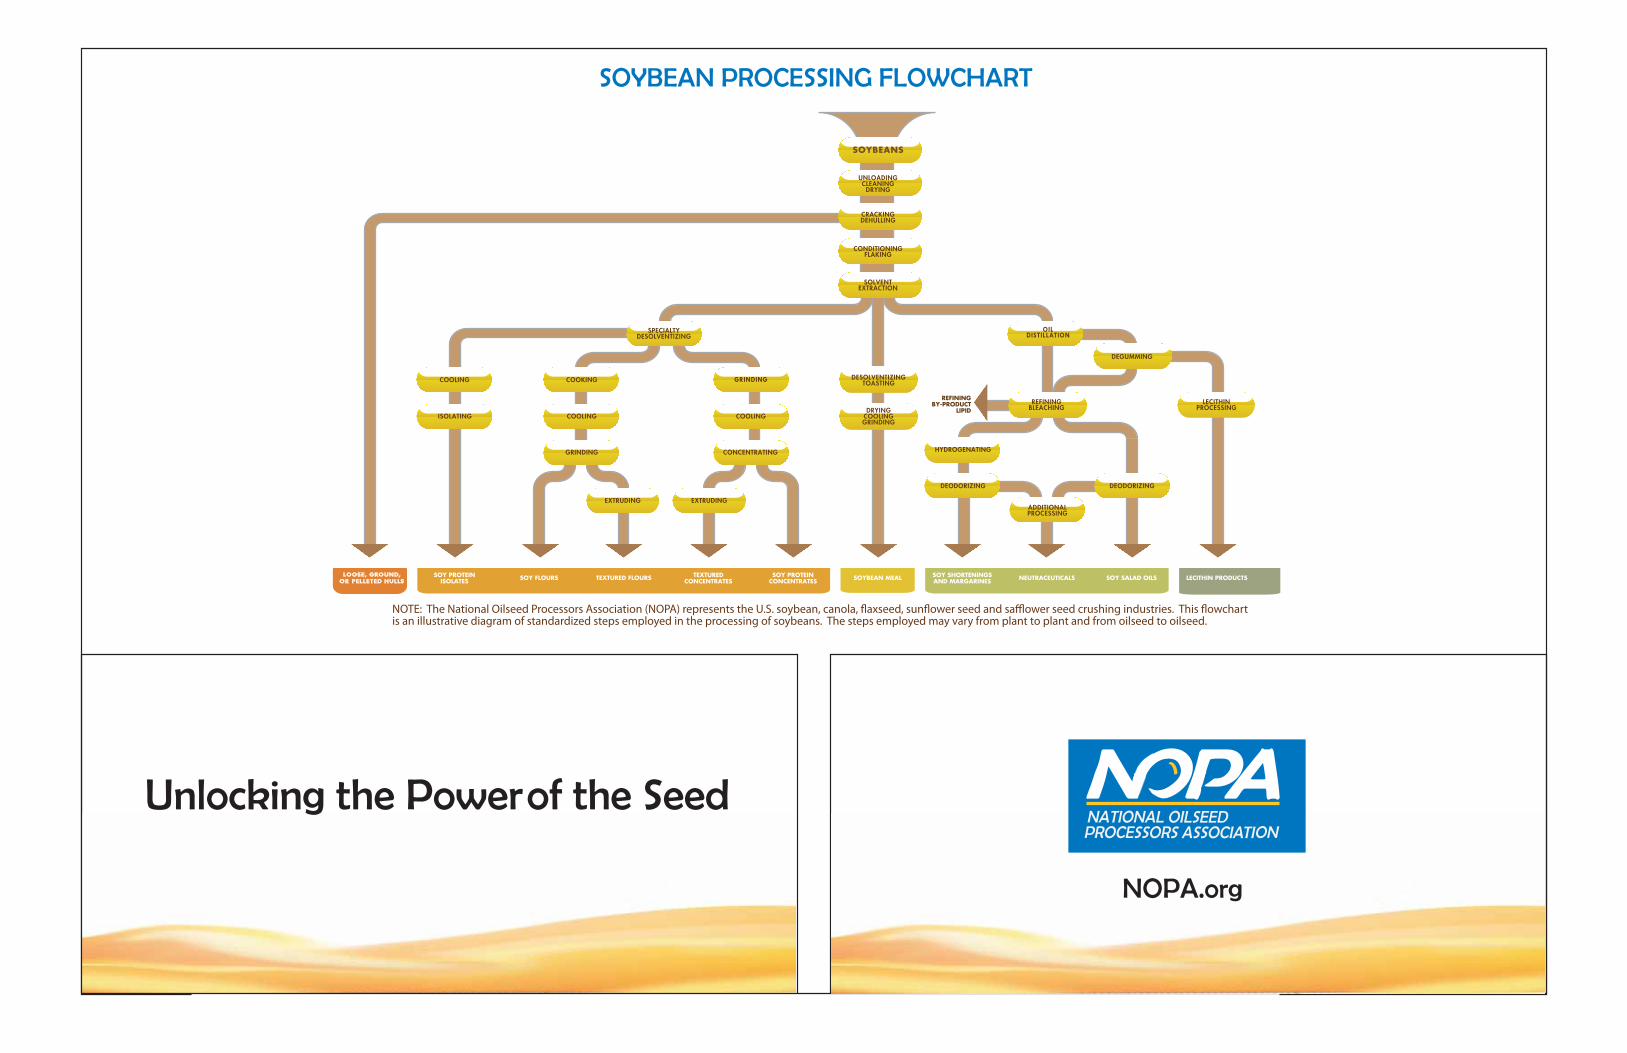
LOOSE, GROUND,OR PELLETED HULLS
OILDISTILLATION
GRINDING
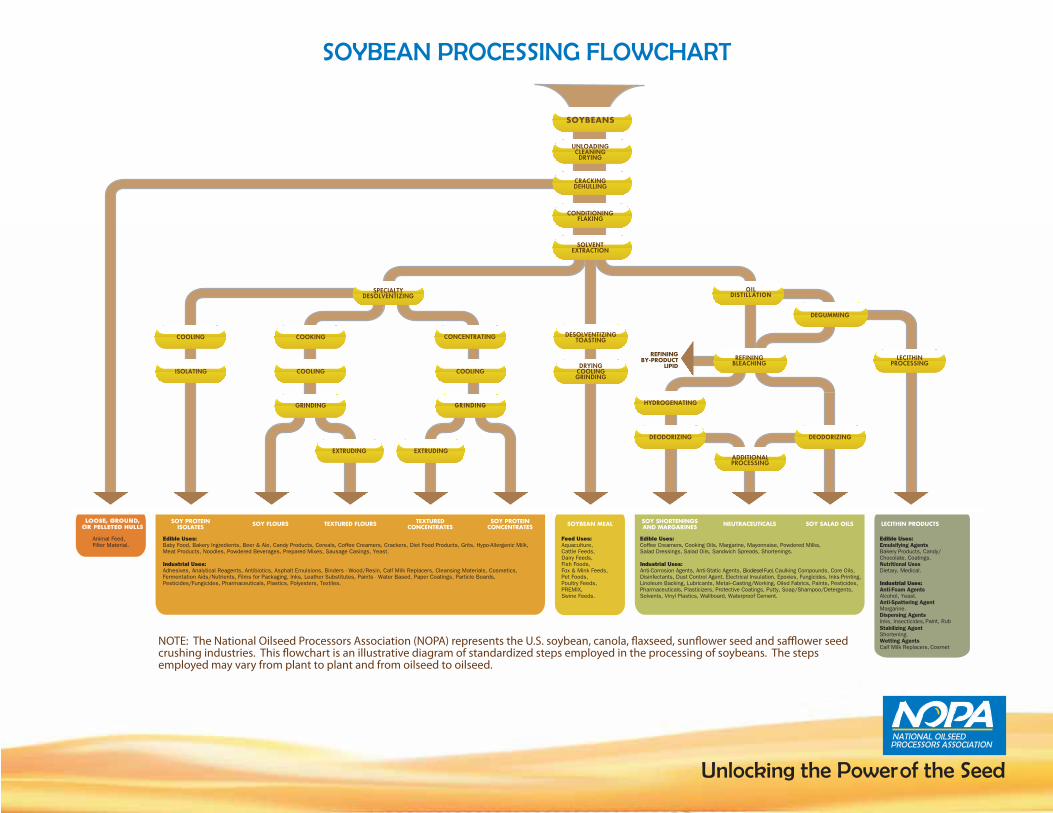
SOYBEAN PROCESSING FLOWCHART
NOTE: The National Oilseed Processors Association (NOPA) represents the U.S. soybean, canola, �axseed, sun�ower seed and sa�ower seed crushing industries. This �owchart is an illustrative diagram of standardized steps employed in the processing of soybeans. The steps employed may vary from plant to plant and from oilseed to oilseed.
NOPAUnlocking the Power of the Seed
1300 L Street, NW Suite 1020 Washington, DC 20005 T 202.842.0463 F 202.842.9126 www.nopa.org
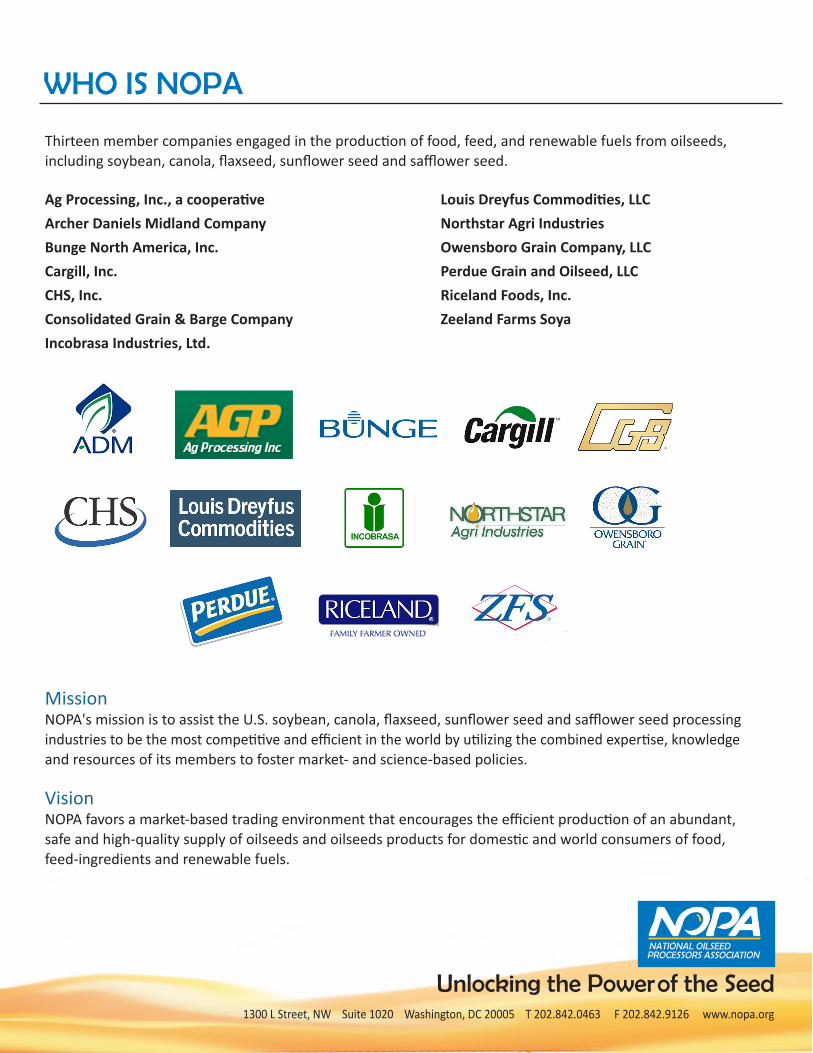
Thirteen member companies engaged in the production of food, feed, and renewable fuels from oilseeds, including soybean, canola, flaxseed, sunflower seed and safflower seed.
Ag Processing, Inc., a cooperativeArcher Daniels Midland CompanyBunge North America, Inc.Cargill, Inc.CHS, Inc.Consolidated Grain & Barge CompanyIncobrasa Industries, Ltd.
MissionNOPA's mission is to assist the U.S. soybean, canola, flaxseed, sunflower seed and safflower seed processing industries to be the most competitive and efficient in the world by utilizing the combined expertise, knowledge and resources of its members to foster market- and science-based policies.
VisionNOPA favors a market-based trading environment that encourages the efficient production of an abundant, safe and high-quality supply of oilseeds and oilseeds products for domestic and world consumers of food, feed-ingredients and renewable fuels.
Louis Dreyfus Commodities, LLCNorthstar Agri IndustriesOwensboro Grain Company, LLCPerdue Grain and Oilseed, LLCRiceland Foods, Inc.Zeeland Farms Soya
WHO IS NOPA
NOPAUnlocking the Power of the Seed
1300 L Street, NW Suite 1020 Washington, DC 20005 T 202.842.0463 F 202.842.9126 www.nopa.org
Title PlaceholderText placeholder
NOPA ISSUES OVERVIEW
NOPAUnlocking the Power of the Seed
1300 L Street, NW Suite 1020 Washington, DC 20005 T 202.842.0463 F 202.842.9126 www.nopa.org
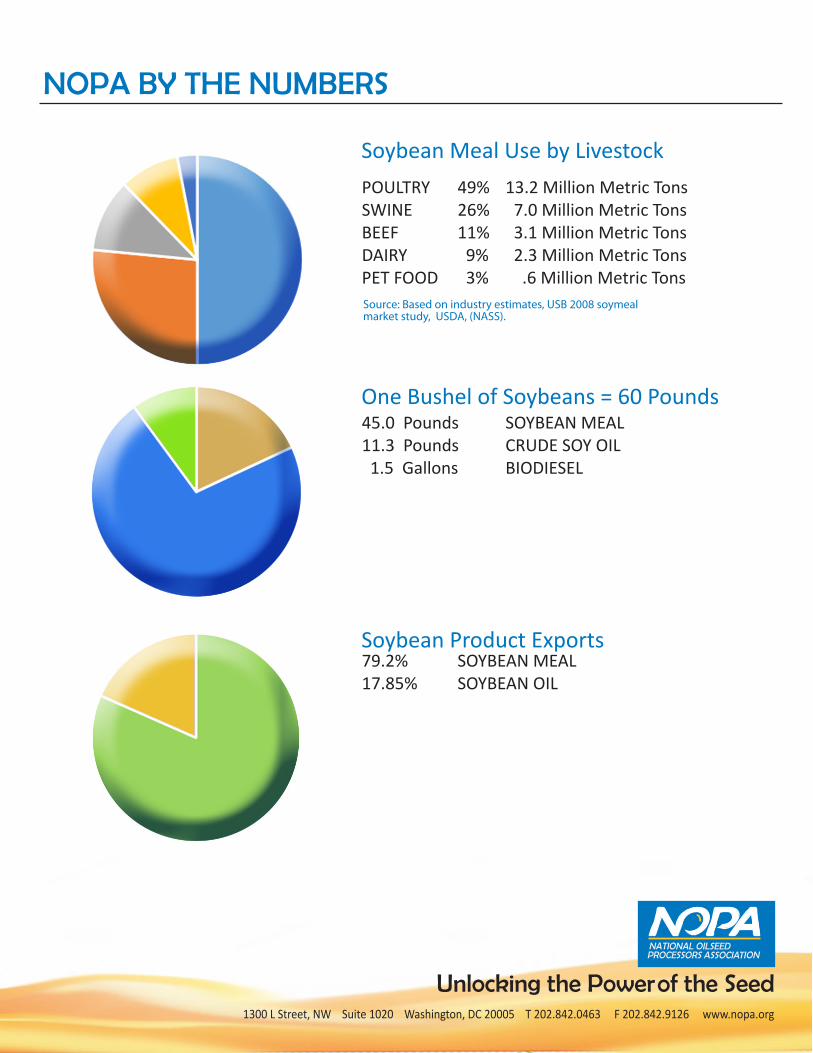
Soybean Meal Use by Livestock
One Bushel of Soybeans = 60 Pounds
Soybean Product Exports
NOPA BY THE NUMBERS
POULTRY 49% 13.2 Million Metric TonsSWINE 26% 7.0 Million Metric TonsBEEF 11% 3.1 Million Metric TonsDAIRY 9% 2.3 Million Metric TonsPET FOOD 3% .6 Million Metric Tons
45.0 Pounds SOYBEAN MEAL 11.3 Pounds CRUDE SOY OIL 1.5 Gallons BIODIESEL
79.2% SOYBEAN MEAL 17.85% SOYBEAN OIL
Source: Based on industry estimates, USB 2008 soymeal market study, USDA, (NASS).
NOPAUnlocking the Power of the Seed
1300 L Street, NW Suite 1020 Washington, DC 20005 T 202.842.0463 F 202.842.9126 www.nopa.org
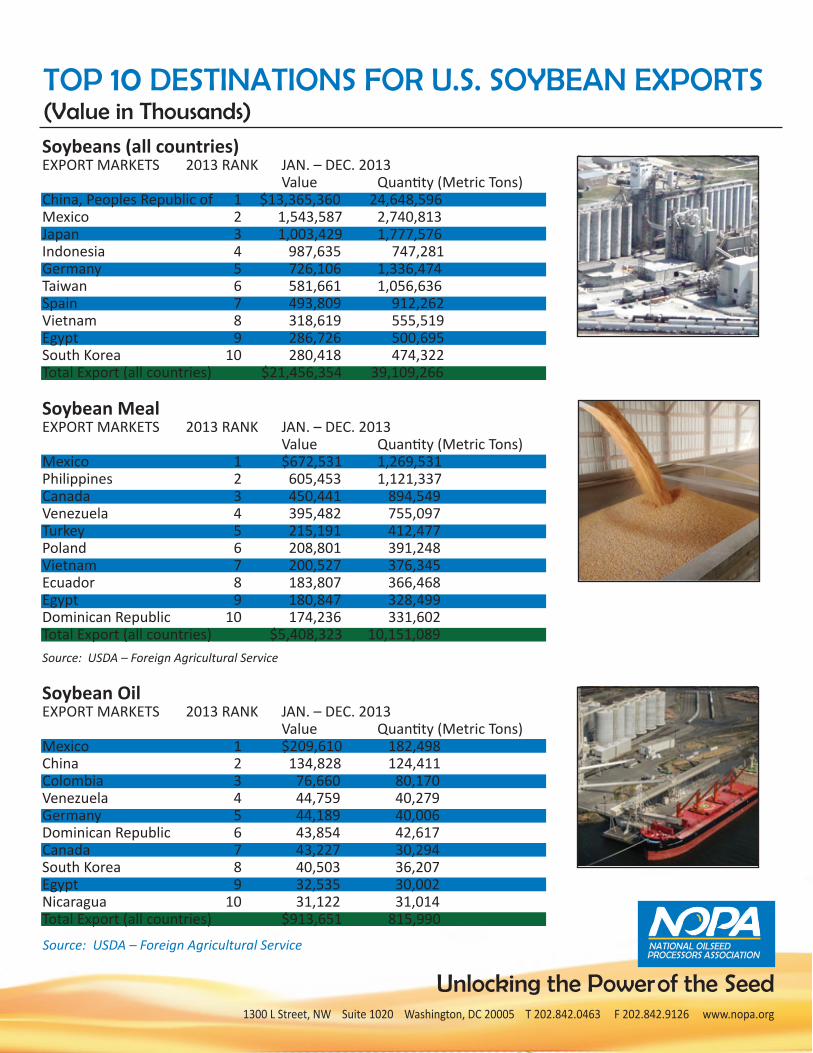
TOP 10 DESTINATIONS FOR U.S. SOYBEAN EXPORTS(Value in Thousands)
Soybeans (all countries)EXPORT MARKETS 2013 RANK JAN. – DEC. 2013 Value Quantity (Metric Tons)China, Peoples Republic of 1 $13,365,360 24,648,596Mexico 2 1,543,587 2,740,813Japan 3 1,003,429 1,777,576Indonesia 4 987,635 747,281Germany 5 726,106 1,336,474Taiwan 6 581,661 1,056,636Spain 7 493,809 912,262Vietnam 8 318,619 555,519Egypt 9 286,726 500,695South Korea 10 280,418 474,322Total Export (all countries) $21,456,354 39,109,266
Soybean MealEXPORT MARKETS 2013 RANK JAN. – DEC. 2013 Value Quantity (Metric Tons)Mexico 1 $672,531 1,269,531Philippines 2 605,453 1,121,337Canada 3 450,441 894,549Venezuela 4 395,482 755,097Turkey 5 215,191 412,477Poland 6 208,801 391,248Vietnam 7 200,527 376,345Ecuador 8 183,807 366,468Egypt 9 180,847 328,499Dominican Republic 10 174,236 331,602Total Export (all countries) $5,408,323 10,151,089Source: USDA – Foreign Agricultural Service
Soybean OilEXPORT MARKETS 2013 RANK JAN. – DEC. 2013 Value Quantity (Metric Tons)Mexico 1 $209,610 182,498China 2 134,828 124,411Colombia 3 76,660 80,170Venezuela 4 44,759 40,279Germany 5 44,189 40,006Dominican Republic 6 43,854 42,617Canada 7 43,227 30,294South Korea 8 40,503 36,207Egypt 9 32,535 30,002Nicaragua 10 31,122 31,014Total Export (all countries) $913,651 815,990
Source: USDA – Foreign Agricultural Service
NOPAUnlocking the Power of the Seed
1300 L Street, NW Suite 1020 Washington, DC 20005 T 202.842.0463 F 202.842.9126 www.nopa.org
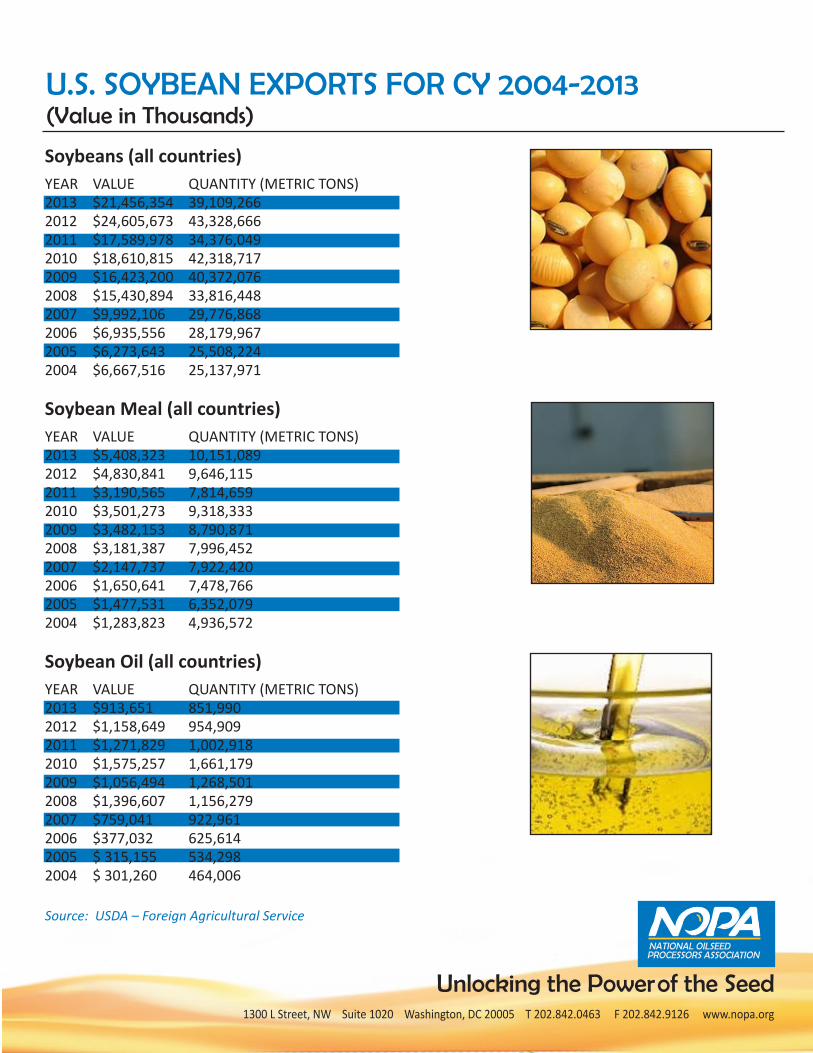
Soybeans (all countries)YEAR VALUE QUANTITY (METRIC TONS)2013 $21,456,354 39,109,2662012 $24,605,673 43,328,6662011 $17,589,978 34,376,0492010 $18,610,815 42,318,7172009 $16,423,200 40,372,0762008 $15,430,894 33,816,4482007 $9,992,106 29,776,8682006 $6,935,556 28,179,9672005 $6,273,643 25,508,2242004 $6,667,516 25,137,971
Soybean Meal (all countries)YEAR VALUE QUANTITY (METRIC TONS)2013 $5,408,323 10,151,0892012 $4,830,841 9,646,1152011 $3,190,565 7,814,6592010 $3,501,273 9,318,3332009 $3,482,153 8,790,8712008 $3,181,387 7,996,4522007 $2,147,737 7,922,4202006 $1,650,641 7,478,7662005 $1,477,531 6,352,0792004 $1,283,823 4,936,572
Soybean Oil (all countries)YEAR VALUE QUANTITY (METRIC TONS)2013 $913,651 851,9902012 $1,158,649 954,9092011 $1,271,829 1,002,9182010 $1,575,257 1,661,1792009 $1,056,494 1,268,5012008 $1,396,607 1,156,2792007 $759,041 922,9612006 $377,032 625,6142005 $ 315,155 534,2982004 $ 301,260 464,006
Source: USDA – Foreign Agricultural Service
U.S. SOYBEAN EXPORTS FOR CY 2004-2013(Value in Thousands)
NOPAUnlocking the Power of the Seed
1300 L Street, NW Suite 1020 Washington, DC 20005 T 202.842.0463 F 202.842.9126 www.nopa.org
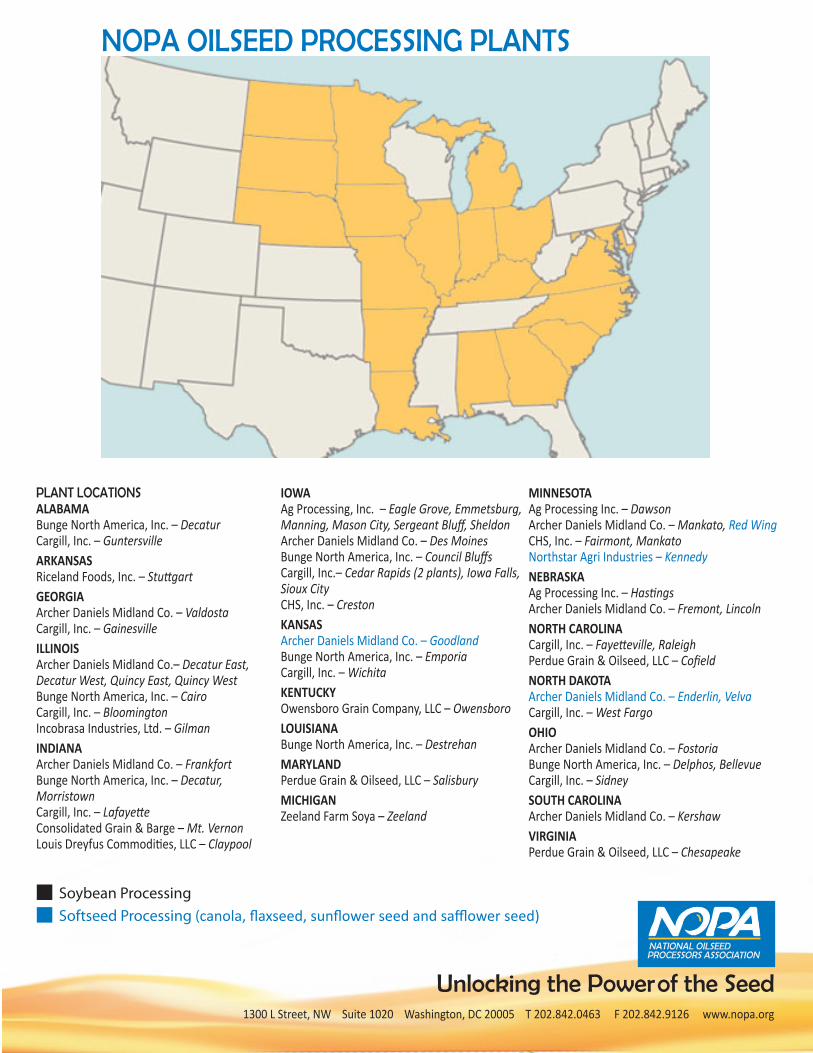
NOPA OILSEED PROCESSING PLANTS
PLANT LOCATIONSALABAMABunge North America, Inc. – DecaturCargill, Inc. – GuntersvilleARKANSASRiceland Foods, Inc. – StuttgartGEORGIAArcher Daniels Midland Co. – ValdostaCargill, Inc. – GainesvilleILLINOISArcher Daniels Midland Co.– Decatur East, Decatur West, Quincy East, Quincy WestBunge North America, Inc. – CairoCargill, Inc. – BloomingtonIncobrasa Industries, Ltd. – GilmanINDIANAArcher Daniels Midland Co. – FrankfortBunge North America, Inc. – Decatur, MorristownCargill, Inc. – LafayetteConsolidated Grain & Barge – Mt. VernonLouis Dreyfus Commodities, LLC – Claypool
IOWAAg Processing, Inc. – Eagle Grove, Emmetsburg, Manning, Mason City, Sergeant Bluff, SheldonArcher Daniels Midland Co. – Des MoinesBunge North America, Inc. – Council BluffsCargill, Inc.– Cedar Rapids (2 plants), Iowa Falls, Sioux CityCHS, Inc. – CrestonKANSASArcher Daniels Midland Co. – GoodlandBunge North America, Inc. – EmporiaCargill, Inc. – WichitaKENTUCKYOwensboro Grain Company, LLC – OwensboroLOUISIANABunge North America, Inc. – DestrehanMARYLANDPerdue Grain & Oilseed, LLC – SalisburyMICHIGANZeeland Farm Soya – Zeeland
MINNESOTAAg Processing Inc. – DawsonArcher Daniels Midland Co. – Mankato, Red WingCHS, Inc. – Fairmont, MankatoNorthstar Agri Industries – KennedyNEBRASKAAg Processing Inc. – HastingsArcher Daniels Midland Co. – Fremont, LincolnNORTH CAROLINACargill, Inc. – Fayetteville, RaleighPerdue Grain & Oilseed, LLC – CofieldNORTH DAKOTAArcher Daniels Midland Co. – Enderlin, VelvaCargill, Inc. – West FargoOHIOArcher Daniels Midland Co. – FostoriaBunge North America, Inc. – Delphos, BellevueCargill, Inc. – SidneySOUTH CAROLINAArcher Daniels Midland Co. – KershawVIRGINIAPerdue Grain & Oilseed, LLC – Chesapeake
Soybean ProcessingSoftseed Processing (canola, flaxseed, sunflower seed and safflower seed)
NOPAUnlocking the Power of the Seed
LOOSE, GROUND,OR PELLETED HULLS
OILDISTILLATION
GRINDING
NOTE: The National Oilseed Processors Association (NOPA) represents the U.S. soybean, canola, �axseed, sun�ower seed and sa�ower seed crushing industries. This �owchart is an illustrative diagram of standardized steps employed in the processing of soybeans. The steps employed may vary from plant to plant and from oilseed to oilseed.
SOYBEAN PROCESSING FLOWCHART