Embed Size (px)
Citation preview
Update on Experiment to Model and Calibrate Pavement Structural Effects on
Vehicle Fuel Economy and GHG Emissions
Participants: University of California Pavement Research Center
Michigan State University Massachusetts Institute of Technology Concrete Sustainability Hub
Oregon State University University of Minnesota
Symplectic Engineering Corporation Sponsored by:
California Department of Transportation with assistance from Minnesota Department of Transportation
Phase I Tasks
• I:1 Identify participating modelers, review models. – Completed
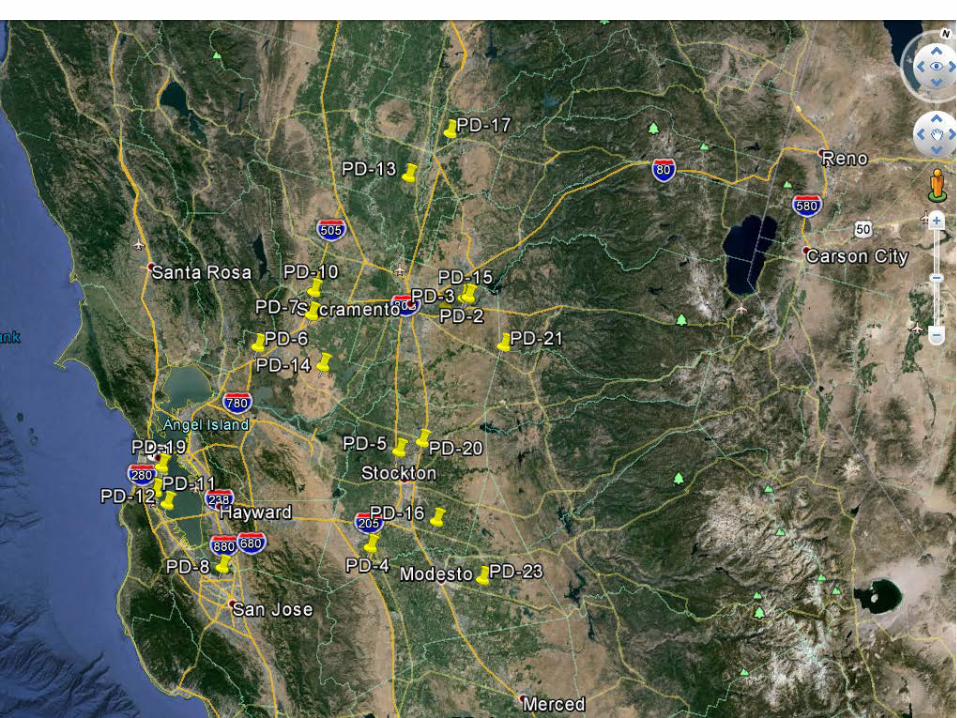
• I:2 Identify test sections, measure pavement characteristics needed by modelers, and other characteristics affecting fuel economy. – 22 sections identified – Field deflection, IRI and MPD measurements completed
twice (cool, hot conditions) – Laboratory shear frequency sweep tests as cross-check on
viscoelastic high temp properties – Completed

Phase I Tasks • I:3 Compare modeling results for test sections
– Initial comparison of deflections, energy dissipation, fuel use for example pavements, completed
– Back-calculation of elastic and viscoelastic properties for test sections (MSU), completed
– Calculations of deflections, energy dissipation, differences in vehicle fuel economy for structural response, roughness, MPD, currently underway, expected completion 1 Dec 2014
• I:4 Prepare experimental plan for validation of modeling results: December 2014
• I:5 Communicate results of Phase I: January 2015 • I:6 Summarize results of Phase I: January 2015
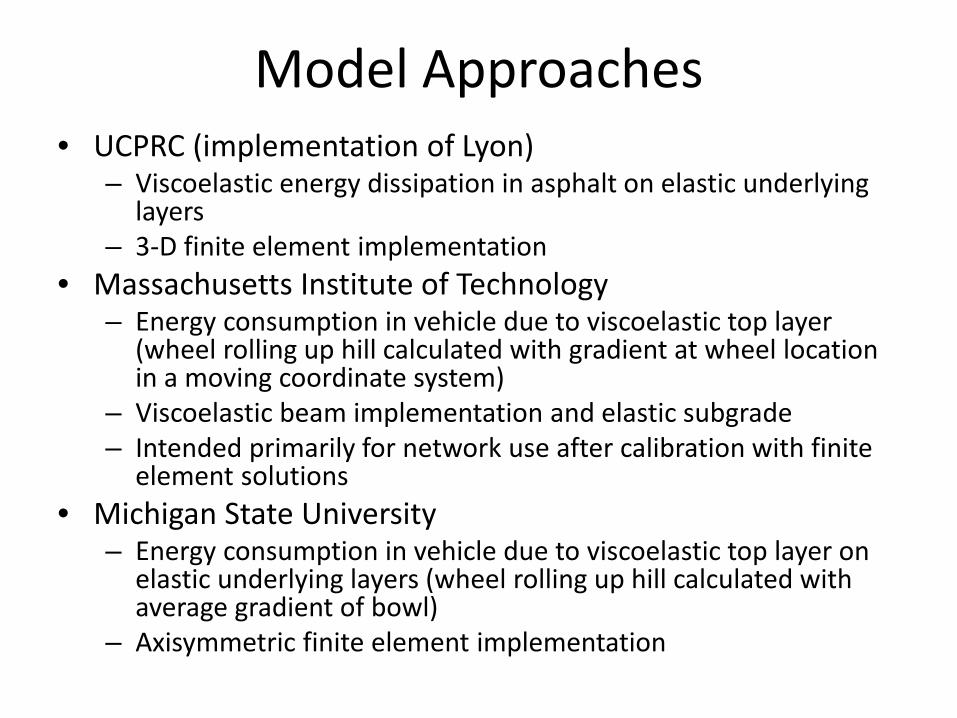
Model Approaches • UCPRC (implementation of Lyon)
– Viscoelastic energy dissipation in asphalt on elastic underlying layers
– 3-D finite element implementation • Massachusetts Institute of Technology
– Energy consumption in vehicle due to viscoelastic top layer (wheel rolling up hill calculated with gradient at wheel location in a moving coordinate system)
– Viscoelastic beam implementation and elastic subgrade – Intended primarily for network use after calibration with finite
element solutions • Michigan State University
– Energy consumption in vehicle due to viscoelastic top layer on elastic underlying layers (wheel rolling up hill calculated with average gradient of bowl)
– Axisymmetric finite element implementation
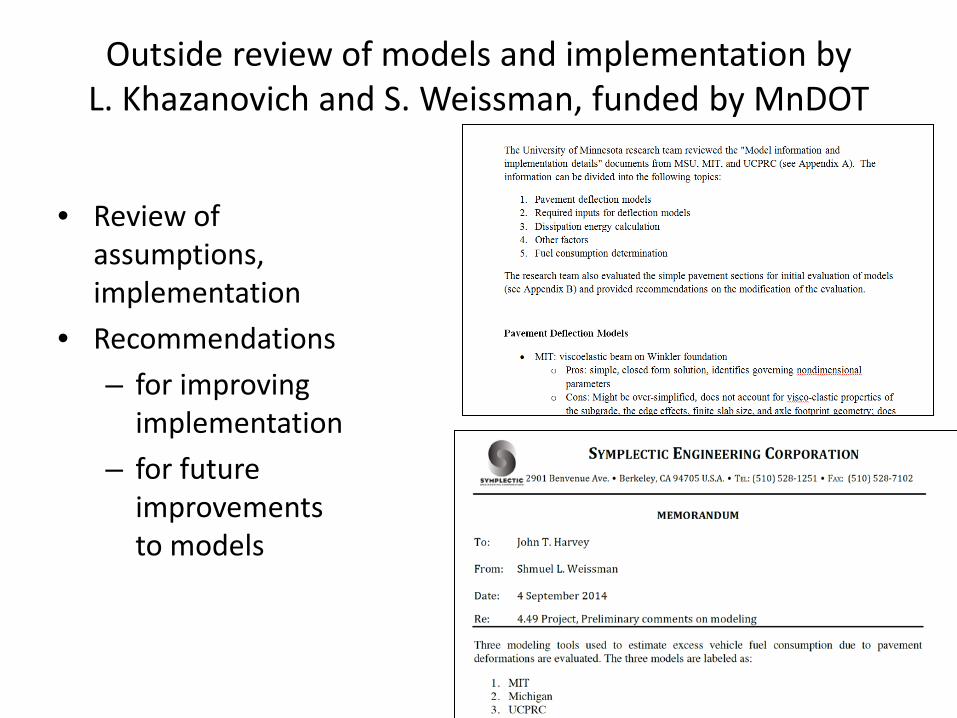
Outside review of models and implementation by L. Khazanovich and S. Weissman, funded by MnDOT
• Review of assumptions, implementation
• Recommendations – for improving
implementation – for future
improvements to models
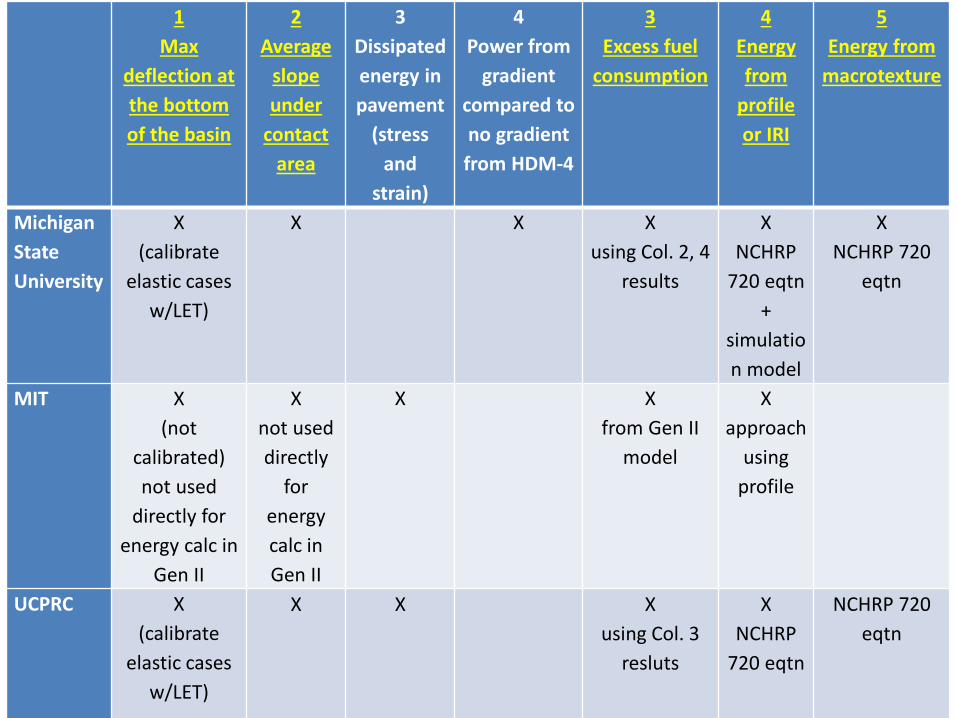
Parameters for comparison
1 Max
deflection at the bottom of the basin
2 Average
slope under
contact area
3 Dissipated energy in pavement
(stress and
strain)
4 Power from
gradient compared to no gradient from HDM-4
3 Excess fuel
consumption
4 Energy from
profile or IRI
5 Energy from
macrotexture
Michigan State University
X (calibrate
elastic cases w/LET)
X X X using Col. 2, 4
results
X NCHRP
720 eqtn +
simulation model
X NCHRP 720
eqtn
MIT X (not
calibrated) not used
directly for energy calc in
Gen II
X not used directly
for energy calc in Gen II
X X from Gen II
model
X approach
using profile
UCPRC X (calibrate
elastic cases w/LET)
X X X using Col. 3
resluts
X NCHRP
720 eqtn
NCHRP 720 eqtn

Section Structure and Surface Type
Approx Htop (mm) GPR/coring
Sub grade
Length (km) Slope avg IRI MPD
PD-01 Concrete (JPCP) 222 Clay 0.94 -0.04% 1.16 0.29
PD-02 Concrete (JPCP) (Dowelled) 208 sand 0.63 0.10% 0.97 0.23
PD-03 Concrete (JPCP) 196 Sand 0.75 -0.04% 1.17 0.33
PD-04 Concrete (JPCP) 280 Any 0.63 0.17% 3.08 0.36
PD-05 Concrete (CRC) TBD Any 0.75 0.06% 1.15 0.51
PD-06 HMA-O HMA
36 268 Sand 1.19 -0.09% 1.56 1.69
PD-07 RHMA-G PCC
146 224 Sand 0.81 0.09% 0.82 1.63
PD-08 HMA-O
HMA PCC
35 117 278
Clay 0.38 -0.10% 1.54 1.37
PD-10
RHMA-G HMA PCC
86 196 233
Sand 0.81 -0.06% 0.97 1.67
PD-11 HMA-O HMA
41 244 Clay 0.63 0.05% 1.22 2.06
PD-12 HMA-O HMA
37 139 Clay 0.63 -0.02% 1.32 1.01
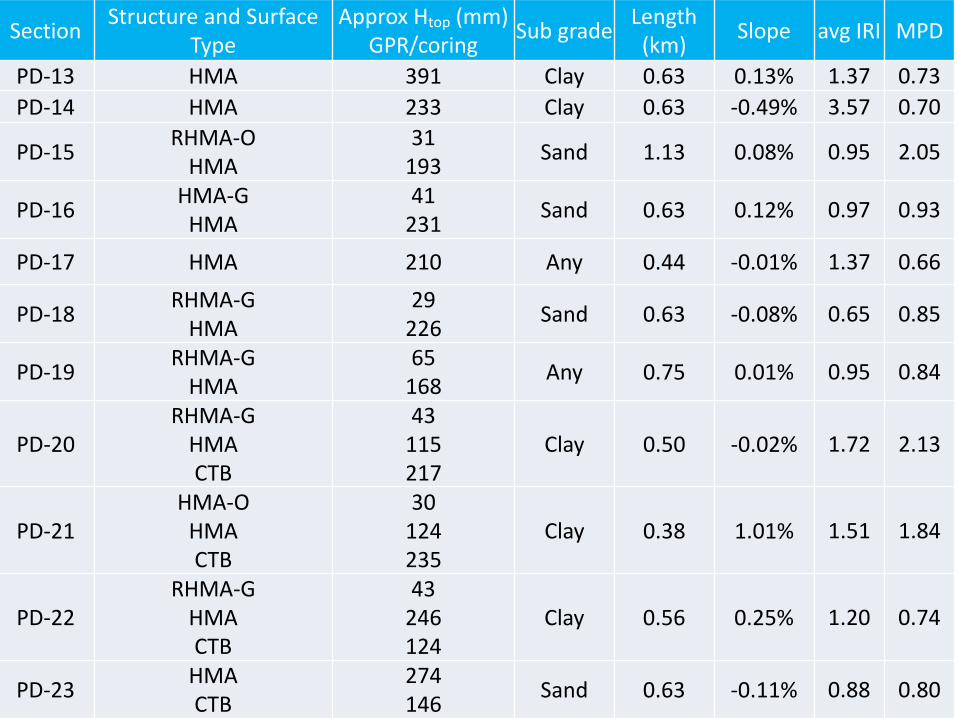
Section Structure and Surface Type
Approx Htop (mm) GPR/coring Sub grade Length
(km) Slope avg IRI MPD
PD-13 HMA 391 Clay 0.63 0.13% 1.37 0.73 PD-14 HMA 233 Clay 0.63 -0.49% 3.57 0.70
PD-15 RHMA-O HMA
31 193 Sand 1.13 0.08% 0.95 2.05
PD-16 HMA-G HMA
41 231 Sand 0.63 0.12% 0.97 0.93
PD-17 HMA 210 Any 0.44 -0.01% 1.37 0.66
PD-18 RHMA-G HMA
29 226 Sand 0.63 -0.08% 0.65 0.85
PD-19 RHMA-G HMA
65 168 Any 0.75 0.01% 0.95 0.84
PD-20 RHMA-G
HMA CTB
43 115 217
Clay 0.50 -0.02% 1.72 2.13
PD-21 HMA-O
HMA CTB
30 124 235
Clay 0.38 1.01% 1.51 1.84
PD-22 RHMA-G
HMA CTB
43 246 124
Clay 0.56 0.25% 1.20 0.74
PD-23 HMA CTB
274 146 Sand 0.63 -0.11% 0.88 0.80
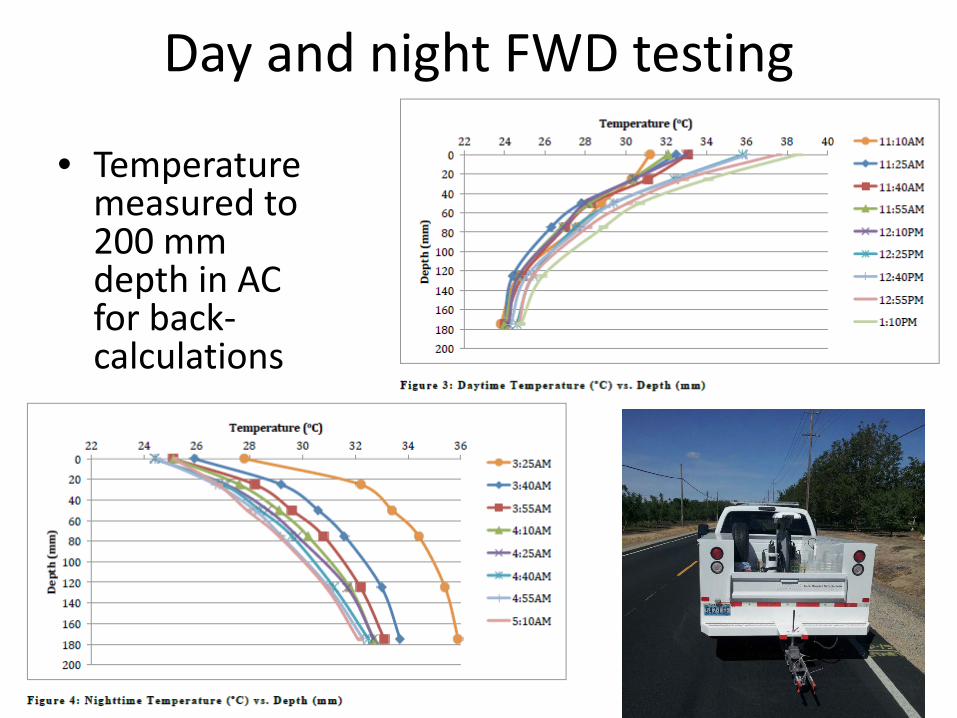
Day and night FWD testing
• Temperature measured to 200 mm depth in AC for back-calculations
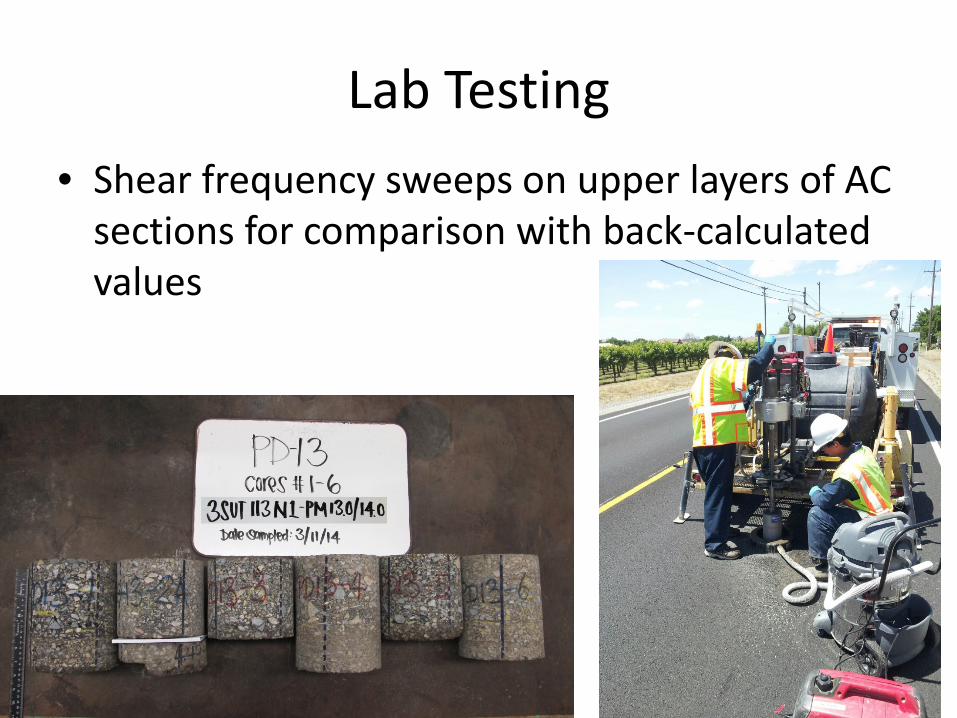
Lab Testing • Shear frequency sweeps on upper layers of AC
sections for comparison with back-calculated values

Field Testing
• MPD and MTD from Laser Texture Scanner
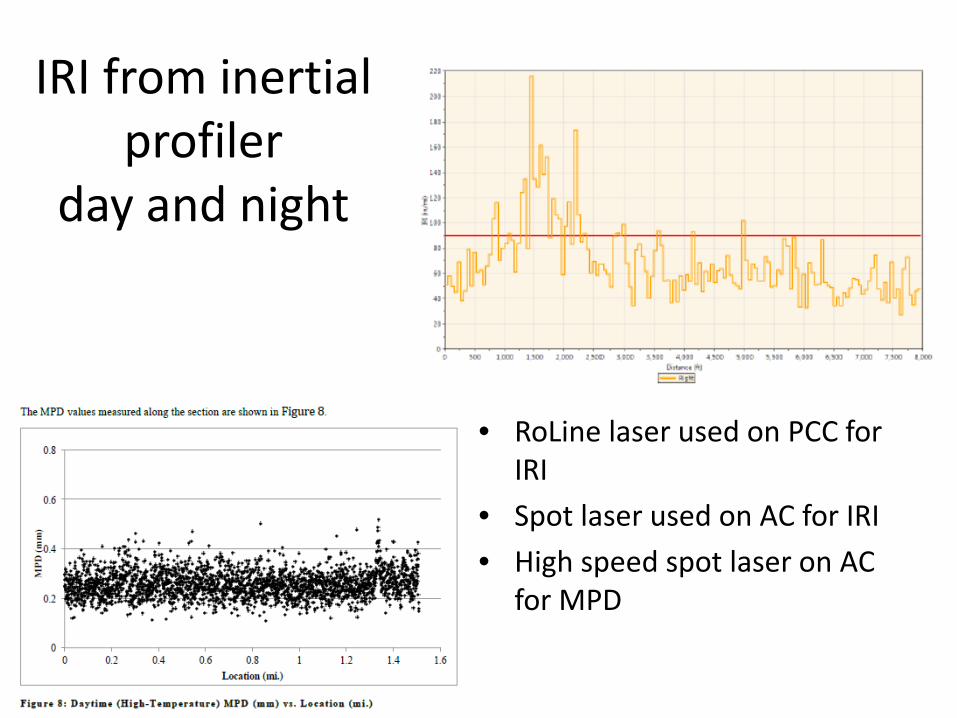
IRI from inertial profiler
day and night
• RoLine laser used on PCC for IRI
• Spot laser used on AC for IRI • High speed spot laser on AC
for MPD
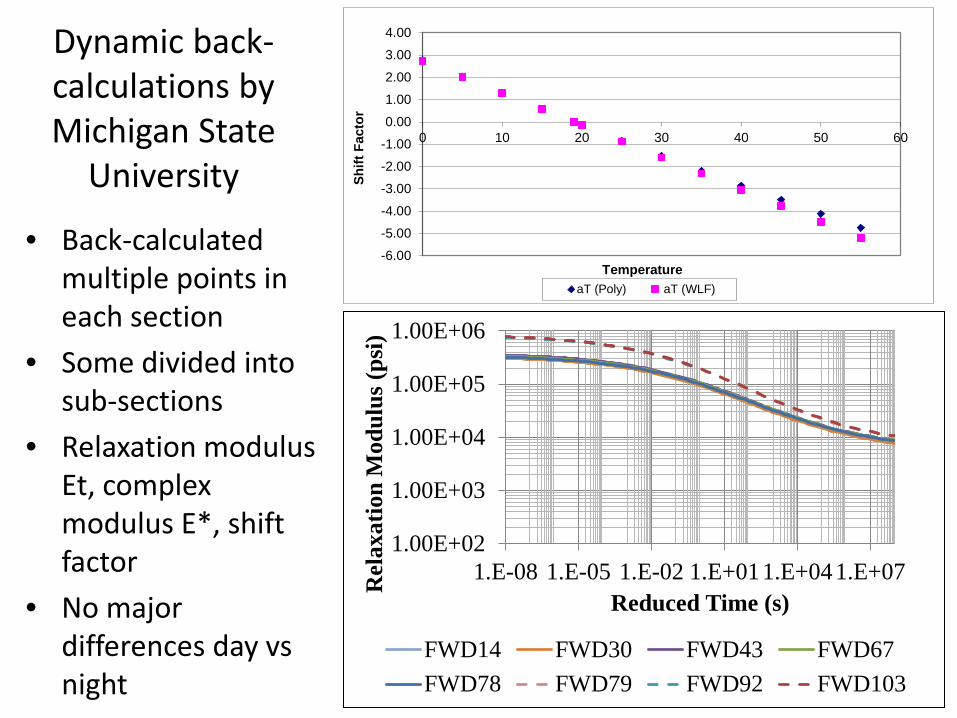
Dynamic back-calculations by Michigan State
University
• Back-calculated multiple points in each section
• Some divided into sub-sections
• Relaxation modulus Et, complex modulus E*, shift factor
• No major differences day vs night
1.00E+02
1.00E+03
1.00E+04
1.00E+05
1.00E+06
1.E-08 1.E-05 1.E-02 1.E+011.E+041.E+07Rel
axat
ion
Mod
ulus
(psi
)
Reduced Time (s)
FWD14 FWD30 FWD43 FWD67FWD78 FWD79 FWD92 FWD103
-6.00
-5.00
-4.00
-3.00
-2.00
-1.00
0.00
1.00
2.00
3.00
4.00
0 10 20 30 40 50 60
Shift
Fac
tor
Temperature aT (Poly) aT (WLF)
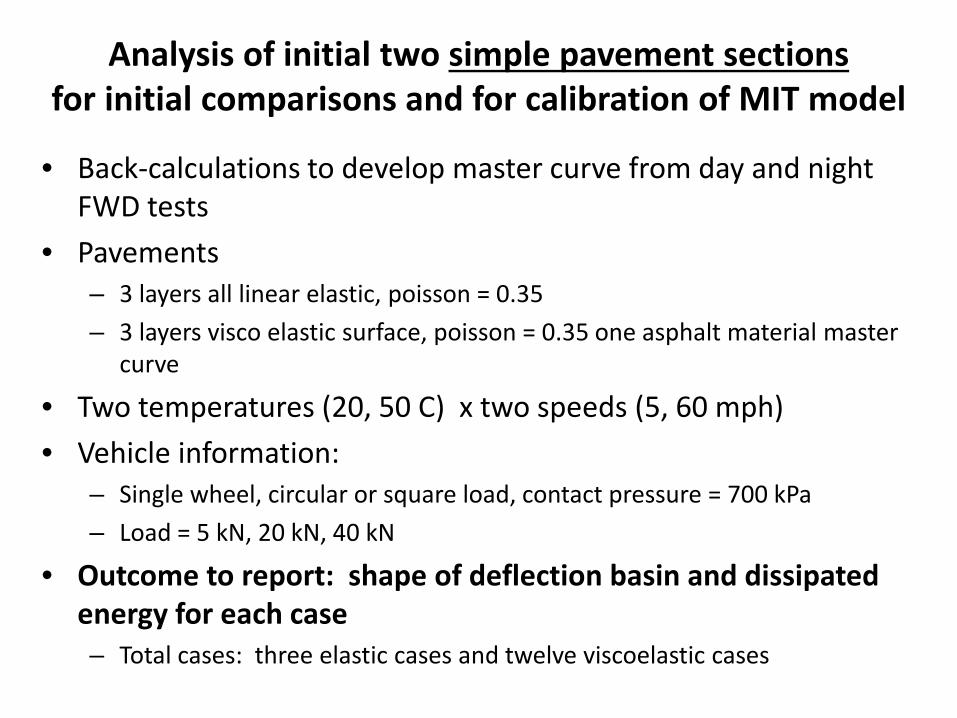
Analysis of initial two simple pavement sections for initial comparisons and for calibration of MIT model
• Back-calculations to develop master curve from day and night FWD tests
• Pavements – 3 layers all linear elastic, poisson = 0.35 – 3 layers visco elastic surface, poisson = 0.35 one asphalt material master
curve
• Two temperatures (20, 50 C) x two speeds (5, 60 mph) • Vehicle information:
– Single wheel, circular or square load, contact pressure = 700 kPa – Load = 5 kN, 20 kN, 40 kN
• Outcome to report: shape of deflection basin and dissipated energy for each case – Total cases: three elastic cases and twelve viscoelastic cases
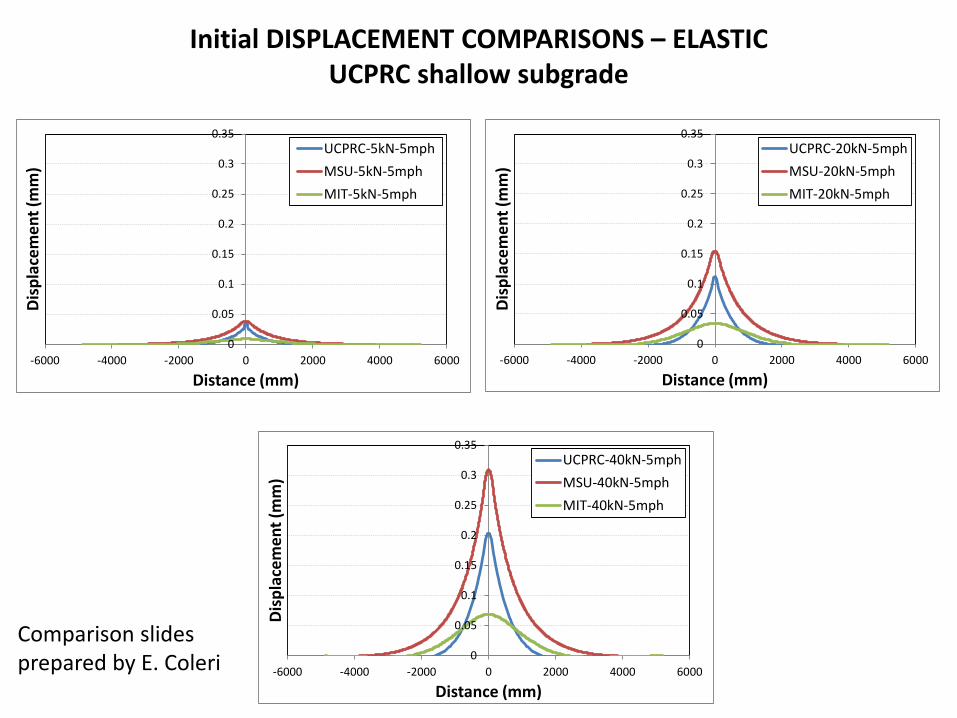
Initial DISPLACEMENT COMPARISONS – ELASTIC UCPRC shallow subgrade
0
0.05
0.1
0.15
0.2
0.25
0.3
0.35
-6000 -4000 -2000 0 2000 4000 6000
Disp
lace
men
t (m
m)
Distance (mm)
UCPRC-5kN-5mphMSU-5kN-5mphMIT-5kN-5mph
0
0.05
0.1
0.15
0.2
0.25
0.3
0.35
-6000 -4000 -2000 0 2000 4000 6000
Disp
lace
men
t (m
m)
Distance (mm)
UCPRC-20kN-5mphMSU-20kN-5mphMIT-20kN-5mph
0
0.05
0.1
0.15
0.2
0.25
0.3
0.35
-6000 -4000 -2000 0 2000 4000 6000
Disp
lace
men
t (m
m)
Distance (mm)
UCPRC-40kN-5mphMSU-40kN-5mphMIT-40kN-5mph
Comparison slides prepared by E. Coleri

Initial DISPLACEMENT COMPARISONS – VISCOELASTIC – 50C – 5 mph UCPRC shallow subgrade
-0.1
0
0.1
0.2
0.3
0.4
0.5
0.6
0.7
0.8
-6000 -4000 -2000 0 2000 4000 6000
Disp
lace
men
t (m
m)
Distance (mm)
UCPRC-5kN-5mph-50CMSU-5kN-5mph-50CMIT-5kN-5mph-50C
-0.1
0
0.1
0.2
0.3
0.4
0.5
0.6
0.7
0.8
-6000 -4000 -2000 0 2000 4000 6000
Disp
lace
men
t (m
m)
Distance (mm)
UCPRC-20kN-5mph-50CMSU-20kN-5mph-50CMIT-20kN-5mph-50C
-0.1
0
0.1
0.2
0.3
0.4
0.5
0.6
0.7
0.8
-6000 -4000 -2000 0 2000 4000 6000
Disp
lace
men
t (m
m)
Distance (mm)
UCPRC-40kN-5mph-50CMSU-40kN-5mph-50CMIT-40kN-5mph-50C

UCPRC change in subgrade thickness
• Changed from shallow subgrade used by Pouget to 5 m thick subgrade to better match semi-infinite subgrades of Michigan State and Layer Elastic Theory
• MIT using Winkler foundation
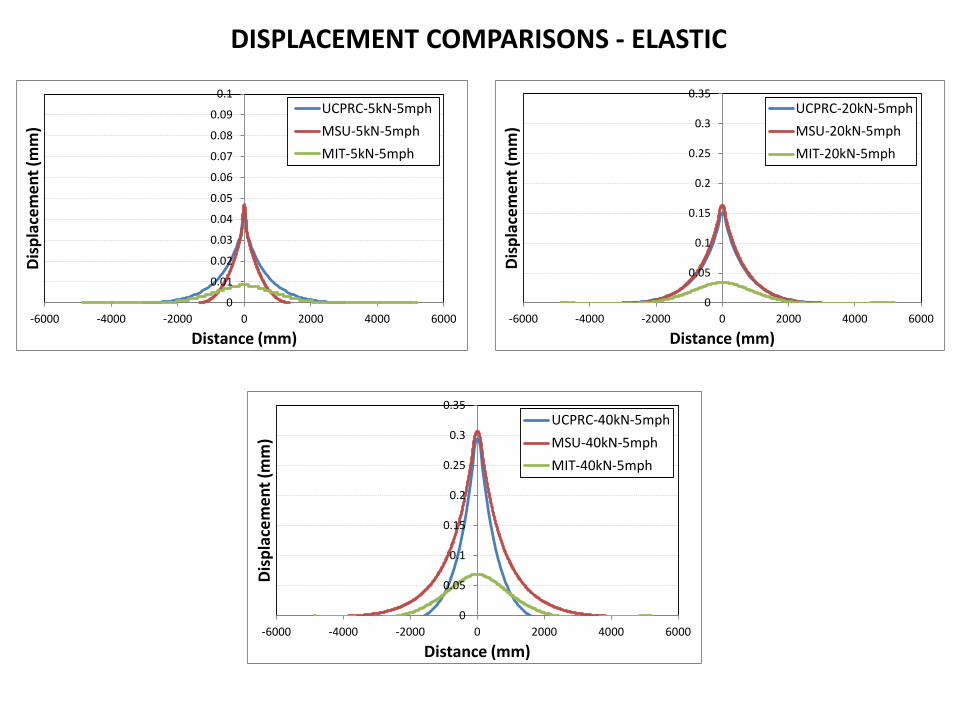
DISPLACEMENT COMPARISONS - ELASTIC
0
0.01
0.02
0.03
0.04
0.05
0.06
0.07
0.08
0.09
0.1
-6000 -4000 -2000 0 2000 4000 6000
Disp
lace
men
t (m
m)
Distance (mm)
UCPRC-5kN-5mphMSU-5kN-5mphMIT-5kN-5mph
0
0.05
0.1
0.15
0.2
0.25
0.3
0.35
-6000 -4000 -2000 0 2000 4000 6000
Disp
lace
men
t (m
m)
Distance (mm)
UCPRC-20kN-5mphMSU-20kN-5mphMIT-20kN-5mph
0
0.05
0.1
0.15
0.2
0.25
0.3
0.35
-6000 -4000 -2000 0 2000 4000 6000
Disp
lace
men
t (m
m)
Distance (mm)
UCPRC-40kN-5mphMSU-40kN-5mphMIT-40kN-5mph
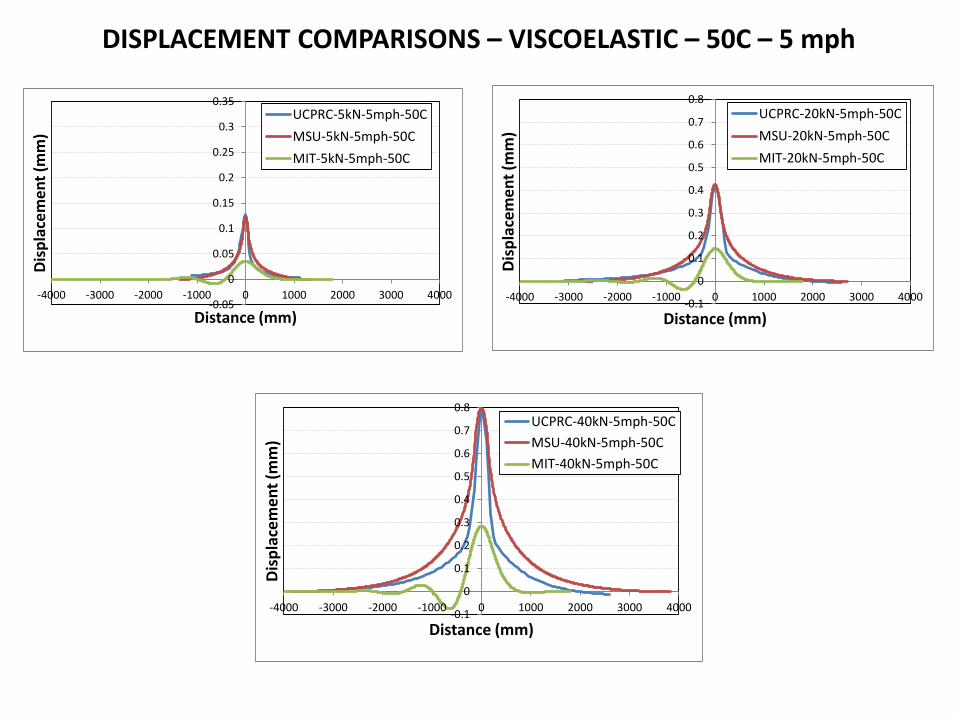
DISPLACEMENT COMPARISONS – VISCOELASTIC – 50C – 5 mph
-0.1
0
0.1
0.2
0.3
0.4
0.5
0.6
0.7
0.8
-4000 -3000 -2000 -1000 0 1000 2000 3000 4000
Disp
lace
men
t (m
m)
Distance (mm)
UCPRC-20kN-5mph-50CMSU-20kN-5mph-50CMIT-20kN-5mph-50C
-0.1
0
0.1
0.2
0.3
0.4
0.5
0.6
0.7
0.8
-4000 -3000 -2000 -1000 0 1000 2000 3000 4000
Disp
lace
men
t (m
m)
Distance (mm)
UCPRC-40kN-5mph-50CMSU-40kN-5mph-50CMIT-40kN-5mph-50C
-0.05
0
0.05
0.1
0.15
0.2
0.25
0.3
0.35
-4000 -3000 -2000 -1000 0 1000 2000 3000 4000
Disp
lace
men
t (m
m)
Distance (mm)
UCPRC-5kN-5mph-50CMSU-5kN-5mph-50CMIT-5kN-5mph-50C
0
100
200
300
400
500
600
700
800
900
Disp
lace
men
t (m
icro
ns)
MSU
MIT
UCPRC
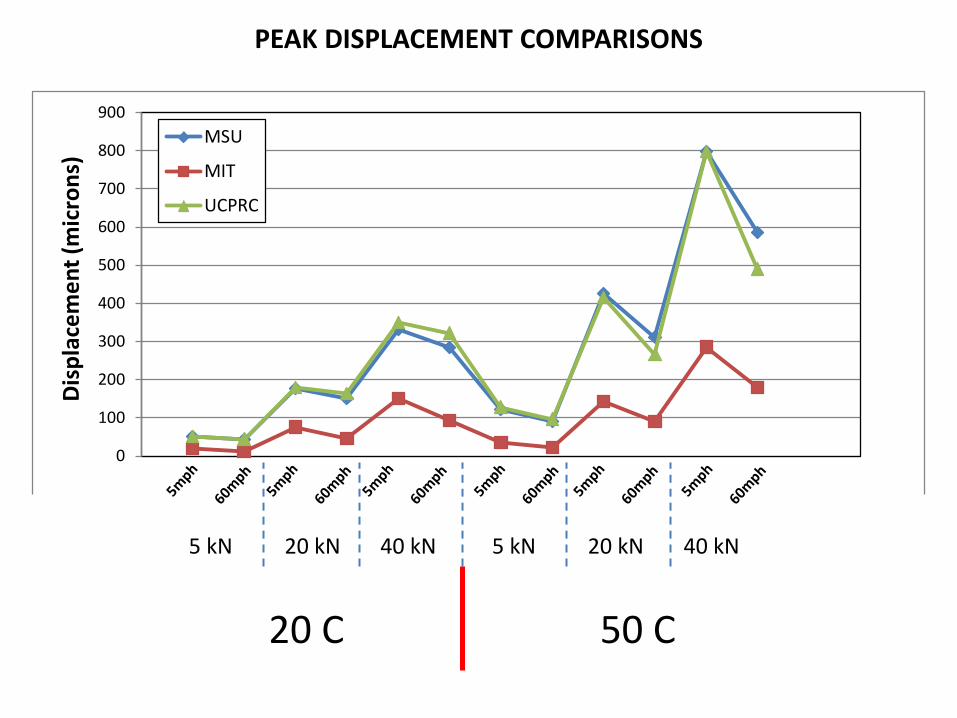
PEAK DISPLACEMENT COMPARISONS
5 kN 20 kN 40 kN 5 kN 20 kN 40 kN
20 C 50 C
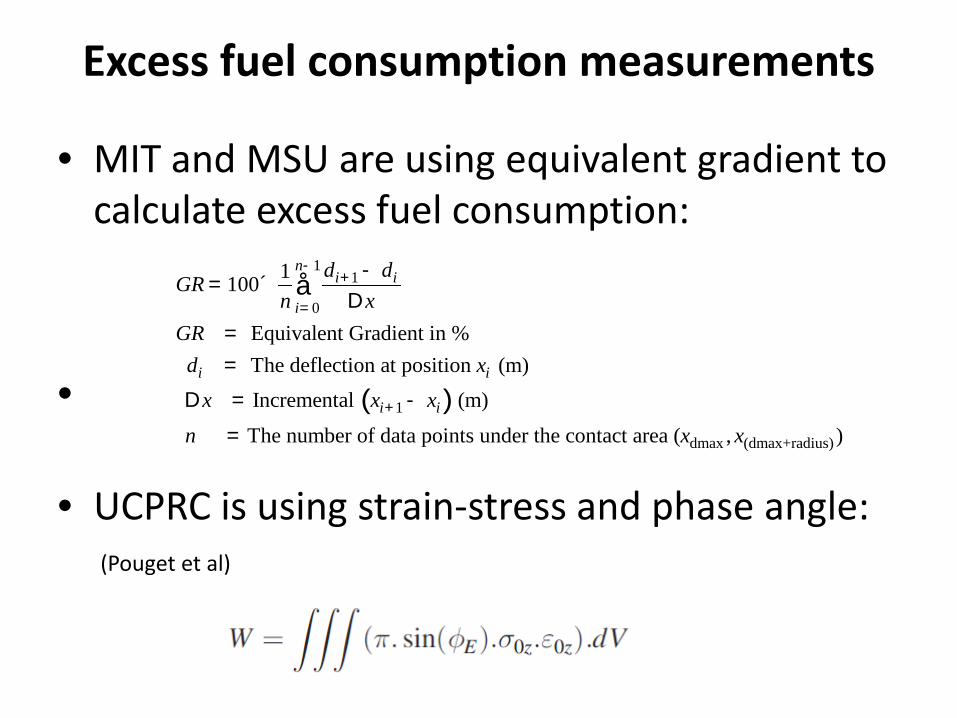
Excess fuel consumption measurements
• MIT and MSU are using equivalent gradient to calculate excess fuel consumption:
•
• UCPRC is using strain-stress and phase angle:
11
0
1100
Equivalent Gradient in % The deflection at position (m)
ni i
i
i i
d dGR
n xGR
d x
-+
=
-= ´
D==
å
( )1
dmax (dmax+
Incremental (m)
The number of data points under the contact area ( ,i ix x x
n x x+D = -
= radius) )
(Pouget et al)
0
0.5
1
1.5
2
2.5
3
Exce
ss fu
el fo
r Die
sel (
mL/
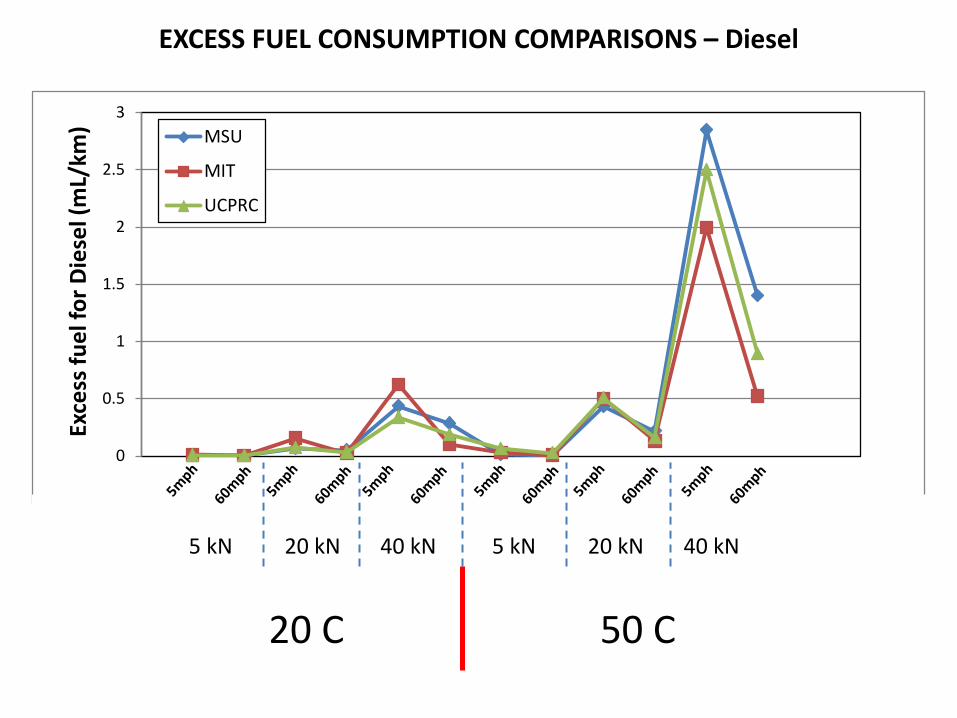
km) MSU
MIT
UCPRC
EXCESS FUEL CONSUMPTION COMPARISONS – Diesel
5 kN 20 kN 40 kN 5 kN 20 kN 40 kN
20 C 50 C
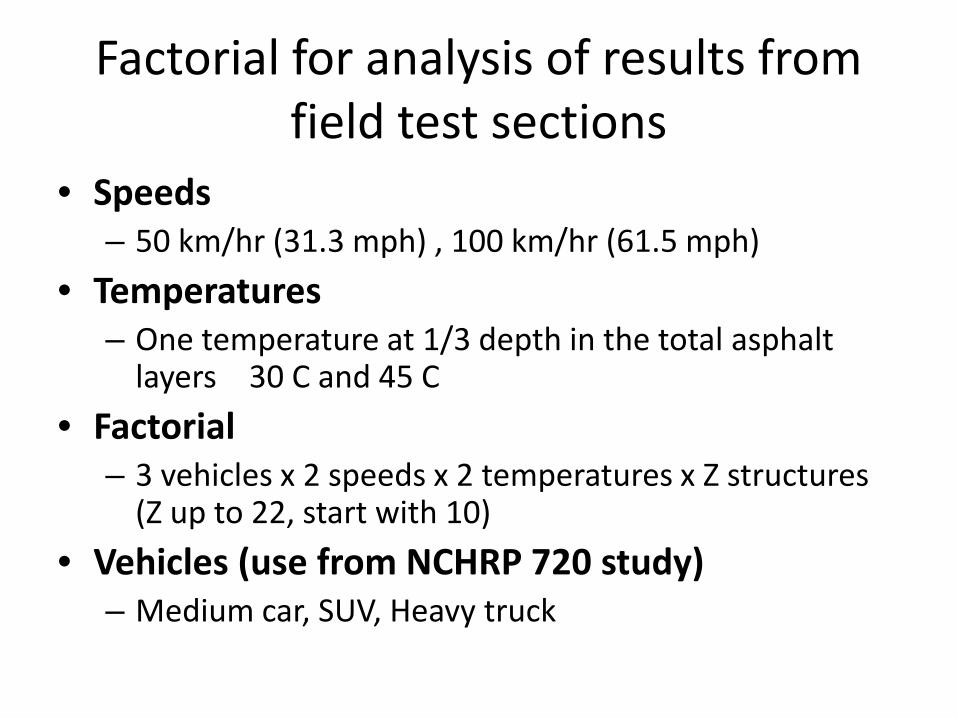
Factorial for analysis of results from field test sections
• Speeds – 50 km/hr (31.3 mph) , 100 km/hr (61.5 mph)
• Temperatures – One temperature at 1/3 depth in the total asphalt
layers 30 C and 45 C • Factorial
– 3 vehicles x 2 speeds x 2 temperatures x Z structures (Z up to 22, start with 10)
• Vehicles (use from NCHRP 720 study) – Medium car, SUV, Heavy truck
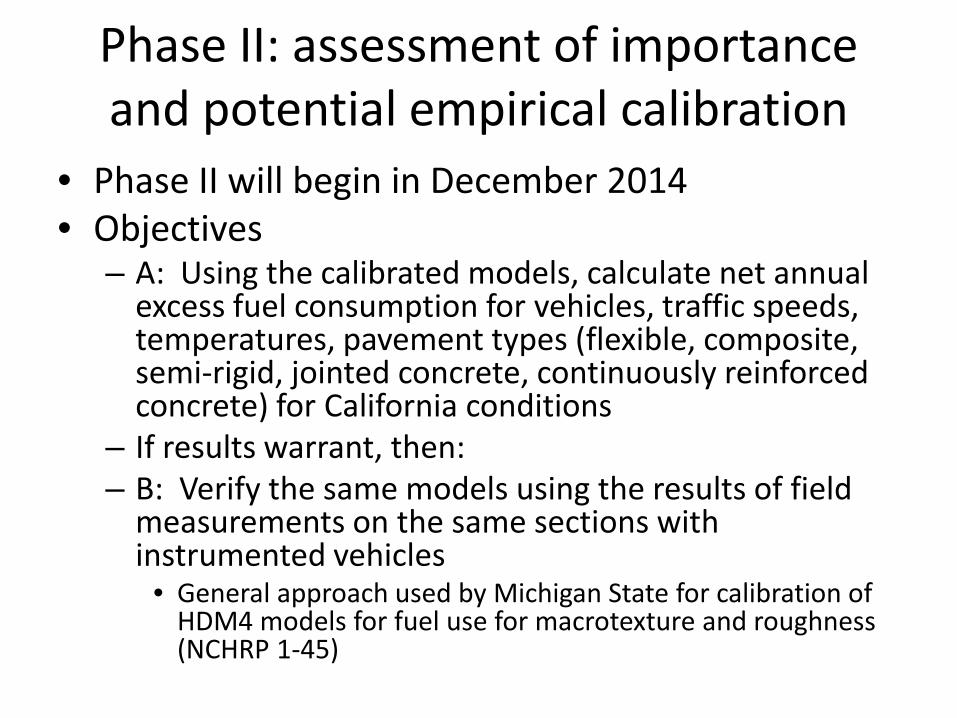
Phase II: assessment of importance and potential empirical calibration
• Phase II will begin in December 2014 • Objectives
– A: Using the calibrated models, calculate net annual excess fuel consumption for vehicles, traffic speeds, temperatures, pavement types (flexible, composite, semi-rigid, jointed concrete, continuously reinforced concrete) for California conditions
– If results warrant, then: – B: Verify the same models using the results of field
measurements on the same sections with instrumented vehicles
• General approach used by Michigan State for calibration of HDM4 models for fuel use for macrotexture and roughness (NCHRP 1-45)