Embed Size (px)
Citation preview

October 2020
Updated energy and emissions projections 2019

2
© Crown copyright 2020
This publication is licensed under the terms of the Open Government Licence v3.0 except where otherwise stated. To view this licence, visit nationalarchives.gov.uk/doc/open-government-licence/version/3 or write to the Information Policy Team, The National Archives, Kew, London TW9 4DU, or email: [email protected].
Where we have identified any third-party copyright information you will need to obtain permission from the copyright holders concerned.
Any enquiries regarding this publication should be sent to us at: [email protected] This publication is available for download at: www.gov.uk/government/publications

3
Contents Lists of figures and tables 4
Figures 4
Boxes and tables 4
Executive summary 5
1 Introduction 7
1.1 About this document 7
1.2 The reference and other scenarios 9
1.3 Comparison with the 2018 projections 10
2 UK emissions projections 12
2.1 Progress towards the carbon budgets 14
2.2 Non-traded emissions projections by sector 16
3 Effect of policies on emissions 18
3.1 Policies for non-traded emissions reduction 19
3.2 Changes to non-traded policy savings since EEP 2018 19
3.3 Emissions savings from policies in electricity supply 20
4 Demand for energy 21
4.1 Final energy demand 21
4.2 Primary energy demand 24
5 Electricity supply 27
5.1 Summary of projections 28
5.2 Net Zero-consistent power sector scenarios 29
6 Detailed comparisons with EEP 2018 30
6.1 Changes in territorial projections since EEP 2018 30
6.2 Changes in non-traded projections since EEP 2018 31
6.2.1 Improvements in the projection methodology 32
6.2.2 Changes due to input updates 33
6.3 Changes in traded projections since EEP 2018 35
7 Lists of supporting material 36
7.1 Annexes 36
7.2 Web tables and figures 38

4
Lists of figures and tables
Figures
Figure 1.1: Emission trends __________________________________________ 11
Figure 2.1: Uncertainty in UK projected emissions _________________________ 13
Figure 2.2: Actual and projected performance against carbon budgets _________ 14
Figure 2.3: Non-traded emissions in the economy _________________________ 16
Figure 4.1: Final energy demand by fuel and consumer sector, 2008 to 2040 ___ 22
Figure 4.2: Primary energy demand by fuel______________________________ 26
Figure 5.1: Electricity generation by fuel source ___________________________ 29
Boxes and tables
Box 1: The UK Net Carbon Account _________________________________ 9
Table 2.1: Net carbon account performance against carbon budgets__________ 15
Table 3.1: Non-traded GHG emissions savings from policies________________ 19
Table 6.1: Changes which affect total territorial emissions __________________ 30
Table 6.2: Changes which affect non-traded emissions ____________________ 31
Table 6.3: Improvements in the projection methodology which affect non-traded emissions _______________________________________________ 32
Table 6.4: Input updates which affect non-traded emissions ________________ 33

Updated energy and emissions projections 2019
5
Executive summary BEIS publishes annual projections of UK energy demand and greenhouse gas emissions1. This year, we have extended the projections to 2040 (from 2035 in EEP 2018). We base the estimates in this report and associated annexes on policy analysis from August 2019 and modelling from March 2020. We completed the latter before the coronavirus (Covid-19) pandemic. Therefore, our projections take no account of the impacts of this on future energy demand or emissions.
The Climate Change Act2, passed in 2008, committed the UK to reducing greenhouse gas emissions by at least 80% by 2050 in comparison with baseline levels3. It also established a system of legally-binding carbon budgets which limit the country’s net greenhouse gas emissions in successive five-year periods. In June 2019, the UK became the first major economy to commit to reducing emissions to Net Zero by 20504.
The Energy and Emissions Projections (EEP) are one way we monitor progress towards the UK’s legislated targets. Between the baseline and 2018, the UK cut emissions by 346 MtCO2e or 43%. We project that they will fall a further 24% to 344 MtCO2e in 2040.
Each year, BEIS updates the projections to incorporate new evidence, policy development and methodology improvements. The new projections for UK territorial emissions are higher than in the previous edition (EEP 2018) for the third and fourth carbon budget period but lower for the fifth carbon budget period. UK territorial emissions include both emissions which fall under the EU Emissions Trading System (EU ETS), or “traded” emissions, and emissions outside this system (“non-traded” emissions). Traded emissions include almost all power sector emissions, domestic aviation (from 2012/13 onward) and energy-intensive industrial sectors. These do not directly affect performance against carbon budgets5.
1 We use the Global Warming Potentials (GWPs) from Table 2.14 of Working Group 1 of the IPCC Fourth Assessment Report: Climate Change 2007: AR4 GWPs. See:
https://www.ipcc.ch/site/assets/uploads/2018/02/ar4-wg1-chapter2-1.pdf This is consistent with the Greenhouse Gas Inventory and BEIS emission statistics. 2 See this link:
http://www.legislation.gov.uk/ukpga/2008/27/contents/enacted 3 The base year for comparison is 1990 for CO2, CH4 and N2O, and 1995 for fluorinated gases:
https://www.legislation.gov.uk/ukpga/2008/27/contents 4 The amendment is here:
http://www.legislation.gov.uk/uksi/2019/1056/article/1/made 5 Carbon budget performance is measured by the Net Carbon Account. In this calculation, emissions from the traded sector are set equal to the UK’s share of the EU ETS cap (the total emissions permitted in the Emissions Trading System) rather than actual traded emissions. Further information on Net Carbon Account calculation can be found in Box 1.

Updated energy and emissions projections 2019
6
Compared with EEP 2018, non-traded emissions projections are higher and traded emissions projections are lower. We explain the main reasons for specific changes in Chapter 6.
Because performance against carbon budget targets depends only on non-traded emissions, the projected shortfall between performance and carbon budget targets has risen since EEP 2018. We give more details about this in Chapter 2: this summarises the emissions projections and explains what this means for performance against carbon budgets.
Updated energy and emissions projections 2019
7
1 Introduction
• This report contains projections of performance against UK greenhouse gas (GHG) carbon budget targets under existing policies.
• The Government sets legally binding carbon budgets for five-year periods. They aim to make sure the UK reaches its target of net zero emissions by 2050.
• The Net Carbon Account measures performance against carbon budgets. This primarily depends on the level of non-traded emissions. These are emissions not covered by the European Union Emissions Trading System (EU ETS).
• The legislated carbon budgets so far are: CB1 (2008 to 2012); CB2 (2013 to 2017); CB3 (2018 to 2022); CB4 (2023 to 2027); and CB5 (2028 to 2032). The Committee on Climate Change will advise the Government about the level for CB6 (2033 to 2037) in December 2020. The Government must set this budget by June 2021.
1.1 About this document
This report sets out the 2019 Energy and Emissions Projections6: EEP 2019. It includes a comparison with the previous edition (EEP 2018, published in April 2019). For this edition, we have extended the projections to 2040: in EEP 2018 the last projection year was 2035. We completed the modelling before the coronavirus (Covid-19) pandemic. Therefore, our assumptions and modelling take no account of any impacts this may have on future energy demand or emissions.
These projections bring together statistical and modelled information from many different sources7:
• The main source of energy consumption data is the annual Digest of UK Energy Statistics (DUKES). Its most recent figures are for 2018 (published July 2019). We therefore report energy consumption trends against a comparison year of 20188.
6 The report and annexes contain outputs from projections under various different macroeconomic assumptions. The “baseline” projection projects energy and emissions without policies brought in since the 2009 Low Carbon Transition Plan. This is the closest scenario to the UNFCCC “without measures” (WoM) projection. A WoM scenario has all mitigation removed. The UK does not produce a WoM projection because we cannot remove the impacts of pre-LCTP climate change measures. Our “existing policies” scenario matches the UNFCCC “with [existing] measures” (WEM) projection. It includes implemented and adopted measures but not planned policies. Our main projection, the reference scenario, includes planned policies too. This matches the UNFCCC “with additional measures” (WAM) scenario. 7 Energy and emissions projections:
https://www.gov.uk/government/collections/energy-and-emissions-projections 8 There is more detail here:
https://www.gov.uk/government/collections/digest-of-uk-energy-statistics-dukes\#2019

Updated energy and emissions projections 2019
8
• The main source of emissions statistics is the Greenhouse Gas (GHG) Inventory which is updated each February. The most recent figures are for 2018 (published February 2020). We therefore report emission trends against this year unless we state otherwise.
• We combine these with other economic and demographic data to update equations that project future energy demand and emissions in the absence of government policy.
This report includes projections of the UK’s progress towards its carbon budget targets for GHG emissions. The 2008 Climate Change Act established a long-term target for the UK to reduce its emissions in 2050 by at least 80% compared with a largely 1990-based baseline9. This target tightened in June 2019 when the UK became the first major economy to commit to reducing its emissions to net zero by 2050.
The Climate Change Act also established a system of legally binding interim limits on net greenhouse gas (GHG) emissions. These are called carbon budgets10. Each one spans five years and is set with the aim of keeping the UK on track for its 2050 target. Performance against these carbon budget targets is measured using the Net Carbon Account (see Box 1 for details).
All UK emissions count towards 2050 targets11. This includes those which the European Union Emissions Trading System (EU ETS) covers. However, these “traded” emissions do not affect the Net Carbon Account and therefore have no impact on performance against carbon budget targets. We therefore include separate, more detailed statistics and commentary for emissions that are outside the EU ETS (“non-traded” emissions).
The United Kingdom left the European Union on 31st January 2020 but remains a full participant in the EU ETS during the transition period until 1st January 2021. In line with the withdrawal agreement, the UK will remain in the European Union Emissions Trading System (EU ETS) until 31st December 2020. The Government set out its approach to negotiations in the UK’s Approach to Negotiations12, published on 27th February 2020. In this edition, we base traded emissions and projections on the EU ETS definition of traded emissions and use EU ETS traded carbon value projections.
9 The base year for comparison is 1990 for CO2, CH4 and N2O, and 1995 for fluorinated gases: https://www.legislation.gov.uk/ukpga/2008/27/contents
10 See page 143 of the Clean Growth Strategy for more background on carbon budgets: https://www.gov.uk/government/publications/clean-growth-strategy
11 We use the Global Warming Potentials (GWPs) from Table 2.14 of Working Group 1 of the IPCC Fourth Assessment Report: Climate Change 2007: AR4 GWPs. See:
https://www.ipcc.ch/site/assets/uploads/2018/02/ar4-wg1-chapter2-1.pdf This is consistent with the Greenhouse Gas Inventory and BEIS emission statistics. 12 For more information see: https://assets.publishing.service.gov.uk/government/uploads/system/uploads/attachment_data/file/868874/The_Future_Relationship_with_the_EU.pdf For discussion of potential alternatives see: https://www.gov.uk/government/consultations/carbon-emissions-tax

Updated energy and emissions projections 2019
9
Box 1: The UK Net Carbon Account
The Government assesses compliance with a carbon budget by comparing the UK “Net Carbon Account” (NCA) against the carbon budget level. The NCA is currently the sum of three components:
1. Emissions allowances the UK receives under the EU Emissions Trading System (EU ETS) This is the UK’s share of tradable allowances for emissions in scope of the EU ETS. Emissions that are traded include most power sector emissions, domestic aviation (from 20212/13 onward) and those from energy-intensive industries. When we project performance against carbon budgets, we use the estimates for EU ETS allowances that the Government assumed at the time of setting each carbon budget. The UK’s actual future shares were not known at that time. We report these assumptions in the web tables.
2. All UK GHG emissions not covered by EU ETS These are the actual level of “non-traded emissions” emitted by the UK i.e. those that are not traded under the EU ETS. This includes most emissions from: road transport, heating in buildings, agriculture, waste and light industry. Since EEP 2017, we have included emissions from “Energy from Waste” power plants under non-traded emissions. This mirrors the ETS directive.
3. Credits/debits from other international credit systems
1.2 The reference and other scenarios
Our main projection is the “reference scenario”. This is our core analysis of how the UK energy and emissions system could evolve under our central assumptions about how the system drivers will change. It includes government policies which have been implemented, adopted, or planned13 as at August 2019. It excludes new policies and changes to existing policies which fall outside these categories14.
The results we report come from the reference scenario unless stated. Many other views of the future are possible: our annexes include some of these.
13 This equates to expired, implemented, adopted, and planned policies as defined by the United Nations Framework Convention on Climate Change (UNFCCC). See Part II, Section V(A) paragraph 13, page 83 of:
http://unfccc.int/resource/docs/cop5/07.pdf This is a UNFCCC “with additional measures” (WAM) scenario. Annex D gives details of the policies we include. 14 Examples of policies announced or in consultation since August 2019 (and hence not included) are the introduction of the Green Home Grant, a consultation on changes to the taxation of red diesel and a green gas levy, and also a consultation on bringing forward the phase-out date for internal-combustion engine sales from 2040. If these were included, the projected level of emissions reported here would be lower.

Updated energy and emissions projections 2019
10
There are significant uncertainties in these projections. We include illustrative confidence intervals based on the figures in EEP 2018 in some of our charts. This is to give a visual indication of how our confidence in our estimates reduces into the future. These bounds are approximate and it is possible that next year’s reference scenario may lie outside the ranges we show. The potential impacts of the Covid-19 pandemic on future energy consumption and emissions are also highly uncertain, and this document does not seek to quantify them. We will keep this matter under review in light of the developments with the Covid-19 pandemic.
We produce projections of energy demand and emissions outside the power sector by applying standard statistical techniques. These project forward energy demand and emissions based on trends and relationships in past data. We adjust these projections to take account of the estimated impact of government policies (as of August 2019).
We base our projection of electricity supply on a model of supplier behaviour rather than statistical analysis of past trends. For this edition, we have changed our approach slightly so the power sector is more in line with the rest of the EEP models. Our assumptions now reflect implemented, adopted and planned policy15 in the power sector. (In EEP 2018 and previous editions, the generation scenario included assumptions that went beyond current government policy).
We publish our projections for the reference scenario and other scenarios in annexes alongside this report. Each section notes the relevant annexes. The data underlying the report’s tables and figures are in the web tables and web figures supplementary files. Section 8 lists these resources in full.
1.3 Comparison with the 2018 projections Figure 1.1 compares the main emissions trends from EEP 2019 with those from EEP 2018. We give more detail about the changes to the projections in Chapter 6. When we compare emissions for carbon budget periods three to five in EEP 2019:
• We project higher UK total territorial emissions than EEP 2018 in carbon budget periods three and four. For the third carbon budget period they are 48 MtCO2e (2%) higher and for the fourth 7 MtCO2e or <0.5% higher. In the fifth carbon budget period emissions are lower than in EEP 2018—by 23 MtCO2e or 1%. We discuss these changes in Section 6.1.
• Non-traded emissions projections are higher than EEP 2018 for all carbon budget periods. In the third carbon budget the difference is 62 MtCO2e (4%), in the fourth 49 MtCO2e (4%) and in the fifth 8 MtCO2e or 1%. We examine changes in non-traded emissions in Section 6.2.
15 This equates to expired, implemented, adopted, and planned policies as defined by the United Nations Framework Convention on Climate Change (UNFCCC). See Part II, Section V(A) paragraph 13, page 83 of:
http://unfccc.int/resource/docs/cop5/07.pdf This is a UNFCCC “with additional measures” (WAM) scenario. Annex D gives details of the policies we include.

Updated energy and emissions projections 2019
11
• Traded emissions projections are lower than in last year’s edition for all carbon budget periods. They are lower by 14 MtCO2e (3%) in carbon budget three, by 42 MtCO2e (9%) in carbon budget four and by 31 MtCO2e (7%) in carbon budget five. We give a brief overview of the changes in traded emissions in Section 6.3.
Figure 1.1: Emission trends, MtCO2e

Updated energy and emissions projections 2019
12
2 UK emissions projections • The UK GHG Inventory reports emissions from 1990 onwards16. Between that year and
2018, territorial emissions from all sources reduced by 43% or 342 MtCO2e. We project that they will reduce by a further 24% (107 MtCO2e) to 344 MtCO2e in 2040.
• The UK met the first and second carbon budgets with headrooms of 3617 and 384 MtCO2e respectively18. Under the reference scenario, we project that the UK will meet the third carbon budget with a headroom of around 26 MtCO2e.
• The projections show shortfalls against the fourth and fifth carbon budgets of 188 and 253 MtCO2e. The projections take account of policies that have been implemented, adopted or planned and where the policy design is sufficiently advanced to allow us to quantify impacts19.
This chapter looks at our projections for UK overall territorial, traded and non-traded emissions. It provides a summary of progress against the carbon budgets.
The UK GHG Inventory reports emissions from 1990 onwards20. Between that year and 2018, territorial emissions from all sources reduced by 43% or 342 MtCO2e. We project that they will reduce by a further 24% (107 MtCO2e) to 344 MtCO2e in 2040. Traded and non-traded emissions follow broadly similar trajectories (Figure 1.1)21. We project that traded emissions will fall by 55 MtCO2e (43%) to 75 MtCO2e in 2040. Non-traded emissions fall by 52 MtCO2e (16%) to 269 MtCO2e in 2040.
Figure 2.1 shows part of this series of actual and projected UK territorial emissions22. However, as with all such projections, there is substantial uncertainty around this analysis. We capture some of this uncertainty in our modelling23. The figure includes a “fan” to show what a range of possible outcomes might be. For this edition, we derived all the uncertainty analysis from the
16 Note this is slightly different from the carbon budgets baseline. 17 Note that performance against carbon budgets depends on the level of non-traded emissions. The actual level of traded emissions does not affect it under current carbon accounting rules. 18 The Government fixes its carbon budget performance against emissions from the greenhouse gas inventory for the end of each budget period. Note that later inventories may adjust these emission estimates. Summary figures for the first two carbon budgets are in Table 9 of the Statistical Summary here:
https://www.gov.uk/government/statistics/final-uk-greenhouse-gas-emissions-national-statistics-1990-to-2018 19 Some policies in the Clean Growth Strategy (October 2017) have not yet reached this stage. We will include the impacts of these in future EEP editions when they are more fully developed. We will also include any policies that may have reached this stage after August 2019. The Clean Growth Strategy:
https://www.gov.uk/government/publications/clean-growth-strategy 20 Note this is slightly different from the carbon budgets baseline. 21 Note that performance against carbon budgets depends on the level of non-traded emissions. The actual level of traded emissions does not affect it under current carbon accounting rules. 22 The full series is in Annex A. 23 In EEP 2018 we used Monte Carlo analysis to derive the uncertainty “fan”. This captured some aspects of uncertainty but with important exceptions. See Chapter 6 of:
https://assets.publishing.service.gov.uk/government/uploads/system/uploads/attachment_data/file/794590/updated-energy-and-emissions-projections-2018.pdf

Updated energy and emissions projections 2019
13
estimates we published in EEP 2018. This is due to time constraints at the time of analysis. Until further data on Covid-19 impacts are available, we have assumed the drivers of uncertainty are similar to previous years. We will keep this matter under review. We include the fan as a visual suggestion of how we are less sure of our estimates as we look to the next decade and beyond.
We give emissions by National Communication sector and greenhouse gas in Annex A. Annex B shows CO2 emissions by DUKES sectors and Annex C gives CO2 emissions for International Panel on Climate Change (IPCC) categories.
Figure 2.1: Uncertainty in UK projected emissions, MtCO2e
Notes: * The uncertainty ranges are indicative and are based on EEP 2018. The chart includes LULUCF.

Updated energy and emissions projections 2019
14
2.1 Progress towards the carbon budgets
Between the carbon budgets baseline24 and 2018, the UK cut emissions by 346 MtCO2e or 43%. Figure 2.2 shows actual and projected performance against the carbon budgets. The range it shows for each projection is indicative. We base the estimates on the 95% confidence intervals from EEP 2018. They give an approximate visual representation of the uncertainty in our figures. Table 2.1 shows how our projections compare with those in the previous edition.
Figure 2.2: Actual and projected performance against carbon budgets, MtCO2e
Notes: Vertical bars show likely uncertainty in the projections. We based them on the 95% confidence intervals for the reference scenario of EEP 2018. They are approximate. Please note that the first and second carbon budgets use the actual net carbon accounts. The projections for the other carbon budgets use the traded cap assumed when the budgets were set25.
24 The base year for comparison is 1990 for CO2, CH4 and N2O, and 1995 for fluorinated gases: https://www.legislation.gov.uk/ukpga/2008/27/contents
25 EEP uses the UK allocation of EU ETS allowances assumed by the respective carbon budgets at the time they were set. This is because the allocations only become final after the budget period they relate to ends. See Box 1.

Updated energy and emissions projections 2019
15
Table 2.1: Net carbon account performance against carbon budgets, MtCO2e and per cent
Carbon budget CB1 CB2 CB3 CB4 CB5 (2008-12)
actual (2013-17)
actual (2018-22) projected
(2023-27) projected
(2028-32) projected
Carbon Budget level [1] emissions, MtCO2e
3,018 2,782 2,544 1,950 1,725
Average annual required reduction vs. base emissions
% -24% -30% -36% -51% -57%
EEP 2018
Reference scenario projected emissions, MtCO2e
2,982 2,398 2,456 2,089 1,970
EEP 2019
Reference scenario projected emissions, MtCO2e
2,982 2,398 2,518 2,138 1,978
Result vs. Budget with reference case
emissions, MtCO2e
-36 -384 -26 188 253
Result vs. Budget with inclusion of CGS policy proposals [2]
emissions, MtCO2e
-36 -384 -26 158 173
Projected average annual reduction vs. base emissions [3]
% -25% -40% -37% -46% -50%
Cumulative Result vs Budget emissions, MtCO2e
-26 162 415
Notes: 1. This is the level of the third carbon budget in the 2009 legislation. The Government raised the budget level to 2,632 MtCO2e by carrying forward 88 MtCO2e of over-achievement from the second carbon budget period. See page 2 of:
https://www.gov.uk/government/publications/annual-statement-of-emissions-for-2018
2. This subset of early stage policies and proposals from the Clean Growth Strategy (CGS) gives an additional potential reduction of up to 30 and 80 MtCO2e over the fourth and fifth carbon budget periods respectively. Please see Box 1 for details of how we project future performance against the budgets. 3. Base emissions were around 797 MtCO2e26. Base year emissions estimates on which CB percentage reductions are based are revised annually and are therefore subject to change.
4. The UK Net Carbon Account (NCA) is fixed at the end of each CB period. The traded sector component of the NCA for CB1 and 2 is based on the actual UK share of EU ETS allowance, whereas for CB3, 4 and 5 it is based on the UK share of EU ETS allowances assumed at the time of setting the respective budgets. See 'Box 1' for further information on how the NCA is calculated.
26 The base year for comparison is 1990 for CO2, CH4 and N2O, and 1995 for fluorinated gases: https://www.legislation.gov.uk/ukpga/2008/27/contents

Updated energy and emissions projections 2019
16
2.2 Non-traded emissions projections by sector
Between 2018 and 2040, we project an overall fall in non-traded emissions of 52 MtCO2e (16%). However, by the end of the period, non-traded emissions will form a slightly larger proportion of all territorial emissions. Their proportion rises from 71% to 78%: this is 7 percentage points higher.
Figure 2.3 shows the trends we project for non-traded emissions by sector. The overall pattern for each is very similar to EEP 2018. The biggest changes are for transport and residential non-traded emissions in this EEP edition.
Figure 2.3: Non-traded emissions in the economy, MtCO2e
Notes: * Other emissions covers emissions which are not from the residential or transport sectors. This includes emissions from industry, commerce and agriculture.
By far the majority of transport emissions come from road transport. We project these will be slightly higher than in EEP 2018 in the early years of projections. However, they decline at a faster rate than in last year’s edition by the late 2020s. EEP 2019 suggests road transport emissions for the year 2035 will be 78 MtCO2e whilst in EEP 2018 the figure was 90 MtCO2; this is 13% lower. Much of this reduction reflects new CO2 regulations for cars, vans and HGVs and the updated policy assumption that electric vehicle uptake will be higher. Over the fourth
Updated energy and emissions projections 2019
17
and fifth carbon budgets these trends translate into emissions of 498 MtCO2e (3% higher than the previous edition) and 446 MtCO2e (3% lower than the previous edition) respectively.
In these projections the lower residential emissions reflect reduced forecasts for the number of UK households from those in EEP 2018: by 2035 the emissions are 4 MtCO2e lower in this edition. For carbon budgets four and five, this means residential non-traded emissions are 12 and 14 MtCO2e lower respectively. On average for the fourth and fifth carbon budget periods, this is around 4% lower than in EEP 2018.
Section 4 discusses the energy demand projections which lead to these emissions.
Updated energy and emissions projections 2019
18
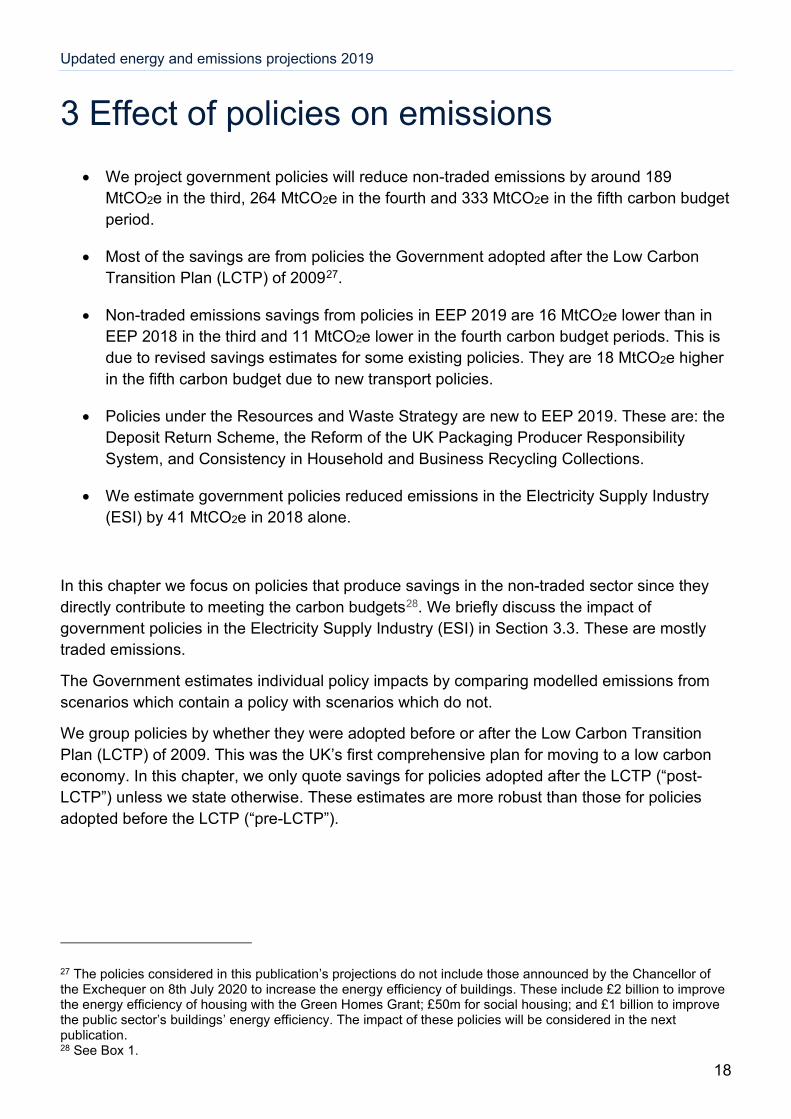
3 Effect of policies on emissions • We project government policies will reduce non-traded emissions by around 189
MtCO2e in the third, 264 MtCO2e in the fourth and 333 MtCO2e in the fifth carbon budget period.
• Most of the savings are from policies the Government adopted after the Low Carbon Transition Plan (LCTP) of 200927.
• Non-traded emissions savings from policies in EEP 2019 are 16 MtCO2e lower than in EEP 2018 in the third and 11 MtCO2e lower in the fourth carbon budget periods. This is due to revised savings estimates for some existing policies. They are 18 MtCO2e higher in the fifth carbon budget due to new transport policies.
• Policies under the Resources and Waste Strategy are new to EEP 2019. These are: the Deposit Return Scheme, the Reform of the UK Packaging Producer Responsibility System, and Consistency in Household and Business Recycling Collections.
• We estimate government policies reduced emissions in the Electricity Supply Industry (ESI) by 41 MtCO2e in 2018 alone.
In this chapter we focus on policies that produce savings in the non-traded sector since they directly contribute to meeting the carbon budgets28. We briefly discuss the impact of government policies in the Electricity Supply Industry (ESI) in Section 3.3. These are mostly traded emissions.
The Government estimates individual policy impacts by comparing modelled emissions from scenarios which contain a policy with scenarios which do not.
We group policies by whether they were adopted before or after the Low Carbon Transition Plan (LCTP) of 2009. This was the UK’s first comprehensive plan for moving to a low carbon economy. In this chapter, we only quote savings for policies adopted after the LCTP (“post-LCTP”) unless we state otherwise. These estimates are more robust than those for policies adopted before the LCTP (“pre-LCTP”).
27 The policies considered in this publication’s projections do not include those announced by the Chancellor of the Exchequer on 8th July 2020 to increase the energy efficiency of buildings. These include £2 billion to improve the energy efficiency of housing with the Green Homes Grant; £50m for social housing; and £1 billion to improve the public sector’s buildings’ energy efficiency. The impact of these policies will be considered in the next publication. 28 See Box 1.
Updated energy and emissions projections 2019
19
3.1 Policies for non-traded emissions reduction
Table 3.1 shows that we estimate that government policies will reduce non-traded emissions by 785 MtCO2e over carbon budgets three to five29. We report policy savings in Annex D: this gives brief information about the policies we include.
Table 3.1: Non-traded GHG emissions savings from policies, MtCO2e Carbon budget
CB3
(2018-22) CB4
(2023-27) CB5
(2028-32) Total
(2018-32)
Savings from pre-LCTP policies 68 60 49 177
Savings from post-LCTP policies 121 204 283 608
Savings from all policies 189 264 333 785
3.2 Changes to non-traded policy savings since EEP 2018
In the short and medium term, we project lower non-traded GHG savings from government policies in EEP 2019 compared with the 2018 projections. Savings for the third carbon budget have decreased from 204 to 189 MtCO2e (16 MtCO2e less) while those for the fourth carbon budget have decreased from 275 to 264 MtCO2e (11 MtCO2e less).
In the long term we project higher policy savings than in EEP 2018. Savings for the fifth carbon budget have increased overall in EEP 2019, from 314 to 333 MtCO2e (a change of 18 MtCO2e).
Policies with the largest change in non-traded policy savings from last year’s projections include:
• Resources and Waste Strategy: the Deposit Return Scheme, the Reform of the UK Packaging Producer Responsibility System, and the Consistency in Household and Business Recycling Collections policies are new to EEP 2019. Together, they contribute 1 MtCO2e and 4 MtCO2e of non-traded savings in the fourth and fifth carbon budget periods, respectively.
• Vehicle Efficiency Policies: for EEP 2019, the savings we attribute to Road Vehicle Efficiency policies are 5 MtCO2e lower in the fourth carbon budget period than in EEP 2018, driven by statistics which show consumers opting for larger and less efficient
29 Our projections do not include the potential impacts of the Government’s consultation on proposals to end the sales of new petrol, diesel and hybrid cars and vans by 2035 or earlier. We will include these when policy is more developed. The projections also do not include the £5 billion in new funding announced for cycling and buses in February 2020, but we will include this policy in EEP 2020.

Updated energy and emissions projections 2019
20
vehicles in recent years. However, savings are 21 MtCO2e higher in the fifth carbon budget period than in the last edition. The main drivers are new CO2 regulations for cars, vans and HGVs and an increased forecast of electric vehicle uptake.
• Agricultural policies30: projected agriculture sector savings for England are lower than EEP 2018 by 10 MtCO2e in the fourth and the fifth carbon budget periods. We revised savings of 4 MtCO2e per year (mostly associated with English agricultural policies) in EEP 2018 to 2 MtCO2e based on updated outturn evidence for the sector. Savings mostly come from improved nutrient management and land and soil management.
3.3 Emissions savings from policies in electricity supply
The EU ETS covers most emissions from electricity supply. These are traded emissions and do not affect the UK’s Net Carbon Account31. A range of government policies have reduced emissions in the Electricity Supply Industry (ESI) since the 2009 Low Carbon Transition Plan.
Supply-side policies comprise:
• Large Combustion Plant Directive
• Industrial Emissions Directive
• EU ETS
• UK Carbon Price Support
• Feed-in-Tariffs (for small scale generation)
• Renewables Obligation and Contracts for Difference (for large-scale generation)
• Phase out of coal-fired generation
Power supply markets are highly interconnected. This means we cannot disentangle the impacts of individual policies. However, we estimate that in total these reduced emissions from the power sector by 41 MtCO2e in 2018 alone.
We project ESI policy savings will be 245 MtCO2e during the fourth carbon budget period. This compares with the 292 MtCO2e we projected in EEP 2018. The change in modelling approach we discuss in Chapter 5 explains most of this difference.
We report aggregated emissions savings from power supply policies in the “All, by sector” section of Annex D.
30 “Agricultural policies” covers a range of resource efficiency and land management emission reduction measures. Please see Annex D for more information. Note that savings in the agriculture sector are not limited to these policies. There are impacts from other measures which do not have agriculture as their sole focus (see Annex D). 31 See Box 1.

Updated energy and emissions projections 2019
21
4 Demand for energy • Our projections suggest that total final energy demand in 2040 will be around 135 million
tonnes of oil equivalent (Mtoe)32. This is about 5 Mtoe (4%) lower than the demand inthe year 2018. This represents around a 14% reduction in per capita demand.
• We project total primary energy demand in 2040 will be around 183 Mtoe, about 17 Mtoe(9%) less than the 2018 value.
• We project the proportion of all final energy demand met from electricity or renewableswill rise from 23% in 2018 to 27% in 2035 and to 28% in 2040. In EEP 2018 the 2035figure was 26%.
In this chapter we summarise the latest projections for final and primary energy demand.
4.1 Final energy demand
We project that total Final Energy Demand (FED)33 will fall until the year 2026—to 133 Mtoe from 140 Mtoe in 2018 (a decrease of around 5%). Demand then rises slowly as the effects of policies diminish34 and macroeconomic drivers continue to push it up. By 2040, we project total FED will be around 135 Mtoe, 4% lower than in the year 2018 (Fig 4.1 a). This represents around a 14% reduction in per capita demand.
In EEP 2019 we project slightly lower total final energy demand than in EEP 2018: in 2035 it is 5% lower than in the previous edition. This is mainly due to decreased demand for oil products in transport and for natural gas in the residential and industry sectors.
In this edition, FED for electricity is slightly lower than in EEP 2018. By 2035 the difference is around 2% (638 Mtoe less). Lower demand in the residential and services sectors outweighs higher demand for industrial and (especially) transport electricity.
The proportion of all FED met from electricity or renewables rises slowly from 23% in 2018 to 27% in 2035, and to 28% in 2040.
Patterns of demand vary across the four major energy consuming sectors of transport (Figure 4.1 b), residential (Figure 4.1 c), industry (Figure 4.1 d) and services (Figure 4.1 e).
32 These are the same units as DUKES uses for historical data. 33 Final energy consumption is energy consumed by the final user—i.e. it excludes any losses during the transformation into other forms of energy. We follow the DUKES approach here and include international aviation but not international shipping demand. The emissions projections we discuss exclude both. 34 The model projects energy demand and emissions in the absence of policy. We then remove emissions to match the emissions reductions we expect for the policies the scenario includes. So, if policy savings diminish (for example when a policy expires), the model’s emissions increase towards the policy-off level.

Updated energy and emissions projections 2019
22
Figure 4.1: Final energy demand by fuel and consumer sector, 2008 to 2040, Mtoe

Updated energy and emissions projections 2019
23
Final energy demand by sector
The main trends in final energy demand for each sector are:
Transport (including international aviation; Figure 4.1 b)
• This had the largest final energy demand in 2018 (40% of the total).
• We project transport final energy demand will fall by 16% between 2018 and 2040. It will then be the second biggest sector behind the residential sector (34% of the total).
• In 2018, 97% of transport FED was from oil-based fossil fuels but by 2040 we project this will fall to 89%. This reflects more electric vehicles and increasing biofuels use.
• We project final energy demand in 2035 will be 8% lower than EEP 2018. The main reason is that new CO2 regulations establishing emissions targets for cars, vans and HGVs lead to reduced demand for petroleum products.
Residential (Figure 4.1 c)
• This sector had the second highest final energy demand in 2018 (29% of the total).
• We project total residential FED will increase by 19% between 2018 and 2040 when the sector overtakes transport to become the largest sector (36% of the total demand). This change is a consequence of our assumptions about: the growth in the number of households, changes in household income, future weather and how retail fuel prices will change.
• In 2018, 28% of residential FED came from electricity and renewables35. We project this proportion will increase slightly to 30% by 2040.
• Our projection for overall residential final energy demand in 2035 is 4% lower than EEP 2018. Our projections for demand from each fuel are lower too. This is mainly because we assume lower future household numbers than in the previous edition.
Industry (Figure 4.1 d)
• This sector was 16% of total final energy demand in 2018.
• We project total industry FED will fall by 24% between 2018 and 2040.
• In 2018 around 43% of industrial final energy demand was for electricity or renewables. In 2040 this rises slightly to 45%.
• We project industry FED in 2035 will be 10% lower than EEP 2018 levels. Demand for electricity, solid fuels and renewables is higher, while FED for petroleum products and natural gas is lower. The main reasons are the DUKES 2019 reallocation of oil from
35 The DUKES category “Bioenergy & waste”. This includes geothermal, solar heat and heat pumps but excludes renewable electricity generation.

Updated energy and emissions projections 2019
24
industry to service sectors36 and improvements to our industry equations (see Section 6.2).
Services37 (Figure 4.1 e)
• Services final energy demand was 15% of the total in 2018.
• We project this to increase by 7% between 2018 and 2040, reaching 17% of total FED.
• In 2018, 45% of services final energy demand was from electricity and renewables38. We project this share will remain roughly the same up to 2040.
• In EEP 2019 our projection for services FED in 2035 is 2% higher than in EEP 2018. We project final energy demand from electricity will decrease and demand for oil will increase. This follows from the demand equation improvements and the DUKES 2019 reallocation of oil from industry to service sectors which we describe in Section 6.2.2.
We give final energy demand projections by sector in annex F.
4.2 Primary energy demand
We project total primary energy demand39 will fall by 11% between 2018 and 2025: from 200 to 179 Mtoe. It then stays at around this level before increasing from the mid-2030s. In 2040 it reaches 183 Mtoe, a reduction of 9% from the year 2018.
Total primary energy demand in 2035 is 7% lower than EEP 2018. This is driven by reduced demand for nuclear, renewables and waste and for oil in the 2019 edition. However, higher demand for imported electricity and natural gas offsets this somewhat.
36 The impact of the DUKES changes is that the statistics now assign around 40% of industrial oil demand to other sectors. For more information see:
https://www.gov.uk/government/publications/energy-trends-june-2019-special-feature-article-change-to-method-of-estimating-sector-demand-for-oil-products
37 Services comprises the commercial sector, public sector and agriculture. 38 The DUKES category “Bioenergy & waste”. This includes geothermal, solar heat and heat pumps but excludes renewable electricity generation. 39 Fuels obtained directly from natural sources, e.g. coal, oil and natural gas. Primary energy includes primary electricity.

Updated energy and emissions projections 2019
25
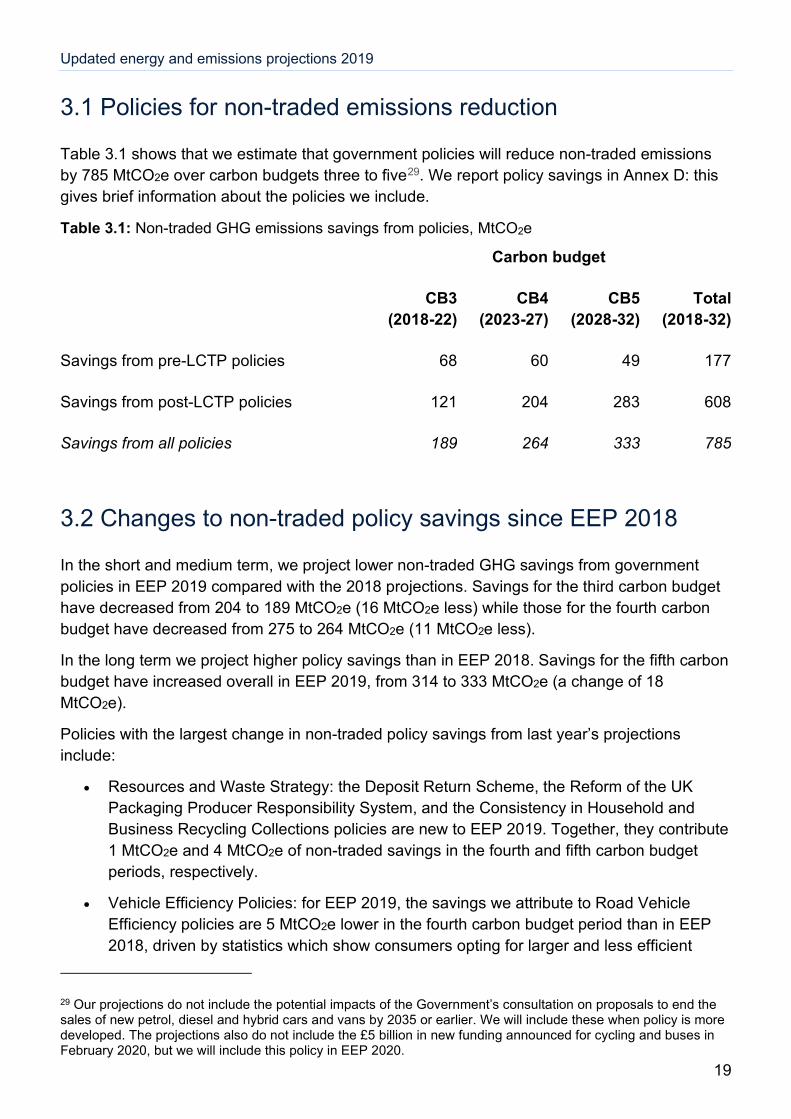
Primary energy demand by fuel group
The trends we project for primary energy demand from different sources are similar to those in the previous edition (Figure 4.2):
• Renewables, nuclear and other electricity (Fig 4.2 a) demand increases steadily. Between 2018 and 2040, primary energy from these sources increases by 36% to reach 29% of total primary energy demand or 54 Mtoe.
• Solid fuels (mostly coal: Fig 4.2 b) use has fallen rapidly since 2013 as electricity generation has switched to using more renewables, waste and natural gas. By 2040 it meets only 2% (4 Mtoe) of demand. There is no coal-fired electricity generation after the government deadline of 2025.
• Demand for primary energy from oil and natural gas (Fig 4.2 c) declines by 18% between 2018 and 2040. Electricity and biofuels meet an increasing proportion of road fuel demand. Renewables and nuclear displace electricity generation from natural gas.
We give primary energy demand projections for each fuel in Annex E.
Updated energy and emissions projections 2019
26
Figure 4.2: Primary energy demand by fuel, Mtoe
Notes: * Other electricity is mainly electricity from waste.

Updated energy and emissions projections 2019
27
5 Electricity supply • For this year’s publication, we aligned the power sector modelling approach with the rest
of EEP by only including assumptions that reflect implemented, adopted and planned policy40. BEIS will also publish two illustrative strategic scenarios showing what a Net Zero-consistent power sector could look like. These go beyond current government policy and do not indicate a preferred outcome41.
• We project that the low carbon share of UK electricity generation42 will rise from 51% in 2018 to 83% in 2040. This is the proportion of all generation from renewables, nuclear or Carbon Capture and Storage (CCS) power producers.
We undertook the electricity supply sector modelling in March 2020 using BEIS’s “Dynamic Dispatch Model” (DDM)43. The DDM models the impact of relevant policies including small scale Feed-in Tariffs, the Renewables Obligation, Contracts for Difference (CfD), Carbon Price Support, the Capacity Market and Industrial Emissions Directive.
This year, we have changed the modelling approach slightly so the power sector is more in line with the rest of EEP modelling. Our reference scenario assumptions now attempt to reflect implemented, adopted and planned policy44. In previous editions the modelling assumed current government policy continued. For example, some of the impacts of this are that the EU ETS trajectory is now the same as other sectors post 2030 and there are no CfD auctions after 2030. Some of the installations included within these projections depend on future decisions by government and regulators. These decisions will be taken on a case-by-case basis at the appropriate moment and will be subject to value for money assessment if additional funding is required.
As in previous years, the report annexes give separate results for “Major Power Producers” (MPPs: annexes G-I) and “All Power Producers” (which includes autogenerators: annexes J-L). In 2018, MPPs accounted for around 95% of the UK’s electricity generation.
40 This equates to expired, implemented, adopted, and planned policies as defined by the United Nations Framework Convention on Climate Change (UNFCCC). See Part II, Section V(A) paragraph 13, page 83 of:
http://unfccc.int/resource/docs/cop5/07.pdf This is a UNFCCC “with additional measures” (WAM) scenario. Annex D gives details of the policies we include. 41 We will give more detail about these in the report published as Annex O once published. 42 The figures we quote in this chapter are for “All Power Producers”. They do not include electricity imports or exports. 43 For background information on the DDM please see:
https://www.gov.uk/government/publications/dynamic-dispatch-model-ddm 44 This equates to expired, implemented, adopted, and planned policies as defined by the United Nations Framework Convention on Climate Change (UNFCCC). See Part II, Section V(A) paragraph 13, page 83 of:
http://unfccc.int/resource/docs/cop5/07.pdf This is a UNFCCC “with additional measures” (WAM) scenario. Annex D gives details of the policies we include.

Updated energy and emissions projections 2019
28
5.1 Summary of projections
The projections show a slightly lower overall demand for electricity than in EEP 2018. We discuss this in Section 4.1. The biggest power sector changes from last year’s edition are in the generation mix.
Figure 5.1 shows our projections of generation by technology for all power producers up to 2040:
• Over time, low carbon generation (renewables, gas CCS and nuclear) increases. It makes up 83% of UK generation by 2040. This is around a 32 percentage point increase in the low carbon share from 51% in 2018.
• As in the previous EEP edition, we project generation from renewables will rise. However, this year’s modelling approach (which reflects implemented and planned policies rather than a trajectory consistent with an 80% emissions reductions target as we assumed in EEP 2018) means the increase is lower as there is less capacity throughout the 2030s. In 2035 this amounts to 30 TWh (14%) less generation compared with EEP 2018: imports and gas generation make up the shortfall. Total renewables generation reaches 56% of UK generation by 2040.
• Natural gas generation responds to increasing low carbon generation by falling rapidly until the late 2020s. It then stabilises as less new low carbon generation capacity comes online. By 2035 it will be around 59 TWh, 55% lower than 2018 levels. This compares with 34 TWh in the previous edition (25 TWh higher). In 2040, 53 TWh of demand is from gas generation, 16% of the total.
• Nuclear generation increases with the opening of new capacity between the mid-2020s and mid-2030s. There are dips as existing plants retire. Our assumption of lower capacity45 in EEP 2019 means less nuclear generation than in EEP 2018 (41 TWh lower in 2035).
• We project net imports from interconnectors will rise as more connections with neighbouring markets open in the 2020s. Imports are higher than in EEP 2018 as they largely offset the lower increases in renewables and nuclear generation.
45 The modelling takes into account the suspension of work on Wylfa Newydd nuclear power station and the subsequent withdrawal of Hitachi from the project.

Updated energy and emissions projections 2019
29
Figure 5.1: Electricity generation by fuel source, TWh
We project emissions from electricity production will fall steadily as generation switches away from fossil fuels (annexes B and C).
5.2 Net Zero-consistent power sector scenarios
BEIS has worked extensively on the Net Zero target since EEP 2018. This includes modelling two illustrative scenarios showing what a Net Zero-consistent power sector could look like. These will be published in the Net Zero and the Power sector publication as Annex O to EEP 2019. This will discuss this modelling and its implications in more detail.

Updated energy and emissions projections 2019
30
6 Detailed comparisons with EEP 2018 This chapter gives more information about the major changes to the projections since EEP 2018. We presented summary figures in Section 1.3.
6.1 Changes in territorial projections since EEP 2018
Table 6.1: Changes which affect total territorial emissions (in comparison with EEP 2018), MtCO2e Carbon budget period
Type of change since EEP 2018 CB3 (2018-22)
CB4 (2023-27)
CB5 (2028-32)
Model inputs 72 35 24
Policy savings updates 12 9 -19
Modelling improvements -36 -37 -28
Total change since EEP 2018 48 7 -23
The differences between this edition and EEP 2018 stem from model improvements, and updates to policy savings and other inputs. We summarise the main changes since EEP 2018 which affect overall territorial emissions in table 6.1. These are:
• Policy savings updates for climate change policies lead to higher projected territorial emissions in the third and fourth carbon budgets (by 12 MtCO2e and 9 MtCO2e respectively), but lower territorial emissions (by 19 MtCO2e) in the fifth carbon budget. The biggest changes from policy updates are in the transport sector. For example, compared with EEP 2018, updated outturn data for vehicle emissions cause higher emissions in the third and fourth carbon budgets (by 7 MtCO2e and 4 MtCO2e) but 20 MtCO2e lower emissions in the fifth carbon budget as changes in electric vehicle ownership and efficiency have an impact. We discuss policy savings in Chapter 3.
• Revisions to model inputs mean that territorial emissions projections are higher than EEP 2018 in each of carbon budget periods three to five. The emissions are higher by 72, 35 and 24 MtCO2e respectively. The main reason is a fall in fossil fuel prices since EEP 2018 which encourages their greater use. However, lower household numbers somewhat offset this in the fourth and fifth carbon budget periods.
• Modelling improvements lead to lower territorial emissions than in EEP 2018 in each of carbon budget periods three to five. The emissions are lower by 36, 37 and 28 MtCO2e respectively. We have lowered projected iron and steel demand since the last edition to

Updated energy and emissions projections 2019
31
better match recent energy use trends in the sector46. This model change caused the greatest fall in territorial emissions.
In this report our main focus has been the non-traded emissions element of territorial emissions. This is because these affect performance against carbon budgets (see Box 1 for more details).
6.2 Changes in non-traded projections since EEP 2018 This section focuses on changes in non-traded emissions since EEP 2018. Table 6.2 below shows the main changes and their impacts on non-traded emissions in the third, fourth and fifth carbon budget periods.
Table 6.2: Changes which affect non-traded emissions (in comparison with EEP 2018), MtCO2e
Carbon budget
Type of change since EEP 2018 CB3 (2018-22)
CB4 (2023-27)
CB5 (2028-32)
Model inputs 40 26 11
Modelling improvements 10 14 18
Policy savings updates 13 8 -21
Total change since EEP 2018 62 49 8
The main reasons for changes in projected non-traded emissions47 since the last edition are:
• Revised model inputs mean projections of non-traded emissions are 40, 26 and 11 MtCO2e higher than in EEP 2018 in the third, fourth and fifth carbon budget periods respectively. We cover the impact of input updates in Section 6.2.2.
• Modelling improvements led to projected non-traded emissions which are 10 MtCO2e higher in the third, 14 MtCO2e higher in the fourth and 18 MtCO2e higher in the fifth carbon budget periods. The main improvements in the projection methodology were to emissions accounting for industry and services (the traded/non-traded split), and to demand projections for commerce, public oil, residential oil and industry. We give more information about this in Section 6.2.1.
• Policy savings updates for climate change policies led to 13 MtCO2e and 8 MtCO2e higher projected non-traded emissions in the third and fourth carbon budgets
46 Recent changes in the sector include the closure of Redcar’s steel plant in 2015 and declining production of manufactured solid fuels such as coke oven coke. 47 Our attributions are approximate here. It is not possible to fully isolate the impact of every change.

Updated energy and emissions projections 2019
32
respectively. In the fifth carbon budget period, these changes result in 21 MtCO2e lower non-traded emissions. We discuss policy savings in detail in Chapter 3.
6.2.1 Improvements in the projection methodology
Since we published EEP 2018, the BEIS modelling team have concentrated on quality assurance48 and modelling methodology updates. All model changes use more up to date data and evidence to improve the accuracy of the projections. Our modelling improvements cause non-traded emissions to be higher in each of carbon budget periods three to five: by 10, 14 and 18 MtCO2e respectively.
Table 6.3: Improvements in the projection methodology which affect non-traded emissions (in comparison with EEP 2018), MtCO2e
Carbon budget
Modelling improvements CB3 (2018-22)
CB4 (2023-27)
CB5 (2028-32)
Traded/non-traded emissions split 11 12 12
Commerce and public demand projections 3 7 10
Industry demand projections -4 -3 -2
Residential demand projections -3 -3 -3
Other [1] 2 1 2
Total change from modelling improvements 10 14 18
Notes: 1. “Other” includes inputs with impacts less than 5 MtCO2e across the combined total of carbon budgets three, four and five.
The main modelling improvements that affected non-traded emissions projections are:
• Revisions to the traded/non-traded emissions split: We improved the alignment of the model to the GHG Inventory and EU ETS data. This made the proportion of non-traded emissions in the projections higher.
• Commerce and public demand projections: We revised commerce and public oil demand upwards to match the revised estimates of past consumption in DUKES49.
48 See BEIS Modelling Quality Assurance tools and guidance here: https://www.gov.uk/government/collections/quality-assurance-tools-and-guidance-in-decc 49 The impact of the DUKES changes is that the statistics now assign around 40% of industrial oil demand to other sectors. For more information see:
https://www.gov.uk/government/publications/energy-trends-june-2019-special-feature-article-change-to-method-of-estimating-sector-demand-for-oil-products

Updated energy and emissions projections 2019
33
• Industry demand projections: Changes to these caused lower industry gas and oil consumption projections. We revised the equations because changes in the sector meant the model no longer matched recent trends50.
• Residential demand projections: Our revised approach led to lower residential oil consumption projections. We made this change because our existing equations were not reflecting past trends as well as in other sectors.
6.2.2 Changes due to input updates
We list the main input updates and their effects on emissions in Table 6.4. The overall impact of changes to inputs is to give higher emissions: by 40, 26 and 11 MtCO2e in carbon budget periods three, four and five.
Table 6.4: Input updates which affect non-traded emissions (in comparison with EEP 2018), MtCO2e Carbon budget
Input update CB3 (2018-22)
CB4 (2023-27)
CB5 (2028-32)
LULUCF and Non-CO2 29 27 25
Fossil fuel price projections 14 16 14
GHG Inventory (2019) 15 7 7
Transport 3 7 6
DUKES [1] -8 -3 -4
Power sector updates & interaction -1 -3 -11
GHG Inventory (2020) -6 -12 -11
Household numbers -7 -13 -16
Other [2] 1 -1 0
Total change due to input updates 40 26 11
Notes: 1. The DUKES update row does not include transport: the “Transport” row captures these changes. It also excludes the indirect impact of our projection equation adjustments which we made after the DUKES revisions to past oil demand. 2. “Other” includes inputs with impacts less than 5 MtCO2e across the total of carbon budgets three to five.
50 We last reviewed industry in depth in 2016.

Updated energy and emissions projections 2019
34
Compared with EEP 2018, the biggest upwards revisions to non-traded emissions come from updates to:
• LULUCF and Non-CO2 emission data: updated historic data and new projections of Land Use, Land Use Change and Forestry (LULUCF) / non-CO2 emissions mean that emissions are higher than in EEP 2018—by 29 MtCO2e in the third, 27 MtCO2e in the fourth and 25 MtCO2e in the fifth carbon budget periods. The main reason for the increases was a correction to GHG removals from forest land in the GHG Inventory (2019)51 (this also affected the main Inventory CO2 emissions inputs: see below).
• Fossil fuel price projections: we assume future prices of fossil fuels will be lower than in EEP 201852. This makes it economically attractive to use more of them. The higher fossil fuel use leads to higher emissions than in EEP 2018. Non-traded emissions are 14, 16 and 14 MtCO2e higher in the third, fourth and fifth carbon budget periods respectively.
• GHG Inventory (2019): this update led to higher non-traded emissions. In the third carbon budget period, emissions were 15 MtCO2e higher. In the fourth and fifth budget periods emissions are also higher—by 7 MtCO2e in the fourth and 7 MtCO2e in the fifth. The main reason for the upward revisions was a correction to GHG removals from forest land53.
• Transport: the latest statistics showed higher than expected fuel consumption from road transport54. This led us to revise our fuel efficiency assumptions downwards. The impact is higher emissions.
Compared with EEP 2018, the biggest downwards revisions to non-traded emissions come from updates to:
• DUKES: DUKES 2019 made significant revisions to oil consumption55. It reallocated a lot from the industry sector to commerce, public and agriculture. These changes lead to slightly lower non-traded emissions in the projections. This reflects our projection that emissions will fall more quickly in the sectors receiving the reallocations than in industry.
• Power sector updates and interaction: we have revised the power sector assumptions since EEP 2018. Most of the sector is in the EU ETS and so its emissions are traded.
51 See Section 6.2.7 of UK Greenhouse Gas Inventory, 1990 to 2017: Annual Report for Submission under the Framework Convention on Climate Change:
http://uk-air.defra.gov.uk/reports/cat07/1905151122_ukghgi-90-17_Main_Issue_2_final.pdf 52 We give these assumptions in Annex M. 53 See Section 6.2.7 of UK Greenhouse Gas Inventory, 1990 to 2017: Annual Report for Submission under the Framework Convention on Climate Change:
http://uk-air.defra.gov.uk/reports/cat07/1905151122_ukghgi-90-17_Main_Issue_2_final.pdf 54 Latest transport statistics:
https://www.gov.uk/government/statistical-data-sets/energy-and-environment-data-tables-env#fuel-consumption-env01
55 The impact of the DUKES changes is that the statistics now assign around 40% of industrial oil demand to other sectors. For more information see:
https://www.gov.uk/government/publications/energy-trends-june-2019-special-feature-article-change-to-method-of-estimating-sector-demand-for-oil-products

Updated energy and emissions projections 2019
35
However, some generation from Combined Heat and Power (CHP) plants is outside the scheme and its emissions are non-traded. We no longer assume any new CHP plants will be built. This means our projections now only reflect generation from existing CHP installations. We assume that any of these plants which close will not be replaced. The lower projected non-traded emissions reflect reduced future CHP generation.
• GHG Inventory (2020): this update led to lower non-traded emissions. They are 6 MtCO2e lower in the third, 12 MtCO2e lower in the fourth and 11 MtCO2e lower in the fifth carbon budget periods.
• Household numbers: non-traded emissions are lower by 7, 13 and 16 MtCO2e in carbon budgets three, four and five respectively. This reflects lower household number forecasts than in EEP 201856. The demand for energy in the residential sector is closely linked to household numbers and is therefore lower. This leads to reduced emissions.
6.3 Changes in traded projections since EEP 2018
Compared with EEP 2018, the biggest downwards revisions to traded emissions come from:
• Changes to our projections of future iron and steel demand (see Section 6.1)
• Our revisions to the traded/non-traded emissions split (Section 6.2.1) and
• Our changes to the commerce and public demand projections (Section 6.2.1).
Of these, the changes to the iron and steel demand projections had the largest impact.
56 We give these assumptions in Annex M.

Updated energy and emissions projections 2019
36
7 Lists of supporting material
7.1 Annexes
Annex A: Greenhouse gas emissions by source
Annex B: Carbon dioxide emissions by source
Annex C: Carbon dioxide emissions by IPCC category
Annex D: Policy savings in the projections
Annex E: Primary energy demand
Annex F: Final energy demand
Annex G: Major power producers’ generation by source
Annex H: Major power producers’ cumulative new electricity generating capacity
Annex I: Major power producers’ total electricity generating capacity
Annex J: Total electricity generation by source
Annex K: Total cumulative new electricity generating capacity
Annex L: Total electricity generating capacity
Annex M: Growth assumptions and prices
Annex N: 2019 non-CO2 GHG emissions projections report
Annex O: Net Zero and the power sector scenarios

Updated energy and emissions projections 2019
37
Our annexes contain projections for the following scenarios which we publish each year:
Scenario Description
Reference Scenario
Based on central estimates of economic growth and fossil fuel prices. Contains all policies where decisions on policy design are sufficiently advanced to allow robust estimates of impact (i.e. including “planned” policies). See annex D on policy savings for definitions of each policy implementation status.
Low Prices Similar assumptions to reference scenario but with lower projected fossil fuel prices.
High Prices Similar assumptions to reference scenario but with higher projected fossil fuel prices.
Low Growth Similar assumptions to reference scenario but with lower projected economic growth.
High Growth Similar assumptions to reference scenario but with higher projected economic growth.
Existing Policies Contains central price and growth assumptions but without planned policies included.
Baseline Policies Contains central price and growth assumptions but only policies that existed before the Low Carbon Transition Plan of July 2009.

Updated energy and emissions projections 2019
38
Once Annex O (Net Zero and the power sector scenarios) has been published, we will also provide annexes G to L for the Net Zero strategic reference scenarios:
Scenario Description
Net Zero (Higher) Net Zero strategic reference scenario with higher power sector electricity demand.
Net Zero (Lower) Net Zero strategic reference scenario with lower power sector electricity demand.
7.2 Web tables and figures
We publish web tables and figures alongside this report. Some of these replicate tables and figures in the report text while others are supplementary.

This publication is available from: www.gov.uk/government/publications/updated-energy-and-emissions-projections-2019
If you need a version of this document in a more accessible format, please email [email protected]. Please tell us what format you need. It will help us if you say what assistive technology you use.