Embed Size (px)
Citation preview
Clinical Radiology (2008) 63, 1035e1048
PICTORIAL REVIEW
Upright positional MRI of the lumbar spine
F. Alyasa,b, D. Connella,b, A. Saifuddina,b,*
aLondon Upright MRI Centre, London, UK, and bDepartment of Radiology, The Royal National OrthopaedicHospital NHS Trust, Stanmore, Middlesex, UK
Received 9 June 2007; received in revised form 5 November 2007; accepted 12 November 2007
Supine magnetic resonance imaging (MRI) is routinely used in the assessment of low back pain and radiculopathy. How-
ever, imaging findings often correlate poorly with clinical findings. This is partly related to the positional dependenceof spinal stenosis, which reflects dynamic changes in soft-tissue structures (ligaments, disc, dural sac, epidural fat,and nerve roots). Upright MRI in the flexed, extended, rotated, standing, and bending positions, allows patients toreproduce the positions that bring about their symptoms and may uncover MRI findings that were not visible with rou-tine supine imaging. Assessment of the degree of spinal stability in the degenerate and postoperative lumbar spine isalso possible. The aim of this review was to present the current literature concerning both the normal and symptom-atic spine as imaged using upright MRI and to illustrate the above findings using clinical examples.ª 2008 The Royal College of Radiologists. Published by Elsevier Ltd. All rights reserved.Introduction
Low back pain (LBP) is a common and costlyproblem in the UK.1 Clinical presentation is non-specific with signs and symptoms being related toa variety of overlapping aetiological factors.Supine magnetic resonance imaging (MRI) has anestablished role in the assessment of spinal disor-ders2; however, its findings, such as stenosis anddisc herniation, have both high false-positive andfalse-negative rates.3e5
Part of the reason relates to the supine patientposition with hips and knees flexed, resulting inrelative spinal flexion. This maximizes the dimen-sions of the canal and exit foramina, thus reducingthe magnitude of any stenotic effect. Clinicalsymptoms can develop with sitting, standing, ordynamic manoeuvres (including flexion and exten-sion) and may not be adequately assessed bysupine MRI. Development of these symptoms
* Guarantor and correspondent: A. Saifuddin, Department ofRadiology, The Royal National Orthopaedic Hospital NHS Trust,Brockley Hill, Stanmore, Middlesex HA7 4LP, UK. Tel.: þ44 208909 5443; fax: þ44 20 8909 5281.
E-mail address: [email protected] (A. Saifuddin).
0009-9260/$ - see front matter ª 2008 The Royal College of Radiolodoi:10.1016/j.crad.2007.11.022
reflects the morphological changes in normal ordegenerate disco-ligamentous structures due tothe effects of gravity, changes in size of theintervertebral foramen, and relative motion be-tween adjacent vertebrae on assumption of theupright posture and with dynamic manoeuvres.
Therefore, upright and dynamic imaging isimportant, and a number of techniques are alreadyavailable for such assessment. Plain radiographsuse ionizing radiation and fail to visualize the softtissues. There are also measurement errors asso-ciated with magnification, rotation and alignmentartefacts related to imaging a three-dimensionalstructure in two-dimensions.6 Myelography suffersfrom similar drawbacks, but is also invasive withrisks of infection, contrast medium reaction, andheadache.7 Furthermore, myelography does not vi-sualize the thecal sac and cauda equina/nerveroots in all cases due to dilution of contrast me-dium, and cannot assess the exit foramen.8 Axiallyloaded supine MRI has been performed to simulatethe upright position,9 but may not truly reflectpostural spinal changes related to muscle tone,loads on the lumbar spine that increase in a caudaldirection rather than being uniform at each spinallevel, and the effects of core muscle activation onthe spine.10
gists. Published by Elsevier Ltd. All rights reserved.
1036 F. Alyas et al.
Improvements in available open MRI systemsfrom increased field strength (mid strength¼0.5e0.6 T), field homogeneity, gradient genera-tion, coil technology (quadrature coils), and fasterimage acquisition (dynamic equilibrium andmagnetization transfer) have resulted in bettersignal-to-noise ratios, contrast and spatial resolu-tion, and therefore, image quality. Open MRI sys-tems with a vertical gap allow imaging under theinfluence of gravity in the upright position (seatedor standing), with varying kinetic manoeuvres(flexion, extension, lateral bending, rotationetc,), as well as with the patient supine. Imagingin the physiologically representative upright posi-tion and with kinetic manoeuvres, allows accurateassessment and measurement of changes in the re-lationship between the components of the func-tional spinal unit and the potential to correlateradiological signs with positional symptoms.
This review illustrates how upright MRI candemonstrate changes from supine to the erectimaging and between-erect flexed and erect-ex-tended positions in the normal, degenerate, andpostoperative spine. The changes will be dividedinto the following sections: the intervertebral disc,central canal, exit foramen, spinal alignment, andspinal stability/instability. In addition, we reviewthe current literature in this area,11e23 which isa combination of both subjectively and objectivelymeasured observations.
Imaging technique
The MRI system (Upright MRI, Fonar Corporation,Melville, NY, USA) has a 0.6 T horizontal field gen-erated between two resistive magnets. A tilting ta-ble placed at right angles between these coils canbe positioned at any angle from �20 to 90� (verti-cal), allowing supine and standing imaging. An MRIcompatible seat can be added in the upright posi-tion. Extension is achieved by positioning of a smallcylindrical cushion just above the lumbrosarcaljunction. Flexion is achieved by leaning forward
Table 1 Imaging parameters
Sequence
Echotime(TE)
Time torepetition(TR)
Number ofexcitations(NEX)
Sagittal T2W FSE 140 1734 2Sagittal T1W FSE 17 671 e
Axial T2W FSE 135 2080 3Axial T1W FSE 17 671 3
T1W FSE, T1-weighted fast spin-echo.
over a wedge-shaped cushion and supporting thehands on a horizontal bar. A dedicated lumbarspine quadrature coil is used for signal acquisition.
The imaging protocol for upright MRI includesstandard sagittal and axial T1-weighted (W) fastspin-echo (FSE) and T2W FSE sequences throughthe lumbar spine in the neutral sitting position.Flexion sagittal T2W FSE and extension sagittal andaxial T2W FSE images are performed when posi-tional MRI is requested. This may be supplementedwith sagittal and axial T2W FSE sequences in thestanding position 5� off vertical (to minimizemotion). Dedicated coronal and axial scouts areobtained for each of these positions (to minimizeerrors from rotation or lateral bending). All imagesare obtained with 4.5 mm section thickness and0.5 mm overlap, acquisition time being approxi-mately 3.5 min. Imaging parameters are describedin Table 1. The lower field strength minimizes arte-fact from metal and chemical shift. Claustrophobicpatients can also be safely imaged, without theneed for prior sedation.24 In addition, the uprightposition allows the study of patients with signifi-cant cardiac and respiratory disease who cannottolerate supine imaging.
Normal postural alignment changes
On supine imaging, spinal alignment does notreflect the true postural effect of body weight,which can increase by 80%,25 and the action of par-aspinal and abdominal musculature.11,12 Normallythe upper lumbar spine undergoes increased ex-tension in the upright sitting11,13 and kneelingpositions, the degree of extension decreasing ina caudal direction (Table 2).10 The lumbrosacraljunction, representing the angle between theposterior margins of the L5 and S1 vertebral bodiesbecomes less flexed,15 and also more vertical tosupport the increased load in the upright posi-tion.26 This flexed position becomes more promi-nent in the seated compared with the standingposition.
Echo trainlength(ETL)
Field ofview(FOV)/cm Matrix
Echospacing(ESP)
13 32 220� 220 e3 32 220� 220 13
13 25 256� 224 e
3 25 256� 224 e
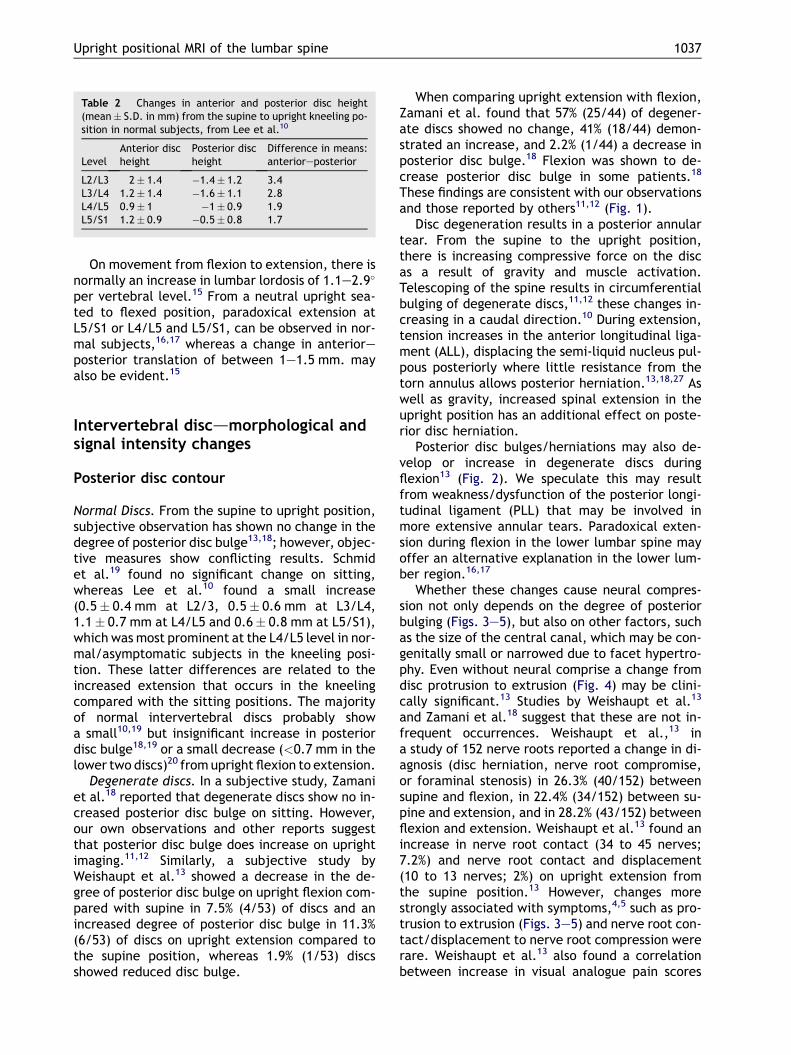
Table 2 Changes in anterior and posterior disc height(mean� S.D. in mm) from the supine to upright kneeling po-sition in normal subjects, from Lee et al.10
LevelAnterior discheight
Posterior discheight
Difference in means:anterioreposterior
L2/L3 2� 1.4 �1.4� 1.2 3.4L3/L4 1.2� 1.4 �1.6� 1.1 2.8L4/L5 0.9� 1 �1� 0.9 1.9L5/S1 1.2� 0.9 �0.5� 0.8 1.7
Upright positional MRI of the lumbar spine 1037
On movement from flexion to extension, there isnormally an increase in lumbar lordosis of 1.1e2.9�
per vertebral level.15 From a neutral upright sea-ted to flexed position, paradoxical extension atL5/S1 or L4/L5 and L5/S1, can be observed in nor-mal subjects,16,17 whereas a change in anterioreposterior translation of between 1e1.5 mm. mayalso be evident.15
Intervertebral discdmorphological andsignal intensity changes
Posterior disc contour
Normal Discs. From the supine to upright position,subjective observation has shown no change in thedegree of posterior disc bulge13,18; however, objec-tive measures show conflicting results. Schmidet al.19 found no significant change on sitting,whereas Lee et al.10 found a small increase(0.5� 0.4 mm at L2/3, 0.5� 0.6 mm at L3/L4,1.1� 0.7 mm at L4/L5 and 0.6� 0.8 mm at L5/S1),which was most prominent at the L4/L5 level in nor-mal/asymptomatic subjects in the kneeling posi-tion. These latter differences are related to theincreased extension that occurs in the kneelingcompared with the sitting positions. The majorityof normal intervertebral discs probably showa small10,19 but insignificant increase in posteriordisc bulge18,19 or a small decrease (<0.7 mm in thelower two discs)20 from upright flexion to extension.
Degenerate discs. In a subjective study, Zamaniet al.18 reported that degenerate discs show no in-creased posterior disc bulge on sitting. However,our own observations and other reports suggestthat posterior disc bulge does increase on uprightimaging.11,12 Similarly, a subjective study byWeishaupt et al.13 showed a decrease in the de-gree of posterior disc bulge on upright flexion com-pared with supine in 7.5% (4/53) of discs and anincreased degree of posterior disc bulge in 11.3%(6/53) of discs on upright extension compared tothe supine position, whereas 1.9% (1/53) discsshowed reduced disc bulge.
When comparing upright extension with flexion,Zamani et al. found that 57% (25/44) of degener-ate discs showed no change, 41% (18/44) demon-strated an increase, and 2.2% (1/44) a decrease inposterior disc bulge.18 Flexion was shown to de-crease posterior disc bulge in some patients.18
These findings are consistent with our observationsand those reported by others11,12 (Fig. 1).
Disc degeneration results in a posterior annulartear. From the supine to the upright position,there is increasing compressive force on the discas a result of gravity and muscle activation.Telescoping of the spine results in circumferentialbulging of degenerate discs,11,12 these changes in-creasing in a caudal direction.10 During extension,tension increases in the anterior longitudinal liga-ment (ALL), displacing the semi-liquid nucleus pul-pous posteriorly where little resistance from thetorn annulus allows posterior herniation.13,18,27 Aswell as gravity, increased spinal extension in theupright position has an additional effect on poste-rior disc herniation.
Posterior disc bulges/herniations may also de-velop or increase in degenerate discs duringflexion13 (Fig. 2). We speculate this may resultfrom weakness/dysfunction of the posterior longi-tudinal ligament (PLL) that may be involved inmore extensive annular tears. Paradoxical exten-sion during flexion in the lower lumbar spine mayoffer an alternative explanation in the lower lum-ber region.16,17
Whether these changes cause neural compres-sion not only depends on the degree of posteriorbulging (Figs. 3e5), but also on other factors, suchas the size of the central canal, which may be con-genitally small or narrowed due to facet hypertro-phy. Even without neural comprise a change fromdisc protrusion to extrusion (Fig. 4) may be clini-cally significant.13 Studies by Weishaupt et al.13
and Zamani et al.18 suggest that these are not in-frequent occurrences. Weishaupt et al.,13 ina study of 152 nerve roots reported a change in di-agnosis (disc herniation, nerve root compromise,or foraminal stenosis) in 26.3% (40/152) betweensupine and flexion, in 22.4% (34/152) between su-pine and extension, and in 28.2% (43/152) betweenflexion and extension. Weishaupt et al.13 found anincrease in nerve root contact (34 to 45 nerves;7.2%) and nerve root contact and displacement(10 to 13 nerves; 2%) on upright extension fromthe supine position.13 However, changes morestrongly associated with symptoms,4,5 such as pro-trusion to extrusion (Figs. 3e5) and nerve root con-tact/displacement to nerve root compression wererare. Weishaupt et al.13 also found a correlationbetween increase in visual analogue pain scores
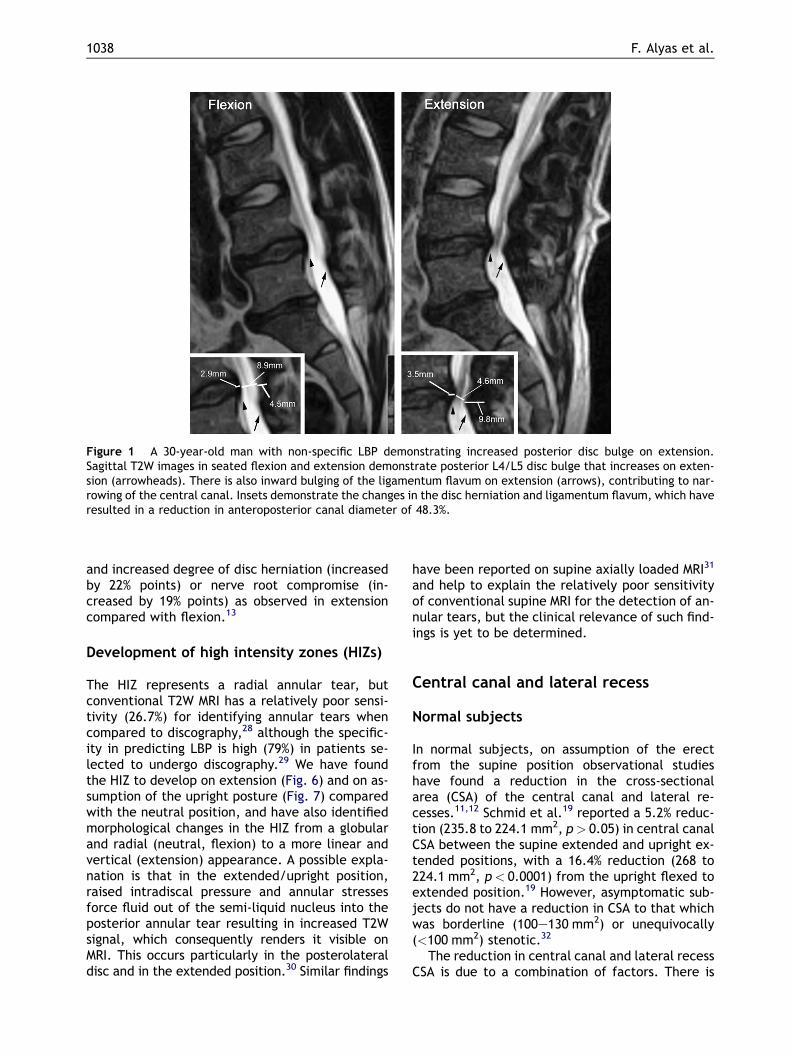
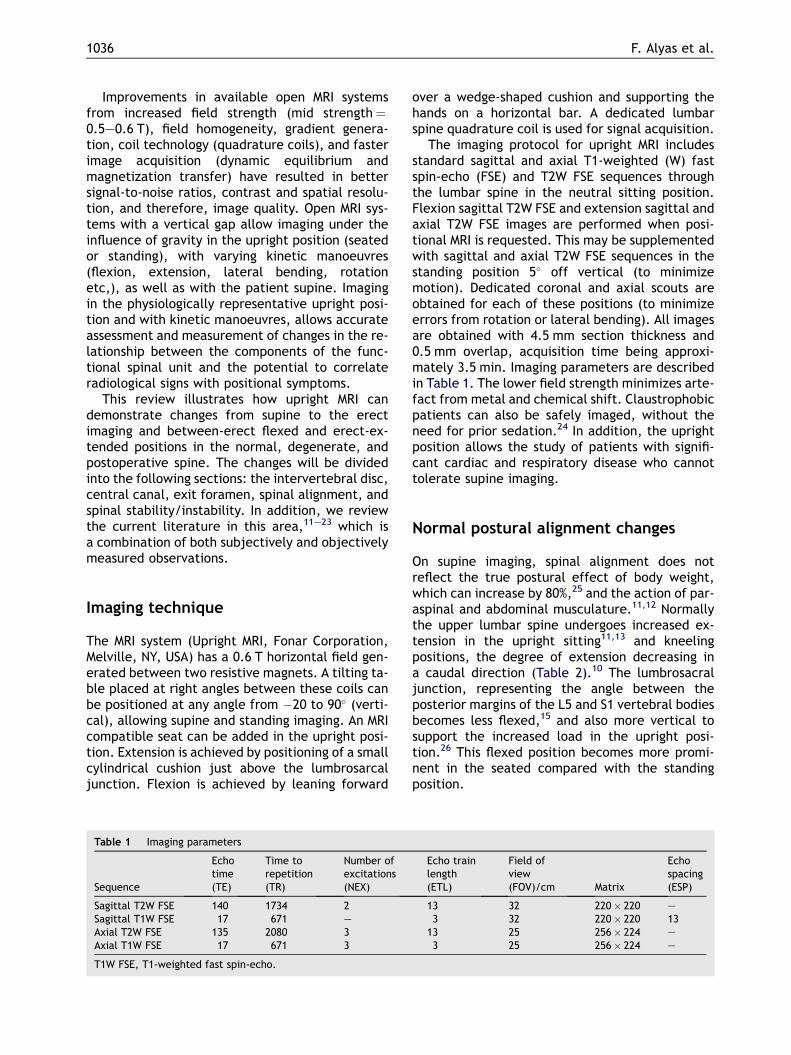
Figure 1 A 30-year-old man with non-specific LBP demonstrating increased posterior disc bulge on extension.Sagittal T2W images in seated flexion and extension demonstrate posterior L4/L5 disc bulge that increases on exten-sion (arrowheads). There is also inward bulging of the ligamentum flavum on extension (arrows), contributing to nar-rowing of the central canal. Insets demonstrate the changes in the disc herniation and ligamentum flavum, which haveresulted in a reduction in anteroposterior canal diameter of 48.3%.
1038 F. Alyas et al.
and increased degree of disc herniation (increasedby 22% points) or nerve root compromise (in-creased by 19% points) as observed in extensioncompared with flexion.13
Development of high intensity zones (HIZs)
The HIZ represents a radial annular tear, butconventional T2W MRI has a relatively poor sensi-tivity (26.7%) for identifying annular tears whencompared to discography,28 although the specific-ity in predicting LBP is high (79%) in patients se-lected to undergo discography.29 We have foundthe HIZ to develop on extension (Fig. 6) and on as-sumption of the upright posture (Fig. 7) comparedwith the neutral position, and have also identifiedmorphological changes in the HIZ from a globularand radial (neutral, flexion) to a more linear andvertical (extension) appearance. A possible expla-nation is that in the extended/upright position,raised intradiscal pressure and annular stressesforce fluid out of the semi-liquid nucleus into theposterior annular tear resulting in increased T2Wsignal, which consequently renders it visible onMRI. This occurs particularly in the posterolateraldisc and in the extended position.30 Similar findings
have been reported on supine axially loaded MRI31
and help to explain the relatively poor sensitivityof conventional supine MRI for the detection of an-nular tears, but the clinical relevance of such find-ings is yet to be determined.
Central canal and lateral recess
Normal subjects
In normal subjects, on assumption of the erectfrom the supine position observational studieshave found a reduction in the cross-sectionalarea (CSA) of the central canal and lateral re-cesses.11,12 Schmid et al.19 reported a 5.2% reduc-tion (235.8 to 224.1 mm2, p> 0.05) in central canalCSA between the supine extended and upright ex-tended positions, with a 16.4% reduction (268 to224.1 mm2, p< 0.0001) from the upright flexed toextended position.19 However, asymptomatic sub-jects do not have a reduction in CSA to that whichwas borderline (100e130 mm2) or unequivocally(<100 mm2) stenotic.32
The reduction in central canal and lateral recessCSA is due to a combination of factors. There is
Figure 2 A 56-year-old man with left leg pain demonstrating increased bulging of the L1/L2 disc on flexion. SagittalT2W images in sitting flexion and extension (a) and axial T2W images in flexion and extension (b). There is increase indisc bulge on flexion compared with extension (arrowheads), which has resulted in some narrowing of the right lateralrecess. There is also a reduction in the volume of cerebrospinal fluid around the nerve roots on flexion. Insets dem-onstrate a reduction in CSA of the central canal of 9.1% in flexion.
Upright positional MRI of the lumbar spine 1039
a reduction in disc height due to body-weight andmuscle activation.11,12,19 This has been demon-strated as a small increase in the anterior discheight and a reduction in the posterior disc height
Figure 3 A 58-year-old man with left leg pain demonstratinS1 disc protrusion narrowing the lateral recess. Axial T2W imL5/S1 paracentral disc protrusion, which increases on extepressing the left S1 nerve root. Insets demonstrate a reduct
in the upright position, with a greater change atthe L2/3 and L3/4 levels.10 This results in redun-dancy of the cauda equina, meninges and liga-ments (ligamentum flavum),11,12,19 the latter
g neural compression on extension due to increasing L5/ages in seated flexion and extension demonstrate a left
nsion (arrowheads), displacing the thecal sac and com-ion in CSA of the lateral recess of 27.6%.
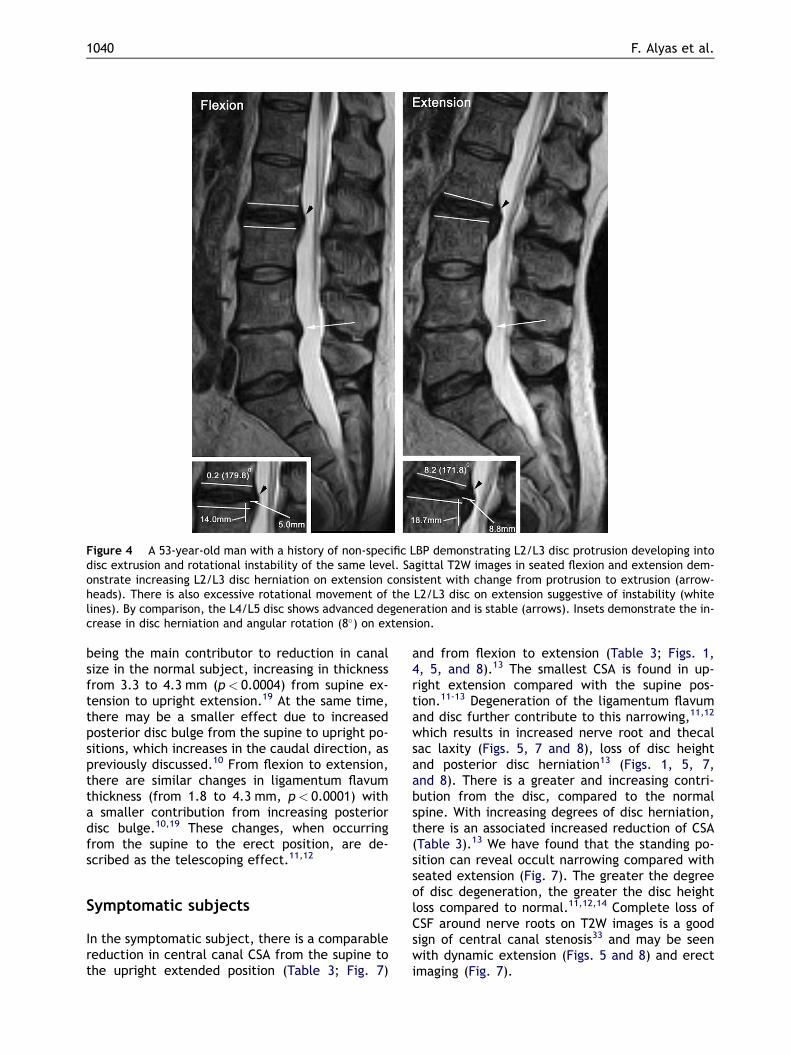
Figure 4 A 53-year-old man with a history of non-specific LBP demonstrating L2/L3 disc protrusion developing intodisc extrusion and rotational instability of the same level. Sagittal T2W images in seated flexion and extension dem-onstrate increasing L2/L3 disc herniation on extension consistent with change from protrusion to extrusion (arrow-heads). There is also excessive rotational movement of the L2/L3 disc on extension suggestive of instability (whitelines). By comparison, the L4/L5 disc shows advanced degeneration and is stable (arrows). Insets demonstrate the in-crease in disc herniation and angular rotation (8�) on extension.
1040 F. Alyas et al.
being the main contributor to reduction in canalsize in the normal subject, increasing in thicknessfrom 3.3 to 4.3 mm (p< 0.0004) from supine ex-tension to upright extension.19 At the same time,there may be a smaller effect due to increasedposterior disc bulge from the supine to upright po-sitions, which increases in the caudal direction, aspreviously discussed.10 From flexion to extension,there are similar changes in ligamentum flavumthickness (from 1.8 to 4.3 mm, p< 0.0001) witha smaller contribution from increasing posteriordisc bulge.10,19 These changes, when occurringfrom the supine to the erect position, are de-scribed as the telescoping effect.11,12
Symptomatic subjects
In the symptomatic subject, there is a comparablereduction in central canal CSA from the supine tothe upright extended position (Table 3; Fig. 7)
and from flexion to extension (Table 3; Figs. 1,4, 5, and 8).13 The smallest CSA is found in up-right extension compared with the supine pos-tion.11-13 Degeneration of the ligamentum flavumand disc further contribute to this narrowing,11,12
which results in increased nerve root and thecalsac laxity (Figs. 5, 7 and 8), loss of disc heightand posterior disc herniation13 (Figs. 1, 5, 7,and 8). There is a greater and increasing contri-bution from the disc, compared to the normalspine. With increasing degrees of disc herniation,there is an associated increased reduction of CSA(Table 3).13 We have found that the standing po-sition can reveal occult narrowing compared withseated extension (Fig. 7). The greater the degreeof disc degeneration, the greater the disc heightloss compared to normal.11,12,14 Complete loss ofCSF around nerve roots on T2W images is a goodsign of central canal stenosis33 and may be seenwith dynamic extension (Figs. 5 and 8) and erectimaging (Fig. 7).
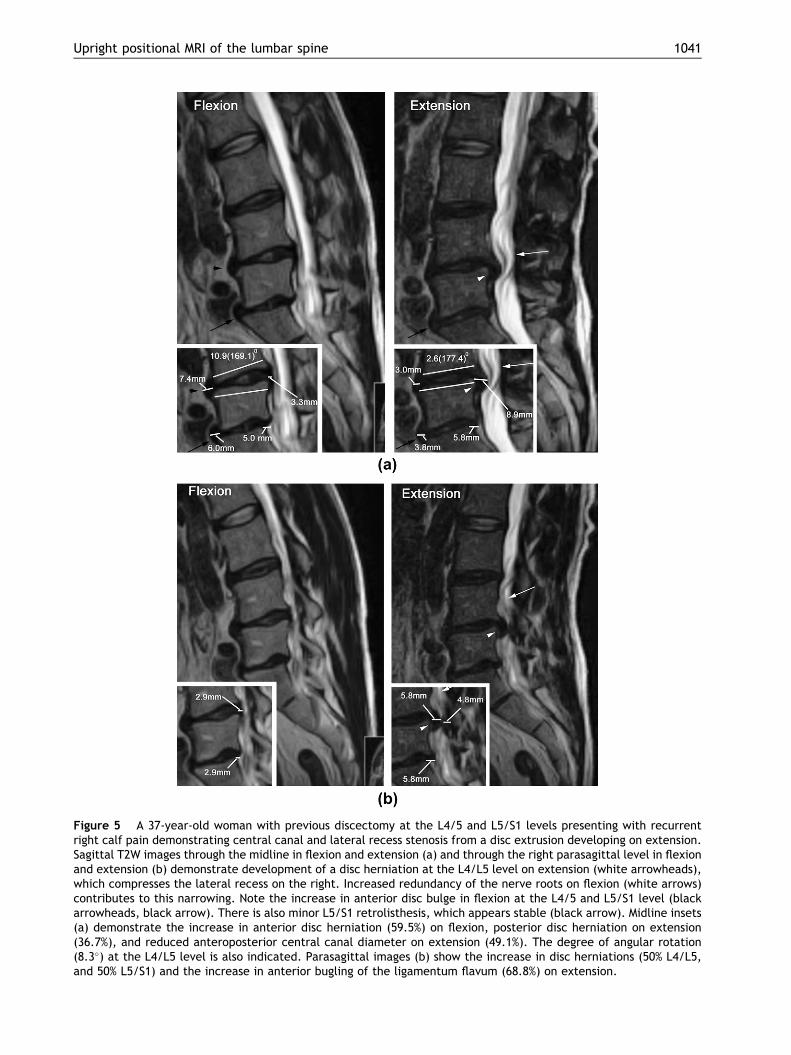
Figure 5 A 37-year-old woman with previous discectomy at the L4/5 and L5/S1 levels presenting with recurrentright calf pain demonstrating central canal and lateral recess stenosis from a disc extrusion developing on extension.Sagittal T2W images through the midline in flexion and extension (a) and through the right parasagittal level in flexionand extension (b) demonstrate development of a disc herniation at the L4/L5 level on extension (white arrowheads),which compresses the lateral recess on the right. Increased redundancy of the nerve roots on flexion (white arrows)contributes to this narrowing. Note the increase in anterior disc bulge in flexion at the L4/5 and L5/S1 level (blackarrowheads, black arrow). There is also minor L5/S1 retrolisthesis, which appears stable (black arrow). Midline insets(a) demonstrate the increase in anterior disc herniation (59.5%) on flexion, posterior disc herniation on extension(36.7%), and reduced anteroposterior central canal diameter on extension (49.1%). The degree of angular rotation(8.3�) at the L4/L5 level is also indicated. Parasagittal images (b) show the increase in disc herniations (50% L4/L5,and 50% L5/S1) and the increase in anterior bugling of the ligamentum flavum (68.8%) on extension.
Upright positional MRI of the lumbar spine 1041
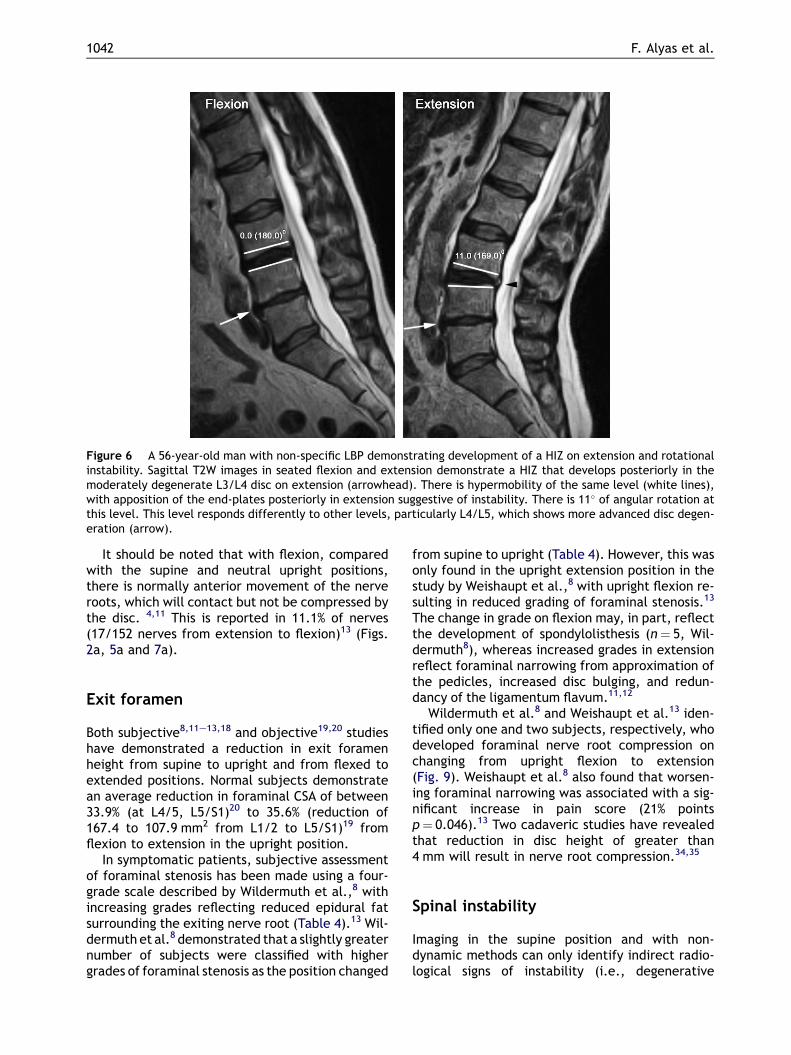
Figure 6 A 56-year-old man with non-specific LBP demonstrating development of a HIZ on extension and rotationalinstability. Sagittal T2W images in seated flexion and extension demonstrate a HIZ that develops posteriorly in themoderately degenerate L3/L4 disc on extension (arrowhead). There is hypermobility of the same level (white lines),with apposition of the end-plates posteriorly in extension suggestive of instability. There is 11� of angular rotation atthis level. This level responds differently to other levels, particularly L4/L5, which shows more advanced disc degen-eration (arrow).
1042 F. Alyas et al.
It should be noted that with flexion, comparedwith the supine and neutral upright positions,there is normally anterior movement of the nerveroots, which will contact but not be compressed bythe disc. 4,11 This is reported in 11.1% of nerves(17/152 nerves from extension to flexion)13 (Figs.2a, 5a and 7a).
Exit foramen
Both subjective8,11e13,18 and objective19,20 studieshave demonstrated a reduction in exit foramenheight from supine to upright and from flexed toextended positions. Normal subjects demonstratean average reduction in foraminal CSA of between33.9% (at L4/5, L5/S1)20 to 35.6% (reduction of167.4 to 107.9 mm2 from L1/2 to L5/S1)19 fromflexion to extension in the upright position.
In symptomatic patients, subjective assessmentof foraminal stenosis has been made using a four-grade scale described by Wildermuth et al.,8 withincreasing grades reflecting reduced epidural fatsurrounding the exiting nerve root (Table 4).13 Wil-dermuth et al.8 demonstrated that a slightly greaternumber of subjects were classified with highergrades of foraminal stenosis as the position changed
from supine to upright (Table 4). However, this wasonly found in the upright extension position in thestudy by Weishaupt et al.,8 with upright flexion re-sulting in reduced grading of foraminal stenosis.13
The change in grade on flexion may, in part, reflectthe development of spondylolisthesis (n¼ 5, Wil-dermuth8), whereas increased grades in extensionreflect foraminal narrowing from approximation ofthe pedicles, increased disc bulging, and redun-dancy of the ligamentum flavum.11,12
Wildermuth et al.8 and Weishaupt et al.13 iden-tified only one and two subjects, respectively, whodeveloped foraminal nerve root compression onchanging from upright flexion to extension(Fig. 9). Weishaupt et al.8 also found that worsen-ing foraminal narrowing was associated with a sig-nificant increase in pain score (21% pointsp¼ 0.046).13 Two cadaveric studies have revealedthat reduction in disc height of greater than4 mm will result in nerve root compression.34,35
Spinal instability
Imaging in the supine position and with non-dynamic methods can only identify indirect radio-logical signs of instability (i.e., degenerative
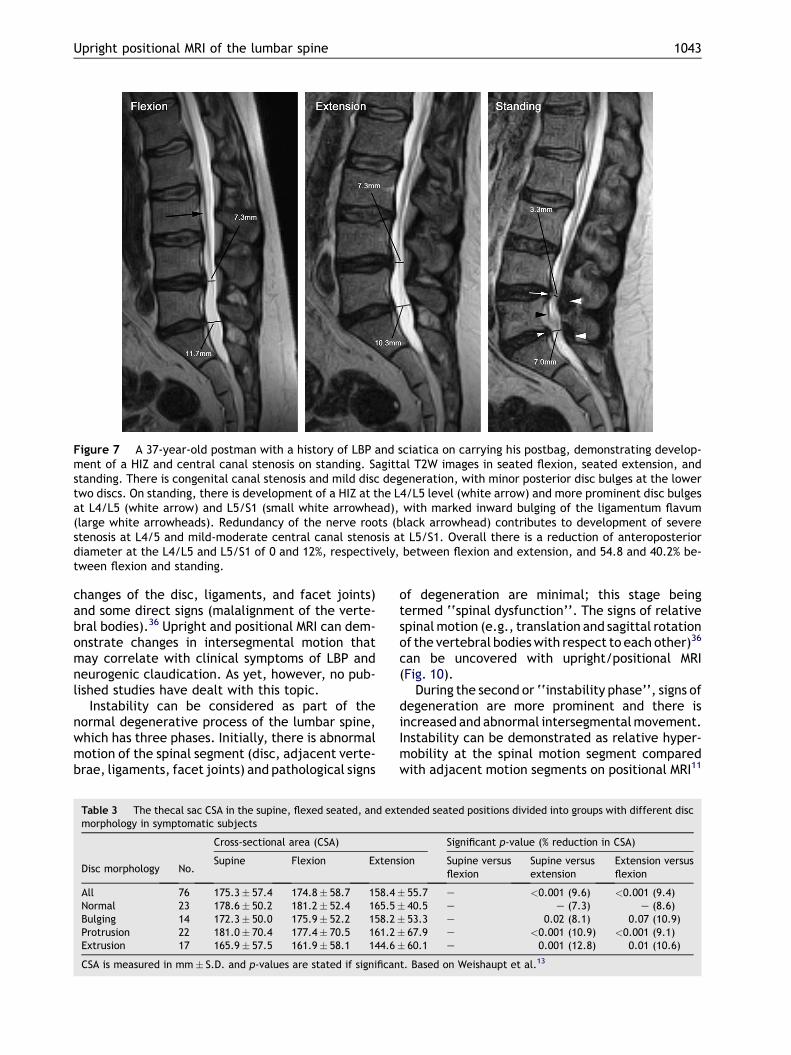
Figure 7 A 37-year-old postman with a history of LBP and sciatica on carrying his postbag, demonstrating develop-ment of a HIZ and central canal stenosis on standing. Sagittal T2W images in seated flexion, seated extension, andstanding. There is congenital canal stenosis and mild disc degeneration, with minor posterior disc bulges at the lowertwo discs. On standing, there is development of a HIZ at the L4/L5 level (white arrow) and more prominent disc bulgesat L4/L5 (white arrow) and L5/S1 (small white arrowhead), with marked inward bulging of the ligamentum flavum(large white arrowheads). Redundancy of the nerve roots (black arrowhead) contributes to development of severestenosis at L4/5 and mild-moderate central canal stenosis at L5/S1. Overall there is a reduction of anteroposteriordiameter at the L4/L5 and L5/S1 of 0 and 12%, respectively, between flexion and extension, and 54.8 and 40.2% be-tween flexion and standing.
Upright positional MRI of the lumbar spine 1043
changes of the disc, ligaments, and facet joints)and some direct signs (malalignment of the verte-bral bodies).36 Upright and positional MRI can dem-onstrate changes in intersegmental motion thatmay correlate with clinical symptoms of LBP andneurogenic claudication. As yet, however, no pub-lished studies have dealt with this topic.
Instability can be considered as part of thenormal degenerative process of the lumbar spine,which has three phases. Initially, there is abnormalmotion of the spinal segment (disc, adjacent verte-brae, ligaments, facet joints) and pathological signs
Table 3 The thecal sac CSA in the supine, flexed seated, and extmorphology in symptomatic subjects
Disc morphology No.
Cross-sectional area (CSA)
Supine Flexion Extens
All 76 175.3� 57.4 174.8� 58.7 158.4Normal 23 178.6� 50.2 181.2� 52.4 165.5Bulging 14 172.3� 50.0 175.9� 52.2 158.2Protrusion 22 181.0� 70.4 177.4� 70.5 161.2Extrusion 17 165.9� 57.5 161.9� 58.1 144.6
CSA is measured in mm� S.D. and p-values are stated if significan
of degeneration are minimal; this stage beingtermed ‘‘spinal dysfunction’’. The signs of relativespinal motion (e.g., translation and sagittal rotationof the vertebral bodies with respect to each other)36
can be uncovered with upright/positional MRI(Fig. 10).
During the second or ‘‘instability phase’’, signs ofdegeneration are more prominent and there isincreased and abnormal intersegmental movement.Instability can be demonstrated as relative hyper-mobility at the spinal motion segment comparedwith adjacent motion segments on positional MRI11
ended seated positions divided into groups with different disc
Significant p-value (% reduction in CSA)
ion Supine versusflexion
Supine versusextension
Extension versusflexion
� 55.7 e <0.001 (9.6) <0.001 (9.4)� 40.5 e e (7.3) e (8.6)� 53.3 e 0.02 (8.1) 0.07 (10.9)� 67.9 e <0.001 (10.9) <0.001 (9.1)� 60.1 e 0.001 (12.8) 0.01 (10.6)
t. Based on Weishaupt et al.13
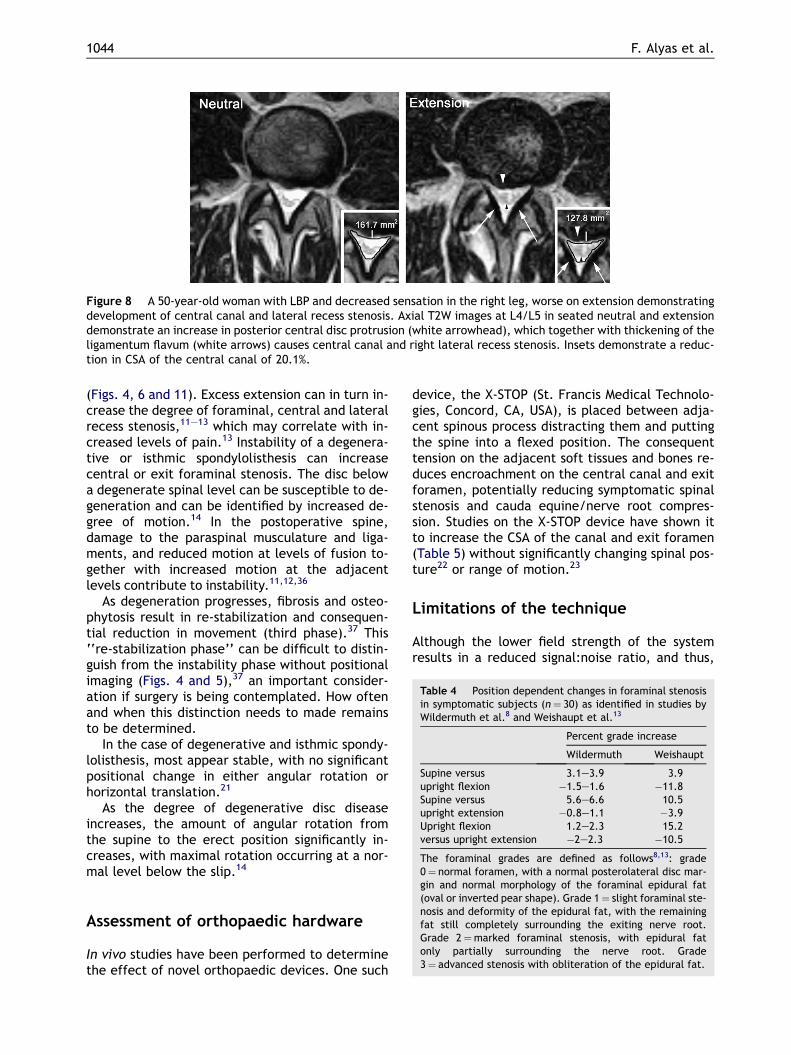
Table 4 Position dependent changes in foraminal stenosisin symptomatic subjects (n¼ 30) as identified in studies byWildermuth et al.8 and Weishaupt et al.13
Percent grade increase
Wildermuth Weishaupt
Supine versusupright flexion
3.1e3.9 3.9�1.5e1.6 �11.8
Supine versusupright extension
5.6e6.6 10.5�0.8e1.1 �3.9
Upright flexionversus upright extension
1.2e2.3 15.2�2e2.3 �10.5
The foraminal grades are defined as follows8,13: grade0¼ normal foramen, with a normal posterolateral disc mar-
Figure 8 A 50-year-old woman with LBP and decreased sensation in the right leg, worse on extension demonstratingdevelopment of central canal and lateral recess stenosis. Axial T2W images at L4/L5 in seated neutral and extensiondemonstrate an increase in posterior central disc protrusion (white arrowhead), which together with thickening of theligamentum flavum (white arrows) causes central canal and right lateral recess stenosis. Insets demonstrate a reduc-tion in CSA of the central canal of 20.1%.
1044 F. Alyas et al.
(Figs. 4, 6 and 11). Excess extension can in turn in-crease the degree of foraminal, central and lateralrecess stenosis,11e13 which may correlate with in-creased levels of pain.13 Instability of a degenera-tive or isthmic spondylolisthesis can increasecentral or exit foraminal stenosis. The disc belowa degenerate spinal level can be susceptible to de-generation and can be identified by increased de-gree of motion.14 In the postoperative spine,damage to the paraspinal musculature and liga-ments, and reduced motion at levels of fusion to-gether with increased motion at the adjacentlevels contribute to instability.11,12,36
As degeneration progresses, fibrosis and osteo-phytosis result in re-stabilization and consequen-tial reduction in movement (third phase).37 This‘‘re-stabilization phase’’ can be difficult to distin-guish from the instability phase without positionalimaging (Figs. 4 and 5),37 an important consider-ation if surgery is being contemplated. How oftenand when this distinction needs to made remainsto be determined.
In the case of degenerative and isthmic spondy-lolisthesis, most appear stable, with no significantpositional change in either angular rotation orhorizontal translation.21
As the degree of degenerative disc diseaseincreases, the amount of angular rotation fromthe supine to the erect position significantly in-creases, with maximal rotation occurring at a nor-mal level below the slip.14
gin and normal morphology of the foraminal epidural fat(oval or inverted pear shape). Grade 1¼ slight foraminal ste-nosis and deformity of the epidural fat, with the remainingfat still completely surrounding the exiting nerve root.Grade 2¼marked foraminal stenosis, with epidural fatonly partially surrounding the nerve root. Grade3¼ advanced stenosis with obliteration of the epidural fat.
Assessment of orthopaedic hardware
In vivo studies have been performed to determinethe effect of novel orthopaedic devices. One such
device, the X-STOP (St. Francis Medical Technolo-gies, Concord, CA, USA), is placed between adja-cent spinous process distracting them and puttingthe spine into a flexed position. The consequenttension on the adjacent soft tissues and bones re-duces encroachment on the central canal and exitforamen, potentially reducing symptomatic spinalstenosis and cauda equine/nerve root compres-sion. Studies on the X-STOP device have shown itto increase the CSA of the canal and exit foramen(Table 5) without significantly changing spinal pos-ture22 or range of motion.23
Limitations of the technique
Although the lower field strength of the systemresults in a reduced signal:noise ratio, and thus,
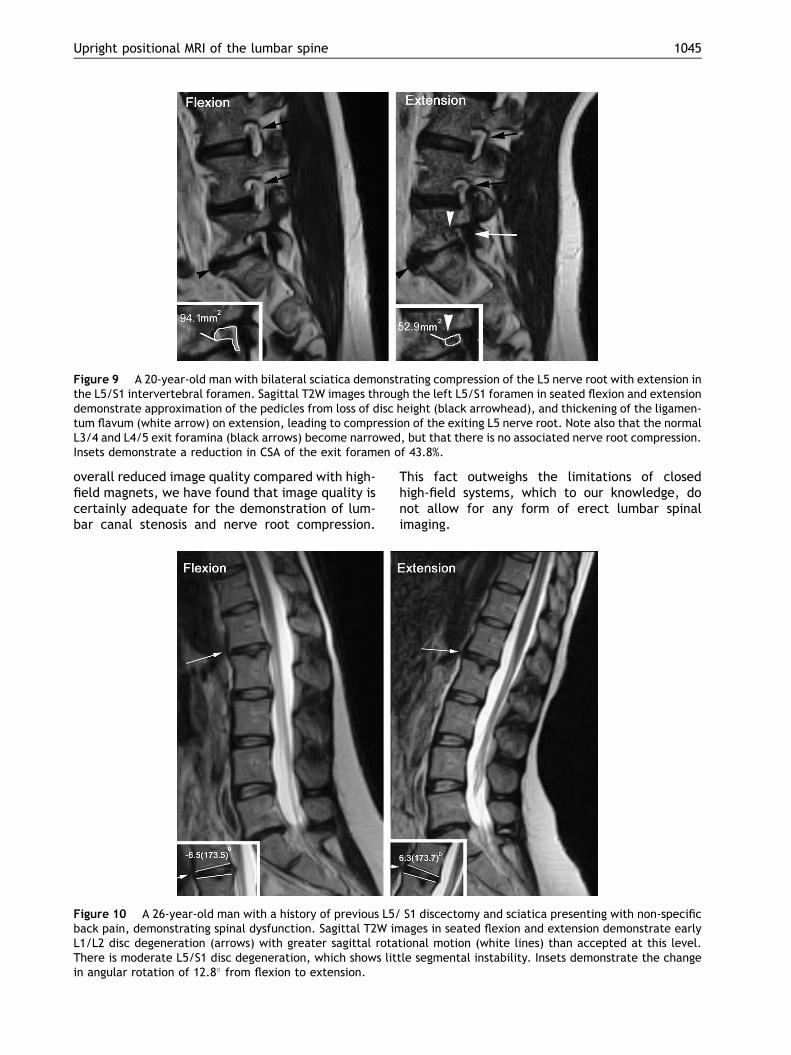
Figure 9 A 20-year-old man with bilateral sciatica demonstrating compression of the L5 nerve root with extension inthe L5/S1 intervertebral foramen. Sagittal T2W images through the left L5/S1 foramen in seated flexion and extensiondemonstrate approximation of the pedicles from loss of disc height (black arrowhead), and thickening of the ligamen-tum flavum (white arrow) on extension, leading to compression of the exiting L5 nerve root. Note also that the normalL3/4 and L4/5 exit foramina (black arrows) become narrowed, but that there is no associated nerve root compression.Insets demonstrate a reduction in CSA of the exit foramen of 43.8%.
Upright positional MRI of the lumbar spine 1045
overall reduced image quality compared with high-field magnets, we have found that image quality iscertainly adequate for the demonstration of lum-bar canal stenosis and nerve root compression.
Figure 10 A 26-year-old man with a history of previous L5/back pain, demonstrating spinal dysfunction. Sagittal T2W imL1/L2 disc degeneration (arrows) with greater sagittal rotaThere is moderate L5/S1 disc degeneration, which shows litin angular rotation of 12.8� from flexion to extension.
This fact outweighs the limitations of closedhigh-field systems, which to our knowledge, donot allow for any form of erect lumbar spinalimaging.
S1 discectomy and sciatica presenting with non-specificages in seated flexion and extension demonstrate early
tional motion (white lines) than accepted at this level.tle segmental instability. Insets demonstrate the change
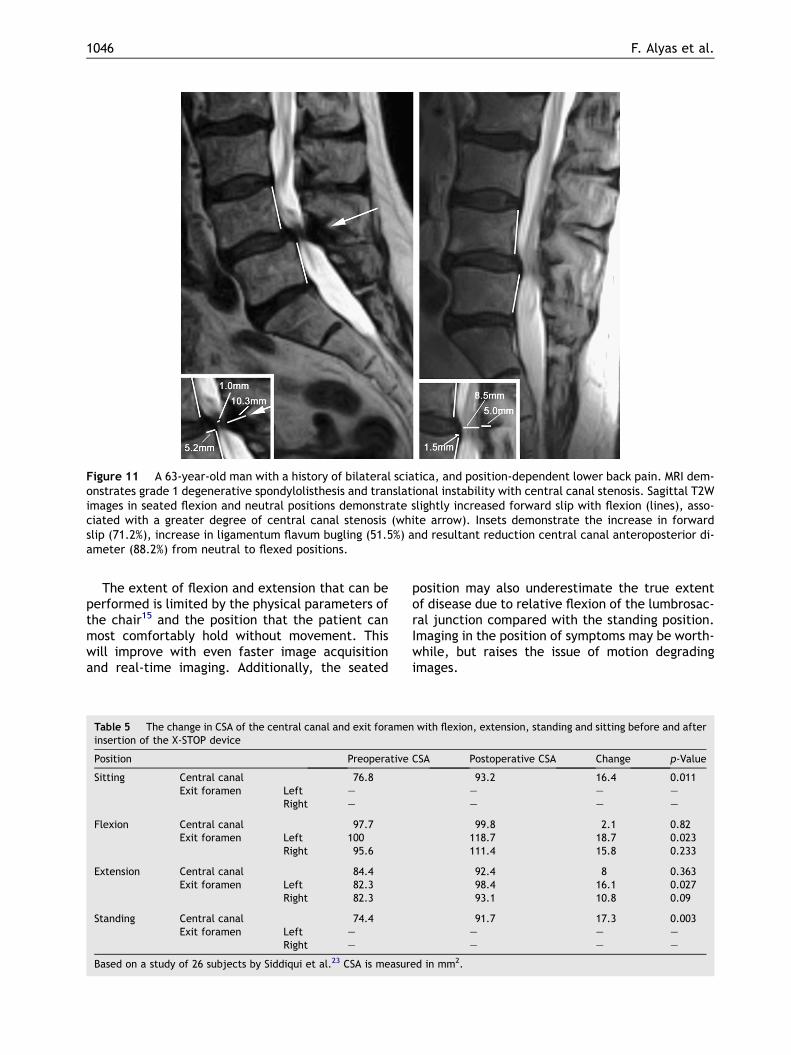
Figure 11 A 63-year-old man with a history of bilateral sciatica, and position-dependent lower back pain. MRI dem-onstrates grade 1 degenerative spondylolisthesis and translational instability with central canal stenosis. Sagittal T2Wimages in seated flexion and neutral positions demonstrate slightly increased forward slip with flexion (lines), asso-ciated with a greater degree of central canal stenosis (white arrow). Insets demonstrate the increase in forwardslip (71.2%), increase in ligamentum flavum bugling (51.5%) and resultant reduction central canal anteroposterior di-ameter (88.2%) from neutral to flexed positions.
1046 F. Alyas et al.
The extent of flexion and extension that can beperformed is limited by the physical parameters ofthe chair15 and the position that the patient canmost comfortably hold without movement. Thiswill improve with even faster image acquisitionand real-time imaging. Additionally, the seated
Table 5 The change in CSA of the central canal and exit forameninsertion of the X-STOP device
Position Preoperative
Sitting Central canal 76.8Exit foramen Left e
Right e
Flexion Central canal 97.7Exit foramen Left 100
Right 95.6
Extension Central canal 84.4Exit foramen Left 82.3
Right 82.3
Standing Central canal 74.4Exit foramen Left e
Right e
Based on a study of 26 subjects by Siddiqui et al.23 CSA is measur
position may also underestimate the true extentof disease due to relative flexion of the lumbrosac-ral junction compared with the standing position.Imaging in the position of symptoms may be worth-while, but raises the issue of motion degradingimages.
with flexion, extension, standing and sitting before and after
CSA Postoperative CSA Change p-Value
93.2 16.4 0.011e e ee e e
99.8 2.1 0.82118.7 18.7 0.023111.4 15.8 0.233
92.4 8 0.36398.4 16.1 0.02793.1 10.8 0.09
91.7 17.3 0.003e e e
e e e
ed in mm2.
Upright positional MRI of the lumbar spine 1047
Many studies have commented on difficulty invisualizing the structures of the exit foramen dueto section thickness and degree of patient rotationand lateral flexion.13 This has made it difficult toidentify the exit foramen in some cases and tomake an objective assessment of changes insize.8,13,18 Consequently, subtle differences in ca-nal and lateral recess dimensions can be difficultto appreciate if sections are not matched exactlybetween different imaging positions.
Conclusions
Conventional high-field MRI with the patient in thesupine position is now widely available and re-mains the technique of choice for the investigationof degenerative lumbar spine disorders associatedwith lower limb symptoms. However, there is nodoubt that clinically relevant spinal canal stenosiscan be uncovered by imaging in the erect position.In cases where conventional MRI shows no evi-dence of cauda equina or lumbar nerve rootcompression in the setting of convincing clinicalsymptoms that warrant surgical intervention, re-imaging in the upright position, with the additionof flexion and extension, is recommended.
References
1. Maniadakis N, Gray A. The economic burden of back pain inthe UK. Pain 2000;84:95e103.
2. Morgan S, Saifuddin A. MRI of the lumbar intervertebraldisc. Clin Radiol 1999;54:703e23.
3. Kent DL, Haynor DR, Larson EB, et al. Diagnosis of lumbarspinal stenosis in adults: a metaanalysis of the accuracyof CT, MR, and myelography. AJR Am J Roentgenol 1992;158:1135e44.
4. Weishaupt D, Zanetti M, Hodler J, et al. MR imaging of thelumbar spine: disk extrusion and sequestration, nerve rootcompression, endplate abnormalities and osteoarthritis ofthe facet joints are rare in asymptomatic volunteers. Radi-ology 1998;209:661e6.
5. Stadnik TW, Lee RR, Coen HL, et al. Annular tears and diskherniation: prevalence and contrast enhancement on MRimages in the absence of low back pain and sciatica. Radi-ology 1998;206:49e55.
6. Panjabi MM, Oxland TR, Yamamato I, et al. Mechanical be-havior of the human lumbar and lumbosacral spine as shownby three-dimensional load displacement curve. J Bone JointSurg 1994;76:413e24.
7. Badami JP, Baker BA, Scholz FJ, et al. Outpatient metniza-mide myelography: prospective evaluation of safety andcost effectiveness. Radiology 1986;158:175e7.
8. Wildermuth S, Zanetti M, Duewell S, et al. Lumbar spine:quantitative and qualitative assessment of positional (up-right flexion and extension) MR imaging and myelography.Radiology 1998;207:391e8.
9. Saifuddin A, Blease S, MacSweeney E. Axial loaded MRI ofthe lumbar spine. Clin Radiol 2003;58:661e71.
10. Lee SU, Hargens AR, Fredericson M, et al. Lumbar spinedisc heights and curvature: upright posture vs. supinecompression harness. Aviat Space Environ Med 2003;74:512e6.
11. Jinkins JR, Dworkin JS, Green CA, et al. Upright, weight-bearing, dynamic-kinetic magnetic resonance imaging ofthe spinedreview of the first clinical results. J Hong KongColl Radiol 2003;6:55e74.
12. Jinkins JR, Dworkin JS, Damadian RV. Upright, weight-bearing, dynamic-kinetic MRI of the spine: initial results.Eur Radiol 2005;15:1815e25.
13. Weishaupt D, Schmid MR, Zaneti M. Positional MR imaging ofthe lumbar spine: does it demonstrated nerve root compro-mise not visible a conventional MR imaging? Radiology 2000;215:247e53.
14. Karadimas EJ, Siddiqui M, Smith FW, et al. Positional MRIchanges in supine versus sitting postures in patients withdegenerative lumbar spine. J Spinal Disord Tech 2006;19:495e500.
15. McGregor AH, Anderton L, Gedroyc WM, et al. Assess-ment of spinal kinematics using open interventional mag-netic resonance imaging. Clin Orthop Relat Res 2001;392:341e8.
16. Vitzthum HE, Konig A, Seifert V. Dynamic examination ofthe lumbar spine by using vertical, open magnetic reso-nance imaging. J Neurosurg 2000;93:58e64.
17. Konig A, Vitzthum HE. Functional MRI of the spine: differentpatterns of positions of the forward flexed lumbar spine inhealthy subjects. Eur Spine J 2001;10:437e42.
18. Zamani AA, Moriarty T, Hsu L, et al. Functional MRI of thelumbar spine in erect position in a superconducting open-configuration MR system: preliminary results. J Magn ResonImaging 1998;8:1329e33.
19. Schmid MR, Stucki G, Duewell S, et al. Changes incross-sectional measurements of the spinal canal and inter-vertebral foramina as a function of body position: in vivostudies on an open-configuration MR system. AJR Am JRoentgenol 1999;172:1095e102.
20. Fredericson M, Lee SU, Welsh J, et al. Changes in posteriordisc bulging and intervertebral foraminal size associatedwith flexioneextension movement: a comparison betweenL4e5 and L5eS1 levels in normal subjects. Spine J 2001;1:10e7.
21. McGregor AH, Anderton L, Gedroyc WM, et al. The use of in-terventional open MRI to assess the kinematics of the lum-bar spine in patients with spondylolisthesis. Spine 2002;27:1582e6.
22. Siddiqui M, Karadimas E, Nicol M, et al. Influence of X-STOPon neural foramina and spinal canal area in spinal stenosis.Spine 2006;31:2958e62.
23. Siddiqui M, Karadimas E, Nicol M, et al. Effects of X-STOPdevice on sagittal lumbar spine kinematics in spinal steno-sis. J Spinal Disord Tech 2006;19:328e33.
24. Spouse E, Gedroyc WM. MRI of the claustrophobic patient:interventionally configured magnets. Br J Radiol 2000;73:146e51.
25. Wilke HJ, Neef P, Caimi M, et al. New in vivo measurementsof pressure in the intervertebral disc in daily life. Spine1999;24:755e62.
26. Lee R, Evans J. An in vivo study of the intervertebral move-ments produced by posteroanterior mobilization. Clin Bio-mech (Bristol, Avon) 1997;12:400e8.
27. Brault JS, Driscoll DM, Laakso LL, et al. Quantificationof lumbar intradiscal deformation during flexion andextension, by mathematical analysis of magnetic reso-nance imaging pixel intensity profiles. Spine 1997;22:2066e72.
1048 F. Alyas et al.
28. Saifuddin A, Braithwaite I, White J, et al. The value of lum-bar spine magnetic resonance imaging in the demonstrationof anular tears. Spine 1998;23:453e7.
29. Lam KS, Carlin D, Mulholland RC. Lumbar disc high-intensityzone: the value and significance of provocative discographyin the determination of the discogenic pain source. EurSpine J 2000;9:36e41.
30. Edwards WT, Ordway NR, Zheng Y, et al. Peak stresses ob-served in the posterior lateral anulus. Spine2001;26:1753e9.
31. Saifuddin A, McSweeney E, Lehovsky J. Development oflumbar high intensity zone on axial loaded magnetic reso-nance imaging. Spine 2003;28:449e52.
32. Hamanishi C, Matukura N, Fujita M, et al. Cross-sectionalarea of the stenotic lumbar dural tube measured from thetransverse views of magnetic resonance imaging. J SpinalDisord 1994;7:388e93.
33. Saifuddin A. The imaging of lumbar spinal stenosis. Clin Ra-diol 2000;55:581e94.
34. Hasegawa T, An HS, Haughton V, et al. Lumbar foraminalstenosis: critical heights of the intervertebral discs and fo-ramina. J Bone Joint Surg Br 1995;7:32e8.
35. Mayoux-Benhamou MA, Revel M, Aaron C, et al. A morpho-metric study of the lumbar foramen: influence of flexioneextension movements and of isolated disc collapse. SurgRadiol Anat 1989;11:97e102.
36. Nizard RS, Wybier M, Laredo JD. Radiologic assessment oflumbar intervertebral instability and degenerative spondy-lolisthesis. Radiol Clin North Am 2001;39:55e71.
37. Friberg O. Lumbar instability: a dynamic approach bytractionecompression radiography. Spine 1987;12:119e29.


![DECEMBER 31, 2015 FONAR CORPORATION 1231 FONAR 10-Q.pdf · form 10-q securities and exchange commission washington, d.c. 20549 [x] quarterly report under section 13 or 15(d) of the](https://img.pdfslide.net/doc/110x75/5e068ededa6e3346ca568fac/december-31-2015-fonar-1231-fonar-10-qpdf-form-10-q-securities-and-exchange.jpg)