Embed Size (px)
Citation preview
Uptake of Nitrogen from Soil, Fertilizer, and Crop Residues by No-till Corn and Soybean1
J. F. POWER, J. W. DORAN, AND W. W. WiLHELM2
ABSTRACTThe relative availability of nitrogen (N) from indigenous soil or-
ganic N, immobilized fertilizer N, currently applied fertilizer N, andcrop residues is largely unknown. A nonirrigated experiment wasconducted on a silty clay loam at Lincoln, NE, with both continuoussoybean [Glycine max (L.) Merr.j and corn (Zea mays L.), in whichcrops were produced with no tillage after surface application of 0,0.5,1.0, or 1.5 times the quantity of aboveground crop residue pro-duced the previous year. In 1980 and 1981, depleted 15N NH4NO,(at 45 kg N ha~') and crop residues were managed so that labeledisotope taken up in the 1981 crop could be separated into that fromcrop residues, from Ist-yr fertilizer that had become immobilized,from fertilizer N applied the 2nd yr, and from indigenous soil N(plus fixed N for soybean).
Grain and straw (stover) production of both crops in 1981 wereincreased 2000 to 3000 kg ha"1 by increasing crop residue rate.Almost all the N in soybean residues was mineralized and taken upby the second crop, with most of this uptake occurring after mid-July. Uptake by soybean of labeled N immobilized in soil organicmatter the previous year increased from about 2 to 6 kg N ha"1 as
1 Contribution from the ARS-USDA, in cooperation with theNebr. Agric. Exp. Stn., Univ. Nebraska-Lincoln. Published as Paperno. 7698, Journal Series, Nebr. Agric. Exp. Stn. Received 8 Feb.1985. Approved 31 July 1985.2 Research Leader, Soil Scientist, and Plant Physiologist, respec-tively, ARS, USDA, Univ. Nebr.-Lincoln, Lincoln, NE 68583.
residue rate increased, possibly originating mainly from N tempo-rarily immobilized in microbial biomass. Uptake by soybean of cur-rent-year fertilizer N also increased slightly with residue rate. Thefraction of total N in soybean derived from indigenous soil (plusfixed) N decreased with increased residue rate from about 85% forno residues to 55% for the 1.5 residue rate. For corn, essentiallynone of the N immobilized in corn residues was recovered by thenext crop at any residue rate. Uptake of labeled N immobilized insoil organic matter was not affected by residue rate, but uptake from1981 fertilizer treatment increased about 6 kg ha~' with increasedresidue rate. Over 80% of the total N uptake by corn in 1981 camefrom indigenous soil N, regardless of residue rate.
Additional Index Words: N cycles, tillage, residue management,N availability, N recovery, immobilization-mineralization, "N-de-pleted nitrogen, Zea mays L., Glycine max. (L.) Merr.
Power, J.F., J.W. Dpran, and W.W. Wilhelm. 1986. Uptake of ni-trogen from soil fertilizer and crop residues by no-till corn and soy-beans. Soil Sci. Soc. Am. J. 50:137-142.
IN MOST CROPPING SYSTEMS, the nitrogen (N) re-quired for crop production is derived from several
sources: (i) mineralization of soil organic N, (ii) de-composition and mineralization of N returned in crop
138 SOIL SCI. SOC. AM. J., VOL. 50, 1986
residues, and (iii) N added as fertilizers. Also, biolog-ical fixation by legumes, manures, wastes, or other ni-trogenous materials may be important N sources whenused. Because of these various and diverse sources ofN for crop nutrition, little information exists on therelative contribution to the available N pool made byeach of these sources under varying soil-managementsituations. The purpose of this study was to documentthe effects of residue quantity on the amount of Nutilized from several of these sources by no-till corn(Zea mays L.) and soybean [Glycine max (L.) Merr.].
Utilization of N is affected by tillage practices used(Kitur et al., 1984; Legg et al., 1979). Recent researchhas shown that reduced and no-tillage systems maygreatly alter N cycling and availability (Kitur et al.,1984; Legg et al., 1979; Power, 1981). Soil organic,mineralizable, and microbial biomass N are usuallygreater in surface soil receiving no tillage than in soilwhere crop residues are incorporated by tillage (Doran,1980). Thus, one might expect that crop residue place-ment could significantly affect the availability of Nfrom various sources.
Several investigators have used labeled-N isotopesto estimate availability of N from several sources forcrop uptake and growth. Yaacob and Blair (1980)found an average of 15.4% of the 15N in soybean res-idues was taken up by rhodesgrass (Chloris gayanaKunth) in pot experiments. In the same study, 13.7to 55.5% of the 15N in residues of siratro [Macroptil-ium atropurpureum (DC.) Urb.] was used, increasingas the number of previous crops of siratro grown inthe soil increased from one to six. They also foundaddition of residues from either crop increased uptakeof native soil organic N by the grass. The N in cropresidues is probably first assimilated into microbialbiomass (Amato and Ladd, 1980). This N is later re-leased as inorganic N, which is available to a growingcrop, utilized by subsequent generations of soil orga-nisms, or polymerized into cyclic C compounds withincreasing resistance to microbial degradation (Alienet al., 1973; Martin et al., 1980). For example, Broad-bent and Nakashima (1974) found 38% of N added inbarley (Hordeum vulgare L.) straw and 57% of N addedin roots remained immobilized as soil organic N after5 yr of incubation, presumably as resistant cyclic-Ncompounds. Because the addition of crop residueschanges relative N and C availability for microorga-nisms (Cochran et al., 1980), and because the presenceof surface crop residues greatly changes soil temper-ature and water regimes (Doran et al., 1984), one mightexpect relative uptake of N from soil, crop residue,and fertilizer sources to vary widely with managementpractices.
MATERIALS AND METHODSCorn, sorghum [Sorghum bicolor (L.) Mpench], and soy-
bean (four replications) were grown in rotation 1978 through1980 on a Crete-Butler silty clay loam (fine, montmprillon-itic, mesic Pachic Arguistolls-Abruptic Argiaquolls) in east-ern Nebraska. After harvest, each autumn, the amount ofcrop residue on the soil surface was adjusted to approxi-mately 0, 50, 100, or 150% of the quantity of residue pro-duced by the previous crop. The next crop in the rotationwas then no-till planted the following spring. In 1978 and1979, NH4NO3 was surface broadcast at 70 kg N ha"1 on
corn and sorghum, and no N was applied to soybean. Dataon crop growth and yield, and on soil water and temperatureregimes for the 1978 through 1980 crops were recently pub-lished (Doran et al., 1984).
Starting with 1980, the crop rotation was stopped, andcontinuous corn and soybean were produced on their re-spective plots (sorghum was dropped from the experiment).In April, 45 kg N ha~' as NH4NO3 was surface broadcaston all plots (148.6 m2). The crop residue rate treatments of0, 50, 100, and 150% of residues produced by the previouscrop were maintained with a no-till system. Each corn andsoybean plot was divided in half during 1980, with one sidereceiving 15N-depleted NH4NO3 (99.99% 14N), and the otherside.regular commercial NH4NO3 (99.635% 14N).
Aboveground plant growth was sampled (2.4 m2) at mid-season in 1980, dried, weighed, and analyzed for total Ncontent and N-isotope ratio (Keeney and Bremner, 1966).Soil samples were also taken in 115-mm diam cylinders toa depth of 115 mm (8 per plot), crop residues screened out,and 1 M KC1 soil extracts were analyzed for inorganic Ncontent and N-isotope ratio in the inorganic N fraction. Cropresidues screened out were weighed and analyzed for totalN and N-isotope ratio.
At maturity, grain yields were determined by combine-harvesting eight rows (0.76-m spacing) 11.6 m in length.Straw (stover) weight was determined by collecting andweighing all residues from the combine harvester plus theremaining standing stubble for the entire half of each plot(6.1 X 12.2 m), and correcting for water content. A subsam-ple of 8 to 12 randomly selected plants was removed atmaturity from each half-plot, dried, ground, subsampled,and analyzed for total N and N-isotope ratio. Soils weresampled by 150-mm depth increments to 0.6 m and ana-lyzed for inorganic N content and isotope ratio in the in-organic N.
After harvest in 1980, crop residues from the 15N-depletedhalf of each plot were replaced at the appropriate rate (0,50, 100, or 150% of that produced in 1980) on the other halfof each plot, i.e., on the half that had not received labeledfertilizer in 1980. Likewise, residues from the half-plot with-out 1980 labeled fertilizer were placed on the respective half-plot that received label in 1980. Residues were cut 50 to 100mm above the soil surface, so crowns and roots were nottransferred. By this procedure, we could separate the labeledN taken up in the 1981 crop into that originating from 1980crop residues and that originating from labeled isotope im-mobilized in 1980 as soil organic N (none of the labeled Napplied in the spring remained as inorganic soil N after har-vest). The additional residue biomass needed for the 1.5treatment came primarily from the plots from which 50%of residues were removed (0.5 treatment). Occasionally, in-sufficient residue was available from this treatment, so someresidue from the 0% treatments was used. After spreadingcrop residues, all plots were covered with polypropylene mesh(approximately 25-mm openings) over winter to prevent res-idue from one half-plot blowing or washing onto an adjacenthalf-plot.
In spring of 1981, each whole plot was split perpendicularto the 1980 split, with half of each plot receiving labeledfertilizer in 1981 and half receiving unlabeled NH4NO3 at45 kg N ha~' broadcast on the surface. Thus, each main plotwas divided into four quarters, each contributing labeled Nto the 1981 crop from different combinations of sources (1980fertilizer, 1980 plus 1981 fertilizer, residues alone, and res-idues plus 1981 fertilizer). Amount of labeled isotope takenup by the 1981 crop could then be divided among that orig-inating from residual effects of 1980 fertilization (probablyimmobilized as organic N), from 1980 crop residues on thesoil surface, and from the 1981 fertilizer application. Soil Nuptake could be calculated by the difference between totaland labeled N uptake. In May 1980, soils were again sam-
POWER ET AL.: UPTAKE OF NITROGEN FROM SOIL FERTILIZER AND CROP RESIDUES 139
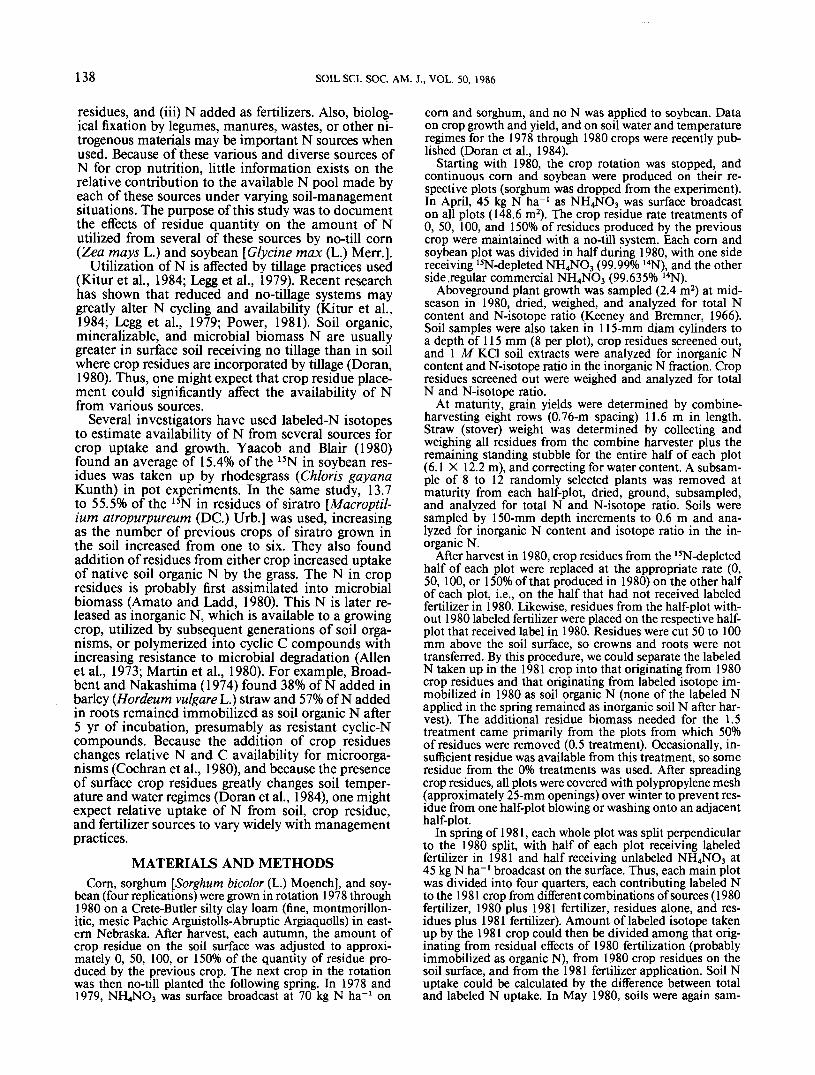
Table 1. Soybean dry weight, total, labeled, and soil N uptakein 1980 as affected by surface placement of crop residues.
Residue rate0.0 0.5 1.0 1.5 LSD0.0,
kg ha-'July 1980 (whole plant)
Dry weightTotal NLabeled NSoil NT
148045.74.4
41.3
156049.14.6
44.5
166059.59.2
50.3
148041.04.4
37.6
NS8.01.36.1
October 1980 (grain)Dry weightTotal NLabeled NSoilNt
129082.24.5
77.7
2120132.9
9.2123.7
2200135.7
9.0126.7
2490155.010.4
144.6
1408.80.99.5
October 1980 (straw)Dry weightTotal NLabeled NSoilNt
261024.23.8
20.4
400032.63.2
30.4
440038.23.2
35.0
502046.93.6
43.3
4004.2
NS3.9
t Indigenous soil N plus biologically fixed N.
pled (15-mm intervals to 0.6 m) and analyzed for inorganicN. Corn and soybean crops were again seeded no-till andsampled midseason and at maturity in 1981, as describedabove. However, at the July plant sampling date, six cornor 10 soybean randomly selected plants were harvested atground surface from each quarter of each plot (outside ofarea harvested at maturity) for total N and N-isotope ratioanalysis. All N analyses (total, soil inorganic, and N-isotoperatio) were performed using procedures adapted from thosepublished in Black (1965).
All data were analyzed statistically by analysis of variance,using a randomized-block design with four replications. Leastsignificant differences between means (LSD0.05) were thencalculated.
RESULTS AND DISCUSSIONThe 1980 growing season was characterized by ex-
treme water and temperature stress (Doran et al., 1984)for several weeks before and after inflorescense of corn(stress through most of July and early August). In con-trast, water and temperature stresses during 1981 weremuch less evident, and growth of nonirrigated cropswas reasonably normal for the region.
Dry weight of whole soybean plants in July was notaffected by residue rate (Table 1). Dry weight of bothsoybean grain and straw at harvest (October) generallyincreased with increased residue rate, and the dryweight increase between July and October was ap-proximately equal to the weight of the grain produced.Likewise, total N uptake by soybean (grain plus straw)tended to increase as residue rate increased—an ex-ception was the July whole-plant sample at the 1.5residue rate. In October, total N uptake for soybean(grain plus straw) from the 1.5 residue rate was almostdouble that for the 0 residue rate. Labeled N uptakeincreased with increased residue rate in the July whole-plant samples (except the 1.5 rate) and in the grainharvested in October, but not in the straw left in thefield after harvest. Uptake of soil plus biologically fixedN in grain plus straw also increased with residue ratefor all sample sets, and again, by October, quantitiesfor the 1.5 residue rate were about double those forthe 0 residue rate. Whole-plant uptake of labeled iso-tope increased by 3 to 13 kg N ha"1 between July and
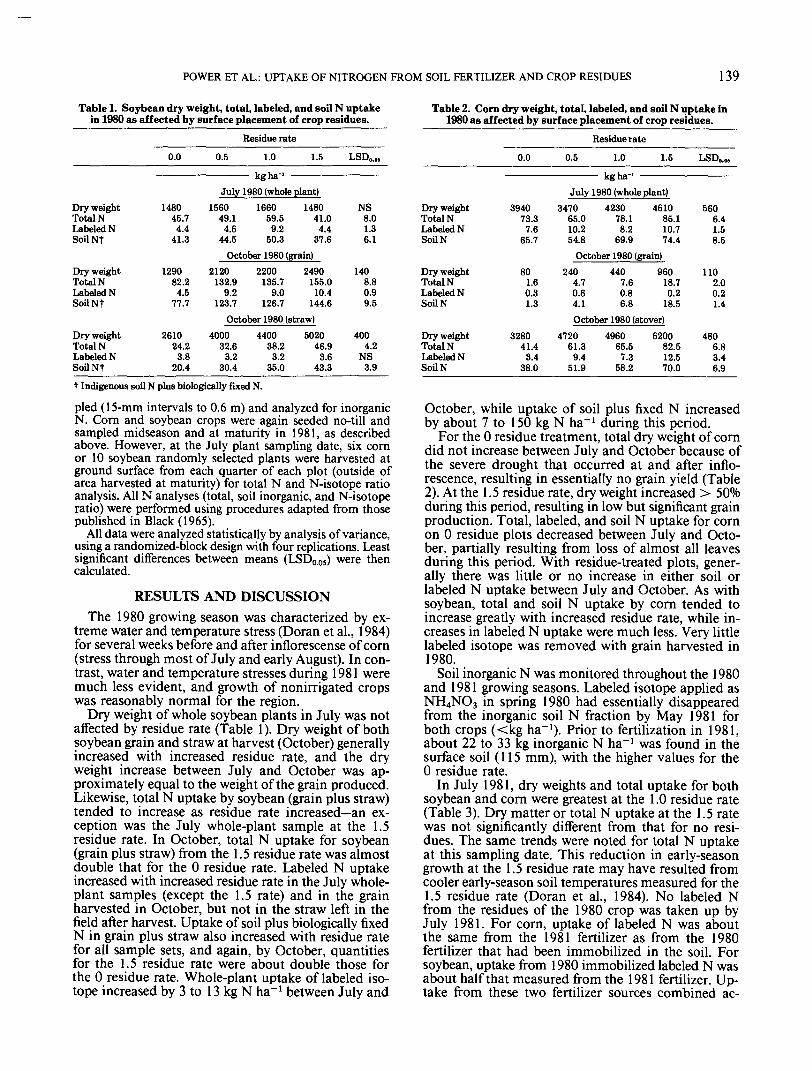
Table 2. Corn dry weight, total, labeled, and soil N uptake in1980 as affected by surface placement of crop residues.
Residue rate0.0 0.5 1.0 1.5 LSD,,.
kg ha-'July 1980 (whole plant)
Dry weightTotal NLabeled NSoilN
Dry weightTotal NLabeled NSoilN
Dry weightTotal NLabeled NSoilN
394073.37.6
65.7
801.60.31.3
328041.4
3.438.0
347065.010.254.8
423078.18.2
69.9
461085.110.774.4
October 1980 (grain)240 440 960
4.7 7.6 18.70.6 0.8 0.24.1 6.8 18.5October 1980 (stover)
472061.39.451.9
496065.57.358.2
620082.512.570.0
5606.41.58.5
1102.00.21.4
4806.83.46.9
October, while uptake of soil plus fixed N increasedby about 7 to 150 kg N ha"1 during this period.
For the 0 residue treatment, total dry weight of corndid not increase between July and October because ofthe severe drought that occurred at and after inflo-rescence, resulting in essentially no grain yield (Table2). At the 1.5 residue rate, dry weight increased > 50%during this period, resulting in low but significant grainproduction. Total, labeled, and soil N uptake for cornon 0 residue plots decreased between July and Octo-ber, partially resulting from loss of almost all leavesduring this period. With residue-treated plots, gener-ally there was little or no increase in either soil orlabeled N uptake between July and October. As withsoybean, total and soil N uptake by corn tended toincrease greatly with increased residue rate, while in-creases in labeled N uptake were much less. Very littlelabeled isotope was removed with grain harvested in1980.
Soil inorganic N was monitored throughout the 1980and 1981 growing seasons. Labeled isotope applied asNH4NO3 in spring 1980 had essentially disappearedfrom the inorganic soil N fraction by May 1981 forboth crops (<kg ha"1). Prior to fertilization in 1981,about 22 to 33 kg inorganic N ha"1 was found in thesurface soil (115 mm), with the higher values for the0 residue rate.
In July 1981, dry weights and total uptake for bothsoybean and corn were greatest at the 1.0 residue rate(Table 3). Dry matter or total N uptake at the 1.5 ratewas not significantly different from that for no resi-dues. The same trends were noted for total N uptakeat this sampling date. This reduction in early-seasongrowth at the 1.5 residue rate may have resulted fromcooler early-season soil temperatures measured for the1.5 residue rate (Doran et al., 1984). No labeled Nfrom the residues of the 1980 crop was taken up byJuly 1981. For corn, uptake of labeled N was aboutthe same from the 1981 fertilizer as from the 1980fertilizer that had been immobilized in the soil. Forsoybean, uptake from 1980 immobilized labeled N wasabout half that measured from the 1981 fertilizer. Up-take from these two fertilizer sources combined ac-
140 SOIL SCI. SOC. AM. J., VOL. 50, 1986
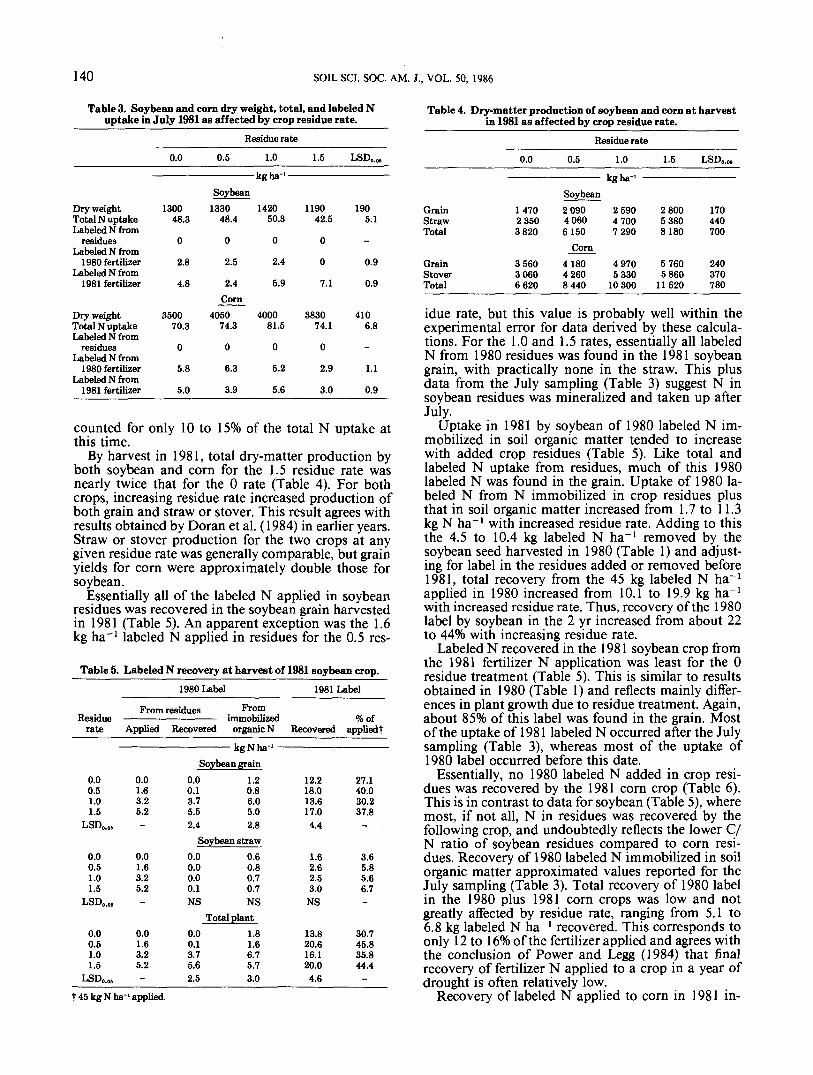
Table 3. Soybean and corn dry weight, total, and labeled Nuptake in July 1981 as affected by crop residue rate.
Residue rate
Dry weightTotal N uptakeLabeled N from
residuesLabeled N from
1980 fertilizerLabeled N from
1981 fertilizer
Dry weightTotal N uptakeLabeled N from
residuesLabeled N from
1980 fertilizerLabeled N from
1981 fertilizer
0.0
130048.3
0
2.8
4.8
350070.3
0
5.8
5.0
0.5
Soybean1330
48.4
0
2.5
2.4Corn
405074.3
0
6.3
3.9
1.0
•kgha--
142050.3
0
2.4
5.9
400081.5
0
5.2
5.6
1.5
119042.5
0
0
7.1
383074.1
0
2.9
3.0
LSD...,
1905.1
-
0.9
0.9
4106.8
-
1.1
0.9
Table 4. Dry-matter production of soybean and corn at harvestin 1981 as affected by crop residue rate.
counted for only 10 to 15% of the total N uptake atthis time.
By harvest in 1981, total dry-matter production byboth soybean and corn for the 1.5 residue rate wasnearly twice that for the 0 rate (Table 4). For bothcrops, increasing residue rate increased production ofboth grain and straw or stover. This result agrees withresults obtained by Doran et al. (1984) in earlier years.Straw or stover production for the two crops at anygiven residue rate was generally comparable, but grainyields for corn were approximately double those forsoybean.
Essentially all of the labeled N applied in soybeanresidues was recovered in the soybean grain harvestedin 1981 (Table 5). An apparent exception was the 1.6kg ha"1 labeled N applied in residues for the 0.5 res-
TableS. Labeled N recovery at harvest of 1981 soybean crop.
1980 Label
Residuerate
From residues
Applied
From
Recovered organic N
1981 Label
Recovered%of
applied!
Soybean grain0.00.51.01.5
LSD0.M
0.01.63.25.2-
0.00.13.75.52.4
1.20.86.05.02.8
12.218.013.617.04.4
27.140.030.237.8-
Soybean straw0.00.51.01.5
LSD0.M
0.00.51.01.5
LSD0.0,
0.01.63.25.2-
0.01.63.25.2-
0.00.00.00.1NS
0.00.13.75.62.5
0.60.80.70.7NS
Total plant1.81.66.75.73.0
1.62.62.53.0
NS
13.820.616.120.04.6
3.65.85.66.7-
30.745.835.844.4-
Residue rate
GrainStrawTotal
GrainStoverTotal
0.0
147023503820
356030606620
0.5
Soybean209040606150
Corn418042608440
1.0
kg ha- -
259047007290
49705330
10300
1.5
280053808180
57605860
11620
LSD0.0,
170440700
240370780
T 45 kg N ha-applied.
idue rate, but this value is probably well within theexperimental error for data derived by these calcula-tions. For the 1.0 and 1.5 rates, essentially all labeledN from 1980 residues was found in the 1981 soybeangrain, with practically none in the straw. This plusdata from the July sampling (Table 3) suggest N insoybean residues was mineralized and taken up afterJuly.
Uptake in 1981 by soybean of 1980 labeled N im-mobilized in soil organic matter tended to increasewith added crop residues (Table 5). Like total andlabeled N uptake from residues, much of this 1980labeled N was found in the grain. Uptake of 1980 la-beled N from N immobilized in crop residues plusthat in soil organic matter increased from 1.7 to 11.3kg N ha"1 with increased residue rate. Adding to thisthe 4.5 to 10.4 kg labeled N ha""1 removed by thesoybean seed harvested in 1980 (Table 1) and adjust-ing for label in the residues added or removed before1981, total recovery from the 45 kg labeled N ha""1
applied in 1980 increased from 10.1 to 19.9 kg ha"1
with increased residue rate. Thus, recovery of the 1980label by soybean in the 2 yr increased from about 22to 44% with increasing residue rate.
Labeled N recovered in the 1981 soybean crop fromthe 1981 fertilizer N application was least for the 0residue treatment (Table 5). This is similar to resultsobtained in 1980 (Table 1) and reflects mainly differ-ences in plant growth due to residue treatment. Again,about 85% of this label was found in the grain. Mostof the uptake of 1981 labeled N occurred after the Julysampling (Table 3), whereas most of the uptake of1980 label occurred before this date.
Essentially, no 1980 labeled N added in crop resi-dues was recovered by the 1981 corn crop (Table 6).This is in contrast to data for soybean (Table 5), wheremost, if not all, N in residues was recovered by thefollowing crop, and undoubtedly reflects the lower C/N ratio of soybean residues compared to corn resi-dues. Recovery of 1980 labeled N immobilized in soilorganic matter approximated values reported for theJuly sampling (Table 3). Total recovery of 1980 labelin the 1980 plus 1981 corn crops was low and notgreatly affected by residue rate, ranging from 5.1 to6.8 kg labeled N ha"1 recovered. This corresponds toonly 12 to 16% of the fertilizer applied and agrees withthe conclusion of Power and Legg (1984) that finalrecovery of fertilizer N applied to a crop in a year ofdrought is often relatively low.
Recovery of labeled N applied to corn in 1981 in-
POWER ET AL.: UPTAKE OF NITROGEN FROM SOIL FERTILIZER AND CROP RESIDUES 141
Table 6. Labeled N recovery at harvest of 1981 corn crop.
1980 Label
Residuerate
0.00.51.01.5
LSD0.01
0.00.51.01.5
LSD,..,
0.00.51.01.5
LSD0.M
From residues
Applied
0.04.77.3
17.2-
0.04.77.3
17.2-
0.04.77.3
17.2-
From
Recovered organic N
0.00.00.00.0NS
0.00.00.20.0NS
0.00.00.20.0NS
——— kgNha- -Corn grain
3.63.93.74.1NS
Corn stover1.21.92.11.6NS
Total plant4.85.85.85.7NS
1981 Label
Recovered
1.84.93.35.72.4
1.92.43.84.92.0
3.77.37.1
10.62.3
%ofappliedt
4.010.97.3
12.7-
4.25.38.4
10.9-
8.216.215.723.6-
Table 7. Sources of N taken up by soybean and cornby harvest in 1981.
145 kg N ha" applied.
creased with increasing residue rate (Table 6). Recov-ery was only about 10 to 24% of that applied, however,and was about equally divided between grain andstover. As with soybean, almost all uptake of 1980label occurred prior to the July sampling, while muchof the 1981 label was taken up after this date. Thisobservation may indicate that 1980 labeled N im-mobilized in soil organic matter was in a form thatwas readily labile and was mineralized and utilizedearly in the cropping season. The soil N pool that mostreadily fits this description is the microbial biomass(Amato and Ladd, 1980).
Sources of the N taken up by the 1981 soybean andcorn crops varied with residue treatment and crop.For soybean, total N uptake increased twofold as res-idues increased from the 0 to the 1.5 rates. Data inTable 5 indicated that 100% of the N in 1980 cropresidues at the 1.0 and 1.5 rates (Table 1) was takenup by the 1981 soybean crop. Thus, most of the dif-ferences in total N uptake resulting from different cropresidue rates were accounted for by differences in theamount of N present in these residues at the beginningof the 1981 season. Although uptake from both resid-ual (1980) and current (1981) fertilizer applicationsalso tended to increase with residue rate, these differ-ences were small in comparison to the quantities ac-counted for by utilization of N in the crop residuesreturned to the soil surface. Uptake derived from min-eralization of native soil N plus biologically fixed N(calculated by difference) was the major source of Nfor soybean in all treatments, and was slightly greaterfor residue-treated soils than for those without resi-dues. Data do not permit any estimate of biologicalfixation.
Somewhat similar trends in sources of N were ob-served for corn (Table 7). Total uptake again increasedgreatly as residue rate increased; however, essentiallynone of the N present in 1980 crop residues was uti-lized by the 1981 corn, even though as much as 114
Residuerate
0.00.51.01.5
0.00.51.01.5
Cropresidues
0.0 (0)t1.0(1)
38.2 (22)63.2 (32)
0.0 (0)0.0(0)1.8(1)0.0(0)
Residualfertilizer
N source
Currentfertilizer
Soybean1.8 (2) 13.8 (14)1.6 (1) 20.6 (14)6.7 (4) 16.1 (9)5.7(3) 20.0(10)
Corn4.8(6)5.8(5)5.8(4)5.7(4)
3.7 (5)7.3 (7)7.1 (5)
10.6 (8)
NativesoilN
84.2t(84)124.0J(84)115.9J(66)105.5t(54)
72.8 (90)96.7 (88)
114.4 (89)124.5 (88)
Total
99.8147.2176.9194.4
81.3109.8129.1140.8
t Numbers in parentheses indicate percent of total.{ Includes biologically fixed N.
kg N ha"1 was added in residues (Table 2). Data avail-able in this experiment do not permit us to addressthe question of the fate of this N. Similar to soybean,total N uptake by the 1981 corn crop also increasedalmost twofold as residue rate increased. Amount ofN taken up from either residual (1980) or current(1981) fertilizer treatment increased modestly with in-creased residue rate, but collectively, these two sourcesaccounted for only a small part (about 12%) of thetotal N used by the 1981 crop. Most of the N (about85%) in the 1981 crop came from mineralization ofthe native soil N. It is interesting to note that quan-tities of soil N used by the two crops were usually verysimilar.
Because of experimental procedures used and var-iation inherent in this type of approach, absolute val-ues reported in Table 7 were subject to a relativelylarge error; however, trends and magnitudes observedshould be valid (because these are derived data, sta-tistical methods of mean separation are not appropri-ate). Essentially, these trends indicate that N in soy-bean residues was used much more effectively bysubsequent crops than was N in corn residue whenleft on the soil surface; increased N uptake resultingfrom increased residue rate was often derived from allavailable sources of N; and the bulk of the N utilizedby either crop came from mineralization of native soilN (plus fixed N for soybean). The increased availa-bility and uptake of native soil N resulting from greatercrop residue cover may have resulted from the morefavorable soil water regimes associated with residuecover (Doran et al, 1984). Fate of the 114 kg N ha"1
added in 1980 corn residues at the 1.5 residue ratecannot be determined from available data. Presum-ably, much of this was immobilized into various soilorganic N pools with varying turnover rates (Broad-bent and Nakashima, 1974; Yaacob and Blair, 1980)and may be partially recovered over time. Additionalresearch using enriched 15N is needed to study long-term transformations of N immobilized in corn stoverreturned to the soil.
ACKNOWLEDGMENTSThis research was financed in part by the Dep. of Energy
Biomass Energy Systems Division. The authors thank Dr.
142 SOIL SCI. SOC. AM. J., VOL. 50, 1986
J. F. McBrayer, of Oak Ridge National Laboratory, for hisassistance on this contract. Also, we wish to thank Mr. Rob-ert Kleinlan at the USDA-ARS Northern Regional ResearchCenter, Peoria, IL, for the N-isotope ratio analyses.
![Clustering of Microarray Data Reveals Transcript Patterns · Clustering of Microarray Data Reveals Transcript Patterns Associated with Somatic Embryogenesis in Soybean1[w] Franc¸oise](https://img.pdfslide.net/doc/110x75/5ed2c7ccae2cb511b17808ae/clustering-of-microarray-data-reveals-transcript-clustering-of-microarray-data-reveals.jpg)