Embed Size (px)
Citation preview
KATERINA ELIAS-TROSTMANN, LUBAINA RANGWALA, RETNO WIHANESTA
URBAN COMMUNITY
RESILIENCE
ASSESSMENT (UCRA)
Identifying differentiated needs for resilience planning in urban poor communities
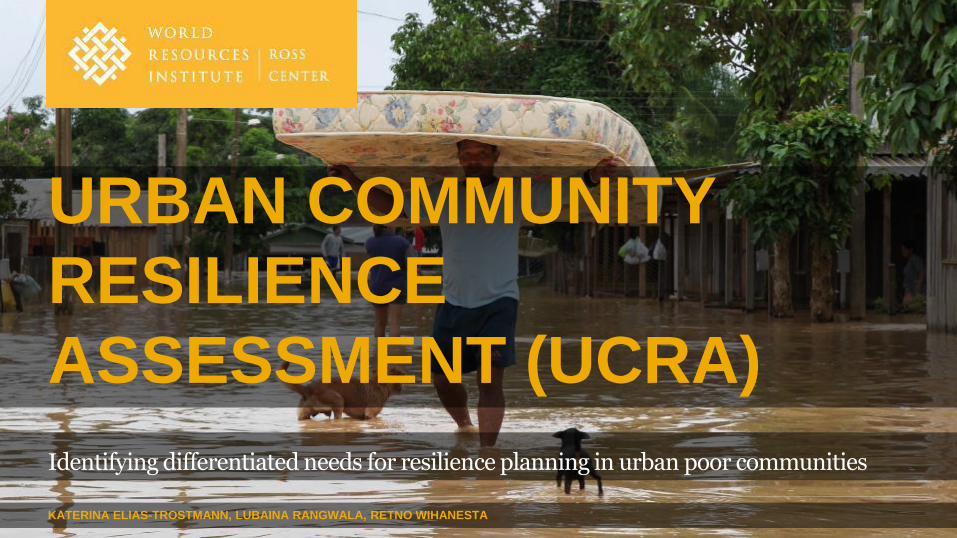
AGENDA
What is the UCRA?
UCRA framework
Why focus on differentiated needs?
How to focus on differentiated needs?
Co-developing resilience strategies
Enhancing UCRA
URBAN COMMUNITY RESILIENCE ASSESSMENT
What is the UCRA?
• The Urban Community Resilience Assessment (UCRA) helps cities incorporate individual and community capacities, into broader urban resilience evaluations.
• The UCRA provides a snapshot of preparedness behaviors, risk perception and the strength of neighborhood relationships.
• These findings enable individuals to identify context-specific adaptation actions and allow policymakers to engage community members in urban resilience planning.
URBAN POOR COMMUNITIES ARE AT THE FOREFRONT
OF CLIMATE CHANGE
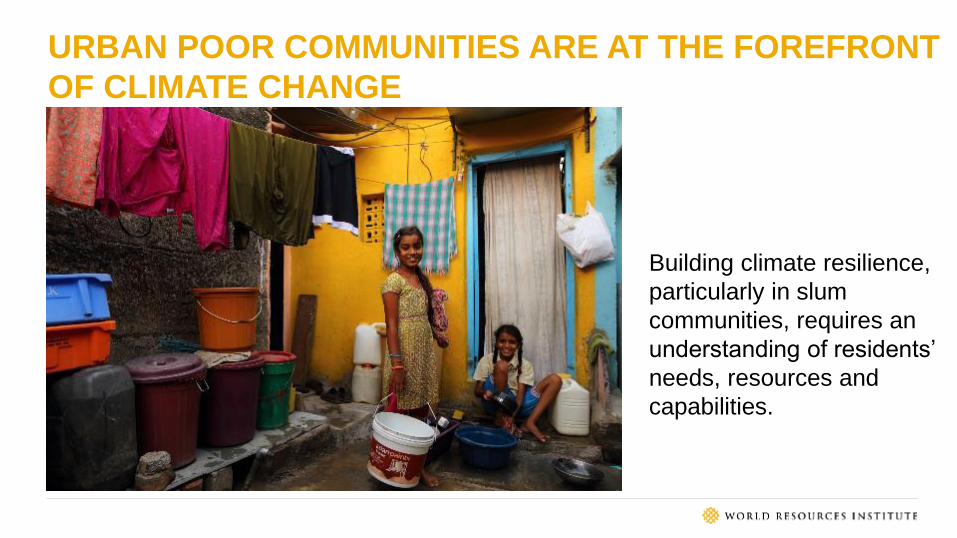
Building climate resilience,
particularly in slum
communities, requires an
understanding of residents’
needs, resources and
capabilities.
WHY FOCUS ON DIFFERENTIATED NEEDS
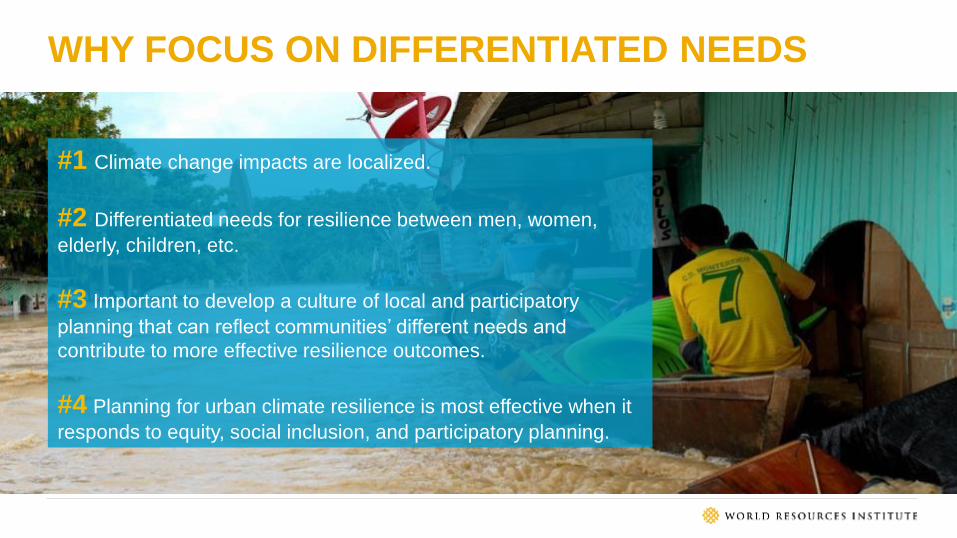
#1 Climate change impacts are localized.
#2 Differentiated needs for resilience between men, women,
elderly, children, etc.
#3 Important to develop a culture of local and participatory
planning that can reflect communities’ different needs and
contribute to more effective resilience outcomes.
#4 Planning for urban climate resilience is most effective when it
responds to equity, social inclusion, and participatory planning.
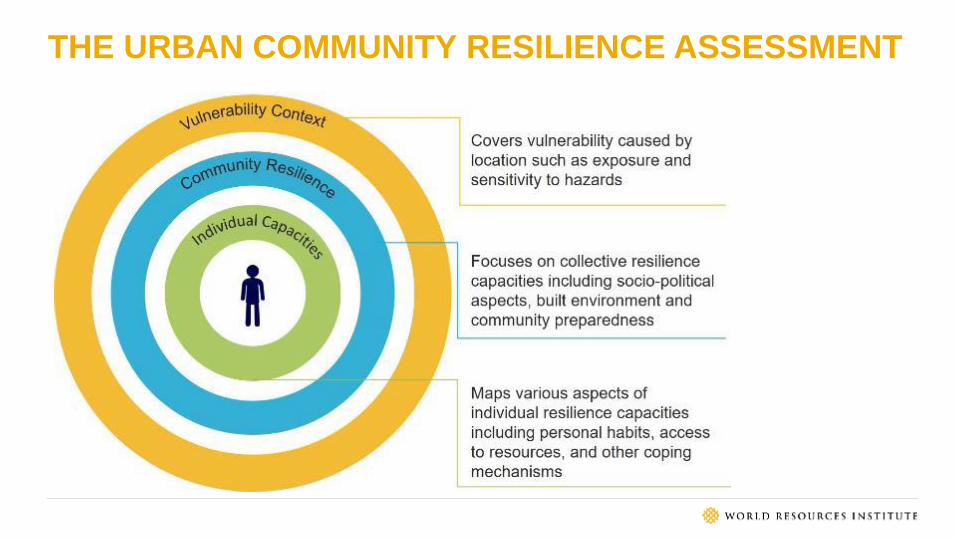
THE URBAN COMMUNITY RESILIENCE ASSESSMENT
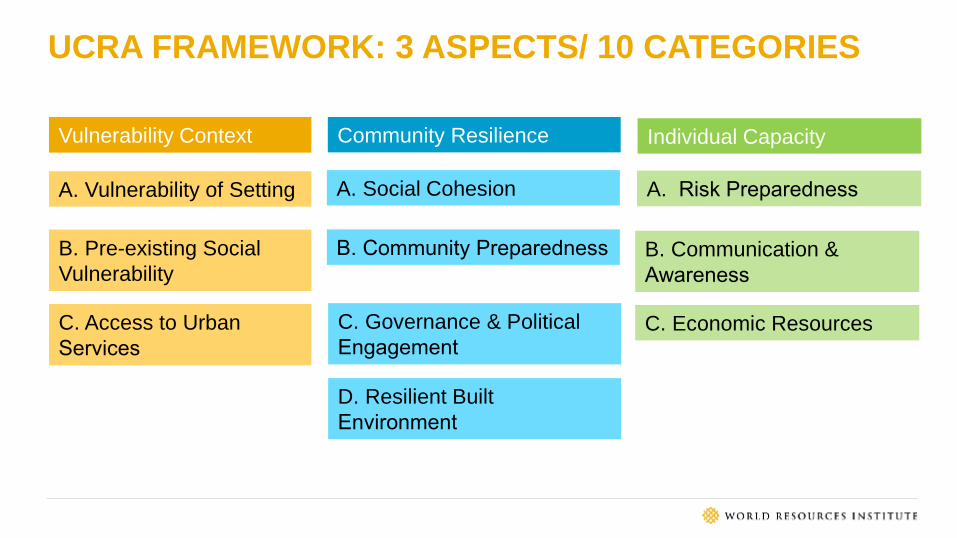
UCRA FRAMEWORK: 3 ASPECTS/ 10 CATEGORIES
Vulnerability Context Community Resilience Individual Capacity
A. Vulnerability of Setting
B. Pre-existing Social
Vulnerability
C. Access to Urban
Services
A. Social Cohesion
B. Community Preparedness
C. Governance & Political
Engagement
D. Resilient Built
Environment
A. Risk Preparedness
B. Communication &
Awareness
C. Economic Resources

UCRA FRAMEWORK AND INDICATORSVulnerability Context Community Resilience Individual Capacity
A. Vulnerability of Setting A. Social Cohesion A. Risk Preparedness
1. High Risk Areas 1. Size & Strength of Informal Social Networks 1. Perceived Climate Risk
2. Urban Poor Housing (Informal Housing) 2. Neighbourhood Socializing 2. Practice of Resilience Habits
3. Summer Heat Index 3. Neighbourhood Preference 3. Resilience Kits
4. Precipitation Anomaly 4. Sense of Community Identity 4. Back-up of documents
5. Extreme Events 5. Community-Based Livelihoods
B. Pre-existing Social Vulnerability B. Community Preparedness B. Communication & Awareness
1. High-risk Labor Profile 1. Community Led Resilience Activities 1. Cell Phone Ownership
2. Literacy Profile 2. Community Health Awareness Camps 2. Internet Access
3. Age Profile 3. High Risk Communities with EWS 3. Access to Local News
4. Gender Imbalance 4. Weather Forecast Awareness
5. Migration Profile 5. Weather Health Awareness
C. Access to Urban Services C. Governance & Political Engagement C. Economic Resources
1. Access to Water Distribution Network 1. Political Engagement 1. Alternative Livelihood Options
2. Access to Sewage Treatment Network 2. Voter Participation 2. Emergency Savings
3. Access to Electricity Grid 3. Trust in Community Leader 3. Health and Life Insurance
4. Access to Waste Collection Network 4. BPL Card/ Proof of Identity
5. Access to Urban Health Amenities 5. Willingness to Invest in Resilience
D. Resilient Built Environment
1. Toilet Type
2. Mobility
3. Access to Natural Features
4. Construction Type
5. Availability of Shade

THE UCRA 4 STAGE PROCESS
1
2
3
4
Preparatory PhaseIdentify communities
Indicators reviewed
Expert & community consultations
Survey MethodologyDraft questionnaire
Train a survey team
Data Collection and AnalysisPrimary surveys and focus group discussions
Develop resilience diagnostic report
Project PlanningShare results & report
Co-develop resilience actions
Submit operational resilience
plans to the City
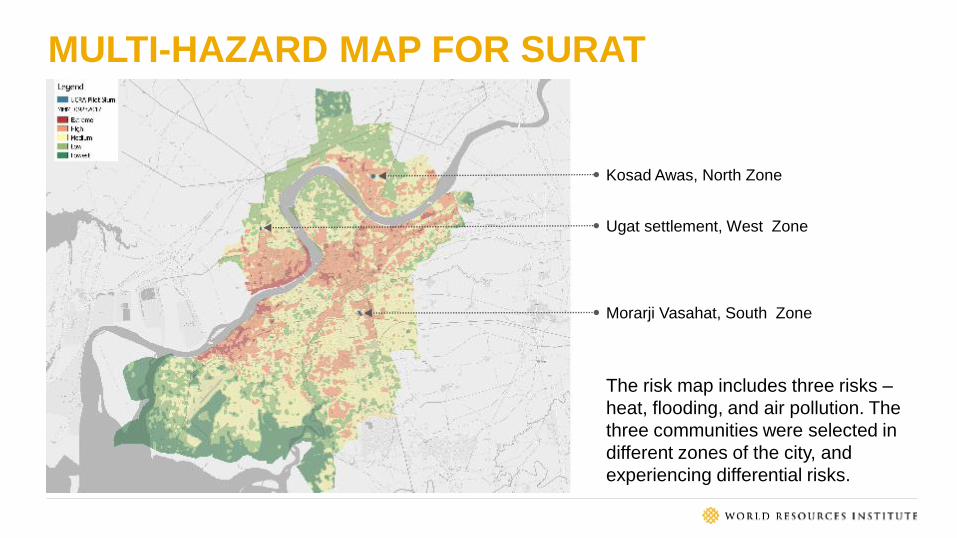
MULTI-HAZARD MAP FOR SURAT
The risk map includes three risks –
heat, flooding, and air pollution. The
three communities were selected in
different zones of the city, and
experiencing differential risks.
Kosad Awas, North Zone
Ugat settlement, West Zone
Morarji Vasahat, South Zone
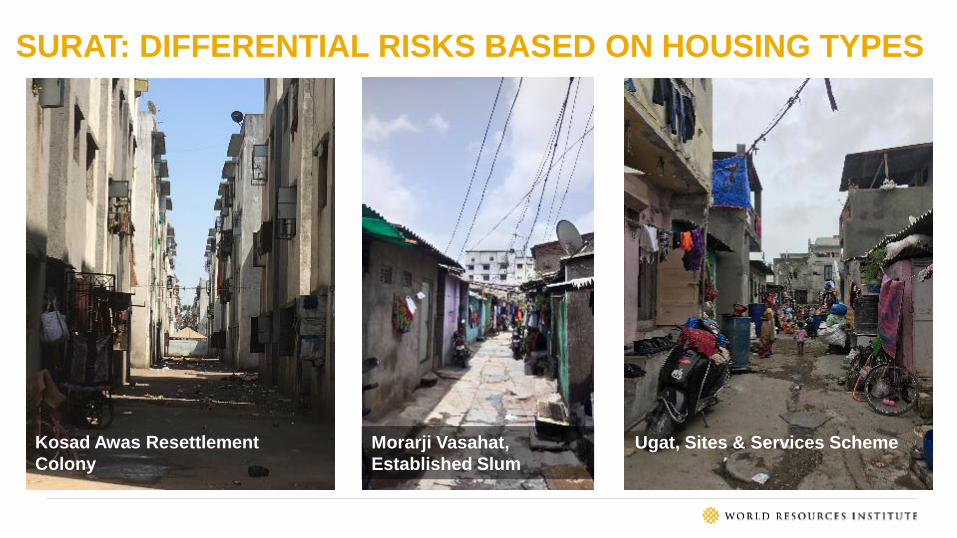
SURAT: DIFFERENTIAL RISKS BASED ON HOUSING TYPES
Kosad Awas Resettlement
Colony
Ugat, Sites & Services SchemeMorarji Vasahat,
Established Slum
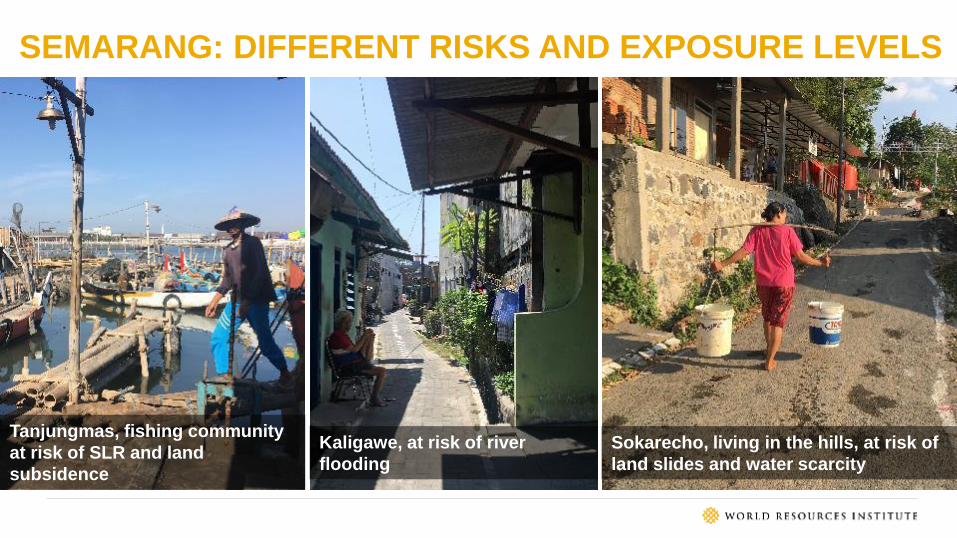
SEMARANG: DIFFERENT RISKS AND EXPOSURE LEVELS
Tanjungmas, fishing community
at risk of SLR and land
subsidence
Sokarecho, living in the hills, at risk of
land slides and water scarcity
Kaligawe, at risk of river
flooding
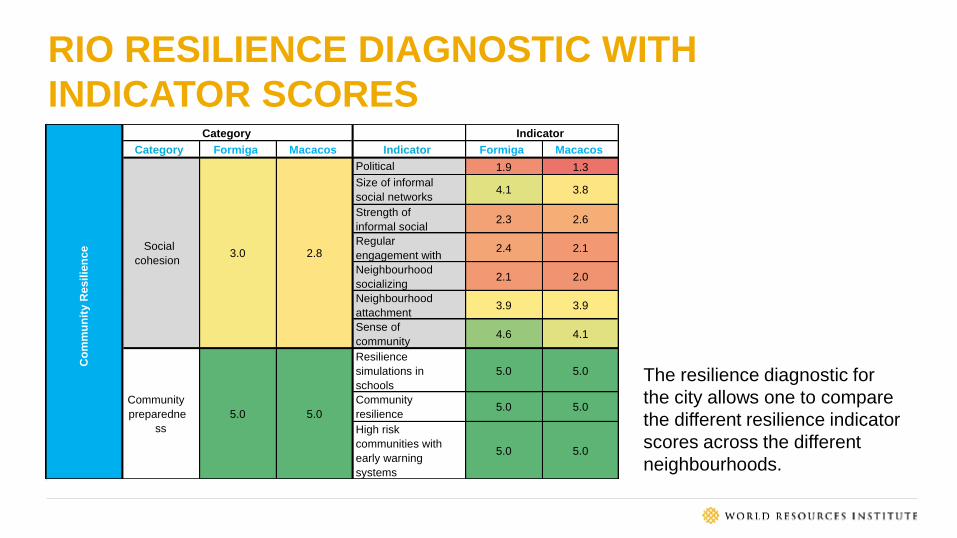
RIO RESILIENCE DIAGNOSTIC WITH
INDICATOR SCORES
The resilience diagnostic for
the city allows one to compare
the different resilience indicator
scores across the different
neighbourhoods.
Category
Category Formiga Macacos Indicator Formiga Macacos
Political
engagement
1.9 1.3
Size of informal
social networks4.1 3.8
Strength of
informal social 2.3 2.6
Regular
engagement with 2.4 2.1
Neighbourhood
socializing2.1 2.0
Neighbourhood
attachment3.9 3.9
Sense of
community
identity
4.6 4.1
Resilience
simulations in
schools
5.0 5.0
Community
resilience
taskforce
5.0 5.0
High risk
communities with
early warning
systems
5.0 5.0
Co
mm
un
ity
Re
sil
ien
ce 3.0 2.8
5.0 5.0
Indicator
Social
cohesion
Community
preparedne
ss
Vulnerability Context (21) City Level Scores Community Resilience (19) Morarji Ugat Kosad Individual Capacity (14) Morarji Ugat Kosad
A. Vulnerability of Setting 2.7 A. Social Cohesion 4.3 4.5 4.5 A. Risk Perception 3 3.3 2.5
1. High Risk Areas 21. Size & Strength of Informal Social
Networks4 4 4 1. Perceived Climate Risk 3 3 2
2. Urban Poor Housing (Informal Housing) 4 2. Neighbourhood Socializing 4 5 5 2. Practice of Resilience Habits 5 5 5
3. Summer Heat Index 1 3. Neighbourhood Preference 5 5 5 3. Resilience Kits 2 2 2
4. Precipitation Anomaly 3 4. Sense of Community Identity 4 4 4 4. Back-up of documents 2 3 1
5. Extreme Events 3.5 5. Community-Based Livelihoods NA NA NA
B. Pre-existing Social Vulnerability 3.5 B. Community Preparedness 1.8 2 1.5 B. Communication & Awareness 3.6 3.8 3.6
1. High-risk Labor Profile 4 1. Community Led Resilience Activities 2 4 2 1. Cell Phone Ownership 3 3 3
2. Literacy Profile 32. Community Health Awareness
Programmes1 1 1 2. Internet Access 2 2 1
3. Age Profile 5 3. Access to EWS 1 1 1 3. Access to Local News 5 5 5
4. Gender Profile 1 4.Refuge Area 3 2 2 4. Weather Forecast Awareness 5 5 5
5. Migration Profile NA 5. Indigenous Community Knowledge NA NA NA 5. Weather Health Awareness 3 4 4
6. Crime Rate 3
7. Disability Profile NA
8. Social Profile (Religion/Caste/ Region) 5
C. Access to Urban Services 4.0C. Governance & Political
Engagement3 2.0 1.8 C. Economic Resources 3.2 3 3.2
1. Access to Water Distribution Network 5 1. Political & City Engagement 3 2 1 1. Alternative Livelihood Options 2 2 3
2. Access to Sewage Treatment Network 5 2. Voter Participation 5 4 4 2. Emergency Savings 2 1 1
3. Access to Electricity Grid 5 3. Trust in Community Leader 2 1 1 3. Health and Life Insurance 2 2 2
4. Access to Waste Collection Network 5 4. Non-Governmental Support 2 1 1 4. BPL Card/ Proof of Identity 5 5 5
5. Access to Urban Health Amenities 3 5. Willingess to Invest in Resilience 5 5 5
6. Storm Water Drainage 4
7. Reliable & Affordable Mobility 3
8. Green areas & Natural Infrastructure 2
D. Resilient Built Environment 1.6 2 2.8
1. Access to Urban Amenities 4 4 5
2. Mobility 1 1 1
3. Access to Natural Features 1 2 2
4. Construction Type 1 2 5
5. Availability of Shade 1 1 1
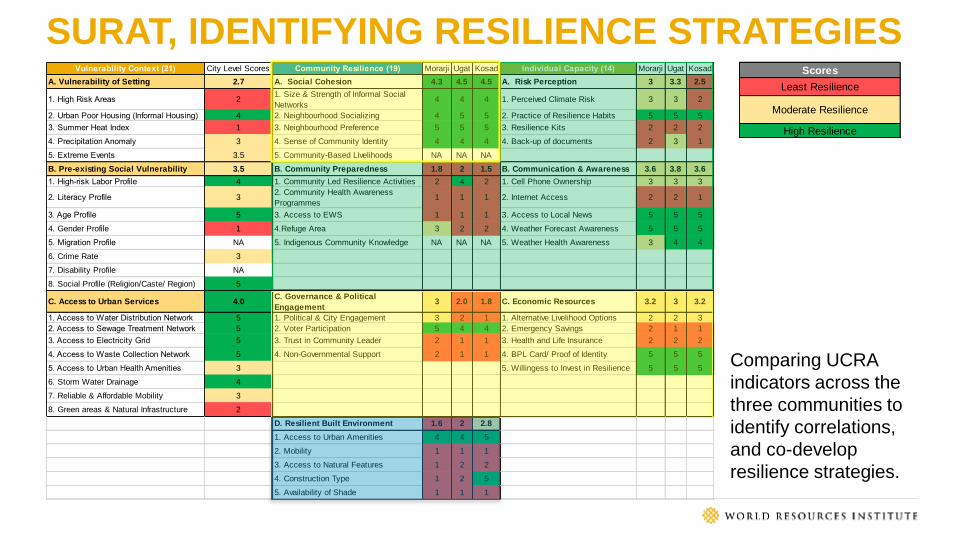
SURAT, IDENTIFYING RESILIENCE STRATEGIESScores
Least Resilience
Moderate Resilience
High Resilience
Comparing UCRA
indicators across the
three communities to
identify correlations,
and co-develop
resilience strategies.

COMMUNITY WORKSHOPS IN SURAT
Gender segregated community workshops were held to address key resilience challenges in the three
communities. We co-developed the following resilience strategies and plans –
• Safety plan for women and children that included an adaptation of a neighbourhood watch;
• Micro-level flood plan that integrated existing social networks into an relief & rescue strategy;
• Waste segregation and management plan for the neighbourhood.
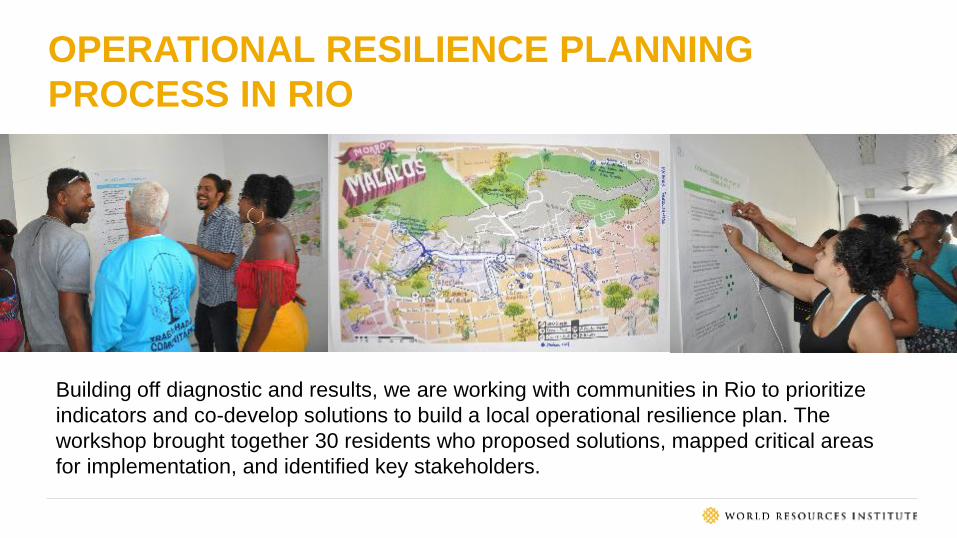
OPERATIONAL RESILIENCE PLANNING
PROCESS IN RIO
Building off diagnostic and results, we are working with communities in Rio to prioritize
indicators and co-develop solutions to build a local operational resilience plan. The
workshop brought together 30 residents who proposed solutions, mapped critical areas
for implementation, and identified key stakeholders.
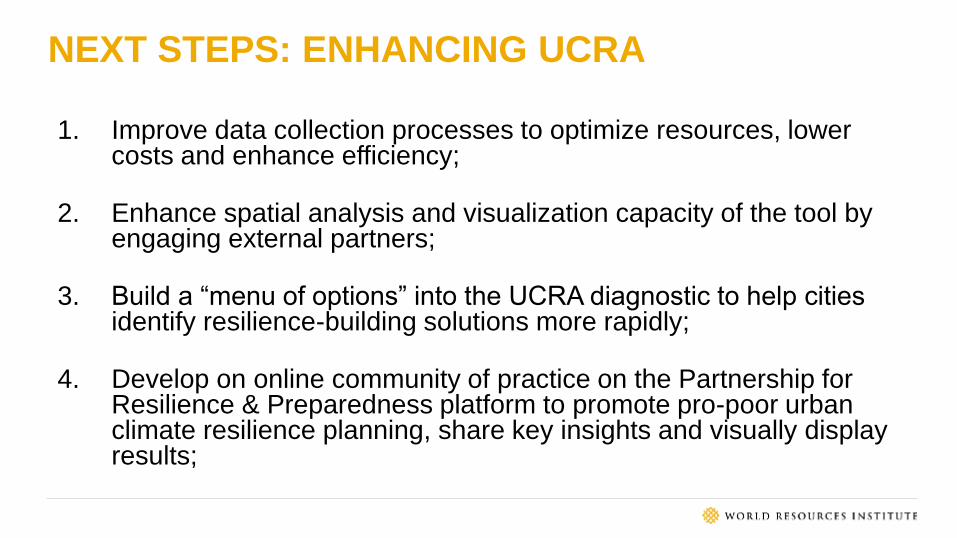
NEXT STEPS: ENHANCING UCRA
1. Improve data collection processes to optimize resources, lower costs and enhance efficiency;
2. Enhance spatial analysis and visualization capacity of the tool by engaging external partners;
3. Build a “menu of options” into the UCRA diagnostic to help cities identify resilience-building solutions more rapidly;
4. Develop on online community of practice on the Partnership for Resilience & Preparedness platform to promote pro-poor urban climate resilience planning, share key insights and visually display results;
THANK YOU