Embed Size (px)
Citation preview

Assessing the Resilience of an Urban Transportation Network
Supervisors: Dr. Prakash Ranjitkar & Dr. Seosamh Costello
PhD Provisional Candidate: Mujaddad Afzal

Background
• “800 million people live within100 km of an active volcano in86 countries and additionaloverseas territories worldwide”.
• The Auckland City is built on topof the Auckland Volcanic Field(AVF),
• The field is likely to erupt again:the most recent eruption,Rangitoto, was only 550 yearsago .
(Global Volcanic Hazards and Risk)

Characteristic of Study Area
• Auckland has a unique geographicallocation.
• Natural bottle neck
• Congested transportation network
• Unique topography
• Situated on active volcanic field
• 8 proposed eruption Scenario byDetermining Volcanic Risk inAuckland (DEVORA)
• Total 411 zones in Auckland (AucklandCity Council)

Ruaumoko Scenario Exercise(Staged Evacuation)
New Zealand Volcanic Alert Level (VAL) version 3.0 (Potter et al.,2014)
UC developed Mt Ruaumoko Scenario in AVF for an educational simulation exercise. The scenario spans 10 week (6 feb – 14 April) (ERI Research Report, 2015)
• On 22 feb VAL increase from 0 to 1, there will be self-evacuation by some concerned residence.
• During Exercise, the evacuation continued to 15 march (MCDEM, 2008).
Limitations: They considered only night time scenario for the calculation of population. No Traffic Simulation used to calculate clearance time of evacuation.

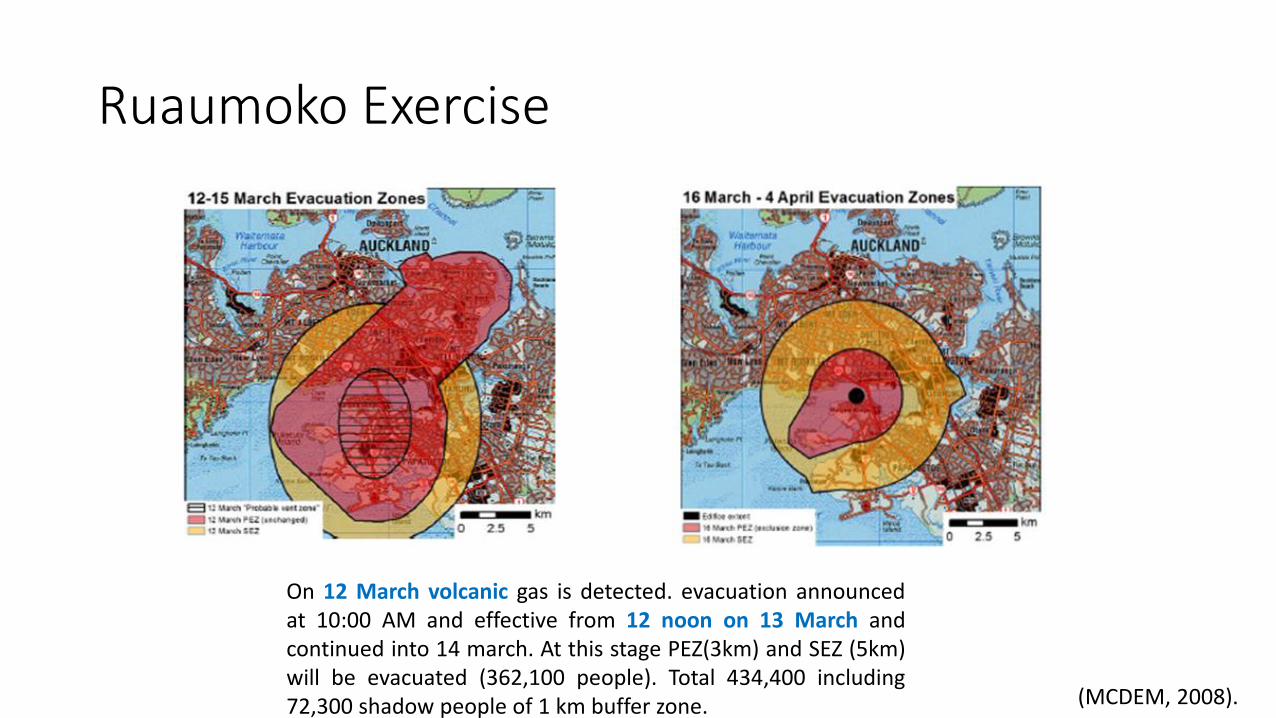
Ruaumoko Exercise
Initial evacuation was called on 8 marchwhen VAL goes from 1 to 2. 199,200people will be affected.
By 11 march additional 54,400 areeffected by the extended evacuation zone.Up to this point total evacuees 253700.
(MCDEM, 2008).
Ruaumoko Exercise
(MCDEM, 2008).
On 12 March volcanic gas is detected. evacuation announcedat 10:00 AM and effective from 12 noon on 13 March andcontinued into 14 march. At this stage PEZ(3km) and SEZ (5km)will be evacuated (362,100 people). Total 434,400 including72,300 shadow people of 1 km buffer zone.

Evacuation Studies using Simulation (Response / Pre Disaster Resilience / Increased Demand Scenario)
Authors MOEs Methodology Case Study Gaps
Zhang et al.(2013)
Total no. of Trips, Total Veh. Hours, Avg. Travel Time, Avg. Travel Speed, Clearance Time
TRANSIMS Hurricane Evacuation for Gulf Coast Region, (Houstan Galveston)
Vehicle removed with travel time 3 hr longer than normal conditions. Computer Processing Limitation, Could not cover full travel condition.
Naghawi & Wolshon(2010)
Average Travel Time and Total Evacuation Time
TRANSIMS, ANOVA
Hurricane Evacuation for New Orleans
Only checked the improvement in evacuation time using transit
Chen (2008) Evacuation Time Vissim V4 Hurricane Evacuation, Galveston Island, USA
35,219 vehicles, 58,000 people, Small Island (only 1 exit used), calibration not even discussed.
Chen et al. (2006)
Evacuation Time VISSIM V3.70 Hurricane Evacuation for Florida Keys, USA
Peninsula, calibration not even discussed.
Gap 01: Few mass evacuation studies available for coastal areas using micro simulation in case of Hurricane. In these studies all Traffic goes in one direction.

Evacuation Studies using Simulation (Response / Pre Disaster Resilience / Increased Demand Scenario)
Authors MOEs Methodology Case Study Gaps
Thomson et al. (2014)
Total Network Clearance Time TransCAD Auckland Software Limitations. Model was not calibrated.
Jayananthan& Jayasinghe(2016)
Total Clearance Time AIMSUN Auckland Model was not Calibrated due to limited time
Gap 01: Two mass evacuation studies available for Auckland City, only one use micro simulation. Model was not calibratedObjective 01: Evaluate total clearance time for “mass evacuation of Auckland city” before eruption occurs using Calibrated model.

Gulf Coast Megaregion (Zhang et al. 2013)

Simulation Results (Zhang et al. 2013)

Galveston County and Island (Chen, 2008)

Florida Keys (Chen et al., 2006)

Transport Network Resilience (Recovery / Post Disaster Resilience / Decreased Capacity Scenario)
Authors MOEs Network Approach Case Study Gap
Bhavathrathan(2015)
“capacity & operation cost”.
Two-space genetic algorithm
Hypothetical Test Networks
Didn’t use the simulation
Taylor & Susil-awati (2012)
Change to accessibility level
Accessibility model Green Triangle road network
Didn’t use the auctualcase study
Ip and Wang(2011)
Avg. no. of links b/w nodes
Optimization Model Chinesrailway Network
It was for , not for roadways
Ash and Newth(2007)
Load Capacity Evolutionary Algorithm
Hypothetical Test Network
Didn’t use simulation
Matisziw and Murray (2007)
Vital Links Optimization Model Ohio Interstate System
No simulation
Rosenkrantz et al. (2005)
Max no. of node failure Algorithms No case study or simulation

Vulnerability Analysis (Recovery / Post Disaster Resilience / Decreased Capacity Scenario)
Authors MOEs Methodology Case Study Gaps
Miramontes, (2016)
Network delay, frontage road delay, queue length
Mesoscopic (DynusT,2015) El Paso Network
Micro simulation
Kim and yeo (2016)
Density, Overflow MFD based Vulnerability index. AIMSUN 7
Gangnumcity
Don’t have enough data to model MFD
Jenelius and Mattsson (2015)
Travel pattern and network density GIS and Algorithms Sweden road network
No Traffic Simulation
Jenelius and Mattsson (2012)
Level of Internal, outbound, and in bound travel demand of the effective area
Grid-based vulnerability analysis
Sweden road network
No Traffic Simulation
Gap 02: Most of the road network vulnerability and Resilience studies are Conceptual or analytical or GIS based. Very Few road network resilience and vulnerability studies use macroscopic or mesoscopic traffic simulation software for densely populated urban area.No Technical Transportation vulnerability Analysis has bee done for Auckland using traffic simulation for any natural or manmade hazard (Volcanic Hazard).Objective 02: Evaluate performance of network after volcanic eruption (Post Disaster Scenario).Vulnerability analyse of Urban Transportation Network for Auckland using traffic simulation software.Asses the resilience of transportation network for post disaster scenario.

Conceptual resilience Curve for an Event
Conceptual Resilience Framework
Conceptual long-term resilience framework Panteli and Mancarella, 2015

Conceptual Resilience Framework
Conceptualized Resilience Triangle from Disaster Research (Bruneau 2003)
Conceptualized Resilience Triangle for a Major Weather Event (Adams et al. 2012)
Graphical Depiction of State Transitions over Time (Baroud et al. 2014)

Conceptual Resilience Framework
Graphical Depiction of State Transitions over Time (Baroud et al. 2014)
Gap 03: ResilienceFrameworks do not explainPre Disaster Situation(increased demandscenario)
Objective 03: DevelopFramework for UrbanTransportation NetworkResilience (UTNR), whichencompass both predisaster and post disasterscenarios.Develop a single measureof resilience for UrbanTransportation Network.
(Faturechi R. and Miller-Hooks E. , 2014)
New Zealand Volcanic Alert Level (VAL)version 3.0 (Potter et al.,2014)

Aims & Objectives
The main aim of this research is to access the resilience of Urban Transportation Network using Traffic simulation software (AIMSUN).
• Objective 01: Evaluate total clearance time for “mass evacuation of Auckland city” before eruption occurs using calibrated model.
• Objective 02: Evaluate performance of network after volcanic eruption (Post Disaster Scenario).
Vulnerability analyse of Urban Transportation Network for Auckland using Traffic simulation software.
• Objective 03: Develop Framework for Urban Transportation Network Resilience (UTNR), which encompass both pre disaster and post disaster scenarios.

Heuristic Approach (General Methodology)
Auckland Transportation Network
Model
Scale:
Regional
Quality & Accesibility:
Road Network,
Demand Data,
OD Surveys,
Travel Time or Queue Data,
Calibration & Validation,
Stages: Macro, Meso, Micro
Resilience Analysis:
1.Robustness, Redundancy, Resourcefulness (Response /
Preparedness), 2.Vulnerability Analysis &
Traffic Management Strategies.

Heuristic Approach (General Methodology)
Auckland Transportation Network
Model
Scale:
Regional
Quality & Accesibility:
Road Network,
Demand Data,
OD Surveys,
Travel Time or Queue Data,
Calibration & Validation
Stages: Macro, Meso, Micro
Evacuation Planning:
1.Total Clearance Time 2.Bottleneck Locations
3. Traffic Management Strategies

Stage 1 (Macro)
Base Model
Scale:
Regional
Quality & Accesibility:
Road Network,
Demand Data,
OD Surveys,
Travel Time,
Signal Phases,
Count Data
Stages: Macro
Calibration / Validation:
Observed flow vs Modelled flow,
Fine Tune Nodes and Links

Count Comparison
(Penlink Traffic & Economic Analysis by BECA, June 2014)

Validation Criteria used by BECA for Penlink
EEM suggested criteria
(Penlink Traffic & Economic Analysis by BECA, June 2014)
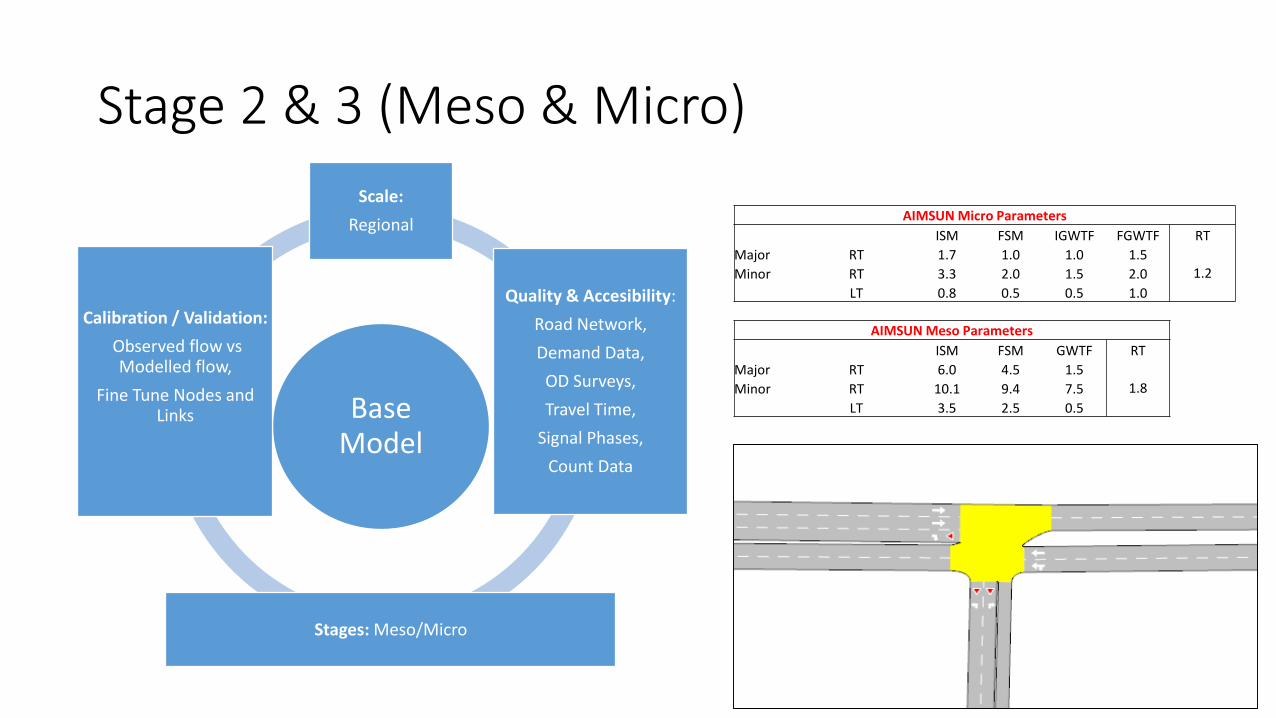
Stage 2 & 3 (Meso & Micro)
AIMSUN Micro Parameters
ISM FSM IGWTF FGWTF RT
Major RT 1.7 1.0 1.0 1.51.2Minor RT 3.3 2.0 1.5 2.0
LT 0.8 0.5 0.5 1.0
AIMSUN Meso Parameters
ISM FSM GWTF RT
Major RT 6.0 4.5 1.51.8Minor RT 10.1 9.4 7.5
LT 3.5 2.5 0.5Base Model
Scale:
Regional
Quality & Accesibility:
Road Network,
Demand Data,
OD Surveys,
Travel Time,
Signal Phases,
Count Data
Stages: Meso/Micro
Calibration / Validation:
Observed flow vs Modelled flow,
Fine Tune Nodes and Links

Methodology (Pre Disaster)
Response (Evacuation) Analysis using Aimsun
Performance not Met
Add Robustness & Post Disaster Redundancy
(Long Term Strategy)
Pre Disaster Redundancy
(Immediate Action)
Response
Evacuation Analysis using Meso/Micro-Simulation
Evacuation Capacity Enhancement Measures
Identify Bottlenecks, Network Performance
Explore other Modes of Transportation
Railway, Waterway, Pedestrian
Network Performance
Achieved
Information Dissemination System
Improvement
Rehabilitation/Recovery (Near Future
Activities)

Methodology (Post Disaster)
Recovery Analysis
Performance Decreased
Add Robustness & Post Disaster Redundancy
(Long Term Strategy)
Recovery
(Immediate Action)
Regain Capacity by removing debris/ash/tephra etc
Explore other Modes of Transportation
Involve other Authorities
Response
Vulnerability Analysis & Mitigation Strategies
Calculate Reduced Capacity & Optimize Network
Analyse Capacity improvement Strategies i.e. contraflow
Network Performance 100 %

Methodology (Evacuation / Pre Disaster Model Preparation)

1 km South of Mt. Eden
Total 411 zones in Auckland (Auckland City Council) 66 (Origin),345 (Destination). Calculated total clearance time 10 to 14 hours (Ranjitkar et al.)
5km

Thanks
To be continued……..