Embed Size (px)
Citation preview

Resilient Communities Project
Prepared for the City of North St. Paul
Stormwater Quality Improvement Plan for the
Urban Ecology Center Subwatershed
P. Paulos, A. Tomasek, J. Hunter, B. Sprang, and A. Miller
May 16, 2014

This project was supported by the Resilient Communities Project (RCP), a program at the University of Minnesota that convenes the wide-‐ranging expertise of U of M faculty and students to address strategic local projects that advance community resilience and sustainability. RCP is a program of the Center for Urban and Regional Affairs (CURA) and the Institute on the Environment.
This work is licensed under the Creative Commons Attribution-‐NonCommercial 3.0 Unported License. To view a copy of this license, visit http://creativecommons.org/licenses/by-‐nc/3.0/ or send a
letter to Creative Commons, 444 Castro Street, Suite 900, Mountain View, California, 94041, USA. Any reproduction, distribution, or derivative use of this work under this license must be accompanied by the following attribution: “Produced by the Resilient Communities Project at the University of Minnesota, 2014. Reproduced under a Creative Commons Attribution-‐NonCommercial 3.0 Unported License.” This publication may be available in alternate formats upon request.
Resilient Communities Project University of Minnesota 330 HHHSPA 301—19th Avenue South Minneapolis, Minnesota 55455 Phone: (612) 625-‐7501 E-‐mail: [email protected] Web site: http://www.rcp.umn.edu
The University of Minnesota is committed to the policy that all persons shall have equal access to its programs, facilities, and employment without regard to race, color, creed, religion, national origin, sex, age, marital status,
disability, public assistance status, veteran status, or sexual orientation.

Executive Summary This report addresses the loading of both total phosphorous (TP) and total suspended solids (TSS) to the Urban Ecology Center (UEC) drainage area within the Kohlman Creek Subwatershed in North St. Paul, MN. The effects of different types and placements of stormwater control measures (SCMs), which are structures or techniques used to control and improve the quality of stormwater runoff, were modeled in the UEC Drainage Area using the computer software P8. A cost analysis was performed of the SCMs in order to gauge the cost-effectiveness of each SCM in reducing TP and TS. The SCMs investigated for this modeling initiative include a sump placed in parallel with an existing sump, adding additional rain gardens throughout the basin, improved street sweeping methods, an infiltration basin and an infiltration vault. This analysis included a cost estimation for removing a pound of total phosphorus and total suspended solids per year based on a 20 year lifespan of the devices. The cost per pound of phosphorus was used as a standard because pounds are the weight measuring unit of preference in the United States and when these numbers are in pounds it is much easier for the general public to visualize. The most financially beneficial practice found in this report is the use of a more efficient street sweeper along with increasing the sweeping frequency from the current schedule of four times per year to six times per year. Also, along with increasing the sweeping frequency, it is recommended that the city use a TYMCO regenerative air sweeper as opposed to the current street sweeper. The phosphorous removal efficiency for street sweeping was found to be $57.82 per pound. If the City decides to implement SCMs in addition to street sweeping, it was found that increasing the number of rain gardens within the UEC drainage area would be the most economical option. This modification would result in a cost of approximately $573 per pound of total phosphorous removed and $2.72 per pound of total suspended solids removed. Alternative practices ranged in price from $1,732-$10,386 per pound of total phosphorous removed and $6.36-$39.69 per pound of total suspended solids removed. In addition, the modeling showed that any SCMs added would be most beneficial if placed in downstream regions of the sub-drainage area. The model did show that upstream SCMs did remove TP and TSS, however these were not cost-effective methods.

Introduction
As part of the Resilient Communities Project (RCP), the City of North St. Paul is working in partnership with the University of Minnesota to explore the implementation of new stormwater management practices (SMPs) that can be used to reduce urban runoff from the city’s streets, homes, and businesses. Specifically, the City is interested in reducing primarily total phosphorous (TP) and total suspended solids (TSS) loading into Kohlman Lake, which is the receiving surface water body for most of North St. Paul. As part of the RCP agreement, the University agreed to use engineering students from the Civil Engineering department’s Urban Hydrology course taught by Dr. John Gulliver to model and test various SMPs and report their findings to the City. The city asked the three student groups to focus on specific areas within the Kohlman Creek subwatershed. This report details the work and findings of the student group assigned to the Urban Ecology Center drainage area. The UEC drainage area consists of 458 acres of residential, commercial, and park space in the south western edge of North St. Paul. The watershed’s approximate boundaries are Highway 36 to the north, First Street North to the east, Ripley Avenue to the south and Seventh Street North to the west. A small portion of Maplewood also falls within the drainage area and was included in the model analysis. Kohlman Lake has been targeted by both the Minnesota State Pollution Control Agency (MPCA) and the Ramsey-Washington Metro Watershed District (RWMWD) as an impaired and special management lake. One of the management concerns is urban runoff carrying excess nutrients into the lake. The watershed district has set a target goal for phosphorous nutrient concentration within the lake of 60 micrograms per liter. Average phosphorus concentrations within the lake from 1997 to 2006 were 98 micrograms per liter. The primary goal of this project was to provide the city with potential SMPs that will lower total phosphorous and total suspended solids, along with the costs associated with the implementation of these devices. To accomplish this task, a site-specific stormwater run-off model was created using available data to evaluate the effectiveness of several different practices. The results for these modeled SMPs are presented in this report. To provide additional cost-benefit analysis to the city of North St. Paul, the group also included the implementation costs in this report. These costs were used to determine the cost effectiveness of the various SMPs, reported as dollars per mass of nutrient removed.
Methods
P8 Analysis
While there are several analytical tools available to stormwater engineers to analyze stormwater management practices, the UEC group chose the “Program for Predicting

Polluting Particle Passage thru Pits, Puddles, & Ponds” (P8) computer model to conduct its North St. Paul study. In order to compare different SCMs within the P8 program, a site-specific, baseline model was created. Data for drainage sub-areas such as land-use type, acreage, and percent impervious were obtained from both the RWMWD and online Geographic Information System (GIS) databases including the National Land Cover Database (NLCD, www.mrlc.gov) and contour and LiDAR data from the Minnesota Geospatial Information Office (www.mngeo.state.mn.us). Figure 1 shows the baseline model inputs of UEC sub-drainage areas and existing SCMs.
Figure 1: Subdrainage boundaries, drainage Pathway and SCMs locations used in UEC model
Modeling existing SCMs
Since specific design and drainage data for each of the existing SCMs were not available, additional data was calculated by hand. This included delineating the watershed using the contour data and the location of the SCMs (since for modeling in P8, the characteristics of the subwatershed that drains to the practice is required) and estimating the size of some of the SCMs. This additional data was obtained by

interpreting surface contour lines surrounding each SCM. Surface areas of wet ponds and infiltration SCMs were also estimated from GIS and/or aerial maps. Depths and infiltration rates in each SCM (except the added infiltration basin) were estimated by using average values from the Minnesota Stormwater Manual. Table 1 lists the existing SCM type, size and location.
Table 1: Existing SCMs in Urban Ecology Center drainage area.
Sub-drainage
Number
Creation
Date Year
SCM Type Bottom
Area
(acres)
Permanent
pool Volume
(Acre-Ft)
Flood Pool
Volume
(Acre-Ft) 10 1987 Wet pond 0.087 0.792 0.511
1 1990 Wet pond 0.262 2.346 1.520
3 1998 Wet pond 0.065 0.594 0.384
3 1998 Swirl separator N/A N/A N/A
Bottom
Width
(Ft)
Slope
(Ft-h)
Length
(Ft)
12 2002 Filter strips and swales 14 0.050 250
Bottom
Area
(acres)
Storage pool
Area (Acres)
Storage Pool
Volume
(Acres-Ft)
0 2011 Rain garden 0.005 0.013 0.019
0 2011 Rain garden 0.005 0.013 0.019
8 2013 Rain garden 0.005 0.013 0.019
11 2013 Rain Garden 0.005 0.013 0.019
Temperature and precipitation data used in P8 were historical data collected in Minneapolis between 10/1/1970 to 9/30/1979, these dates were chosen because it best represented average Minnesota conditions and a 1.1 in storm event. Additionally, Nationwide Urban Runoff Program (NURP) particle size distribution was used to provide conservatism due to its relatively small particle size distribution. After all parameters required for the P8 model were acquired, the P8 model was used to calculate an existing (baseline) TP and TSS load (pounds per year) for the UEC drainage area.
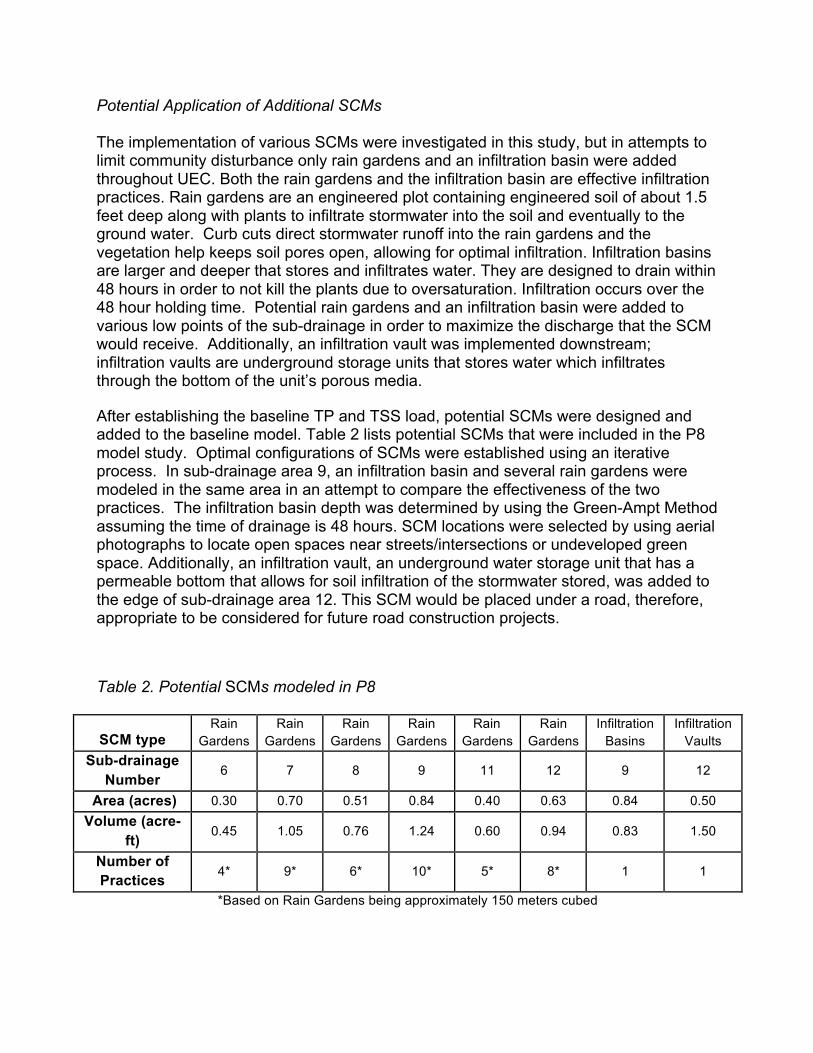
Potential Application of Additional SCMs
The implementation of various SCMs were investigated in this study, but in attempts to limit community disturbance only rain gardens and an infiltration basin were added throughout UEC. Both the rain gardens and the infiltration basin are effective infiltration practices. Rain gardens are an engineered plot containing engineered soil of about 1.5 feet deep along with plants to infiltrate stormwater into the soil and eventually to the ground water. Curb cuts direct stormwater runoff into the rain gardens and the vegetation help keeps soil pores open, allowing for optimal infiltration. Infiltration basins are larger and deeper that stores and infiltrates water. They are designed to drain within 48 hours in order to not kill the plants due to oversaturation. Infiltration occurs over the 48 hour holding time. Potential rain gardens and an infiltration basin were added to various low points of the sub-drainage in order to maximize the discharge that the SCM would receive. Additionally, an infiltration vault was implemented downstream; infiltration vaults are underground storage units that stores water which infiltrates through the bottom of the unit’s porous media. After establishing the baseline TP and TSS load, potential SCMs were designed and added to the baseline model. Table 2 lists potential SCMs that were included in the P8 model study. Optimal configurations of SCMs were established using an iterative process. In sub-drainage area 9, an infiltration basin and several rain gardens were modeled in the same area in an attempt to compare the effectiveness of the two practices. The infiltration basin depth was determined by using the Green-Ampt Method assuming the time of drainage is 48 hours. SCM locations were selected by using aerial photographs to locate open spaces near streets/intersections or undeveloped green space. Additionally, an infiltration vault, an underground water storage unit that has a permeable bottom that allows for soil infiltration of the stormwater stored, was added to the edge of sub-drainage area 12. This SCM would be placed under a road, therefore, appropriate to be considered for future road construction projects.
Table 2. Potential SCMs modeled in P8
SCM type Rain
Gardens Rain
Gardens Rain
Gardens Rain
Gardens Rain
Gardens Rain
Gardens Infiltration
Basins Infiltration
Vaults Sub-drainage
Number 6 7 8 9 11 12 9 12
Area (acres) 0.30 0.70 0.51 0.84 0.40 0.63 0.84 0.50 Volume (acre-
ft) 0.45 1.05 0.76 1.24 0.60 0.94 0.83 1.50
Number of Practices
4* 9* 6* 10* 5* 8* 1 1
*Based on Rain Gardens being approximately 150 meters cubed

Swirl Separator Modeling
SHSAM (Barr Engineering) was used to estimate the load removal by the swirl separator, Stormceptor, from the runoff from sub-drainage area 3. This program is device-specific and is used to model suspended solids removal exclusively by sumps. SHSAM inputs hydrological parameters (i.e. drainage area, percent-impervious, precipitation) which are similar to those used in P8. Based upon North St. Paul’s location, the input precipitation data was from the years 1995-2007 and collected at Golden Valley, MN weather station. The air temperature data is also required by SHSAM to calculate the sedimentation of particles. The temperature data used in SHSAM was from 1995-2007 and was from the city of St. Paul, MN (air temperature is widely accepted as roughly equivalent to stormwater temperature). The particle size distribution used in SHSAM was the same distribution used in P8 (NURP). Two model scenarios were tested; a baseline scenario of TSS removal from the existing Stormceptor sump, and additional removal achieved by using two sumps in parallel. Additional Street Sweeping Street sweeping practices were modeled using a spreadsheet created by Dr. Larry Baker through the University of Minnesota. The current schedule for sweeping was first implemented in order to receive baseline costs and removal values. Next, modeling was completed for an additional two sweeps per year along with the use of a TYMCO regenerative air sweeper. This sweeper uses vacuum and sweepers in tandem in order to collect fine particles from the streets unlike the current sweepers used in North St. Paul. An estimate of $23/curb-mile was used as suggested by Dr. John Gulliver. It was estimated that the UEC drainage area has 38.4 curb and 20% canopy cover using aerial maps within GIS along with the spreadsheet guidelines. Cost Estimates
Using the equations in Figure 2, cost estimations were made for the various SCMs. These cost estimates only included the construction costs and O&M necessary for the various techniques. Because these stormwater practices are expected to last for 20 years, the cost-analysis included is based upon their full lifespan. These costs included a 5% interest on the annual O&M as well as reduced costs due to top soil salvaging. According to the MPCA, top soil was salvaged at a rate of $4.50 per yard2 and according to the Department of Labor Statistics using the inflation of the dollar between 2005 and 2014, top soil salvaging is approximately 5.40 per yard2. By estimating construction costs during the P8 optimization process, SCMs were selected to run in tandem within different sub-drainages based upon their cost effectiveness.

Figure 2. Cost equations used to calculate TP/ TSS removal efficiency

Results
Results of the UEC group’s P8 model are presented in Table 3. TP and TSS load measured at the outlet of the UEC drainage area from all existing devices included in the baseline model was 177 pounds of phosphorus and 48,932 pounds of total suspended solids per year. The existing devices alone approximately removed 30 pounds per year of TP and 15,000 pounds per year of TSS. The most TP removed by any one new device was 33 pounds per year and the lowest amount was 1.2 pounds per year. The most TSS removed by one new device was 8,988 pounds per year and the lowest was 314 pounds per year.
Table 3. P8 model parameters and performance for new SCMs
Sub-drainage Number SCM
Water Quality Volume [cubic
meters]
Total Phosphorous
removed* [pounds/year]
Total Suspended Solids removed**
[pounds/year]
6 Rain Gardens 556 3.4 1,124
7 Rain Gardens 1,295 10.9 3,003
8 Rain Gardens 937 6 1,646
9 Rain Gardens 1,530 10 2,888
11 Rain Gardens 740 1.2 314
12 Rain Gardens 1,159 30.9 6,822
9 Infiltration Basin 1,024 11.5 3,246
12 Infiltration Vault 1,850 32.9 8,988
* relative amount calculated as difference from baseline TP load **relative amount calculated as difference from baseline TSS load
Table 4 is a summary of the cost analysis and total removals as found by using the street sweeping spreadsheet. With four sweeps (April/May/Oct/Nov) throughout the UEC drainage area with the regenerative air sweeper, the City is able to remove

approximately 61.1 pounds per year at $57.82 per pound. If were to increase sweeping frequency to 6 times per year (Apr/ May/ 2 X Oct/ 2X Nov), the City is able to remove phosphorous at a cost of $65 per pound with a load removal of 81 pounds TP per year. This does not include the cost of purchasing the new TYMCO street sweeper which is approximately $165,000.
Table 4-Street Sweeping Results
Street Sweeping Events
Lbs. TP removed/ yr
Additional lbs. TP
removed/ yr
Cost Cost/ lb.
Current Schedule Apr/ May/ Oct/ Nov 61.1 - $3,532.80 $57.82
Enhanced Schedule Apr/ May/ 2 X Oct/ 2X Nov 81.4 20.3 $5,299.20
$65.10
Table 5 presents the construction costs, annual O&M costs and cost effectiveness efficiency for each new SCM based upon a present worth analysis. A 5% interest rate was included in the annual O&M and a 20 year lifespan was assumed. The most efficient device removed TP at a rate of $573 per pound while the least efficient was $10,386 per pound. Construction costs ranged from $199,925 to $434,233 for rain gardens, $312,084 for the infiltration basin and $1,132,500 for the infiltration vault. Devices which treated greater volumes of runoff (e.g. those SCMs farther downstream within the drainage and/ or larger percent impervious covering) were generally more efficient. Though annual O&M costs were calculated, it was only included in the cost effectiveness analysis of infiltration basin and infiltration vaults due to the assumption that rain garden maintenance responsibilities will be handed over to the community.

Table 5. Cost and Cost Effectiveness for each new SCM
Sub-drainage Number
SCM
Practice Construction cost of new
SCM [$]
Annual O&M
[$]
*Cost efficiency
[$/ per pound of TP
removed]
*Cost efficiency
[$/ per pound of
TSS removed]
6 Rain
Gardens 199,925 9,996.26 2,940.08 8.89
7 Rain
Gardens 382,663 19,133.16 1,755.34 6.37
8 Rain
Gardens 216,188 10,809.40 1,801.57 6.57
9 Rain
Gardens 434,233 21,711.66 2,171.17 7.52
11 Rain
Gardens 249,274 12,463.71 10,386.42 39.69
12 Rain
Gardens 353,976 17,698.82 572.78 2.59
9 Infiltration
Basin 312,084 15,604.21 2,298.53# 8.15#
12 Infiltration
Vault 1,132,500 856 1,737.52# 6.36#
Cost efficiency does not include annual O&M * Based upon a 20 Year Life Span # Cost effectiveness includes annual O&M with 5% interest With SHSAM, an additional Stormceptor sump was modeled in parallel to the pre-existing sump in an attempt to analyze the increase in TSS and TP removal with an addition sump at the same location. Removal efficiency was shown to increase 4-6% when an additional sump was added in parallel. Using information provided by Bob Fossum (Fossum, 2014) the ratio of TP (lbs) to TSS (lbs) is 9:23,000; this ratio relates directly to sumps. Table 6 presents the costs associated with the various Stormceptor models as well as its TSS/TP removal and cost effectiveness, based upon a 20 year lifespan with a 5% interest on annual O&M. Depending on the Stormceptor currently on site, when a second identical stormceptor is place in parallel the cost of removal per lb TSS ranges from $1.19 to $2.49; while the cost of removal per lbs phosphorus ranges from $3097 to $6395.

Table 6: TSS removal efficiency increase with two Stormceptors Sumps in Parallel
Model Unit Cost
($)
** Installation Costs ($)
* Annual Cleaning Costs ($)
Average Increase in Load
Removal Efficiency
(%)
Average Increase
in lbs TSS
Removed per year
Cost($) Per lbs of
TSS Removed
Average Increase in lbs P
Removed per year
Cost ($) Per lbs of
P Removed
450 7600.00 2279.70 400 3.9 624 1.19 0.24 3096.60 900 9323.44 2797.03 400 4.3 676 1.27 0.26 3289.32
1200 11093.26 3327.98 400 4.6 722 1.34 0.28 3465.22 1800 15041.32 4512.40 400 5.1 800 1.53 0.31 3957.70 2400 17219.56 5165.87 400 5.3 836 1.64 0.33 4146.88 3600 23391.24 7017.37 400 5.8 906 1.95 0.35 5056.09 4800 27339.30 8201.79 400 6 940 2.16 0.37 5476.36 6000 31423.50 9427.05 400 6.1 965 2.37 0.38 6030.86 7200 33556.00 10066.91 400 6.2 977 2.49 0.38 6395.65
*Mean Annual Cleaning costs (Osterhues, 2014) **Installation costs are from Romah (2003)
In summary, the cost effectiveness of each additional practice is shown in Table 7.
Table 7-Additional SCMs Results Summary Table
SCM Practice SCM location/ type/ schedule
*Cost efficiency [$/ lb. of TP
removed]
*Cost efficiency [ $/ lb of TSS
removed]
Rain Gardens 6 2,940.08 8.89
Rain Gardens 7 1,755.34 6.37
Rain Gardens 8 1,801.57 6.57
Rain Gardens 9 2,171.17 7.52
Rain Gardens 11 10,386.42 39.69
Rain Gardens 12 572.78 2.59
Infiltration Basin 9 2,298.53# 8.15#
Infiltration Vault 12 1,737.52# 6.36#
Stormceptor (Model 450) 3 3096.60# 1.19#
Street Sweeping Apr/ May/ Oct/ Nov 57.82 -
Cost efficiency does not include annual O&M * Based upon a 20 Year Life Span # Cost effectiveness includes annual O&M with 5% interest

Discussion
The purpose of this study is to provide more information about SCM cost-efficiencies for the UEC drainage area. Assumptions about SCMs dimensions and infiltration rates can cause the P8 to deviate significantly from real-world conditions. Likewise, the cost-analysis used by the UEC group is centered around cost equations which have inherent assumptions about SCM dimensions and performances as well. One potential source of cost error not included in this report would be the need for the city to acquire SCM easement on non-city property. City property or right-of-way data was not available to the study group during the project. Any costs necessary for acquisition of easement or access was purposely left out of the cost analysis. The results presented in this report are merely for further information for the City to use when looking at SCM implementation in the UEC drainage area. Per the request of the City, the UEC group did not report any information on potential flooding or sustainability. With the many SCMs already in place, it may be more cost effective to place additional SCMs in other subwatersheds. In the UEC group’s study it was found that the current SCMs already remove significant amounts of TP and TSS. The presence of existing SCMs may drastically change the cost effectiveness of potential additional SCMs. As such, it may be more cost effective to implement additional SCMs in areas with fewer pre-existing devices already in place. Conclusions A more accurate representation of the UEC subwatershed and baseline P8 model could be obtained by greater knowledge on the dimensions of the SCMs in place. Using the information provided, rain gardens are an attractive and generally cost-efficient way to reduce nutrient loading within the UEC drainage when they are placed downstream in the UEC subwatershed where they can treat larger quantities of run-off. The least invasive of the SCM practices studied in this analysis was the increased frequency of street sweeping. This practice also has the most efficient removal of phosphorous. Though the initial cost of a new street sweeper is relatively high, costs might be reduced if the City of North St. Paul was able to partner with surrounding Cities. Rain gardens with locations “downstream” and near lots of impervious area will generally be more efficient than those either near open space and/or up-gradient within the drainage area. If the pre-existing sump is a small Stormceptor, it may be beneficial to explore an additional sump placed in parallel with the original Stormceptor. If the pre-existing sump is large enough that it already reaches a maximum removal efficiency based on cost, it would not be feasible to add another sump. In regards to comparing the modeling of the rain garden and the infiltration basin located in the park of drainage area 9, the results showed the rain gardens to be a slightly more cost effective in phosphorus and TSS removal. However, the infiltration basin would allow more of the existing recreational uses of the park compared to the rain garden.

Additionally, an infiltration vault can be rather expensive to implement and with construction cost ranging in the millions. However, the infiltration vault was also shown to remove the most TP and TSS per year. If possible to synchronize the construction of an infiltration vault with road construction, then the cost effectiveness of this practice would increase dramatically because the road grade is being removed anyway. An infiltration vault could also be plausible if right-of-way/ access agreements or surface SCMs are hard to obtain. By placing an infiltration vault underneath a roadway, the city would have the necessary right-of-way to proceed while placing residential rain gardens could involve complications in right-of-way. In summary, creating a more balanced and timed sweeping route of 4 times per year (April, May, October and November) with a regenerative air sweeper would provide the most cost effective TP removal. Additionally, if the City would like to implement SCM devices in the UEC placing them downstream closer to the Urban Ecology Center, this can be best achieved by the use of rain gardens due to their lack of invasiveness on the community. Finally, if there is any road construction being done downstream in the UEC it would be wise to consider an infiltration vault. References Baker, Lawrence. Street Sweeping Planning Calculator. Computer software. Planning to
Reduce Nutrient Loading through Street Sweeping. University of Minnesota, 2013. Web. 10 Apr. 2014.
Dawley, Morgan. "RE: RCP Student Question on Street Sweeping." Message to
Alexandra Miller. 11 Apr. 2014. E-mail. Fossum, Bob. "Quantifying Gross Solids and Phosphorus Loads Captured by
Stormwater BMP Pretreatment Devices." Information provided to CE 5551. University of Minnesota, Minneapolis. 1 Apr. 2014. Powerpoint.
"Improving Services Statewide through the Coordinated, Affordable, Reliable and
Effective Use of GIS." MnGeo: Minnesota Geospatial Information Office. N.p., n.d. Web. 16 May 2014. <http://www.mngeo.state.mn.us/>
Minnesota Stormwater Steering Committee. "Minnesota Stormwater Manual."
Minnesota Pollution Control Agency, n.d. Web. 4 Feb 2014. Mohesni, Aydin. SHSAM. Computer software. Version 6.60.5.0, Barr Engineering 2013 "National Land Cover Database." Multi-Resolution Land Characteristics Consortium
(MRLC). N.p., n.d. Web. 16 May 2014. <http://www.mrlc.gov/>. Romah, Marie. Evaluation of Proprietary Stormwater Treatment Devices in Field and
Laboratory Conditions. Thesis. University of Central Florida, 2003. Print.

Stormceptor® Corporation. 1996. Product Literature. "Stormwater Best Management Practices in an Ultra-Urban Setting: Selection and
Monitoring." Environmental Review Toolkit. US Department of Transportation, n.d. Web. 30 Apr. 2014.
Weiss, P.T., Gulliver, J.S., Erickson, A.J. 2007. Cost and pollutant removal of storm-
water treatment practices. Journal of Water Resources Planning and Management, 133(3):218-229.
Walker W.W., P8 Urban Catchment Model. Computer Software. Version 3.4, Program,
US EPA, 06/20/2013