Embed Size (px)
Citation preview
Copyright Castalia Limited. All rights reserved. Castalia is not liable for any loss caused by reliance on this document. Castalia is a part of the worldwide Castalia Advisory Group.
Urban Infrastructure for Southern Mongolia-Background Study
Final Report
Report to the World Bank
December 2008

Table of Contents Executive Summary i
1 Introduction 1
1.1 What Is the Purpose of This Paper? 1
1.2 What Is the Structure of This Paper? 3
2 Existing Projections of Population and Plans for Infrastructure Development in South Gobi 4
2.1 What are Government Projections and Plans? 4
2.2 What are Mining Companies’ Projections and Plans? 14
3 Lessons from International Mining Experience 19
3.1 What Problems does Influx Cause? 24
3.2 How to Predict Influx? 29
3.3 How to Avoid the Problems Caused by Influx? 38
3.4 What are the Social Advantages and Disadvantages of Each Recruitment and Settlement Model? 43
3.5 How can Governments Maximize the Economic Benefits from Mining Activities? 46
4 Influx Scenarios and Infrastructure Needs in South Gobi 52
4.1 What Range of Influx Scenarios is Likely? 52
4.2 How Much Infrastructure Is Needed and What Will It Cost? 58
5 Options for Meeting Infrastructure Needs in South Gobi 63
5.1 Who Can Plan and Control the Infrastructure Assets? 64
5.2 Who Can Fund and Finance the Infrastructure? 66
5.3 Who Can Design, Build and Operate the Infrastructure? 69
6 Choosing the Right Option for Infrastructure Provision 72
6.1 What Are the Tradeoffs between Options for Providing Infrastructure Services? 72
6.2 How Can Mongolia Minimize the Tradeoffs? One Possible Approach 78
6.3 What Are the Next Steps? 82
Appendices Appendix A : International Cases 83
Appendix B : Zouerate In-Depth Case Study 97
Appendix C : User’s Guide for Castalia Infrastructure Costing Model 112
Tables Table 1.1: Categories of Populations Used in This Paper 2
Table 2.1: Local Infrastructure Capacity Requirements—Engineering Geodesy Study 9
Table 2.2: Local Infrastructure Capacity Requirements—New Town Co. Ltd. Study 10
Table 2.3: Infrastructure Requirements for Town of 10,000 at Tavan Tolgoi 11
Table 2.4: Infrastructure Needs in Khanbogd by 2020 16
Table 3.1: Summary of Lessons Learned from International Mining Cases22
Table 3.2: Influx in the Mining Cases Studied 31
Table 3.3: Comparison of Typical Models for Mining Recruitment and Settlement 32
Table 3.4: Influx and Remoteness in the Mining Cases Studied 37
Table 3.5: Influx and GDP per Capita in the Mining Cases Studied 37
Table 4.1: Physical Infrastructure Needs and Costs of Buildings 59
Table 4.2: Physical Infrastructure Needs and Costs of Water Supply 59
Table 4.3: Physical Infrastructure Needs and Costs of Sanitation 60
Table 4.4: Physical Infrastructure Needs and Costs of Electricity 60
Table 4.5: Physical Infrastructure Needs and Costs of Heating 60
Table 4.6: Physical Infrastructure Needs and Costs of Roads 61
Table 4.7: Physical Infrastructure Needs and Costs of Solid Waste 61
Table 5.1: Choosing Who Plans and Controls the Infrastructure Assets 65
Table 5.2: Choosing Who Finances Infrastructure 68
Table 5.3: Choosing Who Designs, Builds and Operates Infrastructure 70
Table 6.1: Who Should Provide Infrastructure Services in South Gobi? 73
Table 6.2: Which Organizations Are Best at Which Functions? 76
Table 6.3: Summary of Mining Operations Reviewed for This Paper 84

Table 6.4: Mining Companies’ Infrastructure Investments in Mining Cases Studied 92
Table 6.5: Recruitment Percentage Breakdown in Mining Cases Studied 95
Table 6.6: Iron Ore Production and Export 1963 to 1973 98
Table 6.7: Ethnic Background of MIFERMA Employees in 1970 99
Table 6.8: Population Growth in Zouerate Compared to National and Regional Growth 102
Figures Figure 2.1: Map of South Gobi, Mine Sites and Soum Locations 5
Figure 2.2: MoCUD Consultants’ Population Forecast for South Gobi – Scenario 1 7
Figure 2.3: MoCUD Consultants’ Population Forecast for South Gobi – Scenario 2 7
Figure 2.4: Government Ministries’ Infrastructure Plans for the Transport Sector 12
Figure 2.5: Government Ministries’ Infrastructure Plans for the Power Sector 13
Figure 2.6: Mining Company Population Growth Scenarios in Khanbogd 15
Figure 2.7: Camp accommodations at Nariin Sukhait 18
Figure 3.1: Geographic Location of Mining Operations Reviewed in This Paper 21
Figure 3.2: Photo of a Street in Parauapebas, Brazil 25
Figure 3.3: Informal Settlements in Limpopo Province, South Africa 26
Figure 4.1: Taktics4 Predictions for Population Growth in Khanbogd 53
Figure 4.2: Khanbogd Influx with MoCUD Population Growth Assumptions 54
Figure 4.3: Influx Scenario Recommended for Planning Purposes in Khanbogd 55
Figure 4.4: Population Growth in Galbyn Gobi Micro-Region Attributable to Oyu Tolgoi 57
Figure 5.1: When Is Financing Necessary? 67
Figure 6.1: Infrastructure Council for South Gobi 81
Figure 6.2: Nouadhibou to Zouerate Railway 98
Figure 6.3: Zouerate in the 1960’s 100
Figure 6.4: SNIM Shareholders as at 2005 102
Figure 6.5: Zouerate in 2006 103
Figure 6.6: Anchors Ready to Be Shipped from Zouerate to Nouadhibou 106
Figure 6.7: Tariff Implications in the Water Sector 113
Figure 6.8: Calculated Costs for Investments in the Electricity Sector 114
Figure 6.9: How to Make Changes to Input Assumptions 116
Boxes Box 3.1: Gated Community: The Núcleo Urbano de Carajás and
Parauapebas, Brazil 27
Box 3.3: Housing Shortages in Limpopo Province, South Africa 28
Box 3.3: Mineral Industry Booms and Housing Prices 29
Box 3.4: The Inti Raymi Foundation 39
Box 3.5: Yanacocha Association and Yanacocha Women’s Association 40
Box 3.5: Lihir Islands’ Village Development Scheme, Papua New Guinea 41
Box 3.6: QMM’s Community Relations Program 42
Box 3.7: KMCL’s Social Development Program 42
Box 6.1: The Pilbara Development Commission 79
Box 6.1: Infrastructure Service Provision with PPPs in Subic Bay 80
i
Executive Summary What is the context for this work?
The economic opportunities created by large new mines in Mongolia’s South Gobi region are likely to attract migrants. These migrants will need infrastructure services currently in short supply in South Gobi and the surrounding aimags.
An increase in the demand for infrastructure in South Gobi presents, on the one hand, opportunities for economic growth, and on the other hand, the potential for economic, social and political problems.
What is the purpose of this paper?
The purpose of this paper is to inform the Government’s thinking about the development of population centers around the mines in South Gobi; helping it to make the most of the opportunities for economic growth, while minimizing the potential for economic, social and political problems. More specifically, the World Bank has asked Castalia to:
Review international experience with population influx to mining regions. Throughout this paper, we define “influx” as migrants, other than miners and their families, who come to an area in search of economic opportunities or infrastructure created directly or indirectly by a mining operation
Determine which infrastructure services will be needed to support population influx near the mines in South Gobi aimag, and how much capacity will need to be built
Estimate the cost of the infrastructure needed Identify options for providing the infrastructure the new populations will need, and
help the Government of Mongolia (“the Government”) identify the advantages and disadvantages of each of these options.
Why does influx matter?
Mining offers governments opportunities for improvement in national, regional and local economic welfare and living conditions. However, international experience has shown that towns or settlements near mines are often ill prepared to deal with dramatic population influx. High levels of influx can lead to degradation of living conditions, tensions between locals and migrants, and hardship for migrants whose expectations of economic opportunity fall short. Squalor, degradation and hardship result.
What plans are there to accommodate influx?
The Government of Mongolia has put considerable thought into population growth in South Gobi’s mining areas, and the infrastructure needed to accommodate that growth. Some of the mining companies operating in South Gobi have also developed their own population projections and their own plans for recruiting and housing workers. Unfortunately, the government and mining company plans for soum-level development differ considerably from one another, as do the various ministries’ plans for regional development.
What are Government’s plans to accommodate influx?
A Regional Development Concept (RDC), approved by the Mongolian Parliament in 2001, defines the policy for urban and rural development in Mongolia through 2020.1 The Ministry of Construction and Urban Development (MoCUD) has projected population growth over the next one to two decades, and developed plans for both regional and soum-level communal infrastructure in South Gobi based on the RDC. Several other Government ministries, including MoCUD; the Ministries of Road, Transport and Tourism; Fuel and Energy; and Infrastructure and Trade, have also developed plans for regional infrastructure in South Gobi. Because of the burgeoning mining industry in South Gobi, the Government also
1 Parliament Resolution No. 57.
ii
developed a more specific plan for what it calls the Galbyn Gobi micro-region. The Galbyn Gobi micro-region is defined as the area to be directly affected by mines at Tsagaansuvraga, Oyu Tolgoi and Tavan Tolgoi. MoCUD’s consultants have predicted that the population of micro-region, which is now 10,500, will grow to roughly 120,000 by 2020. Consultants to MoCUD have outlined two possible plans for developing infrastructure in the micro-region. One plan, envisions development dispersed throughout five soums in the micro-region. A second plan would create two new towns, one located between the Tavan Tolgoi and Oyu Tolgoi mine sites, and another located near the Tsaagansuvraga mining area. In addition to these soum-level plans, a number of ministries have developed plans for large-scale regional infrastructure investments in roads, rail, electricity, and water supply to serve the mines and the soums in the micro-region.
What are mining companies plans to accommodate influx?
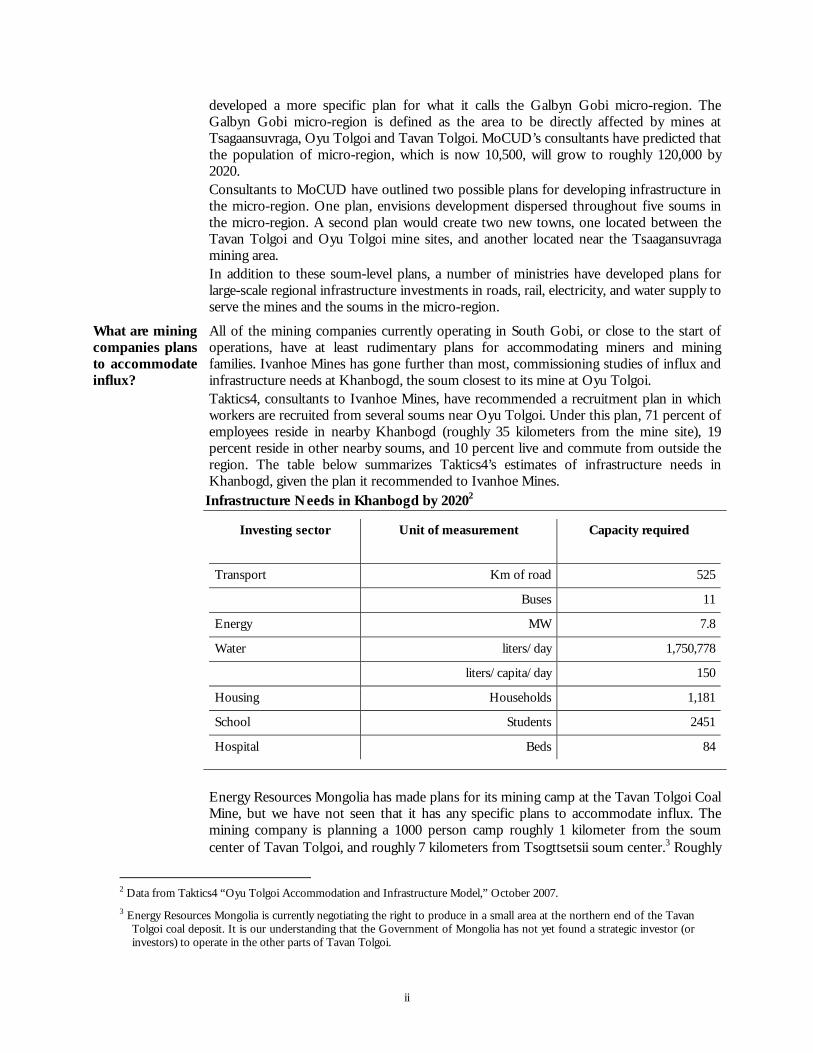
All of the mining companies currently operating in South Gobi, or close to the start of operations, have at least rudimentary plans for accommodating miners and mining families. Ivanhoe Mines has gone further than most, commissioning studies of influx and infrastructure needs at Khanbogd, the soum closest to its mine at Oyu Tolgoi. Taktics4, consultants to Ivanhoe Mines, have recommended a recruitment plan in which workers are recruited from several soums near Oyu Tolgoi. Under this plan, 71 percent of employees reside in nearby Khanbogd (roughly 35 kilometers from the mine site), 19 percent reside in other nearby soums, and 10 percent live and commute from outside the region. The table below summarizes Taktics4’s estimates of infrastructure needs in Khanbogd, given the plan it recommended to Ivanhoe Mines.
Infrastructure Needs in Khanbogd by 20202
Investing sector Unit of measurement Capacity required
Transport Km of road 525
Buses 11
Energy MW 7.8
Water liters/day 1,750,778
liters/capita/day 150
Housing Households 1,181
School Students 2451
Hospital Beds 84
Energy Resources Mongolia has made plans for its mining camp at the Tavan Tolgoi Coal Mine, but we have not seen that it has any specific plans to accommodate influx. The mining company is planning a 1000 person camp roughly 1 kilometer from the soum center of Tavan Tolgoi, and roughly 7 kilometers from Tsogttsetsii soum center.3 Roughly
2 Data from Taktics4 “Oyu Tolgoi Accommodation and Infrastructure Model,” October 2007. 3 Energy Resources Mongolia is currently negotiating the right to produce in a small area at the northern end of the Tavan
Tolgoi coal deposit. It is our understanding that the Government of Mongolia has not yet found a strategic investor (or investors) to operate in the other parts of Tavan Tolgoi.
iii
500 to 600 workers will fly-in, fly out from the camp, and be housed in pre-fabricated, dormitory style housing. The prefabricated housing will have 24-hour electricity and water supply, heating, air conditioning, and indoor sewerage. Another 500 workers (predominantly drivers) will live permanently in gers next to the prefabricated housing, but within the camp gates.
South Gobi Sands owns two coal mines at the Ovoot-Tolgoi mine site in South Gobi Aimag. The company began operations in April 2008. South Gobi Sands currently has a mining camp with ger accommodations for 180 workers. Roughly 40 to 50 workers are bused in and out from the nearby soum of Gurvan Tes every two weeks. All other workers are flown in and out from Ulaanbaatar. South Gobi sands is planning a 3-story hotel to replace the gers in 2009. The hotel will accommodate 196 workers.
Mongolian Alt Corporation (MAK) owns and operates two mining operations at the Nariin Sukhait coal deposit, near Ovoot-Tolgoi. Currently, all workers are accommodated in camps at the mine sites. The two camps, located 7-8 km apart, consist of sandwich block houses with hot water, heating, electricity and indoor sanitary facilities. Each camp also contains a mine office building, laboratory, garage, repair shop, and fuel station.
International experience offers five lessons …
International mining experience indicates five lessons for development of mining areas in Southern Mongolia. The lessons come from a review of more than 20 examples of mining experience in North and South America, Africa, and Australasia.
1. Influx can cause problems
Influx can cause degradation of living conditions, tensions between locals and migrants, and hardship for migrants whose expectations of economic opportunity fall short. Problems result, in particular, when: People move to areas near mines in hope of work, but find none. These migrants
then often live in harsh climates with no work and no services. This was the case for many migrants who moved to the Vila de Parauapebas near Brazil’s Carajas Iron Ore Complex. Parauapebas was planned primarily to accommodate suppliers to the mine and to the mine workers and their families living in a nearby gated town. The mining company spent US$3 million in infrastructure in Parauapebas, but the investment was not enough to keep up with massive number of migrants that came in search of jobs
Money is provided for infrastructure services, but failures in planning, management, and operations prevent the local community from benefiting. For example, in Limpopo, South Africa, the mining company, Anglo Platinum, offered the majority of its workers a “living out allowance”. Because of a severe housing shortage, many workers ended up in informal dwellings without water, electricity, or sewerage service
Mines close down, leaving communities with little to no economic support. For example, when Gecamines, a Congolese state-owned mining company, drastically scaled back its operations in the late 1990s, the mining company was forced to shut down all the infrastructure services it provided to the surrounding community including schools, hospitals, clinics and worker housing.
2. Influx is hard to predict, but recruitment and settlement strategies matter
The mining cases we reviewed show a wide range of influx, and offer little explanation of what causes it. We considered a range of factors as possible causes of influx, but only recruitment and settlement models—the way in which workers are recruited and accommodated by the mining companies—appear to have an impact on influx. Influx is generally lower when the Fly-in, fly-out (FIFO) or Bus-in, bus-out (BIBO) recruitment and settlement models are used rather than other models. The four main models for recruitment and settlement are:
iv
Company town. In the company town model, a mining company builds and operates an entire town, outside the mine gate. The mining company builds and operates all basic infrastructure necessary to accommodate miners and their families, and may also build and operate recreation and leisure facilities (for example, restaurants, retail shops, community centers, hotels, and movie theaters). In building the company town, mining companies also generally plan to accommodate the supplier and contract population, the service population, and possibly some of the existing population. Recruitment strategies in the company town model vary considerably from case to case. The recruitment of miners may be from local areas or may be from distant areas
Fly-in, fly-out (FIFO). In the fly-in, fly out model, workers and their families live in regions, often metropolitan areas, located far away from the site of mining operations. Typically, workers commute to the mining site on a “14-days on/7-days off” rotation or “9 days on/5 days off” rotation. In this model, there is no recruitment from, and no infrastructure development in local communities. The mining company builds a mining camp, inside the mine gate, with enough infrastructure for mine employees only. A variation on the FIFO model is the bus-in, bus-out (BIBO) model used where commuting distances allow for it, or airstrips are not available
Integrated community. In the integrated community model workers and their families live within existing communities located near the mine. The mining company contributes to infrastructure development in these communities in varying degrees. If the mining company does provide some infrastructure, non-miners are typically not excluded from that infrastructure. Workers are often recruited locally under this model, but may also be recruited from elsewhere, and required to relocate to the existing towns around the mine
Gated community. In the gated community model, workers and their families are housed in a new neighborhood bordering on, or within an existing local community. The gated community is outside the mine gate, and has most infrastructure necessary to support miners their families. The mining company may make use of some existing infrastructure, such as roads or electricity connections, to provide service to the gated community, and may expect that, for leisure and entertainment, workers will leave the gated community. Workers may be hired locally, from elsewhere within the country, or from abroad.
3. Coordination between governments, local communities, and mining companies can avoid problems caused by influx
Governments and mining companies can reduce the problems caused by influx through coordination and planning. Mining experience in Paraupebas and Limpopo (described above) stand out as examples of how governments and mining companies failed to accommodate the infrastructure needs of local populations. In Parauapebas, infrastructure was planned to accommodate miners, but not influx. In Limpopo, cash was made available to accommodate workers, but without regard to the capacity of the market to deliver affordable housing. Miners and non-miners were therefore left without proper infrastructure. Experiences at several mining areas throughout the world offer better examples of how the needs of local populations can be accommodated. Mining areas in Peru, Bolivia, Papua New Guinea, Madagascar, and Tanzania offer examples of how local development programs or foundations were established to let mining companies, local governments, and donors to pool funds and jointly manage the expenditure of funds for infrastructure. For example: The Inti Raymi foundation was created in 1991, as a private, nonprofit institution
designed to fund social programs for communities near the Inti Raymi Mining Company’s Kori Kollo gold mine in Bolivia. The foundation has three major focus areas: health care, rural education, and training. The foundation has 58 fulltime
v
employees and its own board of directors. It receives contributions of US$840,000 annually from the Inti Raymi Mining Company, and donations from other domestic and foreign sources
The Yanacocha Mining Company established two associations to help with regional economic development near its gold and silver mine in Cajamarca, Peru. The Yanacocha Association and a separate association, the Yanacocha Women’s Association, provide assistance in the areas of health, nutrition and education. In infrastructure, the associations have provided expanded drinking water systems, education, and health services, and rural highway renovations
To contribute to the economic development of the areas near their Bulyanhulu gold and copper mine in Tanzania, the Kahama Mining Corporation (KMCL) created a Social Development Program (SDP). The SDP consists of four focus areas: Education, health, housing, and water. The SDP was formed and managed by committees that included representation from NGOs, members of the local population, the district council, and donors. The committees helped ensure that KMCL focus on areas where local government did not have the resources to tackle a problem. In areas where the government and local organizations did have sufficient resources, KCML provided technical advice, funding and training. NGOs assisted in project management, supervised the facilities in each focus area, and provided education and training. The District Council, Village Government, and local communities had responsibility for providing construction materials, labor, logistical support, and land use plans.
4. Each recruitment and settlement model has advantages and disadvantages
Mining operations have both positive and negative social impacts. We found that social impacts differ depending on how workers are recruited and accommodated, and we therefore group the advantages and disadvantages by the recruitment and settlement models introduced earlier. The positive and negative social impacts of each recruitment and settlement model are as follows: Company Towns. Company towns show positive and negative social impacts.
Positive social impacts of the company town are the health benefits of the family-centered style of accommodations. Negative social impacts come from the town’s dependence on the mining company for employment and economic activity. When mines close, families must often move in order to find employment opportunities elsewhere. Few alternative employment opportunities typically exist due to the remoteness of many mining operations, and where such opportunities do exist, mine workers may not have transferable skills
FIFO. FIFO has a positive social impact in that it allows workers some flexibility to choose where they live. Miners’ families also therefore have more flexibility in choosing which jobs to take, and what social infrastructure to live near (for example, schools and hospitals). The only requirement is that they be able to reach the airport from which they are flown to the mine site. FIFO also has a limited cultural, environmental, or economic impact on local areas, because the increase in the mining population is limited to mine workers, and is kept within the mine gate. FIFO’s negative social impacts may include an increase in family dysfunction and parenting problems as a result of workers’ prolonged separation from their families. FIFO also provides no direct jobs or infrastructure near the mine site. This may cause tensions with local populations who feel they should benefit from the mine’s presence
Gated Community. The positive social impacts of the gated community model include the health benefits of workers living with their families, and the more limited cultural, environmental, and economic impact on local areas than under the company town model. Negative social impacts stem from possible social tensions between the mining population and existing population
vi
Integrated Community. Positive social impacts of the integrated community model include the fact that workers can live with their families, and the fact that existing populations around the mine stand to benefit from infrastructure and jobs created by the mine. Negative impacts include the risk of social tensions because of cultural differences or income disparities between the mine workers and existing population.
5. Governments can maximize value from mining by…
A government’s objectives are, generally speaking, to maximize economic welfare for the country. A government can maximize the benefits from mining activity by: Recognizing what motivates mining companies, and how this motivation affects the
decisions mining companies make Having its own clear vision of the tradeoffs between the fiscal benefits (government
revenue from mining activity), and external social benefits (improved welfare for the country as a whole) of mining activity.
…recognizing what motivates mining companies, and…
Private mining companies will generally choose the recruitment and settlement model that promises to earn the most revenue at lowest cost, thereby maximizing profits. Revenues, in a commodity business like mining, where mining companies are generally price takers, depend primarily on volumes extracted. Maximizing profits in the mining business is therefore focused on minimizing costs for any volume extracted. The financial impact on a mining company of each of the recruitment and settlement models are as follows: Company Town. The cost to the mining company of building a company town is
usually higher than the cost to the mining company of other recruitment and settlement models, because of the high levels of capital expenditure required
FIFO. Mining companies see the FIFO model as a better alternative to the company town model because upfront capital expenditures on physical infrastructure are lower. FIFO also allows the mining companies to draw from a larger labor pool.
Gated Community. The gated community model requires more upfront infrastructure investment than FIFO, because the gated community must support workers and their families living near the mine on a permanent basis. The upfront capital costs of the gated community model are therefore likely to be higher than in the FIFO model, but lower than in the company town model
Integrated Community. The integrated community model generally requires less capital expenditure than the company town and gated communities’ models. The financial implications for the mining companies vary depending on how much the companies spend on infrastructure or social services in the communities near the mine. This in turn depends on what infrastructure already exists to support workers, and what additional infrastructure the mining company feels it needs to build in order to comply with its social license to operate.
…understanding the tradeoffs between cash and non-cash benefits.
A government’s primary goal in granting a mining concession should be to maximize the value to the country as a result of mining. Generally, governments receive this value from a mining operation as: Cash, through taxes on the mining companies’ operations or royalties from the mine Other external benefits (net of external costs) that add to national welfare, but are
difficult to measure and accrue to the population. For example, training provided by mine companies may lift the skill level of the community as a whole over time, or employment provided in service industries may offer attractive jobs in areas that currently have little formal employment
Governments can increase the cash they receive through negotiations with mining companies, or by holding open competitions for mineral resources and awarding concessions to the highest bidders. However, mines can only yield as much value as their product can be sold for. Because of this, there will be tradeoffs between governments’
vii
goal to maximize cash income from mining, and its desire to have mining companies spend money on other things like infrastructure or training. The recruitment and settlement model chosen therefore affects how much cash mining companies are able to pay. To the extent that mining companies are forced to spend money building infrastructure, they will have less available to pay in taxes and royalties. An example of the tradeoffs between cash payments and infrastructure provision can be seen in Bolivia, where the country’s Mining Code permits companies to invest in community infrastructure and to offset this against tax liabilities.
What range of influx scenarios is most likely in Southern Mongolia?
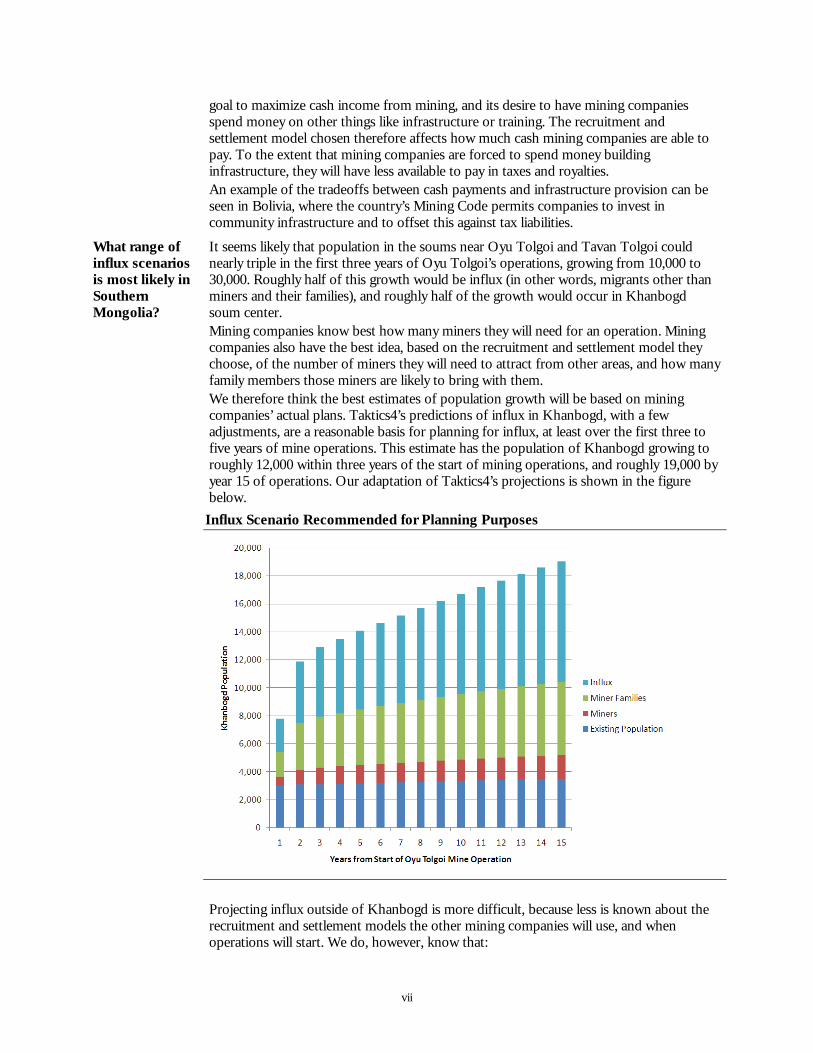
It seems likely that population in the soums near Oyu Tolgoi and Tavan Tolgoi could nearly triple in the first three years of Oyu Tolgoi’s operations, growing from 10,000 to 30,000. Roughly half of this growth would be influx (in other words, migrants other than miners and their families), and roughly half of the growth would occur in Khanbogd soum center. Mining companies know best how many miners they will need for an operation. Mining companies also have the best idea, based on the recruitment and settlement model they choose, of the number of miners they will need to attract from other areas, and how many family members those miners are likely to bring with them. We therefore think the best estimates of population growth will be based on mining companies’ actual plans. Taktics4’s predictions of influx in Khanbogd, with a few adjustments, are a reasonable basis for planning for influx, at least over the first three to five years of mine operations. This estimate has the population of Khanbogd growing to roughly 12,000 within three years of the start of mining operations, and roughly 19,000 by year 15 of operations. Our adaptation of Taktics4’s projections is shown in the figure below.
Influx Scenario Recommended for Planning Purposes
Projecting influx outside of Khanbogd is more difficult, because less is known about the recruitment and settlement models the other mining companies will use, and when operations will start. We do, however, know that:
viii
Under the recruitment and settlement model recommended by Taktics4, there will be roughly 1,500 to 2,000 more miners and their families settled in soums outside of Khanbogd. If we assume the same level of influx in the other soums where Oyu Tolgoi’s miners will live, South Gobi’s population will grow by nearly 50 percent within the first five years of operations, from 45,000 to 65,000-70,000
Energy Resources plans to have roughly 500 workers (including drivers) initially housed in a mining camp 1 kilometer from Tsogttsetsii. Because the FIFO model is used at Tavan Tolgoi, international experience suggests little influx will occur. Energy Resources has considered, however, evolving its mining camp into a gated or integrated community model, in which case influx would be much higher. If Energy Resources does indeed move to an gated community or integrated community model, influx could be as high as in Khanbogd. This means that for Energy Resources’ 500 workers, there would be 1,100 family members and 2,100 migrants, for a total of 4,200 in new population
South Gobi Sands has roughly 200 workers, housed in a mining camp at Ovut Tolgoi. South Gobi Sands also uses BIBO to a limited extent, bussing in roughly 50 workers from nearby Gurvan Tes. If we assume the same level of influx at Gurvan Tes as in Khanbogd, but associated only with the workers housed in Gurvan Tes, we can expect the non-mining population to grow by another 210 within the next couple of years.
These growth figures together point—albeit roughly—to an increase in population in South Gobi of at least 20,000 to 25,000 within just a few years.
How to plan for the influx?
We recommend the Government plan to accommodate influx in South Gobi in phases. We recommend the government plan for a medium influx growth scenario in South Gobi that: Looks ahead 3 to 5 years only, and reassesses every year, so as to:
Avoid having too much infrastructure built. If the rate of influx is lower than predicted, infrastructure plans can be scaled back and the infrastructure built can be used to serve the still growing population of miners and their families during the first 10 years of mining operations
Avoid having too little infrastructure built. If the rate of influx is higher than predicted, the infrastructure gap is not so large that it is no longer possible to catch-up to the population’s infrastructure needs within a few years.
Focuses only on those mines where recruitment and accommodation plans are known, and therefore: The size of the mining population is known Predictions of influx can be made based on international experience with different
recruitment and settlement models. In Khanbogd, this means planning for a population of roughly 12,000 within three years of the start of mining operations. This would ensure that infrastructure keeps up with the medium population growth scenario, but if influx appears to be much lower during three years of mining operations, building plans can be slowed or halted without creating too much spare capacity. If influx continues to be low, the infrastructure built in years one to three will still be needed to serve the existing population, the miners and their families. Even with no influx, the existing population and the mining population will reach roughly 8,000 by year three, and nearly 10,000 by year 10. Most infrastructure assets built in years one to three should continue to be useful through year 10. The infrastructure built in year 3 could therefore be used to serve the growing population of miners and their families through year 10. For South Gobi as a whole, this means planning to accommodate a population of roughly 25,000 to 30,000 in the Galbyn Gobi micro-region within the first three to five years of

ix
Oyu Tolgoi’s operations. If influx is slower than predicted, the Government can readjust its plans after year three, without stranding too much capacity. The mining and existing populations in the micro-region will exceed 20,000 by year 15 of operations, without any influx, and without the start of operations at the Tavan Tolgoi sites still lacking a strategic investor.
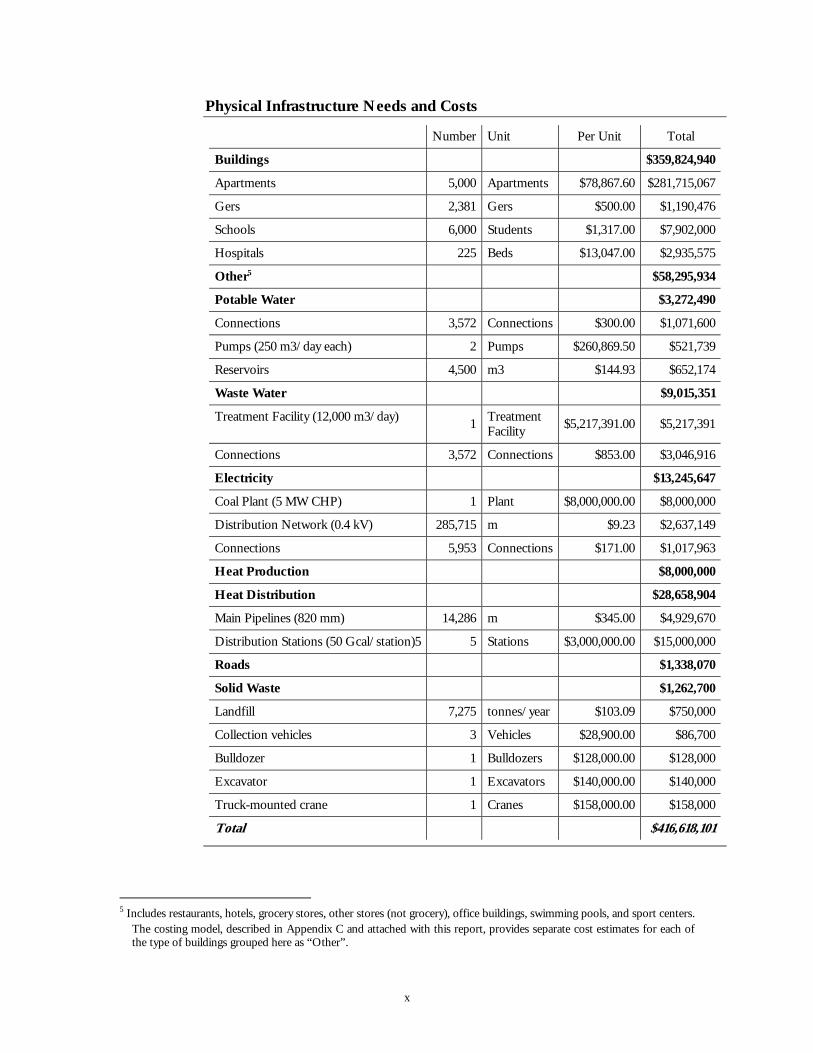
How much infrastructure is needed and what will it cost?
If, as we have suggested could happen, the population of the Galbyn Gobi micro-region grows to 25,000 by year three of mining operations, we expect the soums in the micro-region to need roughly US$417 million in building and infrastructure investment.4 Of this total, we expect the soums in the micro-region will need: Roughly US$360 million in investments in housing, commercial and public buildings Roughly US$57 million in investments in public services, namely, electricity, water,
wastewater, heating, roads, and solid waste. The table below shows the results of the model Castalia used to estimate infrastructure needs and infrastructure costs, assuming a population of 25,000 in which 60 percent of the families live in apartments, and 40 percent live in gers.
4 Throughout this paper, we use the term infrastructure broadly to include: utility services (water, wastewater, heating, and
electricity), solid waste, housing, public administration buildings, and social infrastructure (hospitals and schools).
x
Physical Infrastructure Needs and Costs
Number Unit Per Unit Total
Buildings $359,824,940
Apartments 5,000 Apartments $78,867.60 $281,715,067
Gers 2,381 Gers $500.00 $1,190,476
Schools 6,000 Students $1,317.00 $7,902,000
Hospitals 225 Beds $13,047.00 $2,935,575
Other5 $58,295,934
Potable Water $3,272,490
Connections 3,572 Connections $300.00 $1,071,600
Pumps (250 m3/day each) 2 Pumps $260,869.50 $521,739
Reservoirs 4,500 m3 $144.93 $652,174
Waste Water $9,015,351
Treatment Facility (12,000 m3/day) 1 Treatment Facility $5,217,391.00 $5,217,391
Connections 3,572 Connections $853.00 $3,046,916
Electricity $13,245,647
Coal Plant (5 MW CHP) 1 Plant $8,000,000.00 $8,000,000
Distribution Network (0.4 kV) 285,715 m $9.23 $2,637,149
Connections 5,953 Connections $171.00 $1,017,963
Heat Production $8,000,000
Heat Distribution $28,658,904
Main Pipelines (820 mm) 14,286 m $345.00 $4,929,670
Distribution Stations (50 Gcal/station)5 5 Stations $3,000,000.00 $15,000,000
Roads $1,338,070
Solid Waste $1,262,700
Landfill 7,275 tonnes/year $103.09 $750,000
Collection vehicles 3 Vehicles $28,900.00 $86,700
Bulldozer 1 Bulldozers $128,000.00 $128,000
Excavator 1 Excavators $140,000.00 $140,000
Truck-mounted crane 1 Cranes $158,000.00 $158,000
Total $416,618,101
5 Includes restaurants, hotels, grocery stores, other stores (not grocery), office buildings, swimming pools, and sport centers.
The costing model, described in Appendix C and attached with this report, provides separate cost estimates for each of the type of buildings grouped here as “Other”.
xi
How to meet South Gobi’s infrastructure needs
Providing infrastructure services requires that at least three major functions be fulfilled, namely: Planning and control: Some organization must decide what physical infrastructure is
needed, where it should go, how much capacity is needed, and when that capacity needs to be expanded
Designing, building, operating and maintaining: Some organization must design, build, operate and maintain the physical infrastructure needed to produce and deliver infrastructure services. Once the infrastructure is planned, some organization’s engineers must do a detailed design, some organization must build the infrastructure according to the design
Funding and financing: Someone must pay to have the infrastructure built, and someone must pay for its ongoing operation. Organizations that cannot pay for all of the equipment upfront will have to look for another entity to lend or finance the payments over time.
A single organization may fulfill all of these functions, as happens in the company town model discussed above. Alternatively, the functions may be allocated to multiple organizations. For example, a government may plan and control its roads, but may hire a private sector engineering procurement and construction (EPC) contractor to design and maintain its roads. In Mongolia, the principal organizations that might possibly take responsibility for these different functions include: Government, which may mean
National government Aimag government Soum government
Mining companies A private company, other than the mining company, which may include:
A “specialized private operators”, specialized in delivering infrastructure services A property developer. Mongolia has some recent experience in Ulaanbaatar in which
private property developers build and operate communal services in private housing or apartment complexes.
What are the pros and cons of each institutional option for planning and control?
National governments typically have greater expertise than provincial and local governments, and can best coordinate investments across multiple provinces and soums, and across multiple sectors. This is clearly still the case in Mongolia. Aimag capitals (including Dalanzadgad) rely on national government to run their power plants. The PUSOs, which provide water services in many soums often look to Ulaanbaatar’s Water Supply and Sewerage Authority (USUG) for technical support. On the other hand, national governments are not likely to understand or appreciate the needs of provincial and local populations as well as provincial and local government officials do. National governments are often better at planning and controlling large-scale infrastructure investments than smaller-scale infrastructure investments within provinces, towns and cities. We see evidence of this in Mongolia, where the national government has a lot of plans for transmission lines, roads, and rail lines, but fewer detailed plans for infrastructure within towns near South Gobi’s mines. As shown by our description of the company town recruitment and settlement model, mining companies historically have also played a role in planning and controlling infrastructure. Mining companies, however, may lack the inclination or skills to plan and control infrastructure for towns that include miners as well as non-miners. A government
xii
entity, whether national, provincial, or national, has incentives for planning infrastructure that are better aligned with those of the non-mining populations, and typically has more experience planning infrastructure for towns, and controlling those infrastructure assets. Private property developers have expertise in planning housing complexes, and the infrastructure required to serve those complexes. Private property developers also have a strong business interest in getting infrastructure up and running for their future tenants. Private property developers are not, however, necessarily experts in planning large-scale network infrastructure such as water and wastewater treatment facilities, or heating and electricity production, nor are they required to serve populations that cannot afford, or do not want to live in their apartments or homes.
What are the pros and cons of each institutional option for funding?
We use the term “fund” to mean the same thing as “pay for”. We use the term “fund” as distinct from “finance”. By “finance”, we mean “lend” or “invest in”, with the expectation of receiving ones initial capital expenditure plus a return equal to the time value of money plus some risk premium. If the government or a mining company ‘funds’ all of the infrastructure upfront, there is no need for ‘financing’. The biggest advantage of paying for the entire infrastructure upfront is its simplicity. The biggest disadvantage is that, if the government or the mining company pays upfront, it may not be able or may not be inclined to recover the full costs of service. Governments often have political inclinations to keep tariffs low. Mining companies may similarly feel political or social pressure to keep tariffs low. As a consequence, there may not be enough money coming in to pay to replace the assets when they wear out, or to pay to expand infrastructure to serve new people as the population grows over time.
What are the pros and cons of each institutional option for financing?
Financing, in contrast to funding, means that customers who actually use the infrastructure service pay the full cost of that service over the life of the infrastructure asset. Governments, mining companies or specialized private operators may take out a loan on behalf of customers, but that loan will have to be paid back. The obligation to pay back the loan provides an incentive for the borrower to charge tariffs that reflect the full cost of service, which includes interest costs on the loan. It is often easier and cheaper for national governments to finance infrastructure. National governments often have stronger balance sheets, credit ratings, and better cash flows than provincial or local governments, and can therefore borrow at lower cost. Moreover, a tradition of financing large infrastructure projects from the center, as exists in Mongolia, may make central government financing more attractive because it is easier to understand how it will work. A significant disadvantage of central government financing for infrastructure is that financing typically goes hand in hand with planning and control. As noted above, central governments do not usually know as well as local governments what infrastructure is needed, and how much. Central governments also have many other spending priorities, and limited funds. Mining companies may also finance infrastructure, as in the company town or gated community recruitment and settlement models. Mining companies have strong commercial incentives to finance infrastructure to support their mining operations, and may have easier access to capital. However, mining companies will have less of an incentive to finance infrastructure that is not essential to their operations. The other disadvantages of having a mining companies finance infrastructure is that mining companies are not experts in infrastructure financing, nor will they necessarily have the incentives to minimize a project’s lifetime costs. The higher a project’s lifetime costs, the higher the cost-recovery tariff customers will face, or the higher the subsidy governments will have to pay to help customers afford the tariff.
xiii
Like mining companies and specialized private operators, private property developers will likely have good access to capital, and will be able to move quickly. Private property developers also have a strong incentive to finance the construction of infrastructure so that new owners want to move in. However, private property developers may not have the operational expertise to minimize the lifetime costs of network infrastructure, nor may they have an incentive to minimize those lifetime costs once all of the units are sold.
What are the pros and cons of each institutional option for designing, building, and operating?
In Mongolia, as in many other countries, national governments have more experience designing, building and operating infrastructure than provincial and local governments. National governments, however, are more distant from the customers they are meant to serve, and therefore may not know as well, or care as much as provincial or local governments about what customers want. Mongolia has a tradition of aimag governments providing water, wastewater, solid waste, and in some cases electricity and heating service through PUSOs. Leaving the aimags with responsibility for infrastructure service provision would therefore be a familiar approach, and require few changes to the way in which infrastructure is currently built and operated. The principal disadvantage of having any government entity provide infrastructure services is that governments—whether national, local, or provincial—tend not to be particularly good at running businesses efficiently. Evidence of this in South Gobi can again be seen in the Dalanzadgad’s CHP. Power and heating outages at the plant are common. Only one of the two units at the plant are operational, with operating costs upwards of USD 0.30/kWh, despite the fact that the plant has access to very cheap coal.6 Private companies, unlike most governments, respond well to commercial incentives, and therefore can be given incentives to build and operate infrastructure efficiently. Private mining companies respond well to commercial incentives but designing, building and operating infrastructure for people other than those working in the mine is not part of a mining company’s core business. This means that they are neither particularly motivated nor good at designing, building and operating infrastructure. Mining companies may agree to provide some infrastructure to non-miners, but they will typically seek to limit their responsibility to designing and building, not operating the infrastructure. Private property developers may be good at designing and building infrastructure, but are less likely to specialize in building and operating infrastructure other than housing. Moreover, their interest in providing infrastructure services does not extend to those who cannot afford to be homeowners within their development, or do not want to be. Hiring a specialized private contractor to design, build, and operate infrastructure requires a contract which specifies the infrastructure the private firm must deliver, and the cost of that infrastructure. This contract gives the private firm strong incentives to deliver the infrastructure the government wants, at an agreed price, without offsetting the royalties or taxes the mining company has available to pay. Moreover, a specialized infrastructure operator is just that—a private firm that has made infrastructure service provision the focus of its business activity. The principal disadvantages of hiring a specialized private operator are that procurement is often more time consuming and complicated than traditional government procurement, and there is always a risk that private operators may not be interested, given the terms the government is prepared to offer. In procuring a specialized private operator, government must also be willing to sacrifice some degree of political control of infrastructure, which it may not always be willing to do.
How can the government
We recommend the government use five criteria to determine the best option for providing communal infrastructure in South Gobi’s towns. The best option for providing
6 On a tour of the CHP plan in Dalanzadgad, Castalia was told that coal costs roughly US$20 per metric ton.
xiv
choose the right option?
infrastructure services in any sector will: Provide the infrastructure services people need, at lowest cost Be accountable to the people who use the infrastructure Utilize the best available expertise in building and operating the infrastructure Be simple and low cost to implement Have proven to work well elsewhere in Mongolia and elsewhere in the world.
What are the principal tradeoffs between options?
Each of the institutional options for infrastructure services delivery has tradeoffs. The most important tradeoffs are: The private sector can deliver infrastructure services more efficiently than government
(lower cost for a given level of service quality), and has more expertise in infrastructure service delivery, but procurement of specialized private operators may be more difficult and take longer than traditional government procurement
Mining companies and private property developers often have the capital and expertise to build infrastructure but typically have less expertise than specialized infrastructure operators, fewer incentives to extend infrastructure to non-mining populations, and fewer incentives to operate and maintain that infrastructure
Government is more accountable to its population than private operators, but the private sector can be made accountable to government and customers through PPP contracts
National government has more expertise in infrastructure service provision than provincial (aimag) and soum (local) governments, but is less directly accountable to local populations
There is a tradition of aimags providing infrastructure services to soums in Mongolia through PUSOs, but there is also a new policy to increasingly privatize the PUSOs as a way of improving performance.7
The tradeoffs highlight that different organizations are strongest in different functions. The private sector is best at operating efficiently, while governments are best at ensuring an acceptable level of service is delivered to the right customers at an affordable price. Provincial and local governments know best what infrastructure is needed, and are under the most direct pressure to deliver that infrastructure. The private sector and national government can more easily finance infrastructure than provincial and local governments.
How can Mongolia minimize the tradeoffs?
There are approaches for infrastructure service delivery that harness the strengths of the different organizations who might be involved. The figure below shows an example of an arrangement that could work well in Mongolia. We call this the “infrastructure council” approach. The approach is designed to: Coordinate planning between government and the mining companies, and coordinate
planning between national, aimag, and soum governments Ensure that local, non-mining infrastructure needs are well represented, by including
representation from the soums Be consistent with the geographical realities of mining in South Gobi, and what we
understand to be South Gobi’s Governors’ vision for the economic development of his province
Pool funds available from the IFIs, government, and mining companies for infrastructure investment
Remain consistent with what we understand to be the legal framework for
7 Many of the PUSOs have now signed management contracts with local private operators. Decree 182, passed in 2007,
allows for the privatization of as much as 49 percent of PUSO ownership.
xv
infrastructure service delivery in Mongolia Bring the efficiency of private operators to infrastructure service provision in
Mongolia Draw from international experience with multi-stakeholder mining foundations and
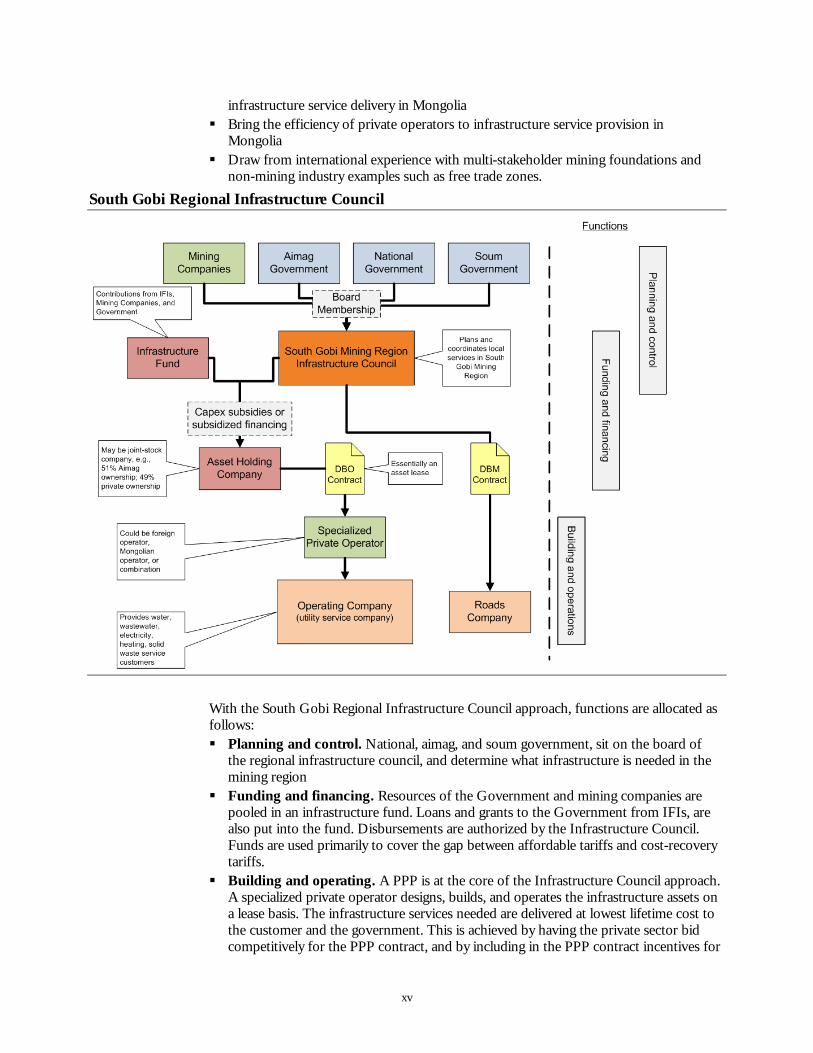
non-mining industry examples such as free trade zones. South Gobi Regional Infrastructure Council
With the South Gobi Regional Infrastructure Council approach, functions are allocated as
follows: Planning and control. National, aimag, and soum government, sit on the board of
the regional infrastructure council, and determine what infrastructure is needed in the mining region
Funding and financing. Resources of the Government and mining companies are pooled in an infrastructure fund. Loans and grants to the Government from IFIs, are also put into the fund. Disbursements are authorized by the Infrastructure Council. Funds are used primarily to cover the gap between affordable tariffs and cost-recovery tariffs.
Building and operating. A PPP is at the core of the Infrastructure Council approach. A specialized private operator designs, builds, and operates the infrastructure assets on a lease basis. The infrastructure services needed are delivered at lowest lifetime cost to the customer and the government. This is achieved by having the private sector bid competitively for the PPP contract, and by including in the PPP contract incentives for
xvi
building and operating the infrastructure as efficiently as possible. The operator collects tariffs, delivers service, and pays the government a fee to cover the capital costs of the asset holding company. Service quality and coverage targets for electricity, water and sanitation, heating, and solid waste, are set in the PPP contract between the government and a private operator.
What are the next steps for Mongolia?
The ability of the government and mining companies to cooperate will make or break the Integrated Community recruitment and settlement model planned for Oyu Tolgoi. Because Oyu Tolgoi appears poised to define much of the development in the region (until strategic investors are identified for the other reserves at Tavan Tolgoi) we recommend the government and mining companies begin immediately to coordinate infrastructure planning. A multi-lateral infrastructure council, like the one we have described above, is a good platform for that coordination. The membership of the council should include representation from as many government agencies as will have a hand in, or be affected by development in South Gobi, and as many mining companies as currently have mining licenses and concrete plans recruiting and settling workers. The mining companies and the government need to agree as soon as possible on: Population projections, for the short-, medium- and long-terms, and how much
infrastructure will be needed to serve the expected population increase Where infrastructure should be built to accommodate influx, including whether the
infrastructure should go into new or existing soums near the mines What, roughly, will the infrastructure cost, and who will fund and finance it Who will plan, design, build, and operate the infrastructure.
We have provided projections, estimates, and recommendations above, but what is most important is that the Government and mining companies reach consensus, and work with the same assumptions about population growth, infrastructure needs, and how best to meet those needs.
1
1 Introduction Mongolia’s South Gobi Region is poised to experience a major economic boom. Several international companies, attracted by the discovery of copper, gold and coal deposits, are establishing world-class mining facilities. Other large mining investments are proposed in the near future. The mines will need people to work in them, and the direct and indirect economic opportunities created by the new mines are likely to attract migrants. These migrants will need infrastructure services currently in short supply, or entirely absent from many parts of South Gobi and the surrounding aimags.
An increase in population in South Gobi presents, on the one hand, opportunities for economic growth, and on the other hand, the potential for economic, social and political problems. Internationally, rapid population influx to mining regions has often led to such problems because of the strain it puts on a region’s resources, and the inability of governments and mine operators to provide the necessary infrastructure.
1.1 What Is the Purpose of This Paper? The World Bank has asked Castalia to:
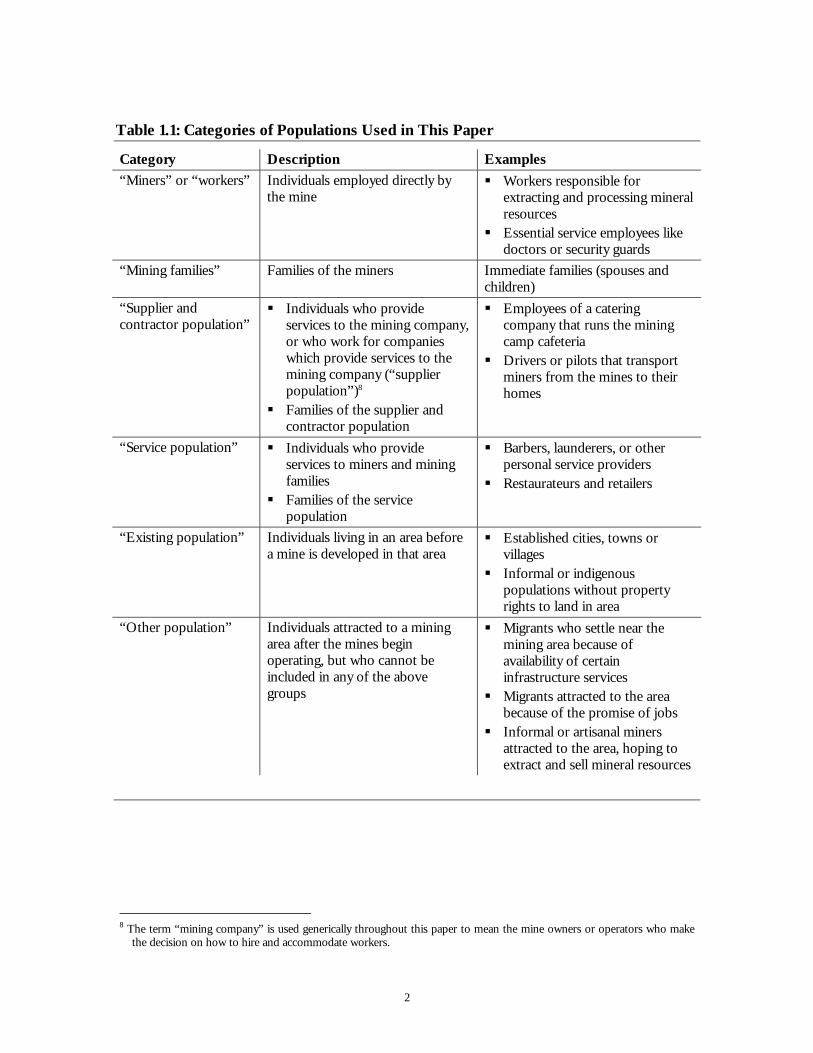
Review international experience with population influx to mining regions. Throughout this paper, we define “influx” as migrants, other than miners and their families, who come to an area in search of economic opportunities or infrastructure created directly or indirectly by a mining operation. We call “non-influx” the sum of miners, their families, and population existing in an area before mining operations start. We will refer to miners and mining families as part of the “mining population”. We will refer to the other categories of populations collectively as the “non-miners” or “non-mining population”. Table 1.1 shows the categories of populations we consider in this paper
Determine the infrastructure services and investments that will be needed by the increased population near the mines in South Gobi aimag, how much capacity will need to be built, and how much it will cost. Throughout this paper, we use the term infrastructure broadly to include: utility services (water, wastewater, heating, and electricity), solid waste, housing, public administration buildings, hospitals and schools
Identify institutional options for providing the infrastructure, and help the Government of Mongolia (“the Government”) identify the advantages and disadvantages of each of these options.
The purpose of this paper is therefore to inform the Government’s thinking about the development of population centers around the mines in South Gobi; helping the Government to make the most of the opportunities for economic growth, while minimizing the potential for economic, social and political problems.
2
Table 1.1: Categories of Populations Used in This Paper
Category Description Examples
“Miners” or “workers” Individuals employed directly by the mine
Workers responsible for extracting and processing mineral resources
Essential service employees like doctors or security guards
“Mining families” Families of the miners Immediate families (spouses and children)
“Supplier and contractor population”
Individuals who provide services to the mining company, or who work for companies which provide services to the mining company (“supplier population”)8
Families of the supplier and contractor population
Employees of a catering company that runs the mining camp cafeteria
Drivers or pilots that transport miners from the mines to their homes
“Service population” Individuals who provide services to miners and mining families
Families of the service population
Barbers, launderers, or other personal service providers
Restaurateurs and retailers
“Existing population” Individuals living in an area before a mine is developed in that area
Established cities, towns or villages
Informal or indigenous populations without property rights to land in area
“Other population” Individuals attracted to a mining area after the mines begin operating, but who cannot be included in any of the above groups
Migrants who settle near the mining area because of availability of certain infrastructure services
Migrants attracted to the area because of the promise of jobs
Informal or artisanal miners attracted to the area, hoping to extract and sell mineral resources
8 The term “mining company” is used generically throughout this paper to mean the mine owners or operators who make
the decision on how to hire and accommodate workers.

3
1.2 What Is the Structure of This Paper? We review, in Section 2, existing predictions of population influx in South Gobi, and the infrastructure planned to accommodate that influx. We describe the Government’s and mining companies’ predictions of influx, and their plans to provide infrastructure.
In Section 3, we describe international experience with population influx and infrastructure service delivery in towns near mines, and draw lessons for the new mining areas in South Gobi.
In Section 4 we estimate how much infrastructure South Gobi’s towns will need, and what that infrastructure will cost, under several different assumptions of population influx. As part of this analysis, we compare the Government’s predictions of influx, and the mining companies’ predictions of influx to international experience with influx in mining areas.
In Section 5, we identify the options available for providing infrastructure services in South Gobi, and analyze the advantages and disadvantages of each option. As part of this section, we will describe the different functions necessary to provide infrastructure services.
We conclude, in Section 6, by recommending how the Government can decide between the options described in Section 5.
4
2 Existing Projections of Population and Plans for Infrastructure Development in South Gobi
The Government of Mongolia has put considerable thought into population growth in South Gobi’s mining areas, and the infrastructure needed to accommodate that growth. Some of the mining companies operating in South Gobi have also developed their own population projections and their own plans for recruiting and housing workers. This report aims to help the parties reach consensus on the development of South Gobi’s mining areas by analyzing both Government and mining company plans and projections in light of international experience.
We summarize in Section 2.1 our understanding of the Government’s plans for South Gobi’s mining areas, and the population forecasts driving those plans. In Section 2.1.3 we summarize our understanding of the mining companies’ plans for infrastructure in the soums around the mines in South Gobi, and their projections of growth for the mining and non-mining populations.
2.1 What are Government Projections and Plans? A Regional Development Concept (RDC), approved by the Mongolian Parliament in 2001, defines the policy for urban and rural development in Mongolia through 2020.9 The Ministry of Construction and Urban Development (MoCUD) has projected population growth over the next one to two decades, and developed plans for both regional and soum-level communal infrastructure in South Gobi based on the RDC. Several other Government ministries, including MoCUD; the Ministries of Road, Transport and Tourism; Fuel and Energy; and Infrastructure and Trade, have also developed plans for regional infrastructure in South Gobi.
2.1.1 Regional Development Plan
Mongolia’s Regional Development Concept develops separate plans for five economic zones: Western, Khangai, Central, Eastern, and Ulaanbaatar City. South Gobi (Umnugobi) falls within the Central economic zone, as do six other aimags: Darkhan-Uul, Selenge, Tuv, Gobisumber, Dornogobi, and Dundgobi.
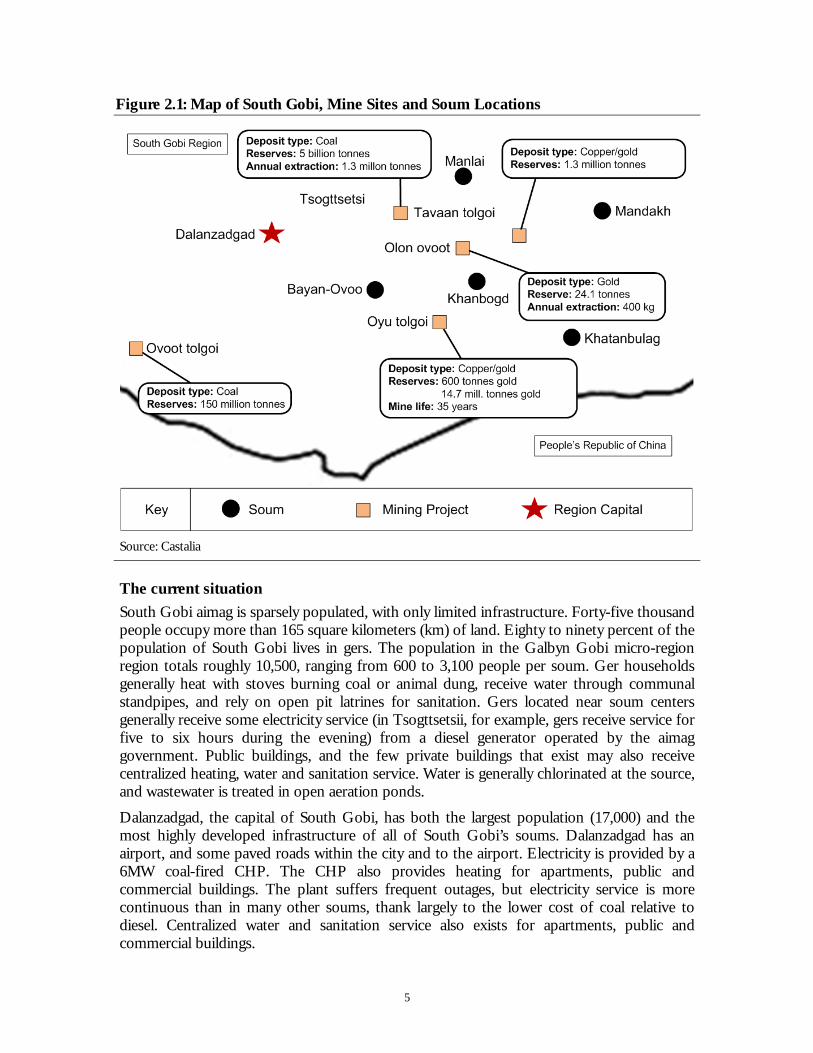
Because of the burgeoning mining industry in South Gobi, the Government also developed a more specific plan for what it calls the Galbyn Gobi micro-region. The Galbyn Gobi micro-region is defined as the area to be directly affected by mines at Tsagaansuvraga, Oyu Tolgoi and Tavan Tolgoi. The micro-region includes Tsogttsetsii, Manlai, Khanbogd, and Bayan-Ovoo soums in the Umnugobi aimag, and Khatanbulag and Mandah soum in the Dornogobi aimag. Figure 2.1 shows a map of the Galbyn Gobi micro-region, its mines and soums.
9 Parliament Resolution No. 57.
5
Figure 2.1: Map of South Gobi, Mine Sites and Soum Locations
Source: Castalia
The current situation
South Gobi aimag is sparsely populated, with only limited infrastructure. Forty-five thousand people occupy more than 165 square kilometers (km) of land. Eighty to ninety percent of the population of South Gobi lives in gers. The population in the Galbyn Gobi micro-region region totals roughly 10,500, ranging from 600 to 3,100 people per soum. Ger households generally heat with stoves burning coal or animal dung, receive water through communal standpipes, and rely on open pit latrines for sanitation. Gers located near soum centers generally receive some electricity service (in Tsogttsetsii, for example, gers receive service for five to six hours during the evening) from a diesel generator operated by the aimag government. Public buildings, and the few private buildings that exist may also receive centralized heating, water and sanitation service. Water is generally chlorinated at the source, and wastewater is treated in open aeration ponds.
Dalanzadgad, the capital of South Gobi, has both the largest population (17,000) and the most highly developed infrastructure of all of South Gobi’s soums. Dalanzadgad has an airport, and some paved roads within the city and to the airport. Electricity is provided by a 6MW coal-fired CHP. The CHP also provides heating for apartments, public and commercial buildings. The plant suffers frequent outages, but electricity service is more continuous than in many other soums, thank largely to the lower cost of coal relative to diesel. Centralized water and sanitation service also exists for apartments, public and commercial buildings.
6
The plans
Consultants to the Ministry of Construction and Urban Development outlined two possible plans for developing infrastructure in the Galbyn Gobi micro-region.10 One plan, developed by consultants Engineering Geodesy, envisions development dispersed throughout five soums in the micro-region. In this plan, non-mining industries would be developed throughout the five soums to accompany the growth in the mining industry. These industries are:
In Tsogttsetsii, a coking and chemical industry, poultry and pig farming, a construction materials industry, and other small and medium enterprises
In Bayan-Ovoo, barter trade and service facilities, duty free, frontier guard, emergency authorities; public epidemic and law and order institutions, livestock farming, and fruit and berry farms
In Khanbogd, transport services (air, rail, and road); warehousing and packaging, printing, irrigated farming, livestock farming, meat and meat processing, ecological research and monitoring, tree nurseries, and an air navigation authority
In Manlai, livestock farming, and vegetable growing
In Mandah, mining enrichment industries, transportation services, tourist camps; fruit and vegetable farming, sewing, and wool knitting factories.
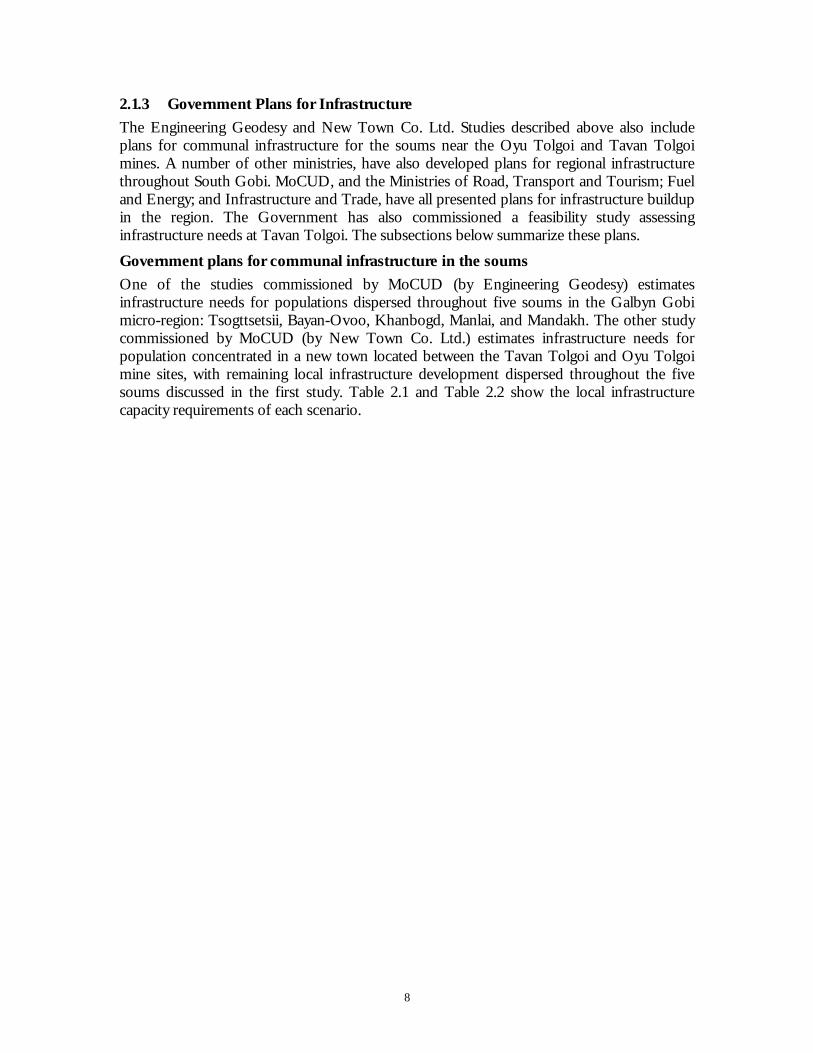
A second plan, developed by New Town Co. Ltd., would create two new towns, one located between the Tavan Tolgoi and Oyu Tolgoi mine sites, and another located near the Tsaagan Suvraga mining area. Under this plan, the new towns would be the center for economic activity in the micro-region. Other soums in the micro-region would be mostly involved in agricultural production.
2.1.2 MoCUD Population Projections
Engineering Geodesy and New Town Co. Ltd. have each developed scenarios for population growth in the soums near South Gobi’s mines. The MoCUD projections we have seen project overall population growth only, not influx.
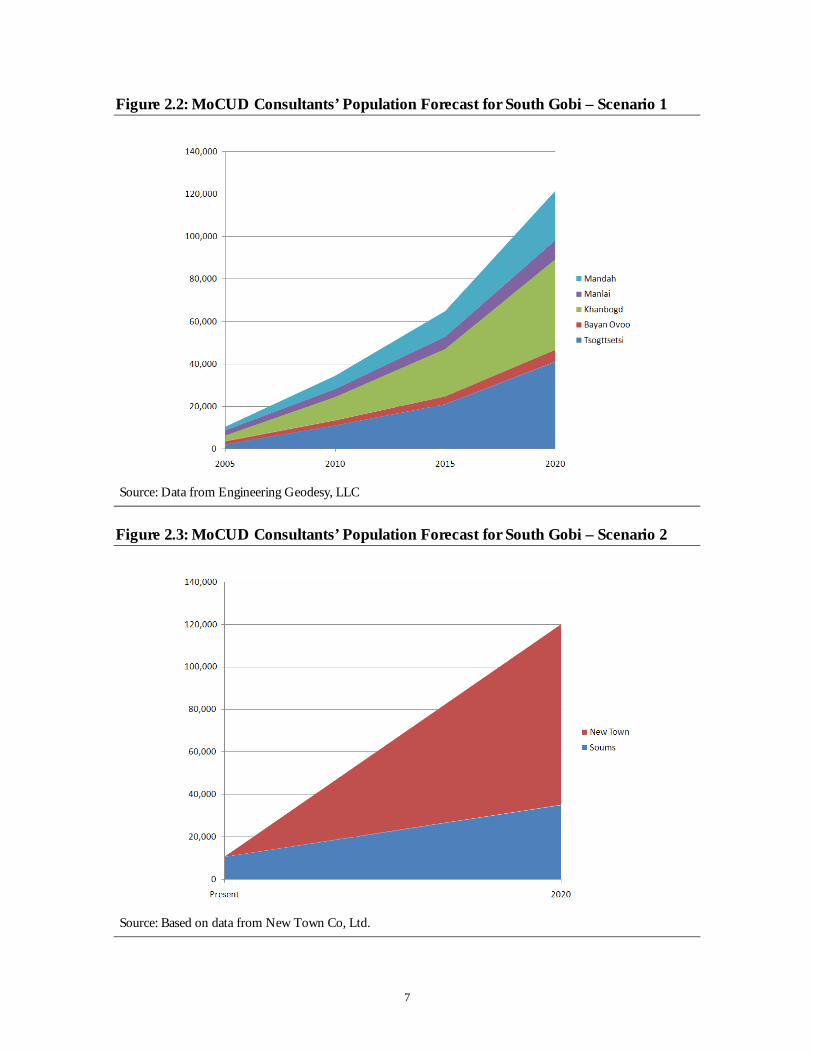
Both studies predict that the population of the Galbyn Gobi micro-region, which is now 10,500, will grow to roughly 120,000 by 2020. In Engineering Geodesy study, population influx is dispersed among five soums, with population concentrated in Tsogttsetsii, Khanbogd, and Mandah soums. In the New Town Co. Ltd. study, population influx will be concentrated in a new town to be created 75 km north-west of Khanbogd, and roughly equidistant between the Oyu Tolgoi and Tavan Tolgoi mine sites. Figure 2.2 and Figure 2.3 show the population forecasts from each study.
10 Engineer Geodesy, LLC in “Galbyn Gobi.” and New Town Co. Ltd. in the “Regional Urban Development Plan for the
Tavan Tolgoi, Oyu Tolgoi and Tsagaan suvarga Mining Deposits in the Gobi Region.” Project No. 3T-2007/01. Ulaanbaatar, 2008.
7
Figure 2.2: MoCUD Consultants’ Population Forecast for South Gobi – Scenario 1
Source: Data from Engineering Geodesy, LLC
Figure 2.3: MoCUD Consultants’ Population Forecast for South Gobi – Scenario 2
Source: Based on data from New Town Co, Ltd.
8
2.1.3 Government Plans for Infrastructure
The Engineering Geodesy and New Town Co. Ltd. Studies described above also include plans for communal infrastructure for the soums near the Oyu Tolgoi and Tavan Tolgoi mines. A number of other ministries, have also developed plans for regional infrastructure throughout South Gobi. MoCUD, and the Ministries of Road, Transport and Tourism; Fuel and Energy; and Infrastructure and Trade, have all presented plans for infrastructure buildup in the region. The Government has also commissioned a feasibility study assessing infrastructure needs at Tavan Tolgoi. The subsections below summarize these plans.
Government plans for communal infrastructure in the soums
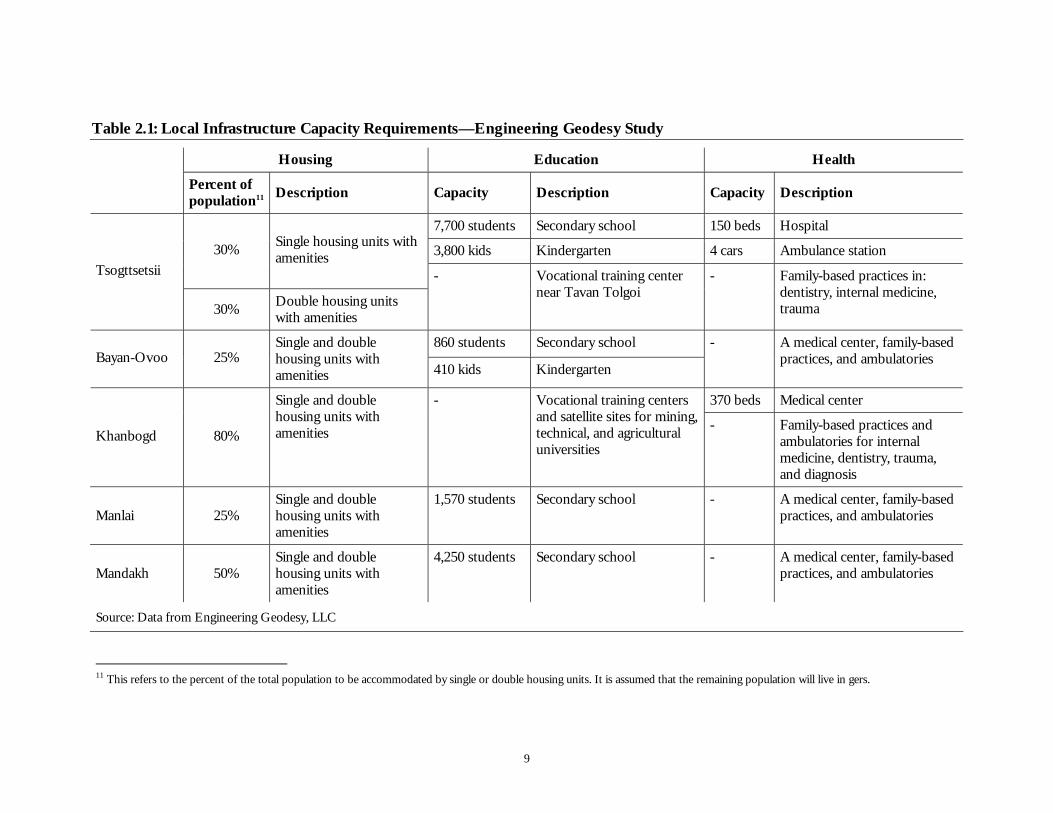
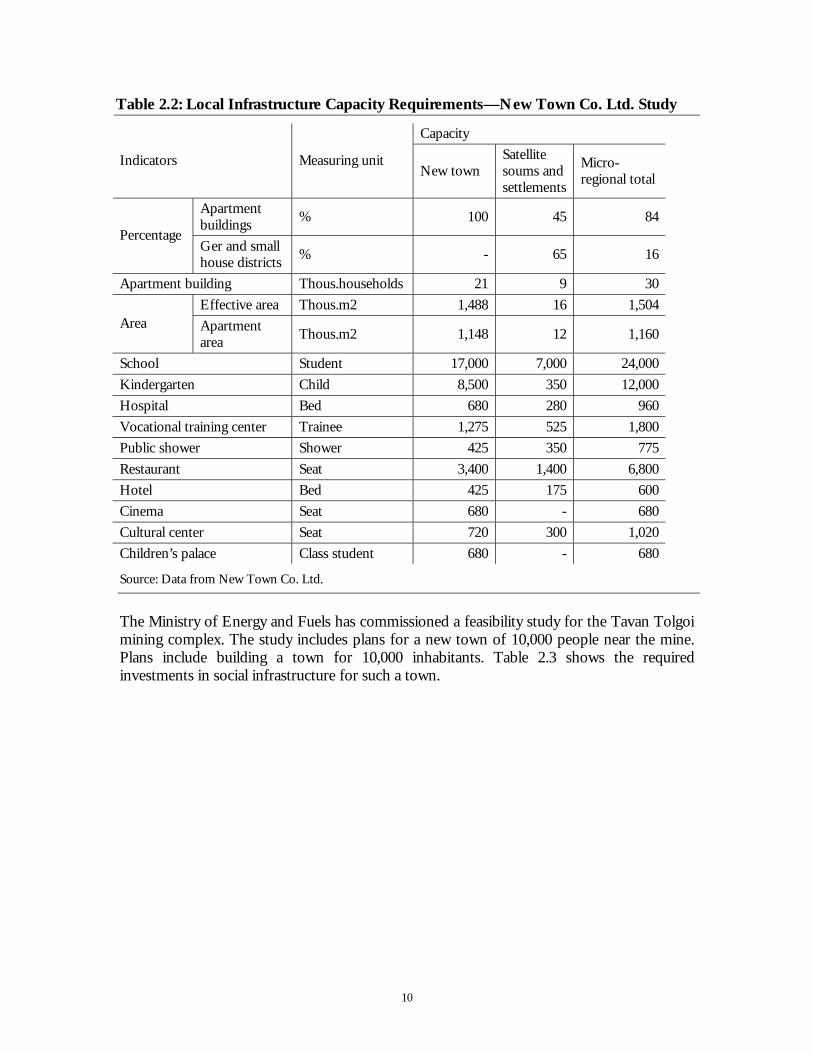
One of the studies commissioned by MoCUD (by Engineering Geodesy) estimates infrastructure needs for populations dispersed throughout five soums in the Galbyn Gobi micro-region: Tsogttsetsii, Bayan-Ovoo, Khanbogd, Manlai, and Mandakh. The other study commissioned by MoCUD (by New Town Co. Ltd.) estimates infrastructure needs for population concentrated in a new town located between the Tavan Tolgoi and Oyu Tolgoi mine sites, with remaining local infrastructure development dispersed throughout the five soums discussed in the first study. Table 2.1 and Table 2.2 show the local infrastructure capacity requirements of each scenario.
9
Table 2.1: Local Infrastructure Capacity Requirements—Engineering Geodesy Study
Housing Education Health Percent of
population11 Description Capacity Description Capacity Description
7,700 students Secondary school 150 beds Hospital
3,800 kids Kindergarten 4 cars Ambulance station 30% Single housing units with amenities
Tsogttsetsii
30% Double housing units with amenities
- Vocational training center near Tavan Tolgoi
- Family-based practices in: dentistry, internal medicine, trauma
860 students Secondary school Bayan-Ovoo 25%
Single and double housing units with amenities 410 kids Kindergarten
- A medical center, family-based practices, and ambulatories
370 beds Medical center
Khanbogd 80%
Single and double housing units with amenities
- Vocational training centers and satellite sites for mining, technical, and agricultural universities
- Family-based practices and ambulatories for internal medicine, dentistry, trauma, and diagnosis
Manlai 25% Single and double housing units with amenities
1,570 students Secondary school - A medical center, family-based practices, and ambulatories
Mandakh 50% Single and double housing units with amenities
4,250 students Secondary school - A medical center, family-based practices, and ambulatories
Source: Data from Engineering Geodesy, LLC
11 This refers to the percent of the total population to be accommodated by single or double housing units. It is assumed that the remaining population will live in gers.
10
Table 2.2: Local Infrastructure Capacity Requirements—New Town Co. Ltd. Study
Capacity
Indicators Measuring unit New town
Satellite soums and settlements
Micro-regional total
Apartment buildings % 100 45 84
Percentage Ger and small house districts % - 65 16
Apartment building Thous.households 21 9 30Effective area Thous.m2 1,488 16 1,504
Area Apartment area Thous.m2 1,148 12 1,160
School Student 17,000 7,000 24,000Kindergarten Child 8,500 350 12,000Hospital Bed 680 280 960Vocational training center Trainee 1,275 525 1,800Public shower Shower 425 350 775Restaurant Seat 3,400 1,400 6,800Hotel Bed 425 175 600Cinema Seat 680 - 680Cultural center Seat 720 300 1,020Children’s palace Class student 680 - 680
Source: Data from New Town Co. Ltd.
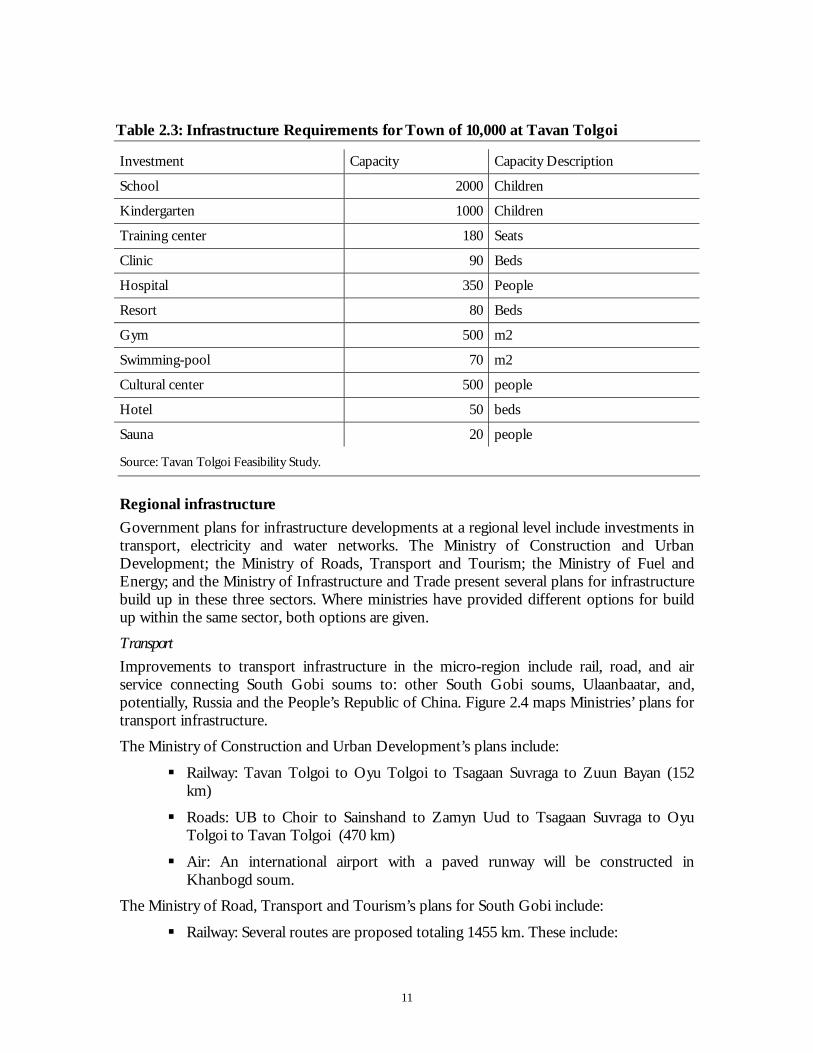
The Ministry of Energy and Fuels has commissioned a feasibility study for the Tavan Tolgoi mining complex. The study includes plans for a new town of 10,000 people near the mine. Plans include building a town for 10,000 inhabitants. Table 2.3 shows the required investments in social infrastructure for such a town.
11
Table 2.3: Infrastructure Requirements for Town of 10,000 at Tavan Tolgoi
Investment Capacity Capacity Description
School 2000 Children
Kindergarten 1000 Children
Training center 180 Seats
Clinic 90 Beds
Hospital 350 People
Resort 80 Beds
Gym 500 m2
Swimming-pool 70 m2
Cultural center 500 people
Hotel 50 beds
Sauna 20 people
Source: Tavan Tolgoi Feasibility Study.
Regional infrastructure
Government plans for infrastructure developments at a regional level include investments in transport, electricity and water networks. The Ministry of Construction and Urban Development; the Ministry of Roads, Transport and Tourism; the Ministry of Fuel and Energy; and the Ministry of Infrastructure and Trade present several plans for infrastructure build up in these three sectors. Where ministries have provided different options for build up within the same sector, both options are given.
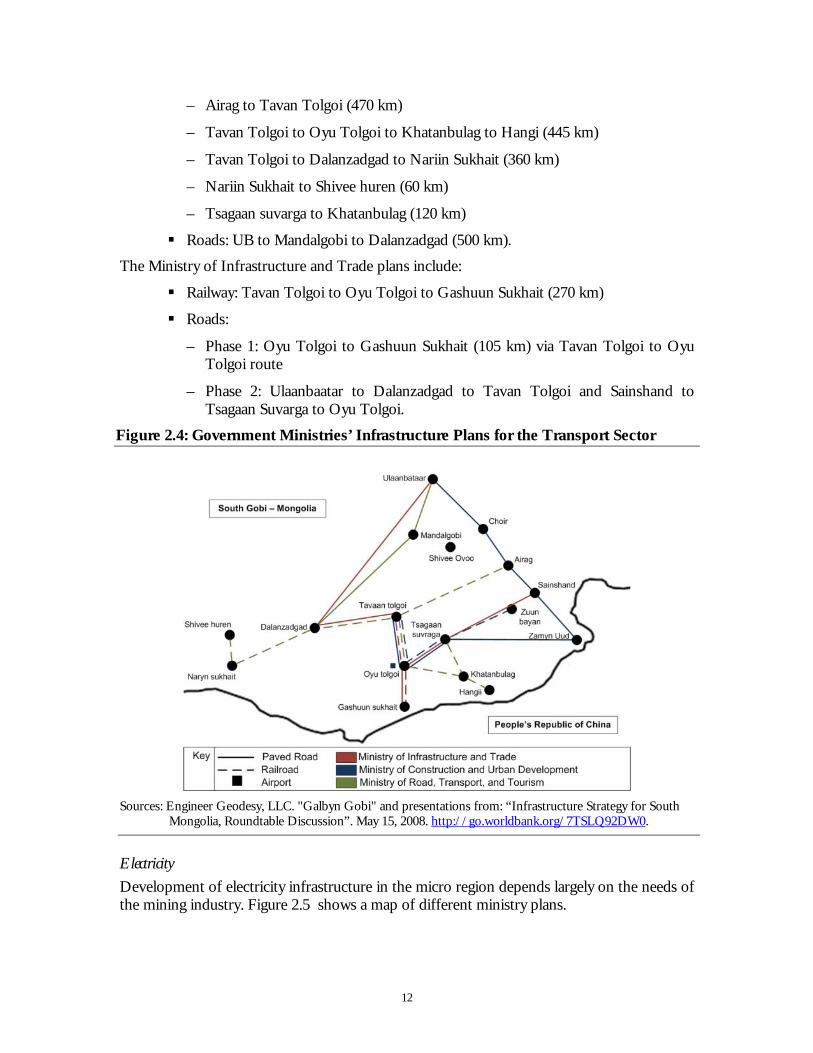
Transport Improvements to transport infrastructure in the micro-region include rail, road, and air service connecting South Gobi soums to: other South Gobi soums, Ulaanbaatar, and, potentially, Russia and the People’s Republic of China. Figure 2.4 maps Ministries’ plans for transport infrastructure.
The Ministry of Construction and Urban Development’s plans include:
Railway: Tavan Tolgoi to Oyu Tolgoi to Tsagaan Suvraga to Zuun Bayan (152 km)
Roads: UB to Choir to Sainshand to Zamyn Uud to Tsagaan Suvraga to Oyu Tolgoi to Tavan Tolgoi (470 km)
Air: An international airport with a paved runway will be constructed in Khanbogd soum.
The Ministry of Road, Transport and Tourism’s plans for South Gobi include:
Railway: Several routes are proposed totaling 1455 km. These include:
12
– Airag to Tavan Tolgoi (470 km)
– Tavan Tolgoi to Oyu Tolgoi to Khatanbulag to Hangi (445 km)
– Tavan Tolgoi to Dalanzadgad to Nariin Sukhait (360 km)
– Nariin Sukhait to Shivee huren (60 km)
– Tsagaan suvarga to Khatanbulag (120 km)
Roads: UB to Mandalgobi to Dalanzadgad (500 km).
The Ministry of Infrastructure and Trade plans include:
Railway: Tavan Tolgoi to Oyu Tolgoi to Gashuun Sukhait (270 km)
Roads:
– Phase 1: Oyu Tolgoi to Gashuun Sukhait (105 km) via Tavan Tolgoi to Oyu Tolgoi route
– Phase 2: Ulaanbaatar to Dalanzadgad to Tavan Tolgoi and Sainshand to Tsagaan Suvarga to Oyu Tolgoi.
Figure 2.4: Government Ministries’ Infrastructure Plans for the Transport Sector
Sources: Engineer Geodesy, LLC. "Galbyn Gobi" and presentations from: “Infrastructure Strategy for South
Mongolia, Roundtable Discussion”. May 15, 2008. http://go.worldbank.org/7TSLQ92DW0.
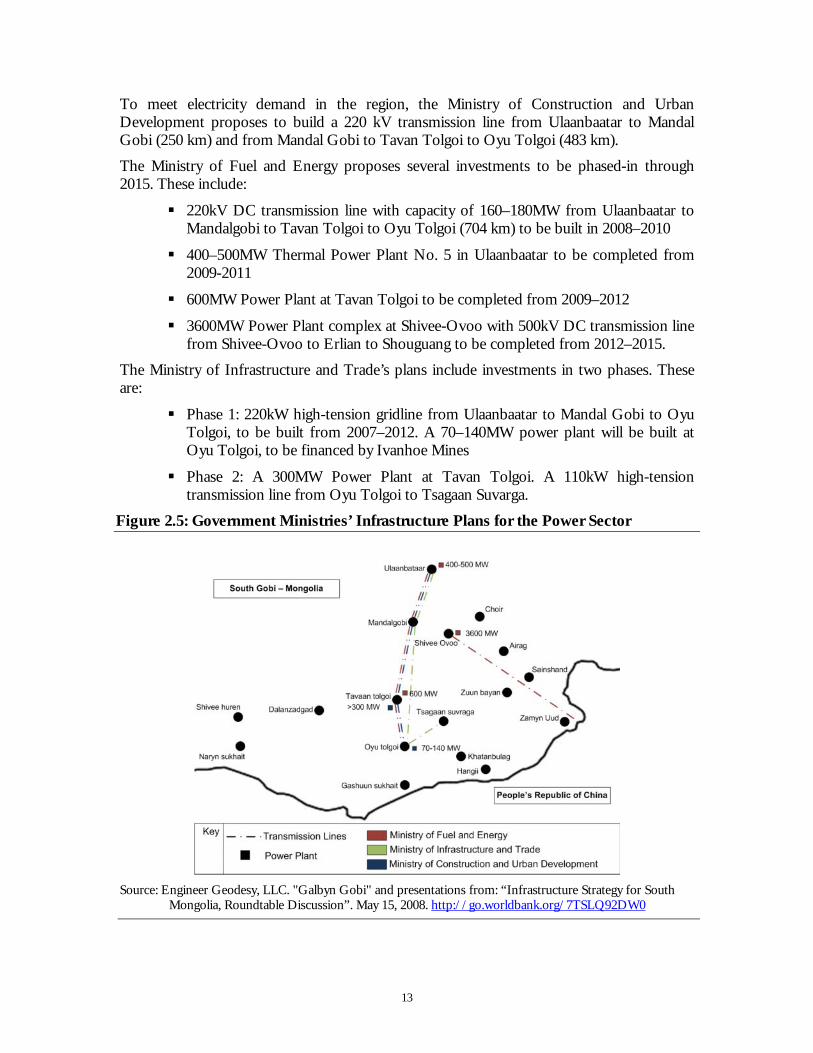
Electricity Development of electricity infrastructure in the micro region depends largely on the needs of the mining industry. Figure 2.5 shows a map of different ministry plans.
13
To meet electricity demand in the region, the Ministry of Construction and Urban Development proposes to build a 220 kV transmission line from Ulaanbaatar to Mandal Gobi (250 km) and from Mandal Gobi to Tavan Tolgoi to Oyu Tolgoi (483 km).
The Ministry of Fuel and Energy proposes several investments to be phased-in through 2015. These include:
220kV DC transmission line with capacity of 160–180MW from Ulaanbaatar to Mandalgobi to Tavan Tolgoi to Oyu Tolgoi (704 km) to be built in 2008–2010
400–500MW Thermal Power Plant No. 5 in Ulaanbaatar to be completed from 2009-2011
600MW Power Plant at Tavan Tolgoi to be completed from 2009–2012
3600MW Power Plant complex at Shivee-Ovoo with 500kV DC transmission line from Shivee-Ovoo to Erlian to Shouguang to be completed from 2012–2015.
The Ministry of Infrastructure and Trade’s plans include investments in two phases. These are:
Phase 1: 220kW high-tension gridline from Ulaanbaatar to Mandal Gobi to Oyu Tolgoi, to be built from 2007–2012. A 70–140MW power plant will be built at Oyu Tolgoi, to be financed by Ivanhoe Mines
Phase 2: A 300MW Power Plant at Tavan Tolgoi. A 110kW high-tension transmission line from Oyu Tolgoi to Tsagaan Suvarga.
Figure 2.5: Government Ministries’ Infrastructure Plans for the Power Sector
Source: Engineer Geodesy, LLC. "Galbyn Gobi" and presentations from: “Infrastructure Strategy for South
Mongolia, Roundtable Discussion”. May 15, 2008. http://go.worldbank.org/7TSLQ92DW0
14
Water The Ministry of Construction and Urban Development has developed options for meeting increased water demand in the region due to population influx and water needs of the mining industry. Population growth is expected to increase demand for water six to 14 times its current levels. Options for meeting the water needs include:
Selenge river. The Selenge river has been identified as a possible source for water needs in the region from 2010–2020. Water would be provided via the Selenge, Bulgan, Central, Dundgobi, Umnigobi, and Dornobogi route
Kherlen river. A large water tank could be constructed with a main canal pipeline to divert some of the Kherlen river flow towards Baruun Urt, Tsagaan suvraga and Oyu Tolgoi. Smaller pipelines would connect soums and dwellings with the main canal transmission line. Pipeline routes might include:
– Mainline: Kherlen river to Choir to Undershil to Mandah, 242 km
– Secondary line: Mandah to Sainshand to Urgen to Eredene to Zamyn uud, 346 km
– Secondary line: Mandah to Tsagaan suvraga to Oyu Tolgoi to Tavan Tolgoi to Dalanzadgad, 208.3 km
– Secondary line: Tsagaan Suvraga to Khanbogd to Oyu Tolgoi
Groundwater. Groundwater is and could continue to be extracted in South Gobi to serve populations and some commercial needs. Some ground water may be unsuitable for domestic purposes because of its hardness and iron content, but can be used with the proper equipment for treatment
Check dams and small reservoirs. These small reservoirs or simple pools of water would be created for the accumulation of rainwater and melted snow would principally be used as a water supply for livestock. At most, one pool would be created per soum.
While MoCUD presents several options for meeting water needs in the region, we were unable to determine which of these options the Ministry expects to pursue.
2.2 What are Mining Companies’ Projections and Plans? All of the mining companies currently operating in South Gobi, or close to the start of operations, have at least rudimentary plans for accommodating miners and mining families. We have reviewed and discussed plans developed by Taktics4 for Ivanhoe Mines’ operations at Oyu Tologi, Energy Resources plans for its mining camp at Tavan Tolgoi, and South Gobi Sands for its mining camp at Ovoot Tolgoi.
2.2.1 Ivanhoe Mines at Oyu Tolgoi
Ivanhoe Mines has commissioned studies of i) population influx at Khanbogd the soum closest to its mine at Oyu Tolgoi, and ii) recommendations for how to accommodate that influx.
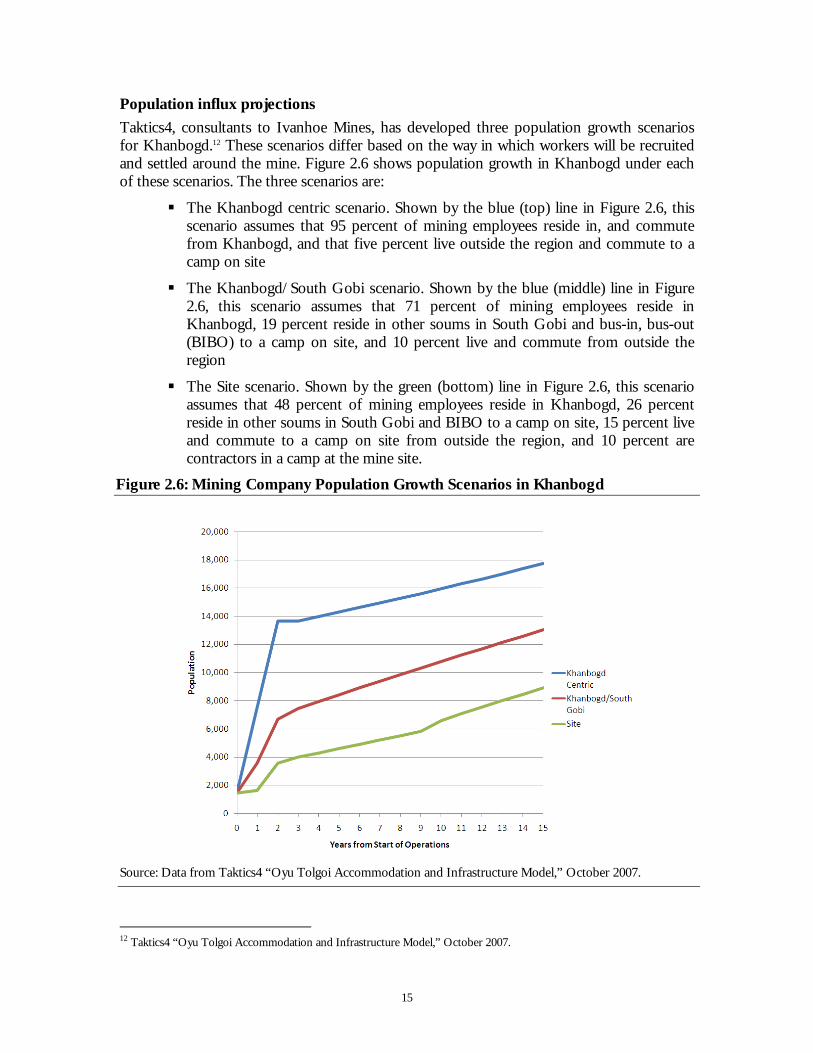
15
Population influx projections
Taktics4, consultants to Ivanhoe Mines, has developed three population growth scenarios for Khanbogd.12 These scenarios differ based on the way in which workers will be recruited and settled around the mine. Figure 2.6 shows population growth in Khanbogd under each of these scenarios. The three scenarios are:
The Khanbogd centric scenario. Shown by the blue (top) line in Figure 2.6, this scenario assumes that 95 percent of mining employees reside in, and commute from Khanbogd, and that five percent live outside the region and commute to a camp on site
The Khanbogd/South Gobi scenario. Shown by the blue (middle) line in Figure 2.6, this scenario assumes that 71 percent of mining employees reside in Khanbogd, 19 percent reside in other soums in South Gobi and bus-in, bus-out (BIBO) to a camp on site, and 10 percent live and commute from outside the region
The Site scenario. Shown by the green (bottom) line in Figure 2.6, this scenario assumes that 48 percent of mining employees reside in Khanbogd, 26 percent reside in other soums in South Gobi and BIBO to a camp on site, 15 percent live and commute to a camp on site from outside the region, and 10 percent are contractors in a camp at the mine site.
Figure 2.6: Mining Company Population Growth Scenarios in Khanbogd
Source: Data from Taktics4 “Oyu Tolgoi Accommodation and Infrastructure Model,” October 2007.
12 Taktics4 “Oyu Tolgoi Accommodation and Infrastructure Model,” October 2007.
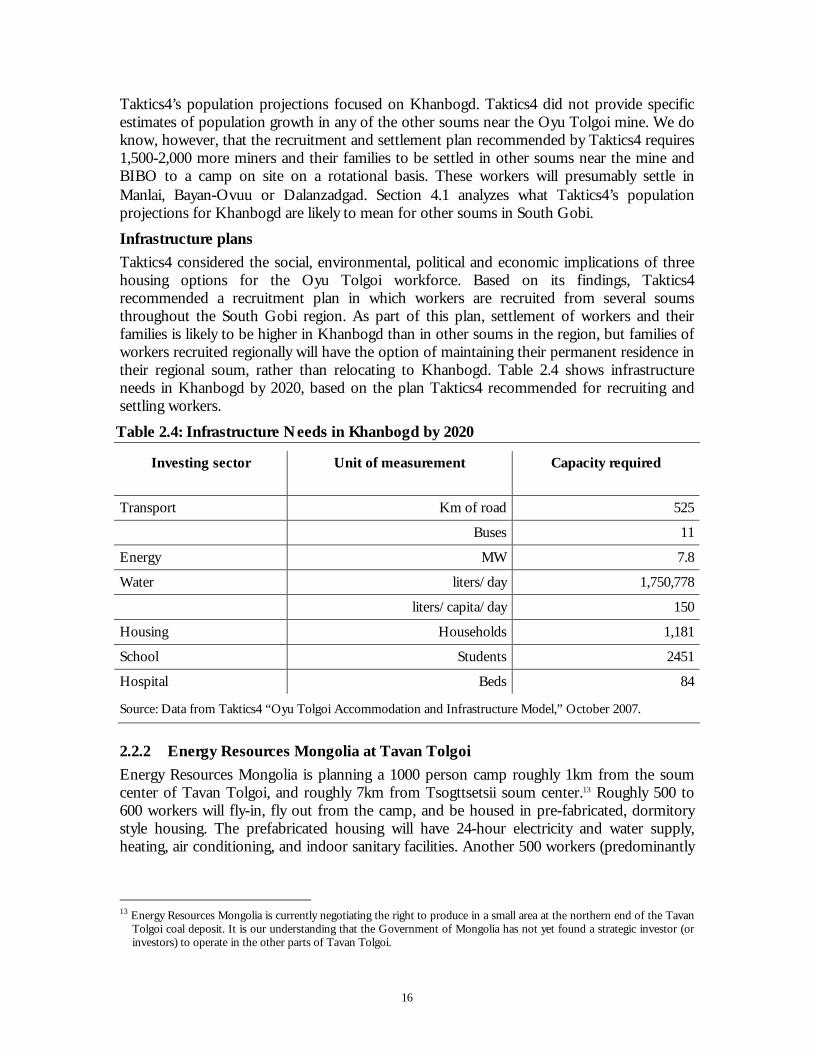
16
Taktics4’s population projections focused on Khanbogd. Taktics4 did not provide specific estimates of population growth in any of the other soums near the Oyu Tolgoi mine. We do know, however, that the recruitment and settlement plan recommended by Taktics4 requires 1,500-2,000 more miners and their families to be settled in other soums near the mine and BIBO to a camp on site on a rotational basis. These workers will presumably settle in Manlai, Bayan-Ovuu or Dalanzadgad. Section 4.1 analyzes what Taktics4’s population projections for Khanbogd are likely to mean for other soums in South Gobi.
Infrastructure plans
Taktics4 considered the social, environmental, political and economic implications of three housing options for the Oyu Tolgoi workforce. Based on its findings, Taktics4 recommended a recruitment plan in which workers are recruited from several soums throughout the South Gobi region. As part of this plan, settlement of workers and their families is likely to be higher in Khanbogd than in other soums in the region, but families of workers recruited regionally will have the option of maintaining their permanent residence in their regional soum, rather than relocating to Khanbogd. Table 2.4 shows infrastructure needs in Khanbogd by 2020, based on the plan Taktics4 recommended for recruiting and settling workers.
Table 2.4: Infrastructure Needs in Khanbogd by 2020
Investing sector Unit of measurement Capacity required
Transport Km of road 525
Buses 11
Energy MW 7.8
Water liters/day 1,750,778
liters/capita/day 150
Housing Households 1,181
School Students 2451
Hospital Beds 84
Source: Data from Taktics4 “Oyu Tolgoi Accommodation and Infrastructure Model,” October 2007.
2.2.2 Energy Resources Mongolia at Tavan Tolgoi
Energy Resources Mongolia is planning a 1000 person camp roughly 1km from the soum center of Tavan Tolgoi, and roughly 7km from Tsogttsetsii soum center.13 Roughly 500 to 600 workers will fly-in, fly out from the camp, and be housed in pre-fabricated, dormitory style housing. The prefabricated housing will have 24-hour electricity and water supply, heating, air conditioning, and indoor sanitary facilities. Another 500 workers (predominantly
13 Energy Resources Mongolia is currently negotiating the right to produce in a small area at the northern end of the Tavan
Tolgoi coal deposit. It is our understanding that the Government of Mongolia has not yet found a strategic investor (or investors) to operate in the other parts of Tavan Tolgoi.
17
drivers) will live permanently in gers next to the prefabricated housing, but within the camp gates.
Outside the camp gate Energy Resources intends to build:
A 250km rail link to the Chinese border, which will run near the Oyu Tolgoi mine
A road from Oyu Tolgoi to Tavan Tolgoi. Energy Resources will finance this road for the government and eventually transfer it to the Government
A water pipeline to serve the camp and the mine. So far, the best source of water (50 liters/second) found is roughly 70km from the mining camp.
2.2.3 South Gobi Energy Resources Plans at Ovoot Tolgoi
South Gobi Sands owns two coal mines at the Ovoot-Tolgoi mine site in South Gobi Aimag. The company began operations in April 2008. South Gobi Sands currently has a mining camp with ger accommodations for 180 workers. Roughly 40 to 50 workers are bused in and out from the nearby soum of Gurvan Tes every two weeks. All other workers are flown in and out from Ulaanbaatar. Higher level management commutes weekly from Ulaanbaatar.
South Gobi sands is planning a 3-story hotel to replace the gers in 2009. The hotel will accommodate 196 workers. In addition to its mine site infrastructure, the company has donated money to local schools and paved local roads.
2.2.4 Mongolian Alt Corporation at Nariin Sukhait
The Nariin Sukhait coal deposit contains two mines, one owned exclusively by the Mongolian Alt Corporation (MAK) and another operated as a joint venture between MAK and the Chinese company Quinhua (Quinhua-MAK). The mines have 105 and 110 workers, respectively, with roughly 20 percent of the workforce recruited locally from the Gurvan Tes soum. In 2008, the companies trained 50 people from the Gurvan Tes soum as heavy truck drivers, drillers, and crane operators at the Erdenet training center.
Currently, all workers are accommodated in camps at the mine sites. However, in 2009, the mining companies plan to introduce rotational fly-in, fly-out or bus-in, bus-out schedules. In 2008, the two companies invested about 4.5 billion MNT in the camps and their facilities. The two camps, located 7-8 km apart, consist of sandwich block houses with hot water, heating, electricity and indoor sanitary facilities. Each camp also contains a mine office building, laboratory, garage, repair shop, and fuel station.
Outside the camp gate, infrastructure built or planned to be built by MAK and Quinhua-MAK includes:
Electricity. A 35kV line (56 km) from Nariin Sukhait to the Chinese border, a 25 km line to the Gurvan Tes soum, and a 17 km line to the border
Roads. A 56 km road from Nariin Sukhait to Shivee Khuren on the Chinese border
Railway. MAK has a license to construct a 47.8 km railway from Nariin Sukhait to Shivee Khuren. Construction design of the railway will be completed in March 2009.
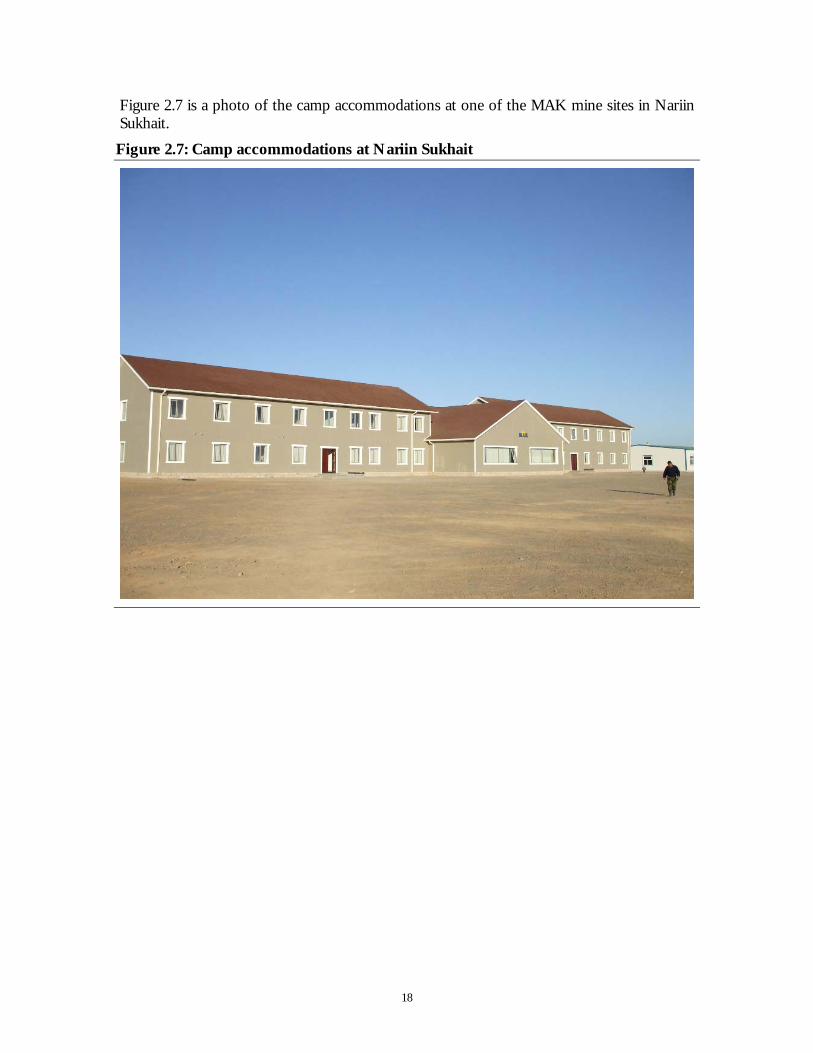
18
Figure 2.7 is a photo of the camp accommodations at one of the MAK mine sites in Nariin Sukhait.
Figure 2.7: Camp accommodations at Nariin Sukhait
19
3 Lessons from International Mining Experience This Section draws lessons from international experience with population change and infrastructure development around mines. We draw these lessons from a review of more than 20 examples of mining experience in North and South America, Africa, and Australasia.
The lessons
We draw five lessons for development in Southern Mongolia:
Influx can cause problems. Influx can cause degradation of living conditions, tensions between locals and migrants, and hardship for migrants whose expectations of economic opportunity fall short. Problems result, in particular, when:
– People move to areas near mines in search of work, but find none
– Money is provided for infrastructure, but failures in planning, management or operations prevent the local community from benefiting
– Mines close down in areas where they were the primary source of economic activity.
In Section 3.1 we describe some of these problems in more detail, and provide examples
Influx is hard to predict, but it is possible to identify one factor that causes it. Section 3.1 shows that the cases we reviewed experienced a wide range of influx, with little apparent explanation for the differences between cases. The way in which mining companies recruit and settle workers, however, does appear to have an impact on influx around mines.
Coordination between governments, local communities and mining companies can help avoid the problems caused by influx. Governments and mining companies can reduce the problems caused by influx through coordination and planning. Section 3.3 contains 4 examples of how mining companies, governments and local populations have cooperated to plan, finance, and deliver infrastructure services in areas near mines.
Each recruitment and settlement model has advantages and disadvantages from a social perspective. Section 3.4 describes some of the principal advantages and disadvantages of each recruitment and settlement model, and provides examples
Government can maximize a country’s value from mining by understanding the tradeoffs between cash and non-cash benefits, and recognizing how mining companies’ profit motivations affects their decision-making. A government’s objective is to maximize the economic welfare for the country. A mining company’s objective is to maximize profit. A government may try to maximize its economic benefit by imposing requirements on mining companies, for example, by requiring that the mining company make certain infrastructure investments. In doing so, however, governments sacrifice revenue from mining activities (in the form of taxes and royalties). Section 3.5
20
analyzes the tradeoffs for a government between cash and non-cash benefits of mining.
We discuss each of these lessons in separate subsections below, and draw examples from our review of more than 20 cases of mining experience around the world.
The cases
We selected cases that demonstrated:
A range of recruitment and settlement models, in other words, a range of experience in terms of how workers are recruited, and how infrastructure is provided for them and other migrants to the area
A range of population influx
Relevance to South Gobi in terms of exogenous variables like:
– Size of local population
– Distance from larger population
– Climate
– Availability of skilled labor
– Income disparity
– Per capita income
– Availability of infrastructure and social services.
Figure 3.4 shows where these cases are located geographically and the recruitment and settlement model they represent.
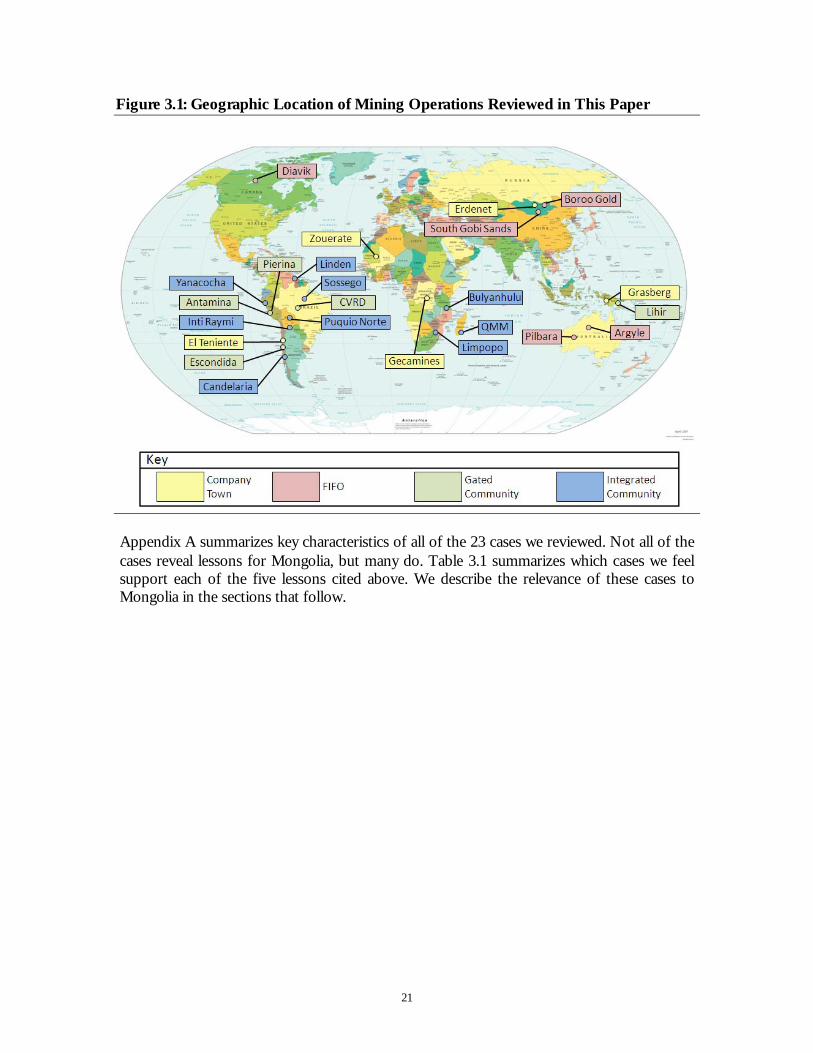
21
Figure 3.1: Geographic Location of Mining Operations Reviewed in This Paper
Appendix A summarizes key characteristics of all of the 23 cases we reviewed. Not all of the cases reveal lessons for Mongolia, but many do. Table 3.1 summarizes which cases we feel support each of the five lessons cited above. We describe the relevance of these cases to Mongolia in the sections that follow.
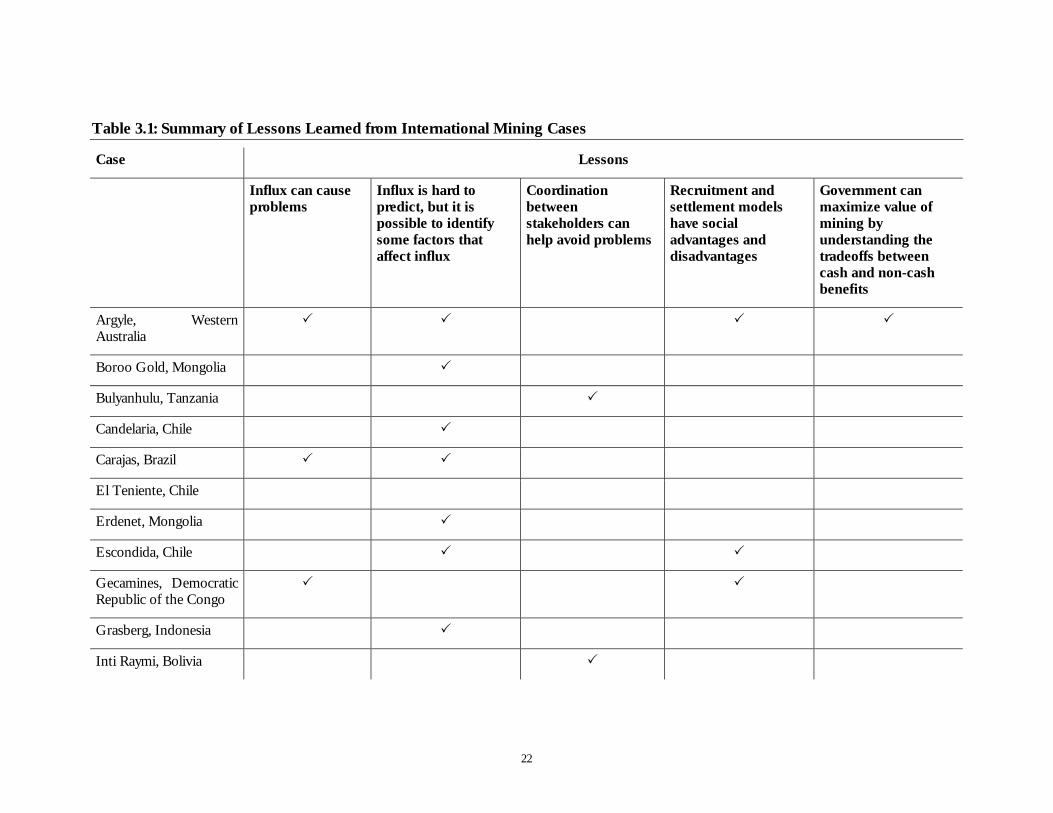
22
Table 3.1: Summary of Lessons Learned from International Mining Cases
Case Lessons
Influx can cause problems
Influx is hard to predict, but it is possible to identify some factors that affect influx
Coordination between stakeholders can help avoid problems
Recruitment and settlement models have social advantages and disadvantages
Government can maximize value of mining by understanding the tradeoffs between cash and non-cash benefits
Argyle, Western Australia
Boroo Gold, Mongolia
Bulyanhulu, Tanzania
Candelaria, Chile
Carajas, Brazil
El Teniente, Chile
Erdenet, Mongolia
Escondida, Chile
Gecamines, Democratic Republic of the Congo
Grasberg, Indonesia
Inti Raymi, Bolivia
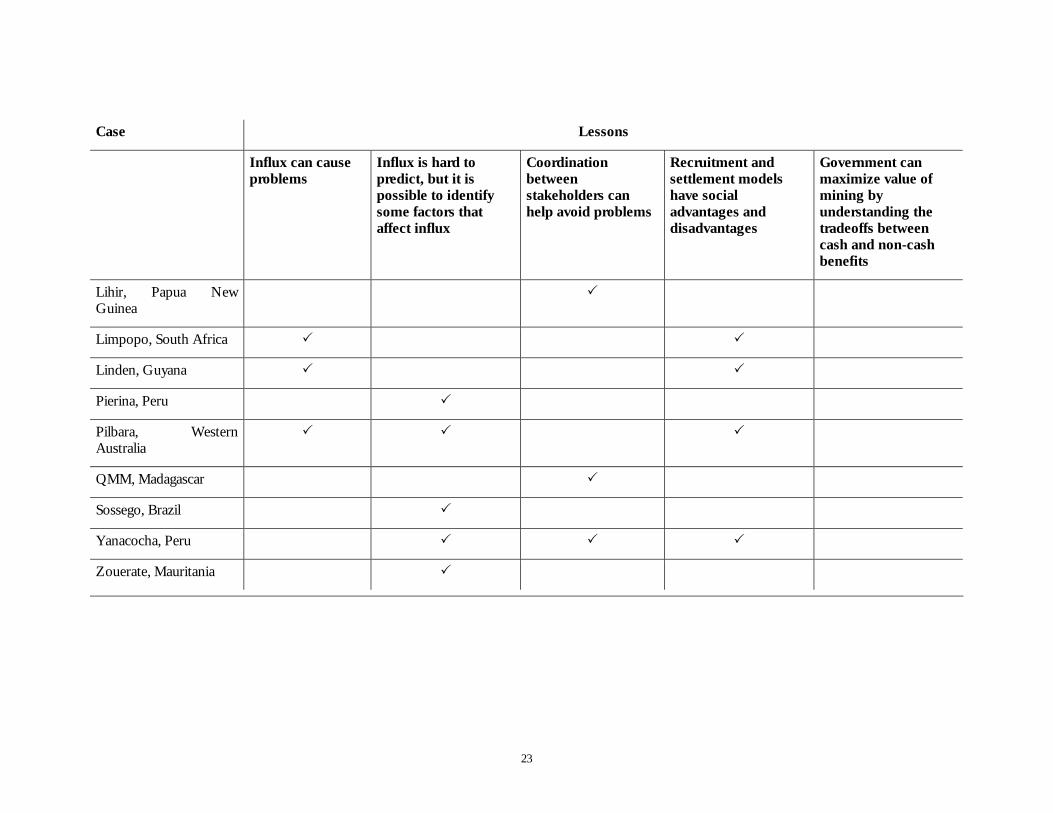
23
Case Lessons
Influx can cause problems
Influx is hard to predict, but it is possible to identify some factors that affect influx
Coordination between stakeholders can help avoid problems
Recruitment and settlement models have social advantages and disadvantages
Government can maximize value of mining by understanding the tradeoffs between cash and non-cash benefits
Lihir, Papua New Guinea
Limpopo, South Africa
Linden, Guyana
Pierina, Peru
Pilbara, Western Australia
QMM, Madagascar
Sossego, Brazil
Yanacocha, Peru
Zouerate, Mauritania
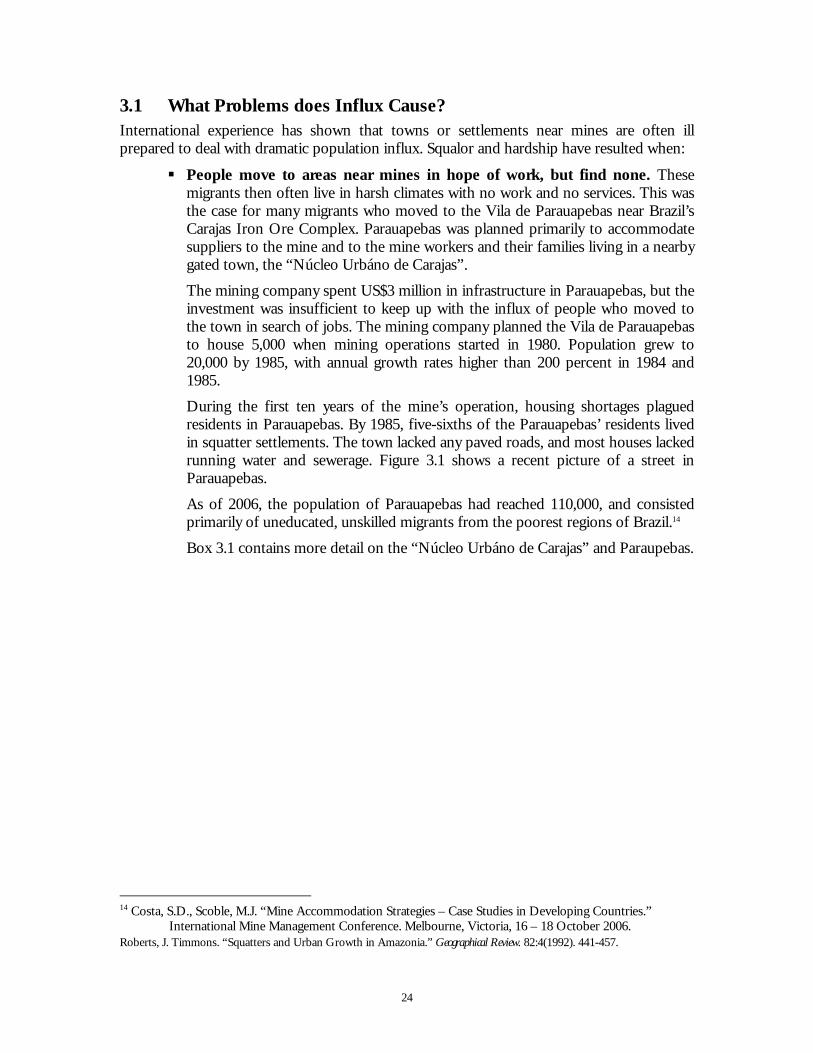
24
3.1 What Problems does Influx Cause? International experience has shown that towns or settlements near mines are often ill prepared to deal with dramatic population influx. Squalor and hardship have resulted when:
People move to areas near mines in hope of work, but find none. These migrants then often live in harsh climates with no work and no services. This was the case for many migrants who moved to the Vila de Parauapebas near Brazil’s Carajas Iron Ore Complex. Parauapebas was planned primarily to accommodate suppliers to the mine and to the mine workers and their families living in a nearby gated town, the “Núcleo Urbáno de Carajas”.
The mining company spent US$3 million in infrastructure in Parauapebas, but the investment was insufficient to keep up with the influx of people who moved to the town in search of jobs. The mining company planned the Vila de Parauapebas to house 5,000 when mining operations started in 1980. Population grew to 20,000 by 1985, with annual growth rates higher than 200 percent in 1984 and 1985.
During the first ten years of the mine’s operation, housing shortages plagued residents in Parauapebas. By 1985, five-sixths of the Parauapebas’ residents lived in squatter settlements. The town lacked any paved roads, and most houses lacked running water and sewerage. Figure 3.1 shows a recent picture of a street in Parauapebas.
As of 2006, the population of Parauapebas had reached 110,000, and consisted primarily of uneducated, unskilled migrants from the poorest regions of Brazil.14
Box 3.1 contains more detail on the “Núcleo Urbáno de Carajas” and Paraupebas.
14 Costa, S.D., Scoble, M.J. “Mine Accommodation Strategies – Case Studies in Developing Countries.”
International Mine Management Conference. Melbourne, Victoria, 16 – 18 October 2006. Roberts, J. Timmons. “Squatters and Urban Growth in Amazonia.” Geographical Review. 82:4(1992). 441-457.
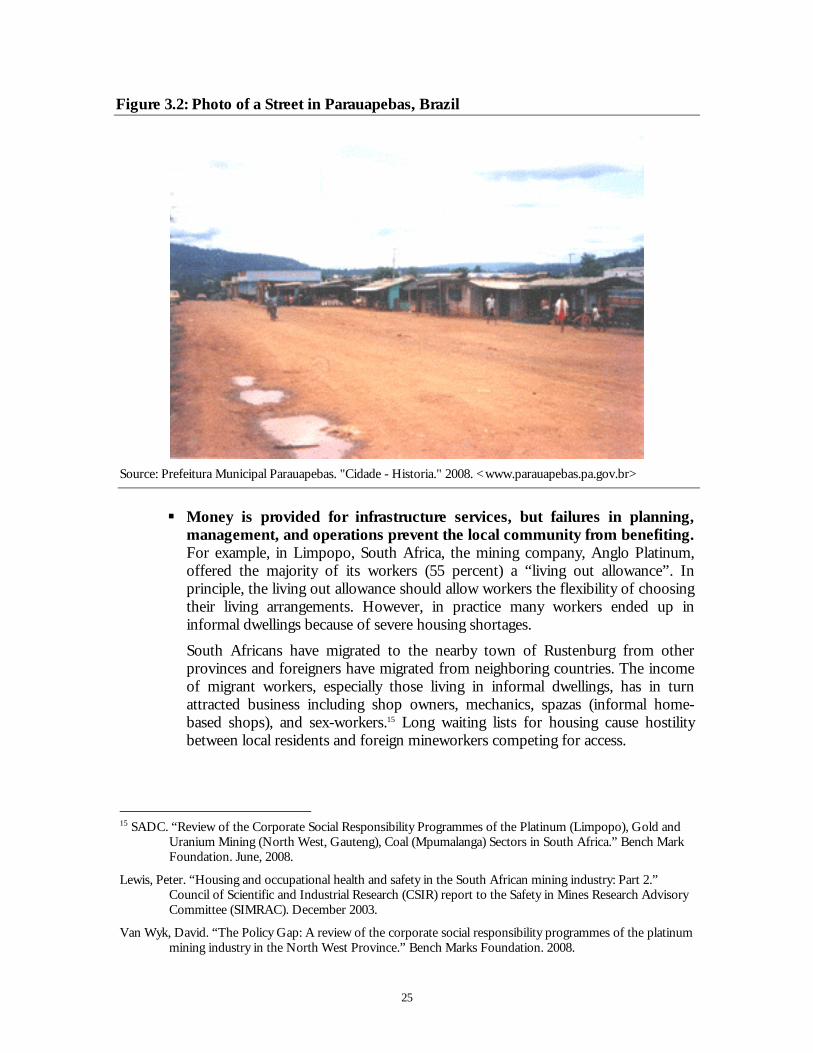
25
Figure 3.2: Photo of a Street in Parauapebas, Brazil
Source: Prefeitura Municipal Parauapebas. "Cidade - Historia." 2008. <www.parauapebas.pa.gov.br>
Money is provided for infrastructure services, but failures in planning,
management, and operations prevent the local community from benefiting. For example, in Limpopo, South Africa, the mining company, Anglo Platinum, offered the majority of its workers (55 percent) a “living out allowance”. In principle, the living out allowance should allow workers the flexibility of choosing their living arrangements. However, in practice many workers ended up in informal dwellings because of severe housing shortages.
South Africans have migrated to the nearby town of Rustenburg from other provinces and foreigners have migrated from neighboring countries. The income of migrant workers, especially those living in informal dwellings, has in turn attracted business including shop owners, mechanics, spazas (informal home-based shops), and sex-workers.15 Long waiting lists for housing cause hostility between local residents and foreign mineworkers competing for access.
15 SADC. “Review of the Corporate Social Responsibility Programmes of the Platinum (Limpopo), Gold and
Uranium Mining (North West, Gauteng), Coal (Mpumalanga) Sectors in South Africa.” Bench Mark Foundation. June, 2008.
Lewis, Peter. “Housing and occupational health and safety in the South African mining industry: Part 2.” Council of Scientific and Industrial Research (CSIR) report to the Safety in Mines Research Advisory Committee (SIMRAC). December 2003.
Van Wyk, David. “The Policy Gap: A review of the corporate social responsibility programmes of the platinum mining industry in the North West Province.” Bench Marks Foundation. 2008.
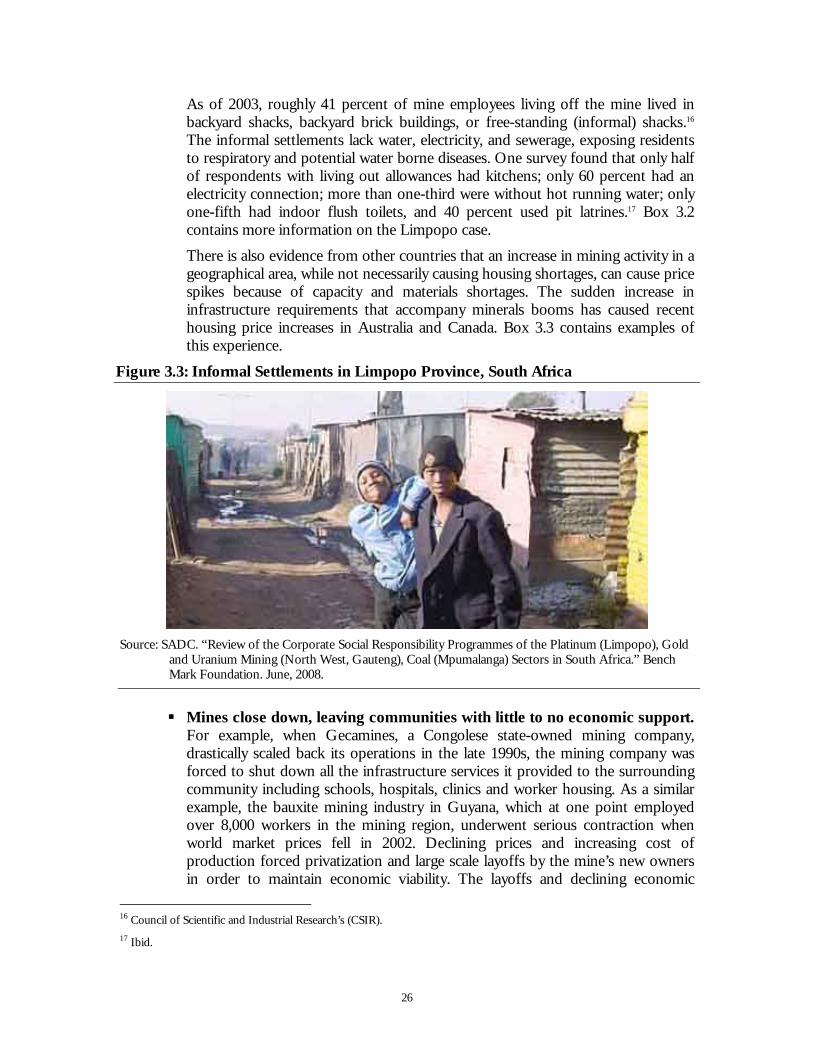
26
As of 2003, roughly 41 percent of mine employees living off the mine lived in backyard shacks, backyard brick buildings, or free-standing (informal) shacks.16 The informal settlements lack water, electricity, and sewerage, exposing residents to respiratory and potential water borne diseases. One survey found that only half of respondents with living out allowances had kitchens; only 60 percent had an electricity connection; more than one-third were without hot running water; only one-fifth had indoor flush toilets, and 40 percent used pit latrines.17 Box 3.2 contains more information on the Limpopo case.
There is also evidence from other countries that an increase in mining activity in a geographical area, while not necessarily causing housing shortages, can cause price spikes because of capacity and materials shortages. The sudden increase in infrastructure requirements that accompany minerals booms has caused recent housing price increases in Australia and Canada. Box 3.3 contains examples of this experience.
Figure 3.3: Informal Settlements in Limpopo Province, South Africa
Source: SADC. “Review of the Corporate Social Responsibility Programmes of the Platinum (Limpopo), Gold
and Uranium Mining (North West, Gauteng), Coal (Mpumalanga) Sectors in South Africa.” Bench Mark Foundation. June, 2008.
Mines close down, leaving communities with little to no economic support.
For example, when Gecamines, a Congolese state-owned mining company, drastically scaled back its operations in the late 1990s, the mining company was forced to shut down all the infrastructure services it provided to the surrounding community including schools, hospitals, clinics and worker housing. As a similar example, the bauxite mining industry in Guyana, which at one point employed over 8,000 workers in the mining region, underwent serious contraction when world market prices fell in 2002. Declining prices and increasing cost of production forced privatization and large scale layoffs by the mine’s new owners in order to maintain economic viability. The layoffs and declining economic
16 Council of Scientific and Industrial Research’s (CSIR). 17 Ibid.
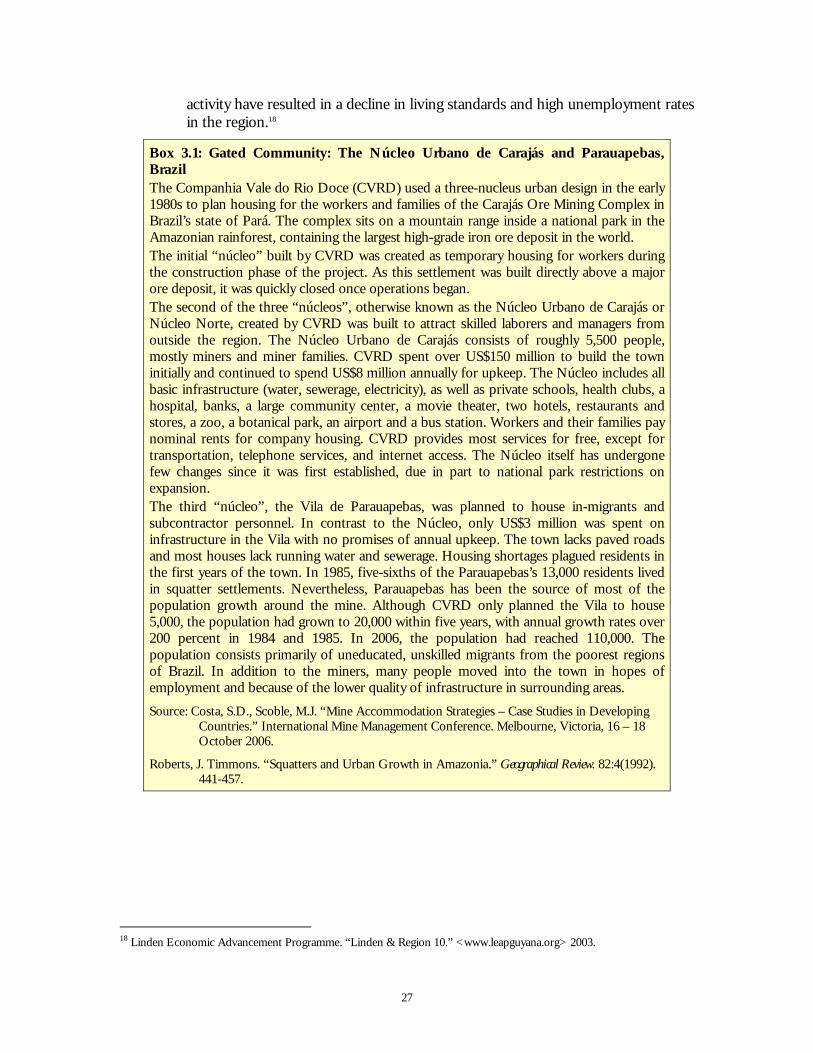
27
activity have resulted in a decline in living standards and high unemployment rates in the region.18
Box 3.1: Gated Community: The Núcleo Urbano de Carajás and Parauapebas, Brazil The Companhia Vale do Rio Doce (CVRD) used a three-nucleus urban design in the early 1980s to plan housing for the workers and families of the Carajás Ore Mining Complex in Brazil’s state of Pará. The complex sits on a mountain range inside a national park in the Amazonian rainforest, containing the largest high-grade iron ore deposit in the world. The initial “núcleo” built by CVRD was created as temporary housing for workers during the construction phase of the project. As this settlement was built directly above a major ore deposit, it was quickly closed once operations began. The second of the three “núcleos”, otherwise known as the Núcleo Urbano de Carajás or Núcleo Norte, created by CVRD was built to attract skilled laborers and managers from outside the region. The Núcleo Urbano de Carajás consists of roughly 5,500 people, mostly miners and miner families. CVRD spent over US$150 million to build the town initially and continued to spend US$8 million annually for upkeep. The Núcleo includes all basic infrastructure (water, sewerage, electricity), as well as private schools, health clubs, a hospital, banks, a large community center, a movie theater, two hotels, restaurants and stores, a zoo, a botanical park, an airport and a bus station. Workers and their families pay nominal rents for company housing. CVRD provides most services for free, except for transportation, telephone services, and internet access. The Núcleo itself has undergone few changes since it was first established, due in part to national park restrictions on expansion. The third “núcleo”, the Vila de Parauapebas, was planned to house in-migrants and subcontractor personnel. In contrast to the Núcleo, only US$3 million was spent on infrastructure in the Vila with no promises of annual upkeep. The town lacks paved roads and most houses lack running water and sewerage. Housing shortages plagued residents in the first years of the town. In 1985, five-sixths of the Parauapebas’s 13,000 residents lived in squatter settlements. Nevertheless, Parauapebas has been the source of most of the population growth around the mine. Although CVRD only planned the Vila to house 5,000, the population had grown to 20,000 within five years, with annual growth rates over 200 percent in 1984 and 1985. In 2006, the population had reached 110,000. The population consists primarily of uneducated, unskilled migrants from the poorest regions of Brazil. In addition to the miners, many people moved into the town in hopes of employment and because of the lower quality of infrastructure in surrounding areas. Source: Costa, S.D., Scoble, M.J. “Mine Accommodation Strategies – Case Studies in Developing
Countries.” International Mine Management Conference. Melbourne, Victoria, 16 – 18 October 2006.
Roberts, J. Timmons. “Squatters and Urban Growth in Amazonia.” Geographical Review. 82:4(1992). 441-457.
18 Linden Economic Advancement Programme. “Linden & Region 10.” <www.leapguyana.org> 2003.
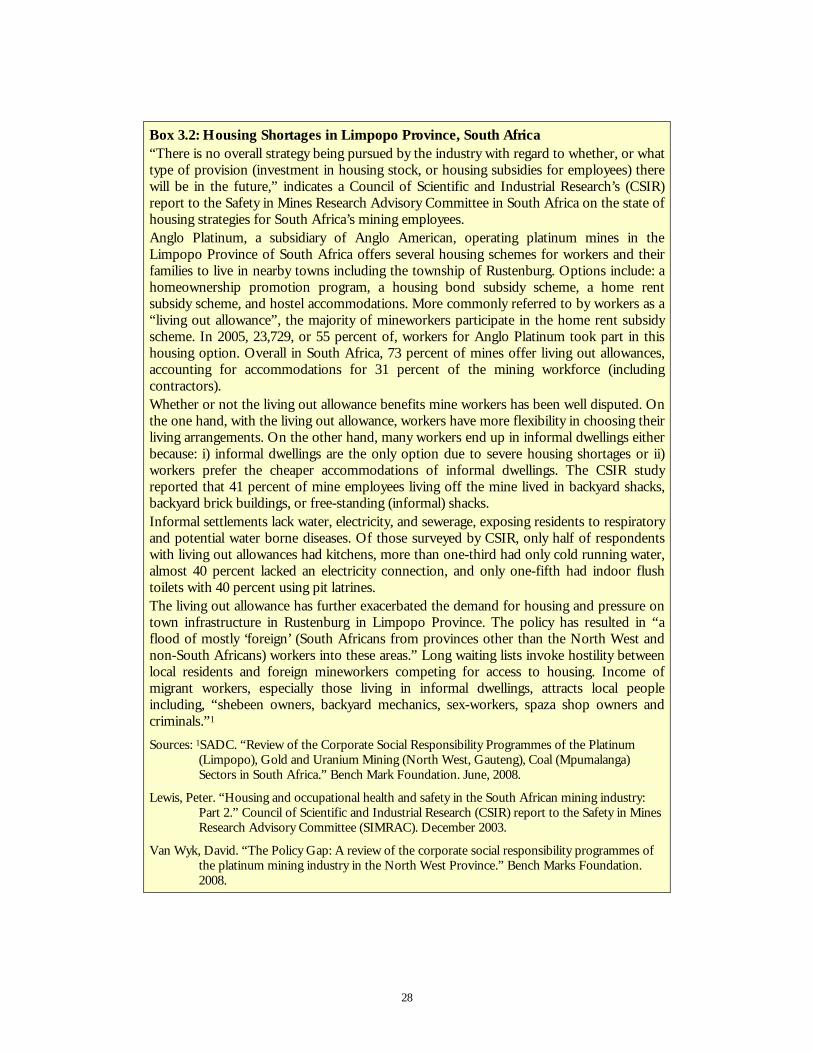
28
Box 3.2: Housing Shortages in Limpopo Province, South Africa “There is no overall strategy being pursued by the industry with regard to whether, or what type of provision (investment in housing stock, or housing subsidies for employees) there will be in the future,” indicates a Council of Scientific and Industrial Research’s (CSIR) report to the Safety in Mines Research Advisory Committee in South Africa on the state of housing strategies for South Africa’s mining employees. Anglo Platinum, a subsidiary of Anglo American, operating platinum mines in the Limpopo Province of South Africa offers several housing schemes for workers and their families to live in nearby towns including the township of Rustenburg. Options include: a homeownership promotion program, a housing bond subsidy scheme, a home rent subsidy scheme, and hostel accommodations. More commonly referred to by workers as a “living out allowance”, the majority of mineworkers participate in the home rent subsidy scheme. In 2005, 23,729, or 55 percent of, workers for Anglo Platinum took part in this housing option. Overall in South Africa, 73 percent of mines offer living out allowances, accounting for accommodations for 31 percent of the mining workforce (including contractors). Whether or not the living out allowance benefits mine workers has been well disputed. On the one hand, with the living out allowance, workers have more flexibility in choosing their living arrangements. On the other hand, many workers end up in informal dwellings either because: i) informal dwellings are the only option due to severe housing shortages or ii) workers prefer the cheaper accommodations of informal dwellings. The CSIR study reported that 41 percent of mine employees living off the mine lived in backyard shacks, backyard brick buildings, or free-standing (informal) shacks. Informal settlements lack water, electricity, and sewerage, exposing residents to respiratory and potential water borne diseases. Of those surveyed by CSIR, only half of respondents with living out allowances had kitchens, more than one-third had only cold running water, almost 40 percent lacked an electricity connection, and only one-fifth had indoor flush toilets with 40 percent using pit latrines. The living out allowance has further exacerbated the demand for housing and pressure on town infrastructure in Rustenburg in Limpopo Province. The policy has resulted in “a flood of mostly ‘foreign’ (South Africans from provinces other than the North West and non-South Africans) workers into these areas.” Long waiting lists invoke hostility between local residents and foreign mineworkers competing for access to housing. Income of migrant workers, especially those living in informal dwellings, attracts local people including, “shebeen owners, backyard mechanics, sex-workers, spaza shop owners and criminals.”1 Sources: 1SADC. “Review of the Corporate Social Responsibility Programmes of the Platinum
(Limpopo), Gold and Uranium Mining (North West, Gauteng), Coal (Mpumalanga) Sectors in South Africa.” Bench Mark Foundation. June, 2008.
Lewis, Peter. “Housing and occupational health and safety in the South African mining industry: Part 2.” Council of Scientific and Industrial Research (CSIR) report to the Safety in Mines Research Advisory Committee (SIMRAC). December 2003.
Van Wyk, David. “The Policy Gap: A review of the corporate social responsibility programmes of the platinum mining industry in the North West Province.” Bench Marks Foundation. 2008.
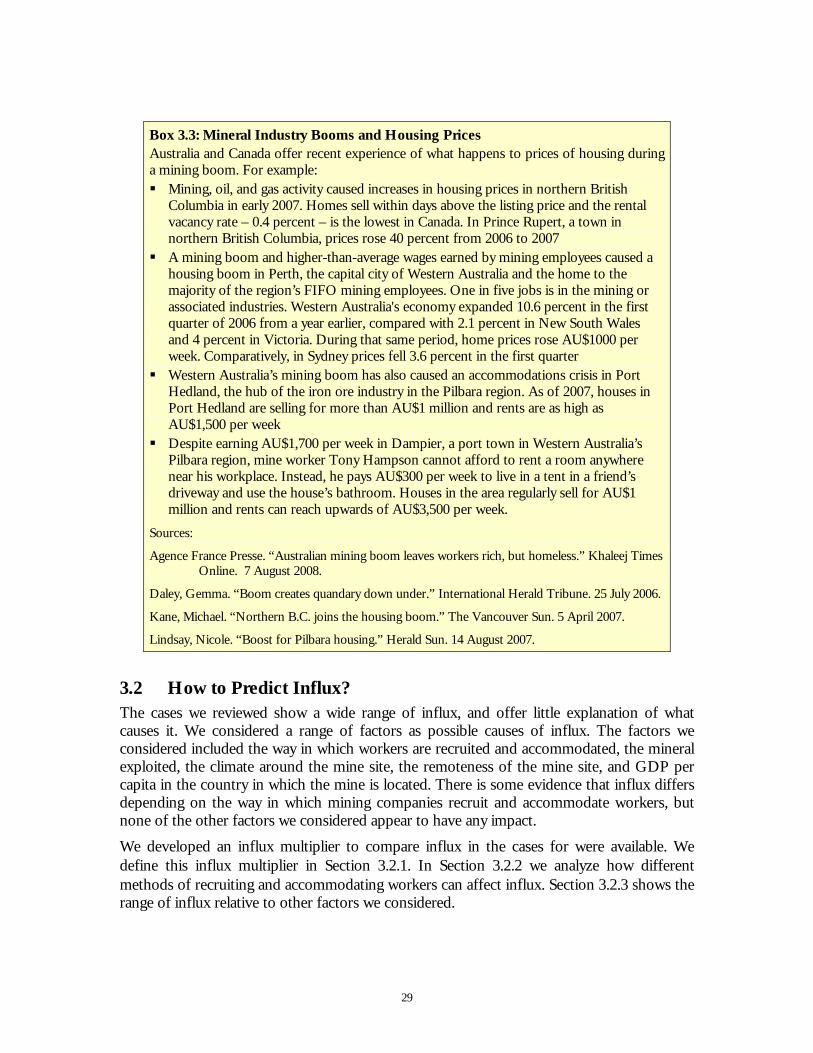
29
3.2 How to Predict Influx? The cases we reviewed show a wide range of influx, and offer little explanation of what causes it. We considered a range of factors as possible causes of influx. The factors we considered included the way in which workers are recruited and accommodated, the mineral exploited, the climate around the mine site, the remoteness of the mine site, and GDP per capita in the country in which the mine is located. There is some evidence that influx differs depending on the way in which mining companies recruit and accommodate workers, but none of the other factors we considered appear to have any impact.
We developed an influx multiplier to compare influx in the cases for were available. We define this influx multiplier in Section 3.2.1. In Section 3.2.2 we analyze how different methods of recruiting and accommodating workers can affect influx. Section 3.2.3 shows the range of influx relative to other factors we considered.
Box 3.3: Mineral Industry Booms and Housing Prices Australia and Canada offer recent experience of what happens to prices of housing during a mining boom. For example: Mining, oil, and gas activity caused increases in housing prices in northern British
Columbia in early 2007. Homes sell within days above the listing price and the rental vacancy rate – 0.4 percent – is the lowest in Canada. In Prince Rupert, a town in northern British Columbia, prices rose 40 percent from 2006 to 2007
A mining boom and higher-than-average wages earned by mining employees caused a housing boom in Perth, the capital city of Western Australia and the home to the majority of the region’s FIFO mining employees. One in five jobs is in the mining or associated industries. Western Australia's economy expanded 10.6 percent in the first quarter of 2006 from a year earlier, compared with 2.1 percent in New South Wales and 4 percent in Victoria. During that same period, home prices rose AU$1000 per week. Comparatively, in Sydney prices fell 3.6 percent in the first quarter
Western Australia’s mining boom has also caused an accommodations crisis in Port Hedland, the hub of the iron ore industry in the Pilbara region. As of 2007, houses in Port Hedland are selling for more than AU$1 million and rents are as high as AU$1,500 per week
Despite earning AU$1,700 per week in Dampier, a port town in Western Australia’s Pilbara region, mine worker Tony Hampson cannot afford to rent a room anywhere near his workplace. Instead, he pays AU$300 per week to live in a tent in a friend’s driveway and use the house’s bathroom. Houses in the area regularly sell for AU$1 million and rents can reach upwards of AU$3,500 per week.
Sources:
Agence France Presse. “Australian mining boom leaves workers rich, but homeless.” Khaleej Times Online. 7 August 2008.
Daley, Gemma. “Boom creates quandary down under.” International Herald Tribune. 25 July 2006.
Kane, Michael. “Northern B.C. joins the housing boom.” The Vancouver Sun. 5 April 2007.
Lindsay, Nicole. “Boost for Pilbara housing.” Herald Sun. 14 August 2007.
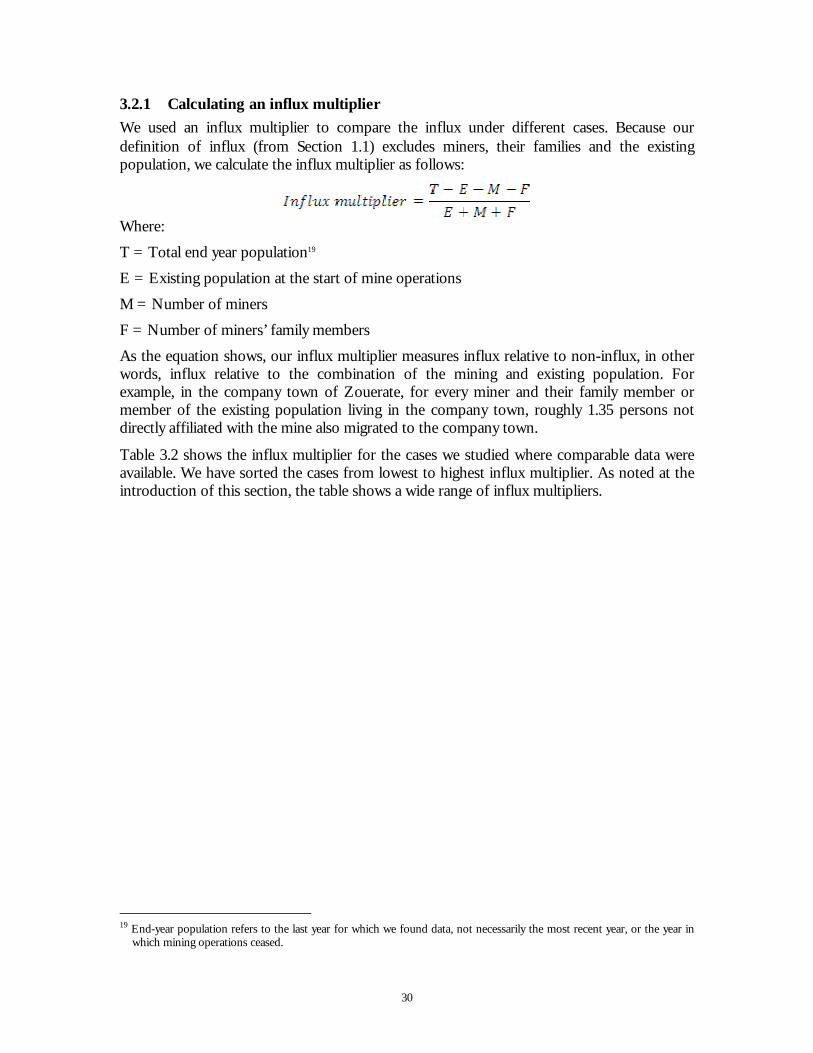
30
3.2.1 Calculating an influx multiplier
We used an influx multiplier to compare the influx under different cases. Because our definition of influx (from Section 1.1) excludes miners, their families and the existing population, we calculate the influx multiplier as follows:
Where:
T = Total end year population19
E = Existing population at the start of mine operations
M = Number of miners
F = Number of miners’ family members
As the equation shows, our influx multiplier measures influx relative to non-influx, in other words, influx relative to the combination of the mining and existing population. For example, in the company town of Zouerate, for every miner and their family member or member of the existing population living in the company town, roughly 1.35 persons not directly affiliated with the mine also migrated to the company town.
Table 3.2 shows the influx multiplier for the cases we studied where comparable data were available. We have sorted the cases from lowest to highest influx multiplier. As noted at the introduction of this section, the table shows a wide range of influx multipliers.
19 End-year population refers to the last year for which we found data, not necessarily the most recent year, or the year in
which mining operations ceased.
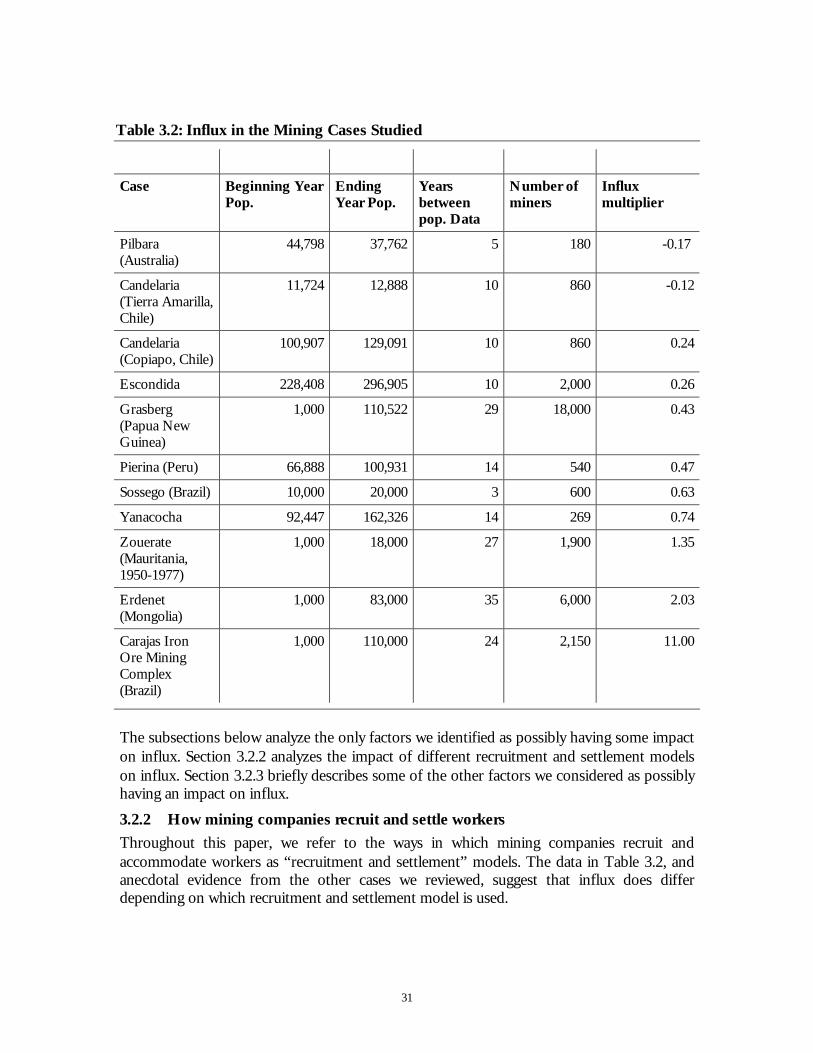
31
Table 3.2: Influx in the Mining Cases Studied
Case Beginning Year Pop.
Ending Year Pop.
Years between pop. Data
Number of miners
Influx multiplier
Pilbara (Australia)
44,798 37,762 5 180 -0.17
Candelaria (Tierra Amarilla, Chile)
11,724 12,888 10 860 -0.12
Candelaria (Copiapo, Chile)
100,907 129,091 10 860 0.24
Escondida 228,408 296,905 10 2,000 0.26
Grasberg (Papua New Guinea)
1,000 110,522 29 18,000 0.43
Pierina (Peru) 66,888 100,931 14 540 0.47
Sossego (Brazil) 10,000 20,000 3 600 0.63
Yanacocha 92,447 162,326 14 269 0.74
Zouerate (Mauritania, 1950-1977)
1,000 18,000 27 1,900 1.35
Erdenet (Mongolia)
1,000 83,000 35 6,000 2.03
Carajas Iron Ore Mining Complex (Brazil)
1,000 110,000 24 2,150 11.00
The subsections below analyze the only factors we identified as possibly having some impact on influx. Section 3.2.2 analyzes the impact of different recruitment and settlement models on influx. Section 3.2.3 briefly describes some of the other factors we considered as possibly having an impact on influx.
3.2.2 How mining companies recruit and settle workers
Throughout this paper, we refer to the ways in which mining companies recruit and accommodate workers as “recruitment and settlement” models. The data in Table 3.2, and anecdotal evidence from the other cases we reviewed, suggest that influx does differ depending on which recruitment and settlement model is used.
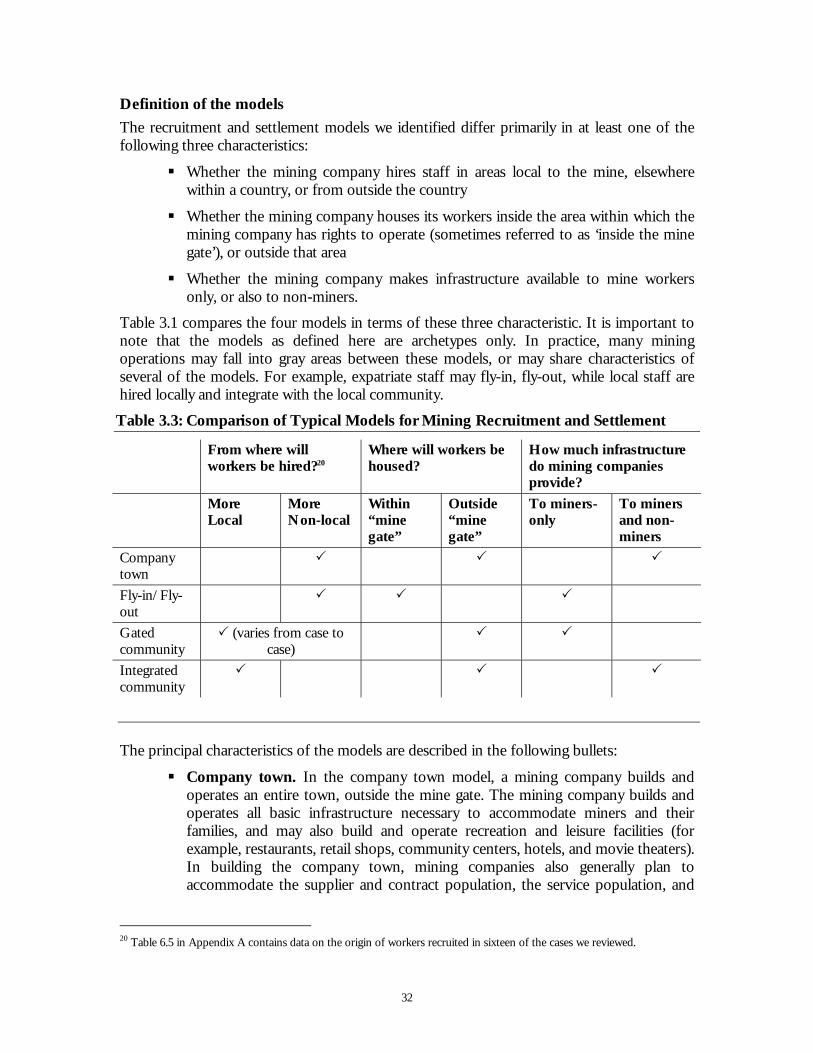
32
Definition of the models
The recruitment and settlement models we identified differ primarily in at least one of the following three characteristics:
Whether the mining company hires staff in areas local to the mine, elsewhere within a country, or from outside the country
Whether the mining company houses its workers inside the area within which the mining company has rights to operate (sometimes referred to as ‘inside the mine gate’), or outside that area
Whether the mining company makes infrastructure available to mine workers only, or also to non-miners.
Table 3.1 compares the four models in terms of these three characteristic. It is important to note that the models as defined here are archetypes only. In practice, many mining operations may fall into gray areas between these models, or may share characteristics of several of the models. For example, expatriate staff may fly-in, fly-out, while local staff are hired locally and integrate with the local community.
Table 3.3: Comparison of Typical Models for Mining Recruitment and Settlement
From where will workers be hired?20
Where will workers be housed?
How much infrastructure do mining companies provide?
More Local
More Non-local
Within “mine gate”
Outside “mine gate”
To miners-only
To miners and non-miners
Company town
Fly-in/Fly-out
Gated community
(varies from case to case)
Integrated community
The principal characteristics of the models are described in the following bullets:
Company town. In the company town model, a mining company builds and operates an entire town, outside the mine gate. The mining company builds and operates all basic infrastructure necessary to accommodate miners and their families, and may also build and operate recreation and leisure facilities (for example, restaurants, retail shops, community centers, hotels, and movie theaters). In building the company town, mining companies also generally plan to accommodate the supplier and contract population, the service population, and
20 Table 6.5 in Appendix A contains data on the origin of workers recruited in sixteen of the cases we reviewed.
33
possibly some of the existing population. Infrastructure services provided by the mining company in a company town include:
– Housing
– Basic infrastructure, including water, sewerage, and electricity
– Educational and health care facilities
– Banks
– Transport facilities, including bus stations, roads, and sometimes airports.
Some mining companies also build and operate recreation and leisure facilities that may include restaurants, retail shops, community centers, hotels, and even movie theaters. In Sewell, for example, the company town of the El Teniente mine, in Chile, the company built housing, electricity, water, sewerage, medical facilities, schools, a shopping area, football field, and a 74 km railway connecting Sewell and Rancagua.
In Zouerate, the French company that began mining operations at Zouerate (MIFERMA), built and operated a harbor in Nouadhibou, a power plant, housing for MIFERMA staff, a railway between the harbor and the mining site, an international airport (in Nouadhibou), and a regional airport (in Zouerate). MIFERMA also brought in drinking water via tanker.21
The company town model has often been used in remote areas where skilled workers and the infrastructure required to support and attract those workers are scarce. In the company town model, mine workers, and often suppliers and contractors, therefore come from areas distant from the mine site. Hence, in the Company Town model, most of the mine workers, and often many of the suppliers and contractors, come from areas distant from the mine site.
Fly-in, fly-out (FIFO). In the fly-in, fly out model, workers and their families live in regions, often metropolitan areas, located far away from the site of mining operations. Typically, workers commute to the mining site on a “14-days on/7-days off” rotation or “9 days on/5 days off” rotation. In this model, there is no recruitment from, and no infrastructure development in local communities. The mining company builds a mining camp, inside the mine gate, with enough infrastructure for mine employees only. The only infrastructure mining companies typically build outside of the mine gate are air strips, roads, or railroads required to transport workers, product, or supplies needed for mining operations.
Mining companies using the FIFO model may also make some investments in infrastructure on an ad hoc basis when needed to maintain their social license to operate with local communities.22 For example, Boroo Gold in Mongolia has set
21 Workers were housed in different neighborhoods depending on their role in the project, in other words, whether they
were management (only expatriates), middle management, lower management or workers. Workers hired locally were not provided housing, and either had to sublet a room or live in a traditional tent in the neighborhoods around Zoureate.
22 In this and the other models, mining companies often make one-off investments in local communities to forestall or dispel tensions, in the form of investments in infrastructure. These investments typically target improvements in social services, capacity building, or environmental rehabilitation.
34
up a training center in the soum of Baruunkhaara that focuses on recruiting and training personnel from the two surrounding provinces for mine work and support positions (for example, transportation). Boroo Gold has also contributed funds for multiple projects in the region that include: renovation of the dormitory at a local school in Baruunkhaara; improved heating, plumbing, and drinking water infrastructure and a new cafeteria for the Bilig Institute; a local private school; and agricultural and community centers in Bayangol Soum and Mandam Soum.
Mining camp accommodations in the FIFO model typically include motel- or dormitory-style living quarters with water, sewerage, electricity, heating and cooling. Food is provided for workers in a mess hall-type setting. Healthcare facilities are also usually provided. Other facilities vary depending on the remoteness of the location, the climatic conditions, and the interest of the company in meeting workers’ expectations. For example, the mining camp facilities of Pilbara Iron’s camps in Yandicoogina and Marandoo, Australia include a swimming pool, sporting courts, air-conditioning units in each living quarter, television and internet connection.23
A variation on the FIFO model is the bus-in, bus-out (BIBO) model used where commuting distances allow for it, or airstrips are not available. As for mining companies using the company town model, mining companies often use FIFO in remote areas where skilled workers and infrastructure are in limited supply.
Gated community. In the gated community model, workers and their families are housed in a new neighborhood bordering on, or within an existing local community. The gated community is outside the mine gate, and has most infrastructure necessary to support miners their families. Workers may be hired locally, from elsewhere within the country, or from abroad. The origin of workers in the gated community model varies considerably. Workers may be recruited from the local community, or from other areas. At the Antamina copper and zinc mine in Huaraz, Peru, for example, fewer than 10 percent of mine staff were recruited locally. As a counter-example, at the Escondida copper mine in Antofagasta, Chile, more than 80 percent of mine staff were recruited from local areas.
In the gated community model, the mining company provides basic infrastructure services to workers and their families within the gated community. These services generally include housing, electricity, heating and cooling, and water and sewerage. Gated communities may approximate the company town model in that they also provide an array of social services, including educational, health and recreational services, within the gated community. The mining company may make use of some existing infrastructure, such as roads or electricity connections, to provide service to the gated community, and may expect that, for leisure and entertainment, workers will leave the gated community.
The amount of infrastructure investment that mining companies make outside gated communities differs considerably from case to case. The population outside
23 Pilbara Iron Website. <http://www.pilbarairon.com/SiteContent/working/flyinout.asp>
35
the gated community may indirectly benefit from the creation of some infrastructure, such as roads, built for the mine but available for all to use.
Integrated community. In the integrated community model workers and their families live within existing communities located near the mine. The mining company contributes to infrastructure development in these communities in varying degrees. If the mining company does provide some infrastructure, non-miners are typically not excluded from that infrastructure. Workers are often recruited locally under this model, but may also be recruited from elsewhere, and required to relocate to the existing towns around the mine.
In the Integrated Community model, mining companies seek to utilize a local community’s existing infrastructure and existing institutional framework for providing infrastructure services, rather than building separate infrastructure for miners and their families. How much infrastructure is provided, and the role played by mining companies in providing that infrastructure, varies significantly within the general category of ‘Integrated Community’. In some cases, mining companies contribute heavily to local infrastructure. For example, the Companhia Vale de Rio Doce (CVRD) invested in infrastructure in Canaã dos Carajás, the municipality supplying the majority of workers to the Sossego Copper Mine. Investments included US$39 million in the municipality to build a hospital with 40 beds, a school with 700 students, 100 km of paved highways, 20 km of paved roads, water and sewerage systems, a cultural center, and a police station.24
In general, mining companies are heavily involved in the build-up of transport and electricity infrastructure as these are vital to the operation of the mine. For example, QMM built a deep water, multi-use port at Fort-Dauphin to serve its ilmenite mine. QMM, will operate the port for the life of the mining project after which responsibility and control will go to the Government of Madagascar.25 Likewise, as in Limpopo example described in Section 3.1, mining companies often play a significant role in housing to workers and their families.
Impact of the recruitment and settlement model
Our review of mining experience elsewhere suggests that the choice of recruitment and settlement model does affect influx. Influx is generally lower when the FIFO/BIBO model is used rather than the other models. We did not have sufficient data to calculate the influx multiplier for FIFO cases other than Pilbara. However, we do know that population growth in several of the FIFO/BIBO cases was zero or negative.
Anecdotally, this has been the experience of Mongolia’s other FIFO/BIBO mining experiences. For example: 26
– Boroo Gold uses a bus-in, bus-out model to get its miners back and forth from the mining camp to Ulaanbaatar. The company does use some local suppliers and contractors to provide catering services for its cafeteria. A Boroo
24 “CVRD Inaugurates Sossego.” CVRD Press Release. July 2, 2004.
<http://www.bradespar.com.br/pdf/eFATO_CVRD_050704.pdf> 25 http://www.riotintomadagascar.com/siteware/pdfs/community-relations-plans.pdf 26 Castalia conversation with Boroo Gold and South Gobi Sands Management.
36
Gold official speculated that the higher incomes created by these jobs has allowed some local people to relocate from the soums around the mine, to Ulaanbaatar
– South Gobi Sands claims to have seen little or no increase in population in the nearby soum of Gurvan Tes since it began mining activity in April 2008.
No concrete pattern of effect on influx can be discerned from other multipliers or anecdotes. As Table 3.2 shows, influx varies considerably within the gated community model and within the integrated community model. For example, roughly 11 non-mining migrants came to Parauapebas, near the Carajas mine in Brazil, for every member of the mining and existing population. Influx in the other gated community cases, the Escondida and Pierina mines, were 0.26 and 0.47, respectively, and thus more in line with influx seen in the integrated community cases.
3.2.3 Other factors
None of the other factors we considered, in the cases we reviewed, showed any impact on the influx multiplier. We considered, in particular, the possibility that influx would be affected by:
The remoteness of the mine from major population centers27
GDP per capita in the country in which the mine is located.
One might assume, for example, that influx multipliers are generally lower in the cases in which mines were in remote areas, yet Table 3.2 shows that cases like Carajas and Zoureate contradict this assumption.
27 We considered remoteness to be a function of i) the distance of the mine from major population centers, and ii) the
availability of transport infrastructure available to easily traverse those distances. Some mines, while not far from major population centers in terms of distance are in other ways inaccessible for transport of human and physical capital to and from the mine site. Several of the cases we reviewed in Peru and Chile, for example, were near to towns when measured in terms of km, but were at altitudes that made them difficult to reach.
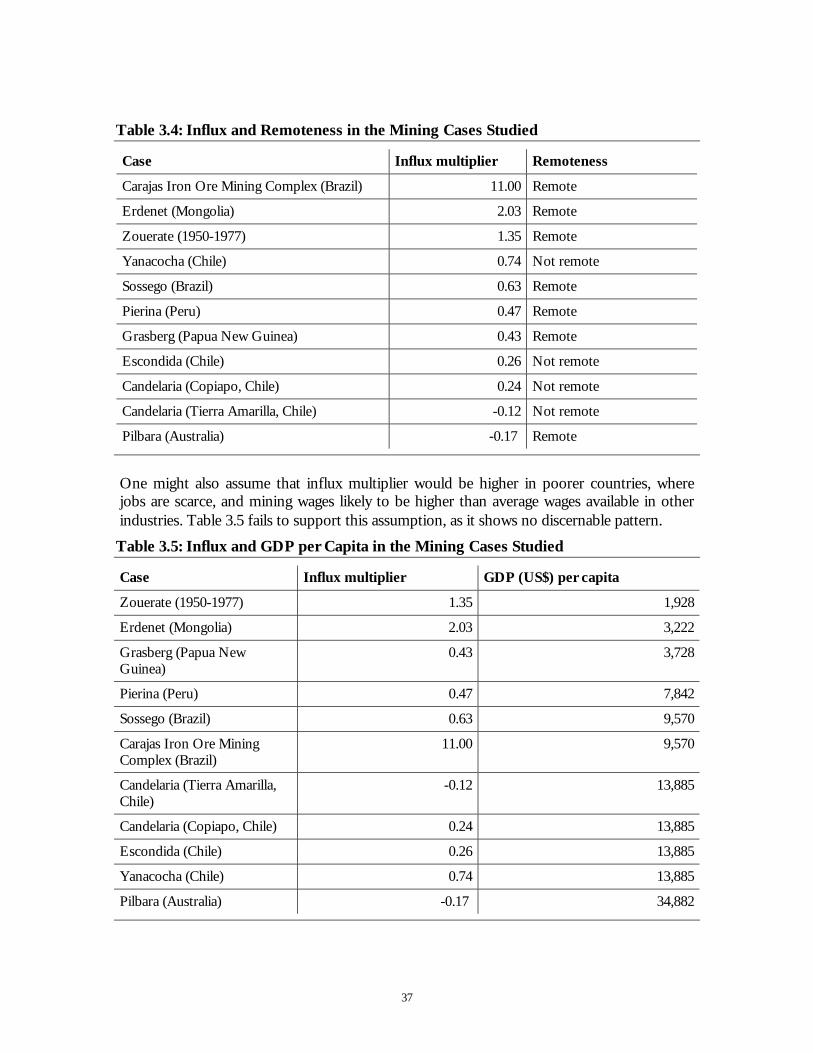
37
Table 3.4: Influx and Remoteness in the Mining Cases Studied
Case Influx multiplier Remoteness
Carajas Iron Ore Mining Complex (Brazil) 11.00 Remote
Erdenet (Mongolia) 2.03 Remote
Zouerate (1950-1977) 1.35 Remote
Yanacocha (Chile) 0.74 Not remote
Sossego (Brazil) 0.63 Remote
Pierina (Peru) 0.47 Remote
Grasberg (Papua New Guinea) 0.43 Remote
Escondida (Chile) 0.26 Not remote
Candelaria (Copiapo, Chile) 0.24 Not remote
Candelaria (Tierra Amarilla, Chile) -0.12 Not remote
Pilbara (Australia) -0.17 Remote
One might also assume that influx multiplier would be higher in poorer countries, where jobs are scarce, and mining wages likely to be higher than average wages available in other industries. Table 3.5 fails to support this assumption, as it shows no discernable pattern.
Table 3.5: Influx and GDP per Capita in the Mining Cases Studied
Case Influx multiplier GDP (US$) per capita
Zouerate (1950-1977) 1.35 1,928
Erdenet (Mongolia) 2.03 3,222
Grasberg (Papua New Guinea)
0.43 3,728
Pierina (Peru) 0.47 7,842
Sossego (Brazil) 0.63 9,570
Carajas Iron Ore Mining Complex (Brazil)
11.00 9,570
Candelaria (Tierra Amarilla, Chile)
-0.12 13,885
Candelaria (Copiapo, Chile) 0.24 13,885
Escondida (Chile) 0.26 13,885
Yanacocha (Chile) 0.74 13,885
Pilbara (Australia) -0.17 34,882

38
39
3.3 How to Avoid the Problems Caused by Influx? Governments and mining companies can avoid the problems caused by influx through coordination and planning. Influx may not be easy to predict, but it can be planned for. Coordination is particularly important—and its absence particularly noticeable—where mining companies use the integrated community model, because the integrated community model relies more than the other models on infrastructure outside the mine gate, and may supply some of that infrastructure.
The Paraupebas and Limpopo cases described earlier in this section stand out as examples of how governments and mining companies failed to accommodate the infrastructure needs of local populations. In the case of Parauapebas, infrastructure was planned to accommodate miners, but not influx. In Limpopo, cash was made available to accommodate workers, but without regard to the capacity of the market to deliver affordable housing. Miners and non-miners were therefore left without proper infrastructure. As a 2003 study found, referring to Limpopo as well as other mining areas in South Africa, “There is no overall strategy being pursued by the industry with regard to whether, or what type of provision (investment in housing stock, or housing subsidies for employees) there will be in the future”.28
The experiences at the Inti Rayimi Mining Company’s Kori Kollo gold mine in Bolivia and the Yanacocha Mining Company’s gold and silver mine in Cajamarca, Peru offer better examples of how the needs of local populations can be accommodated. These experiences are described in Box 3.4 and Box 3.5.
Local development programs or foundations like those described in Box 3.4 and Box 3.5 have become increasingly common vehicles for mining companies, donors, and local governments to pool funds, and jointly manage expenditure of those funds.29 Inti Rayimi and Kori Kollo are examples of the integrated community model of recruitment and settlement. We also include, in Box 3.6, an example from Papua New Guinea of a local development program used in conjunction with the gated community recruitment and settlement model. Finally, Box 3.7 and Box 3.8 describe other, similar programs established at mines in Madagascar and Tanzania.
Where a foundation is established, these are generally established as non-profit institutions, with independent boards of directors that include representation from the mining company, local government, and possibly other donors and community members. The foundations receive some funding from the mining company as well as general direction from the mining company on how regional development should integrate with the mine’s resource development.
28 Lewis, Peter. “Housing and occupational health and safety in the South African mining industry: Part 2.” Council of
Scientific and Industrial Research (CSIR) report to the Safety in Mines Research Advisory Committee (SIMRAC). December 2003.
29 Mining, Minerals, and Sustainable Development. “Breaking New Ground.” International Institute for Environment and Development and World Business Council for Sustainable Development. Earthscan Publications Ltd: London and Sterling, VA: 2002. 213.

40
Box 3.4: The Inti Raymi Foundation The Inti Raymi foundation was created in 1991, as a private, nonprofit institution designed to fund social programs for communities near the Inti Raymi Mining Company’s Kori Kollo gold mine in Bolivia. The foundation has three major focus areas: health care, rural education, and training. The foundation has 58 fulltime employees and its own board of directors. It receives contributions of US$840,000 annually from the Inti Raymi Mining Company, along with donations from domestic and foreign sources. Since its creation, it has spent US$4 million on social programs. All programs are managed and funded by the foundation for five years, after which responsibilities are transferred to the local government. The foundation’s main goal, within health care, is to lower the maternal and child morbidity and mortality rate, which are high compared with many parts of the world. The foundation has a staff of two doctors, two nurses, and a dentist. The foundation has also helped expand the potable water supply, and to train residents how to operate and maintain water systems. In rural education, the foundation has supported 18 rural schools, with 1,394 students and 87 teachers, and has co-funded construction of 10 new schools. The foundation’s support to schools includes providing training and education to teachers, and providing nutritional assistance to children through school breakfast and lunch programs. In Oruro the foundation funded and built the Center for Multiple Educational and Intercultural Services, which has a library, computer center, and sports center. The Inti Raymi Foundation also provides many types of training to support the local economy. It has an Agricultural and Livestock Breeding Project, which constitutes the foundation’s primary activity. A local slaughterhouse cooperative was formed, and improvements in sheep handling were made. Local women were given the opportunity to work and increase their incomes through the Handicrafts Project. Inti Raymi also uses US$230,000 a year to directly finance other community projects. Managers meet weekly with community members to discuss requests for money to fund local events and projects. In its direct contact with the community, Inti Raymi focuses mainly on avoiding conflicts that delay the normal mining operation, while the Inti Raymi Foundation focuses on approving projects that promote regional development. Source: Bouton, Lawrence. The Private Sector and Development: Five Case Studies. World Bank
Publications. 1998.
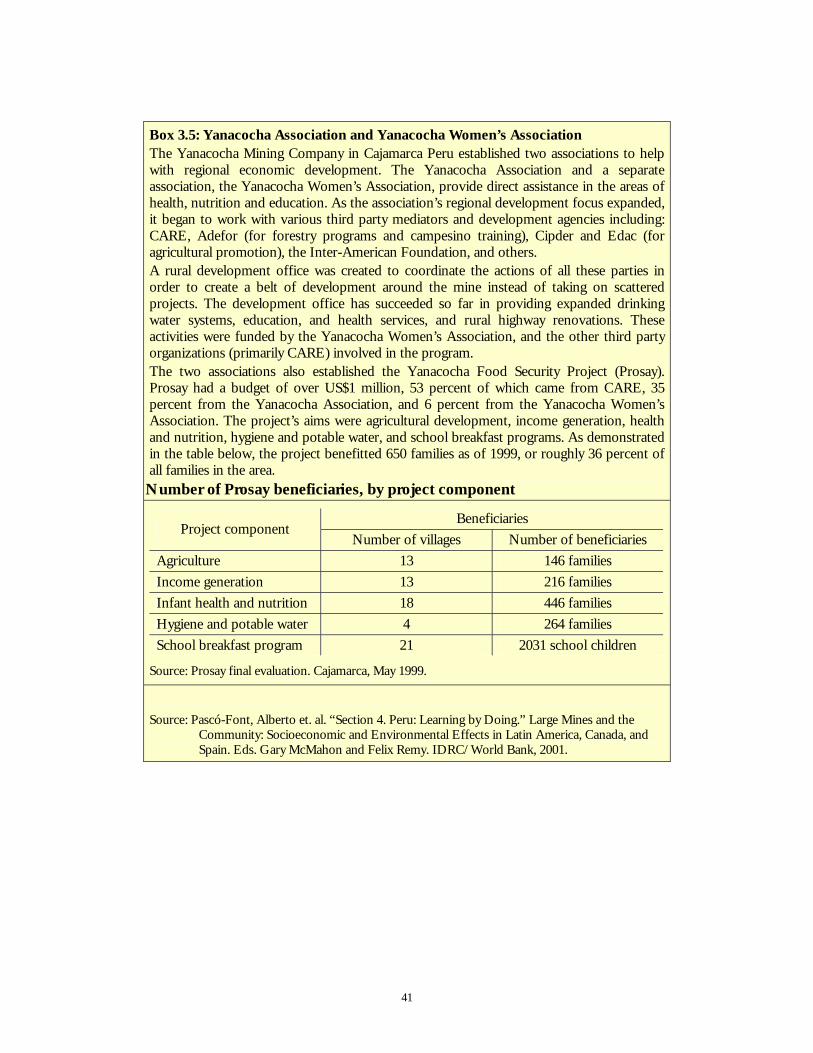
41
Box 3.5: Yanacocha Association and Yanacocha Women’s Association The Yanacocha Mining Company in Cajamarca Peru established two associations to help with regional economic development. The Yanacocha Association and a separate association, the Yanacocha Women’s Association, provide direct assistance in the areas of health, nutrition and education. As the association’s regional development focus expanded, it began to work with various third party mediators and development agencies including: CARE, Adefor (for forestry programs and campesino training), Cipder and Edac (for agricultural promotion), the Inter-American Foundation, and others. A rural development office was created to coordinate the actions of all these parties in order to create a belt of development around the mine instead of taking on scattered projects. The development office has succeeded so far in providing expanded drinking water systems, education, and health services, and rural highway renovations. These activities were funded by the Yanacocha Women’s Association, and the other third party organizations (primarily CARE) involved in the program. The two associations also established the Yanacocha Food Security Project (Prosay). Prosay had a budget of over US$1 million, 53 percent of which came from CARE, 35 percent from the Yanacocha Association, and 6 percent from the Yanacocha Women’s Association. The project’s aims were agricultural development, income generation, health and nutrition, hygiene and potable water, and school breakfast programs. As demonstrated in the table below, the project benefitted 650 families as of 1999, or roughly 36 percent of all families in the area. Number of Prosay beneficiaries, by project component
Beneficiaries Project component
Number of villages Number of beneficiaries Agriculture 13 146 families Income generation 13 216 families Infant health and nutrition 18 446 families Hygiene and potable water 4 264 families School breakfast program 21 2031 school children
Source: Prosay final evaluation. Cajamarca, May 1999.
Source: Pascó-Font, Alberto et. al. “Section 4. Peru: Learning by Doing.” Large Mines and the
Community: Socioeconomic and Environmental Effects in Latin America, Canada, and Spain. Eds. Gary McMahon and Felix Remy. IDRC/World Bank, 2001.
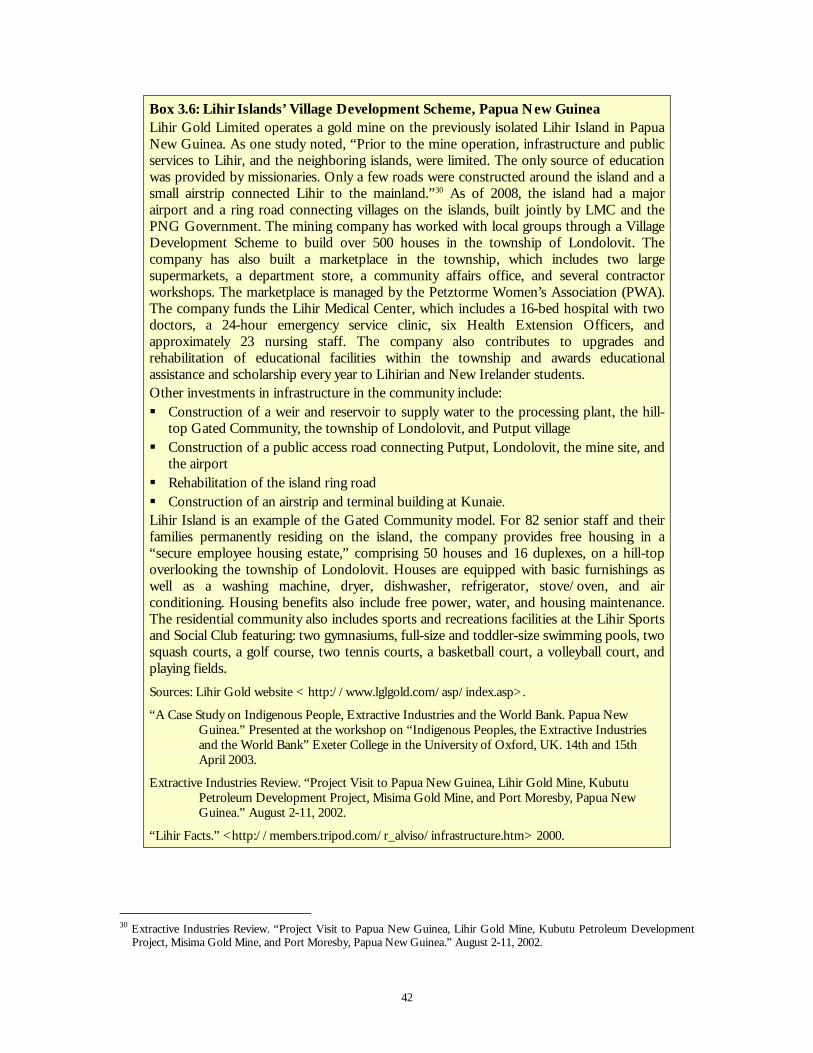
42
Box 3.6: Lihir Islands’ Village Development Scheme, Papua New Guinea Lihir Gold Limited operates a gold mine on the previously isolated Lihir Island in Papua New Guinea. As one study noted, “Prior to the mine operation, infrastructure and public services to Lihir, and the neighboring islands, were limited. The only source of education was provided by missionaries. Only a few roads were constructed around the island and a small airstrip connected Lihir to the mainland.”30 As of 2008, the island had a major airport and a ring road connecting villages on the islands, built jointly by LMC and the PNG Government. The mining company has worked with local groups through a Village Development Scheme to build over 500 houses in the township of Londolovit. The company has also built a marketplace in the township, which includes two large supermarkets, a department store, a community affairs office, and several contractor workshops. The marketplace is managed by the Petztorme Women’s Association (PWA). The company funds the Lihir Medical Center, which includes a 16-bed hospital with two doctors, a 24-hour emergency service clinic, six Health Extension Officers, and approximately 23 nursing staff. The company also contributes to upgrades and rehabilitation of educational facilities within the township and awards educational assistance and scholarship every year to Lihirian and New Irelander students. Other investments in infrastructure in the community include: Construction of a weir and reservoir to supply water to the processing plant, the hill-
top Gated Community, the township of Londolovit, and Putput village Construction of a public access road connecting Putput, Londolovit, the mine site, and
the airport Rehabilitation of the island ring road Construction of an airstrip and terminal building at Kunaie.
Lihir Island is an example of the Gated Community model. For 82 senior staff and their families permanently residing on the island, the company provides free housing in a “secure employee housing estate,” comprising 50 houses and 16 duplexes, on a hill-top overlooking the township of Londolovit. Houses are equipped with basic furnishings as well as a washing machine, dryer, dishwasher, refrigerator, stove/oven, and air conditioning. Housing benefits also include free power, water, and housing maintenance. The residential community also includes sports and recreations facilities at the Lihir Sports and Social Club featuring: two gymnasiums, full-size and toddler-size swimming pools, two squash courts, a golf course, two tennis courts, a basketball court, a volleyball court, and playing fields. Sources: Lihir Gold website < http://www.lglgold.com/asp/index.asp>.
“A Case Study on Indigenous People, Extractive Industries and the World Bank. Papua New Guinea.” Presented at the workshop on “Indigenous Peoples, the Extractive Industries and the World Bank” Exeter College in the University of Oxford, UK. 14th and 15th April 2003.
Extractive Industries Review. “Project Visit to Papua New Guinea, Lihir Gold Mine, Kubutu Petroleum Development Project, Misima Gold Mine, and Port Moresby, Papua New Guinea.” August 2-11, 2002.
“Lihir Facts.” <http://members.tripod.com/r_alviso/infrastructure.htm> 2000.
30 Extractive Industries Review. “Project Visit to Papua New Guinea, Lihir Gold Mine, Kubutu Petroleum Development
Project, Misima Gold Mine, and Port Moresby, Papua New Guinea.” August 2-11, 2002.
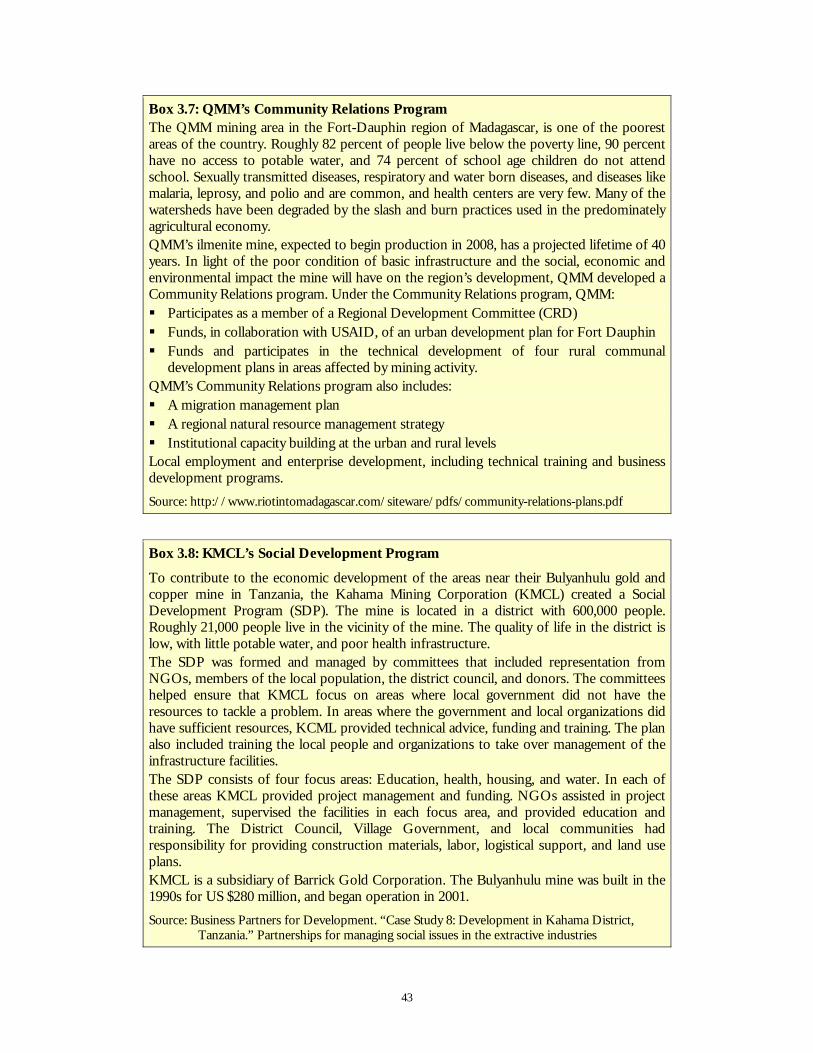
43
Box 3.7: QMM’s Community Relations Program The QMM mining area in the Fort-Dauphin region of Madagascar, is one of the poorest areas of the country. Roughly 82 percent of people live below the poverty line, 90 percent have no access to potable water, and 74 percent of school age children do not attend school. Sexually transmitted diseases, respiratory and water born diseases, and diseases like malaria, leprosy, and polio and are common, and health centers are very few. Many of the watersheds have been degraded by the slash and burn practices used in the predominately agricultural economy. QMM’s ilmenite mine, expected to begin production in 2008, has a projected lifetime of 40 years. In light of the poor condition of basic infrastructure and the social, economic and environmental impact the mine will have on the region’s development, QMM developed a Community Relations program. Under the Community Relations program, QMM: Participates as a member of a Regional Development Committee (CRD) Funds, in collaboration with USAID, of an urban development plan for Fort Dauphin Funds and participates in the technical development of four rural communal
development plans in areas affected by mining activity. QMM’s Community Relations program also includes: A migration management plan A regional natural resource management strategy Institutional capacity building at the urban and rural levels
Local employment and enterprise development, including technical training and business development programs. Source: http://www.riotintomadagascar.com/siteware/pdfs/community-relations-plans.pdf
Box 3.8: KMCL’s Social Development Program
To contribute to the economic development of the areas near their Bulyanhulu gold and copper mine in Tanzania, the Kahama Mining Corporation (KMCL) created a Social Development Program (SDP). The mine is located in a district with 600,000 people. Roughly 21,000 people live in the vicinity of the mine. The quality of life in the district is low, with little potable water, and poor health infrastructure. The SDP was formed and managed by committees that included representation from NGOs, members of the local population, the district council, and donors. The committees helped ensure that KMCL focus on areas where local government did not have the resources to tackle a problem. In areas where the government and local organizations did have sufficient resources, KCML provided technical advice, funding and training. The plan also included training the local people and organizations to take over management of the infrastructure facilities. The SDP consists of four focus areas: Education, health, housing, and water. In each of these areas KMCL provided project management and funding. NGOs assisted in project management, supervised the facilities in each focus area, and provided education and training. The District Council, Village Government, and local communities had responsibility for providing construction materials, labor, logistical support, and land use plans. KMCL is a subsidiary of Barrick Gold Corporation. The Bulyanhulu mine was built in the 1990s for US $280 million, and began operation in 2001. Source: Business Partners for Development. “Case Study 8: Development in Kahama District,
Tanzania.” Partnerships for managing social issues in the extractive industries
44
3.4 What are the Social Advantages and Disadvantages of Each Recruitment and Settlement Model?
Mining operations have both positive and negative social impacts. Positive social impacts of mining include:
The creation of jobs at the mine, with suppliers or contractors to the mine, or servicing the personal needs of miners and their families
Improved infrastructure services near the mine (for example: water, wastewater, heating, electricity, transport) and social services (for example, healthcare and education)
As a result of higher incomes and improved infrastructure and social services, lower disease and mortality rates, and higher levels of literacy and education among the population near the mine
The creation of jobs not related to mining, as businesses are attracted to the area because of the availability of infrastructure and better living conditions.
Negative social impacts of mining may include:
Overcrowding and overstretched infrastructure, as migrants move to the area in search of jobs, before sufficient infrastructure can be built to support the population
Conflict between miners and non-miners because of disparities in wealth or access to services
Price inflation in a mining area, as a result of increased wealth, and increasing demand for goods and services in the face of limited supply
Excessive dependence on the mine for infrastructure and jobs such that, when the mining activity stops, the population has trouble finding jobs in the area and providing and sustaining its own infrastructure.
Some of these social impacts are felt when the mine is built and operated. Others are felt only after the mine has shut down operations. In Section 3.4.1 we describe the positive and negative social impacts of mining while the mine is operating. In Section 3.4.2 we describe the positive and negative social impacts of mining once the mine stops operating. We refer to this latter category of social impacts as “sustainability impact”. We found that social impacts and sustainability impact differ depending on which recruitment and settlement model is used. We therefore organize our summary of impacts and sustainability impact by recruitment and settlement models described in Section 3.2.2.
3.4.1 Social impacts
There are differences between the social impacts of the different recruitment and settlement models, namely:
Company town. Studies of company towns show positive and negative social impacts. Positive social impacts of the company town are the health benefits of the family-centered style of accommodations. In Southern Africa, for example, the migrant labor system of staffing mines, in which workers spend months away from home in single-sex hostels with frequent access to sex workers, is seen as a
45
major contributor to the spread of HIV/AIDS.31 The National Union of Mineworkers (NUM) in South Africa promotes workers living with their families in order to reduce the prevalence of HIV/AIDS among mineworkers.
Negative social impacts of the company town model come from the town’s dependence on the mining company for employment and economic activity. This negative social impact is discussed in the following section.
FIFO. Studies of mining operations using FIFO show that the model has advantages from a social perspective in that the model:
– Benefits workers because it allows them some flexibility to choose where they live. Miners’ families also therefore have more flexibility in choosing which jobs to take, and what social infrastructure to live near (schools and hospitals). The only requirement is that they be able to reach the airport from which they are flown to the mine site.
– Has a limited cultural, environmental, or economic impact on local areas, because the increase in the mining population is limited to mine workers, and is kept within the mine gate.
The model’s principal disadvantages, from a social perspective, are that it:
– May have negative consequences for the families of workers. The primary burden of adjustment to FIFO operations falls on women who, if married with children, must assume a single-parent role. Research in Australia suggests that FIFO mothers experience higher levels of family dysfunction than non-FIFO mothers. Critics also note that, among the mining population, FIFO may lead to greater abuse of alcohol and drugs, greater instances of family violence and break-ups, parenting problems, and reduced community involvement.32
– Does not, in and of itself, provide jobs or infrastructure services near the mine.
Gated community. The positive social impacts of this model include the health benefits of workers living with their families, and the more limited cultural, environmental, and economic impact on local areas than under the company town model.
The same characteristics of the gated community model that lead to positive social impacts also lead to negative social impacts:
– On the one hand, the gated community model allows for less economic and cultural interaction between the mining and non-mining populations than the company town model.
– On the other hand, the gated community model allows for more economic and cultural interaction between the mining and non-mining population than the FIFO model.
31 The Mining, Minerals and Sustainable Development Project. “Breaking New Ground.” 204. 32 Houghton, D.S. “Long-Distance Commuting: a new Approach to Mining in Australia.” The Geographical Journal, 159:3
(1993), 281-290.
46
Either too much, or too little economic and cultural interaction can create social conflict. Whether social impact is net positive or net negative depends on the specific context in which the gated community model is used, and the perspective of the individuals affected.
Integrated community. The social impacts of the integrated community model also vary depending on how much the mining company gets involved in providing infrastructure and jobs, relative to what is needed and expected by the local population.
The integrated community model has social impacts similar to a gated community or company town model. Positive impacts include:
– Workers can live with their families, as under the gated community and company town models
– Existing populations around the mine stand to benefit more than under the company town or gated community model, because there is less of a divide between the mining and non-mining populations
Negative impacts include the risk of social tensions because of cultural differences or income disparities between the mine workers and existing population. For example, in Yanacocha, the existing population associates the benefits of improved services and higher quality of life with the mine’s presence. However, the economic activity generated by the mine has also brought with it a higher cost of living, dollarization of prices, and an influx of in-migrants that the existing population does not always view as desirable. Mineworkers, who primarily migrate from the coast, are viewed by locals as disorderly and rough. Cajamarca residents note the deterioration of decent customs in the appearance of nightclubs, and an increase in prostitution. Additionally, residents complain of a significant increase in crime.33
The social costs of the integrated community model are arguably little different than the negative impacts of any urbanization. Cultural conflict between existing and new populations is arguably less of a problem (unless it leads to violent conflict) than the other social problems created when insufficient infrastructure exists to support the needs of a population.
3.4.2 Sustainability impact
As when the mine is operating, different recruitment and settlement models have different effects on mining areas after the mine stops operating. In general, towns that rely on a single resource in order to sustain the economic well-being of the town are more vulnerable to commodity price fluctuations and the life of the mine’s reserves. In contrast, areas with existing populations have economic activity independent of the mine, which is more likely to be sustained when mining operations close. Sustainability for each of the four models includes:
33 Pascó-Font, Alberto et. al. “Section 4. Peru: Learning by Doing.” Large Mines and the Community: Socioeconomic and
Environmental Effects in Latin America, Canada, and Spain. Eds. Gary McMahon and Felix Remy. IDRC/World Bank, 2001.
47
Company town. Historically, in remote company towns, the closing of the mine meant the closing of the town as well. When mines close, families must often move in order to find employment opportunities elsewhere. Few alternative employment opportunities typically exist due to the remoteness of many mining operations, and where such opportunities do exist, mine workers may not have transferrable skills. Examples additional to those (in the Congo and Guyana) cited in Section 3.1 can be found in tin mine closures in Bolivia, coal mine closures in parts of the former Soviet Union, and retrenchment in the South African gold industry.34
FIFO. The FIFO model does not typically cause any community development or growth in economic activity. Sustainability is not a major concern with FIFO because the model creates little or nothing to sustain. As a result, mining companies operating under FIFO model do not typically take measures to sustain economic activity after the mining operation closes
Gated community. The gated community model is used in or near existing populations. The prospects for economic activity to continue after the mine closes is therefore good, since some economic activity existed before the mine opened
Integrated community. The integrated community model is used in or near existing populations. The prospects for economic activity to continue after the mine closes is therefore good, since some economic activity existed before the mine opened.
As in the gated community model, some economic activity existed before the mine opened. The chances are therefore better than under the company town model, that some economic activity will therefore be sustainable after the mine closes.
3.5 How can Governments Maximize the Economic Benefits from Mining Activities?
A government’s objectives are, generally speaking, to maximize economic welfare for the country. A government can maximize the benefits from mining activity by:
Having its own clear vision of the tradeoffs between the fiscal benefits (government revenue from mining activity), and external social benefits (improved welfare for the country as a whole) of mining activity
Recognizing what motivates mining companies, and how this motivation affects the decisions mining companies make.
We analyze in Section 3.5.1 mining companies’ motivations and how those motivations affect their choice of recruitment and settlement model, which in turn determines their commitments to developing infrastructure. In Section 3.5.2, we analyze the tradeoffs for government between fiscal and economic benefits from mining activity.
34 Ibid.
48
3.5.1 Recognizing what motivates mining companies
Private mining companies will generally choose the recruitment and settlement model that promises to earn the most revenue at lowest cost, thereby maximizing profits. Revenues, in a commodity business like mining, where mining companies are generally price takers, depend primarily on volumes extracted. Maximizing profits in the mining business is therefore primarily focused on minimizing costs for any volume extracted.
The financial impact on a mining company of each of the recruitment and settlement models are as follows:
Company town. The cost to the mining company of building a company town is usually higher than the cost to the mining company of other recruitment and settlement models. The company town model typically requires the most amount of capital expenditure on infrastructure of any of the models surveyed in this paper, because the mining company must:
– Build infrastructure for more categories of population than in the other models: miners, their families, the service population, and often the mining contractor and supply population
– Build more infrastructure than in the other models. In the company town model, the mining company builds an entire town anew, rather than relying on existing infrastructure to serve the needs of the town’s population.
The mining company also typically commits, in a company town, to operating much of the infrastructure it builds. Historically, mining companies provide infrastructure services to its employees at cost, or below cost, as part of their package of employment benefits.
Because of the cost, company towns are less commonly seen today than they were in previous decades. In Canada, the last new residential mining town was created in Tumbler Ridge, British Columbia in the late 1970s. In Australia, the last mining town was established at Olympic Dam in South Australia in the mid-1980s.35
Before building the mine in East Kimberley, Western Australia, Argyle Diamonds estimated that construction of a company town would have added AU$72 million (US$58 million) to the upfront capital cost of the mining project, compared to the FIFO model chosen. Argyle also estimated that total costs (capital and operating costs) from using a FIFO model over a twenty-year period would be as much as 50 percent lower than using a company town model.
FIFO. Mining companies tend to use the FIFO model when developing mines in remote, sparsely populated areas, because it:
– Requires less capital expenditure than other recruitment and settlement models
– Allows the companies to draw from a larger labor pool.
Over the past two decades, the FIFO model has been extensively utilized in remote areas of Western Australia and Canada’s Northwest Territories, areas with severe climatic conditions, sparse populations, and large geographical expanses.
35 The Chamber of Minerals and Energy, Western Australia. "Fly In/Fly Out: A Sustainability Perspective." January 2005.
49
As of 2005, 46.6 percent of mineworkers were employed using a FIFO model in Western Australia, totaling an estimated AU$12.6 billion per year production value for mining operations. A 1991 survey of 26 mines conducted by Australia’s Department of Mines indicated the two major reasons for adopting FIFO as: isolation of the project site (44 percent) and short life of the project (31 percent).36
Mining companies often see the FIFO model as a better alternative to the Company Town because upfront capital expenditures on physical infrastructure are lower. FIFO will generally become more attractive to mining companies as the number of workers needed decreases, and the life span of the mine decreases
Gated community. The gated community model requires more upfront infrastructure investment than FIFO, because the gated community must support workers and their families living near the mine on a permanent basis. Some of the gated community models surveyed in this paper (for example, El Pinar) also lie far enough from the mine site that mining camps must also be built, and workers bused-in and bused-out from those camps. The upfront capital costs of the gated community model are therefore likely to be higher than in the FIFO model, but lower than in the company town model.
Integrated community. The integrated community model generally requires less capital expenditure than the company town and gated communities’ models. The financial implications for the mining companies vary depending on how much the companies spend on infrastructure or social services in the communities near the mine. This in turn depends on what infrastructure already exists to support workers, and what additional infrastructure the mining company feels it needs to build in order to comply with its social license to operate.
Finally, it is important to note that a mining company’s goal to maximize profit is usually constrained by other factors. These factors include:
Requirements in mining companies’ investments agreements with governments, or other requirements in law
Non-financial objectives, usually part of what mining companies refer to as their “social license to operate”.
For example, Taktics4 has recommended a recruitment and settlement plan (on which the “Khanbogd /South Gobi influx scenario is based) to Ivanhoe Mines which required higher capital and operating cost expenditure than another option (on which the “Khanbogd Centric” influx scenario is based.) Taktics4 made this recommendation because the plan “delivers national, aimag and soum government expectations for broader regional economic development opportunities. It may also reduce pressure on [Ivanhoe Mines] to be the sole contributor to town infrastructure or be the primary reason for [Khanbogd’s] existence”.37
36 “Fly in/Fly out: A Sustainable Perspective.” The Chamber of Minerals & Energy, Western Australia. January 2005. 37 Taktics4 “Oyu Tolgoi Accommodation and Infrastructure Model,” October 2007. p. 19.
50
3.5.2 Estimating the tradeoff between cash and non-cash benefits
A government’s primary goal in granting a mining concession should be to maximize the value to the country as a result of mining. Generally, governments receive this value from a mining operation as:
Cash, through taxes on the mining companies’ operations or royalties from the mine
Other external benefits (net of external costs) that add to national welfare, but are difficult to measure and accrue to the population. For example, the training provided by mine companies may work to lift the skill level of the community as a whole over time, or employment provided in service industries may offer attractive jobs in areas that currently have little formal employment.
In this paper, we refer to the sum of cash and external benefits governments receive as “economic benefits”. Governments can maximize the economic benefits they receive from a mining concession by maximizing the sum of all of the above types of benefits. In other words, governments maximize the economic benefit they receive from mining when they receive:
MAX[C + (EB-EC)]
Where:
C=Cash received from taxes, royalties or similar payments
EB=External benefits accruing to the country as a whole, as a result of the mining operations
EC=External costs accruing to the country as a whole, as a result of the mining operations.
In practice, this is a difficult calculation, as there will be tradeoffs between, for example, the value received through royalties and the value of investments the mining company is expected to make. The values of terms “EB” and “EC” are difficult if not impossible to measure. The EB and EC terms represent the value of many of what we called “social impacts” and “sustainability impact” in Section 3.4.
Governments can improve the royalties they receive through negotiations with mining companies, or by holding open competitions for mineral resources and awarding concessions to the highest bidders. However, it is important to recognize that mines can only yield as much value as their product can be sold for. Because of this, there will be tradeoffs between governments’ goal to maximize cash income from mining (the C term above), and its desire to have mining companies spend money on other things like infrastructure. The recruitment and settlement model chosen therefore affects how much cash mining companies are able to pay. To the extent that mining companies are forced to spend money building infrastructure, they will have less available to pay in taxes and royalties.
An example of the tradeoffs between cash payments and infrastructure provision can be seen in Bolivia, where the country’s Mining Code permits companies to invest in community infrastructure and to offset this against tax liabilities. This approach to building infrastructure
51
in a mining area is sometimes taken where provincial and local government capacity is too weak to deliver basic services.38
The tradeoffs between cash and non-cash benefits under each of the recruitment and settlement models are as follows:
Company town. Mining companies will be able to pay less tax and fewer royalties in this model than in the other models because the mining company’s upfront investment in infrastructure is costlier. Higher costs for a mining company mean lower profits and lower profits mean lower income on which to pay taxes. Lower profits will also mean lower royalties, if royalties are tied to the mine’s profitability. If royalties are tied instead to the value of the product sold, royalties may still decrease as the mine’s output and employment decline with profitability
FIFO. The FIFO model provides less employment and economic opportunities in the local area than building a mining town would. However, FIFO is generally done in areas where few people live. The economic benefits of creating employment and economic opportunities in places where few people live may not be high. The lower cost of FIFO increases the profitability of the mining operation, and so potentially the tax and royalty payments to government
Gated community. The economic impact of this model depends, as in the other models, on how much infrastructure expenditure the mining company must make and therefore how much money is left over for royalties or other payments to the government.
Integrated community. The integrated community model relies on existing infrastructure to accommodate workers and their families. As a result, this model requires an existing, moderate sized town. To the extent that this model is financially better for the mining company, because it saves money they would otherwise spend on infrastructure and transport costs, it also means more cash available for government royalties and hence higher welfare.
An important tradeoff for Monoglia to consider is the tradeoff between cash revenues from mining and the possible national welfare benefits of developing the South Gobi region. Southern Mongolia has two areas in which multiple private mining companies are developing separate mines: The coal mines near Nariin Sukhait, and the copper, gold and coal mines in the region the Government now refers to as Galbyn Gobi. It is possible that the recruitment and settlement models the mining companies are using, or are considering, are sub-optimal from a national welfare perspective. In other words, it is possible that the recruitment and settlement models that are best for the mining companies maximize the “C” term, but do not maximize the sum of [C + (EB-EC)].
As we discussed in Section 2.1, the government is considering a regional approach to developing the Galbyn Gobi region, and may eventually want to consider something similar for Nariin Sukhait. The government’s plans in Galbyn Gobi include the construction of a new town in the region, and the promotion of mining-related industries such as metals
38 International Institute for Environment and Development and World Business Council for Sustainable Development.
Earthscan Publications Ltd: London and Sterling, VA: 2002.

52
processing. The government may therefore prefer that mining companies in the region use the integrated community recruitment and settlement models rather than FIFO, and that the mining companies therefore contribute to infrastructure investment in the new town. Government may accordingly wish to make this preference a point of their negotiations with the mining companies currently operating in South Gobi, or a prequalification criterion for the mining companies who will bid on future Tavan Tolgoi concessions.
If the government decides to try to push the mining companies from the financially best (from the perspective of the mining companies) recruitment and settlement models, it does so at the expense of fiscal revenues. Investments in infrastructure detract from what mining companies are able to pay in royalties and taxes. The decision is justified if government believes that building a new town in Galbyn Gobi, and investing in minerals processing has external benefits that outweigh what the government sacrifices immediately in terms of cash, and hence maximizes value for the country as a whole. The analysis required to make the decision is substantial, and beyond the scope of this paper, but is essential if the government wants to consider trying to shaping the mining companies’ choices of recruitment and settlement models beyond what if financially best.
53
4 Influx Scenarios and Infrastructure Needs in South Gobi
This section recommends how Government can plan for population growth in South Gobi’s mining areas. We begin, in Section 4.1 by analyzing Government and mining companies’ population and influx forecasts in light of international experience. In Section 4.2 we estimate infrastructure needs and costs required to meet the range of different influx scenarios we think are possible.
4.1 What Range of Influx Scenarios is Likely? It seems likely that population in the soums near Oyu Tolgoi and Tavan Tolgoi could nearly triple in the first three years of Oyu Tolgoi’s operations, growing from 10,000 to 30,000. Roughly half of this growth would be influx (in other words, migrants other than miners and their families), and roughly half of the growth would occur in Khanbogd soum center.
We recommend the Government plan, in phases, to plan for the accommodation for a medium level of influx in South Gobi that:
Looks ahead three to five years only, and reassesses every year, so as to:
– Avoid having too much infrastructure built. If the rate of influx is lower than predicted, infrastructure plans can be scaled back and the infrastructure built can be used to serve the still growing population of miners and their families during the first 10 years of mining operations
– Avoid having too little infrastructure built. If the rate of influx is higher than predicted, the infrastructure gap is not so large that it is no longer possible to catch-up to the population’s infrastructure needs within a few years.
Focuses only on those mines where recruitment and accommodation plans are known, and therefore:
– The size of the mining population is known
– Predictions of influx can be made based on international experience with different recruitment and settlement models.
To our knowledge, only Ivanhoe Mines (through their consultants, Taktics4), Energy Resources, South Gobi Sands, Qinhua and MAK have thought about recruitment and settlement strategies. We recommend the Government start planning immediately for the infrastructure needed in the soums nearest to these mines.
We focus primarily on influx and from the start of mining operations onwards, because the construction phase is by its nature temporary, and often self-contained. We include only a brief discussion, in Section 4.1.3, of projected construction workforce needs and likely influx at the Oyu Tolgoi and Tavan Tolgoi mines. More important for South Gobi at present is to think beyond the temporary construction influx to the medium to longer-term infrastructure needs of the region.
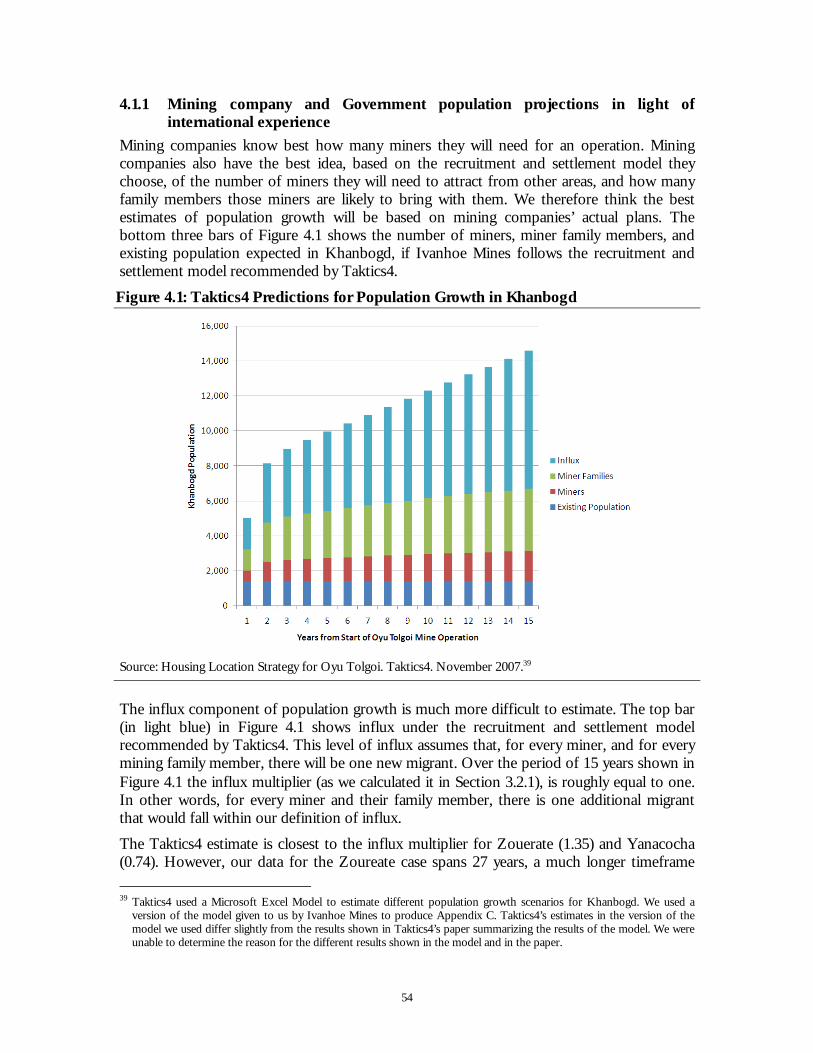
54
4.1.1 Mining company and Government population projections in light of international experience
Mining companies know best how many miners they will need for an operation. Mining companies also have the best idea, based on the recruitment and settlement model they choose, of the number of miners they will need to attract from other areas, and how many family members those miners are likely to bring with them. We therefore think the best estimates of population growth will be based on mining companies’ actual plans. The bottom three bars of Figure 4.1 shows the number of miners, miner family members, and existing population expected in Khanbogd, if Ivanhoe Mines follows the recruitment and settlement model recommended by Taktics4.
Figure 4.1: Taktics4 Predictions for Population Growth in Khanbogd
Source: Housing Location Strategy for Oyu Tolgoi. Taktics4. November 2007.39
The influx component of population growth is much more difficult to estimate. The top bar (in light blue) in Figure 4.1 shows influx under the recruitment and settlement model recommended by Taktics4. This level of influx assumes that, for every miner, and for every mining family member, there will be one new migrant. Over the period of 15 years shown in Figure 4.1 the influx multiplier (as we calculated it in Section 3.2.1), is roughly equal to one. In other words, for every miner and their family member, there is one additional migrant that would fall within our definition of influx.
The Taktics4 estimate is closest to the influx multiplier for Zouerate (1.35) and Yanacocha (0.74). However, our data for the Zoureate case spans 27 years, a much longer timeframe 39 Taktics4 used a Microsoft Excel Model to estimate different population growth scenarios for Khanbogd. We used a
version of the model given to us by Ivanhoe Mines to produce Appendix C. Taktics4’s estimates in the version of the model we used differ slightly from the results shown in Taktics4’s paper summarizing the results of the model. We were unable to determine the reason for the different results shown in the model and in the paper.
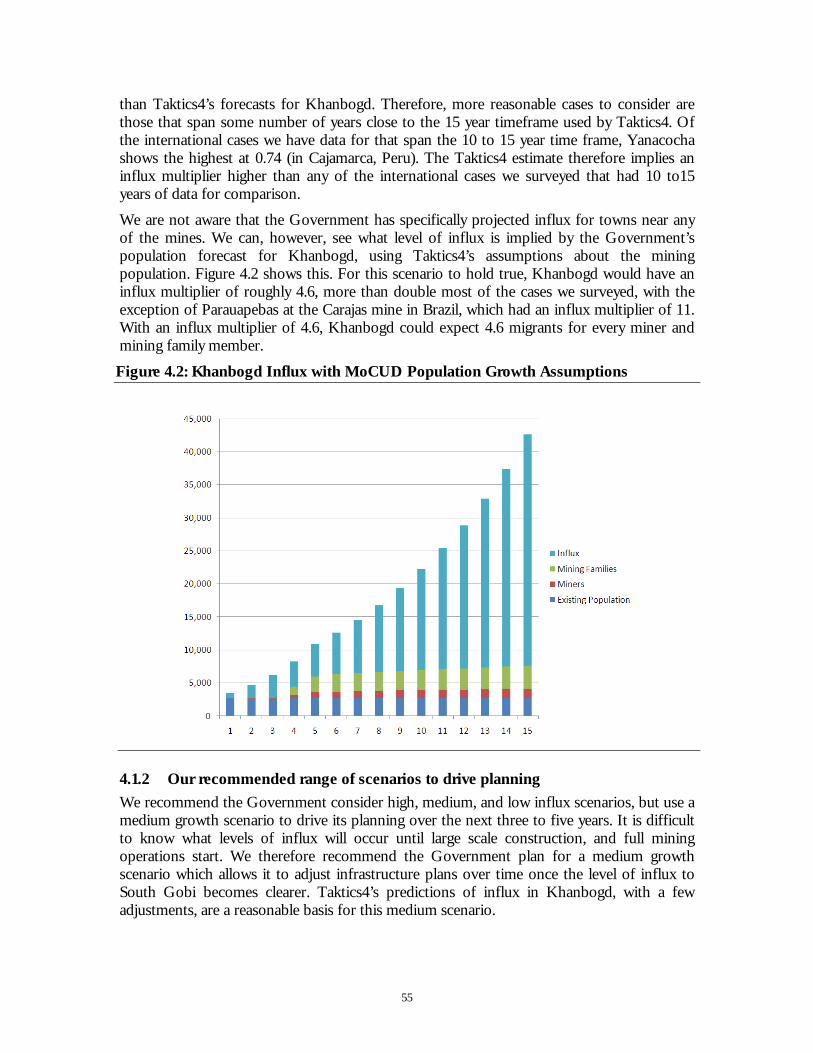
55
than Taktics4’s forecasts for Khanbogd. Therefore, more reasonable cases to consider are those that span some number of years close to the 15 year timeframe used by Taktics4. Of the international cases we have data for that span the 10 to 15 year time frame, Yanacocha shows the highest at 0.74 (in Cajamarca, Peru). The Taktics4 estimate therefore implies an influx multiplier higher than any of the international cases we surveyed that had 10 to15 years of data for comparison.
We are not aware that the Government has specifically projected influx for towns near any of the mines. We can, however, see what level of influx is implied by the Government’s population forecast for Khanbogd, using Taktics4’s assumptions about the mining population. Figure 4.2 shows this. For this scenario to hold true, Khanbogd would have an influx multiplier of roughly 4.6, more than double most of the cases we surveyed, with the exception of Parauapebas at the Carajas mine in Brazil, which had an influx multiplier of 11. With an influx multiplier of 4.6, Khanbogd could expect 4.6 migrants for every miner and mining family member.
Figure 4.2: Khanbogd Influx with MoCUD Population Growth Assumptions
4.1.2 Our recommended range of scenarios to drive planning
We recommend the Government consider high, medium, and low influx scenarios, but use a medium growth scenario to drive its planning over the next three to five years. It is difficult to know what levels of influx will occur until large scale construction, and full mining operations start. We therefore recommend the Government plan for a medium growth scenario which allows it to adjust infrastructure plans over time once the level of influx to South Gobi becomes clearer. Taktics4’s predictions of influx in Khanbogd, with a few adjustments, are a reasonable basis for this medium scenario.
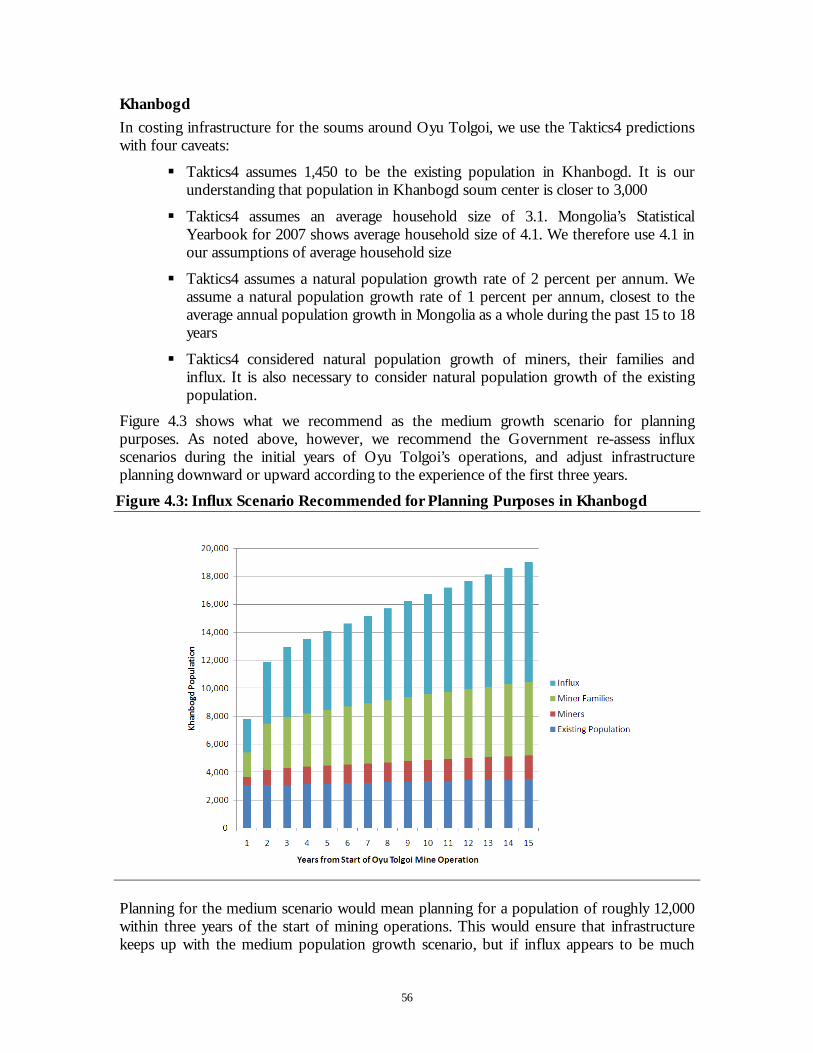
56
Khanbogd
In costing infrastructure for the soums around Oyu Tolgoi, we use the Taktics4 predictions with four caveats:
Taktics4 assumes 1,450 to be the existing population in Khanbogd. It is our understanding that population in Khanbogd soum center is closer to 3,000
Taktics4 assumes an average household size of 3.1. Mongolia’s Statistical Yearbook for 2007 shows average household size of 4.1. We therefore use 4.1 in our assumptions of average household size
Taktics4 assumes a natural population growth rate of 2 percent per annum. We assume a natural population growth rate of 1 percent per annum, closest to the average annual population growth in Mongolia as a whole during the past 15 to 18 years
Taktics4 considered natural population growth of miners, their families and influx. It is also necessary to consider natural population growth of the existing population.
Figure 4.3 shows what we recommend as the medium growth scenario for planning purposes. As noted above, however, we recommend the Government re-assess influx scenarios during the initial years of Oyu Tolgoi’s operations, and adjust infrastructure planning downward or upward according to the experience of the first three years.
Figure 4.3: Influx Scenario Recommended for Planning Purposes in Khanbogd
Planning for the medium scenario would mean planning for a population of roughly 12,000 within three years of the start of mining operations. This would ensure that infrastructure keeps up with the medium population growth scenario, but if influx appears to be much
57
lower during three years of mining operations, building plans can be slowed or halted without creating too much spare capacity. If influx continues to be very low, the infrastructure built in years one to three will still be needed to serve the existing population, the miners and their families. Even with no influx, the combination of these populations will reach roughly 8,000 by year three, and nearly 10,000 by year 10. Most infrastructure assets built in years one to three should continue to be useful through year 10. The infrastructure built in year three could therefore be used to serve the growing population of miners and their families through year 10.
If influx during years one to three of operation proves to be higher than the medium scenario, there will still be time to scale up infrastructure plans to meet influx. Figure 4.3’s influx scenario assumes population will be just 14,000 by year five of mine operations. By planning for a population of 12,000 in year three, the Government can meet most of the population’s infrastructure needs, and still have time to scale up infrastructure plans to meet higher future influx.
South Gobi as a whole
Planning for infrastructure outside of Khanbogd is more difficult, because less is known about the recruitment and settlement models the other mining companies will use, and when operations will start.
We do, however, know that:
Under the recruitment and settlement model recommended by Taktics4, there will be roughly 1,500-2,000 more miners and their families settled in soums outside of Khanbogd. If we assume the same level of influx in the other soums where Oyu Tolgoi’s miners will live, South Gobi’s population will more than triple by year five of operations, growing to roughly 33,000. Figure 4.4 shows this scenario of population growth for the soums near Oyu Tolgoi
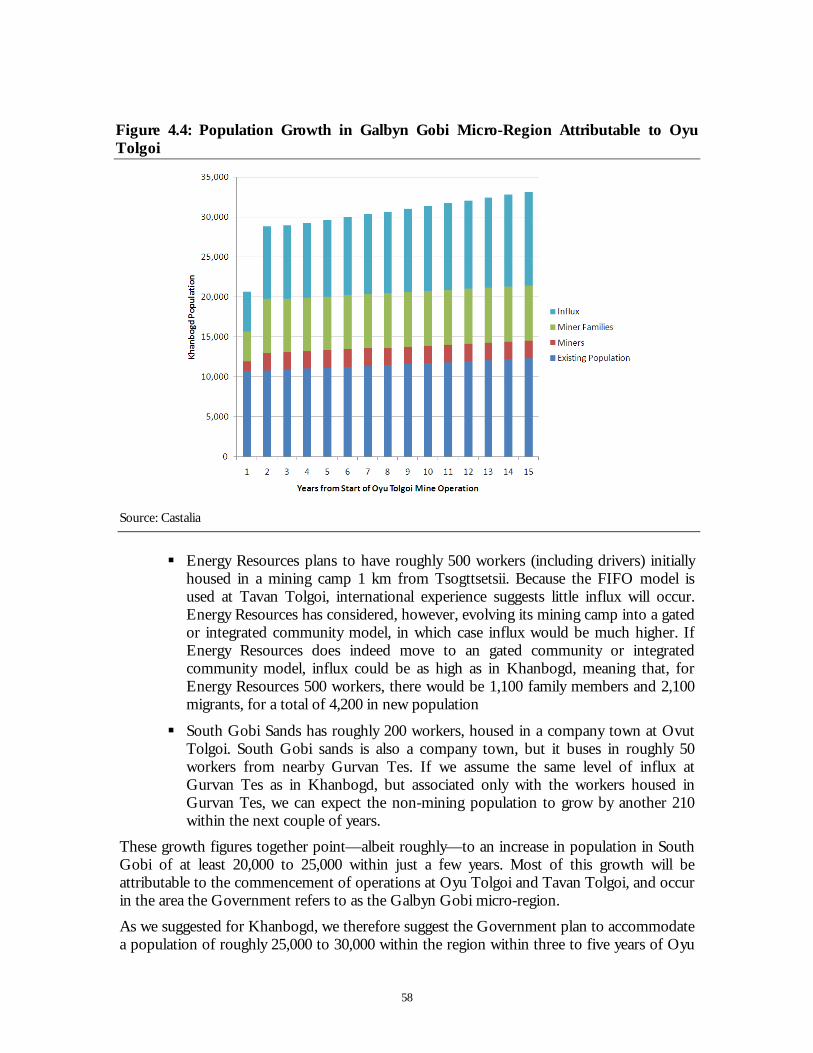
58
Figure 4.4: Population Growth in Galbyn Gobi Micro-Region Attributable to Oyu Tolgoi
Source: Castalia
Energy Resources plans to have roughly 500 workers (including drivers) initially
housed in a mining camp 1 km from Tsogttsetsii. Because the FIFO model is used at Tavan Tolgoi, international experience suggests little influx will occur. Energy Resources has considered, however, evolving its mining camp into a gated or integrated community model, in which case influx would be much higher. If Energy Resources does indeed move to an gated community or integrated community model, influx could be as high as in Khanbogd, meaning that, for Energy Resources 500 workers, there would be 1,100 family members and 2,100 migrants, for a total of 4,200 in new population
South Gobi Sands has roughly 200 workers, housed in a company town at Ovut Tolgoi. South Gobi sands is also a company town, but it buses in roughly 50 workers from nearby Gurvan Tes. If we assume the same level of influx at Gurvan Tes as in Khanbogd, but associated only with the workers housed in Gurvan Tes, we can expect the non-mining population to grow by another 210 within the next couple of years.
These growth figures together point—albeit roughly—to an increase in population in South Gobi of at least 20,000 to 25,000 within just a few years. Most of this growth will be attributable to the commencement of operations at Oyu Tolgoi and Tavan Tolgoi, and occur in the area the Government refers to as the Galbyn Gobi micro-region.
As we suggested for Khanbogd, we therefore suggest the Government plan to accommodate a population of roughly 25,000 to 30,000 within the region within three to five years of Oyu
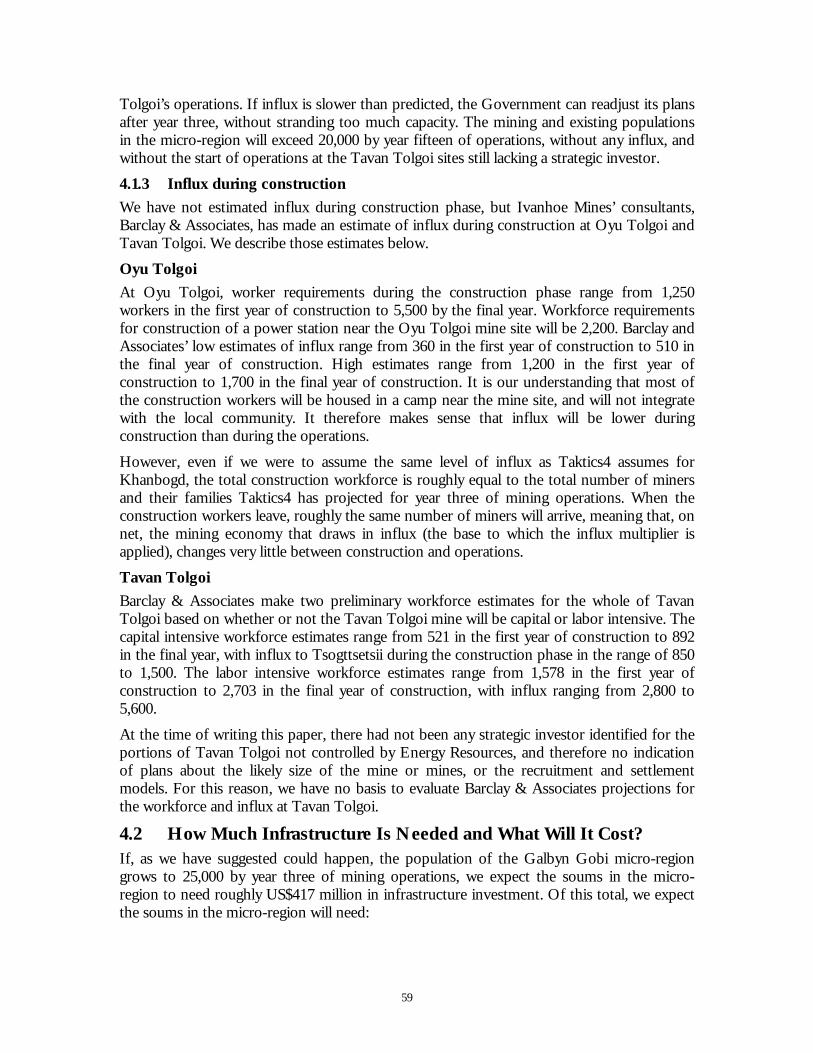
59
Tolgoi’s operations. If influx is slower than predicted, the Government can readjust its plans after year three, without stranding too much capacity. The mining and existing populations in the micro-region will exceed 20,000 by year fifteen of operations, without any influx, and without the start of operations at the Tavan Tolgoi sites still lacking a strategic investor.
4.1.3 Influx during construction
We have not estimated influx during construction phase, but Ivanhoe Mines’ consultants, Barclay & Associates, has made an estimate of influx during construction at Oyu Tolgoi and Tavan Tolgoi. We describe those estimates below.
Oyu Tolgoi
At Oyu Tolgoi, worker requirements during the construction phase range from 1,250 workers in the first year of construction to 5,500 by the final year. Workforce requirements for construction of a power station near the Oyu Tolgoi mine site will be 2,200. Barclay and Associates’ low estimates of influx range from 360 in the first year of construction to 510 in the final year of construction. High estimates range from 1,200 in the first year of construction to 1,700 in the final year of construction. It is our understanding that most of the construction workers will be housed in a camp near the mine site, and will not integrate with the local community. It therefore makes sense that influx will be lower during construction than during the operations.
However, even if we were to assume the same level of influx as Taktics4 assumes for Khanbogd, the total construction workforce is roughly equal to the total number of miners and their families Taktics4 has projected for year three of mining operations. When the construction workers leave, roughly the same number of miners will arrive, meaning that, on net, the mining economy that draws in influx (the base to which the influx multiplier is applied), changes very little between construction and operations.
Tavan Tolgoi
Barclay & Associates make two preliminary workforce estimates for the whole of Tavan Tolgoi based on whether or not the Tavan Tolgoi mine will be capital or labor intensive. The capital intensive workforce estimates range from 521 in the first year of construction to 892 in the final year, with influx to Tsogttsetsii during the construction phase in the range of 850 to 1,500. The labor intensive workforce estimates range from 1,578 in the first year of construction to 2,703 in the final year of construction, with influx ranging from 2,800 to 5,600.
At the time of writing this paper, there had not been any strategic investor identified for the portions of Tavan Tolgoi not controlled by Energy Resources, and therefore no indication of plans about the likely size of the mine or mines, or the recruitment and settlement models. For this reason, we have no basis to evaluate Barclay & Associates projections for the workforce and influx at Tavan Tolgoi.
4.2 How Much Infrastructure Is Needed and What Will It Cost? If, as we have suggested could happen, the population of the Galbyn Gobi micro-region grows to 25,000 by year three of mining operations, we expect the soums in the micro-region to need roughly US$417 million in infrastructure investment. Of this total, we expect the soums in the micro-region will need:
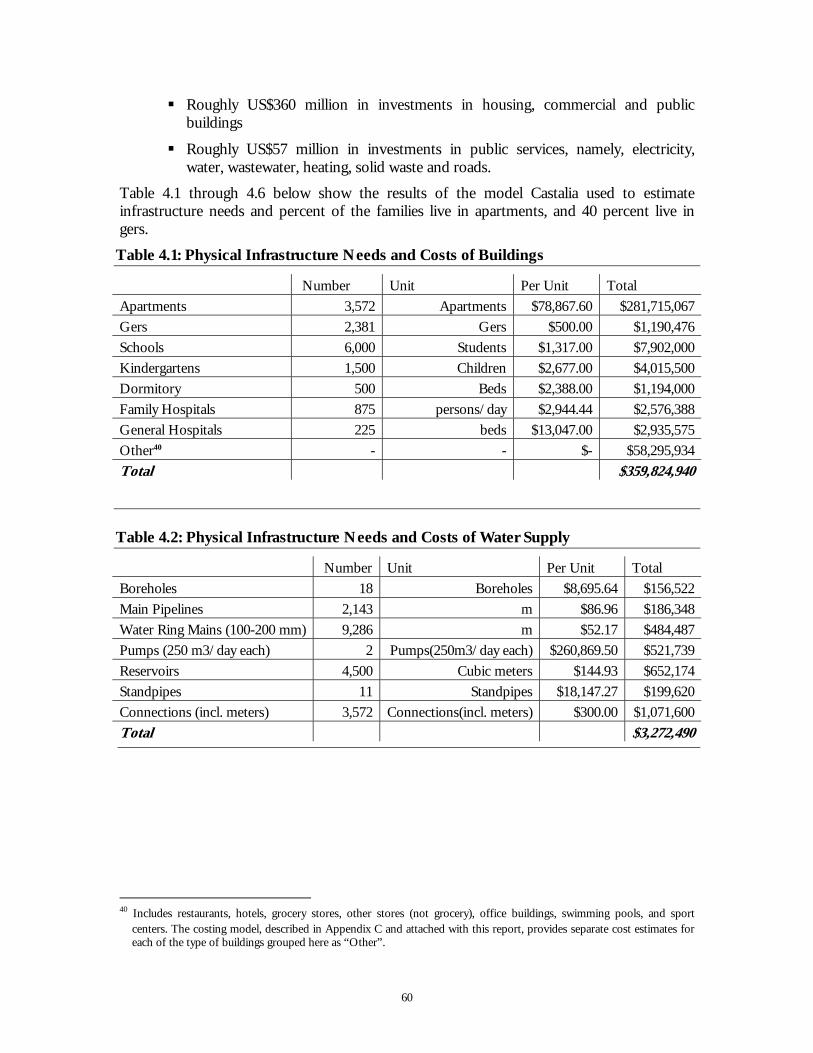
60
Roughly US$360 million in investments in housing, commercial and public buildings
Roughly US$57 million in investments in public services, namely, electricity, water, wastewater, heating, solid waste and roads.
Table 4.1 through 4.6 below show the results of the model Castalia used to estimate infrastructure needs and percent of the families live in apartments, and 40 percent live in gers.
Table 4.1: Physical Infrastructure Needs and Costs of Buildings
Number Unit Per Unit Total Apartments 3,572 Apartments $78,867.60 $281,715,067Gers 2,381 Gers $500.00 $1,190,476Schools 6,000 Students $1,317.00 $7,902,000Kindergartens 1,500 Children $2,677.00 $4,015,500Dormitory 500 Beds $2,388.00 $1,194,000Family Hospitals 875 persons/day $2,944.44 $2,576,388General Hospitals 225 beds $13,047.00 $2,935,575Other40 - - $- $58,295,934Total $359,824,940
Table 4.2: Physical Infrastructure Needs and Costs of Water Supply
Number Unit Per Unit Total Boreholes 18 Boreholes $8,695.64 $156,522Main Pipelines 2,143 m $86.96 $186,348Water Ring Mains (100-200 mm) 9,286 m $52.17 $484,487Pumps (250 m3/day each) 2 Pumps(250m3/day each) $260,869.50 $521,739Reservoirs 4,500 Cubic meters $144.93 $652,174Standpipes 11 Standpipes $18,147.27 $199,620Connections (incl. meters) 3,572 Connections(incl. meters) $300.00 $1,071,600Total $3,272,490
40 Includes restaurants, hotels, grocery stores, other stores (not grocery), office buildings, swimming pools, and sport
centers. The costing model, described in Appendix C and attached with this report, provides separate cost estimates for each of the type of buildings grouped here as “Other”.
61
Table 4.3: Physical Infrastructure Needs and Costs of Sanitation
Number Unit Per Unit Total Pipelines (150-500 mm) 5,358 M $130.43 $698,870Pump Station 1 Pump Station $52,174.00 $52,174Treatment Facility (12,000 m3/day) 1
Treatment Facility (12,000 m3/day) $5,217,391.00 $5,217,391
Connections 3,572 Connections $853.00 $3,046,916Total $9,015,351
Table 4.4: Physical Infrastructure Needs and Costs of Electricity
Number Unit Per Unit Total Coal Plant (5 MW CHP) 1 Plants $8,000,000.00 $8,000,000Substation (2,500 kva) 2 Substations $349,694.50 $699,389Distribution Lines (10kV) 57,143 m $15.60 $891,145Distribution Network (0.4 kV) 285,715 m $9.23 $2,637,149Connections 5,953 Connections $171.00 $1,017,963Total $13,245,647
Table 4.5: Physical Infrastructure Needs and Costs of Heating
Number Unit Per Unit Total Heat Production CHP Plant (5 MW CHP) 1 Plants $8,000,000.00 $8,000,000Total $8,000,000 Heat Distribution Main Pipelines (820 mm) 14,286 m $345.00 $4,928,670Distribution Pipelines (100-300 mm) 21,429 m $176.78 $3,788,274Distribution Stations (50 Gcal/station) 5 Stations $3,000,000.00 $15,000,000Plate Heat Exchangers 54 Heat Exchangers $30,000.00 $1,620,000Connections 3,572 Connections $930.00 $3,321,960Total $28,658,904
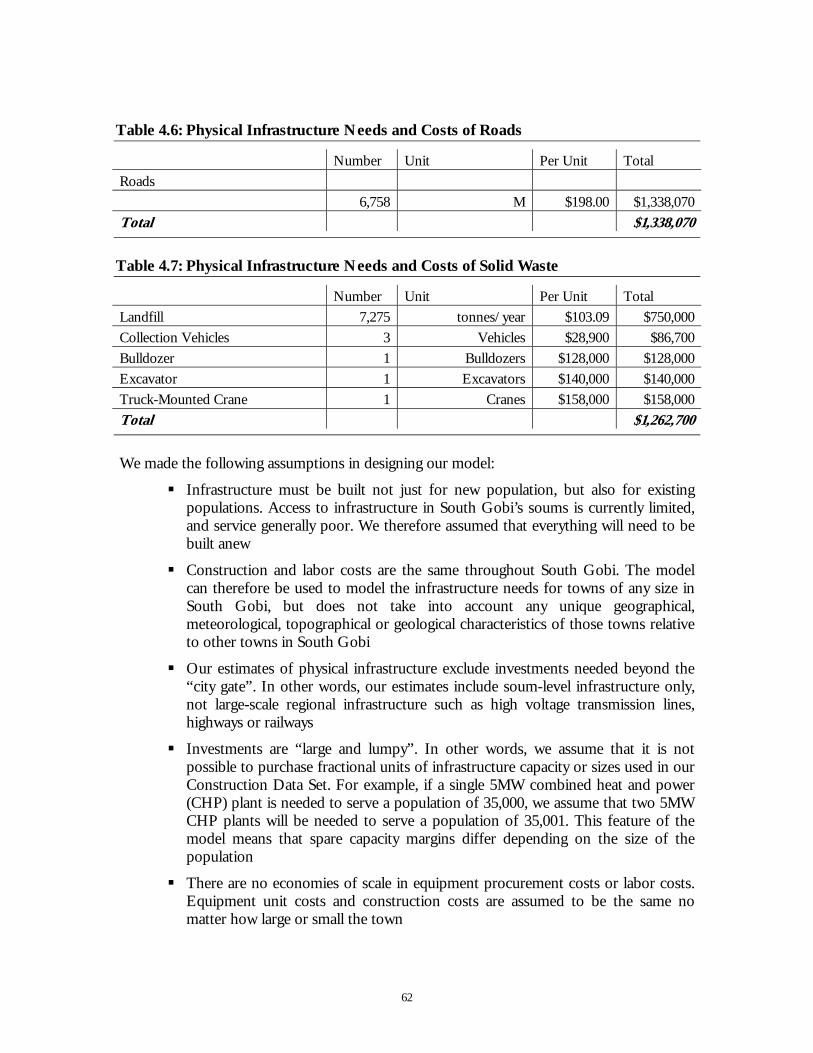
62
Table 4.6: Physical Infrastructure Needs and Costs of Roads
Number Unit Per Unit Total Roads 6,758 M $198.00 $1,338,070Total $1,338,070
Table 4.7: Physical Infrastructure Needs and Costs of Solid Waste
Number Unit Per Unit Total Landfill 7,275 tonnes/year $103.09 $750,000Collection Vehicles 3 Vehicles $28,900 $86,700Bulldozer 1 Bulldozers $128,000 $128,000Excavator 1 Excavators $140,000 $140,000Truck-Mounted Crane 1 Cranes $158,000 $158,000Total $1,262,700
We made the following assumptions in designing our model:
Infrastructure must be built not just for new population, but also for existing populations. Access to infrastructure in South Gobi’s soums is currently limited, and service generally poor. We therefore assumed that everything will need to be built anew
Construction and labor costs are the same throughout South Gobi. The model can therefore be used to model the infrastructure needs for towns of any size in South Gobi, but does not take into account any unique geographical, meteorological, topographical or geological characteristics of those towns relative to other towns in South Gobi
Our estimates of physical infrastructure exclude investments needed beyond the “city gate”. In other words, our estimates include soum-level infrastructure only, not large-scale regional infrastructure such as high voltage transmission lines, highways or railways
Investments are “large and lumpy”. In other words, we assume that it is not possible to purchase fractional units of infrastructure capacity or sizes used in our Construction Data Set. For example, if a single 5MW combined heat and power (CHP) plant is needed to serve a population of 35,000, we assume that two 5MW CHP plants will be needed to serve a population of 35,001. This feature of the model means that spare capacity margins differ depending on the size of the population
There are no economies of scale in equipment procurement costs or labor costs. Equipment unit costs and construction costs are assumed to be the same no matter how large or small the town
63
Gers and apartments receive different infrastructure services. Apartments receive all utility services (water, wastewater, electricity, heating and use of roads). Gers receive only:
– Electricity service
– Water service through standpipes
– Use of roads.
Monthly consumption of electricity, water, wastewater and heating per customer is fixed. Income elasticity of demand, and price elasticity of demand therefore do not enter into our analysis.
The infrastructure needed will be built immediately. Expected inflation, or costs associated with construction delays, or commodity price fluctuations, do not enter into our analysis
Population density, and family size are fixed, at 7.44 people per hectare, and 4.2 people per family, respectively.
Appendix C contains a guide to using the model, and summarizes our main assumptions.
64
5 Options for Meeting Infrastructure Needs in South Gobi
This Section presents various options for meeting infrastructure needs in South Gobi. The options differ in where (in other words, to which institutions) they allocate responsibility for the functions required to provide infrastructure services.
Providing infrastructure services requires that at least three major functions be fulfilled, namely:
Plan and control. Decide what physical infrastructure is needed, where it should go, how much capacity is needed, and when that capacity needs to be expanded. For example, some organization must decide where boreholes should be dug, where the reservoirs should be sited, where the pump stations should be built, where the pipelines run, and which customers should be connected.
Some organization also needs to decide on the quality of the infrastructure service the population receives, and the price they pay for it. For example, some organization needs to decide whether ger areas have standpipes or individual water connections, what minimum level of water quality must be provided, and the basis for charging customers for water service (for example, based on metered consumption or some other, normative basis)
Design, build, operate and maintain. Some organization must design, build, operate and maintain the physical infrastructure needed to produce and deliver infrastructure services. Once the infrastructure is planned, some organization’s engineers must do a detailed design, some organization must build the infrastructure according to the design, and some organization must then operate and maintain the infrastructure. In the roads sector, for example, some organization must design the roads’ technical specifications, consistent with planners’ wishes. Construction engineers must decide, for example, which type of gravel and surfacing to use. Some organization must then build the roads, and some organization must maintain them over time. If the road is a toll road, some organization must also decide who operates the toll collection booths
Fund and finance. Someone must pay to have the infrastructure built, and someone must pay for its ongoing operation. Organizations that cannot pay for all of the equipment upfront will have to look for another entity to lend or finance the payments over time. For example, if a government cannot pay upfront to build a school, it may borrow the money from the World Bank, the Asian Development Bank or some other international financial institution (IFI), and pay it back over time. As another example, governments or mining companies may have the cash to pay for the infrastructure upfront, but customers usually do not. In such cases, governments or mining companies pay for the infrastructure upfront but recover their costs from customers, over time, through tariffs paid in exchange for service.
A single organization may fulfill all of these functions, as in the company town model, discussed above. As an alternative, the functions named in the bullets above may be allocated to multiple organizations. For example, a government may plan and control its
65
roads, but may hire a private sector engineering procurement and construction (EPC) contractor to design and maintain its roads.
It is possible to separate some of these functions further. For example, the design, build, operating and maintenance functions could be separated and allocated to different organizations. The government could hire a private EPC contractor to design and build an electricity system which will then be operated and maintained by a government-owned utility. That utility may also choose to hire a private sector O&M contractor to help improve efficiency of operations.
We have grouped the functions into the three bullets above for the sake of simplicity, and because these groups of functions are the groups one sees most often in infrastructure projects around the world.
In Mongolia, the principal organizations that might possibly take responsibility for these different functions include:
Government, which may mean
– National government
– Aimag government
– Soum government
Mining companies
A private company, other than the mining company. This may include:
– A company specialized in delivering infrastructure services. We will refer to such companies as “specialized private operators”
– A property developer. Mongolia has some recent experience in Ulaanbaatar in which private property developers build and operate communal services in private housing or apartment complexes. Because existing infrastructure service providers have proven unable to deliver acceptable water, wastewater and energy services, property developers are building and operating their own infrastructure.
In the sections that follow, we analyze the advantages of each of these entities planning and controlling, funding and financing, and building and operating infrastructure. In Section 6 we recommend how the Government can evaluate each of the options, and provide examples of innovative arrangements for infrastructure provision that have worked well elsewhere in the world.
5.1 Who Can Plan and Control the Infrastructure Assets? Historically, in many countries, governments take responsibility for planning and controlling infrastructure assets. Even if private companies build, own and operate infrastructure, the Government typically specifies where the infrastructure should be built, and who should receive services from it. For example, many private companies build, own, and operate electricity infrastructure in the United States of America, Australia and Japan, but the national and provincial governments in these countries control where generating stations and where transmission lines can be built.
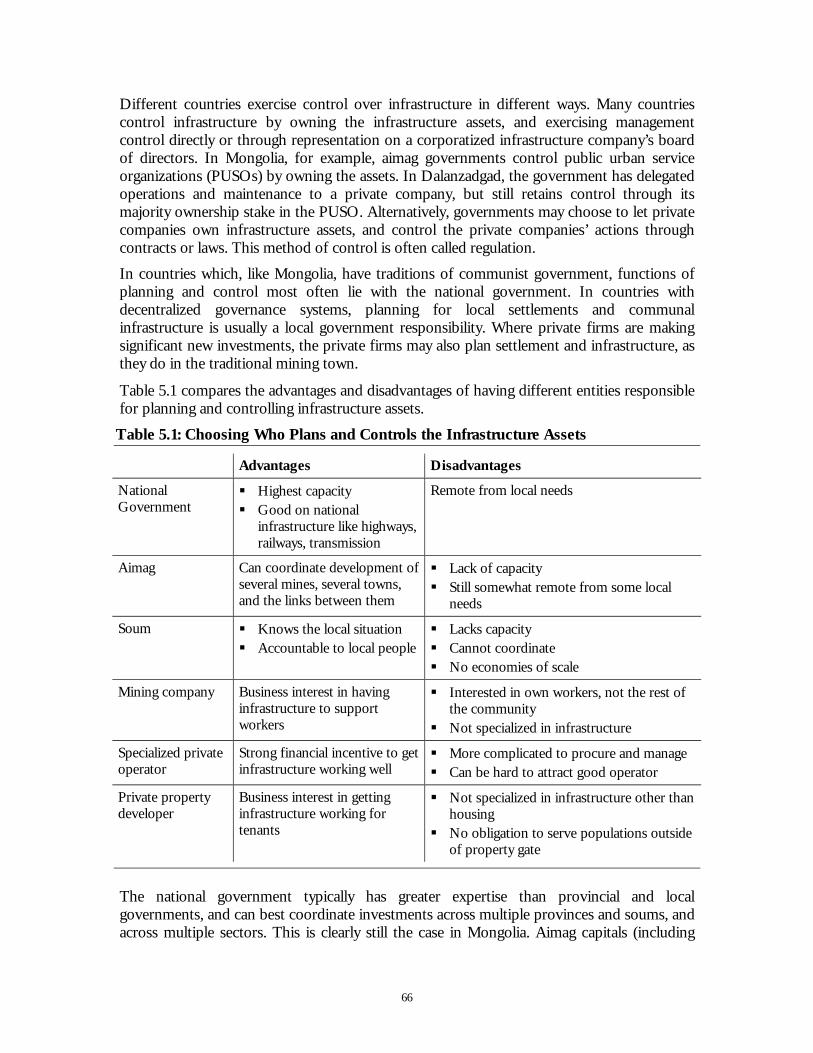
66
Different countries exercise control over infrastructure in different ways. Many countries control infrastructure by owning the infrastructure assets, and exercising management control directly or through representation on a corporatized infrastructure company’s board of directors. In Mongolia, for example, aimag governments control public urban service organizations (PUSOs) by owning the assets. In Dalanzadgad, the government has delegated operations and maintenance to a private company, but still retains control through its majority ownership stake in the PUSO. Alternatively, governments may choose to let private companies own infrastructure assets, and control the private companies’ actions through contracts or laws. This method of control is often called regulation.
In countries which, like Mongolia, have traditions of communist government, functions of planning and control most often lie with the national government. In countries with decentralized governance systems, planning for local settlements and communal infrastructure is usually a local government responsibility. Where private firms are making significant new investments, the private firms may also plan settlement and infrastructure, as they do in the traditional mining town.
Table 5.1 compares the advantages and disadvantages of having different entities responsible for planning and controlling infrastructure assets.
Table 5.1: Choosing Who Plans and Controls the Infrastructure Assets
Advantages Disadvantages
National Government
Highest capacity Good on national
infrastructure like highways, railways, transmission
Remote from local needs
Aimag Can coordinate development of several mines, several towns, and the links between them
Lack of capacity Still somewhat remote from some local
needs
Soum Knows the local situation Accountable to local people
Lacks capacity Cannot coordinate No economies of scale
Mining company Business interest in having infrastructure to support workers
Interested in own workers, not the rest of the community
Not specialized in infrastructure
Specialized private operator
Strong financial incentive to get infrastructure working well
More complicated to procure and manage Can be hard to attract good operator
Private property developer
Business interest in getting infrastructure working for tenants
Not specialized in infrastructure other than housing
No obligation to serve populations outside of property gate
The national government typically has greater expertise than provincial and local governments, and can best coordinate investments across multiple provinces and soums, and across multiple sectors. This is clearly still the case in Mongolia. Aimag capitals (including
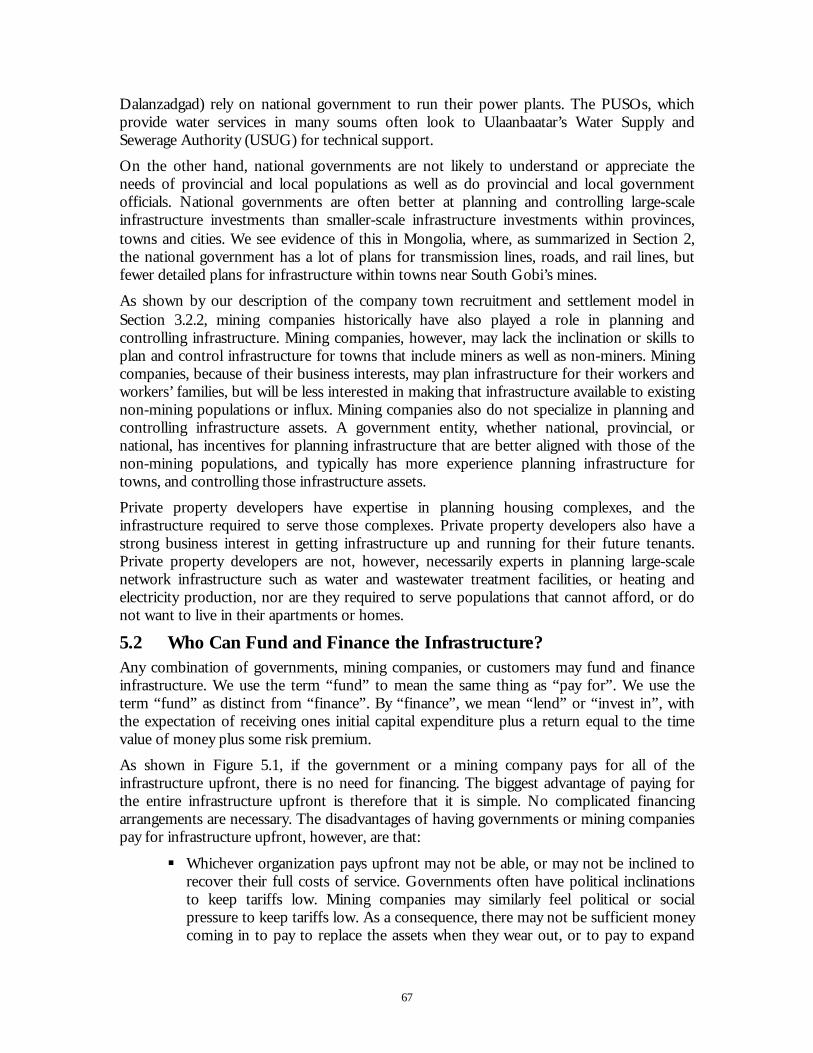
67
Dalanzadgad) rely on national government to run their power plants. The PUSOs, which provide water services in many soums often look to Ulaanbaatar’s Water Supply and Sewerage Authority (USUG) for technical support.
On the other hand, national governments are not likely to understand or appreciate the needs of provincial and local populations as well as do provincial and local government officials. National governments are often better at planning and controlling large-scale infrastructure investments than smaller-scale infrastructure investments within provinces, towns and cities. We see evidence of this in Mongolia, where, as summarized in Section 2, the national government has a lot of plans for transmission lines, roads, and rail lines, but fewer detailed plans for infrastructure within towns near South Gobi’s mines.
As shown by our description of the company town recruitment and settlement model in Section 3.2.2, mining companies historically have also played a role in planning and controlling infrastructure. Mining companies, however, may lack the inclination or skills to plan and control infrastructure for towns that include miners as well as non-miners. Mining companies, because of their business interests, may plan infrastructure for their workers and workers’ families, but will be less interested in making that infrastructure available to existing non-mining populations or influx. Mining companies also do not specialize in planning and controlling infrastructure assets. A government entity, whether national, provincial, or national, has incentives for planning infrastructure that are better aligned with those of the non-mining populations, and typically has more experience planning infrastructure for towns, and controlling those infrastructure assets.
Private property developers have expertise in planning housing complexes, and the infrastructure required to serve those complexes. Private property developers also have a strong business interest in getting infrastructure up and running for their future tenants. Private property developers are not, however, necessarily experts in planning large-scale network infrastructure such as water and wastewater treatment facilities, or heating and electricity production, nor are they required to serve populations that cannot afford, or do not want to live in their apartments or homes.
5.2 Who Can Fund and Finance the Infrastructure? Any combination of governments, mining companies, or customers may fund and finance infrastructure. We use the term “fund” to mean the same thing as “pay for”. We use the term “fund” as distinct from “finance”. By “finance”, we mean “lend” or “invest in”, with the expectation of receiving ones initial capital expenditure plus a return equal to the time value of money plus some risk premium.
As shown in Figure 5.1, if the government or a mining company pays for all of the infrastructure upfront, there is no need for financing. The biggest advantage of paying for the entire infrastructure upfront is therefore that it is simple. No complicated financing arrangements are necessary. The disadvantages of having governments or mining companies pay for infrastructure upfront, however, are that:
Whichever organization pays upfront may not be able, or may not be inclined to recover their full costs of service. Governments often have political inclinations to keep tariffs low. Mining companies may similarly feel political or social pressure to keep tariffs low. As a consequence, there may not be sufficient money coming in to pay to replace the assets when they wear out, or to pay to expand
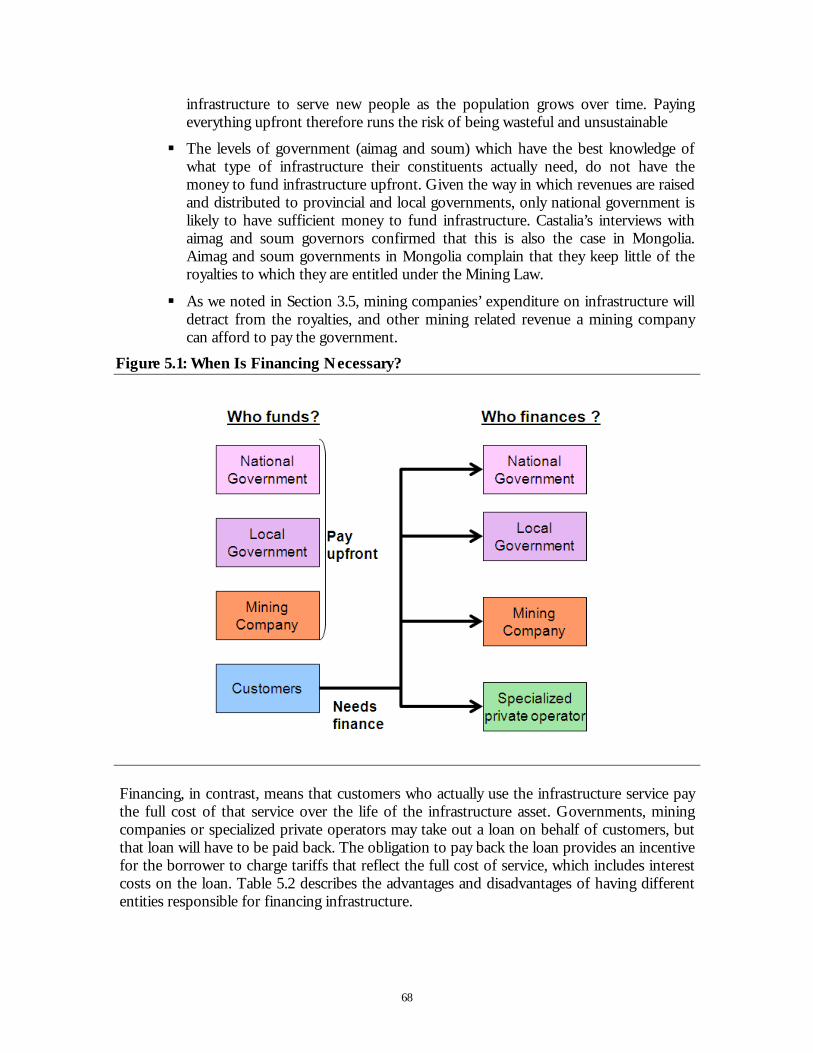
68
infrastructure to serve new people as the population grows over time. Paying everything upfront therefore runs the risk of being wasteful and unsustainable
The levels of government (aimag and soum) which have the best knowledge of what type of infrastructure their constituents actually need, do not have the money to fund infrastructure upfront. Given the way in which revenues are raised and distributed to provincial and local governments, only national government is likely to have sufficient money to fund infrastructure. Castalia’s interviews with aimag and soum governors confirmed that this is also the case in Mongolia. Aimag and soum governments in Mongolia complain that they keep little of the royalties to which they are entitled under the Mining Law.
As we noted in Section 3.5, mining companies’ expenditure on infrastructure will detract from the royalties, and other mining related revenue a mining company can afford to pay the government.
Figure 5.1: When Is Financing Necessary?
Financing, in contrast, means that customers who actually use the infrastructure service pay the full cost of that service over the life of the infrastructure asset. Governments, mining companies or specialized private operators may take out a loan on behalf of customers, but that loan will have to be paid back. The obligation to pay back the loan provides an incentive for the borrower to charge tariffs that reflect the full cost of service, which includes interest costs on the loan. Table 5.2 describes the advantages and disadvantages of having different entities responsible for financing infrastructure.
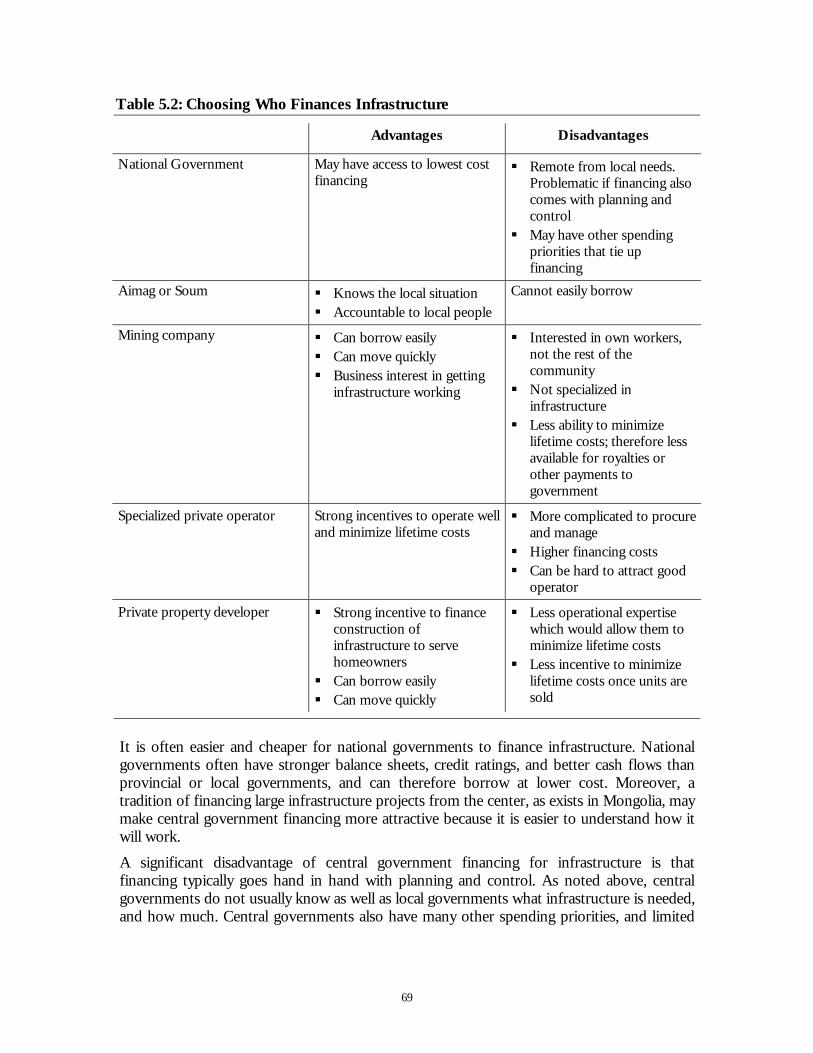
69
Table 5.2: Choosing Who Finances Infrastructure
Advantages Disadvantages
National Government May have access to lowest cost financing
Remote from local needs. Problematic if financing also comes with planning and control
May have other spending priorities that tie up financing
Aimag or Soum Knows the local situation Accountable to local people
Cannot easily borrow
Mining company Can borrow easily Can move quickly Business interest in getting
infrastructure working
Interested in own workers, not the rest of the community
Not specialized in infrastructure
Less ability to minimize lifetime costs; therefore less available for royalties or other payments to government
Specialized private operator Strong incentives to operate well and minimize lifetime costs
More complicated to procure and manage
Higher financing costs Can be hard to attract good
operator
Private property developer Strong incentive to finance construction of infrastructure to serve homeowners
Can borrow easily Can move quickly
Less operational expertise which would allow them to minimize lifetime costs
Less incentive to minimize lifetime costs once units are sold
It is often easier and cheaper for national governments to finance infrastructure. National governments often have stronger balance sheets, credit ratings, and better cash flows than provincial or local governments, and can therefore borrow at lower cost. Moreover, a tradition of financing large infrastructure projects from the center, as exists in Mongolia, may make central government financing more attractive because it is easier to understand how it will work.
A significant disadvantage of central government financing for infrastructure is that financing typically goes hand in hand with planning and control. As noted above, central governments do not usually know as well as local governments what infrastructure is needed, and how much. Central governments also have many other spending priorities, and limited
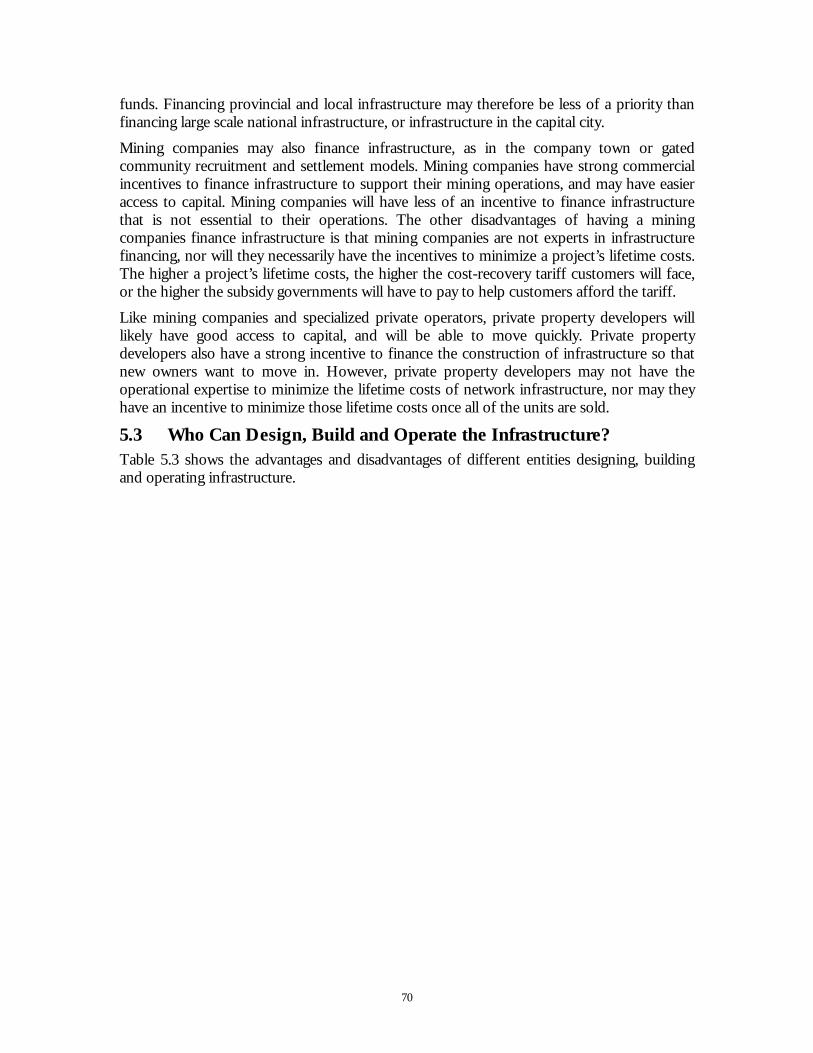
70
funds. Financing provincial and local infrastructure may therefore be less of a priority than financing large scale national infrastructure, or infrastructure in the capital city.
Mining companies may also finance infrastructure, as in the company town or gated community recruitment and settlement models. Mining companies have strong commercial incentives to finance infrastructure to support their mining operations, and may have easier access to capital. Mining companies will have less of an incentive to finance infrastructure that is not essential to their operations. The other disadvantages of having a mining companies finance infrastructure is that mining companies are not experts in infrastructure financing, nor will they necessarily have the incentives to minimize a project’s lifetime costs. The higher a project’s lifetime costs, the higher the cost-recovery tariff customers will face, or the higher the subsidy governments will have to pay to help customers afford the tariff.
Like mining companies and specialized private operators, private property developers will likely have good access to capital, and will be able to move quickly. Private property developers also have a strong incentive to finance the construction of infrastructure so that new owners want to move in. However, private property developers may not have the operational expertise to minimize the lifetime costs of network infrastructure, nor may they have an incentive to minimize those lifetime costs once all of the units are sold.
5.3 Who Can Design, Build and Operate the Infrastructure? Table 5.3 shows the advantages and disadvantages of different entities designing, building and operating infrastructure.
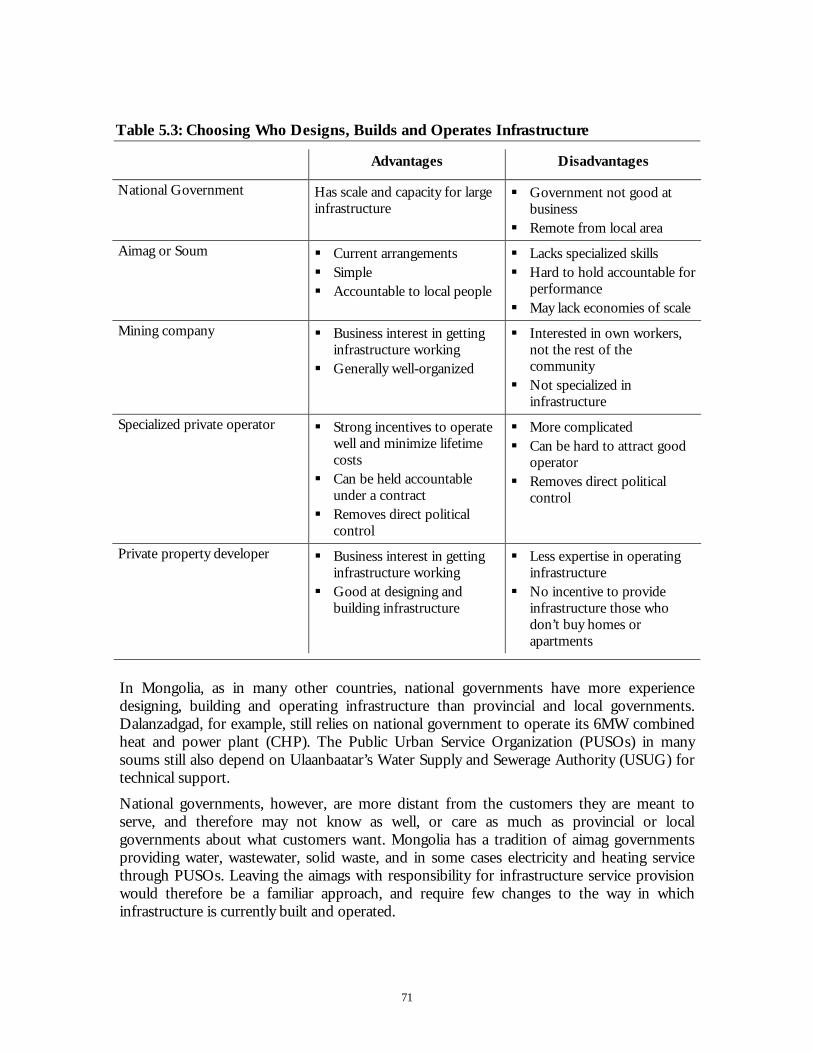
71
Table 5.3: Choosing Who Designs, Builds and Operates Infrastructure
Advantages Disadvantages
National Government Has scale and capacity for large infrastructure
Government not good at business
Remote from local area Aimag or Soum Current arrangements
Simple Accountable to local people
Lacks specialized skills Hard to hold accountable for
performance May lack economies of scale
Mining company Business interest in getting infrastructure working
Generally well-organized
Interested in own workers, not the rest of the community
Not specialized in infrastructure
Specialized private operator Strong incentives to operate well and minimize lifetime costs
Can be held accountable under a contract
Removes direct political control
More complicated Can be hard to attract good
operator Removes direct political
control
Private property developer Business interest in getting infrastructure working
Good at designing and building infrastructure
Less expertise in operating infrastructure
No incentive to provide infrastructure those who don’t buy homes or apartments
In Mongolia, as in many other countries, national governments have more experience designing, building and operating infrastructure than provincial and local governments. Dalanzadgad, for example, still relies on national government to operate its 6MW combined heat and power plant (CHP). The Public Urban Service Organization (PUSOs) in many soums still also depend on Ulaanbaatar’s Water Supply and Sewerage Authority (USUG) for technical support.
National governments, however, are more distant from the customers they are meant to serve, and therefore may not know as well, or care as much as provincial or local governments about what customers want. Mongolia has a tradition of aimag governments providing water, wastewater, solid waste, and in some cases electricity and heating service through PUSOs. Leaving the aimags with responsibility for infrastructure service provision would therefore be a familiar approach, and require few changes to the way in which infrastructure is currently built and operated.

72
The principal disadvantage of having any government entity provide infrastructure services is that governments—whether national, local, or provincial—tend not to be particularly good at running businesses efficiently. Evidence of this in South Gobi can again be seen in the Dalanzadgad’s CHP. Power and heating outages at the plant are common. Only one of the two units at the plant are operational, with operating costs upwards of USD 0.30/kWh, despite the fact that the plant has access to very cheap coal.41
Private companies, unlike most governments, respond well to commercial incentives, and therefore can be given incentives to build and operate infrastructure efficiently. Private mining companies respond well to commercial incentives but designing, building and operating infrastructure for people other than those working in the mine is not part of a mining company’s core business. This means that they are neither particularly motivated nor good at designing, building and operating infrastructure. Mining companies may agree to provide some infrastructure to non-miners, but they will typically seek to limit their responsibility to designing and building, not operating the infrastructure.
Private property developers may be good at designing and building infrastructure, but are less likely to specialize in building and operating infrastructure other than housing. Moreover, their interest in providing infrastructure services does not extend to those who cannot afford to be homeowners within their development, or do not want to be.
Table 5.3 includes an option for designing, building, and operating infrastructure that harnesses the incentives and expertise of the private sector, but avoids the principal disadvantages of relying on the mining company for infrastructure.42 Hiring a specialized private contractor to design, build, and operate infrastructure requires a contract which specifies the infrastructure the private firm must deliver, and the cost of that infrastructure. This contract gives the private firm strong incentives to deliver the infrastructure the government wants, at an agreed price, without offsetting the royalties or taxes the mining company has available to pay. Moreover, a specialized infrastructure operator is just that—a private firm that has made infrastructure service provision the focus of its business activity.
The principal disadvantages of hiring a specialized private operator are that procurement is often more time consuming and complicated than traditional government procurement, and there is always a risk that private operators may not be interested, given the terms the government is prepared to offer. In procuring a specialized private operator, government must also be willing to sacrifice some degree of political control of infrastructure, which it may not always be willing to do.
41 On a tour of the CHP plan in Dalanzadgad, Castalia was told that coal costs roughly US$20 per metric ton. 42 This option would also give the financing function to the private sector. In other words, the private firm pays
construction costs upfront, and recoups its costs through tariffs, user fees, or payments from the government.
73
6 Choosing the Right Option for Infrastructure Provision
We recommend the government use five criteria to determine the best option for providing communal infrastructure in South Gobi’s towns. The best option for providing infrastructure services in any sector will:
Provide the infrastructure services people need, at lowest cost
Be accountable to the people who use the infrastructure
Utilize the best available expertise in building and operating the infrastructure
Be simple and low cost to implement
Have proven to work well elsewhere in Mongolia and elsewhere in the world.
Ultimately, the government must decide what weight to assign to each of these criteria in making its decision. Some of these decisions can be quantified. Governments often estimate, for example, the “value-for-money” of a PPP, to help them judge, for example whether the promise of greater efficiency offered by a specialized private operator outweighs the simplicity and low cost of traditional government procurement.
Other decisions can only be informed by subjective judgment. It is difficult to quantify the advantages of increased government centralization (for example, greater expertise, greater consistency and economies of scale) versus its disadvantages (for example, less knowledge of local infrastructure needs, and less immediate accountability to the local population).
6.1 What Are the Tradeoffs between Options for Providing Infrastructure Services?
Table 6.1 describes the principal tradeoffs between the options described in Section 5.
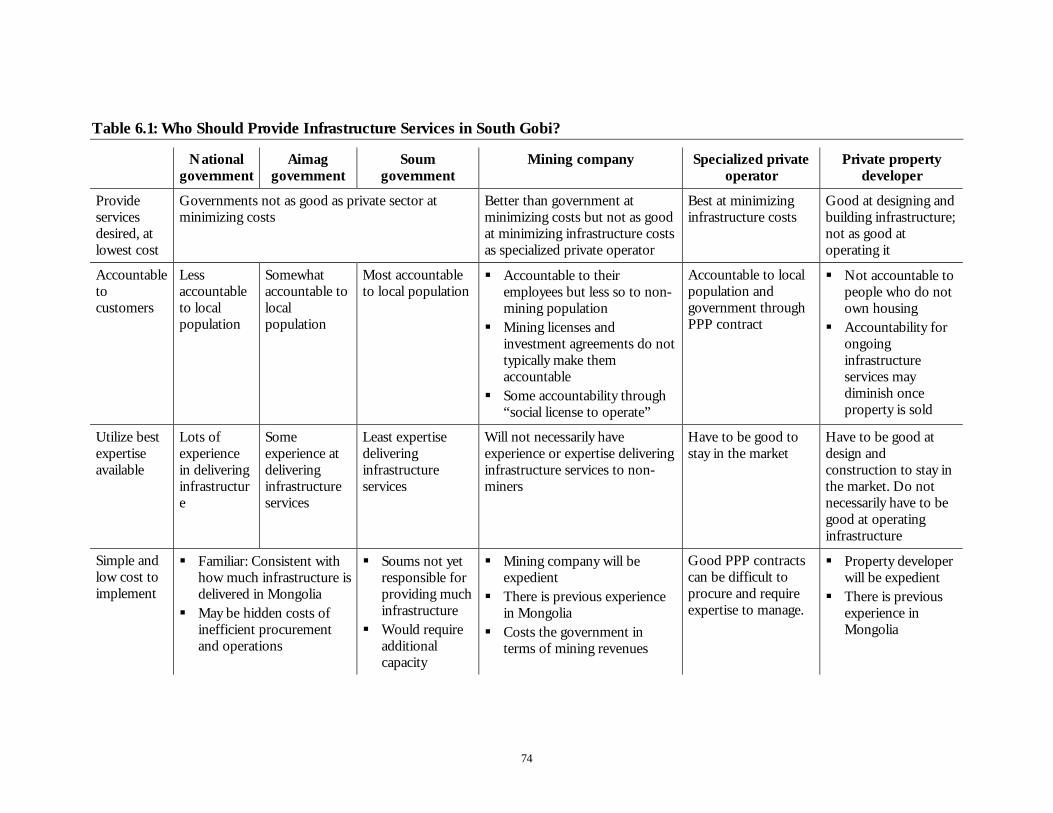
74
Table 6.1: Who Should Provide Infrastructure Services in South Gobi?
National government
Aimag government
Soum government
Mining company Specialized private operator
Private property developer
Provide services desired, at lowest cost
Governments not as good as private sector at minimizing costs
Better than government at minimizing costs but not as good at minimizing infrastructure costs as specialized private operator
Best at minimizing infrastructure costs
Good at designing and building infrastructure; not as good at operating it
Accountable to customers
Less accountable to local population
Somewhat accountable to local population
Most accountable to local population
Accountable to their employees but less so to non-mining population
Mining licenses and investment agreements do not typically make them accountable
Some accountability through “social license to operate”
Accountable to local population and government through PPP contract
Not accountable to people who do not own housing
Accountability for ongoing infrastructure services may diminish once property is sold
Utilize best expertise available
Lots of experience in delivering infrastructure
Some experience at delivering infrastructure services
Least expertise delivering infrastructure services
Will not necessarily have experience or expertise delivering infrastructure services to non-miners
Have to be good to stay in the market
Have to be good at design and construction to stay in the market. Do not necessarily have to be good at operating infrastructure
Simple and low cost to implement
Familiar: Consistent with how much infrastructure is delivered in Mongolia
May be hidden costs of inefficient procurement and operations
Soums not yet responsible for providing much infrastructure
Would require additional capacity
Mining company will be expedient
There is previous experience in Mongolia
Costs the government in terms of mining revenues
Good PPP contracts can be difficult to procure and require expertise to manage.
Property developer will be expedient
There is previous experience in Mongolia
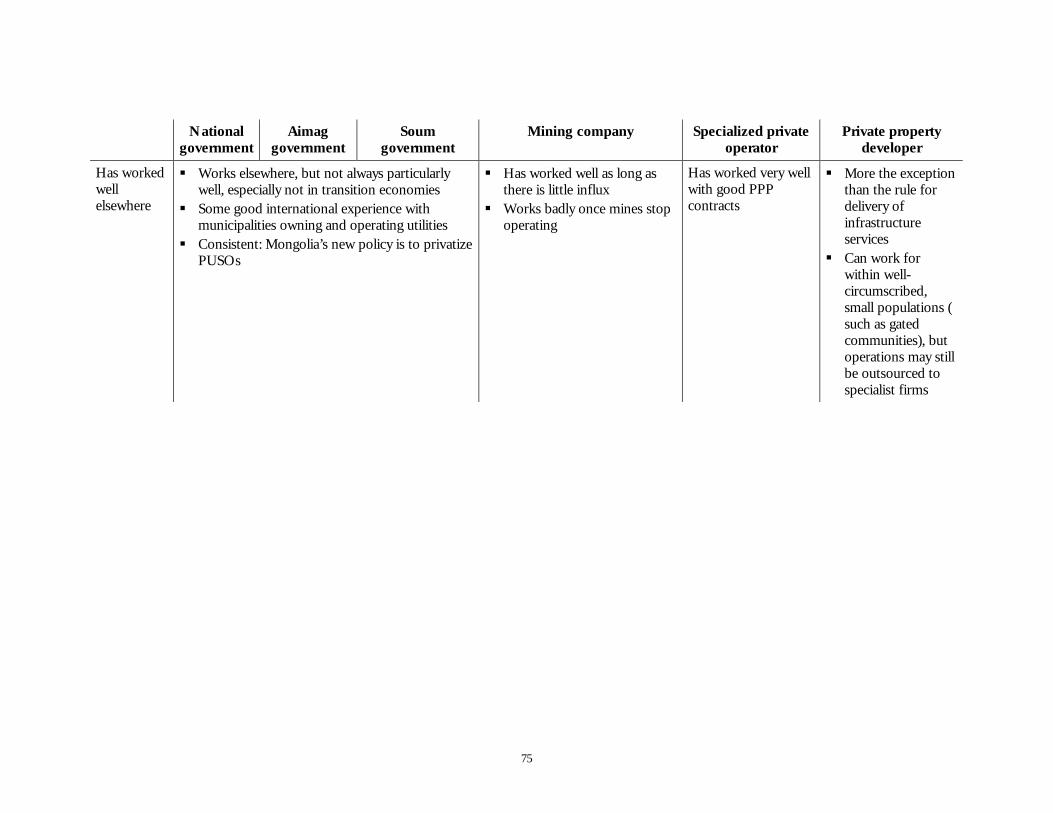
75
National government
Aimag government
Soum government
Mining company Specialized private operator
Private property developer
Has worked well elsewhere
Works elsewhere, but not always particularly well, especially not in transition economies
Some good international experience with municipalities owning and operating utilities
Consistent: Mongolia’s new policy is to privatize PUSOs
Has worked well as long as there is little influx
Works badly once mines stop operating
Has worked very well with good PPP contracts
More the exception than the rule for delivery of infrastructure services
Can work for within well-circumscribed, small populations ( such as gated communities), but operations may still be outsourced to specialist firms
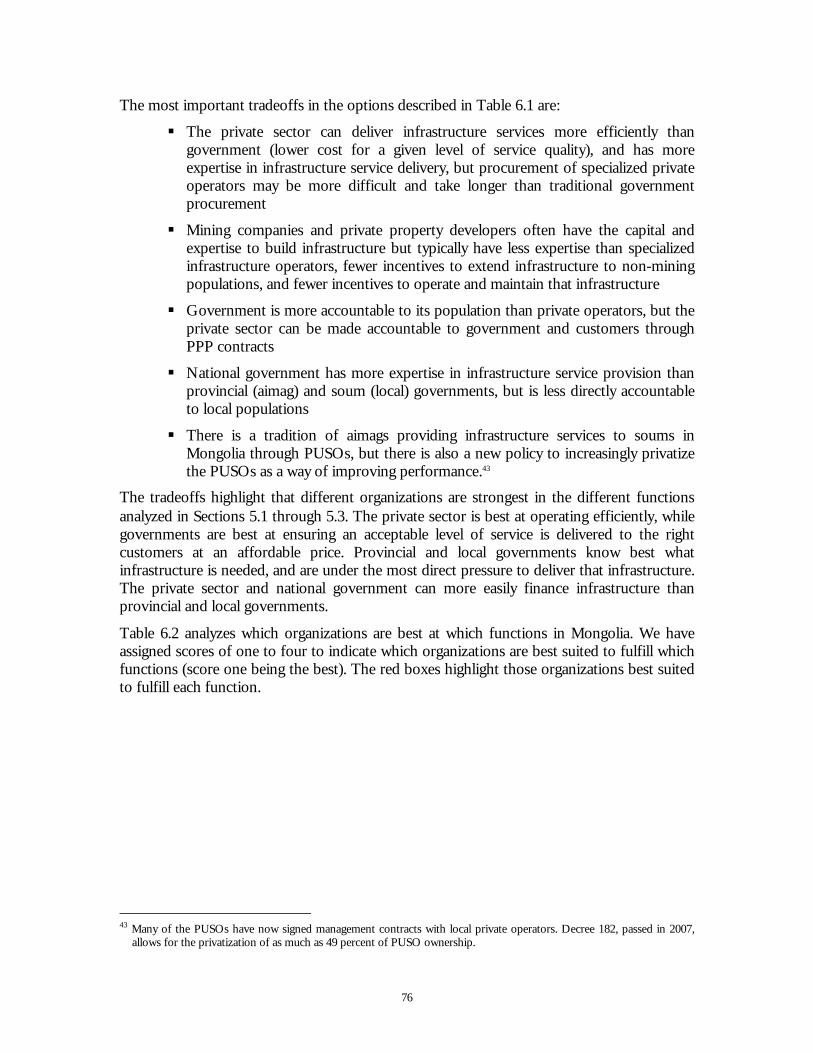
76
The most important tradeoffs in the options described in Table 6.1 are:
The private sector can deliver infrastructure services more efficiently than government (lower cost for a given level of service quality), and has more expertise in infrastructure service delivery, but procurement of specialized private operators may be more difficult and take longer than traditional government procurement
Mining companies and private property developers often have the capital and expertise to build infrastructure but typically have less expertise than specialized infrastructure operators, fewer incentives to extend infrastructure to non-mining populations, and fewer incentives to operate and maintain that infrastructure
Government is more accountable to its population than private operators, but the private sector can be made accountable to government and customers through PPP contracts
National government has more expertise in infrastructure service provision than provincial (aimag) and soum (local) governments, but is less directly accountable to local populations
There is a tradition of aimags providing infrastructure services to soums in Mongolia through PUSOs, but there is also a new policy to increasingly privatize the PUSOs as a way of improving performance.43
The tradeoffs highlight that different organizations are strongest in the different functions analyzed in Sections 5.1 through 5.3. The private sector is best at operating efficiently, while governments are best at ensuring an acceptable level of service is delivered to the right customers at an affordable price. Provincial and local governments know best what infrastructure is needed, and are under the most direct pressure to deliver that infrastructure. The private sector and national government can more easily finance infrastructure than provincial and local governments.
Table 6.2 analyzes which organizations are best at which functions in Mongolia. We have assigned scores of one to four to indicate which organizations are best suited to fulfill which functions (score one being the best). The red boxes highlight those organizations best suited to fulfill each function.
43 Many of the PUSOs have now signed management contracts with local private operators. Decree 182, passed in 2007,
allows for the privatization of as much as 49 percent of PUSO ownership.
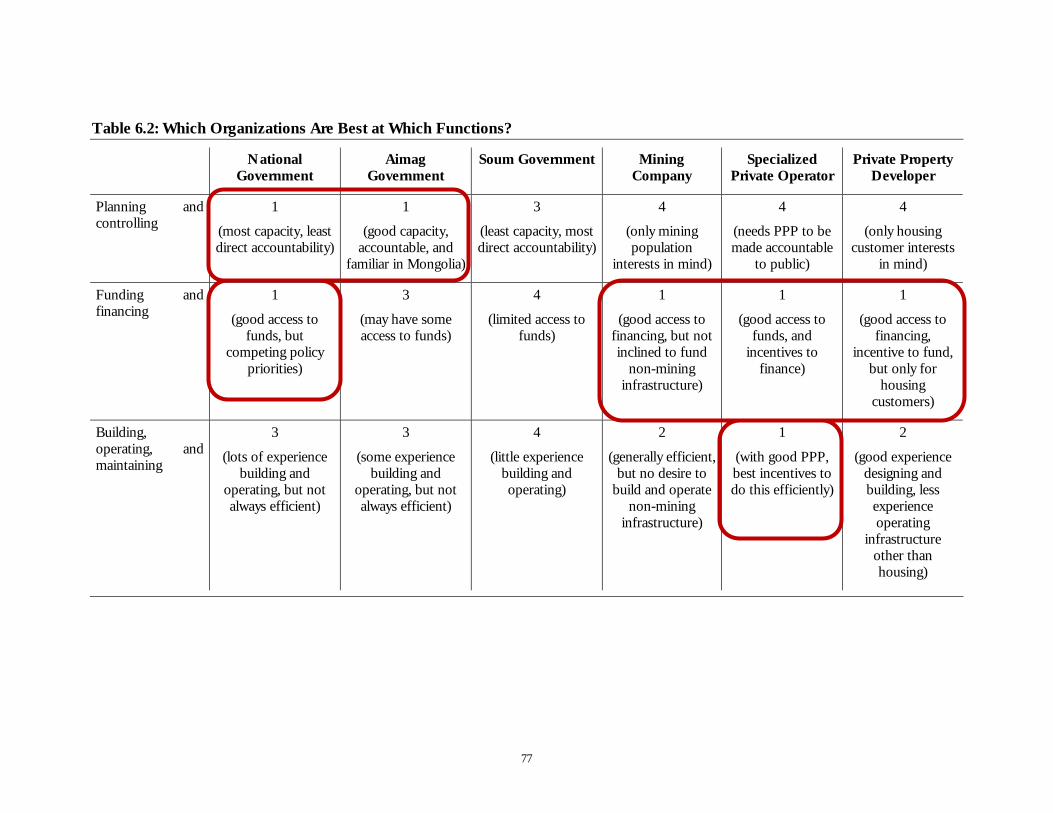
77
Table 6.2: Which Organizations Are Best at Which Functions?
National Government
Aimag Government
Soum Government Mining Company
Specialized Private Operator
Private Property Developer
Planning and controlling
1
(most capacity, least direct accountability)
1
(good capacity, accountable, and
familiar in Mongolia)
3
(least capacity, most direct accountability)
4
(only mining population
interests in mind)
4
(needs PPP to be made accountable
to public)
4
(only housing customer interests
in mind)
Funding and financing
1
(good access to funds, but
competing policy priorities)
3
(may have some access to funds)
4
(limited access to funds)
1
(good access to financing, but not inclined to fund
non-mining infrastructure)
1
(good access to funds, and
incentives to finance)
1
(good access to financing,
incentive to fund, but only for
housing customers)
Building, operating, and maintaining
3
(lots of experience building and
operating, but not always efficient)
3
(some experience building and
operating, but not always efficient)
4
(little experience building and operating)
2
(generally efficient, but no desire to
build and operate non-mining
infrastructure)
1
(with good PPP, best incentives to do this efficiently)
2
(good experience designing and building, less experience operating
infrastructure other than housing)
78
The discussion in this section refers primarily to utility services that might typically be the responsibility of the PUSO, namely: water, wastewater, electricity, heating, roads, and solid waste disposal. We assume that the private sector will build most housing, and that government will take primary responsibility for public administration buildings, hospitals and schools (but will likely hire a private sector construction firm for design and construction).
There remains a risk that the private sector may not have sufficient capacity to finance, design, build and operate the large amounts of infrastructure that needs to be built to support populations around Mongolia’s mines. The prices of basic construction materials have increased sharply in Mongolia in recent years, and investment in construction grew by roughly 77 percent between 2004 and 2007.44 Section 3.1 described examples from South Africa and Australia of how the private sector failed to keep up with demand for affordable housing.
Our conversations with Mongolian construction companies and mine developers suggest that there is capacity and appetite to build the infrastructure needed in Mongolia, but not all of the labor and materials will necessarily be sourced domestically.45 It is our understanding, for example, that Chinese workers provide most of the labor currently used for major construction projects in Mongolia, and will do so for the major mining projects planned in South Gobi.
44 Mongolian Statistical Yearbook 2007. National Statistics Office of Mongolia. Between 2004 and 2007, price increases for
the following domestically-produced construction materials were: for concrete mortar 40%, for brick 23%, for cement 17%, for lime 45%.
45 Castalia’s conversations with Megawatt Group, MCS Properties, and Ivanhoe Mines.
79
6.2 How Can Mongolia Minimize the Tradeoffs? One Possible Approach
There are approaches for infrastructure service delivery that harness the strengths of the different organizations who might be involved. Table 6.1 shows an example of an arrangement that could work well in Mongolia. We call this the “infrastructure council” approach.
The approach is designed to:
Coordinate planning between government and the mining companies, and coordinate planning between national, aimag, and soum governments. We are not aware that any formal mechanism currently exists to ensure that such coordination takes place
Ensure that local, non-mining infrastructure needs are well represented, by including representation from the soums
Be consistent with the geographical realities of mining in South Gobi, and what we understand to be South Gobi’s Governors’ vision for the economic development of his province. The largest mines, Tavan Tolgoi and Oyu Tolgoi, are clustered within roughly 150 km of one another. Operations at both those mines present potentially overlapping infrastructure needs in the nearby soums.46
Pool funds available from the IFIs, Government, and Mining Companies for infrastructure investment. As mentioned in Section 5.2, customers are unlikely to be able to afford full cost-recovery tariffs for the new infrastructure needed in South Gobi. This approach pools funds that can be made available for capital cost subsidies for customers, or subsidized financing for the asset holding company
Remain consistent with what we understand to be the legal framework for infrastructure service delivery in Mongolia. The approach preserves aimag government majority ownership of the PUSO in an asset holding company, while also allowing for private ownership of PUSO assets, consistent with Decree 182
Bring the efficiency of private operators to infrastructure service provision in Mongolia
Draw from international experience with foundations and programs like those described in Section 3.3 (for example, the Inti Rayimi Foundation). The Pilbara mining region in Australia offers a particularly useful example of an organization designed to foster development in a mining region, rather than development around a specific mine. Box 6.1 describes the purpose and activities of the Pilbara Development Commission There are also good examples from non-mining industries, but those that present similar infrastructure delivery and sustainability challenges as mining. Box 6.2 describes how the Philippines Government used the US Military’s departure from Subic Bay as an opportunity for economic growth, and used PPPs to deliver key infrastructure services.
46 A similar, yet separate council could be formed for the mining operations at Ovut Tolgoi and other areas, if and when
proven reserves grow.
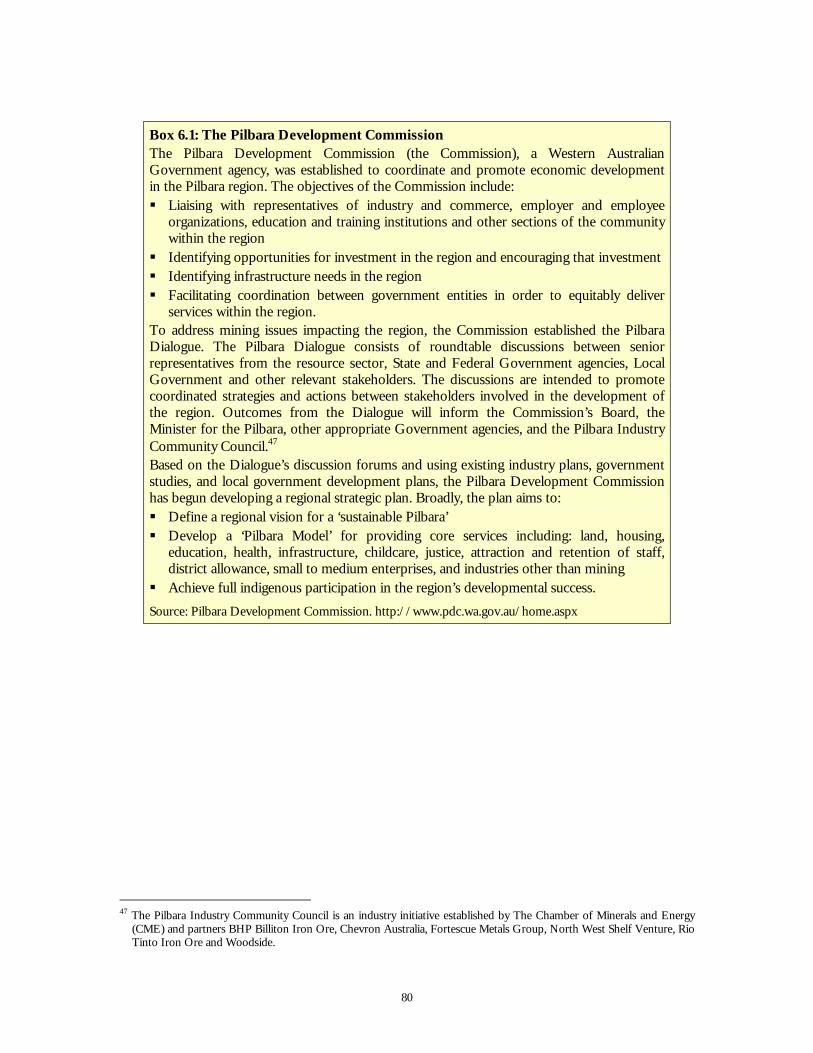
80
Box 6.1: The Pilbara Development Commission The Pilbara Development Commission (the Commission), a Western Australian Government agency, was established to coordinate and promote economic development in the Pilbara region. The objectives of the Commission include: Liaising with representatives of industry and commerce, employer and employee
organizations, education and training institutions and other sections of the community within the region
Identifying opportunities for investment in the region and encouraging that investment Identifying infrastructure needs in the region Facilitating coordination between government entities in order to equitably deliver
services within the region. To address mining issues impacting the region, the Commission established the Pilbara Dialogue. The Pilbara Dialogue consists of roundtable discussions between senior representatives from the resource sector, State and Federal Government agencies, Local Government and other relevant stakeholders. The discussions are intended to promote coordinated strategies and actions between stakeholders involved in the development of the region. Outcomes from the Dialogue will inform the Commission’s Board, the Minister for the Pilbara, other appropriate Government agencies, and the Pilbara Industry Community Council.47 Based on the Dialogue’s discussion forums and using existing industry plans, government studies, and local government development plans, the Pilbara Development Commission has begun developing a regional strategic plan. Broadly, the plan aims to: Define a regional vision for a ‘sustainable Pilbara’ Develop a ‘Pilbara Model’ for providing core services including: land, housing,
education, health, infrastructure, childcare, justice, attraction and retention of staff, district allowance, small to medium enterprises, and industries other than mining
Achieve full indigenous participation in the region’s developmental success. Source: Pilbara Development Commission. http://www.pdc.wa.gov.au/home.aspx
47 The Pilbara Industry Community Council is an industry initiative established by The Chamber of Minerals and Energy
(CME) and partners BHP Billiton Iron Ore, Chevron Australia, Fortescue Metals Group, North West Shelf Venture, Rio Tinto Iron Ore and Woodside.
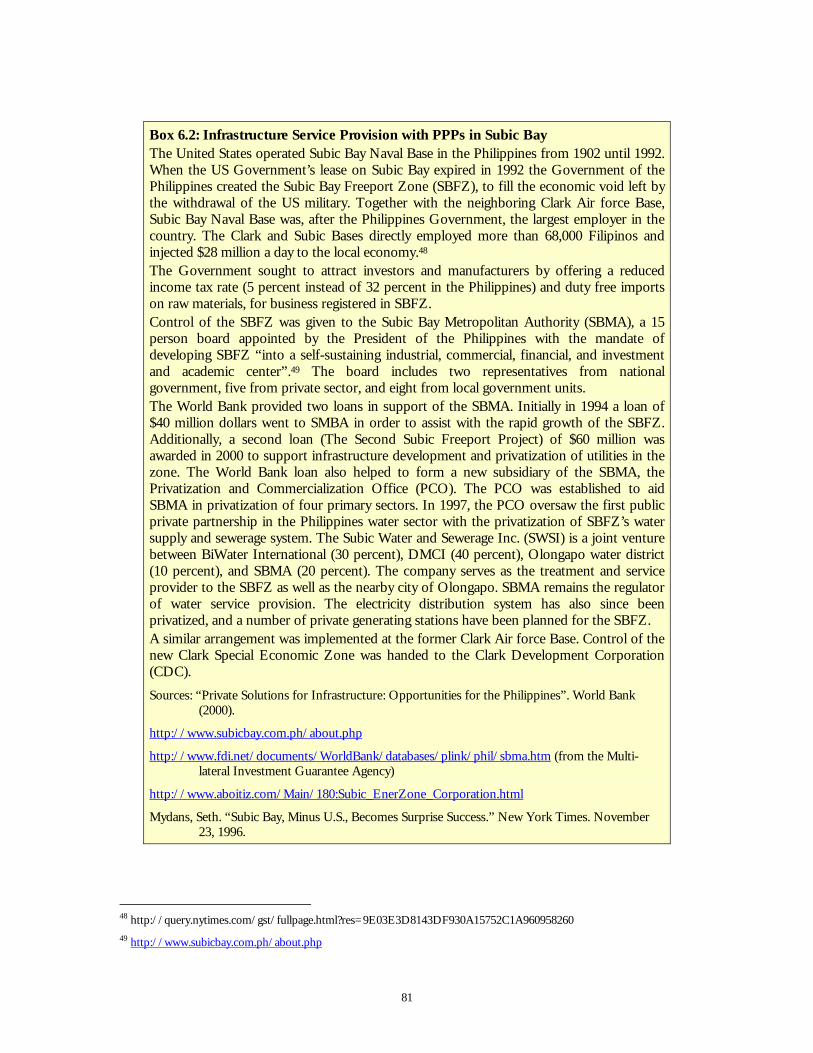
81
Box 6.2: Infrastructure Service Provision with PPPs in Subic Bay The United States operated Subic Bay Naval Base in the Philippines from 1902 until 1992. When the US Government’s lease on Subic Bay expired in 1992 the Government of the Philippines created the Subic Bay Freeport Zone (SBFZ), to fill the economic void left by the withdrawal of the US military. Together with the neighboring Clark Air force Base, Subic Bay Naval Base was, after the Philippines Government, the largest employer in the country. The Clark and Subic Bases directly employed more than 68,000 Filipinos and injected $28 million a day to the local economy.48 The Government sought to attract investors and manufacturers by offering a reduced income tax rate (5 percent instead of 32 percent in the Philippines) and duty free imports on raw materials, for business registered in SBFZ. Control of the SBFZ was given to the Subic Bay Metropolitan Authority (SBMA), a 15 person board appointed by the President of the Philippines with the mandate of developing SBFZ “into a self-sustaining industrial, commercial, financial, and investment and academic center”.49 The board includes two representatives from national government, five from private sector, and eight from local government units. The World Bank provided two loans in support of the SBMA. Initially in 1994 a loan of $40 million dollars went to SMBA in order to assist with the rapid growth of the SBFZ. Additionally, a second loan (The Second Subic Freeport Project) of $60 million was awarded in 2000 to support infrastructure development and privatization of utilities in the zone. The World Bank loan also helped to form a new subsidiary of the SBMA, the Privatization and Commercialization Office (PCO). The PCO was established to aid SBMA in privatization of four primary sectors. In 1997, the PCO oversaw the first public private partnership in the Philippines water sector with the privatization of SBFZ’s water supply and sewerage system. The Subic Water and Sewerage Inc. (SWSI) is a joint venture between BiWater International (30 percent), DMCI (40 percent), Olongapo water district (10 percent), and SBMA (20 percent). The company serves as the treatment and service provider to the SBFZ as well as the nearby city of Olongapo. SBMA remains the regulator of water service provision. The electricity distribution system has also since been privatized, and a number of private generating stations have been planned for the SBFZ. A similar arrangement was implemented at the former Clark Air force Base. Control of the new Clark Special Economic Zone was handed to the Clark Development Corporation (CDC). Sources: “Private Solutions for Infrastructure: Opportunities for the Philippines”. World Bank
(2000).
http://www.subicbay.com.ph/about.php
http://www.fdi.net/documents/WorldBank/databases/plink/phil/sbma.htm (from the Multi-lateral Investment Guarantee Agency)
http://www.aboitiz.com/Main/180:Subic_EnerZone_Corporation.html
Mydans, Seth. “Subic Bay, Minus U.S., Becomes Surprise Success.” New York Times. November 23, 1996.
48 http://query.nytimes.com/gst/fullpage.html?res=9E03E3D8143DF930A15752C1A960958260 49 http://www.subicbay.com.ph/about.php
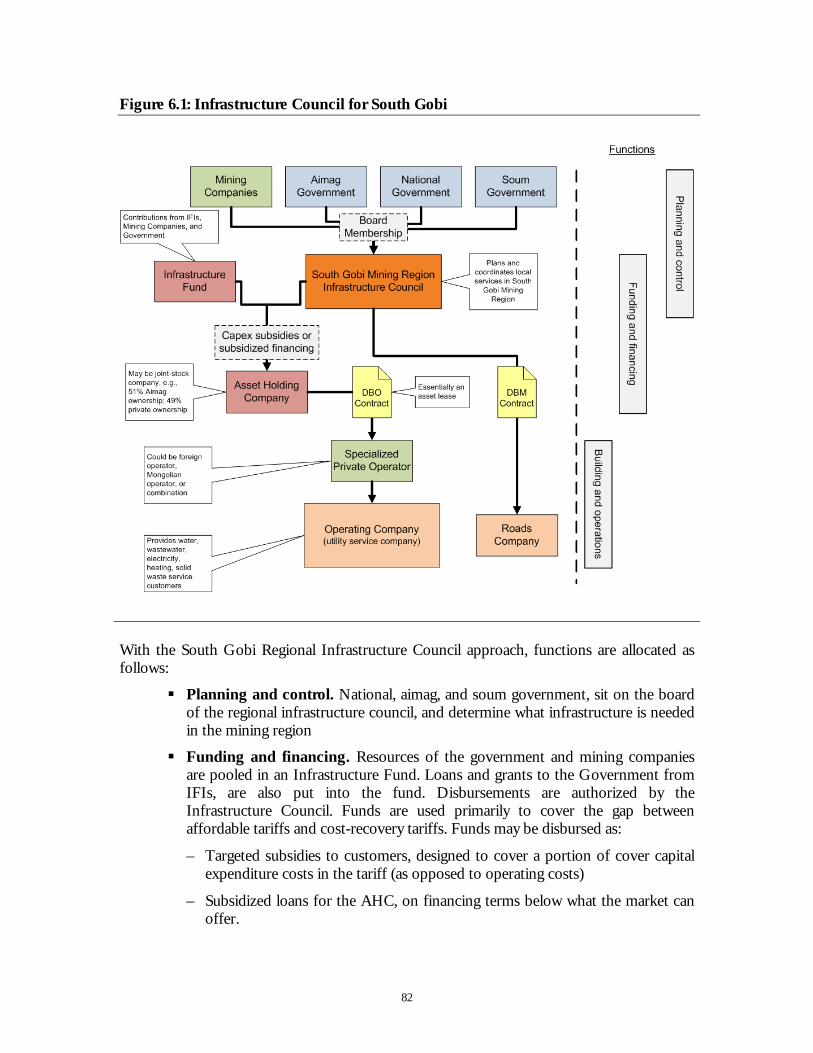
82
Figure 6.1: Infrastructure Council for South Gobi
With the South Gobi Regional Infrastructure Council approach, functions are allocated as follows:
Planning and control. National, aimag, and soum government, sit on the board of the regional infrastructure council, and determine what infrastructure is needed in the mining region
Funding and financing. Resources of the government and mining companies are pooled in an Infrastructure Fund. Loans and grants to the Government from IFIs, are also put into the fund. Disbursements are authorized by the Infrastructure Council. Funds are used primarily to cover the gap between affordable tariffs and cost-recovery tariffs. Funds may be disbursed as:
– Targeted subsidies to customers, designed to cover a portion of cover capital expenditure costs in the tariff (as opposed to operating costs)
– Subsidized loans for the AHC, on financing terms below what the market can offer.
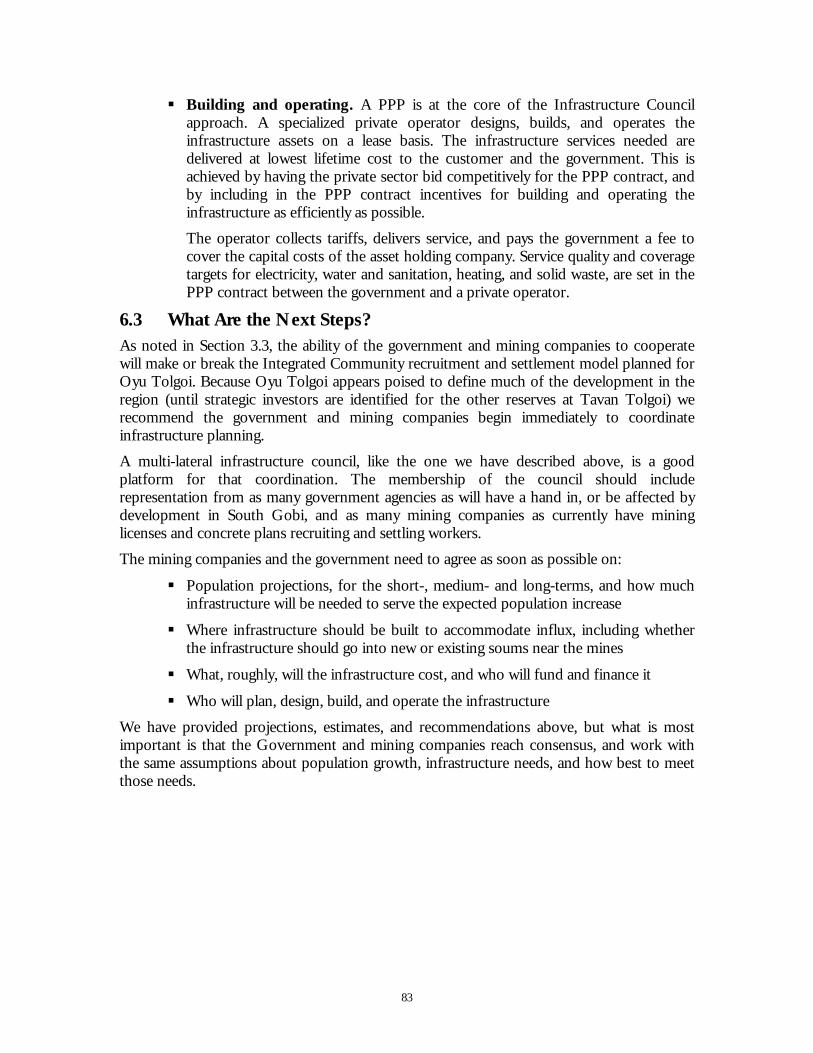
83
Building and operating. A PPP is at the core of the Infrastructure Council approach. A specialized private operator designs, builds, and operates the infrastructure assets on a lease basis. The infrastructure services needed are delivered at lowest lifetime cost to the customer and the government. This is achieved by having the private sector bid competitively for the PPP contract, and by including in the PPP contract incentives for building and operating the infrastructure as efficiently as possible.
The operator collects tariffs, delivers service, and pays the government a fee to cover the capital costs of the asset holding company. Service quality and coverage targets for electricity, water and sanitation, heating, and solid waste, are set in the PPP contract between the government and a private operator.
6.3 What Are the Next Steps? As noted in Section 3.3, the ability of the government and mining companies to cooperate will make or break the Integrated Community recruitment and settlement model planned for Oyu Tolgoi. Because Oyu Tolgoi appears poised to define much of the development in the region (until strategic investors are identified for the other reserves at Tavan Tolgoi) we recommend the government and mining companies begin immediately to coordinate infrastructure planning.
A multi-lateral infrastructure council, like the one we have described above, is a good platform for that coordination. The membership of the council should include representation from as many government agencies as will have a hand in, or be affected by development in South Gobi, and as many mining companies as currently have mining licenses and concrete plans recruiting and settling workers.
The mining companies and the government need to agree as soon as possible on:
Population projections, for the short-, medium- and long-terms, and how much infrastructure will be needed to serve the expected population increase
Where infrastructure should be built to accommodate influx, including whether the infrastructure should go into new or existing soums near the mines
What, roughly, will the infrastructure cost, and who will fund and finance it
Who will plan, design, build, and operate the infrastructure
We have provided projections, estimates, and recommendations above, but what is most important is that the Government and mining companies reach consensus, and work with the same assumptions about population growth, infrastructure needs, and how best to meet those needs.

84
Appendix A: International Cases We identified the four recruitment and settlement models by reviewing examples of more than twenty mining operations around the world, and analyzing their similarities and differences. Table 6.3 lists and summarizes key characteristics of the international cases we studied. Table 3.4 provides examples of the infrastructure investments made by mining companies in the cases we studied.
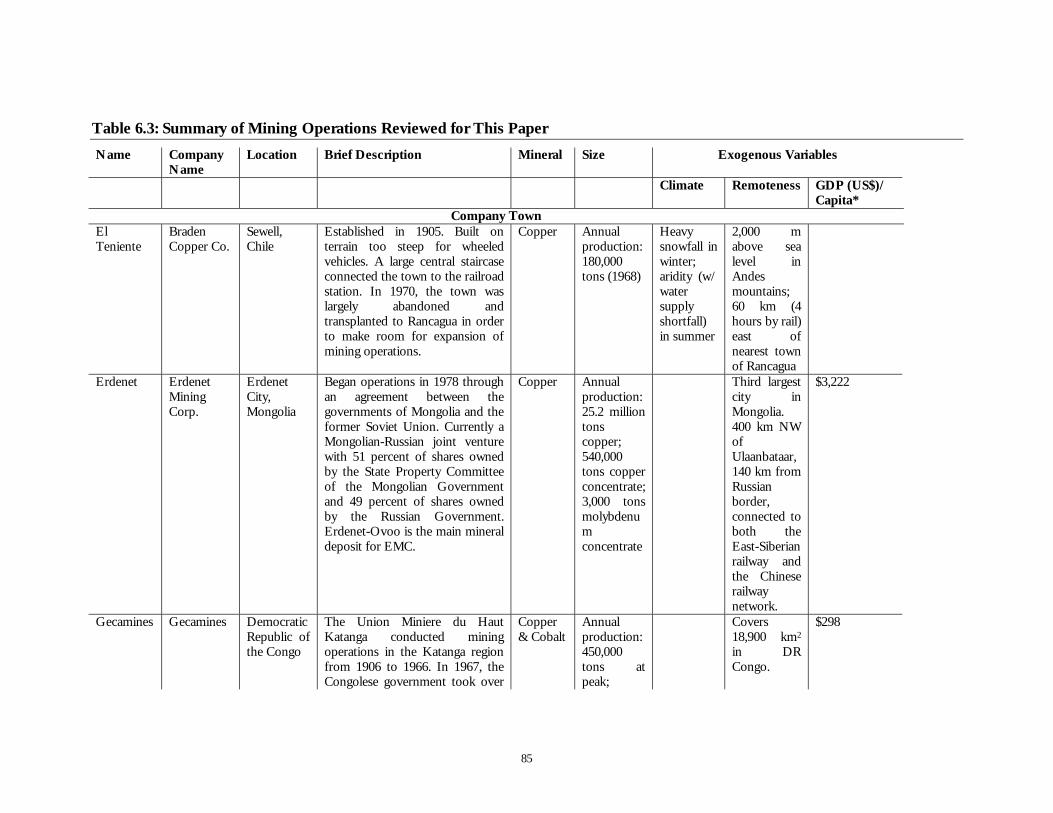
85
Table 6.3: Summary of Mining Operations Reviewed for This Paper
Name Company Name
Location Brief Description Mineral Size Exogenous Variables
Climate Remoteness GDP (US$)/ Capita*
Company Town El Teniente
Braden Copper Co.
Sewell, Chile
Established in 1905. Built on terrain too steep for wheeled vehicles. A large central staircase connected the town to the railroad station. In 1970, the town was largely abandoned and transplanted to Rancagua in order to make room for expansion of mining operations.
Copper Annual production: 180,000 tons (1968)
Heavy snowfall in winter; aridity (w/ water supply shortfall) in summer
2,000 m above sea level in Andes mountains; 60 km (4 hours by rail) east of nearest town of Rancagua
Erdenet Erdenet Mining Corp.
Erdenet City, Mongolia
Began operations in 1978 through an agreement between the governments of Mongolia and the former Soviet Union. Currently a Mongolian-Russian joint venture with 51 percent of shares owned by the State Property Committee of the Mongolian Government and 49 percent of shares owned by the Russian Government. Erdenet-Ovoo is the main mineral deposit for EMC.
Copper Annual production: 25.2 million tons copper; 540,000 tons copper concentrate; 3,000 tons molybdenum concentrate
Third largest city in Mongolia. 400 km NW of Ulaanbataar, 140 km from Russian border, connected to both the East-Siberian railway and the Chinese railway network.
$3,222
Gecamines Gecamines Democratic Republic of the Congo
The Union Miniere du Haut Katanga conducted mining operations in the Katanga region from 1906 to 1966. In 1967, the Congolese government took over
Copper & Cobalt
Annual production: 450,000 tons at peak;
Covers 18,900 km2 in DR Congo.
$298
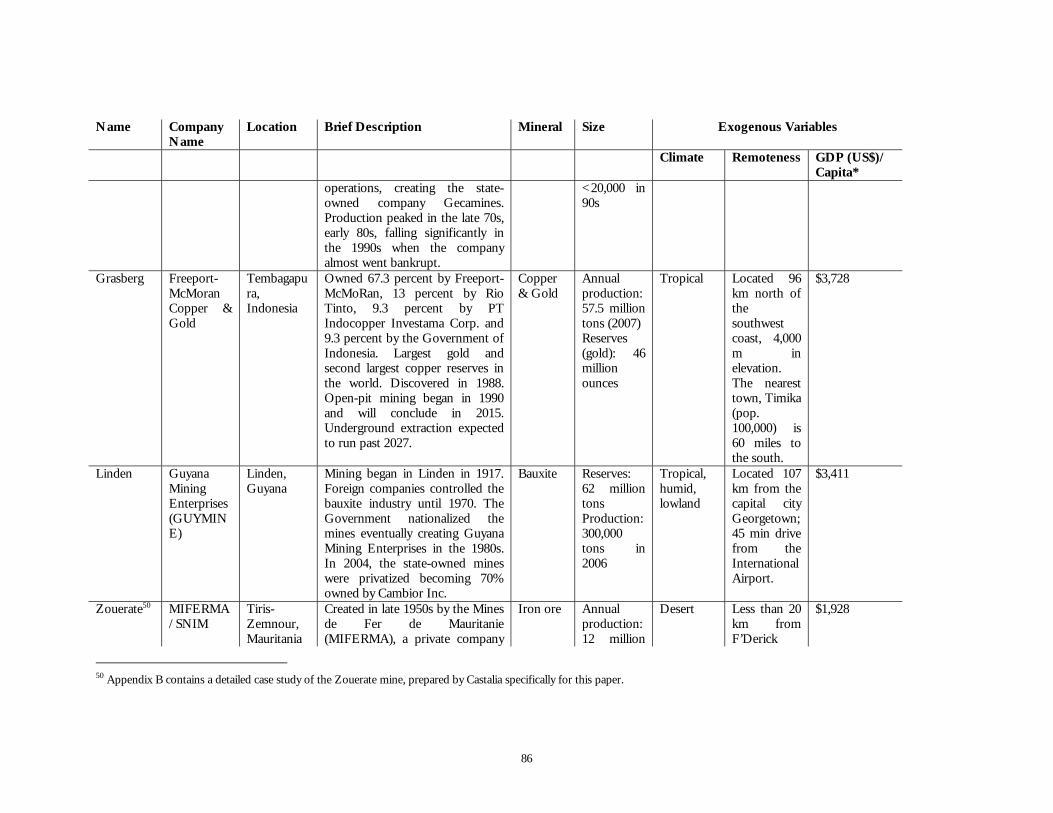
86
Name Company Name
Location Brief Description Mineral Size Exogenous Variables
Climate Remoteness GDP (US$)/ Capita*
operations, creating the state-owned company Gecamines. Production peaked in the late 70s, early 80s, falling significantly in the 1990s when the company almost went bankrupt.
<20,000 in 90s
Grasberg Freeport-McMoran Copper & Gold
Tembagapura, Indonesia
Owned 67.3 percent by Freeport-McMoRan, 13 percent by Rio Tinto, 9.3 percent by PT Indocopper Investama Corp. and 9.3 percent by the Government of Indonesia. Largest gold and second largest copper reserves in the world. Discovered in 1988. Open-pit mining began in 1990 and will conclude in 2015. Underground extraction expected to run past 2027.
Copper & Gold
Annual production: 57.5 million tons (2007) Reserves (gold): 46 million ounces
Tropical Located 96 km north of the southwest coast, 4,000 m in elevation. The nearest town, Timika (pop. 100,000) is 60 miles to the south.
$3,728
Linden Guyana Mining Enterprises (GUYMINE)
Linden, Guyana
Mining began in Linden in 1917. Foreign companies controlled the bauxite industry until 1970. The Government nationalized the mines eventually creating Guyana Mining Enterprises in the 1980s. In 2004, the state-owned mines were privatized becoming 70% owned by Cambior Inc.
Bauxite Reserves: 62 million tons Production: 300,000 tons in 2006
Tropical, humid, lowland
Located 107 km from the capital city Georgetown; 45 min drive from the International Airport.
$3,411
Zouerate50 MIFERMA/SNIM
Tiris-Zemnour, Mauritania
Created in late 1950s by the Mines de Fer de Mauritanie (MIFERMA), a private company
Iron ore Annual production: 12 million
Desert Less than 20 km from F’Derick
$1,928
50 Appendix B contains a detailed case study of the Zouerate mine, prepared by Castalia specifically for this paper.
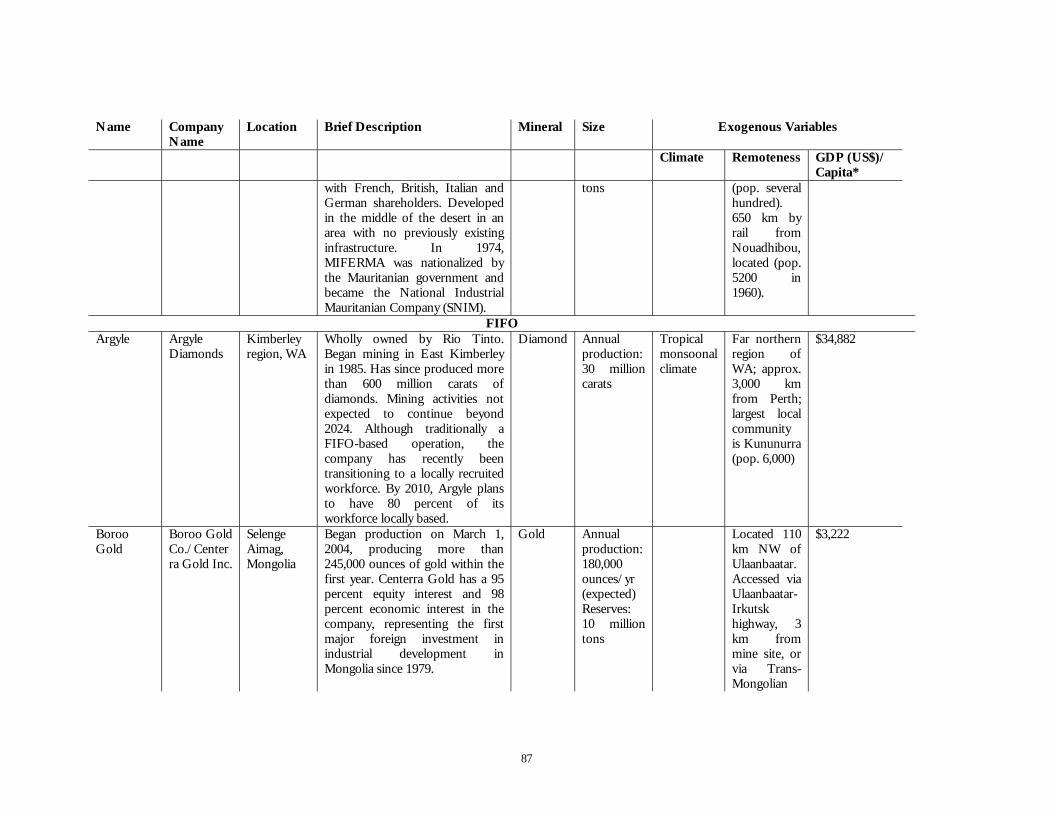
87
Name Company Name
Location Brief Description Mineral Size Exogenous Variables
Climate Remoteness GDP (US$)/ Capita*
with French, British, Italian and German shareholders. Developed in the middle of the desert in an area with no previously existing infrastructure. In 1974, MIFERMA was nationalized by the Mauritanian government and became the National Industrial Mauritanian Company (SNIM).
tons (pop. several hundred). 650 km by rail from Nouadhibou, located (pop. 5200 in 1960).
FIFO Argyle Argyle
Diamonds Kimberley region, WA
Wholly owned by Rio Tinto. Began mining in East Kimberley in 1985. Has since produced more than 600 million carats of diamonds. Mining activities not expected to continue beyond 2024. Although traditionally a FIFO-based operation, the company has recently been transitioning to a locally recruited workforce. By 2010, Argyle plans to have 80 percent of its workforce locally based.
Diamond Annual production: 30 million carats
Tropical monsoonal climate
Far northern region of WA; approx. 3,000 km from Perth; largest local community is Kununurra (pop. 6,000)
$34,882
Boroo Gold
Boroo Gold Co./Centerra Gold Inc.
Selenge Aimag, Mongolia
Began production on March 1, 2004, producing more than 245,000 ounces of gold within the first year. Centerra Gold has a 95 percent equity interest and 98 percent economic interest in the company, representing the first major foreign investment in industrial development in Mongolia since 1979.
Gold Annual production: 180,000 ounces/yr (expected) Reserves: 10 million tons
Located 110 km NW of Ulaanbaatar. Accessed via Ulaanbaatar-Irkutsk highway, 3 km from mine site, or via Trans-Mongolian
$3,222
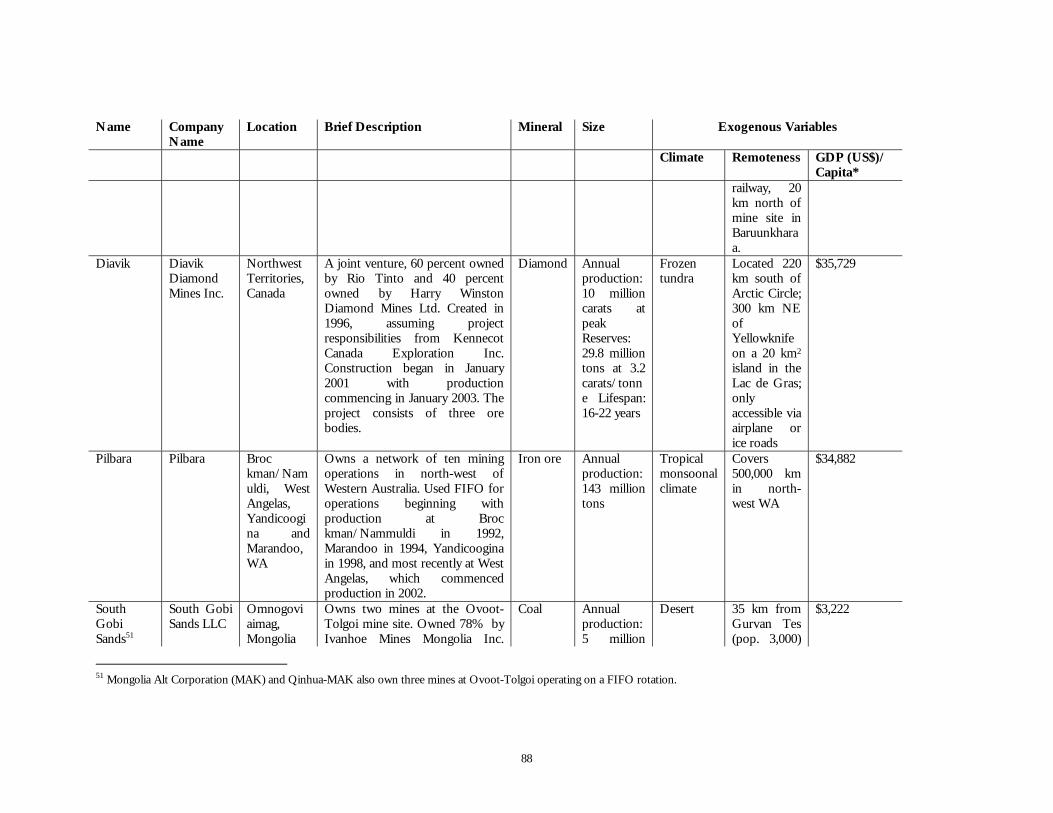
88
Name Company Name
Location Brief Description Mineral Size Exogenous Variables
Climate Remoteness GDP (US$)/ Capita*
railway, 20 km north of mine site in Baruunkharaa.
Diavik Diavik Diamond Mines Inc.
Northwest Territories, Canada
A joint venture, 60 percent owned by Rio Tinto and 40 percent owned by Harry Winston Diamond Mines Ltd. Created in 1996, assuming project responsibilities from Kennecot Canada Exploration Inc. Construction began in January 2001 with production commencing in January 2003. The project consists of three ore bodies.
Diamond Annual production: 10 million carats at peak Reserves: 29.8 million tons at 3.2 carats/tonne Lifespan: 16-22 years
Frozen tundra
Located 220 km south of Arctic Circle; 300 km NE of Yellowknife on a 20 km2 island in the Lac de Gras; only accessible via airplane or ice roads
$35,729
Pilbara Pilbara Broc kman/Namuldi, West Angelas, Yandicoogina and Marandoo, WA
Owns a network of ten mining operations in north-west of Western Australia. Used FIFO for operations beginning with production at Broc kman/Nammuldi in 1992, Marandoo in 1994, Yandicoogina in 1998, and most recently at West Angelas, which commenced production in 2002.
Iron ore Annual production: 143 million tons
Tropical monsoonal climate
Covers 500,000 km in north-west WA
$34,882
South Gobi Sands51
South Gobi Sands LLC
Omnogovi aimag, Mongolia
Owns two mines at the Ovoot-Tolgoi mine site. Owned 78% by Ivanhoe Mines Mongolia Inc.
Coal Annual production: 5 million
Desert 35 km from Gurvan Tes (pop. 3,000)
$3,222
51 Mongolia Alt Corporation (MAK) and Qinhua-MAK also own three mines at Ovoot-Tolgoi operating on a FIFO rotation.
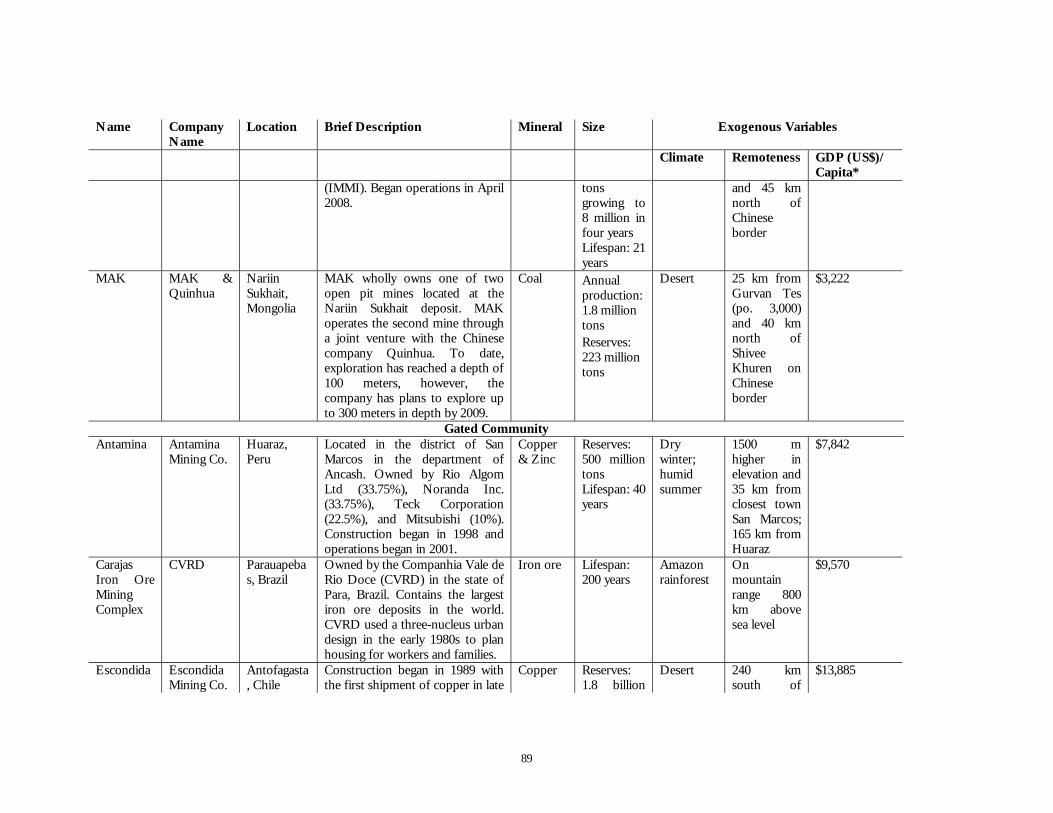
89
Name Company Name
Location Brief Description Mineral Size Exogenous Variables
Climate Remoteness GDP (US$)/ Capita*
(IMMI). Began operations in April 2008.
tons growing to 8 million in four years Lifespan: 21 years
and 45 km north of Chinese border
MAK MAK & Quinhua
Nariin Sukhait, Mongolia
MAK wholly owns one of two open pit mines located at the Nariin Sukhait deposit. MAK operates the second mine through a joint venture with the Chinese company Quinhua. To date, exploration has reached a depth of 100 meters, however, the company has plans to explore up to 300 meters in depth by 2009.
Coal Annual production: 1.8 million tons Reserves: 223 million tons
Desert 25 km from Gurvan Tes (po. 3,000) and 40 km north of Shivee Khuren on Chinese border
$3,222
Gated Community Antamina Antamina
Mining Co. Huaraz, Peru
Located in the district of San Marcos in the department of Ancash. Owned by Rio Algom Ltd (33.75%), Noranda Inc. (33.75%), Teck Corporation (22.5%), and Mitsubishi (10%). Construction began in 1998 and operations began in 2001.
Copper & Zinc
Reserves: 500 million tons Lifespan: 40 years
Dry winter; humid summer
1500 m higher in elevation and 35 km from closest town San Marcos; 165 km from Huaraz
$7,842
Carajas Iron Ore Mining Complex
CVRD Parauapebas, Brazil
Owned by the Companhia Vale de Rio Doce (CVRD) in the state of Para, Brazil. Contains the largest iron ore deposits in the world. CVRD used a three-nucleus urban design in the early 1980s to plan housing for workers and families.
Iron ore Lifespan: 200 years
Amazon rainforest
On mountain range 800 km above sea level
$9,570
Escondida Escondida Mining Co.
Antofagasta, Chile
Construction began in 1989 with the first shipment of copper in late
Copper Reserves: 1.8 billion
Desert 240 km south of
$13,885
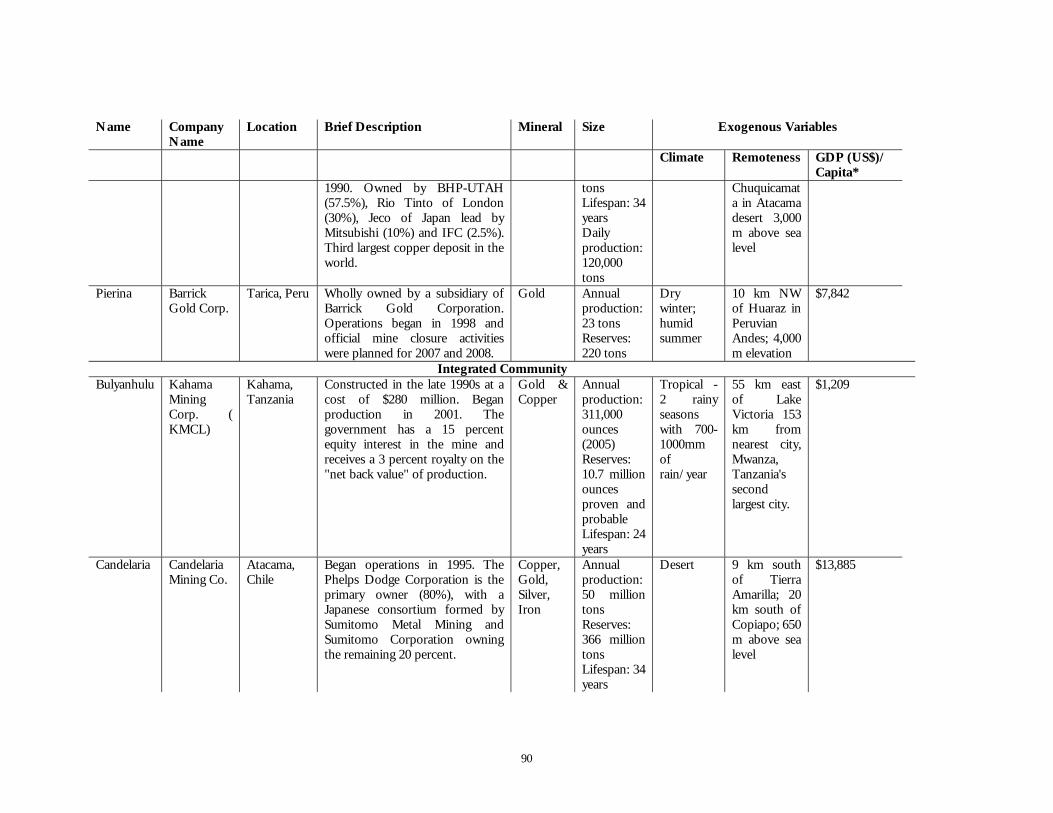
90
Name Company Name
Location Brief Description Mineral Size Exogenous Variables
Climate Remoteness GDP (US$)/ Capita*
1990. Owned by BHP-UTAH (57.5%), Rio Tinto of London (30%), Jeco of Japan lead by Mitsubishi (10%) and IFC (2.5%). Third largest copper deposit in the world.
tons Lifespan: 34 years Daily production: 120,000 tons
Chuquicamata in Atacama desert 3,000 m above sea level
Pierina Barrick Gold Corp.
Tarica, Peru Wholly owned by a subsidiary of Barrick Gold Corporation. Operations began in 1998 and official mine closure activities were planned for 2007 and 2008.
Gold Annual production: 23 tons Reserves: 220 tons
Dry winter; humid summer
10 km NW of Huaraz in Peruvian Andes; 4,000 m elevation
$7,842
Integrated Community Bulyanhulu Kahama
Mining Corp. ( KMCL)
Kahama, Tanzania
Constructed in the late 1990s at a cost of $280 million. Began production in 2001. The government has a 15 percent equity interest in the mine and receives a 3 percent royalty on the "net back value" of production.
Gold & Copper
Annual production: 311,000 ounces (2005) Reserves: 10.7 million ounces proven and probable Lifespan: 24 years
Tropical - 2 rainy seasons with 700-1000mm of rain/year
55 km east of Lake Victoria 153 km from nearest city, Mwanza, Tanzania's second largest city.
$1,209
Candelaria Candelaria Mining Co.
Atacama, Chile
Began operations in 1995. The Phelps Dodge Corporation is the primary owner (80%), with a Japanese consortium formed by Sumitomo Metal Mining and Sumitomo Corporation owning the remaining 20 percent.
Copper, Gold, Silver, Iron
Annual production: 50 million tons Reserves: 366 million tons Lifespan: 34 years
Desert 9 km south of Tierra Amarilla; 20 km south of Copiapo; 650 m above sea level
$13,885
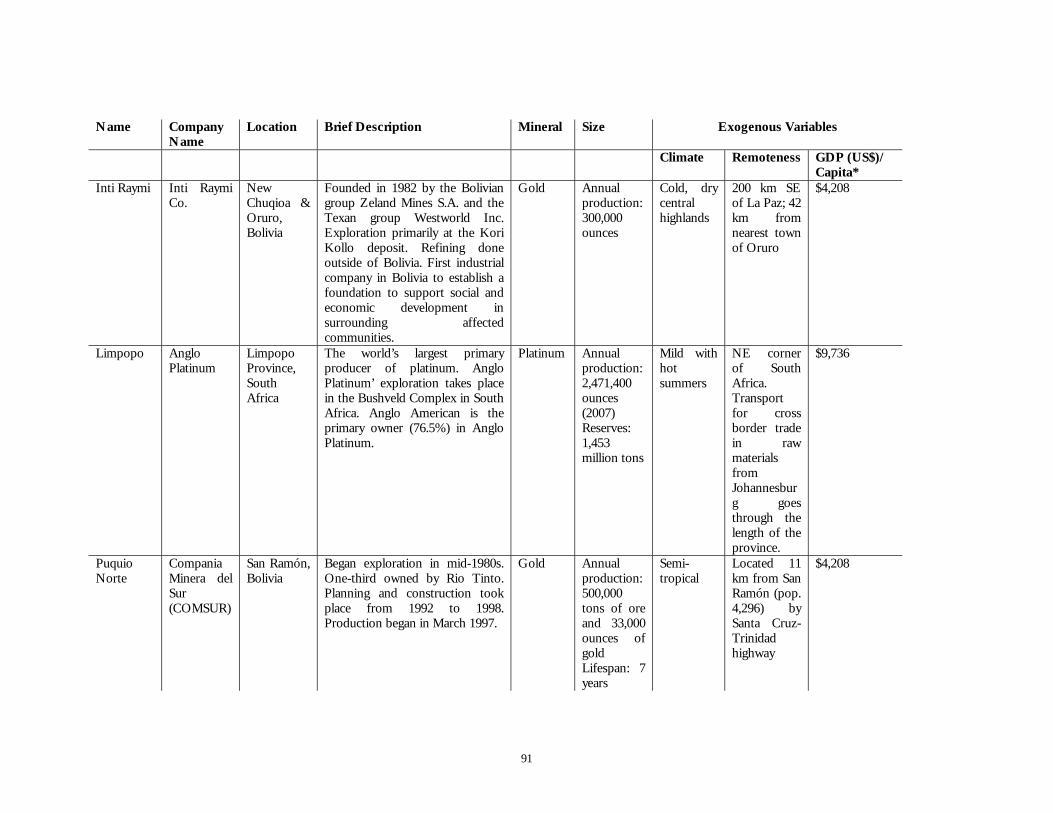
91
Name Company Name
Location Brief Description Mineral Size Exogenous Variables
Climate Remoteness GDP (US$)/ Capita*
Inti Raymi Inti Raymi Co.
New Chuqioa & Oruro, Bolivia
Founded in 1982 by the Bolivian group Zeland Mines S.A. and the Texan group Westworld Inc. Exploration primarily at the Kori Kollo deposit. Refining done outside of Bolivia. First industrial company in Bolivia to establish a foundation to support social and economic development in surrounding affected communities.
Gold Annual production: 300,000 ounces
Cold, dry central highlands
200 km SE of La Paz; 42 km from nearest town of Oruro
$4,208
Limpopo Anglo Platinum
Limpopo Province, South Africa
The world’s largest primary producer of platinum. Anglo Platinum’ exploration takes place in the Bushveld Complex in South Africa. Anglo American is the primary owner (76.5%) in Anglo Platinum.
Platinum Annual production: 2,471,400 ounces (2007) Reserves: 1,453 million tons
Mild with hot summers
NE corner of South Africa. Transport for cross border trade in raw materials from Johannesburg goes through the length of the province.
$9,736
Puquio Norte
Compania Minera del Sur (COMSUR)
San Ramón, Bolivia
Began exploration in mid-1980s. One-third owned by Rio Tinto. Planning and construction took place from 1992 to 1998. Production began in March 1997.
Gold Annual production: 500,000 tons of ore and 33,000 ounces of gold Lifespan: 7 years
Semi-tropical
Located 11 km from San Ramón (pop. 4,296) by Santa Cruz-Trinidad highway
$4,208
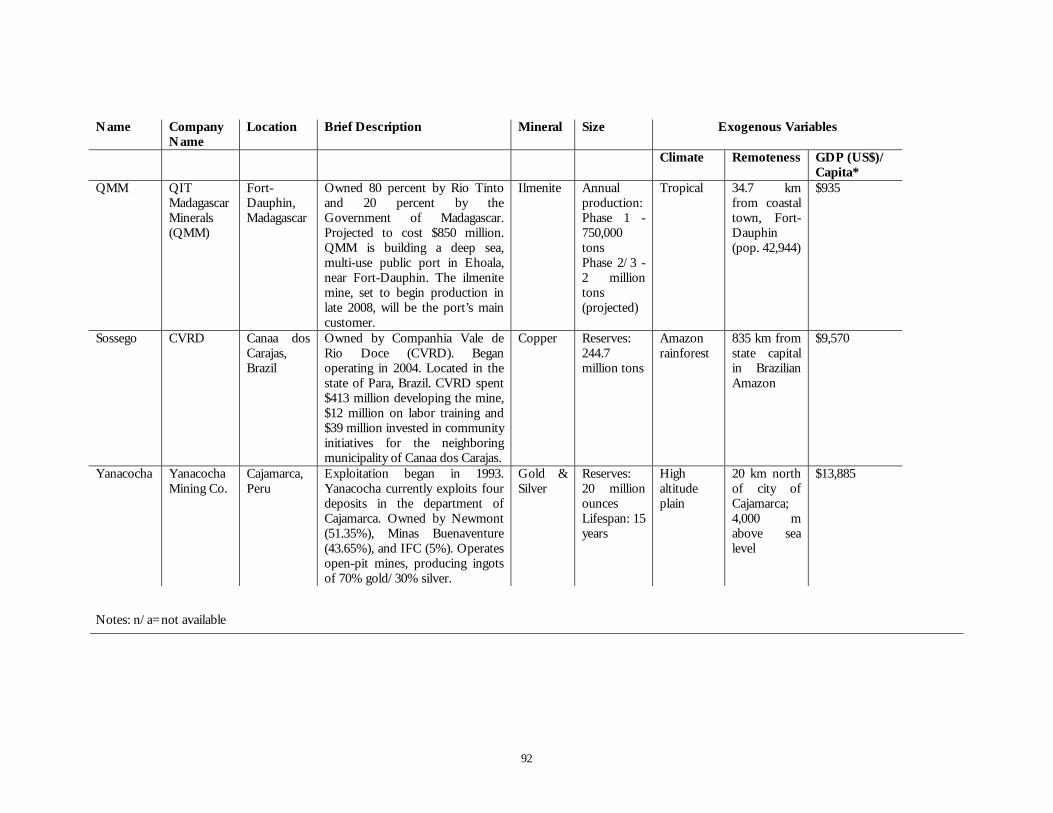
92
Name Company Name
Location Brief Description Mineral Size Exogenous Variables
Climate Remoteness GDP (US$)/ Capita*
QMM QIT Madagascar Minerals (QMM)
Fort-Dauphin, Madagascar
Owned 80 percent by Rio Tinto and 20 percent by the Government of Madagascar. Projected to cost $850 million. QMM is building a deep sea, multi-use public port in Ehoala, near Fort-Dauphin. The ilmenite mine, set to begin production in late 2008, will be the port’s main customer.
Ilmenite Annual production: Phase 1 - 750,000 tons Phase 2/3 - 2 million tons (projected)
Tropical 34.7 km from coastal town, Fort-Dauphin (pop. 42,944)
$935
Sossego CVRD Canaa dos Carajas, Brazil
Owned by Companhia Vale de Rio Doce (CVRD). Began operating in 2004. Located in the state of Para, Brazil. CVRD spent $413 million developing the mine, $12 million on labor training and $39 million invested in community initiatives for the neighboring municipality of Canaa dos Carajas.
Copper Reserves: 244.7 million tons
Amazon rainforest
835 km from state capital in Brazilian Amazon
$9,570
Yanacocha Yanacocha Mining Co.
Cajamarca, Peru
Exploitation began in 1993. Yanacocha currently exploits four deposits in the department of Cajamarca. Owned by Newmont (51.35%), Minas Buenaventure (43.65%), and IFC (5%). Operates open-pit mines, producing ingots of 70% gold/30% silver.
Gold & Silver
Reserves: 20 million ounces Lifespan: 15 years
High altitude plain
20 km north of city of Cajamarca; 4,000 m above sea level
$13,885
Notes: n/a=not available
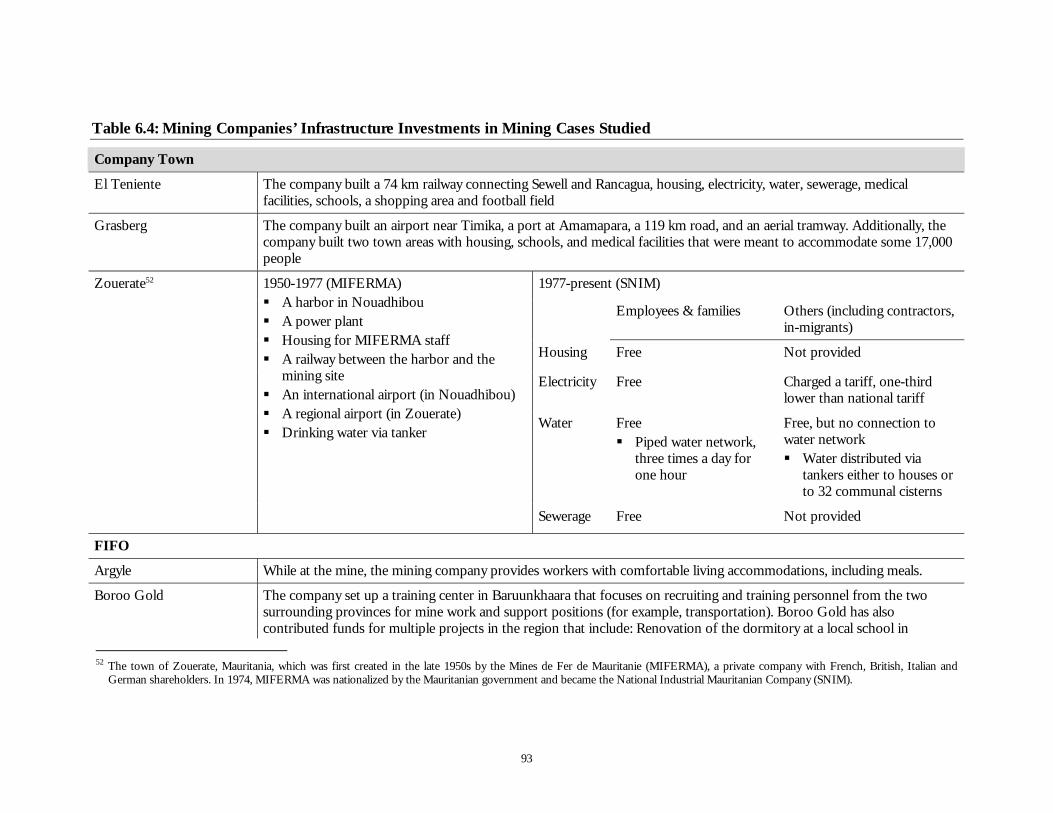
93
Table 6.4: Mining Companies’ Infrastructure Investments in Mining Cases Studied
Company Town
El Teniente The company built a 74 km railway connecting Sewell and Rancagua, housing, electricity, water, sewerage, medical facilities, schools, a shopping area and football field
Grasberg The company built an airport near Timika, a port at Amamapara, a 119 km road, and an aerial tramway. Additionally, the company built two town areas with housing, schools, and medical facilities that were meant to accommodate some 17,000 people
1977-present (SNIM)
Employees & families Others (including contractors, in-migrants)
Housing Free Not provided
Electricity Free Charged a tariff, one-third lower than national tariff
Water Free Piped water network,
three times a day for one hour
Free, but no connection to water network Water distributed via
tankers either to houses or to 32 communal cisterns
Zouerate52 1950-1977 (MIFERMA) A harbor in Nouadhibou A power plant Housing for MIFERMA staff A railway between the harbor and the
mining site An international airport (in Nouadhibou) A regional airport (in Zouerate) Drinking water via tanker
Sewerage Free Not provided
FIFO
Argyle While at the mine, the mining company provides workers with comfortable living accommodations, including meals.
Boroo Gold The company set up a training center in Baruunkhaara that focuses on recruiting and training personnel from the two surrounding provinces for mine work and support positions (for example, transportation). Boroo Gold has also contributed funds for multiple projects in the region that include: Renovation of the dormitory at a local school in
52 The town of Zouerate, Mauritania, which was first created in the late 1950s by the Mines de Fer de Mauritanie (MIFERMA), a private company with French, British, Italian and
German shareholders. In 1974, MIFERMA was nationalized by the Mauritanian government and became the National Industrial Mauritanian Company (SNIM).
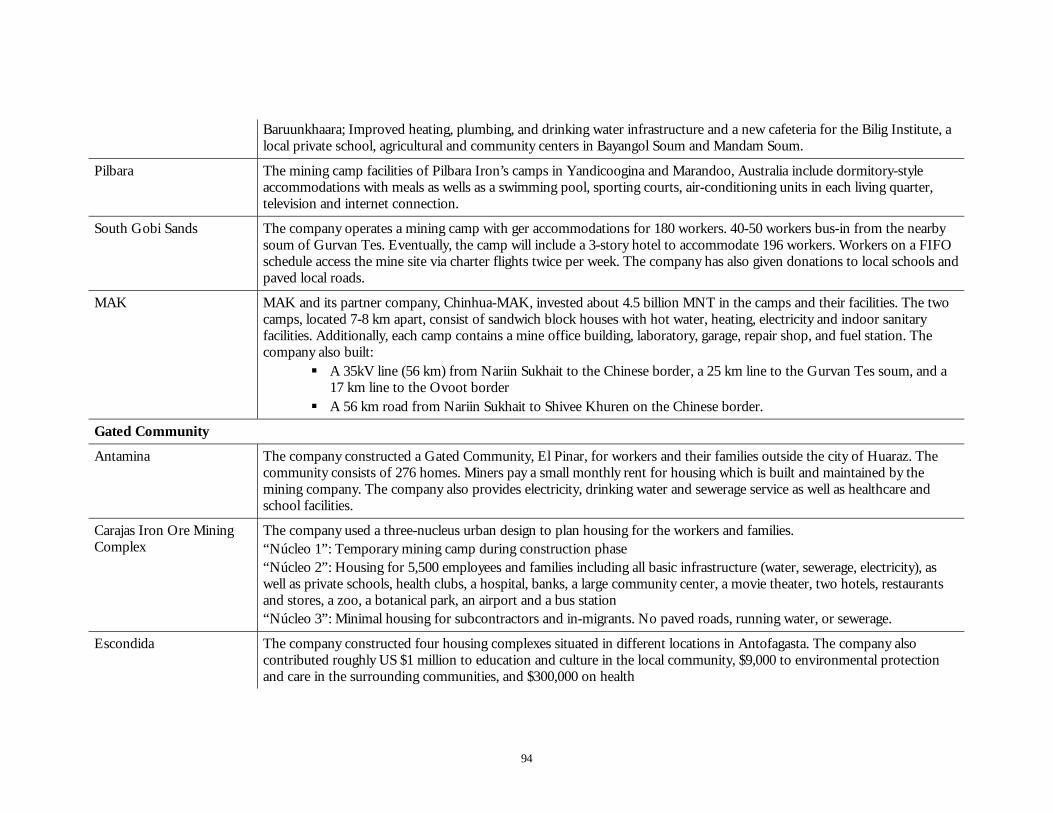
94
Baruunkhaara; Improved heating, plumbing, and drinking water infrastructure and a new cafeteria for the Bilig Institute, a local private school, agricultural and community centers in Bayangol Soum and Mandam Soum.
Pilbara The mining camp facilities of Pilbara Iron’s camps in Yandicoogina and Marandoo, Australia include dormitory-style accommodations with meals as wells as a swimming pool, sporting courts, air-conditioning units in each living quarter, television and internet connection.
South Gobi Sands The company operates a mining camp with ger accommodations for 180 workers. 40-50 workers bus-in from the nearby soum of Gurvan Tes. Eventually, the camp will include a 3-story hotel to accommodate 196 workers. Workers on a FIFO schedule access the mine site via charter flights twice per week. The company has also given donations to local schools and paved local roads.
MAK MAK and its partner company, Chinhua-MAK, invested about 4.5 billion MNT in the camps and their facilities. The two camps, located 7-8 km apart, consist of sandwich block houses with hot water, heating, electricity and indoor sanitary facilities. Additionally, each camp contains a mine office building, laboratory, garage, repair shop, and fuel station. The company also built:
A 35kV line (56 km) from Nariin Sukhait to the Chinese border, a 25 km line to the Gurvan Tes soum, and a 17 km line to the Ovoot border
A 56 km road from Nariin Sukhait to Shivee Khuren on the Chinese border.
Gated Community
Antamina The company constructed a Gated Community, El Pinar, for workers and their families outside the city of Huaraz. The community consists of 276 homes. Miners pay a small monthly rent for housing which is built and maintained by the mining company. The company also provides electricity, drinking water and sewerage service as well as healthcare and school facilities.
Carajas Iron Ore Mining Complex
The company used a three-nucleus urban design to plan housing for the workers and families. “Núcleo 1”: Temporary mining camp during construction phase “Núcleo 2”: Housing for 5,500 employees and families including all basic infrastructure (water, sewerage, electricity), as well as private schools, health clubs, a hospital, banks, a large community center, a movie theater, two hotels, restaurants and stores, a zoo, a botanical park, an airport and a bus station “Núcleo 3”: Minimal housing for subcontractors and in-migrants. No paved roads, running water, or sewerage.
Escondida The company constructed four housing complexes situated in different locations in Antofagasta. The company also contributed roughly US $1 million to education and culture in the local community, $9,000 to environmental protection and care in the surrounding communities, and $300,000 on health
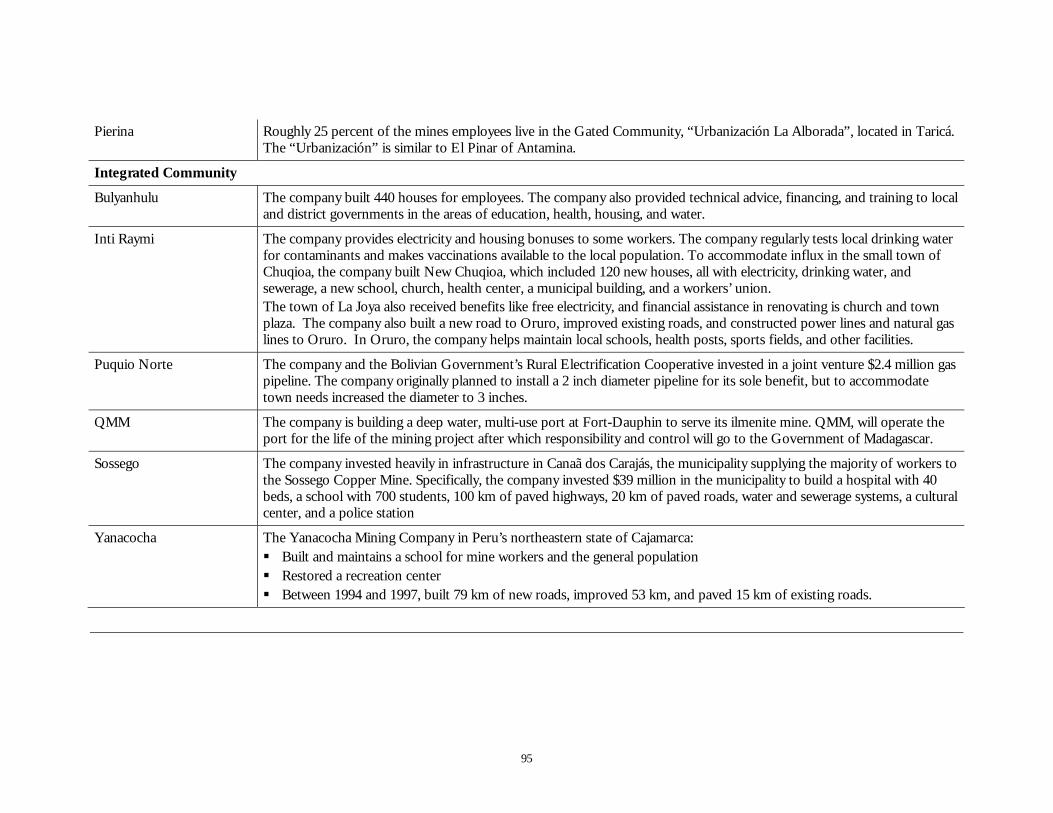
95
Pierina Roughly 25 percent of the mines employees live in the Gated Community, “Urbanización La Alborada”, located in Taricá. The “Urbanización” is similar to El Pinar of Antamina.
Integrated Community
Bulyanhulu The company built 440 houses for employees. The company also provided technical advice, financing, and training to local and district governments in the areas of education, health, housing, and water.
Inti Raymi The company provides electricity and housing bonuses to some workers. The company regularly tests local drinking water for contaminants and makes vaccinations available to the local population. To accommodate influx in the small town of Chuqioa, the company built New Chuqioa, which included 120 new houses, all with electricity, drinking water, and sewerage, a new school, church, health center, a municipal building, and a workers’ union. The town of La Joya also received benefits like free electricity, and financial assistance in renovating is church and town plaza. The company also built a new road to Oruro, improved existing roads, and constructed power lines and natural gas lines to Oruro. In Oruro, the company helps maintain local schools, health posts, sports fields, and other facilities.
Puquio Norte The company and the Bolivian Government’s Rural Electrification Cooperative invested in a joint venture $2.4 million gas pipeline. The company originally planned to install a 2 inch diameter pipeline for its sole benefit, but to accommodate town needs increased the diameter to 3 inches.
QMM The company is building a deep water, multi-use port at Fort-Dauphin to serve its ilmenite mine. QMM, will operate the port for the life of the mining project after which responsibility and control will go to the Government of Madagascar.
Sossego The company invested heavily in infrastructure in Canaã dos Carajás, the municipality supplying the majority of workers to the Sossego Copper Mine. Specifically, the company invested $39 million in the municipality to build a hospital with 40 beds, a school with 700 students, 100 km of paved highways, 20 km of paved roads, water and sewerage systems, a cultural center, and a police station
Yanacocha The Yanacocha Mining Company in Peru’s northeastern state of Cajamarca: Built and maintains a school for mine workers and the general population Restored a recreation center Between 1994 and 1997, built 79 km of new roads, improved 53 km, and paved 15 km of existing roads.
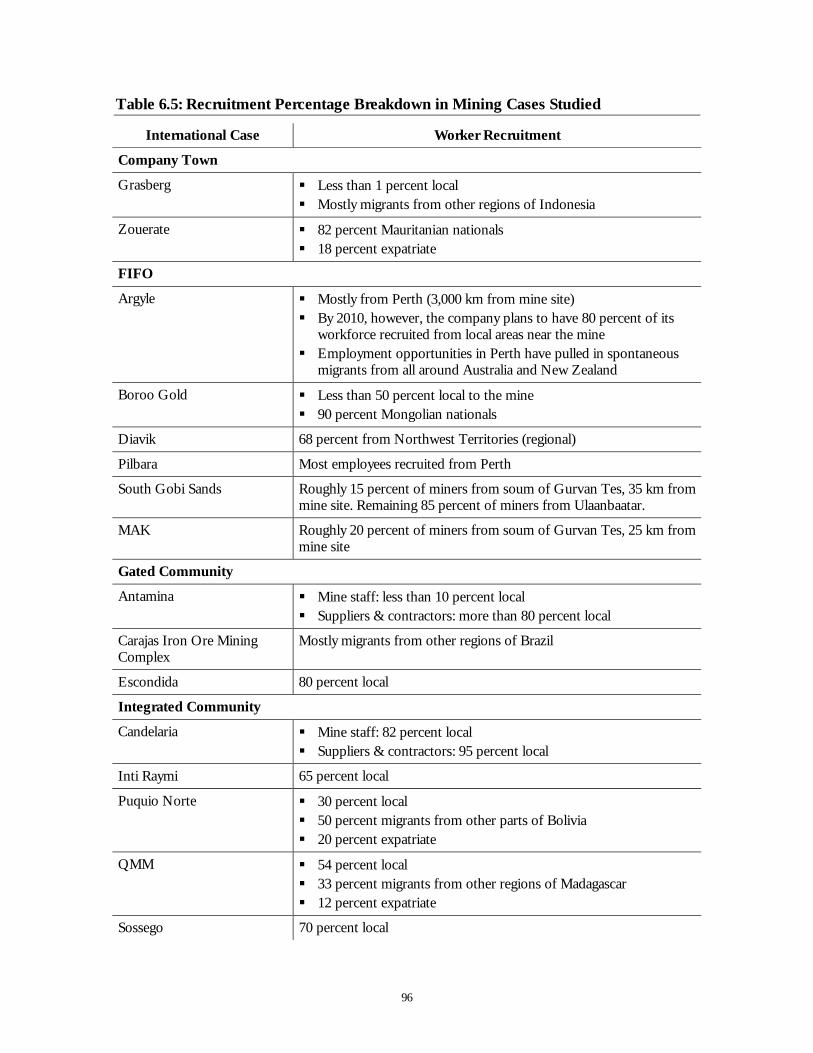
96
Table 6.5: Recruitment Percentage Breakdown in Mining Cases Studied
International Case Worker Recruitment
Company Town
Grasberg Less than 1 percent local Mostly migrants from other regions of Indonesia
Zouerate 82 percent Mauritanian nationals 18 percent expatriate
FIFO
Argyle Mostly from Perth (3,000 km from mine site) By 2010, however, the company plans to have 80 percent of its
workforce recruited from local areas near the mine Employment opportunities in Perth have pulled in spontaneous
migrants from all around Australia and New Zealand
Boroo Gold Less than 50 percent local to the mine 90 percent Mongolian nationals
Diavik 68 percent from Northwest Territories (regional)
Pilbara Most employees recruited from Perth
South Gobi Sands Roughly 15 percent of miners from soum of Gurvan Tes, 35 km from mine site. Remaining 85 percent of miners from Ulaanbaatar.
MAK Roughly 20 percent of miners from soum of Gurvan Tes, 25 km from mine site
Gated Community
Antamina Mine staff: less than 10 percent local Suppliers & contractors: more than 80 percent local
Carajas Iron Ore Mining Complex
Mostly migrants from other regions of Brazil
Escondida 80 percent local
Integrated Community
Candelaria Mine staff: 82 percent local Suppliers & contractors: 95 percent local
Inti Raymi 65 percent local
Puquio Norte 30 percent local 50 percent migrants from other parts of Bolivia 20 percent expatriate
QMM 54 percent local 33 percent migrants from other regions of Madagascar 12 percent expatriate
Sossego 70 percent local

97
International Case Worker Recruitment
Yanacocha 90 percent local
98
Appendix B: Zouerate In-Depth Case Study This case study looks at the mining town of Zouerate in the Kedia region of Mauritania.
B.1 The Kediya Iron Ore Site The Kediya region is in the north-west part of Mauritania and is part of the Tiris-Zemnour province. The province is situated in a desert and, accordingly, living conditions are tough. While the desert of this province is known for the quality of its grass after a rain, the rains do not come often, with no rain in some years.
The presence if iron ore in the Kediya has been well-known for a long time, with written references being made back in 1068. However, prospecting in the area began only after World War II, by the French administration.
Toward the end of the 1950’s, a project to mine iron ore was approved and a private company (MIFERMA – “Mines de Fer de Mauritanie”) was set up to develop and operate the required infrastructure with the help of a US$66 million loan from the World Bank.
The shares in MIFERMA were owned mainly by overseas firms from France (61.6%), United Kingdom (20%), Italy (15%), and Germany (3.4%). Most of the companies involved were steel companies, which accounted for 53.4% of the shares. Later, the Mauritanian Government took a 5 percent shareholding.
Construction began in 1960 and iron ore exports commenced in April 1963. The three year of construction timeframe was due to the fact that the mine was in the middle of the desert, with no existing infrastructure of any kind. Therefore MIFERNA needed to:
Develop a port that could be used to, firstly, import the goods required for the project, and later to export iron ore. The port was developed in the town of Nouadhibou, which had 5,200 inhabitants in 1960. While this was a good site for a port, there were no significant sources of fresh water
Locate and develop an aquifer of potable water. The aquifer was found in Boulanouar, 100 km away from Nouadhibou. Water initially had to be carried by truck tankers, and later by train
Develop a town (including a power plant) for housing MIFERMA staff and head-office in Nouadhibou. The new town was named Cansado City
Build a railway between the port in Nouadhinbou and the mining site near Zouerate. As it was not possible (for political reasons) to lay railway lines through the Spanish Sahara, the railway had to follow the international border. The railway is 650 km long and has 5 stations (mainly used for maintenance works).
Build an international airport in Nouadhibou (allowing for direct regular flights between France and Nouadhibou)
In Zouerate (which was simply open desert), build a power plant, mining head-office, a town for housing mining staff and a regional airport.
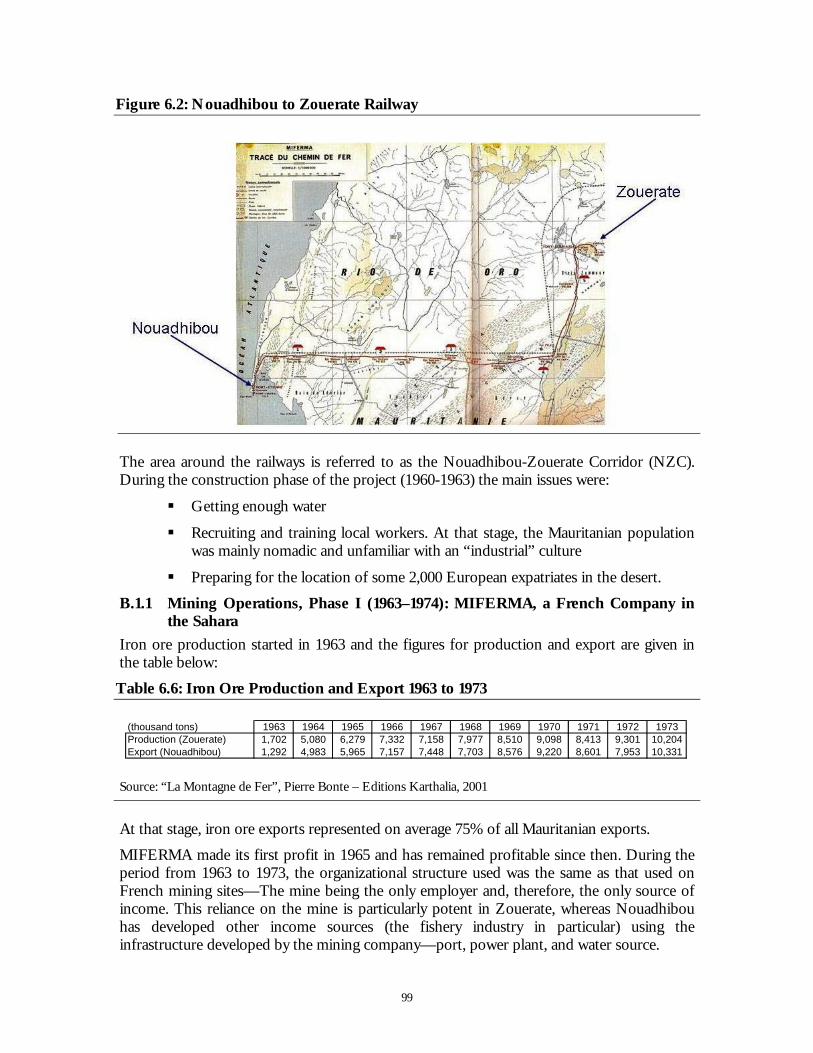
99
Figure 6.2: Nouadhibou to Zouerate Railway
The area around the railways is referred to as the Nouadhibou-Zouerate Corridor (NZC). During the construction phase of the project (1960-1963) the main issues were:
Getting enough water
Recruiting and training local workers. At that stage, the Mauritanian population was mainly nomadic and unfamiliar with an “industrial” culture
Preparing for the location of some 2,000 European expatriates in the desert.
B.1.1 Mining Operations, Phase I (1963–1974): MIFERMA, a French Company in the Sahara
Iron ore production started in 1963 and the figures for production and export are given in the table below:
Table 6.6: Iron Ore Production and Export 1963 to 1973
(thousand tons) 1963 1964 1965 1966 1967 1968 1969 1970 1971 1972 1973Production (Zouerate) 1,702 5,080 6,279 7,332 7,158 7,977 8,510 9,098 8,413 9,301 10,204Export (Nouadhibou) 1,292 4,983 5,965 7,157 7,448 7,703 8,576 9,220 8,601 7,953 10,331
Source: “La Montagne de Fer”, Pierre Bonte – Editions Karthalia, 2001
At that stage, iron ore exports represented on average 75% of all Mauritanian exports.
MIFERMA made its first profit in 1965 and has remained profitable since then. During the period from 1963 to 1973, the organizational structure used was the same as that used on French mining sites—The mine being the only employer and, therefore, the only source of income. This reliance on the mine is particularly potent in Zouerate, whereas Nouadhibou has developed other income sources (the fishery industry in particular) using the infrastructure developed by the mining company—port, power plant, and water source.
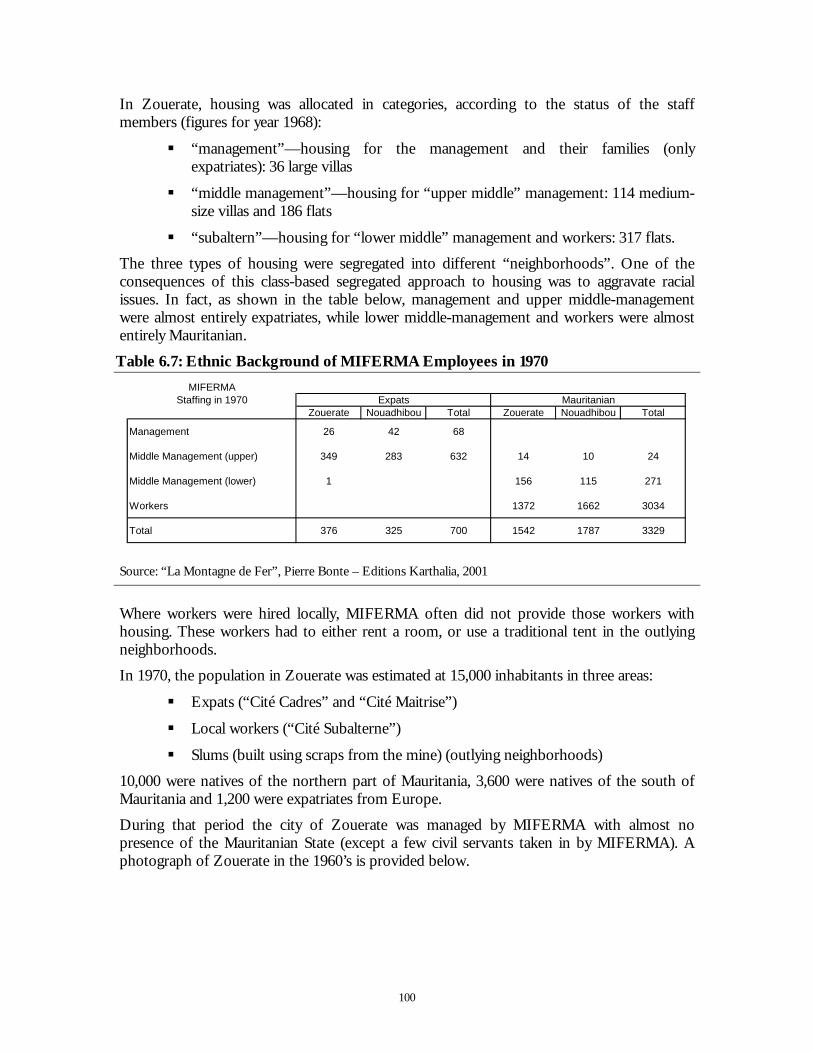
100
In Zouerate, housing was allocated in categories, according to the status of the staff members (figures for year 1968):
“management”—housing for the management and their families (only expatriates): 36 large villas
“middle management”—housing for “upper middle” management: 114 medium-size villas and 186 flats
“subaltern”—housing for “lower middle” management and workers: 317 flats.
The three types of housing were segregated into different “neighborhoods”. One of the consequences of this class-based segregated approach to housing was to aggravate racial issues. In fact, as shown in the table below, management and upper middle-management were almost entirely expatriates, while lower middle-management and workers were almost entirely Mauritanian.
Table 6.7: Ethnic Background of MIFERMA Employees in 1970
MIFERMAStaffing in 1970
Zouerate Nouadhibou Total Zouerate Nouadhibou Total
Management 26 42 68
Middle Management (upper) 349 283 632 14 10 24
Middle Management (lower) 1 156 115 271
Workers 1372 1662 3034
Total 376 325 700 1542 1787 3329
Expats Mauritanian
Source: “La Montagne de Fer”, Pierre Bonte – Editions Karthalia, 2001
Where workers were hired locally, MIFERMA often did not provide those workers with housing. These workers had to either rent a room, or use a traditional tent in the outlying neighborhoods.
In 1970, the population in Zouerate was estimated at 15,000 inhabitants in three areas:
Expats (“Cité Cadres” and “Cité Maitrise”)
Local workers (“Cité Subalterne”)
Slums (built using scraps from the mine) (outlying neighborhoods)
10,000 were natives of the northern part of Mauritania, 3,600 were natives of the south of Mauritania and 1,200 were expatriates from Europe.
During that period the city of Zouerate was managed by MIFERMA with almost no presence of the Mauritanian State (except a few civil servants taken in by MIFERMA). A photograph of Zouerate in the 1960’s is provided below.
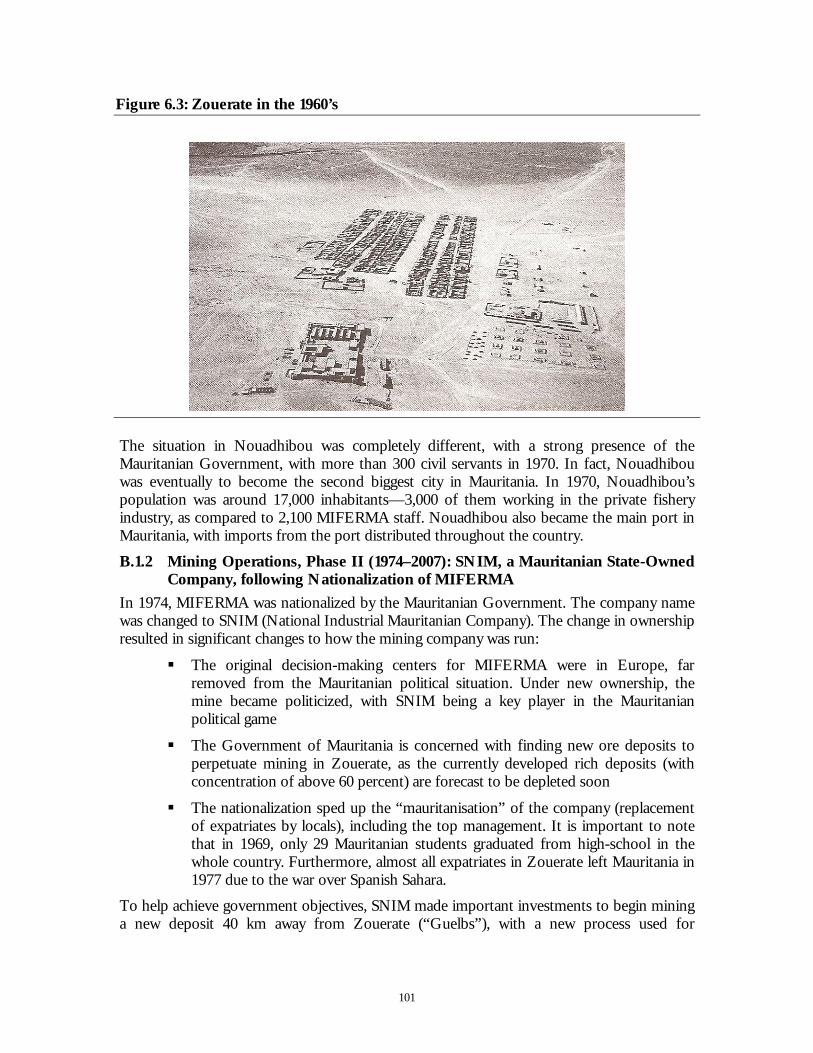
101
Figure 6.3: Zouerate in the 1960’s
The situation in Nouadhibou was completely different, with a strong presence of the Mauritanian Government, with more than 300 civil servants in 1970. In fact, Nouadhibou was eventually to become the second biggest city in Mauritania. In 1970, Nouadhibou’s population was around 17,000 inhabitants—3,000 of them working in the private fishery industry, as compared to 2,100 MIFERMA staff. Nouadhibou also became the main port in Mauritania, with imports from the port distributed throughout the country.
B.1.2 Mining Operations, Phase II (1974–2007): SNIM, a Mauritanian State-Owned Company, following Nationalization of MIFERMA
In 1974, MIFERMA was nationalized by the Mauritanian Government. The company name was changed to SNIM (National Industrial Mauritanian Company). The change in ownership resulted in significant changes to how the mining company was run:
The original decision-making centers for MIFERMA were in Europe, far removed from the Mauritanian political situation. Under new ownership, the mine became politicized, with SNIM being a key player in the Mauritanian political game
The Government of Mauritania is concerned with finding new ore deposits to perpetuate mining in Zouerate, as the currently developed rich deposits (with concentration of above 60 percent) are forecast to be depleted soon
The nationalization sped up the “mauritanisation” of the company (replacement of expatriates by locals), including the top management. It is important to note that in 1969, only 29 Mauritanian students graduated from high-school in the whole country. Furthermore, almost all expatriates in Zouerate left Mauritania in 1977 due to the war over Spanish Sahara.
To help achieve government objectives, SNIM made important investments to begin mining a new deposit 40 km away from Zouerate (“Guelbs”), with a new process used for
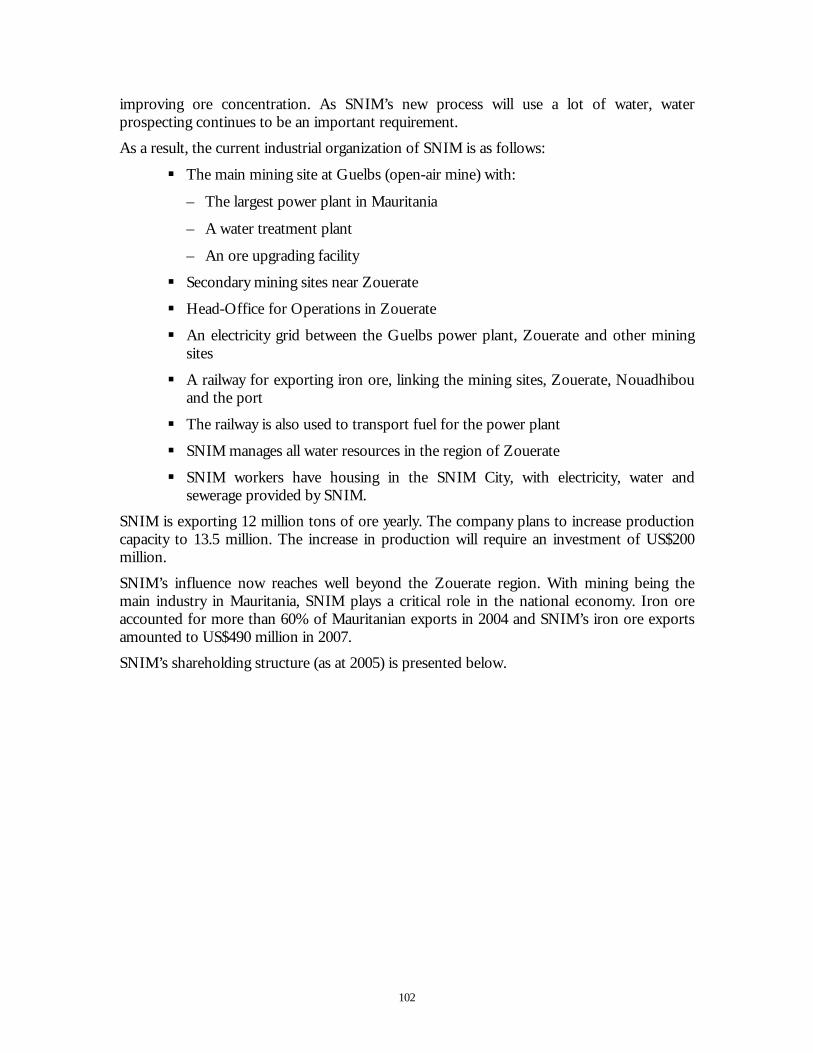
102
improving ore concentration. As SNIM’s new process will use a lot of water, water prospecting continues to be an important requirement.
As a result, the current industrial organization of SNIM is as follows:
The main mining site at Guelbs (open-air mine) with:
– The largest power plant in Mauritania
– A water treatment plant
– An ore upgrading facility
Secondary mining sites near Zouerate
Head-Office for Operations in Zouerate
An electricity grid between the Guelbs power plant, Zouerate and other mining sites
A railway for exporting iron ore, linking the mining sites, Zouerate, Nouadhibou and the port
The railway is also used to transport fuel for the power plant
SNIM manages all water resources in the region of Zouerate
SNIM workers have housing in the SNIM City, with electricity, water and sewerage provided by SNIM.
SNIM is exporting 12 million tons of ore yearly. The company plans to increase production capacity to 13.5 million. The increase in production will require an investment of US$200 million.
SNIM’s influence now reaches well beyond the Zouerate region. With mining being the main industry in Mauritania, SNIM plays a critical role in the national economy. Iron ore accounted for more than 60% of Mauritanian exports in 2004 and SNIM’s iron ore exports amounted to US$490 million in 2007.
SNIM’s shareholding structure (as at 2005) is presented below.
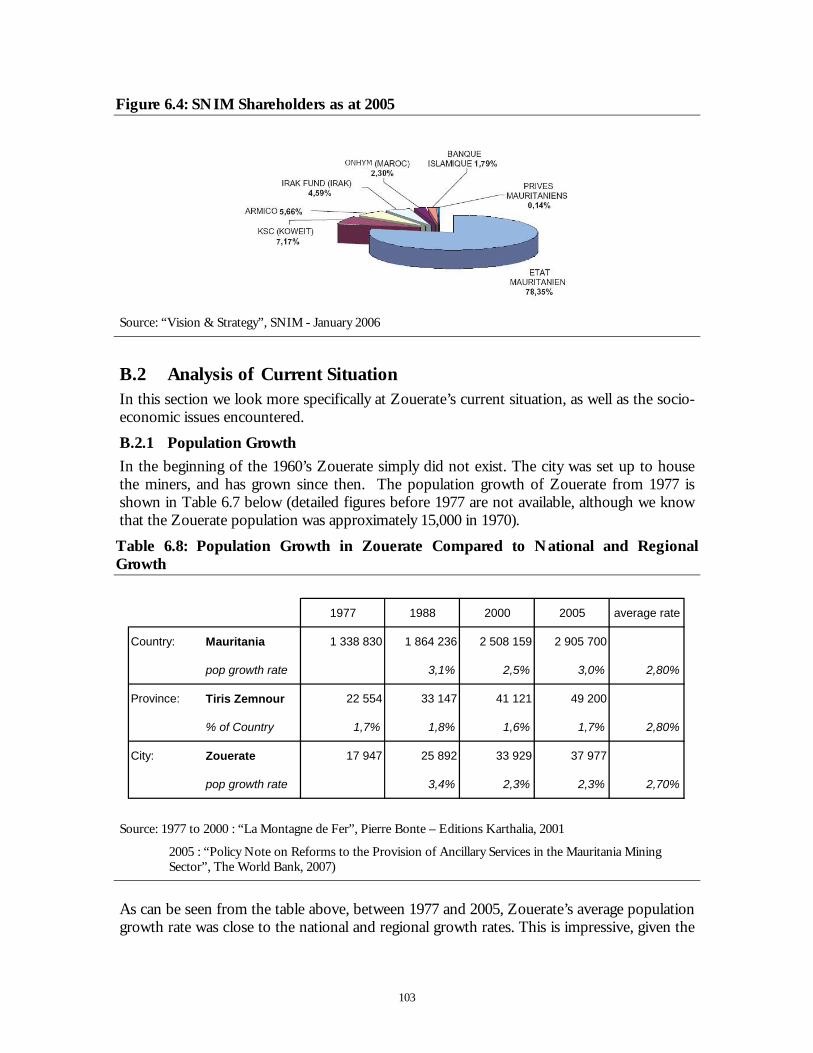
103
Figure 6.4: SNIM Shareholders as at 2005
Source: “Vision & Strategy”, SNIM - January 2006
B.2 Analysis of Current Situation In this section we look more specifically at Zouerate’s current situation, as well as the socio-economic issues encountered.
B.2.1 Population Growth
In the beginning of the 1960’s Zouerate simply did not exist. The city was set up to house the miners, and has grown since then. The population growth of Zouerate from 1977 is shown in Table 6.7 below (detailed figures before 1977 are not available, although we know that the Zouerate population was approximately 15,000 in 1970).
Table 6.8: Population Growth in Zouerate Compared to National and Regional Growth
1977 1988 2000 2005 average rate
Country: Mauritania 1 338 830 1 864 236 2 508 159 2 905 700
pop growth rate 3,1% 2,5% 3,0% 2,80%
Province: Tiris Zemnour 22 554 33 147 41 121 49 200
% of Country 1,7% 1,8% 1,6% 1,7% 2,80%
City: Zouerate 17 947 25 892 33 929 37 977
pop growth rate 3,4% 2,3% 2,3% 2,70%
Source: 1977 to 2000 : “La Montagne de Fer”, Pierre Bonte – Editions Karthalia, 2001
2005 : “Policy Note on Reforms to the Provision of Ancillary Services in the Mauritania Mining Sector”, The World Bank, 2007)
As can be seen from the table above, between 1977 and 2005, Zouerate’s average population growth rate was close to the national and regional growth rates. This is impressive, given the
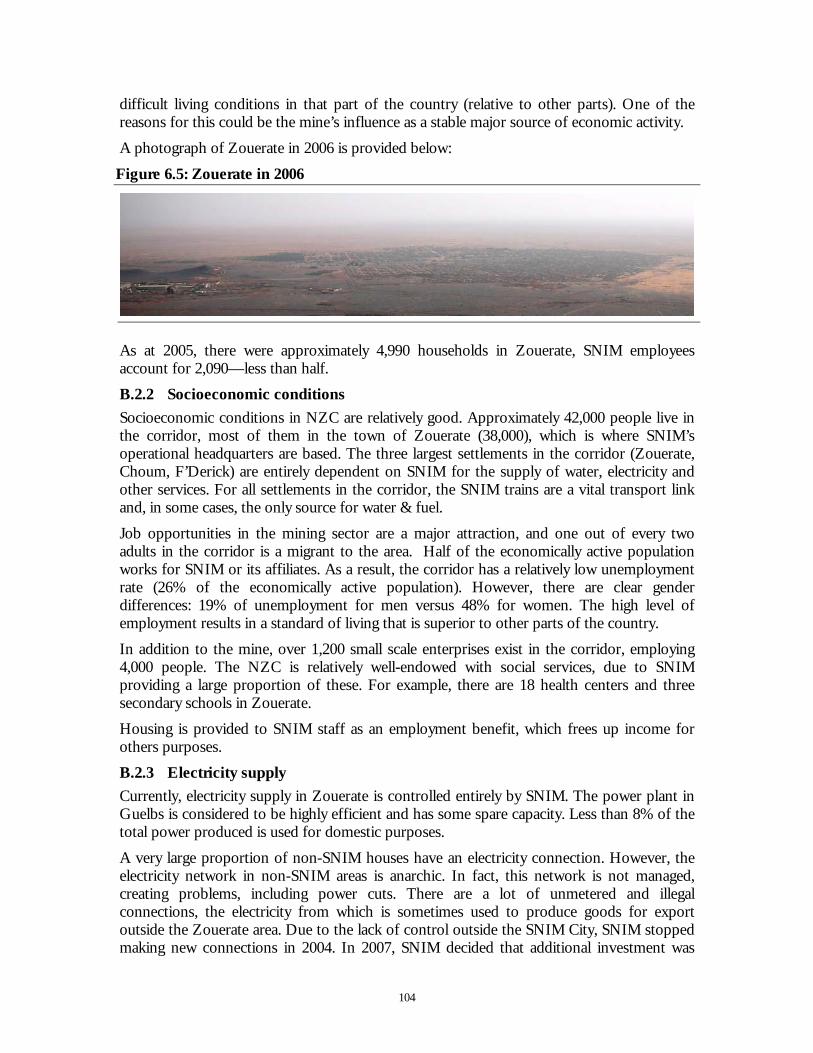
104
difficult living conditions in that part of the country (relative to other parts). One of the reasons for this could be the mine’s influence as a stable major source of economic activity.
A photograph of Zouerate in 2006 is provided below:
Figure 6.5: Zouerate in 2006
As at 2005, there were approximately 4,990 households in Zouerate, SNIM employees account for 2,090—less than half.
B.2.2 Socioeconomic conditions
Socioeconomic conditions in NZC are relatively good. Approximately 42,000 people live in the corridor, most of them in the town of Zouerate (38,000), which is where SNIM’s operational headquarters are based. The three largest settlements in the corridor (Zouerate, Choum, F’Derick) are entirely dependent on SNIM for the supply of water, electricity and other services. For all settlements in the corridor, the SNIM trains are a vital transport link and, in some cases, the only source for water & fuel.
Job opportunities in the mining sector are a major attraction, and one out of every two adults in the corridor is a migrant to the area. Half of the economically active population works for SNIM or its affiliates. As a result, the corridor has a relatively low unemployment rate (26% of the economically active population). However, there are clear gender differences: 19% of unemployment for men versus 48% for women. The high level of employment results in a standard of living that is superior to other parts of the country.
In addition to the mine, over 1,200 small scale enterprises exist in the corridor, employing 4,000 people. The NZC is relatively well-endowed with social services, due to SNIM providing a large proportion of these. For example, there are 18 health centers and three secondary schools in Zouerate.
Housing is provided to SNIM staff as an employment benefit, which frees up income for others purposes.
B.2.3 Electricity supply
Currently, electricity supply in Zouerate is controlled entirely by SNIM. The power plant in Guelbs is considered to be highly efficient and has some spare capacity. Less than 8% of the total power produced is used for domestic purposes.
A very large proportion of non-SNIM houses have an electricity connection. However, the electricity network in non-SNIM areas is anarchic. In fact, this network is not managed, creating problems, including power cuts. There are a lot of unmetered and illegal connections, the electricity from which is sometimes used to produce goods for export outside the Zouerate area. Due to the lack of control outside the SNIM City, SNIM stopped making new connections in 2004. In 2007, SNIM decided that additional investment was
105
required to reshape the network outside the SNIM city. As of 2006, SNIM charges non-SNIM costumers an electricity tariff that is one third lower that the national tariff and is looking into the possibility of using pre-paid meters.
Residents of households without a connection (for instance new houses) feel disadvantaged and frustrated by not being able to get any electricity, other than by means of paying for an illegal connection. In contrast, supply to SNIM households, within the SNIM city, is well-planned and secure and, more importantly, free of charge.
Since power is free for SNIM households, there is an exceptionally high level of electrification (80 percent of households), with 62 percent of households owning a television and 52 percent a refrigerator.
B.2.4 Water supply
SNIM controls water supply in Zouerate, drawing water from non-renewable aquifers, most of which provide salty water. The water reserves are estimated to be sufficient only for 10 more years. Given water’s strategic importance, SNIM is prospecting new aquifers, even though this conflicts with the Mauritanian legal framework for water (Code de l’Eau), which allocates the role of water prospecting to CNRE—the National Agency for Water Resources.
To optimize the use of water resources, SNIM mixes salty and fresh water for domestic use, diminishing water quality.
The SNIM city is the only part of Zouerate with a piped water network. Water supply is usually for an hour at a time, at three different times during the day. The supply is free. The existing network requires some repairs, as it is suffering from a number of visible leaks.
Outside of the SNIM City there is no piped water network. Water is supplied freely by SNIM at watering points, as well as being distributed by tankers—directly to some houses and also to 32 communal cisterns. Water is also sold at high prices – more than 10 times the production cost. There are also some illegal connections from the SNIM water network to private households, which likely account for 20 to 30 percent of domestic water production.
Customers complain that the Municipality is doing a poor job of maintaining the communal cisterns and managing distribution by tankers. Private vendors exploit the situation by charging exorbitant prices, especially in summer when demand is at its peak. Most non-SNIM inhabitants cannot afford to drive out of town to collect fresh water from a well.
B.2.5 Sewerage
There is a wastewater network for the 2,090 households in the SNIM City. The wastewater is released without any treatment to irrigate an area where palms, vegetables and mint are grown.
B.2.6 Agriculture
There are two main palm groves in Zouerate. Palm groves in a desert city are important because the groves create some income from farming (mint, dates, and fresh vegetables), as well giving a better appearance to the city.
One of the palm groves uses the wastewater from the SNIM City. This creates a health issues, as wastewater is used without any treatment.
106
The second palm grove uses illegal connections to the water network and is irrigated with fresh water in an area where fresh water is very scarce. SNIM attempted to cut off supply, but was met with demonstrations by the people using the palm grove and the status quo remained.
Although understandably important to the “gardeners”, production at the palm grove (even with free irrigation) is only marginally profitable.
B.2.7 Transportation
The railway is the main transport route in the region. The train is used to export iron ore, and to import all goods required to support mining operations. The train is also used to export locally-made products. Most consumer goods are also brought in by train, as trucking is not an easy option. Roads (other than those on the mining site) are not asphalted. This means that a trip by car to any large Mauritanian town would be along at least 350 km of dusty or sandy trail.
There is a regional airport in Zouerate. For political reasons it was decided that only the national carrier would be authorized to fly to Zouerate from Nouakchott or Nouadhibou. A disagreement over the cost of tickets between that company and SNIM lead to all commercial air routes to/from Zouerate being cancelled.
B.2.8 Non-SNIM Economic Activities
There are a number of economic activities that take place in Zouerate that SNIM is not involved in directly. We discuss these activities below.
SNIM subcontracting (workforce, goods)
While technically not part of SNIM’s operations, unskilled subcontractors are totally dependent on SNIM for their income. The subcontractors have no other option than to contract with SNIM. However, the presence of such subcontractors is an important driver for population growth, as it is easier to get a day-to-day job with a subcontractor, than to get a permanent job with SNIM.
Production using mining by-products or waste
Although Zouerate is a city in the middle of a desert and is 650 km from the nearest shoreline, it is also a key producer of boat anchors.
The reasons for this are:
A lot of steel waste is generated from used mine tools and equipment
With an illegal electricity connection, the power required for welding is almost free of charge
There is a huge market for boat parts in Nouadhibou, the main fishing port in Mauritania
The railway makes it easy and inexpensive to transport products between Zouerate and Nouadhibou
Given the above, the production of anchors is dependent on SNIM’s goodwill, as all the main inputs along the value chain (raw material, electricity, transport) are provided by SNIM at little or no charge. The photo below shows anchors produced in Zouerate.
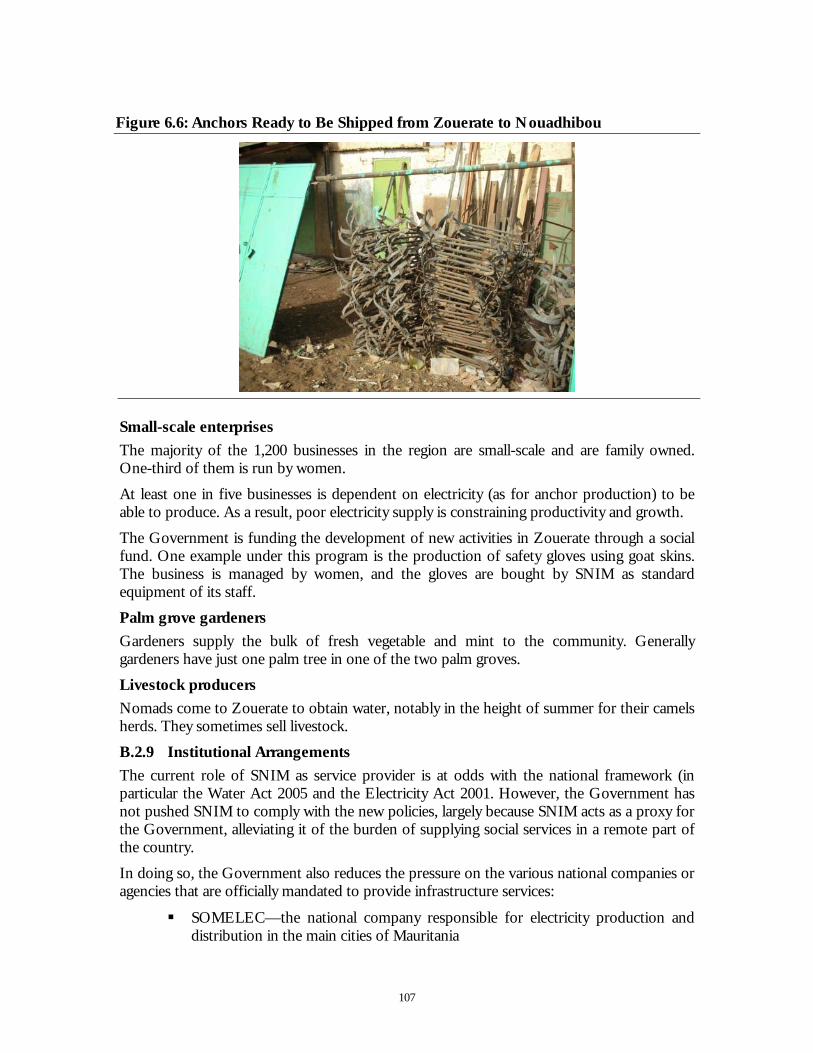
107
Figure 6.6: Anchors Ready to Be Shipped from Zouerate to Nouadhibou
Small-scale enterprises
The majority of the 1,200 businesses in the region are small-scale and are family owned. One-third of them is run by women.
At least one in five businesses is dependent on electricity (as for anchor production) to be able to produce. As a result, poor electricity supply is constraining productivity and growth.
The Government is funding the development of new activities in Zouerate through a social fund. One example under this program is the production of safety gloves using goat skins. The business is managed by women, and the gloves are bought by SNIM as standard equipment of its staff.
Palm grove gardeners
Gardeners supply the bulk of fresh vegetable and mint to the community. Generally gardeners have just one palm tree in one of the two palm groves.
Livestock producers
Nomads come to Zouerate to obtain water, notably in the height of summer for their camels herds. They sometimes sell livestock.
B.2.9 Institutional Arrangements
The current role of SNIM as service provider is at odds with the national framework (in particular the Water Act 2005 and the Electricity Act 2001. However, the Government has not pushed SNIM to comply with the new policies, largely because SNIM acts as a proxy for the Government, alleviating it of the burden of supplying social services in a remote part of the country.
In doing so, the Government also reduces the pressure on the various national companies or agencies that are officially mandated to provide infrastructure services:
SOMELEC—the national company responsible for electricity production and distribution in the main cities of Mauritania
108
SNDE—is the national company responsible for producing and distributing potable water in the main cities of Mauritania
ANEPA—the national agency responsible for developing rural and semi-rural water distribution
ADER—the national agency responsible for promoting solar systems and small thermal systems for electricity generation in rural and semi-rural areas.
The Municipality of Zouerate is in charge of water distribution outside the SNIM City, mainly through 32 communal cisterns. It is also in charge of waste management. Due to the lack of budget and weak political will, the Municipality is not an efficient actor in providing services. However since the last election at the end of 2006, the situation appears to be changing, with the Municipality showing more support for reforms.
Given the critical role that SNIM plays in the corridor and its contribution to Government revenue and Mauritania’s GDP, SNIM is clearly in a powerful position. The success of any reform will depend, to a large extent, on SNIM’s support and cooperation.
B.2.10 Socioeconomic Issues
The growing inequality in service provision (between the mining and non-mining population) appears to be the main factor motivating the Government to change the status quo.
As the non-mining population has grown, so has the gap in the quality of service, with non-SNIM households being in a far worse position than the SNIM ones.
Such disparities are becoming less acceptable to the population and increasingly people are calling for an approach to service delivery that brings more equitable results. The key disparities that need to be addressed are:
No possibility of a legal water connection for non-SNIM households
Difficulty in getting a legal electricity connection, which is at SNIM’s sole discretion
The perception by the non-mining population that SNIM households waste the water and electricity they get for free.
With a growing non-mining population being attracted to Zouerate, SNIM’s ability to meet the demand for services in an efficient and equitable manner is being questioned.
B.3 Ongoing Reform of Infrastructure and Social Services Provision In this section we discuss the reform initiatives that have been or are being undertaken to help resolve the issues around infrastructure and social services.
B.3.1 Purpose of the Reforms
It is becoming increasingly clear that the provision of services by SNIM is not sustainable in the long term. SNIM is a mining company, and its involvement in water and electricity utilities is not supported by national policies or legislation.
While SNIM has demonstrated good corporate social responsibility in providing water and electricity to non-SNIM households, this is not part of SNIM’s core business. Furthermore,
109
SNIM does not have the necessary expertise to manage a large scale utility operation with a large number of customers.
The current situation is also a drag on SNIM’s corporate resources, as it diverts finances and effort to supplying essential services to the growing non-SNIM population. Extending and improving the services would require investments that SNIM is not willing to undertake.
B.3.2 Stakeholder Views
All stakeholders, except for residents of SNIM households, recognize the need of the reform:
SNIM management has long wanted to hand-over the management of the non-SNIM part of Zouerate. Therefore, SNIM’s position is rather complex:
– SNIM supports many aspects of the reform (such as a third-party taking over electricity distribution to non-SNIM neighborhoods)
– But SNIM has strong reservations about the ability of the national utilities to provide satisfactory service in Zouerate, far away from any main centers.
– SNIM will also not be willing to hand over either power production or water management to a third party, as both are vital to the mining process
Residents of SNIM households have a negative view of the reform. They do not expect any good outcomes, and are opposed to any change in the status quo, which brings them a good quality of life almost free of charge
Residents of non-SNIM households expect a lot from the reform. They are in favor of any reform that will improve their current situation. The simplest quote from the representatives of this group is “We are thirsty!”
The Municipality’s position changed substantively after the first municipal election. In the past, the Mayor was nominated by the Government and was not in favor of reform—it was easier for him if SNIM was in charge of providing essential services. Following the elections, which brought a complete change of the municipal team, the new Mayor now has a strong interest in improving services for the entire population—from both SNIM and non-SNIM households. As a result, the Mayor is a strong supporter of reform, to the extent that it improves services to the population.
The Government is in favor of the reform, as the Government would like to see greater equity in service provision. The Government has helped promote dialogue between all stakeholders. Unfortunately there is currently no real “champion” at the Government level to promote the reform. Many ministerial departments are adopting a “wait and see” approach, expressing a neutral view on the reform, provided it does not cause disruption to the mining process.
SOMELEC (the national electricity utility) supports the reform. SOMELEC’s main interest is to take over the Guelbs power plant. Although SNIM has made it clear that they would never allow this. SOMELEC is much less interested in taking over electricity distribution to non-SNIM neighborhoods, but it will obey a Government directive to do so. Zouerate is one of the cities specifically mentioned in SOMELEC’s work program.
110
SNDE (the national water utility) is keen to be involved in Zouerate, as the town is part of SNDE’s mandate. However, SNDE is currently in financial distress, and Zouerate is 400 km away from any of SNDE’s operational bases. This makes SNDE’s involvement difficult.
B.3.3 Willingness to Pay for Water and Electricity
An analysis of the willingness to pay shows different attitudes between SNIM city and non-SNIM neighborhoods.
Inside the SNIM City, willingness to pay is very low and it is clear that any attempt to impose payment for electricity or water is likely to result in strong opposition. SNIM households are strongly in favor of their current system of quotas and see no reason to alter it.
Outside the SNIM City there is a strong appreciation that improvements in water and electricity supply can only be made if water and electricity are paid for. Most households are ready to pay the national water tariff if they can get a connection. Those without an electricity connection are very keen to connect and happy to pay ongoing charges, but will have a low level of consumption and are reluctant to pay connection fees.
B.3.4 Economic Analysis
An economic analysis undertaken by the World Bank in 200753 recommended that a third party operator be given a mandate to distribute both electricity and water in Zouerate from bulk supplies provided by SNIM. The main idea was to gain efficiencies (for example by using a sole customer management system for both water and electricity) and to potentially offset losses in water distribution through gains in electricity distribution.
The economic analysis also showed that viability could only be achieved if the operator was in charge of both SNIM and non-SNIM neighborhoods. Without the upper-income customers of SNIM City, operations would never be viable.
The analysis also showed also that the profitability of the operator would be very sensitive to the wholesale prices SNIM would charge. This was especially important for electricity, as the price would be dependent on external factors, such as petroleum prices.
B.3.5 Preferred Option
An option that has been greeted with enthusiasm by some stakeholders is for a new independent operator to be created that would initially be majority owned by SNIM, with SNIM’s shareholding declining over time as the operator gains experience. SOMELEC and SNDE would also take shareholdings, in order to fulfill their national mandates and monitor the situation in Zouerate. The two utilities could also provide technical advices to the new operator.
SNIM would act as an Independent Power Producer (IPP) on a “cost plus” basis for electricity, and would also provide raw water for free in quantities compatible with available resources and industrial needs.
This option was validated by the reform steering committee in 2007. However, it is yet to be implemented. 53 The World Bank, “Mauritania – Policy Note on the Reforms to the Provision of Ancillary Services in the Mauritania
Mining Sector”, 2007.
111
B.3.6 The Current Status of the Reform
The political agenda in Mauritania was quite volatile during the last several years, with Government changes in 2006, 2007 and 2008. The Steering Committee for the Zouerate reforms has not met since 2007. As a result, there has been no real “champion” at Government level to push through the reform.
For now SNIM remains “a state within the state” and still provides water and electricity services in Zouerate. SNIM has also decided to set aside an investment budget for improving the electricity network in non-SNIM neighborhoods.
B.4 Lessons Learnt The key points to take away from the Zouerate case are:
Regardless of the living conditions, stable industrial and economic activity (such as mining) in a developing country will attract an influx of people well in excess of those staffing the main industrial production process. This occurs even in the middle of a desert with no existing settlements and no reliable water source
The mining operator may provide services to the non-mining population out of good will. While at the beginning of the mining operations, providing services to non-miners may be inexpensive, over time service provision becomes a big burden, as the non-mining population increases
Given the standard approach to service provision (mining company is primarily responsible for looking after its own staff), inequality is likely to emerge, with the mining population receiving a much better level of services and the non-mining population potentially receiving an unacceptable level of service. The inequality will create tension
At some point, the non-mining population (people not directly employed by the mining company) will likely outgrow the mining population, making inequality unsustainable
Local Authorities have a key role to play in service provision. This requires the Authorities to be well resourced and representative of the population. It is difficult for Authorities to take a leading role if, at the outset, the mining operator is set up as “a state within a state”, with no thought spared to the influx population
Ideally, the settlement of the influx population should be planned and organized in order to minimize the costs of providing network service, and to optimize land use
Over time, it will become unsustainable for the mining company to provide utility services to a large population. This resolution of this problem should be planned well in advance
The mining company will always remain an important stakeholder in utility service provision, both as a major customer and potentially as the main bulk provider
Where a transition is required from service provision by the mining company to another model, the reform process requires a strong “champion” in order to keep up the momentum of the reform process.
112
B.5 Bibliography “Mauritania – Policy Note on the Reforms to the Provision of Ancillary Services in the Mauritania Mining Sector”, The World Bank, 2007
“Analyse des Impacts sur la Pauvreté et le Social du Transfert des Services Auxiliaires de la SNIM à un Fournisseur Privé ou Public en Mauritanie – Volet économique”, Jean-Loup Jourdain, 2006
“Vision & Stratégie de la SNIM”, SNIM, 2005
“Assistance Technique pour l’Etude de la Situation Actuelle des Services fournis aux Communautés par la SNIM et Alternatives de Gestion, Rapport II « Diagnostic » ”, PRISM54, 2003
“Assistance Technique pour l’Etude de la Situation Actuelle des Services fournis aux Communautés par la SNIM et Alternatives de Gestion, Rapport III « Identification d’options alternatives de gestion et Plan d’action pour l’étude de faisabilité » ”, PRISM, 2003
“Etude de l’extension du réseau électrique alimentant les quartiers périphériques de la ville de Zouerate”, SNIM, 2003
“La Montagne de Fer”, Pierre Bonte – Editions Karthalia, 2001
54 PRISM is a section of the Ministry of Oil & Mines of the Government of Mauritania, in charge of mining projects
financed by the World Bank
113
Appendix C: User’s Guide for Castalia Infrastructure Costing Model
Castalia developed a simple spreadsheet model to estimate the infrastructure needs and costs of towns in South Gobi. We asked a Mongolian construction firm, The Megawatt Group, to provide estimates of infrastructure needed, and the cost of that infrastructure to serve a hypothetical city of 35,000 people in South Gobi. The model adjusts The Megawatt Group’s original estimates for towns with:
Populations of different sizes, and
Different proportions of families living in gers and modern apartment buildings.
The model calculates the number of pieces of equipment needed, the total capacity and the cost of that equipment. Labor costs are included in equipment costs. The sectors covered by the model include: buildings (public and private), water, wastewater, electricity, heating, and roads.
In the electricity and heating sectors, we have considered multiple options for providing service:
In the electricity sector, we considered:
– Option A: Power supplied via a connection to a high voltage transmission grid (for example, an extension of the new line planned from Mandal Gobi to Tavan Tolgoi)
– Option B: A 3MW coal-fired combined heat and power (CHP) plant
– Option C: A 3MW diesel generating unit.
In the heating sector, we considered:
– Option A: A 300 Gcal CHP Plant (the heating component of Option B for electricity generation)
– Option B: Individual hot water boilers in each building.
The remainder of this appendix describes how to use the Castalia model to determine the cost of providing infrastructure to populations in South Gobi. In this appendix we will describe:
The components of the model and how they work
How to change input assumptions.
C.1 Components of the Model The model’s worksheets can be grouped into the following categories:
Summaries
Costs by Sector
Tariff Implications
Multipliers
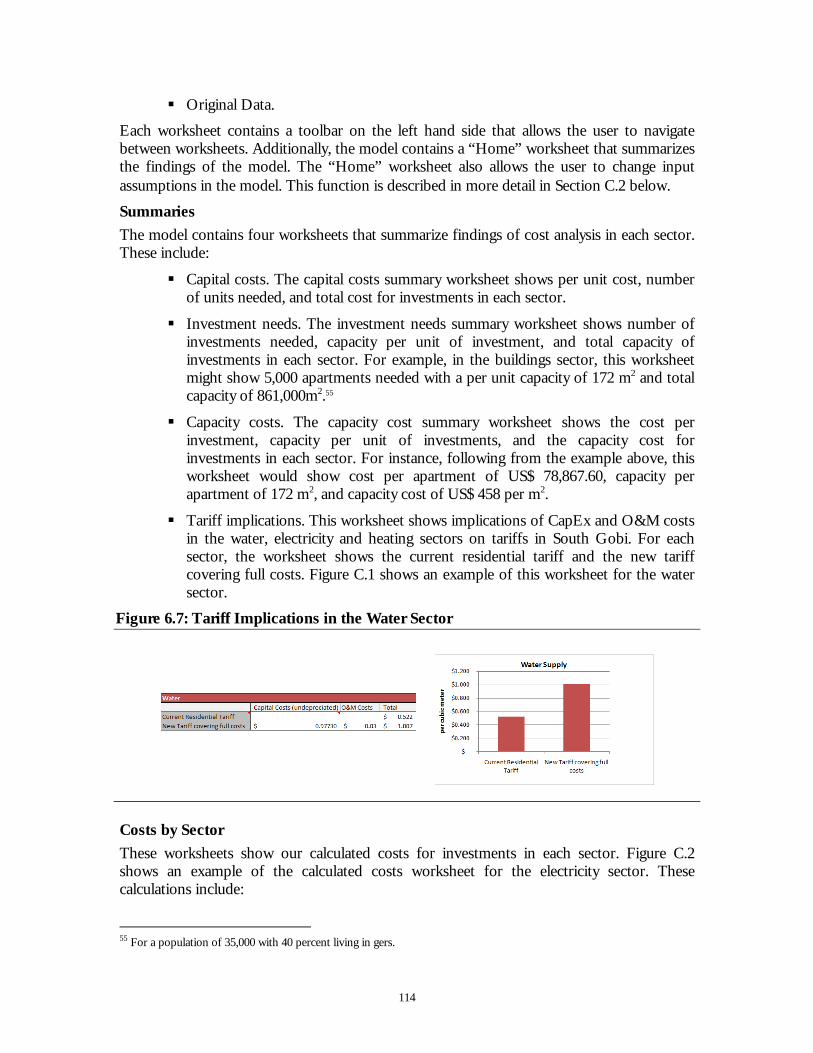
114
Original Data.
Each worksheet contains a toolbar on the left hand side that allows the user to navigate between worksheets. Additionally, the model contains a “Home” worksheet that summarizes the findings of the model. The “Home” worksheet also allows the user to change input assumptions in the model. This function is described in more detail in Section C.2 below.
Summaries
The model contains four worksheets that summarize findings of cost analysis in each sector. These include:
Capital costs. The capital costs summary worksheet shows per unit cost, number of units needed, and total cost for investments in each sector.
Investment needs. The investment needs summary worksheet shows number of investments needed, capacity per unit of investment, and total capacity of investments in each sector. For example, in the buildings sector, this worksheet might show 5,000 apartments needed with a per unit capacity of 172 m2 and total capacity of 861,000m2.55
Capacity costs. The capacity cost summary worksheet shows the cost per investment, capacity per unit of investments, and the capacity cost for investments in each sector. For instance, following from the example above, this worksheet would show cost per apartment of US$ 78,867.60, capacity per apartment of 172 m2, and capacity cost of US$ 458 per m2.
Tariff implications. This worksheet shows implications of CapEx and O&M costs in the water, electricity and heating sectors on tariffs in South Gobi. For each sector, the worksheet shows the current residential tariff and the new tariff covering full costs. Figure C.1 shows an example of this worksheet for the water sector.
Figure 6.7: Tariff Implications in the Water Sector
Costs by Sector
These worksheets show our calculated costs for investments in each sector. Figure C.2 shows an example of the calculated costs worksheet for the electricity sector. These calculations include:
55 For a population of 35,000 with 40 percent living in gers.
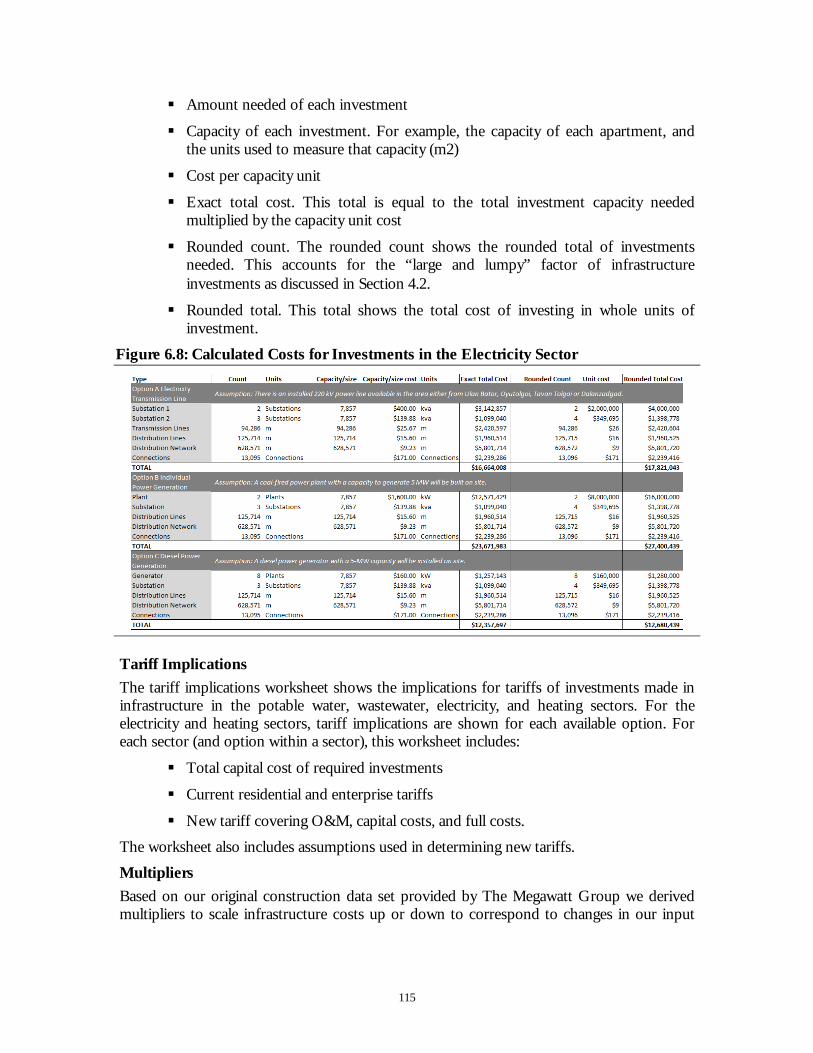
115
Amount needed of each investment
Capacity of each investment. For example, the capacity of each apartment, and the units used to measure that capacity (m2)
Cost per capacity unit
Exact total cost. This total is equal to the total investment capacity needed multiplied by the capacity unit cost
Rounded count. The rounded count shows the rounded total of investments needed. This accounts for the “large and lumpy” factor of infrastructure investments as discussed in Section 4.2.
Rounded total. This total shows the total cost of investing in whole units of investment.
Figure 6.8: Calculated Costs for Investments in the Electricity Sector
Tariff Implications
The tariff implications worksheet shows the implications for tariffs of investments made in infrastructure in the potable water, wastewater, electricity, and heating sectors. For the electricity and heating sectors, tariff implications are shown for each available option. For each sector (and option within a sector), this worksheet includes:
Total capital cost of required investments
Current residential and enterprise tariffs
New tariff covering O&M, capital costs, and full costs.
The worksheet also includes assumptions used in determining new tariffs.
Multipliers
Based on our original construction data set provided by The Megawatt Group we derived multipliers to scale infrastructure costs up or down to correspond to changes in our input
116
assumptions. The “Multipliers” worksheet shows our assumptions and multipliers for physical infrastructure needs and costs.
Original Data
As noted in the introduction to this section, we asked The Megawatt Group to provide estimates of infrastructure needed, and the cost of that infrastructure to serve a hypothetical city of 35,000 people in South Gobi. The data provided by The Megawatt Group for the building, water, wastewater, electricity, heating, and roads sectors are shown the “Original Data” worksheets. Additionally, our original data and source information for tariffs is included under this category.
C.2 How to Change Input Assumptions The model’s input assumptions are in red on the “Home” worksheet to indicate where the user can make changes in basic assumptions to drive changes in the rest of the model. As noted in the introduction to this appendix, the two basic assumptions that drive cost analysis in this model include:
Total population, and
Different proportions of families living in gers and modern apartment buildings.
Additionally, we have considered three options for supplying electricity and two corresponding options for supplying heat, which drive cost analysis for the electricity and heating sectors.
Figure C.3 shows the area on the “Home” worksheet where the user may make changes to basic input assumptions. To change these three input assumptions, follow the steps below:
Step 1. Choose an “Input Option” from the drop-down box on the worksheet entitled “Home”. You may either choose “Select Scenario” or “Customize”.
Note: You MUST choose your input option first in order to activate the desired option.
Step 2a. If you choose “Select Scenario”, you must choose from two drop-down boxes under the heading “Population Scenarios”. The first drop-down box allows you to choose the percent of population living in gers, ranging from 30 percent to 70 percent. The second drop-down box allows you to choose the total population, ranging from 15,000 to 85,000.
Step 2b. If you choose “Customize”, you must input your own assumption values for percentage living in gers and total population under the heading “Custom Input”.
Step 3. You may choose between electricity and heating options by selecting from the drop-down box next to “Electricity Option”. Heating options correspond to the desired electricity options and, therefore, do not require self selection.

117
Figure 6.9: How to Make Changes to Input Assumptions
T: +1 (202) 466-6790 F: +1 (202) 466-6797 1700 K Street NW Suite 450 WASHINGTON DC 20006 United States of America T: +61 (2) 9231 6862 F: +61 (2) 9231 3847 Level 10, 1 Castlereagh Street
SYDNEY NSW 2000 Australia T: +64 (4) 913 2800 F: +64 (4) 913 2808 Level 2, 88 The Terrace PO Box 10-225 WELLINGTON 6143 New Zealand T: +33 (1) 45 27 24 55 F: +33 (1) 45 20 17 69 7 Rue Claude Chahu PARIS 75116 France ------------- www.castalia.fr