Embed Size (px)
Citation preview
URBAN TRANSPORT
Journal
Volume 12 No. 1 August 2013
Volume 12 No. 1 August 2013
Impact of Proposed River Bridge on Level of Service of Existing Bridge and 1Linked Corridors: A Case Study 0f Surat City
Gaurang Joshi, Dinesh Vagadiya, Sunny Deol G.
Evaluation Of Traffic System Management Measures Using Microscopic Multi Modal Simulation 17
Madhu ERRAMPALLI, Ravinder KAYITHA
A Composite Index To Measure The Perceived Inadequacy Of Public Transportation 28
Krishna N. S. Behara Shriniwas S. Arkatkar, Ashoke K. Sarkar
Analyzing Service Quality: Hubli-Dharwad Intercity Bus Services 36
Ranjeet F J, Srikanth Shastry
Travel Time Reliability Based Traffic Assignment Model For An Urban Road Network 45
Dr. Ch. Ravi Sekhar, Ananya Bijay, N.s.divia
Fuel Subsidy Removal In Nigeria: Its Impacts and The Way Forward 54
Desmond Amiegbebhor
Role Of Informal Bus Operators In The City Of Addis Ababa, Ethiopia 63
Fekadu K.
Sustainable Mobility Based Qualitative Approach To Evaluate Comprhensive 74
Mobility Plan (Cmp) Of Pune
Akshima T Ghate
Executive SecretaryInstitute of Urban Transport (India) 1st Floor, AnandViharMetro Station Building,(Entry Adjacent to Gate No. 1) Delhi 110 092Phones : 011-66578700 –709Telefax : +(91) 11 66578733,E-mail : [email protected] : www.iutindia.org
All communication pertaining to submission of papers for publication in the Journal may be sent by e-mail at the following address :
Views expressed in the papers in this Journal are those of the authors and not necessarily the views of the Institute.
All rights reserved
From the Editor's Desk
The present issue of the journal comprises of eight technical papers reflecting a fine blend of diverse themes such as assessing impact of new transport facility, evaluation of traffic system management measures, public transport service adequacy, service quality of intercity bus services, traffic assignment modelling, impacts of fuel subsidy removal, evaluating Comprehensive Mobility Plan and role of informal bus operators.
The first paper on ‘Impact of Proposed River Bridge on Level of Service of Existing Bridge and Linked Corridors: A Case Study of Surat City’ based on an empirical study provides an overview of changes in traffic pattern in connected corridors due to construction of a Cable Stayed Bridge parallel to existing Sardar Bridge on Tapi River in Surat city.
The second paper on ‘Evaluation of Traffic System Management Measures using Microscopic Multi Modal Simulation’ describes testing of various TSM measures options using traffic simulation model. In this paper Port Blair city road network is considered for testing eight TSM options using VISSIM 5.4 (Microscopic Multi-Modal Simulation) software and evaluated in terms of the travel time, delay and speeds.
The third paper on ‘A Composite Index to Measure the Perceived Inadequacy of Public Transportation’ is based on a study using revealed preference data samples collected in Malviya Nagar residential area of Jaipur City to assess the public perceptions on public and private modes of transportation using four different factors i.e. acceptability, availability, affordability and accessibility.
The fourth paper on ‘Analyzing Service Quality: Hubli-Dharwad Intercity Bus Services’ attempts to analyse the quality of bus services based on an empirical study carried out for inter-city bus services in Hubli-Dharwad based on which appropriate rationalization strategies are evolved.
The fifth paper on ‘Travel Time Reliability based Traffic Assignment Model for an Urban Road Network’ emphasis that Reliability User Equilibrium (RUE) based assignment model are efficient than the User Equilibrium (UE) based model in route choice assignment under uncertain conditions. In this paper RUE model is applied to a small urban road network in Delhi to demonstrate its utility..
The sixth paper on ‘Fuel Subsidy Removal in Nigeria: Its Impacts and the Way Forward’ highlights the controversy surrounding the removal of fuel subsidy in Nigeria considering its positive or negative economic and social implications on the masses and examines the best practices for dealing with petroleum subsidy in other countries particularly in emerging economies.
The seventh paper on ‘Role of Informal Bus Operators in the City of Addis Ababa, Ethiopia’ is based on an empirical study of informal bus operators in the city of Addis Ababa. The paper reports the rise of informality in bus operation in Addis Ababa during on-journey seasons and identifies various factors which have led to the rise of informality in bus services.
The last paper on ‘Sustainable Mobility Based Qualitative Approach to Evaluate Comprehensive Mobility Plan (CMP) of Pune’ evaluates process of CMP preparation along with its contents and the recommendation in the CMP prepared for city of Pune . The paper summarises good practices/ recommendations in the plan and addresses the gaps identified while reviewing the plan.
Dr. Sanjay Gupta
URBAN TRANSPORTJOURNAL
Vol. 12 No. 1, Aug. 2013

Volume 12 No. 1 August 2013
Contents
Impact of Proposed River Bridge on Level of Service of Existing Bridge and 1 Linked Corridors: A Case Study of Surat City
Gaurang Joshi, Dinesh Vagadiya, Sunny Deol G.
Evaluation of Traffic System Management Measures Using Microscopic Multi Modal Simulation 17
Madhu Errampalli, Ravinder Kayitha
A Composite Index to Measure the Perceived Inadequacy of Public Transportation 28Krishna N. S. Behara, Shriniwas S. Arkatkar, Ashoke K. Sarkar
Analyzing Service Quality of Hubli-Dharwad Intercity Bus Services 36
Ranjeet F. J, Srikanth Shastry
Travel Time Reliability Based Traffic Assignment Model for an Urban Road Network 45
Ch. Ravi Sekhar, Ananya Bijay, N.S.Divia
Fuel Subsidy Removal in Nigeria: Its Impacts and the Way Forward 54
Desmond Amiegbebhor
Role of Informal Bus Operators in the City of Addis Ababa, Ethiopia 63Fekadu K.
Sustainable Mobility Based Qualitative Approach to Evaluate Comprehensive 74Mobility Plan (CMP) of PuneAkshima T. Ghate
Urban Transport Journal

URBAN TRANSPORTjOURNAl
Vol. 12 No. 1, Aug. 2013
IMPACT OF PROPOSED RIVER BRIDGE ON LEVEL OF SERVICE OF EXISTING BRIDGE AND LINKED CORRIDORS: A CASE STUDY OF SURAT CITY
Gaurang Joshi*, Dinesh Vagadiya**, Sunny Deol G.***
Abstract: The development of city largely depends upon its physical, social, and institutional infrastructure. Traffic pattern is the key input to planning for transport facilities that plays vital role in promoting economic growth and prosperity of any city. In this context, the importance of intra-urban transportation is paramount. Congestion on city roads becomes major problem due to ever growing traffic and it is generally solved by providing new facilities like grade separation or underpass etc. as a last resort. Construction of such facility affects the traffic pattern in adjoining areas also. The impact of new transport facility on the existing connected corridors needs to be evaluated to assess the efficacy of such improvement programme. This study provides an overview of change in traffic pattern in connected corridors due to construction of a Cable Stayed Bridge parallel to existing Sardar Bridge on Tapi River in Surat city.
Keywords: Traffic Pattern, Travel Impedance, Logit Model, Traffic Forecast, LoS
1.0 INTRODUCTION
After liberalization phenomenon, Indian economy is growing rapidly demanding for more and better infrastructure facilities in metropolitan areas. One way push and pull has led India to acceleration phase of urbanization. About 19 crore people (42% of urban population) are living in metropolitan cities. Surat is one of the metropolitan regions in the state of Gujarat which has been continuously growing rapidly over past three decades at average decadal population growth rate of 60%. This rapid urbanization in the city center has spread over its periphery resulting into spatial expansion and increase in the average trip length. The population increase has also led to jump in travel demand also. Accessibility between the outer periphery and the city center becomes very critical especially when people seek employment within the city center. Due to lack of adequate and efficient transit system on one hand, and improved socioeconomic conditions of population on the other hand, the demand for private vehicle also rises significantly. Higher
share of personalized low occupancy vehicles increases traffic volume on the existing roads as well as on grade separators leading to deteriorated level of service i.e. congestion, delay, pollution, fatigue etc.
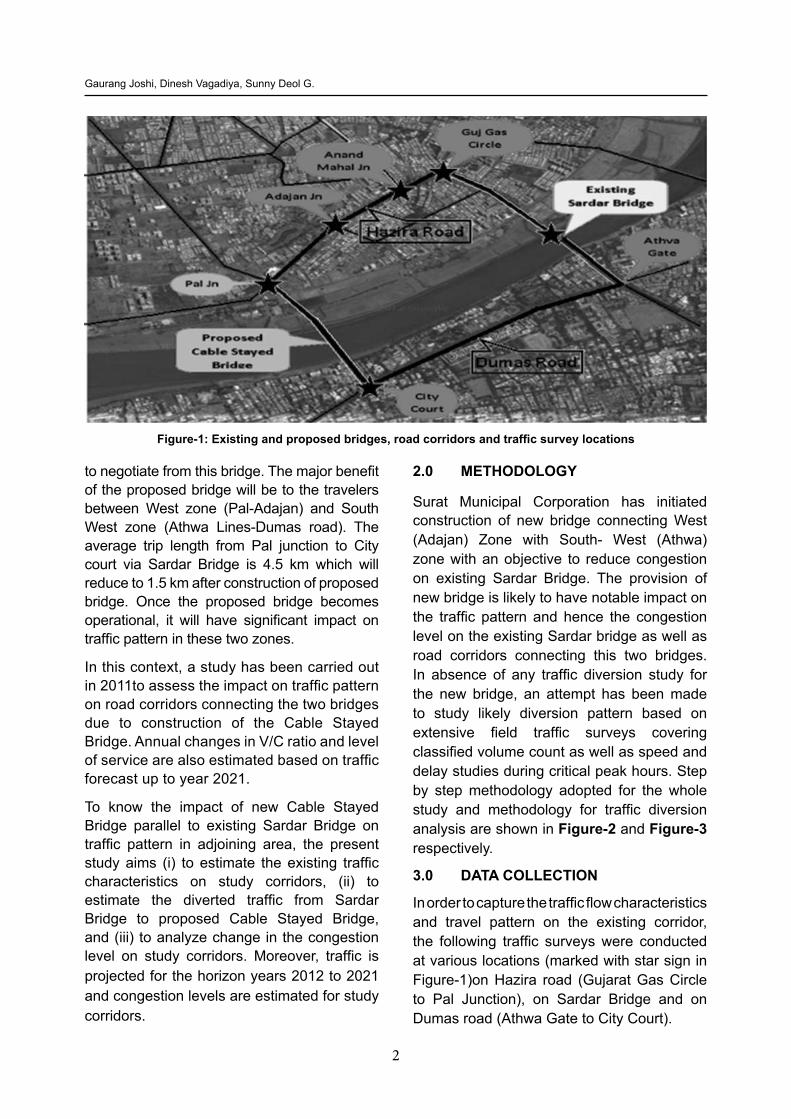
Gujarat’s first Cable Stayed bridge having 15m four lane divided carriageway is being constructed in Surat on Tapi River parallel to existing Sardar Bridge joining Hazira road (West Zone-Adajan) and Dumas road (South West Zone –Athwa). The proposed bridge will connect Pal junction in West zone to City Court junction in South West zone. Figure-1 shows locations of both the bridges and road corridors connecting them. Presently, Sardar Bridge having 15m four lane divided carriageway serves the traffic in saturated condition during peak hours with volume to capacity (V/C) ratio 1.2 as per CMP(2008).The bridge connects predominantly residential west zone with the rest of the city. All the vehicular traffic coming from West zone areas of Adajan, Pal, Anand Mahal, Rander, Tadwadi and going towards Udhna, Athwa and Varachha zones which are business and industrial hubs have only option
* Associate Professor, Civil Engineering Department, S.V. N.I.T.,Surat.** Lecturer, Government Polytechnic , Rajkot*** Research Scholar, Civil Engineering Department, S.V.N.I.T., Surat.
2
Gaurang Joshi, Dinesh Vagadiya, Sunny Deol G.
to negotiate from this bridge. The major benefit of the proposed bridge will be to the travelers between West zone (Pal-Adajan) and South West zone (Athwa Lines-Dumas road). The average trip length from Pal junction to City court via Sardar Bridge is 4.5 km which will reduce to 1.5 km after construction of proposed bridge. Once the proposed bridge becomes operational, it will have significant impact on traffic pattern in these two zones.
In this context, a study has been carried out in 2011to assess the impact on traffic pattern on road corridors connecting the two bridges due to construction of the Cable Stayed Bridge. Annual changes in V/C ratio and level of service are also estimated based on traffic forecast up to year 2021.
To know the impact of new Cable Stayed Bridge parallel to existing Sardar Bridge on traffic pattern in adjoining area, the present study aims (i) to estimate the existing traffic characteristics on study corridors, (ii) to estimate the diverted traffic from Sardar Bridge to proposed Cable Stayed Bridge, and (iii) to analyze change in the congestion level on study corridors. Moreover, traffic is projected for the horizon years 2012 to 2021 and congestion levels are estimated for study corridors.
Figure-1: Existing and proposed bridges, road corridors and traffic survey locations
2.0 METHODOLOGY
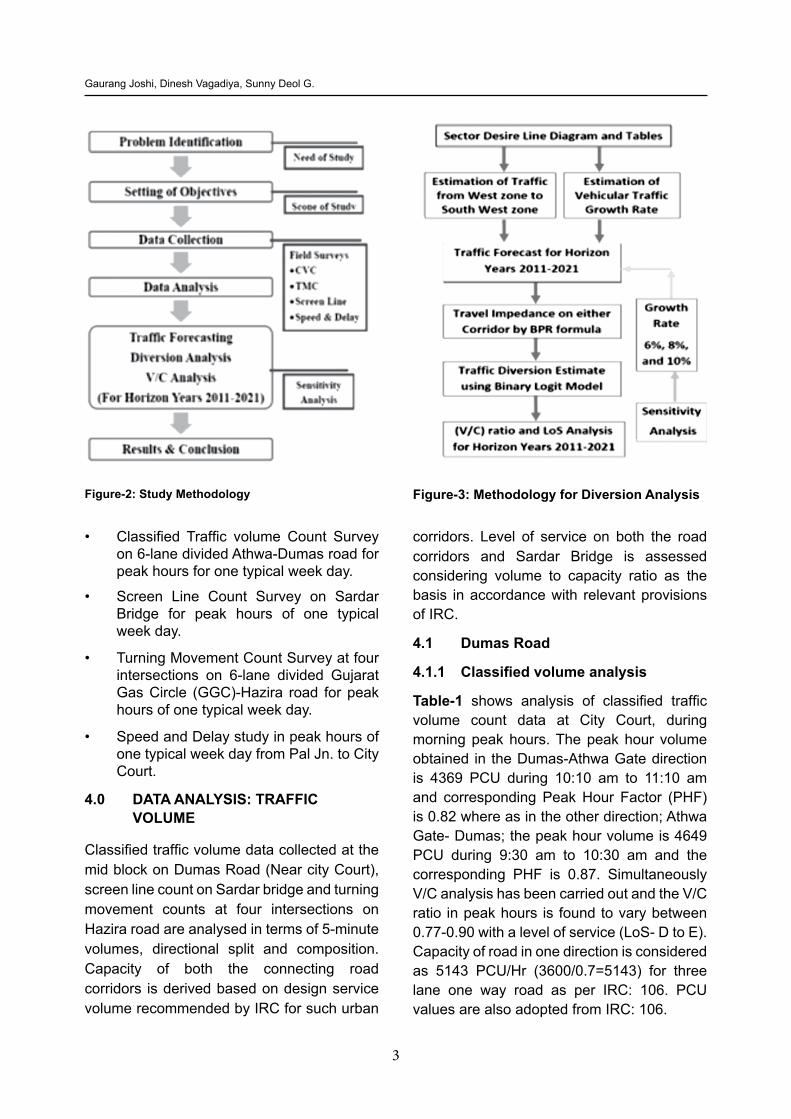
Surat Municipal Corporation has initiated construction of new bridge connecting West (Adajan) Zone with South- West (Athwa) zone with an objective to reduce congestion on existing Sardar Bridge. The provision of new bridge is likely to have notable impact on the traffic pattern and hence the congestion level on the existing Sardar bridge as well as road corridors connecting this two bridges. In absence of any traffic diversion study for the new bridge, an attempt has been made to study likely diversion pattern based on extensive field traffic surveys covering classified volume count as well as speed and delay studies during critical peak hours. Step by step methodology adopted for the whole study and methodology for traffic diversion analysis are shown in Figure-2 and Figure-3 respectively.
3.0 DATA COLLECTION
In order to capture the traffic flow characteristics and travel pattern on the existing corridor, the following traffic surveys were conducted at various locations (marked with star sign in Figure-1)on Hazira road (Gujarat Gas Circle to Pal Junction), on Sardar Bridge and on Dumas road (Athwa Gate to City Court).
3
Gaurang Joshi, Dinesh Vagadiya, Sunny Deol G.
• Classified Traffic volume Count Survey on 6-lane divided Athwa-Dumas road for peak hours for one typical week day.
• Screen Line Count Survey on Sardar Bridge for peak hours of one typical week day.
• Turning Movement Count Survey at four intersections on 6-lane divided Gujarat Gas Circle (GGC)-Hazira road for peak hours of one typical week day.
• Speed and Delay study in peak hours of one typical week day from Pal Jn. to City Court.
4.0 DATA ANALYSIS: TRAFFIC VOLUME
Classified traffic volume data collected at the mid block on Dumas Road (Near city Court), screen line count on Sardar bridge and turning movement counts at four intersections on Hazira road are analysed in terms of 5-minute volumes, directional split and composition. Capacity of both the connecting road corridors is derived based on design service volume recommended by IRC for such urban
Figure-2: Study Methodology Figure-3: Methodology for Diversion Analysis
corridors. Level of service on both the road corridors and Sardar Bridge is assessed considering volume to capacity ratio as the basis in accordance with relevant provisions of IRC.
4.1 Dumas Road
4.1.1 Classified volume analysis
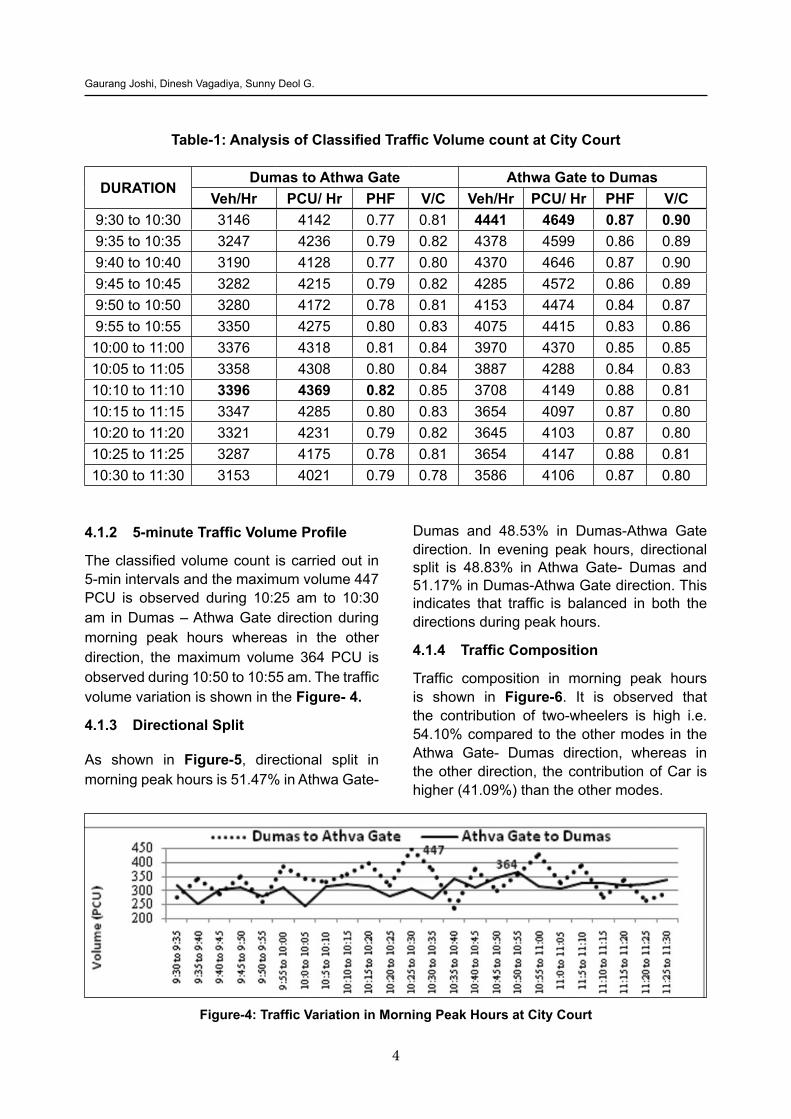
Table-1 shows analysis of classified traffic volume count data at City Court, during morning peak hours. The peak hour volume obtained in the Dumas-Athwa Gate direction is 4369 PCU during 10:10 am to 11:10 am and corresponding Peak Hour Factor (PHF) is 0.82 where as in the other direction; Athwa Gate- Dumas; the peak hour volume is 4649 PCU during 9:30 am to 10:30 am and the corresponding PHF is 0.87. Simultaneously V/C analysis has been carried out and the V/C ratio in peak hours is found to vary between 0.77-0.90 with a level of service (LoS- D to E). Capacity of road in one direction is considered as 5143 PCU/Hr (3600/0.7=5143) for three lane one way road as per IRC: 106. PCU values are also adopted from IRC: 106.
4
Gaurang Joshi, Dinesh Vagadiya, Sunny Deol G.
Table-1: Analysis of Classified Traffic Volume count at City Court
DURATIONDumas to Athwa Gate Athwa Gate to Dumas
Veh/Hr PCU/ Hr PHF V/C Veh/Hr PCU/ Hr PHF V/C9:30 to 10:30 3146 4142 0.77 0.81 4441 4649 0.87 0.909:35 to 10:35 3247 4236 0.79 0.82 4378 4599 0.86 0.899:40 to 10:40 3190 4128 0.77 0.80 4370 4646 0.87 0.909:45 to 10:45 3282 4215 0.79 0.82 4285 4572 0.86 0.899:50 to 10:50 3280 4172 0.78 0.81 4153 4474 0.84 0.879:55 to 10:55 3350 4275 0.80 0.83 4075 4415 0.83 0.8610:00 to 11:00 3376 4318 0.81 0.84 3970 4370 0.85 0.8510:05 to 11:05 3358 4308 0.80 0.84 3887 4288 0.84 0.8310:10 to 11:10 3396 4369 0.82 0.85 3708 4149 0.88 0.8110:15 to 11:15 3347 4285 0.80 0.83 3654 4097 0.87 0.8010:20 to 11:20 3321 4231 0.79 0.82 3645 4103 0.87 0.8010:25 to 11:25 3287 4175 0.78 0.81 3654 4147 0.88 0.8110:30 to 11:30 3153 4021 0.79 0.78 3586 4106 0.87 0.80
Figure-4: Traffic Variation in Morning Peak Hours at City Court
4.1.2 5-minute Traffic Volume Profile
The classified volume count is carried out in 5-min intervals and the maximum volume 447 PCU is observed during 10:25 am to 10:30 am in Dumas – Athwa Gate direction during morning peak hours whereas in the other direction, the maximum volume 364 PCU is observed during 10:50 to 10:55 am. The traffic volume variation is shown in the Figure- 4.
4.1.3 Directional Split
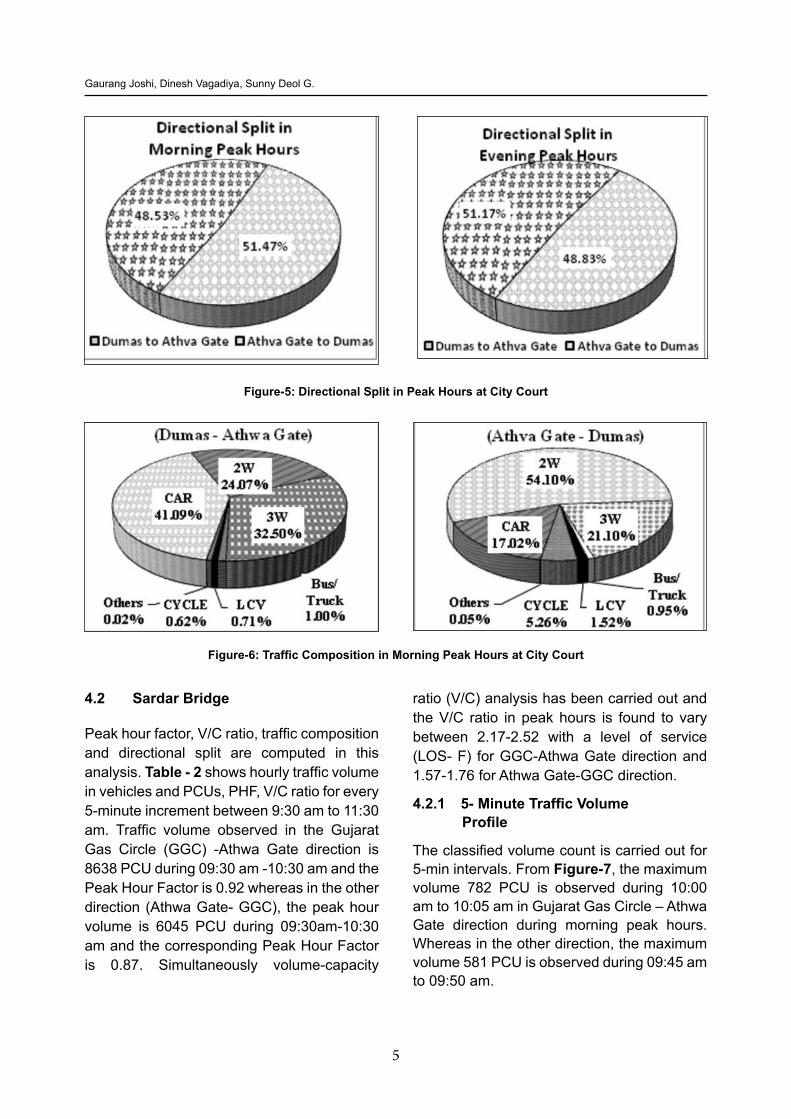
As shown in Figure-5, directional split in morning peak hours is 51.47% in Athwa Gate-
Dumas and 48.53% in Dumas-Athwa Gate direction. In evening peak hours, directional split is 48.83% in Athwa Gate- Dumas and 51.17% in Dumas-Athwa Gate direction. This indicates that traffic is balanced in both the directions during peak hours.
4.1.4 Traffic Composition
Traffic composition in morning peak hours is shown in Figure-6. It is observed that the contribution of two-wheelers is high i.e. 54.10% compared to the other modes in the Athwa Gate- Dumas direction, whereas in the other direction, the contribution of Car is higher (41.09%) than the other modes.
5
Gaurang Joshi, Dinesh Vagadiya, Sunny Deol G.
Figure-5: Directional Split in Peak Hours at City Court
Figure-6: Traffic Composition in Morning Peak Hours at City Court
4.2 Sardar Bridge
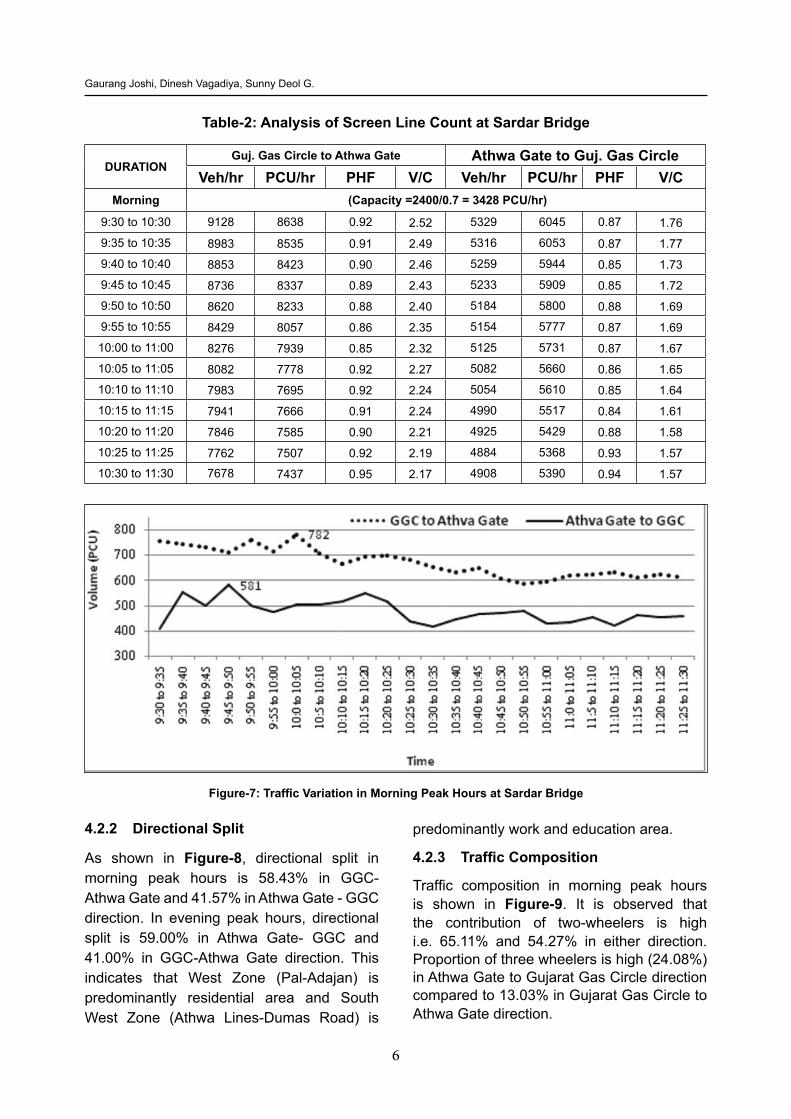
Peak hour factor, V/C ratio, traffic composition and directional split are computed in this analysis. Table - 2 shows hourly traffic volume in vehicles and PCUs, PHF, V/C ratio for every 5-minute increment between 9:30 am to 11:30 am. Traffic volume observed in the Gujarat Gas Circle (GGC) -Athwa Gate direction is 8638 PCU during 09:30 am -10:30 am and the Peak Hour Factor is 0.92 whereas in the other direction (Athwa Gate- GGC), the peak hour volume is 6045 PCU during 09:30am-10:30 am and the corresponding Peak Hour Factor is 0.87. Simultaneously volume-capacity
ratio (V/C) analysis has been carried out and the V/C ratio in peak hours is found to vary between 2.17-2.52 with a level of service (LOS- F) for GGC-Athwa Gate direction and 1.57-1.76 for Athwa Gate-GGC direction.
4.2.1 5- Minute Traffic Volume Profile
The classified volume count is carried out for 5-min intervals. From Figure-7, the maximum volume 782 PCU is observed during 10:00 am to 10:05 am in Gujarat Gas Circle – Athwa Gate direction during morning peak hours. Whereas in the other direction, the maximum volume 581 PCU is observed during 09:45 am to 09:50 am.
6
Gaurang Joshi, Dinesh Vagadiya, Sunny Deol G.
Table-2: Analysis of Screen Line Count at Sardar Bridge
DURATIONGuj. Gas Circle to Athwa Gate Athwa Gate to Guj. Gas Circle
Veh/hr PCU/hr PHF V/C Veh/hr PCU/hr PHF V/CMorning (Capacity =2400/0.7 = 3428 PCU/hr)
9:30 to 10:30 9128 8638 0.92 2.52 5329 6045 0.87 1.76
9:35 to 10:35 8983 8535 0.91 2.49 5316 6053 0.87 1.77
9:40 to 10:40 8853 8423 0.90 2.46 5259 5944 0.85 1.73
9:45 to 10:45 8736 8337 0.89 2.43 5233 5909 0.85 1.72
9:50 to 10:50 8620 8233 0.88 2.40 5184 5800 0.88 1.69
9:55 to 10:55 8429 8057 0.86 2.35 5154 5777 0.87 1.69
10:00 to 11:00 8276 7939 0.85 2.32 5125 5731 0.87 1.67
10:05 to 11:05 8082 7778 0.92 2.27 5082 5660 0.86 1.65
10:10 to 11:10 7983 7695 0.92 2.24 5054 5610 0.85 1.64
10:15 to 11:15 7941 7666 0.91 2.24 4990 5517 0.84 1.61
10:20 to 11:20 7846 7585 0.90 2.21 4925 5429 0.88 1.58
10:25 to 11:25 7762 7507 0.92 2.19 4884 5368 0.93 1.57
10:30 to 11:30 7678 7437 0.95 2.17 4908 5390 0.94 1.57
Figure-7: Traffic Variation in Morning Peak Hours at Sardar Bridge
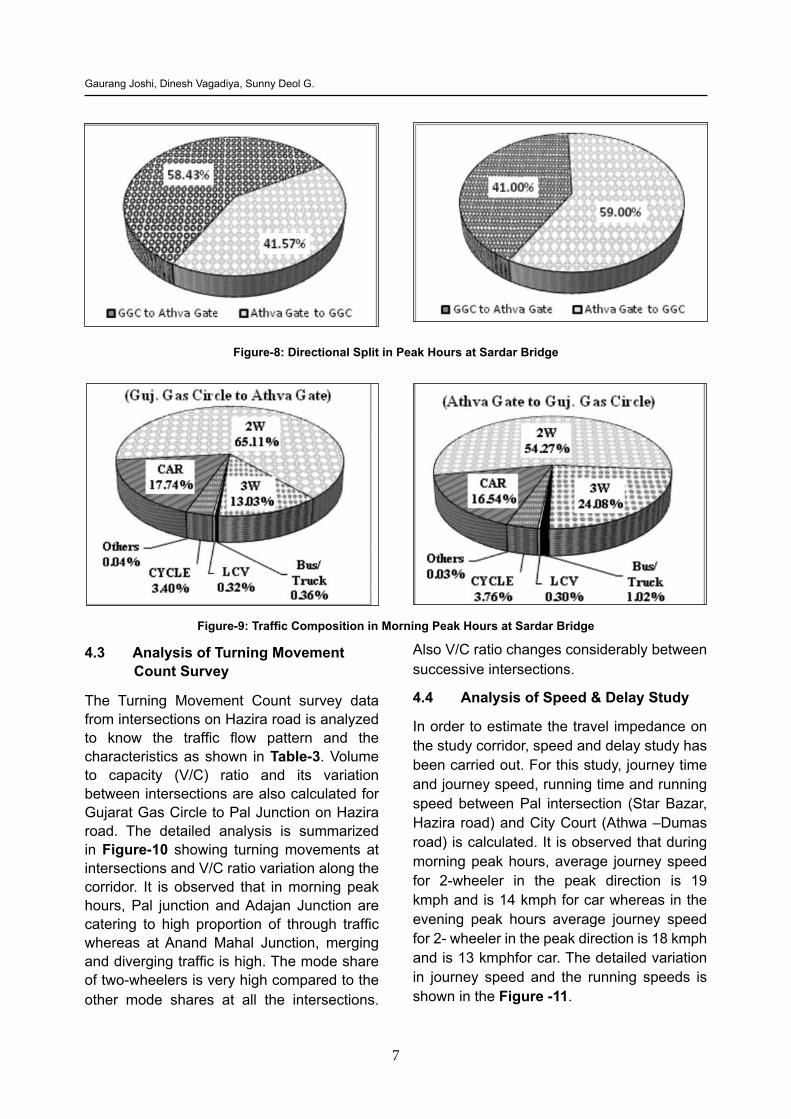
4.2.2 Directional Split
As shown in Figure-8, directional split in morning peak hours is 58.43% in GGC- Athwa Gate and 41.57% in Athwa Gate - GGC direction. In evening peak hours, directional split is 59.00% in Athwa Gate- GGC and 41.00% in GGC-Athwa Gate direction. This indicates that West Zone (Pal-Adajan) is predominantly residential area and South West Zone (Athwa Lines-Dumas Road) is
predominantly work and education area.
4.2.3 Traffic Composition
Traffic composition in morning peak hours is shown in Figure-9. It is observed that the contribution of two-wheelers is high i.e. 65.11% and 54.27% in either direction. Proportion of three wheelers is high (24.08%) in Athwa Gate to Gujarat Gas Circle direction compared to 13.03% in Gujarat Gas Circle to Athwa Gate direction.
7
Gaurang Joshi, Dinesh Vagadiya, Sunny Deol G.
Figure-8: Directional Split in Peak Hours at Sardar Bridge
Figure-9: Traffic Composition in Morning Peak Hours at Sardar Bridge
4.3 Analysis of Turning Movement Count Survey
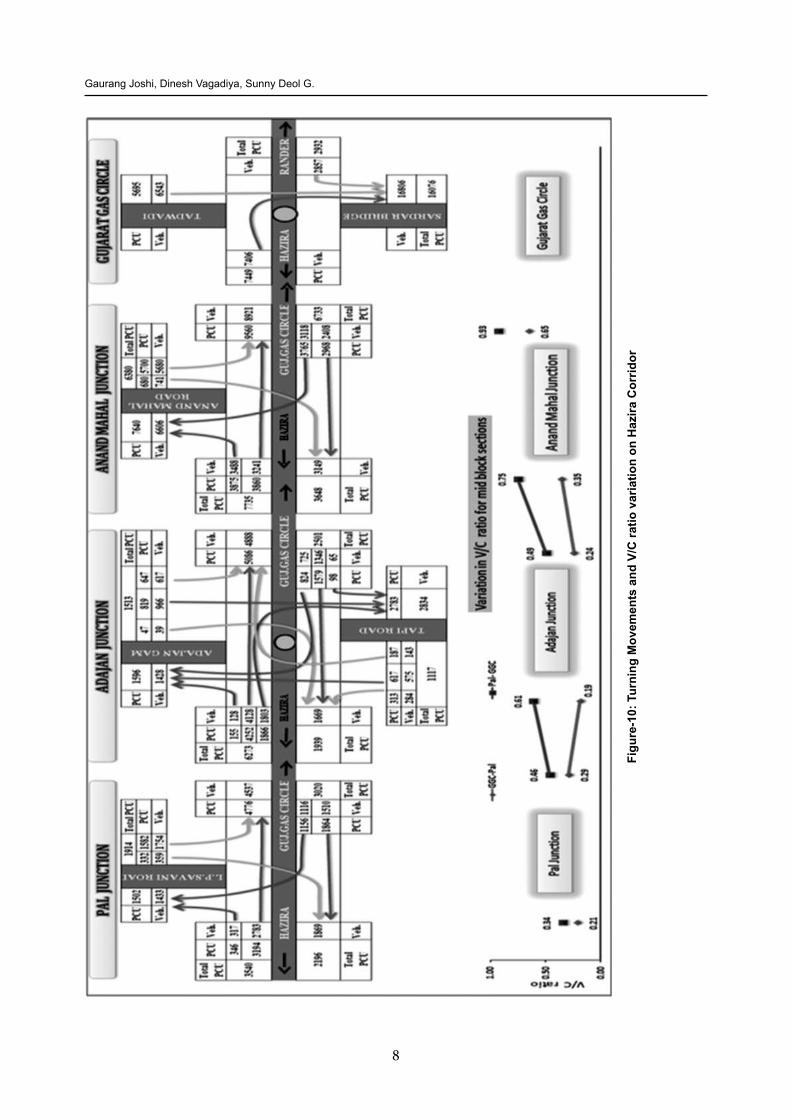
The Turning Movement Count survey data from intersections on Hazira road is analyzed to know the traffic flow pattern and the characteristics as shown in Table-3. Volume to capacity (V/C) ratio and its variation between intersections are also calculated for Gujarat Gas Circle to Pal Junction on Hazira road. The detailed analysis is summarized in Figure-10 showing turning movements at intersections and V/C ratio variation along the corridor. It is observed that in morning peak hours, Pal junction and Adajan Junction are catering to high proportion of through traffic whereas at Anand Mahal Junction, merging and diverging traffic is high. The mode share of two-wheelers is very high compared to the other mode shares at all the intersections.
Also V/C ratio changes considerably between successive intersections.
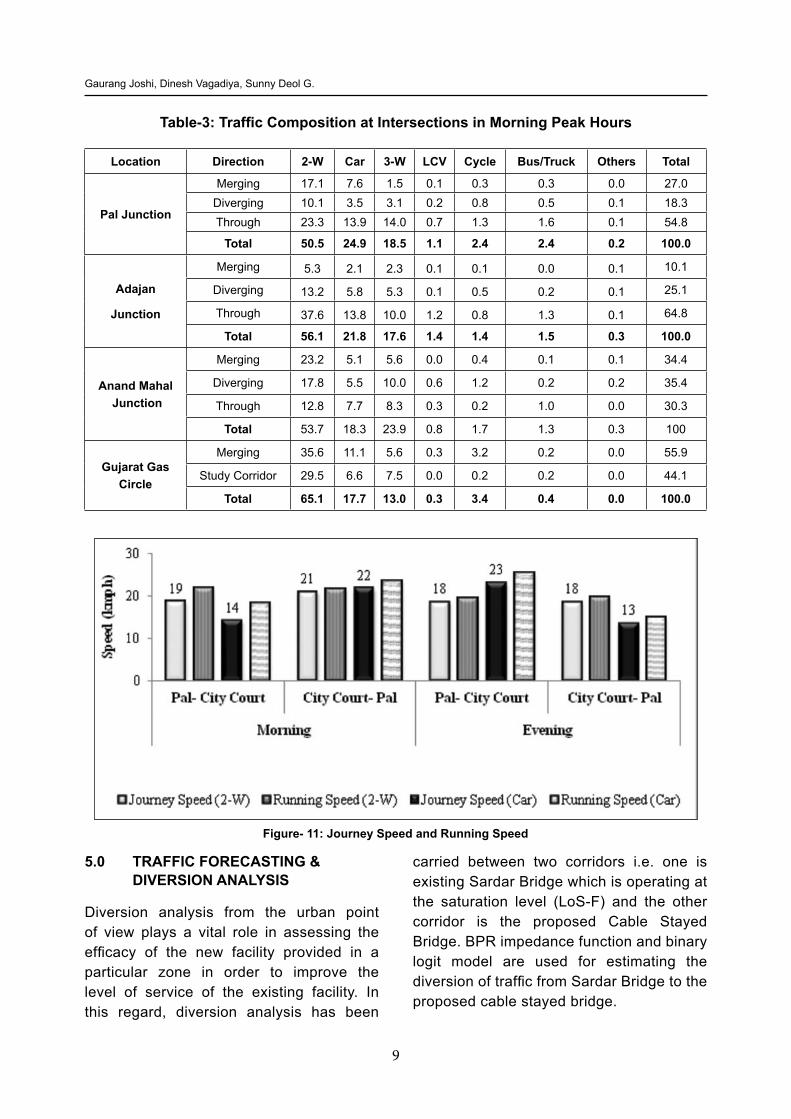
4.4 Analysis of Speed & Delay Study
In order to estimate the travel impedance on the study corridor, speed and delay study has been carried out. For this study, journey time and journey speed, running time and running speed between Pal intersection (Star Bazar, Hazira road) and City Court (Athwa –Dumas road) is calculated. It is observed that during morning peak hours, average journey speed for 2-wheeler in the peak direction is 19 kmph and is 14 kmph for car whereas in the evening peak hours average journey speed for 2- wheeler in the peak direction is 18 kmph and is 13 kmphfor car. The detailed variation in journey speed and the running speeds is shown in the Figure -11.
8
Gaurang Joshi, Dinesh Vagadiya, Sunny Deol G.
Figu
re-1
0: T
urni
ng M
ovem
ents
and
V/C
ratio
var
iatio
n on
Haz
ira C
orrid
or
9
Gaurang Joshi, Dinesh Vagadiya, Sunny Deol G.
Table-3: Traffic Composition at Intersections in Morning Peak Hours
Location Direction 2-W Car 3-W LCV Cycle Bus/Truck Others Total
Pal Junction
Merging 17.1 7.6 1.5 0.1 0.3 0.3 0.0 27.0Diverging 10.1 3.5 3.1 0.2 0.8 0.5 0.1 18.3Through 23.3 13.9 14.0 0.7 1.3 1.6 0.1 54.8
Total 50.5 24.9 18.5 1.1 2.4 2.4 0.2 100.0
Adajan
Junction
Merging 5.3 2.1 2.3 0.1 0.1 0.0 0.1 10.1
Diverging 13.2 5.8 5.3 0.1 0.5 0.2 0.1 25.1
Through 37.6 13.8 10.0 1.2 0.8 1.3 0.1 64.8
Total 56.1 21.8 17.6 1.4 1.4 1.5 0.3 100.0
Anand Mahal Junction
Merging 23.2 5.1 5.6 0.0 0.4 0.1 0.1 34.4
Diverging 17.8 5.5 10.0 0.6 1.2 0.2 0.2 35.4
Through 12.8 7.7 8.3 0.3 0.2 1.0 0.0 30.3
Total 53.7 18.3 23.9 0.8 1.7 1.3 0.3 100
Gujarat Gas Circle
Merging 35.6 11.1 5.6 0.3 3.2 0.2 0.0 55.9
Study Corridor 29.5 6.6 7.5 0.0 0.2 0.2 0.0 44.1
Total 65.1 17.7 13.0 0.3 3.4 0.4 0.0 100.0
Figure- 11: Journey Speed and Running Speed
5.0 TRAFFIC FORECASTING & DIVERSION ANALYSIS
Diversion analysis from the urban point of view plays a vital role in assessing the efficacy of the new facility provided in a particular zone in order to improve the level of service of the existing facility. In this regard, diversion analysis has been
carried between two corridors i.e. one is existing Sardar Bridge which is operating at the saturation level (LoS-F) and the other corridor is the proposed Cable Stayed Bridge. BPR impedance function and binary logit model are used for estimating the diversion of traffic from Sardar Bridge to the proposed cable stayed bridge.
10
Gaurang Joshi, Dinesh Vagadiya, Sunny Deol G.
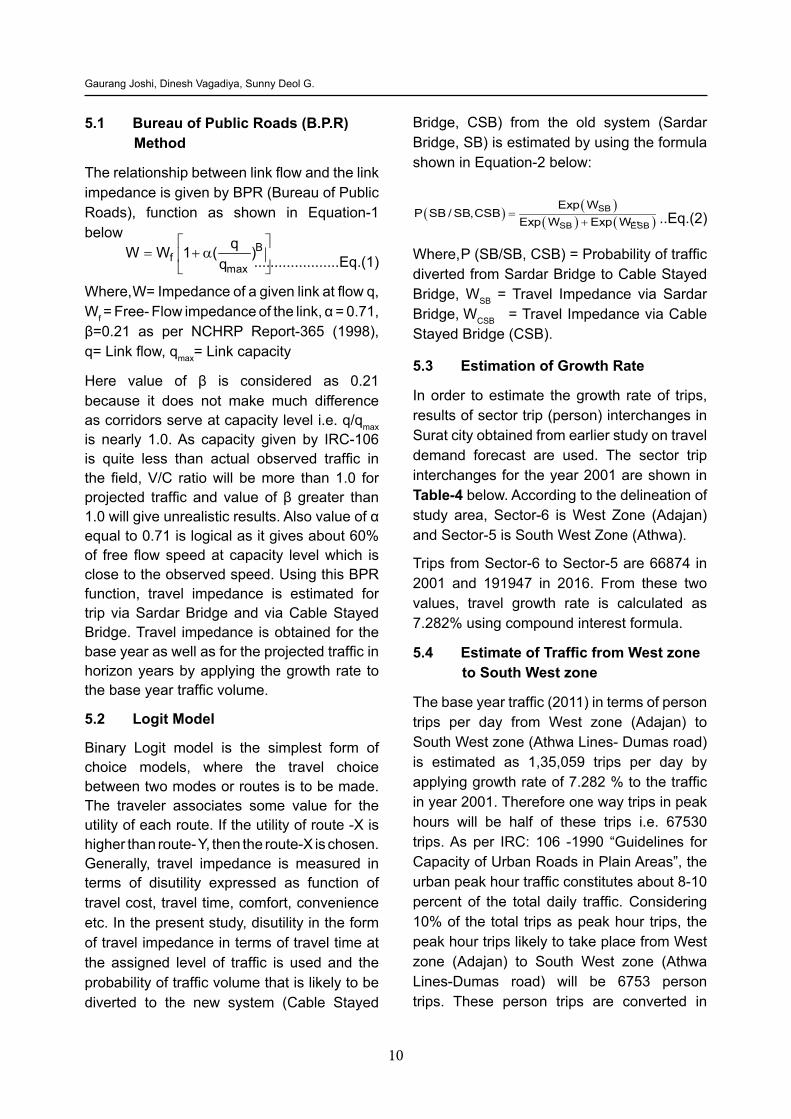
5.1 Bureau of Public Roads (B.P.R) Method
The relationship between link flow and the link impedance is given by BPR (Bureau of Public Roads), function as shown in Equation-1 below
= + α
B
fmax
qW W 1 ( )q .....................Eq.(1)
Where, W= Impedance of a given link at flow q, Wf = Free- Flow impedance of the link, α = 0.71, β=0.21 as per NCHRP Report-365 (1998), q= Link flow, qmax= Link capacity
Here value of β is considered as 0.21 because it does not make much difference as corridors serve at capacity level i.e. q/qmax is nearly 1.0. As capacity given by IRC-106 is quite less than actual observed traffic in the field, V/C ratio will be more than 1.0 for projected traffic and value of β greater than 1.0 will give unrealistic results. Also value of α equal to 0.71 is logical as it gives about 60% of free flow speed at capacity level which is close to the observed speed. Using this BPR function, travel impedance is estimated for trip via Sardar Bridge and via Cable Stayed Bridge. Travel impedance is obtained for the base year as well as for the projected traffic in horizon years by applying the growth rate to the base year traffic volume.
5.2 Logit Model
Binary Logit model is the simplest form of choice models, where the travel choice between two modes or routes is to be made. The traveler associates some value for the utility of each route. If the utility of route -X is higher than route- Y, then the route-X is chosen. Generally, travel impedance is measured in terms of disutility expressed as function of travel cost, travel time, comfort, convenience etc. In the present study, disutility in the form of travel impedance in terms of travel time at the assigned level of traffic is used and the probability of traffic volume that is likely to be diverted to the new system (Cable Stayed
Bridge, CSB) from the old system (Sardar Bridge, SB) is estimated by using the formula shown in Equation-2 below:
( ) ( )( ) ( )
=+
SB
SB ESB
Exp WP SB / SB,CSB
Exp W Exp W
... ..Eq.(2)
Where, P (SB/SB, CSB) = Probability of traffic diverted from Sardar Bridge to Cable Stayed Bridge, WSB = Travel Impedance via Sardar Bridge, WCSB
= Travel Impedance via Cable Stayed Bridge (CSB).
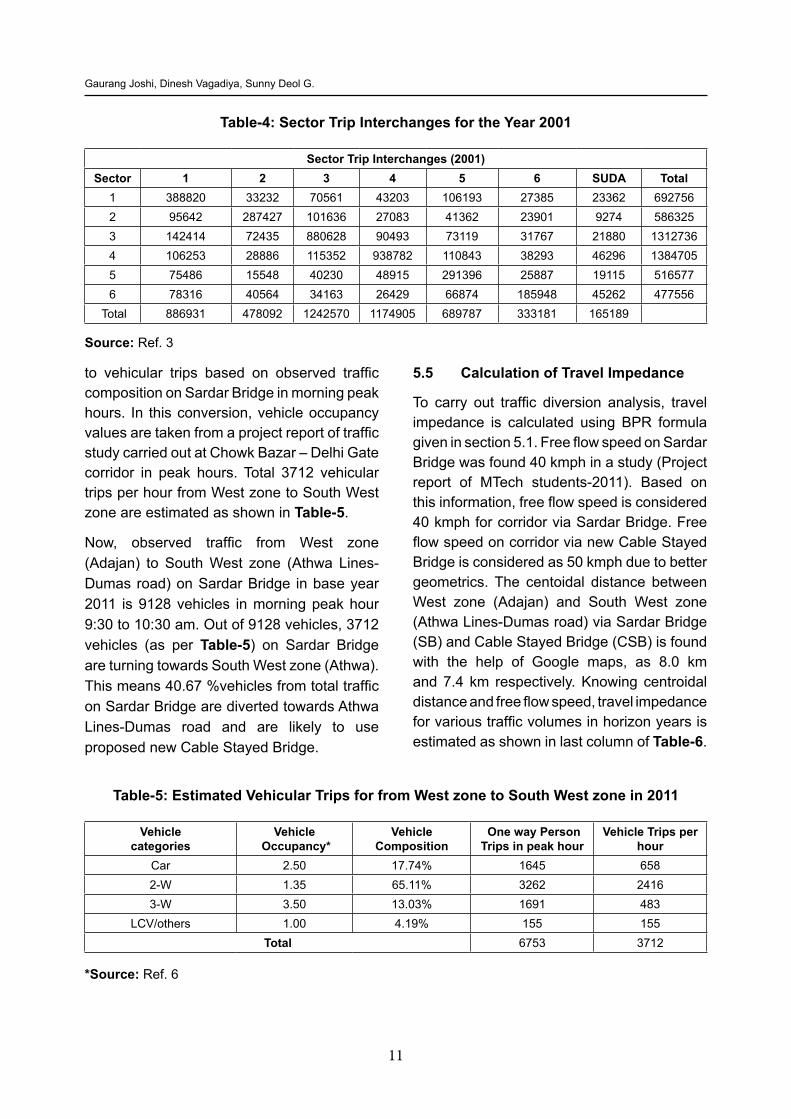
5.3 Estimation of Growth Rate
In order to estimate the growth rate of trips, results of sector trip (person) interchanges in Surat city obtained from earlier study on travel demand forecast are used. The sector trip interchanges for the year 2001 are shown in Table-4 below. According to the delineation of study area, Sector-6 is West Zone (Adajan) and Sector-5 is South West Zone (Athwa).
Trips from Sector-6 to Sector-5 are 66874 in 2001 and 191947 in 2016. From these two values, travel growth rate is calculated as 7.282% using compound interest formula.
5.4 Estimate of Traffic from West zone to South West zone
The base year traffic (2011) in terms of person trips per day from West zone (Adajan) to South West zone (Athwa Lines- Dumas road) is estimated as 1,35,059 trips per day by applying growth rate of 7.282 % to the traffic in year 2001. Therefore one way trips in peak hours will be half of these trips i.e. 67530 trips. As per IRC: 106 -1990 “Guidelines for Capacity of Urban Roads in Plain Areas”, the urban peak hour traffic constitutes about 8-10 percent of the total daily traffic. Considering 10% of the total trips as peak hour trips, the peak hour trips likely to take place from West zone (Adajan) to South West zone (Athwa Lines-Dumas road) will be 6753 person trips. These person trips are converted in
11
Gaurang Joshi, Dinesh Vagadiya, Sunny Deol G.
to vehicular trips based on observed traffic composition on Sardar Bridge in morning peak hours. In this conversion, vehicle occupancy values are taken from a project report of traffic study carried out at Chowk Bazar – Delhi Gate corridor in peak hours. Total 3712 vehicular trips per hour from West zone to South West zone are estimated as shown in Table-5.
Now, observed traffic from West zone (Adajan) to South West zone (Athwa Lines-Dumas road) on Sardar Bridge in base year 2011 is 9128 vehicles in morning peak hour 9:30 to 10:30 am. Out of 9128 vehicles, 3712 vehicles (as per Table-5) on Sardar Bridge are turning towards South West zone (Athwa). This means 40.67 %vehicles from total traffic on Sardar Bridge are diverted towards Athwa Lines-Dumas road and are likely to use proposed new Cable Stayed Bridge.
5.5 Calculation of Travel Impedance
To carry out traffic diversion analysis, travel impedance is calculated using BPR formula given in section 5.1. Free flow speed on Sardar Bridge was found 40 kmph in a study (Project report of MTech students-2011). Based on this information, free flow speed is considered 40 kmph for corridor via Sardar Bridge. Free flow speed on corridor via new Cable Stayed Bridge is considered as 50 kmph due to better geometrics. The centoidal distance between West zone (Adajan) and South West zone (Athwa Lines-Dumas road) via Sardar Bridge (SB) and Cable Stayed Bridge (CSB) is found with the help of Google maps, as 8.0 km and 7.4 km respectively. Knowing centroidal distance and free flow speed, travel impedance for various traffic volumes in horizon years is estimated as shown in last column of Table-6.
Table-5: Estimated Vehicular Trips for from West zone to South West zone in 2011
Vehicle categories
Vehicle Occupancy*
Vehicle Composition
One way Person Trips in peak hour
Vehicle Trips per hour
Car 2.50 17.74% 1645 6582-W 1.35 65.11% 3262 24163-W 3.50 13.03% 1691 483
LCV/others 1.00 4.19% 155 155Total 6753 3712
Table-4: Sector Trip Interchanges for the Year 2001
Sector Trip Interchanges (2001)Sector 1 2 3 4 5 6 SUDA Total
1 388820 33232 70561 43203 106193 27385 23362 6927562 95642 287427 101636 27083 41362 23901 9274 5863253 142414 72435 880628 90493 73119 31767 21880 13127364 106253 28886 115352 938782 110843 38293 46296 13847055 75486 15548 40230 48915 291396 25887 19115 5165776 78316 40564 34163 26429 66874 185948 45262 477556
Total 886931 478092 1242570 1174905 689787 333181 165189
Source: Ref. 3
*Source: Ref. 6
12
Gaurang Joshi, Dinesh Vagadiya, Sunny Deol G.
Table-6: Forecasted Traffic Volume and Travel Impedance
Year
Predicted Traffic Volume on
Sardar Bridge
Traffic towards Dumas Road (Right turn from
Athwa Gate)
Traffic towards Railway Station
(Straight from Athwa Gate)
Impedance (min)
Veh/Hr PCU/Hr Veh/Hr PCU/Hr Veh/Hr PCU/Hr Via Sardar Bridge
Via Cable Stayed Bridge
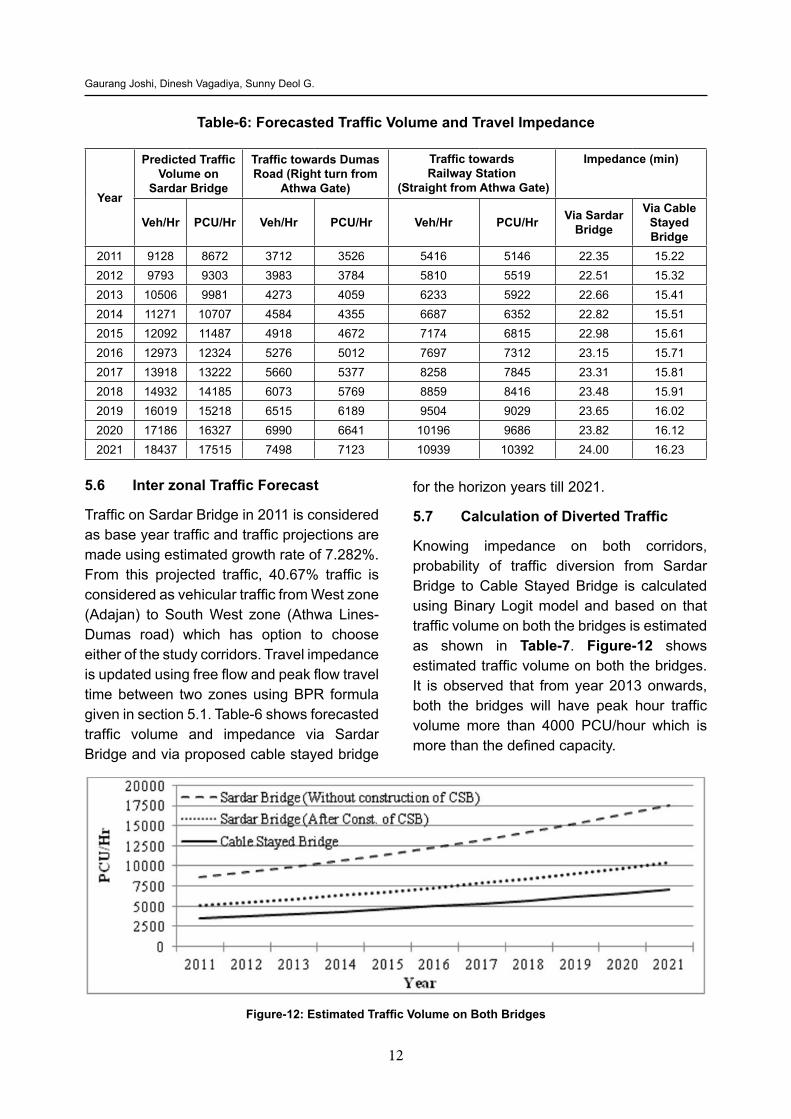
2011 9128 8672 3712 3526 5416 5146 22.35 15.222012 9793 9303 3983 3784 5810 5519 22.51 15.322013 10506 9981 4273 4059 6233 5922 22.66 15.412014 11271 10707 4584 4355 6687 6352 22.82 15.512015 12092 11487 4918 4672 7174 6815 22.98 15.612016 12973 12324 5276 5012 7697 7312 23.15 15.712017 13918 13222 5660 5377 8258 7845 23.31 15.812018 14932 14185 6073 5769 8859 8416 23.48 15.912019 16019 15218 6515 6189 9504 9029 23.65 16.022020 17186 16327 6990 6641 10196 9686 23.82 16.122021 18437 17515 7498 7123 10939 10392 24.00 16.23
5.6 Inter zonal Traffic Forecast
Traffic on Sardar Bridge in 2011 is considered as base year traffic and traffic projections are made using estimated growth rate of 7.282%. From this projected traffic, 40.67% traffic is considered as vehicular traffic from West zone (Adajan) to South West zone (Athwa Lines-Dumas road) which has option to choose either of the study corridors. Travel impedance is updated using free flow and peak flow travel time between two zones using BPR formula given in section 5.1. Table-6 shows forecasted traffic volume and impedance via Sardar Bridge and via proposed cable stayed bridge
for the horizon years till 2021.
5.7 Calculation of Diverted Traffic
Knowing impedance on both corridors, probability of traffic diversion from Sardar Bridge to Cable Stayed Bridge is calculated using Binary Logit model and based on that traffic volume on both the bridges is estimated as shown in Table-7. Figure-12 shows estimated traffic volume on both the bridges. It is observed that from year 2013 onwards, both the bridges will have peak hour traffic volume more than 4000 PCU/hour which is more than the defined capacity.
Figure-12: Estimated Traffic Volume on Both Bridges
13
Gaurang Joshi, Dinesh Vagadiya, Sunny Deol G.
Table-7: Traffic Diversion to SB and CSB
Year
Impedance (min) Traffic volume to be diverted
(PCU/hr)
Probability of traffic diversion to Cable Stayed
Bridge
Traffic volume
diverted to CS Bridge
Total traffic volume on
Sardar BridgeSardar Bridge
Cable Stayed
2011 22.35 15.22 3526 0.9992 3523 5149
2012 22.51 15.32 3784 0.9992 3781 5522
2013 22.66 15.41 4059 0.9993 4056 5925
2014 22.82 15.51 4355 0.9993 4352 6355
2015 22.98 15.61 4672 0.9994 4669 6818
2016 23.15 15.71 5012 0.9994 5009 7315
2017 23.31 15.81 5377 0.9994 5374 7848
2018 23.48 15.91 5769 0.9995 5766 8419
2019 23.65 16.02 6189 0.9995 6186 9032
2020 23.82 16.12 6641 0.9995 6638 9689
2021 24.00 16.23 7123 0.9996 7120 10395
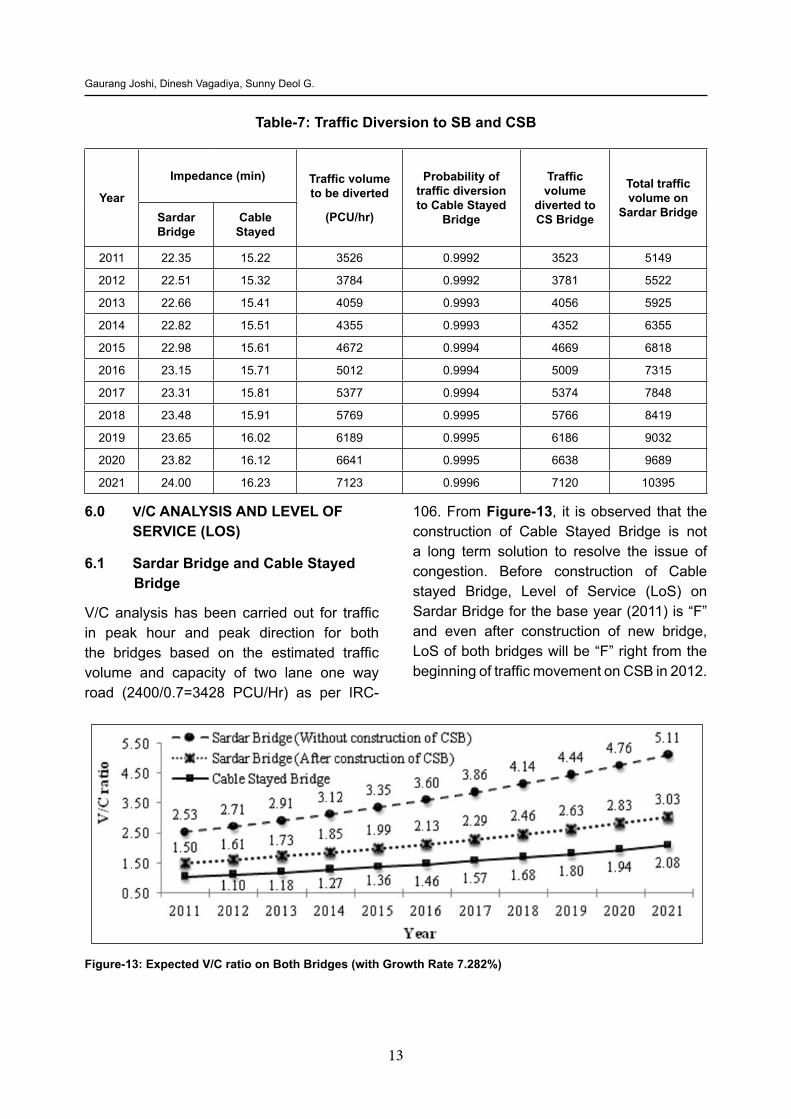
6.0 V/C ANALYSIS AND LEVEL OF SERVICE (LOS)
6.1 Sardar Bridge and Cable Stayed Bridge
V/C analysis has been carried out for traffic in peak hour and peak direction for both the bridges based on the estimated traffic volume and capacity of two lane one way road (2400/0.7=3428 PCU/Hr) as per IRC-
106. From Figure-13, it is observed that the construction of Cable Stayed Bridge is not a long term solution to resolve the issue of congestion. Before construction of Cable stayed Bridge, Level of Service (LoS) on Sardar Bridge for the base year (2011) is “F” and even after construction of new bridge, LoS of both bridges will be “F” right from the beginning of traffic movement on CSB in 2012.
Figure-13: Expected V/C ratio on Both Bridges (with Growth Rate 7.282%)
14
Gaurang Joshi, Dinesh Vagadiya, Sunny Deol G.
Figure-14: Expected V/C ratio on Study Road Stretches
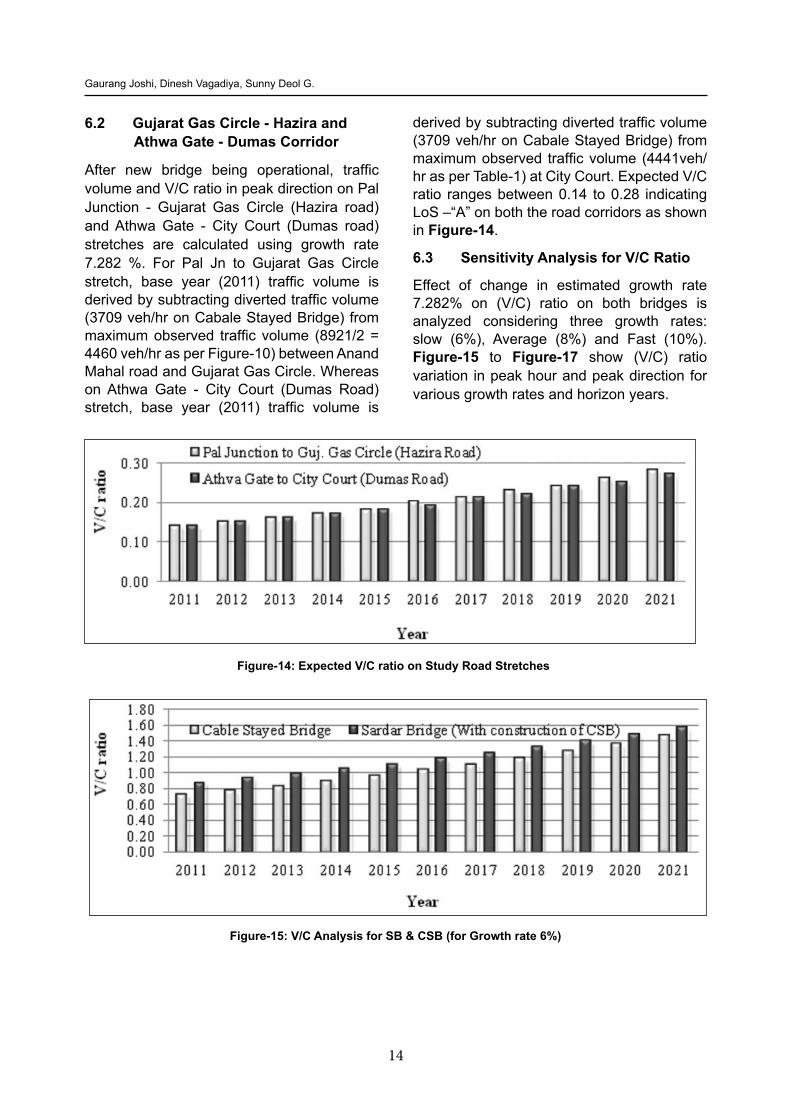
6.2 Gujarat Gas Circle - Hazira and Athwa Gate - Dumas Corridor
After new bridge being operational, traffic volume and V/C ratio in peak direction on Pal Junction - Gujarat Gas Circle (Hazira road) and Athwa Gate - City Court (Dumas road) stretches are calculated using growth rate 7.282 %. For Pal Jn to Gujarat Gas Circle stretch, base year (2011) traffic volume is derived by subtracting diverted traffic volume (3709 veh/hr on Cabale Stayed Bridge) from maximum observed traffic volume (8921/2 = 4460 veh/hr as per Figure-10) between Anand Mahal road and Gujarat Gas Circle. Whereas on Athwa Gate - City Court (Dumas Road) stretch, base year (2011) traffic volume is
derived by subtracting diverted traffic volume (3709 veh/hr on Cabale Stayed Bridge) from maximum observed traffic volume (4441veh/hr as per Table-1) at City Court. Expected V/C ratio ranges between 0.14 to 0.28 indicating LoS –“A” on both the road corridors as shown in Figure-14.
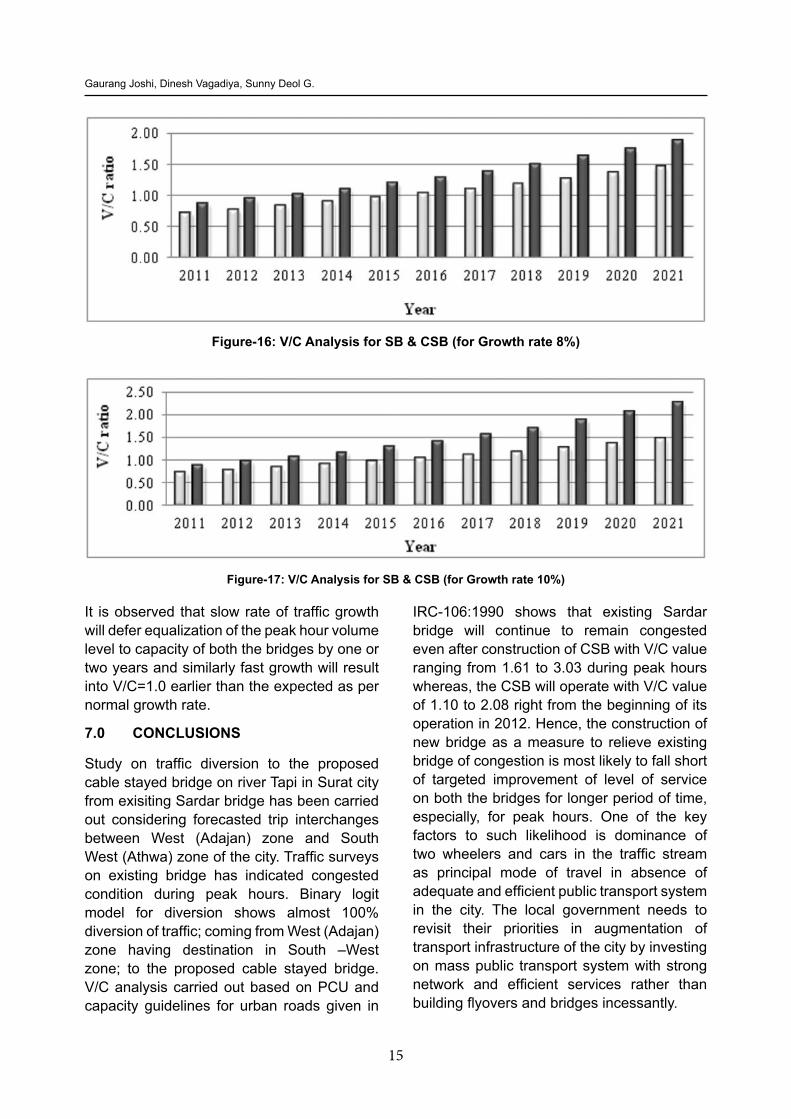
6.3 Sensitivity Analysis for V/C Ratio
Effect of change in estimated growth rate 7.282% on (V/C) ratio on both bridges is analyzed considering three growth rates: slow (6%), Average (8%) and Fast (10%). Figure-15 to Figure-17 show (V/C) ratio variation in peak hour and peak direction for various growth rates and horizon years.
Figure-15: V/C Analysis for SB & CSB (for Growth rate 6%)
15
Gaurang Joshi, Dinesh Vagadiya, Sunny Deol G.
Figure-16: V/C Analysis for SB & CSB (for Growth rate 8%)
Figure-17: V/C Analysis for SB & CSB (for Growth rate 10%)
It is observed that slow rate of traffic growth will defer equalization of the peak hour volume level to capacity of both the bridges by one or two years and similarly fast growth will result into V/C=1.0 earlier than the expected as per normal growth rate.
7.0 CONCLUSIONS
Study on traffic diversion to the proposed cable stayed bridge on river Tapi in Surat city from exisiting Sardar bridge has been carried out considering forecasted trip interchanges between West (Adajan) zone and South West (Athwa) zone of the city. Traffic surveys on existing bridge has indicated congested condition during peak hours. Binary logit model for diversion shows almost 100% diversion of traffic; coming from West (Adajan) zone having destination in South –West zone; to the proposed cable stayed bridge. V/C analysis carried out based on PCU and capacity guidelines for urban roads given in
IRC-106:1990 shows that existing Sardar bridge will continue to remain congested even after construction of CSB with V/C value ranging from 1.61 to 3.03 during peak hours whereas, the CSB will operate with V/C value of 1.10 to 2.08 right from the beginning of its operation in 2012. Hence, the construction of new bridge as a measure to relieve existing bridge of congestion is most likely to fall short of targeted improvement of level of service on both the bridges for longer period of time, especially, for peak hours. One of the key factors to such likelihood is dominance of two wheelers and cars in the traffic stream as principal mode of travel in absence of adequate and efficient public transport system in the city. The local government needs to revisit their priorities in augmentation of transport infrastructure of the city by investing on mass public transport system with strong network and efficient services rather than building flyovers and bridges incessantly.
16
Gaurang Joshi, Dinesh Vagadiya, Sunny Deol G.
REFERENCES1. Khisty, C. J., Lal, B.K. (2008). “Transportation
Engineering - An Introduction”, Prentice-Hall of IndiaPvt. Ltd., New Delhi, pp 533-534.
2. Papacostas, C. S., Prevedouros, P.D.(2009). “Transportation Engineering and Planning”, Prentice-Hall of India Pvt. Ltd., New Delhi, pp 416-418.
3. Joshi, G. J. (2006). “Spatial Household Growth and Urbal Travel Demand Study with reference to a Metropolitan city in Gujarat through Fuzzy- Neuro Simulation”, Ph.D Thesis.
4. IRC: 106-1990, “Guidelines for Capacity of Urban Roads in Plain Areas”, Indian Road Congress, New Delhi.
5. NCHRP Report-365. (1998).“Travel Estimation Techniques for Urban Planning”, Transportation Research Board, Washington, D. C., pp 94-95.
6. Sardar Vallabhbhai National Institute of Technology. (2011). “Study of Public Transport operation in CBD corridor”, Project report of MTech (TE&P) Students, SVNIT, Surat.
7. www.suratmunicipal.org accessed on 8-10-2011.
URBAN TRANSPORTJOURNAL
Vol. 12 No. 1, Aug. 2013
EVALUATION OF TRAFFIC SYSTEM MANAGEMENT MEASURES USING MICROSCOPIC MULTI MODAL SIMULATION
Madhu Errampalli*, Ravinder Kayitha**
Abstract: Due to rapid increase of the mobility needs the travel demand is increasing rapidly in urban centers which are unable to widen the roads due to scarcity of land leaving the traffic planner/ traffic police/ local agencies the only option to use the existing road network efficiently with help of various options of Traffic System Management Measures (TSM).It is not possible to implement these various measures physically on the ground for evaluation to arrive the best possible TSM because of the heavy traffic on plying on the ground and inconvenience to the road users. Therefore any TSM measures options before implementing on the ground are to be tested using simulation practical implementation. In this paper Port Blair City road network is considered for testing the eight TSM options using VISSIM 5.4 (Microscopic Multi Modal Simulation) software and evaluated in term of the travel time, delay and speeds. Based on the above results the best TSM option was selected for Port Blair city.
Keywords: Traffic System Management (TSM), Measures, Microscopic Multi Modal Simulation, Calibration, Evaluation
1.0 INTRODUCTION
According to the 2011 census of India, India has a total population of 1210 millions of which 377 millions(i.e. 31%) lives in urban areas; as compared with 28% population living in urban areas in 2001. The percentage decadal growth rate of population in urban areas has almost been steady in the last two decades with 31.2% from 1991 – 2001 and 32.3% from 2001 – 2011. The urban population in India has witnessed a significant growth from 62 million in 1951 to 285 million in 2001 to 377 millions in 2011.And it has been estimated that it would grow upto 540 million by the year 2021. In terms of percentage, the urban population has gone up from 17% in 1951 to 28% in 2001 and 31% in 2011 and it is expected that it would increase up to around 37% by the year 2021.
The number of towns has increased from 5161 in 2001 to 7935 in 2011. In 1951, there were only five metropolitan cities (with population over 1 million), i.e. Kolkata, Mumbai, Chennai, Hyderabad, and Delhi. This number increased
to 12 in 1981, 35 in 2001 and 50 in 2011. Their share in urban population increased from 18.9% in 1951 to 27.7% in 1981 to 37.8% in 2001 and to 42.3% in 2011. By 2001, all the original five metropolitan cities had grown to population of over 5 million, with Bengaluru joining them.
Though these figures sound alarming, but if compared to other developing countries of the world, India is slow to urbanize, for example, China has 45% urban population, Indonesia – 54%, Mexico – 78%, and Brazil – 87% urban population. But differences in the definition of urban also contribute to India’s low level of urbanization. Rapid growth of urban areas can be attributed to two factors: a natural increase in population (excess of births over deaths) and migration to urban areas. Today the movement of people from rural to urban areas is more significant reason for urbanization. In order to make room for large migration from rural areas to higher productive sectors in urban areas while maintaining the liveability of these urban areas, the cities of India will have to provide a receptive environment for
* Principal Scientist, CSIR-Central Road Research Institute, New Delhi, India, 110025, E-mail: [email protected]** Senior Scientist, CSIR-Central Road Research Institute, New Delhi, India,110025, E-mail:[email protected]
18
Madhu Errampalli, Ravinder Kayitha
innovation and productivity enhancement which can foster growth of the Indian economy.The skewed distribution of the urban population towards major cities is a matter of concern to the planners and administrators of urban infrastructure.
This heavy concentration of population in a few centres has resulted in the expansion of cities in density as well as area. However at the urban centres, due to rapid increase of the mobility needs the travel demand is increasing rapidly however at the urban centers where the widening of the roads is not possible due to scarcity of land. The traffic planner/ traffic police/ local agencies should use the existing road network efficiently to operate the traffic with help of various options of Traffic System Management Measures (TSM). It is not possible to implement these various measures physically on the ground for evaluation to arrive the best possible TSM because of the heavy traffic on plying on the ground and inconvenience to the road users.
Therefore any TSM measures options before implementing on the ground need to be are tested using the VISSIM 5.40 (Microscopic Multi Modal Simulation) Software adopting for the practical implementation.
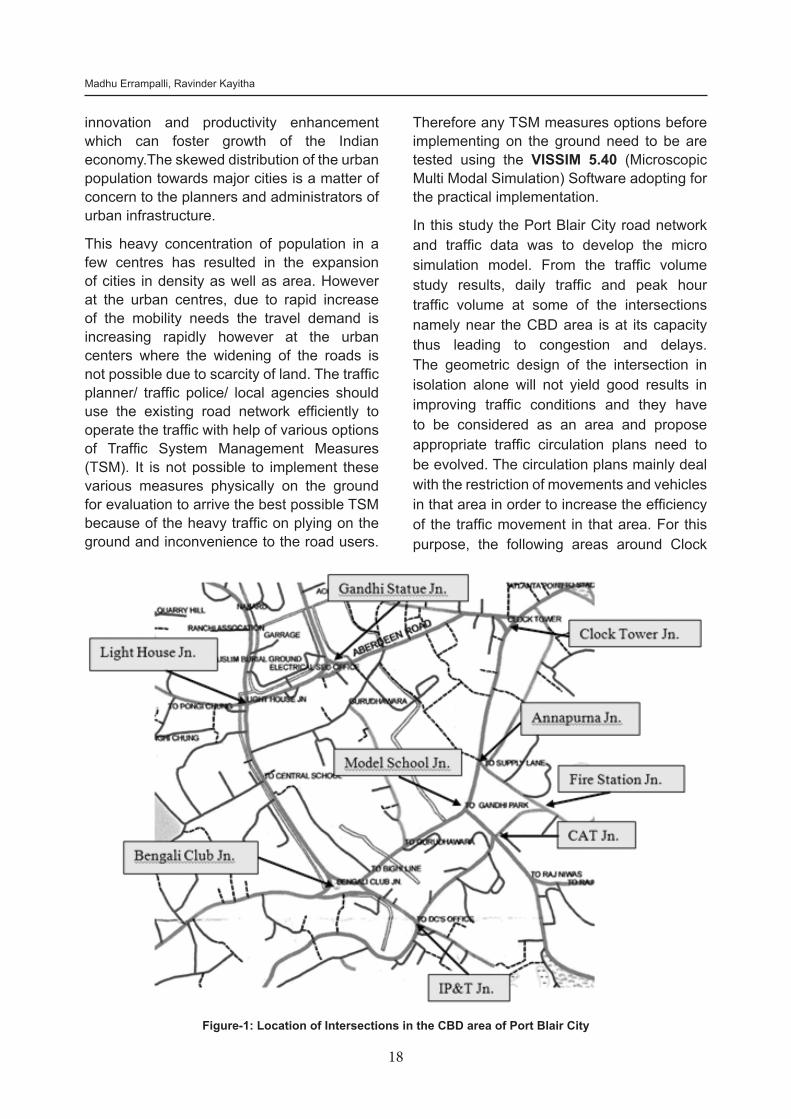
In this study the Port Blair City road network and traffic data was to develop the micro simulation model. From the traffic volume study results, daily traffic and peak hour traffic volume at some of the intersections namely near the CBD area is at its capacity thus leading to congestion and delays. The geometric design of the intersection in isolation alone will not yield good results in improving traffic conditions and they have to be considered as an area and propose appropriate traffic circulation plans need to be evolved. The circulation plans mainly deal with the restriction of movements and vehicles in that area in order to increase the efficiency of the traffic movement in that area. For this purpose, the following areas around Clock
Figure-1: Location of Intersections in the CBD area of Port Blair City
19
Evaluation of Traffic System Management Measures using Microscopic Multi Modal Simulation
Tower Area (include Clock Tower Jn, Light House Jn, Gandhi Statue Jn, Bengali Club Jn, Model School Jn, IP&T Jn)are selected as shown in Figure-1 for implementing TSM measures.
2.0 OBJECTIVES
Evaluation of various Traffic System Management Measures using the Microscopic Multi Modal Simulation (VISSIM 5.40) for Central Business District (CBD) area.
3.0 MICROSCOPIC TRAFFIC SIMULATION TECHNIQUE
As can be seen from the above, the CBD area is going to involve about 9 intersections, it is appropriate that the circulation plans are proposed to be evaluated with simulation models. In view of the need to improve traffic conditions in the CBD area of Port Blair city road network it is proposed to develop microscopic traffic simulation model to evaluate circulation plans. For this purpose following tasks are carried out:
• Develop existing road network in VISSIM
and validate the simulation model comparing the observed data
• Simulate the vehicular movements under different TSM measures and select best options to improve the traffic flow conditions on the road network of Port Blair city.
For this purpose, VISSIM 5.40 (Microscopic Multi Modal Simulation) Software has been utilised to simulate the vehicular movements for peak hours (i.e. 7:00 ASM to 12:00 Noon). To achieve the objective of developing simulation model the following steps are carried out.
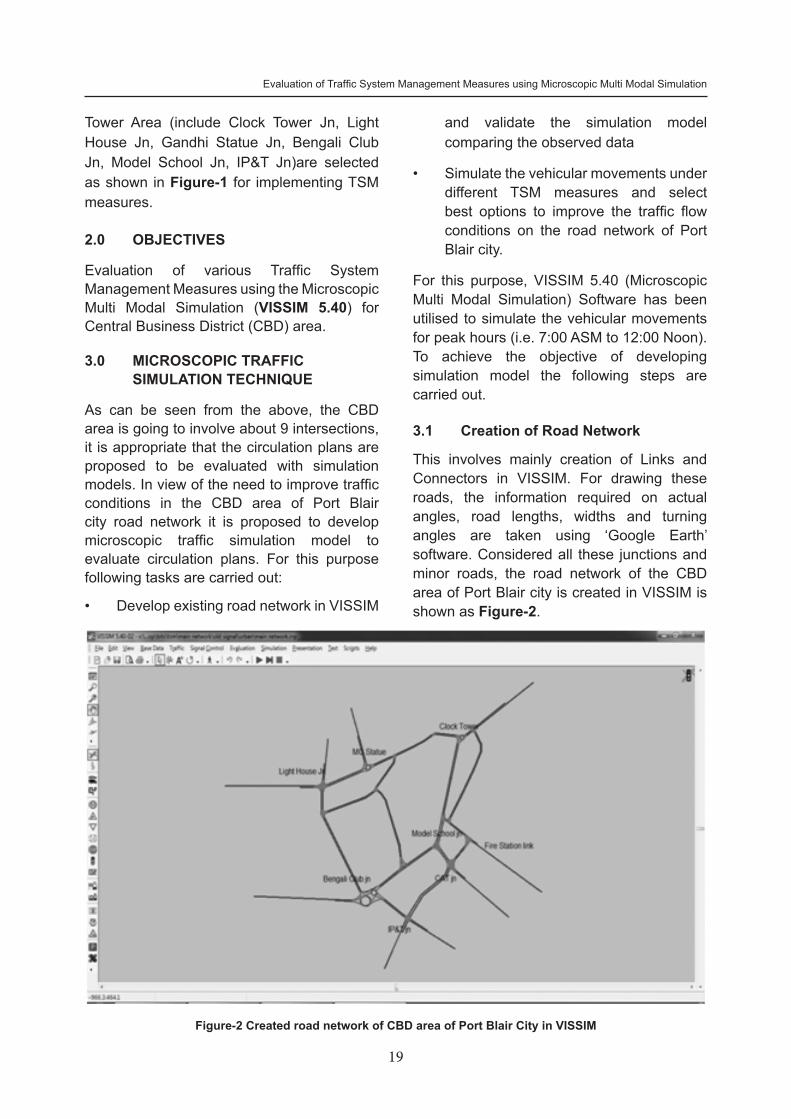
3.1 Creation of Road Network
This involves mainly creation of Links and Connectors in VISSIM. For drawing these roads, the information required on actual angles, road lengths, widths and turning angles are taken using ‘Google Earth’ software. Considered all these junctions and minor roads, the road network of the CBD area of Port Blair city is created in VISSIM is shown as Figure-2.
Figure-2 Created road network of CBD area of Port Blair City in VISSIM
20
Madhu Errampalli, Ravinder Kayitha
3.2 Routing Decisions and Turning Ratios at Intersections
Routing Decisions are provided at an intersection i.e. wherever two links are connected. Routing decisions for all the five major junctions within the CBD area of Port Blair City are given on the basis of traffic survey results. whereas at other intersections, routing decisions are appropriately considered based upon importance of intersecting roads. These decisions are basically the ratios in which vehicles turn in different possible directions. For each hour different ratios are given for surveyed intersections whereas for others, a single value is assumed
3.3 TrafficVolumeData
In the network of CBD of Port Blair City, vehicle input has been given at 9 links and this input is given in two steps: Hourly Volume and Vehicle Composition. Vehicle composition defines the ratios of different types of vehicle in the given volume. The types of vehicles considered in this study are - car, two wheeler, auto, bus, mini bus, light commercial vehicle (LCV), two axle trucks (HGV) and multi axle trucks (MCV). For each time period, different vehicle composition has been given as input in VISSIM. These inputs are given on the basis of traffic survey results.
3.4 Implementation of Signals
Though there are traffic signals existing at some intersections, they are not in operation in Port Blair city. The traffic is manually controlled at all the intersections by traffic police. As Gandhi Statue junction, Bengali Club junction and Clock Tower junctions are rotaries, there is no signal or manual control of traffic at these junctions.
In order to simulate such manual control at the intersections, fixed time control signal is considered with green time calculated using traffic volume entering into intersection through that approach road. As green time would be different for entire hour, average green time is used for approach at intersection.
IP&T junction, Model School junction and Light House junction have been assumed as 120 sec cycle time with inter-green time of 4 sec (2 sec amber and 2 sec all red) for each cycle. At CAT junction 90 sec cycle time is used and green time for each approach of each intersection.
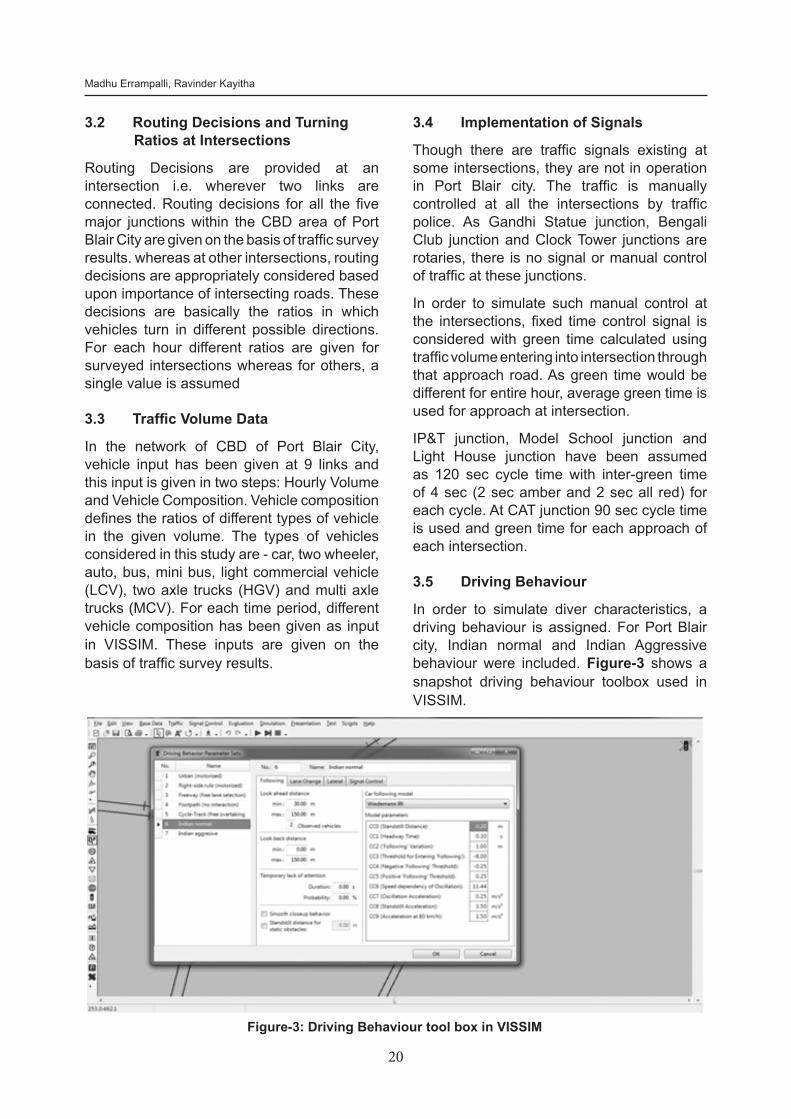
3.5 Driving Behaviour
In order to simulate diver characteristics, a driving behaviour is assigned. For Port Blair city, Indian normal and Indian Aggressive behaviour were included. Figure-3 shows a snapshot driving behaviour toolbox used in VISSIM.
Figure-3: Driving Behaviour tool box in VISSIM
21
Evaluation of Traffic System Management Measures using Microscopic Multi Modal Simulation
3.6 Calibration & Validation of Model
In order to simulate diver characteristics, a driving behaviour is assigned. For Port Blair city, Indian normal and Indian Aggressive behaviour were included. Figure-3 shows a snapshot driving behaviour toolbox used in VISSIM. Calibration and validation procedure is used in VISSIM to signify the similarity between existing and simulated conditions of the vehicular movements in Port Blair city road network. To achieve validation in range of permissible error, various trials are done by appropriately changing the assumptions and parameter values in the VISSIM. In order to validate the developed simulation network, the travel speed is utilised as an evaluation parameter. For this purpose, the observed travel speeds in following travel time sections are utilised:
• Light House Junction Side A to Bengali Club Junction Side B
• Bengali Club Junction Side B to Model School Junction Side C
• Light House junction Side D to Clock Tower Junction Side B
• Clock Tower Junction Side B to IP&T Junction Side C
(Side A, B, C and D represents North, East, South and West Approach roads of intersection respectively)
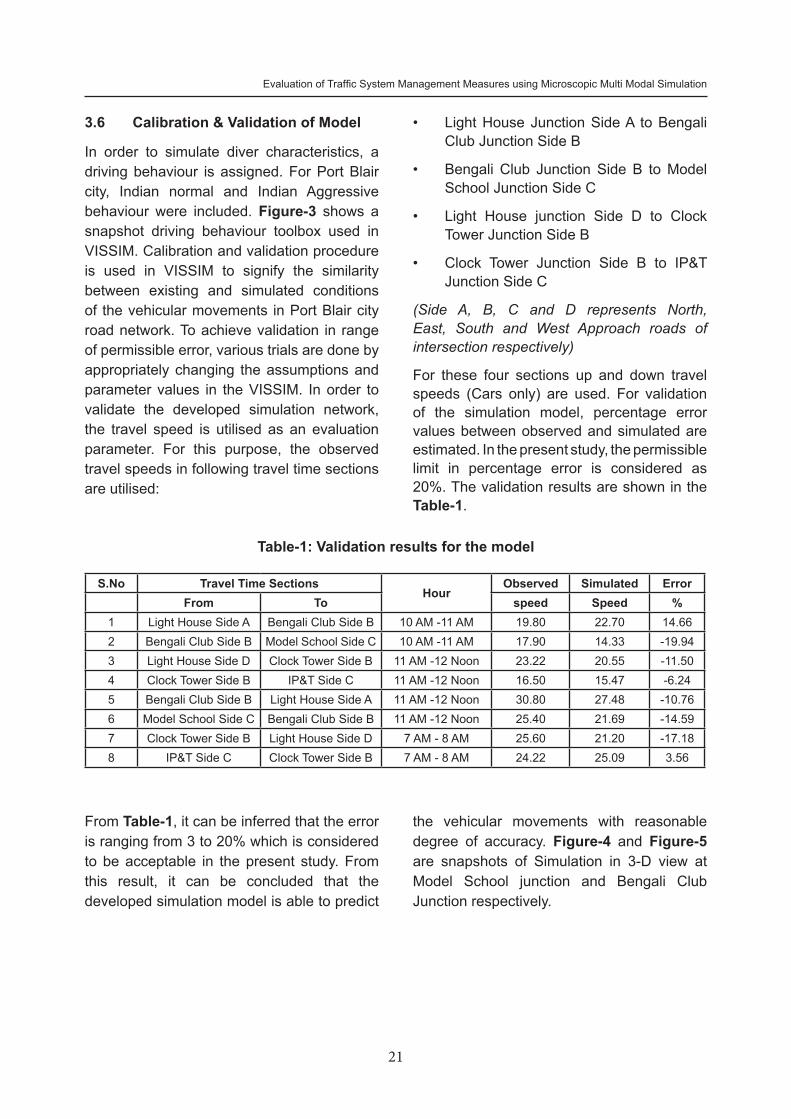
For these four sections up and down travel speeds (Cars only) are used. For validation of the simulation model, percentage error values between observed and simulated are estimated. In the present study, the permissible limit in percentage error is considered as 20%. The validation results are shown in the Table-1.
Table-1: Validation results for the model
S.No Travel Time SectionsHour
Observed Simulated ErrorFrom To speed Speed %
1 Light House Side A Bengali Club Side B 10 AM -11 AM 19.80 22.70 14.662 Bengali Club Side B Model School Side C 10 AM -11 AM 17.90 14.33 -19.943 Light House Side D Clock Tower Side B 11 AM -12 Noon 23.22 20.55 -11.504 Clock Tower Side B IP&T Side C 11 AM -12 Noon 16.50 15.47 -6.245 Bengali Club Side B Light House Side A 11 AM -12 Noon 30.80 27.48 -10.766 Model School Side C Bengali Club Side B 11 AM -12 Noon 25.40 21.69 -14.597 Clock Tower Side B Light House Side D 7 AM - 8 AM 25.60 21.20 -17.188 IP&T Side C Clock Tower Side B 7 AM - 8 AM 24.22 25.09 3.56
From Table-1, it can be inferred that the error is ranging from 3 to 20% which is considered to be acceptable in the present study. From this result, it can be concluded that the developed simulation model is able to predict
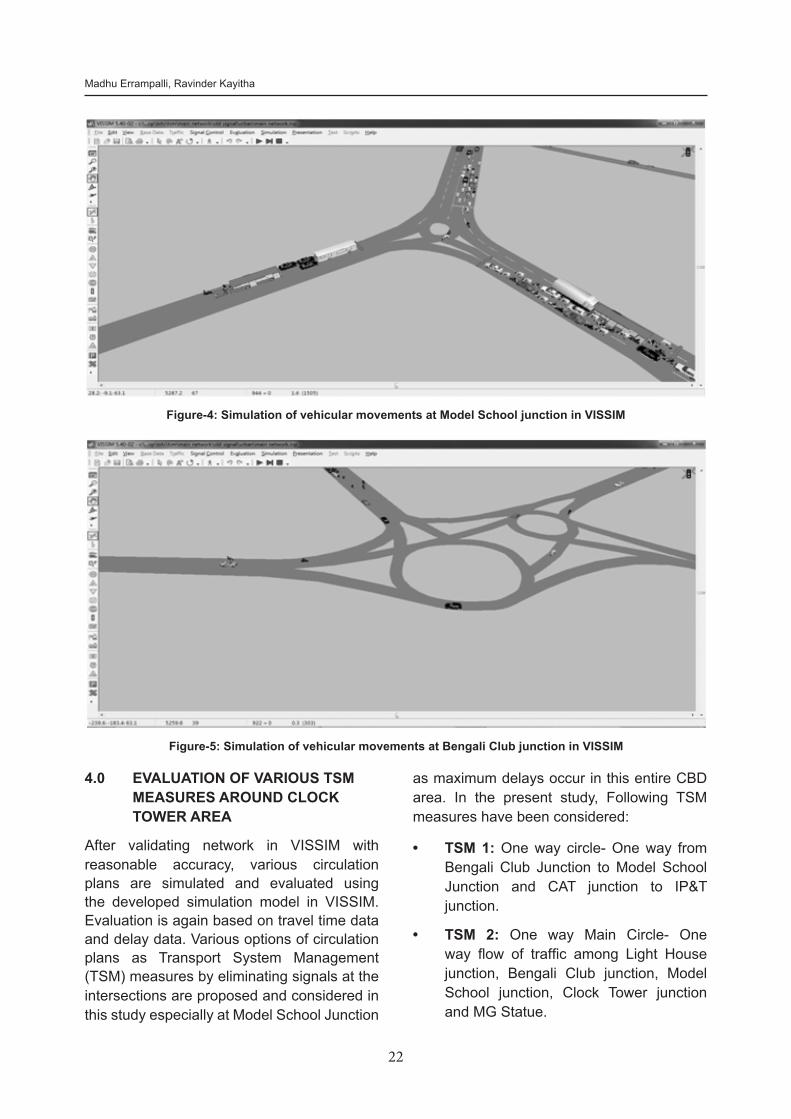
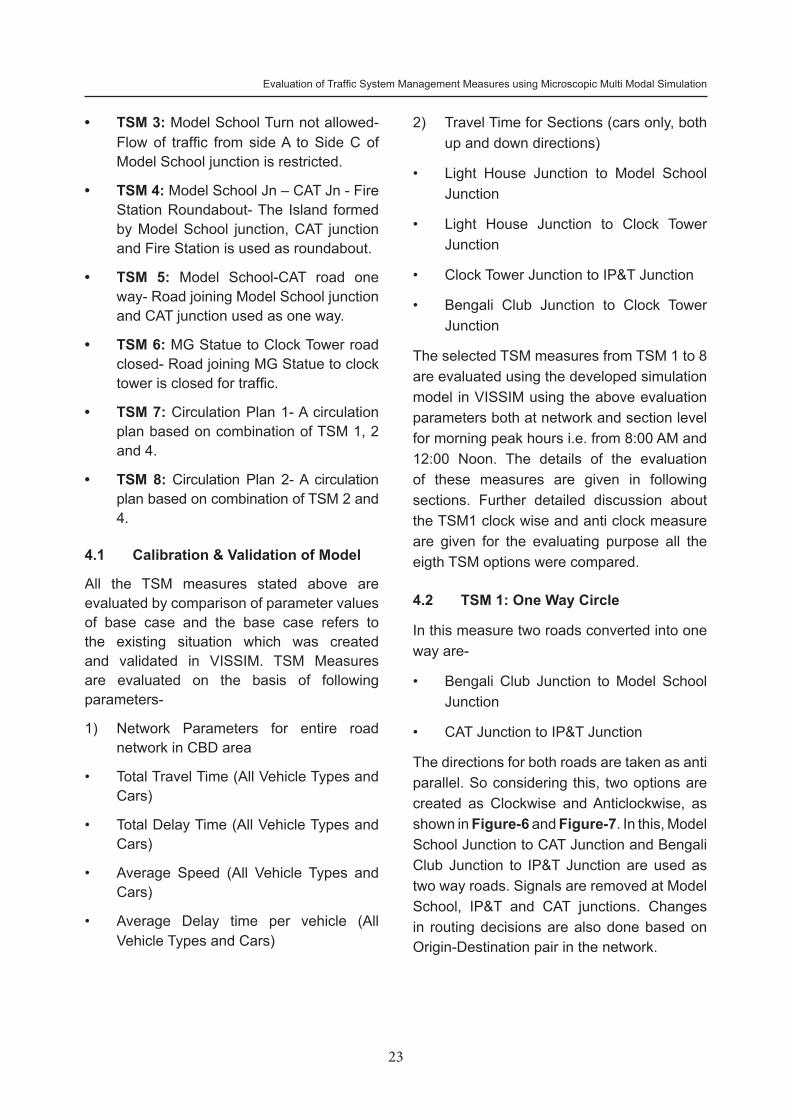
the vehicular movements with reasonable degree of accuracy. Figure-4 and Figure-5 are snapshots of Simulation in 3-D view at Model School junction and Bengali Club Junction respectively.
22
Madhu Errampalli, Ravinder Kayitha
4.0 EVALUATION OF VARIOUS TSM MEASURES AROUND CLOCK TOWER AREA
After validating network in VISSIM with reasonable accuracy, various circulation plans are simulated and evaluated using the developed simulation model in VISSIM. Evaluation is again based on travel time data and delay data. Various options of circulation plans as Transport System Management (TSM) measures by eliminating signals at the intersections are proposed and considered in this study especially at Model School Junction
as maximum delays occur in this entire CBD area. In the present study, Following TSM measures have been considered:
• TSM 1: One way circle- One way from Bengali Club Junction to Model School Junction and CAT junction to IP&T junction.
• TSM 2: One way Main Circle- One way flow of traffic among Light House junction, Bengali Club junction, Model School junction, Clock Tower junction and MG Statue.
Figure-4: Simulation of vehicular movements at Model School junction in VISSIM
Figure-5: Simulation of vehicular movements at Bengali Club junction in VISSIM
23
Evaluation of Traffic System Management Measures using Microscopic Multi Modal Simulation
• TSM 3: Model School Turn not allowed- Flow of traffic from side A to Side C of Model School junction is restricted.
• TSM 4: Model School Jn – CAT Jn - Fire Station Roundabout- The Island formed by Model School junction, CAT junction and Fire Station is used as roundabout.
• TSM 5: Model School-CAT road one way- Road joining Model School junction and CAT junction used as one way.
• TSM 6: MG Statue to Clock Tower road closed- Road joining MG Statue to clock tower is closed for traffic.
• TSM 7: Circulation Plan 1- A circulation plan based on combination of TSM 1, 2 and 4.
• TSM 8: Circulation Plan 2- A circulation plan based on combination of TSM 2 and 4.
4.1 Calibration & Validation of Model
All the TSM measures stated above are evaluated by comparison of parameter values of base case and the base case refers to the existing situation which was created and validated in VISSIM. TSM Measures are evaluated on the basis of following parameters-
1) Network Parameters for entire road network in CBD area
• Total Travel Time (All Vehicle Types and Cars)
• Total Delay Time (All Vehicle Types and Cars)
• Average Speed (All Vehicle Types and Cars)
• Average Delay time per vehicle (All Vehicle Types and Cars)
2) Travel Time for Sections (cars only, both up and down directions)
• Light House Junction to Model School Junction
• Light House Junction to Clock Tower Junction
• Clock Tower Junction to IP&T Junction
• Bengali Club Junction to Clock Tower Junction
The selected TSM measures from TSM 1 to 8 are evaluated using the developed simulation model in VISSIM using the above evaluation parameters both at network and section level for morning peak hours i.e. from 8:00 AM and 12:00 Noon. The details of the evaluation of these measures are given in following sections. Further detailed discussion about the TSM1 clock wise and anti clock measure are given for the evaluating purpose all the eigth TSM options were compared.
4.2 TSM 1: One Way Circle
In this measure two roads converted into one way are-
• Bengali Club Junction to Model School Junction
• CAT Junction to IP&T Junction
The directions for both roads are taken as anti parallel. So considering this, two options are created as Clockwise and Anticlockwise, as shown in Figure-6 and Figure-7. In this, Model School Junction to CAT Junction and Bengali Club Junction to IP&T Junction are used as two way roads. Signals are removed at Model School, IP&T and CAT junctions. Changes in routing decisions are also done based on Origin-Destination pair in the network.
24
Madhu Errampalli, Ravinder Kayitha
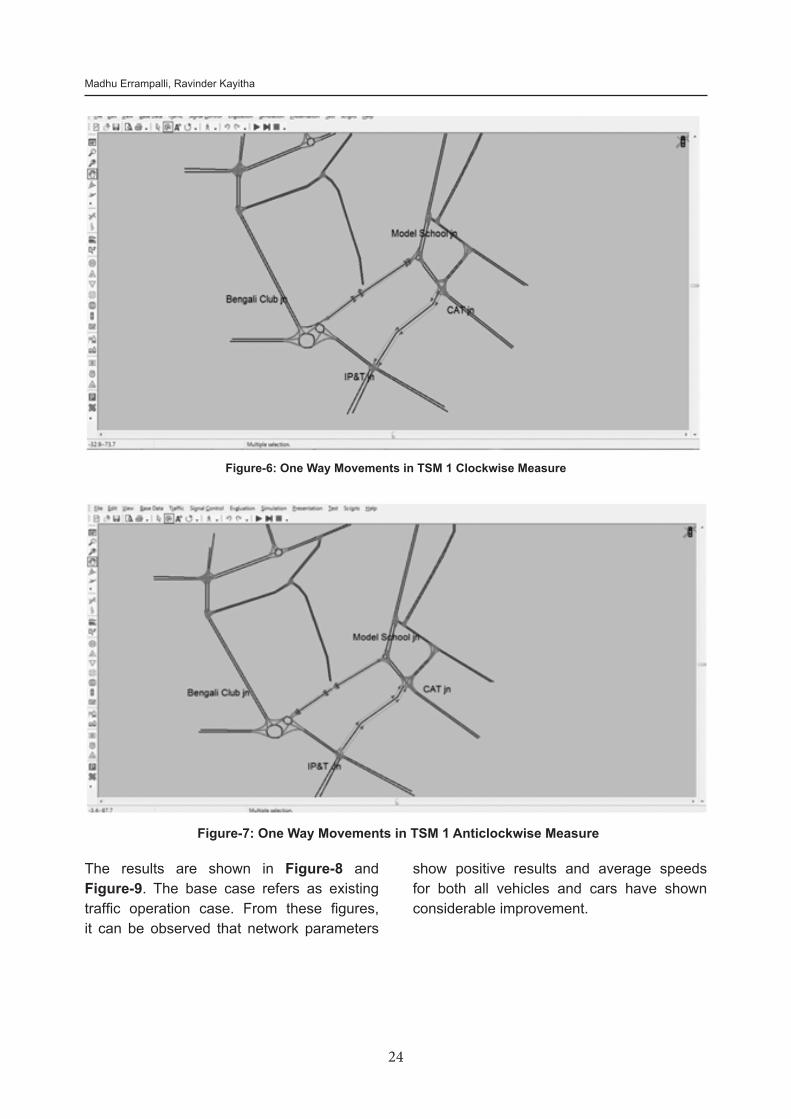
Figure-6: One Way Movements in TSM 1 Clockwise Measure
Figure-7: One Way Movements in TSM 1 Anticlockwise Measure
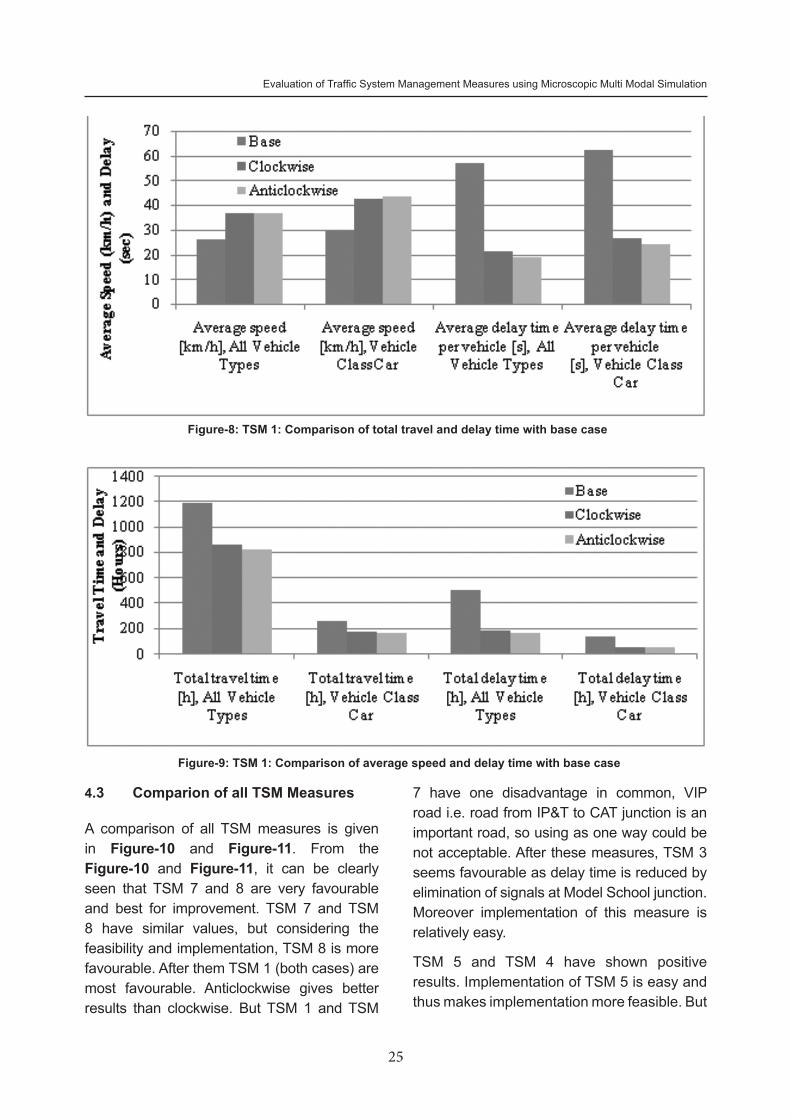
The results are shown in Figure-8 and Figure-9. The base case refers as existing traffic operation case. From these figures, it can be observed that network parameters
show positive results and average speeds for both all vehicles and cars have shown considerable improvement.
25
Evaluation of Traffic System Management Measures using Microscopic Multi Modal Simulation
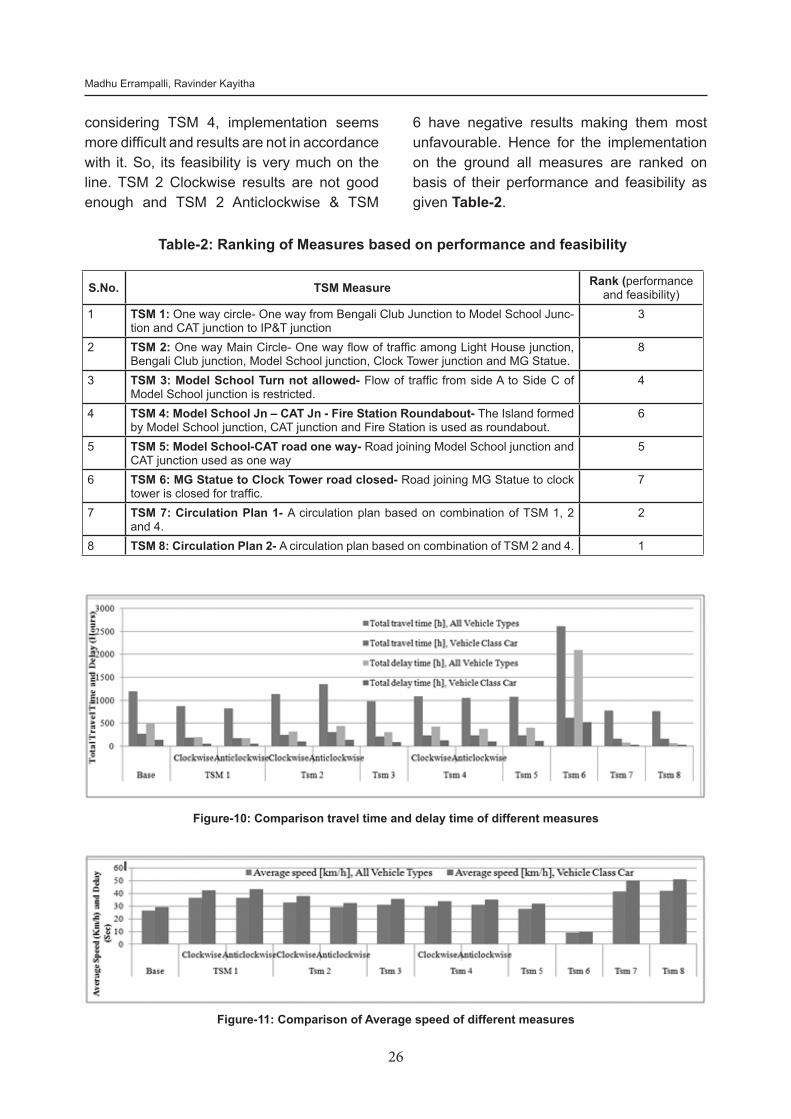
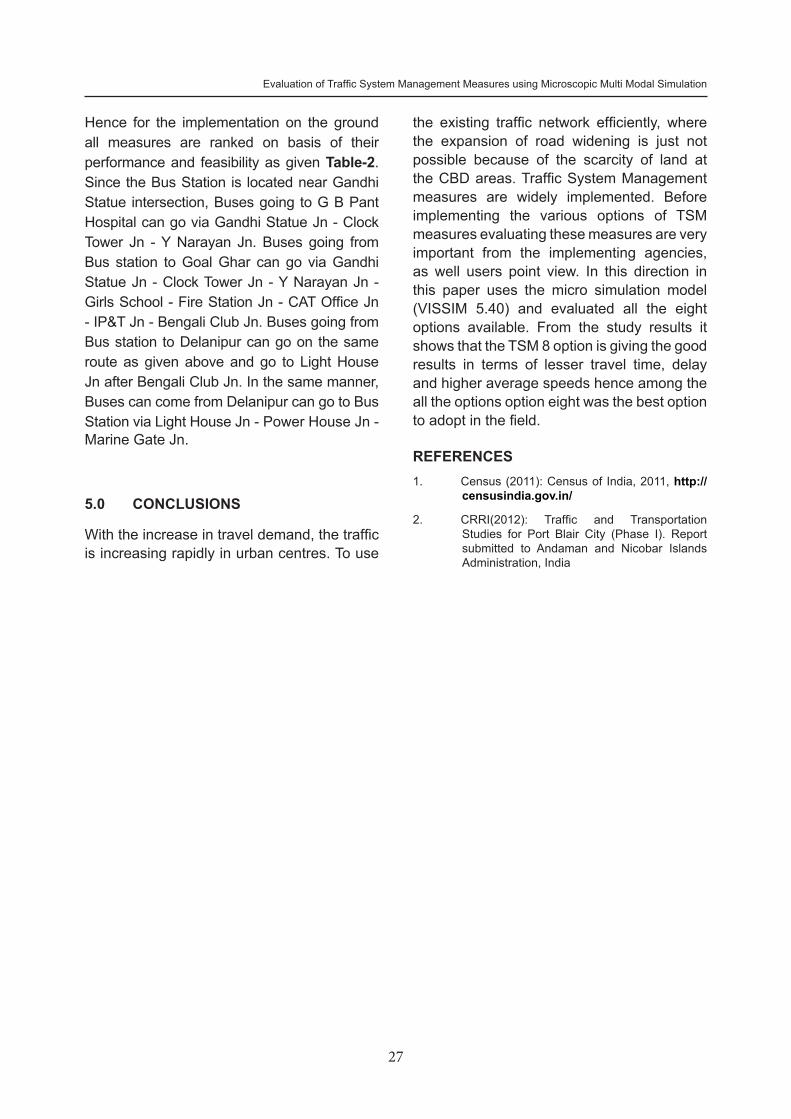
4.3 Comparion of all TSM Measures
A comparison of all TSM measures is given in Figure-10 and Figure-11. From the Figure-10 and Figure-11, it can be clearly seen that TSM 7 and 8 are very favourable and best for improvement. TSM 7 and TSM 8 have similar values, but considering the feasibility and implementation, TSM 8 is more favourable. After them TSM 1 (both cases) are most favourable. Anticlockwise gives better results than clockwise. But TSM 1 and TSM
Figure-8: TSM 1: Comparison of total travel and delay time with base case
Figure-9: TSM 1: Comparison of average speed and delay time with base case
7 have one disadvantage in common, VIP road i.e. road from IP&T to CAT junction is an important road, so using as one way could be not acceptable. After these measures, TSM 3 seems favourable as delay time is reduced by elimination of signals at Model School junction. Moreover implementation of this measure is relatively easy.
TSM 5 and TSM 4 have shown positive results. Implementation of TSM 5 is easy and thus makes implementation more feasible. But
26
Madhu Errampalli, Ravinder Kayitha
Figure-10: Comparison travel time and delay time of different measures
considering TSM 4, implementation seems more difficult and results are not in accordance with it. So, its feasibility is very much on the line. TSM 2 Clockwise results are not good enough and TSM 2 Anticlockwise & TSM
6 have negative results making them most unfavourable. Hence for the implementation on the ground all measures are ranked on basis of their performance and feasibility as given Table-2.
Figure-11: Comparison of Average speed of different measures
Table-2: Ranking of Measures based on performance and feasibility
S.No. TSM Measure Rank (performance and feasibility)
1 TSM 1: One way circle- One way from Bengali Club Junction to Model School Junc-tion and CAT junction to IP&T junction
3
2 TSM 2: One way Main Circle- One way flow of traffic among Light House junction, Bengali Club junction, Model School junction, Clock Tower junction and MG Statue.
8
3 TSM 3: Model School Turn not allowed- Flow of traffic from side A to Side C of Model School junction is restricted.
4
4 TSM 4: Model School Jn – CAT Jn - Fire Station Roundabout- The Island formed by Model School junction, CAT junction and Fire Station is used as roundabout.
6
5 TSM 5: Model School-CAT road one way- Road joining Model School junction and CAT junction used as one way
5
6 TSM 6: MG Statue to Clock Tower road closed- Road joining MG Statue to clock tower is closed for traffic.
7
7 TSM 7: Circulation Plan 1- A circulation plan based on combination of TSM 1, 2 and 4.
2
8 TSM 8: Circulation Plan 2- A circulation plan based on combination of TSM 2 and 4. 1
27
Evaluation of Traffic System Management Measures using Microscopic Multi Modal Simulation
Hence for the implementation on the ground all measures are ranked on basis of their performance and feasibility as given Table-2. Since the Bus Station is located near Gandhi Statue intersection, Buses going to G B Pant Hospital can go via Gandhi Statue Jn - Clock Tower Jn - Y Narayan Jn. Buses going from Bus station to Goal Ghar can go via Gandhi Statue Jn - Clock Tower Jn - Y Narayan Jn - Girls School - Fire Station Jn - CAT Office Jn - IP&T Jn - Bengali Club Jn. Buses going from Bus station to Delanipur can go on the same route as given above and go to Light House Jn after Bengali Club Jn. In the same manner, Buses can come from Delanipur can go to Bus Station via Light House Jn - Power House Jn - Marine Gate Jn.
5.0 CONCLUSIONS
With the increase in travel demand, the traffic is increasing rapidly in urban centres. To use
the existing traffic network efficiently, where the expansion of road widening is just not possible because of the scarcity of land at the CBD areas. Traffic System Management measures are widely implemented. Before implementing the various options of TSM measures evaluating these measures are very important from the implementing agencies, as well users point view. In this direction in this paper uses the micro simulation model (VISSIM 5.40) and evaluated all the eight options available. From the study results it shows that the TSM 8 option is giving the good results in terms of lesser travel time, delay and higher average speeds hence among the all the options option eight was the best option to adopt in the field.
REFERENCES1. Census (2011): Census of India, 2011, http://
censusindia.gov.in/
2. CRRI(2012): Traffic and Transportation Studies for Port Blair City (Phase I). Report submitted to Andaman and Nicobar Islands Administration, India

URBAN TRANSPORTJOURNAL
Vol. 12 No. 1, Aug. 2013
A COMPOSITE INDEX TO MEASURE THE PERCEIVED INADEQUACY OF PUBLIC TRANSPORTATION
Krishna N. S. Behara*, Shriniwas S. Arkatkar**, Ashoke K. Sarkar***
Abstract: The increased social and economic status of the residents has encouraged the commuters to own personalized mode of transport. In spite of efforts put forward by the Government in providing better service facilities in terms of providing Low-Floor buses and BRT systems, the public perceptions still remain the same considering the private vehicle as the better mode than the Public Transit. In order to assess this situation, a revealed preference (RP) data (116 samples) was collected in Malviya Nagar residential area of Jaipur city situated in India to observe the commuter’s perceptions on both the modes of transportation. The adequacy/inadequacy of both the modes (public and private mode of transportation) was measured using four different factors such as acceptability (individual characteristics), availability (frequency of service), affordability (socio-economic characteristics) and accessibility (travel time and distance). It was observed that overall Composite Score for public transport was far less than that of private mode of transport. Although Low-floor buses are providing good service to the public of this residential area, still the percentage of commuters using public transportation is less. The access distance till the bus stops is one of the primary reasons besides what they perceive about the service.
Keywords: Public Transportation, Satisfaction Levels, User’s Perceptions, Fuzzy Logic, Composite Index
1. INTRODUCTION
India’s transportation sector has not been able to keep pace with rising demand and is proving to be a drag on the economy (World Bank, 2012). Major improvements in the sector are therefore required to support the country’s continued economic growth and to reduce poverty. Many projects in sustainable transportation sector have been started in this regard to overcome the overwhelming crisis. Public Transportation plays a key role in Sustainable Transportation sector. More the public transit stops are accessible; the more is the visibility of public transportation. This enhances accessibility to the destinations through public transportation. Accessibility is better enhanced by the facilities provided to the pedestrians in both reaching and waiting at the transit stop locations. Although walking distance is the important parameter, but
walking and waiting ambience definitely have their share in inclining a user’s view towards public transit.
Indian cities are built for walking and cycling (CAI Asia, 2011). However, rapid motorization combined with limited attention to pedestrian facilities has inadvertently resulted in a decrease in the overall mode share for non-motorized transport. The perception of one individual user about public transportation is always different from that of the other user. Those who are using Public Transportation have a perception different from those who are not using or never tried. The perceptions they carry certainly make them to think of shifting towards private modes as rightly said by Ajzen, ‘“attitude toward the behavior,” “subjective norm,” and “perceived behavioral control” lead to the formation of a “behavioral intention”’. Thus a methodology is needed
* M.E., Birla Institute of Technology & Science, Pilani, email: [email protected]** Assistant Professor, Birla Institute of Technology & Science, email: [email protected]*** Professor, Birla Institute of Technology & Science, email: [email protected]
29
A Composite Index to Measure The Perceived Inadequacy of Public Transportation
which can quantify the user’s perception while walking; waiting at the bus stops and also while travelling within the transit unit.
The purpose of the study is to quantify the user’s perceptions towards the public transit service as well as the usage of private vehicles. Even the private mode of transportation has environmental variables associated with it, which contributes towards its disutility. They could be, in-vehicle travel time, walking ambience, waiting time at the bus stops, traffic volume and congestion etc. The perception he/she carries along with him/her could be the only reason for any action to be taken. A behavioral action is dependent on the attitude of the person besides the subjective parameters as well as the control variables.
Understanding the behavioral intention of public transport passenger is important, because favorable behavioral intention lead to customer loyalty, which plays a crucial role for success and survival of the service firm (Wen et al. 2005; Lai and Chen, 2010). Sumaedi et al. (2012) addresses satisfaction, service value, service quality, and perceived sacrifice as variables affecting the para-transit passengers’ behavioral intentions in Jakarta city. It is shown that the behavioral intentions are indirectly influenced by perceived value via satisfaction. Here the behavioral intention is the act of using public transit as the mode rather than using private vehicle. The inadequacy of public transportation is quantified based on users’ perceptions. A revealed preference data (116 samples) is collected in a residential area with the help of Jaipur Development Authority (JDA) in Malviya Nagar area in Jaipur city, India.
2.0 MATERIAL AND METHODS
The questionnaire consisted of four pages to collect both Household and Travel characteristics. Apart from the quantitative variables, the households were also requested to give the rating for the qualitative variables like the attributes associated with the quality of walking environment, bus stop, bus as well as
the private vehicle. The ratings (five different categories), range from ‘Excellent’ to ‘worst’. Through the revealed preference survey, the respondents were requested to tick the most appropriate option ranging from “Excellent” to “Worst” according to their perception of existing situation.
2.1 Measures of The Commuters Environment
Iseki and Taylor (2010) say, “Travel by public transit involves much more than moving about on buses and trains. A typical door-to-door trip entails walking from one’s origin to a bus stop or train station, waiting for the vehicle to arrive, boarding the vehicle, traveling in the vehicle, alighting from the vehicle, and then walking to one’s destination. Transit travelers expend a great deal of time and energy on this out-of-vehicle walking and waiting, which plays greatly into their perceived burden of transit travel.” As discussed by Sumaedi et al. (2012), behavioral intentions are indirectly influenced by perceived value via satisfaction.
The factors affecting the satisfaction of the users are thus based on the disutilities of both of the modes. Accordingly, all these factors are classified into four different categories namely acceptability, availability, affordability and accessibility. The factors which come under the above four categories are discussed below.
Acceptability:
1. Neat and cleanliness of footpaths
2. Walking space availability
3. Traffic volume
4. Availability of tree shading
5. The presence of toilets
6. Safety while walking
7. The quality of the transit stops
8. Seat availability at both the transit stops and within Public Transit
30
Krishna N. S. Behara Shriniwas S. Arkatkar, Ashoke K. Sarkar
9. Shade availability at the transit stops
10. Neat and cleanliness inside Public Transit
11. Ventilation inside Public Transit
12 Safety and Crowding inside Public Transit
13. Comfort and Convenience while driving the Private Mode of Transport
14 Maneuverability and Congestion on the road way
15. Pollution and Road Condition
16. Pedestrian Interference and Safety while driving.
Availability:
1. Waiting time at bus stop or frequency of the service and Total Walking distance
Affordability:
1. Household Income
2. Ticket cost
3. Vehicle operating cost
Accessibility:
1. In-vehicle travel time
2. Time taken in private Vehicle
Landis et al. (2007) discussed “While the qualitative measure of a pedestrian’s enjoyment of the walking experience is important to provide a complete picture of the walking environment and to design an “inviting” sidewalk, it is a separate measure of effectiveness and must be developed and calibrated, if possible, separately from the sidewalk capacity or safety perception measures.” Thus a quantitative measure of all the qualitative (subjective) parameters which a commuter experiences right from trip origin point till the trip end point is important to provide a complete picture of the environment he/she encounters to take a decision whether to use public transit or a private mode upon his/her next trip. A calibrated, transferable model is developed to objectively reflect, “The perceived safety or comfort of pedestrians
along a roadway segment” using measurable traffic and roadway variables by Landis B.W. et al. (2007). But in this article all of the variables are qualitative in the “acceptability” section. Thus a fuzzy logic approach is used to rate all the qualitative variables for each individual as a measure of satisfaction levels. But the variables are quantitative in nature for the remaining three categories (i.e. availability, affordability and accessibility).
3.0 THEORY AND CALCULATION
The data analysis is divided into four sections for quantifying acceptability, availability, affordability and accessibility independently. Fuzzy logic approach is adopted for estimating “acceptability” part while availability scores are calculated for “availability” section based on the walking and waiting times. The sections concerned with “affordability” and “accessibility” are calculated in terms of distance, cost and travel time for both the modes independently.
3.1 Acceptability
Travelling in Public Transit to reach the desired destinations is actually divided into three different sections: (i) Walking to access the bus stop from origin and destination from the bus stop, (ii) Waiting at the Bus stop, and (iii) Within the transit experience
The commuters would be dissatisfied, when the quality of the bus stop is poor, when there is no proper seating facility and shade available at the bus stops. Similarly the difficulty levels would be more when a user travels in a crowded bus, without seat availability. The person who is seated for a long time would not be so much dissatisfied than a person who has been standing for a long time. Similarly the commuters would be dissatisfied if the traffic volume, congestion and pollution levels are high. A fuzzy logic approach is used to measure the user’s dissatisfaction. Linguistic variables are used in fuzzy logic approach both for the ratings and weightages. The linguistic variables are shown in Table 1 and Table 2 below for both the ratings and weightages respectively.
31
A Composite Index to Measure The Perceived Inadequacy of Public Transportation
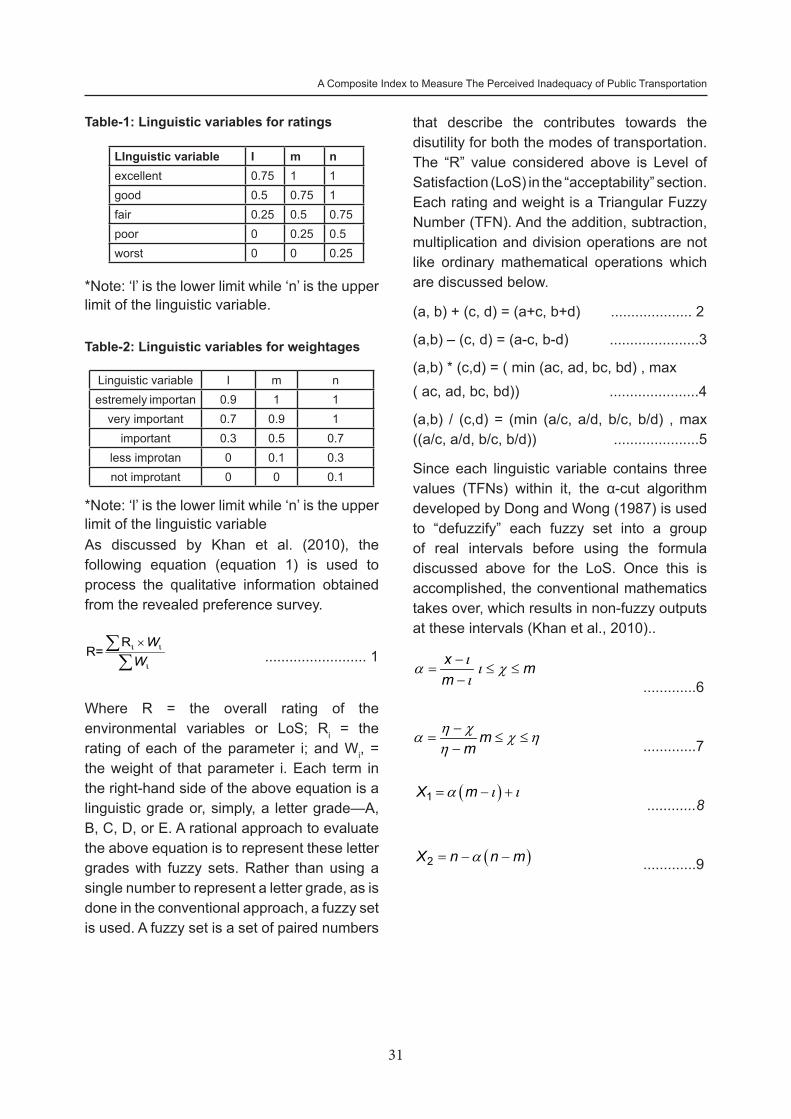
Table-1: Linguistic variables for ratings
*Note: ‘l’ is the lower limit while ‘n’ is the upper limit of the linguistic variable.
Table-2: Linguistic variables for weightages
*Note: ‘l’ is the lower limit while ‘n’ is the upper limit of the linguistic variableAs discussed by Khan et al. (2010), the following equation (equation 1) is used to process the qualitative information obtained from the revealed preference survey.
RR=
WWι ι
ι
×∑∑ ......................... 1
Where R = the overall rating of the environmental variables or LoS; Ri = the rating of each of the parameter i; and Wi, = the weight of that parameter i. Each term in the right-hand side of the above equation is a linguistic grade or, simply, a letter grade—A, B, C, D, or E. A rational approach to evaluate the above equation is to represent these letter grades with fuzzy sets. Rather than using a single number to represent a letter grade, as is done in the conventional approach, a fuzzy set is used. A fuzzy set is a set of paired numbers
that describe the contributes towards the disutility for both the modes of transportation. The “R” value considered above is Level of Satisfaction (LoS) in the “acceptability” section. Each rating and weight is a Triangular Fuzzy Number (TFN). And the addition, subtraction, multiplication and division operations are not like ordinary mathematical operations which are discussed below.
(a, b) + (c, d) = (a+c, b+d) .................... 2
(a,b) – (c, d) = (a-c, b-d) ......................3
(a,b) * (c,d) = ( min (ac, ad, bc, bd) , max( ac, ad, bc, bd)) ......................4
(a,b) / (c,d) = (min (a/c, a/d, b/c, b/d) , max ((a/c, a/d, b/c, b/d)) .....................5
Since each linguistic variable contains three values (TFNs) within it, the α-cut algorithm developed by Dong and Wong (1987) is used to “defuzzify” each fuzzy set into a group of real intervals before using the formula discussed above for the LoS. Once this is accomplished, the conventional mathematics takes over, which results in non-fuzzy outputs at these intervals (Khan et al., 2010)..
x mm
ιa ι χι
−= ≤ ≤
−
.............6
mm
η χa χ ηη−
= ≤ ≤− .............7
( )X ma ι ι= − +1 ............8
( )X n n ma= − −2 .............9
LInguistic variable I m nexcellent 0.75 1 1good 0.5 0.75 1fair 0.25 0.5 0.75poor 0 0.25 0.5worst 0 0 0.25
Linguistic variable I m nestremely importan 0.9 1 1
very important 0.7 0.9 1important 0.3 0.5 0.7
less improtan 0 0.1 0.3not improtant 0 0 0.1
32
Krishna N. S. Behara Shriniwas S. Arkatkar, Ashoke K. Sarkar
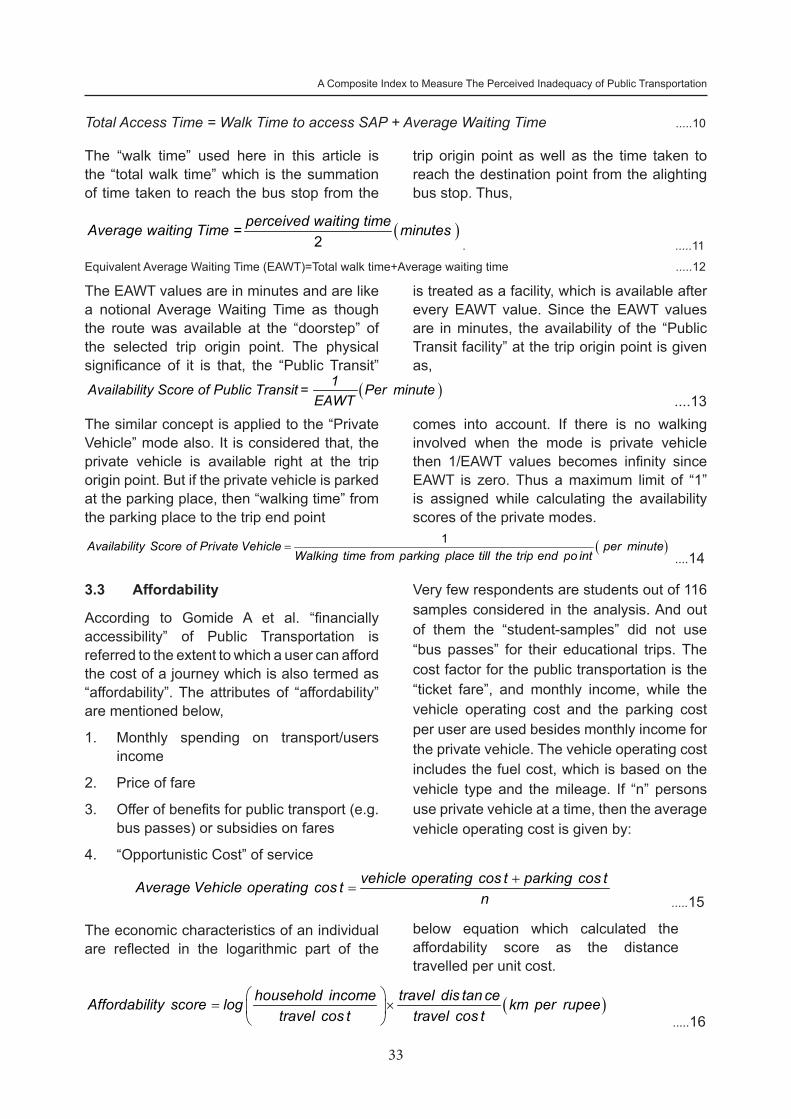
The a-cut values for weightages is shown in Table 4.
Table 4: α cut for 0, 0.5 and 1 for weightages
0a = 0 5.a = 1a =
e x c e l l e n t important
0.9 1 0.95 1 1 1
very improtant 0.7 1 0.8 0.95 0.9 0.9improtant 0.3 0.7 0.4 0.6 0.5 0.5
less improtant 0 0.3 0.05 0.2 0.1 0.1not improtant 0 0.1 0 0.125 0 0
The level of satisfaction (LoS) values for 116 respondents are shown in the Figure 1. The darker graph represents the “Private Vehicle mode”
while the lighter one represents the “Public Transport.”
From Figure 1, the average of all LoS values is 0.64 for private modes, while it is 0.54 for the public transportation modes respectively.
3.2 Availability
The variables discussed in the “Acceptability”
Figure-1: LoS for both Public Transit as well as the private mode
sections are purely qualitative. But the variables which are used in this section and the consecutive ones are quantitative. They deal with “walking times” and “waiting times”. A report by Transport for London (2010) has used the concept of Equivalent door step frequency in calculating Public Transport Accessibility Levels (PTALS). The methodology was developed in 1992, by the London Borough of Hammersmith and Fulham.
The Equivalent Average Waiting Time (EWAT) concept adopted here is similar to that of PTALS’. According to PTAL, waiting time is the average time between when a passenger arrives at a stop or station, and the arrival of the desired service. In PTALs passengers are assumed to arrive at the Service Access Point (SAP) at random. Similarly the perceived “waiting time” given by each respondent is used in calculating the average waiting time when they arrive at the bus stops randomly. PTAL gives the relation between total access time in reaching the bus stops and the waiting times as,
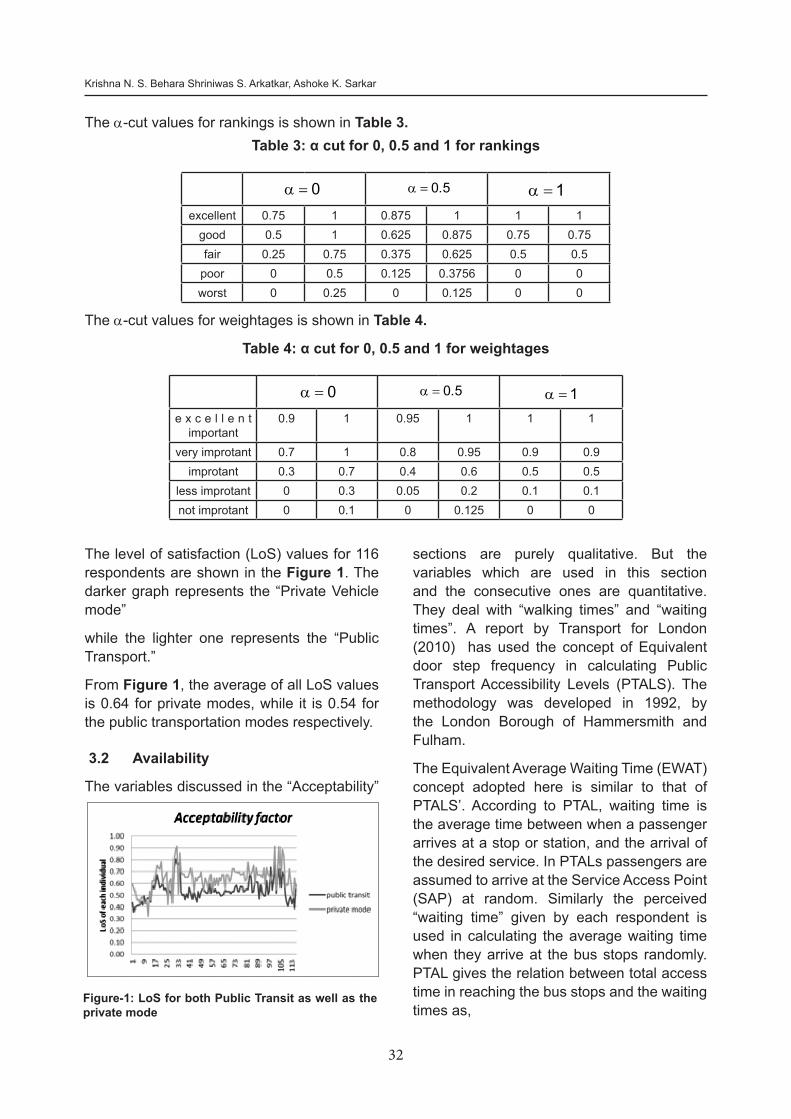
Table 3: α cut for 0, 0.5 and 1 for rankings
0a = 0 5.a = 1a =excellent 0.75 1 0.875 1 1 1
good 0.5 1 0.625 0.875 0.75 0.75fair 0.25 0.75 0.375 0.625 0.5 0.5
poor 0 0.5 0.125 0.3756 0 0worst 0 0.25 0 0.125 0 0
The a-cut values for rankings is shown in Table 3.
33
A Composite Index to Measure The Perceived Inadequacy of Public Transportation
Total Access Time = Walk Time to access SAP + Average Waiting Time .....10
The “walk time” used here in this article is the “total walk time” which is the summation of time taken to reach the bus stop from the
trip origin point as well as the time taken to reach the destination point from the alighting bus stop. Thus,
( )2
perceived waiting timeAverage waiting Time = minutes. .....11
Equivalent Average Waiting Time (EAWT)=Total walk time+Average waiting time .....12
The EAWT values are in minutes and are like a notional Average Waiting Time as though the route was available at the “doorstep” of the selected trip origin point. The physical significance of it is that, the “Public Transit”
is treated as a facility, which is available after every EAWT value. Since the EAWT values are in minutes, the availability of the “Public Transit facility” at the trip origin point is given as,
( )1Availability Score of Public Transit = Per minuteEAWT ....13
comes into account. If there is no walking involved when the mode is private vehicle then 1/EAWT values becomes infinity since EAWT is zero. Thus a maximum limit of “1” is assigned while calculating the availability scores of the private modes.
The similar concept is applied to the “Private Vehicle” mode also. It is considered that, the private vehicle is available right at the trip origin point. But if the private vehicle is parked at the parking place, then “walking time” from the parking place to the trip end point ( )1
=Availability Score of Private Vehicle per minuteWalking time from parking place till the trip end po int ....14
3.3 Affordability
According to Gomide A et al. “financially accessibility” of Public Transportation is referred to the extent to which a user can afford the cost of a journey which is also termed as “affordability”. The attributes of “affordability” are mentioned below,
1. Monthly spending on transport/users income
2. Price of fare
3. Offer of benefits for public transport (e.g. bus passes) or subsidies on fares
4. “Opportunistic Cost” of service
Very few respondents are students out of 116 samples considered in the analysis. And out of them the “student-samples” did not use “bus passes” for their educational trips. The cost factor for the public transportation is the “ticket fare”, and monthly income, while the vehicle operating cost and the parking cost per user are used besides monthly income for the private vehicle. The vehicle operating cost includes the fuel cost, which is based on the vehicle type and the mileage. If “n” persons use private vehicle at a time, then the average vehicle operating cost is given by:
vehicle operating cos t parking cos tAverage Vehicle operating cos t
n+
= .....15
The economic characteristics of an individual are reflected in the logarithmic part of the
below equation which calculated the affordability score as the distance travelled per unit cost.
( )household income travel dis tan ceAffordability score log km per rupeetravel cos t travel cos t
= ×
.....16
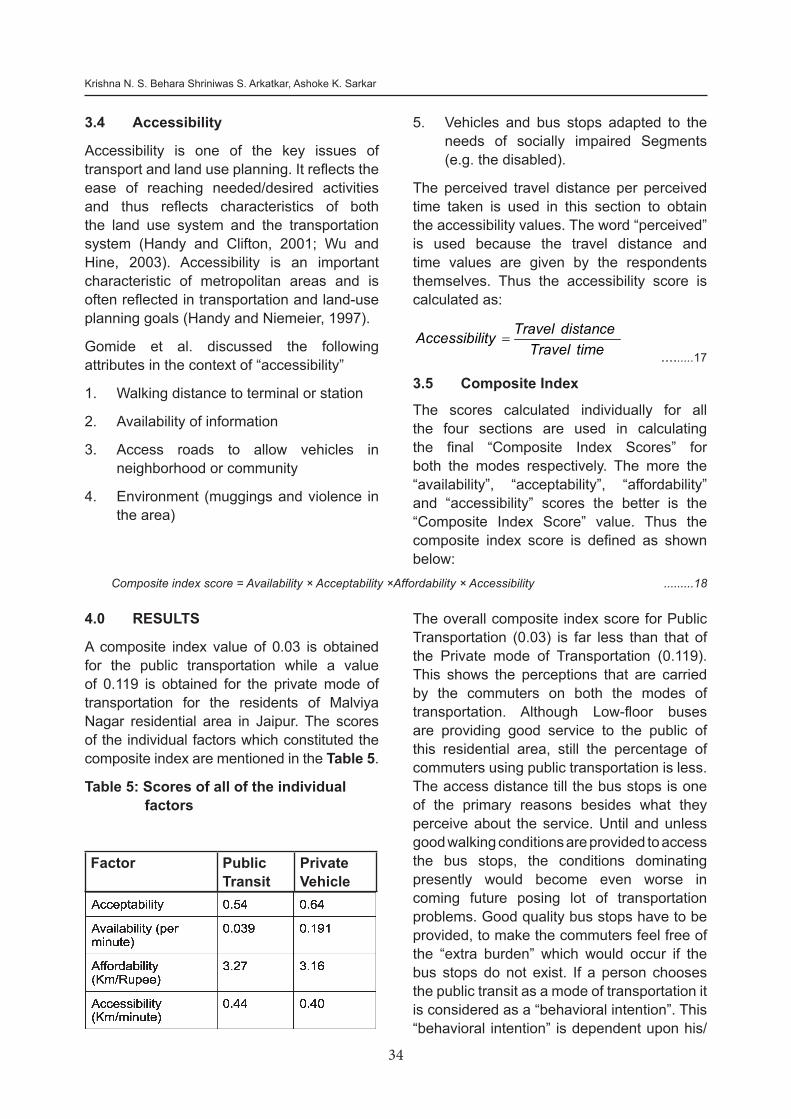
34
Krishna N. S. Behara Shriniwas S. Arkatkar, Ashoke K. Sarkar
3.4 Accessibility
Accessibility is one of the key issues of transport and land use planning. It reflects the ease of reaching needed/desired activities and thus reflects characteristics of both the land use system and the transportation system (Handy and Clifton, 2001; Wu and Hine, 2003). Accessibility is an important characteristic of metropolitan areas and is often reflected in transportation and land-use planning goals (Handy and Niemeier, 1997).
Gomide et al. discussed the following attributes in the context of “accessibility”
1. Walking distance to terminal or station
2. Availability of information
3. Access roads to allow vehicles in neighborhood or community
4. Environment (muggings and violence in the area)
5. Vehicles and bus stops adapted to the needs of socially impaired Segments (e.g. the disabled).
The perceived travel distance per perceived time taken is used in this section to obtain the accessibility values. The word “perceived” is used because the travel distance and time values are given by the respondents themselves. Thus the accessibility score is calculated as:
=Travel distanceAccessibility
Travel time .........17
3.5 Composite Index
The scores calculated individually for all the four sections are used in calculating the final “Composite Index Scores” for both the modes respectively. The more the “availability”, “acceptability”, “affordability” and “accessibility” scores the better is the “Composite Index Score” value. Thus the composite index score is defined as shown below:
Composite index score = Availability × Acceptability ×Affordability × Accessibility .........18
4.0 RESULTS
A composite index value of 0.03 is obtained for the public transportation while a value of 0.119 is obtained for the private mode of transportation for the residents of Malviya Nagar residential area in Jaipur. The scores of the individual factors which constituted the composite index are mentioned in the Table 5.
Table 5: Scores of all of the individual factors
The overall composite index score for Public Transportation (0.03) is far less than that of the Private mode of Transportation (0.119). This shows the perceptions that are carried by the commuters on both the modes of transportation. Although Low-floor buses are providing good service to the public of this residential area, still the percentage of commuters using public transportation is less. The access distance till the bus stops is one of the primary reasons besides what they perceive about the service. Until and unless good walking conditions are provided to access the bus stops, the conditions dominating presently would become even worse in coming future posing lot of transportation problems. Good quality bus stops have to be provided, to make the commuters feel free of the “extra burden” which would occur if the bus stops do not exist. If a person chooses the public transit as a mode of transportation it is considered as a “behavioral intention”. This “behavioral intention” is dependent upon his/
Factor Public Transit
Private Vehicle
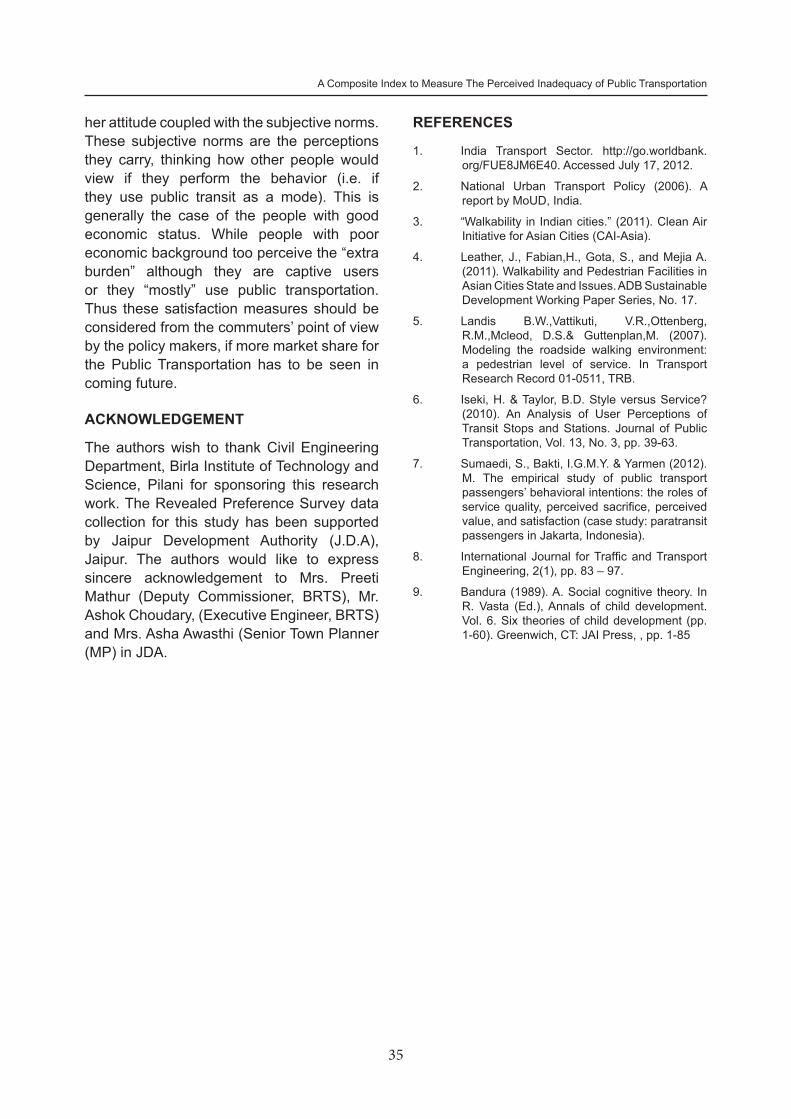
35
A Composite Index to Measure The Perceived Inadequacy of Public Transportation
her attitude coupled with the subjective norms. These subjective norms are the perceptions they carry, thinking how other people would view if they perform the behavior (i.e. if they use public transit as a mode). This is generally the case of the people with good economic status. While people with poor economic background too perceive the “extra burden” although they are captive users or they “mostly” use public transportation. Thus these satisfaction measures should be considered from the commuters’ point of view by the policy makers, if more market share for the Public Transportation has to be seen in coming future.
ACKNOWLEDGEMENT
The authors wish to thank Civil Engineering Department, Birla Institute of Technology and Science, Pilani for sponsoring this research work. The Revealed Preference Survey data collection for this study has been supported by Jaipur Development Authority (J.D.A), Jaipur. The authors would like to express sincere acknowledgement to Mrs. Preeti Mathur (Deputy Commissioner, BRTS), Mr. Ashok Choudary, (Executive Engineer, BRTS) and Mrs. Asha Awasthi (Senior Town Planner (MP) in JDA.
REFERENCES
1. India Transport Sector. http://go.worldbank.org/FUE8JM6E40. Accessed July 17, 2012.
2. National Urban Transport Policy (2006). A report by MoUD, India.
3. “Walkability in Indian cities.” (2011). Clean Air Initiative for Asian Cities (CAI-Asia).
4. Leather, J., Fabian,H., Gota, S., and Mejia A. (2011). Walkability and Pedestrian Facilities in Asian Cities State and Issues. ADB Sustainable Development Working Paper Series, No. 17.
5. Landis B.W.,Vattikuti, V.R.,Ottenberg, R.M.,Mcleod, D.S.& Guttenplan,M. (2007). Modeling the roadside walking environment: a pedestrian level of service. In Transport Research Record 01-0511, TRB.
6. Iseki, H. & Taylor, B.D. Style versus Service? (2010). An Analysis of User Perceptions of Transit Stops and Stations. Journal of Public Transportation, Vol. 13, No. 3, pp. 39-63.
7. Sumaedi, S., Bakti, I.G.M.Y. & Yarmen (2012). M. The empirical study of public transport passengers’ behavioral intentions: the roles of service quality, perceived sacrifice, perceived value, and satisfaction (case study: paratransit passengers in Jakarta, Indonesia).
8. International Journal for Traffic and Transport Engineering, 2(1), pp. 83 – 97.
9. Bandura (1989). A. Social cognitive theory. In R. Vasta (Ed.), Annals of child development. Vol. 6. Six theories of child development (pp. 1-60). Greenwich, CT: JAI Press, , pp. 1-85
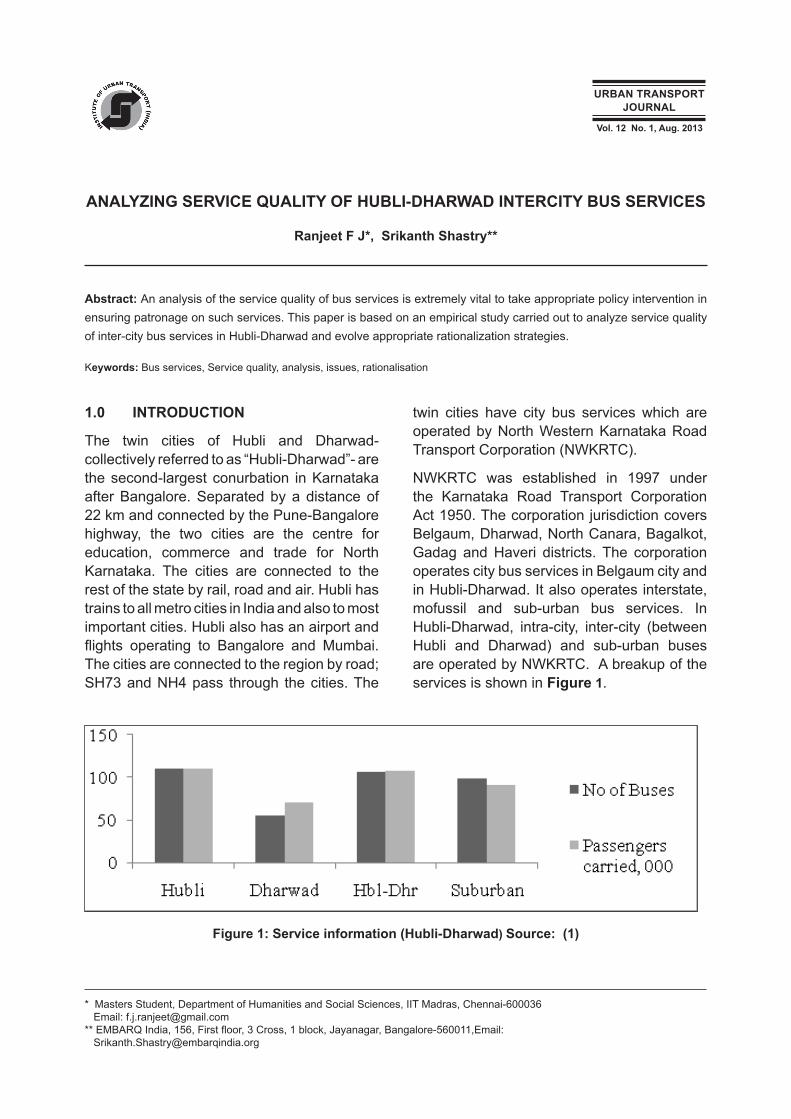
URBAN TRANSPORTJOURNAL
Vol. 12 No. 1, Aug. 2013
ANALYZING SERVICE QUALITY OF HUBLI-DHARWAD INTERCITY BUS SERVICES
Ranjeet F J*, Srikanth Shastry**
Abstract: An analysis of the service quality of bus services is extremely vital to take appropriate policy intervention in ensuring patronage on such services. This paper is based on an empirical study carried out to analyze service quality of inter-city bus services in Hubli-Dharwad and evolve appropriate rationalization strategies.
Keywords: Bus services, Service quality, analysis, issues, rationalisation
1.0 INTRODUCTION
The twin cities of Hubli and Dharwad- collectively referred to as “Hubli-Dharwad”- are the second-largest conurbation in Karnataka after Bangalore. Separated by a distance of 22 km and connected by the Pune-Bangalore highway, the two cities are the centre for education, commerce and trade for North Karnataka. The cities are connected to the rest of the state by rail, road and air. Hubli has trains to all metro cities in India and also to most important cities. Hubli also has an airport and flights operating to Bangalore and Mumbai. The cities are connected to the region by road; SH73 and NH4 pass through the cities. The
twin cities have city bus services which are operated by North Western Karnataka Road Transport Corporation (NWKRTC).
NWKRTC was established in 1997 under the Karnataka Road Transport Corporation Act 1950. The corporation jurisdiction covers Belgaum, Dharwad, North Canara, Bagalkot, Gadag and Haveri districts. The corporation operates city bus services in Belgaum city and in Hubli-Dharwad. It also operates interstate, mofussil and sub-urban bus services. In Hubli-Dharwad, intra-city, inter-city (between Hubli and Dharwad) and sub-urban buses are operated by NWKRTC. A breakup of the services is shown in Figure 1.
Figure 1: Service information (Hubli-Dharwad) Source: (1)
* Masters Student, Department of Humanities and Social Sciences, IIT Madras, Chennai-600036 Email: [email protected]** EMBARQ India, 156, First floor, 3 Cross, 1 block, Jayanagar, Bangalore-560011,Email: [email protected]
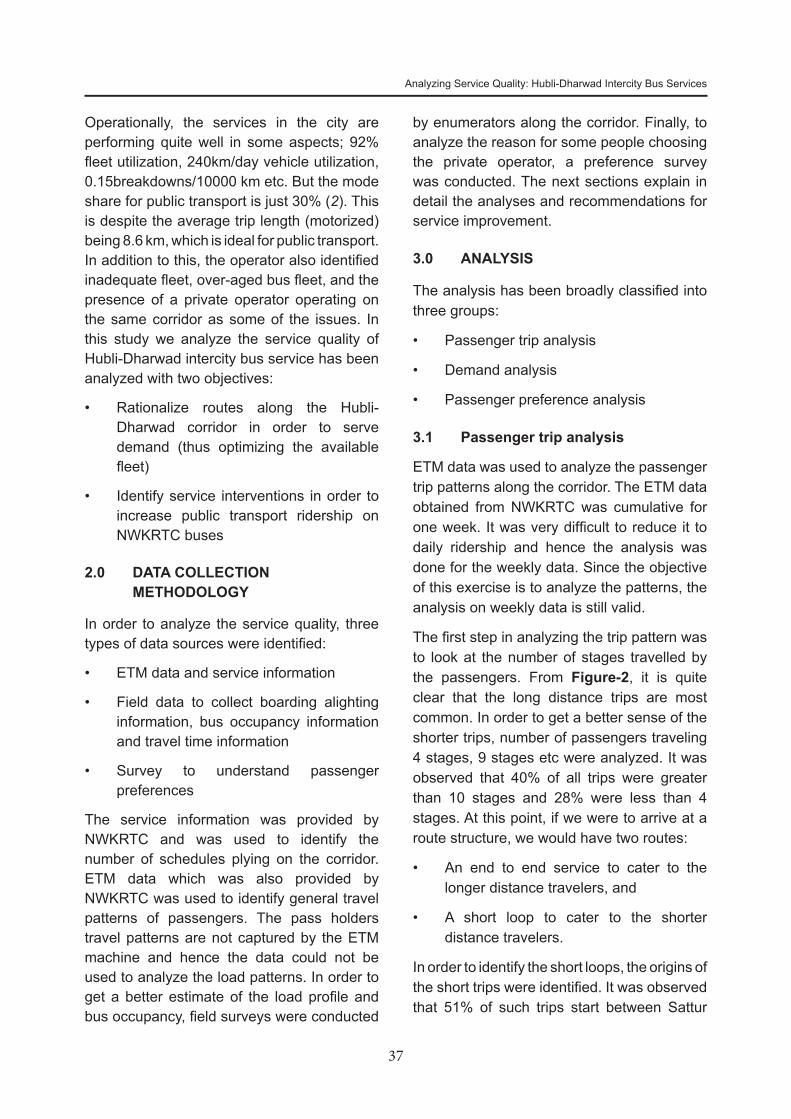
37
Analyzing Service Quality: Hubli-Dharwad Intercity Bus Services
Operationally, the services in the city are performing quite well in some aspects; 92% fleet utilization, 240km/day vehicle utilization, 0.15breakdowns/10000 km etc. But the mode share for public transport is just 30% (2). This is despite the average trip length (motorized) being 8.6 km, which is ideal for public transport. In addition to this, the operator also identified inadequate fleet, over-aged bus fleet, and the presence of a private operator operating on the same corridor as some of the issues. In this study we analyze the service quality of Hubli-Dharwad intercity bus service has been analyzed with two objectives:
• Rationalize routes along the Hubli-Dharwad corridor in order to serve demand (thus optimizing the available fleet)
• Identify service interventions in order to increase public transport ridership on NWKRTC buses
2.0 DATA COLLECTION METHODOLOGY
In order to analyze the service quality, three types of data sources were identified:
• ETM data and service information
• Field data to collect boarding alighting information, bus occupancy information and travel time information
• Survey to understand passenger preferences
The service information was provided by NWKRTC and was used to identify the number of schedules plying on the corridor. ETM data which was also provided by NWKRTC was used to identify general travel patterns of passengers. The pass holders travel patterns are not captured by the ETM machine and hence the data could not be used to analyze the load patterns. In order to get a better estimate of the load profile and bus occupancy, field surveys were conducted
by enumerators along the corridor. Finally, to analyze the reason for some people choosing the private operator, a preference survey was conducted. The next sections explain in detail the analyses and recommendations for service improvement.
3.0 ANALYSIS
The analysis has been broadly classified into three groups:
• Passenger trip analysis
• Demand analysis
• Passenger preference analysis
3.1 Passenger trip analysis
ETM data was used to analyze the passenger trip patterns along the corridor. The ETM data obtained from NWKRTC was cumulative for one week. It was very difficult to reduce it to daily ridership and hence the analysis was done for the weekly data. Since the objective of this exercise is to analyze the patterns, the analysis on weekly data is still valid.
The first step in analyzing the trip pattern was to look at the number of stages travelled by the passengers. From Figure-2, it is quite clear that the long distance trips are most common. In order to get a better sense of the shorter trips, number of passengers traveling 4 stages, 9 stages etc were analyzed. It was observed that 40% of all trips were greater than 10 stages and 28% were less than 4 stages. At this point, if we were to arrive at a route structure, we would have two routes:
• An end to end service to cater to the longer distance travelers, and
• A short loop to cater to the shorter distance travelers.
In order to identify the short loops, the origins of the short trips were identified. It was observed that 51% of such trips start between Sattur
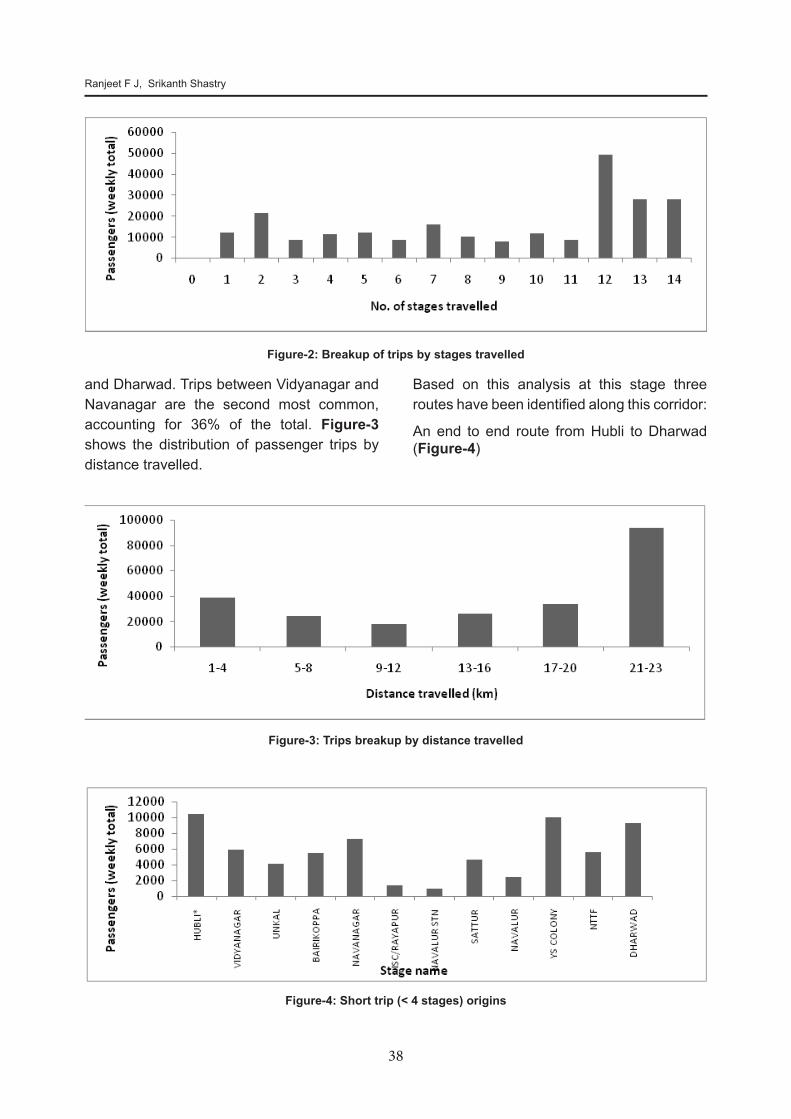
38
Ranjeet F J, Srikanth Shastry
and Dharwad. Trips between Vidyanagar and Navanagar are the second most common, accounting for 36% of the total. Figure-3 shows the distribution of passenger trips by distance travelled.
Based on this analysis at this stage three routes have been identified along this corridor:
An end to end route from Hubli to Dharwad (Figure-4)
Figure-2: Breakup of trips by stages travelled
Figure-3: Trips breakup by distance travelled
Figure-4: Short trip (< 4 stages) origins
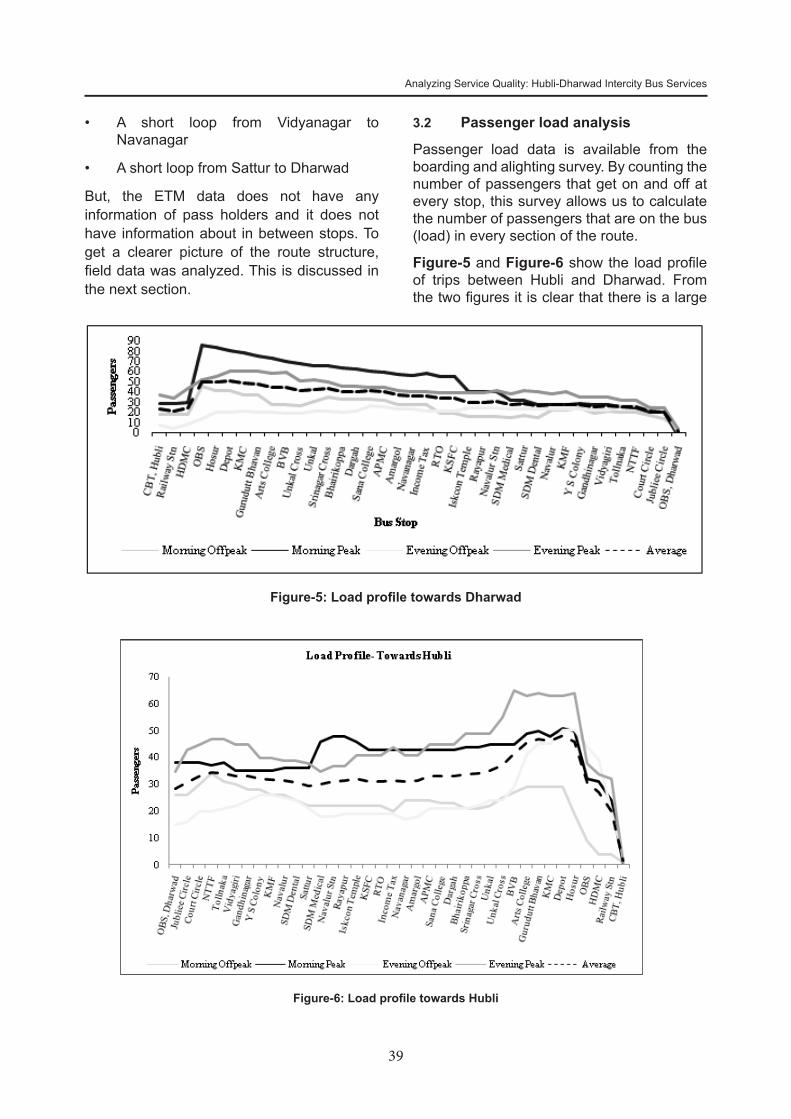
39
Analyzing Service Quality: Hubli-Dharwad Intercity Bus Services
Figure-6: Load profile towards Hubli
• A short loop from Vidyanagar to Navanagar
• A short loop from Sattur to Dharwad
But, the ETM data does not have any information of pass holders and it does not have information about in between stops. To get a clearer picture of the route structure, field data was analyzed. This is discussed in the next section.
Figure-5: Load profile towards Dharwad
3.2 Passenger load analysis
Passenger load data is available from the boarding and alighting survey. By counting the number of passengers that get on and off at every stop, this survey allows us to calculate the number of passengers that are on the bus (load) in every section of the route.
Figure-5 and Figure-6 show the load profile of trips between Hubli and Dharwad. From the two figures it is clear that there is a large
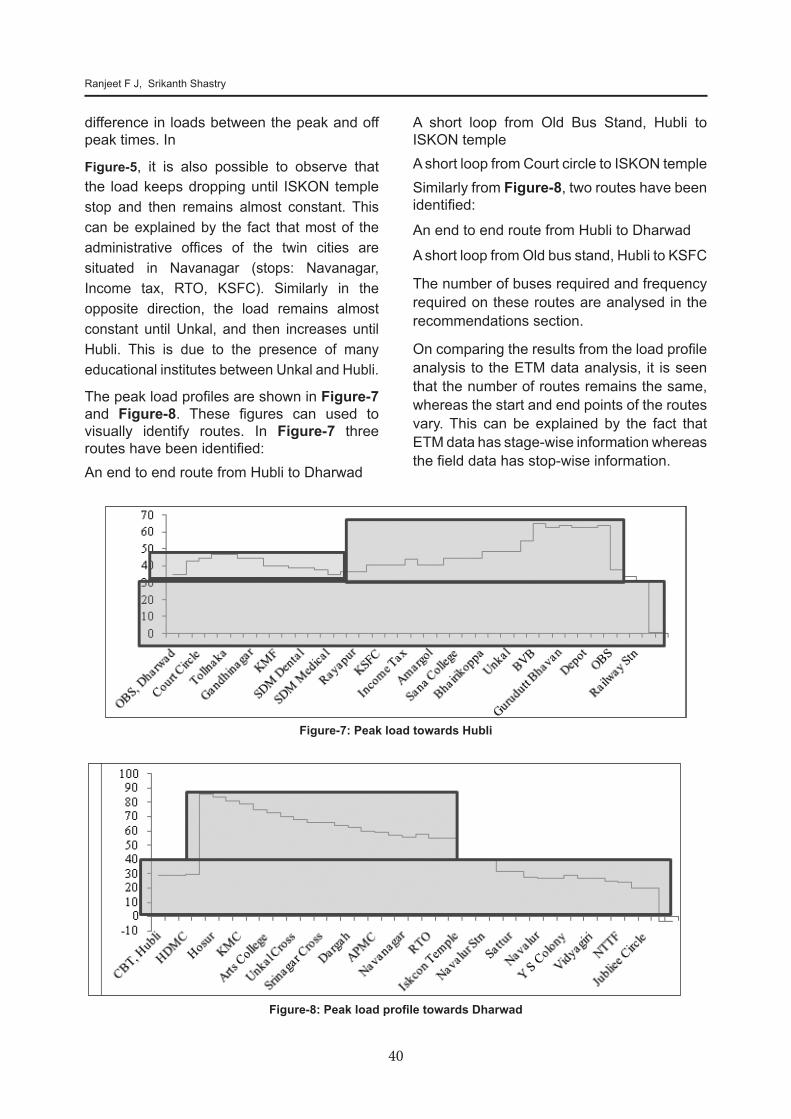
40
Ranjeet F J, Srikanth Shastry
Figure-7: Peak load towards Hubli
difference in loads between the peak and off peak times. In
Figure-5, it is also possible to observe that the load keeps dropping until ISKON temple stop and then remains almost constant. This can be explained by the fact that most of the administrative offices of the twin cities are situated in Navanagar (stops: Navanagar, Income tax, RTO, KSFC). Similarly in the opposite direction, the load remains almost constant until Unkal, and then increases until Hubli. This is due to the presence of many educational institutes between Unkal and Hubli.
The peak load profiles are shown in Figure-7 and Figure-8. These figures can used to visually identify routes. In Figure-7 three routes have been identified:An end to end route from Hubli to Dharwad
Figure-8: Peak load profile towards Dharwad
A short loop from Old Bus Stand, Hubli to ISKON templeA short loop from Court circle to ISKON templeSimilarly from Figure-8, two routes have been identified:
An end to end route from Hubli to Dharwad
A short loop from Old bus stand, Hubli to KSFC
The number of buses required and frequency required on these routes are analysed in the recommendations section.
On comparing the results from the load profile analysis to the ETM data analysis, it is seen that the number of routes remains the same, whereas the start and end points of the routes vary. This can be explained by the fact that ETM data has stage-wise information whereas the field data has stop-wise information.
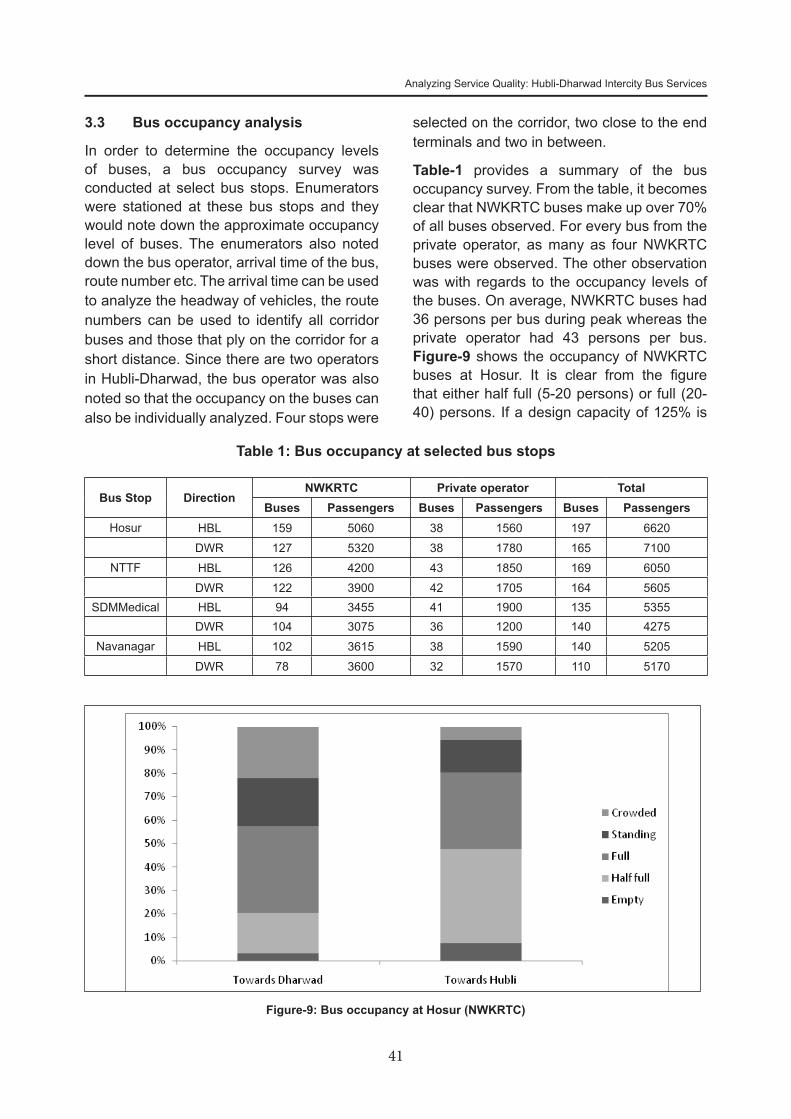
41
Analyzing Service Quality: Hubli-Dharwad Intercity Bus Services
Figure-9: Bus occupancy at Hosur (NWKRTC)
3.3 Bus occupancy analysis
In order to determine the occupancy levels of buses, a bus occupancy survey was conducted at select bus stops. Enumerators were stationed at these bus stops and they would note down the approximate occupancy level of buses. The enumerators also noted down the bus operator, arrival time of the bus, route number etc. The arrival time can be used to analyze the headway of vehicles, the route numbers can be used to identify all corridor buses and those that ply on the corridor for a short distance. Since there are two operators in Hubli-Dharwad, the bus operator was also noted so that the occupancy on the buses can also be individually analyzed. Four stops were
Table 1: Bus occupancy at selected bus stops
Bus Stop DirectionNWKRTC Private operator Total
Buses Passengers Buses Passengers Buses PassengersHosur HBL 159 5060 38 1560 197 6620
DWR 127 5320 38 1780 165 7100NTTF HBL 126 4200 43 1850 169 6050
DWR 122 3900 42 1705 164 5605SDMMedical HBL 94 3455 41 1900 135 5355
DWR 104 3075 36 1200 140 4275Navanagar HBL 102 3615 38 1590 140 5205
DWR 78 3600 32 1570 110 5170
selected on the corridor, two close to the end terminals and two in between.
Table-1 provides a summary of the bus occupancy survey. From the table, it becomes clear that NWKRTC buses make up over 70% of all buses observed. For every bus from the private operator, as many as four NWKRTC buses were observed. The other observation was with regards to the occupancy levels of the buses. On average, NWKRTC buses had 36 persons per bus during peak whereas the private operator had 43 persons per bus. Figure-9 shows the occupancy of NWKRTC buses at Hosur. It is clear from the figure that either half full (5-20 persons) or full (20-40) persons. If a design capacity of 125% is
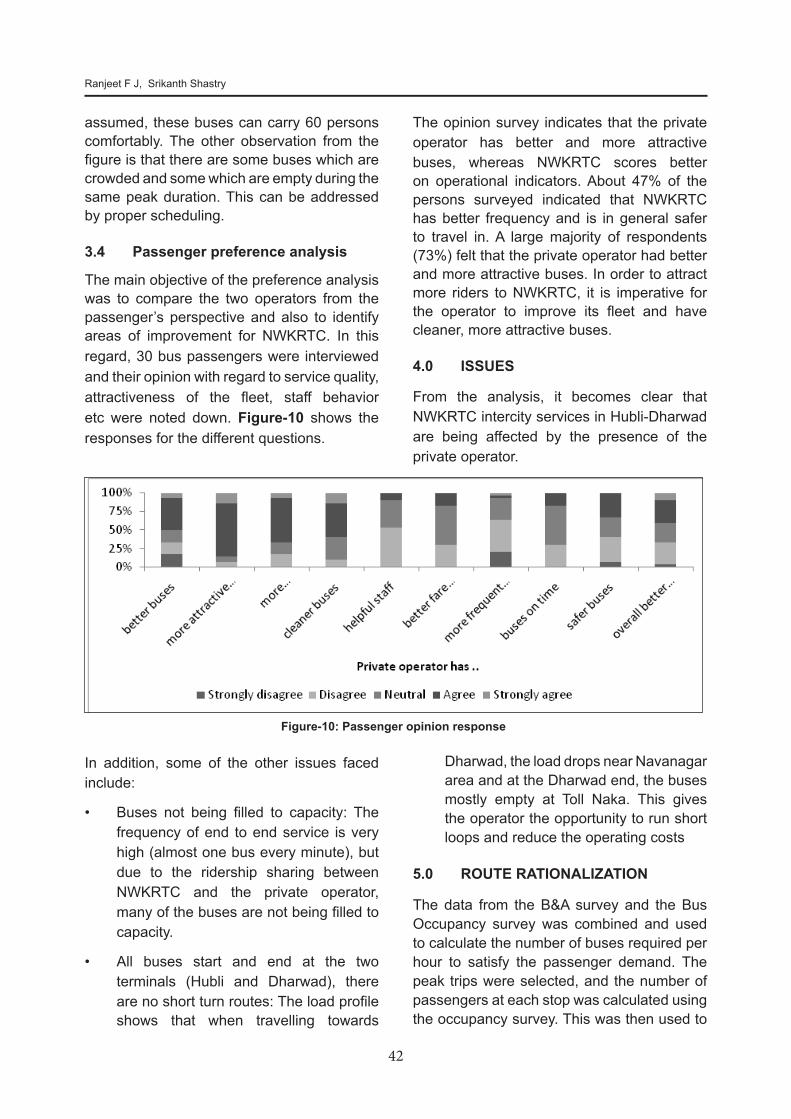
42
Ranjeet F J, Srikanth Shastry
Figure-10: Passenger opinion response
assumed, these buses can carry 60 persons comfortably. The other observation from the figure is that there are some buses which are crowded and some which are empty during the same peak duration. This can be addressed by proper scheduling.
3.4 Passenger preference analysis
The main objective of the preference analysis was to compare the two operators from the passenger’s perspective and also to identify areas of improvement for NWKRTC. In this regard, 30 bus passengers were interviewed and their opinion with regard to service quality, attractiveness of the fleet, staff behavior etc were noted down. Figure-10 shows the responses for the different questions.
The opinion survey indicates that the private operator has better and more attractive buses, whereas NWKRTC scores better on operational indicators. About 47% of the persons surveyed indicated that NWKRTC has better frequency and is in general safer to travel in. A large majority of respondents (73%) felt that the private operator had better and more attractive buses. In order to attract more riders to NWKRTC, it is imperative for the operator to improve its fleet and have cleaner, more attractive buses.
4.0 ISSUES
From the analysis, it becomes clear that NWKRTC intercity services in Hubli-Dharwad are being affected by the presence of the private operator.
In addition, some of the other issues faced include:
• Buses not being filled to capacity: The frequency of end to end service is very high (almost one bus every minute), but due to the ridership sharing between NWKRTC and the private operator, many of the buses are not being filled to capacity.
• All buses start and end at the two terminals (Hubli and Dharwad), there are no short turn routes: The load profile shows that when travelling towards
Dharwad, the load drops near Navanagar area and at the Dharwad end, the buses mostly empty at Toll Naka. This gives the operator the opportunity to run short loops and reduce the operating costs
5.0 ROUTE RATIONALIZATION
The data from the B&A survey and the Bus Occupancy survey was combined and used to calculate the number of buses required per hour to satisfy the passenger demand. The peak trips were selected, and the number of passengers at each stop was calculated using the occupancy survey. This was then used to
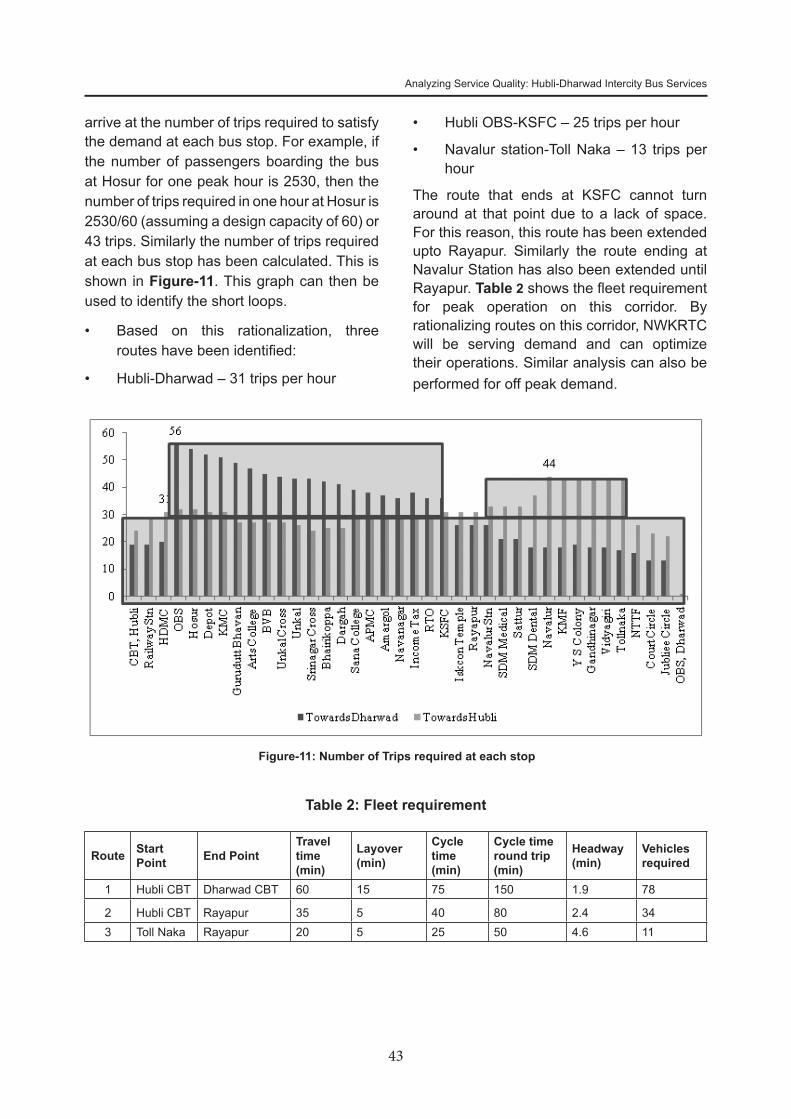
43
Analyzing Service Quality: Hubli-Dharwad Intercity Bus Services
arrive at the number of trips required to satisfy the demand at each bus stop. For example, if the number of passengers boarding the bus at Hosur for one peak hour is 2530, then the number of trips required in one hour at Hosur is 2530/60 (assuming a design capacity of 60) or 43 trips. Similarly the number of trips required at each bus stop has been calculated. This is shown in Figure-11. This graph can then be used to identify the short loops.
• Based on this rationalization, three routes have been identified:
• Hubli-Dharwad – 31 trips per hour
Figure-11: Number of Trips required at each stop
• Hubli OBS-KSFC – 25 trips per hour
• Navalur station-Toll Naka – 13 trips per hour
The route that ends at KSFC cannot turn around at that point due to a lack of space. For this reason, this route has been extended upto Rayapur. Similarly the route ending at Navalur Station has also been extended until Rayapur. Table 2 shows the fleet requirement for peak operation on this corridor. By rationalizing routes on this corridor, NWKRTC will be serving demand and can optimize their operations. Similar analysis can also be performed for off peak demand.
Table 2: Fleet requirement
Route Start Point End Point
Travel time (min)
Layover (min)
Cycle time (min)
Cycle time round trip (min)
Headway (min)
Vehicles required
1 Hubli CBT Dharwad CBT 60 15 75 150 1.9 78
2 Hubli CBT Rayapur 35 5 40 80 2.4 343 Toll Naka Rayapur 20 5 25 50 4.6 11
44
Ranjeet F J, Srikanth Shastry
6.0 CONCLUSIONS
NWKRTC can improve operations by rationalizing their routes to serve demand and also by revitalizing the existing fleet of buses. Revitalizing the existing fleet can be done by either purchasing new buses or by improving the aesthetics of existing buses (repainting, ensuring all seats are in good condition etc). Cleanliness of buses was another issue mentioned by passengers, and can be addressed by ensuring that certain minimum standards are adhered to.
ACKNOWLEDGEMENT
The authors would like to express their sincere
gratitude to the NWKRTC for their cooperation and assistance rendered throughout the entire process especially Mr. Shashidhar V M, NWKRTC, DTO Hubli Division and Mr. Ganesh Rathod, NWKRTC Systems Manager.
REFERENCES
1. North Western Karnataka Road Transport Corporation (NWKRTC). Modernizing city bus services under the provision of World Bank assisted grants (presentation). 2012.
2. CEPT University. Bus Rapid Transit System
Hubli-Dharwad, Detailed Feasibility Report.
Directorate of Urban Land Transport, 2011.

URBAN TRANSPORTJOURNAL
Vol. 12 No. 1, Aug. 2013
TRAVEL TIME RELIABILITY BASED TRAFFIC ASSIGNMENT MODEL FOR AN URBAN ROAD NETWORK
Ch. Ravi Sekhar*, Ananya Bijay**, N.S.Divia***
Abstract: Driver’s behaviour in traffic congestion is different from that in uncongested traffic condition. When traffic is uncongested motorists choose the path on basis of travel time. But in traffic congestion, motorists might choose the path based on travel time reliability due to uncertain from the system. The objective of the study is to introduce travel time reliability based traffic assignment techniques for road transport network. For this, Method of Successive Average (MSA) solution algorithm is considered for solving user equilibrium assignment and reliability based user equilibrium technique. In this paper, Reliability User Equilibrium (RUE) model is applied to a small urban road network connecting origin (CRRI) destination (Ashram Chowk) on NH2 and an alternative path connecting the same origin and destination. Speed and travel time data is collected using Probe vehicle technique and Traffic volume data has been considered from the previous surveys. Preliminary data analysis has been done to find travel time, average speed, running speed and delay. These data were used to model the conventional travel time assignment model using MSA algorithm for traffic assignment. Link/ path travel time reliability modeled by considering Weibull probability distribution function. Results observed from this study emphasizes that RUE based assignment based model are efficient than the UE based model in route choice assignment under uncertain conditions.
Keywords: Travel Time, Traffic Assignment, Models, Reliability, User Equilibrium
1.0 INTRODUCTION
Reliable transportation system provides safe and efficient movement of people and goods. The term reliability is defined in system engineering as probability of a device performing its purpose adequately for the period of time intended under the operating conditions encountered. (Billinton and Ronald, 1992). In road network, reliability is defined as the network which can guarantee an acceptable level of service for road traffic even if the function of some links are physically damaged or large amount of travel demand is occasionally generated (Asakura and Kashiwadani,1991). Road network reliability problems are mainly caused by uncertainty of traffic conditions of the network. Sources of uncertainties can be an element of demand side factors, supply side factors and other external factors of the network. (Asakura
1997, Chen et.al 2003 and David Watling et.al, 2004).
Modeling travel time variability is the most useful indicator to measure performance and reliability of transportation system. Travel time variation frequently occurs in urban arterial road networks as a result of demand and supply variations as well as some external factors such as adverse weather. The knowledge about relation between sources of uncertainties and travel time is not enough, but quantitative evaluation between these will be very much useful to the planners as well as system managers to take decision on how to improve travel time reliability. Travel time reliability has attracted many researchers in the studies of transport network reliability because of its importance as compared with other network reliability measures such as connectivity reliability, capacity reliability etc.
* Senior Scientist, CSIR- Central Road Research Institute, New Delhi** B. Tech Student, AMITY University, New Delhi*** Master Student, National Institute of Technology, Surathkal, India
46
Dr. Ch. Ravi Sekhar, Ananya Bijay, N.S.Divia
In connectivity reliability studies assumes that link/path is a physical event. Physical components might only be two states i.e. operation or failures (One or Zero variable denoting the states of components). This type of reliability analysis is suitable for abnormal situation such as earth quakes, landslides etc. In modeling real transport network this assumption does not hold true, due to events that may be caused by the normal daily traffic conditions. Therefore travel time reliability based network reliability studies are useful to evaluate the performance of the system. The use of travel time reliability measures have been growing in the recent years in various developed countries like US (FHWA Report 2006) and Japan (Asakura 2006).
The importance of travel time reliability and its necessity in daily traffic flow situations leads us to study about the various developments that took place in travel time reliability. These studies, useful to decide on the priorities of expanding the capacities of the road network will have to be determined on a rational basis. In this respect the travel time reliability studies will be of great help. Therefore there is a need to evolve the methodology and arrive at the results of travel time reliability for the networks in India. Various traffic assignment techniques and their limitations are briefly discussed in this Study. Furthermore, the methodology of reliability based traffic assignment technique is also discussed. The developed reliability based user equilibrium technique has been applied to a simple road network of an urban corridor in Delhi.
2.0 REVIEW ON TRAFFIC ASSIGNMENT TECHNIQUES
Based on network topology and flow condition, the analysis of road network could be divided into two dimensions, pure network analysis and flow network analysis. Pure network models are characterized only by their topological structure. These models are widely and deeply studied in the field of communications. Flow network models characterized by both
structure and pattern of flow in the network. These models are unique in the transportation field because they allow travel demand, travel decision-making behaviour of travelers and the state of traffic information. Various traffic assignment techniques were considered for solving traffic assignment problems under the influence of uncertainties were briefly discussed in the following sections
2.1 UserEquilibrium(UE)TrafficAssignment
User Equilibrium traffic assignment models are most widely used in practice. This model assumes that, each traveller has perfect knowledge of the network travel times on all possible routes between his/her OD pair. Each traveller’s route choice criterion is to minimize the known value of the route travel time, which is obtained by adding up the travel times on all the arcs belonging to the route. The choices of routes by all travellers result in a network flow allocation such that all used routes between every origin and destination have equal travel times and no unused route has a lower travel time according to Wardrop’s First Principle. Du and Nicholson(1993) developed a general frame work for evaluating reliability measures based on UE model Asakura (1998) developed frame work based on UE model with variable demand and strict link capacity constrained was applied to describe flows in a network with some disconnected links. Chen et al. (2003) used UE based models to estimate travel time reliability under demand and supply variation.
2.2 Stochastic User Equilibrium (SUE) TrafficAssignment
A stochastic User Equilibrium method was proposed by Daganzo and Sheffi (Sheffi Y1985). These models combine user equilibrium and stochastic methods.They defined the equilibrium state of traffic flow on a network as stochastic user equilibrium when every user chooses his route such that perceived travel time between origin and destination is minimum, but perceived
47
Travel Time Reliability Based Traffic Assignment Model for an Urban Road Network
travel time on a link varies randomly across users. SUE model is suitable for describing user’s probabilistic route choice behaviour in a congested network. These models includes both logit based (perceived travel time follows Gumbel distribution) models and Probit based (perceived travel time follows normal distribution) models. Asakura (1999) used multi-class SUE model in the evaluation process for describing network flows under uncertain conditions. Inoyue.H (2003) developed a model to estimate travel time reliability in road networks based on SUE. In his study he explained how to calculate travel time reliability for large scale networks and he applied this model to the Hanshin area road network, Japan to evaluate the new lines in the national road plan from the view point of travel time reliability.
2.3 Reliability User Equilibrium (RUE) BasedTrafficAssignment
The characterization of this method is that no travellers can improve his travel time reliability by unilaterally changing routes. The main idea of this method of approach is that travelers do not choose the path according to only travel time, they have a tendency to prefer the path on which the travel time variation is minimized. Lee, S. et.al (2000) defined reliability based route choice principle and formulated a reliability based equilibrium traffic assignment principle. Lam et.al proposed a RUE model to predict traffic assignment for road network in which drivers would consider both travel time and reliability for their route choices. Chan and Lam (2005) studied the impact of road pricing on the network reliability and investigated with the use of newly developed RUE based model.
2.4 Monte Carlo Simulation Based TrafficAssignmentTechniques
This technique is often used to identify the effects on a dependent variable, as a result of variation in those variable upon which first variable depends. Especially when the relation between the dependent variable and the other
variable is complex, or the variation in the other variable cannot be described mathematically this approach can be adopted. Chen et al.(2003) developed Monte Carlo simulation based procedure to simulate risk perceptions and preference in making route choice decisions under an uncertain environment. In this study they developed four different route choice models Monte Carlo simulation based stochastic and deterministic user equilibrium models to estimate the OD and path travel time reliabilities.
Some other approaches like “Absorbing Markov Chains and Game Theory” approaches are used in the past studies for measuring road network reliability. Bell (1999) proposed game theory approach for measuring network reliability. In this approach travellers try to choose the links with the minimal expected travel cost while the evil entity try to maximize the expected travel cost. The game will continue until the Nash equilibrium point is reached, this is the equilibrium point neither traveler or evil entity can further improve their travel cost.Haitham and Emam et. al (2006) proposed a new methodology to study the multistate system reliability analysis of transportation networks for which one cannot formulate an “all or nothing “ type of failure criterion and in which dependent link failures are considered. In this study travel time reliability was found for the system’s most probable states. The fault Tree Analysis (FTA) Algorithm was used to enumerate the most probable states in decreasing order of probability. They applied the cause-based multimode model (CBMM) to predict transportation network’s travel time reliability such that an origin demand can reach a specified destination under multimodal dependency link failure conditions that have not been considered before in the calculation of transportation network’s reliability. By knowing the system states, they estimated lower and upper bounds of reliabilities for network paths and for the entire network. The analysis showed that the dependency assumption is important to obtain accurate travel time reliability of links, paths, and the entire network.
48
Dr. Ch. Ravi Sekhar, Ananya Bijay, N.S.Divia
UE models characterizes based on the concept that, no travelers can improve his travel time by unilaterally changing routes. These models assume that a trip maker assumes perceive travel time identically. SUE principle is similar to DUE models but these models relax the assumption of the identical perception of travel time. In these models the time perceived by any trip maker is assumed to be random variable. SUE based models are more realistic and better predictable models than DUE. Particularly if some links in the networks subjected to uncertainty in travel time. If most of the links are facing the uncertainties in travel time can select DUE based reliability models. RUE and DUE models are extension to basic UE model. Simulation techniques on the other hand estimate the reliability indices by simulating the actual process and random behaviour of the system. This article mainly focused on reliability based traffic assignment model for route choice analysis under certain conditions. The algorithm and application to simple road network were discussed briefly in the following sections.
3.0 DEVELOPMENT OF RELIABILITY BASED TRAFFIC ASSIGNMENT MODEL
To solve the reliability assignment model, it is required that the rule by which motorist choose a route be specified. The interaction between the route choice between all origin-destination pairs on the one hand and the travel time reliability on all the network links on the other determines the reliability based equilibrium flows. It is reasonable to assume that every motorist will try to minimize his or her own travel time variation when travelling from origin to destination. The travel time variation on each link changes with the flow and therefore the travel time reliability on several of network paths changes as the link flows changes. A stable condition is reached only when no traveller can improve his travel time reliability by unilaterally changes routes.
This is the characterization of the reliability user equilibrium. For each O-D pair, at user RUE, the travel time on all used paths is equal, and (also) less than or equal to the travel time reliability that would be experienced by a single vehicle on any unused path.
3.1 Estimation of Link Travel Time
Several approaches are available in literature regarding the link performance functions. One of the earliest travel time functions used was the model proposed by Irwin et.al (1961). This study proposed a linear relationship between travel time and flow, this equation is relatively simple. Some other studies proposed curvilinear travel time-flow relationship (Smock 1962, Soltman 1965 and Overgaard 1967). In the year 1963 Mosher suggested two approaches for the travel time functions, namely the logarithmic and the hyperbolic functions, and Davidson (1966) and Ackleik (1991) presented two non linear travel time functions for urban road. One of the best known and most widely used travel time- flow function in traffic assignment is Bureau of Public Roads, often referred to as the BPR function. Most of the traffic assignment algorithms update link travel time iteratively based on BPR link performance function and this is discussed in the equation 1.
af a
aa
Vt tC
b
a a
= + ∝ 1 ...........Eqn. (1)
Where ta= travel time on link a, = free flow travel time on link a, va= flow on link a, and ca = capacity on link a. In the present study, the Bureau of Public Roads (BPR) formula is used for link performance. In this study, for estimation of link travel time BPR standard function with ba=4 and aa= 0.15 was considered in this study based on the available literature (Chen et al. 2003).
3.2 Estimation of Link Travel Time Reliability
Link travel time reliability R(T) can be expressed using well defined reliability functions such as hazard rate function. This function can mathematically presented in Equation 2 (Haitham et.al 2006)
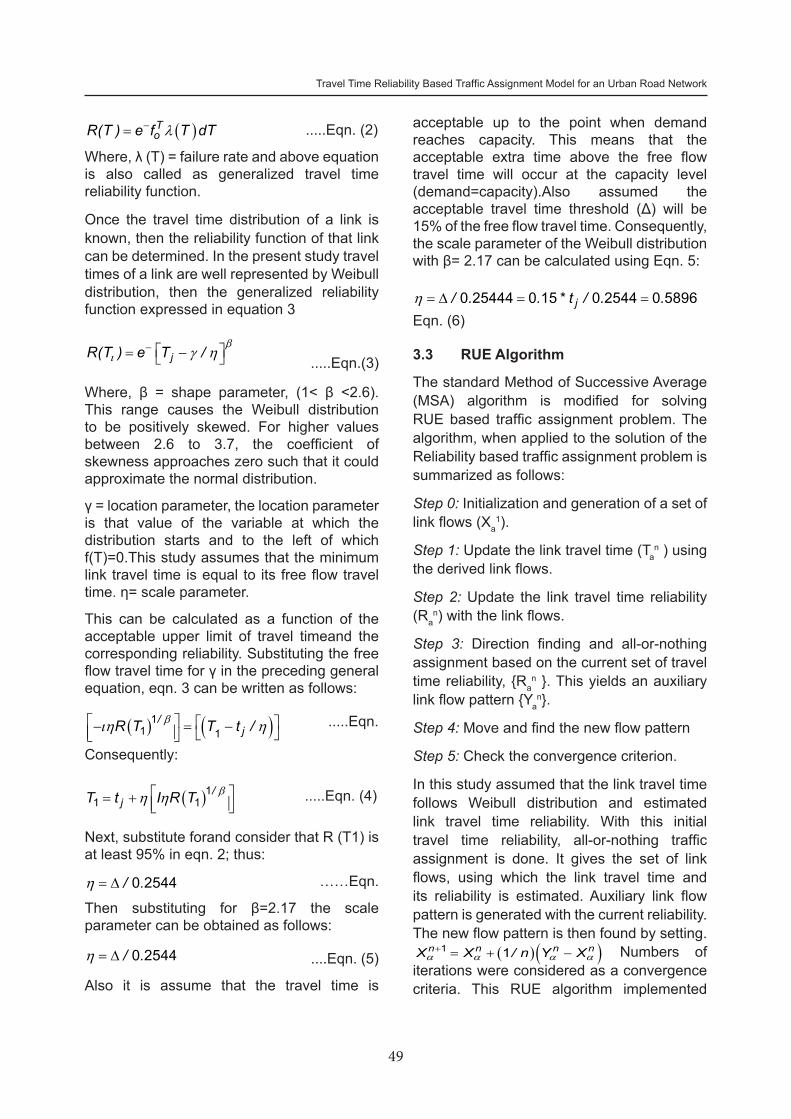
49
Travel Time Reliability Based Traffic Assignment Model for an Urban Road Network
( )ToR(T ) e f T dTλ−= .....Eqn. (2)
Where, λ (T) = failure rate and above equation is also called as generalized travel time reliability function.
Once the travel time distribution of a link is known, then the reliability function of that link can be determined. In the present study travel times of a link are well represented by Weibull distribution, then the generalized reliability function expressed in equation 3
jR(T ) e T /b
ι γ η− = − .....Eqn.(3)
Where, β = shape parameter, (1< β <2.6). This range causes the Weibull distribution to be positively skewed. For higher values between 2.6 to 3.7, the coefficient of skewness approaches zero such that it could approximate the normal distribution.
γ = location parameter, the location parameter is that value of the variable at which the distribution starts and to the left of which f(T)=0.This study assumes that the minimum link travel time is equal to its free flow travel time. η= scale parameter.
This can be calculated as a function of the acceptable upper limit of travel timeand the corresponding reliability. Substituting the free flow travel time for γ in the preceding general equation, eqn. 3 can be written as follows:
( ) ( )/jR T T t /bιη η − = −
11 1
.....Eqn.
Consequently:
( ) /jT t I R T bη η = +
11 1 .....Eqn. (4)
Next, substitute forand consider that R (T1) is at least 95% in eqn. 2; thus:
/ .η = ∆ 0 2544 ……Eqn.
Then substituting for β=2.17 the scale parameter can be obtained as follows:
/ .η = ∆ 0 2544 ....Eqn. (5)
Also it is assume that the travel time is
acceptable up to the point when demand reaches capacity. This means that the acceptable extra time above the free flow travel time will occur at the capacity level (demand=capacity).Also assumed the acceptable travel time threshold (Δ) will be 15% of the free flow travel time. Consequently, the scale parameter of the Weibull distribution with β= 2.17 can be calculated using Eqn. 5:
j/ . . * t / . .η = ∆ = =0 25444 0 15 0 2544 0 5896
Eqn. (6)
3.3 RUE Algorithm
The standard Method of Successive Average (MSA) algorithm is modified for solving RUE based traffic assignment problem. The algorithm, when applied to the solution of the Reliability based traffic assignment problem is summarized as follows:
Step 0: Initialization and generation of a set of link flows (Xa
1).
Step 1: Update the link travel time (Tan ) using
the derived link flows.
Step 2: Update the link travel time reliability (Ra
n) with the link flows.
Step 3: Direction finding and all-or-nothing assignment based on the current set of travel time reliability, {Ra
n }. This yields an auxiliary link flow pattern {Ya
n}.
Step 4: Move and find the new flow pattern
Step 5: Check the convergence criterion.
In this study assumed that the link travel time follows Weibull distribution and estimated link travel time reliability. With this initial travel time reliability, all-or-nothing traffic assignment is done. It gives the set of link flows, using which the link travel time and its reliability is estimated. Auxiliary link flow pattern is generated with the current reliability. The new flow pattern is then found by setting.
( ) ( )n n n nX X / n Y Xa a a a+ = + −1 1 Numbers of
iterations were considered as a convergence criteria. This RUE algorithm implemented
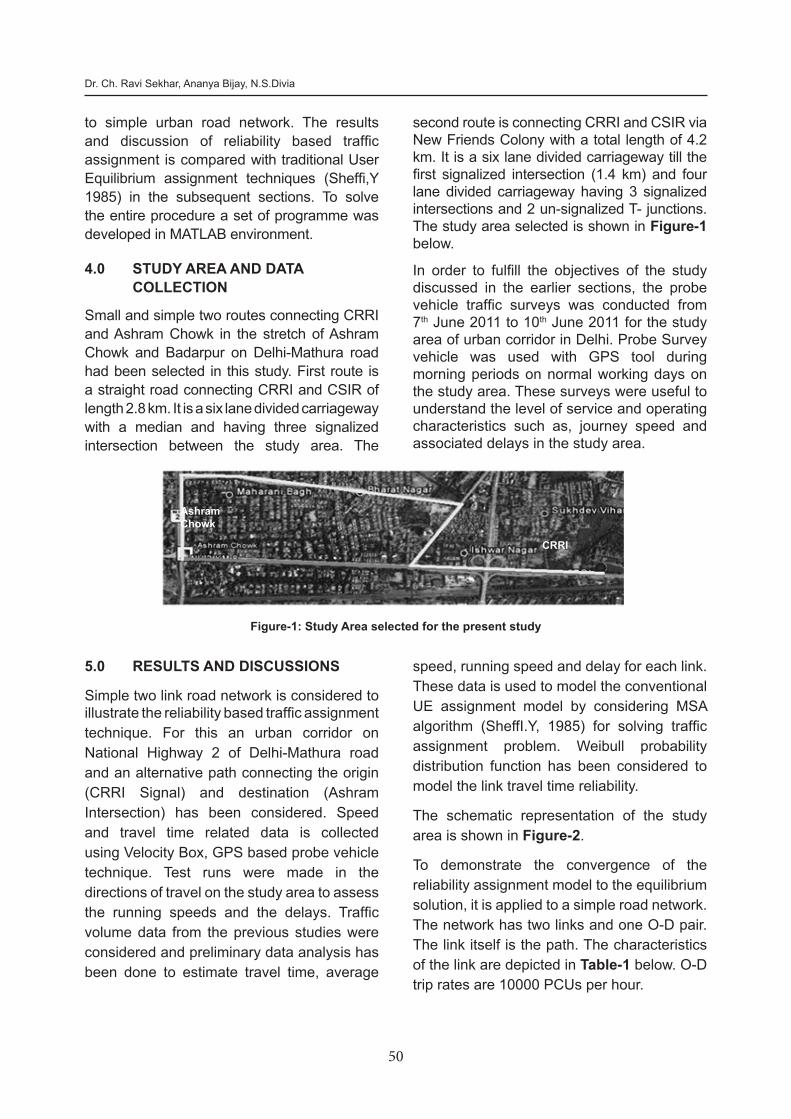
50
Dr. Ch. Ravi Sekhar, Ananya Bijay, N.S.Divia
to simple urban road network. The results and discussion of reliability based traffic assignment is compared with traditional User Equilibrium assignment techniques (Sheffi,Y 1985) in the subsequent sections. To solve the entire procedure a set of programme was developed in MATLAB environment.
4.0 STUDY AREA AND DATA COLLECTION
Small and simple two routes connecting CRRI and Ashram Chowk in the stretch of Ashram Chowk and Badarpur on Delhi-Mathura road had been selected in this study. First route is a straight road connecting CRRI and CSIR of length 2.8 km. It is a six lane divided carriageway with a median and having three signalized intersection between the study area. The
AshramChowk
CRRI
Figure-1: Study Area selected for the present study
second route is connecting CRRI and CSIR via New Friends Colony with a total length of 4.2 km. It is a six lane divided carriageway till the first signalized intersection (1.4 km) and four lane divided carriageway having 3 signalized intersections and 2 un-signalized T- junctions. The study area selected is shown in Figure-1 below.
In order to fulfill the objectives of the study discussed in the earlier sections, the probe vehicle traffic surveys was conducted from 7th June 2011 to 10th June 2011 for the study area of urban corridor in Delhi. Probe Survey vehicle was used with GPS tool during morning periods on normal working days on the study area. These surveys were useful to understand the level of service and operating characteristics such as, journey speed and associated delays in the study area.
5.0 RESULTS AND DISCUSSIONS
Simple two link road network is considered to illustrate the reliability based traffic assignment technique. For this an urban corridor on National Highway 2 of Delhi-Mathura road and an alternative path connecting the origin (CRRI Signal) and destination (Ashram Intersection) has been considered. Speed and travel time related data is collected using Velocity Box, GPS based probe vehicle technique. Test runs were made in the directions of travel on the study area to assess the running speeds and the delays. Traffic volume data from the previous studies were considered and preliminary data analysis has been done to estimate travel time, average
speed, running speed and delay for each link. These data is used to model the conventional UE assignment model by considering MSA algorithm (SheffI.Y, 1985) for solving traffic assignment problem. Weibull probability distribution function has been considered to model the link travel time reliability.
The schematic representation of the study area is shown in Figure-2.
To demonstrate the convergence of the reliability assignment model to the equilibrium solution, it is applied to a simple road network. The network has two links and one O-D pair. The link itself is the path. The characteristics of the link are depicted in Table-1 below. O-D trip rates are 10000 PCUs per hour.
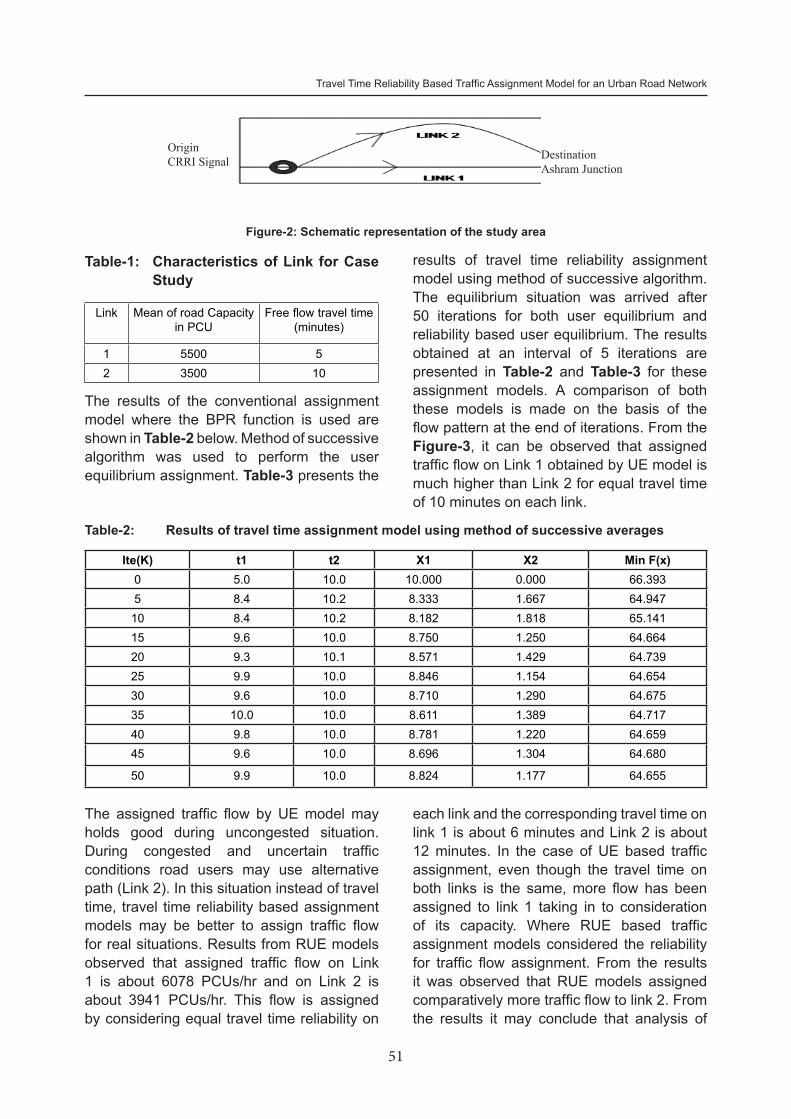
51
Travel Time Reliability Based Traffic Assignment Model for an Urban Road Network
Table-1: Characteristics of Link for Case Study
Link Mean of road Capacity in PCU
Free flow travel time (minutes)
1 5500 52 3500 10
The results of the conventional assignment model where the BPR function is used are shown in Table-2 below. Method of successive algorithm was used to perform the user equilibrium assignment. Table-3 presents the
OriginCRRI Signal Destination
Ashram Junction
Figure-2: Schematic representation of the study area
results of travel time reliability assignment model using method of successive algorithm. The equilibrium situation was arrived after 50 iterations for both user equilibrium and reliability based user equilibrium. The results obtained at an interval of 5 iterations are presented in Table-2 and Table-3 for these assignment models. A comparison of both these models is made on the basis of the flow pattern at the end of iterations. From the Figure-3, it can be observed that assigned traffic flow on Link 1 obtained by UE model is much higher than Link 2 for equal travel time of 10 minutes on each link.
Table-2: Results of travel time assignment model using method of successive averages
Ite(K) t1 t2 X1 X2 Min F(x)0 5.0 10.0 10.000 0.000 66.3935 8.4 10.2 8.333 1.667 64.947
10 8.4 10.2 8.182 1.818 65.14115 9.6 10.0 8.750 1.250 64.66420 9.3 10.1 8.571 1.429 64.73925 9.9 10.0 8.846 1.154 64.65430 9.6 10.0 8.710 1.290 64.67535 10.0 10.0 8.611 1.389 64.71740 9.8 10.0 8.781 1.220 64.65945 9.6 10.0 8.696 1.304 64.680
50 9.9 10.0 8.824 1.177 64.655
The assigned traffic flow by UE model may holds good during uncongested situation. During congested and uncertain traffic conditions road users may use alternative path (Link 2). In this situation instead of travel time, travel time reliability based assignment models may be better to assign traffic flow for real situations. Results from RUE models observed that assigned traffic flow on Link 1 is about 6078 PCUs/hr and on Link 2 is about 3941 PCUs/hr. This flow is assigned by considering equal travel time reliability on
each link and the corresponding travel time on link 1 is about 6 minutes and Link 2 is about 12 minutes. In the case of UE based traffic assignment, even though the travel time on both links is the same, more flow has been assigned to link 1 taking in to consideration of its capacity. Where RUE based traffic assignment models considered the reliability for traffic flow assignment. From the results it was observed that RUE models assigned comparatively more traffic flow to link 2. From the results it may conclude that analysis of
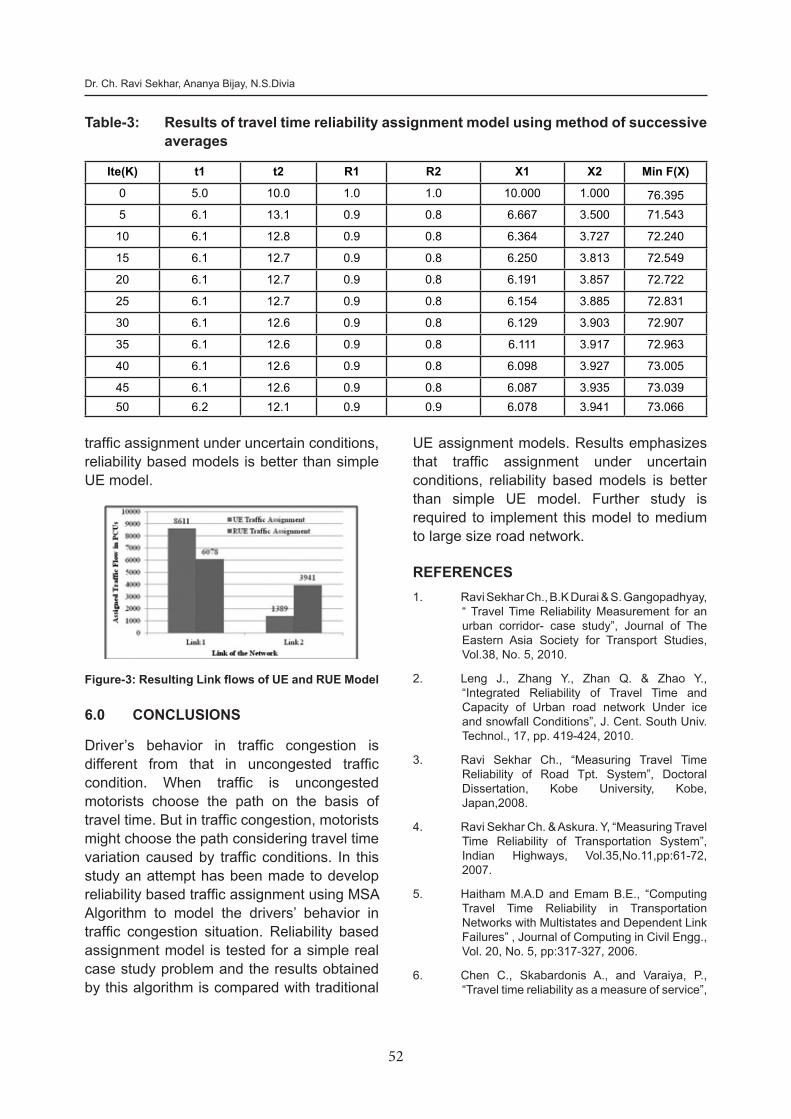
52
Dr. Ch. Ravi Sekhar, Ananya Bijay, N.S.Divia
Table-3: Results of travel time reliability assignment model using method of successive averages
Ite(K) t1 t2 R1 R2 X1 X2 Min F(X)
0 5.0 10.0 1.0 1.0 10.000 1.000 76.3955 6.1 13.1 0.9 0.8 6.667 3.500 71.543
10 6.1 12.8 0.9 0.8 6.364 3.727 72.240
15 6.1 12.7 0.9 0.8 6.250 3.813 72.549
20 6.1 12.7 0.9 0.8 6.191 3.857 72.722
25 6.1 12.7 0.9 0.8 6.154 3.885 72.831
30 6.1 12.6 0.9 0.8 6.129 3.903 72.907
35 6.1 12.6 0.9 0.8 6.111 3.917 72.963
40 6.1 12.6 0.9 0.8 6.098 3.927 73.005
45 6.1 12.6 0.9 0.8 6.087 3.935 73.03950 6.2 12.1 0.9 0.9 6.078 3.941 73.066
traffic assignment under uncertain conditions, reliability based models is better than simple UE model.
Figure-3:ResultingLinkflowsofUEandRUEModel
6.0 CONCLUSIONS
Driver’s behavior in traffic congestion is different from that in uncongested traffic condition. When traffic is uncongested motorists choose the path on the basis of travel time. But in traffic congestion, motorists might choose the path considering travel time variation caused by traffic conditions. In this study an attempt has been made to develop reliability based traffic assignment using MSA Algorithm to model the drivers’ behavior in traffic congestion situation. Reliability based assignment model is tested for a simple real case study problem and the results obtained by this algorithm is compared with traditional
UE assignment models. Results emphasizes that traffic assignment under uncertain conditions, reliability based models is better than simple UE model. Further study is required to implement this model to medium to large size road network.
REFERENCES1. Ravi Sekhar Ch., B.K Durai & S. Gangopadhyay,
“ Travel Time Reliability Measurement for an urban corridor- case study”, Journal of The Eastern Asia Society for Transport Studies, Vol.38, No. 5, 2010.
2. Leng J., Zhang Y., Zhan Q. & Zhao Y., “Integrated Reliability of Travel Time and Capacity of Urban road network Under ice and snowfall Conditions”, J. Cent. South Univ. Technol., 17, pp. 419-424, 2010.
3. Ravi Sekhar Ch., “Measuring Travel Time Reliability of Road Tpt. System”, Doctoral Dissertation, Kobe University, Kobe, Japan,2008.
4. Ravi Sekhar Ch. & Askura. Y, “Measuring Travel Time Reliability of Transportation System”, Indian Highways, Vol.35,No.11,pp:61-72, 2007.
5. Haitham M.A.D and Emam B.E., “Computing Travel Time Reliability in Transportation Networks with Multistates and Dependent Link Failures” , Journal of Computing in Civil Engg., Vol. 20, No. 5, pp:317-327, 2006.
6. Chen C., Skabardonis A., and Varaiya, P., “Travel time reliability as a measure of service”,
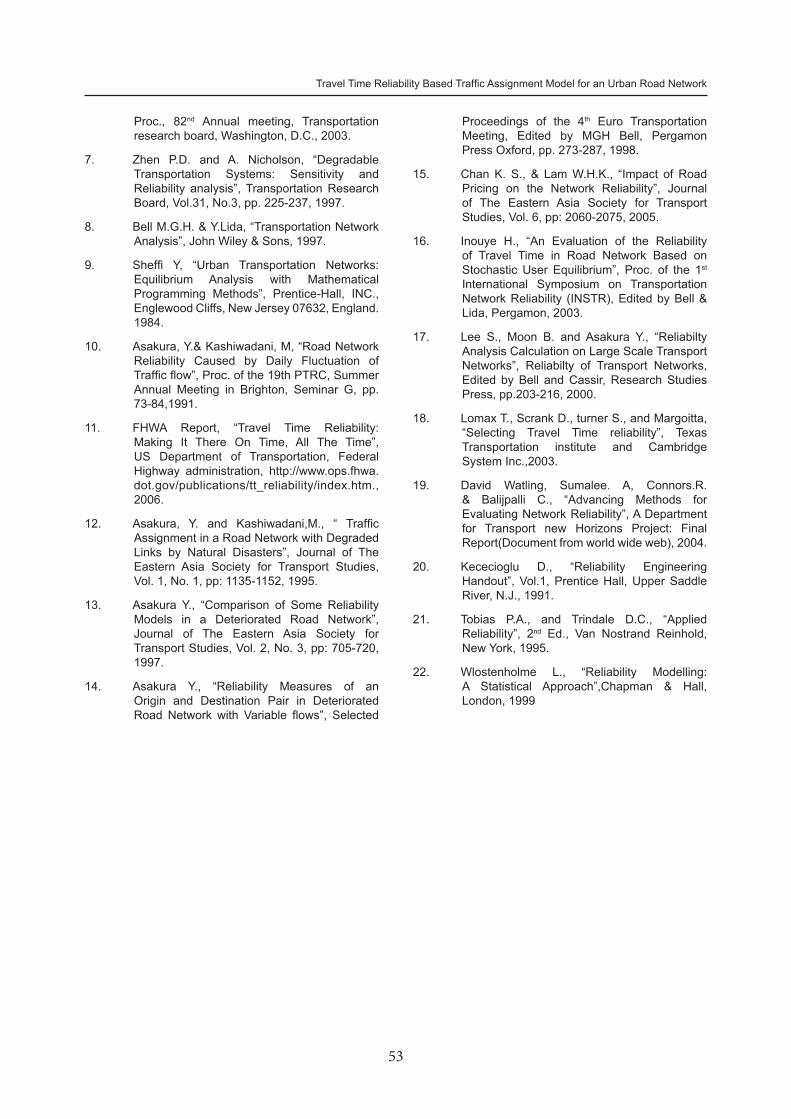
53
Travel Time Reliability Based Traffic Assignment Model for an Urban Road Network
Proc., 82nd Annual meeting, Transportation research board, Washington, D.C., 2003.
7. Zhen P.D. and A. Nicholson, “Degradable Transportation Systems: Sensitivity and Reliability analysis”, Transportation Research Board, Vol.31, No.3, pp. 225-237, 1997.
8. Bell M.G.H. & Y.Lida, “Transportation Network Analysis”, John Wiley & Sons, 1997.
9. Sheffi Y, “Urban Transportation Networks: Equilibrium Analysis with Mathematical Programming Methods”, Prentice-Hall, INC., Englewood Cliffs, New Jersey 07632, England. 1984.
10. Asakura, Y.& Kashiwadani, M, “Road Network Reliability Caused by Daily Fluctuation of Traffic flow”, Proc. of the 19th PTRC, Summer Annual Meeting in Brighton, Seminar G, pp. 73-84,1991.
11. FHWA Report, “Travel Time Reliability: Making It There On Time, All The Time”, US Department of Transportation, Federal Highway administration, http://www.ops.fhwa.dot.gov/publications/tt_reliability/index.htm., 2006.
12. Asakura, Y. and Kashiwadani,M., “ Traffic Assignment in a Road Network with Degraded Links by Natural Disasters”, Journal of The Eastern Asia Society for Transport Studies, Vol. 1, No. 1, pp: 1135-1152, 1995.
13. Asakura Y., “Comparison of Some Reliability Models in a Deteriorated Road Network”, Journal of The Eastern Asia Society for Transport Studies, Vol. 2, No. 3, pp: 705-720, 1997.
14. Asakura Y., “Reliability Measures of an Origin and Destination Pair in Deteriorated Road Network with Variable flows”, Selected
Proceedings of the 4th Euro Transportation Meeting, Edited by MGH Bell, Pergamon Press Oxford, pp. 273-287, 1998.
15. Chan K. S., & Lam W.H.K., “Impact of Road Pricing on the Network Reliability”, Journal of The Eastern Asia Society for Transport Studies, Vol. 6, pp: 2060-2075, 2005.
16. Inouye H., “An Evaluation of the Reliability of Travel Time in Road Network Based on Stochastic User Equilibrium”, Proc. of the 1st International Symposium on Transportation Network Reliability (INSTR), Edited by Bell & Lida, Pergamon, 2003.
17. Lee S., Moon B. and Asakura Y., “Reliabilty Analysis Calculation on Large Scale Transport Networks”, Reliabilty of Transport Networks, Edited by Bell and Cassir, Research Studies Press, pp.203-216, 2000.
18. Lomax T., Scrank D., turner S., and Margoitta, “Selecting Travel Time reliability”, Texas Transportation institute and Cambridge System Inc.,2003.
19. David Watling, Sumalee. A, Connors.R. & Balijpalli C., “Advancing Methods for Evaluating Network Reliability”, A Department for Transport new Horizons Project: Final Report(Document from world wide web), 2004.
20. Kececioglu D., “Reliability Engineering Handout”, Vol.1, Prentice Hall, Upper Saddle River, N.J., 1991.
21. Tobias P.A., and Trindale D.C., “Applied Reliability”, 2nd Ed., Van Nostrand Reinhold, New York, 1995.
22. Wlostenholme L., “Reliability Modelling: A Statistical Approach”,Chapman & Hall, London, 1999
URBAN TRANSPORTJOURNAL
Vol. 12 No. 1, Aug. 2013
FUEL SUBSIDY REMOVAL IN NIGERIA: ITS IMPACTS AND THE WAY FORWARD
Desmond Amiegbebhor*
Abstract: The controversy surrounding the removal of fuel subsidy in Nigeria is a protracted one, considering its posi-tive or negative economic and social implications on the masses. The upstream of the energy sector had been fully deregulated with gradual deregulation of the downstream. Diesel in the downstream subsector has been deregulated, and that has positively affected the availability of the product in circulation. Previous governments had been approach-ing the subject of fuel subsidy removal through gradual increase in pump price. This approach has not addressed the challenges arising from fuel subsidy. In January 2012, a full deregulation was attempted. Conversely, it was met with stiff resistance, which made the government to revert to partial deregulation. It is believed that the government would still completely remove the fuel subsidy to pave way for full deregulation of the sector.
Keywords: Fuel Subsidy, Energy, Fares, Impacts, SURE
1.0 INTRODUCTION
Subsidies were introduced in the Nigerian energy sector in the mid 1980’s.Something of a creeping phenomenon, the value of the subsidies has gone from 1 billion in the 1980s to an expected 6 billion Dollars in 2011. In this period the specific products targeted for subsidy have changed. Diesel oil has had its associated subsidy redacted while Gasoline, kerosene DPK continues to enjoy a 54.4 % subsidy over the international spot market price at the Nigerian pump.
A subsidy by definition is any measure that keeps prices consumers pay for a good or product below market levels for consumers or for producers above market. A subsidy can also be defined basically as government action that decreases the consumption price of the consumer and or increases the selling price of the producer (UNEP, 2002). Subsidies take different forms.
Some subsidies have a direct impact on price. These include grants, tax reductions and exemptions or price controls. Others affect prices or costs indirectly, such as regulations
that skew the market in favor of a particular fuel, government-sponsored technology, or research and development (R&D)
Energy subsidies and specifically fuel subsidies, which are the subject of this review, have a long history and have been applied in different forms with differing outcomes internationally.
Two major classes of subsidies exist. They include:
• Production subsidies, mainly a feature of developed economies;
• Consumer subsidies, which are found mainly in developing countries.
2.0 PROFILE OF NIGERIA
Nigeria is the world’s 14th largest producer of (index mundi) (with10th largest proven reserves) crude oil. It possesses the world’s 8th largest proven natural gas reserves. The country has 4 refineries with an installed production capacity of 445,000 barrels of fuel per day, adequate to meet its domestic needs with a surplus for export.
* Deputy Director, Bus Services in LAMATA
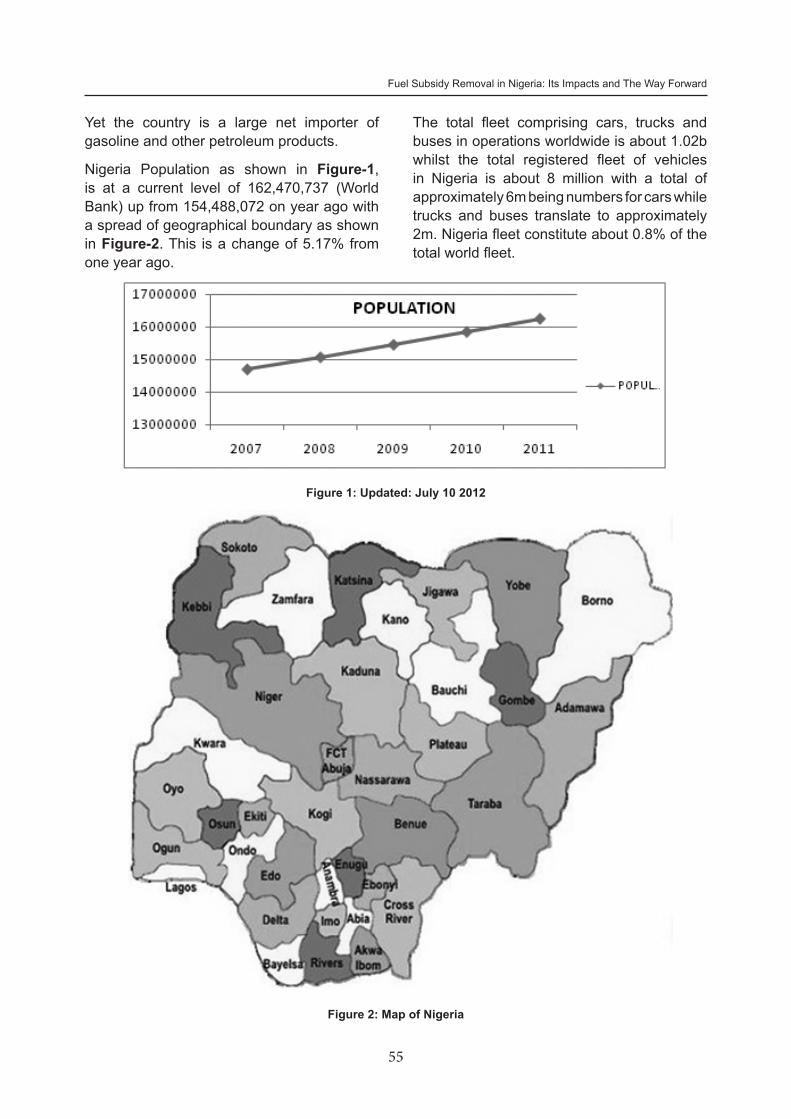
55
Fuel Subsidy Removal in Nigeria: Its Impacts and The Way Forward
Yet the country is a large net importer of gasoline and other petroleum products.
Nigeria Population as shown in Figure-1, is at a current level of 162,470,737 (World Bank) up from 154,488,072 on year ago with a spread of geographical boundary as shown in Figure-2. This is a change of 5.17% from one year ago.
Figure 1: Updated: July 10 2012
The total fleet comprising cars, trucks and buses in operations worldwide is about 1.02b whilst the total registered fleet of vehicles in Nigeria is about 8 million with a total of approximately 6m being numbers for cars while trucks and buses translate to approximately 2m. Nigeria fleet constitute about 0.8% of the total world fleet.
Figure 2: Map of Nigeria
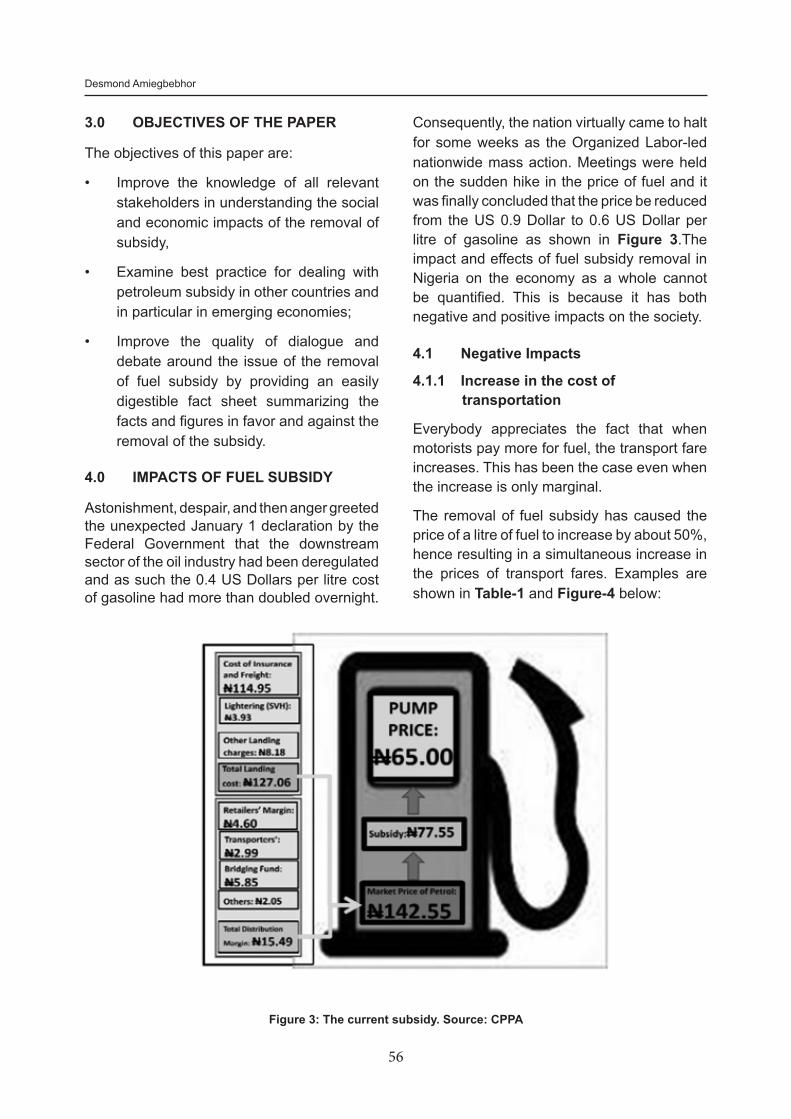
56
Desmond Amiegbebhor
3.0 OBJECTIVES OF THE PAPER
The objectives of this paper are:
• Improve the knowledge of all relevant stakeholders in understanding the social and economic impacts of the removal of subsidy,
• Examine best practice for dealing with petroleum subsidy in other countries and in particular in emerging economies;
• Improve the quality of dialogue and debate around the issue of the removal of fuel subsidy by providing an easily digestible fact sheet summarizing the facts and figures in favor and against the removal of the subsidy.
4.0 IMPACTS OF FUEL SUBSIDY
Astonishment, despair, and then anger greeted the unexpected January 1 declaration by the Federal Government that the downstream sector of the oil industry had been deregulated and as such the 0.4 US Dollars per litre cost of gasoline had more than doubled overnight.
Figure 3: The current subsidy. Source: CPPA
Consequently, the nation virtually came to halt for some weeks as the Organized Labor-led nationwide mass action. Meetings were held on the sudden hike in the price of fuel and it was finally concluded that the price be reduced from the US 0.9 Dollar to 0.6 US Dollar per litre of gasoline as shown in Figure 3.The impact and effects of fuel subsidy removal in Nigeria on the economy as a whole cannot be quantified. This is because it has both negative and positive impacts on the society.
4.1 Negative Impacts
4.1.1 Increase in the cost of transportation
Everybody appreciates the fact that when motorists pay more for fuel, the transport fare increases. This has been the case even when the increase is only marginal.
The removal of fuel subsidy has caused the price of a litre of fuel to increase by about 50%, hence resulting in a simultaneous increase in the prices of transport fares. Examples are shown in Table-1 and Figure-4 below:
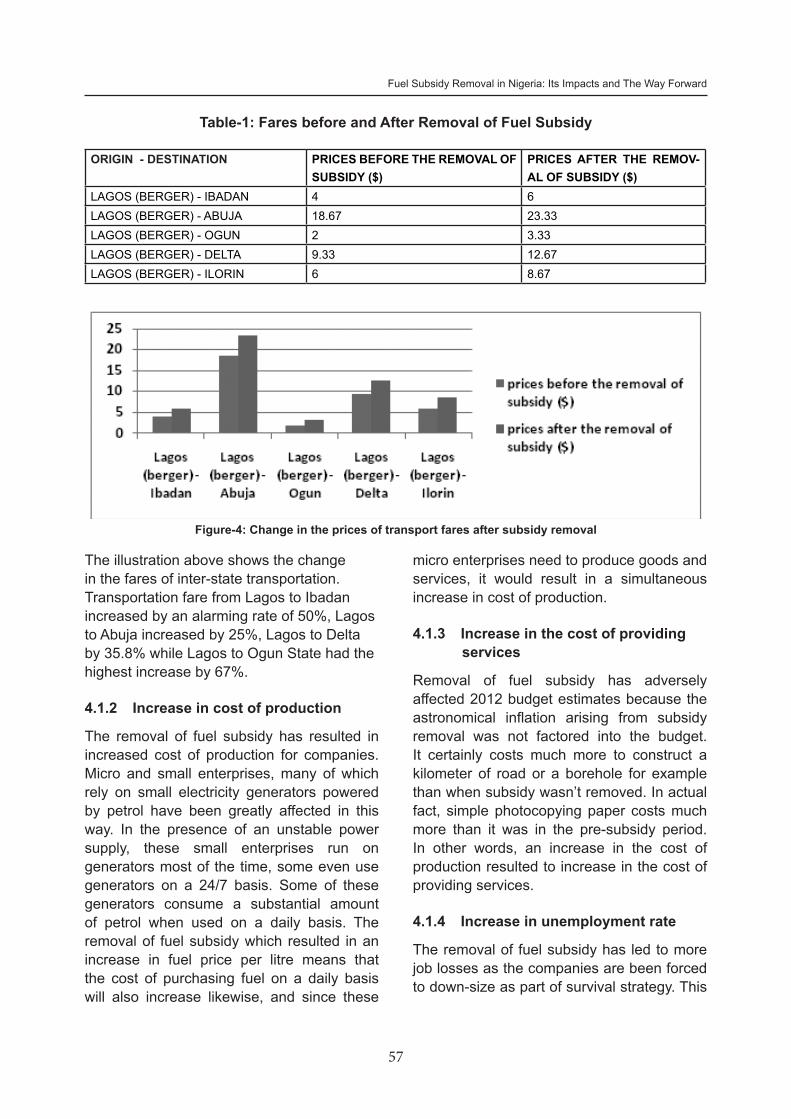
57
Fuel Subsidy Removal in Nigeria: Its Impacts and The Way Forward
Table-1: Fares before and After Removal of Fuel Subsidy
ORIGIN - DESTINATION PRICES BEFORE THE REMOVAL OF SUBSIDY ($)
PRICES AFTER THE REMOV-AL OF SUBSIDY ($)
LAGOS (BERGER) - IBADAN 4 6LAGOS (BERGER) - ABUJA 18.67 23.33LAGOS (BERGER) - OGUN 2 3.33LAGOS (BERGER) - DELTA 9.33 12.67LAGOS (BERGER) - ILORIN 6 8.67
Figure-4: Change in the prices of transport fares after subsidy removal
The illustration above shows the change in the fares of inter-state transportation. Transportation fare from Lagos to Ibadan increased by an alarming rate of 50%, Lagos to Abuja increased by 25%, Lagos to Delta by 35.8% while Lagos to Ogun State had the highest increase by 67%.
4.1.2 Increase in cost of production
The removal of fuel subsidy has resulted in increased cost of production for companies. Micro and small enterprises, many of which rely on small electricity generators powered by petrol have been greatly affected in this way. In the presence of an unstable power supply, these small enterprises run on generators most of the time, some even use generators on a 24/7 basis. Some of these generators consume a substantial amount of petrol when used on a daily basis. The removal of fuel subsidy which resulted in an increase in fuel price per litre means that the cost of purchasing fuel on a daily basis will also increase likewise, and since these
micro enterprises need to produce goods and services, it would result in a simultaneous increase in cost of production.
4.1.3 Increase in the cost of providing services
Removal of fuel subsidy has adversely affected 2012 budget estimates because the astronomical inflation arising from subsidy removal was not factored into the budget. It certainly costs much more to construct a kilometer of road or a borehole for example than when subsidy wasn’t removed. In actual fact, simple photocopying paper costs much more than it was in the pre-subsidy period. In other words, an increase in the cost of production resulted to increase in the cost of providing services.
4.1.4 Increase in unemployment rate
The removal of fuel subsidy has led to more job losses as the companies are been forced to down-size as part of survival strategy. This
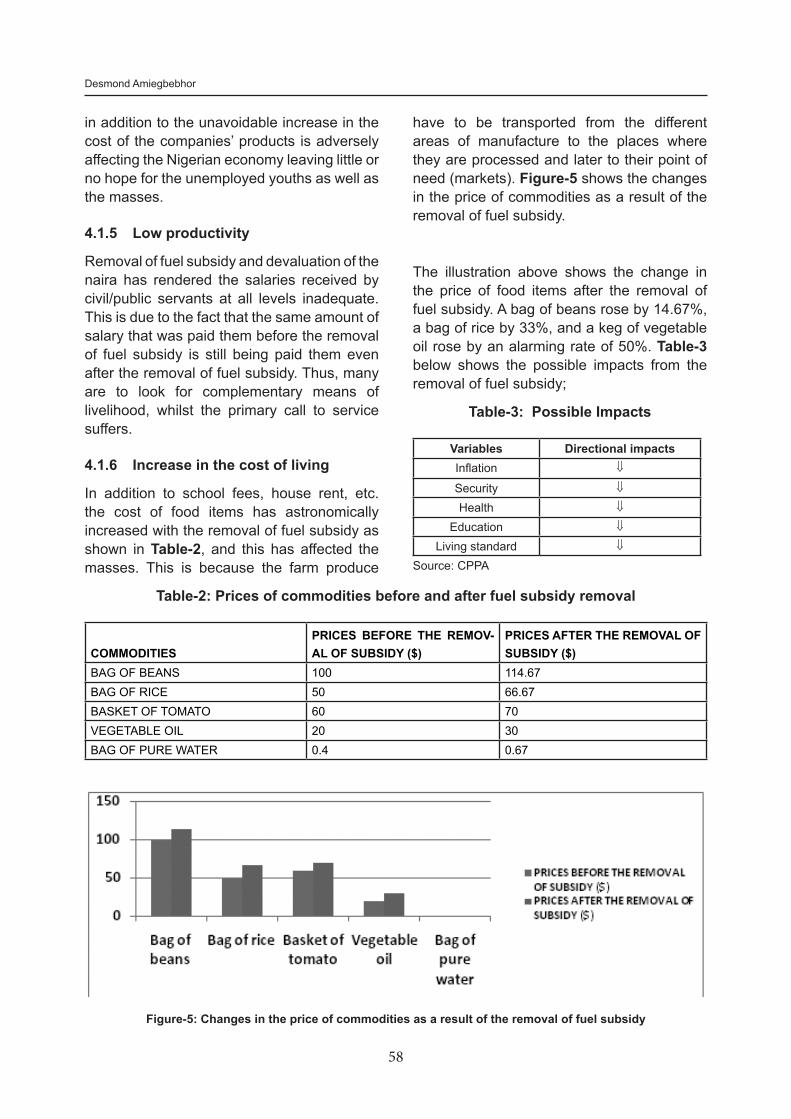
58
Desmond Amiegbebhor
Figure-5: Changes in the price of commodities as a result of the removal of fuel subsidy
in addition to the unavoidable increase in the cost of the companies’ products is adversely affecting the Nigerian economy leaving little or no hope for the unemployed youths as well as the masses.
4.1.5 Low productivity
Removal of fuel subsidy and devaluation of the naira has rendered the salaries received by civil/public servants at all levels inadequate. This is due to the fact that the same amount of salary that was paid them before the removal of fuel subsidy is still being paid them even after the removal of fuel subsidy. Thus, many are to look for complementary means of livelihood, whilst the primary call to service suffers.
4.1.6 Increase in the cost of living
In addition to school fees, house rent, etc. the cost of food items has astronomically increased with the removal of fuel subsidy as shown in Table-2, and this has affected the masses. This is because the farm produce
Table-2: Prices of commodities before and after fuel subsidy removal
COMMODITIESPRICES BEFORE THE REMOV-AL OF SUBSIDY ($)
PRICES AFTER THE REMOVAL OF SUBSIDY ($)
BAG OF BEANS 100 114.67BAG OF RICE 50 66.67BASKET OF TOMATO 60 70VEGETABLE OIL 20 30BAG OF PURE WATER 0.4 0.67
have to be transported from the different areas of manufacture to the places where they are processed and later to their point of need (markets). Figure-5 shows the changes in the price of commodities as a result of the removal of fuel subsidy.
The illustration above shows the change in the price of food items after the removal of fuel subsidy. A bag of beans rose by 14.67%, a bag of rice by 33%, and a keg of vegetable oil rose by an alarming rate of 50%. Table-3 below shows the possible impacts from the removal of fuel subsidy;
Table-3: Possible Impacts
Variables Directional impactsInflation ⇓
Security ⇓
Health ⇓
Education ⇓
Living standard ⇓
Source: CPPA
59
Fuel Subsidy Removal in Nigeria: Its Impacts and The Way Forward
Though the negative impacts of the removal of fuel subsidy are numerous, it is expected that the removal of fuel subsidy would benefit the economy and the citizens of Nigeria in different ways. These ways are explained below:
4.2 Positive Impacts
4.2.1 Controlled motorisation
Many people have begun to rationalize how they use their vehicles now because of this new fuel regime. Rather one person using a car, three or more people now occupies such a vehicle. Hence, mass transportation carpooling is been greatly encouraged.
4.2.2 Dominance of urban transport
Since the removal of fuel subsidy, urban transportation has become increasingly a major topical issue arising from its impact on the commuting public. The dominant mode of public transport in developing countries is road-based. Public transport as an integral back bone of urban life is one of the factors which determine the form and socio-economic development of a city (Santhakumar, 2003). The importance of public transport stemmed from the fact that it provides mobility for those who cannot afford to buy a car and helps in creating and maintaining livable communities by relieving highway congestion and assuring long term sustainability in terms of resource consumption and the environment (Paul, 2001).
Transportation provides a very efficient means of moving large number of people with considerable flexibility in order to meet demand throughout the city (Armstrong-Wright, 1999). It plays key role in shaping urban and rural landscape through its influences on the form and size of settlements, the style and pace of life by facilitating trade, permitting access to people and resources, and enabling greater economies of scale (Santha kumar, 2003). Problems pervading urban transport sector in most developing countries range from inadequate and poor quality of infrastructures,
mismatch between demand and supply to increased rate of accident. The problems are triggered by interrelated trends such as urban population growth; rapid, unplanned and uncoordinated growth of cities.
4.2.3 Foreign investors’ interest
Following the dominance of urban public transportation, is the foreign investors’ yearning to set up various vehicles assembling plants in Nigeria. This is informed by the huge bus markets as a result of both government and private sector interest to invest in urban transportation.
4.2.4 Reductioningasflaring
It’s no news that the Nigerian oil sector loses 40% of her oil produce annually to the mis-managing hands of flaring. Flaring causes pollution and subsequently the depletion of the ozone layer. The removal of subsidy has led to a drop in the number of companies engaged in gas flaring as no company will want to lose that much.
4.2.5 Alternative source of fuel
With the price of petroleum product sky-rocketing since the removal of subsidy, Nigerians are exploring alternative means of fuel. This has resulted to (Compressed Natural Gas) CNG option which is currently gaining some buy-in in the Nigerian energy market.
4.2.6 Gasoline Versus Diesel
It has been recorded that large buses have increased by about 2% in the last couple of months. This was due to the subsidy removal on the price of petrol (Aregbesola, 2012). According to chemical engineers, diesel engines are more efficient because of the diesel engine process, which burns fuel at a much higher temperature than regular gasoline engines, promoting more-efficient fuel combustion. Also, diesel fuel has a higher energy density than standard gasoline, meaning it takes less fuel to provide the same
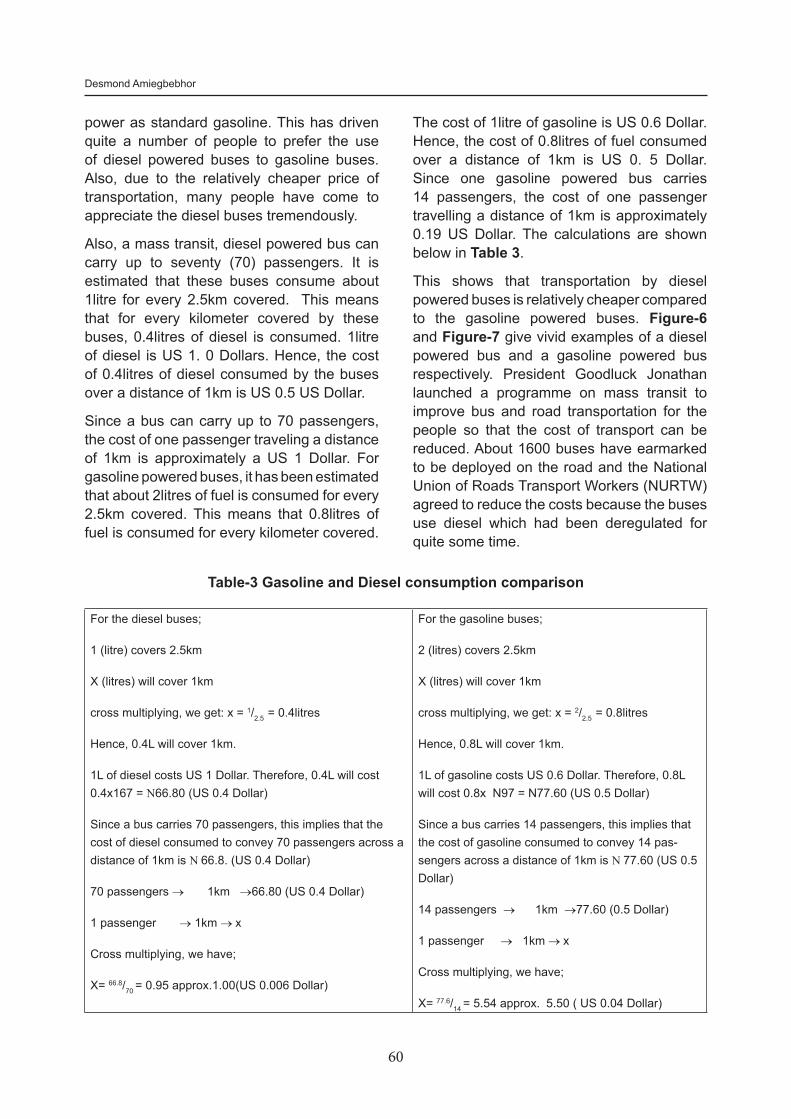
60
Desmond Amiegbebhor
power as standard gasoline. This has driven quite a number of people to prefer the use of diesel powered buses to gasoline buses. Also, due to the relatively cheaper price of transportation, many people have come to appreciate the diesel buses tremendously.
Also, a mass transit, diesel powered bus can carry up to seventy (70) passengers. It is estimated that these buses consume about 1litre for every 2.5km covered. This means that for every kilometer covered by these buses, 0.4litres of diesel is consumed. 1litre of diesel is US 1. 0 Dollars. Hence, the cost of 0.4litres of diesel consumed by the buses over a distance of 1km is US 0.5 US Dollar.
Since a bus can carry up to 70 passengers, the cost of one passenger traveling a distance of 1km is approximately a US 1 Dollar. For gasoline powered buses, it has been estimated that about 2litres of fuel is consumed for every 2.5km covered. This means that 0.8litres of fuel is consumed for every kilometer covered.
Table-3 Gasoline and Diesel consumption comparison
For the diesel buses;
1 (litre) covers 2.5km
X (litres) will cover 1km
cross multiplying, we get: x = 1/2.5 = 0.4litres
Hence, 0.4L will cover 1km.
1L of diesel costs US 1 Dollar. Therefore, 0.4L will cost 0.4x167 = N66.80 (US 0.4 Dollar)
Since a bus carries 70 passengers, this implies that the cost of diesel consumed to convey 70 passengers across a distance of 1km is N 66.8. (US 0.4 Dollar)
70 passengers → 1km →66.80 (US 0.4 Dollar)
1 passenger → 1km → x
Cross multiplying, we have;
X= 66.8/70 = 0.95 approx.1.00(US 0.006 Dollar)
For the gasoline buses;
2 (litres) covers 2.5km
X (litres) will cover 1km
cross multiplying, we get: x = 2/2.5 = 0.8litres
Hence, 0.8L will cover 1km.
1L of gasoline costs US 0.6 Dollar. Therefore, 0.8L will cost 0.8x N97 = N77.60 (US 0.5 Dollar)
Since a bus carries 14 passengers, this implies that the cost of gasoline consumed to convey 14 pas-sengers across a distance of 1km is N 77.60 (US 0.5 Dollar)
14 passengers → 1km →77.60 (0.5 Dollar)
1 passenger → 1km → x
Cross multiplying, we have;
X= 77.6/14 = 5.54 approx. 5.50 ( US 0.04 Dollar)
The cost of 1litre of gasoline is US 0.6 Dollar. Hence, the cost of 0.8litres of fuel consumed over a distance of 1km is US 0. 5 Dollar. Since one gasoline powered bus carries 14 passengers, the cost of one passenger travelling a distance of 1km is approximately 0.19 US Dollar. The calculations are shown below in Table 3.
This shows that transportation by diesel powered buses is relatively cheaper compared to the gasoline powered buses. Figure-6 and Figure-7 give vivid examples of a diesel powered bus and a gasoline powered bus respectively. President Goodluck Jonathan launched a programme on mass transit to improve bus and road transportation for the people so that the cost of transport can be reduced. About 1600 buses have earmarked to be deployed on the road and the National Union of Roads Transport Workers (NURTW) agreed to reduce the costs because the buses use diesel which had been deregulated for quite some time.
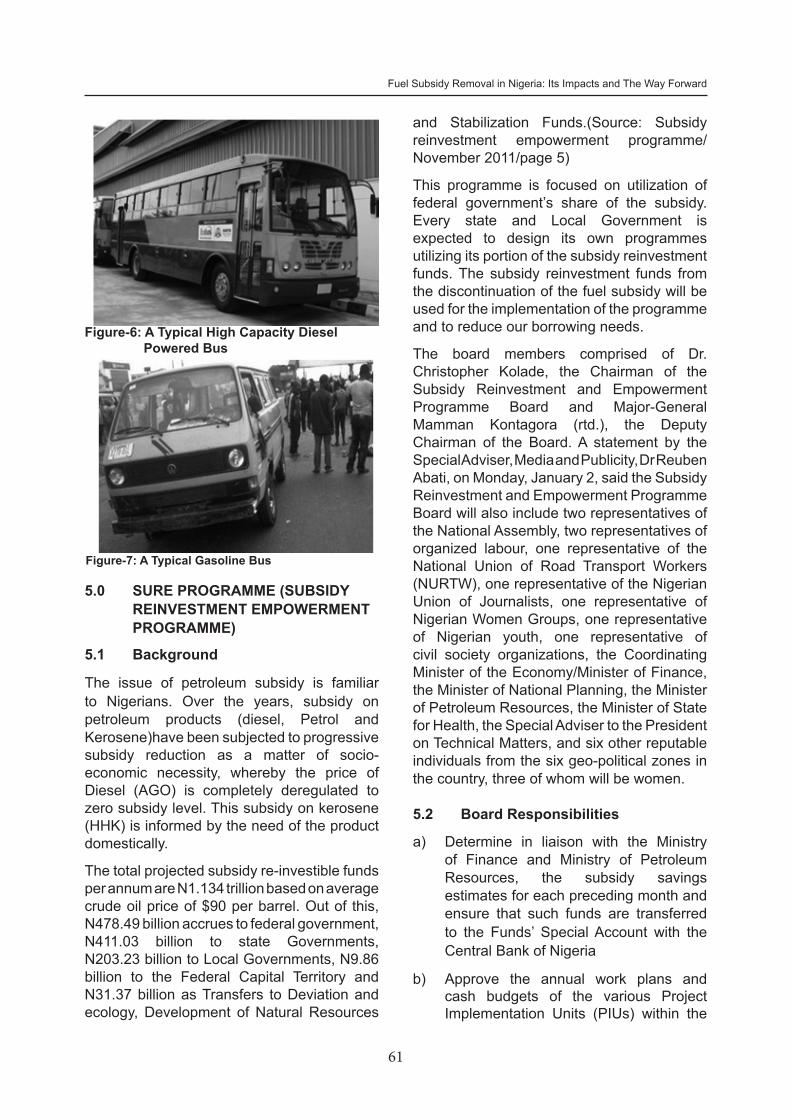
61
Fuel Subsidy Removal in Nigeria: Its Impacts and The Way Forward
Figure-6: A Typical High Capacity Diesel Powered Bus
and Stabilization Funds.(Source: Subsidy reinvestment empowerment programme/November 2011/page 5)
This programme is focused on utilization of federal government’s share of the subsidy. Every state and Local Government is expected to design its own programmes utilizing its portion of the subsidy reinvestment funds. The subsidy reinvestment funds from the discontinuation of the fuel subsidy will be used for the implementation of the programme and to reduce our borrowing needs.
The board members comprised of Dr. Christopher Kolade, the Chairman of the Subsidy Reinvestment and Empowerment Programme Board and Major-General Mamman Kontagora (rtd.), the Deputy Chairman of the Board. A statement by the Special Adviser, Media and Publicity, Dr Reuben Abati, on Monday, January 2, said the Subsidy Reinvestment and Empowerment Programme Board will also include two representatives of the National Assembly, two representatives of organized labour, one representative of the National Union of Road Transport Workers (NURTW), one representative of the Nigerian Union of Journalists, one representative of Nigerian Women Groups, one representative of Nigerian youth, one representative of civil society organizations, the Coordinating Minister of the Economy/Minister of Finance, the Minister of National Planning, the Minister of Petroleum Resources, the Minister of State for Health, the Special Adviser to the President on Technical Matters, and six other reputable individuals from the six geo-political zones in the country, three of whom will be women.
5.2 Board Responsibilities
a) Determine in liaison with the Ministry of Finance and Ministry of Petroleum Resources, the subsidy savings estimates for each preceding month and ensure that such funds are transferred to the Funds’ Special Account with the Central Bank of Nigeria
b) Approve the annual work plans and cash budgets of the various Project Implementation Units (PIUs) within the
Figure-7: A Typical Gasoline Bus
5.0 SURE PROGRAMME (SUBSIDY REINVESTMENT EMPOWERMENT PROGRAMME)
5.1 Background
The issue of petroleum subsidy is familiar to Nigerians. Over the years, subsidy on petroleum products (diesel, Petrol and Kerosene)have been subjected to progressive subsidy reduction as a matter of socio-economic necessity, whereby the price of Diesel (AGO) is completely deregulated to zero subsidy level. This subsidy on kerosene (HHK) is informed by the need of the product domestically.
The total projected subsidy re-investible funds per annum are N1.134 trillion based on average crude oil price of $90 per barrel. Out of this, N478.49 billion accrues to federal government, N411.03 billion to state Governments, N203.23 billion to Local Governments, N9.86 billion to the Federal Capital Territory and N31.37 billion as Transfers to Deviation and ecology, Development of Natural Resources
62
Desmond Amiegbebhor
Ministries, Departments and Agencies (MDAs) and ensure orderly disbursement of funds by the PIUs in order to certify and execute projects;
C) Monitor and evaluate execution of the funded projects, including periodic Poverty and Social Impact Analyses (PSIA)
d) Update the President regularly on the programme;
e) Periodically brief the Executive Council of the Federation on the progress of the programme;
f) Appoint consulting firms with international reputation to provide technical assistance to the Board in financial and project management;
h) Appoint external auditors for the fund;
i) Do such other things as are necessary or incidental to the objective of the Fund or as may be assigned by the Federal Government;
6.0 WAY FORWARD
The way forward for the government in the issue of subsidy removal is as follows;
• Government has commenced the repairs of the refineries. Fuel subsidy should be removed as soon as these new refineries are operational. Once the refineries are operational, it is expected that there would be maximum production to meet local demand. The partial removal of fuel subsidy therefore should be channeled to fund the repairs.
• Government should vigorously pursue the revitalization of the railways. As an alternative to road transport.
• Government should invest in Mass Transit provision for the masses to be supported with subsidy to ensure low fares for the commuting public
• Government should in subsequent attempt strategically carry out public enlightenment for the masses to minimize wrong information to the public.
• Finally, Private companies should be encouraged to start building refineries now with the assurance that subsidy would be removed before they start production.
ACKNOWLEDGEMENTSThe author acknowledges the efforts of Uonye Ifeanyichukwu, Olumide Moses and Ridwan Aluko (Industrial Attachment students from Lagos State University) for their in-depth assistance in researches and contributions towards this work. In addition, l wish to express my appreciation to Irene Okhade for her support
REFERENCES1. UNEP (2003) Energies subsidies: Lessons
learned in assessing their impact and designing policy reforms, UNEP, Geneva.
2. World Bank (2010) Subsidies in the energy sector: An Overview. The World Bank Group Available online at: http://siteresources.worldbank.org/EXTESC/Resources/Subsidy_background_paper.pdf
3. Adebiyi. O. (October 27, 2011). Fuel subsidy: The true story. 234Next. Available online at: http://234next.com/csp/cms/sites/Next/Home/5746467182/fuel_subsidy_the_true_story.csp
4. Central Bank of Nigeria. (CBN). (2009). Annual Statistical Bulletin. Available online at: http://www.cenbank.org/documents/Statbulletin.asp.
5. Subsidy reinvestment empowerment programme/November 2011/page 5
6. http://ask.cars.com/2007/05/diesel_gas_mile.html
7. Paul, J. (2001). Transport network development in developing countries, Sydney, McDonald Printing Press.
8. Santhakumar, S.K. (2003). Transportation System Management for Madurai city using GIS Madurai Map of India Publication.
9. By Anthony Kola-Olusanya, PhD Thesis. http://mobile.saharareporters.com/article/if-nigerians-must-pay-higher-fuel-gej-and-government-must-refund-nigerians-what-it-owes-them
10. World Development Indicators. http://ycharts.com/indicators/nigeria_population
11. Auto Beat Insider, World Vehicle. http://autobeatinsider.com/news/worlds-vehicle-fleet-tops-1-billion
URBAN TRANSPORTJOURNAL
Vol. 12 No. 1, Aug. 2013
ROLE OF INFORMAL BUS OPERATORS IN THE CITY OF ADDIS ABABA, ETHIOPIA
Fekadu K.*
Abstract: Informal transport is just one of the many sectors of the underground economy that thrives in many third world countries. This paper is based on an empirical study of informal bus operators in the city of Addis Ababa. The study finding shows that most Mini bus belong to the informal sector, while medium and large buses are normally run by formal operators. The rise of informality during on-journey seasons is due to the existing congestion of passenger in formal industry, the prevalence of low quality and quantity of formal services and it also inspires the accommodation of illegal man power contributes more.
Keywords: Informal Transport, GPS Tools, Bus Transport, Informal Operators, Long Distance Bus (LBD)
1.0 INTRODUCTION
1.1 Background
Informal bus transport is the operation that is carried out in an unlawful to the formal industry. It is the term best reflects the operators in the sector that functionalize their buses informally, somewhat driving outside the officially sanctioned public transport sector. It has known for their illegal operation that found on non-sanctioned status that makes them illegal. In short, they are also unsanctioned in their actions as the whole. In some place, operators’ lack the necessary permits or registration for the market entry in what is a restricted and regulated market place (HABITAT, 2000). The term informal public transport is used to refer to the collective passengers with little or no control of its operations by an overall regulatory authority usually provides an unplanned and ad-hoc service, insufficient or no respect for routes and no published or fixed fare structure (UITP, 2010).
HABITAT (2000) indicates that the informal transport is about as close to laissez-faire transportation systems. Through the invisible hand of the market place because it is
undertaken by those who are willing to pay for transport services make deals for lifts with those who are willing-to-provide. The same account explicitly forward that the informality is happen only because of regulations and rules are laxly enforced that unlicensed operators are “informally” able to step in and pick up where public transport operators have left off. In spite of such transgressions, in many cases, the informal transport sector is tolerated by public authorities, allowed to exist as long as it remains more or less “invisible” to most motorists, confined to the low-income neighborhoods.
On the subject of its quantity has been increase from time to time and vis-a-vis. In most part of the world it has shown numerical rise. Brasileir et al (2001), he thoroughly proved that the illegal inter-city transportation has been increasingly practiced pre dominated by microbuses, which leave São Paulo City for the inner part of the São Paulo State or even for the Northeast. Where, in selected areas, it was going to be in downing manner in terms of supply and demand. For instance, in sub Sehara African countries, the supply of informal buses fell by 12 percent between 1986 and 1989, when population was grows
* Department of Geography and Environmental Studies, Arbamnich University, Ethiopia

64
Fekadu k.
by 6 to 9 percent (Habitat, 2000). However, its number grows from time to time according to the peoples demand.
It has provided various advantages directly to the operators, society and the owners. Kenneth (2006) and Gomez (1990), in many developing countries transport needs of the poor better met to ensure that the informal sector. The informal sector already plays an important role in public transport in many cities in Latin America, Africa and East Asia, and often provides services that are no longer available from the regulated transport operator. It also encourages the growth of the informal sector can have significant effects directly on reduce poverty because of the entrepreneurial and income-generating possibilities that it offers to the poor. They are also more maneuverable in busy traffic and can accelerate and decelerate faster. The other studies show that the passengers also tend to feel more secure in a smaller vehicle, and also Mini bus riders enjoy the camaraderie and “friendliness” of riding in cozy quarters.
Ethiopia is found in the Horn of Africa with the area coverage approximately 1,221,900 square kilometers. World Bank (2008) depicts that Ethiopia has a population of 76.5 million in 2007 that made the nation the second most populous in Africa, after Nigeria, but the present population of Ethiopia will be more than 80 million and it will reach 106 million by 2020 (CSA, 1998). Addis Ababa is the capital city of Ethiopia and Africa. It is the largest city in Ethiopia, with a population of 3,384,569 according to the 2007 population census (CSA, 2007). And various estimates depict that until 2020 the city is expected to host 6-7 million inhabitants. The City of Addis Ababa has the dual status of both a city and a state capital (CSA, 2007 and MoFED, 2006) (Map-1).
In Ethiopia, the word informality also refers the operators that fail to wait their turn and begin to
load without their turn. And also, in rare case, it describe for those who haven’t meet the certification requirements of the commercial bus transport such as minimum vehicle size, maximum age, or fitness standards and leveling divisions (MOTC, 2011).
The bus sector transport primarily consists of Mini buses, microbuses, and other modes that often lumped together under marked scaled down versions of the collective ride transport that capture the full spectrum of the service options that lie between conventional buses and single passenger taxis (Gomez Meyer, 1990). The public transport service in the entire world offers by both on formal and informal ways. It was chiefly observed on the majority of the service within the metropolitan area and also on some specific places was also included. The formal or informal characteristics of public transport in Africa are primarily related to both the regulatory and operating mode of the transport and its internal management system (UITP, 2010).
However, Informal transport is just one of many sectors of the underground economy that thrives in many third-world countries. It has also similar feature that can be seen in Ethiopia and study areas.
As a consequence, and in order to make the comparison between the formal and informal transport and the prevalence of informality (UITP, 2010) studies, a large part of the daily trips in African cities carried out by formal bus transport, but it is dominates by the informal operators, its rate is ranging high on small bus seats from 4 to 30 seats. In many Africans cities, there is the use of informal transport mostly for inter urban trips. It shows that they don’t have other traveling option and no alternative way to make intercity travel than that of the formal one.
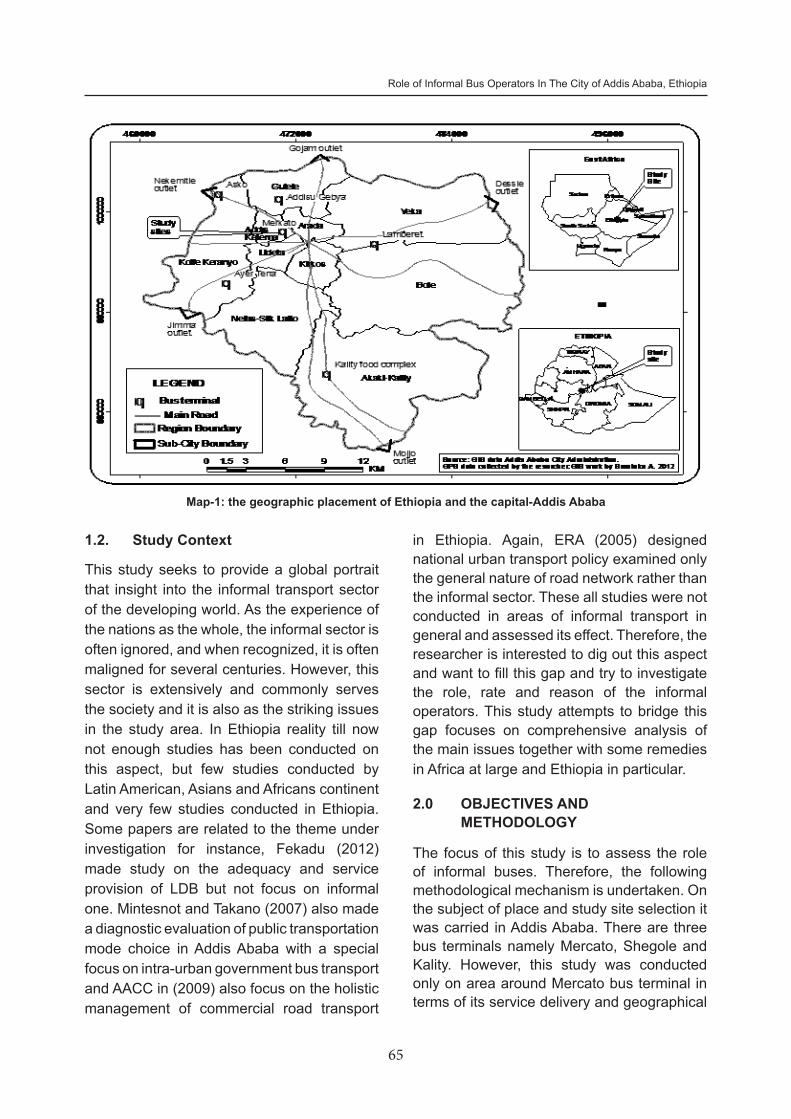
65
Role of Informal Bus Operators In The City of Addis Ababa, Ethiopia
1.2. Study Context
This study seeks to provide a global portrait that insight into the informal transport sector of the developing world. As the experience of the nations as the whole, the informal sector is often ignored, and when recognized, it is often maligned for several centuries. However, this sector is extensively and commonly serves the society and it is also as the striking issues in the study area. In Ethiopia reality till now not enough studies has been conducted on this aspect, but few studies conducted by Latin American, Asians and Africans continent and very few studies conducted in Ethiopia. Some papers are related to the theme under investigation for instance, Fekadu (2012) made study on the adequacy and service provision of LDB but not focus on informal one. Mintesnot and Takano (2007) also made a diagnostic evaluation of public transportation mode choice in Addis Ababa with a special focus on intra-urban government bus transport and AACC in (2009) also focus on the holistic management of commercial road transport
in Ethiopia. Again, ERA (2005) designed national urban transport policy examined only the general nature of road network rather than the informal sector. These all studies were not conducted in areas of informal transport in general and assessed its effect. Therefore, the researcher is interested to dig out this aspect and want to fill this gap and try to investigate the role, rate and reason of the informal operators. This study attempts to bridge this gap focuses on comprehensive analysis of the main issues together with some remedies in Africa at large and Ethiopia in particular.
2.0 OBJECTIVES AND METHODOLOGY
The focus of this study is to assess the role of informal buses. Therefore, the following methodological mechanism is undertaken. On the subject of place and study site selection it was carried in Addis Ababa. There are three bus terminals namely Mercato, Shegole and Kality. However, this study was conducted only on area around Mercato bus terminal in terms of its service delivery and geographical
Map-1: the geographic placement of Ethiopia and the capital-Addis Ababa
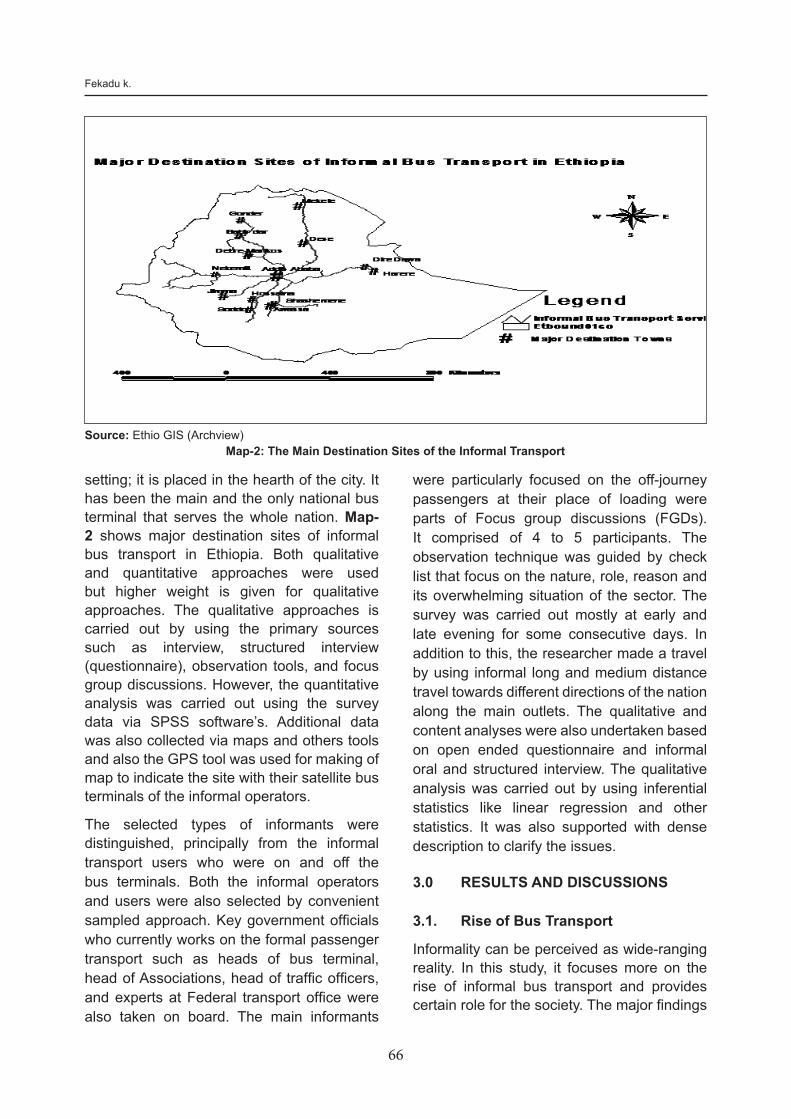
66
Fekadu k.
setting; it is placed in the hearth of the city. It has been the main and the only national bus terminal that serves the whole nation. Map-2 shows major destination sites of informal bus transport in Ethiopia. Both qualitative and quantitative approaches were used but higher weight is given for qualitative approaches. The qualitative approaches is carried out by using the primary sources such as interview, structured interview (questionnaire), observation tools, and focus group discussions. However, the quantitative analysis was carried out using the survey data via SPSS software’s. Additional data was also collected via maps and others tools and also the GPS tool was used for making of map to indicate the site with their satellite bus terminals of the informal operators.
The selected types of informants were distinguished, principally from the informal transport users who were on and off the bus terminals. Both the informal operators and users were also selected by convenient sampled approach. Key government officials who currently works on the formal passenger transport such as heads of bus terminal, head of Associations, head of traffic officers, and experts at Federal transport office were also taken on board. The main informants
Map-2: The Main Destination Sites of the Informal TransportSource: Ethio GIS (Archview)
were particularly focused on the off-journey passengers at their place of loading were parts of Focus group discussions (FGDs). It comprised of 4 to 5 participants. The observation technique was guided by check list that focus on the nature, role, reason and its overwhelming situation of the sector. The survey was carried out mostly at early and late evening for some consecutive days. In addition to this, the researcher made a travel by using informal long and medium distance travel towards different directions of the nation along the main outlets. The qualitative and content analyses were also undertaken based on open ended questionnaire and informal oral and structured interview. The qualitative analysis was carried out by using inferential statistics like linear regression and other statistics. It was also supported with dense description to clarify the issues.
3.0 RESULTS AND DISCUSSIONS
3.1. Rise of Bus Transport
Informality can be perceived as wide-ranging reality. In this study, it focuses more on the rise of informal bus transport and provides certain role for the society. The major findings
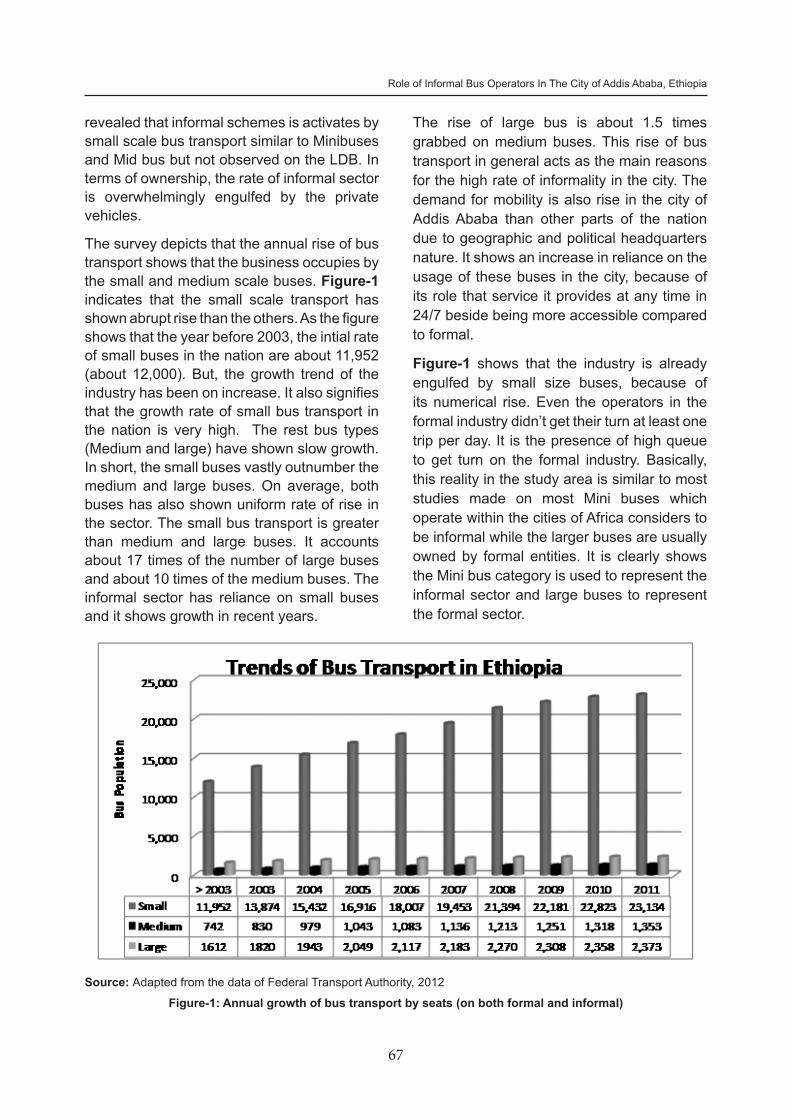
67
Role of Informal Bus Operators In The City of Addis Ababa, Ethiopia
revealed that informal schemes is activates by small scale bus transport similar to Minibuses and Mid bus but not observed on the LDB. In terms of ownership, the rate of informal sector is overwhelmingly engulfed by the private vehicles.
The survey depicts that the annual rise of bus transport shows that the business occupies by the small and medium scale buses. Figure-1 indicates that the small scale transport has shown abrupt rise than the others. As the figure shows that the year before 2003, the intial rate of small buses in the nation are about 11,952 (about 12,000). But, the growth trend of the industry has been on increase. It also signifies that the growth rate of small bus transport in the nation is very high. The rest bus types (Medium and large) have shown slow growth. In short, the small buses vastly outnumber the medium and large buses. On average, both buses has also shown uniform rate of rise in the sector. The small bus transport is greater than medium and large buses. It accounts about 17 times of the number of large buses and about 10 times of the medium buses. The informal sector has reliance on small buses and it shows growth in recent years.
Figure-1: Annual growth of bus transport by seats (on both formal and informal)Source: Adapted from the data of Federal Transport Authority, 2012
The rise of large bus is about 1.5 times grabbed on medium buses. This rise of bus transport in general acts as the main reasons for the high rate of informality in the city. The demand for mobility is also rise in the city of Addis Ababa than other parts of the nation due to geographic and political headquarters nature. It shows an increase in reliance on the usage of these buses in the city, because of its role that service it provides at any time in 24/7 beside being more accessible compared to formal.
Figure-1 shows that the industry is already engulfed by small size buses, because of its numerical rise. Even the operators in the formal industry didn’t get their turn at least one trip per day. It is the presence of high queue to get turn on the formal industry. Basically, this reality in the study area is similar to most studies made on most Mini buses which operate within the cities of Africa considers to be informal while the larger buses are usually owned by formal entities. It is clearly shows the Mini bus category is used to represent the informal sector and large buses to represent the formal sector.
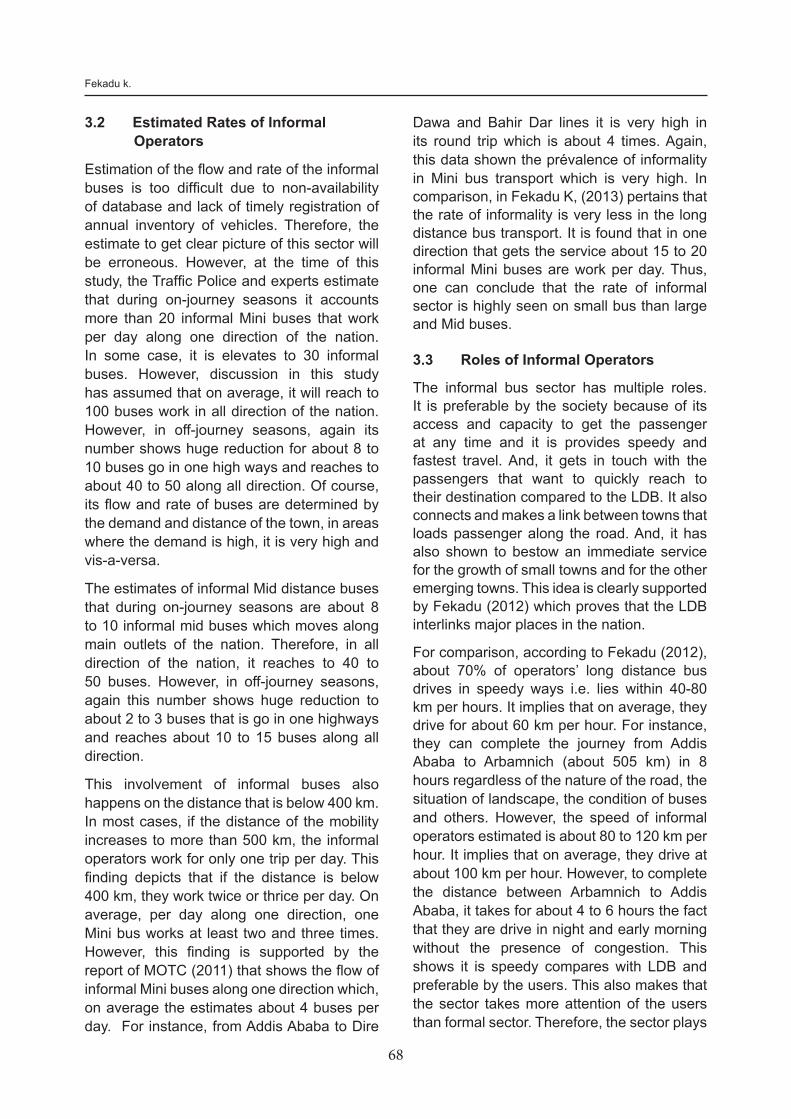
68
Fekadu k.
3.2 Estimated Rates of Informal Operators
Estimation of the flow and rate of the informal buses is too difficult due to non-availability of database and lack of timely registration of annual inventory of vehicles. Therefore, the estimate to get clear picture of this sector will be erroneous. However, at the time of this study, the Traffic Police and experts estimate that during on-journey seasons it accounts more than 20 informal Mini buses that work per day along one direction of the nation. In some case, it is elevates to 30 informal buses. However, discussion in this study has assumed that on average, it will reach to 100 buses work in all direction of the nation. However, in off-journey seasons, again its number shows huge reduction for about 8 to 10 buses go in one high ways and reaches to about 40 to 50 along all direction. Of course, its flow and rate of buses are determined by the demand and distance of the town, in areas where the demand is high, it is very high and vis-a-versa.
The estimates of informal Mid distance buses that during on-journey seasons are about 8 to 10 informal mid buses which moves along main outlets of the nation. Therefore, in all direction of the nation, it reaches to 40 to 50 buses. However, in off-journey seasons, again this number shows huge reduction to about 2 to 3 buses that is go in one highways and reaches about 10 to 15 buses along all direction.
This involvement of informal buses also happens on the distance that is below 400 km. In most cases, if the distance of the mobility increases to more than 500 km, the informal operators work for only one trip per day. This finding depicts that if the distance is below 400 km, they work twice or thrice per day. On average, per day along one direction, one Mini bus works at least two and three times. However, this finding is supported by the report of MOTC (2011) that shows the flow of informal Mini buses along one direction which, on average the estimates about 4 buses per day. For instance, from Addis Ababa to Dire
Dawa and Bahir Dar lines it is very high in its round trip which is about 4 times. Again, this data shown the prévalence of informality in Mini bus transport which is very high. In comparison, in Fekadu K, (2013) pertains that the rate of informality is very less in the long distance bus transport. It is found that in one direction that gets the service about 15 to 20 informal Mini buses are work per day. Thus, one can conclude that the rate of informal sector is highly seen on small bus than large and Mid buses.
3.3 Roles of Informal Operators
The informal bus sector has multiple roles. It is preferable by the society because of its access and capacity to get the passenger at any time and it is provides speedy and fastest travel. And, it gets in touch with the passengers that want to quickly reach to their destination compared to the LDB. It also connects and makes a link between towns that loads passenger along the road. And, it has also shown to bestow an immediate service for the growth of small towns and for the other emerging towns. This idea is clearly supported by Fekadu (2012) which proves that the LDB interlinks major places in the nation.
For comparison, according to Fekadu (2012), about 70% of operators’ long distance bus drives in speedy ways i.e. lies within 40-80 km per hours. It implies that on average, they drive for about 60 km per hour. For instance, they can complete the journey from Addis Ababa to Arbamnich (about 505 km) in 8 hours regardless of the nature of the road, the situation of landscape, the condition of buses and others. However, the speed of informal operators estimated is about 80 to 120 km per hour. It implies that on average, they drive at about 100 km per hour. However, to complete the distance between Arbamnich to Addis Ababa, it takes for about 4 to 6 hours the fact that they are drive in night and early morning without the presence of congestion. This shows it is speedy compares with LDB and preferable by the users. This also makes that the sector takes more attention of the users than formal sector. Therefore, the sector plays
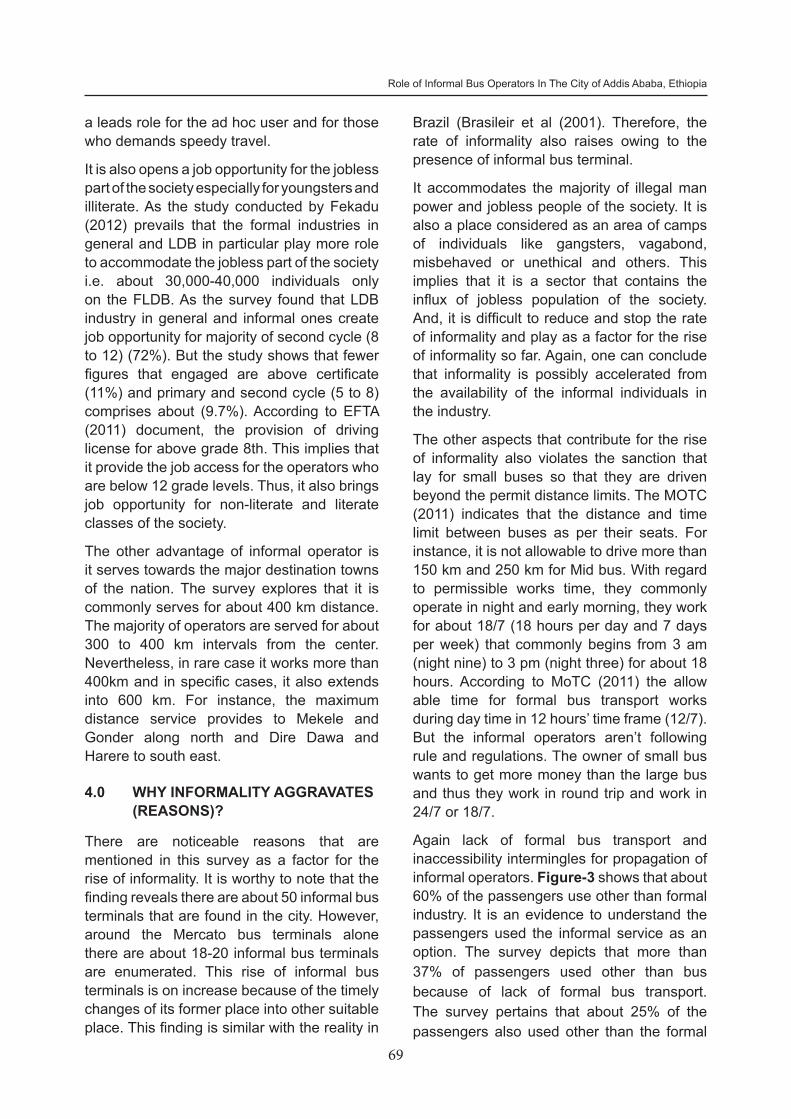
69
Role of Informal Bus Operators In The City of Addis Ababa, Ethiopia
a leads role for the ad hoc user and for those who demands speedy travel.
It is also opens a job opportunity for the jobless part of the society especially for youngsters and illiterate. As the study conducted by Fekadu (2012) prevails that the formal industries in general and LDB in particular play more role to accommodate the jobless part of the society i.e. about 30,000-40,000 individuals only on the FLDB. As the survey found that LDB industry in general and informal ones create job opportunity for majority of second cycle (8 to 12) (72%). But the study shows that fewer figures that engaged are above certificate (11%) and primary and second cycle (5 to 8) comprises about (9.7%). According to EFTA (2011) document, the provision of driving license for above grade 8th. This implies that it provide the job access for the operators who are below 12 grade levels. Thus, it also brings job opportunity for non-literate and literate classes of the society.
The other advantage of informal operator is it serves towards the major destination towns of the nation. The survey explores that it is commonly serves for about 400 km distance. The majority of operators are served for about 300 to 400 km intervals from the center. Nevertheless, in rare case it works more than 400km and in specific cases, it also extends into 600 km. For instance, the maximum distance service provides to Mekele and Gonder along north and Dire Dawa and Harere to south east.
4.0 WHY INFORMALITY AGGRAVATES (REASONS)?
There are noticeable reasons that are mentioned in this survey as a factor for the rise of informality. It is worthy to note that the finding reveals there are about 50 informal bus terminals that are found in the city. However, around the Mercato bus terminals alone there are about 18-20 informal bus terminals are enumerated. This rise of informal bus terminals is on increase because of the timely changes of its former place into other suitable place. This finding is similar with the reality in
Brazil (Brasileir et al (2001). Therefore, the rate of informality also raises owing to the presence of informal bus terminal.
It accommodates the majority of illegal man power and jobless people of the society. It is also a place considered as an area of camps of individuals like gangsters, vagabond, misbehaved or unethical and others. This implies that it is a sector that contains the influx of jobless population of the society. And, it is difficult to reduce and stop the rate of informality and play as a factor for the rise of informality so far. Again, one can conclude that informality is possibly accelerated from the availability of the informal individuals in the industry.
The other aspects that contribute for the rise of informality also violates the sanction that lay for small buses so that they are driven beyond the permit distance limits. The MOTC (2011) indicates that the distance and time limit between buses as per their seats. For instance, it is not allowable to drive more than 150 km and 250 km for Mid bus. With regard to permissible works time, they commonly operate in night and early morning, they work for about 18/7 (18 hours per day and 7 days per week) that commonly begins from 3 am (night nine) to 3 pm (night three) for about 18 hours. According to MoTC (2011) the allow able time for formal bus transport works during day time in 12 hours’ time frame (12/7). But the informal operators aren’t following rule and regulations. The owner of small bus wants to get more money than the large bus and thus they work in round trip and work in 24/7 or 18/7.
Again lack of formal bus transport and inaccessibility intermingles for propagation of informal operators. Figure-3 shows that about 60% of the passengers use other than formal industry. It is an evidence to understand the passengers used the informal service as an option. The survey depicts that more than 37% of passengers used other than bus because of lack of formal bus transport. The survey pertains that about 25% of the passengers also used other than the formal
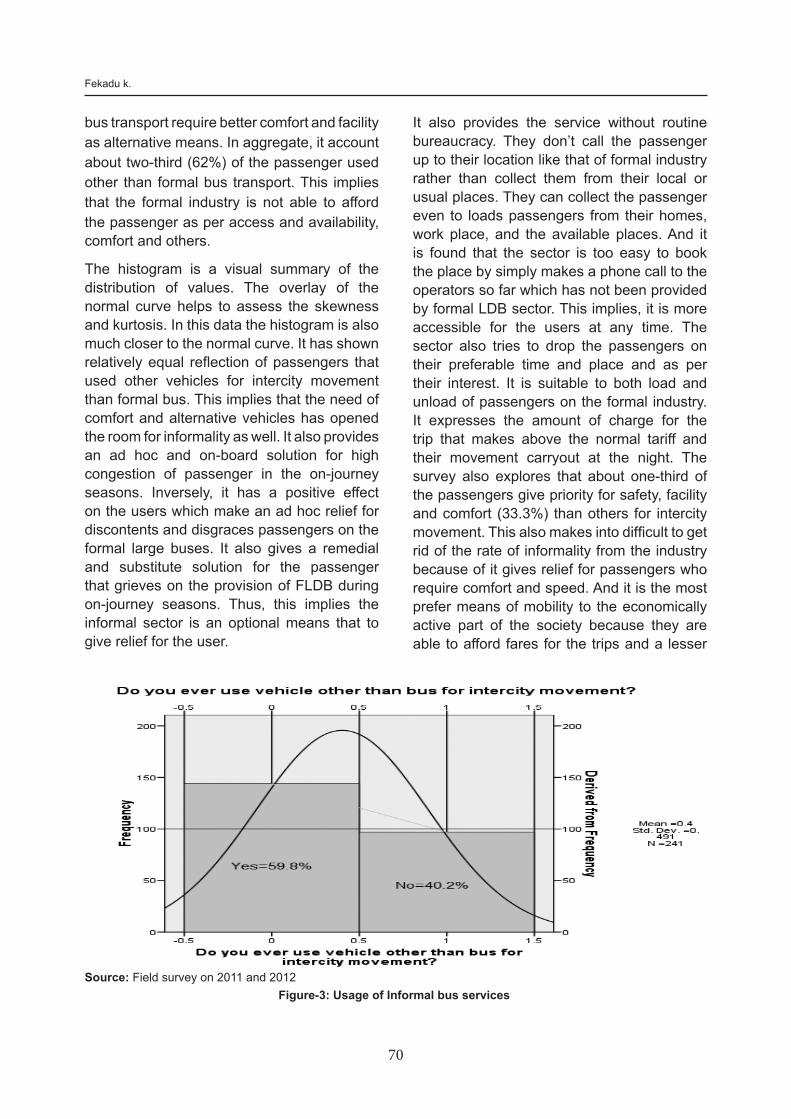
70
Fekadu k.
bus transport require better comfort and facility as alternative means. In aggregate, it account about two-third (62%) of the passenger used other than formal bus transport. This implies that the formal industry is not able to afford the passenger as per access and availability, comfort and others.
The histogram is a visual summary of the distribution of values. The overlay of the normal curve helps to assess the skewness and kurtosis. In this data the histogram is also much closer to the normal curve. It has shown relatively equal reflection of passengers that used other vehicles for intercity movement than formal bus. This implies that the need of comfort and alternative vehicles has opened the room for informality as well. It also provides an ad hoc and on-board solution for high congestion of passenger in the on-journey seasons. Inversely, it has a positive effect on the users which make an ad hoc relief for discontents and disgraces passengers on the formal large buses. It also gives a remedial and substitute solution for the passenger that grieves on the provision of FLDB during on-journey seasons. Thus, this implies the informal sector is an optional means that to give relief for the user.
Figure-3: Usage of Informal bus servicesSource: Field survey on 2011 and 2012
It also provides the service without routine bureaucracy. They don’t call the passenger up to their location like that of formal industry rather than collect them from their local or usual places. They can collect the passenger even to loads passengers from their homes, work place, and the available places. And it is found that the sector is too easy to book the place by simply makes a phone call to the operators so far which has not been provided by formal LDB sector. This implies, it is more accessible for the users at any time. The sector also tries to drop the passengers on their preferable time and place and as per their interest. It is suitable to both load and unload of passengers on the formal industry. It expresses the amount of charge for the trip that makes above the normal tariff and their movement carryout at the night. The survey also explores that about one-third of the passengers give priority for safety, facility and comfort (33.3%) than others for intercity movement. This also makes into difficult to get rid of the rate of informality from the industry because of it gives relief for passengers who require comfort and speed. And it is the most prefer means of mobility to the economically active part of the society because they are able to afford fares for the trips and a lesser
71
Role of Informal Bus Operators In The City of Addis Ababa, Ethiopia
amount for all walks of mankind. Thus, one can conclude that it is attractive regardless of its price.
It is also observed that, low quality and quantity of the large buses overlay the way for the rise of informality. The potential and actual reasons for happening of the rise are to the lowness of quality of service provision on the formal industry. And, in terms of quantity the supply is too poor for the long period of time. The study implies that the formal sector doesn’t fulfill the interest of the customers stretches its service at any time. It also does not provides 24/7 service like that of informal Mini bus operators. The quality for the provision of formal transport is very low. This idea is proved on the data of MOTC (2011) and Fekadu (2012) affirm that out of the total LDB, the majority of the buses are categorized within level three (62%) in 2009. And in 2010, it moves out in decline rate and consists about 50% and in 2011 reached to 39%. It is also not able to persuade the demand of the society as per their interest.
It is also found that the survey depicts that assumes that poor coaching and controlling of the traffic police (21.1%) also fastens the rate of informality so far. It provokes
due to poor control and coordination of the government officials. Again, it found that this sector is the most susceptible industry that exposes corruption and sabotage. The other insignificant reasons are the involvement of different higher officials of the government such as the traffic officer, key government officials and other affiliates bodies as the owner of the informal sector. It is found that they commonly participated on the ownership of small scale passenger transport.
As the evident from this study the rise of informality as due to saturation of buses at the metropolise during on-seasons and also it is usually seen at the other destination towns. It is also due to the prevalence of high demand and the incoming buses which are transported. It is usually seen during on-journey seasons passengers are carried beyond the load capacity of the formal industry, however, this also opens rooms for the rise of informality. Hence, due to this saturation of buses in the city, it also forced them to incorporâtes the formal bus transport into informal business during on-seasons.
In general, Figure-4 demonstrates that the cumulative effect of the informal bus transport and how it interlink within the sector.
Figure-4: Schematic Diagram of Informal Transport Effects
Note: FBT =Formal Bus Terminal, FLDB= Formal Long Distance Bus, and LDB=Long Distance Bus
72
Fekadu k.
5.0 SUMMARY
In general, the main reasons for the rise of informality is the fact that its gets and drops the passenger to their destination as quicker as possible. And it also provides the service in 24/7. It is also frequently creates job opportunity for jobless man power. It takes less waiting time to gets full load, is availability at any time besides, lowness of quality and quantity of the formal sector and other factors which plays leading role for the rise of the informal operators in the city and towards the city.
The traffic office estimates shows on average two to three informal Mid buses goes to the single major towns of the nation. In aggregate, their number has risen to 5 informal Mid buses per day. In all direction of the nation, it has reached to 20 to 30 Mid buses. But, the rate of Mini bus involved on informal flow ranges within 15 to 20 per day per line. Again, in aggregate, the amount of informal Mini buses reaches about 100 per day along all outlets of the nation. The small scale and Mid buses work all days and night however, the majority of the informal operators commonly works from 3 pm to 3 am (night nine to night three) per day.
It accommodates the majority of illegal man power and jobless peoples of the society. Passenger can obtain service at any time. Also informal sectors serves the society, gives an ad hoc solution and makes relief for on-board passengers.
6.0 RECOMMENDATIONS
Based on the preceding discussion, following remedial strategies are proposed to improve the overall nature of informal transport in the sector:
• It requires an integrative work with stockholders at various bodies
• Strong traffic management needed to reduce the rate of informality and maximize the security and satisfaction of passengers
• Teach the society to utilize the service only from the formal industry, as it safeguards them from exploitation and insecurity of informal operators.
• Regulate the supply and demand of the sector and the LDB Associations should provide accessible and qualified formal bus service operators.
• Expand the utilization and application of Radar with high detective resolution to detect the informal operators and their speeds.
• Policy makers around the developing world handling similar issues should share and disseminate their experiences.
• Require proper and timely data handling of Transport Authority at all Levels.
ACKNOWLEDGMENTS
The author would like to acknowledge to the workers of Ministry of Transport of Ethiopia to provide various secondary data and willingness to provide primary information. Of them, my special thanks would goes to Mr Animute Kassie for his data provision and GIS work and it also goes to Ms Meseret Hailu for her encoding the data as per I enquired. All errors particularly related with the survey data, is the responsibility of the author. This article is designed based on a study that sponsored by Arbamnich University research fund,
REFERENCES1. Addis Ababa Chamber of Commerce, (AACC)
(2009). The Management of Commercial Road Transport in Ethiopia Private Sector Development Hub/Addis Ababa Chamber of Commerce and Sectoral Associations, 2009, may 2009
2. AACGO, Addis Ababa City Government, office of the mayor 2011/12.
3. Barbero, J. (2000), Recent Changes and Perspectives in Buenos Aires Urban Transportation, Buenos, Aires, Metrovias S.A., unpublished paper, 2000.
4. Badami, M. (1999), Improving Air Quality in Delhi, Habitat Debate, Vol. 4, No. 2, 1998,pp. 22-23
73
Role of Informal Bus Operators In The City of Addis Ababa, Ethiopia
5. Banister D. and R. Mackett. (1990), The Minibus: Theory and Experience, and Their Implications, Transport Reviews, Vol. 10, No. 3, 1990, pp. 189-214.
6. Brasileiro A, Enilson S., and Joaquim A. “Regulating Interstate Passenger Transport by means of Independent Agencies: Challenges to the Institutional Development of Road Passenger Transport in Brazil”, Department of Civil Engineering Federal University of Pernambuco BRAZIL (www.thredbo.econ.usyd.edu.au Accessed on 13 March 2009).
7. Central Stastical Authority (CSA) (1984). Ethiopia 1984: Population and Housing Census of Ethiopia. Preliminary report, Addis Ababa.
8. Central Statistical Authority (CSA) (1996). The Federal Democratic Republic of Ethiopian Central Statistical Authority Transport and Communication Statistics Statistical bulletin No 246, Addis Ababa march 1996.
9. Central Statistical Agency (CSA) (2007). Compilation of Economic Statistics in Ethiopia, July 2007 Addis Ababa
10. Central Statistical Agency (CSA) of Ethiopia. “Census 2007preliminary(pdf-file)” (http://www.csa.gov.et/pdf/Cen2007prelimineray.pdf. Retrieved 2008-12-07).
11. Cervero. R. 1991, Paratransit in Southeast Asia: A Market Response to Poor Roads? Review of Urban and Regional Development Studies Vol. 3, No. 1, 1991, pp. 3-27.
12. Ethiopian Road Authority (ERA) (2005). Ethiopian National Urban Transport Policy, Urban Transport Study and Preparation of Pilot Project of Addis Ababa Final Report Addis Ababa December 2005.
13. Ethiopian Federal Transport Authority (EFTA) (2011). The Directorate of Commercial Passenger Quality Certificate Office, July 2011
14. Fekadu Kassa (2012). ‘Long Distance Bus Transport in Ethiopia: Structure, Service Adequacy, and Its Role for Metropolitan Linkage, Addis Ababa’. PhD dissertation,
University of South Africa (UNISA) unpublished.
15. ----------------- (2013). “Probability, Area and Service Coverage, and Effects of Informal Passenger Road Transport on Formal Industry and Long Distance Bus Transport in Addis Ababa, Ethiopia” unpublished
16. Glaister. S. (1986), Bus Deregulation, Competition and Vehicle Size. Journal of Transport Economics and Policy, Vol. 20, No. 2, 1986, pp. 217-244;
17. Gomez-Ibaand J. Meyer. (1990), Privatizing and Deregulating Local Public Services Lessons from Britain’s Buses. Journal of the American Planning Association,Vol. 56, No. 1, 1990, pp. 921;
18. HABITAT, 2000, Informal Transport in the Developing World (HABITAT, 2000, 301 p)
19. Mintesnot Gebeyehu and Shin-Ei Takano. (2007). “Diagnostic Evaluation of Public Transportation Mode Choice in Addis Ababa” Hokkaido University, Sapporo Japan Journal of Public Transportation, Vol. 10, No. 4, 2007.
20. MoFED, Ministry of Finance and Economic Development, 2006. Ethiopia: Status Report on the Brussels Pogramme of Action (BPoA) for Least Developed Countries (LDCs) Ministry of Finance and Economic Development (MoFED) January 2006 Addis Ababa
21. MoTC, Ministry of Transport and communication Transport Authority, (2011) Revised Commercial Passenger transport Quality Certificate and dispatch rule and regulation work flow February, 2011Addis Ababa.
22. Robert Cervero 2000 Informal Transport in the Developing World United Nations Centre for Human Settlements (Habitat) Nairobi, 2000 HS/593/00E ISBN 92−1−131453−4
23. UITP–International Association of Public Transport, 2010, Public Transport in Sub-Saharan Africa Major trends and case studies Rue Sainte-Marie 6 1080 Brussels Belgium

URBAN TRANSPORTJOURNAL
Vol. 12 No. 1, Aug. 2013
SUSTAINABLE MOBILITY BASED QUALITATIVE APPROACH TO EVALUATE COMPREHENSIVE MOBILITY PLAN (CMP) OF PUNE
Akshima T Ghate*
1.0 INTRODUCTION
In December 2005, the Government of India launched the Jawaharlal Nehru National Urban Renewal Mission (JNNURM) under the Common Minimum Program, which aimed to rejuvenate the urban milieu through implementation of a number of projects with active private sector participation. Subsequently, in 2006, the Government announced the first ever policy on urban transport, the National Urban Transport Policy (NUTP)1 with a focus to promote overall sustainability of transport sector in cities. Some of the policy objectives in the NUTP are being realized as proposals and projects under the JNNURM, which has selected 63 cities (later made 65) in India and is implementing an urban reforms agenda of which urban transport is a significant component. The Mission now makes it conditional upon the cities to take up transport projects in line with the recommendations made in the NUTP (which is driven by the principle of moving people not vehicles), in order to receive funding and grants. Each of the cities has to come up with a Comprehensive Mobility Plan (CMP) for the city, and currently, many cities are engaged in the same. A few cities have already drawn up CMPs and have submitted them to the Government of India.
1www.urbanindia.nic.in/programme/ut/TransportPolicy.pdf2The framework is published in Ghate and Sundar (2012)* Fellow and Area Convenor, Centre for Research on Sustainable Urban Development and Transport Systems, Sustainable Habitat Division, The Energy and Resources Institute (TERI), email - [email protected]
It is important that the CMPs are able to guide sustainable growth of the transport sector in the cities. Sustainability of transport system implies that every individual or commuter category in the city is able to fulfil his or her mobility needs in a quick, affordable, safe, reliable, comfortable, energy efficient and environmentally benign manner (TERI, 2009) i.e. the transport system should be able to meet all the associated social, economic and environmental sustainability goals. Since, the CMPs will be the tools to guide the future growth of transport in cities, it becomes important to evaluate their strategies with respect to the sustainable mobility parameters. This becomes all the more important as Indian cities are currently facing a major transport crisis that is marked by increasing personal vehicle use, declining public transport / NMT use,
congestion, pollution, road accidents, etc. This paper hence focuses on reviewing CMP of Pune city, to assess if it promotes sustainability of transport systems in the city.
2.0 CMP EVALUATION FRAMEWORK
A framework has been developed to review the CMP from the perspective of sustainable mobility parameters2 Figure 1. The following were taken into consideration to develop the CMP evaluation framework:
ABSTRACT: As part of the JNNURM Programme it is now conditional that in order to receive funding and grants for transport sector the cities have to come up with a Comprehensive Mobility Plan (CMP). Pune has developed its CMP vision within the framework suggested by National Urban Transport Policy (NUTP). This papers attempt to evaluate the process of preparation of CMP for Pune highlighting the recommendation favoring sustainable mobility objectives and also identifying gaps in the Plan.
Keywords: Comprehensive Mobility Plan (CMP), Sustainability, Evaluation, Review, Recommendations.
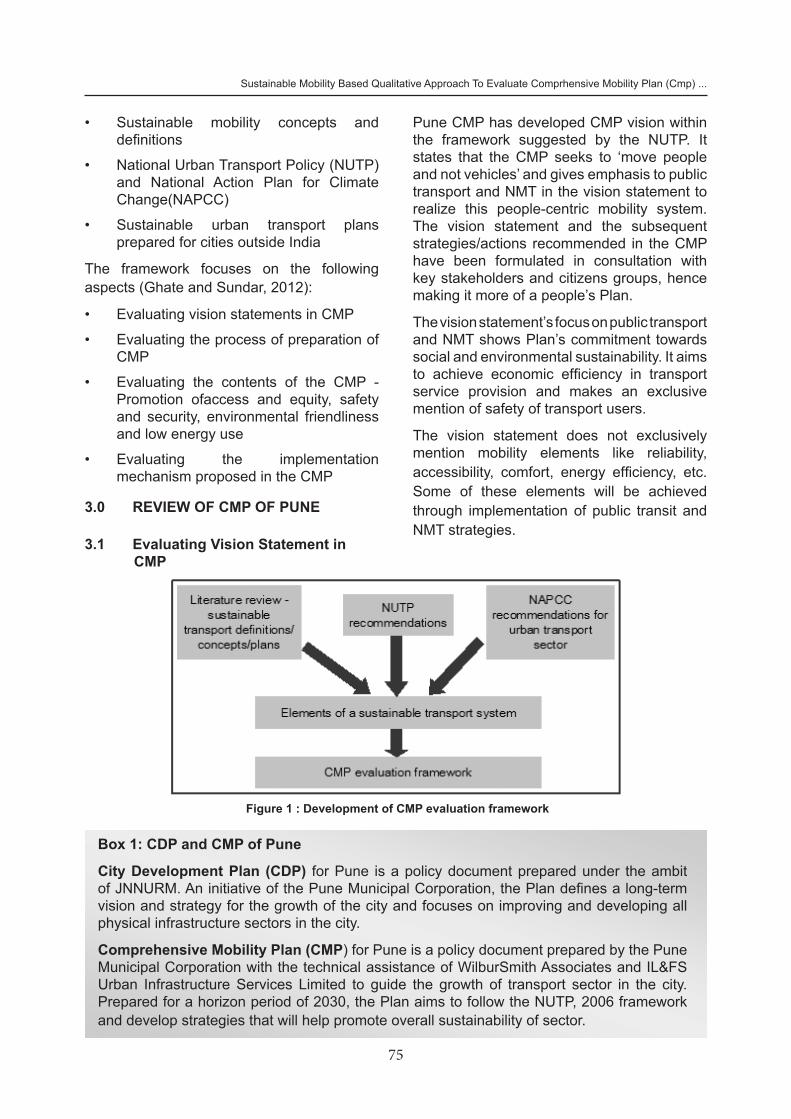
75
Sustainable Mobility Based Qualitative Approach To Evaluate Comprhensive Mobility Plan (Cmp) ...
• Sustainable mobility concepts and definitions
• National Urban Transport Policy (NUTP) and National Action Plan for Climate Change(NAPCC)
• Sustainable urban transport plans prepared for cities outside India
The framework focuses on the following aspects (Ghate and Sundar, 2012):
• Evaluating vision statements in CMP
• Evaluating the process of preparation of CMP
• Evaluating the contents of the CMP - Promotion ofaccess and equity, safety and security, environmental friendliness and low energy use
• Evaluating the implementation mechanism proposed in the CMP
3.0 REVIEW OF CMP OF PUNE
3.1 Evaluating Vision Statement in CMP
Figure 1 : Development of CMP evaluation framework
Pune CMP has developed CMP vision within the framework suggested by the NUTP. It states that the CMP seeks to ‘move people and not vehicles’ and gives emphasis to public transport and NMT in the vision statement to realize this people-centric mobility system. The vision statement and the subsequent strategies/actions recommended in the CMP have been formulated in consultation with key stakeholders and citizens groups, hence making it more of a people’s Plan.
The vision statement’s focus on public transport and NMT shows Plan’s commitment towards social and environmental sustainability. It aims to achieve economic efficiency in transport service provision and makes an exclusive mention of safety of transport users.
The vision statement does not exclusively mention mobility elements like reliability, accessibility, comfort, energy efficiency, etc. Some of these elements will be achieved through implementation of public transit and NMT strategies.
Box 1: CDP and CMP of Pune
City Development Plan (CDP) for Pune is a policy document prepared under the ambit of JNNURM. An initiative of the Pune Municipal Corporation, the Plan defines a long-term vision and strategy for the growth of the city and focuses on improving and developing all physical infrastructure sectors in the city.
Comprehensive Mobility Plan (CMP) for Pune is a policy document prepared by the Pune Municipal Corporation with the technical assistance of WilburSmith Associates and IL&FS Urban Infrastructure Services Limited to guide the growth of transport sector in the city. Prepared for a horizon period of 2030, the Plan aims to follow the NUTP, 2006 framework and develop strategies that will help promote overall sustainability of sector.
76
Akshima T Ghate
The other parameters primarily related to quality of the transport systems should be adequately addressed in the Plan.
The vision statement in Pune CMP is in the right direction as it promotes people-centric mobility system and focuses on public transit and NMT.
Box 2: Vision, Pune CMP
Vision for transport sector in Pune CMP:
‘Moving people safely and economically by emphasizing public transport and non-motorized transport.’ Source: Pune CMP
3.2 Evaluating the Process of Preparation of CMP
Pune CMP clearly describes the methodology adopted to formulate the CMP. The plan preparation process was comprehensive, scientifically sound and participatory. The process involved the following stages:
1. Mobilization of human and material resources and reconnaissance survey of the city.
2. Secondary data collection and primary surveys
3. Travel demand modelling (CUBE 4.1 model was used)
4. Preparation of short terms strategies
5. Preparation of alternative transport plans and land use plans
6. Development of transport vision and strategy (citizens groups were adequately involved at this stage)
7. Development of project evaluation and screening framework (provides a sound basis for evaluating the impacts of plan proposals; includes public involvement)
8. Identifying and prioritizing improvements (includes one of more options for each infrastructure project and assessment of cost , revenue, etc for each option; phasing of projects suggested)
9. Recommendations on institutional set-up
10. Economic evaluation of CMP proposals
11. Preparation of draft mobility plan
12. Stakeholder participation (citizen groups involved to disseminate plan
proposals and solicit their concerns and suggestions)
13. Revision of the Plan to include stakeholder concerns/suggestions
Process of preparation of Pune CMP was very robust both in terms of technical methods and participatory approach used. Stakeholders were involved at various stages and their concerns / suggestions were addressed in the Plan.
3.3 Evaluating the contents of the CMP
To achieve the vision set in the Plan, the Pune CMP defines a broad approach (Box 3); it focuses on:
• Provision of public transit and NMT modes and measures to attract their usage;
• Introduction of measures to discourage use of private vehicles;
• Measures to reduce congestion ;
• Creation of safe mobility environment; and
• Creation of adequate institutional and regulatory arrangements to implement Plan recommendations and manage transport system in the city.
The approach, as such, is in the right direction that will help move towards sustainable mobility objectives. However, it is important that the Plan recommendations are in line with this strategy and help achieve overall sustainable mobility objectives. This section evaluates the recommendations in the Pune CMP from the perspective of sustainable mobility parameters as defined in the CMP evaluation framework.
77
Sustainable Mobility Based Qualitative Approach To Evaluate Comprhensive Mobility Plan (Cmp) ...
3.3.1 Sustainability Indicator – Access and Equity
Pune CMP promotes equity principles of mobility. It promotes equitable allocation of road space and recommends dedicated road space for public transit modes and NMT. The focus of the Plan on promoting public transit and NMT would ensure equitable opportunities and modal choices for all traveller categories in the city.
With regard to promoting accessibility, the Plan proposes extensive public transit, NMT and road infrastructure improvements/expansions that will help improve overall accessibility of
Box3: Broad approach/strategy adopted in Pune CMP
• ‘Identification of a number of trunk mobility corridors along which high capacity public transport systems such as BRT/Monorail/LRT/Metro, etc. would be considered based on a scientific and detailed alternatives analysis.
• Enhancing the capacity and quality of the public transport so that people are willing to use it instead of moving towards personal motor vehicles
• Providing alternative routes for those having to enter the core city area even when their journey does not begin or end in this part of the city. For this purpose, ring corridors have been suggested to enable the core city area to be bypassed.
• Providing bypass routes for long distance commuter and truck traffic so that they do not have to travel through the city roads.
• Identifying feeder systems that connect different pockets and wards in the city to the most convenient point in one or more of the mobility corridors
• Providing a network of dedicated cycle tracks, footpaths and pedestrian crossings
• Pedestrianizing important portions of the core city area and linking them with strategic parking places to encourage people to walk in such areas
• Providing flyovers in a few heavily congested junctions/intersections to reduce idling traffic
• Special attention towards road safety
• Introduction of physical and fiscal measures that would discourage the use of personal motor vehicles
• Reform and strengthen the institutional arrangements for managing and regulating the transport system in the city’
Source: Pune CMP
the system. However, there are no specific recommendations in the Plan to improve accessibility of vulnerable traveller categories like physically challenged, elderly, children, etc. The Plan also needs to ensure physical and financial accessibility of lower income categories to public transit services; the Plan currently does not contain any specific recommendations for this traveller category.
Pune CMP promotes the concept of equity in mobility and makes recommendation to improve overall accessibility in the city. However, the Plan does not have dedicated recommendations to improve accessibility of vulnerable traveller categories
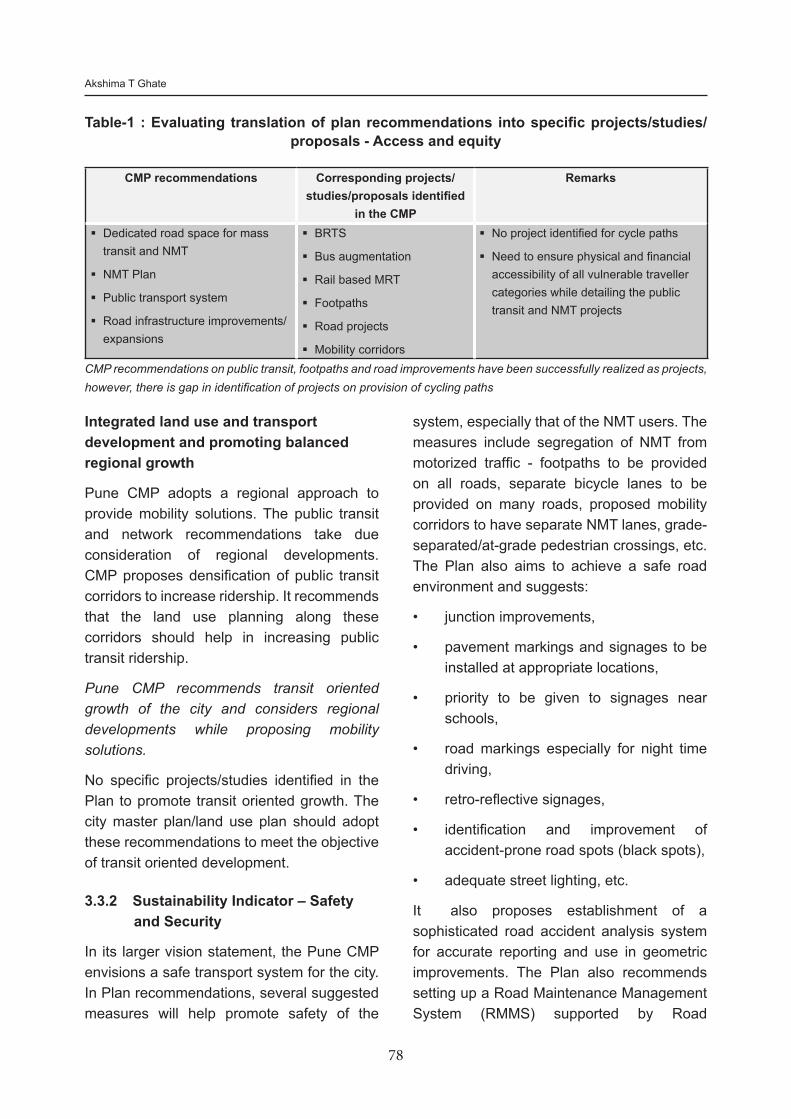
78
Akshima T Ghate
Table-1 : Evaluating translation of plan recommendations into specific projects/studies/proposals - Access and equity
CMP recommendations Corresponding projects/studies/proposals identified
in the CMP
Remarks
Dedicated road space for mass transit and NMT
NMT Plan
Public transport system
Road infrastructure improvements/ expansions
BRTS
Bus augmentation
Rail based MRT
Footpaths
Road projects
Mobility corridors
No project identified for cycle paths
Need to ensure physical and financial accessibility of all vulnerable traveller categories while detailing the public transit and NMT projects
CMP recommendations on public transit, footpaths and road improvements have been successfully realized as projects, however, there is gap in identification of projects on provision of cycling paths
Integrated land use and transport development and promoting balanced regional growth
Pune CMP adopts a regional approach to provide mobility solutions. The public transit and network recommendations take due consideration of regional developments. CMP proposes densification of public transit corridors to increase ridership. It recommends that the land use planning along these corridors should help in increasing public transit ridership.
Pune CMP recommends transit oriented growth of the city and considers regional developments while proposing mobility solutions.
No specific projects/studies identified in the Plan to promote transit oriented growth. The city master plan/land use plan should adopt these recommendations to meet the objective of transit oriented development.
3.3.2 Sustainability Indicator – Safety and Security
In its larger vision statement, the Pune CMP envisions a safe transport system for the city. In Plan recommendations, several suggested measures will help promote safety of the
system, especially that of the NMT users. The measures include segregation of NMT from motorized traffic - footpaths to be provided on all roads, separate bicycle lanes to be provided on many roads, proposed mobility corridors to have separate NMT lanes, grade-separated/at-grade pedestrian crossings, etc. The Plan also aims to achieve a safe road environment and suggests:
• junction improvements,
• pavement markings and signages to be installed at appropriate locations,
• priority to be given to signages near schools,
• road markings especially for night time driving,
• retro-reflective signages,
• identification and improvement of accident-prone road spots (black spots),
• adequate street lighting, etc.
It also proposes establishment of a sophisticated road accident analysis system for accurate reporting and use in geometric improvements. The Plan also recommends setting up a Road Maintenance Management System (RMMS) supported by Road
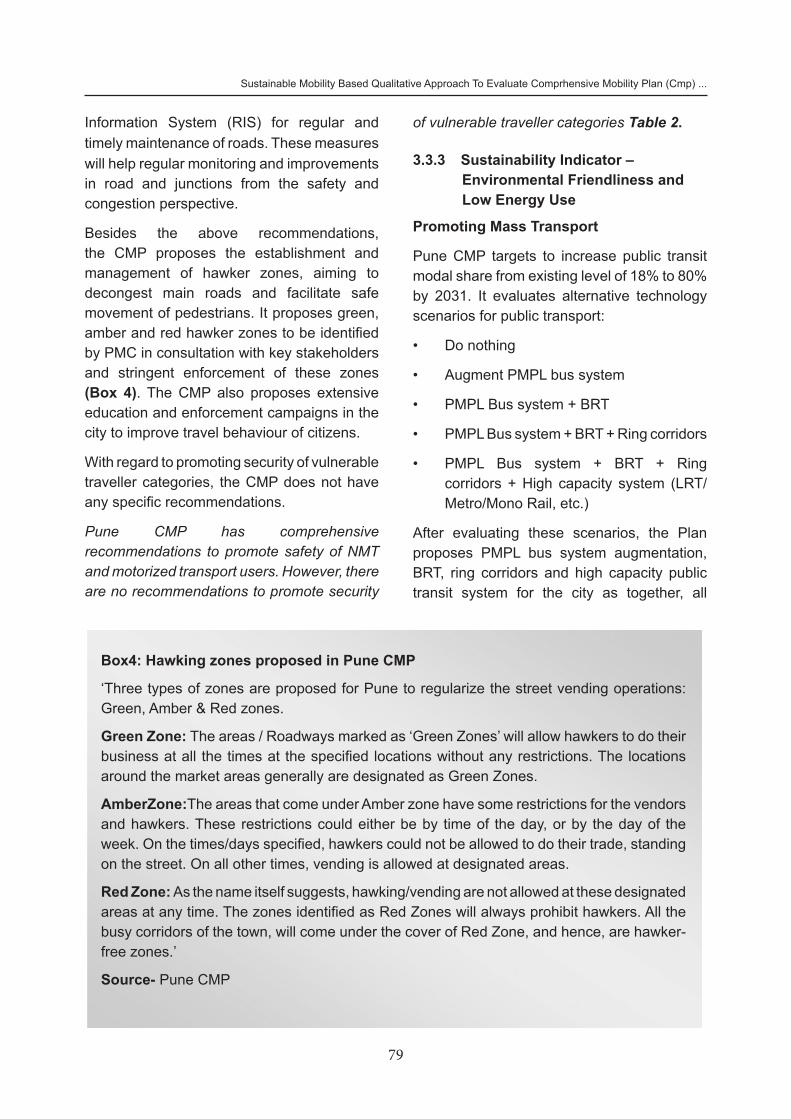
79
Sustainable Mobility Based Qualitative Approach To Evaluate Comprhensive Mobility Plan (Cmp) ...
Information System (RIS) for regular and timely maintenance of roads. These measures will help regular monitoring and improvements in road and junctions from the safety and congestion perspective.
Besides the above recommendations, the CMP proposes the establishment and management of hawker zones, aiming to decongest main roads and facilitate safe movement of pedestrians. It proposes green, amber and red hawker zones to be identified by PMC in consultation with key stakeholders and stringent enforcement of these zones (Box 4). The CMP also proposes extensive education and enforcement campaigns in the city to improve travel behaviour of citizens.
With regard to promoting security of vulnerable traveller categories, the CMP does not have any specific recommendations.
Pune CMP has comprehensive recommendations to promote safety of NMT and motorized transport users. However, there are no recommendations to promote security
of vulnerable traveller categories Table 2.
3.3.3 Sustainability Indicator – Environmental Friendliness and Low Energy Use
Promoting Mass Transport
Pune CMP targets to increase public transit modal share from existing level of 18% to 80% by 2031. It evaluates alternative technology scenarios for public transport:
• Do nothing
• Augment PMPL bus system
• PMPL Bus system + BRT
• PMPL Bus system + BRT + Ring corridors
• PMPL Bus system + BRT + Ring corridors + High capacity system (LRT/Metro/Mono Rail, etc.)
After evaluating these scenarios, the Plan proposes PMPL bus system augmentation, BRT, ring corridors and high capacity public transit system for the city as together, all
Box4: Hawking zones proposed in Pune CMP
‘Three types of zones are proposed for Pune to regularize the street vending operations: Green, Amber & Red zones.
Green Zone: The areas / Roadways marked as ‘Green Zones’ will allow hawkers to do their business at all the times at the specified locations without any restrictions. The locations around the market areas generally are designated as Green Zones.
AmberZone:The areas that come under Amber zone have some restrictions for the vendors and hawkers. These restrictions could either be by time of the day, or by the day of the week. On the times/days specified, hawkers could not be allowed to do their trade, standing on the street. On all other times, vending is allowed at designated areas.
Red Zone: As the name itself suggests, hawking/vending are not allowed at these designated areas at any time. The zones identified as Red Zones will always prohibit hawkers. All the busy corridors of the town, will come under the cover of Red Zone, and hence, are hawker-free zones.’
Source- Pune CMP
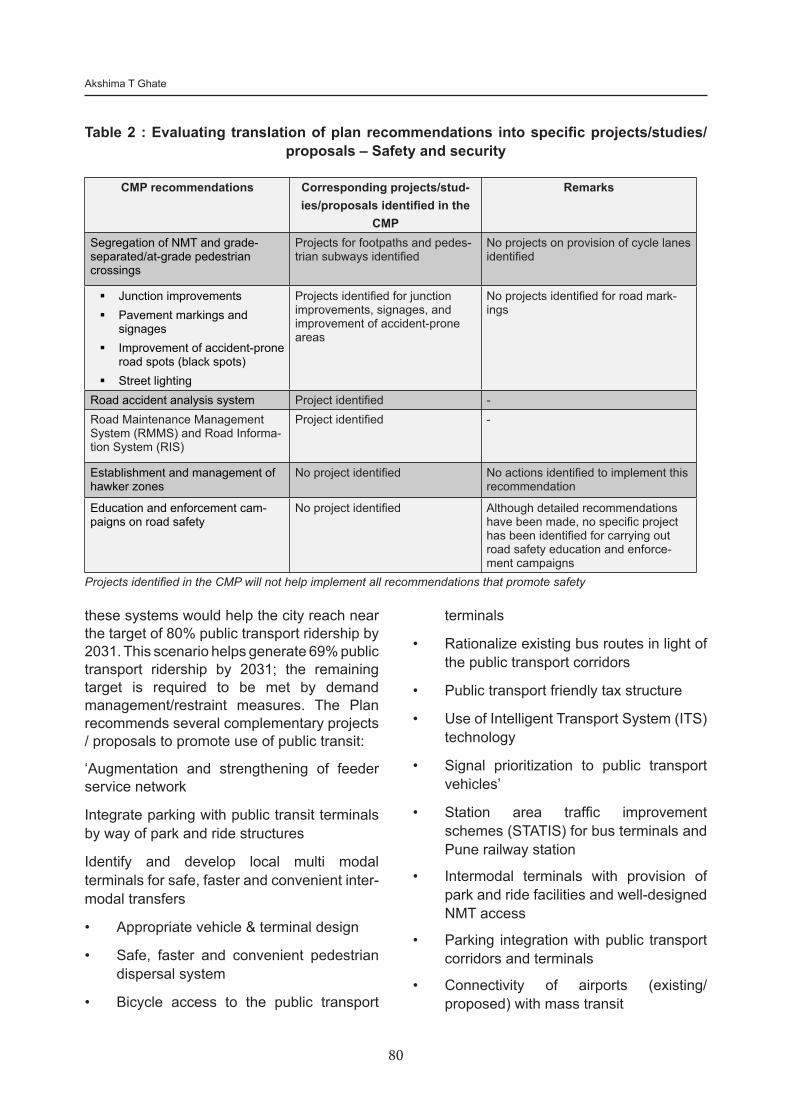
80
Akshima T Ghate
Table 2 : Evaluating translation of plan recommendations into specific projects/studies/proposals – Safety and security
CMP recommendations Corresponding projects/stud-ies/proposals identified in the
CMP
Remarks
Segregation of NMT and grade-separated/at-grade pedestrian crossings
Projects for footpaths and pedes-trian subways identified
No projects on provision of cycle lanes identified
Junction improvementsPavement markings and
signages Improvement of accident-prone
road spots (black spots)Street lighting
Projects identified for junction improvements, signages, and improvement of accident-prone areas
No projects identified for road mark-ings
Road accident analysis system Project identified -Road Maintenance Management System (RMMS) and Road Informa-tion System (RIS)
Project identified -
Establishment and management of hawker zones
No project identified No actions identified to implement this recommendation
Education and enforcement cam-paigns on road safety
No project identified Although detailed recommendations have been made, no specific project has been identified for carrying out road safety education and enforce-ment campaigns
Projects identified in the CMP will not help implement all recommendations that promote safety
these systems would help the city reach near the target of 80% public transport ridership by 2031. This scenario helps generate 69% public transport ridership by 2031; the remaining target is required to be met by demand management/restraint measures. The Plan recommends several complementary projects / proposals to promote use of public transit:
‘Augmentation and strengthening of feeder service network
Integrate parking with public transit terminals by way of park and ride structures
Identify and develop local multi modal terminals for safe, faster and convenient inter-modal transfers
• Appropriate vehicle & terminal design
• Safe, faster and convenient pedestrian dispersal system
• Bicycle access to the public transport
terminals
• Rationalize existing bus routes in light of the public transport corridors
• Public transport friendly tax structure
• Use of Intelligent Transport System (ITS) technology
• Signal prioritization to public transport vehicles’
• Station area traffic improvement schemes (STATIS) for bus terminals and Pune railway station
• Intermodal terminals with provision of park and ride facilities and well-designed NMT access
• Parking integration with public transport corridors and terminals
• Connectivity of airports (existing/proposed) with mass transit
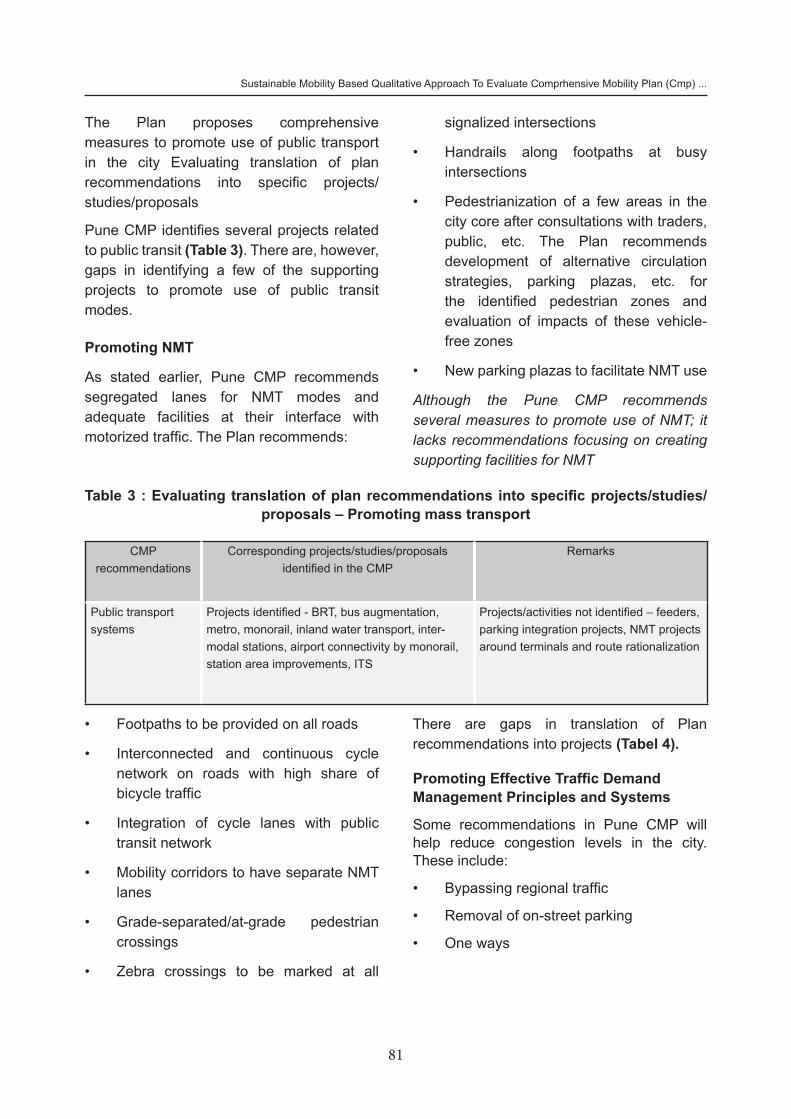
81
Sustainable Mobility Based Qualitative Approach To Evaluate Comprhensive Mobility Plan (Cmp) ...
The Plan proposes comprehensive measures to promote use of public transport in the city Evaluating translation of plan recommendations into specific projects/studies/proposals
Pune CMP identifies several projects related to public transit (Table 3). There are, however, gaps in identifying a few of the supporting projects to promote use of public transit modes.
Promoting NMT
As stated earlier, Pune CMP recommends segregated lanes for NMT modes and adequate facilities at their interface with motorized traffic. The Plan recommends:
• Footpaths to be provided on all roads
• Interconnected and continuous cycle network on roads with high share of bicycle traffic
• Integration of cycle lanes with public transit network
• Mobility corridors to have separate NMT lanes
• Grade-separated/at-grade pedestrian crossings
• Zebra crossings to be marked at all
Table 3 : Evaluating translation of plan recommendations into specific projects/studies/proposals – Promoting mass transport
CMP recommendations
Corresponding projects/studies/proposals identified in the CMP
Remarks
Public transport systems
Projects identified - BRT, bus augmentation, metro, monorail, inland water transport, inter-modal stations, airport connectivity by monorail, station area improvements, ITS
Projects/activities not identified – feeders, parking integration projects, NMT projects around terminals and route rationalization
signalized intersections
• Handrails along footpaths at busy intersections
• Pedestrianization of a few areas in the city core after consultations with traders, public, etc. The Plan recommends development of alternative circulation strategies, parking plazas, etc. for the identified pedestrian zones and evaluation of impacts of these vehicle-free zones
• New parking plazas to facilitate NMT use
Although the Pune CMP recommends several measures to promote use of NMT; it lacks recommendations focusing on creating supporting facilities for NMT
There are gaps in translation of Plan recommendations into projects (Tabel 4).
Promoting Effective Traffic Demand Management Principles and Systems
Some recommendations in Pune CMP will help reduce congestion levels in the city. These include:
• Bypassing regional traffic
• Removal of on-street parking
• One ways
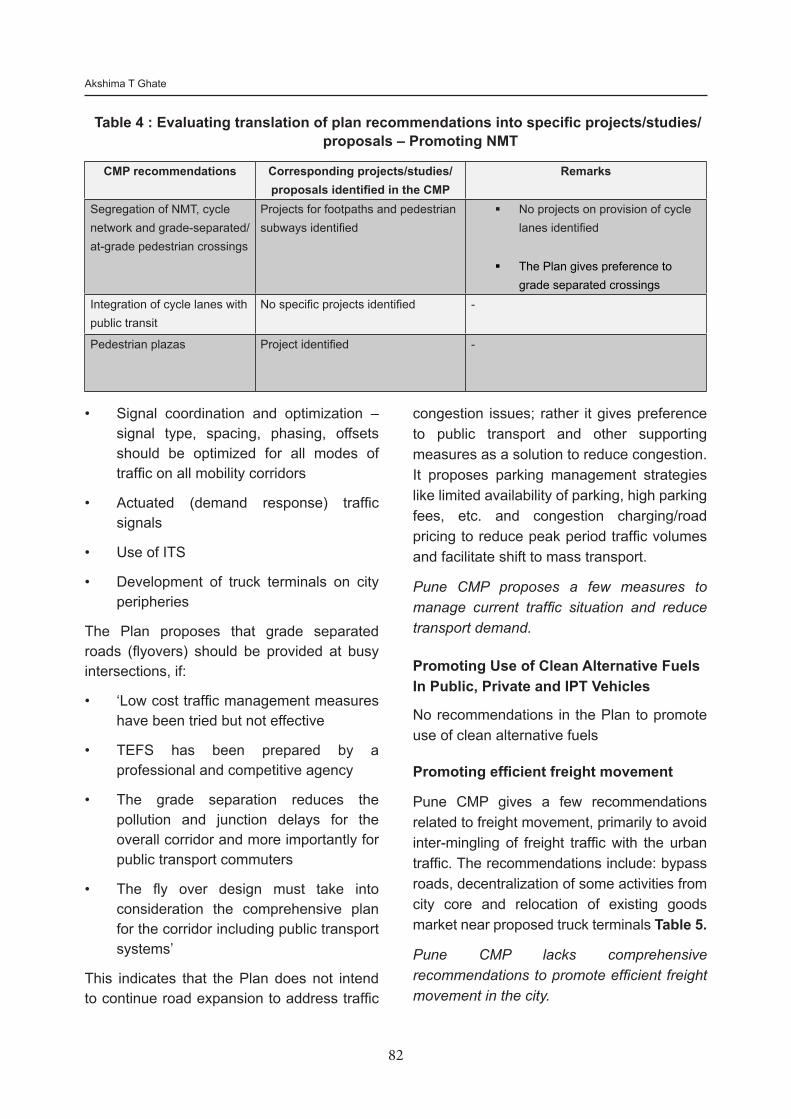
82
Akshima T Ghate
Table 4 : Evaluating translation of plan recommendations into specific projects/studies/proposals – Promoting NMT
CMP recommendations Corresponding projects/studies/proposals identified in the CMP
Remarks
Segregation of NMT, cycle network and grade-separated/at-grade pedestrian crossings
Projects for footpaths and pedestrian subways identified
No projects on provision of cycle lanes identified
The Plan gives preference to grade separated crossings
Integration of cycle lanes with public transit
No specific projects identified -
Pedestrian plazas Project identified -
• Signal coordination and optimization – signal type, spacing, phasing, offsets should be optimized for all modes of traffic on all mobility corridors
• Actuated (demand response) traffic signals
• Use of ITS
• Development of truck terminals on city peripheries
The Plan proposes that grade separated roads (flyovers) should be provided at busy intersections, if:
• ‘Low cost traffic management measures have been tried but not effective
• TEFS has been prepared by a professional and competitive agency
• The grade separation reduces the pollution and junction delays for the overall corridor and more importantly for public transport commuters
• The fly over design must take into consideration the comprehensive plan for the corridor including public transport systems’
This indicates that the Plan does not intend to continue road expansion to address traffic
congestion issues; rather it gives preference to public transport and other supporting measures as a solution to reduce congestion. It proposes parking management strategies like limited availability of parking, high parking fees, etc. and congestion charging/road pricing to reduce peak period traffic volumes and facilitate shift to mass transport.
Pune CMP proposes a few measures to manage current traffic situation and reduce transport demand.
Promoting Use of Clean Alternative Fuels In Public, Private and IPT Vehicles
No recommendations in the Plan to promote use of clean alternative fuels
Promoting efficient freight movement
Pune CMP gives a few recommendations related to freight movement, primarily to avoid inter-mingling of freight traffic with the urban traffic. The recommendations include: bypass roads, decentralization of some activities from city core and relocation of existing goods market near proposed truck terminals Table 5.
Pune CMP lacks comprehensive recommendations to promote efficient freight movement in the city.
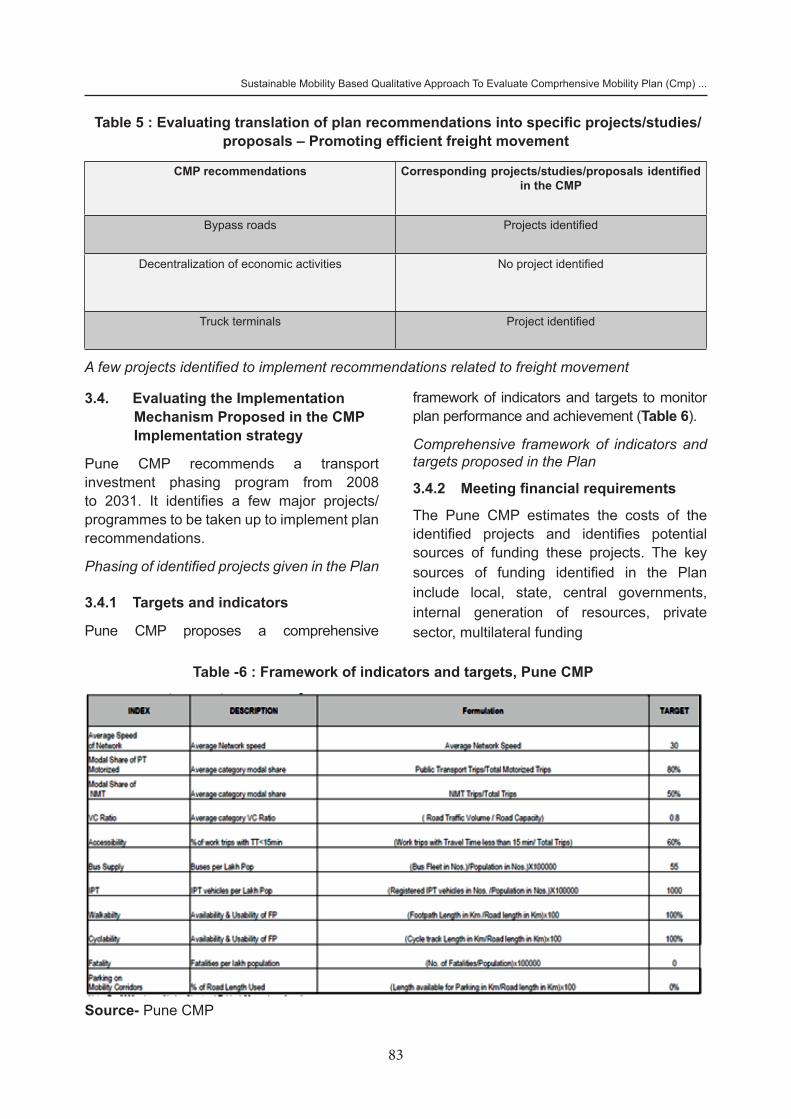
83
Sustainable Mobility Based Qualitative Approach To Evaluate Comprhensive Mobility Plan (Cmp) ...
Table 5 : Evaluating translation of plan recommendations into specific projects/studies/proposals – Promoting efficient freight movement
CMP recommendations Corresponding projects/studies/proposals identified in the CMP
Bypass roads Projects identified
Decentralization of economic activities No project identified
Truck terminals Project identified
A few projects identified to implement recommendations related to freight movement
Source- Pune CMP
Table -6 : Framework of indicators and targets, Pune CMP
3.4. Evaluating the Implementation Mechanism Proposed in the CMP Implementation strategy
Pune CMP recommends a transport investment phasing program from 2008 to 2031. It identifies a few major projects/programmes to be taken up to implement plan recommendations.
Phasing of identified projects given in the Plan
3.4.1 Targets and indicators
Pune CMP proposes a comprehensive
framework of indicators and targets to monitor plan performance and achievement (Table 6).
Comprehensive framework of indicators and targets proposed in the Plan
3.4.2 Meeting financial requirements
The Pune CMP estimates the costs of the identified projects and identifies potential sources of funding these projects. The key sources of funding identified in the Plan include local, state, central governments, internal generation of resources, private sector, multilateral funding
84
Akshima T Ghate
The plan identifies potential sources of funding for the projects
3.4.3 Institutional recommendations
Pune Metropolitan Transport Authority (PMTA) was set up by the Maharashtra state to implement the NUTP recommendations on formation of UMTAs in all million-plus cities. The Plan proposes PMTA to be the key agency for implementing recommendations of the Plan and recommends that it should function independently as an efficient business corporation and should be able to generate its own funds. It main functions include:
‘Strategic Regional and Transportation Planning
• Investment, Management and Operations Policy Planning
• System/Corridor Planning
• Financial Planning
• Long and Short-Term Priority Setting, Decision Making for Investment and Operating Subsidies
• Infrastructure Project Implementation
• Service and Operations Regulation
• end Operations Management
• Service Provision and Operations’
‘The purview of PMTA is expected to include the following urban transport entities:
• Bus Transport system
• Rapid Transport System
• Inland Water Transport
• Existing and Proposed Airport
• Roads, Bridges and Highways
• Railway and Truck Terminals
• Parking
• Pedestrian and bi-cycle transport’
The Plan proposes that the regional traffic authority should continue to exist and ‘its role
would be to mostly act as a regulatory body.
Comprehensive institutional set-up proposed to implement the Plan
3.4.4 Capacity building
No recommendation on capacity building in the Plan
3.4.5 Review and updating the Plan
Pune CMP does not provide any indication on periodic revision of the CMP to take into account the dynamic nature of growth and changing circumstances in future in the city.
4.0 SUMMARIZING REVIEW OF PUNE CMP
There are several recommendations in Pune CMP that help promote sustainable mobility objectives. At the same time, there are a few gaps in the Plan recommendations and the projects identified to realize the Plan recommendations. This section summarizes the good points in the CMP and gives broad recommendations to address the gaps identified while reviewing the Plan.
4.1 Good Practices/Recommendations in the Plan
Unlike other city CMPs selected for this study, Pune CMP clearly and in detail describes the methodology adopted to formulate the CMP. The plan preparation process for the CMP was comprehensive, scientifically sound and participatory. The vision statement and the subsequent strategies/actions recommended in the CMP have been formulated in consultation with key stakeholders and citizens groups, hence making it more of a people’s Plan.
• Pune CMP promotes equity principles of mobility. It promotes equitable allocation of road space and recommends dedicated road space for public transit modes and NMT.
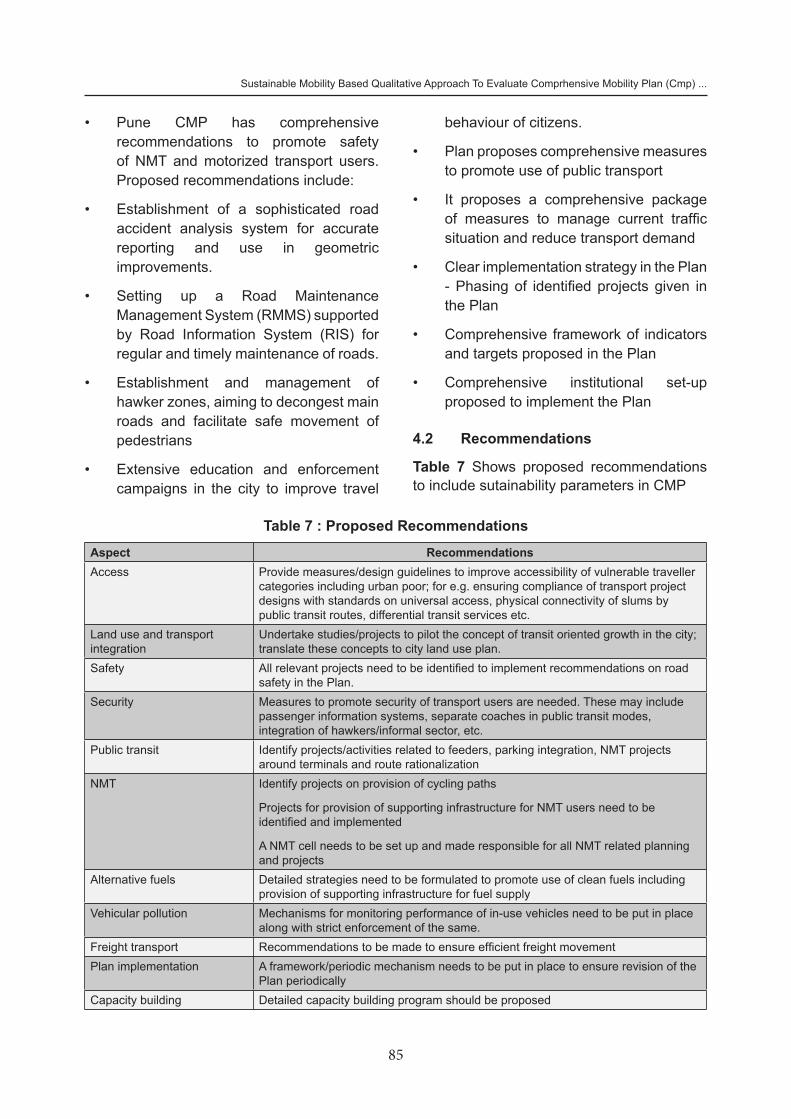
85
Sustainable Mobility Based Qualitative Approach To Evaluate Comprhensive Mobility Plan (Cmp) ...
• Pune CMP has comprehensive recommendations to promote safety of NMT and motorized transport users. Proposed recommendations include:
• Establishment of a sophisticated road accident analysis system for accurate reporting and use in geometric improvements.
• Setting up a Road Maintenance Management System (RMMS) supported by Road Information System (RIS) for regular and timely maintenance of roads.
• Establishment and management of hawker zones, aiming to decongest main roads and facilitate safe movement of pedestrians
• Extensive education and enforcement campaigns in the city to improve travel
behaviour of citizens.
• Plan proposes comprehensive measures to promote use of public transport
• It proposes a comprehensive package of measures to manage current traffic situation and reduce transport demand
• Clear implementation strategy in the Plan - Phasing of identified projects given in the Plan
• Comprehensive framework of indicators and targets proposed in the Plan
• Comprehensive institutional set-up proposed to implement the Plan
4.2 Recommendations
Table 7 Shows proposed recommendations to include sutainability parameters in CMP
Aspect RecommendationsAccess Provide measures/design guidelines to improve accessibility of vulnerable traveller
categories including urban poor; for e.g. ensuring compliance of transport project designs with standards on universal access, physical connectivity of slums by public transit routes, differential transit services etc.
Land use and transport integration
Undertake studies/projects to pilot the concept of transit oriented growth in the city; translate these concepts to city land use plan.
Safety All relevant projects need to be identified to implement recommendations on road safety in the Plan.
Security Measures to promote security of transport users are needed. These may include passenger information systems, separate coaches in public transit modes, integration of hawkers/informal sector, etc.
Public transit Identify projects/activities related to feeders, parking integration, NMT projects around terminals and route rationalization
NMT Identify projects on provision of cycling paths
Projects for provision of supporting infrastructure for NMT users need to be identified and implemented
A NMT cell needs to be set up and made responsible for all NMT related planning and projects
Alternative fuels Detailed strategies need to be formulated to promote use of clean fuels including provision of supporting infrastructure for fuel supply
Vehicular pollution Mechanisms for monitoring performance of in-use vehicles need to be put in place along with strict enforcement of the same.
Freight transport Recommendations to be made to ensure efficient freight movement Plan implementation A framework/periodic mechanism needs to be put in place to ensure revision of the
Plan periodicallyCapacity building Detailed capacity building program should be proposed
Table 7 : Proposed Recommendations
86
Akshima T Ghate
ACKNOWLEDGEMENTS
Author would like to acknowledge the support of Shakti Sustainable Energy Foundation for support of this study that focused on review of CMPs of Indian cities. Author is also grateful to Mr S Sundar, Distinguished Fellow, TERI, New Delhi under whose guidance the CMP evaluation framework was prepared and the review of CMP was carried out.
REFERENCES1. TERI. 2009 - An exploration of sustainability in
the provision of basic urban services in Indian cities, New Delhi: The Energy and Resources Institute (TERI)
2. Ghate Akshima T. and SundarSanjivi. 2012 - How should cities plan for sustainable mobility? - A framework based on evaluation of city mobility plans. Paper presented at CODATU XV conference, October 24, 2012, Addis Ababa.
3. Pune Municipal Corporation (PMC). 2008 - Comprehensive Mobility Plan for Pune City, Pune: Pune Municipal Corporation

CALL FOR PAPERS
The Institute of Urban Transport is actively engaged in the dissemination of knowledge about the importance of urban transport by publishing its journal, quarterly news-letter, organizing conferences, workshops and training courses. The Institute proposes to publish two issues of its journal every year – one in June and the other in December - focusing on the following themes:
1. Transport Planning and Mobility – Transport Plans (CTTS, CMP’s etc.), mobility patterns and issues, integrated land use – transport planning, travel behavior, transport modeling, planning for parking facilities, mobility of physically challenged etc.
2. Public Transport – Planning for road and rail based transit systems (city buses, BRTS, MRTS, LRT, monorails etc.), feeder transport systems, para transit systems, interchange, terminals and depots, fare collection systems, public transport productivity issues etc.
3. Non-Motorised Transport – Role of NMT systems, planning aspects related to pedestrians, cyclists and cycle rickshaw facilities etc.
4. TrafficEngineering,ManagementandSafety – Road geometrics and capacity, intersection design and capacity, delays, congestion, traffic management, TSM, traffic control and regulation, ITS applications, road safety issues etc.
5. Transport Economics, Financing and InstitutionalMechanism – Urban transport economics aspects, urban transport financing methods, congestion pricing, urban transport fund, institutional mechanisms, capacity building, reforms etc.
6. Transport Policy and Environment – Urban Transport Policy, sustainability issues, environment impacts etc.
All the papers received by the institute would be peer reviewed before considering them for publication in the Journal.
Interested authors are requested to send soft copies of their papers preferably based on some case studies as per the format of the past papers published alongwith a brief abstract and key words at the following e-mail addresses :
1. Executive Secretary (IUT) : [email protected]
2. Chairman, Editorial Board : [email protected]
SubmissionDeadlines
For June issue of the Journal - by 15th April
For December issue of the Journal - by 15th October

LISTOFPAPERSPUBLISHEDTILLDATE
August 2012 Edition
TechnicalPapers
1. Transport Sector Plan for Al Batinah Region of Sultanate of Oman Satyakam Sahu, Pradeep Kumar, Renu Kumar and M.P. Raju
2. Development of Mass Transport System Network for Bengaluru Yash Sachdeva, Viresh P. Goel and Sudeep Gupta
3 Traffic Impact Assessment of Urban Infrastructure Project Samir Sharma and Sharad Mohindru
4. Fare Strategy and Transit Performance, Case Study-Jaipur City Transport Services Amit Bhatt, Preeti Mathur and Umang Jain
5. Mobitity Patterns in Residental Neighborhoods of Delhi: Characteristics and Issues Amit Arora and Sanjay Gupta
6. Time-Use Analysis of Warangal City-An Activity Based Approach Karthikeya Pavan Kumar Pisipati and C.S.R.K. Prasad
7. Modelling the infulence of Cross Roads and Fringe conditions on Travel Time Shivprasad B. Khedkar and R. Sivanandan
August 2011 Edition
TechnicalPapers
1. Travel Characteristics of Kabul City and Reconstruction of Transport Infrastructure P.K. Sikdar and Nimisha Pal
2. GIS Based Evaluation of Public Transit System Vimal Gahlot, B.L. Swami, M. Parida, S.S. Jain and P. Kalla
3 Evaluation of Traffic and Transportation Characteristics of Delhi Madhu Errampalli, Ravinder Kayitha and Velmurugan S.
4 Study on Impact of Variable Message Signs (VMS) in Regulating Urban Traffic Gouri, Vinay Maitri and P.K. Sarkar
5 Genetic Algorithm Based Neural Network Model for Mode Choice Analysis Ch. Ravi Sekhar, B.K.Durai, E. Madhu and S. Gangopadyayay
6 Optimisation of Coordinated Signal System Parameters Ranju Mohan, Anjaneyuli M.V.L.R and Hari Krishna M
7 Systematic Identification of Bottlenecks on Urban Arterials : A Case Study A. Mohan Rao and K. Ramachandra Rao
December2010Edition
TechnicalPapers
1. Discrete Route Choice Model for Bicyclists in Pune, India Himani Jain and Geetam Tiwari
2. Discrete Route Choice Analysis of Activity Based Travel Pattern Neethu Mohan and Anjaneyulu M.V.L.R
3. Dynamic Trip Distribution of Workers for a Metropolitan City through Implicit Gravity Modeling G.J.Joshi and B.K.Katti
4. Water Transport Demand –Exploring Potential between Island City and Main Land Mumbai Sarat Pal, Santosh Jalihal and Madhulika V
(i)
5. Chennai Metro-Will it be a Boon for Development of Chennai City S.P. Sekar and D. Karthigeyan
6. Understanding Conditions for Bicycles Traffic through Historical Inquiry: The Case of Stockholm Martin Emanuel
7. Evaluation of Pedestrian Crossing Facilities: A Case Study of Delhi Mukti Advani, B. Kanagadurai and Kamini Gupta
8. Methodology of Qualitative Assessment of Traffic Management Measures for Disasters Anil Minhans
9. Planning for Accessible Transit Infrastructure - Case of Delhi BRT Anjlee Agarwal and Debabrata Chakravarti
10. Designing Better Streets for Indian Cities Pradeep Sachdeva and Vishwesh Viswanathan
TechnicalNotes11. Non-Motorized Modes as Feeder for Bus Rapid Transit System Vimal Gahlot, B.L. Swami, M.Parida, Pawan Kalla and Rajeev Mishra
July 2010 Edition
TechnicalPapers
1. Planning Development of City Bus Services for Small Size Cities in India Nimisha Pal and V. Brindha Sankari
2. Mobility Characteristics of Refugees and Displaced Persons in Metropolitan City of India Sanjay Gupta
3. Transportation Planning Issues for Gurgaon Urban Area Yash Sachdeva
4. Strategies for Promoting Low Carbon Transport (Public Transport and Non Motorised Transport) in Indian Cities
Geetam Tiwari and Deepty Jain
5. Quantification of Welfare Benefits of London Congestion Pricing Kayitha Ravinder, S. Velmurugan and S. Gangopadhyay
6. Perils of Road Traffic Accidents (RTA) and Mobility Risk on Indian Roads Kiran Sandhu and Gurpreet Singh Gill
7. Development of Road Accident Models for Hyderabad Metropolitan City A. Ramesh and M. Kumar
TechnicalNotes
8. Seat Belt : Safety Potential Untapped Surinder Mohan, R.K. Bajpai and S. Gangopadhyay
9. Towards Safe and Sustainable Urban Trasnsport A.K. Jain
December2009EditionTechnicalPapers
1. Modelling Passenger Mode Choice Behaviour for Medium Cities in India A Mohan Rao, P K Kanchan and B K Durai
2. Evaluation of Transit Quality and Commuter Satisfaction in Multi modal Transport System
(ii)
Pawan Kumar, S Y Kulkarni and M Parida
3. Non- Motorized Transport - A Deprived Mode on Urban Roads Hapreet Singh Brar and Tania Chopra
4. Impact of Variable Message Signs on Motorist Behaviour on an Urban Highway Stretch: A Case Study S Velmurugan, K Ravinder , K V Gaensh Babu and S. Gangopadhyay
5. Saturation Flow Characteristics at Signalised Junctions Mashkur Ahmad, Sewa Ram and P K Sarkar
6. Application of GPS for Traffic Studies K Ramachandra Rao and A Mohan Rao
TechnicalNotes
7. Leveraging Information Technology in Bus Transport Organizations D B Srinivas
8. Best Practices on Integrated Public Transport System: A World Scenario Ami H Shah, M Parida and S S Jain
9 Personal Rapid Transit: A Sustainable Mass Transit Alternative for India Anupam Vibhuti
10. Sustainable Urban Transport Planning Initiatives in India Peter Matin, Seshadri Iyengar, Sujay Rathi and Vinoba S Singh
11. Global Environment Facility - Sustainable Urban Transport Project Arun Herur and Mugdha Shekhar
December2008Edition1 Redevelopment Plan for Connaught Place, New Delhi Traffic Engineering and Management Proposals Abhay Negi and Piyush Kansal
2 Development of Quick Response Techniques (QRT) for Travel Demand Estimation of Small & Medium Town Cities in India
Kavitha Ravinder, S. Velmurugan, J. Natraju and S. Gangopadhyay
3 Mobility Considerations for Improvement of Weekly Markets in Delhi, Case Study: Amar Colony Sonia Arora, P.K. Sarkar and Kanika Kalra
4 Application of Delphi Technique to Evolve Reform Strategies for Bus System of Delhi Sujata Sawant and Sanjay Gupta
5 Three Wheeled Scooter Taxi: Problems & Solutions for an Efficient Mode of Transportation Dinesh Mohan
6 Bicycles in Urban India Geetam Tiwari and Himani Jain
7 Sensitivity Analysis of Walkability for Pedestrian Facilities in Delhi Purnima Parida, Najamuddin and M. Parida
8 Financing Urban Public Transport P.S. Kharola
December2007Edition
1 Planning Pedestrian Facilities in the Urban Environment D. Sanyal
(iii)
2 Planning & Designing of Bus Rapid Transit System - Delhi Experience Piyush Kansal and Abhay Negi
3 Cost Effectiveness Analysis of Advanced Parking Management System (APMS) installed in Palika Parking, New Delhi
S. Velumurugan, Purnima Parida, S. Gangopadhyay and Kirit B. Nasit
4 Light Rail Transit B.I. Singal
5 Delhi Metro Feeder Bus Service Ch. Srinivas
6 Urban Freight Movement in Delhi – Characteristics Issues and Policy Directions Sanjay Gupta and N. Ranganathan
7 Traffic Characteristics and Transportation Problems of Amravati City Kayitha Ravinder and S. Gangopadhyay
December 2006 Edition1 National Urban Transport Policy – The Road Ahead R.C. Sharma
2 Uran Roads and Mixed Land Use Dsevelopment: Some Viewpoints of Delhi’s Scenario R.C. Gupta
3 Mumbai Metro Rail Project - An Overview PRK Murthy and K. Vijaya Lakshmi
4 Driving Bangalore Forward – “NAMMA METRO” Sandeep Dash
5 Parking Demand Management in Small & Medium towns LS Murali, PN Rajesh and B. Ramamurthy
6 Transport Measures to Reduce Fuel Loss on Chelmsford Road, New Delhi Purnima Parida, S. Gangopadhyay and A.K. Goel
7 Traffic Management in Hyderabad: Problems & Perspectives Abdul Sameem Ansari
December2005Edition1 PURA- Planned Urbanization for Rural Areas P.S. Rana
2 Monorail B.I. Singal
3 Rail Based Commuter Service for Million Plus Cities A.A. Sahay
4 Evolving A Parking Policy for Delhi A.K. Jain
5 Transport Measures to Reduce Emissions in Hyderabad Yash Sachdeva, Viresh Goel and D.S. Chari
6 Traffic Management Plan for Central Kampala Piyush Kansal and Rakesh Kaul
(iv)
January 2005 Edition1 Urban Transportation in India- Need for Indigenous and Innovative Systems Murty and V.A. Bondada
2 Technologies In Public Transport Vinod Sibal
3 Intelligent Transport Systems – Potential Tool to Optimize Usage of Transportation Infrastructure Sanjay Gupta
4 Technological Development I Metro Systems with Special Reference to Delhi Metro Satish Kumar
5 Tool for Demand Management of Urban Transport Rajiv Sharma
6 Decision Support System for Feeder Bus Routes of Rail Transit Network Raman Parti, B.R. Marwah and Sujata Sawant
7 Urban Public Transportation – Commuter Perception on APSRTC bus Service B.P. Chandrasekhar and C.S.R.K. Prasad
January 2004 Edition1 Some reflections on transport problems in Mumbai M.Q. Dalvi
2 Issues and Consideration in integration of Road and Raill Mass Transit System B.R. Marwah, V.K. Sibal, Dr. Raman Parti and Sujata Sawant
3 Master Plan for Metro Projects S.L. Dhingra
4 Prioritization of road improvement schemes for medium sized towns using HDM-4 model V.N. Vijukumar, G. Ravikumar and T. Elangovan
5 Sustainable Transport Policy for building Metropolises of India- facts to be considered Ashwani Luthra
September2002Edition1 Comuter Rail System in Delhi & surrounding NCR area Sanjay Singhal
2 Future Fuels for Transportation T. Elangovan
3 Public Mass Transportation in India- Planning & Development Strategy T.K. Mitra
4 Accident Scenario in Metropolitan Cities of India Mahesh Chand
December2001Edition1 Needs for National Urban Transport Policy R.C. Sharma
2 Urban Traffic Management – A case study of Delhi D. Geetam Tiwari
3 Challenges of Urban Transport A.N. Bansal
4 Financing Projects through Property Development – A case study of Delhi MRTS R.M. Rana
(v)
5 Road Accident Analysis – A case study of Patna City Sanjay K. Singh and Ashish Mishra
6 Public Transport Systems - A case study of Chennai S. Ponnuswamy and M. Imtiyaz Ahmed
7 Traffic Integration of MRTS stations – A case study of Seelampur station K Srinath
March2001Edition1 Management of Urban Infrastructure: Institutional Reforms & Restructuring N. Ranganathan
2 Urban Roads in the Service of the Nation D.P. Gupta
3 Transport & Urban Governance Sudarsanam Padam
4 Urban Transport Scenario in India and its Linkages with Energy & Environment Vinod Sibal and Yash Sachdeva
5 Self-help Program fro Traffic Improvemnets in Tirupur Town N.S. Srinivasan
6 Integrated GIS as a tool fro Urban Transport Planning Samon Mathew and Ms. Bh. Annapurna
7 A Level of Service Concept for Capacity Analysis of Grade Separated Pedestrian Facilities M. Parida, S.S. Jain and K. Bhavanarayana
8 DMI and its use in Traffic Engineering M.V.L.R. Anjaneyulu and B.N. Nagaraj
December2000Edition1 Traffic Congestion Management in Urban Areas Sanjay Gupta
2 The Turn Around Strategy of Urban Bus Transportation System P.S. Kharola, B. Gopalkrishna, D. Madhu BAbu and D.C. Prakash
3 The Relevance of Trolley Buses for Metropolitan Transit Schemes in India with particular reference to Delhi A.A. Sahay
4 Traffic Management at Intersections of Nagpur City T.S. Reddy, S. Gangopadhyay and Subhash Chand
5 Vexed Pedestrians and Vexing Problems of Pedestrianisation D. Sanyal
6 Performance Evaluation of Mass Transportation Services in Thiruvananthapuram City Kuncheria, P. Isaac and Shaheem S.
7 Optimal Bus Stop Spacing and Location Using GIS P. Partheeban and S. Moses Santhakumar
8 A Parking Management in Delhi Emerging Imperatives P. Jayapal and S. Srirangan
9 Application of SIDRA software for Evaluation of Performance of Road Intersections P.K. Sarkar and Abhro Mira
(vi)
March2000Edition1 Problems relating to Metropolitan Transportation in India & Possible Remedies N.P. Singh
2 Urban Transport Strategies for Indian Cities Bharat Singal
3 Urbanization & Urban Transport E. Sreedharan
4 Legislative Restrictions on Transportation in Metropolitan Areas Kiran Dhingra
5 Urban Transportation Planning & Strategies T.S. Reddy
6 Transportation Demand Management as a Solution to Traffic Problems in Urban Areas D. Sanyal
7 Non- Motorized Transport in Urban India: An Overview Y.P. Anand
8 Area of Influence in Designing Safer Roads S.M. Sarin
9 Experience with Premium Bus Service in Guwahati O.P. Agarwal
(vii)
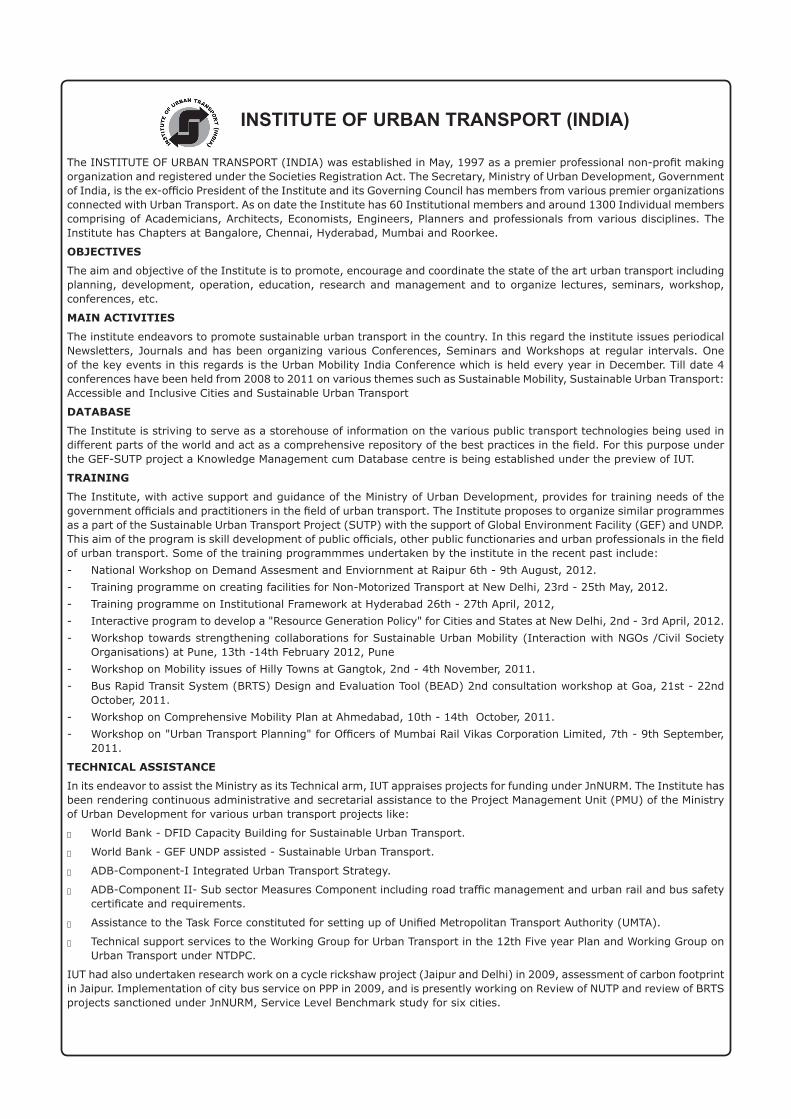
INSTITUTE OF URBAN TRANSPORT (INDIA)
The INSTITUTE OF URBAN TRANSPORT (INDIA) was established in May, 1997 as a premier professional non-profit making organization and registered under the Societies Registration Act. The Secretary, Ministry of Urban Development, Government of India, is the ex-officio President of the Institute and its Governing Council has members from various premier organizations connected with Urban Transport. As on date the Institute has 60 Institutional members and around 1300 Individual members comprising of Academicians, Architects, Economists, Engineers, Planners and professionals from various disciplines. The Institute has Chapters at Bangalore, Chennai, Hyderabad, Mumbai and Roorkee.
OBJECTIVES
The aim and objective of the Institute is to promote, encourage and coordinate the state of the art urban transport including planning, development, operation, education, research and management and to organize lectures, seminars, workshop, conferences, etc.
MAIN ACTIVITIES
The institute endeavors to promote sustainable urban transport in the country. In this regard the institute issues periodical Newsletters, Journals and has been organizing various Conferences, Seminars and Workshops at regular intervals. One of the key events in this regards is the Urban Mobility India Conference which is held every year in December. Till date 4 conferences have been held from 2008 to 2011 on various themes such as Sustainable Mobility, Sustainable Urban Transport: Accessible and Inclusive Cities and Sustainable Urban Transport
DATABASE
The Institute is striving to serve as a storehouse of information on the various public transport technologies being used in different parts of the world and act as a comprehensive repository of the best practices in the field. For this purpose under the GEF-SUTP project a Knowledge Management cum Database centre is being established under the preview of IUT.
TRAINING
The Institute, with active support and guidance of the Ministry of Urban Development, provides for training needs of the government officials and practitioners in the field of urban transport. The Institute proposes to organize similar programmes as a part of the Sustainable Urban Transport Project (SUTP) with the support of Global Environment Facility (GEF) and UNDP. This aim of the program is skill development of public officials, other public functionaries and urban professionals in the field of urban transport. Some of the training programmmes undertaken by the institute in the recent past include:
- National Workshop on Demand Assesment and Enviornment at Raipur 6th - 9th August, 2012.
- Training programme on creating facilities for Non-Motorized Transport at New Delhi, 23rd - 25th May, 2012.
- Training programme on Institutional Framework at Hyderabad 26th - 27th April, 2012,
- Interactive program to develop a "Resource Generation Policy" for Cities and States at New Delhi, 2nd - 3rd April, 2012.
- Workshop towards strengthening collaborations for Sustainable Urban Mobility (Interaction with NGOs /Civil Society Organisations) at Pune, 13th -14th February 2012, Pune
- Workshop on Mobility issues of Hilly Towns at Gangtok, 2nd - 4th November, 2011.
- Bus Rapid Transit System (BRTS) Design and Evaluation Tool (BEAD) 2nd consultation workshop at Goa, 21st - 22nd October, 2011.
- Workshop on Comprehensive Mobility Plan at Ahmedabad, 10th - 14th October, 2011.
- Workshop on "Urban Transport Planning" for Officers of Mumbai Rail Vikas Corporation Limited, 7th - 9th September, 2011.
TECHNICAL ASSISTANCE
In its endeavor to assist the Ministry as its Technical arm, IUT appraises projects for funding under JnNURM. The Institute has been rendering continuous administrative and secretarial assistance to the Project Management Unit (PMU) of the Ministry of Urban Development for various urban transport projects like:
● World Bank - DFID Capacity Building for Sustainable Urban Transport.
● World Bank - GEF UNDP assisted - Sustainable Urban Transport.
● ADB-Component-I Integrated Urban Transport Strategy.
● ADB-Component II- Sub sector Measures Component including road traffic management and urban rail and bus safety certificate and requirements.
● Assistance to the Task Force constituted for setting up of Unified Metropolitan Transport Authority (UMTA).
● Technical support services to the Working Group for Urban Transport in the 12th Five year Plan and Working Group on Urban Transport under NTDPC.
IUT had also undertaken research work on a cycle rickshaw project (Jaipur and Delhi) in 2009, assessment of carbon footprint in Jaipur. Implementation of city bus service on PPP in 2009, and is presently working on Review of NUTP and review of BRTS projects sanctioned under JnNURM, Service Level Benchmark study for six cities.
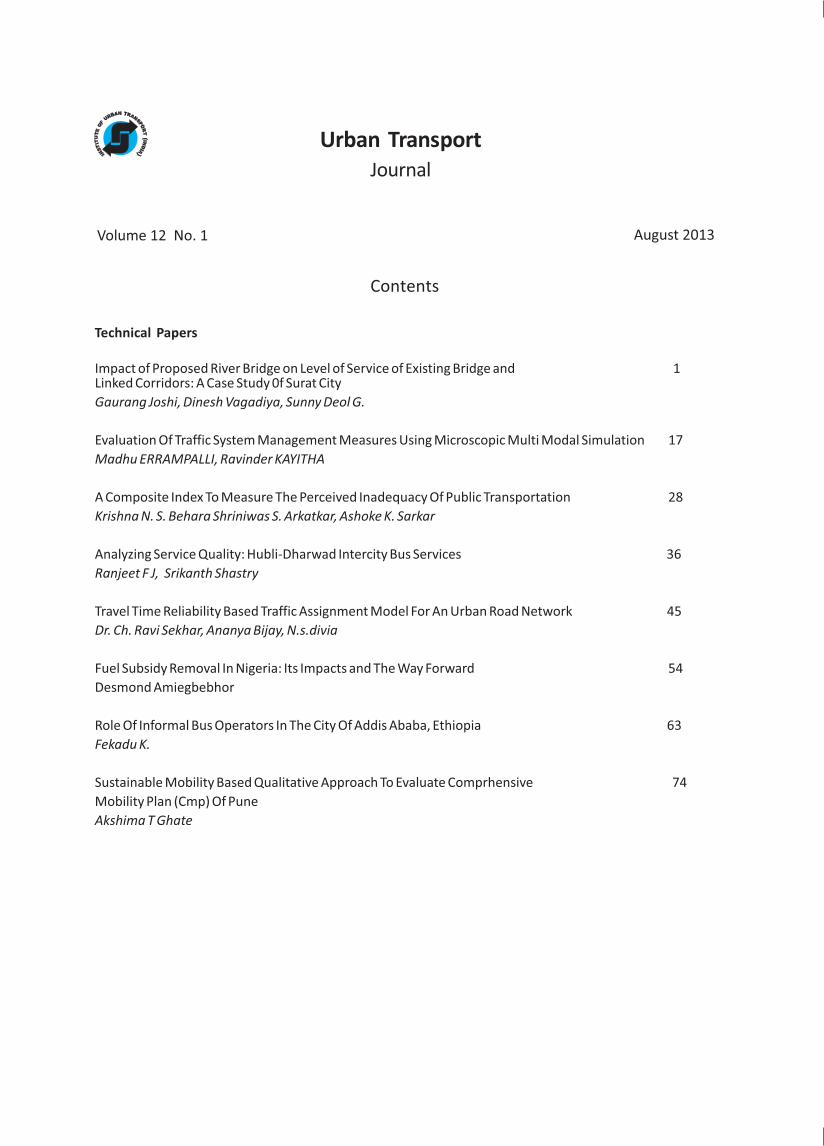
URBAN TRANSPORT
Journal
Volume 12 No. 1 August 2013
Volume 12 No. 1 August 2013
Impact of Proposed River Bridge on Level of Service of Existing Bridge and 1Linked Corridors: A Case Study 0f Surat City
Gaurang Joshi, Dinesh Vagadiya, Sunny Deol G.
Evaluation Of Traffic System Management Measures Using Microscopic Multi Modal Simulation 17
Madhu ERRAMPALLI, Ravinder KAYITHA
A Composite Index To Measure The Perceived Inadequacy Of Public Transportation 28
Krishna N. S. Behara Shriniwas S. Arkatkar, Ashoke K. Sarkar
Analyzing Service Quality: Hubli-Dharwad Intercity Bus Services 36
Ranjeet F J, Srikanth Shastry
Travel Time Reliability Based Traffic Assignment Model For An Urban Road Network 45
Dr. Ch. Ravi Sekhar, Ananya Bijay, N.s.divia
Fuel Subsidy Removal In Nigeria: Its Impacts and The Way Forward 54
Desmond Amiegbebhor
Role Of Informal Bus Operators In The City Of Addis Ababa, Ethiopia 63
Fekadu K.
Sustainable Mobility Based Qualitative Approach To Evaluate Comprhensive 74
Mobility Plan (Cmp) Of Pune
Akshima T Ghate