Embed Size (px)
Citation preview

Urban Transportation Planning Model Update - Phase II
TASK E
DEVELOP STANDARDIZED MODAL SPLIT MODELS
Prepared for:
The Florida Department of Transportation
Prepared by:
COMSIS Corporation Killearn Village Square
3644 Shamrock West Tallahassee, Florida 32308
(904) 893-3125
October 1981

Urban Transportation Planning Model Update - Phase II
TASK E
DEVELOP STANDARDIZED MODAL SPLIT MODELS
Prepared for:
The Florida Department of Transportation
Prepared by:
COMSIS Corporation Killearn Village Square
3644 Shamrock West Tallahassee, Florida 32308
(904) 893-3125
October 1981

FOREWORD
This report is the third in a series of four reports
documenting Phase II of the urban Transportation Planning
Model Update Study. This report documents Task E. Task E
has developed standardized modal split models for use in the
urbanized areas of Florida.
Phase I of the Urban Transportation Planning Model Up-
date has been completed. Phase I consisted of Tasks A and B.
Task A included the initial review of operating experience
within the Urban Transportation Section (now the Bureau of
Urbanized Area Systems Planning) of the Florida Department of
Transportation and the identification of individual programs
and procedures that would best serve all or groups of Flor-
ida's urbanized areas in the application mode. In Task B, a
trip generation model set was developed for potential use in
the urbanized areas of Florida.
Phase II is divided into four tasks. Task E, which is
documented herein, has developed standardized modal split
models; Task C has developed standardized distribution and
assignment models; Task D will develop a systems evaluation
model; and in Task F, corridor analysis procedures were de-
veloped.
This report is divided into four chapters which parallel
the study progress in Task E. The first chapter presents a
review of operational experience. In Chapter Two, alterna-
tive modal split procedures were recommended for further con-
sideration. In Chapter Three, an evaluation of the alterna-
i

tive modal split procedures was accomplished and specific
recommendations were advanced as to which areas should use
the recommended procedures. In Chapter Four, refinements of
this recommendation are documented based upon Florida DOT and
Model Task Force review. In addition, a procedure to stand-
ardize the application of the modal split models is pre-
sented.
ii

TABLE OF CONTENTS
FOREWORD .............................................
LIST OF FIGURES ......................................
LIST OF TABLES .......................................
CHAPTER ONE - REVIEW OF OPERATIONAL EXPERIENCE .......
Mode Choice Models - Background ................. Review of Florida Mode Choice Models ............ Auto Occupancy ..................................
CHAPTER TWO - FORMULATION OF ALTERNATIVE PROCEDURES . .
Categorization of Existing Florida Models ....... Alternatives to be Considered ................... Recommendation for Modal Choice Models .......... Accuracy Evaluations ............................
CHAPTER THREE - EVALUATION OF ALTERNATIVE MODAL SPLIT PROCEDURES ..........................
Review of Modal Split Model Categorization ...... Review of Recommended Modal Split Alternatives . . Area Sensitive Evaluation of Recommended Procedures .....................................
Recommendations ................................. Summary .........................................
CHAPTER FOUR - SELECTION AND REFINEMENT OF RECOMMENDED PROCEDURES ...............
Sensitivity Tests of Logit Formulation .......... Specific Model Recommendations .................. Procedures for Applying Standardized Modal Split Model ....................................
APPENDIX I - TRIP TABLE DEVELOPMENT CODE CONTAINING POLK COUNTY MODAL SPLIT MODEL ..........
APPENDIX II - TRIP TABLE DEVELOPMENT CODE CONTAINING GAINESVILLE MODAL SPLIT MODEL .........
Page
i
iV
V
1
: 14
17
.I7 19 20 24
29
29 30
3; 41
43
43 47
51
I-l
II-1 APPENDIX III - STANDARDIZED MODAL SPLIT PROCEDURES... III-1
iii

LIST OF FIGURES
Figure
1 Mode Choice Model Alternatives
2 Mode Choice Model for Polk Study
3 Example of Transit Trip-Making Indices for Sarasota-Manatee
4 Summary of Mode Choice Models
Page
3
9
10
12
iv

LIST OF TABLES
Table Page
1 Choice Models and Other Characteristics for Florida Study Areas 20
Chapter One
REVIEW OF OPERATIONAL EXPERIENCE
The purpose of this chapter is to accomplish a general-
ized review of the existing modal split models in use within
the State of Florida as well as to review current Urban Mass
Transportation Administration (UMTA) policy with regard to
modal split modeling. Also, a review of the current state-
of-the-art in disaggregate, behavioral modal split modeling
techniques currently being researched is made. The findings
of this task will be utilized to formulate alternative proce-
dures in Chapter Two.
Mode choice analysis is accomplished to determine the
number of transit trips and auto person trips. Auto occu-
pancy relationships are utilized to convert the auto person
trips to auto drivers and auto passengers. Although auto
occupancy relationships will be reviewed herein and alter-
nates presented in Chapter Two, Task E will not evaluate and
validate alternate relationships since this is beyond the
scope of this project.
MODE CHOICE MODELS - BACKGROUND
There are numerous methods utilized for mode choice
analysis. The four basic approaches have been:
1. Direct Generation:
Trip generation rates are developed for auto driver trips, thereby eliminating any mode choice model procedure, as such. Rates can also be developed to generate transit trips directly. This procedure is most appropriate for smaller urban areas where transit use is very low.
1
2. Pre-Distribution
A mode choice model that is applied after person trips are generated but before trip distribution. This technique results in trip distribution model applications for auto and for transit trips. Also, most approaches of this type do not consider system attributes directly. Basically, trip end character- istics such as auto ownership and population den- sity, may be considered at the production end and employment density at the attraction end. Sys tern characteristics such as whether service is provided or not may be considered. Interchange character- istics related to specific production and attraction areas cannot be considered here. This type of approach is most appropriate in smaller to moderate size urban areas with a small bus system.
3. Post-Distribution:
A mode choice model that is applied after trip dis- tribution of person trips. Here the model is ap- plied to the person trip table resulting in transit passenger trips and auto passenger trips. The ad- vantage .of this technique is that it can reflect system operation between pairs of production and attraction zones based upon operating characteris- tics and cost of travel. This allows the ability to assess: competing highway and transit levels of service; auto operation cost; parking fees; and transit fares. This approach is most suitable for larger urban areas with a transit system large enough to support system level alternatives analy- sis.
4. Simultaneous:
A simultaneous trip distribution and mode choice model which in one operation determines the inter- change by mode between production and attraction zone pairs. The mode choice analysis element can reflect the same system parameters as the post-dis- tribution mode choice model. At best what is saved is a computer step. What is lost is the ability to separately evaluate the two steps of distribution and mode choice.
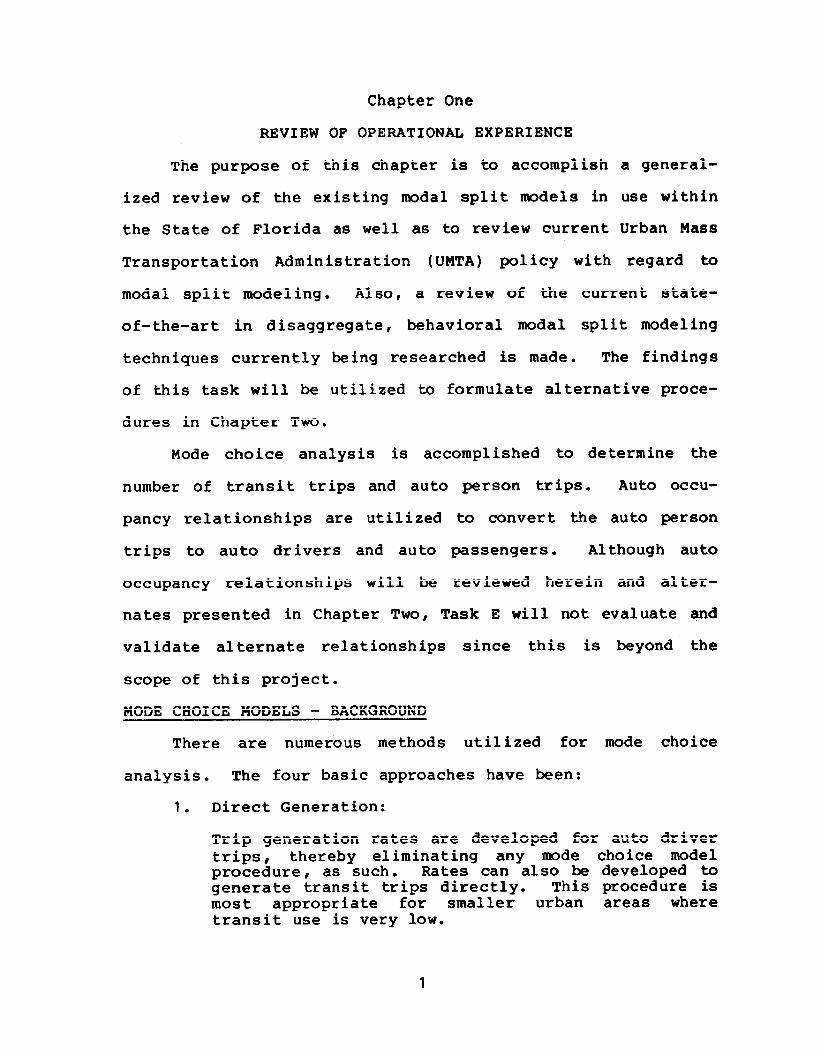
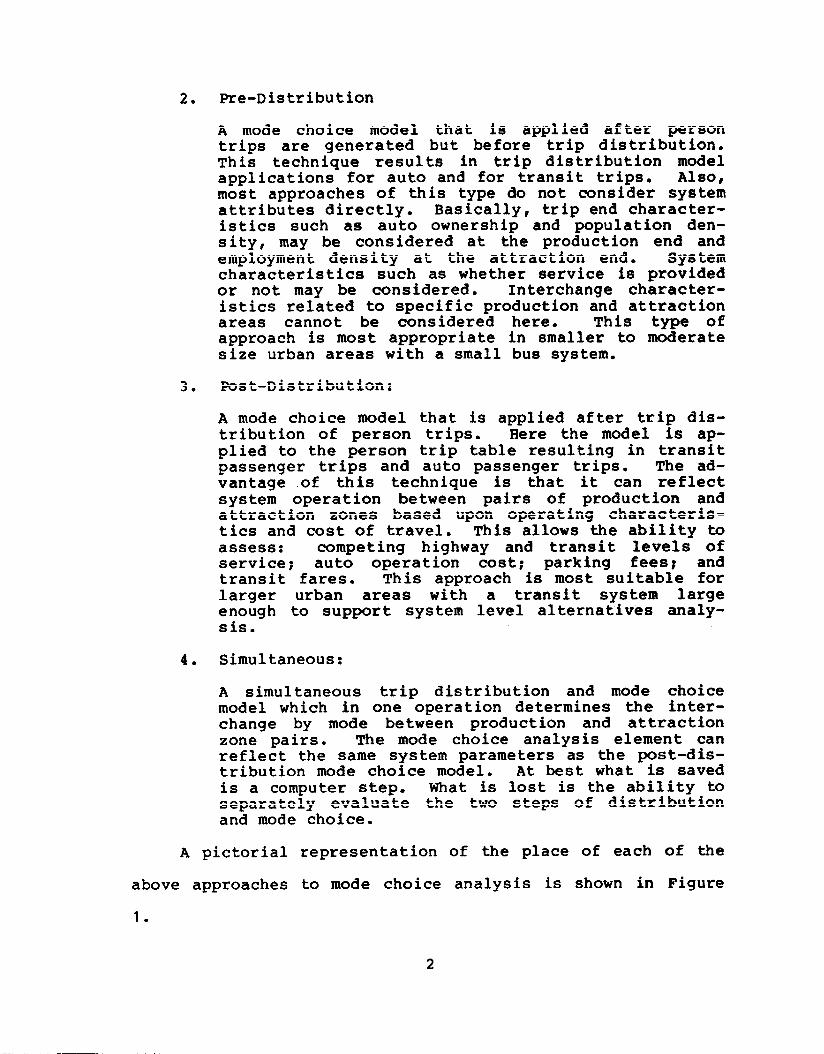
A pictorial representation of the place of each of the
above approaches to mode choice analysis is shown in Figure
1.

TRIP I
GENERATION
Direct Generation •--_-_-~----_.o--~
of Trips by Mode 7
I
I
I
Pte-Dlstributlon I *--- --__ -----___-
1
TRlP ti DISTRIBUTION
Simultaneous --mm--- --
i
MODE CHOICE MODEL
4-a _-
I I TRAFFIC ASSIGNMENT
Post-Distribution I
MSw--w --w-B-- J
FIGURE 1
MIDI CIiOICE MODEL ALTERNATIVES
3

REVIEW OF FLORIDA MODE CHOICE MODELS
The Logit Model - Post-Distribution
Basically, all of the above generic types of models have
been used by Florida's urbanized areas - except for the
simultaneous approach.
The most utilized model is the post-distribution LOGIT
formulation of the form:
MSt=A+l-A-B
1 + eC(Au +D)
Where: MSt = Modal Split to Transit Mode
A= Transit Captives Fraction
B= Highway Captives Fraction
c= Slope parameter which determines elasti- city of the LOGIT curve
D= Point of Symmetry of the LOCIT curve
The calibration consists of determining the values for terms
A, B, C and D. In most cases the Au, or disutility term, is
expressed as:
nu = Transit Impedance - Auto Impedance
The values forming the transit and auto impedance are both
expressed in terms of time in minutes. Impedances considered
are line haul travel time, excess time and out-of-pocket cost
converted to time.
For the automobile, the line haul time is defined to be
the time spent in the auto during travel. The excess time is
composed of access, parking and egress time. The out-of-
pocket costs consist of parking costs, tolls and a perceived
automobile operating cost per mile.
4

For transit, the line haul time is the actual time spent
on the transit mode. The excess time consists of access time
(auto or walk), transfer time, waiting time and egress time.
Cost consists of transit fare and station parking fees.
The costs mentioned above are converted to equivalent
minutes through the function:
ACostmin = ACOStcnts X 60 X 2000 X 1 Income
Where: 2000 hrs./year is assumed number of working hours to convert annual income to hourly income.
60 min./HR is used to convert hourly cost to costs in minutes.
Annual income in cents/year.
The function thereby allows income to be an input parameter.
In most Florida applications, a single income value was used
for an entire urbanized area. To allow for proper sensi-
tivity this value should be estimated by zone.
The total disutility Au is then the sum of the (tran-
sit - auto) value differences for line haul time, excess time
and cost, or:
Au = (Line Haul Time A ) + 2.5fExcess Time A) + 3.0 (Cost A)
The coefficients of 2.5 and 3.0 are a result of research on
the value of time. Indications are that these parameters are
reasonably stable for urban areas.
The model coefficients A, B, C and D are calibrated by
urban area by trip purpose. This usually considers the trip
purposes of Home-Based Work (HBW), Home-Based Non-Work (HBNW)
and Non-Home-Based (NHB), but can be derived for other
5

purposes. For example, in Jacksonville, Home-Based School
was an "other" purpose.
Input data requirements for the LOGIT model used in
several Florida urbanized areas include:
Transit Network Highway Network Person Trip Table by Purpose Cost Functions: Operating Cost/Mile - Auto Parking Cost by Purpose Transit Fares Income
The LOGIT formulation has been calibrated for the fol-
lowing Florida areas:
Miami Broward Pinellas Tampa Jacksonville Orlando Pensacola Tallahassee
Basically, all the model forms are the same but values for
the parameters A,. B, C and D vary. There is a very slight
difference in weighting of parameters for the disutility
function in Orlando. Other differences include use of dif-
fering numbers of purposes and special situations such as
differing model parameters for Miami's beach and non-beach
areas.
West Palm Beach utilizes a modal share model of the mul-
tinomial logit formulation, which considers parameters simi-
lar to that described above. The form of the model and vari-
ables used are shown below for non-work trips:
6

MSP = 1 l+e(A*APA+B) + e(C*DTT+D*DIFC+E)
e(A*APA+B) MSD =
l+e(A+APA+B) + e(C*DTT+D*DIFC+E)
e(C*DTT+D*DIFC+E) MST =
l+e(A+APA+B) + e(C*DTT+D*DIFC+E)
Where:
MSP = Probability of Making an Auto Passenger Trip;
MSD = Probability of Making an Auto Driver Trip:
MST = Probability of Making a Transit Passenger Trip;
APA = Autos Per Adult;
A = Coefficient of APA;
B = Constant;
DTT = Difference in Total Time;
C = Coefficient of DTT;
DIFC = Difference in Cost;
D = Coefficient of DIFC; and
E = Constant.
7

Other Post-Distribution Model
The Polk study utilizes a cross-classification post-dis-
tribution model. Three purposes are considered: HBW, HBNW,
and NHB. A transit coverage variable is used considering:
trip interchanges not covered by transit service; trip inter-
changes covered by transit service where one end is in a ma-
jor transportation attraction zone; trip interchanges covered
by transit service where neither end is in a major transpor-
tation attraction zone. A third variable considers the num-
ber of autos per dwelling unit (D.U.) at the production end
of resident D.U.'S. Transient D.U.*s are also considered.
An example cross-classification matrix is shown in Figure 2.
Cross-Clasification Pre-Distribution
The Sarasota-Manatee area utilizes a mode choice model
based upon use of a cross-classification of transit trips per
household based on auto ownership and income range by zone at
the production end. Rates are developed and controlled based
on an areawide rate of transit system users. The general
indices are shown in Figure 3. These are multiplied by an
areawide transit trip rate to obtain the final rate table.
For example, if 25,000 users are to be served per day, and
there are 100,000 dwelling units in the transit service area,
the areawide factor for the rate table would be 0.25
(25,000 t 100,000).
Trip attractions are handled based on a rate equation
consisting of a coefficient to be multiplied by zonal (total)
employment used to calculate an index for zone-to-zone
8
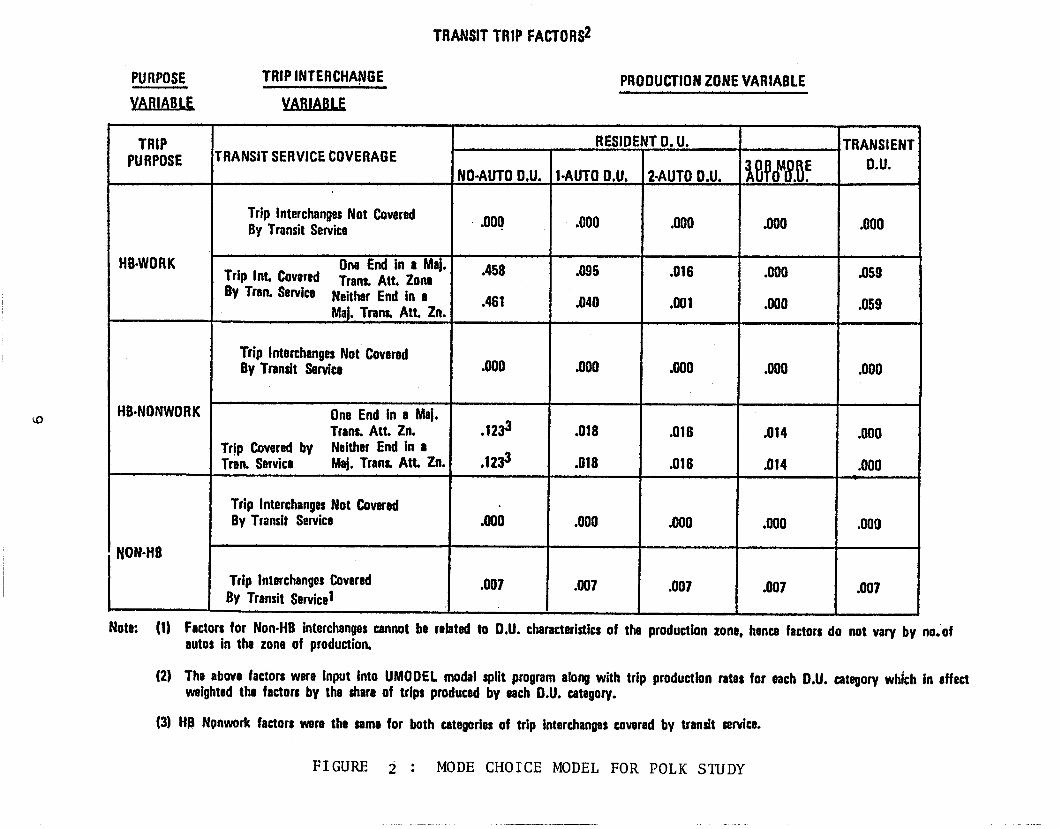
TRANSIT TRIP FACTORS2
PURPOSE
YAfWU
TRIP INTERCHANGE PRODUCTION ZONE VARIABLE
TRIP RESIOENT 0. U.
PURPOSE TRANSIT SERVICE COVERAGE . TRANSIENT
NO-AUTO D.U. l-AUTO 0.U. 2.AUTO D.U. i!S(J%JE DJJ.
Trip Interchanges Not Covered By Transit Service
.ooq .ooo .ooo .ooo ,000
H&WORK Trip ht. Covered
One End in a Maj.
By Trnn* Service Trans, Att. zone
.45&t .096 .016 .ootl .059
Neither End in I Maj. Trans. Att. Zn.
.461 .040 ,091 .ooo ,059
Trip Interchanges Not Covered By Transit Service .a00 .ooo .OOO .ooo .ooo
HB=NONWORK One End in a MaL Trans. Att. fn. .1233 .018 .016 .014 ,000
Tr!p Covered by Neither End in e Tran. Service Maj. Tranr Att. fn. .1233 .018 .016 .014 .ooo
Trip Interchanges Not Covered By Transit Service .oob .OOO ,000 .ooo .a00
NON-He
Trip Interchanges Covered .007 BV Transit Service1 I
.007 .007 .007 .007
Note: (1) Factors for Non.HB interchanges cennot be related to D.U. characteristics of the production zone, hence factors do not vary by no.‘of autos in the zone of production.
(2) The above factors were input into UMOOEL modal split program along with trip production rates for each D.U. category which in effect weighted the factors by the share of trips produced by each D.U. category.
(3) H8 Nonwork factors were the same for both categories of trip interchanges covered by transit service.
FIGURE 2 : MODE CHOICE MODEL FOR POLK STUDY

INCOME LEVEL
LOW
MIDDLE
HIGH
AUTO OWNERSH IF’
0 1 ‘Zor rr0re k-.
2.33 0.90 0.66
3.32 0.73 0.43
3.83 0.65 0.32
*To be multiplied by the areawide transit trip rate.
FIGURE 3
Em@LE OF TRANSIT TRIP-MAKING INDICES
FCR SABASOTA-MANATEE
10
transit trip attractions. The coefficient is determined by
setting total transit trip attractions equal to total transit
trip productions and thereby dividing transit trip produc-
tions from the cross-classification model by total employment
from the transit service area.
Direct Generation of Auto Travel
Gainesville, Lee and Brevard generate auto trips direct-
ly, so that no modal choice model is used.
Summary of Florida Models
Figure 4 presents a summary of the mode choice model
types that have been calibrated in Florida.
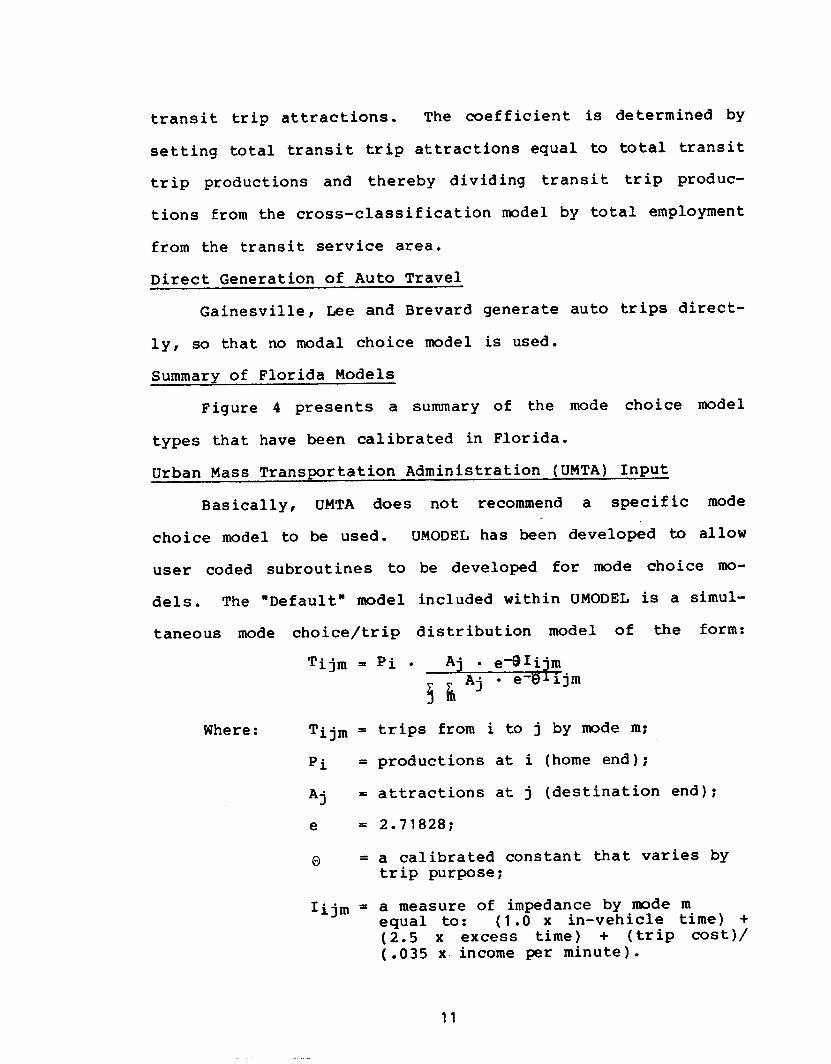
Urban Mass Transportation Administration (UMTA) Input
Basically, UMTA does not recommend a specific mode
choice model to be used. UMODEL has been developed to allow
user coded subroutines to be developed for mode choice mo-
dels. The "Default" model included within UMODEL is a simul-
taneous mode choice/trip distribution model of the form:
Tijm -_ Pi . Aj - e_BIi'm
SE Aj l e-ekjrn
Where: Tijm = trips from i to j by mode m;
Pi = productions at i (home end);
Aj = attractions at j (destination end);
e = 2.71828;
0 = a calibrated constant that varies by trip purpose;
Iijm = a measure of impedance by mode m equal to: (1.0 x in-vehicle time) + (2.5 x excess time) + (trip cost)/ (.035 x. income per minute).
11

MIAMI
BROWARD
PINELLAS
TAMPA
JACKSONVILLE
WEST PALM BEACH
ORLANDO
POLK
BREVARD
PENSACOLA
VOLUSIA
SARASOTA-MANATEE
LEE
TALLAHASSEE
GAINESVILLE
POST DISTRIBUTION
LOGIT
LOGIT
LOGIT
LOGIT
LOGIT
PROPORTIONAL
LOGIT
CROSS CLASS
LOGIT
LOGIT
LOGIT
PRE- DISTRIBUTION OTHER
GENERATE AUTOS
CROSS CLASS
GENERATE AUTOS
GENERATE AUTOS
FIGURE 4
SUMMARY OF MODE CHOICE MODELS
12

The mode choice model can be extracted from the above and is
of the form: MSt = _@I!$q&ja x 100
Where: MSt = fractional share of trips estimated to use the transit mode
t = mode of transit
a = mode of auto
Other terms as explained previously.
This is a logit formulation where impedances for auto
and transit are treated individually by the n-ode choice model
rather than as difference values.
Some of the considerations expressed in discussions with
UMTA and FHWA relate to the use of captive riders in the lo-
git formulation and in the use of income in the impedance
calculations. It would appear that better representation of
conditions would be reflected if these two characteristics
were zonal input rather than regional parameters.
Also, with regard to disaggregate behavioral models, the
current thinking appears to be that logit-type formulations
are the most appropriate type formulations for current appli-
cations and that they do reflect the behavioral characteris-
tics of the traveler. Logit type models reflect system char-
acteristics such as headway and speed, cost factors such as
parking cost and transit fare and user variables such as
income. All these factors are related to the traveler's
decision making regarding choice of mode for any particular
trip purpose.
13

Some other thoughts from Federal personnel include:
Perhaps only work trips should be considered in mode choice analysis using a logit model formulation. For non-work trips a trip end model may be most appropriate. This is based on the thought that non-work trips often involve family travel of 2, 3, and 4 people traveling together. The logit formulation considers individuals, whereas households or groups of individuals should be considered for non-work trips. One possible solution is the use of an auto occupancy division of the cost func- tion in the disutility portion of auto costs.
There is perhaps some reason to stratify work travelers by some economic factor(s) and calibrate separate models by classification. For example, auto ownership or auto ownership combined with workers per household could be utilized to stratify households for the development of separate models. Other possible stratifiers might in- clude population within walking distance to transit ver- sus those not within walking distance.
The logit model will not give reasonable results if walk and auto access times are not dealt with carefully (i.e. as zones get larger, average walk time cannot be used for the entire zone).
The discussion relative to thoughts from Federal personnel
indicate there are differences in approach to mode choice
between individuals. There is no consensus relative to
approach.
AUTO OCCUPANCY
There are two basic approaches to auto occupancy estima-
tion that have been used in Florida. The one used most fre-
quently is the development of a factor by trip purpose to be
applied to auto person trips. This considers one factor for
all trip movements of a particular purpose. For example,
auto occupancy factors might look like:
HB Work 0.86 HB Shop 0.57 HBSoc-Ret 0.50 HBMisc 0.58 NHB 0.61 All Purposes 0.63
14

The second approach uses the "default" model in the pro-
gram UMODEL. This model is based on a model used by the
Metropolitan Washington Council of Governments. This app-
roach considers a cross-classification of occupancy rates
considering: three classes of trip purpose; income (1st
Quartile, 2nd and 3rd Quartile; 4th Quartile), five classes
of destination parking cost; and five classes of trip inter-
change density. Trip interchange density is equal to highway
person trips between two zones divided by the product of the
residence zone area and the non-residence zone area.
15

Chapter Two
FORMULATION OF ALTERNATIVE
The purpose of this chapter is to
Florida Modal Choice Models to assist
PROCEDURES
categorize the current
in determining appro-
priate modal choice models for application. Using the find-
ings of Chapter One and a categorization of Florida models, a
determination will be made of the alternative modal choice
models to be developed. Additionally, specifications will be
developed to allow accuracy evaluations to be made in compar-
ison of model results with ridership counts made by corridor,
cutline, trip end areas and other measures.
CATEGORIZATION OF EXISTING FLORIDA MODELS
An evaluation of modal choice model application as util-
ized in general throughout the United States indicates that
large urbanized areas utilize post distribution models that
consider system characteristics as well as rider characteris-
tics. The logit formulation is currently the model form that
is most useful for such analysis. A description of the logit
formulation has been previously presented in Chapter One.
Variations in the usage of the logit formulation were
also noted in Chapter One. In addition to the proportional
logit formulation calibrated in West Palm Beach, Orlando uses
a model that is sensitive to some zonal variables. A Summary
of the models used in the state is shown in Table 1.
17
TABLE 1
CHOICE MODELS AND OTHER CHARACTERISTICS FOR FLORIDA STUDY AREAS
Urban Area
Est. 1979 % Growth Population 1970-1980
(000'S) Per Year Number Buses Model Used1
Miami 1503
Broward 921
Pinellas 710
Tampa 615
Jacksonville 583
West Palm Beach 536
Orlando 624
Folk 285
Brevard 261
Pensacola 231
volusia 190
Sarasota-Manatee 185
Lee 181
Tallahassee 139
Gainesville 137
< 2%
> 4%
2-4%
> 4%
< 2%
> 4%
2-4%
2-4%
< 2%
2-4%
2-4%
> 4%
> 4%
2-4%
2-4%
810 Logit
101 Logit
120 Logit
80 Logit
200 Logit
47 prop. Logit
54 Logit
3 Cross-Class2
* Gen. Auto
27 Logit
* Logit
36 Cross-Class3
* Gen. Auto
35 Logit
31 Gen. Auto
FOOTNOTES:
IAll Logit models shown are post distribution models.
2This is a post distribution model.
3This is a pre-distribution model,
4Tallahassee calibrated a logit model but used a procedure based on policy determinations.
*Data not available.
18

In addition to the logit formulation, which is presently
used in most of the larger urbanized areas in Florida, the
table indicates that a variety of other techniques have been
used in Florida. A few areas have not developed modal split
models. These areas for the most part generate auto or
auto-person trips. In Gainesville, a procedure has been
adopted which permits policy decision to provide a "modal
split" technique. This technique identifies subareas within
the urbanized area that should attract high transit usage.
Transit usage for these areas is estimated and then sub-
tracted from the input trip tables. Tallahassee also adopted
a similar policy sensitive modal
a target split percentage for
lished, and the model determined
ted to result in this target.
split model. In this
the entire area was
which trips would be
ALTERNATIVES TO BE CONSIDERED
An evaluation of the models utilized in Florida
ized areas, consideration of UMTA and FHWA comments,
evaluation of logical need for systemwide modal choice
sis has resulted in a determination of alternatives
considered.
model,
estab-
selec-
urban-
and an
analy-
to be
Also among the issues considered in the determination of
the recommended modal choice alternatives was Florida's
experience with the logit formulation. The fact that this
expression has been used in several urban areas provides
strong impetus to utilizing it as an alternative. Also, con-
sidering the data variables used for highway and transit
19

networks, and the trip purposes and cross-class variables
used for trip generation leads to a selection of a modal
choice alternatives which would not put additional burdens on
local study staffs if possible in data forecasting. This
means that some consideration must be given to expressions
which do not require forecasting income.
Bus transit studies or the long range planning of sys-
tems where fixed capital investments are not required usually
do not warrant ultra-sophistication in the choice of mode
share modeling techniques. The modal choice modeling, where
non-fixed rolling stock is the alternative to be considered
in systems planning is basically a mechanism to determine
fleet size and physical facilities and the impact on highway
needs. In systems such as this, modal split modeling tech-
niques that are not system sensitive can be used. These
techniques are most appropriate for use in the smaller urban-
ized areas.
RECOMMENDATION FOf! MODAL CHOICE MODELS
The standard trip generation model will produce internal
person trips by five purposes. It is possible using the
standard generation model set to utilize a modal choice model
of either the post distribution or pre-distribution type. It
is recommended that three modal choice models alternatives be
tested. One model would be a logit model of the form cur-
rently in use in Florida, but with some recommended changes.
The second model would be a cross-classification model
that would consider the type of variables used in the trip
20
generation model. These include autos per dwelling unit,
persons per dwelling unit and type of unit at the production
end and employment by category at the destination end. A mo-
del of the type used in the Folk Study, where supply of tran-
sit is also a variable is a good example of a cross-classifi-
cation rate procedure utilizing the trip generation para-
meters plus some measure of transit service. This second
choice of a modeling technique would be non-system sensitive
and as such would not require a coded transit network.
This leads to the recommendation of two procedures. One
would require explicit network coding regarding the transit
system; thereby allowing the testing and analysis of policy
type variables such as level of service and fare structures.
This model is of course system sensitive. The logit model
formulation is recommended based on its previous use in the
state, the evaluation of the alternatives available, and dis-
cussions with Federal personnel. Some recommended modifica-
tions are described later. The second procedure would not
require a coded transit network and would thus be non-system
sensitive. This procedure would consider population related
characteristics such as considered for trip generation and a
measure of the availability of transit service to determine
split characteristics. The cross-classification post distri-
bution model utilized in Polk County is recommended as an
alternative to be tested.
As an additional alternative in the areas where a non-
system sensitive model can be used, the technique used in
21

Gainesville will be studied to determine if it has use in
other areas.
The logit formulation would most appropriately be
applied in areas with greater than 500,000 population and/or
with more than 50 buses in the forecast year. In the smaller
areas and/or with smaller bus fleets the non-system sensitive
model would be used.
The logit modal choice models already calibrated will
allow evaluation of the A, B, C and D parameters to determine
possible groupings and allow and evaluation of accuracies now
being achieved. It is recommended that three general im-
provements to the process should be considered for the stan-
dard model. First, zonal income rather than an areawide in-
come should be used to convert transit fares, parking costs
and other costs to time. Secondly, auto occupancy by trip
purpose should be used in the consideration of auto costs to
determine a cost per person. Thirdly, the captive riders for
auto and transit should be a zonal characteristic rather than
one value for the entire area.
This project was not intended to
research required to re-calibrate and
meters based on these considerations.
posed that an already calibrated model
support the type of
determine new
However, it is
for one study
whose areawide parameters were used, be applied with
para-
pro-
area,
esti-
mates of zone level income, auto occupancies and estimates of
captives by zone. The results will be compared with base
data and results of previous calibration runs to determine if
22

improvements in results are achieved. If so, this will be
the recommended procedure. If not, the existing modal choice
models for the larger areas will be incorporated in the stan-
dard model set. It is important to note that there is a
great need to recalibrate the model split models in all of
the areas.
TO further test the sensitivity of zonal as opposed to
areawide estimates of model inputs, the opposite test will
also be conducted. In an area, such as Orlando, where zonal
inputs are currently used, the modal split model will be
applied using areawide estimates of the model inputs. The
results of using these inputs will be compared with the
results obtained from zonal inputs.
The major effort will be to develop the procedure for
the smaller urban areas utilizing the procedures of the Folk
Study (See Figure 2 on page 9). It is recommended that
tables similar to that shown in Figure 2 be developed for
Gainesville and the results of the two areas (Polk and
Gainesville) compared for consistency and possible transfera-
bility to other areas which would not use the LOGIT model.
Polk and Gainesville provide a good population spread for
areas under 500,000 population (See Table 1). Also, data for
Gainesville were used for trip generation and should be in
good condition for this use. The effort for the smaller
areas will also attempt to determine if the policy sensitive
models developed in Gainesville and Tallahassee are usable in
other areas.
23

ACCURACY EVALUATIONS
The mode choice estimates produced by the standard model
set must be evaluated to determine their ability to reflect
reality. This will be accomplished as part of the validation
work effort. Basically, the validation involves comparisons
of model results with field observations. So mode choice
estimates would be compared with patronage information. This
patronage information is scheduled to be gathered as has been
presented in the CENVAL effort.* The validation for 1980
conditions to be accomplished as part of the CENVAL effort
will not be possible within this work effort since data will
not be available until sometime after completion of this
contract.
Calibration will be accomplished as part of this effort
in the sense of comparing model application results with some
base year conditions. The comparisons are made utilizing
travel survey and field information, if available, for the
base year. The comparison process will make use of available
data documenting current or base year transit usage and com-
pare these figures with the results obtained from the appli-
cation of the modal split model. These comparisons will be
made at the following levels:
Areawide Transit Usage Cutline Comparisons Screenline Comparisons Route Comparisons
*“Utilization of 1980 CeIlSUS Data in Urban Travel EStima- tion,l Final Report, COMSIS Corporation, September, 1980.
24

Care must be taken that the modal split model is being
evaluated and not the results of the transit assignment which
might be accomplished in a subsequent, step. Some urban areas
may not accomplish a transit assignment since they do not
necessarily require a transit network as input. Therefore,
route comparisons would actually be a check of both the modal
split and transit assignment, where this latter step is
accomplished. The areawide transit comparison is basic and
would be accomplished in both validation (against field data)
and in calibration (usually against survey data).
Screenline comparisons are again basic for validation
and calibration and would check major directional movements
across the entire study area. Cutline comparisons are most
valid as an assignment check where routes are grouped into
major corridors and comparisons made against ground counts.
However, where survey data is available, the survey data as
well as the model results may be compared across screenlines.
What must be carefully evaluated, however, is the fact that
transit use is very low in smaller urban areas and is not
accurate at this level. On-board survey results are most
appropriate for these type comparisons when available.
Route checks can be made for calibration by assigning
survey data and model data and comparing results on a route-
by-route basis. The same consideration made above for cut-
lines is even more significant here.
For the areas using the non-system sensitive approach,
there generally will not be a network for assignment purposes.
25

In these cases comparisons will be on an areawide basis and
across screenlines. For those using the logit formulation,
the four types of checks can be made, realizing, however,
that the individual route and cutline checks will also be a
check of assignment results.
There are no standards of accuracy available for modal
choice model estimates, as is the case for highway traffic
assignments. Therefore, the accuracy standards that have
been established for use in validating highway assignments
have been transferred to the application of modal split mo-
dels.
The standards established below are also based upon
experience, review of both highway and transit results and
intuition. Basically, the same types of accuracy obtained in
person trip distribution should be obtained in mode choice
estimates while keeping in mind the differences in the volume
sizes between the two types of travel. Also, the use of the
estimates is taken into account. For non-capital intensive
systems, long range planning generally is accomplished to
"size" the bus system in terms of maintenance and storage
facilities as well as number of buses. The individual route
demands except as it may help size the facility needs are not
of primary importance. Likewise, where transit assignments
are not made, the major reason for acceptable mode choice
estimation is to insure accurate highway trips and assign-
ments.
26

For calibration purposes, the range of error that should
not be exceeded for transit trips are presented below:
Total Area Transit Trips: Trips Entering the Central Area: Sectors of the Central Area Boundary:
(perhaps 4-5 corridors) Total Area Transit Average Trip Length: Cutlines and/or Routes:
(1000 Passengers/Day: 1000-2000 Passengers/Day: 2000-5000 Passengers/Day: SOOO-10,000 Passengers/Day: lO,OOO-20,000 Passengers/Day:
>20,000 Passengers/Day:
< 3% error < 5% error <20% error
< 5% error
<150% error <90% error (70% error (45% error (35% error (30% error
For validation in a year other than used for calibration
the following is recommended:
Total Area Transit Trips: < 6% error Trips Entering the Central Area: (10% error Sectors of the Central Area Boundary: (25% error Total Area Transit Average Trip Length: < 8% error Cutlines and/or Routes: Same as above
27

EVALUATION OF ALTERNATIVE MODAL SPLIT PROCEDURES
The purpose of Chapter Three is to evaluate the alterna-
tive modal split procedures advanced in Chapter Two, and to
CHAPTER THREE
determine which of these alternatives is most appropriate for
use in each of the four test areas determined in Phase I of
this effort. This evaluation will develop a recommended
modal split procedure for each of the urbanized areas in the
state. The evaluation documented in this chapter was
designed to determine the ability of the alternative modal
split procedures advanced in Chapter Two to respond to the
issue requirements of the four test areas. This evaluation
and analysis will permit the determination of a recommended
model set for each of the urbanized areas in the state.
REVIEW OF MODAL SPLIT MODEL CATEGORIZATION
In Chapter Two, a categorization of the modal split
models currently used in Florida was accomplished. The
results of the categorization indicates that in the fifteen
urbanized areas in the state, a large variety of modal split
models are used, This large variety of model choices has
been utilized as a source of models from which models appro-
priate for standardization can be drawn.
As can be seen from Chapter Two, a large variety of
modal split techniques are in use in the state. This indi-
cates that a large amount of effort has been applied in Flor-
ida to addressing a problem of making logical decisions as to
the future course of public transportation in the state. It
29

also indicates that available experience in Florida is not
being fully utilized as new modal split techniques are de-
vised.
REVIEW OF RECOMMENDED MODAL SPLIT ALTERNATIVES
Three general recommendations of modal split models to
be evaluated further were advanced as a part of the effort
documented in Chapter Two. These are: 1) The logit model
with some modifications to permit more standardization in its
application and use and to permit policy sensitivity; 2) A
non-system sensitive post distribution Cross Classification
modal split model similar to that used in the Polk study; and
3) A non-system sensitive Policy Modal Split Model that would
permit simulation of high transit usage scenarios.
Logit Model
Of these three alternatives, the logit model is current-
ly used in the majority of the urbanized areas in the state.
A thorough technical discussion of the logit model and its
functions has previously been presented in Chapter One.
Non-System Sensitive Non-Policy Sensitive Post Distribution Cross Classification Model
A table provided in Chapter One illustrates the concept
behind the post-distribution cross classification model cur-
rently used in Polk. This is the cross classification model
previously recommended for further evaluation in this effort.
As can be seen from the table which was presented as Figure
2, modal split ratios or transit trip factors are determined
in Polk based upon whether or not transit service is avail-
30

able to the trip interchange and also based upon certain den-
sity definitions of the attraction and production ends of the
trip and also based upon trip purpose.
The computer set-up used to apply the Polk modal split
procedure is shown in Appendix I. This set-up is labeled
PL931PO.DISCOMOD.2430.CNTL.
This set-up is used to build
form trip distribution, trip
split. There are a number
detailed below.
There is also a 2552 version.
and update highway skims, per-
purpose, combinations and modal
of steps in this procedure as
1) STEP0
2) s2
3) AGM
4) STEP1
5) STEP2
6) STEP3
7) STEP4
8) STEP5
9) STEP6
10) TESTMCON- UMCON to convert from FHWA to UTPS format.
11) USRCD - USERCODE of split procedures.
12) MODSPLT - UMODEL to apply previous step.
UROAD to build time and distance skims.
UMODEL to update time skims.
AGM to distribute person trips.
UMCON to convert tables to FHWA format.
TRPTAB to create HB work trip tables for zones covered and not covered by transit service.
TRPTAB to separate HB work trips covered into those with and without major attractions.
TRPTAB to create HB Non-work trip tables for zones covered and not covered by transit ser- vice.
TRPTAB to separate HB Non-work trips covered into those with and without major attraction.
TRPTAB to create one dataset with 6 tables - HB work - covered, not covered and covered with major attraction; HB Non-work - covered, not covered and covered with major attraction.
31

13) STEP7 -
14) STEP8 -
15) Tl
16) T2 -
TRPTAB to separate NHB trips into those covered and not covered by transit. Also mod-split per- centages and auto occupancy factors are app- lied.
UMCON to convert NHB and IE trip tables to UTPS format.
UMATRIX to balance (P-A to O-D) and combine NHB, truck, IE and EE trips.
UMATRIX to balance (P-A to O-D) and combine HB trips.
Non-System Sensitive - Policy Sensitive Modal Split Model
The third modal split modeling scheme recqmmended for
further evaluation in Chapter Two was the policy sensitive
model currently under development in the Gainesville area.
This model functions by establishing "desired" modal split
fractions at certain trip ends. Trip interchanges involving
the targeted trip ends are modified to result in the desired
modal split or transit usage at that trip end. This process
is heavily dependent upon "hand manipulation" to achieve its
desired results. This type of modeling effort is extremely
important to the transportation planning effort in a number
of urbanized areas in the state where the populace and the
decision making bodies have become aware of the need to
increase transit ridership to alleviate several of the socio/
economic problems that will confront them in the coming de-
cades.
The computer set-up used to apply this procedure is
shown in Appendix II. This set-up is located on PL931RD.GA.
DISCOMOD.CNTL. This set-up also builds and updates highway
skims, performs trip distribution, trip purpose combination,
32

and modal split. The function of each of the program steps is
detailed below.
1) UROAD -
2) s2
3) AGM
4) UMATRIXl -
5) UMCON -
6) UMATRIXZ -
UROAD to build time and distance skims.
UMODEL to update skims
AGM to distribute trips
UMATRIX to add EE trips and balance ta- bles (P-A to O-D).
UMCON to perform modal split. Split fac- tors are read in from dataset of the form PL93lGA.UMCON.SPLIT-.DATA
UMATRIX to create an auto trip table and a transit passenger trip table
AREA SENSITIVE EVALUATION OF RECOMMENDED PROCEDURES
The three recommended modal split procedures must be
evaluated to determine their usefulness as a standardized mo-
dal split procedure in each of the various Florida urbanized
areas or in a selected sub-set of these urbanized areas.
Based on this evaluation, and subject to the intent to test
each of the various procedures that might be recommended, test
areas for each of the various procedures will be established.
It is important to note that the tests accomplished as a
part of this effort will in all probability not provide the
final answer as to the appropriateness of the standardized
modal split procedures to be recommended. The lack of data
available to completely evaluate the models' functions will
most likely not be alleviated until the Census Validation
Phase III activities now scheduled for 1982 are accomplished.
The tests accomplished as a part of this effort will attempt
to define the limits of the proposed modal split schemes and
33

to develop standardized procedures that can be further defined
following collection of adequate data in the Census Validation
effort.
The first step in the evaluation of each of the proposed
standardized modal split models was to determine if the pro-
posed models are able to respond to the issue requirements in
the various urbanized areas in the state. This determination
was made in each of the test areas used in Phase I of this
study. (These areas are Broward, Orlando, Tallahassee, and
Tampa Bay.) The evaluation of the various models' ability to
respond to the issues in these test areas was based upon dis-
cussions with DOT personnel and local officials in the various
test areas.
Broward County
The Broward Urban Area Transportation Study currently
uses a logit model to perform modal split modeling. The par-
ticular model calibrated in Broward County was developed from
the Miami model with some modification to simulate transit
travel in Broward County. The resultant model simulated
23,682 daily transit trips, which was 8.3 percent lower than
the 1976 daily patronage. BY purpose# the model assigned 47.3
percent of the transit trips to homebased work, 46.5 percent
to homebased other, and 6.2 percent to non-homebased.
Local officials in Broward County and officials of the
DOT agree that the logit formulation has been and in all lik-
lihood will continue to be an adequate tool for performing mo-
dal split in this area. The post-distribution cross classifi-
34

cation alternative and the policy-sensitive alternative both
have features that are attractive to planners in the Broward
area; however, the general feeling is that while these models
would not be sufficient for systems planning, they might pro-
vide a valuable tool for supplementing the systems effort in
special conditions. The concensus is that the logit formula-
tion should be used in the area, but that the other expres-
sions should be made available for use if they are needed.
Broward County is now participating in a study being con-
ducted by the Florida DOT to determine the need for a regional
transit system. The general feeling in the area is that the
logit expression is the only alternative under consideration
that could be used to perform the modal split function in this
area.
Orlando
The Orlando Urbanized Area Transportation Study (OUATS)
utilizes a modal split model of the logit formula that was
originally calibrated in 1973. This model was updated
and minor changes to the model's functions were made
adequately model certain conditions. The logit model
Orlando is different than those used in other areas
in 1978
to more
used in
in the
state in that internal calculations in the model which calcu-
late the disutility functions utilize zonal income data, and
also because the highway and transit captive portions for a
particular trip interchange are related to the income at the
production end of the trip. Information on transit and auto
captives were based on attitudinal surveys conducted in 1973
and repeated in 1978.
35

In Orlando, it appears that the logit model is adequate
to respond to the systems planning issues. Some questions
have been raised in the past as to the Orlando model's
results, particularly in specific corridors, but generally,
the reaction to the modal split results has been favorable.
Orlando has a series of future alternative transit networks
which have already been developed. These networks will reduce
the transit network coding requirements in future updates of
the study.
Although Orlando has a number of "special attractors", it
is felt that the existing logit model has adequately modeled
modal split for these attractions. The area is in the process
of studying at least one major future transit corridor to de-
termine if fixed guideway rail service should be provided a-
long this corridor. The last update of the OUATS did not show
the level of transit service on this corridor that many
thought it should have. The general feeling is that the
determination of the need for more sophisticated service in
this corridor should be made a part of a corridor analysis
procedure and not as a direct result of a systems planning
effort.
The review in Orlando has led to the conclusions that a
standardized expression of the logit formulation would be
adequate to handle the systems planning requirements. The
ability to make modifications to this process should not be
eliminated and some desire to see a process similar to the
Gainesville model available in unique areas was expressed.
36

Tallahassee
The Tallahassee Urbanized Area Transportation Study has
developed both a logit formulation and a policy-sensitive
modal split process. Dissatisfaction with the results of the
calibration of the logit model, a consultant's recommendation
that the model should not be used for long-range planning, and
local policy makers' desire to see what would happen if large
modal split percentages could be obtained led to the develop-
ment of a policy-sensitive model for the area.
The policy-sensitive modal split model was designed to
produce a target split percentage for the entire area. Speci-
fic trips were dependent upon trip purpose, zonal income, and
the magnitude of the areawide split. The model was not sys-
tem-sensitive, however transit trips were not allowed in zones
which did not have transit service. Modal splits as high as
25 percent were tested in the study. In general, satisfaction
was expressed with the results of this model and the plan
adopted had a target modal split percentage of 5 percent.
General feeling now in the area is that sophisticated
system-sensitive modal split procedures such as the proposed
logit formulation should not be used in Tallahassee. The
ability to maintain policy maker participation in the process
is thought to be important, and thus the area seems to favor
an approach like the one previously used in the area or like
the one now being developed in Gainesville. These models
would adequately meet the technical needs of the area and
would also permit policy participation in the effort.
37
Tampa Bay
The Tampa Bay study effort has calibrated a logit model
to perform the modal split function. This model is used in
the regional study effort but different values of the elasti-
city and bias coefficients are used in the three transit ser-
vice areas in the region.
As with the other large study areas evaluated, local
users of the logit formulation in the Tampa Bay area appear
satisfied with its results and are hesitant to substitute
other models, particularly a model that is non-system-sensi-
tive. General interest in the ability to make modifications
in the results of the logit model are expressed, usually in an
effort to obtain results in special studies, Satisfaction in
the models' ability to simulate HOV lane usage was noted in
the past experiences in using the existing logit formulation.
Some reservation in the logit formulation's ability to
produce adequate results in special study efforts was ex-
pressed. Such a special study effort is currently underway in
a Tampa Central Business District transit study. Generally,
however, it was agreed that this probably was not a function
that a standardized systems modal split model should perform.
RECOMMENDATIONS
Current use of the logit formulation to perform modal
split is pervasive in Florida, particularly in the larger
urbanized areas. The evaluation of the issues impacting modal
split decisions generally tend to indicate that in these lar-
ger areas, some sort of modal split procedure which is system-
38

sensitive should be used. In the smaller areas in the state,
the general feeling is that the more sophisticated modal split
procedures are not needed and that other procedures such as
the Polk County procedure would be adequate to perform the
modal split function. In both the larger and in the smaller
areas, some type of policy input to the modal split process
was seen as desirable and an important element to be main-
tained as a part of the standardized modal split procedure.
These considerations, the past experiences of the various
urbanized areas in the state along with an appraisal of the
possible future functions of a modal split model led to the
preliminary recommendation of two separate models for use in
the state. The first of these models would be the logit form-
ulation. To permit standardization, different formulations of
the logit expression such as that currently used in West Palm
Beach and use of non-standard variables as is currently done
in the Orlando effort would be eliminated.
Calibrated values of the A, B, C, and D parameters that
are currently used in the various areas should continue to be
used until better data becomes available as a part of the Cen-
sus Validation effort. West Palm Beach should borrow cali-
brated A, B, C, and D parameters from another area, probably
from the Broward area. In Orlando, survey results should be
used to develop area-wide parameter values.
The areas that should use the logit formulation are:
Broward, Jacksonville, Miami, Orlando, Pinellas, Tampa, and
West Palm Beach. These areas are a preliminary recommendation
39

and are based upon a number of characteristics and assumptions
about the various areas. Generally, the areas recommended are
the larger areas in the state and are the areas that now have
or are considering capital intensive involving construction of
fixed facilities transit plans. Each of these areas currently
has a coded transit network and generally, the transit plan-
ning requirements of the area require at least the sophistica-
tion of a coded transit network. The policy-sensitive func-
tion and modeling techniques available from the Gainesville
experience should also be made available to the areas using
the logit expression.
The other recommended modal split model will be a post-
distribution cross classification model of the type now used
in Polk County. Modifications will be made to this model to
permit policy-sensitive modal split procedures similar to
those currently being used in Gainesville. This will be
accomplished by an additional row added to the existing cross-
classification matrix to permit modeling policy-sensitive cor-
ridors or trip interchanges as is currently done in Gaines-
ville. Actual transit split percentages for input into the
standardized procedure will not be recommended at this time.
Values for those parameters should be determined during the
Census Validation procedure. During the next Chapter in this
analysis, the values currently used in Polk County will be
carefully evaluated for their potential input into a standar-
dized procedure.
40

The areas that should use this recommended procedure are:
Brevard, Gainesville, Lee, Pensacola, Polk, Sarasota-Manatee,
Tallahassee, Volusia, and the various new urbanized areas
designated by the 1980 Census. These areas are generally the
areas in the state that require less sophistication in modal
split modeling. These areas are currently served by small
transit systems, and current planning efforts do not include
planning for capital intensive improvements.
SUMMARY
This chapter has presented the results of evaluation that
was accomplished to determine the type of standardized modal
split model that should be used in Florida. In addition, pre-
liminary recommendations as to which areas should make the
alternative modal split procedures a part of their standard-
ized model application were advanced.. Because of the flexi-
bility of the Gainesville modal split model, this model can be
made available to both groups of areas. This will permit pol-
icy input to the process in all of the areas of the state.
41

Chapter Four
SELECTION AND REFINEMENT OF RECOMMENDED PROCEDURES
The purpose of this chapter is to refine the recommenda-
tions presented in Chapter Three and to advance specific re-
commendations as to the standardized modal split procedures to
be followed in each of the fifteen urbanized areas in Florida.
These specific recommendations build upon two general recom-
mendations presented in the earlier chapters. Chapter Four
also outlines the program steps that should be followed in
applying the two procedures and presents Division of Transpor-
tation Planning Procedures for each of the two processes.
SENSITIVITY TESTS OF LOGIT PROCEDURES
The preliminary recommendations in Chapter Three stated
that the larger areas in the state should continue to use the
logit formulation to perform modal split. In each of these
areas, this model has been calibrated and is currently used to
perform modal split modeling. Three of the areas for which
this procedure were recommended use slightly different ver-
sions of the logit formulation. The Miami model uses slightly
differing model parameters for beach and non-beach areas, the
West Palm Beach area model uses a multinomial logit formula-
tion, and the Orlando model uses a differing weighing of the
parameters and also a zonal value of income as input into the
calculation of the disutility function.
It was desired to test the sensitivity of one of these
outlying models to determine if critical differences in model
performance would occur if more standardized procedures were
43

used. The area selected for this analysis was the Orlando
area. The specific test selected was a test to determine if
differences in model results would be observed if average in-
come values were substituted for the zonal income values cur-
rently used in the Orlando model.
The Orlando model uses the zonal income data in two ways.
First, the zonal income is divided into five groupings to es-
tablish zonal auto and transit captivity rates. These rates
are based on two surveys that have been completed in the last
several years. The rates range from a transit captive rate of
0% in high income areas for some trip purposes to 18.6% in low
income areas for Home-Based Shop trips. Auto captivity rates
vary from a low of 29.7% to a high of 77.9%. Those trips
which are neither transit captive or auto captive are the free
choice trips and it is these trips on which the Orlando modal
split model operates.
The second use of the zonal income data is in the calcu-
lation of the trip interchange disutility value. The value of
the zonal interchange modal disutility determines what percen-
tage of the free choice trips will split to which mode. The
range of split that can occur in the Orlando model is between
0.3% transit to 93.0% transit. The Orlando model translates
the various dollar costs implied in the disutility expression
to time by relating the value of time to a dollar value using
the zonal income inputs.
The modifications to the zonal income variable that were
accomplished in the test consisted of equating all zonal
44

income values to a midpoint value of income in the income
range in which the zone lies. This would equate to five in-
come values or ranges being used. In other words, the model
would then operate as if the income values forecast for the
area were five ranges from low to high. Most planners feel
more comfortable forecasting income ranges rather than actual
zonal income values. This test was designed to duplicate that
situation.
Although most areas in the state only use three values of
income (low, middle, and high), it was decided to test five
values in Orlando since the model currently duplicates the
five ranges in parts of its calculations as explained above.
Thus, for purposes of the sensitivity tests zonal income value
input to the model were equated to a midpoint value within
each range. The five values used in this subsitution were:
$1500, $4500, $7500, $12,000, and $18,000. The model thus
used the same values of auto and transit captives as would
have been obtained if the zonal income values would have been
used, but different values of income were input into the dis-
utility calculation.
The results of the runs using both zonal income values
were somewhat surprising, Notably, extremely small differ-
ences were observad in total modal split values, and no dis-
cernable differences in individual zonal interchange values
were noted. These results indicate that the modal split model
depends very heavily on the values input to the model for
transit captivity and auto captivity, and that the split
45

obtained from the disutility calculation or the split of the
free choice trips are very minor in comparison.
To further test these assumptions, an additional test was
performed to determine what results would be obtained if dif-
ferent values were input into the portion of the model which
determined the auto and transit captivity. In this test, the
model was manipulated in such a way as to duplicate the situa-
tion when only one value of income was used in the various
calculations. In this instance, the middle income value was
used.
In this case, very noticeable differences in model re-
sults were observed. The transit split values were some 20%
higher than before and differences in zonal auto and transit
trip totals were noted. These results were not particularly
surprising because zonal income figures used in the Orlando
area are generally higher than the mid range, and so the re-
sult of the model manipulation was to place most zones in a
lower income range. Of course, the location of the modal
split demand was greatly changed because in fact, what the
model projected was that greater use of transit would occur in
high income zones and less transit use in low income zones.
These results, although showing a greater use of transit,
would be very dangerous because the transit demand was obvi-
ously misplaced.
The overall results of the sensitivity tests was
lize that the modal split model in use in the Orlando
to rea-
area and
no doubt in the other areas as well, is very sensitive to the
46

definition in the model to the mode captivity and sensitive to
a much lesser degree to disutility calculations where it would
appear due to existing and historic use of transit, the calcu-
lations are very much slanted to auto use.
SPECIFIC MODEL RECOMMENDATIONS
In Chapter Three, preliminary recommendations were ad-
vanced as to the general modal split scheme each of the urban-
ized areas in Florida should use. These recommendations were
based for the most part on the area sensitive evaluation of
the various alternative model schemes and on a desire to stan-
dardize the modal split model to the maximum extent possible.
These recommendations stated that the seven larger urbanized
areas in the state should use the logit formulation with the
addition of a policy-sensitive function, and that the areas
that
made
had model expressions that varied from the norm
more standard.
should be
The preliminary recommendations for the other areas in
the state was to adopt the Polk County Cross-Classification
model with the addition of functions of the Gainesville model.
These two models are non-system sensitive and would not re-
quire the coding of a transit network, although a definition
of areas served by a potential transit system would have to be
made. This model was recommended for those areas which are
not expected to be planning for capital intensive transit
plans which would require the construction of fixed
facilities.
47

The results of the sensitivity tests reported earlier in
this chapter have changed these preliminary recommendations
somewhat. Due to the significant changes in both the total
split values and the locations of these changes, it is felt
that it would be a mistake to eliminate any outlying model
functions which would result in changes in how the model se-
lects the transit and auto captive trips. This means in fact,
that the internal calculations used in the various areas in
applying the logit formulation should not be changed. Modal
split model standardization should occur in model application
and in the fact that the Department of Transportation should
work toward being able to forecast more specific variables
that would result in a finer level of detail in the calcula-
tion or setting of the auto and transit captive rates in the
various areas.
The areas using the logit formulation should also be per-
mitted to input policy decisions to the modal split calcula-
tions. This can be accomplished by adding the Gainesville
model to the model chain following the application of the lo-
git formulation, This addition would permit further opera-
tions on the auto portions of the trips between selected zones
to increase modal split for these interchanges. Details of
how this would be accomplished are presented later. In all of
the areas for which it is recommended that the logit formula-
tion be used, standardization in model application should be
accomplished. This standardization would require placing the
various programs used to manipulate the trips and to create
48

separate transit person and auto trip tables within the
DISCOMOD module in a standard order. This order will be de-
tailed later in this chapter.
The standardization process also requires that the applf-
cation of the source codes containing the logit .formulation in
the various areas should be applied in a standardized manner.
It is recommended that the UTPS USERCODE function be used and
that the model applied with the UTPS program UMODEL. This
standardization would permit easier understanding of the var-
ious model applications in the state. The specific recommen-
dations
greater
0
for the areas using the logit formulation, until
standardization can be obtained are detailed below:
Broward - Use existing modal split model. Existing A, B, C, and D parameters as calibrated for the areas should continue to be used.
0
0
0
Jacksonville - Use existing modal split model. Existing A, B, C, and D parameters should be used.
Miami - Use existing modal split model. Existing A, B, C, and D parameters should continue to be used.
Orlando - Use existing modal split model. Existing calculations to determine auto and transit captive proportions should continue to be used.
0 Pinellas - Use existing modal split model. Existing A, B, C, and D parameters should continue to be used.
0
0
Tampa - Use existing modal split model. Existing A, B, C, and D parameters should continue to be used.
West Palm Beach - Model functions should be changed to the logit formulation as used in the other areas. Model and parameter values should be borrowed from Broward.
In each of these areas, the ability to provide policy
sensitive modal split modelling should be added to the
49

DISCOMOD module. This addition can be accomplished by inser-
ting the Gainesville model which is applied with runs of the
UTPS programs UMCON and UMATRIX. The procedures herein recom-
mended will detail how this addition will be made and how the
Gainesville model should be used.
The model recommended for the smaller areas in the state
is the model currently used in the Polk County area. This mo-
del is a non-system sensitive cross classification model that
splits trips to the transit mode based on trip purpose, number
of autos per DU, and whether the zone being served is a major
attractor. A figure showing these relationships has previ-
ously been presented. This model is applied through a series
of FBWA programs TRPTAB which are used to separate the zones
which are either served or not served by transit and those
which are defined as special attractors. These runs are fol-
lowed by the UTPS programs USERCODE and UMODEL which actually
apply the modal split procedure. The set-up used to accom-
plish this modeling is shown in Appendix I.
This model has been chosen for a number of reasons. The
model, despite the multiple runs of TRPTAB which are required,
is easy to run. The functions of the model are easy to under-
stand, the variables required by the model are also required
by the standard trip generation model. The model does not re-
quire the coding of a transit network and the model results
can be modified to permit policy sensitive modelling by adding
the functions of the Gainesville model. These points led to
the recommendation that this model be incorporated into the
50

modal split modelling procedures in the following areas: Bre-
vard, Gainesville, Lee, Pensacola, Polk, Sarasota-Manatee,
Tallahassee, Volusia, and the emerging areas. As will be de-
tailed in the section dealing with modal split procedures, the
functions of the Gainesville model will also be incorporated
into the standard procedure to permit the flexibility of poli-
cy sensitive modelling in these areas.
The specific rates used in the Polk model were also exam-
ined to determine if these rates were adequate for the stan-
dardized procedure or if different rates should be substitu-
ted. This analysis showed that the rates used in Polk County
are adequate, but that some areas might desire more specifici-
ty in trip purpose modelling and that rates for Home-Based
Shop trips be separated from the more general rates now ap-
plied for Home-Based Nonwork trips. It is the recommendation
of this effort that the rates as used in Polk County be made
part of the standardized procedure and that the DOT examine
more closely the need for additional trip purpose modelling
within the set-up.
PROCEDURES FOR APPLYING STANDARDIZED MODAL SPLIT MODEL
The review of the recommended modal split modelling tech-
niques has led to the recommendation of specific Division of
Planning Procedures for the application of the models. These
procedures are detailed
should be made a part of
and their application
in Appendix III. These procedures
the DISCOMOD module within each area
begins immediately following the
51

AGM run which is used
tion model in each of
The standardized
to apply the standardized trip distribu-
the areas.
model in the larger urbanized areas in
the state or those areas which elect to use the logit formula-
tion procedure should be applied using the following programs
in a standardized procedure:
UMATRIX - The first UMATRIX run is used to combine trip pur- poses ror splitting. The standardized trip distribution model creates six trip tables in the following order: Home-Based Work, Home-Based Shop, Home-Based Social/Recreational, Home- Based Other, Non Home-Based, and Internal-External. In addi- tion, some areas require a separate AGM run to distribute trips for special purposes. Generally these trips are genera- ted vehicle trips, although in some cases, person trips are generated and modal split should be acomplished with the Non Home-Based Trips.
USERCODE - The program USERCODE is used to integrate the source code containing the modal split program in each of the areas with a sketeton UTPS source code to create a new execua- ble program.
UMODEL - UMODEL is used to apply the source code created in theERc0~~ step.
UMATRIX - UMATRIX is used again to combine the trip tables as produced by UMODEL into a single auto vehicle trip table and a single transit person trip table. This step also applies the auto-occupancy model which can be accomplished by using simple rates for each purpose.
UMATRIX - This application of UMATRIX is used to balance the output trip tables or to modify these tables from the P/A ar- rangement to the O/D convention.
UMCON - This run of the program UMCON is used to apply the Gainesville modal split model. This model permits the user to select a range of trip interchanges for which special modal split rates can be applied. UMCON applys these rates to the interchange as defined and creates a new trip table containing the extra split trips. As an example, it might be desired to determine the impact if 75% (or any other percentage) of the trips currently using the automobile to travel to and from the CBD could be induced to use transit. UMCON can be used to ap- ply a factor of 75% to all auto trips with a origin or desti-
52

nation in the CBD. This UMCON run would produce a new trip
table with just those trips.
UMATRIX - This run of UMATRIX would then be required to sub- tract the special split trips as created above from the auto trip table and to add these trips to the transit trip table. The output of this run would be the standard HWY.TRN trip ta- ble as used throughout the standardized procedure.
In the areas using the Polk County model, the following
steps are required to apply the model and produce the desired
HWY.TRN trip table.
UMATRIX - UMATRIX is used to combine the trip tables as crea- ted by the application of the standard trip distribution pro- cedures into the purposes required for modal split. At the current time using the non-system sensitive model, the pur- poses required are Home-Based Work, Home-Based NonWork, and Non Home-Based. Other purposes (IE and Special Generators) should also be combined since generally these purposes are auto trips and modal split is not appropriate.
UMCON - UMCON is used to convert the trip tables created above fromUTPS format to FHWA format for application of the program TRPTAB.
TRPTAB - TRPTAB is used to separate the zonal interchanges into three separate groupings, namely, those not covered by transit, those covered by transit but with no special attrac- tor, and those covered by transit with a special attractor. To accomplish this, five runs of TRPTAB are required. These runs require the user to identify the zones which are covered by transit, not covered by transit, and covered by transit and containing a special transit attractor. The first application of* TRPTAB separates Non-Work trips from Work trips and also work trips covered and not covered by transit. The second ap- plication splits the work trips into those with a special at- tractor and those without a special attractor. The third ap- plication carries forward the three work trip categories and separates non work trips into those covered and not covered by transit service. The fourth TRPTAB application carries for- ward the tables created earlier and separates the non-work covered trips into those with and without special attractors. The fifth application reorders the tables for input into the split model.
USERCODE - USERCODE is used to integrate the Polk County modal split source code into the UTPS framework.
UMODEL - UMODEL applies the modal split model and outputs 16 purpose and mode tables including totals.
53

TRPTAB - An additional application of TRPTAB is required to separate the Non Home-Based transit and auto trips and the Internal-External trips.
UMCON - UMCON is used again to convert the trip tables crea- my TRPTAB back to UMTA format. UMATRIX - UMATRIX is next used to again balance and created a single auto vehicle table and a transit trip table.
UMCON - This run of UMCON is used to apply the Gainesville modal split model. As with the procedure in the areas using the logit formulation, UMCON allows the user to select a group of zones for application of modal split percentages in re- sponse to policy decisions to test unique modal conditions. UMCON can be used to apply a factor to any groups of zonal in- terchanges thus permitting splitting of trips.
UMATRIX - UMATRIX is used to subtract the special transit trips from the total auto trip table and to add these trips to the transit trips.
The existing set-up used in Polk County is shown in Ap-
pendix I. This set-up is the base for these recommendations
but certain changes have been made to reflect more flexibility
in trip purpose selection. The recommended procedures for ap-
plication of the recommended standard modal split models are
provided in Appendix III.
It is important to realize that the Gainesville modal
split function recommended in these procedures must be applied
with a great amount of care and a full understanding of what
the model can do and what it cannot do. The model permits the
transportation planner to consider various "what if" scenar-
ios, but the model does not address the types of strategies
that might be required to produce the modelled transit "de-
mand". The model should not be used in the forecast mode if
strategies to support modes other than the auto cannot support
the figures obtained. This would result in unrealistic plan-
54

ning for the auto mode and the development of auto improvement
strategies based upon situations which it is known will not
happen. Thus the application of the Gainesville function in
the standardized procedure must be followed by an analysis of
what strategies are required to fulfill the desired policy.
OTHER ISSUES
Not all of the tests recommended in the earlier chapters
were completed. Data shortcomings and a reassessment of the
objectives of this effort dictated in some instances that
tests different from those recommended be performed. In Chap-
ter One, a specific test to apply the Polk County model to the
Gainesville area was suggested. This test was not completed
because the evaluation of the Polk model, as reported earlier,
showed that the more critical question in regard to the Polk
rates dealt with the trip purposes considered in the model.
It was felt that any rates used in the application of the Polk
model should be developed during the Census validation
effort.
It was also recommended that zonal income variables be
substituted for area-wide estimates in a test of the logit
formulation. This test could not be completed due to a lack
of zonal income variables to input to the test. In place of
this test, an additional test of the Orlando model was con-
ducted as reported earlier.
55


![Multi-modal Circulant Fusion for Video-to-Language and ... · modal features will lead to a further performance gain. Au-thors in[Fukuiet al., 2016; Yuet al., 2017] develop multi-modal](https://img.pdfslide.net/doc/110x75/5e2361e61319bf4855651ea8/multi-modal-circulant-fusion-for-video-to-language-and-modal-features-will-lead.jpg)