Embed Size (px)
Citation preview

Logo UNEP Logo MAP Logo Blue Plan
Urbanisation in the Mediterranean Region from 1950 to 1995
Blue Plan Notebooks 1
URBANISATION IN THE MEDITERRANEAN REGION URBANISATION IN THE MEDITERRANEAN REGION FROM 1950 TO 1995 FROM 1950 TO 1995
Plan Bleu Centre d'activités régionales
Blue Plan Papers, 1Blue Plan Papers, 1
Sophia Antipolis, 2001

Urbanisation in the Mediterranean Region from 1950 to 1995
Blue Plan - 2001

Urbanisation in the Mediterranean Region from 1950 to 1995
Blue Plan - 2001
Blue Plan Papers 1
Urbanisation in the Mediterranean Region from 1950 to 1995
Blue Plan – October 2001

Urbanisation in the Mediterranean Region from 1950 to 1995
Blue Plan - 2001
The analysis of urbanisation in the Mediterranean region from 1950 to 1995 was done by François Moriconi-Ebrard (CNRS, UMR Espace, Avignon). The opinions expressed here are those of the author.
The processed data of the Géopolis data bank and the illustrations carried out at the Blue Plan were made by François Mahoux, under the direction of Jean-Pierre Giraud, Blue Plan.
Head of project: Elisabeth Coudert, Blue Plan.
Director of the publication: Guillaume Benoit, Blue Plan Director.
The names used on maps and in tables and graphs and the data figuring in them do not signify that the Blue Plan is taking any position as to the legal status of the countries or to their borders or limits.

Urbanisation in the Mediterranean Region from 1950 to 1995
B
Contents
URBANISATION IN THE MEDITERRANEAN REGION FROM 1950 TO 1995
Foreword................................................................................................................................v
1 Introduction..................................................................................................................1 1.1 The principle behind the development of the Géopolis data bank .........................1 1.2 Contents of the Géopolis data bank .......................................................................2 1.3 The advantages of harmonising data......................................................................4 1.4 The range and limits of data...................................................................................5 1.5 Quantitative assessment .........................................................................................6
2 The evolution and present situation of urbanisation in all Mediterranean countries................................................................................................................................8
2.1 Total population and urban population..................................................................8 2.2 Rate of urbanisation.............................................................................................12 2.3 Patterns of urban areas .........................................................................................16 2.4 Size and growth of urban areas............................................................................18
3 of urbanisation in all Mediterranean c ...........................................................................24
4
B
The evolution and present situationoastal regions..........................................
lue Plan - 2001 i
3.1 Definitions ............................................................................................................24 3.2 Urbanisation in the coastal regions ......................................................................25 3.3 Four examples of urbanisation of the coastline. ..................................................36
Conclusion ..................................................................................................................42
ibliography .......................................................................................................................43

Urbanisation in the Mediterranean Region from 1950 to 1995
Blue Plan - 2001 ii
Liste of Tables
Table 1.- Total population from 1950 to 1995 (in thousands) ...........................................3
Table 2.- Urban population from 1950 to 1995 (in thousands) ..........................................3
Table 3.- Urbanisation rates according to sources (in %) ..................................................7
Table 4.- Total population, urban population and urbanisation rates of all Mediterranean countries......................................................................................8
Table 5.- Average annual growth rates of the total population and the urban population in the Mediterranean countries or territories (in %) .......................10
Table 6.- Urbanisation rates of Mediterranean countries or territories (%) .....................12
Table 7.- Average distance between urban areas in 1995 ................................................17
Table 8.- Number and average size of urban areas ..........................................................20
Table 9.- The growth of urban areas by size classes ........................................................21
Table 10.- The share of the total population and the total urban population living on the Mediterranean coast in 1995 (in %).......................................................29
Table 11.- The average annual growth rate of total, urban and coastal populations of countries or territories between 1990 and 1995 (in %) .....................................30
Table 12.- The urbanisation rates of Mediterranean coastal regions in 1995 ....................31
Table 13.- The number and average size of urban areas in 1995 .......................................32
Liste of Graphs
Graph 1.- Relative share of EU's Mediterranean countries and the other Mediterranean
countries in the total urban population..................................................................9
Graph 2.- The urban population of the Mediterranean countries of the EU and the other Mediterranean countries ......................................................................................11
Graph 3.- The urbanisation rate of the Mediterranean countries or territories (in %) .........14
Graph 4.- The urban population distribution by size classes ...............................................22
Graph 5.- Growth of urban areas according to three classes ...............................................23

Urbanisation in the Mediterranean Region from 1950 to 1995
Blue Plan - 2001 iii
List of Maps
Map 1. The growth of urbanisation rates in Mediterranean countries or territories between 1950 and 1995 15
Map 2.- Urban-area patterns with 10,000 inhabitants and more in 1995 16
Map 3.- The Mediterranean country urban areas in 1950 and 1995 19
Map 4.- Population density in the regions of the Mediterranean countries in 1995 26
Map 5.- The urban areas of the Mediterranean coastal regions in 1950 and 1995 33
Map 6.- A small coastal plain: the Abruzzi coast (Italy) 38
Map 7.- The Greek model: the southern coast of Sicily (Italy) 39
Map 8.- An urban corridor: the Catalonian coast around Barcelona (Spain) 40
Map 9.- A delta sea-front: the coastline of the Po delta (Italy) 41
List of acronyms and abbreviations
CEDEJ Centre d'études et de documentation économique, juridique et social
CNRS Centre national de la recherche scientifique
GDP Gross Domestic Product
INRETS Institut national de recherche sur les transports et leur sécurité
INSEE Institut national de la statistique et des études économiques
MAP Mediterranean Action Plan
MCSD Mediterranean Commission for Sustainable development
NUTS Nomenclature of Territorial Units for Statistics
SME Small and Medium Enterprises
UMR Unité mixte de recherche
UN United Nations
UNEP United Nations Environment Programme

Urbanisation in the Mediterranean Region from 1950 to 1995
Blue Plan - 2001 iv

Urbanisation in the Mediterranean Region from 1950 to 1995
Blue Plan - 2001 v
Foreword
The quantitative and qualitative distribution of population in the
Mediterranean countries and their coastal regions is of considerable importance from
a sustainable development point of view. This phenomenon and its modalities largely
condition the well-being of people, their level of economic development, the more or
less rational management and use of natural resources, as well as the state of the
environment
Urbanisation, a weighty trend on both the world and the Mediterranean
levels—both significant cause and effect of the mutations at work in societies today—
deserves being better known, better analysed and better understood. Indeed, this
accrued knowledge should make it possible to become aware of the scope of the
phenomenon and its evolution (at least in the middle-term) so as to study the
implications concerning both its control and its necessary social, economic and
environmental support.
With this in mind the Blue Plan has undertaken an analysis of urbanisation in the
Mediterranean region from 1950 and 1995. This analysis was carried out by François
Moriconi-Ebrard, designer and creator of the Géopolis data bank and knowledgeable
about the Mediterranean region. Presently working in Avignon, François Moriconi-
Ebrard worked for a long time in Cairo at the Centre for Economic, Legal and Social
Studies and Documentation (CEDEJ). Detailed sheets per country (tables, graphs and
maps) are available on CD-Rom.
Other studies on the theme of urbanisation and cities are underway, in
particular within the framework of the Mediterranean Commission for Sustainable
Development (MCSD). Their future publication will add to already-acquired
knowledge in this field.
Guillaume Benoit Director, Blue Plan

Urbanisation in the Mediterranean Region from 1950 to 1995
Blue Plan - 2001 vi

Urbanisation in the Mediterranean Region from 1950 to 1995
Blue Plan - 2001 1
1 Introduction
The idea of this paper is to get an overview of the urbanisation process in the Mediterranean-rim countries as well as in their Mediterranean coastal regions.
By the Mediterranean-rim countries, we mean the 22 countries or entities with at least one coast giving on to the Mediterranean Sea. Twenty of these countries are at present Contracting Parties to the Barcelona Convention (1976) for the protection of the Mediterranean Sea against pollution.
By the Mediterranean coastal regions, we means the administrative units having one sea-front and corresponding to level 3 of the European nomenclature, NUTS1, for the countries of the European Union and the equivalent level (governorate, wilaya, mohazfazat, and so forth) in the other countries.
After presentation of the Géopolis data bank, the second part of this report undertakes to analyse the present situation and the past developments of the urbanisation phenomenon in all of the rim countries taken as a whole. The third part is devoted to the same analysis in the Mediterranean coastal regions. And the conclusion summarises the major points previously analysed.
Analysing the phenomenon of urbanisation relies especially on the use of the data of the Géopolis data bank. These data are significant for being calculated from identical definitions of urban from one country to the next, which enables international comparisons. According to the Géopolis data bank, the urban population corresponds to the sum of the populations living in urban areas containing more than a minimum of 10,000 inhabitants. For this reason the figures may diverge noticeably from the countries' official figures.
1.1 The principle behind the development of the Géopolis data bank a. Demarcation
The spatial limits of urban areas are defined by the continuity of buildings (a maximum of 200 m between buildings, i.e. the same official criterion as in France, Algeria, Greece and so forth)2. The built-up area is defined from:
• satellite images, • aerial photos, • cartographic documents, • studies by local specialists (geography, planning, etc.), • visits to the field.
1 Nomenclature of Territorial Units for Statistics 2 See Moriconi-Ebrard, F., 1994, GEOPOLIS, pour comparer les villes du Monde, Economica-Anthropos, Collection Villes, Paris, pp. 82 and following.

Urbanisation in the Mediterranean Region from 1950 to 1995
Blue Plan - 2001 2
b. Statistical data To have data derived from statistical sources (censuses, countings, etc.), an
urban area is readjusted along the lines of administrative units based on territorial support or sectors limits of counting called local units. When the total population reaches or surpasses 10,000 inhabitants, it is considered urban.
Population is calculated according to the demographic sources available in each country, i.e. censuses, publications taken from public records or official estimates. As there is seldom any concordance between countries as to the years and dates of demographic information gathering, we have used statistical alignment. It consists of interpolating population figures on identical dates, i.e. here, they are the "zero" years (1990, 1980…), plus the year 1995 in order to have more recent data3.
When it was not possible to interpolate these values because of a lack of a series of sufficient countings to support these dates, we did a short projection or, on the contrary, a retropolation.
1.2 Contents of the Géopolis data bank
Géopolis supplies data on the urban-area level and makes it possible to reproduce them on the level of intermediary administrative units (e.g. NUTS 1, 2, 3).
The following fields are available for each of the urban areas:
• Population 1900, 1950, 1960, 1970, 1980, 1990, 1995 (population in 1995 within the limits of 1990),
• Localisation : international co-ordinates (degrees, minutes),
• Corresponding intermediary administrative units (e.g. NUTS 1,2,3),
• Land area (not exhaustive),
• GDP in 1995 in US dollars for urban areas with more than 100,000 inhabitants.
• Names of constitutive local units (e.g. "communes" in France).
Géopolis includes about 4,000 urban areas for all Mediterranean-rim countries.
For each of the intermediary administrative units (e.g. NUTS 1, 2, 3) the following data is available:
• Population in 1950, 1960, 1970, 1980, 1990, 1995 (taking into account possible changes in limits occurring during this period),
• Land area.
As an example of the Géopolis data bank, tables 1 and 2 give the total population and the urban population for all countries in the period from 1950 to 1995.
3 ibid, pp. 115-122

Urbanisation in the Mediterranean Region from 1950 to 1995
Blue Plan - 2001 3
Table 1.- Total population from 1950 to 1995 (in thousands)
Country or territory 1950 1960 1970 1980 1990 1995 Albania 1 250 1 626 2 184 2 720 3 258 3 383Algeria 9 181 10 197 13 623 18 577 24 864 28 047Bosnia-Herzegovina 2 674 3 221 3 697 4 085 4 341 4 130Croatia 3 842 4 131 4 399 4 584 4 747 4 830Cyprus 483 574 618 639 697 726Egypt 21 504 25 959 32 614 41 020 52 392 58 066France 41 614 45 527 50 569 53 848 56 619 58 168Greece 7 159 8 262 8 719 9 638 10 211 10 278Israel 1 258 2 073 2 935 3 761 4 545 5 638Italy 47 248 50 287 53 758 56 329 57 581 57 333Lebanon 1 364 1 787 2 206 3 075 3 130 3 340Libya 947 1 350 1 933 3 068 3 964 4 934Malta 309 318 319 333 356 372Monaco 18 21 24 27 30 32Morocco 8 975 11 672 15 081 19 390 24 016 26 588Palestinian Authority 1 026 1 159 1 134 1 348 1 691 2 523Slovenia 1 465 1 580 1 713 1 875 1 958 1 990Spain 28 124 30 585 34 027 37 379 38 949 39 525Syria 3 495 4 561 6 277 8 753 12 115 14 342Tunisia 3 517 4 067 4 975 6 316 8 007 8 992Turkey 20 960 27 758 35 666 44 740 56 477 61 399Yugoslavia 7 099 8 021 8 886 9 803 10 343 10 800MEDITERRANEAN TOTAL 213 509 244 734 285 357 331 305 380 290 405 436
Table 2.- Urban population from 1950 to 1995 (in thousands)
Country or territory 1950 1960 1970 1980 1990 1995 Albania 237 414 518 688 967 1 150Algeria 1 679 3 186 4 772 7 380 11 301 13 305Bosnia-Herzegovina 259 428 645 1 032 1 376 1 351Croatia 840 1 164 1 613 1 998 2 306 2 371Cyprus 127 194 238 338 415 453Egypt 9 186 12 993 18 016 24 650 34 115 38 859France 21 987 26 155 31 395 34 001 35 432 36 062Greece 2 738 3 477 4 504 5 530 6 046 6 109Israel 941 1 541 2 316 3 058 3 710 4 684Italy 28 580 32 594 37 252 40 203 41 383 40 947Lebanon 521 931 1 193 1 481 1 982 2 253Libya 193 358 862 1 903 3 146 3 882Malta 202 235 235 241 263 271Monaco 18 21 24 27 30 32Morocco 2 185 3 163 4 948 7 593 10 854 13 118Palestinian Authority 427 560 632 723 922 1 428Slovenia 251 337 435 560 647 675Spain 15 937 18 644 23 774 28 075 30 214 30 795Syria 1 196 1 628 2 629 4 425 6 671 7 969Tunisia 916 1 227 1 814 2 881 4 240 4 957Turkey 4 031 7 383 12 901 20 622 31 940 37 039Yugoslavia 1 454 2 163 3 136 4 181 4 846 4 965MEDITERRANEAN TOTAL 93 903 118 796 153 850 191 590 232 804 252 674
Source: Géopolis 1998, Blue Plan 1999.
Urbanisation in the Mediterranean Region from 1950 to 1995
Blue Plan - 2001 4
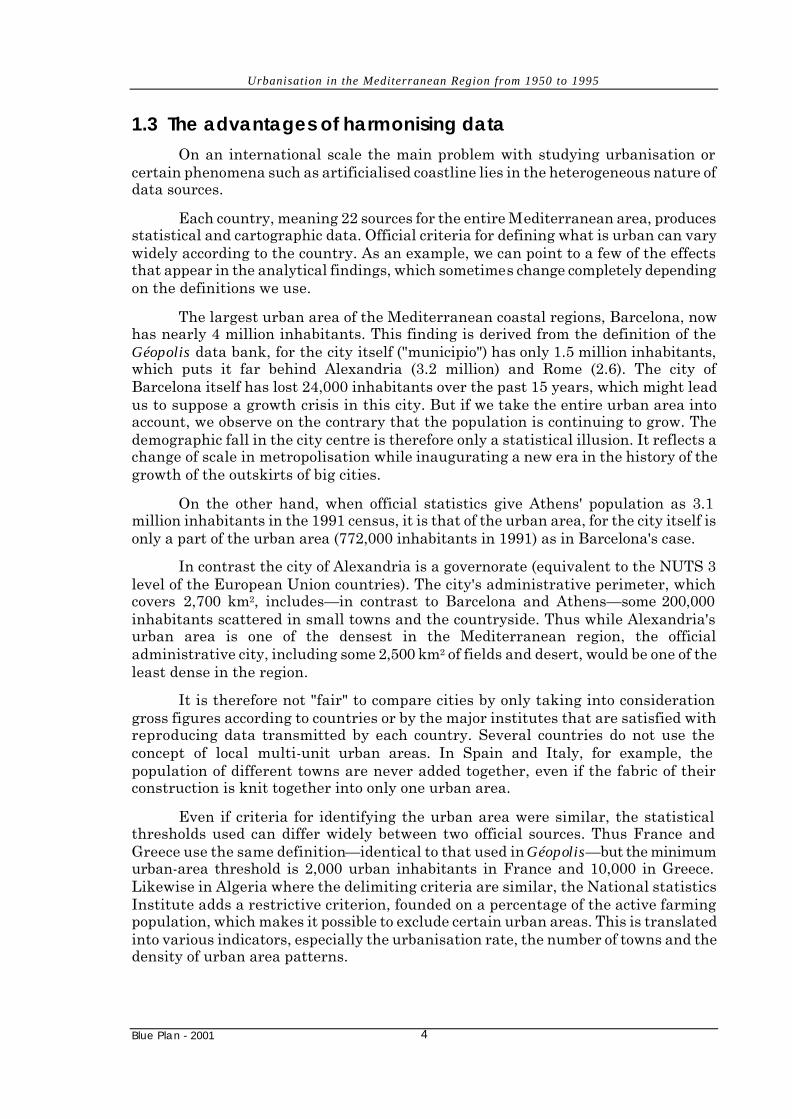
1.3 The advantages of harmonising data
On an international scale the main problem with studying urbanisation or certain phenomena such as artificialised coastline lies in the heterogeneous nature of data sources.
Each country, meaning 22 sources for the entire Mediterranean area, produces statistical and cartographic data. Official criteria for defining what is urban can vary widely according to the country. As an example, we can point to a few of the effects that appear in the analytical findings, which sometimes change completely depending on the definitions we use.
The largest urban area of the Mediterranean coastal regions, Barcelona, now has nearly 4 million inhabitants. This finding is derived from the definition of the Géopolis data bank, for the city itself ("municipio") has only 1.5 million inhabitants, which puts it far behind Alexandria (3.2 million) and Rome (2.6). The city of Barcelona itself has lost 24,000 inhabitants over the past 15 years, which might lead us to suppose a growth crisis in this city. But if we take the entire urban area into account, we observe on the contrary that the population is continuing to grow. The demographic fall in the city centre is therefore only a statistical illusion. It reflects a change of scale in metropolisation while inaugurating a new era in the history of the growth of the outskirts of big cities.
On the other hand, when official statistics give Athens' population as 3.1 million inhabitants in the 1991 census, it is that of the urban area, for the city itself is only a part of the urban area (772,000 inhabitants in 1991) as in Barcelona's case.
In contrast the city of Alexandria is a governorate (equivalent to the NUTS 3 level of the European Union countries). The city's administrative perimeter, which covers 2,700 km2, includes—in contrast to Barcelona and Athens—some 200,000 inhabitants scattered in small towns and the countryside. Thus while Alexandria's urban area is one of the densest in the Mediterranean region, the official administrative city, including some 2,500 km2 of fields and desert, would be one of the least dense in the region.
It is therefore not "fair" to compare cities by only taking into consideration gross figures according to countries or by the major institutes that are satisfied with reproducing data transmitted by each country. Several countries do not use the concept of local multi-unit urban areas. In Spain and Italy, for example, the population of different towns are never added together, even if the fabric of their construction is knit together into only one urban area.
Even if criteria for identifying the urban area were similar, the statistical thresholds used can differ widely between two official sources. Thus France and Greece use the same definition—identical to that used in Géopolis—but the minimum urban-area threshold is 2,000 urban inhabitants in France and 10,000 in Greece. Likewise in Algeria where the delimiting criteria are similar, the National statistics Institute adds a restrictive criterion, founded on a percentage of the active farming population, which makes it possible to exclude certain urban areas. This is translated into various indicators, especially the urbanisation rate, the number of towns and the density of urban area patterns.

Urbanisation in the Mediterranean Region from 1950 to 1995
Blue Plan - 2001 5
This heterogeneity of sources constituted a roadblock for a long time, on the one hand to international comparison, and on the other, to a general rational overview of urbanisation of the Mediterranean region. In contrast, the Géopolis data make it possible to make rigorous comparisons not only between the different Mediterranean-rim countries but also between these countries and the world's other regions.
1.4 The range and limits of data
The definition of urban area used here poses certain limits of use that must be mentioned.
There are an infinite number of possible methods for defining the category, "urban". Depending on the authors, morphological, administrative, historical, economic, social criteria are used or a combination of them all. It might therefore be thought that the definition of "city" is irreducible to simple criteria. On a local level this remark is correct if the extreme diversity of towns is taken into account, their origins, their forms, their locations, their histories, their populations and their functions. Yet that would prevent any comparative approach beyond a spatial dimension of a small region's size. At the same time the development of cities is only understood (nowadays probably more than ever) by their inclusion in wide-reaching systems of exchange that often go beyond regional or even national issues.
The city is therefore something that is built as much in the mind as in statistics. In a study that claims to describe or analyse this phenomenon it is necessary for this construction to be clearly defined.
The "morphological" criterion is a choice. Like any result derived from a preliminary choice made, this study can only imperfectly cover the phenomenon of urbanisation in its multiple aspects and immense diversity. The criterion adopted first responds to a technical necessity, i.e. of all the countries considered all the data that might be wanted are not available. For example, obtaining exhaustive information on employment or the economy of each community is at the moment still a dream. Only a few countries are capable of supplying such data.
The two criteria retained—specific extension of built-up areas and the total number of residents—are the only ones available in an exhaustive manner for all Mediterranean-area countries. If we have to be satisfied with these data, it is worth giving a rapid evaluation of why they are significant.
a. The morphological criterion By definition an urban area or agglomeration means "uniting in a compact
mass". The data used in this study are therefore well adapted to this basis question about the consequences engendered by urbanisation. Indeed the morphological criterion relies on a phenomenon that is at the core of urbanisation problems in the Mediterranean area, i.e. the extension of built-up areas that translates into the artificialising of the habitat by buildings.
b. The 10,000-inhabitant threshold The second criterion—minimum population threshold—is more ambiguous,
for it corresponds to an "average". The figure of 10,000 inhabitants clearly represents an "average" and not a mechanical threshold beyond which a rural area would become an urban one. This threshold may seem sometimes too high

Urbanisation in the Mediterranean Region from 1950 to 1995
Blue Plan - 2001 6
(especially in northern Europe) and sometimes too small as in the southern Balkans, Egypt and in certain regions of Syria, an urban area the population of which is about this size often presents more rural characteristics than urban. Whether it be on the social level (life-styles, and sociabilisation), economic (strong presence of farmers), urbanistic or historical (lack of monuments, urban plans), these towns are still rather more like big villages. Crossing the threshold is in this case an effect of the strong demographic growth in the past few years within the context of a drop in the movement from country to city.
Through this study it must therefore be kept in mind that the figures refer to a certain reality of the phenomenon of urbanisation and to it alone. The viewpoint of urban areas has the merit of being one of the basic principles of urbanisation, which is translated by a spatial concentration of a large number of people in very small spaces. The population figure is synthetic fact, for the number of inhabitants says nothing about social organisation, or the nature of the their activity. It only shows the incarnation of various and sometimes complex processes that have led people to concentrate in the given space for an infinity of reasons, trying to abolish the physical distance between them (the concept of co-presence), to explore new kinds of social bonds (urbanity) and doing new jobs.
Finally, the urbanisation maps contained in this report are to the reader what the "revealer" is to the photographer, i.e. an image that we have tried to build with the greatest possible rigour and detail, depending on objective information available. The observations and comments derived from them are interpretations, more or less validated by experience in the field, surveys or other studies.
1.5 Quantitative assessment
In general, when considering the Mediterranean countries as a whole, the difference between the Géopolis harmonised data and the official statistics is small (less than 1 per cent difference between the two).
On the other hand, if this spread is relatively small on the Mediterranean-wide level, it does not exclude large differences when we look at countries or territories (Table 3).
The largest of these spreads is seen in Egypt. The urbanisation rate according to Géopolis is 24 points higher than the official statistics. The difference is explained by the use of a very restrictive definition by the Egyptian authorities. Indeed, the Egyptian definition is based on an administrative criterion, i.e. urban status is linked to a territorial support function (county seat of "muhafaza" or "markaz"). With a result that the number of official towns has practically not grown since 1960. As with all the countries of the region, cities tend to spread and since the "outskirts" of the large cities officially come under the heading of "rural", the official urbanisation rate has stagnated since the 1970s at around 45 per cent, and it even went down slightly between the censuses of 1986 and 1996.

Urbanisation in the Mediterranean Region from 1950 to 1995
Blue Plan - 2001 7
Table 3.- Urbanisation rates according to sources (in %)
Country or territory
Urbanisation rate
according to Géopolis
Urbanisation rate
according to official statistics
Difference between Géopolis and official
statistics
1995 1995
Albania 34 37 -3
Algeria 47 56 -9
Bosnia-Herzegovina 62 54 8
Croatia 33 41 -8
Cyprus 49 52 -3
Egypt 78 76 1
France 62 75 -13
Greece 59 59 0
Israel 83 91 -8
Italy 71 67 5
Lebanon 67 87 -20
Libya 79 85 -6
Malta 49 52 -3
Monaco 73 89 -16
Morocco 100 100 0
Palestinian Authority 57 94 -38
Slovenia 67 43 24
Spain 34 51 -17
Syria 56 52 3
Tunisia 55 57 -2
Turkey 60 69 -9
Yugoslavia 46 57 -11 MEDITERRANEAN TOTAL 62 63 -1
* Gaza alone is taken into account for the official statistics. Sources: Géopolis 1998, Plan Bleu 1999. World urbanisation prospects, the 1996 revision. Estimates and projection of urban and rural population and of urban agglomerations, New York, ed. by the United Nations, 1998.- United Nations, 191 pp.

Urbanisation in the Mediterranean Region from 1950 to 1995
Blue Plan - 2001 8
2 The evolution and present situation of urbanisation in all Mediterranean countries
2.1 Total population and urban population
The total population of the 22 countries and territories bordering the Mediterranean Sea was estimated at 405 million in 1995, 62 per cent of which live in urban areas (44 per cent in 1950).
With 253 million urban dwellers in 1995, the Mediterranean-rim countries form one of the globe's largest urban areas. If compared with space of similar dimension at the same date and according to the same definition, the urban areas of the United States reach a little more than 185 million inhabitants, and those of India at about 250 million and China at about 400 million.
Since 1950 the urban population has multiplied by 2.7 times, and the total population by 1.9 times (Table 4) in the Mediterranean region.
Table 4.- Total population, urban population and urbanisation rate of the Mediterranean countries
1950 1970 1995
Multiplier (1950-70)
Multiplier (1970-1995)
Multiplier (1950-1995)
Total population (millions)
214 285 405 1,34 1,42 1,9
Urban population (millions)
94 154 253 1,64 1,64 2,7
Urbanisation rate (%) 44 54 62 1,23 1,16 1,4
Source : Géopolis 1998, Plan Bleu 1999.
Generally the Mediterranean countries have urbanised less rapidly since the 1970s. The multiplier of the urbanisation rate went from 1.23 for the 1950-1970 period to 1.16 for the 1970-1995 period.
Various countries' shares in the urban population of the Mediterranean region has undergone a lot of changes since 1950. Thus did the four Mediterranean countries of the European Union (France, Greece, Italy and Spain) represent 74 per cent of the Mediterranean's total urban population in 1950 all by themselves. In 1995, these same four countries now represent but 45 per cent of the urban population (Graph 1).

Urbanisation in the Mediterranean Region from 1950 to 1995
Blue Plan - 2001 9
Graph 1.- Relative share of EU's Mediterranean countries and the other Mediterranean countries in the total urban population
0
10
20
30
40
50
60
70
80
1950 1960 1970 1980 1990 2000
%
OtherMediterraneancountries
Mediterraneancountries
Source : Géopolis 1998, Plan Bleu 1999.
The over-all growth of the Mediterranean population hides a wide-ranging variability between the countries or territories (Table 5). The four EU Mediterranean countries and the Balkan countries have the lowest annual average growth rates in the Mediterranean region. Italy even had a negative rate of –0.1 per cent per year between 1990-1995.
In the countries and territories of the southern and eastern Mediterranean, annual growth rates remain fairly high but, with the exception of Syria, Israel, the Palestinian Authority and Libya, decreased at the end of the period.
Since the beginning of the 20th century in the southern and eastern Mediterranean countries, growth was at first moderate (less than 1 per cent) before experiencing a prodigious leap in the 1950s and 1960s, with rates attaining or surpassing 3 per cent annually in three countries (Israel, Libya and Syria), and rates between 2 to 3 per cent annually in five other countries (Albania, Egypt, Lebanon, Morocco and Turkey). This was due to the phenomenon of demographic transition, the first phase of which was typified by a drop in mortality while fertility remained at a high level. In this phase countries saw their population double every 25 to 30 years, and at the time people talked about the threat of a "demographic explosion".
In the developing Mediterranean countries, it wasn't until the 1980s, even the 1990s that fertility decreased in a significant manner. This drop has been very noticeable in Turkey and Egypt, especially in the big cities. Nonetheless with the population still being very young because of the large number of births in the two preceding decades, relatively high rates of growth should still be expected in the coming 25 years.

Urbanisation in the Mediterranean Region from 1950 to 1995
Blue Plan - 2001 10
Table 5.- Average annual growth rates of the total population and the urban population in the Mediterranean countries or territories (in %)
Total population Urban population Country or territory 1950-1970 1970-1990 1990-1995 1950-1970 1970-1990 1990-1995
Albania 2,8 2,0 0,8 4,0 3,2 3,5 Algeria 2,0 3,1 2,4 5,4 4,4 3,3 Bosnia-Herzegovina 1,6 0,8 -1,0 4,7 3,9 -0,4 Croatia 0,7 0,4 0,3 3,3 1,8 0,6 Cyprus 1,2 0,6 0,8 3,2 2,8 1,8 Egypt 2,1 2,4 2,1 3,4 3,2 2,6 France 1,0 0,6 0,5 1,8 0,6 0,4 Greece 1,0 0,8 0,1 2,5 1,5 0,2 Israel 4,3 2,2 4,4 4,6 2,4 4,8 Italy 0,6 0,3 -0,1 1,3 0,5 -0,2 Lebanon 2,4 1,8 1,3 4,2 2,6 2,6 Libya 3,6 3,7 4,5 7,8 6,7 4,3 Malta 0,2 0,6 0,9 0,8 0,6 0,6 Monaco 1,3 1,2 1,1 1,3 1,2 1,1 Morocco 2,6 2,4 2,1 4,2 4,0 3,9 Palestinian Authority 0,5 2,0 8,3 2,0 1,9 9,1 Slovenia 0,8 0,7 0,3 2,8 2,0 0,8 Spain 1,0 0,7 0,3 2,0 1,2 0,4 Syria 3,0 3,3 3,4 4,0 4,8 3,6 Tunisia 1,7 2,4 2,3 3,5 4,3 3,2 TurKey 2,7 2,3 1,7 6,0 4,6 3,0 Yugoslavia 1,1 0,8 0,9 3,9 2,2 0,5 MEDITERRANEAN TOTAL
1,5 1,4 1,3 2,5 2,1 1,7
Source : Géopolis 1998, Plan Bleu 1999.
To understand the present situation, it is best to put the demographic evolution of the Mediterranean basin in a longer-term temporal perspective. In 1846 the first census in Egypt made it possible to count 4,442,000 inhabitants. At that time France had 35,402,000 (36,097,000 within the present borders). In 1900, with 40.5 million inhabitants, France still had more than twice the number of inhabitants in all of northern Africa from Morocco to Egypt. These latter numbered 20.2 million or about the same population as Spain (18.6 million). Italy at 33.3 million was nearly three times more populated than Turkey.
It wasn't until 1989 that the population of the southern countries surpassed that of the North. The gap widened quickly, i.e. after having long tended to move towards the north-west, the Mediterranean's demographic centre of gravity has slipped towards the south and east where the present dynamics are the result of the high fertility rates of the 1950s to 1980s. Indeed, because of today's pyramid-like structure of age in the southern countries, even with an identical fertility rate with the Mediterranean's north-western countries, the average annual growth rate of the southern and eastern countries would still be greater than the northern countries and for a long time to come.

Urbanisation in the Mediterranean Region from 1950 to 1995
Blue Plan - 2001 11
According to the latest population projections carried out for the Blue Plan for the horizon of 20254, Egypt and Turkey will have respectively 95 and 87 million inhabitants, or 70 to 80 per cent more than Italy (54 million) and 50 per cent more than France (64 million). Algeria and Morocco will have populations comparable to that of Spain (around 40 million inhabitants each).
Concerning urbanisation, northern dominance was even clearer both from the point of view of their urban population (Graph 2) as the number and size of the cities. This is less and less true, and the changes have been even more spectacular.
Graph 2.- The urban population of the EU's Mediterranean countries and the other Mediterranean countries
Source : Géopolis 1998, Plan Bleu 1999.
In 11 countries of the southern and eastern side of the Basin between 1950 and 1970, the annual rates of urban growth reached more than 3.5 per cent (7.8 per cent in Libya). It should be remembered that an annual growth rate of 3.5 per cent means doubling the population in 21 years, and a rate of 7.8 per cent in less than 10 years.
A cumulative process results from such values, i.e. the naturally high growth added to rural de-population (massive migratory movements towards cities). Yet the extreme values tend to pile up since, as we have seen, natural growth itself tends to calm down. Thus from 1990 to 1995, there were no more than six southern and eastern Mediterranean countries or territories to have growth rates higher than 3.5 per cent and more. The Palestinian authority alone maintains a high growth rate, for it is also the territory where fertility was the highest in the world at the beginning of the nineties. Likewise the differential between urban growth and total growth, though still favourable to cities, is tending to fade.
4 Attané Isabelle, Courbage Youssef., 2001 I. La démographie en Méditerranée, situation et projections, Les Fascicules du Plan Bleu n°11, Paris, Economica.
0
20 000
40 000
60 000
80 000
100 000
120 000
140 000
160 000
1950 1960 1970 1980 1990 2000
Urb
an p
opul
atio
n ((
in th
ousa
nd o
f inh
abita
nts)
OtherMediterraneancoutries
Mediterraneancoutries

Urbanisation in the Mediterranean Region from 1950 to 1995
Blue Plan - 2001 12
2.2 Rate of urbanisation
Mediterranean cities are at the source of European urbanisation. Up to the dawn of the 19th century, the urbanisation rates of the Mediterranean Arab countries and Turkey were equivalent, even higher than those of Europe. Although the urbanisation rate that grew slowly but regularly in Europe from the 13th century took off in the 19th century, it only took a short lead over the countries of the southern Mediterranean. A short lead in a temporal sense, since at the end of the 20th century, the southern "lag" is now being made up. A short lead also on the quantitative level, for the urbanisation rate of the southern countries has never been nil. In 1900 it came to 16 per cent in the Mediterranean-rim Arab countries and 22 per cent in Turkey. At the time, Mediterranean Europe was still mostly rural with urbanisation rates wavering between 25.2 per cent in Greece and 39.2 per cent5 in Italy.
With an average of 62 per cent of the population urban in 1995, the Mediterranean Basin is one of the most urbanised regions of the world. Of the 22 countries or territories, 15 surpassed the 50 per cent urban-population threshold in 1995 (Table 6). The highest rates, excluding Monaco (100%), are recorded in Israel (83 per cent), Libya (79 per cent) and Spain (78 per cent).
Table 6.- Urbanisation rates of Mediterranean countries or territories (%)
Country or territory 1950 1960 1970 1980 1990 1995 Albania 19 25 24 25 30 34 Algeria 18 31 35 40 45 47 Bosnia-Herzegovina 10 13 17 25 32 33 Croatia 22 28 37 44 49 49 Cyprus 26 34 38 53 59 62 Egypt 43 50 55 60 65 67 France 53 57 62 63 63 62 Greece 38 42 52 57 59 59 Israel 75 74 79 81 82 83 Italy 60 65 69 71 72 71 Lebanon 38 52 54 48 63 67 Libya 20 26 45 62 79 79 Malta 65 74 74 72 74 73 Monaco 100 100 100 100 100 100 Morocco 24 27 33 39 45 49 Palestinian Authority 42 48 56 54 54 57 Slovenia 17 21 25 30 33 34 Spain 57 61 70 75 78 78 Syria 34 36 42 51 55 56 Tunisia 26 30 36 46 53 55 Turkey 19 27 36 46 57 60 Yugoslavia 20 27 35 43 47 46 MEDITERRANEAN TOTAL 44 49 54 58 61 62
Source : Géopolis 1998, Plan Bleu 1999.
5 The figures cited are taken from Bairoch (1984) for the periods prior to the 19th century, from the Géopolis data bank for 1900 and beyond. For 1900, the figures refer to the populations living in urban areas of 10,000 inhabitants and more. The latter were stopped in their growth in 1913.

Urbanisation in the Mediterranean Region from 1950 to 1995
Blue Plan - 2001 13
In 1995 there were no countries clearly under-urbanised. The lowest rates were recorded in the Balkans (Slovenia and Albania at 34 per cent and Bosnia at 33 per cent). These low rates in the Balkans are due to the fact that this region has never had large cities but small- and middle-sized urban areas often having the look more of large farming communities. Moreover, the post-1945 political regimes (Yugoslavia, Albania) promoted agriculture and maintaining the rural population rather than urban concentration. But these policies have since been abandoned and with the regional conflicts causing profound changes, it is now very possible that urbanisation will make up for lost time in the coming years, with, in particular, considerable growth of big cities such as Tirana in Albania.
The countries with the strongest growth in the urbanisation rate between 1950 and 1995 were Libya, plus 58 per cent in absolute terms and Turkey, plus 41 per cent in absolute terms (Graph 3 and Map 1)). On the other hand from 1990 to 1995 the urbanisation rate stagnated, even regressed, in the northern countries and, more generally, in all the countries already strongly urbanised (Israel and Malta). The spectacular growth in cities in Libya has been linked to a deep change in the economy brought about by income from oil. The size of the phenomenon is due to the small Libyan population (5 million in 1995) in relation to the exceptionally high windfall represented by the hydrocarbons and to the fact that this is a desert country that never had a genuine sedentary farming population, rather a pastoral and nomadic one that the State has tried to settle in cities.

Urbanisation in the Mediterranean Region from 1950 to 1995
Blue Plan - 2001 14
Graph 3.- Urbanisation rate of the Mediterranean countries or territories (in %)
Source : Géopolis 1998, Plan Bleu 1999.

Urbanisation in the Mediterranean Region from 1950 to 1995
Blue Plan - 2001 15
Map 1. The growth of urbanisation rates in Mediterranean countries or territories between 1950 and 1995

Urbanisation in the Mediterranean Region from 1950 to 1995
Blue Plan - 2001 16
2.3 Patterns of urban areas
Analysis of urban area patterns—a neutral term designating the distribution of urban areas in space based on the emplacement of each urban area—makes it possible to account for the spatial differentiation that occurs on a smaller scale.
Each urban area, whatever its size, is represented by a dot. Physical and political limits have not been represented on purpose.
In 1995 Géopolis registered 3,962 urban areas with at least 10,000 inhabitants in the Mediterranean countries. Mapping the patterns of these urban areas (Map 2) demonstrates that the urban areas generally copy the coastal lines with remarkable precision. With only a few exceptions (Corsica, Crete, Cyprus and Libya), this indicates that the coastline has now become intensively urbanised.
Map 2.- Urban-area patterns with 10,000 inhabitants and more in 1995
Source: Géopolis 1998, Plan Bleu 1999.
Two countries stand out by the high density of their urban-area patterns. On their own, they account for more than 40 per cent of the total number of urban areas:
• Egypt has 865 urban areas, nearly all located in the Nile Valley, making the Valley one of the planet's most densely populated regions (1,600 inhabitants/km2). On the other hand the coast, strictly speaking, is as yet relatively little urbanised, despite the recent boom of holiday villages to the west of Alexandria, most of which are not lived in on a permanent basis;
• Italy contains 769 urban areas, most of which are located in low-lying areas or along the peninsula's foothills. Likewise, Italy is the most "Mediterranean" of the big countries of the Basin.

Urbanisation in the Mediterranean Region from 1950 to 1995
Blue Plan - 2001 17
All the countries or territories of the Levant (Syria, Lebanon, Israel, the Palestinian Authority), cradle of the region's (if not the world's) most ancient urban civilisations, also have a very dense pattern, both inland (Jerusalem, Alep and Damascus) and on the coast (Tel Aviv-Jaffa and Beirut).
The average distance between the urban areas gives an idea of the pattern density of the urban areas, i.e. the lesser the average distance between urban areas, the tighter is the urban-area patterns in the territory concerned. This average distance is calculated for every country or territory (Table 7).
Table 7.- Average distance between urban areas in 1995
Source : Géopolis 1998, Plan Bleu 1999.
Malta, the Palestinian Authority, Israel, Lebanon and Italy have the densest urban-area patterns. In fact, the average distance between the urban areas depends on the local demographic density, i.e. these countries or territories are also the most densely populated of the Mediterranean region.
This overall calculation on a country scale also introduces the problem of the contrasts in the population spread. The countries on the southern rim contain vast, totally desert stretches in contrast to very dense areas where the patterns of cities are very compact (Nile Valley, the northern part of North Africa). The mapping of patterns per city makes it possible to correct this problem by restoring the real position of each urban area. The urban-area patterns are thus relatively unified in Turkey, whereas on the contrary in Egypt and Libya, the pattern is found on only a tiny part of the territory.
Country or territory
Average distance between urban areas (in km)
Albania 16 Algeria 48 Bosnia-Herzegovina 19 Croatia 18 Cyprus 21 Egypt 17 France 18 Greece 22 Israel 10 Italy 10 Lebanon 10 Libya 88 Malta 4 Monaco Morocco 36 Palestinian Authority 9 Slovenia 18 Spain 17 Syria 23 Tunisia 21 Turkey 20 Yugoslavia 16

Urbanisation in the Mediterranean Region from 1950 to 1995
Blue Plan - 2001 18
When the patterns are dense, the economies of urban-areas can become very specialised. The diversity of services and functions can be compensated for by exchanges between cities when they are close to one another. This situation encourages interurban movement and exchanges and functional complementarity between different sites. This results in the fate of each city's being linked with that of a region. In cases of growth as in crises, it is often observed that it is a whole batch of cities that follow the same movement. On the contrary remote cities surrounded by vast rural or desert countryside are obliged to offer a fuller panoply of services and functions.
If the urban-area patterns are looked at more closely, it is observable that they can be copied exactly on the map of high rural density, e.g. the Nile Delta, Spanish huertas and the Italian or Israelo-Palestinian coastal plains. This harks back to the observation made in the introduction to this work about the definition of cities. Most of these urban areas were once big villages that have gone beyond the threshold of 10,000 inhabitants under the influence of the demographic growth of these past few years.
2.4 Size and growth of urban areas
N u m b e r a n d a v e r a g e s i z e o f u r b a n a r e a s
The Mediterranean urban areas experienced strong numerical growth between 1950 and 1995 (going from 1,923 to 3,962) and in size (Map 3 and Table 8). Twenty-nine urban areas surpassed the million-inhabitant mark in 1995; there were only 10 in 1950. The major phenomenon is the rise in power of the metropolises of the southern and eastern Mediterranean countries in the group of million-strong urban areas. Whereas in 1950 there were only 2 out of 10, in 1995 there are 17 out of 29.
With close to 11 million, Cairo is the largest metropolis in the Mediterranean-rim countries, ahead of Paris (9.5 million) and Istanbul (8.3 million). None of these three cities is a "Mediterranean" metropolis in the strict sense of the term. If we stick to the narrow meaning of the coastline, no Mediterranean coastal urban area contains more than 4 million inhabitants, but there are five urban areas of very similar sizes, i.e. about 3 to 4 million in Barcelona, Rome, Naples, Athens and Alexandria.
The largest Mediterranean metropolises are therefore of relatively modest size on the world scale. The UN sets the minimum population threshold of "megacities" at 8 million souls. According to the Géopolis data bank, these urban areas numbered 23 world-wide in 1995. Cairo comes in in only 14th place, and no strictly "Mediterranean" region attains this size. The most populous, Barcelona, ranked 54th in the world in 1996 (INSEE, 1997/98). Likewise, from an economic point of view, the Mediterranean does not contain a "global city" in the sense that none of its metropolises has an economic, financial or political position or a decisive or motor role in globalisation (cf. Sassen, 1996).

Urbanisation in the Mediterranean Region from 1950 to 1995
Blue Plan - 2001 19
Map 3.- The Mediterranean country urban areas in 1950 and 1995

Urbanisation in the Mediterranean Region from 1950 to 1995
Blue Plan - 2001 20
Table 8.- Number and average size of urban areas
Country or territory Number of urban areas Average size (in thousands of inhabitants)
1950 1970 1995 1950 1970 1995
Albania 9 13 26 26 40 44 Algeria 37 98 262 45 49 51 Bosnia-Herzegovina 8 14 37 32 46 37 Croatia 20 27 43 42 60 55 Cyprus 4 4 5 32 59 91 Egypt 215 358 865 43 50 45 France 296 373 433 74 84 83 Greece 51 56 70 54 80 87 Israel 8 24 53 118 96 88 Italy 674 677 769 42 55 53 Lebanon 6 13 23 87 92 98 Libya 4 17 57 48 51 68 Malta 2 4 5 101 59 54 Monaco 1 1 1 18 24 32 Morocco 31 56 135 70 88 97 Palestinian Authority 10 11 20 43 57 71 Slovenia 6 10 16 42 43 42 Spain 350 370 415 46 64 74 Syria 18 34 85 66 77 94 Tunisia 19 37 84 48 49 59 TurKey 104 231 460 39 56 81 Yugoslavia 50 76 98 29 41 51 MEDITERRANEAN TOTAL 1 923 2 504 3 962 49 61 64
Source : Géopolis 1998, Plan Bleu 1999.
The "average size" is an indicator with the advantage of describing an average urbanisation profile making it possible to distinguish between countries of "small cities" (Albania, Algeria, Bosnia, Egypt and Italy) where the average city size ranges from 37,000 to 55,000, and countries with rather "large cities" (Lebanon, Morocco, Greece and Syria) where the general average is double that of the first.
Certain spatial irregularities in the average size may be attributed to the low number of urban areas possessed by certain countries. Thus does Lebanon have but 22 urban areas with more than 10,000 inhabitants, a highly populated capital notwithstanding, the presence of which raises the national average quite noticeably. On the contrary, it is the presence of numerous small cities that draws down the national averages in Egypt. It is therefore in a rather unexpected way that we find Egypt among the countries of rather "small cities", unexpected because the usual image of the city in this country is generally linked with that of Cairo, which often represents par excellence the idea of the "megapole" of the developing countries. Because of this, we forget that urbanisation cannot be summed up as the growth of a few large urban areas but affects the population system as a whole.
The observation of this phenomenon in the Mediterranean region is all the more complicated in that urbanisation includes very contrasting realities. Between hundreds of small Italian, Turk and Egyptian urban areas and enormous multi-
Urbanisation in the Mediterranean Region from 1950 to 1995
Blue Plan - 2001 21
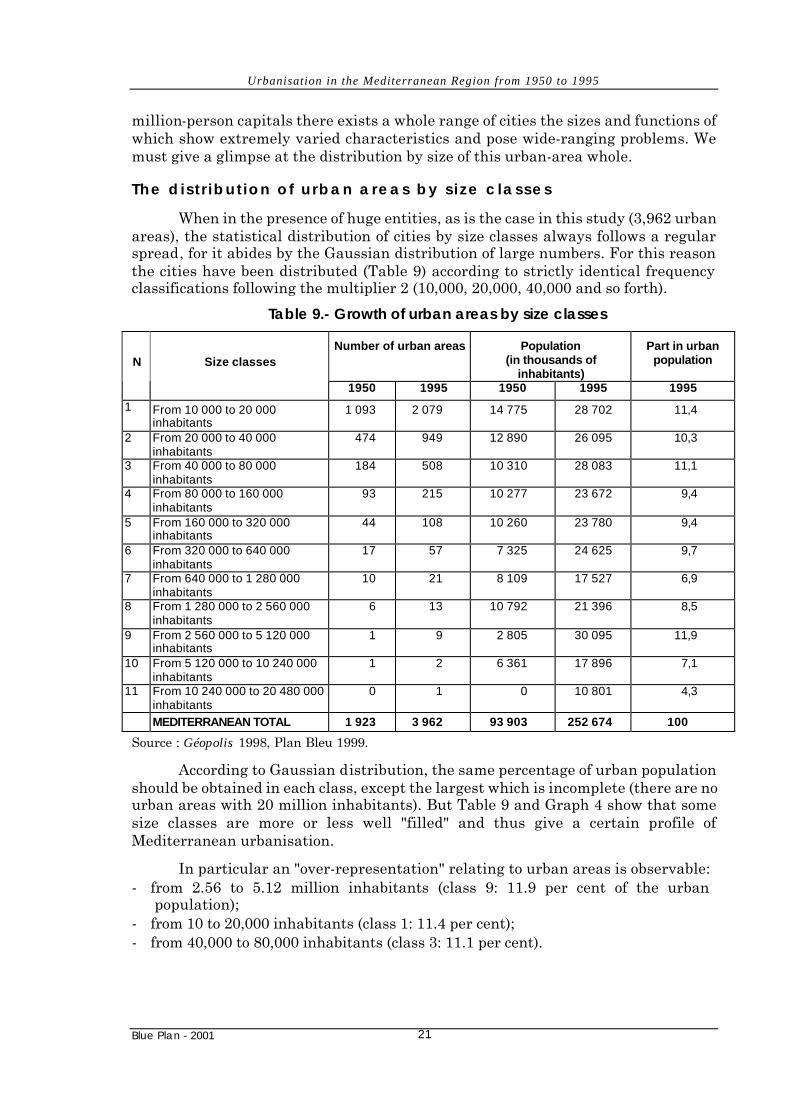
million-person capitals there exists a whole range of cities the sizes and functions of which show extremely varied characteristics and pose wide-ranging problems. We must give a glimpse at the distribution by size of this urban-area whole.
The d i s t r ibu t ion o f u rban a reas by s i ze c lasses
When in the presence of huge entities, as is the case in this study (3,962 urban areas), the statistical distribution of cities by size classes always follows a regular spread, for it abides by the Gaussian distribution of large numbers. For this reason the cities have been distributed (Table 9) according to strictly identical frequency classifications following the multiplier 2 (10,000, 20,000, 40,000 and so forth).
Table 9.- Growth of urban areas by size classes
Number of urban areas Population (in thousands of
inhabitants)
Part in urban population N Size classes
1950 1995 1950 1995 1995
1 From 10 000 to 20 000 inhabitants
1 093 2 079 14 775 28 702 11,4
2 From 20 000 to 40 000 inhabitants
474 949 12 890 26 095 10,3
3 From 40 000 to 80 000 inhabitants
184 508 10 310 28 083 11,1
4 From 80 000 to 160 000 inhabitants
93 215 10 277 23 672 9,4
5 From 160 000 to 320 000 inhabitants
44 108 10 260 23 780 9,4
6 From 320 000 to 640 000 inhabitants
17 57 7 325 24 625 9,7
7 From 640 000 to 1 280 000 inhabitants
10 21 8 109 17 527 6,9
8 From 1 280 000 to 2 560 000 inhabitants
6 13 10 792 21 396 8,5
9 From 2 560 000 to 5 120 000 inhabitants
1 9 2 805 30 095 11,9
10 From 5 120 000 to 10 240 000 inhabitants
1 2 6 361 17 896 7,1
11 From 10 240 000 to 20 480 000 inhabitants
0 1 0 10 801 4,3
MEDITERRANEAN TOTAL 1 923 3 962 93 903 252 674 100
Source : Géopolis 1998, Plan Bleu 1999.
According to Gaussian distribution, the same percentage of urban population should be obtained in each class, except the largest which is incomplete (there are no urban areas with 20 million inhabitants). But Table 9 and Graph 4 show that some size classes are more or less well "filled" and thus give a certain profile of Mediterranean urbanisation.
In particular an "over-representation" relating to urban areas is observable: - from 2.56 to 5.12 million inhabitants (class 9: 11.9 per cent of the urban
population); - from 10 to 20,000 inhabitants (class 1: 11.4 per cent); - from 40,000 to 80,000 inhabitants (class 3: 11.1 per cent).

Urbanisation in the Mediterranean Region from 1950 to 1995
Blue Plan - 2001 22
On the other hand a certain "deficit" of urban areas in classes 7, 10 and 11 appear, which is hard to interpret given the small number of urban areas in these intervals.
All the other classes have just about "normal" representation.
Graph 4.- Urban population distribution by size classes
Source : Géopolis 1998, Plan Bleu 1999.
These findings indicate the presently "strong" echelons of the urban framework of the Mediterranean-rim countries. These are:
• on the one hand, the large urban areas of class 9 (from 2.56 to 5.12 million inhabitants) such as Alexandria, Rome, Athens, Naples, Algiers, Barcelona and Izmir, all located on the coastline. Only Milan, Ankara and Madrid are inland cities;
• on the other and opposite hand, the smallest cities (class 1: from 10,000 to 20,000 inhabitants). On the national level this echelon is over-represented in Egypt, Italy, the Balkans and Spain. On this level the urban character is reluctant. These urban areas are dominated by big villages barely emerged from a farming economy. In Egypt the urban areas of this size often present more than 50 per cent of the active work force in the farming sector, while the rest of the work force works in sectors that are themselves attached to local agriculture (market trade, the food industry, cotton textiles, rural crafts of transformation of farming products or tool production). Likewise, in the Balkans and southern Italy numerous authors are reluctant to qualify this kind of area as "urban". Yet it must be admitted that these urban areas, even farming, present a great number of "urban" traits such as, for example, the presence of an often very dense fabric. Classification in "urban" or "rural" categories remains formal. Yet if the characteristics described briefly above are taken into account, it becomes apparent
0
2
4
6
8
10
12
14
16
18
1 2 3 4 5 6 7 8 9 10 11Class number
Par
t in
th
e u
rban
po
pu
lati
on
(%
)
199519701950

Urbanisation in the Mediterranean Region from 1950 to 1995
Blue Plan - 2001 23
that this is a fairly wide-spread figure and very typical of Mediterranean urbanisation.
• intermediate cities (class 3: 40,000 to 80,000 inhabitants), the urban nature of which are less open to doubt, represent the framework echelon of the previous ones in local economies. They are especially numerous in the regions where the patterns are dense (the Nile Valley and Delta, Puglia, southern Spain): they are generally part of small traditional regions that correspond to a "countryside geography" (cf. Denis, 1998), or in less dense regions of broader administrative circumscriptions.
The phenomenon of urbanisation in the Mediterranean cannot therefore be limited to the spectacular growth—to use a journalistic phrase—of a few large cities, i.e. a third of the urban population lives in an urban area of under 80,000 inhabitants, and 60 per cent in an urban area of less than 640,000 inhabitants. Far from the great metropolises, small- and medium-sized cities therefore occupy a very important place in the movement of urbanisation. By their number and the density of their patterns, they contribute to knit together the region and to bring urbanisation closer to the rural world. By their population contingents they represent an important part of the urban population in the Mediterranean-rim countries.
Graph 5.- Growth of urban areas according to three classes
0
50 000
100 000
150 000
200 000
250 000
300 000
1950 1960 1970 1980 1990 2000
Pop
ulat
ion
(in th
ousa
nd o
f inh
abita
nts)
Total
over 500 000inhabitants
100 000 - 500 000inhabitants
10 000 - 100 000inhabitants
Source : Géopolis 1998, Plan Bleu 1999.

Urbanisation in the Mediterranean Region from 1950 to 1995
Blue Plan - 2001 24
3 The evolution and present situation of urbanisation in all Mediterranean coastal regions
3.1 Definitions
For the present study, all Mediterranean-rim countries are considered Mediterranean. This is a conventional definition of the Mediterranean space insofar as six countries have one or more maritime coasts (Egypt, France, Israel, Morocco, Spain and Turkey). This definition has the merit of being operational insofar as numerous political decisions concerning territorial planning and coastal development are made on the national level. In other words, when a State has a Mediterranean coastline, it is the whole of its territory that is concerned the presence (or absence) of legislation concerning development, urbanism, transportation and so forth.
The Contracting Parties to the Barcelona Convention (1976), i.e. twenty States and the European Community, illustrates the operational nature of this definition very well.
Moreover, by taking the whole of a country, the possibilities of evaluating the weight of coastal regions on the national checker board are optimised, i.e. this is how the growth of cities in Mediterranean coastal regions can be compared with those inland or, where applicable, those located on other coasts.
Here the Mediterranean coast is considered on two different scales: on the one hand, the administrative regions touching the Mediterranean coastline (Mediterranean coastal regions); on the other, the urban areas that are located on the coast.
The administrative regions touching the Mediterranean coastline. For the purposes of this study the expressions "Mediterranean coastal regions" and "Mediterranean littoral regions" are synonymous.
For the countries of the European Union the basic administrative units selected are those of level 3 of the Nomenclature of Territorial Units for Statistics (NUTS 3). In agreement with the countries, the Blue Plan has extended the equivalent of level 3 of this nomenclature to the rim of the Mediterranean Basin.
The NUTS 3 equivalent level of the European Union, even if it is not always strictly comparable between two countries, is the first operational level of the territory's decentralised management. In certain countries (especially in Europe), the trend is to transform these spatial units into local communities with greater and greater political and budgetary autonomy. This however is not the case in the South and East (Egypt, Algeria, Turkey, etc.), where these geographic entities have little autonomy in relation to the central power. Administered by a governor or a prefect directly named by the government, they are managed directly by the State.
From the moment that one of these territorial entities has a maritime coast, even if only a few kilometres long, the question is asked—always in an operational perspective—as to its place and the interest shown in it in local development policies. Whatever the management mode (centralised or not), we know that there is at least

Urbanisation in the Mediterranean Region from 1950 to 1995
Blue Plan - 2001 25
one interlocutor (named or elected) on this territorial level, who has financial, legal and political means and responsibility for this part of the coast.
Urban areas located on the coastline. This second scale used in the study refers to a very restrictive definition of the coastline. It at least is incontestable, and the problems of artificialised coastline are put here with particularly lively acuteness.
An urban area is considered to be touching the coast when one of its constituent local units (see §1.1a) is delimited by the sea front. The urban area's historical centre may then be found slightly inland. This is the case with Rome, for example.
The use of these two definitions makes it possible to distinguish certain processes. Map reading can indeed be done on two levels:
• the indicators of the urbanisation of coastal regions compared to the country as a whole give an idea of the weight of the dynamics and attractiveness of the coastlines on a national scale. They refer to a notion of the "relative artificialised coastline" of the urban population.
• The indicators of the urbanisation of the coastline show the coast's urban load in the strict sense of the word. They can be compared to the previous indicators of the coastal regions or to the country as a whole and refer diagrammatically to a notion of "absolute artificialised coastline" of the urban population.
The cities of certain coastal regions can be especially attractive on the regional level and not those located on the coastline. That means that these Mediterranean coastal regions are attractive on the national level but that a redeployment of the population from the coast towards the inland areas of these regions can be observed at the same time.
3.2 Urbanisation in the coastal regions
The ave rage dens i t y and popu la t ion con t rasts
Of the 651 regions of the Mediterranean-rim countries, a third (221) touch the Mediterranean coastline. These Mediterranean coastal regions are twice as densely populated as the countries' regions as a whole, i.e. 96 inhabitants/km2 on average as opposed to 47 inhabitants/km2 (Map 4).
This disparity can be explained first of all by the southern deserts. The 29 least-densely-populated desert regions (equivalent to NUTS 3 level) of the south, corresponding to the Sahara, the eastern Egyptian desert and the Sinai, are both immense and nearly uninhabited. The wilaya of Tamanrasset, for example, is larger than France or Spain yet has only 124,000 inhabitants. The regions of Adrar (Algeria), Al-Kufra (Libya) and New Valley (Egypt) each cover more than 400,000 km2 (i.e. more than Italy) for about 400,000 inhabitants in 1995. Together these 29 regions occupy 4,462,000 km2 out of 8,158,000 km2, or 55 per cent of the land surface area of all the countries in the zone studied.

Urbanisation in the Mediterranean Region from 1950 to 1995
Blue Plan - 2001 26
Map 4.- Population density in the regions of the Mediterranean countries in 1995

Urbanisation in the Mediterranean Region from 1950 to 1995
Blue Plan - 2001 27
On the other hand the presence of these deserts is counterbalanced by highly populated, non-coastal regions. The Valley and Delta of the Nile and the adjacent areas (Alexandria and the Suez Canal) hold 58 million inhabitants in 53,000 km2, or 14 per cent of the total population on 0.7 per cent of the Mediterranean countries' land-surface area. Now, 2/3 of this population are not considered as belonging to a coastal region according to our definition. Likewise the regions of Paris, Milan-Turin, Madrid, Lyons, Ankara, Damascus, Alep and Belgrade that hold about 40 million inhabitants, or 10 per cent of the whole, are very dense and non-coastal. The regions of Istanbul, Nord-Pas de Calais, Casablanca-Rabat, Seville and the Basque Country (20 million inhabitants involved all told, i.e. 5 per cent of the whole), which are very dense, would have to be added, too. They are coastal but not located on the Mediterranean.
In this context it must be kept in mind that the notion of "average" reduces a reality that covers extreme contrasts to a descriptor, most especially in the Mediterranean Basin. Although it offers the advantage of setting an order of size, a convenient benchmark, the average density is a datum that is not very reducible to the mode of Mediterranean population, right down to the smallest geographic scales. The contact areas between countrysides, the forms and environments are extremely contrasted in many regions. In just a few dozen metres one extreme can replace another, from an irrigated oasis to desert, from a highly populated alluvial plain to steep slopes covered with undergrowth or garrigues—from the ager to the saltus, to use the classification from the Roman world—from a densely populated town to fields irrigated and cultivated like a garden, from an industrial and urban corridor covered with intersecting roads to a totally wild mountain chain.
This cliché, widely present in regional literature as in tourist documentation and which the notion of average closes up, therefore makes sense, for in the end it is a genuine constant in the Mediterranean Basin, most especially when the problems of urbanisation and artificialised coastline are studied. This constant can be said to be structural for it transcends all the geographic scales from the smallest to the largest, i.e. located at the gates of regions among the densest on earth, is one of the most absolute and biggest deserts of the world (Egypt, Damascus); large urban areas among the densest of their regions (Barcelona, Marseilles and Genoa) are surrounded by almost uninhabited mountain ranges.
The preoccupation of thinning out saturated areas by better apportioning the population over the whole territory also seems to be a constant in planning and development policies (Egypt, Libya, Algeria, Syria and Israel) and to a lesser degree—especially from questions about water—in Turkey (planning for the Tigris and Euphrates Valleys), in Spain (programme of building large dams on inland plateaux) and in Tunisia.
Now to improve the desert and marshland, build roads and canals, parcel out virgin mountain areas, enhance the resources remote from inhabited centres and develop entire valleys, considerable investment has been mobilised. These programs prove to be very costly when compared to the number of people involved, and the first objections aimed at these policies are that they put a strain on budgets that might be allocated to the rehabilitation, renovation or modernisation of traditionally populated areas. In terms of impact on the population, the question is only measurable in the long-term. But it is impossible to forecast if new developments will create large

Urbanisation in the Mediterranean Region from 1950 to 1995
Blue Plan - 2001 28
movements of people and new job-creating dynamics or only if a handful of people will benefit.
The example of Egypt, the most committed country insofar as building new cities is concerned, is interesting. New cities receive the majority of the new foreign companies that arrive thanks to liberalised development, but they have a harder time attracting people. In 1993 the cities of “Ten of Ramadan” and “Six October” offered respectively 36,600 and 29,000 industrial jobs while their respective total populations were 47,839 and 35,479 according to the November, 1996 census. Their economic fabric is varied, i.e. there are numerous multinational companies, but certain establishments are also relocated companies that were already present in Egypt, especially in Cairo. In all, the SMEs provided 77 per cent of the jobs in “Ten of Ramadan”. As of 1994 the new cities accounted for 20 per cent of the export of manufactured goods in Egypt. From the population's point of view, the housing offer was more aimed at the middle and well-off classes rather than the poor, which explains their relatively small demographic growth compared to other experiences in the world (Brasilia, Chandigarh…). Totally new forms of populations are found, e.g. urbanism entirely organised around private cars or the building of individual housing lots of the American "village compound" type. The arrival of these forms of life-style, which are in all regards foreign to traditional Egyptian society and particularly ill adapted to the vast majority of the social demand, reveals the communications dimension that is one professional aspect of the "major projects". But the question might also be asked as to whether these new forms of population may not induce new styles of life on which the middle classes would emerge in tomorrow's world. In other words, it is also possible that the r edeployment programmes could serve as a support for radical changes in Mediterranean societies. Spatial spread would therefore be the sign not only of a quantitative but also an historical and qualitative break in the ways of life and social organisation.
T h e d e m o g r a p h i c w e i g h t o f t h e c o a s t a l r e g i o n s
In 1995 the coastal regions of the Mediterranean held 34 per cent of the 405 million inhabitants of the Mediterranean-rim countries, i.e. 140 million inhabitants. Their urban population comes to 93 million, 59 million of which are in urban areas located on the coastline (Table 10).

Urbanisation in the Mediterranean Region from 1950 to 1995
Blue Plan - 2001 29
Table 10.- The share of the total population and the total urban population living on the Mediterranean coast in 1995 (in %)
Country or territory Population in
Mediterranean coastal regions
(%)
Urban population in Mediterranean coastal
regions (%)
Population in urban areas located on the
coastline (%)
Albania 39,2 44,2 20,8 Algeria 43,1 46,9 32,6 Bosnia-Herzegovina 12,0 9,7 0,0 Croatia 32,9 33,9 31,7 Cyprus 100,0 100,0 59,7 Egypt 34,8 30,6 10,1 France 10,4 12,1 9,0 Greece 89,4 94,6 81,9 Israel 85,6 85,3 59,8 Italy 57,3 61,5 37,4 Lebanon 90,6 95,7 83,6 Libya 85,0 88,2 71,9 Malta 100,0 100,0 77,2 Monaco 100,0 100,0 100,0 Morocco 15,6 12,7 4,3 Palestinian Authority 36,1 59,8 35,8 Slovenia 5,2 5,2 5,2 Spain 38,7 42,2 29,6 Syria 9,9 6,8 6,6 Tunisia 70,2 82,0 70,0 TurKey 20,5 20,8 10,6 Yugoslavia 3,7 5,1 1,1 MEDITERRANEAN TOTAL 34,1 36,9 23,3
Source : Géopolis 1998, Plan Bleu 1999. Note: For certain countries, the value corresponds to 1990.
In general the population in the Mediterranean coastal regions has undergone a nearly identical growth to the total population of the countries for the 1990-1995 period (average annual growth rate of 1.23 per cent for the Mediterranean regions and 1.29 per cent for all countries (Table 11).
For the same period from 1990-1995 it can be noted that all the urban areas located on the coastline underwent slower growth than the total and coastal populations of the countries. For all that, the situations in all the countries are not identical. In northern Africa (Algeria, Egypt, Libya and Tunisia) and Israel, coastal urban areas grow more slowly than those inland, and this, even more slowly when they are located directly on the coast. The trend is the reverse in Spain and Croatia but in a very weak demographic growth context. Only Turkey, Syria and Morocco are coastalising in a context of strong growth. The other countries show like characteristics, i.e. stronger urban growth in the Mediterranean coastal regions but rather in the inland areas of these regions than in the cities located on the shore. The coast is attractive on the overall scale of the country, but in the coastal regions scale growth is being observed rather in inland cities. Italy is the only country to undergo

Urbanisation in the Mediterranean Region from 1950 to 1995
Blue Plan - 2001 30
negative growth rates. The country is de-populating and faster in the coastal urban areas than anywhere else.
Table 11.- Average annual growth rates of total, urban and coastal populations of countries or territories between 1990 and 1995 (in %)
Country or territory
Total population
1990-1995
Urban population
1990-1995
Population in Mediterranean coastal regions
1990-1995
Urban population in Mediterranean coastal regions
1990-1995
Population in urban areas
located on the coastline
Albania 0,76 3,54 na* 4,19 3,01 Algeria 2,44 3,32 2,26 2,78 1,70 Bosnia-Herzegovina -0,99 -0,37 na 3,86 Croatia 0,35 0,56 na 0,65 0,69 Cyprus 0,82 1,80 0,82 1,80 1,93 Egypt 2,08 2,64 2,10 2,37 1,19 France 0,54 0,35 0,76 0,63 0,60 Greece 0,13 0,21 0,13 0,21 0,10 Israel 4,41 4,77 4,26 4,67 3,21 Italy -0,09 -0,21 -0,15 -0,19 -0,39 Lebanon 1,31 2,60 1,99 2,72 2,53 Libya 4,48 4,30 na 3,65 2,90 Malta 0,89 0,64 0,89 0,64 0,53 Monaco 1,11 1,11 1,11 1,11 1,11 Morocco 2,06 3,86 2,20 4,41 4,10 Palestinian Authority 8,33 9,15 10,25 10,24 10,24 Slovenia 0,31 0,84 0,05 0,23 0,23 Spain 0,29 0,38 0,49 0,62 0,45 Syria 3,43 3,62 1,12 4,24 4,30 Tunisia 2,35 3,17 2,41 2,80 2,67 TurKey 1,69 3,01 2,09 2,88 3,57 Yugoslavia 0,87 0,49 na 0,98 MEDITERRANEAN TOTAL 1,29 1,65 1,23 1,48 1,10
*not available. Source : Géopolis 1998, Plan Bleu 1999.
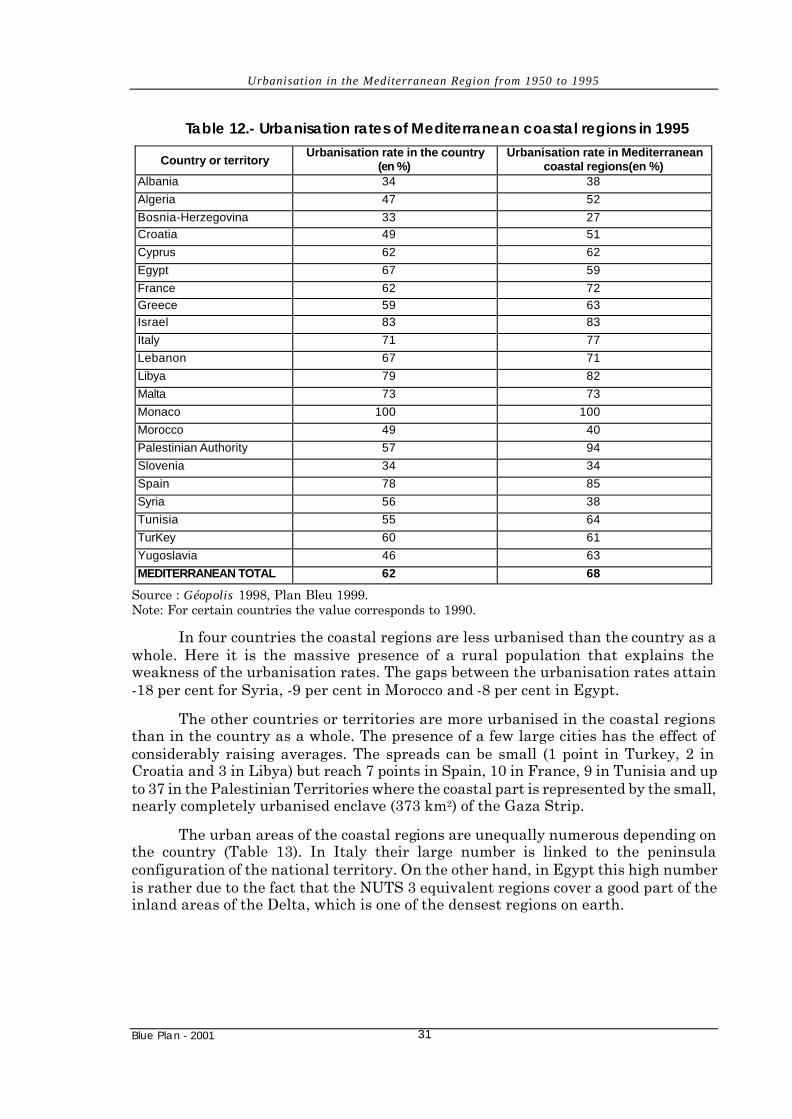
The Mediterranean coastal regions are more urbanised than countries as a whole, i.e. in 1995 their urbanisation rate was 68 per cent while the countries had a rate of 62 per cent (Table 12).
Five countries (including the two island-States and Monaco, comparable to an urban island) had an identical urbanisation rate in the two spaces considered.
Urbanisation in the Mediterranean Region from 1950 to 1995
Blue Plan - 2001 31
Table 12.- Urbanisation rates of Mediterranean coastal regions in 1995
Country or territory Urbanisation rate in the country
(en %) Urbanisation rate in Mediterranean
coastal regions(en %) Albania 34 38 Algeria 47 52 Bosnia-Herzegovina 33 27 Croatia 49 51 Cyprus 62 62 Egypt 67 59 France 62 72 Greece 59 63 Israel 83 83 Italy 71 77 Lebanon 67 71 Libya 79 82 Malta 73 73 Monaco 100 100 Morocco 49 40 Palestinian Authority 57 94 Slovenia 34 34 Spain 78 85 Syria 56 38 Tunisia 55 64 TurKey 60 61 Yugoslavia 46 63 MEDITERRANEAN TOTAL 62 68
Source : Géopolis 1998, Plan Bleu 1999. Note: For certain countries the value corresponds to 1990.
In four countries the coastal regions are less urbanised than the country as a whole. Here it is the massive presence of a rural population that explains the weakness of the urbanisation rates. The gaps between the urbanisation rates attain -18 per cent for Syria, -9 per cent in Morocco and -8 per cent in Egypt.
The other countries or territories are more urbanised in the coastal regions than in the country as a whole. The presence of a few large cities has the effect of considerably raising averages. The spreads can be small (1 point in Turkey, 2 in Croatia and 3 in Libya) but reach 7 points in Spain, 10 in France, 9 in Tunisia and up to 37 in the Palestinian Territories where the coastal part is represented by the small, nearly completely urbanised enclave (373 km2) of the Gaza Strip.
The urban areas of the coastal regions are unequally numerous depending on the country (Table 13). In Italy their large number is linked to the peninsula configuration of the national territory. On the other hand, in Egypt this high number is rather due to the fact that the NUTS 3 equivalent regions cover a good part of the inland areas of the Delta, which is one of the densest regions on earth.
Urbanisation in the Mediterranean Region from 1950 to 1995
Blue Plan - 2001 32
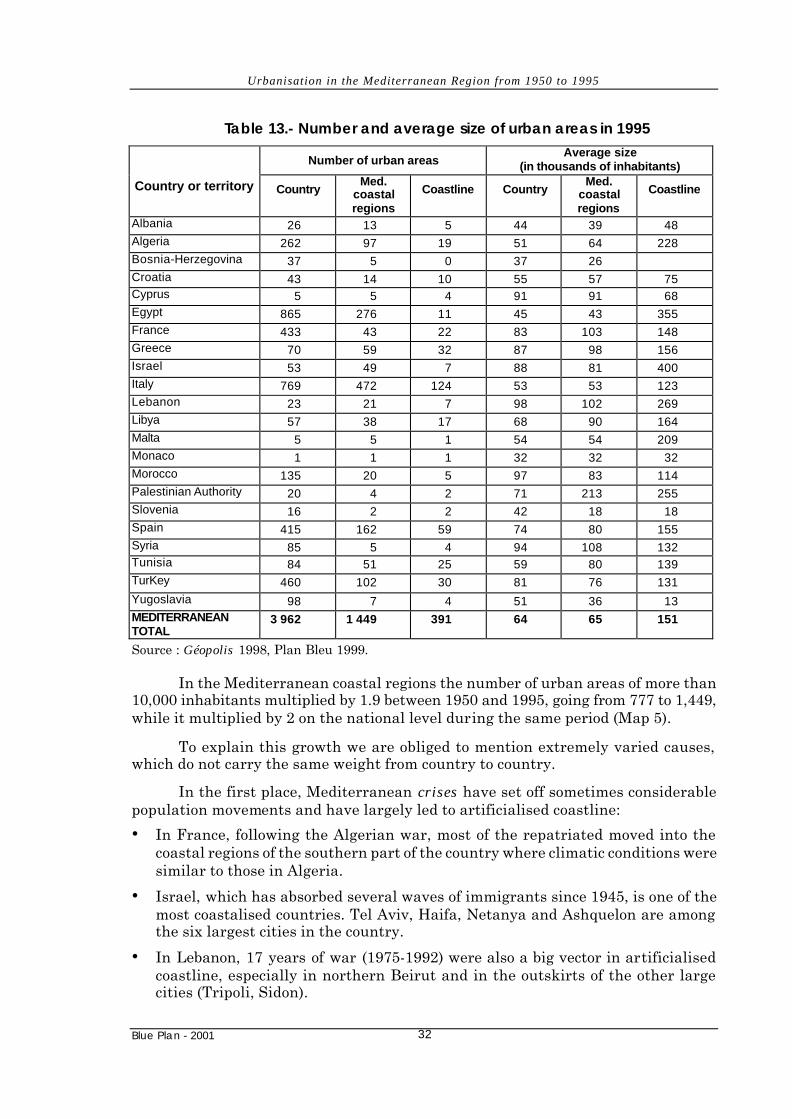
Table 13.- Number and average size of urban areas in 1995
Number of urban areas Average size
(in thousands of inhabitants)
Country or territory Country Med.
coastal regions
Coastline Country Med.
coastal regions
Coastline
Albania 26 13 5 44 39 48 Algeria 262 97 19 51 64 228 Bosnia-Herzegovina 37 5 0 37 26 Croatia 43 14 10 55 57 75 Cyprus 5 5 4 91 91 68 Egypt 865 276 11 45 43 355 France 433 43 22 83 103 148 Greece 70 59 32 87 98 156 Israel 53 49 7 88 81 400 Italy 769 472 124 53 53 123 Lebanon 23 21 7 98 102 269 Libya 57 38 17 68 90 164 Malta 5 5 1 54 54 209 Monaco 1 1 1 32 32 32 Morocco 135 20 5 97 83 114 Palestinian Authority 20 4 2 71 213 255 Slovenia 16 2 2 42 18 18 Spain 415 162 59 74 80 155 Syria 85 5 4 94 108 132 Tunisia 84 51 25 59 80 139 TurKey 460 102 30 81 76 131 Yugoslavia 98 7 4 51 36 13 MEDITERRANEAN TOTAL
3 962 1 449 391 64 65 151
Source : Géopolis 1998, Plan Bleu 1999.
In the Mediterranean coastal regions the number of urban areas of more than 10,000 inhabitants multiplied by 1.9 between 1950 and 1995, going from 777 to 1,449, while it multiplied by 2 on the national level during the same period (Map 5).
To explain this growth we are obliged to mention extremely varied causes, which do not carry the same weight from country to country.
In the first place, Mediterranean crises have set off sometimes considerable population movements and have largely led to artificialised coastline:
• In France, following the Algerian war, most of the repatriated moved into the coastal regions of the southern part of the country where climatic conditions were similar to those in Algeria.
• Israel, which has absorbed several waves of immigrants since 1945, is one of the most coastalised countries. Tel Aviv, Haifa, Netanya and Ashquelon are among the six largest cities in the country.
• In Lebanon, 17 years of war (1975-1992) were also a big vector in artificialised coastline, especially in northern Beirut and in the outskirts of the other large cities (Tripoli, Sidon).

Urbanisation in the Mediterranean Region from 1950 to 1995
Blue Plan - 2001 33
Map 5.- The urban areas of the Mediterranean coastal regions in 1950 and 1995

Urbanisation in the Mediterranean Region from 1950 to 1995
Blue Plan - 2001 34
• In Cyprus, the population of which was 18 per cent Turkish speaking in 1974, the partition of the island led to the sudden displacement of 191,000 people. 180,000 inhabitants of the northern zone headed south. Simultaneously 11,000 Turkish speakers from the south moved to the north, most of whom did so to the outskirts of the capital. These very uneven movements meant that whole villages in the north were depopulated, even abandoned, and that the southern cities grew considerably, all of which are located on the coast.
• The war of independence in Croatia, then the conflicts in Bosnia and Kosovo, weakened the isolated populations and thereby amplified rural depopulation. Cities served as shelter, particularly those on the coast. In Split, as tourism totally collapsed, hotels were used as temporary housing for refugees as early as 1991. It appears that a certain number of the refugees then remained in the region afterwards.
• Concerning the Palestinian Territories, the coastal part of the Gaza Strip, the Palestinian Authority's only coastline, has become one of the most densely populated territories anywhere on the Mediterranean. With 905,000 inhabitants in 1997 (as opposed to 297,000 in 1952) on 373 km2, or 2,420 inhabitans/km2, the density has more than tripled in 45 years.
Excluding these exceptional circumstances, which have nonetheless been numerous and brought about lasting changes in the population geography, the strong demographic growth of the past 45 years explains a good part of the densification of the coastal regions, especially in the southern and eastern countries.
Likewise in the rise of the urbanisation rate, the Mediterranean coastal regions have only followed a world-wide trend. The primary source of the densification of the coastal regions is this world-wide demographic growth but is not a specifically Mediterranean phenomenon. Even if there had been no migrations whatever, the coastal populations would have increased anyway, and numerous towns would have become cities, for their population just naturally grew.
In the northern Mediterranean countries growth was relatively sustained up to the middle of the 1960s because of the "baby boom", but there was much less growth than in the southern countries. Yet in the coastal regions urban growth was fed by high immigration from the inland areas (Spain, Italy, Greece and Croatia) or located further north (France).
In France, indeed in Europe as a whole, as in America, people also talk about a certain tendency for companies and individuals to be drawn to the sunny south from the northern climes. This attraction to the regions where there is more sun and the climate is milder, called "heliotropism", would be due to the place taken by the quality of the living environment and hobbies in relation to free time. The place granted to leisure-time in our society is due less to a spectacular quantitative advance in free time than to the new perspective that society devotes to free time. Henceforth it is the nature and quality of what is done with free time that tends to be given pride of place rather than the time devoted to work.
Two of many examples make it possible to illustrate this phenomenon; the Sophia Antipolis technology park with more than 20,000 jobs at present and Montpellier, one of the most dynamic of the regional technology park in terms of
Urbanisation in the Mediterranean Region from 1950 to 1995
Blue Plan - 2001 35
demographics between 1990 and 1999. Yet this movement towards the south is not generalised, as witness the decline since 1975 of Béziers, a middle-size Mediterranean city.
On a Basin-wide scale, this heliotropism has not yet enticed individuals or enterprises from Europe into crossing the water and setting up in the southern countries. Yet on this level, if the movement continues and spreads, it is entirely possible that today's South-North migratory flows some day might reverse.
Spain's Catalonia is the leading industrial region in the country. Elsewhere in Spain, as in Greece, southern Italy and Croatia, the cities of coastal regions have taken advantage of the rural depopulation and the decline of their closest inland areas, i.e. there have not been any mechanical movements North to South but sometimes from East to West or West to East, or, to be more exact, a slide of people and activities towards the coastal plains and their adjacent valleys.
Finally, it is undeniable that the Mediterranean coastal regions, in particular those on the northern shore, are especially attractive to certain kinds of jobs and populations. It is worth noting that the attraction of these regions is concomitant with the development of tourism. Tourism as a factor of attractiveness must be distinguished from tourism as an economic activity.
In the European societies the coastal regions' attractiveness has been amply fed by tourism's having discovered them first. This is true not only for the Mediterranean but also for the English Channel, the Atlantic and the North Sea. Moreover, this phenomenon is not limited to western societies but also affects countries in the South and East of the Mediterranean region with a delay effect that can be put at about an average of twenty years.
Seaside tourism is a long-standing practice and fairly generalised among the well-to-do classes of England6, France7, Italy8 and Austria9, not to mention Egypt10, Lebanon and Turkey. The Mediterranean coast also attracts a good number of aesthetes from northern Europe11, Russia12 and the United States13. In Europe this practise is massively followed by the middle classes during the "30 glorious years" [the Fifties, Sixties and Seventies]. Every year migration by several tens of thousands come from all over Europe. In the 1990s the Mediterranean beaches attracted a growing fringe of people from the countries of central and eastern Europe, also the inland populations of less-wealthy countries from the southern side of the Mediterranean Basin. This domestic tourism has always existed but under sometimes different forms such as feast-days and pilgrimages. For a long time it was very badly
6 See, for example, the literary descriptions by Virginia Wolff in The Lighthouse. 7 See Marcel Proust, A la recherché du temps perdu, in particular A l’ombre des jeunes filles en fleur. 8 See Cesare Pavese, La Spiaggia (The Beach), 1956, written at the end of the 1940s. 9 See Thomas Mann, Death in Venice, transposed to the screen by Lucchino Visconti (Death in Venice, 1971). 10 See the trilogy by Naguib Mahfouz, which takes place in the first third of the 20th century. The well-to-do spend their summers in the coolness of the small resort of R’âs el-Barr (to the north of Damiette). 11 See Gerald Durrell, My Family and other Animals (Gerald Durrell is Lawrence Durrell's brother, the latter being the author of the Alexandria Quartet). The Durrell family had escaped the urban grey of England to move to the Greek island of Corfu. 12 See Leon Tolstoy, Anna Karenina, part 5. 13 See F. Scott Fitzgerald, Tender is the Night, 1934, which begins with these words: "On the pleasant shore of the French Riviera, about half way between Marseilles and the Italian border, stands a large, proud, rose-colored hotel […] Lately is has become a summer resort of notable and fashionable people…"

Urbanisation in the Mediterranean Region from 1950 to 1995
Blue Plan - 2001 36
quantified, even not at all, and was not necessarily at the seaside. Today, however, it is changing both quantitatively and qualitatively.
The importance of the phenomenon is often made evident when there is a fall in the number of international tourists as has happened in Morocco and Egypt. On such occasions with the offer greatly exceeding demand, prices fall and tourist products become accessible to the country's middle classes. Trade professionals then discover that domestic tourism can, partially at least, make up for a short-fall in international tourism.
Tens of millions of tourists thus visit the Mediterranean coastal regions every year. Housing and other infrastructures required for receiving them are a powerful factor in creating an urban fabric, then of its growth. This phenomenon can also lead to a change in the residential function, which becomes more or less p ermanent rather than just seasonal.
An example is given by the "immigrant" retirees, which have a large population in the coastal regions of the northern Mediterranean countries, not just in the buildings of seaside resort areas, but also in certain villages and housing developments of inland towns, to such a degree that they form genuine local communities. The retired population is especially cosmopolitan in terms of social and geographical origins, since many of them come from northern Europe, even from other continents (African and Arab elites…). This fairly mobile population also poses problems of residency for a precise counting insofar as most of them divide their time between their home areas (generally when it is hot) and their coastal residences (in winter).
Tourism in itself generates a considerable number of jobs in fields like construction and relatively specialised services linked to it. It also can to a certain degree generate new professions by stimulating sectors that may already be present (crafts, restaurants…). All of these opportunities benefit both local populations and the immigrants themselves. Tourist-related activities benefit already existing towns and cities and contribute to changing the physical aspect of rural towns by modifying their socio-economic bases.
3.3 Four examples of urbanisation of the coastline.
The Mediterranean shorelines are typified to a considerable degree by very uneven land relief that affords little space for today's needs in urban development, i.e. spreading out, moving and communicating with other cities. Compared with the coasts of the United States, China and India, this particularity of the Mediterranean Basin is striking.
Although in a general way constraints are therefore more frequent than on other of the world's coasts, there are several population modes, nonetheless. Four examples, demonstrating how the contact between the sea and cities is carried out give an idea of this diversity, i.e. small coastal plains, the Greek model, urban corridors and delta seafronts.
Small coastal plains. Map 6 shows a segment of the Abruzzi coastline in Italy. The coastal plain that borders the Adriatic is narrow and punctuated with small coastal rivers that come down from the Apennines and which are fairly turbulent because of

Urbanisation in the Mediterranean Region from 1950 to 1995
Blue Plan - 2001 37
the slope. Stimulated by seasonal tourism and located on a natural corridor that has become a major route between the north and the south of the Italian peninsula, most of the communities located by the sea have become small cities, whereas the inland villages and towns have been depopulated.
Urban areas have sprung up directly on the sea front and have stretched out along the coastline. This kind of land occupation has prevailed all around the Adriatic, on the western shores of the Mediterranean, in Lebanon and in Syria.
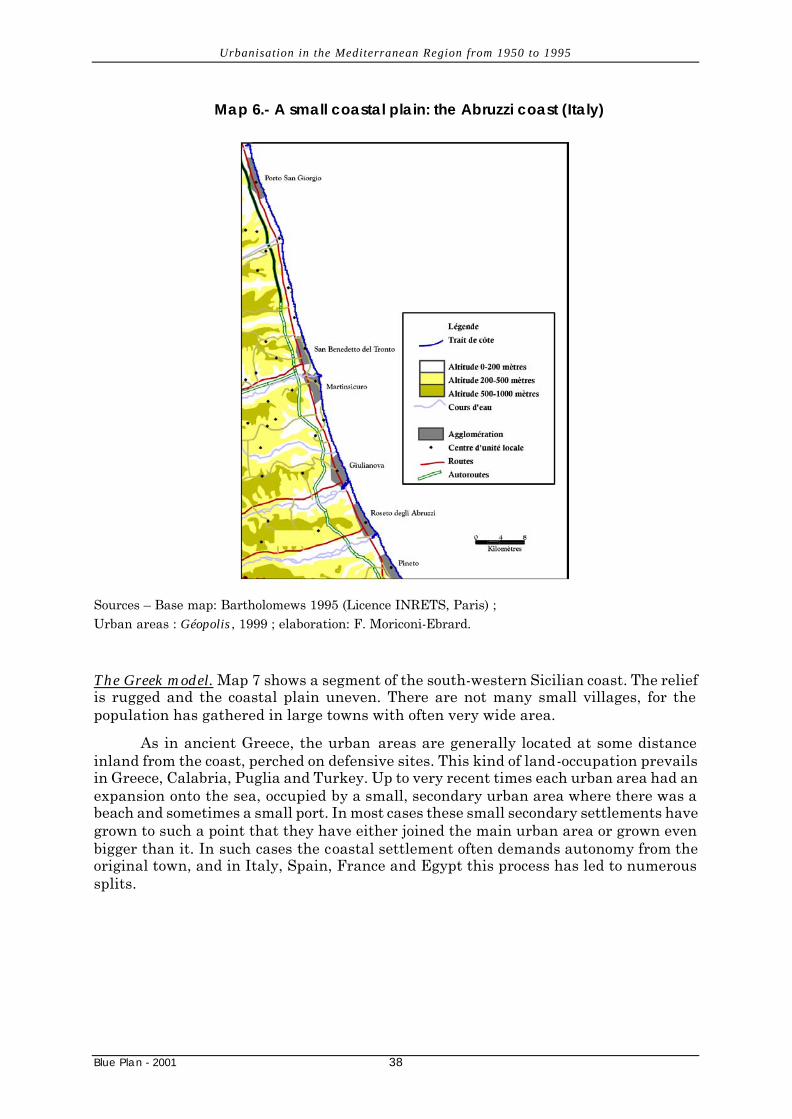
Urbanisation in the Mediterranean Region from 1950 to 1995
Blue Plan - 2001 38
Map 6.- A small coastal plain: the Abruzzi coast (Italy)
Sources – Base map: Bartholomews 1995 (Licence INRETS, Paris) ; Urban areas : Géopolis, 1999 ; elaboration: F. Moriconi-Ebrard.
The Greek model. Map 7 shows a segment of the south-western Sicilian coast. The relief is rugged and the coastal plain uneven. There are not many small villages, for the population has gathered in large towns with often very wide area.
As in ancient Greece, the urban areas are generally located at some distance inland from the coast, perched on defensive sites. This kind of land-occupation prevails in Greece, Calabria, Puglia and Turkey. Up to very recent times each urban area had an expansion onto the sea, occupied by a small, secondary urban area where there was a beach and sometimes a small port. In most cases these small secondary settlements have grown to such a point that they have either joined the main urban area or grown even bigger than it. In such cases the coastal settlement often demands autonomy from the original town, and in Italy, Spain, France and Egypt this process has led to numerous splits.
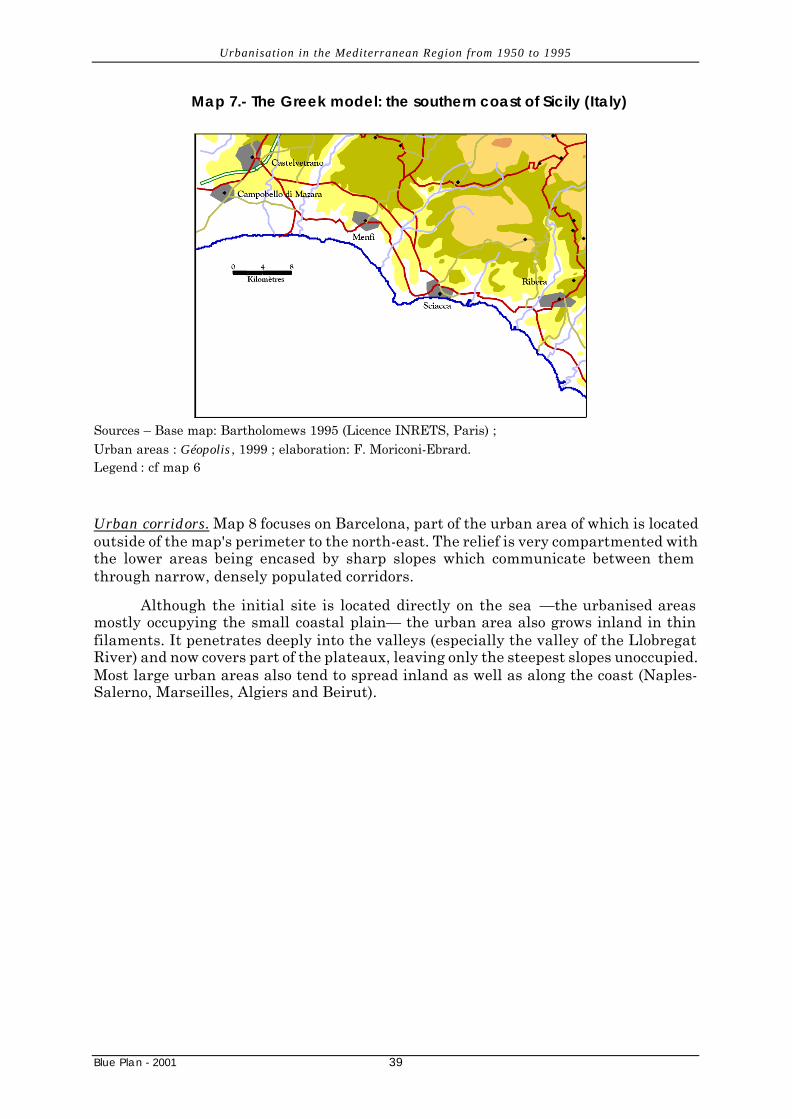
Urbanisation in the Mediterranean Region from 1950 to 1995
Blue Plan - 2001 39
Map 7.- The Greek model: the southern coast of Sicily (Italy)
Sources – Base map: Bartholomews 1995 (Licence INRETS, Paris) ; Urban areas : Géopolis, 1999 ; elaboration: F. Moriconi-Ebrard. Legend : cf map 6
Urban corridors. Map 8 focuses on Barcelona, part of the urban area of which is located outside of the map's perimeter to the north-east. The relief is very compartmented with the lower areas being encased by sharp slopes which communicate between them through narrow, densely populated corridors.
Although the initial site is located directly on the sea —the urbanised areas mostly occupying the small coastal plain— the urban area also grows inland in thin filaments. It penetrates deeply into the valleys (especially the valley of the Llobregat River) and now covers part of the plateaux, leaving only the steepest slopes unoccupied. Most large urban areas also tend to spread inland as well as along the coast (Naples-Salerno, Marseilles, Algiers and Beirut).

Urbanisation in the Mediterranean Region from 1950 to 1995
Blue Plan - 2001 40
Map 8.- An urban corridor: the Catalonian coast around Barcelona (Spain)
0 4 8
Kilomètres
Cardedeu
Garriga, La
Sitges
Caldes de Montbui
Manresa
Barcelona
Sources – Base map: Bartholomews 1995 (Licence INRETS, Paris) ; Urban areas : Géopolis, 1999 ; elaboration: F. Moriconi-Ebrard. Legend : cf map 6
Delta sea-fronts. Map 9 shows the Adriatic coast at the Po Delta (Italy). The altitude of this region, for long swampland, is very low and the relief practically uniformly flat. The coast is low and its shape unstable because of the alluvium brought by the river and the erosion due to coastal currents. It has been deserted by urbanisation, which only begins again to the south along the coast. Roads are numerous and not very orderly, in the image of the patterns of villages and towns that they lead to.
This kind of land-occupation is typical of the delta regions of the Mediterranean (Nile Delta, the region of Rome, Adana…). It is worth remembering that nearly all large Mediterranean rivers end in a delta. Due to the weak amplitude of tides, the sedimentation is a good deal more than the quantities that the tides can remove. Long unhealthy, these areas have mostly been ignored by settlements. On the one hand, they are recent and unstable constructions with the coastline constantly shifting either through erosion or by accumulating sediment, which makes for unfavourable conditions for urban sites. On the other hand, sediment piles up, which causes slow the sinking of the deltas unless the level is compensated for by newly arrived sediment. The weight of building cities has a tendency to amplify this phenomenon, and this natural subsidence is reinforced by the over-use of ground-table water. The few Mediterranean cities on the edge of a delta are seriously threatened in the long-term: Venice, Burg al-Rashid (downstream of Rosette), Ra's all-Bar (downstream of Damitte). The encroachment of mud in water ways makes the sites unsuitable for building ports.
All these conditions are not very favourable to cities, even inland of the great deltas, such as those of the Rhone, the Ebre, the Po or the Ceyhan (near Adana), which

Urbanisation in the Mediterranean Region from 1950 to 1995
Blue Plan - 2001 41
are relatively empty or were highlighted only very late in the long history of the Mediterranean civilisations. The Nile Delta is an exception only in appearance, for only the old regions at the centre of the Delta are very dense. The delta's sides and sea-front only started being improved in the 19th century by British engineers.
Map 9.- A delta sea-front: the coastline of the Po delta (Italy)
Sources – Base map: Bartholomews 1995 (Licence INRETS, Paris) ; Urban areas : Géopolis, 1999 ; elaboration: F. Moriconi-Ebrard. Legend : cf map 6

Urbanisation in the Mediterranean Region from 1950 to 1995
Blue Plan - 2001 42
4 Conclusion 1. The Géopolis data bank makes it possible to establish a panorama of past and
present urbanisation in the Mediterranean countries and in their coastal regions. Comparisons between countries and regions are made possible by making data uniform and harmonised. The 45 years studied are sufficient to make it possible to highlight the major trends of the phenomenon and its points of inflection.
2. This time period is typified in the South and East by a strong growth in the population as a whole and by an even greater growth in the urban population. In the North growth is much weaker, even to the point of becoming negative towards the end of the period.
On the cusp between the 80s and 90s a shift in the relative total and urban population weight was observed from the North to the South and East of the Basin.
In the long-term the permanence of the Mediterranean Basin resides in the city, the initial forms of which appeared in the Near East and which is now undergoing mutations of a quantitative and qualitative order. The phenomenon is being followed in the permanence of the dense network of small cities and in the present transformation of the large cities into metropolises.
3. The Mediterranean coastal regions of the rim countries are twice as densely populated as the countries as a whole. They are also more urbanised and are typified by very sharp contrasts in terms of population, urbanisation and relief, the latter more or less explaining this. Among the growth factors of the urban phenomenon, the following have been identified: the crises occurring during this period, demographic growth in itself, a certain heliotropism, rural depopulation (the major cause of urbanisation in certain countries and which is worth better measuring and analysing) and finally the major trend of tourism development, itself the origin of various forms of urbanisation.
And lastly, four forms of urbanisation have been identified in the immediate vicinity of coastlines, forms that are found in all Mediterranean coastal regions.
4. Insofar as the city is already and will in all probability be (cf. Courbage and Attané), the environment in which lives and will live the majority of Mediterranean inhabitants, it is advisable to include it in a continuing programme of observation and analysis so as to better understand the mechanisms of evolution as well as the demands in terms of the standards of living, economic development and the protection of natural resources.

Urbanisation in the Mediterranean Region from 1950 to 1995
Blue Plan - 2001 43
Bibliography
Attané I., Courbage Y. (2001). La démographie en Méditerranée, situation et projections Les Fascicules du Plan Bleu n°11, Paris, Economica.
Bairoch P. (1985). De Jericho à Mexico. Villes et économies dans l’Histoire. Gallimard, Paris. 706 p.
Besançon J. (1957). L’homme et le Nil. Gallimard. 396 p.
Côte M. (1988). L’Algérie ou l’espace retourné
Courbage Y. (1995). Les incertitudes de la fécondité égyptienne. Population. INED
Denis E. & Moriconi-Ebrard F. (1995). Dynamiques spatiales de la population égyptienne : les tendances nouvelles. Méditerranée,n° 1-2. pp.91-99
Denis E. (1998). Les échelles de la densification. Le peuplement de l’Egypte de 1897 à 1996. Géographie Sociale de l’Egypte. Revue de Géographie de Lyon, vol.73, n°3
El Kadi G. (1996). La recherche urbaine en Egypte : un état de la question. Pratiques urbaines, n°13. Interurba
Fanchette S. (1990). Densités de population et urbanisation de l’espace rural : le cas du delta du Nil. Tiers-Monde, tome 31, n° 121. pp. 29-56
INSEE (1997). Tableaux de l’Economie Française 1997-1998
Leresche J.P. & Joye D. (1993). Métropolisation : de l’urbain au politique. Espaces-Temps, 51-52. pp. 6-17
Meyer G. (1994). Land Reclamation and Development of New Agricultural Land in Égypte. Applied Geography & Development, n°44. pp. 59-71
Moriconi-Ebrard F. (1993). L’urbanisation du Monde depuis 1950. Economica-Anthropos, Paris
Moriconi-Ebrard F. (1994). Géopolis, pour comparer les villes du Monde. Economica-Anthropos, Paris
Moriconi-Ebrard F. (1996). De la crise du centralisme au triomphe des marges. Égypte-Monde Arabe, n° 22. CEDEJ. pp.11-42
Raymond A. (1993). Le Caire. Librairie Arthème Fayard, Paris. 428 p.
Sassen S. (1996). La ville globale. Descartes et Cie, Paris
Voiron-Canicio C. (1999). Urbanisation et littoralisation sur les rives de la Méditerranée. Les Méditerranées dans le Monde. Artois Presse Université. pp.103-112

Urbanisation in the Mediterranean Region from 1950 to 1995
Blue Plan - 2001 44
Urbanisation in the Mediterranean Region from 1950 to 1995
Blue Plan - 2001 45
Blue Plan Publications • Le Plan Bleu. Avenirs du Bassin Méditerranéen Futures for the Mediterranean Basin. The Blue Plan Michel Grenon and Michel Batisse French ed.: Economica, Paris, 1989 English ed.: Oxford University Press, 1989 Spanish ed.: MOPU, Madrid, 1990 Arabic ed.: Edifra, Paris, 1991 Turkish ed.: Çevre Bakanligi, Ankara, 1993
• L’eau en région méditerranéenne. Situations, perspectives et stratégies pour une gestion durable de la ressource
Water in the Mediterranean Region. Situations, perspectives and strategies for sustainable water resources management Mohamed Benblidia, Jean Margat and Domitille Vallée Bilingual document (French-English) prepared for the Euro-Mediterranean Conference on Water Management, Marseille, 25-26 novembre 1996 Plan Bleu, Sophia Antipolis, 1997 • Les indicateurs d’économie de l’eau : ressources et
utilisations Plan Bleu, Observatoire du Sahara et du Sahel, Paris, 1996 • Vision méditerranéenne sur l’eau, la population et
l’environnement au XXI ème siècle Mediterranean vision on water, population and the environment for the 21st century Jean Margat et Domitille Vallée Document élaboré dans le cadre de la vision mondiale sur l’eau - Plan Bleu, Sophia Antipolis, 2000 • 130 indicateurs pour le développement durable en
Méditerranée 130 indicators for the sustainable development in Mediterranean region Plan Bleu, Sophia Antipolis, 2000
Les Fascicules du Plan Bleu Series edited by Michel Batisse. Ed. Economica, Paris 1- Pêche et aquaculture en Méditerranée. Etat actuel
et perspectives. Daniel Charbonnier et al., 1990
2- Les forêts méditerranéennes. Enjeux et perspectives. Henri Marchand et al., 1990
3- Conservation des écosystèmes méditerranéens. Enjeux et prospective. François Ramade et al., nouvelle édition 1997
4- Industrie et environnement en Méditerranée. Evolution et perspectives. Jacques Giri et al., 1991
5- Les îles en Méditerranée. Enjeux et perspectives. Louis Brigand et al., 1992
6- L’eau dans le Bassin méditerranéen. Situation et prospective. Jean Margat et al., 1992
7- Energie et environnement en Méditerranée. Enjeux et prospective. Michel Grenon et al., 1993
8- Tourisme et environnement en Méditerranée. Enjeux et prospective. Robert Lanquar et al., 1995
9- Transports et environnement en Méditerranée. Enjeux et prospective. Christian Reynaud et al., 1996
10- Les risques naturels en Méditerranée. Situation et perspectives. Adelin Villevielle et al., 1997
11- La démographie en Méditerranée. Situation et projections. Isabelle Attané ,Youssef Courbage, 2001
« Mediterranean Country Profiles » series Plan Bleu, Sophia Antipolis
• "Institutions - Environment - Development"
- Albania, Turkey, Tunisie, Maroc . 1995
- Egypt. 1996 - Algéria. 1998 (French, English)
• New series « Environment and Sustainable Development Issues and Policies "
- Lebanon . 1999 (French, English)
- Tunisia. French, 2000 –English, 2001
MAP Technical Reports Series Mediterranean Action Plan, Athens E-mail: [email protected] Web site: www.unepmap.org Fax: + 30 1 725 31 96
• Actes du séminaire débat sur la prospective méditerranéenne. 19-21 Octobre 1992
MAP Technical Reports Series n°88, 1994
• Iskenderun Bay Project :
- Vol. I : Environmental Management within the context of Environment-Development MAP Technical Reports Series n°89, 1994
- Vol. II : Systemic and Prospective Analysis MAP Technical Report Series n°90, 1994
• Une contribution de l’écologie à la prospective des régions côtières de la Méditerranée. Problèmes et acquis. S.I. Ghabbour. MAP Technical Reports Series n°91, 1994
• Méthodes et outils pour les études systémiques et prospectives en Méditerranée. MAP Technical Reports Series n°115, 1996
• Rapport de l'atelier sur le tourisme et le développement durable en Méditerranée. Antalya, Turkey, 17-19 September 1998.
(texts in French or in English) MAP Technical Reports Series n° 126, 1999
• Actes du séminaire « La prospective territoriale en Méditerranée et l’approche par acteurs". Sophia Antipolis (France), 7-9 novembre 1996.
(texts in French or in English) MAP Technical Reports Series n° 127, 1999

PNUE
When the Mediterranean countries, concerned by the degradation of their natural link and common heritage -the sea, signed the Barcelona Convention and launched their Mediterranean Action Plan (MAP), they wished this Plan to include a specific component for exploring possible future open to the Mediterranean Basin, so as to support decisions in favour of a sustained socio-economic development without harming the environment.
This was the origin of the Blue Plan (created in 1977), one of the six MAP regional activities centres and a prospective exercise leading to proposals for action, the first scenarios of which, published in 1989, aroused keen interest in the Mediterranean region and at the 1992 Rio Conference.
The Blue Plan work programme includes a general mission of observation, assessment and exploration of the evolving relationships between populations, resources, the environment and development, as well as analytical studies and syntheses on the different riparian countries and on priority thematic issues for the whole Mediterranean Basin. The Blue Plan also participates in MAP's coastal area management programmes and acts as one of the main support centres of the Mediterranean Commission for Sustainable Development (MCSD), created in 1996.
The goal of the new series of the "Blue Plan Notebooks", complementary to its "Fascicules” series (published by Economica, Paris) and to its "Country Profiles" series, is to supply basic synthesized information in English and French on the major issues or tools and methods about the sustainable development of the Mediterranean region.
Urbanisation is at present one of the spectacular phenomena at work in the Mediterranean region and at the heart of the changes and new economic, social and environmental challenges. The Géopolis data bank makes it possible to measure and compare changes in the various countries. The comments accompanying the tables, maps and graphs made by the Blue Plan are by François Moriconi-Ebrard, designer and creator of this data bank.


![Urbanisation 06.06.09[1]](https://img.pdfslide.net/doc/110x75/55a11bbe1a28abc87f8b45de/urbanisation-0606091.jpg)