Embed Size (px)
Citation preview
Global Journal of Management, Social Sciences and Humanities 379
Vol 7 (2) April-June, 2021, pp. 379-407.
ISSN 2520-7113 (Print), ISSN 2520-7121 (Online)
www.gjmsweb.com. Email:[email protected].
Impact Factor value = 4.739 (SJIF).
DOI: https://orcid.org/0000-0001-5767-6229
_______________________________________________________
URBANIZATION AND DEPLETION OF NATURAL RESOURCES: A CASE STUDY OF PAKISTAN.
Prof. Dr. Abdul Ghafoor Awan1, Humaira Liaqat2
ABSTRACT-The aim of this research paper is to examine the effects of
depletion of natural resource including both renewable and nonrenewable on
economic growth due to growing urbanization in Pakistan. For this purpose,
we collected data time series data for the period of 20 years (1998-2018) from
different sources. Depletion of Natural resources was taken as dependent
variable while urbanization, water, air pollution, depletion of fertile land,
migration from Rural to urban areas and Per capita income were taken as
independent variables. Correlation analysis, ADF test, and Ordinary Least
square (OLS) method were used to analyze data. The results of this study
reveal that high population growth rate as well as urbanization have
significant effect on depletion of natural resources in Pakistan. We also found
that more than one third of natural resources of Pakistan i.e. water, air, land,
soil, etc, have been contaminated or exhausted due to these two factors.
Keywords: Natural resource depletion, Climate change, Population growth rate,
Per Capita Income.
Type of study: Original Research paper
Paper received: 10.01.2021
Paper accepted: 04.03.2021
Online published: 01.04.2021. ______________________________________________________________
1. Dean, Faculty of Management and Social Sciences, Institute of Southern Punjab,
Multan-Pakistan. [email protected]. Cell # +0923136015051.
2. M.Phil Scholar, Department of Economics, Institute of Southern Punjab, Multan-
Pakistan. humairaliaqat87@gmail

380 Abdul Ghafoor Awan, Humaira Liaqat
_______________________________________________________
1.INTRODUCTION:
1.1. Background of study:
The combination of the urbanization process with economic
development has changed society and culture beyond the landscape and the
natural environment. The biggest challenge facing by the most of countries
today is to "maintain" economic growth rates and minimize its impact on
development and environment. With the transformation from agriculture to
industry, there was a large-scale urbanization. In this process, urban areas
generally grow twice as fast as total population growth. In 1950,
approximately 29% of the world's population was in urban areas. According
to (Rashid et al., 2018) in 1990, this number was increased to 43%, while in
2030 it will likely to increase by 61%. Urbanization is one of the most
significant segment patterns of the 21st century and has grown especially
rapidly in low-income nations (Parkinson and Tayler, 2003). The intensive use
of natural resources to support the urban economy includes the excessive
energy resources (including firewood), the exploitation of quarries and the
large-scale excavation of sand, gravel and construction and overuse of water.
All of this leads to the deterioration of natural support systems and the
irreversible loss of important ecosystem functions such as the water cycle, the
carbon cycle and biodiversity, as well as conflicts with the use of this limited
resources in areas. Other impacts may be felt later, such as river pollution,
human health impacts, and long-term air pollution from vegetation and soil
erosion (Henderson et al., 2009).
In 1998, the share of cities with more than one million inhabitants in
the total population was 50%. Today Pakistan is urbanizing at a rate of 3% per
year. Urbanization in Pakistan has created horizontal development that covers

Urbanization and depletion of Natural Resources: A case study of Pakistan 381
_______________________________________________________
fertile land, and as a result agriculture output is exhausted. The most recent
insights from the World Health Organization (WHO) show that of the 10
dirtiest urban cities in the world are five and three among them are Pakistani
cities such as Karachi, Peshawar and Rawalpindi. The major causes of
urbanization are the lack of employment opportunities, adequate rural
education infrastructure, lack of communication infrastructure, medical
facilities, business opportunities and conflicts. In all cases, poverty is the
major cause (Braithwaite and Mont, 2009). According to World Development
Indicators (Alkire and Santos, 2014), 60.2% of the population of the Pakistani
population lives below the poverty line and their income is less than $ 2 a
day, while 21% of the population lives with less than $ 1.25 per day income.
1.2 Main Research problem:
The problem of this research study is to study the impact of
urbanization and depletion of natural resources on economic growth of
Pakistan during 1998-2018.
1.3 Objectives of study:
● To study the causes of urbanization in Pakistan.
● To explore the impacts of urbanization on natural resources.
● To analyze the depletion of natural resources in Pakistan.
● To identify the impacts of depletion of resources on economy of Pakistan.
2. REVIEW OF LITERATTURE:
The literature review is based on previous studies conducted in
different countries as well as in Pakistan. It is briefly analyzed in the following.

382 Abdul Ghafoor Awan, Humaira Liaqat
_______________________________________________________
Ali and Khan (2013) said that livestock growth could help ensure food
security for rural households. Although men can leave their body space to
work elsewhere, they can be more mobile, while women may not move in the
same way. This part can also be explained by the child's upbringing, one of
the parents must stay at home. In this case, livestock gains can help women
reduce short-term economic shocks. In addition, low and middle income
migrant groups cannot compete for scarce urban housing. Outdated building
regulations have hindered the growth of urban housing. These rules also forced
the prices of real estate to rise artificially. The rental laws have led to predators
and the development of groups of predators, and for these reasons, landlords
are now concerned about the provision of rental housing. This particularly
affects the poor, as they are excluded from the city due to high rent. The lack
of microfinance and mortgages prevent the ability of low-income groups to
participate in housing and business, which in turn results in the expansion of
slums. This exclusion has led to social disadvantages and it is easy to see that
crime rates have increased in Karachi, Faisalabad, Peshawar, Multan and other
cities of Pakistan.
Shah et al (2008) examined the trend of city development and
urbanization in Lahore, as well as air, water pollution and changes in forest
resources in Lahore. The basic goal of this study was to study whether our
environmental assets (drinking water, clean air, and trees) in Lahore are
declining, expanding, or staying at the same level. Rapid urbanization is
associated with natural problems such as pollution, waste management,
blockades and subtle environmental irregularities. Air pollution has always
been a problem in Lahore. Air pollution in Lahore accounts for 2% of
everything. As the report shows, 22,700 people have been displaced due to
Urbanization and depletion of Natural Resources: A case study of Pakistan 383
_______________________________________________________
increasing urban pollution. Poor air quality in Lahore is caused by vehicle and
business emissions. With the development of the civilian population,
companies based in Lahore have moved to adjoining areas of Lahore. Lahore
needs drinking water. Many people in Lahore have little access to drinking
water. Water pollution is mainly due to poor sanitation and solid waste in
various areas of Lahore.
Khattak et al (2011) argued that Pakistan's atmosphere is starting to
change because of worldwide environmental change. Investigations of
chronicled temperature informational indexes show that there is a huge
warming pattern in Pakistan, with normal yearly temperatures rising by 0.6 °
C somewhere in the range of 1900 and 1999 (Walter et al., 2009). Local
contrasts have been watched and Northern Pakistan has seen a worldwide
temperature alteration pattern in the course of recent years as parts of the lower
Indus bowl have cooled. Simultaneously, the temperature in the upper areas
of the Indus shows a contrary pattern during winter and summer. The normal
and most extreme winter temperatures show a factually critical increment (0.1
to 0.55 ° C like clockwork). Normal and least temperatures show constant
cooling. Winter warming is restricted to low-lying regions, while higher
heights have a more grounded cooling impact in summer.
Hassan, et al (2019) studied the impact of globalization and Natural
Resources on economic growth of Pakistan during the period of 1970 to 2014.
globalization is a dynamic force behind vibrant economies around the world.
Based on an auto-regressive distributive lag (ARDL) model, the researchers
conclude that globalization boosts economic growth in Pakistan. Natural

384 Abdul Ghafoor Awan, Humaira Liaqat
_______________________________________________________
resources also play an important role in economic growth. Countries should
emphasize security, increase exports, encourage technological progress, and
increase its intellectual management capacity for Policy implications. They
suggested that with the help of globalization, the improvement of the use of
the natural resource can be achieved by providing expertise and skills and
encouraging the use of natural resources for the country’s raw materials and
energy-saving techniques. The efficiency of natural resources would be
improved by globalization process.
Tareen et al (2018) stated that Pakistan has many natural energy
resources but it is facing worst energy crisis of its history. They found that
Pakistan has prodigious potential of energy like wind, solar, micro-hydel, fuel
cell, tidal, biomass and bio gas. Sindh has great potential for wind energy.
Pakistan has great solar potential and so it has 3000 hours of sunshine a year.
They concluded that Pakistan possesses abundant hydropower resources,
which are the most environmental friendly and cheapest source of energy. The
shortage of electricity has resulted in load shedding during the summer season,
costing the economy billions of rupees. In light of these facts, hydropower is
the best solution to Pakistan's energy crisis.
3.RESEARCH METHODOLOGY:
This is a quantitative study in which quantitative methods have been
used. In this study, some key economic indicators of Pakistan s' economy are
described which provide the results of this study. The researcher has used
secondary data in this study. The data has been collected from different
sources such as Pakistan Economic survey, State Bank of Pakistan, World
Bank, International Monetary Fund and Asian Development Bank. Time series
data for the period of 20-years from 1998-2018 has been used in this study

Urbanization and depletion of Natural Resources: A case study of Pakistan 385
_______________________________________________________
3.1 Type of Data:
Time series data over the time period 1998 to 2018 has been used for
analysis. In this research we will find out the impact of urbanization on natural
resources in Pakistan.
3.2. Sampling period:
The sampling period of the study is spread over 20 years from 1998 to
2018.
3.3. Selected Variables:
Natural resources were taken as dependent variable while per capita
income, population growth rate, depletion of soil fertility, air pollution, water
quality and urbanization are taken as independent variables.
3.4. Specification of Model:
The econometric model of this study is engraved in the following
general form:
Y = b0 + b1U1 + b2W2 + b3AP3 + b4DFL4 + b5M5 + b6P6 + e
Where:
Y= Depletion of Natural Resources (dependent variable)
B0 = Constant Term (Intercept)
U1 = Urbanization (independent variable)
W2 = Water Quality (independent variable)
AP3 = Air Pollution (independent variable)
DFL4 = Depletion of Fertility Land (independent variable)
M5 = Migration from Rural to Urban areas (independent variable)
P6 = Per Capita Income (independent variable)

386 Abdul Ghafoor Awan, Humaira Liaqat
_______________________________________________________
e = error term
3.5 Conceptual Model:
The conceptual model of this study is given in Figure 1;
Independent Variables
Figure1: Conceptual Model
3.6 Hypothesis of the study:
The hypothesis of this study are given below: -
H0: There is a negative impact of urbanization and high population growth
rate on of natural resources in Pakistan.
H1: There is a positive impact of urbanization and high population growth rate
on natural resources in Pakistan.
4. DATA ANALYSIS:
4.1 Descriptive Analysis:
Depletion of Natural Resources
Urbanization
Water pollution
Air pollution
Depletion of fertile Land
Migration from Rural to urban Areas
Per capita income
Dependent Variable

Urbanization and depletion of Natural Resources: A case study of Pakistan 387
_______________________________________________________
4.1.1 Urbanization:
Table1: Annual Population Growth Rate of Major Cities of Pakistan 1998-2018
Sr.
No. Name of City
Population Average Annual
Growth Rate 1998 2018
1. KARACHI 9,339,023 15,400,000 3.49
2. LAHORE 5,143,495 11,738,000 3.32
3. FAISALABAD 2,008,861 3,311,000 3.58
4. RAWALPINDI 1,409,768 2,156,000 3.43
5. MULTAN 1,197,384 1,931,000 2.93
6. HYDERABAD 1,166,894 1,782,000 2.62
7. GUJRANWALA 1,132,509 2,110,000 3.79
8. PESHAWAR 982,816 2,065,000 3.29
9. QUETTA 565,137 1,042,000 4.09
10. ISLAMABAD 529,180 1,061,000 5.76
Source: Pakistan Bureau of Statistics, 2019
The data in table 1 shows that among the major cities of Pakistan, Islamabad
is top of the list with rapidly growing urbanization by average annual growth
rate 5.76% while Hyderabad is the lowest city by the means of population
annual growth rate 2.62%.

388 Abdul Ghafoor Awan, Humaira Liaqat
_______________________________________________________
Table 2 : Population of Pakistan (Province-wise) and its Urban Share
Source: Pakistan Bureau of Statistics, 2019
Table 2 shows that among four provinces of Pakistan, Sindh is top of the list
with rapidly growing urbanization by average annual growth rate of 52.02%
while FATA has the lowest in urbanization only by 2.84%.
Table 3: Urban and Rural Share in Population of Pakistan
Year Urban Rural
1998 32.5% 67.5%
2018 38.5% 61.5%
Future Estimate
2051 50.1% 49.9%
Source: Environmental Impact of Rapid Urbanization in Pakistan, 2018
Table 3 shows that urban and rural population growth rate in Pakistan. The
ratio of rural population in 1998 was 67.5 percent which was decreased to 61.5
percent in 2018 while urban population ration in 1998 was 32.5 percent which
was increased to 38.5 percent in 2018. Urban population was increased six
Urbanization and depletion of Natural Resources: A case study of Pakistan 389
_______________________________________________________
percent during the period of 20 years. It means majority of the population is
still living in the rural areas of Pakistan.
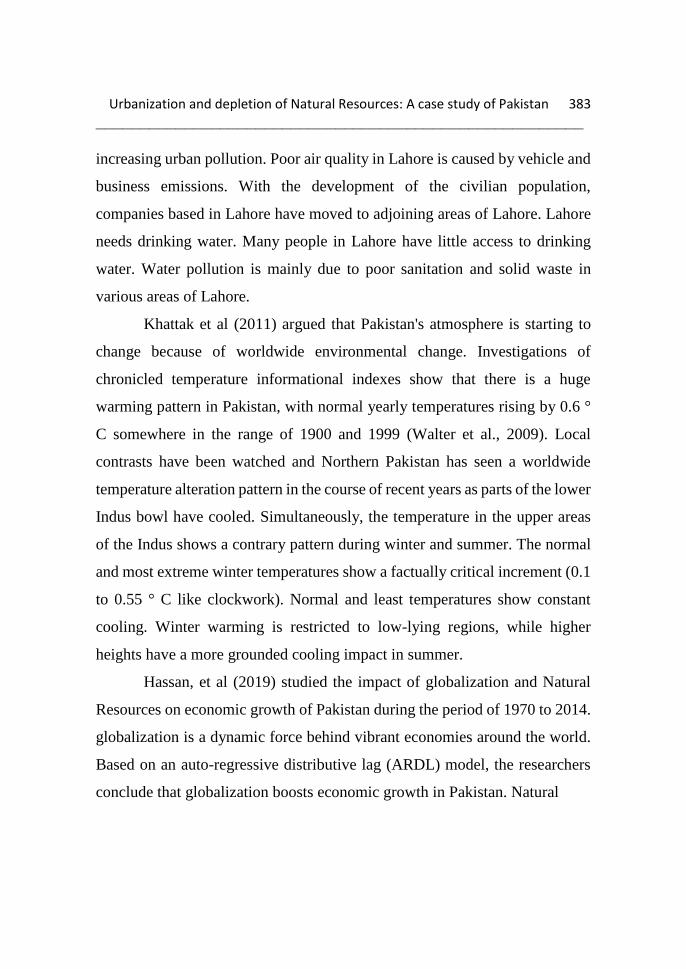
4.1.2 Drinking water:
The resources of drinking water in Pakistan is shown in Figure 2:
Figure 1: Source of Drinking Water
Source: National Nutritional Survey -2018
The data in figure 2 shows that 50% of Pakistanis use piped water, 32% Tube
Well and 18% get drinking water through other sources.
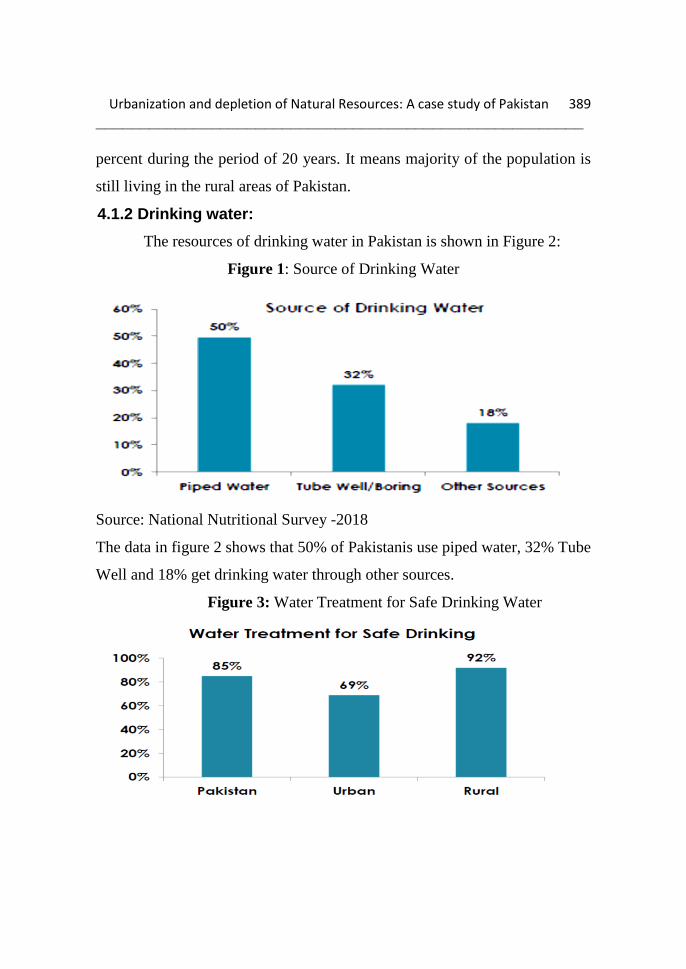
Figure 3: Water Treatment for Safe Drinking Water

390 Abdul Ghafoor Awan, Humaira Liaqat
_______________________________________________________
The Figure 3 shows that the use of tap water has improved: in 2018 and 41%
of households are using tap water. Most of population use contaminated water
because it has no resources to treat the water. However, various methods of
water treatment, such as cooking (61%), filtration through a filter cloth (10%)
and other methods (32%) are used for cleaning water.
Table 4: Groundwater quality data of some cities of Pakistan
City Name Water pH WHO Standard
1998 2018 Min Max
Lahore 7.4–7.6 7.8–8.8 6.51 8.86
Faisalabad 8.0–8.2 8.8–9.8 6.51 8.86
Peshawar 7.3–7.6 8.5–9.8 6.51 8.86
Multan 7.3–7.8 8.5–9.1 6.51 8.86
Jhelum 7.2–8.1 8.4–9.3 6.51 8.86
Rahim Yar Khan 7.1–7.3 8.3–8.5 6.51 8.86
Mardan 7.0–7.2 8.2–9.4 6.51 8.86
Kohat 7.2–7.5 8.4–9.7 6.51 8.86
Rawalpindi 6.7–8.1 8.0–9.3 6.51 8.86
Quetta 7.4–8.4 8.6–9.6 6.51 8.86
Dera Ghazi Khan 7.5–8.1 8.7–9.0 6.51 8.86
Dera Ismail Khan 7.2–7.3 8.4–8.5 6.51 8.86
Khushab 7.2–7.4 8.4–8.6 6.51 8.86
Hyderabad 7.2–8.0 8.1–9.2 6.51 8.86
Karachi 7.1–7.4 8.3–9.6 6.51 8.86
Islamabad 7.1–8.2 8.0–9.3 6.51 8.86
Source: Eastern Mediterranean Health Journal, Vol. 11, Nos 5/6, 2019

Urbanization and depletion of Natural Resources: A case study of Pakistan 391
_______________________________________________________
Table 4 shows that the concentration range for different quality parameters in
groundwater is wide at different locations and often exceeds the
recommendations of the WHO. Eastern Mediterranean Health recently
conducted a detailed survey of groundwater in 14 major regions of Punjab. In
this study, 280 water samples were taken from existing wells, pipeline wells,
manual and electric pumps. The water depth in the samples taken varies
between 10 and 150 meters. Since 180 samples were contaminated with
bacteria, a very poor bacteriological quality of the groundwater was found.
4.1.3 Air Pollution:
Table 5: Air Pollution from Various Sectors of economy (in 1000 tons)
Sector 1998 2018
CO2 SO2 NOx CO2 SO2 NOx
Industry 51429 882 NA 10435 982 NA
Transport 15987 95 NA 22957 105 NA
Power 51062 976 66 72075 996 76
Domestic 35098 30 NA 41048 40 NA
Agriculture 6168 30 NA 8367 40 NA
Commercial 4061 15 NA 6485 32 NA
Source: Government of Pakistan / IUCN (2019, P. 82)
Table 5 shows that in the 20 years from 1998 to 2018, air emissions increased
substantially due to expansion of industry, power generation, transportation,
agriculture and domestic wastes. For example, sulfur dioxide has increased on
an average of 23 times in all industries in the past two decades. Similarly,

392 Abdul Ghafoor Awan, Humaira Liaqat
_______________________________________________________
nitrogen oxide has increased 25 times, while carbon dioxide has increased four
times on average in Pakistan.
Table 6: Three Pakistani cities among 10 most polluted cities of the world
Rank City Country
1 Delhi India
2 Patna India
3 Gwalior India
4 Raipur India
5 Karachi Pakistan
6 Peshawar Pakistan
7 Rawalpinidi Pakistan
8 Khoramabad Iran
9 Ahmedabad India
10 Lucknow India
Source:http://tribune.com.pk/story/926245.
4.1.4 Depletion of fertile land:
With the expanding population, the utilization of kindling by family
units can increment by 3% every year. Wood biomass from Pakistan will be
totally expended in the next 10 to 15 years. Deforestation for business
purposes has likewise fundamentally quickened woods exhaustion. Boundless
nibbling of dairy cattle is additionally a genuine danger. Prolific land is the
extent of arable land that is planned for lasting harvests and perpetual fields.
Developed land incorporates land that the FAO characterizes as transitory

Urbanization and depletion of Natural Resources: A case study of Pakistan 393
_______________________________________________________
harvests (two homesteads are tallied once), impermanent prairie for cutting or
touching, land under business sectors or brief vegetables and decrepit land.
Table 7: Fertile land ratio in Pakistan
Year Fertile Area in sq.km Change Value %
2018 375920 1.15 %
2017 371310 1.43 %
2016 368440 1.77 %
2015 362020 -0.14 %
2014 362520 -0.08 %
2013 362800 0.60 %
2012 360630 0.35 %
2011 359360 1.97 %
2010 352420 -0.11 %
2009 352770 -0.10 %
2008 353130 -1.94 %
2007 360130 -0.34 %
2006 361350 0.47 %
2005 359650 0.33 %
2004 354578 1.44 %
2003 364840 -0.12 %
2002 358422 -0.15 %
2001 360485 -1.65 %
2000 353110 -0.44 %
1999 358899 0.43 %
1998 364065 0.37 %
Source: https://knoema.com/atlas/Pakistan/Agricultural-land-area
Table 7 shows the statistics of fertile land ratio in Pakistan from 1998
to 2018. The data reveals that the fertile land ratio, which was overall
364065sqft (0.37%) in 1998, has been changed into 375920sqft (changing
ratio 1.15 %) in 2018. In 2018, agricultural land area in Pakistan was
375920sq. km.

394 Abdul Ghafoor Awan, Humaira Liaqat
_______________________________________________________
Figure 4: Fertile Land Ratio of Pakistan
1998-
2001
2002-
2005
2006-
2009
2010-
2013
2013-
2016
2017-
2018
Table 8: Depletion of Soil Fertility and Negative Nutrient Balances
Province N (kg/ha) P2O5 (kg/ha) K2O (kg/ha)
1998 2018 1998 2018 1998 2018
Punjab -19.1 -8.5 -10.4 -10.6 -23.7 -27.4
Sindh -5.1 -7.1 -8.4 -11.6 -7.8 -17.5
KPK -9.5 -10.6 -8.5 -10.6 -20.8 -29.4
Baluchistan -21.5 27.1 -7.5 -11.5 -14.1 -25.5
Pakistan -15.5 -9.5 -9.7 -10.8 -20.1 -25.7
Source: http://www.eco-web.com/editorial/060715.html
Table 8 shows a nutrient balance for Pakistani soil that reflects serious
mining developments. All provinces have negative nitrogen balances, even
though the Punjab deficits are decreasing. The negative phosphorus balance in

Urbanization and depletion of Natural Resources: A case study of Pakistan 395
_______________________________________________________
Punjab has not changed significantly in the past ten years, but has worsened in
the other three provinces. Punjab had the highest deficit from 1998 to 2018.
The potash balance has deteriorated in the past ten years. Loss of productivity
due to soil degradation is estimated at $ 353 million a year, and pasture
productivity losses are between $9 and $160 million a year. These statistics
show that environmental problems are increasing in Pakistan rapidly.
According to an estimates suggest that the effects of biodiversity deterioration
and loss on productivity and public health account for 3% of GDP per capita.
4.1.5 Migration from rural to urban areas:
Table 9: Rural to Urban Migrants at Provincial Level (1998-2018)
Source: Author’s tabulation from LFS (1998-2018).
Table 9 shows the relationship between farmers and urban migrants at the
provincial level. It appears that, with the exception of 2007-2009 and 2010-
2012, migration was high from rural to urban areas. However, the distribution
of these immigrants across the provinces at provincial level has led to
surprising results. The number of immigrants in Punjab is higher than in the
1998-2000
2001-2003
2004-2006
2007-2009
2010-2012
2013-2015
2015-2018

396 Abdul Ghafoor Awan, Humaira Liaqat
_______________________________________________________
other provinces. In Sindh, the opposite seems to be the case for men who
dominate the migration from rural to urban areas. In all other years, men
dominate migration from rural to urban areas.
4.1.6 Per capita income:
Table 10: Per capita income by Type of Capital and Country Income Level
Source: Pakistan GDP Per Capita 1960-2020 | MacroTrends

Urbanization and depletion of Natural Resources: A case study of Pakistan 397
_______________________________________________________
The role for migrants is that men move alone and leave behind families in
rural areas. The gender ratio in Punjab has increased over time. From 1998-
2000 to 2017-2018, the proportion of male immigrants increased by 2.58
percentage points. The decline in gender in Sindh and North West Frontier
indicates an increase in the share of women in country-to-city migration. In
Baluchistan, the proportion of male immigrants from rural to urban areas has
increased over time.
4.2 Empirical Analysis:
4.2.1 Econometric Model:
The Econometric Model of this research study is given as under;
Y = b0 + b1U1 + b2W2 + b3AP3 + b4DFL4 + b5M5 + b6P6 + e
Where
Y Depletion of Natural Resources
U1 Urbanization
W2 Water
AP3 Air pollution
DFL4 Depletion of fertile land
M5 Migration from Rural to urban areas
P5 Per capita income
e Error Term

398 Abdul Ghafoor Awan, Humaira Liaqat
_______________________________________________________
Table 11: Results of descriptive Analysis of variables:
Source: Authors’ Calculations drawn through E-Views software
Table 11 provides an overview of the statistics used in this study. The data
shows that the lowest mean of the DNR (deterioration of natural resources) is
0.031548 and the standard deviation is 0.021386, while the maximum mean
of the LDF is 6.99 and the deviation type is 5.91. The mean values of W
(water), AP (air pollution), U (urbanization), M (migration) and P (per capita
income) are 0.09, 0.13, 0.15, 6 99 and 0.15. The DNR is considered a
dependent variable, while the other variables are independent variables. The
least square method is used in this data contains 20 observations and data
collected from 1998 to 2018.
4.2.2 Correlation Analysis:
The results of correlation analysis are shown in Table 12:
DNR W AP DFL U M P
Mean 0.031548
0.091741
0.136364
6.997727
0.154059
6.997727
0.154059
Maximum 0.0896 0.2003 0.2 17.7 0.293 17.7 0.293
Minimum 0.0036 0.031 0.08 1.05 0.0431 1.05 0.0431
Std. Dev. 0.021386
0.042826
0.030945
5.916112
0.055302
5.916112
0.055302
observations
20 20 20 20 20 20 20

Urbanization and depletion of Natural Resources: A case study of Pakistan 399
_______________________________________________________
Table 12: Results of Correlation Analysis
DNR W AP DFL U M P
DNR 1.0000 W -0.0509 1.0000 AP -0.2047 0.4082 1.0000 DFL -0.0123 0.1010 -0.6472 1.0000 U 0.3467 -0.0592 0.1002 -0.0104 1.0000 M -0.0231 0.1011 0.165 -0.5452 0.5415 1.000
0
P 0.3751 -0.0443 0.172 -0.0215 -0.368 -0.0104
1.0000
Source: Authors’ Calculations through E-Views software
The degree of relationship between two existing variables is called correlation.
These relationships can be positive or negative. The results were calculated
through E-View software. The results show that correlates positively with
Depletion of Natural Resources, Water, Air Pollution, Depletion of Fertile
Land, Migration and Per Capita Income are inversely related to Depletion of
Natural Resources.
4.2.3 Multiple Regression:
The results of multiple regression are shown in Table 13.
Dependent Variable: DNR
Method: Least Squares
Sample (adjusted): 1998 2018.

400 Abdul Ghafoor Awan, Humaira Liaqat
_______________________________________________________
Table 13: Results of Multiple Regressions
Variable Coefficient Std. Error t-Statistic Prob.
W 0.08003 0.0752 1.0348 0.0471
AP 0.14875 0.13481 1.05201 0.0150
DFL -0.4447 0.23481 1.8277 0.0000
U -0.0017 0.00148 1.2584 0.0251
M 0.15563 0.06244 1.71481 0.0301
P 0.07001 0.0824 -1.0148 0.3248
R-squared 0.58248
F-statistic 1.24813
Prob(F-
statistic)
0.34351
We have found, from the estimation, that Air Pollution (AP), Water (W) and
migration from rural to urban areas (M) have positive and significant impact
on depletion of natural resources (DNR). It is shown from the values of 1.0348,
1.05201, 1.8277, 1.2584 and 1.71481 respectively on depletion of natural
resources in term of increase Urbanization rate have significant positive
impact on Depletion of Natural Resources (DNR) while only Per capita
income (P) has negative and insignificant impact on Depletion of Natural
Resources (DNR) because its show from t-value -1.0148 and p-value 0.3248.
Therefore, H1 is rejected and the Null Hypothesis H0 is accepted. R-squared
value is 0.58, which means above 50% variation in dependent variable
(depletion of resources) explained by independent variables (Urbanization,
Water, Air pollution, Depletion of fertile land, Migration from Rural to urban
areas, Per capita income).

Urbanization and depletion of Natural Resources: A case study of Pakistan 401
_______________________________________________________
5. FINDINGS OF THE STUDY:
Key findings of this research study are as follows: -
Pakistan is a rapidly urbanizing country. Population growth rate in
large cities is higher than in small and medium-sized cities. Although
urbanization has brought great benefits to the country's economic
development, rapid and uncontrolled urbanization has the following serious
consequences:
Housing shortage leads to development of Katchi Abadis (slum areas).
Education and health problems increase in urban areas.
Traffic and transport problems are increased.
Environmental pollution causes environmental damage in cities.
Rising security problem and deterioration of law and order.
● Pollution is increasing from uncontrolled development, industrialization
and increasing traffic. People, animals and plants are suffering from various
types of diseases.
● Rapid consumption of natural resources (such as water, wood, fossil fuels
and fertile soils), resulting in a lack of these resources for future generations.
● Global warming and climate change due to the increased use of energy and
CFCs and the greenhouse effect from population explosions, the thawing
of glaciers and the depletion of the ozone layer is also causing earthquakes,
wind storms and ocean volcanos in Pakistan.
6.CONCLUSION:
Uncontrolled population growth rate is a major cause of the
deterioration of the urban environment in Pakistan. The development of

402 Abdul Ghafoor Awan, Humaira Liaqat
_______________________________________________________
transport sector and exponential growth rate of vehicles in Pakistan is spoiling
clean environment is producing high rate of emission, resulting in the
spreading of diseases, disabilities and number of deaths among children,
young and old persons. Due to migration from rural to urban areas, slums are
developing where no proper living facilities are available and poor people are
living in very bad and unhygienic conditions. The growth of different
industries such as fertilizers, cement, metals, leather, and textiles around big
cities are causing huge pollution and emission level in certain cities has risen
to dangerous level. It is creating health hazards and people are seriously
suffering from chronicle diseases. The lack of urban planning and government
legislation can lead to the growth of the toxic industry near residential areas.
Improper handling of liquid and solid waste can lead to environmental damage
and ultimately to the transmission of diseases.
7. POLICY RECOMMENDATIONS:
In the light of above discussion, we would like to make to the following
policy recommendations: -
The government should prepare a master plan for urban areas because
provides a coherent policy framework that includes comprehensive
instructions for the future development of the city or region. The entire
area of the city and region should be planned to combine compatible uses
and separate incompatible uses. With good building management and
development, extremely low and high densities can be avoided and
adequate lighting and ventilation levels guaranteed. The compact design,
mixed-use zones and suitable public spaces can reduce average trips to
workplaces, schools and commercial areas, thereby reducing fuel
consumption and pollution.

Urbanization and depletion of Natural Resources: A case study of Pakistan 403
_______________________________________________________
To control air pollution, good traffic management and the provision of
suitable bus systems (bus, light rail or public transport systems for
subways) may be introduced. Traffic control technology, vehicle
inspections and noise and smoke protection may be ensured particularly in
central urban areas
Developing parks and open space systems in cities and planting trees on
streets can help maintain high levels of oxygen in cities. New forests
should be planted regionally and tree planting campaigns should be carried
out in cities. Cities should promote gardening and gardening.
Appropriate infrastructure services such as water, sewage and drainage
systems, electricity and natural gas can be provided properly. Groundwater
and surface water should be used after treatment to prevent the spread of
waterborne diseases. Likewise, the development of appropriate
wastewater treatment systems will reduce groundwater pollution and
improve general environment. All cities must have adequate solid waste
collection and disposal systems.

404 Abdul Ghafoor Awan, Humaira Liaqat
_______________________________________________________
REFERENCES
Alkire, S. and M. E. Santos (2014). Measuring acute poverty in the developing
world: Robustness and scope of the multidimensional poverty index.
World Development 59: 251-274.
Ashraf, S., et al. (2013). Performance evaluation of the dairy farmers regarding
adoption of precise dairy farming practices in the Punjab, Pakistan.
African Journal of Agricultural Research 8 (29): 4074-4080.
Awan, A. G. (2013). Relationship between environment and sustainable
economic development: A theoretical approach to environmental
problems. International Journal of Asian Social Science, 3(3), 741-
761.
Awan, A. G., & Anum, V. (2014). Impact of infrastructure development on
economic growth: A case study of Pakistan. International Journal of
Economics and Sustainable Development, 2(5), 1-15.
Awan, A. G., & Khan, R. E. A. (2014). The Enigma of US Productivity
Slowdown: A Theoretical Analysis. American Journal of Trade and
Policy, 1(1), 7-15.
Awan, Abdul Ghafoor (2014). Environmental challenges to South Asian
Countries, Asian Accounting and Auditing Advancement, Vol 3
(1):84-103.
Awan, Abdul Ghafoor (2015). Analysis of the impact of 2008 financial crisis
on the economic, political and health systems and societies of
advanced countries. Global Journal of Management and Social
Sciences, Vol 1(1):1-16.
Awan, Abdul Ghafoor (2016). Wave of Anti-Globalization and Capitalism
and its impact on world economy, Global Journal of Management

Urbanization and depletion of Natural Resources: A case study of Pakistan 405
_______________________________________________________
and Social Sciences, Volume 2 (4): 1-21
Awan, Abdul Ghafoor (2015). State versus Free Market capitalism: A
comparative Analysis, Journal of Economics and Sustainable
Development Vol 6 (1):166-176
Awan, Abdul Ghafoor (2014). Brazil’s innovative Anti-poverty & inequality
Model, International Journal of Development and Economic
Sustainability, Vol 2 (5): 45-55.
Awan, Abdul Ghafoor (2012). Human capital: Driving Force of Economic
growth in selected Emerging Economies, Global Disclosure of
Economic and Business, Vol 1(1): 09-30
Awan, Abdul Ghafoor (2013). China’s Economic Growth-21st Century
Puzzle, Global Disclosure of Economics and Business, Vol 2 (2):9-20
Awan, Abdul Ghafoor,. Afroz Umair (2019) Impact of Globalization on
Poverty in Pakistan, Global Journal of Management, Social Sciences
and Humanities Vol 5 (4):624-664.
Braithwaite, J. and D. Mont (2009). Disability and poverty: a survey of World
Bank poverty assessments and implications. Alter 3(3): 219-232.
Easterly, W. (2000). The effect of IMF and World Bank programs on poverty.
Available at SSRN 256883.
Hassan, S. T., et al. (2019). Natural resources, globalization, and economic
growth: evidence from Pakistan. Environmental Science and Pollution
Research 26 (15): 15527-15534.
Henderson, J. V., et al. (2009). Urbanization in China: Policy issues and
options. Unpublished manuscript, Brown University.

406 Abdul Ghafoor Awan, Humaira Liaqat
_______________________________________________________
Khattak, M. S., et al. (2011). Hydro-meteorological trends in the upper Indus
River basin in Pakistan. Climate research 46 (2): 103-119.
Parkinson, J. and K. Tayler (2003). Decentralized wastewater management in
peri-urban areas in low-income countries. Environment and
Urbanization 15 (1): 75-90.
Rashid, H., et al. (2018). Urbanization and its effects on water resources: An
exploratory analysis. Asian Journal of Water, Environment and
Pollution 15 (1): 67-74.
Shah, S. A., et al. (2008). Air pollution influence on non-structural
carbohydrates and protein constituents of native flora along the Lahore
Canal. Amino acids: 8.
Tareen, W. U. K., et al. (2018). The prospective non-conventional alternate
and renewable energy sources in Pakistan—A focus on biomass energy
for power generation, transportation, and industrial fuel. Energies
11(9): 2431.
Walter, R., et al. (2009). Effects of temperature on composite resin shrinkage.
Quintessence International 40 (10).
Urbanization and depletion of Natural Resources: A case study of Pakistan 407
_______________________________________________________
CONTRIBUTION OF AUTHORS AND CONFLICT OF INTEREST
This research work was carried out in collaboration between two
authors.
Author 1: Prof. Dr. Abdul Ghafoor Awan did his first Ph.D in Economics
from Islamia University of Bahawalpur-Pakistan and second in Business
Administration from University of Sunderland, U.K. He contributed in this
research paper by way of guiding author first about title selection, data analysis
and statistical techniques. He also edited and gave final shape to the
manuscript. In order to know about his other fields of research please look at
his Web of Science Researcher ID M-9196 2015 or his profile at Google
scholar.
Author 2: Humaira Liaqat has completed her M.Phil in Economics from
Department of Economics, Institute of Southern Punjab. She designed this
study, collected required data and analyzed it. She wrote first draft of this
manuscript under the supervision of author 1. She can be reached at her Email
ID: humairaliaqat87@gmail
Both authors read the manuscript carefully and declared no conflict of
interest with any person or institution.