Embed Size (px)
Citation preview
DRAFT FOR LIMITED CIRCULATION
GREEN GROWTH SERIES REPORT NO. 1 (MAY 2013)
URBANIZATION AND GREEN GROWTH IN AFRICA
(The Economist)
Maria Emilia Freire, Ph. D Senior Advisor, Growth Dialogue
www.growthdialogue.org

Page 2
Page 3
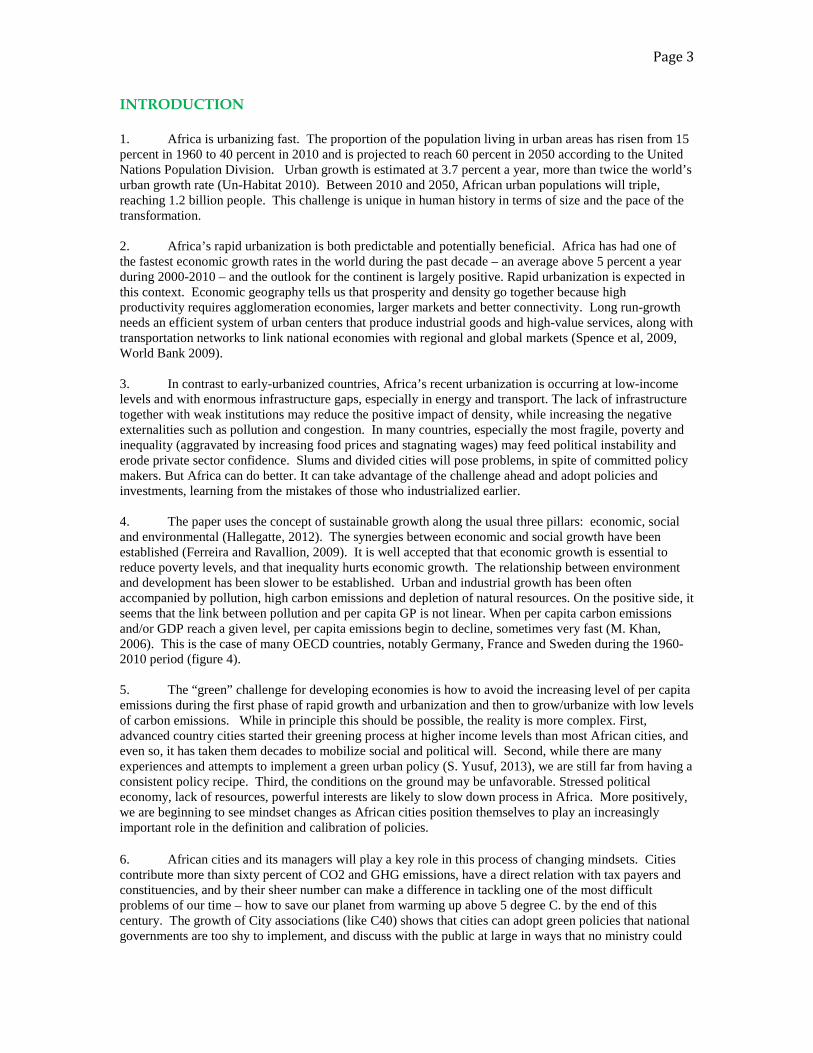
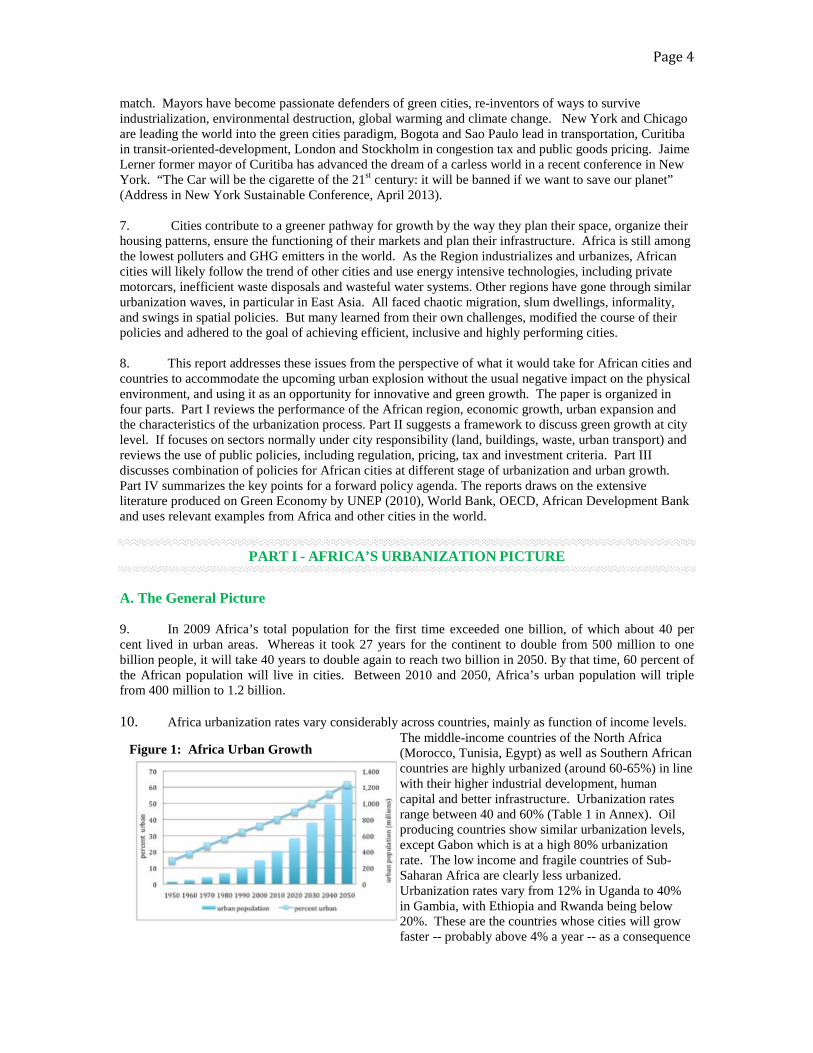
INTRODUCTION 1. Africa is urbanizing fast. The proportion of the population living in urban areas has risen from 15 percent in 1960 to 40 percent in 2010 and is projected to reach 60 percent in 2050 according to the United Nations Population Division. Urban growth is estimated at 3.7 percent a year, more than twice the world’s urban growth rate (Un-Habitat 2010). Between 2010 and 2050, African urban populations will triple, reaching 1.2 billion people. This challenge is unique in human history in terms of size and the pace of the transformation.
2. Africa’s rapid urbanization is both predictable and potentially beneficial. Africa has had one of the fastest economic growth rates in the world during the past decade – an average above 5 percent a year during 2000-2010 – and the outlook for the continent is largely positive. Rapid urbanization is expected in this context. Economic geography tells us that prosperity and density go together because high productivity requires agglomeration economies, larger markets and better connectivity. Long run-growth needs an efficient system of urban centers that produce industrial goods and high-value services, along with transportation networks to link national economies with regional and global markets (Spence et al, 2009, World Bank 2009). 3. In contrast to early-urbanized countries, Africa’s recent urbanization is occurring at low-income levels and with enormous infrastructure gaps, especially in energy and transport. The lack of infrastructure together with weak institutions may reduce the positive impact of density, while increasing the negative externalities such as pollution and congestion. In many countries, especially the most fragile, poverty and inequality (aggravated by increasing food prices and stagnating wages) may feed political instability and erode private sector confidence. Slums and divided cities will pose problems, in spite of committed policy makers. But Africa can do better. It can take advantage of the challenge ahead and adopt policies and investments, learning from the mistakes of those who industrialized earlier. 4. The paper uses the concept of sustainable growth along the usual three pillars: economic, social and environmental (Hallegatte, 2012). The synergies between economic and social growth have been established (Ferreira and Ravallion, 2009). It is well accepted that that economic growth is essential to reduce poverty levels, and that inequality hurts economic growth. The relationship between environment and development has been slower to be established. Urban and industrial growth has been often accompanied by pollution, high carbon emissions and depletion of natural resources. On the positive side, it seems that the link between pollution and per capita GP is not linear. When per capita carbon emissions and/or GDP reach a given level, per capita emissions begin to decline, sometimes very fast (M. Khan, 2006). This is the case of many OECD countries, notably Germany, France and Sweden during the 1960-2010 period (figure 4). 5. The “green” challenge for developing economies is how to avoid the increasing level of per capita emissions during the first phase of rapid growth and urbanization and then to grow/urbanize with low levels of carbon emissions. While in principle this should be possible, the reality is more complex. First, advanced country cities started their greening process at higher income levels than most African cities, and even so, it has taken them decades to mobilize social and political will. Second, while there are many experiences and attempts to implement a green urban policy (S. Yusuf, 2013), we are still far from having a consistent policy recipe. Third, the conditions on the ground may be unfavorable. Stressed political economy, lack of resources, powerful interests are likely to slow down process in Africa. More positively, we are beginning to see mindset changes as African cities position themselves to play an increasingly important role in the definition and calibration of policies. 6. African cities and its managers will play a key role in this process of changing mindsets. Cities contribute more than sixty percent of CO2 and GHG emissions, have a direct relation with tax payers and constituencies, and by their sheer number can make a difference in tackling one of the most difficult problems of our time – how to save our planet from warming up above 5 degree C. by the end of this century. The growth of City associations (like C40) shows that cities can adopt green policies that national governments are too shy to implement, and discuss with the public at large in ways that no ministry could
Page 4
match. Mayors have become passionate defenders of green cities, re-inventors of ways to survive industrialization, environmental destruction, global warming and climate change. New York and Chicago are leading the world into the green cities paradigm, Bogota and Sao Paulo lead in transportation, Curitiba in transit-oriented-development, London and Stockholm in congestion tax and public goods pricing. Jaime Lerner former mayor of Curitiba has advanced the dream of a carless world in a recent conference in New York. “The Car will be the cigarette of the 21st century: it will be banned if we want to save our planet” (Address in New York Sustainable Conference, April 2013). 7. Cities contribute to a greener pathway for growth by the way they plan their space, organize their housing patterns, ensure the functioning of their markets and plan their infrastructure. Africa is still among the lowest polluters and GHG emitters in the world. As the Region industrializes and urbanizes, African cities will likely follow the trend of other cities and use energy intensive technologies, including private motorcars, inefficient waste disposals and wasteful water systems. Other regions have gone through similar urbanization waves, in particular in East Asia. All faced chaotic migration, slum dwellings, informality, and swings in spatial policies. But many learned from their own challenges, modified the course of their policies and adhered to the goal of achieving efficient, inclusive and highly performing cities. 8. This report addresses these issues from the perspective of what it would take for African cities and countries to accommodate the upcoming urban explosion without the usual negative impact on the physical environment, and using it as an opportunity for innovative and green growth. The paper is organized in four parts. Part I reviews the performance of the African region, economic growth, urban expansion and the characteristics of the urbanization process. Part II suggests a framework to discuss green growth at city level. If focuses on sectors normally under city responsibility (land, buildings, waste, urban transport) and reviews the use of public policies, including regulation, pricing, tax and investment criteria. Part III discusses combination of policies for African cities at different stage of urbanization and urban growth. Part IV summarizes the key points for a forward policy agenda. The reports draws on the extensive literature produced on Green Economy by UNEP (2010), World Bank, OECD, African Development Bank and uses relevant examples from Africa and other cities in the world.
PART I - AFRICA’S URBANIZATION PICTURE
A. The General Picture 9. In 2009 Africa’s total population for the first time exceeded one billion, of which about 40 per cent lived in urban areas. Whereas it took 27 years for the continent to double from 500 million to one billion people, it will take 40 years to double again to reach two billion in 2050. By that time, 60 percent of the African population will live in cities. Between 2010 and 2050, Africa’s urban population will triple from 400 million to 1.2 billion. 10. Africa urbanization rates vary considerably across countries, mainly as function of income levels.
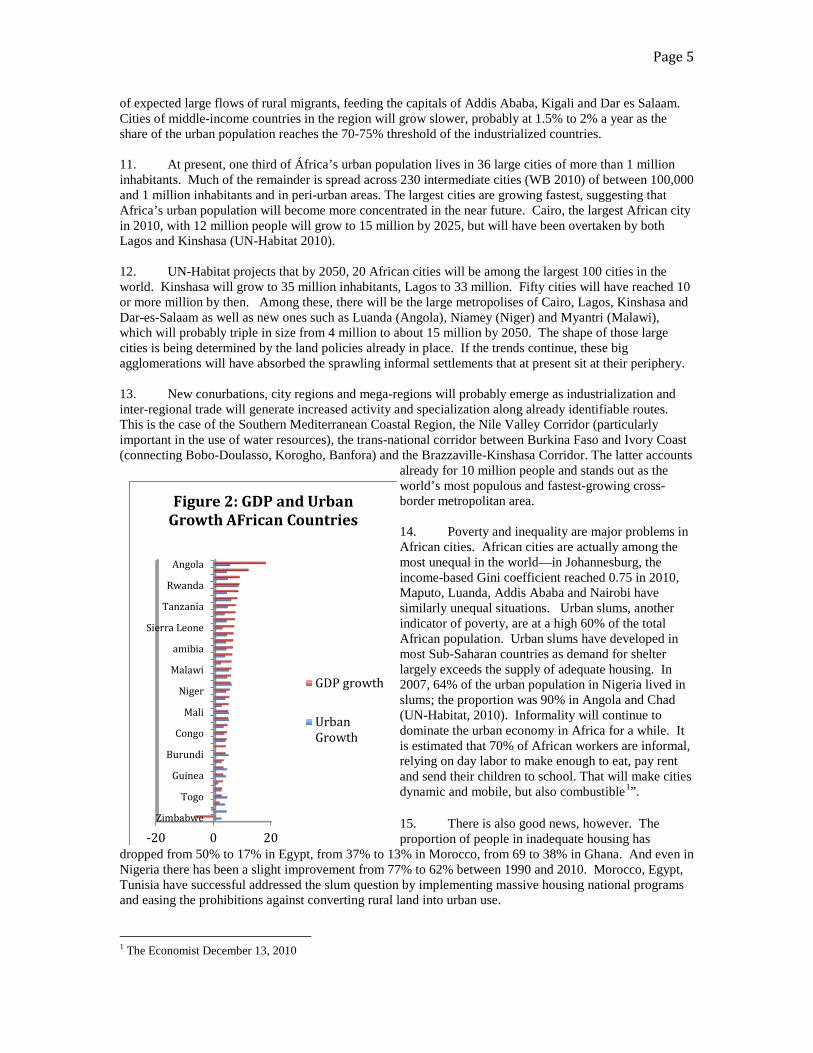
The middle-income countries of the North Africa (Morocco, Tunisia, Egypt) as well as Southern African countries are highly urbanized (around 60-65%) in line with their higher industrial development, human capital and better infrastructure. Urbanization rates range between 40 and 60% (Table 1 in Annex). Oil producing countries show similar urbanization levels, except Gabon which is at a high 80% urbanization rate. The low income and fragile countries of Sub-Saharan Africa are clearly less urbanized. Urbanization rates vary from 12% in Uganda to 40% in Gambia, with Ethiopia and Rwanda being below 20%. These are the countries whose cities will grow faster -- probably above 4% a year -- as a consequence
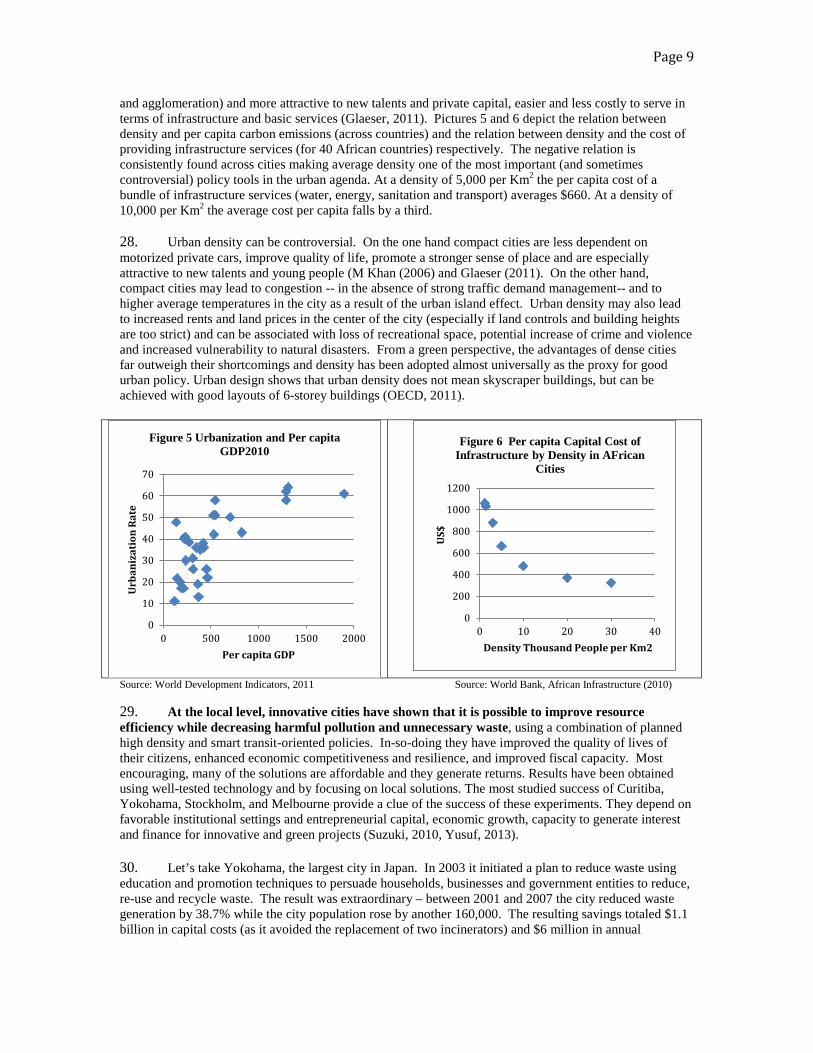
Figure 1: Africa Urban Growth
Page 5
of expected large flows of rural migrants, feeding the capitals of Addis Ababa, Kigali and Dar es Salaam. Cities of middle-income countries in the region will grow slower, probably at 1.5% to 2% a year as the share of the urban population reaches the 70-75% threshold of the industrialized countries. 11. At present, one third of África’s urban population lives in 36 large cities of more than 1 million inhabitants. Much of the remainder is spread across 230 intermediate cities (WB 2010) of between 100,000 and 1 million inhabitants and in peri-urban areas. The largest cities are growing fastest, suggesting that Africa’s urban population will become more concentrated in the near future. Cairo, the largest African city in 2010, with 12 million people will grow to 15 million by 2025, but will have been overtaken by both Lagos and Kinshasa (UN-Habitat 2010). 12. UN-Habitat projects that by 2050, 20 African cities will be among the largest 100 cities in the world. Kinshasa will grow to 35 million inhabitants, Lagos to 33 million. Fifty cities will have reached 10 or more million by then. Among these, there will be the large metropolises of Cairo, Lagos, Kinshasa and Dar-es-Salaam as well as new ones such as Luanda (Angola), Niamey (Niger) and Myantri (Malawi), which will probably triple in size from 4 million to about 15 million by 2050. The shape of those large cities is being determined by the land policies already in place. If the trends continue, these big agglomerations will have absorbed the sprawling informal settlements that at present sit at their periphery. 13. New conurbations, city regions and mega-regions will probably emerge as industrialization and inter-regional trade will generate increased activity and specialization along already identifiable routes. This is the case of the Southern Mediterranean Coastal Region, the Nile Valley Corridor (particularly important in the use of water resources), the trans-national corridor between Burkina Faso and Ivory Coast (connecting Bobo-Doulasso, Korogho, Banfora) and the Brazzaville-Kinshasa Corridor. The latter accounts
already for 10 million people and stands out as the world’s most populous and fastest-growing cross-border metropolitan area. 14. Poverty and inequality are major problems in African cities. African cities are actually among the most unequal in the world—in Johannesburg, the income-based Gini coefficient reached 0.75 in 2010, Maputo, Luanda, Addis Ababa and Nairobi have similarly unequal situations. Urban slums, another indicator of poverty, are at a high 60% of the total African population. Urban slums have developed in most Sub-Saharan countries as demand for shelter largely exceeds the supply of adequate housing. In 2007, 64% of the urban population in Nigeria lived in slums; the proportion was 90% in Angola and Chad (UN-Habitat, 2010). Informality will continue to dominate the urban economy in Africa for a while. It is estimated that 70% of African workers are informal, relying on day labor to make enough to eat, pay rent and send their children to school. That will make cities dynamic and mobile, but also combustible1”. 15. There is also good news, however. The proportion of people in inadequate housing has
dropped from 50% to 17% in Egypt, from 37% to 13% in Morocco, from 69 to 38% in Ghana. And even in Nigeria there has been a slight improvement from 77% to 62% between 1990 and 2010. Morocco, Egypt, Tunisia have successful addressed the slum question by implementing massive housing national programs and easing the prohibitions against converting rural land into urban use. 1 The Economist December 13, 2010
-20 0 20Zimbabwe
Togo
Guinea
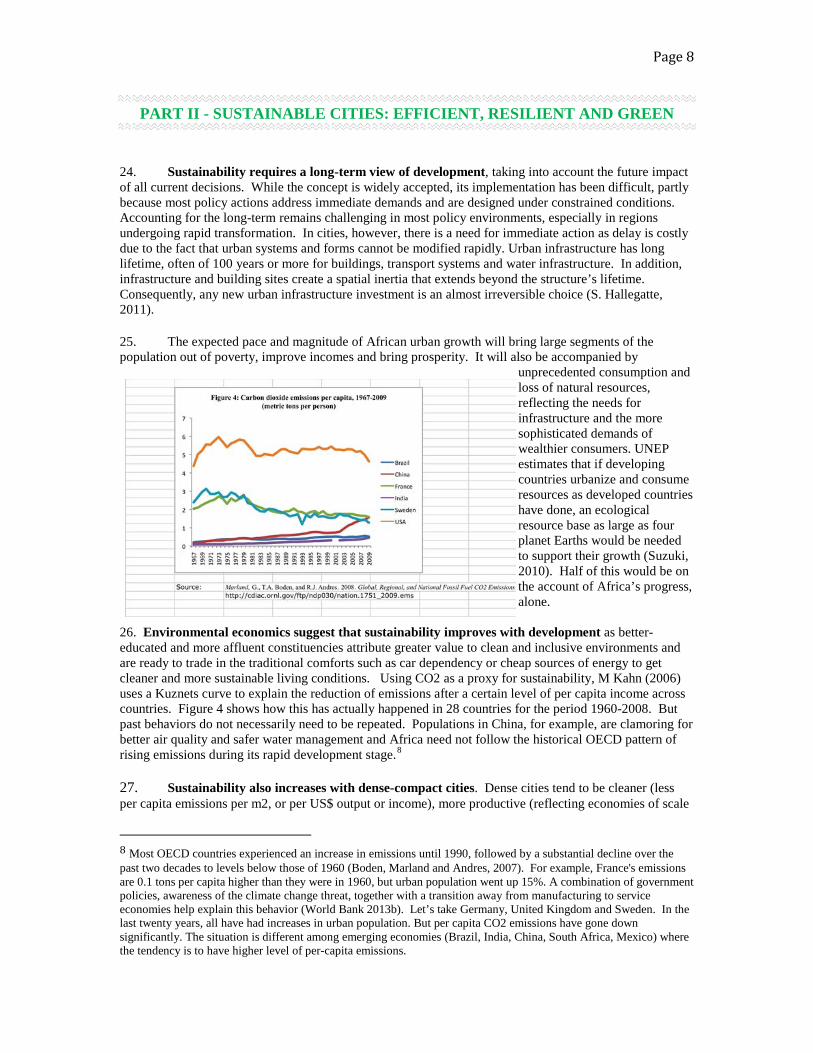
Burundi
Congo
Mali
Niger
Malawi
amibia
Sierra Leone
Tanzania
Rwanda
Angola
Figure 2: GDP and Urban Growth AFrican Countries
GDP growth
UrbanGrowth
Page 6
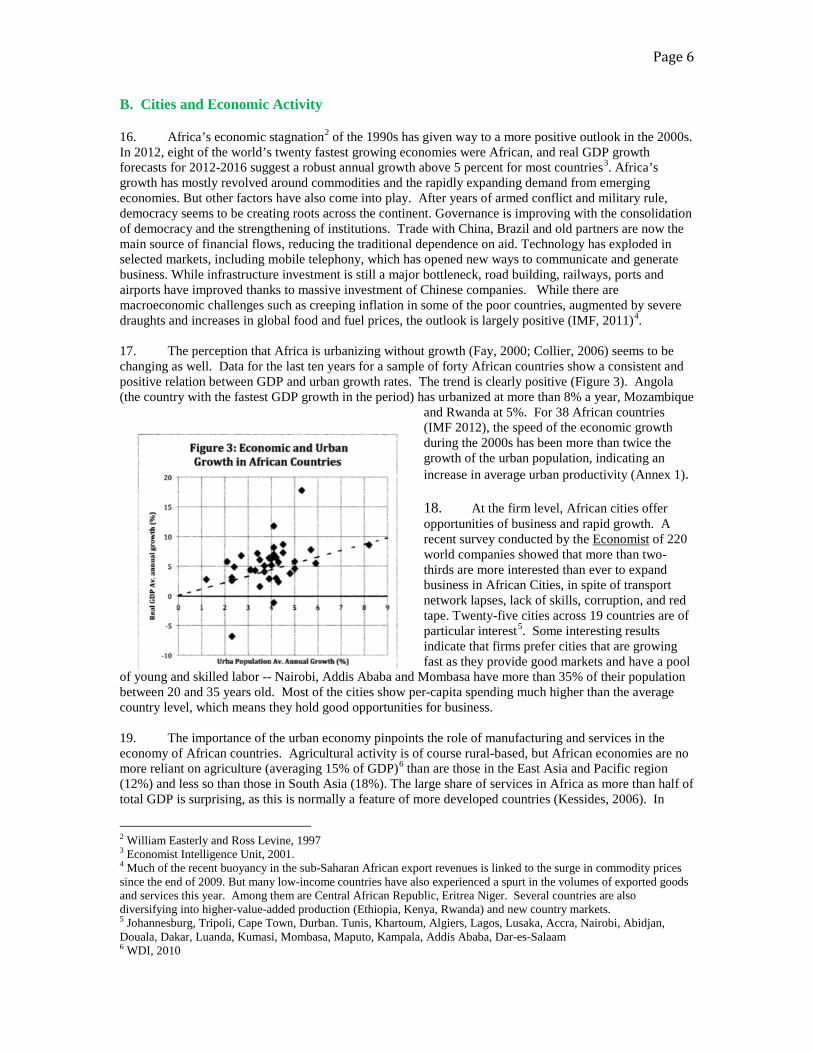
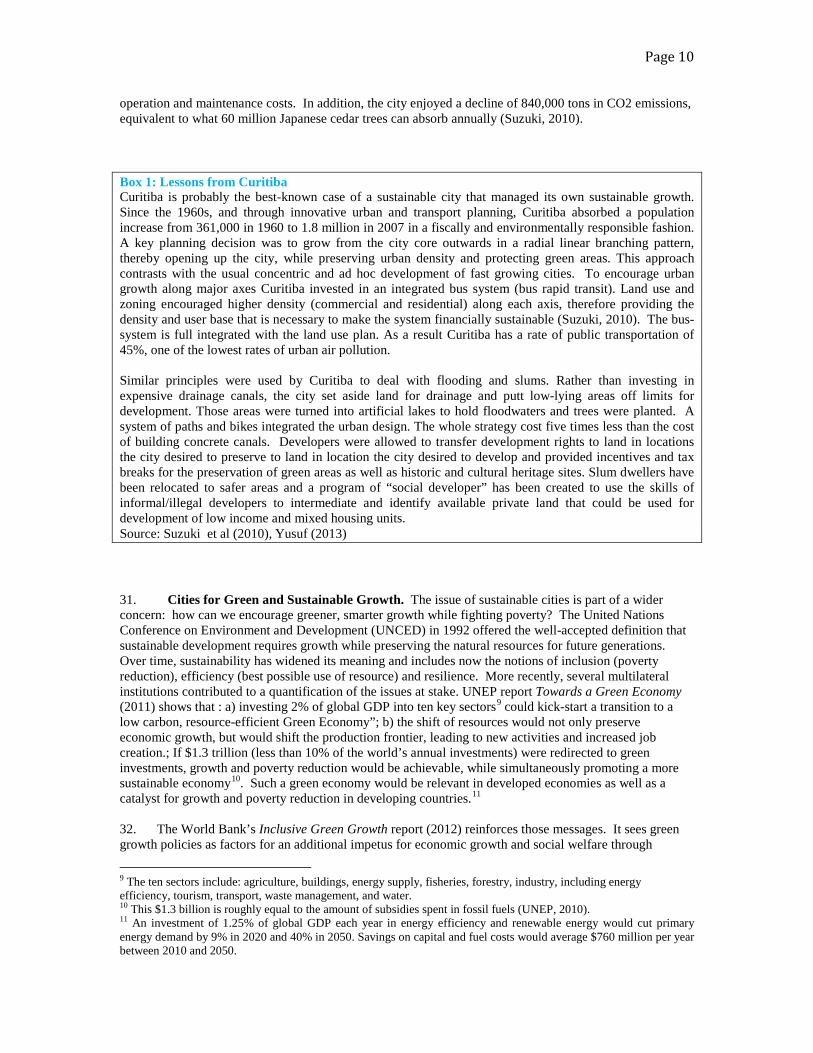
B. Cities and Economic Activity 16. Africa’s economic stagnation2 of the 1990s has given way to a more positive outlook in the 2000s. In 2012, eight of the world’s twenty fastest growing economies were African, and real GDP growth forecasts for 2012-2016 suggest a robust annual growth above 5 percent for most countries3. Africa’s growth has mostly revolved around commodities and the rapidly expanding demand from emerging economies. But other factors have also come into play. After years of armed conflict and military rule, democracy seems to be creating roots across the continent. Governance is improving with the consolidation of democracy and the strengthening of institutions. Trade with China, Brazil and old partners are now the main source of financial flows, reducing the traditional dependence on aid. Technology has exploded in selected markets, including mobile telephony, which has opened new ways to communicate and generate business. While infrastructure investment is still a major bottleneck, road building, railways, ports and airports have improved thanks to massive investment of Chinese companies. While there are macroeconomic challenges such as creeping inflation in some of the poor countries, augmented by severe draughts and increases in global food and fuel prices, the outlook is largely positive (IMF, 2011)4. 17. The perception that Africa is urbanizing without growth (Fay, 2000; Collier, 2006) seems to be changing as well. Data for the last ten years for a sample of forty African countries show a consistent and positive relation between GDP and urban growth rates. The trend is clearly positive (Figure 3). Angola (the country with the fastest GDP growth in the period) has urbanized at more than 8% a year, Mozambique
and Rwanda at 5%. For 38 African countries (IMF 2012), the speed of the economic growth during the 2000s has been more than twice the growth of the urban population, indicating an increase in average urban productivity (Annex 1). 18. At the firm level, African cities offer opportunities of business and rapid growth. A recent survey conducted by the Economist of 220 world companies showed that more than two-thirds are more interested than ever to expand business in African Cities, in spite of transport network lapses, lack of skills, corruption, and red tape. Twenty-five cities across 19 countries are of particular interest5. Some interesting results indicate that firms prefer cities that are growing fast as they provide good markets and have a pool
of young and skilled labor -- Nairobi, Addis Ababa and Mombasa have more than 35% of their population between 20 and 35 years old. Most of the cities show per-capita spending much higher than the average country level, which means they hold good opportunities for business. 19. The importance of the urban economy pinpoints the role of manufacturing and services in the economy of African countries. Agricultural activity is of course rural-based, but African economies are no more reliant on agriculture (averaging 15% of GDP)6 than are those in the East Asia and Pacific region (12%) and less so than those in South Asia (18%). The large share of services in Africa as more than half of total GDP is surprising, as this is normally a feature of more developed countries (Kessides, 2006). In
2 William Easterly and Ross Levine, 1997 3 Economist Intelligence Unit, 2001. 4 Much of the recent buoyancy in the sub-Saharan African export revenues is linked to the surge in commodity prices since the end of 2009. But many low-income countries have also experienced a spurt in the volumes of exported goods and services this year. Among them are Central African Republic, Eritrea Niger. Several countries are also diversifying into higher-value-added production (Ethiopia, Kenya, Rwanda) and new country markets. 5 Johannesburg, Tripoli, Cape Town, Durban. Tunis, Khartoum, Algiers, Lagos, Lusaka, Accra, Nairobi, Abidjan, Douala, Dakar, Luanda, Kumasi, Mombasa, Maputo, Kampala, Addis Ababa, Dar-es-Salaam 6 WDI, 2010
Page 7
Africa, services are dominated by lower-values activities, such as basic trading and less of information technology, banking and other services of modern towns. 20. This situation is prone to change and to change soon. The demands of an active export sector will translate into greater requirements for finance, marketing, and consulting and business-support services. The reorientation of exports towards new markets and nontraditional partners, as well as the increase in investment and FDI will press cities to provide efficient local services and avoid unnecessary bottlenecks. 21. Glaeser (1992), Duranton and Puga (2002) and many others have explained the role of cities in economic growth using the concept of agglomeration economies, that is, the advantages that firms and industries gain by locating in proximity of each other and to large markets. However, these advantages do not materialize in the absence of good public policy. The microeconomic foundations of agglomeration economies -- knowledge spillovers, labor market pooling, and input sharing7 -- will depend on the capacity of city governments to create an environment in which economic agents can meet and communicate, workers can move and services and infrastructure are efficiently provided. Failures of these pillars undermine the economic performance of cities, especially in Africa (Kessides, 2006). 22. In 2006, the Cities Alliance published the results of an investment climate surveys for several African and Asian countries. The report highlighted the main obstacles that impede African cities’ capacity to promote innovation and attract private investment. The most important were infrastructure deficiencies and institutional constraints (Table 1). One third of African businesses reported a worrisome lack of electricity and 15% identified inadequate transportation as a major constraint. Poor quality roads and other weak transportation infrastructure endanger connectivity between rural and urban areas, between products and markets and between workers and labor markets. The 2010 World Bank study on African infrastructure suggests that the infrastructure requirements at the city level in the next ten years amounted to about 20-30% of national GDP.
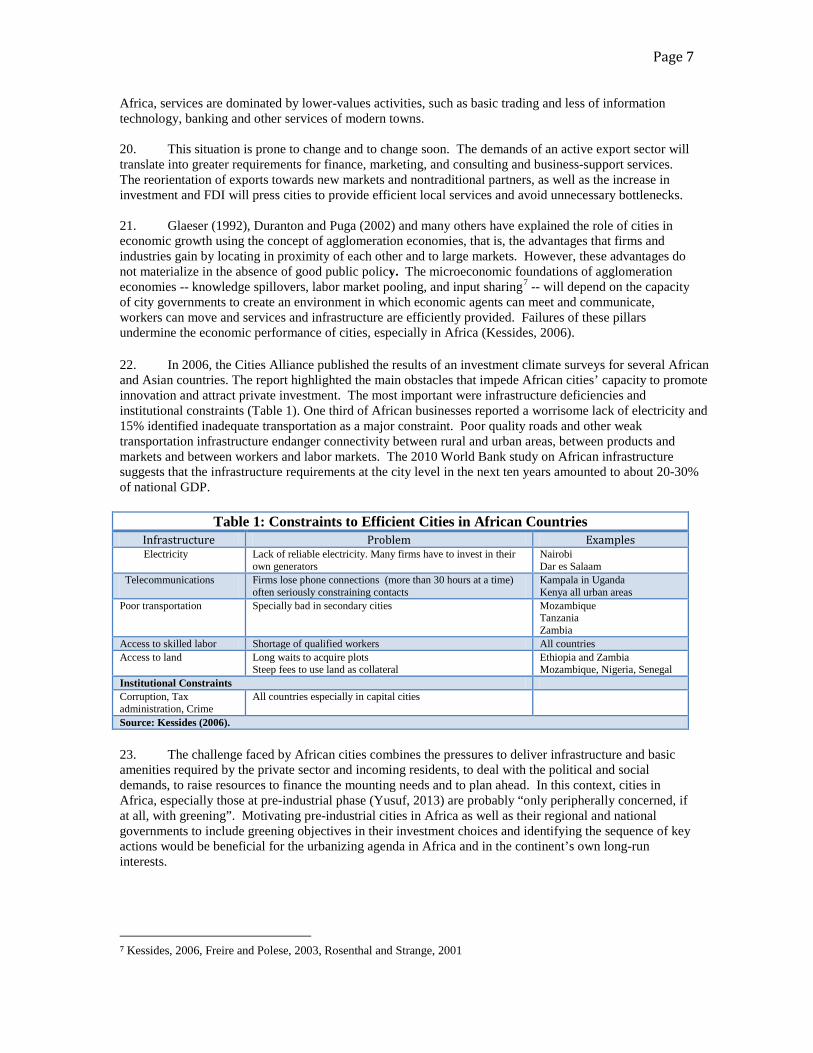
Table 1: Constraints to Efficient Cities in African Countries Infrastructure Problem Examples Electricity Lack of reliable electricity. Many firms have to invest in their
own generators Nairobi Dar es Salaam
Telecommunications
Firms lose phone connections (more than 30 hours at a time) often seriously constraining contacts
Kampala in Uganda Kenya all urban areas
Poor transportation Specially bad in secondary cities Mozambique Tanzania Zambia
Access to skilled labor Shortage of qualified workers All countries Access to land Long waits to acquire plots
Steep fees to use land as collateral Ethiopia and Zambia Mozambique, Nigeria, Senegal
Institutional Constraints Corruption, Tax administration, Crime
All countries especially in capital cities
Source: Kessides (2006). 23. The challenge faced by African cities combines the pressures to deliver infrastructure and basic amenities required by the private sector and incoming residents, to deal with the political and social demands, to raise resources to finance the mounting needs and to plan ahead. In this context, cities in Africa, especially those at pre-industrial phase (Yusuf, 2013) are probably “only peripherally concerned, if at all, with greening”. Motivating pre-industrial cities in Africa as well as their regional and national governments to include greening objectives in their investment choices and identifying the sequence of key actions would be beneficial for the urbanizing agenda in Africa and in the continent’s own long-run interests.
7 Kessides, 2006, Freire and Polese, 2003, Rosenthal and Strange, 2001
Page 8
PART II - SUSTAINABLE CITIES: EFFICIENT, RESILIENT AND GREEN 24. Sustainability requires a long-term view of development, taking into account the future impact of all current decisions. While the concept is widely accepted, its implementation has been difficult, partly because most policy actions address immediate demands and are designed under constrained conditions. Accounting for the long-term remains challenging in most policy environments, especially in regions undergoing rapid transformation. In cities, however, there is a need for immediate action as delay is costly due to the fact that urban systems and forms cannot be modified rapidly. Urban infrastructure has long lifetime, often of 100 years or more for buildings, transport systems and water infrastructure. In addition, infrastructure and building sites create a spatial inertia that extends beyond the structure’s lifetime. Consequently, any new urban infrastructure investment is an almost irreversible choice (S. Hallegatte, 2011). 25. The expected pace and magnitude of African urban growth will bring large segments of the population out of poverty, improve incomes and bring prosperity. It will also be accompanied by
unprecedented consumption and loss of natural resources, reflecting the needs for infrastructure and the more sophisticated demands of wealthier consumers. UNEP estimates that if developing countries urbanize and consume resources as developed countries have done, an ecological resource base as large as four planet Earths would be needed to support their growth (Suzuki, 2010). Half of this would be on the account of Africa’s progress, alone.
26. Environmental economics suggest that sustainability improves with development as better-educated and more affluent constituencies attribute greater value to clean and inclusive environments and are ready to trade in the traditional comforts such as car dependency or cheap sources of energy to get cleaner and more sustainable living conditions. Using CO2 as a proxy for sustainability, M Kahn (2006) uses a Kuznets curve to explain the reduction of emissions after a certain level of per capita income across countries. Figure 4 shows how this has actually happened in 28 countries for the period 1960-2008. But past behaviors do not necessarily need to be repeated. Populations in China, for example, are clamoring for better air quality and safer water management and Africa need not follow the historical OECD pattern of rising emissions during its rapid development stage.8 27. Sustainability also increases with dense-compact cities. Dense cities tend to be cleaner (less per capita emissions per m2, or per US$ output or income), more productive (reflecting economies of scale
8 Most OECD countries experienced an increase in emissions until 1990, followed by a substantial decline over the past two decades to levels below those of 1960 (Boden, Marland and Andres, 2007). For example, France's emissions are 0.1 tons per capita higher than they were in 1960, but urban population went up 15%. A combination of government policies, awareness of the climate change threat, together with a transition away from manufacturing to service economies help explain this behavior (World Bank 2013b). Let’s take Germany, United Kingdom and Sweden. In the last twenty years, all have had increases in urban population. But per capita CO2 emissions have gone down significantly. The situation is different among emerging economies (Brazil, India, China, South Africa, Mexico) where the tendency is to have higher level of per-capita emissions.
Page 9
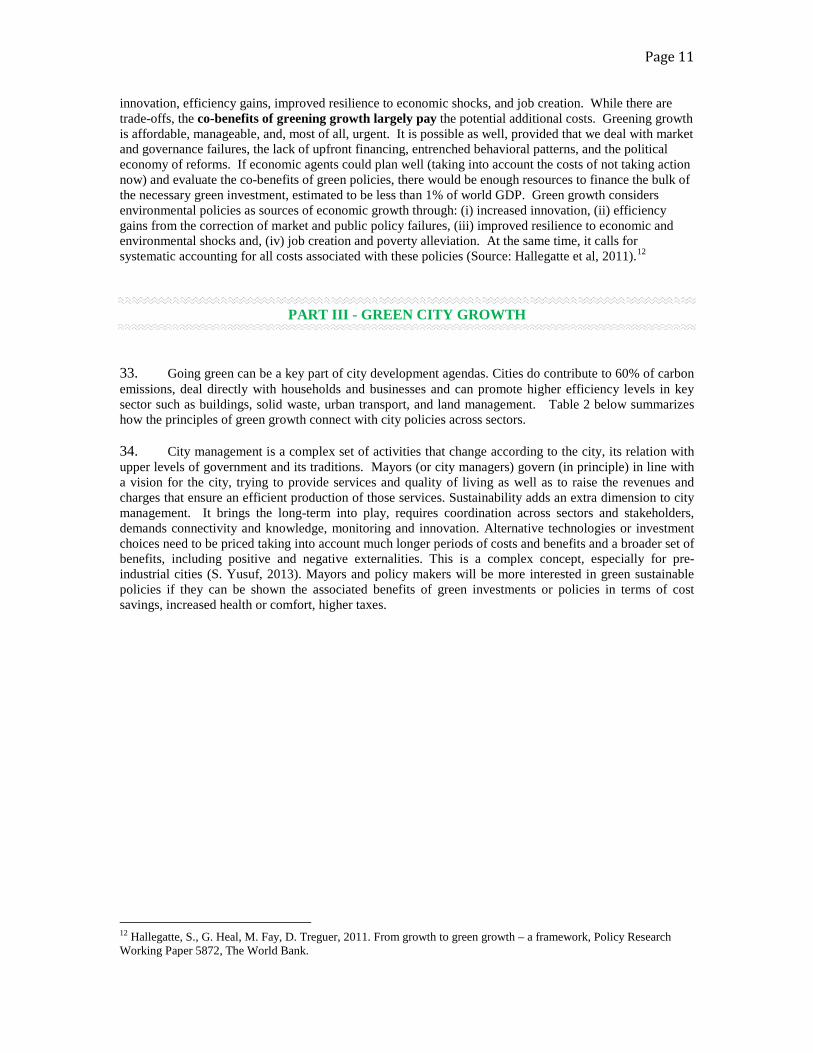
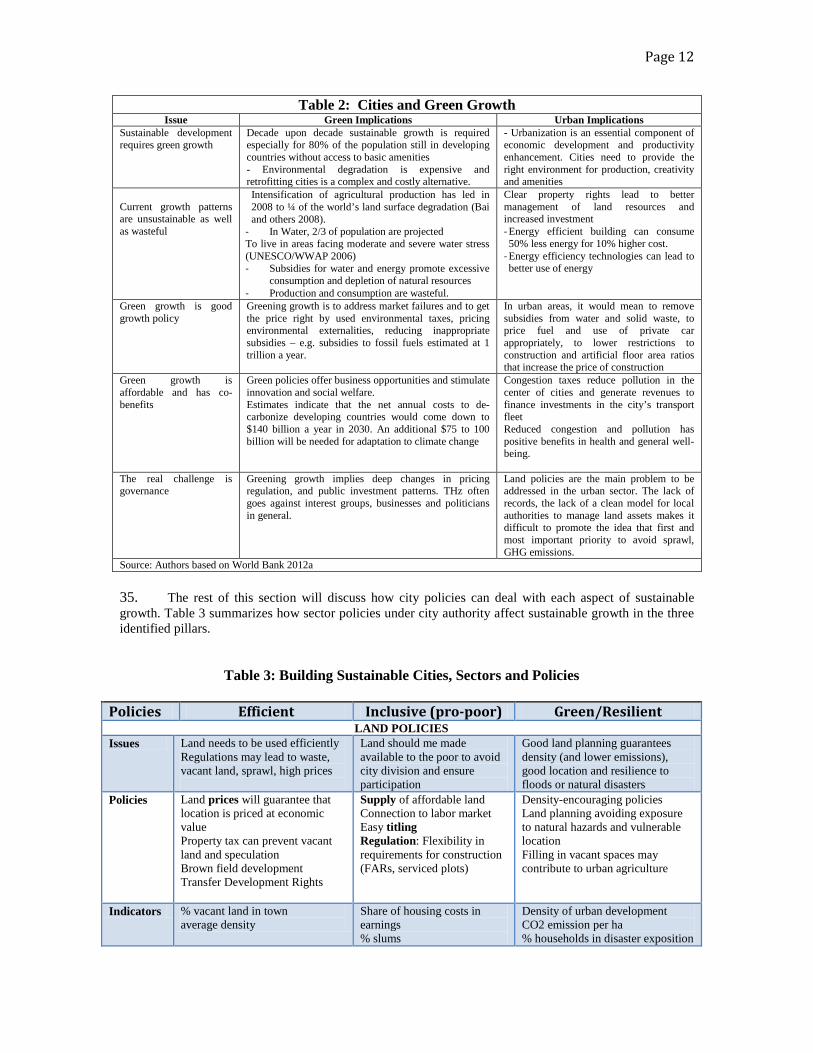
and agglomeration) and more attractive to new talents and private capital, easier and less costly to serve in terms of infrastructure and basic services (Glaeser, 2011). Pictures 5 and 6 depict the relation between density and per capita carbon emissions (across countries) and the relation between density and the cost of providing infrastructure services (for 40 African countries) respectively. The negative relation is consistently found across cities making average density one of the most important (and sometimes controversial) policy tools in the urban agenda. At a density of 5,000 per Km2 the per capita cost of a bundle of infrastructure services (water, energy, sanitation and transport) averages $660. At a density of 10,000 per Km2 the average cost per capita falls by a third. 28. Urban density can be controversial. On the one hand compact cities are less dependent on motorized private cars, improve quality of life, promote a stronger sense of place and are especially attractive to new talents and young people (M Khan (2006) and Glaeser (2011). On the other hand, compact cities may lead to congestion -- in the absence of strong traffic demand management-- and to higher average temperatures in the city as a result of the urban island effect. Urban density may also lead to increased rents and land prices in the center of the city (especially if land controls and building heights are too strict) and can be associated with loss of recreational space, potential increase of crime and violence and increased vulnerability to natural disasters. From a green perspective, the advantages of dense cities far outweigh their shortcomings and density has been adopted almost universally as the proxy for good urban policy. Urban design shows that urban density does not mean skyscraper buildings, but can be achieved with good layouts of 6-storey buildings (OECD, 2011).
Source: World Development Indicators, 2011 Source: World Bank, African Infrastructure (2010) 29. At the local level, innovative cities have shown that it is possible to improve resource efficiency while decreasing harmful pollution and unnecessary waste, using a combination of planned high density and smart transit-oriented policies. In-so-doing they have improved the quality of lives of their citizens, enhanced economic competitiveness and resilience, and improved fiscal capacity. Most encouraging, many of the solutions are affordable and they generate returns. Results have been obtained using well-tested technology and by focusing on local solutions. The most studied success of Curitiba, Yokohama, Stockholm, and Melbourne provide a clue of the success of these experiments. They depend on favorable institutional settings and entrepreneurial capital, economic growth, capacity to generate interest and finance for innovative and green projects (Suzuki, 2010, Yusuf, 2013). 30. Let’s take Yokohama, the largest city in Japan. In 2003 it initiated a plan to reduce waste using education and promotion techniques to persuade households, businesses and government entities to reduce, re-use and recycle waste. The result was extraordinary – between 2001 and 2007 the city reduced waste generation by 38.7% while the city population rose by another 160,000. The resulting savings totaled $1.1 billion in capital costs (as it avoided the replacement of two incinerators) and $6 million in annual
0
10
20
30
40
50
60
70
0 500 1000 1500 2000
Urb
aniz
atio
n Ra
te
Per capita GDP
Figure 5 Urbanization and Per capita GDP2010
0
200
400
600
800
1000
1200
0 10 20 30 40
US$
Density Thousand People per Km2
Figure 6 Per capita Capital Cost of Infrastructure by Density in AFrican
Cities
Page 10
operation and maintenance costs. In addition, the city enjoyed a decline of 840,000 tons in CO2 emissions, equivalent to what 60 million Japanese cedar trees can absorb annually (Suzuki, 2010). Box 1: Lessons from Curitiba Curitiba is probably the best-known case of a sustainable city that managed its own sustainable growth. Since the 1960s, and through innovative urban and transport planning, Curitiba absorbed a population increase from 361,000 in 1960 to 1.8 million in 2007 in a fiscally and environmentally responsible fashion. A key planning decision was to grow from the city core outwards in a radial linear branching pattern, thereby opening up the city, while preserving urban density and protecting green areas. This approach contrasts with the usual concentric and ad hoc development of fast growing cities. To encourage urban growth along major axes Curitiba invested in an integrated bus system (bus rapid transit). Land use and zoning encouraged higher density (commercial and residential) along each axis, therefore providing the density and user base that is necessary to make the system financially sustainable (Suzuki, 2010). The bus-system is full integrated with the land use plan. As a result Curitiba has a rate of public transportation of 45%, one of the lowest rates of urban air pollution. Similar principles were used by Curitiba to deal with flooding and slums. Rather than investing in expensive drainage canals, the city set aside land for drainage and putt low-lying areas off limits for development. Those areas were turned into artificial lakes to hold floodwaters and trees were planted. A system of paths and bikes integrated the urban design. The whole strategy cost five times less than the cost of building concrete canals. Developers were allowed to transfer development rights to land in locations the city desired to preserve to land in location the city desired to develop and provided incentives and tax breaks for the preservation of green areas as well as historic and cultural heritage sites. Slum dwellers have been relocated to safer areas and a program of “social developer” has been created to use the skills of informal/illegal developers to intermediate and identify available private land that could be used for development of low income and mixed housing units. Source: Suzuki et al (2010), Yusuf (2013) 31. Cities for Green and Sustainable Growth. The issue of sustainable cities is part of a wider concern: how can we encourage greener, smarter growth while fighting poverty? The United Nations Conference on Environment and Development (UNCED) in 1992 offered the well-accepted definition that sustainable development requires growth while preserving the natural resources for future generations. Over time, sustainability has widened its meaning and includes now the notions of inclusion (poverty reduction), efficiency (best possible use of resource) and resilience. More recently, several multilateral institutions contributed to a quantification of the issues at stake. UNEP report Towards a Green Economy (2011) shows that : a) investing 2% of global GDP into ten key sectors9 could kick-start a transition to a low carbon, resource-efficient Green Economy”; b) the shift of resources would not only preserve economic growth, but would shift the production frontier, leading to new activities and increased job creation.; If $1.3 trillion (less than 10% of the world’s annual investments) were redirected to green investments, growth and poverty reduction would be achievable, while simultaneously promoting a more sustainable economy10. Such a green economy would be relevant in developed economies as well as a catalyst for growth and poverty reduction in developing countries.11 32. The World Bank’s Inclusive Green Growth report (2012) reinforces those messages. It sees green growth policies as factors for an additional impetus for economic growth and social welfare through
9 The ten sectors include: agriculture, buildings, energy supply, fisheries, forestry, industry, including energy efficiency, tourism, transport, waste management, and water. 10 This $1.3 billion is roughly equal to the amount of subsidies spent in fossil fuels (UNEP, 2010). 11 An investment of 1.25% of global GDP each year in energy efficiency and renewable energy would cut primary energy demand by 9% in 2020 and 40% in 2050. Savings on capital and fuel costs would average $760 million per year between 2010 and 2050.
Page 11
innovation, efficiency gains, improved resilience to economic shocks, and job creation. While there are trade-offs, the co-benefits of greening growth largely pay the potential additional costs. Greening growth is affordable, manageable, and, most of all, urgent. It is possible as well, provided that we deal with market and governance failures, the lack of upfront financing, entrenched behavioral patterns, and the political economy of reforms. If economic agents could plan well (taking into account the costs of not taking action now) and evaluate the co-benefits of green policies, there would be enough resources to finance the bulk of the necessary green investment, estimated to be less than 1% of world GDP. Green growth considers environmental policies as sources of economic growth through: (i) increased innovation, (ii) efficiency gains from the correction of market and public policy failures, (iii) improved resilience to economic and environmental shocks and, (iv) job creation and poverty alleviation. At the same time, it calls for systematic accounting for all costs associated with these policies (Source: Hallegatte et al, 2011).12
PART III - GREEN CITY GROWTH
33. Going green can be a key part of city development agendas. Cities do contribute to 60% of carbon emissions, deal directly with households and businesses and can promote higher efficiency levels in key sector such as buildings, solid waste, urban transport, and land management. Table 2 below summarizes how the principles of green growth connect with city policies across sectors. 34. City management is a complex set of activities that change according to the city, its relation with upper levels of government and its traditions. Mayors (or city managers) govern (in principle) in line with a vision for the city, trying to provide services and quality of living as well as to raise the revenues and charges that ensure an efficient production of those services. Sustainability adds an extra dimension to city management. It brings the long-term into play, requires coordination across sectors and stakeholders, demands connectivity and knowledge, monitoring and innovation. Alternative technologies or investment choices need to be priced taking into account much longer periods of costs and benefits and a broader set of benefits, including positive and negative externalities. This is a complex concept, especially for pre-industrial cities (S. Yusuf, 2013). Mayors and policy makers will be more interested in green sustainable policies if they can be shown the associated benefits of green investments or policies in terms of cost savings, increased health or comfort, higher taxes.
12 Hallegatte, S., G. Heal, M. Fay, D. Treguer, 2011. From growth to green growth – a framework, Policy Research Working Paper 5872, The World Bank.
Page 12
Table 2: Cities and Green Growth Issue Green Implications Urban Implications
Sustainable development requires green growth
Decade upon decade sustainable growth is required especially for 80% of the population still in developing countries without access to basic amenities - Environmental degradation is expensive and retrofitting cities is a complex and costly alternative.
- Urbanization is an essential component of economic development and productivity enhancement. Cities need to provide the right environment for production, creativity and amenities
Current growth patterns are unsustainable as well as wasteful
Intensification of agricultural production has led in 2008 to ¼ of the world’s land surface degradation (Bai and others 2008).
- In Water, 2/3 of population are projected To live in areas facing moderate and severe water stress (UNESCO/WWAP 2006) - Subsidies for water and energy promote excessive
consumption and depletion of natural resources - Production and consumption are wasteful.
Clear property rights lead to better management of land resources and increased investment - Energy efficient building can consume 50% less energy for 10% higher cost.
- Energy efficiency technologies can lead to better use of energy
Green growth is good growth policy
Greening growth is to address market failures and to get the price right by used environmental taxes, pricing environmental externalities, reducing inappropriate subsidies – e.g. subsidies to fossil fuels estimated at 1 trillion a year.
In urban areas, it would mean to remove subsidies from water and solid waste, to price fuel and use of private car appropriately, to lower restrictions to construction and artificial floor area ratios that increase the price of construction
Green growth is affordable and has co-benefits
Green policies offer business opportunities and stimulate innovation and social welfare. Estimates indicate that the net annual costs to de-carbonize developing countries would come down to $140 billion a year in 2030. An additional $75 to 100 billion will be needed for adaptation to climate change
Congestion taxes reduce pollution in the center of cities and generate revenues to finance investments in the city’s transport fleet Reduced congestion and pollution has positive benefits in health and general well- being.
The real challenge is governance
Greening growth implies deep changes in pricing regulation, and public investment patterns. THz often goes against interest groups, businesses and politicians in general.
Land policies are the main problem to be addressed in the urban sector. The lack of records, the lack of a clean model for local authorities to manage land assets makes it difficult to promote the idea that first and most important priority to avoid sprawl, GHG emissions.
Source: Authors based on World Bank 2012a 35. The rest of this section will discuss how city policies can deal with each aspect of sustainable growth. Table 3 summarizes how sector policies under city authority affect sustainable growth in the three identified pillars.
Table 3: Building Sustainable Cities, Sectors and Policies
Policies Efficient Inclusive (pro-poor) Green/Resilient LAND POLICIES
Issues Land needs to be used efficiently Regulations may lead to waste, vacant land, sprawl, high prices
Land should me made available to the poor to avoid city division and ensure participation
Good land planning guarantees density (and lower emissions), good location and resilience to floods or natural disasters
Policies Land prices will guarantee that location is priced at economic value Property tax can prevent vacant land and speculation Brown field development Transfer Development Rights
Supply of affordable land Connection to labor market Easy titling Regulation: Flexibility in requirements for construction (FARs, serviced plots)
Density-encouraging policies Land planning avoiding exposure to natural hazards and vulnerable location Filling in vacant spaces may contribute to urban agriculture
Indicators % vacant land in town average density
Share of housing costs in earnings % slums
Density of urban development CO2 emission per ha % households in disaster exposition
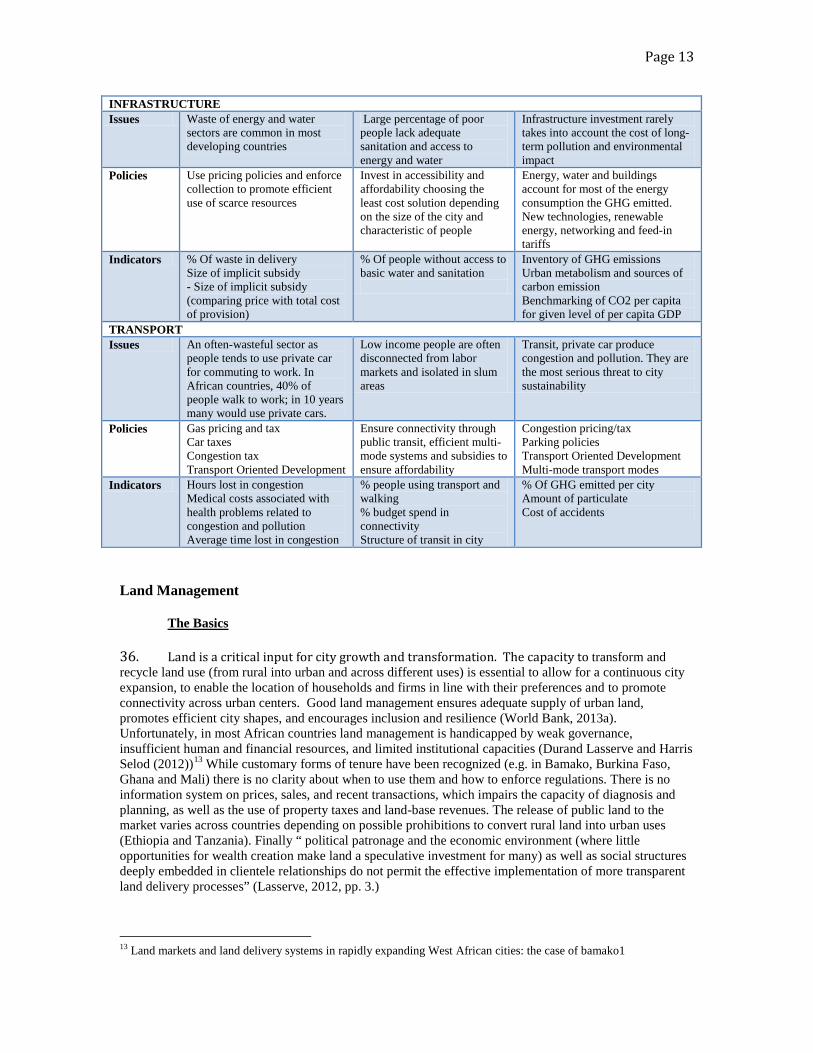
Page 13
INFRASTRUCTURE Issues Waste of energy and water
sectors are common in most developing countries
Large percentage of poor people lack adequate sanitation and access to energy and water
Infrastructure investment rarely takes into account the cost of long-term pollution and environmental impact
Policies Use pricing policies and enforce collection to promote efficient use of scarce resources
Invest in accessibility and affordability choosing the least cost solution depending on the size of the city and characteristic of people
Energy, water and buildings account for most of the energy consumption the GHG emitted. New technologies, renewable energy, networking and feed-in tariffs
Indicators % Of waste in delivery Size of implicit subsidy - Size of implicit subsidy (comparing price with total cost of provision)
% Of people without access to basic water and sanitation
Inventory of GHG emissions Urban metabolism and sources of carbon emission Benchmarking of CO2 per capita for given level of per capita GDP
TRANSPORT Issues An often-wasteful sector as
people tends to use private car for commuting to work. In African countries, 40% of people walk to work; in 10 years many would use private cars.
Low income people are often disconnected from labor markets and isolated in slum areas
Transit, private car produce congestion and pollution. They are the most serious threat to city sustainability
Policies Gas pricing and tax Car taxes Congestion tax Transport Oriented Development
Ensure connectivity through public transit, efficient multi-mode systems and subsidies to ensure affordability
Congestion pricing/tax Parking policies Transport Oriented Development Multi-mode transport modes
Indicators Hours lost in congestion Medical costs associated with health problems related to congestion and pollution Average time lost in congestion
% people using transport and walking % budget spend in connectivity Structure of transit in city
% Of GHG emitted per city Amount of particulate Cost of accidents
Land Management The Basics 36. Land is a critical input for city growth and transformation. The capacity to transform and recycle land use (from rural into urban and across different uses) is essential to allow for a continuous city expansion, to enable the location of households and firms in line with their preferences and to promote connectivity across urban centers. Good land management ensures adequate supply of urban land, promotes efficient city shapes, and encourages inclusion and resilience (World Bank, 2013a). Unfortunately, in most African countries land management is handicapped by weak governance, insufficient human and financial resources, and limited institutional capacities (Durand Lasserve and Harris Selod (2012))13 While customary forms of tenure have been recognized (e.g. in Bamako, Burkina Faso, Ghana and Mali) there is no clarity about when to use them and how to enforce regulations. There is no information system on prices, sales, and recent transactions, which impairs the capacity of diagnosis and planning, as well as the use of property taxes and land-base revenues. The release of public land to the market varies across countries depending on possible prohibitions to convert rural land into urban uses (Ethiopia and Tanzania). Finally “ political patronage and the economic environment (where little opportunities for wealth creation make land a speculative investment for many) as well as social structures deeply embedded in clientele relationships do not permit the effective implementation of more transparent land delivery processes” (Lasserve, 2012, pp. 3.)
13 Land markets and land delivery systems in rapidly expanding West African cities: the case of bamako1
Page 14
37. Land supply is also limited by legal prohibitions to convert rural land in urban land (Ethiopia and Tanzania); in other countries, land sale and lease has been adopted as a source of funds to finance infrastructure development (Egypt, Tanzania). While auctions are now regularly used in Egypt, in other countries the allocation of leased land is not transparent. Because of the lack of transparency, land grabbing can take place, where less scrupulous agents grab parcels of land for individual profit. The result is a mismatch between demand and supply of urban land, and development of the city in places where the restrictions are less severe, often in unregulated land in the periphery. In some extreme situations, land grabbing by people in power position, has led to exploitation of slum dwellers as slumlords invest in rental housing in the slums and charge a fee for access to publically provided services14. 38. As a result, African cities face shortages of housing and shelter as mentioned before. But most important, African cities miss the essential land information and land assessment tools to engage in spatial planning and urban policy. The problem of urban land markets is at the core of effective urbanization. Most countries that have been successful at the urbanization process – Korea, Singapore, China, Vietnam – have invested in making land available for urban settlements, often with the help of private investors. and in improving the flow of information and the available data on use and price of urban land.
Major Trends
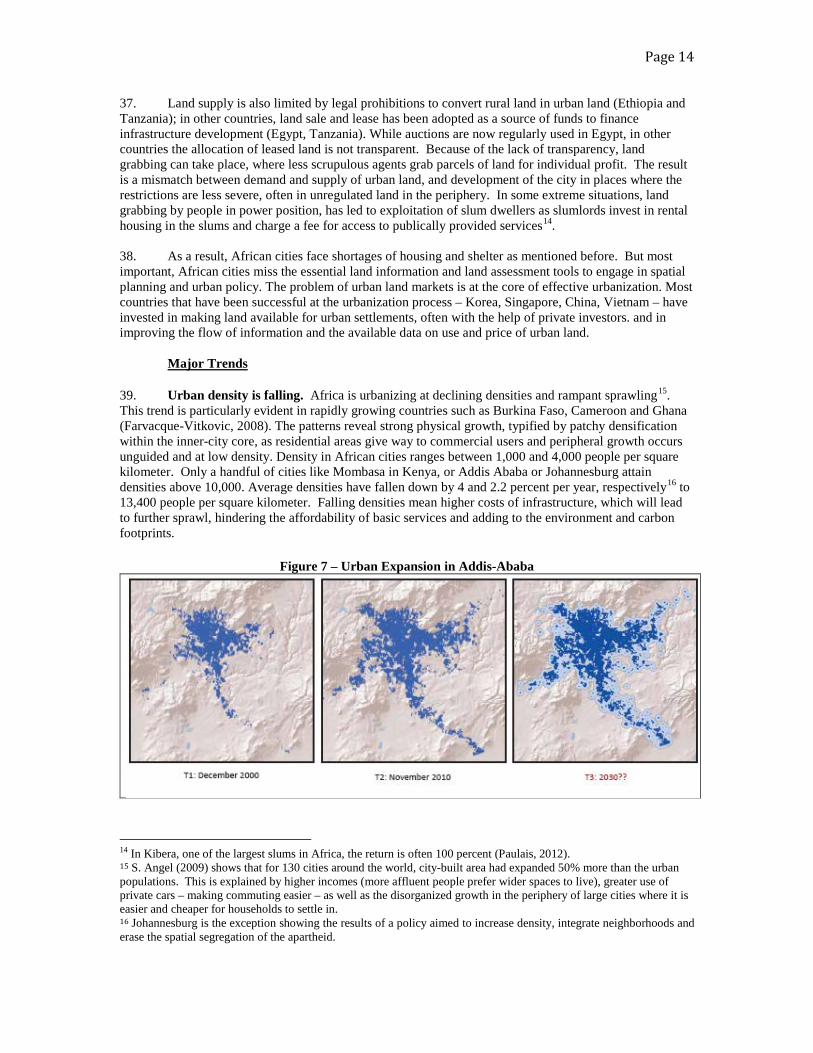
39. Urban density is falling. Africa is urbanizing at declining densities and rampant sprawling15. This trend is particularly evident in rapidly growing countries such as Burkina Faso, Cameroon and Ghana (Farvacque-Vitkovic, 2008). The patterns reveal strong physical growth, typified by patchy densification within the inner-city core, as residential areas give way to commercial users and peripheral growth occurs unguided and at low density. Density in African cities ranges between 1,000 and 4,000 people per square kilometer. Only a handful of cities like Mombasa in Kenya, or Addis Ababa or Johannesburg attain densities above 10,000. Average densities have fallen down by 4 and 2.2 percent per year, respectively16 to 13,400 people per square kilometer. Falling densities mean higher costs of infrastructure, which will lead to further sprawl, hindering the affordability of basic services and adding to the environment and carbon footprints.
Figure 7 – Urban Expansion in Addis-Ababa
14 In Kibera, one of the largest slums in Africa, the return is often 100 percent (Paulais, 2012). 15 S. Angel (2009) shows that for 130 cities around the world, city-built area had expanded 50% more than the urban populations. This is explained by higher incomes (more affluent people prefer wider spaces to live), greater use of private cars – making commuting easier – as well as the disorganized growth in the periphery of large cities where it is easier and cheaper for households to settle in. 16 Johannesburg is the exception showing the results of a policy aimed to increase density, integrate neighborhoods and erase the spatial segregation of the apartheid.
Page 15
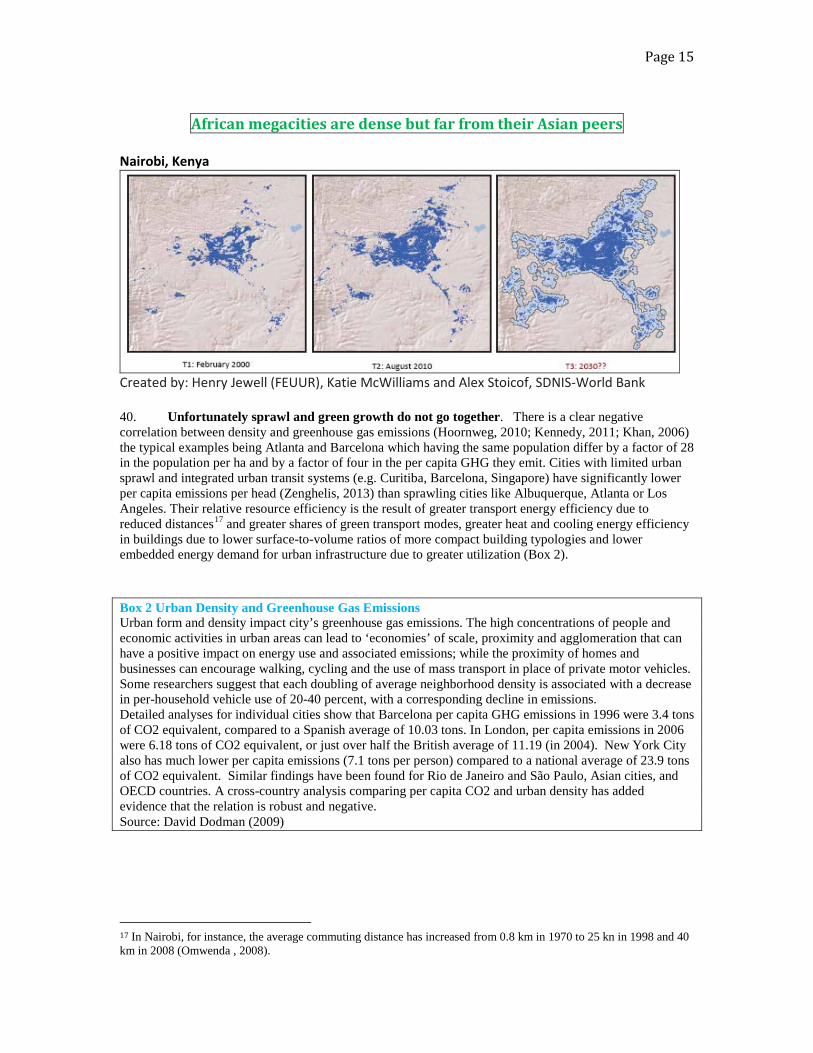
African megacities are dense but far from their Asian peers
Nairobi, Kenya
Created by: Henry Jewell (FEUUR), Katie McWilliams and Alex Stoicof, SDNIS-World Bank 40. Unfortunately sprawl and green growth do not go together. There is a clear negative correlation between density and greenhouse gas emissions (Hoornweg, 2010; Kennedy, 2011; Khan, 2006) the typical examples being Atlanta and Barcelona which having the same population differ by a factor of 28 in the population per ha and by a factor of four in the per capita GHG they emit. Cities with limited urban sprawl and integrated urban transit systems (e.g. Curitiba, Barcelona, Singapore) have significantly lower per capita emissions per head (Zenghelis, 2013) than sprawling cities like Albuquerque, Atlanta or Los Angeles. Their relative resource efficiency is the result of greater transport energy efficiency due to reduced distances17 and greater shares of green transport modes, greater heat and cooling energy efficiency in buildings due to lower surface-to-volume ratios of more compact building typologies and lower embedded energy demand for urban infrastructure due to greater utilization (Box 2). Box 2 Urban Density and Greenhouse Gas Emissions Urban form and density impact city’s greenhouse gas emissions. The high concentrations of people and economic activities in urban areas can lead to ‘economies’ of scale, proximity and agglomeration that can have a positive impact on energy use and associated emissions; while the proximity of homes and businesses can encourage walking, cycling and the use of mass transport in place of private motor vehicles. Some researchers suggest that each doubling of average neighborhood density is associated with a decrease in per-household vehicle use of 20-40 percent, with a corresponding decline in emissions. Detailed analyses for individual cities show that Barcelona per capita GHG emissions in 1996 were 3.4 tons of CO2 equivalent, compared to a Spanish average of 10.03 tons. In London, per capita emissions in 2006 were 6.18 tons of CO2 equivalent, or just over half the British average of 11.19 (in 2004). New York City also has much lower per capita emissions (7.1 tons per person) compared to a national average of 23.9 tons of CO2 equivalent. Similar findings have been found for Rio de Janeiro and São Paulo, Asian cities, and OECD countries. A cross-country analysis comparing per capita CO2 and urban density has added evidence that the relation is robust and negative. Source: David Dodman (2009)
17 In Nairobi, for instance, the average commuting distance has increased from 0.8 km in 1970 to 25 kn in 1998 and 40 km in 2008 (Omwenda , 2008).
Page 16
41. Sprawl also increases the cost of infrastructure and service provision (Table B6 in annex). For a bundle of services that include water, sanitation, transportation and energy, the capital cost (per capita) declines with density. World Bank study on African Infrastructure, indicates that at the highest density, the cost of a bundle of basic services is $325 per capita, for medium density cities is $665 and for the rural hinterland $2,837. The way that African cities are growing – with sprawl and low densities – will only aggravate the cost of providing infrastructure to all. For Africa largest cities, with a population over 3 million and a median density of 5,000 people per Km2, water and sanitation represent the heaviest weight in the infrastructure bundle (54%) followed by roads (28%), and power (17%) according to the World Bank.
These values illustrate the cost disadvantage of African cities
(generally less dense) compared with their high-density Asian peers 42. African cities are particularly exposed to natural disasters, droughts, floods, sea-level rise and cyclones. Two thirds of SSA is fragile desert or arid land. As a result of the expected rise in temperatures and changes in rainfall, African cities are faced with vulnerability to drought and water scarcity while urban services including housing, transport, health and safety are vulnerable to floods18. This impact will be felt more in cities where growth is happening Coastal flooding and storm surges produced by sea level rise are likely to affect the African cities in low-elevation coastal zones where 12% of the population lives (UN-Habitat 2008b). Lagos and Dar es Salaam are among the cities most at risk of sea level and flood surges19. Many other cities in Sub-Saharan Africa may be affected by sea-level rise, such as Banjul, Cotonou, Lomé and Port Harcourt. Most of the population living in informal settlements will be particularly at risk as these settlements tend to be located in hazard prone areas such as food plains (World Bank, 2010).
In addition, cities will likely become host to climate refugees as people migrate from rural areas hit by drought and flooding.
43. A major problem for Africa’s growing cities is the rapid spread of informal settlements. Lack of affordable serviced land, unaffordable plots, and zoning policies have often excluded the poor from being integrated with urban development, leaving them in underserviced shelters (slums) both in and on the outskirts of major cities.20 As much as 70 percent of Africa’s urban population resides in slums.21 In Cameroon, Chad, Mozambique and Niger, the percentage is above 80%. 44. Not all people living in these settlements are income-poor and living standards differ across countries. In many cases informal settlements are scattered across cities, side-by-side with wealthier people. In Tanzania, urban dwellers in the periurban areas do well, enjoying the freedom of informality, even without land titling or finished walls. Indeed, informal periurban areas are sometimes the most dynamic, precisely because they are not affected by overzealous regulation. There is also a strong “city effect.” Thanks to leadership, land security, ownership, and civic participation, the inhabitants of Dakar’s slums have living standards far superior to Nairobi’s, with its higher incomes and education levels.22
18 Recent projections for 2010-2030 suggest that climate change related economic losses represent 2.6% of annual GDP in Kenya and 1.5% in Tanzania. (GCAP 2011; SEI 2009). 19 Currently about 8% of the land in Dar es Salaam, including 140,000 people and economic assets worth more than $170 million are located in potentially vulnerable areas. In Senegal, two-thirds of the population and 90 percent of the industry are located in Greater Dakar. 20 The UN-Habitat standard definition of people living in slums is overcrowding, low access to water and sanitation, lack of secure tenure, and poor housing quality 21 UN-Habitat statistics. 22 Gulyani and others 2008.
Page 17
Box 3 - The Indispensable Emergence of the Informal Sector In the cores of large cities, the substitution of capital for land is an integral part of land price formation. For low-income households that cannot afford the minimum cost of a minimum-sized dwelling in a multistory structure, the land market is clearly out of reach, even if they were to reduce their consumption of land and floor space to a few square meters per household. For households that cannot afford to substitute capital for land, a parallel market for land is bound to develop. This parallel informal market exists in every city of the world where a large number of households have An income that is too low to permit land substitution. When the rate of migration slows down and most low-income workers have reached a level of productivity that allows them to substitute capital for land, the informal parallel land market tends to disappear. If we agree that free migration from rural areas to cities is economically desirable, then we must admit that the constitution of an informal market independent from and parallel to the formal market is indispensable for households whose productivity has not yet reached the point where they can afford to substitute capital for land. The issue to be addressed, therefore, is not how to prevent the development of an informal land market but on the contrary (1) how to ensure a steady supply of land for this parallel market and (2) how to ensure a minimum level of health and education for households whose dwellings are in the informal sector. Source: Extracted from Alain Bertaud.2010. Land markets, government Interventions, and housing Affordability pp. 9 in Wolfenshon Center for Development, Working Paper 18, May 2010.
45. The main problem of slums and informality is the exclusion from basic amenities. In Africa as a whole, the price of piped water in $0.50 per cubic meter, while water purchased from private vendors in mobile carts is $4.75 per cubic meter. Inadequate access to basic services also has implications for health and human development. And spatial mismatches and distance constrain accessibility to education and livelihood opportunities. Informality is also a handicap to design targeted benefits or even know about the conditions of the population at risk.
Nairobi’s slum residents pay up to 11 times more for water sold by private vendors than those who have access to piped water23
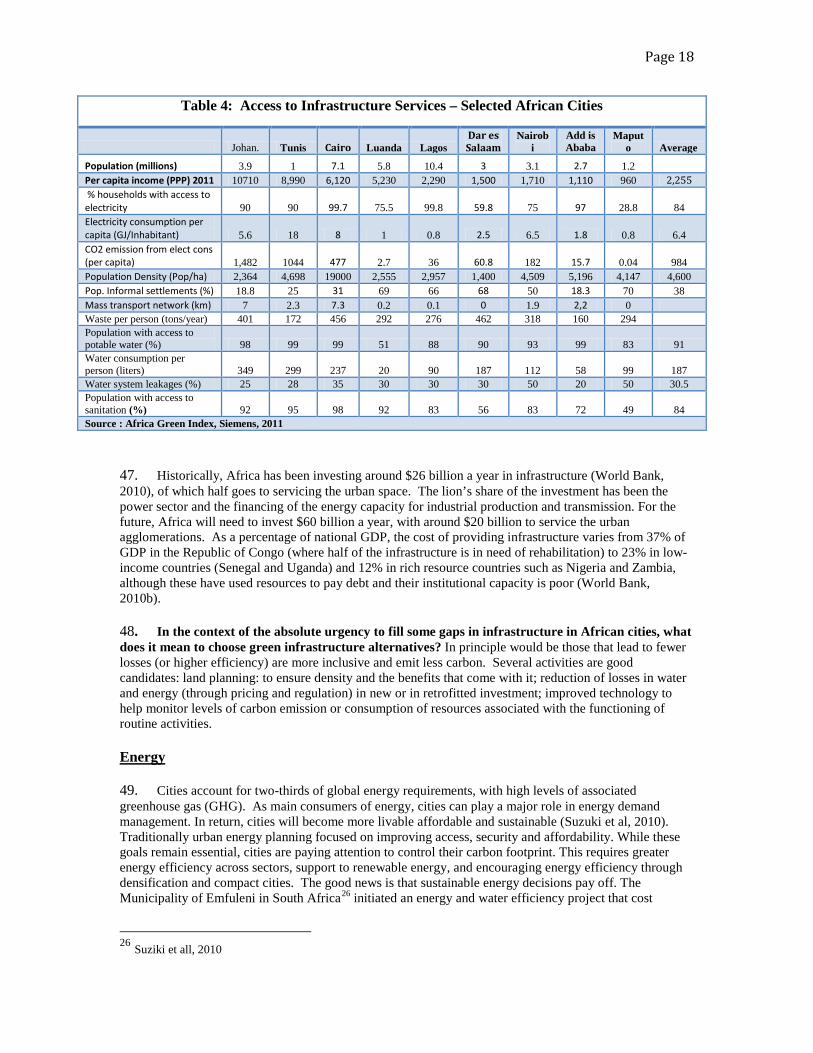
GREEN INFRASTRUCTURE 46. African cities have large gaps in basic infrastructure24 and both access and efficiency vary across cities (Table 4)25. Low-income cities show consistent lower levels in access to energy, water and sanitation. Slums account for more than 60% of shelter in Maputo, Luanda, and Dar es Salaam. Conversely the amount of water and electricity consumed is much higher in the middle-income countries. Waste and water leakages are show less variation across cities; in all, 25% or more of water is lost, in Maputo and Nairobi, losses by leakages represent 50% of what is produced. CO2 emissions follow the indicators of economic activity and industrialization. While Tunis and Johannesburg emit more than 1,200 tons of CO2 per person year, Maputo and Luanda show an average of 2 tons per capita. While some of the differences are due to higher use of hydropower to generate electricity, the degree of industrial and urban development seems to be the most important explanatory variable.
In Maputo less than 30% households have electricity and less than half have access to sanitation compared to almost universal coverage
in Northern Africa cities 23 Farvacque-Vitkovic, Matthew and Glasser and others 2008. 24 About 97 billion per year according to the African Infrastructure Flagship report (World Bank 2011). One third being for maintenance. The most needed sectors are energy, water and transport. 25 From Africa Green Index, Siemens
Page 18
Table 4: Access to Infrastructure Services – Selected African Cities
Johan. Tunis Cairo Luanda Lagos Dar es Salaam
Nairobi
Add is Ababa
Maputo Average
Population (millions) 3.9 1 7.1 5.8 10.4 3 3.1 2.7 1.2 Per capita income (PPP) 2011 10710 8,990 6,120 5,230 2,290 1,500 1,710 1,110 960 2,255 % households with access to electricity 90 90 99.7 75.5 99.8 59.8 75 97 28.8 84 Electricity consumption per capita (GJ/Inhabitant) 5.6 18 8 1 0.8 2.5 6.5 1.8 0.8 6.4 CO2 emission from elect cons (per capita) 1,482 1044 477 2.7 36 60.8 182 15.7 0.04 984 Population Density (Pop/ha) 2,364 4,698 19000 2,555 2,957 1,400 4,509 5,196 4,147 4,600 Pop. Informal settlements (%) 18.8 25 31 69 66 68 50 18.3 70 38 Mass transport network (km) 7 2.3 7.3 0.2 0.1 0 1.9 2,2 0 Waste per person (tons/year) 401 172 456 292 276 462 318 160 294 Population with access to potable water (%) 98 99 99 51 88 90 93 99 83 91 Water consumption per person (liters) 349 299 237 20 90 187 112 58 99 187 Water system leakages (%) 25 28 35 30 30 30 50 20 50 30.5 Population with access to sanitation (%) 92 95 98 92 83 56 83 72 49 84 Source : Africa Green Index, Siemens, 2011
47. Historically, Africa has been investing around $26 billion a year in infrastructure (World Bank, 2010), of which half goes to servicing the urban space. The lion’s share of the investment has been the power sector and the financing of the energy capacity for industrial production and transmission. For the future, Africa will need to invest $60 billion a year, with around $20 billion to service the urban agglomerations. As a percentage of national GDP, the cost of providing infrastructure varies from 37% of GDP in the Republic of Congo (where half of the infrastructure is in need of rehabilitation) to 23% in low-income countries (Senegal and Uganda) and 12% in rich resource countries such as Nigeria and Zambia, although these have used resources to pay debt and their institutional capacity is poor (World Bank, 2010b). 48. In the context of the absolute urgency to fill some gaps in infrastructure in African cities, what does it mean to choose green infrastructure alternatives? In principle would be those that lead to fewer losses (or higher efficiency) are more inclusive and emit less carbon. Several activities are good candidates: land planning: to ensure density and the benefits that come with it; reduction of losses in water and energy (through pricing and regulation) in new or in retrofitted investment; improved technology to help monitor levels of carbon emission or consumption of resources associated with the functioning of routine activities. Energy 49. Cities account for two-thirds of global energy requirements, with high levels of associated greenhouse gas (GHG). As main consumers of energy, cities can play a major role in energy demand management. In return, cities will become more livable affordable and sustainable (Suzuki et al, 2010). Traditionally urban energy planning focused on improving access, security and affordability. While these goals remain essential, cities are paying attention to control their carbon footprint. This requires greater energy efficiency across sectors, support to renewable energy, and encouraging energy efficiency through densification and compact cities. The good news is that sustainable energy decisions pay off. The Municipality of Emfuleni in South Africa26 initiated an energy and water efficiency project that cost
26 Suziki et all, 2010
Page 19
US$1.8 million and achieved annual savings of 7 billion liters and 14 million kilowatt hours. This means that the project paid for itself in six months. Other co-benefits relate to the impact that cleaner energy has to promote productivity, improve health conditions (and reduce medical bills), which improves urban livability and competitiveness. In China, the cost of air pollution in terms of air pollution-related deaths and illnesses amounted to $63 billion in 2003 or 3.8% of GDP27.
Most energy efficiency and conservation measures are not high-technology applications or expensive solutions
and the initial costs are usually quickly recovered. 50. Energy saving programs can be launched at early stages of development, along some sequential decisions: First, cities can adopt energy efficiency and conservation measures in government-owned buildings and municipal services such as water supply and wastewater treatment facilities, public lighting, transportation and solid waste management. The savings obtained in these actions have a payback period relatively short and because of that should be easily financeable. Local governments might also expand renewable energy technologies such as photovoltaic systems and solar water heating, in their own buildings and facilities, as technology is expanding fast and commercial solutions are available at reasonable prices ensure a rapid pay-off of the initial investments through reduced energy bills. The city of Cape Town is enforcing sustainable building codes and renovation. 51. Cities can enforce national/regional energy efficiency standards in new building construction and renovations as well as standards of water efficiency and conservation. They can endorse advocacy campaigns to educate their constituency as well as implement incentive programs for residential users. In addition, cities should be mindful of the savings in energy, waste and financial costs associated with adequate land planning and land development. As seen before cities can shape and reshape land use in ways that minimize carbon footprints. Energy planning needs to integrate transportation planning and other urban infrastructure planning to serve a city’s growth ambitions and environmental aspirations effectively. 52. Finally, cities can adopt smart technologies and management processes that encourage efficient behavior of the collectivity by providing real-time information on actual consumption levels and impact in terms of GHG emissions. This includes better management and information system – the smart city concept is based on sharing information with consumers to enable them to make rational choices on consumption patterns – as well as appropriate financial and economic analysis. 53. The economic and financial aspects of investment decisions often favor green/sustainable investment if proper long-run calculations are made. Economic justification requires cities to clearly account for and evaluate costs and benefits of alternative solutions so as to facilitate robust comparisons. This is challenging because evaluation environment externalities such as health benefits or hazards is difficult. A critical aspect of economic analysis is the calculation of life-cycle cost of alternative energy solutions. Many alternatives such as energy efficiency measures have life-cycle costs lower than the business as usual alternatives. For example a program developed in Melbourne to reduce electricity by 82%, gas by 87%, and water by 72% and CO3 emission by 87% had very high initial costs, but the city demonstrated that it could pay the costs in 10 years based on the associated energy savings (C40 cities, 2009b). 54. Because local governments are concerned with long-term—as well as short-term—benefits and costs, they are well positioned to adopt life cycle cost analyses when making decisions about purchasing energy-using products. Traditional methods for assessing project cost-effectiveness typically focus on the initial design and construction costs in the short-term. The life-cycle cost of a product or service is the sum of the present values of the costs of investment, capital, installation, energy, operation, maintenance, and 27 China’s efforts in the past two decades to modernize energy infrastructure and improve energy efficiency aims mainly at reducing the health impacts of air pollution.
Page 20
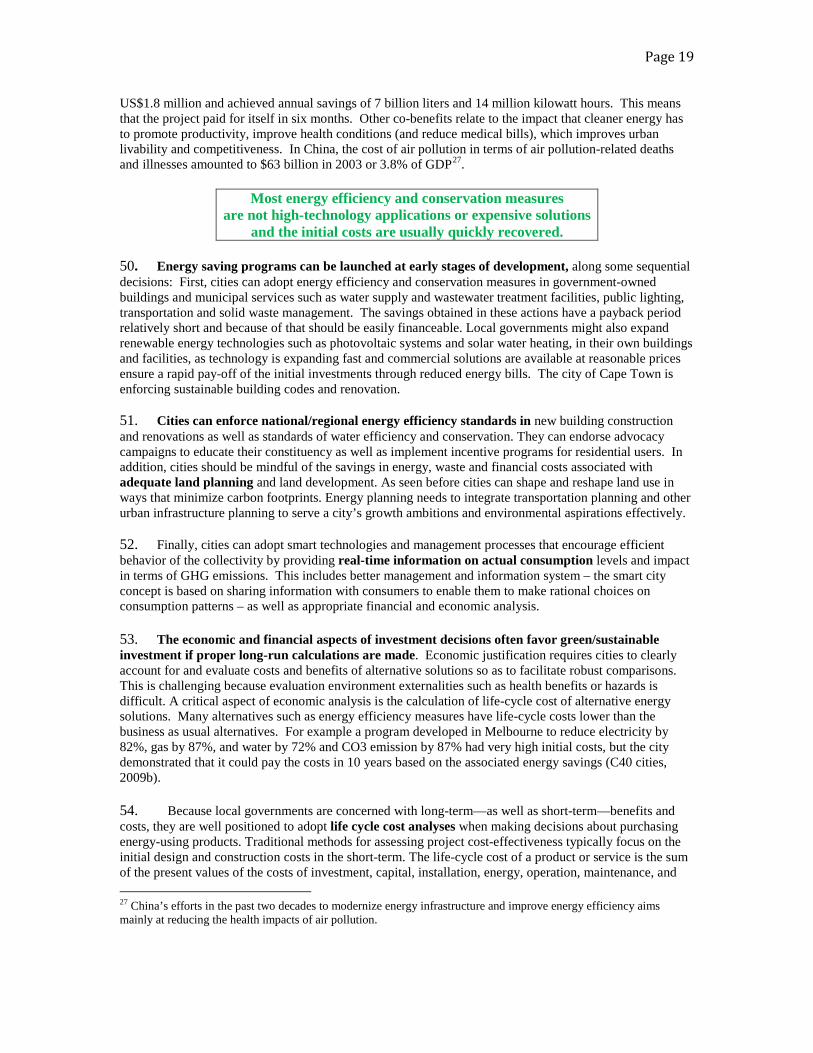
disposal over the life of the product (U.S. DOE, 2003). Because life cycle cost analysis reveals whether energy efficiency investments are cost-effective over the long run, it can be an important feature of an overall energy policy. Though the commercial sector normally considers projects viable if payback periods are less than 5 years, city governments have longer investment horizons because their built environments last for decades. This is a serious consideration to be taken into account in planning the needed infrastructure for African cities.
Table 5: Indicative Economics of Sustainable Energy Options
Sector Short term payback, less than 5 years Medium term Long term, 10 +
Public buildings Equipment retrofits Labeling building performance Solar water heating
Green roofs Training in good actions
Building codes Certification of building materials Equipment standards
Public Lighting Lighting Retrofits Control system with sensors
Retrofits using light-emiting diodes
Street and traffic lighting standards
Transport Optimization of traffic signals Fuel efficiency vehicle standards Congestion taxes, tolls
Alternative fuels for buses Bus rapid transit system
Modal shifts Vehicle inspection Changes in land pattern to promote densification
Water Pumping retrofits Correct size of pumps Lead reduction Load management
System redesign and optimization Water demand side management (low-flow outlets, drip irrigation)
Solid waste Methane recovery for power generation from landfills Recycling programs
Electricity Supply side loss reduction Improved metering and pricing Retrofits of piping systems
Combined heat and power provision Load management Energy storage system Promotion of distributed generation with feed-in tariffs
Source: Jas Singh, Dilip Limaye, Brian Henderson and Xiaoyu Shi.2010. Public Procurement of Energy Efficiency Services: Lesson from International Experience. Washington DC: World Bank cited in Suzuki et al. 2010. 55. The built environment defined as buildings and physical structures is crucial and in rapidly growing cities policy makers should focus on the features and functioning of new buildings that affect energy consumption, specially heating and cooling systems (Nandi and Bose, 2010 and Leipziger, 2013.) Other factors include site plans, lighting fixtures, and water heaters. Relevant experience has been accumulated in developed countries over the past 30 years. Matured technologies and materials may be applied to create buildings with low or near zero energy use for heating and cooling (Rosenthal 2008). Implementing energy efficiency will require the commitment of all levels of government but local enforcement is critical28.
28 China is a good example of great progress. Among the large Northern Chinese cities the compliance rates at local level rose from 6% in 2002 to 70% in 2007.
Page 21
Box 4 - Smart Cities The phrase ‘Smart Cities’ has entered the established lexicon of urban management. It is associated with programs that help cities improve their resource efficiency using IT and technological infrastructure. One of the goals of smart grid IT platforms is to cover the real-time monitoring, control and optimization of distributed energy resources, to optimize the dispatch of electricity balancing within the city (integrating real-time load forecasts, weather-based generation forecasts, energy price forecasts, and public transportation congestion forecasts). Another benefit of such technologies is to provide all smart city stakeholders (citizens, public authorities, companies, industries) with the necessary information to maximize the efficiency of infrastructure. Interactions with this integrated platform can allow all consumers to play an active role in the optimization of the overall system by acting appropriately according to prevailing conditions. Rio de Janeiro has developed an integrate platform to improve the response time against flooding, weather hazards and other issues in preparation for the upcoming 2016 Olympic games. Buildings 56. In Africa, buildings alone consume over 50% of energy supply, making it the biggest consumer of energy compared to other sectors. Modern buildings do not always make use of environment-friendly design options and as a result, a huge amount of energy is wasted in buildings. The imposition of tough building standards and mandatory energy certificates, as well as the provision of tax incentives, loans and subsidized feed-in tariffs, have had a measurable impact on energy demand in OECD countries.29 EPA estimates that most new and renovated buildings can achieve energy savings on the order of 30% percent as compared to conventional buildings (U.S. EPA, 2008). This means that with commercially available technologies, energy consumption in both new and existing buildings can be cut by an estimated 30 to 80 percent with a potential net profit during the building life-span30. The potential for successful business in this sector cannot be underestimated (Leipziger, 2013.) 57. Usual regulations/policy tools include (a) building codes that set a maximum limit for the level of heat transfer (b) mandatory building energy audits31 (c) encouraging off-grid applications of renewable energy – e.g. solar water heaters have been mandatory for new buildings in Spain since 2005 and Australia in 2006; (d) disseminating renewable energy appliances (many projects financed by regional development banks have had a clear impact on the use of renewable fuels); and (e) zero-carbon buildings where energy provided by on-site renewable sources is equal to the energy used by the building. Zero energy buildings are connected to the main electricity grid but have zero net consumption because they produce more energy in the summer and consume more in the winter. Interesting projects have been piloted, notably the WWF’s zero-energy housing project in the Netherlands and the Malaysia Energy Center (Pusar Tenaga Malaysia) headquarters in Kuala Lumpur. In Germany, passive building technologies are spreading rapidly, while in France, the Grenelle de l’Environment in France recommended that all new housing be passive or energy-positive by 2020 (UNEP, 2010). 58. South Africa has enacted a detailed legislation on Energy Efficient Buildings. It contains clear instructions for the design of the buildings, orientation, use of windows and light, as well as standard measures to monitor energy efficiency. In many other African countries, especially in Sub-Sahara, there is enormous potential to develop new ways to produce green buildings taking advantage of the traditional low-energy methods and materials. The huge demand for new housing units (both formal and informal) offers a fantastic opportunity for new business to explore new technologies for urban buildings. Adoption of efficient buildings in African cities will bring several co-benefits including reduced energy costs, better functionality (especially in public buildings) and preserving cultural heritage sites. Old buildings are almost always more energy efficient as their construction materials and design were adapted to the climate and
29 C40 Cities Climate Leadership Group. “Best Practices Buildings.” http://www.c40cities.org/bestpractices/buildings/ 30 Study and best practices in the US show that just adjusting building operational practices can provide between 20 and 40% reduction without requiring equipment upgrades or substantial retrofits. See: http://esl.tamu.edu/ 31 In the United States, savings identified after energy auditing can average 38% in cooking, 62% in heating, and 25% overall
Page 22
natural conditions of the place. Reuse of old buildings has become a recommended practice rather than building new ones. Urban Transport and Transit Oriented Development 59. African cities – especially Sub-Saharan cities -- show the results of inefficient transport with high traffic congestion, poor maintenance, unresponsive public transportation, poor road safety and high levels of road accidents and increasing rates of traffic-related emissions (ECA 2009). Urban transport contributes around 22% of the world’s energy related greenhouse gas emissions. It contributes also to time losses, pollution and respiratory diseases and congestion32. In Africa, the existing urban transport infrastructure is limited, serving about 25% of the population. Most of the urban dwellers walk to work (40%), about 20% use private car and the rest use public transportation. Congestion in African large cities is the norm with high commuting time – average 50 minutes for 10 km in Nairobi, going up to 2 hours in Lagos. Urban transport is expensive in African cities. As a percentage of household budgets, urban transport represents 3% in Addis Ababa, 12% in Dar es Salaam, 10% in Nairobi, 13.8% in Lagos and 10% in Johannesburg (UNESC 2009). 60. As African countries develop and the opportunity costs of walking increase, people will expand the use of the private car unless the public transit alternative is cheaper, faster and more convenient (Bertaud et al. 2010). Between 2002 and 2010 the share of private car in the transportation modes went up from 10% to 17% and the use of public transportation fell from 42% to 34% (Pascaline, 2011)33. The trend needs to be reversed but it is not clear whether African cities have the commitment to avoid automobile-dependent sprawl so that African cities could grow more efficient, more inclusive and certainly greener than their peers in the developed world.
The 500 million people who are expected to join African cities in the next 30 years will tend to expand outward, following the trajectory of
automobile dependent sprawl evident in developed countries. 61. Reversing or slowing down the trend of motorized transportation has been the object of analytical work and many successful interventions. By now it is well established that transit-oriented development (TOD) strategies are the most promising means of reversing the automobile-dependent sprawl. TOD combines urban and transit design with economic incentives (land-value capture34, congestion taxes, parking fees) to discourage use of private car and enable financing the alternative public system. Transit and land use integration is consistent with a vision for land-use that shapes regional transit investments rather than vice-versa. Transit is considered one of the three policy tools that are essential for sustainable urbanization, together with supportive zoning and creative financing. 62. Transit-oriented development has been implemented in Curitiba in the 1970s and in Bogota in the 1990s. It could be used by African cities, especially those at the rapid growth stage where the results of higher density and high occupancy public transportation could be easily obtained. The main challenge is technical capacity, planning and good land policies. Transit oriented development depends on good planning to (a) develop strategic plans and vision that integrate transit and urban development and use transit to create desirable patterns of urban growth; (b) remove restrictive regulations and set appropriate
32 In the UK, congestion of roads causes estimated annual losses of around US$11 billion. London’s congestion charge reduced congestion by an estimated 30 per cent between February 2003 and February 2004, in comparison to the same period in previous years and CO2 emissions from traffic inside the charging zone were cut by about 20 percent. 33 For those who cannot afford new private cars, motorized ownership will arrive by way of highly pollution, used vehicles (UNESC 2009, Pascaline 2011), including two-wheeled motorized vehicles such as a scooter or motorcycle whose emission level ranks next to that of cars. A combination of mini-buses, motor cycles and highly congested networks might result in the highest emission levels in developing cities. 34 Experiences in Hong-Kong and Tokyo show that recovering through taxes part of the increase in value produced by public investments has been very effective. Value capture is particularly well suited for financing transit infrastructure in dense congested settings where a high premium is placed on accessibility
Page 23
prices on land (to allow densification in the most valuable places of the city and accrue tax money for the city government); (c) remove subsidies such as subsidized fuel prices, low parking prices and low toll changes; (d) improve short-term mobility and long-term sustainable urban-form; (e) combine TOD with demand management such as congestion charges and parking fees; and (f) pursue sustainable finance through land-value capture. Most of the TOD experiences so far have included the implementation of a Bus Rapid Transit System, dedicated lanes and coordination of transport modes. The consistent use of land densities and the set of economic tools have varied across cities. 63. During the last decade, a number of African cities have adopted the bus rapid transit systems with good results. Cape Town has invested $5.8 billion to develop a Bus Rapid System; Lagos, Johannesburg, Nairobi and Dar es Salam have received financing to establish their own systems. The results are impressive. After the implementation of the 22 km BRT in Lagos, the first dedicated bus route in Sub-Saharan Africa -- BRT gained a modal share of 25% of all motorized transport. Half all the private car users admit that BRT is better than private vehicles in terms of safety, reliability, comfort, and cost (UITP 2010ap; Mobereiola, 2009). In addition, 10 percent traffic and 25,000 tons of CO2 equivalent were reduced. 64 Green initiatives in transport have also been used in Cairo. The Greater Cairo has the second longest superior public transit network in Africa cities. Unfortunately, the BRT was not accompanies by significant changes in the existing public urban transport structure which continues to suffer from congestion and high pollution. Interesting plans in the making include using river transportation as an alternative to reduce congestion. Cairo is also leading initiatives to improve and share successful experiences and environment information around the Mediterranean region. Mostly important, few cities have shown commitment to use policies that discourage motorized solutions. 65. Adoption of low carbon transport to improve access and affordability of public transport in African cities will bring several co-benefits including better services, access to labor markets, poverty alleviation, reduced air pollution and reduced energy use and costs (Bongardt et al 2013). The alternatives include reducing travel demand, shifting towards more efficient transport modes and increasing the efficiency of the transport modes. Transport systems and urban layouts have great inertia and acting now would be the smartest way to go to achieve sustainable cities in terms of design, density and transport (Chapman, 2007).
PART IV – KEY INGREDIENTS FOR AFRICA’S GREEN URBAN AGENDA
66. In the next 20 years, African cities will double in size. While one expects that economic growth will help cities cope with the needs in infrastructure and services, the size of the effort seems almost overwhelming. Fortunately, considerable information and experience has been collected that can be obtained. They will be useful for African cities. Information Tools 67. New tools towards green urban growth are emerging in practice and in the literature. Knowledge, data, benchmarks and metrics are essential ingredients for cities to plan, make a diagnosis, plan ahead, and decide on efficient tools and investments. A wealth of case studies has been assembled and their findings are available to help policy makers make sequential decisions based on economic and sustainable criteria (WB, Green and Inclusive Growth, 2012). The main issue is the need to adapt that information to the specific needs and conditions of African cities. Below are examples of tools and metrics developed in the last five years that could and should be standardized for African cities.
Page 24
• Rankings - City Performance rankings have been developed by major think-thanks including McKenzie, Siemens, Cisco, IBM, Philips, the Economist Intelligence Unit etc. They provide relevant benchmarks for cities to measure progress and establish improvement goals. Data collection varies according to the lens of the analysis and the availability of information at city level. A recent program – Global City Indicator Facility – is trying to standardize indicators in a self-sustaining way so as to provide a common lexicon and comparable information across cities.
• Urban Risk Assessments - a methodology to identify the risks affecting a city in terms of institutional factors, hazard risk and socioeconomic conditions. They are particularly important for African countries where adaptation ought to be an integral part of the greening agenda. Dar-es-Salaam has been part of the study group that provided information for this methodology.
• Urban Metabolism - an approach that provides a detailed account of cities’ environmental impact by analyzing the specific inputs that are used in city activities, as well as the outputs and storage of energy, water, nutrients, and materials. Comprehensive analyses have been carried out in Cape Town, Amman, Manila, Brussels and Beijing.
• New Economic Analysis - Mitigation and adaptation cost curves are very useful tools to be used in cost-benefit analysis to help choose among sustainable interventions. Cape Town has produced a mitigation cost curve analysis.
• High Tech - Remote sensing allows for collection of spatial data. It is important to assess disaster risk, study water resources, and forecast manifestation of climate change. Alexandria, Casablanca and Tunis have used remote sensing technology to assess their climate vulnerability to raising sea water levels.
• Green House Emissions Inventory - This measures emissions from sources within the city boundaries and attributed to city activities, including fossil fuel combustion, industrial production, and decomposition of disposed waste.
68. In addition to data instruments, cities have access to city blogs and associations ranging from the League of Cities and Development to municipal associations focused on particular questions such as public finance and/or water policy. Much is happening in terms of urban research within African Universities with the support from international organizations and Cities-Alliance. The African Center for Cities is one of many promising projects with urbanization reviews being conducted by six African universities. Topics include the specificities of Africa including the size and potential of the informal sector, the need to leap-frog polluting infrastructure solutions, and to unleash the creativity and the potential of African-born knowledge. Criteria for Decision 69. While these metrics assist cities in their planning and monitoring, equally important is to ground decision on sound economic analysis and to encourage choose the best solution in terms of
• Cost-effectiveness and efficiency criteria. The choice of alternative investments is particularly difficult in the presence of interest groups and soft assumptions especially when cities are planning ahead based on very limited past experience. The use of international benchmarks is particularly useful to ensure that minimum efficiency standards are achieved. This is especially important in key sectors such as energy, transport and housing. It has been found that while access to electricity is an urgent objective (social and economic), most African cities and countries will not be able to afford the western solutions and that low-cost alternatives may need to be deployed so as to satisfy the most urgent needs specially in less dense areas.
• Compatibility with economic growth objectives. Green investment in cities needs to be
compatible and reinforce growth and inclusion objectives. Growth in Africa will generate jobs, better living conditions and availability of services for wider groups of people but it will take a while before the very poor will be fully included in the formal economy. Meanwhile, it will make sense to help the new migrants to settle in places where they will not be evicted,
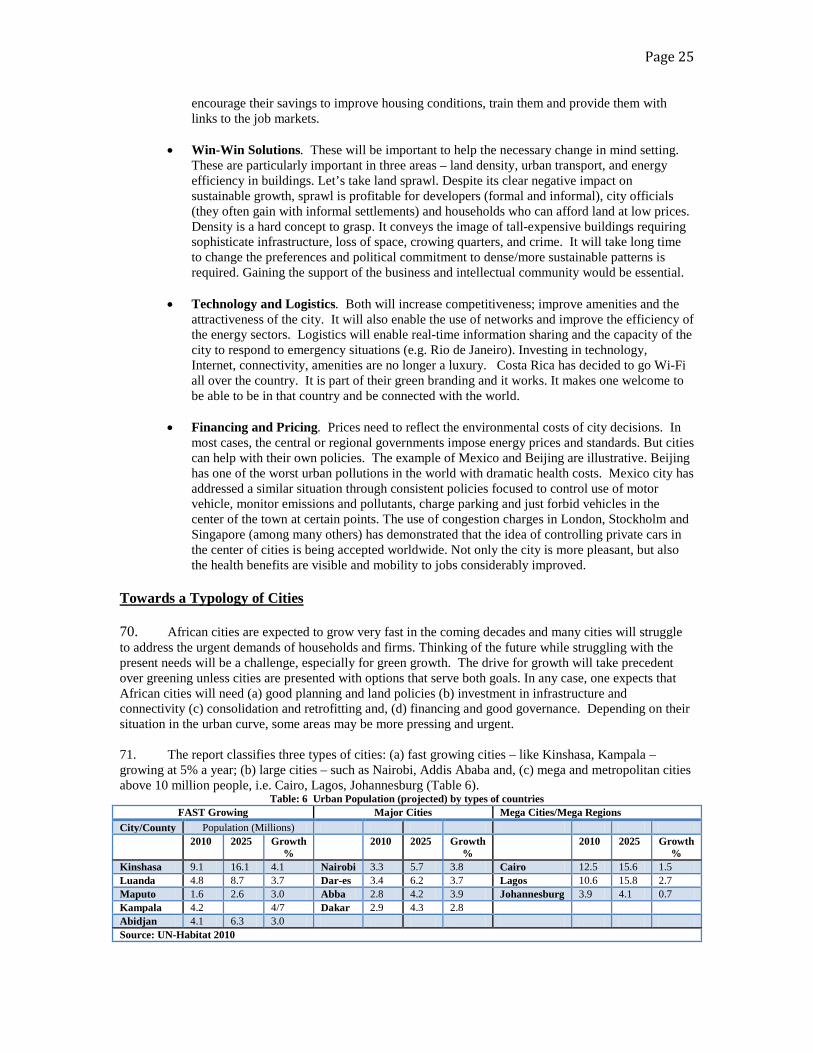
Page 25
encourage their savings to improve housing conditions, train them and provide them with links to the job markets.
• Win-Win Solutions. These will be important to help the necessary change in mind setting.
These are particularly important in three areas – land density, urban transport, and energy efficiency in buildings. Let’s take land sprawl. Despite its clear negative impact on sustainable growth, sprawl is profitable for developers (formal and informal), city officials (they often gain with informal settlements) and households who can afford land at low prices. Density is a hard concept to grasp. It conveys the image of tall-expensive buildings requiring sophisticate infrastructure, loss of space, crowing quarters, and crime. It will take long time to change the preferences and political commitment to dense/more sustainable patterns is required. Gaining the support of the business and intellectual community would be essential.
• Technology and Logistics. Both will increase competitiveness; improve amenities and the
attractiveness of the city. It will also enable the use of networks and improve the efficiency of the energy sectors. Logistics will enable real-time information sharing and the capacity of the city to respond to emergency situations (e.g. Rio de Janeiro). Investing in technology, Internet, connectivity, amenities are no longer a luxury. Costa Rica has decided to go Wi-Fi all over the country. It is part of their green branding and it works. It makes one welcome to be able to be in that country and be connected with the world.
• Financing and Pricing. Prices need to reflect the environmental costs of city decisions. In most cases, the central or regional governments impose energy prices and standards. But cities can help with their own policies. The example of Mexico and Beijing are illustrative. Beijing has one of the worst urban pollutions in the world with dramatic health costs. Mexico city has addressed a similar situation through consistent policies focused to control use of motor vehicle, monitor emissions and pollutants, charge parking and just forbid vehicles in the center of the town at certain points. The use of congestion charges in London, Stockholm and Singapore (among many others) has demonstrated that the idea of controlling private cars in the center of cities is being accepted worldwide. Not only the city is more pleasant, but also the health benefits are visible and mobility to jobs considerably improved.
Towards a Typology of Cities 70. African cities are expected to grow very fast in the coming decades and many cities will struggle to address the urgent demands of households and firms. Thinking of the future while struggling with the present needs will be a challenge, especially for green growth. The drive for growth will take precedent over greening unless cities are presented with options that serve both goals. In any case, one expects that African cities will need (a) good planning and land policies (b) investment in infrastructure and connectivity (c) consolidation and retrofitting and, (d) financing and good governance. Depending on their situation in the urban curve, some areas may be more pressing and urgent. 71. The report classifies three types of cities: (a) fast growing cities – like Kinshasa, Kampala – growing at 5% a year; (b) large cities – such as Nairobi, Addis Ababa and, (c) mega and metropolitan cities above 10 million people, i.e. Cairo, Lagos, Johannesburg (Table 6).
Table: 6 Urban Population (projected) by types of countries FAST Growing Major Cities Mega Cities/Mega Regions
City/County Population (Millions) 2010 2025 Growth
% 2010 2025 Growth
% 2010 2025 Growth
% Kinshasa 9.1 16.1 4.1 Nairobi 3.3 5.7 3.8 Cairo 12.5 15.6 1.5 Luanda 4.8 8.7 3.7 Dar-es 3.4 6.2 3.7 Lagos 10.6 15.8 2.7 Maputo 1.6 2.6 3.0 Abba 2.8 4.2 3.9 Johannesburg 3.9 4.1 0.7 Kampala 4.2 4/7 Dakar 2.9 4.3 2.8 Abidjan 4.1 6.3 3.0 Source: UN-Habitat 2010
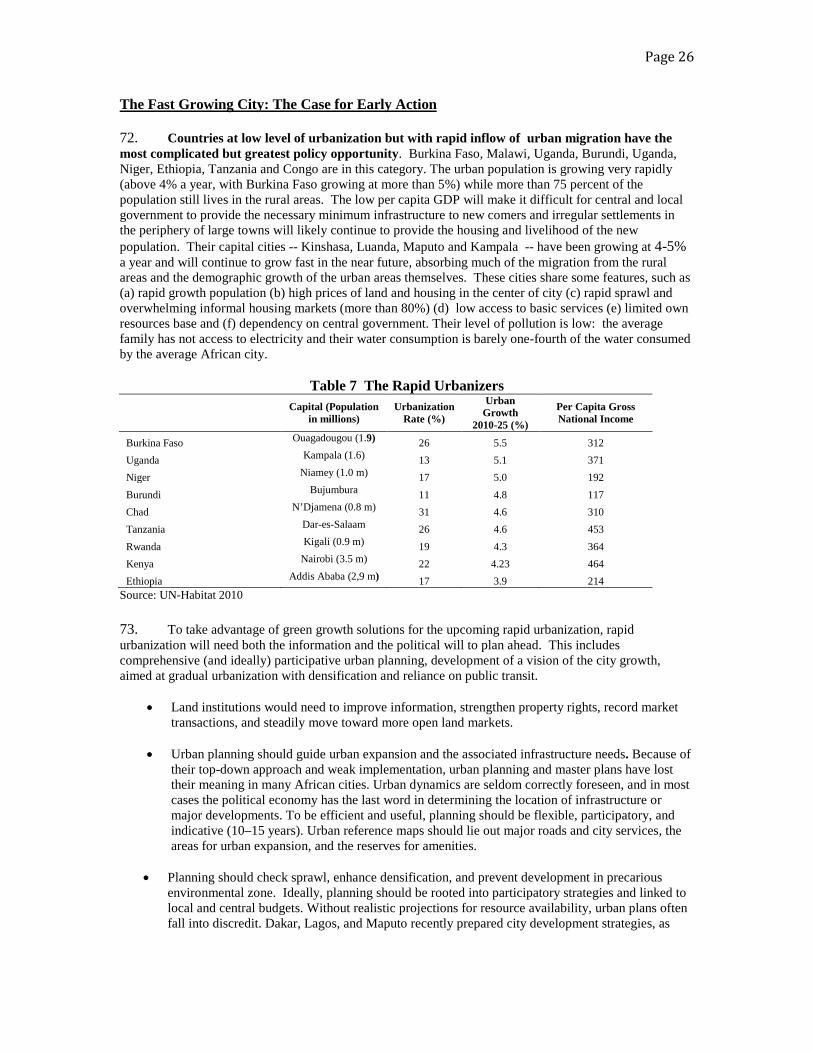
Page 26
The Fast Growing City: The Case for Early Action 72. Countries at low level of urbanization but with rapid inflow of urban migration have the most complicated but greatest policy opportunity. Burkina Faso, Malawi, Uganda, Burundi, Uganda, Niger, Ethiopia, Tanzania and Congo are in this category. The urban population is growing very rapidly (above 4% a year, with Burkina Faso growing at more than 5%) while more than 75 percent of the population still lives in the rural areas. The low per capita GDP will make it difficult for central and local government to provide the necessary minimum infrastructure to new comers and irregular settlements in the periphery of large towns will likely continue to provide the housing and livelihood of the new population. Their capital cities -- Kinshasa, Luanda, Maputo and Kampala -- have been growing at 4-5% a year and will continue to grow fast in the near future, absorbing much of the migration from the rural areas and the demographic growth of the urban areas themselves. These cities share some features, such as (a) rapid growth population (b) high prices of land and housing in the center of city (c) rapid sprawl and overwhelming informal housing markets (more than 80%) (d) low access to basic services (e) limited own resources base and (f) dependency on central government. Their level of pollution is low: the average family has not access to electricity and their water consumption is barely one-fourth of the water consumed by the average African city.
Table 7 The Rapid Urbanizers
Capital (Population in millions)
Urbanization Rate (%)
Urban Growth
2010-25 (%)
Per Capita Gross National Income
Burkina Faso Ouagadougou (1.9) 26 5.5 312 Uganda Kampala (1.6) 13 5.1 371 Niger Niamey (1.0 m) 17 5.0 192 Burundi Bujumbura 11 4.8 117 Chad N’Djamena (0.8 m) 31 4.6 310 Tanzania Dar-es-Salaam 26 4.6 453 Rwanda Kigali (0.9 m) 19 4.3 364 Kenya Nairobi (3.5 m) 22 4.23 464 Ethiopia Addis Ababa (2,9 m) 17 3.9 214
Source: UN-Habitat 2010 73. To take advantage of green growth solutions for the upcoming rapid urbanization, rapid urbanization will need both the information and the political will to plan ahead. This includes comprehensive (and ideally) participative urban planning, development of a vision of the city growth, aimed at gradual urbanization with densification and reliance on public transit.
• Land institutions would need to improve information, strengthen property rights, record market transactions, and steadily move toward more open land markets.
• Urban planning should guide urban expansion and the associated infrastructure needs. Because of
their top-down approach and weak implementation, urban planning and master plans have lost their meaning in many African cities. Urban dynamics are seldom correctly foreseen, and in most cases the political economy has the last word in determining the location of infrastructure or major developments. To be efficient and useful, planning should be flexible, participatory, and indicative (10–15 years). Urban reference maps should lie out major roads and city services, the areas for urban expansion, and the reserves for amenities.
• Planning should check sprawl, enhance densification, and prevent development in precarious
environmental zone. Ideally, planning should be rooted into participatory strategies and linked to local and central budgets. Without realistic projections for resource availability, urban plans often fall into discredit. Dakar, Lagos, and Maputo recently prepared city development strategies, as
Page 27
frameworks to encourage participation from the community in discussing challenges and opportunities.
74. Poverty and inclusion issues will be best addressed by recognizing the role of informal settlements in providing shelter for millions of poor people, and ensuring the delivery of basic services including education and health. This will ensure the required development of human capital which is essential for bridging the inequality gap in next generations. Finance will need to come from the central government, but land based taxes (including property taxes) and user charges could be used effectively. International assistance could be important in identifying the factors that would make possible early-on green strategies for urbanizing Africa. 75. An extraordinary number of great examples have been assembled (especially from Latin America, South and East Asia) on how to pursue green strategies at sector level but very few have been adapted to the specific conditions of African cities. Africa has obtained important advances in city management, public finance, investment capacity, poverty assessments and monitoring and even daily management functions in waste management and water capacity. Privatization has helped improve efficiency of services and trim central bureaucracies. Planning to improve sustainability is the new challenge where experiences from other countries could be essential.
The Large Cities: Capitalizing on Economic Activity 76. Dar-es- Salaam, Nairobi, and Addis Ababa share many characteristics of the first group of cities. The difference is that they started growing earlier, have internalized many of the problems and some of the solutions, and have greater institutional capacity. National universities are producing planners and engineers who are interested and able to contribute to the urban sustainability debate. They have experienced the expansion of the cities inside and outside the boundaries, the low-density sprawl, as well as the emergence of decentralized structures that informally organize/sell services to informal settlements. 77. Their countries are reaching the 50% urbanization rate and have governance structures in place. The challenge is to provide a framework for continuing urban growth, while improving connectivity, density in the center and connectivity outside. This grouping includes the oil exporting countries and the middle-income countries, such as Botswana, Cape Verde, and Senegal. These countries include cities where management and creativity has already produced important results. Middle Income countries of Northern Africa have introduced effective policies to absorb informal settlements and provide shelter to the population. Using methodologies similar to the highly successful in Honk-Kong and Singapore – strong presence of the public sector and an effective housing finance system -- Egypt, Morocco and Tunisia have achieved a remarkable decline in the percentage of population living in slums. Thousands of housing units have been made available in the last ten years. The program includes public investment, finance from the private sector, subsidies to leverage the savings of the households, incentives to cooperatives and self-construction solutions. 78. For large cities in Sub-Saharan Africa, the challenge will be to include the emergent development in the periphery and consolidate or reform the old structure. On land management, there is a need to look at the pattern of density and land prices. Regulations may be too strict and in need to be relaxed so that cities can grow in height and explore the benefits of density. With the available knowledge, these cities will be advised to engage with the private sector and discuss how to invest in a transit-oriented development partly paid by capture-land instruments. Connective infrastructure is a must and savings in energy consumption need to be generated both through regulation and standards, removal of subsidies, carbon taxes, parking fees. Mega Cities: Consolidation towards efficient and productive urban regions 79. Africa is urbanizing fast and with large cities absorbing most of the demographic growth. By 2050, 20 of the largest World cities will be in Africa. In 2100, probably half. Large cities bring enormous opportunities of growth, creativity, and prosperity. They are the center of creativity, knowledge, culture,
Page 28
exchange and democracy. Urban policy makers will face at first excess demand for land and amenities and will see the informal market playing a visible and important role in the shape of the city. But once growth is consolidated and cities will have the means to provide the basic services to all its citizens large cities can be seen as the place for a special kind of agglomeration economies where the proximity of different industries and consumers produce the impetus for new activities and great productivity. To ensure that these opportunities are explored, large African cities need to guarantee well-functioning land markets, efficient connectivity and focus on special intervention such as informality, congestion, and links with other cities. Large cities will have to decide whether they will expand to accommodate the new growth or whether some satellite cities would be appropriate. There are no unique solutions, but African cities will do well if they learn from the examples of their African peers and large cities in Latin America and East and South Asia. 80. African mega cities are very large and have special characteristics. Cairo is a modern city with a very high education level, first world universities, leading thinkers and policy makers. It has registered visible success in dealing with informality and slummization – from 50% to 17% in 20 years – has auctioned public land to obtain funds to finance infrastructure programs, and tried a courageous plan to create new cities in the desert. Johannesburg is another middle-income city with access to information and advice, good universities and think thanks and pioneer in many initiatives in green growth and urban management. Its determination to compensate for the errors of the apartheid era has lead to a densification of the urban grid, a fantastic achievement for any city of its size. Lagos faces growth and governance challenges, but it has shown commitment to improve connectivity, adopted several green policies and has adopted one of the first green environmental plans among African cities. 81. The main challenges faced by these large cities is what to do in terms of consolidation, densification, inclusion and resilience. The issue on how to accommodate the continuing growth should have been addressed earlier, but the alternatives of promoting densification in the center, or encouraging satellite formation in the suburbs is a complicated one that needs considerable thought given the implications on infrastructure and the requirements for successful outcome. Let’s take the examples of Cairo and Seoul. Cairo began the experience of creating dozens of cities in the desert so as to divert the continuing influx of people to Cairo. The result was less positive than expected. Despite the enormous cost (20% of Egypt investment budget for some years), new migrants were not attracted by those cities that were located at more than 40 km of the capital and without affordable connectivity links. In Seoul, the objective of creating a polycentric structure for the mega region followed similar principles. However, connectivity was ensured as the new localities were relatively close to Seoul (10 km). This scheme allowed for an organic decentralization and economic specialization according to natural advantages. 82. Slum upgrading and integration of the informal housing need to occur at this time. It is also the time when formal titling happens, when people accept paying services because it is a sign of citizenship. It is the time when informal developers can upgrade their skills and be part of the program by the government (social developers in Parana). Two approaches are widely used to absorb slum settlements into the formal urban grid. The first consists of sites and services and remedial slum upgrading, including packages of basic services, paving, shelter, social integration, and land titling. The Accra District Rehabilitation Project in Ghana is an example of successful upgrading, as are several national upgrading programs in Ethiopia, Kenya, and Uganda. The second approach, more difficult, takes spatial inefficiencies into account and tries to compensate slum dwellers for disruptions to their livelihoods. Recent urban program with mixed developments and private sector participation in Mumbai and Sao Paulo have shown the benefits of this market-approach solution. 83. In many cities in West and East Africa, central areas have been emptied out as commerce has gone to the periphery and so the families. When areas are low density and on the way to build higher densities, the alternative can be to redesign these areas to accommodate higher densities. This requires assembling small pilots into large and more efficient parcels and ensuring that the new area has sufficient infrastructure, including water, sanitation, and electricity, broadband Internet, to support higher population densities. These programs should take place in consultation with the local population to make sure they benefit. In many cases, slum dwellers are part of the consolidation. From a financial viewpoint these types of operations are often self-financing. If the centre of the city has vitality and economic attractiveness, the new dense zones will be sold at a substantial profit, which the local authority ought to capture to finance
Page 29
the investments of the new zone. This method widely used in Sao Paulo, especially near the stations of metro, can easily be applied to African cities, including Cairo, Dakar, and Accra where old quarters and revitalization of the centre town are overdue. Going Forward: Green Growth is Smart Growth 84. As African countries continue their urbanization process, the rapidly growing populations of cities provide an unprecedented opportunity to plan ahead and ensure that investments and policies are well suited for a sustainable development The Green Growth Report prepared by the World Bank notes several key actions and conditions--- concentrating on the win-wins, leveraging interest in the most urgent and feasible actions, and mobilizing funding for those key actions to go ahead. While large part of this agenda rests on the central government’s shoulders, cities play a fundamental role in ensuring that the green urban strategies are tailored to the local circumstances and that lock-in city investments that lead to irreversible patterns of city life and energy consumption are avoided. Five key messages are extracted from the previous discussion, within the philosophy of concentrating on the most urgent actions, looking for the co-benefits and inventing new ways of financing (World Bank, 2012a):
• Lack of adequate urban policies and institutions is costly for development. Green urban
policies need to anticipate future urbanization and city configurations. Effective policies should allow existing urban areas to redevelop while preparing the urban periphery to accommodate new settlements. For this to work, land markets need to be operate well. African cities can improve the functioning of land markets, promote collection of information relevant for policy making (prices, transactions, cadasters valuations) as well as of tax policy (property tax, impact fees). Regulations need to be flexible to allow for the redeveloping of older settlements as well as to promote the integration of land policy with urban mobility and transportation. Failure to encourage high density will result in higher costs to provide basic services, higher levels of pollution and diminished agglomeration economies.
• Clean/green urbanization is cost effective in the short, medium and long term. For practical
reasons, green strategies at city level ought to concentrate on visible, local and short-run benefits (to obtain the support of constituencies and to attract private interests) while avoiding lock in irreversible infrastructure investments that will produce undesirable outcomes, such as sprawl. The clear example is the impact of clean air policies in reducing pollution while planning ahead to substitute private car use by public transit or non-motorized solutions. City policies to promote energy efficiency and cleaner energy sources for electricity generation, buildings, and urban transport are smart investments. Buildings are one of the largest consumers of energy in cities. Adoption of green building standards and incentives for retrofitting are usually easy steps with the relative short pay-off time (about 3 years).
• Integrated transit/land development is an extraordinary opportunity in the African context
due to the rapid growth and the emergence of cities of all sizes along emerging trade routes. There are enormous possibilities for African rapidly growing medium-size cities to adapt efficient transit-oriented development models developed elsewhere (e.g., by Curitiba and Bogota) to their own conditions. Cities and countries in Northern Africa have been successful in designing and implementing effective housing programs in conjunction with the private and financial sectors. New cities that will emerge along the new African corridors (e.g., Nile Corridor.) could be a good laboratory for planning efficient and greener urban areas in an integrated way.
• Draw on the power of the private sector. Firms have a major role in providing solutions to green growth. They have capacity to innovate, drive to adjust production processes, and are vigilant in terms of costs. It makes sense for local governments to work firms so as to align actions with the green objectives of the city. Open information on GHG emissions and environmental impact will improve the capacity of the population to press private businesses to be greener. But cities can also attract the private sector to partner in adapting new green technologies
Page 30
to the African context (e.g. using traditional construction materials, studying the efficiency of the traditional design, using renewable and inexpensive energy.). Many of the needed investments could benefit from public-private partnerships, learning from the success already obtained in few sectors namely telecoms, energy, and housing. The examples of Mexican and Brazilian firms working with public banks to extend affordable shelter to millions of urban households attest to potential that private sector developers can bring to the urban challenge.
• Data and information are increasingly important for monitoring green policies, but also to balance trade-offs and help making the right choices. Green policies need to focus on short-term and immediate actions while avoiding locking-in potentially problematic investments. A reliable and easy system of data collection and indicators (benchmarks) can be indispensable to help African cities to identify their needs, plan their development and monitor their progress. A host of public and private partners are eager to continue their work of collecting information and presenting it in ways that helps cities design their next steps towards sustainability.
85. The major message of the report is to avoid segmentation of policies into those that spur economic growth, those that assist sustainability, and those that support the inevitable development of cities. As a combined policy imperative, countries and major cities face the opportunity to drive more efficient growth, lower long-term costs of managing cities, and greater ease of metropolitan management. Green Growth is not a slogan and not an agenda driven solely by climate change objectives (Leipziger, 2012). It is smart city growth, and given Africa’s demographics and projected urbanization patterns, it is clearly the superior policy approach to create sustainable and inclusive economic growth for its increasing urban populations.
Page 31
REFERENCES Angel, Shlomo, Parent, Jason, Civco D.L., and Blei A.M. 2011. Making Room for a Planet of Cities. Linco
ln Institute of Land Policy, Cambridge, USA. Bongardt,D., Felix Creutzig, Hanna Hüging, Ko Sakamoto, Stefan Bakker, Sudhir Gota, Susanne Böhler-
Baedeker.2013. Low-Carbon Land Trasnport handbook, New York: Routledge Bertau, Alain.2010. Land markets, government Interventions, and housing Affordability pp. 9 in
Wolfensohn Center for Development, Working Paper 18, May 2010. Chapman, L. 2007. Transport and climate change: A review. Journal of Transport Geography, Vol.15, No.5
pp. 354-367, ISSN 0966-6923 Climate Leadership Group. 2008. “C40 Cities Best Practices’ http://www.c40cities.org/bestpractices/ Collier, Paul .2006. Africa’s Economic Growth: Opportunities and Constraints, Oxford University, Center
for African Studies. . Durand Lasserve and Harris Selod .2012. Land markets and land delivery systems in rapidly expanding
West African cities: the case of Bamako. Paper presented at 4th Urban Research Symposium, Washington DC.
Duranton, G. and Diego Puga. 2002. “Diversity and Specialization in Cities: Why, Where and When Does it Matter,” in P. McCann (ed.) Industrial Location Economics, ed. P. McCann. Cheltenham, U.K.: Edward Elgar.
Dodman, D. (2009) Urban Density and Climate Change, United Nations Population Fund (UNFPA), Analytical Review of the Interaction between Urban Growth Trends and Environmental Changes, Paper 1
de Serres, A., Murtin F. and Nicoletti G. .2010. “A Framework for Assessing Green Growth Policies”, OECD Economics Department Working Papers, No. 774, OECD Publishing (available at http://www.oecd-
Economic Commission for Africa .2009. Greening the Blue. Addis Abada: United Nations
Farvacque-Vitkovic, Catherine, Matthew Glasser, Barjor Mehta, Madhu Raghunath, Austin Kilroy, Alvaro Federico Barra, and Raj Salooja. 2008. “Africa’s Urbanization for Development: Under- standing Africa’s Urban Challenges and Opportunities.” World Bank, Washington, DC.
Ferreira, F.H.G., and M.Ravaillon. 2009. “Poverty and Inequality: The Global Context.” In Oxford Handbook of Economic Inequality, ed. B. Nolan, W. Salvedra and T. Smeeding, ch. 24. Oxford: Oxford University Press.
Freire, Mila and Mario Polese. 2003. Connecting Cities with Macroeconomic Concerns: the Missing Link. Montreal: Institut National de la Recherche Scientifique and the World Bank. (GCAP 2011;
Glaeser,E.L., H.D. Kallal, J.A. Scheinkman. 1992. “Grpwth in Cities” Journal of Political Economy 100 (6): 1126-1152
Glaeser, E. L. 2011. The Triumph of the City. London: the Penguin Press Hallegate, Stephan .2012. – The Economics of Sustainable Cities in Towards a Partnership of Sustainable
Cities forthcoming Fall 2013, World Bank Hallegatte, S., G. Heal, M. Fay, D. Treguer, 2011. From growth to green growth – a framework, Policy
Research Working Paper 5872, The World Bank. Hoornweg D, Freire M. Yen, B.. 2011. Cities and Climate Change an Urgent Agenda, World Bank. Hoornweg, D., Freire M., Yen, Belinda .2012. Cities and Climate Change: Proceedings of the 5th Research
Symposium on Cities and Climate Change, Marseille, 2009. IMF, 2011. Regional Economic Outlook for Africa: Sustaining the growth, October 2011. Washington
D.C.: International Monetary Fund Khan, Matthew E. 2006. Green Cities: Urban Growth and the Environment. Washington, D.C.: Brookings
Institution Press Kennedy, Chistopher, D. Bristow, Sybil Derrible, Eugene Moharch, Sheyda Saneijehad, Robert Stupka,
Lorraise Sugar, Ryan Zizzo and Bernard McIntyre . 2010. Getting to Carbon Neutral: A Review of Best Practices in Infrastructure Strategy in Energy Efficient Cities: Assessment Tools and Benchmarking Practices, R. Bose (ed.) The World Bank.
Page 32
Kessides, Christine. 2006. The Urban Transition in Sub-Saharan Africa. Implications for Economic Growth and Poverty Reduction. Washington DC: Cities-Alliance.
Lasserve, Durand (ed.) .2012. Holding Their Ground: Secure Land Tenure for the Urban Poor in Developing Countries. London: Earthscan.
Leipziger, Danny. 2012. Cities as Green Growth Innovators, in Economic Viewpoint, George Washington University School of Business.
Leipziger, David 2013. Comparing Building Energy Performance Measurement, A framework for international energy efficiency assessment systems. Institute for Market Transformation (IMT), Global Buildings Performance Network (GBPN)
Marland, G., T.A. Boden, and R.J. Andres. 2008. Global, Regional, and National Fossil Fuel CO2 Emissions. In Trends: A Compendium of Data on Global Change. Carbon Dioxide Information Analysis Center, Oak Ridge National Laboratory, U.S. Department of Energy, Oak Ridge, Tenn., U.S.A.
Mobereola Dayo. 2009. Africa’s First Bus Rapid Transit Scheme: The Lagos BRT-Lite System. SSATP (Sub-Saharan Africa Transport Policy Program Discussion Paper 9, Urban Transport Series, World Bank.
Nandi, Sangeeta and Ranjan K. Bose. 2010. The imperative of Efficient Energy Use in Cities: Analytical Approaches and Good Practices, in Energy Efficient Cities: Assessment Tools and Benchmarking Practices, Ranjan K. Bose (ed). The World Bank.
OECD .2012. Green Growth and Developing Countries: Consultation Draft. Organization for Economic Cooperation and Development, June 2012
OECD. 2011. Compact City Policies: A comparative Assessment. Paris: OECD Pascaline .2011.Future of Five African Cities: Johannesburg, Lagos, Nairobi, Dar es Salaam and Addis
Ababa: Opportunities for Sustainable Growth (mimeo). The World Bank Paulais, Thierry .2012, Financing Africa’s Cities the Imperative of Local Investment, AFD and The World
Bank. Rosenthal, S.R. and W.C. Strange.2001. The Determinants of Agglomeration. Journal of Urban
Economics 50:191-229 SEI 2009 Spence M., Annez, P., and Buckley, R. .2009. Urbanization and Growth: Background paper for the
Commissioni on Growth and Development. Washington DC Singh, Jas, Dilip Limaye, Brian Henderson and Xiaoyu Shi.2010. Public Procurement of Energy Efficiency Services: Lesson from
International Experience. Washington DC: World Bank Suzuki, Hro, Arish Dastur, Sebastian Moffatt, Nanae Yabuki, Hinako Maryama. 2010 Eco2 Cities:
Ecological Cities as Economic Cities Wolrd Bank, Washington DC UNEP .2010. Green Economy Report: A Preview. United Nations Environment Program (available at: UNEP .2011. Towards a Green Economy: Pathways to Sustainable Development and Poverty Eradication,
United Nations Environment Program, Nairobi UN-Habitat. 2010. The State of African Cities 2010, Governance Inequality and Urban Land Markets,
Nairobi. UITP International Association of Public Transport. 2010. Report on Statistical Indicators of Public Transport Performance in Africa. Trans-Africa Consortium: Brussels. U.S. Environmental Protection Agency. 2008. “The ENERGY STAR for Buildings,” available at energystar.gov/index.cfm?c=business.bus_bldgs. World Bank. 2013a. Planning, Connecting and Financing Cities – Now, Priorities for City Leaders,
Washington DC World Bank .2013b. Towards a Partnership of Sustainable Cities. Upcoming publication in Summer 2013. World Bank .2012b. Sustainable Cities – South Africa. Washington DC World Bank. 2012a. Green and Inclusive Growth. Washington DC: the World Bank World Bank .2010. Africa’s Infrastructure. A Time for Transformation 2010. Washington Dc. World Bank. 2009. Reshaping Economic Geography, Washington DC Yusuf, Shahid, ed.. 2013. Five Cities Going Green: How are they doing it? Washington DC: The Growth
Dialogue Zenghelis, Dimitri, 2013 Economics of Green Cities in Towards a Partnership of Sustainable Cities
(forthcoming) World Bank
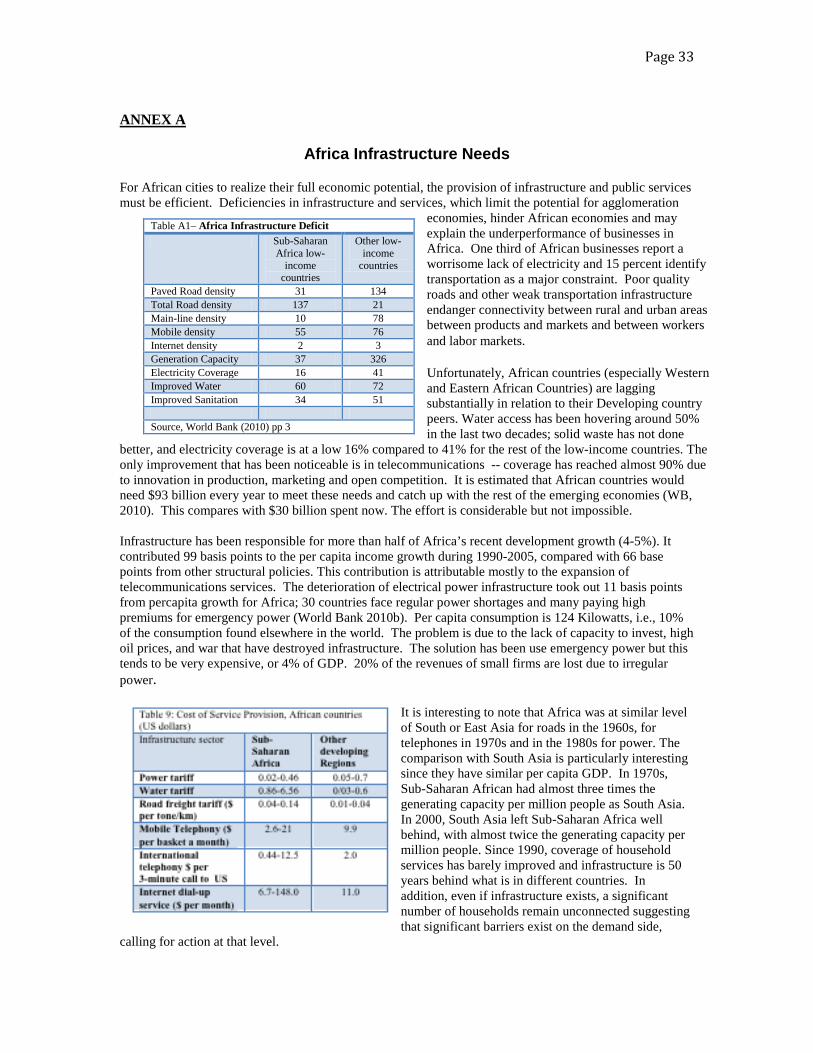
Page 33
ANNEX A
Africa Infrastructure Needs For African cities to realize their full economic potential, the provision of infrastructure and public services must be efficient. Deficiencies in infrastructure and services, which limit the potential for agglomeration
economies, hinder African economies and may explain the underperformance of businesses in Africa. One third of African businesses report a worrisome lack of electricity and 15 percent identify transportation as a major constraint. Poor quality roads and other weak transportation infrastructure endanger connectivity between rural and urban areas between products and markets and between workers and labor markets. Unfortunately, African countries (especially Western and Eastern African Countries) are lagging substantially in relation to their Developing country peers. Water access has been hovering around 50% in the last two decades; solid waste has not done
better, and electricity coverage is at a low 16% compared to 41% for the rest of the low-income countries. The only improvement that has been noticeable is in telecommunications -- coverage has reached almost 90% due to innovation in production, marketing and open competition. It is estimated that African countries would need $93 billion every year to meet these needs and catch up with the rest of the emerging economies (WB, 2010). This compares with $30 billion spent now. The effort is considerable but not impossible. Infrastructure has been responsible for more than half of Africa’s recent development growth (4-5%). It contributed 99 basis points to the per capita income growth during 1990-2005, compared with 66 base points from other structural policies. This contribution is attributable mostly to the expansion of telecommunications services. The deterioration of electrical power infrastructure took out 11 basis points from percapita growth for Africa; 30 countries face regular power shortages and many paying high premiums for emergency power (World Bank 2010b). Per capita consumption is 124 Kilowatts, i.e., 10% of the consumption found elsewhere in the world. The problem is due to the lack of capacity to invest, high oil prices, and war that have destroyed infrastructure. The solution has been use emergency power but this tends to be very expensive, or 4% of GDP. 20% of the revenues of small firms are lost due to irregular power.
It is interesting to note that Africa was at similar level of South or East Asia for roads in the 1960s, for telephones in 1970s and in the 1980s for power. The comparison with South Asia is particularly interesting since they have similar per capita GDP. In 1970s, Sub-Saharan African had almost three times the generating capacity per million people as South Asia. In 2000, South Asia left Sub-Saharan Africa well behind, with almost twice the generating capacity per million people. Since 1990, coverage of household services has barely improved and infrastructure is 50 years behind what is in different countries. In addition, even if infrastructure exists, a significant number of households remain unconnected suggesting that significant barriers exist on the demand side,
calling for action at that level.
Table A1– Africa Infrastructure Deficit Sub-Saharan
Africa low-income
countries
Other low-income
countries
Paved Road density 31 134 Total Road density 137 21 Main-line density 10 78 Mobile density 55 76 Internet density 2 3 Generation Capacity 37 326 Electricity Coverage 16 41 Improved Water 60 72 Improved Sanitation 34 51 Source, World Bank (2010) pp 3
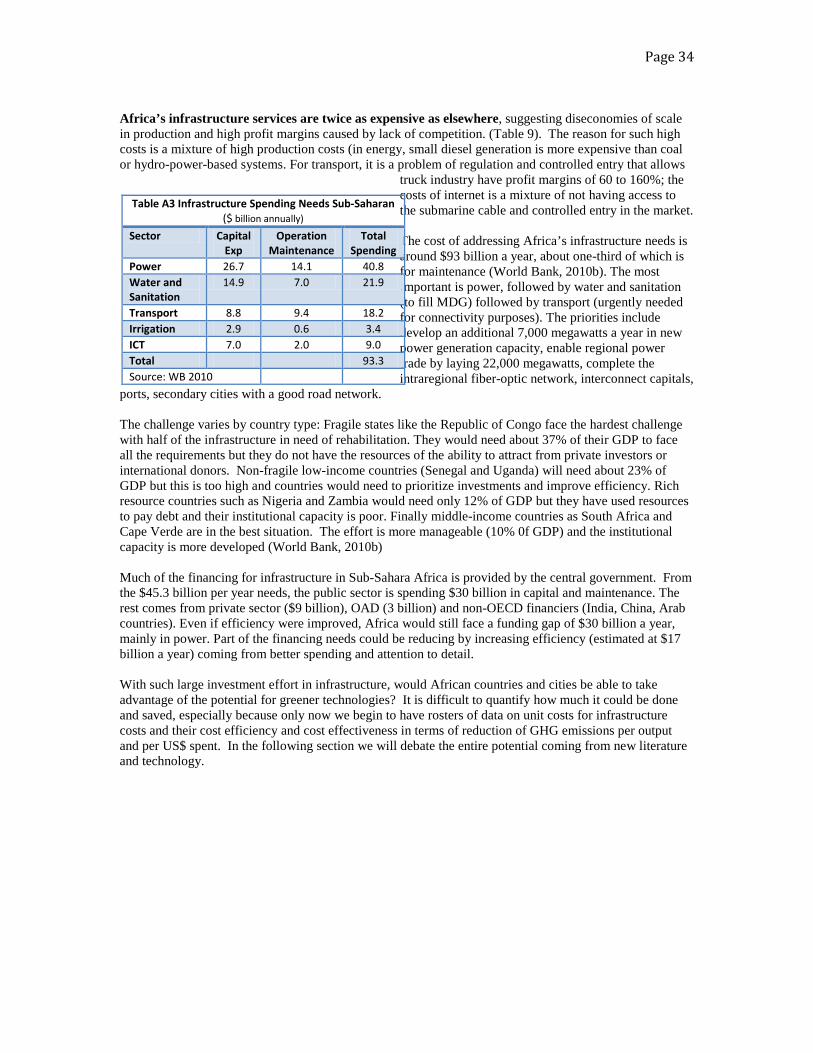
Page 34
Africa’s infrastructure services are twice as expensive as elsewhere, suggesting diseconomies of scale in production and high profit margins caused by lack of competition. (Table 9). The reason for such high costs is a mixture of high production costs (in energy, small diesel generation is more expensive than coal or hydro-power-based systems. For transport, it is a problem of regulation and controlled entry that allows
truck industry have profit margins of 60 to 160%; the costs of internet is a mixture of not having access to the submarine cable and controlled entry in the market. The cost of addressing Africa’s infrastructure needs is around $93 billion a year, about one-third of which is for maintenance (World Bank, 2010b). The most important is power, followed by water and sanitation (to fill MDG) followed by transport (urgently needed for connectivity purposes). The priorities include develop an additional 7,000 megawatts a year in new power generation capacity, enable regional power trade by laying 22,000 megawatts, complete the intraregional fiber-optic network, interconnect capitals,
ports, secondary cities with a good road network. The challenge varies by country type: Fragile states like the Republic of Congo face the hardest challenge with half of the infrastructure in need of rehabilitation. They would need about 37% of their GDP to face all the requirements but they do not have the resources of the ability to attract from private investors or international donors. Non-fragile low-income countries (Senegal and Uganda) will need about 23% of GDP but this is too high and countries would need to prioritize investments and improve efficiency. Rich resource countries such as Nigeria and Zambia would need only 12% of GDP but they have used resources to pay debt and their institutional capacity is poor. Finally middle-income countries as South Africa and Cape Verde are in the best situation. The effort is more manageable (10% 0f GDP) and the institutional capacity is more developed (World Bank, 2010b)
Much of the financing for infrastructure in Sub-Sahara Africa is provided by the central government. From the $45.3 billion per year needs, the public sector is spending $30 billion in capital and maintenance. The rest comes from private sector ($9 billion), OAD (3 billion) and non-OECD financiers (India, China, Arab countries). Even if efficiency were improved, Africa would still face a funding gap of $30 billion a year, mainly in power. Part of the financing needs could be reducing by increasing efficiency (estimated at $17 billion a year) coming from better spending and attention to detail. With such large investment effort in infrastructure, would African countries and cities be able to take advantage of the potential for greener technologies? It is difficult to quantify how much it could be done and saved, especially because only now we begin to have rosters of data on unit costs for infrastructure costs and their cost efficiency and cost effectiveness in terms of reduction of GHG emissions per output and per US$ spent. In the following section we will debate the entire potential coming from new literature and technology.
Table A3 Infrastructure Spending Needs Sub-Saharan ($ billion annually)
Sector Capital Exp
Operation Maintenance
Total Spending
Power 26.7 14.1 40.8 Water and Sanitation
14.9 7.0 21.9
Transport 8.8 9.4 18.2 Irrigation 2.9 0.6 3.4 ICT 7.0 2.0 9.0 Total 93.3 Source: WB 2010
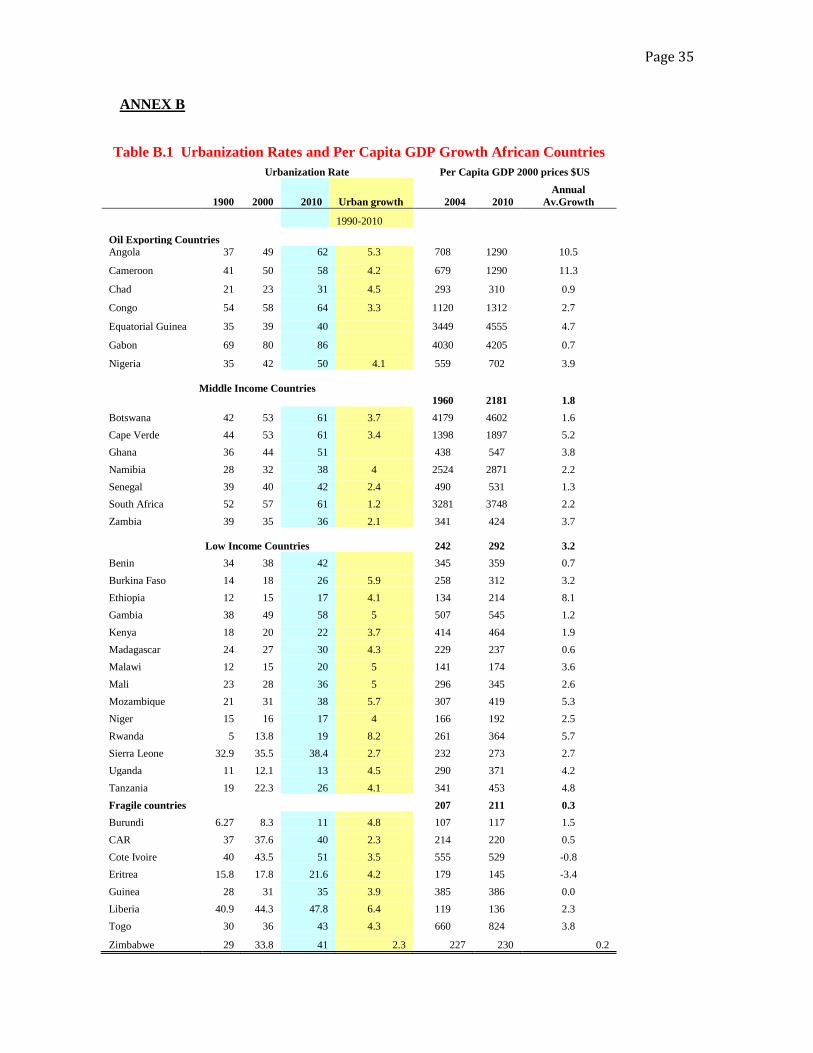
Page 35
ANNEX B
Table B.1 Urbanization Rates and Per Capita GDP Growth African Countries Urbanization Rate Per Capita GDP 2000 prices $US
1900 2000 2010 Urban growth 2004 2010 Annual
Av.Growth
1990-2010
Oil Exporting Countries Angola 37 49 62 5.3 708 1290 10.5
Cameroon 41 50 58 4.2 679 1290 11.3
Chad 21 23 31 4.5 293 310 0.9
Congo 54 58 64 3.3 1120 1312 2.7
Equatorial Guinea 35 39 40 3449 4555 4.7
Gabon 69 80 86 4030 4205 0.7
Nigeria 35 42 50 4.1 559 702 3.9
Middle Income Countries 1960 2181 1.8
Botswana 42 53 61 3.7 4179 4602 1.6 Cape Verde 44 53 61 3.4 1398 1897 5.2 Ghana 36 44 51 438 547 3.8 Namibia 28 32 38 4 2524 2871 2.2 Senegal 39 40 42 2.4 490 531 1.3 South Africa 52 57 61 1.2 3281 3748 2.2 Zambia 39 35 36 2.1 341 424 3.7
Low Income Countries 242 292 3.2
Benin 34 38 42 345 359 0.7 Burkina Faso 14 18 26 5.9 258 312 3.2 Ethiopia 12 15 17 4.1 134 214 8.1 Gambia 38 49 58 5 507 545 1.2 Kenya 18 20 22 3.7 414 464 1.9 Madagascar 24 27 30 4.3 229 237 0.6 Malawi 12 15 20 5 141 174 3.6 Mali 23 28 36 5 296 345 2.6 Mozambique 21 31 38 5.7 307 419 5.3 Niger 15 16 17 4 166 192 2.5 Rwanda 5 13.8 19 8.2 261 364 5.7 Sierra Leone 32.9 35.5 38.4 2.7 232 273 2.7 Uganda 11 12.1 13 4.5 290 371 4.2 Tanzania 19 22.3 26 4.1 341 453 4.8 Fragile countries 207 211 0.3 Burundi 6.27 8.3 11 4.8 107 117 1.5 CAR 37 37.6 40 2.3 214 220 0.5 Cote Ivoire 40 43.5 51 3.5 555 529 -0.8 Eritrea 15.8 17.8 21.6 4.2 179 145 -3.4 Guinea 28 31 35 3.9 385 386 0.0 Liberia 40.9 44.3 47.8 6.4 119 136 2.3 Togo 30 36 43 4.3 660 824 3.8
Zimbabwe 29 33.8 41 2.3 227 230 0.2
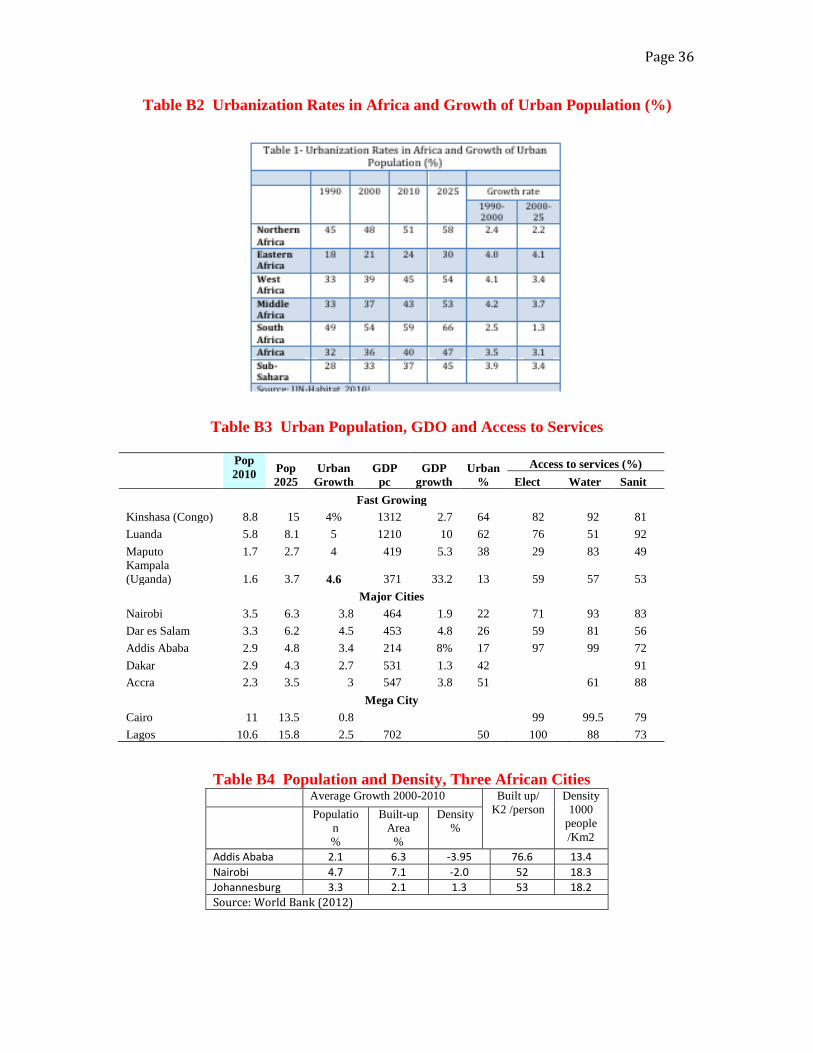
Page 36
Table B2 Urbanization Rates in Africa and Growth of Urban Population (%)
Table B3 Urban Population, GDO and Access to Services
Pop 2010 Pop
2025 Urban
Growth GDP
pc GDP
growth Urban
% Access to services (%)
Elect Water Sanit Fast Growing
Kinshasa (Congo) 8.8 15 4% 1312 2.7 64 82 92 81 Luanda 5.8 8.1 5 1210 10 62 76 51 92 Maputo 1.7 2.7 4 419 5.3 38 29 83 49 Kampala (Uganda) 1.6 3.7 4.6 371 33.2 13 59 57 53
Major Cities Nairobi 3.5 6.3 3.8 464 1.9 22 71 93 83 Dar es Salam 3.3 6.2 4.5 453 4.8 26 59 81 56 Addis Ababa 2.9 4.8 3.4 214 8% 17 97 99 72 Dakar 2.9 4.3 2.7 531 1.3 42 91 Accra 2.3 3.5 3 547 3.8 51 61 88
Mega City Cairo 11 13.5 0.8 99 99.5 79 Lagos 10.6 15.8 2.5 702 50 100 88 73
Table B4 Population and Density, Three African Cities Average Growth 2000-2010 Built up/
K2 /person
Density 1000
people /Km2
Population %
Built-up Area
%
Density%
Addis Ababa 2.1 6.3 -3.95 76.6 13.4 Nairobi 4.7 7.1 -2.0 52 18.3 Johannesburg 3.3 2.1 1.3 53 18.2 Source: World Bank (2012)
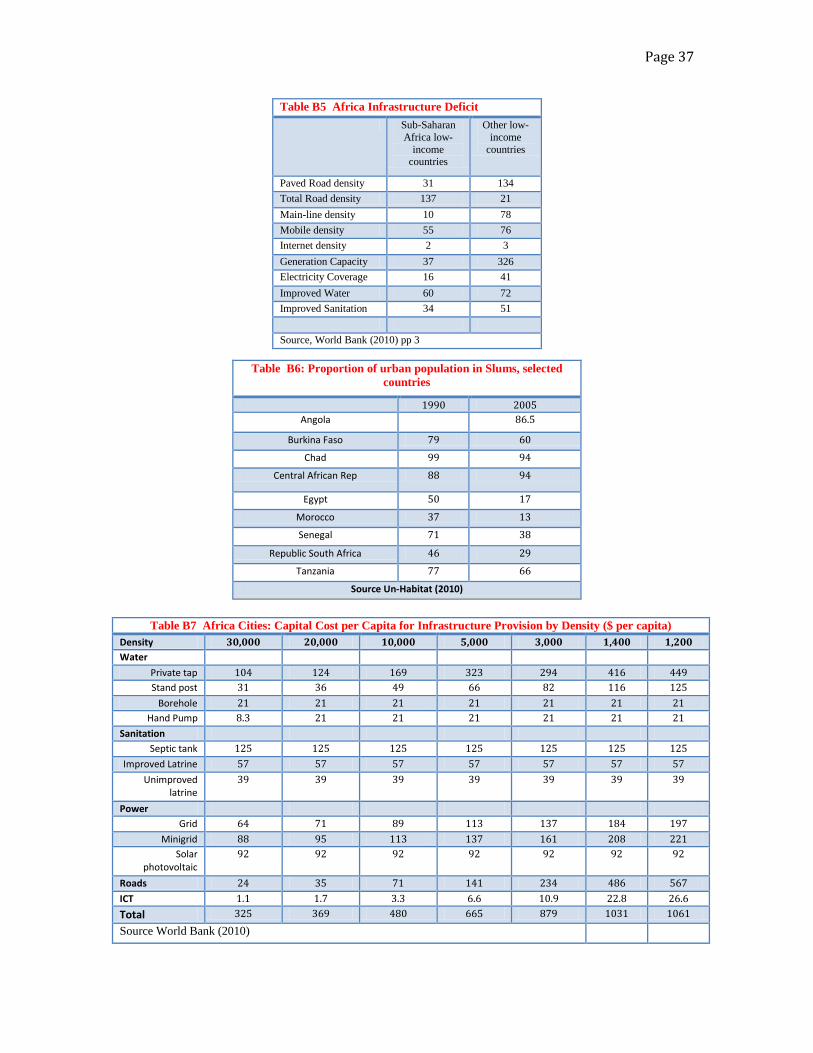
Page 37
Table B7 Africa Cities: Capital Cost per Capita for Infrastructure Provision by Density ($ per capita) Density 30,000 20,000 10,000 5,000 3,000 1,400 1,200 Water
Private tap 104 124 169 323 294 416 449 Stand post 31 36 49 66 82 116 125
Borehole 21 21 21 21 21 21 21 Hand Pump 8.3 21 21 21 21 21 21
Sanitation Septic tank 125 125 125 125 125 125 125
Improved Latrine 57 57 57 57 57 57 57 Unimproved
latrine 39 39 39 39 39 39 39
Power Grid 64 71 89 113 137 184 197
Minigrid 88 95 113 137 161 208 221 Solar
photovoltaic 92 92 92 92 92 92 92
Roads 24 35 71 141 234 486 567 ICT 1.1 1.7 3.3 6.6 10.9 22.8 26.6 Total 325 369 480 665 879 1031 1061 Source World Bank (2010)
Table B6: Proportion of urban population in Slums, selected countries
1990 2005 Angola 86.5
Burkina Faso 79 60 Chad 99 94
Central African Rep 88 94
Egypt 50 17
Morocco 37 13 Senegal 71 38
Republic South Africa 46 29 Tanzania 77 66
Source Un-Habitat (2010)
Table B5 Africa Infrastructure Deficit Sub-Saharan
Africa low-income
countries
Other low-income
countries
Paved Road density 31 134 Total Road density 137 21 Main-line density 10 78 Mobile density 55 76 Internet density 2 3 Generation Capacity 37 326 Electricity Coverage 16 41 Improved Water 60 72 Improved Sanitation 34 51 Source, World Bank (2010) pp 3
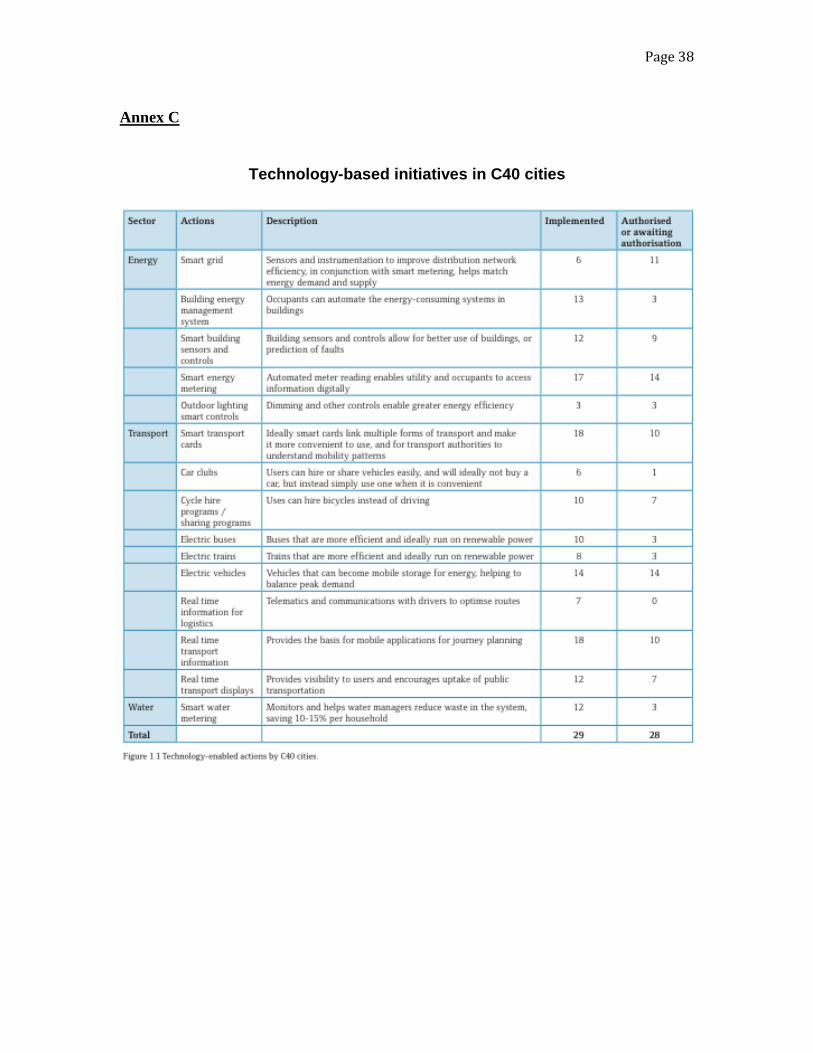
Page 38
Annex C
Technology-based initiatives in C40 cities