Embed Size (px)
Citation preview
GeoJournal 34.3 287-293 © 1994 (Nov) by Kluwer Academic Publishers
287
Urbanization and Vulnerable Urban Groups in Gaborone/Botswana
Kriiger, Fred, Dr., University of Freiburg, Institute of Cultural Geography, 79085 Freiburg, Germany
ABSTRACT: This article examines two factors which are of major importance for urban poverty groups in Botswana: the costs the urban poor have to pay for housing, and the role assets like cattle and land play as safety elements in the urban livelihood system.
Focus on the Urban Poor
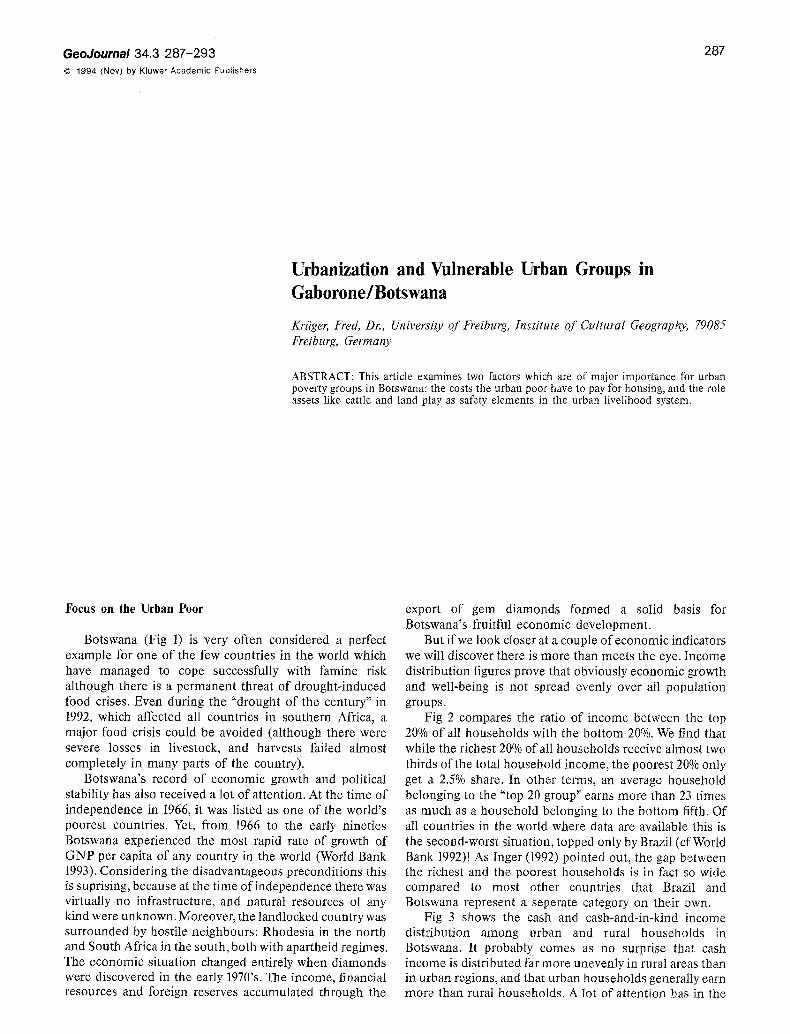
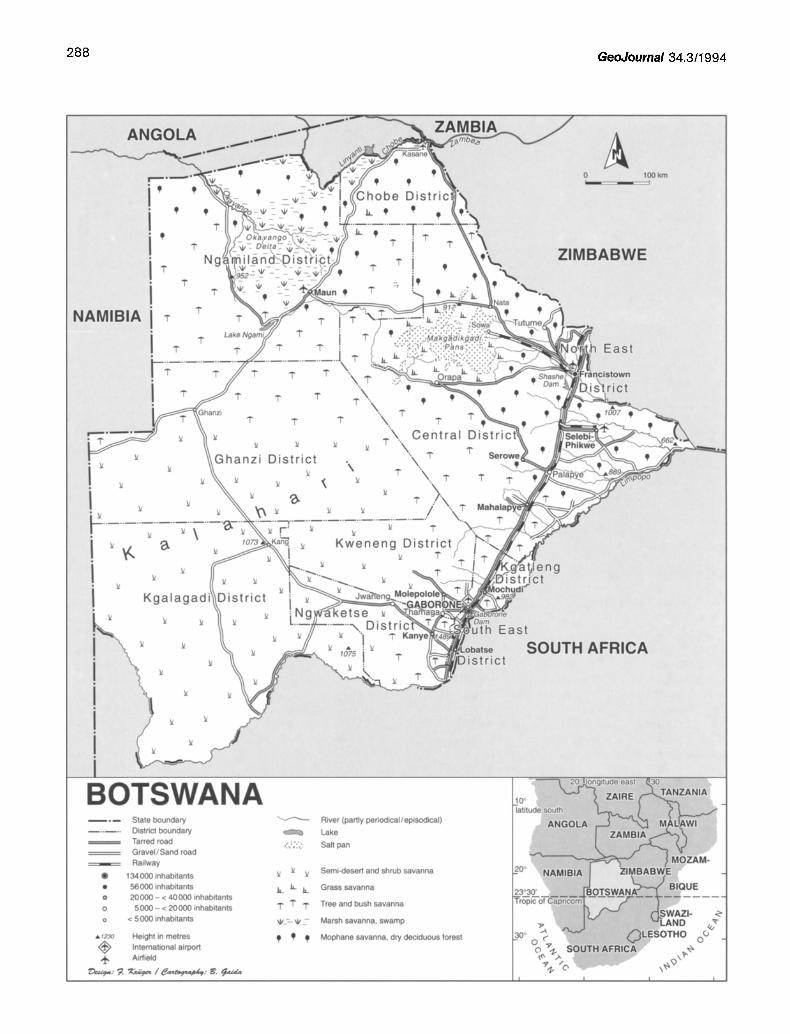
Botswana (Fig 1) is very often considered a perfect example for one of the few countries in the world which have managed to cope successfully with famine risk although there is a permanent threat of drought-induced food crises. Even during the "drought of the century" in 1992, which affected all countries in southern Africa, a major food crisis could be avoided (although there were severe losses in livestock, and harvests failed almost completely in many parts of the country).
Botswana's record of economic growth and political stability has also received a lot of attention. At the time of independence in 1966, it was listed as one of the world's poorest countries. Yet, from 1966 to the early nineties Botswana experienced the most rapid rate of growth of GNP per capita of any country in the world (World Bank 1993). Considering the disadvantageous preconditions this is suprising, because at the time of independence there was virtually no infrastructure, and natural resources of any kind were unknown. Moreover, the landlocked country was surrounded by hostile neighbours: Rhodesia in the north and South Africa in the south, both with apartheid regimes. The economic situation changed entirely when diamonds were discovered in the early 1970's. The income, financial resources and foreign reserves accumulated through the
export of gem diamonds formed a solid basis for Botswana's fruitful economic development.
But if we look closer at a couple of economic indicators we will discover there is more than meets the eye. Income distribution figures prove that obviously economic growth and well-being is not spread evenly over all population groups.
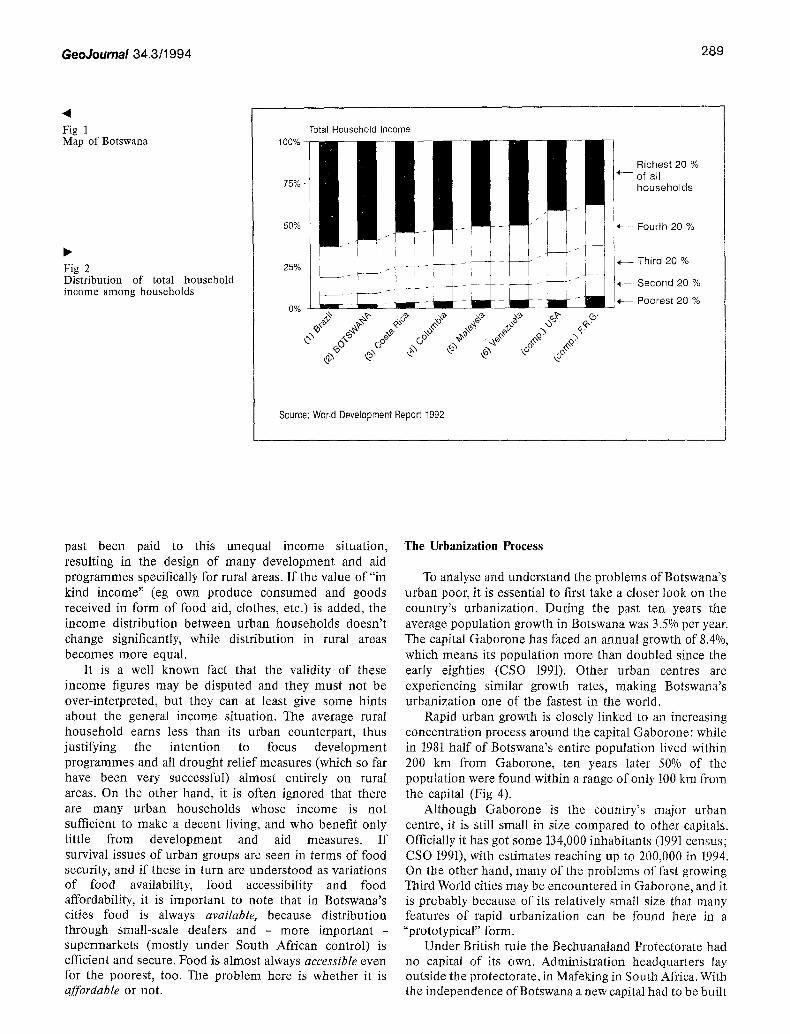
Fig 2 compares the ratio of income between the top 20o/0 of all households with the bottom 200/0. We find that while the richest 20% of all households receive almost two thirds of the total household income, the poorest 20% only get a 2.5% share. In other terms, an average household belonging to the "top 20 group" earns more than 23 times as much as a household belonging to the bottom fifth. Of all countries in the world where data are available this is the second-worst situation, topped only by Brazil (cfWorld Bank 1992)! As Inger (1992) pointed out, the gap between the richest and the poorest households is in fact so wide compared to most other countries that Brazil and Botswana represent a seperate category on their own.
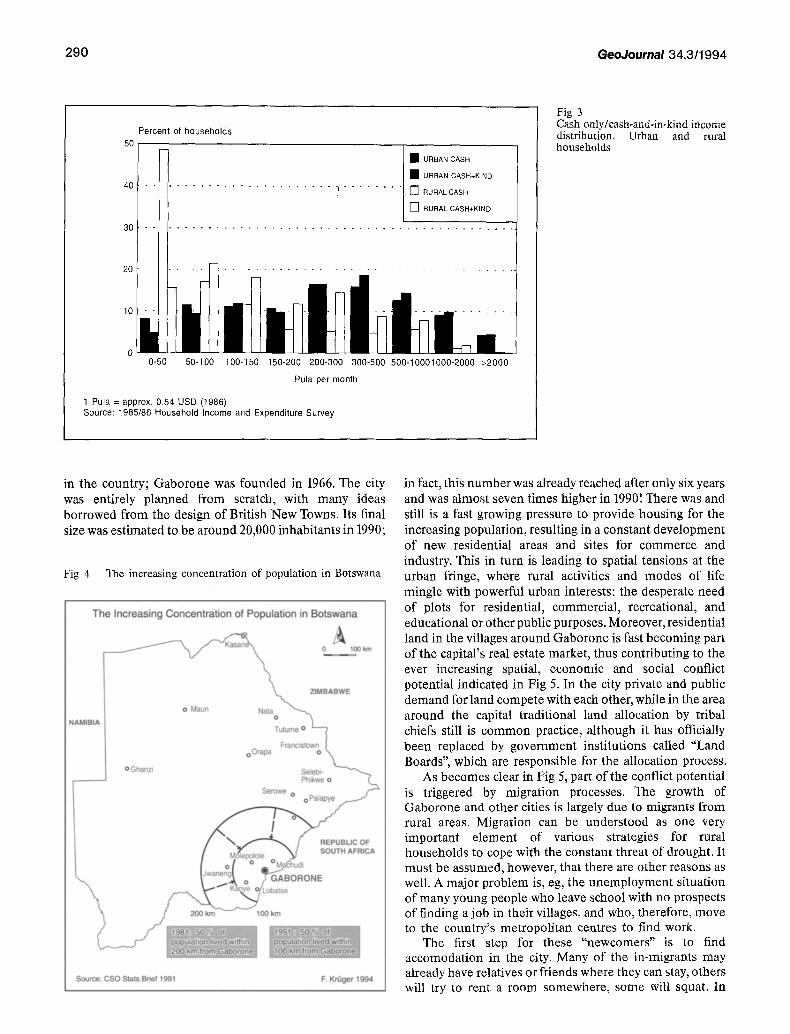
Fig 3 shows the cash and cash-and-in-kind income distribution among urban and rural households in Botswana. It probably comes as no surprise that cash income is distributed far more unevenly in rural areas than in urban regions, and that urban households generally earn more than rural households. A lot of attention has in the
288 GeoJournal 34.3/1994
<~ International airport Airfield
Deign: F. K r ~ i ~ : B.
GeoJournal 34.3/1994 289
4 Fig 1 Map of Botswana
Fig 2 Distribution of total household income among households
Total Household Income
jd .4" .~,o~ .~'~ ,~,'~ .~' .~" ~
Source: World Development Report 1992
Richest 20 % of all households
Fourth 20 %
Third 20 %
Second 20 %
Poorest 20 %
past been paid to this unequal income situation, resulting in the design of many development and aid programmes specifically for rural areas. I f the value of "in kind income" (eg own produce consumed and goods received in form of food aid, clothes, etc.) is added, the income distribution between urban households doesn't change significantly, while distribution in rural areas becomes more equal.
It is a well known fact that the validity of these income figures may be disputed and they must not be over-interpreted, but they can at least give some hints about the general income situation. The average rural household earns less than its urban counterpart, thus justifying the intention to focus development programmes and all drought relief measures (which so far have been very successful) almost entirely on rural areas. On the other hand, it is often ignored that there are many urban households whose income is not sufficient to make a decent living, and who benefit only little from development and aid measures. I f survival issues of urban groups are seen in terms of food security, and if these in turn are understood as variations of food availability, food accessibility and food affordability, it is important to note that in Botswana's cities food is always available, because distribution through small-scale dealers and - more important - supermarkets (mostly under South African control) is efficient and secure. Food is almost always accessible even for the poorest, too. The problem here is whether it is affordable or not.
The Urbanization Process
To analyse and understand the problems of Botswana's urban poor, it is essential to first take a closer look on the country's urbanization. During the past ten years the average population growth in Botswana was 3.5% per year. The capital Gaborone has faced an annual growth of 8.4%, which means its population more than doubled since the early eighties (CSO 1991). Other urban centres are experiencing similar growth rates, making Botswana's urbanization one of the fastest in the world.
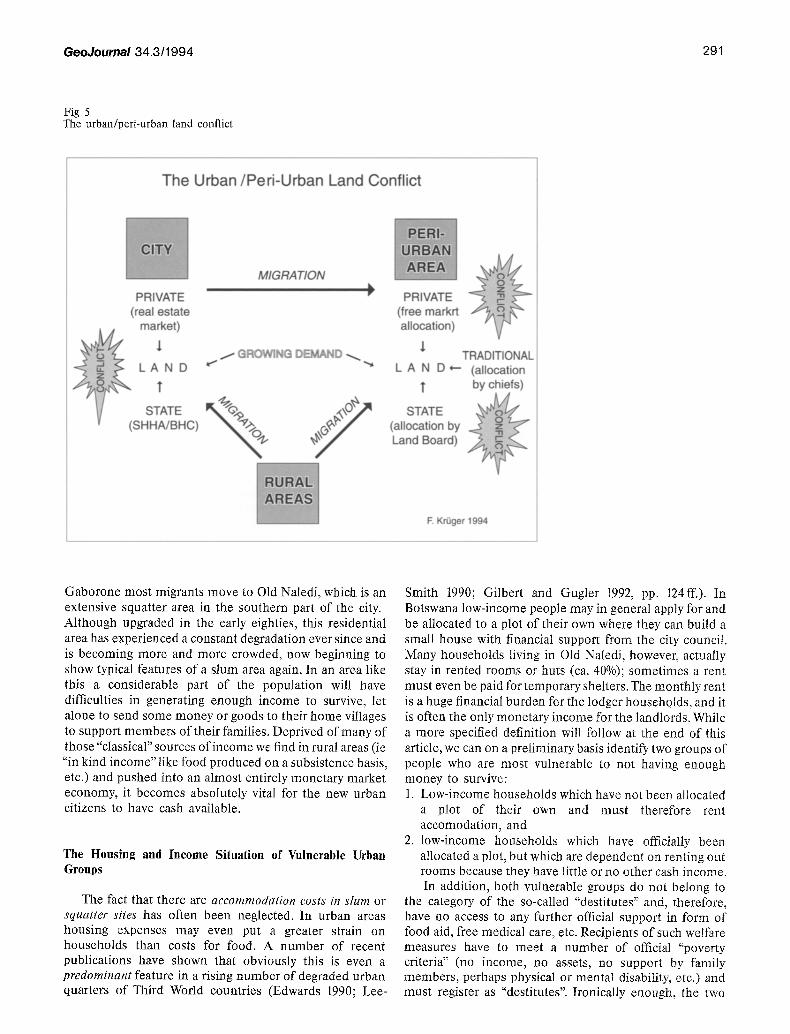
Rapid urban growth is closely linked to an increasing concentration process around the capital Gaborone: while in 1981 half of Botswana's entire population lived within 200 km from Gaborone, ten years later 50% of the population were found within a range of only 100 km from the capital (Fig 4).
Although Gaborone is the country's major urban centre, it is still small in size compared to other capitals. Officially it has got some 134,000 inhabitants (1991 census; CSO 1991), with estimates reaching up to 200,000 in 1994. On the other hand, many of the problems of fast growing Third World cities may be encountered in Gaborone, and it is probably because of its relatively small size that many features of rapid urbanization can be found here in a "prototypical" form.
Under British rule the Bechuanaland Protectorate had no capital of its own. Administration headquarters lay outside the protectorate, in Mafeking in South Africa. With the independence of Botswana a new capital had to be built
290 GeoJournal 34.3/1994
Percent of households 50
40
30
20
10
Ii • URBAN CASH • URBAN CASH+KIND . . . . . . . . . . . . . . . . . . . . ] . . . . . . . [ ] RURALCASH
[ ] RURAL CASH+KIND
0 0-50 50-100 100-150 150-200 200-300 300-500 500-10001000-2000 >2000
Pula per month
1 Pula = approx. 0.54 USD (1986) Source: 1985/86 Household Income and Expenditure Survey
Fig 3 Cash only/cash-and-in-kind income distribution. Urban and rural households
in the country; Gaborone was founded in 1966. The city was entirely planned from scratch, with many ideas borrowed from the design of British New Towns. Its final size was estimated to be around 20,000 inhabitants in 1990;
Fig 4 The increasing concentration of population in Botswana
The Increasing Concentration of Population in Botswana
o loo m
NAM|BiA
OGhanzi
o Maun
ZIMBABWE Nata~L ~o Tutume o
Francistown oOrapa o
Selebi- Phikwe o
£erowe o oPNapy e
~ . ~ SOUTH AFRICA
f Lobatse
200 km lOO km
Source: CSO Stats Brief 1991 F. Krf~ger 1994
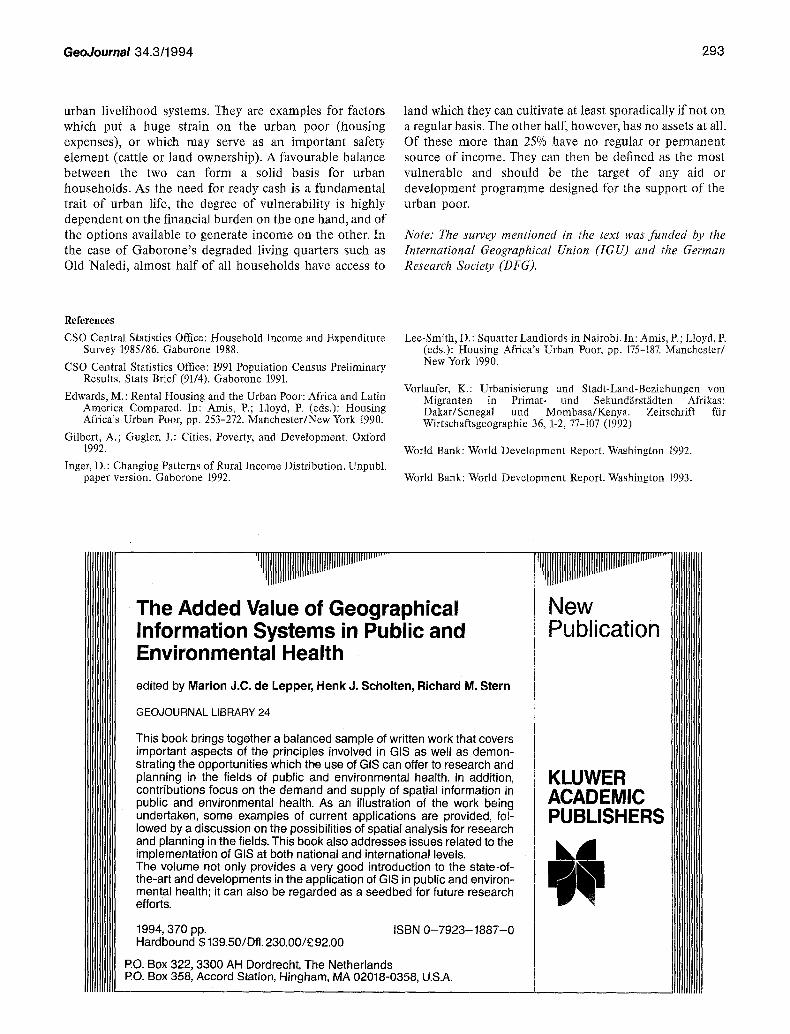
in fact, this number was already reached after only six years and was almost seven times higher in 1990! There was and still is a fast growing pressure to provide housing for the increasing population, resulting in a constant development of new residential areas and sites for commerce and industry. This in turn is leading to spatial tensions at the urban fringe, where rural activities and modes of life mingle with powerful urban interests: the desperate need of plots for residential, commercial, recreational, and educational or other public purposes. Moreover, residential land in the villages around Gaborone is fast becoming part of the capital's real estate market, thus contributing to the ever increasing spatial, economic and social conflict potential indicated in Fig 5. In the city private and public demand for land compete with each other, while in the area around the capital traditional land allocation by tribal chiefs still is common practice, although it has officially been replaced by government institutions called "Land Boards", which are responsible for the allocation process.
As becomes clear in Fig 5, part of the conflict potential is triggered by migration processes. The growth of Gaborone and other cities is largely due to migrants from rural areas. Migration can be understood as one very important element of various strategies for rural households to cope with the constant threat of drought. It must be assumed, however, that there are other reasons as well. A major problem is, eg, the unemployment situation of many young people who leave school with no prospects of finding a job in their villages, and who, therefore, move to the country's metropolitan centres to find work.
The first step for these "newcomers" is to find accomodation in the city. Many of the in-migrants may already have relatives or friends where they can stay, others will try to rent a room somewhere, some will squat. In
GeoJournal 34.3/1994 291
Fig 5 The urban/peri-urban land conflict
The Urban/Peri-Urban Land Conflict
PRIVATE (real estate
market)
1 L A N D
1"
STATE ~SHHA/BHC)
MIGRATION )
i GROWING DEMAND
PRIVATE (free markrt allocation)
TRADITIONAL L A N D ,,-- (allocation
1" by chiefs)
STATE (allocation by Land Board)
F. KrOger 1994
Gaborone most migrants move to Old Naledi, which, is an extensive squatter area in the southern part of the city. Although upgraded in the early eighties, this residential area has experienced a constant degradation ever since and is becoming more and more crowded, now beginning to show typical features of a slum area again. In an area like this a considerable part of the population will have difficulties in generating enough income to survive, let alone to send some money or goods to their home villages to support members of their families. Deprived of many of those "classical" sources of income we find in rural areas (ie "in kind income" like food produced on a subsistence basis, etc.) and pushed into an almost entirely monetary market economy, it becomes absolutely vital for the new urban citizens to have cash available.
The Housing and Income Situation of Vulnerable Urban Groups
The fact that there are accommodation costs in slum or squatter sites has often been neglected. In urban areas housing expenses may even put a greater strain on households than costs for food. A number of recent publications have shown that obviously this is even a predominant feature in a rising number of degraded urban quarters of Third World countries (Edwards 1990; Lee-
Smith 1990; Gilbert and Gugler 1992, pp. 124ff.). In Botswana low-income people may in general apply for and be allocated to a plot of their own where they can build a small house with financial support from the city council. Many households living in Old Naledi, however, actually stay in rented rooms or huts (ca. 40%); sometimes a rent must even be paid for temporary shelters. The monthly rent is a huge financial burden for the lodger households, and it is often the only monetary income for the landlords. While a more specified definition will follow at the end of this article, we can on a preliminary basis identify two groups of people who are most vulnerable to not having enough money to survive: 1. Low-income households which have not been allocated
a plot of their own and must therefore rent accomodation, and
2. low-income households which have officially been allocated a plot, but which are dependent on renting out rooms because they have little or no other cash income. In addition, both vulnerable groups do not belong to
the category of the so-called "destitutes" and, therefore, have no access to any further official support in form of food aid, free medical care, etc. Recipients of such welfare measures have to meet a number of official "poverty criteria" (no income, no assets, no support by family members, perhaps physical or mental disability, etc.) and must register as "destitutes". Ironically enough, the two

292 GeoJournal 34.3/1994
Tab 1 Cattle and/or land ownership of Old Naledi households
groups described above are not poor enough, and this makes them all the more vulnerable.
Findings from a survey conducted by the author show that of all Old Naledi households about 20-25% fall into either one or the other low-income group described above. There are cases where more than three quarters of the average monthly income has to be spent on paying rent, with very little left for buying food and virtually nothing for clothes, etc.
The survey also drew a more detailed picture of the income situation of Old Naledi households: - 16% of all households earn less than Pula 250/month (=
US$112). These households spend approx. Pula 90 on food/month (= US$ 40), send approx. Pula 30/month home to support members of their family (= US$13).
- 24% earn more than Pula 250 but less than Pula 500/ month.
- 9% of all landlord households have no other income apart from the rent received.
- 18% of the landlord households have an additional income of less than Pula 250.
It is important to note that all figures are for households and not for single persons. The average household size is 5 to 6 persons, with a maximum of 32 persons/household.
To survive members of these households have to engage in numerous informal economic activities. These cover a very wide range and involve street hawking, beer brewing and selling (mostly by women and often in combination with a small bar), running a tiny grocery "shop" (with little more than ten different items to sell), brickmaking or bricklaying and other manual work, and even prostitution (often not for money but for food). In almost half of all Old Naledi households such informal activities form a vital strategy to generate income.
A s s e t s as a S a f e t y Va lve
Another point of specific interest is the question whether urban dwellers have lasting ties to their home villages which may also serve as a supporting factor. It is surprising that more than one third of all households in Old Naledi still have got cattle in their home villages, and
of these one third has migrated to Gaborone 20 or more years ago! Herd sizes are sometimes astonishingly big (more than 40 cows). Almost 50% still have land in their home villages, which is cultivated more or less regularly; 25% have even got land and cattle!
Land is cultivated by either the owner himself who travels to his home village at the beginning of the rainy season, or by members of his family. Sometimes workers are employed, as is also the case with herdsmen who look after the cattle. Workers and herdsmen are usually paid "in kind" (ie food - traditionally the milk from the cows belongs to the herdsman), occasionally in cash.
The fact that in-migrants from rural areas maintain assets as an emergency reserve is also known from other African cities (cf Vorlaufer 1992). Still, it is surprising that these ties last even after decades of absence from the home village. The survey in Old Naledi also showed that there seems to be little or no correlation between cattle or land ownership and distance to the home village: on average the proportion of migrants who own cattle and/or land is very irregular, no matter whether their home villages lie near Gaborone or hundreds of kilometres away (Tab 1).
To own cattle not only implies an obvious possibility to generate income if necessary (ie an additional - or probably only - form of assets: if times are bad a cow can be slaughtered or sold). It also means that cattle owners are recognized as a "full" member of the Batswana society, their reputation and social influence being slightly higher than if they didn't possess any cattle. To own cattle therefore has not only material or financial advantages, but it is also a moral support! This in turn may reduce the frustration of having to live in shabby surroundings, with no work and little money or food. Thus, vulnerability studies should probably focus on these psychological factors more than they did in the past; after all, poverty, vulnerability, physical and mental strength are closely linked to each other.
C o n c l u s i o n : I d e n t i f y i n g t h e M o s t V u l n e r a b l e
Housing costs and the existence and maintainance of assets are only two of many crucial components of intra-
GeoJournal 34.3/1994 293
urban l ive l ihood systems. They are examples for factors which put a huge strain on the urban poor (housing expenses) , or which may serve as an impor tan t safety e lement (cattle or land ownership). A favourable balance be tween the two can form a solid basis for urban households . As the need for ready cash is a fundamenta l trait o f urban life, the degree o f vulnerabi l i ty is highly dependen t on the financial bu rden on the one hand, and of the opt ions available to generate income on the other. In the case o f Gabo rone ' s degraded living quarters such as Old Naledi , a lmost half o f all households have access to
land which they can cultivate at least sporadical ly if not on a regular basis. The o ther half, however, has no assets at all. Of these more than 25% have no regular or pe rmanen t source o f income. They can then be defined as the most vulnerable and should be the target of any aid or deve lopment p rogramme designed for the support of the urban poor.
Note." The survey mentioned in the text was funded by the International Geographical Union (IGU) and the German Research Society (DFG).
References
CSO Central Statistics Office: Household Income and Expenditure Survey 1985/86. Gaborone 1988.
CSO Central Statistics Office: 1991 Population Census Preliminary Results. Stats Brief (91/4). Gaborone 1991.
Edwards, M.: Rental Housing and the Urban Poor: Africa and Latin America Compared. In: Amis, P.; Lloyd, P. (eds.): Housing Africa's Urban Poor, pp. 253-272. Manchester/New York 1990.
Gilbert, A.; Gugler, J.: Cities, Poverty, and Development. Oxford 1992.
Inger, D.: Changing Patterns of Rural Income Distribution. Unpubl. paper version. Gaborone 1992.
Lee-Smith, D.: Squatter Landlords in Nairobi. In: Amis, P.; Lloyd, P. (eds.): Housing Africa's Urban Poor, pp. 175-187. Manchester/ New York 1990.
Vorlaufer, K.: Urbanisierung und Stadt-Land-Beziehungen von Migranten in Primat- und Sekund~irst~idten Afrikas: Dakar/Senegal und Mombasa/Kenya. Zeitschrift ffir Wirtschaftsgeographie 36, 1-2, 77-107 (1992)
World Bank: World Development Report. Washington 1992.
World Bank: World Development Report. Washington 1993.
"LIIILIIllIJIflfl'Jl'""""'""' ..... - The Added Value of Geographical Information Systems in Public and Environmental Health
edited by Marion J.C. de Lepper, Henk J. Scholten, Richard M. Stern
GEOJOURNAL LIBRARY 24
This book brings together a balanced sample of written work that covers important aspects of the principles involved in GIS as well as demon- strating the opportunities which the use of GIS can offer to research and planning in the fields of public and environmental health. In addition, contributions focus on the demand and supply of spatial information in public and environmental health. As an illustration of the work being undertaken, some examples of current applications are provided, fol- lowed by a discussion on the possibilities of spatial analysis for research and planning in the fields. This book also addresses issues related to the implementation of GIS at both national and international levels. The volume not only provides a very good introduction to the state-of- the-art and developments in the application of GIS in public and environ- mental health; it can also be regarded as a seedbed for future research efforts.
1994, 370 pp. Hardbound $139.50/Df1.230.00/£92.00
ISBN 0-7923-1887-0
P.O. Box 322, 3300 AH Dordrecht, The Netherlands P.O. Box 358, Accord Station, Hingham, MA 02018-0358, U.S.A.
New Publication
KLUWER ACADEMIC PUBLISHERS