Embed Size (px)
Citation preview
PertanikaJ. Trap. Agric. Sci. 16(2): 87-94 (1993) ISSN: 0126-6128© Universiti Pertanian Malaysia Press
Urea as the Nitrogen Source in NIT Hydroponic System
AMINUDDI H., KHALIP R. I, NORAYAH K. and ALIAS H.2
Department of Soil Science, Universiti Pertanian MalaysiaIAgronomy Department, Universiti Pertanian Malaysia
2Petroleum Research Institute, PETRONAS
Keywords: Hydroponics, urea, hydrolysis, urease, ammonium
ABSTRAK
Unsur nitrogen dalam larutan nutrien hidroponik cara NIT (nutrient film technique) menjalani proses hidrolisisdengan pengeluaran ammoniam. Hidrolisis urea berlaku dengan pesat dari hari ketujuh dan tamat pada harikeduapuluh. Dalam masa yang sama jumlah ammoniam dalam larutan meningkat dan mencapai tahapmaksima pada hari keduapuluh. Penitratan berlaku serentak dan kepekatan nitrat mencapai maksima pada harikeduapuluh juga. Berat kering tanaman pada peringkat matang tidak berbeza antara larutan rawatan urea danrawatan nitrat. Kepekatan ammoniam dalam daun dan akar rawatan urea adalah tinggi dari rawatan nitrat.Kepekatan nitrat dalam daun dan akar tidak berbeza diantara kedua dua rawatan tersebut. Kajian menunjukkanurea dapat menggantikan nitrat sebagai sumber unsur nitrogen untuk tanaman dalam sistem hidroponik cara
NIT.
ABSTRACT
Urea as the source of nitrogen in the nutrient solution in NIT (nutrient film technique) hydroponic systemundergoes hydrolysis which results in the release of ammonium in solution. Urea hydrolysis was rapid from the7th day onwards and ended by the 20th day. At the same time, ammonium concentration in solution increasedand reached its maximum on the 20th day. Nitrification occurred simultaneously and peaked also on the 20thday. Plant dry matter weight at harvest was similar for both urea and nitrate treatments. Ammoniumconcentration in leaves and roots was higher in urea than in nitrate treatments. Nitrate concentration in leavesand roots was similarfor both treatments. The study showed that urea can be substituted for nitrate as the nitrogensource in the NIT hydroponic system.
INTRODUCTION
The source of nitrogen in the nutrient solutionfor the growing of crops under the hydroponicsystem has been in the forms of Ca( 03)2 andKN03 (Cooper 1975). Even though urea is increasingly being used as the main source ofnitrogen fertilizer for crops grown on soil (Gouldet al. 1986), its use as the N source for cropsgrown under the hydroponic system has yet tobe evaluated. One of the reasons which couldhinder the use of urea in hydroponics is thaturea has to undergo hydrolysis with the releaseof NH/ and subsequent formation of N03through nitrificaton, forms that are utilised bythe plants. Hydrolysis of urea proceeds throughenzymatic catalysis of urease (Vlek et al. 1980).In soils urease activity is located in the soilbiomass and solution originating from decaying
organisms (Skujins 1976; Vlek et al. 1980). Thereis also evidence that soil urease activity may bederived from plants (Frakenberger and Tabatabai1982). It has also been shown that floodwater oftropical lowland rice soils has measurableamounts of urease activity (Sahrawat 1980), whichcould possibly originate from the soil.
Since the presence of urease has alwaysbeen associated with soil, its presence in thenutrient solution in the hydroponic system devoid of soil therefore is of interest. Since bacteria can proliferate in nutrient solution andurease originates from bacteria cells, the possible presence of urease in nutrient solution media and hydrolysis of urea in the solution therefore is great.

AMINUDDI H., KHALIP R., ORAYAH K. AND ALIAS H.
The objective of this study was to examinethe possibility of using urea as the nitrogensource in the nutrient solution in the hydroponic system by following its transformation inthe nutrient solution and the performance ofBrassica chinensis grown in it.
MATERIALS AND METHODS
The NIT (nutrient film technique) of soillessculture with plants grown in channels fed withrecirculating nutrient solution was used (Cooper,1975). The container which held therecirculating nutrient solution had a capacity of50 1. The channels were 3.7 m long, 30 em wideand 5 em high. These channels were constructedfrom 1 em thick plywood. The inner surface ofthe channels was covered with polyethene sheetsalong which the solution flowed and bathed theplant roots. A submersible pump in the container delivered the solution through 2 em (diameter) PVC pipes from the container to thetop of the channel, discharging the solutionthrough a 5 mm tube at the rate of 2 1/min. Thechannels were elevated at the top end (10 emhigher) so that the solution would flow in a thinfilm on the surface of the channel to the bottomend and into the container and then recirculated.Each replicate of a treatment consisted of thechannel, a container and a pump. Three replicates were used for each treatment. The experiment was run in the greenhouse in a completerandomized design. Mini pak choy (Brassicachinensis var Ching Chiang -Taiwan) seeds weresown on rockwool blocks 6 cm2 and 40 em inlength for each block; nine blocks were used foreach channe1.These blocks were placed at thecentre of the channels. Three seeds were placedat each point, 8 em apart. Each rockwool blockhad 5 plants. Thinning was done on the tenthday leaving one plant per point. The totalnumber of plants per channel at the start of theexperiment was 45. Since the concentration ofurea in the solution had to be monitored continuously for the whole period of the plantgrowth, elemental nutrients were added to thesolution for plant need, based on the electricalconductivity (E.C.) of the solution; the elementcontent of the solution was analysed on the 20thday to ensure that all elements with the exception of were adequate for plant need. Plantswere observed for deficiency symptoms. Cooperand Charlesworth (1977) concluded that addition of nutrients under the IT based on the
readings of the E.C. and the solution pH wasadequate to produce equivalent tomato yieldcompared to nutrient addition based on nutrient analysis.
Treatments
The standard nutrient formulation used wasbased on Cooper (1975) (Table 1). The otherthree treatments were 100% N-urea (No.2),mixture of 50%N-nitrate and 50%N- urea (No.3)and 75%N-urea and 25%N-nitrate (No.4). Anaccompanying treatment (No.5) similar to (No.2)but without plants grown was included. CaC1
2,
KOH and ~S04 were substituted for theCa( 03)2 and KN03 for treatments containingurea, resulting in some treatments having highersulphur and chloride contents which, however,did not exceed toxic levels. pH of the solutionwas maintained at between 5.5-6.5 by addingHCl or aOH. Electrical conductivity (E.C.) ofthe solution was maintained at 2.4 dS m-I untilthe plants were harvested. Solution E.C. whichfell below this value was replenished with thestock solution of the respective treatments.Amounts added to each treatment are given inTable 2. Water loss through evapotranspirationwas replaced with tap water to the 50 1 markdaily.
Sampling
Solution samples were taken daily for the firstseven days and thereafter on the 10th, 20th,
TABLE 1Chemical make-up of the various treatments
Treatments (g/1000)
Source 2 3 4 5
urea 480 240 360 480KHlO4 272 272 272 272 272KN0
3 808 808 404Ca(N03)2 943CaCl
2 588 588 588 588MgS04 492 492 492 492 492KOH 224 112 224~S04 348 174 348MnS0
45.27 5.27 5.27 5.27 5.27
H3B03 3.03 3.03 3.03 3.03 3.03
a2Mo04 .027 .027 .027 .027 .027ZnS04 .22 .22 .22 .22 .22CuS04 .05 .05 .05 .05 .05EDTA-Fe 19.48 19.48 19.48 19.48 19.48
88 PERTANlKAJ. TROP. ACRIe. SCI. VOL. 16 NO.2, 1993

UREA AS THE NITROGE SOURCE I IT HYDROPO IC SYSTEM
the solution in treatments containing urea wasrapid from the 7th day onwards. Loss of urea inthe 100% N- urea with plant treatment wasgreater compared to the same treatment without plants on the 10th day. It is possible that theurease activity was greater in solution whereplants were present. Elliott (1986) found hydrolysis of urea in cropped media more rapidthan in uncropped media. Between the1st and 7th day the urea loss was about 5%.Between the 7th and 10th day, urea in solutionof cropped treatments decreased by 30%. Mostof the urea was hydrolysed between the lOthand 20th day. Ammonium in the solution wasdetected as early as the first day after the start ofthe experiment in all the treatments receivingurea, indicating that hydrolysis of urea occurredimmediately.
TABLE 2itrogen supplement during the period of
plant growth
Treatments NOs-N (g) Urea-N (g)
Tl 14.79T2 6T3 19.78 8.7T4 7.38 10.8T5
30th and the 40th day. Plants were harvested onthe 40th day. PMA (phenylmercuric acetate) wasadded to samples to retard hydrolysis of ureabefore analysis of the samples was done. Samples were analysed for °3' and NH/ (Bremner1965) and urea (Douglas and Bremner 1970).
Plant samples were taken on the 20th, 30thand the 40th day. For the first two samplings, 9plants (one from each rockwool block taken atrandom) were harvested from each channel.The tops and roots were separated and weighed.The final harvest comprised 27 plants. Theywere oven dried, reweighed and ground. Foranalysis of NH/ and NOs' in the samples, 1 gsample (oven dry) was shaken with 50 ml distilled water for 1 hr and the extract filtered. 10ml of the extract was determined for NOs' andNH/ (Woolley et al. 1960).
200
'50
~a::>E&'00
so
10 '5 2<l
OAYS
a-on.6.-.6. T2V-VT3c-o HO_OT5
25 30 3S
RESULTS AND DISCUSSION
Results of the analysis of the nutrient solutionon the 20th day (Table 3) indicated that themacronutrient element content was adequate(Cooper and Charlesworth 1977). The elementscontent in the leaves at harvest also indicatedthat their concentration in plants were adequate(Table 3). Visual observation of the plants indicated no apparent nutrient deficiency exceptthat the 100% -urea treatment had darkergreen leaves than those in the other treatments.
Urea concentration in solution of treatments containing urea dropped rapidly fromthe 7th day onwards which showed that it hadbeen hydrolysed. By the 20th day all the ureawas depleted from the nutrient solution (Fig. 1).In soils urea is found to be fully hydrolysedwithin 3 days after application mostly in theform of NH/ and by the 14th day most are inthe NOs' form (Gasser, 1964; Bundy and Bremner1974). Decrease in the urea concentration of
Fig. 1: Urea concentration in solution of the various treatments
Ammonium in Solulion
Ammonium concentration in the nutrient solutions increased until the 20th day, thereafter itsconcentrations began to decline except in thetreatment without plants (Fig. 2) . Plant uptakeand the transformation of NH/ to NOs' vianitrification are the possible reasons for thedecline after the 20th day. Furthermore, itssource, urea, had been depleted by that time.Ammonium concentration in solution dependedon the amount of urea in the treatments. Highurea levels resulted in high NH/ concenU'ations. The highest NH
4' concentration was re
corded in the 100% -N-urea U'eatments. Withplant growth the decrease was higher whichcould be due to plant uptake and increasednitrification. Decline in NH/ concentration intl1e treatment without plants after the 20th day
PERTANIKAj. TROP. AGRIe. SCI. VOL. 16 0.2,1993 89

AMINUDDIN H., KHALIP R., NORAYAH K. AND ALIAS H.
120.,----------.::-----------,
was slight. 75% and 50% - urea treatmentsattained maximum H/ concentration on the20th day and the 1 H/ concentrations were inproportion to the amount of urea added. It cantherefore be said that rate of hydrolysis of ureawas not affected by the amount of urea presentwithin the amounts of urea used in the experiment. This showed that urease was a non-limiting factor. Several researchers have found thatin soils the rate of ure31 hvdrolysed by soil ureaseincreased with inc~ease in urea concentrationuntil the amount 0'[ urea added is sufficient tosaturate the enzyme with the substrate (Douglasand Bremner 1971; Tabatabai and Bremner 1972;Dalal 1975).
403530
0-0 T16-6 T2o-a T3v-v T40-0 T5
20 25DAYS
1510
300
100
900
700
900
200
1000,---1""-------------------,
plants had a Os' concentration decrease afterthe 20th day, treatment without plants maintained the NOs' concentration until the 40thday. itrate concentration in treatments whichcontained urea decreased more sharply untilthe 40th day compared to plants in the 100%°3' treatment.
a-OTl6,-.6 T20-0 T3v-v H0-0 T5100
Fig. 3: NO]- concentration in solution oj the vmious treatments
..,
.03530
0-0 T1.6.-6 T20-0 T3v-v r.0-0 T5
2520DAYS
15100'+------,------,r---,----,----.--,-_--,-_4
o
240
..,
200
!1~~1::: 120z
~8 ..
Fig. 4: Total N in solution oj the various treatments
Total N in solution
Summation of the various forms of N ( Os',H/ and urea) in the solution of the treatments
is presented in Fig. 4. Total N remained thesame for the first 7 days. From the 7th to 10thday total of treatments 100% and 50% N- Os'was lower compared to the others. From thelOth to the 20th day, 100% and 75 % N- ureatreatments decreased in total N value. Furtherdecline in total N occurred in all treatmentsexcept the one without plants from the 20th tothe 30th day. At the 40th day, treatments whichcontained urea had lower values compared to100% N- N03' treatment. From the 20th dayonwards the treatment without plants maintainedits total N to the end.
302520
DAYS
15'0
0~~~~_~;==="1'====;:=~~'=i'~~o
20
hg. 2: NH; concentration in solution oj the various treatments
Nitrate in Solution
The extent of nitrification occurring in the solution containing urea is shown in Fig. 3. Similarto the NH/ buildup, N0
3' increase in the nutri
ent solUlion was observed in the 100% N-ureatreatments with and without plants; however thebuildup started later (from the 7th day onwards). While treatments with 100% and 50% NN0
3' source declined for the period of 7- 10th
day, treatments with 100%N-urea had NOs' concentration increased during the same period.
Maximum concentration of NOs' in thenutrient solution in the 100% Lurea treatmentswas attained on the 20th day. Subsequent periods showed no increase in nitrate concentrationas shown by the 100% N- urea treatment withoutplants. At the 20th day the concentration of
H4
+ was only one third of NOs'·Ammonium buildup and nitrate formation
in the treatments containing urea occurred simultaneously. While 100% N-urea treatment with
90 PERTANlKAJ- TRap. AGRIe. SCI. VOL 16 NO.2, 1993

UREA AS THE ITROGE SOURCE I IT HYDROPO IC SYSTEM
TABLE 3Macronutrient concentrations in the solution (ppm)
on the 20th. day and in the leaves at harvest (%)
Elements Treatments
1 2 3 4
K (solution-s) 306 332 249 263(leaves-I) 11.5 8.5 8.2 8.4
p (s) 29 52 32 39
(1) 1.33 1.10 1.04 1.22
Ca (s) 175 214 227 200(l) 3.70 3.08 3.09 3.25
Mg (s) 68 42 43 42(l) .63 .56 .43 .50
(l) 4.97 5.51 5.18 4.4
Plant dry weight
Plant dry weight on the 20th day for 100% Nurea treatment was the lowest recorded and wassignificantly different (P<0.05) from those of 100%and 50% N-nitrate treatments (Table 4). Thisinitial difference in the dry weight can be attributed to the time taken for urea to be hydrolysedbefore H
4+ and the subsequent release of Og'
in the solution for plant use. On the 30th day, theplant dry matter weight of the 100% N- nitratetreatment was not significantly different from thatof 100%N-urea treatment. However, the two treatments with mixtures of urea and nitrate registered the highest value. Studies by Cox andReisenauer (1973) have shown that mixtures ofNH + and NO ' in solution give higher yield than
4 g
those of Og' or H4+ supplied singly. Moneerat
et al. (1982) reported that maximum dry weightwas achieved with a ratio of 60: 40 (NHt Nag') inthe solution. Dry matter weight on the 40th dayshowed no significant difference among the fourtreatments (Table 4).
Total N Uptake l7y Plants
Total N uptake values normally follow dry matter weight figures. Total N uptake values ofBrassica at harvest (40 days) were not significantly different among treatments. The 50% Nurea and 50% -nitrate mixture recorded thehighest N uptake value of 3.16 g. Baker andMaynard (1972) reported that maximum ab-
sorption by plants was achieved when NH4+ and
Nag' were combined in the nutrient solution.The amount of N taken up by the plants accounts for 80% of the N supplied in the solution.
Ammonium in Roots
The percent coefficient of variation (%C.V.) ofthe NH
4+ content in the plant roots on the 20th
day growth stage was high due to the problem ofseparating the roots from the rockwool media.At this stage the roots were very fine and werefirmly embedded in the media making the taskof separation difficult. At the 30th and 40th day,the roots were thicker and bigger and therockwool was softer making the task of separation easier. This was reflected in the decreasingtrend in the C.v. value as the plants matured.No significant difference in ammonium concentration in the plant roots of the 20- and 30-dayold plants of the various treatments was observed (Table 4). Plants treated with 100% Nnitrate did contain NH
4+ in the roots. The
reduction and assimilation of Nag' in the rootsproduce NH/ as an intermediary product (Pate1973). H/ concentration in the roots of the30- and 40-day old plants treated with 100%Nurea was higher than those treated with 100%Nnitrate. Pill and Lambert (1977) noted that ingeneral, plants supplied with NH/ have a higherconcentration of free NH/ than plants grown atcomparable levels of NOg-. NH/ accumulationin the roots of the 100% -urea treatment couldalso be due to the slow conversion of NHg' intoglutamine which is a function of the carbohydrate supply (Vickery et ai. 1936).
Ammonium in Leaves
Ammonium concentration in the leaves of 20day-old plants treated with 100% N-urea washigher than that in plants in the 100% N- nitratetreatments (Table 4). Pate and Wallace (1964)found that the bulk of the NH/ absorbed byroots is converted to amino acids by the metabolic system of the roots and only a small percentage of the H/ is found in the xylemexudate presumably transported to the leavesfor assimilation. It is possible that in leafy vegetables, the leaves playa major role in the assimilation of NH
4+ which thus results in concentration
of H/ in leaves being comparable to that inthe roots. On the 30th day, NH
4+ concentration
in the leaves in all the treatments was similar.
PERTANIKAJ. TROP. AGRIC. SCI. VOL. 16 0.2,1993 91
AMINUDDIN H., KHALIP R., NORAYAH K. AND ALIAS H.
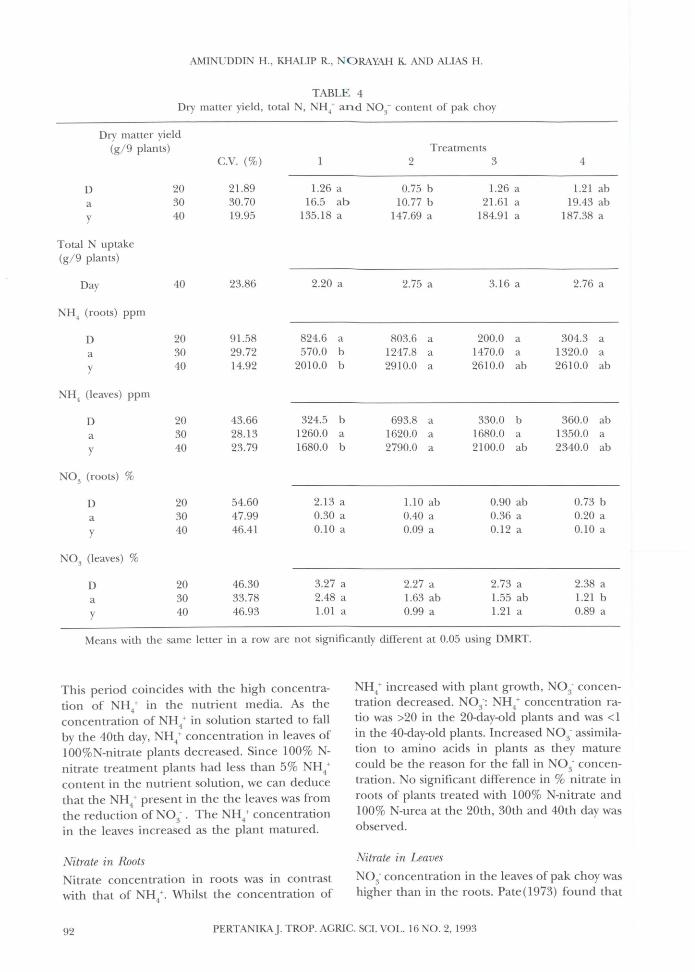
TABLE 4Dry matter yield, total ,NH/ and Og- content of pak choy
Dry matter yield(g/9 plants) Treatments
C.V. (%) 1 2 3 4
D 20 21.89 1.26 a 0.75 b 1.26 a 1.21 aba 30 30.70 16.5 ab 10.77 b 21.61 a 19.43 ab
y 40 19.95 135.18 a 147.69 a 184.91 a 187.38 a
Total N uptake(g/9 plants)
Day 40 23.86 2.20 a 2.75 a 3.16 a 2.76 a
NH4
(roots) ppm
D 20 91.58 824.6 a 803.6 a 200.0 a 304.3 aa 30 29.72 570.0 b 1247.8 a 1470.0 a 1320.0 a
y 40 14.92 2010.0 b 2910.0 a 2610.0 ab 2610.0 ab
H4
(leaves) ppm
D 20 43.66 324.5 b 693.8 a 330.0 b 360.0 aba 30 28.13 1260.0 a 1620.0 a 1680.0 a 1350.0 a
y 40 23.79 1680.0 b 2790.0 a 2100.0 ab 2340.0 ab
Og (roots) %
D 20 54.60 2.13 a 1.10 ab 0.90 ab 0.73 b
a 30 47.99 0.30 a 0.40 a 0.36 a 0.20 a
y 40 46.41 0.10 a 0.09 a 0.12 a 0.10 a
NOg (leaves) %
D 20 46.30 3.27 a 2.27 a 2.73 a 2.38 a
a 30 33.78 2.48 a 1.63 ab 1.55 ab 1.21 b
Y 40 46.93 1.01 a 0.99 a 1.21 a 0.89 a
Means with the same letter in a row are not significantly different at 0.05 using DMRT.
This period coincides with the high concentration of H/ in the nutrient media. As theconcentration of H/ in solution started to fallby the 40th day, NH
4+ concentration in leaves of
100%N-nitrate plants decreased. Since 100% Nnitrate treatment plants had less than 5% H/content in the nutrient solution, we can deducethat the NH/ present in the the leaves was fromthe reduction ofNOg'. The NH/ concentrationin the leaves increased as the plant matured.
Nitrate in Roots
Nitrate concentration in roots was in contrastwith that of H
4+. Whilst the concentration of
NH4+ increased with plant growth, NOg' concen
tration decreased. NOg': H/ concentration ratio was >20 in the 20-day-old plants and was <1in the 40-day-old plants. Increased NOg' assimilation to amino acids in plants as they maturecould be the reason for the fall in NOg' concentration. 0 significant difference in % nitrate inroots of plants treated with 100% N-nitrate and100% N-urea at the 20th, 30th and 40th day wasobserved.
Nitrate in Leaves
Og' concentration in the leaves of pak choy washigher than in the roots. Pate (l973) found that
92 PERTANlKAJ. TRap. AGRIC. SCI. VOL. 16 NO.2, 1993

REA AS THE ITROGE SO RCE I IT HYDROPO IC SYSTEM
the reduction of 03- concentration in the leavesis relative to the roots and varie widely amongplant species. It i possible that 03- assimilationin the leaves of pak choy is more intense than inthe roots. In maize plants, the roots were foundto reduce about 1/3 of the nitrate and thepercentage of 03- reduction decreased as theplant aged (Raghuveer 1977). 0 significantdifference in % nitrate in leaves between treatments was ob erved at the three plant growthstages (Table 4). The amount of 03- in theleaves decreased as the plant growth increased.Percent 03- was ten-fold higher than H
4+ in
the leaves, the ratio being greater when plan twere young.
CONCLUSION
rea a the source of used in nutrient solu-tion in the NIT hydroponic sy tern undergoesh drol sis with the release of H
4+ and the
sub equent formation of °3", The urea wascompletely hydrolysed by the 20th day. Therewas no difference in either the plant dry weightin the 100% Lurea or 100% -nitrate treatments at harvest. H/ concentration in rootsand leaves wa higher in the 100% -urea treatment than in the 100% N-nitrate treatment. Nodifference in °3" concentration in roots andleaves of 100% -nitrate and 100% -urea treatments was detected. The study showed the possibility of u ing urea as the ource for the IThydroponic system in crop production.
REFERE CES
BAKER, A.V and D. . MAYNARD. 1972. Cation andnitrate accumulation in pea and cucumberplants as influenced by nutrition. J Amer.Soc. Hort. Sci. 97: 27-30.
BREM ER, J.M. 1965. Inorganic Forms of itrogen.In CA. Black (ed.). Methods of Soil Analysis,Part 2. 1179-1232. Madison, Wisconsin: Am.Soc. Agron.
BUNDY, L.G. and J.M. BREMNER. 1974. Effects ofnitrification inhibitors on transformation ofurea in soils. Soil Biochem. 6: 369-376.
COOPER, AJ. 1975. Crop production in recirculatingnutrient solution. Scientia Hortic. 3: 251-258.
COOPER, AJ. and RR CHARLE WORTH. 1977. utritional control of a nutrient-film tomato crop.Scientia Hortic. 7: 189-195.
Cox, WJ. and H.M. REISE A ER. 1973. Growth andion uptake b wheat supplied nitrogen as nitrate, or ammonium, or both. Plant Soil 38:363-380.
DAlAL, RC. 1975. rease activity in some Trinidadsoils. Soil Bio!. Biochem. 7: 5-8.
Do GLAS, C.A. and J.M. BREM ER. 1970. Extractionand colorimetric determination of urea. SoilSci. Soc. Am. Proc. 34: 859-862.
DOUGLAS, C.A. and J.M. BREMNER. 1971. A rapidmethod of evaluating different compounds orinhibitors of urease activity in soils. Soil Bio!.Biochem. 3: 309-315.
ELLIOTT, G.C. 1986. rea hydrolysis in pottingmedia. J Am. Soc. Hart. Sci. 6: 862-866.
FRAKE BERGER, W. T. and .A. TABATABAI. 1982.Amidase and urease activities in plants. Plantand Soil 64: 153-166.
GASSER, J.K.R 1964. Urea as a fertilizer. Soils Fert.27: 175-180.
Go LD, W.D., C. HAGEDORN and RG.L. McCREADY.1986. Urea transformations and fertilizer efficiency in soil. Adv. in Agran. 40: 209.
MONEERAT, P.H., P.D. CASTALLANE, J.L.C. ZAMBON,J.G. PAND A and JJ.v. M LLER. 1982. Effect ofammonium to nitrate ratio on initial development and mineral composition of tomato,Lycopersicon esculentum. Proceedings of Amer. Soc.Hart. Sci. 25: 451-455.
PATE, J.S. 1973. Uptake, a similation and transportof nitrogen compound by plants. Soil Bio!.Biochem. 5: 109-119.
PATE, J.S. and W. WALLACE. 1964. Movement ofassimilated nitrogen from the root systems ofthe field pea (Pisum arvense L.) Ann. Bot. 28:83-99.
PILL, W.G. and V. . LAMBERT. 1977. Effects of NH4
and 03 nutrition with and without pH adjustments on tomato growth, ion compositionsand water relations. J Am. Soc. Hort. Sci. 102:78-81.
RAGHUVEER, P. 1977. Characteristics of nitrate uptake from nutrient olution and root nitratereductase activity among corn genotype. Ph.DDissertation. niv. of Illinois, rbanaChampaign.
PERT IKAJ. TRap. AGRIC. SCI. VOL. 16 0.2,1993 93
AMINUDDIN H., KHALIP R., NORAYAH K. AND ALIAS H.
SAHRAWAT, K.L. 1980. Urease activity in tropical ricesoils and floodwater. Soil Biol. Biochem. 12: 195196.
SKUJINS, JJ. 1976. Extracellular enzymes in soils.CRC Crit. Rev. Microbial. 4: 383-421.
TABATABAI, M.A and lM.BREMNER. 1972. Assay ofurease activity in soils. Soil Biol. Biochem. 4: 479487.
VICKERY, H.B., G.W. PUCHEZ and H.E. CLARK. 1936.Glutamine metabolism of the beet. Plant Physiol.11: 413-420.
VLEK, P.L.G., lM. STUMPE and B.H.BYRNES. 1980.Urease activity and inhibition in flooded soilsystems. Fert. Res. 1: 191-202.
WOOLLEY, IT., G.P.HICKS and R.H. HAGEMAN. 1960.Rapid determination of nitrate and nitrite inplant material. J Agric. and Food Chem. 8: 481482.
(Received 27 August 1991)
94 PERTANIKAJ. TROP. AGRIC. SCI. VOL. 16 NO.2, 1993