Embed Size (px)
Citation preview

1
Urgent Care Centers Business Plan
ORIGINATING DEPARTMENT:
Business Development and Strategic Planning
I. Executive Summary
An eastern and western Urgent Care Centres (UCC) will be developed to complement the existing acute care
hospital (KEMH) located in the central portion of the island to provide direct access to care for all Bermudians.
Urgent care is the delivery of ambulatory care in a facility dedicated to the delivery of unscheduled, walk-in care
outside of a hospital emergency department. Development of the two facilities will facilitate access to care
providers through extended service hours within closer geographic proximity for to patients, families, and
caregivers.
Under the leadership of the Bermuda Hospitals Board (BHB), the linkage between the UCCs and KEMH will limit
the duplication of services that would lead to unnecessary medical spending without discernible quality or service
advantages by providing administrative and medical oversight. Organizing the UCC’s under BHB minimizes the
operating costs by leveraging the existing infrastructure provided by BHB. The Director of Emergency Services
will provide clinical monitoring to ensure quality service provisions..
The UCCs will integrate into the emergent care system for Bermuda. The UCCs will act to alleviate demand for ED
services by shifting lower acute patients to a less resource-intensive environment. Emergent patients entering the
UCCs will be triaged and stabilized. Ambulance service will be located at each UCC to transfer emergent patients
to the KEMH ED. Additionally, locating ambulances at each UCC provides superior response times to the far ends
of the island.
Project Team
BHB has collaborated with Lahey Clinic and with support from Kurron, including, but not limited to the following:
Organization Individuals
Bermuda Hospital Board David Hill, CEO
Neil Rolfes, Chief Business Development Officer
Dr. Donald Thomas, III, Chief of Staff
Kurron Corbett Price
Devin Price
Andrew Cameron
2
II. Program Overview
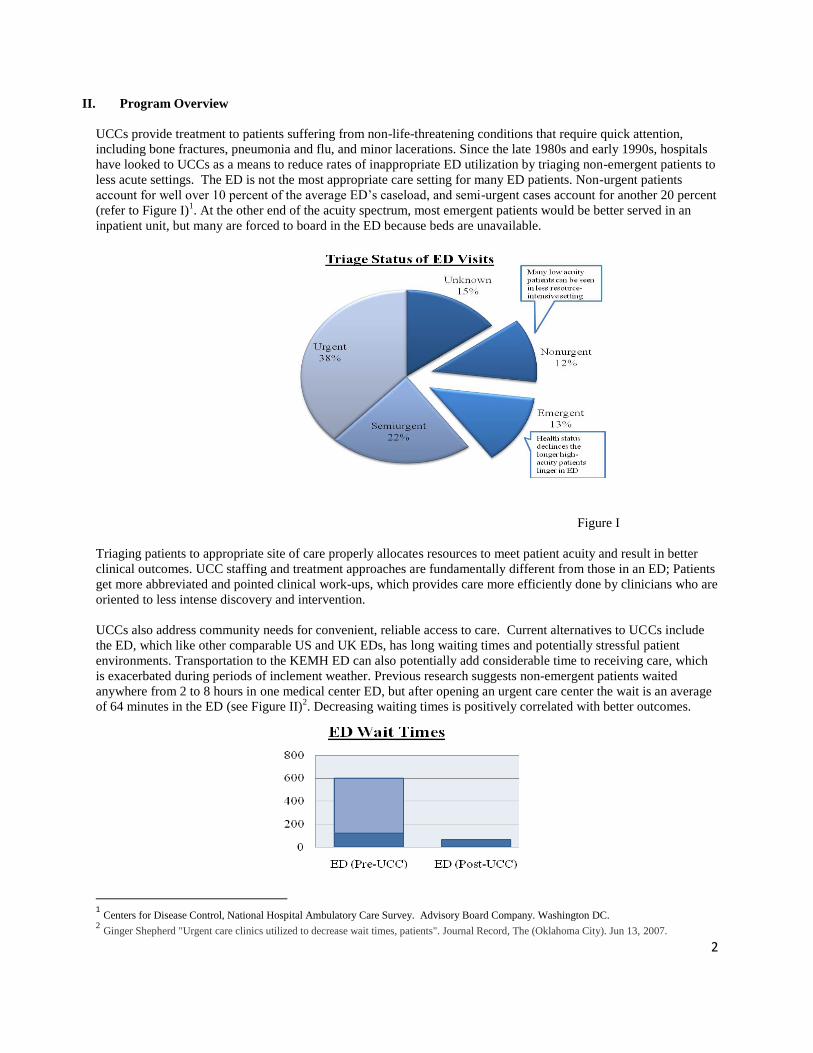
UCCs provide treatment to patients suffering from non-life-threatening conditions that require quick attention,
including bone fractures, pneumonia and flu, and minor lacerations. Since the late 1980s and early 1990s, hospitals
have looked to UCCs as a means to reduce rates of inappropriate ED utilization by triaging non-emergent patients to
less acute settings. The ED is not the most appropriate care setting for many ED patients. Non-urgent patients
account for well over 10 percent of the average ED’s caseload, and semi-urgent cases account for another 20 percent
(refer to Figure I)1. At the other end of the acuity spectrum, most emergent patients would be better served in an
inpatient unit, but many are forced to board in the ED because beds are unavailable.
Figure I
Triaging patients to appropriate site of care properly allocates resources to meet patient acuity and result in better
clinical outcomes. UCC staffing and treatment approaches are fundamentally different from those in an ED; Patients
get more abbreviated and pointed clinical work-ups, which provides care more efficiently done by clinicians who are
oriented to less intense discovery and intervention.
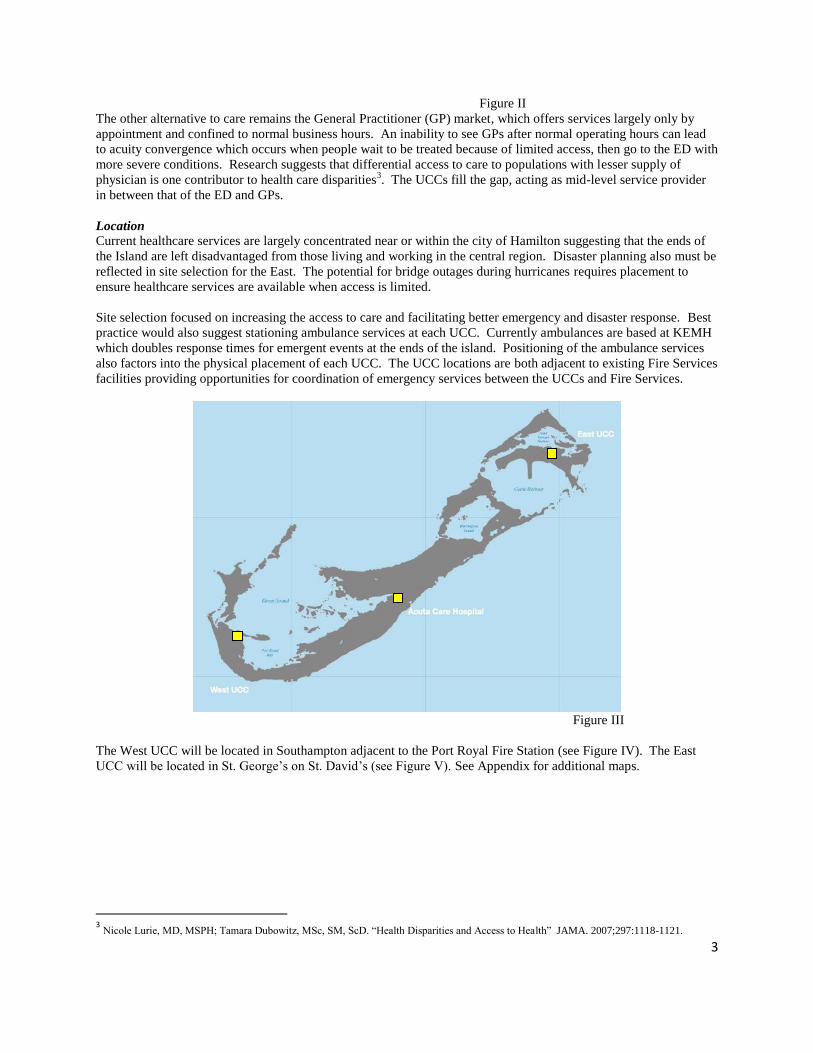
UCCs also address community needs for convenient, reliable access to care. Current alternatives to UCCs include
the ED, which like other comparable US and UK EDs, has long waiting times and potentially stressful patient
environments. Transportation to the KEMH ED can also potentially add considerable time to receiving care, which
is exacerbated during periods of inclement weather. Previous research suggests non-emergent patients waited
anywhere from 2 to 8 hours in one medical center ED, but after opening an urgent care center the wait is an average
of 64 minutes in the ED (see Figure II)2. Decreasing waiting times is positively correlated with better outcomes.
1 Centers for Disease Control, National Hospital Ambulatory Care Survey. Advisory Board Company. Washington DC.
2 Ginger Shepherd "Urgent care clinics utilized to decrease wait times, patients". Journal Record, The (Oklahoma City). Jun 13, 2007.
3
Figure II
The other alternative to care remains the General Practitioner (GP) market, which offers services largely only by
appointment and confined to normal business hours. An inability to see GPs after normal operating hours can lead
to acuity convergence which occurs when people wait to be treated because of limited access, then go to the ED with
more severe conditions. Research suggests that differential access to care to populations with lesser supply of
physician is one contributor to health care disparities3. The UCCs fill the gap, acting as mid-level service provider
in between that of the ED and GPs.
Location
Current healthcare services are largely concentrated near or within the city of Hamilton suggesting that the ends of
the Island are left disadvantaged from those living and working in the central region. Disaster planning also must be
reflected in site selection for the East. The potential for bridge outages during hurricanes requires placement to
ensure healthcare services are available when access is limited.
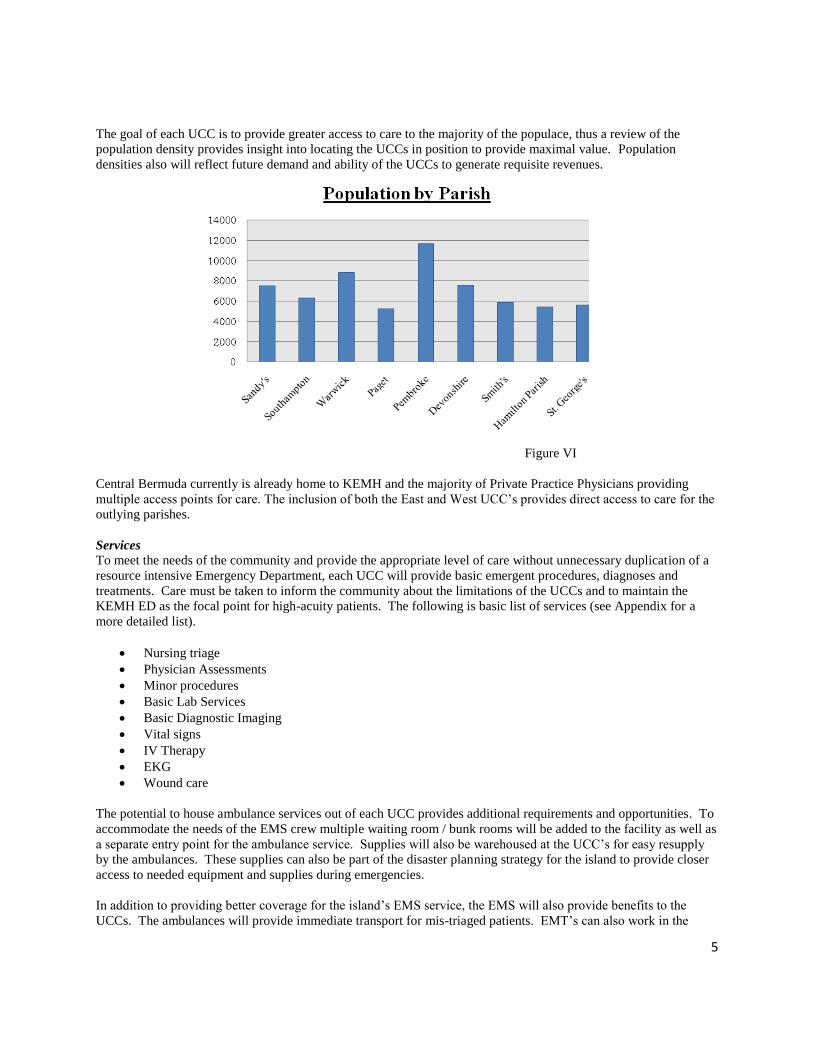
Site selection focused on increasing the access to care and facilitating better emergency and disaster response. Best
practice would also suggest stationing ambulance services at each UCC. Currently ambulances are based at KEMH
which doubles response times for emergent events at the ends of the island. Positioning of the ambulance services
also factors into the physical placement of each UCC. The UCC locations are both adjacent to existing Fire Services
facilities providing opportunities for coordination of emergency services between the UCCs and Fire Services.
Figure III
The West UCC will be located in Southampton adjacent to the Port Royal Fire Station (see Figure IV). The East
UCC will be located in St. George’s on St. David’s (see Figure V). See Appendix for additional maps.
3 Nicole Lurie, MD, MSPH; Tamara Dubowitz, MSc, SM, ScD. “Health Disparities and Access to Health” JAMA. 2007;297:1118-1121.

4
West UCC Site
Figure IV
East UCC Site
Figure V
5
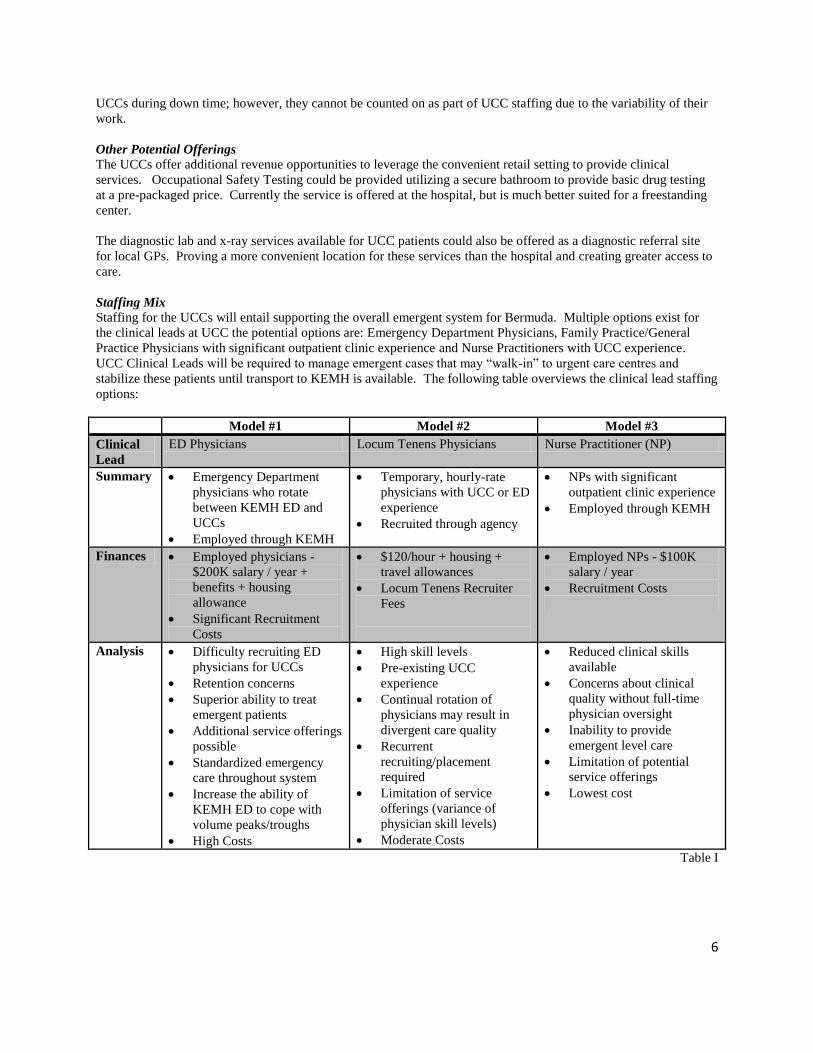
The goal of each UCC is to provide greater access to care to the majority of the populace, thus a review of the
population density provides insight into locating the UCCs in position to provide maximal value. Population
densities also will reflect future demand and ability of the UCCs to generate requisite revenues.
Figure VI
Central Bermuda currently is already home to KEMH and the majority of Private Practice Physicians providing
multiple access points for care. The inclusion of both the East and West UCC’s provides direct access to care for the
outlying parishes.
Services
To meet the needs of the community and provide the appropriate level of care without unnecessary duplication of a
resource intensive Emergency Department, each UCC will provide basic emergent procedures, diagnoses and
treatments. Care must be taken to inform the community about the limitations of the UCCs and to maintain the
KEMH ED as the focal point for high-acuity patients. The following is basic list of services (see Appendix for a
more detailed list).
Nursing triage
Physician Assessments
Minor procedures
Basic Lab Services
Basic Diagnostic Imaging
Vital signs
IV Therapy
EKG
Wound care
The potential to house ambulance services out of each UCC provides additional requirements and opportunities. To
accommodate the needs of the EMS crew multiple waiting room / bunk rooms will be added to the facility as well as
a separate entry point for the ambulance service. Supplies will also be warehoused at the UCC’s for easy resupply
by the ambulances. These supplies can also be part of the disaster planning strategy for the island to provide closer
access to needed equipment and supplies during emergencies.
In addition to providing better coverage for the island’s EMS service, the EMS will also provide benefits to the
UCCs. The ambulances will provide immediate transport for mis-triaged patients. EMT’s can also work in the
6
UCCs during down time; however, they cannot be counted on as part of UCC staffing due to the variability of their
work.
Other Potential Offerings
The UCCs offer additional revenue opportunities to leverage the convenient retail setting to provide clinical
services. Occupational Safety Testing could be provided utilizing a secure bathroom to provide basic drug testing
at a pre-packaged price. Currently the service is offered at the hospital, but is much better suited for a freestanding
center.
The diagnostic lab and x-ray services available for UCC patients could also be offered as a diagnostic referral site
for local GPs. Proving a more convenient location for these services than the hospital and creating greater access to
care.
Staffing Mix
Staffing for the UCCs will entail supporting the overall emergent system for Bermuda. Multiple options exist for
the clinical leads at UCC the potential options are: Emergency Department Physicians, Family Practice/General
Practice Physicians with significant outpatient clinic experience and Nurse Practitioners with UCC experience.
UCC Clinical Leads will be required to manage emergent cases that may “walk-in” to urgent care centres and
stabilize these patients until transport to KEMH is available. The following table overviews the clinical lead staffing
options:
Model #1 Model #2 Model #3
Clinical
Lead
ED Physicians Locum Tenens Physicians Nurse Practitioner (NP)
Summary Emergency Department
physicians who rotate
between KEMH ED and
UCCs
Employed through KEMH
Temporary, hourly-rate
physicians with UCC or ED
experience
Recruited through agency
NPs with significant
outpatient clinic experience
Employed through KEMH
Finances Employed physicians -
$200K salary / year +
benefits + housing
allowance
Significant Recruitment
Costs
$120/hour + housing +
travel allowances
Locum Tenens Recruiter
Fees
Employed NPs - $100K
salary / year
Recruitment Costs
Analysis Difficulty recruiting ED
physicians for UCCs
Retention concerns
Superior ability to treat
emergent patients
Additional service offerings
possible
Standardized emergency
care throughout system
Increase the ability of
KEMH ED to cope with
volume peaks/troughs
High Costs
High skill levels
Pre-existing UCC
experience
Continual rotation of
physicians may result in
divergent care quality
Recurrent
recruiting/placement
required
Limitation of service
offerings (variance of
physician skill levels)
Moderate Costs
Reduced clinical skills
available
Concerns about clinical
quality without full-time
physician oversight
Inability to provide
emergent level care
Limitation of potential
service offerings
Lowest cost
Table I
7
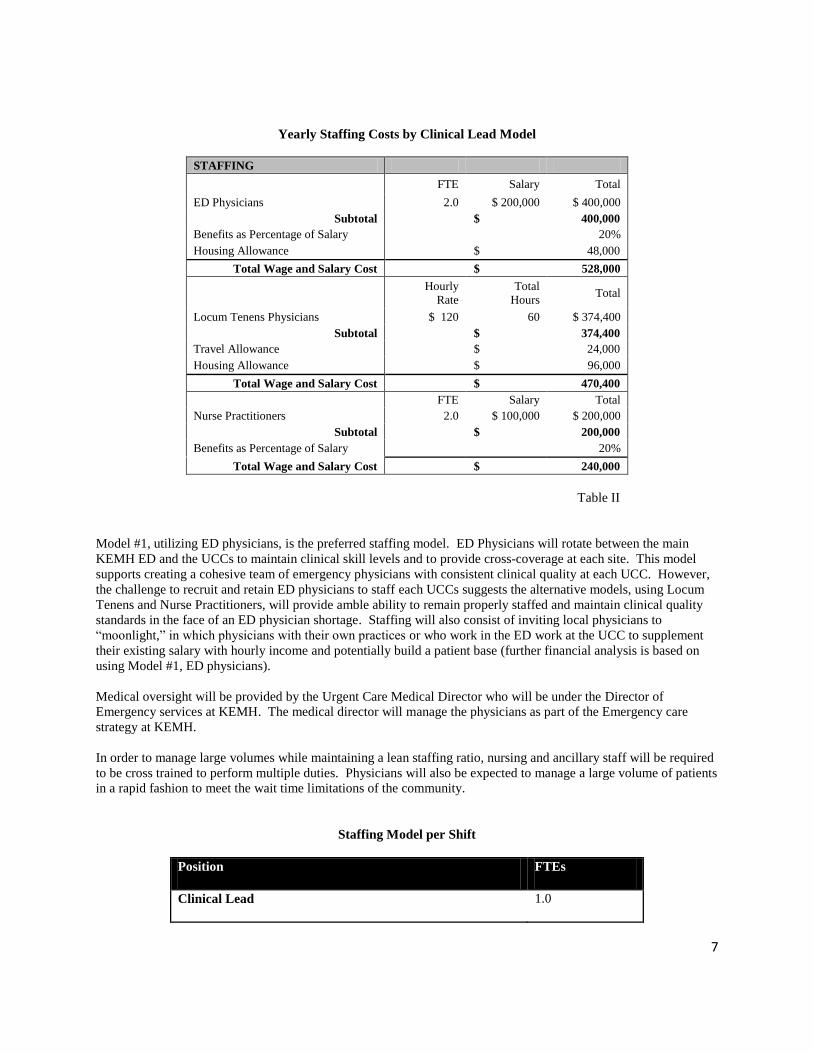
Yearly Staffing Costs by Clinical Lead Model
STAFFING
FTE Salary Total
ED Physicians 2.0 $ 200,000 $ 400,000
Subtotal $ 400,000
Benefits as Percentage of Salary 20%
Housing Allowance $ 48,000
Total Wage and Salary Cost $ 528,000
Hourly
Rate
Total
Hours Total
Locum Tenens Physicians $ 120 60 $ 374,400
Subtotal $ 374,400
Travel Allowance $ 24,000
Housing Allowance $ 96,000
Total Wage and Salary Cost $ 470,400
FTE Salary Total
Nurse Practitioners 2.0 $ 100,000 $ 200,000
Subtotal $ 200,000
Benefits as Percentage of Salary 20%
Total Wage and Salary Cost $ 240,000
Table II
Model #1, utilizing ED physicians, is the preferred staffing model. ED Physicians will rotate between the main
KEMH ED and the UCCs to maintain clinical skill levels and to provide cross-coverage at each site. This model
supports creating a cohesive team of emergency physicians with consistent clinical quality at each UCC. However,
the challenge to recruit and retain ED physicians to staff each UCCs suggests the alternative models, using Locum
Tenens and Nurse Practitioners, will provide amble ability to remain properly staffed and maintain clinical quality
standards in the face of an ED physician shortage. Staffing will also consist of inviting local physicians to
“moonlight,” in which physicians with their own practices or who work in the ED work at the UCC to supplement
their existing salary with hourly income and potentially build a patient base (further financial analysis is based on
using Model #1, ED physicians).
Medical oversight will be provided by the Urgent Care Medical Director who will be under the Director of
Emergency services at KEMH. The medical director will manage the physicians as part of the Emergency care
strategy at KEMH.
In order to manage large volumes while maintaining a lean staffing ratio, nursing and ancillary staff will be required
to be cross trained to perform multiple duties. Physicians will also be expected to manage a large volume of patients
in a rapid fashion to meet the wait time limitations of the community.
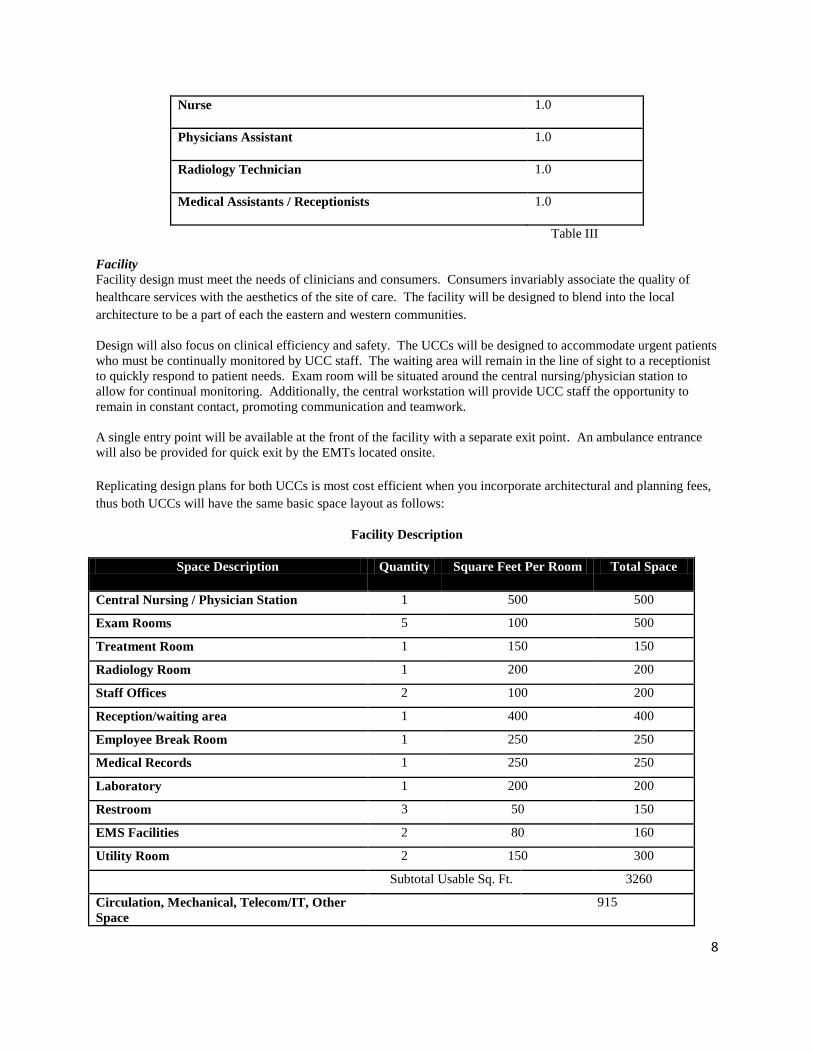
Staffing Model per Shift
Position FTEs
Clinical Lead 1.0
8
Nurse 1.0
Physicians Assistant 1.0
Radiology Technician 1.0
Medical Assistants / Receptionists 1.0
Table III
Facility
Facility design must meet the needs of clinicians and consumers. Consumers invariably associate the quality of
healthcare services with the aesthetics of the site of care. The facility will be designed to blend into the local
architecture to be a part of each the eastern and western communities.
Design will also focus on clinical efficiency and safety. The UCCs will be designed to accommodate urgent patients
who must be continually monitored by UCC staff. The waiting area will remain in the line of sight to a receptionist
to quickly respond to patient needs. Exam room will be situated around the central nursing/physician station to
allow for continual monitoring. Additionally, the central workstation will provide UCC staff the opportunity to
remain in constant contact, promoting communication and teamwork.
A single entry point will be available at the front of the facility with a separate exit point. An ambulance entrance
will also be provided for quick exit by the EMTs located onsite.
Replicating design plans for both UCCs is most cost efficient when you incorporate architectural and planning fees,
thus both UCCs will have the same basic space layout as follows:
Facility Description
Space Description Quantity Square Feet Per Room Total Space
Central Nursing / Physician Station 1 500 500
Exam Rooms 5 100 500
Treatment Room 1 150 150
Radiology Room 1 200 200
Staff Offices 2 100 200
Reception/waiting area 1 400 400
Employee Break Room 1 250 250
Medical Records 1 250 250
Laboratory 1 200 200
Restroom 3 50 150
EMS Facilities 2 80 160
Utility Room 2 150 300
Subtotal Usable Sq. Ft. 3260
Circulation, Mechanical, Telecom/IT, Other
Space
915
9
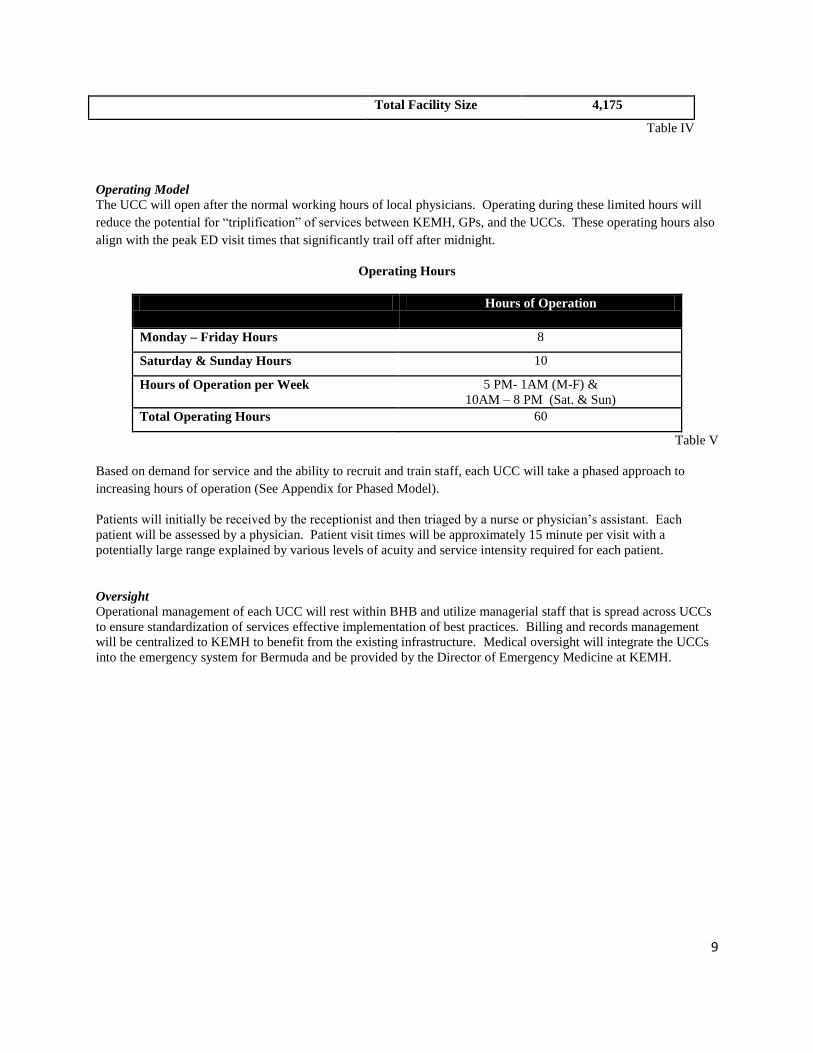
Total Facility Size 4,175
Table IV
Operating Model
The UCC will open after the normal working hours of local physicians. Operating during these limited hours will
reduce the potential for “triplification” of services between KEMH, GPs, and the UCCs. These operating hours also
align with the peak ED visit times that significantly trail off after midnight.
Operating Hours
Hours of Operation
Monday – Friday Hours 8
Saturday & Sunday Hours 10
Hours of Operation per Week 5 PM- 1AM (M-F) &
10AM – 8 PM (Sat. & Sun)
Total Operating Hours 60
Table V
Based on demand for service and the ability to recruit and train staff, each UCC will take a phased approach to
increasing hours of operation (See Appendix for Phased Model).
Patients will initially be received by the receptionist and then triaged by a nurse or physician’s assistant. Each
patient will be assessed by a physician. Patient visit times will be approximately 15 minute per visit with a
potentially large range explained by various levels of acuity and service intensity required for each patient.
Oversight
Operational management of each UCC will rest within BHB and utilize managerial staff that is spread across UCCs
to ensure standardization of services effective implementation of best practices. Billing and records management
will be centralized to KEMH to benefit from the existing infrastructure. Medical oversight will integrate the UCCs
into the emergency system for Bermuda and be provided by the Director of Emergency Medicine at KEMH.
10
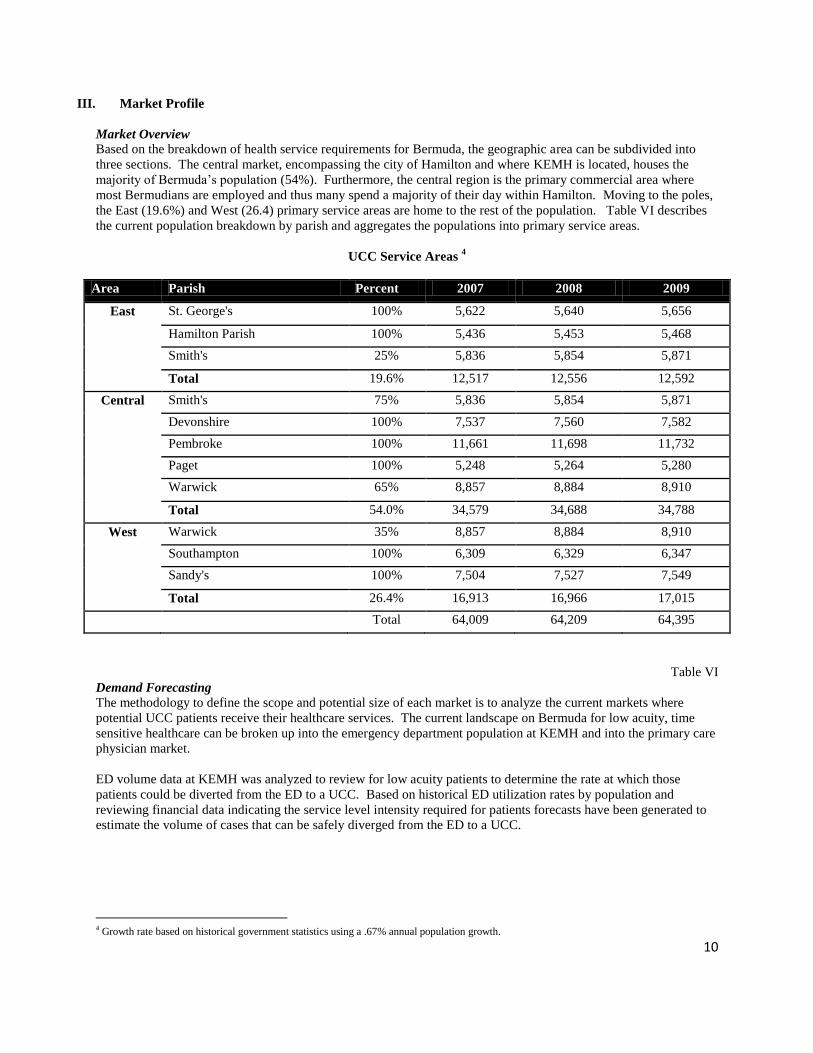
III. Market Profile
Market Overview
Based on the breakdown of health service requirements for Bermuda, the geographic area can be subdivided into
three sections. The central market, encompassing the city of Hamilton and where KEMH is located, houses the
majority of Bermuda’s population (54%). Furthermore, the central region is the primary commercial area where
most Bermudians are employed and thus many spend a majority of their day within Hamilton. Moving to the poles,
the East (19.6%) and West (26.4) primary service areas are home to the rest of the population. Table VI describes
the current population breakdown by parish and aggregates the populations into primary service areas.
UCC Service Areas 4
Area Parish Percent 2007 2008 2009
East St. George's 100% 5,622 5,640 5,656
Hamilton Parish 100% 5,436 5,453 5,468
Smith's 25% 5,836 5,854 5,871
Total 19.6% 12,517 12,556 12,592
Central Smith's 75% 5,836 5,854 5,871
Devonshire 100% 7,537 7,560 7,582
Pembroke 100% 11,661 11,698 11,732
Paget 100% 5,248 5,264 5,280
Warwick 65% 8,857 8,884 8,910
Total 54.0% 34,579 34,688 34,788
West Warwick 35% 8,857 8,884 8,910
Southampton 100% 6,309 6,329 6,347
Sandy's 100% 7,504 7,527 7,549
Total 26.4% 16,913 16,966 17,015
Total 64,009 64,209 64,395
Table VI
Demand Forecasting
The methodology to define the scope and potential size of each market is to analyze the current markets where
potential UCC patients receive their healthcare services. The current landscape on Bermuda for low acuity, time
sensitive healthcare can be broken up into the emergency department population at KEMH and into the primary care
physician market.
ED volume data at KEMH was analyzed to review for low acuity patients to determine the rate at which those
patients could be diverted from the ED to a UCC. Based on historical ED utilization rates by population and
reviewing financial data indicating the service level intensity required for patients forecasts have been generated to
estimate the volume of cases that can be safely diverged from the ED to a UCC.
4 Growth rate based on historical government statistics using a .67% annual population growth.
11
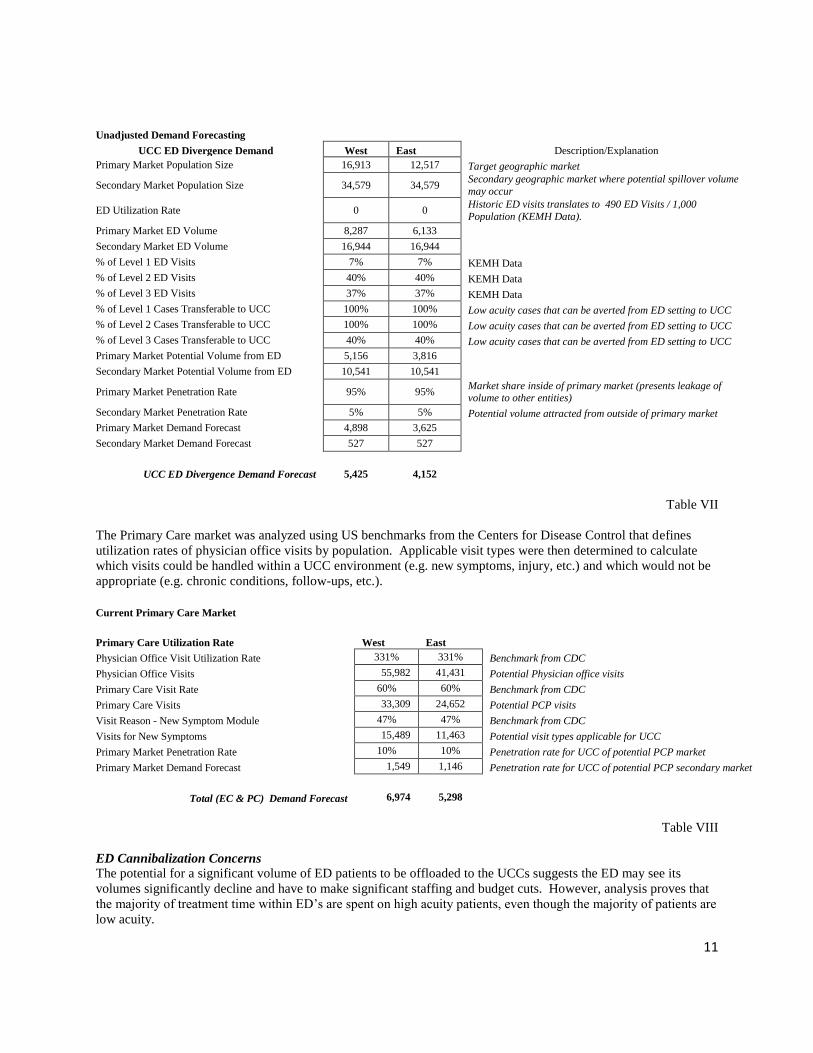
Unadjusted Demand Forecasting
UCC ED Divergence Demand West East Description/Explanation
Primary Market Population Size 16,913 12,517 Target geographic market
Secondary Market Population Size 34,579 34,579 Secondary geographic market where potential spillover volume
may occur
ED Utilization Rate 0 0 Historic ED visits translates to 490 ED Visits / 1,000
Population (KEMH Data).
Primary Market ED Volume 8,287 6,133
Secondary Market ED Volume 16,944 16,944
% of Level 1 ED Visits 7% 7% KEMH Data
% of Level 2 ED Visits 40% 40% KEMH Data
% of Level 3 ED Visits 37% 37% KEMH Data
% of Level 1 Cases Transferable to UCC 100% 100% Low acuity cases that can be averted from ED setting to UCC
% of Level 2 Cases Transferable to UCC 100% 100% Low acuity cases that can be averted from ED setting to UCC
% of Level 3 Cases Transferable to UCC 40% 40% Low acuity cases that can be averted from ED setting to UCC
Primary Market Potential Volume from ED 5,156 3,816
Secondary Market Potential Volume from ED 10,541 10,541
Primary Market Penetration Rate 95% 95% Market share inside of primary market (presents leakage of volume to other entities)
Secondary Market Penetration Rate 5% 5% Potential volume attracted from outside of primary market
Primary Market Demand Forecast 4,898 3,625
Secondary Market Demand Forecast 527 527
UCC ED Divergence Demand Forecast 5,425 4,152
Table VII
The Primary Care market was analyzed using US benchmarks from the Centers for Disease Control that defines
utilization rates of physician office visits by population. Applicable visit types were then determined to calculate
which visits could be handled within a UCC environment (e.g. new symptoms, injury, etc.) and which would not be
appropriate (e.g. chronic conditions, follow-ups, etc.).
Current Primary Care Market
Primary Care Utilization Rate West East
Physician Office Visit Utilization Rate 331% 331% Benchmark from CDC
Physician Office Visits 55,982 41,431 Potential Physician office visits
Primary Care Visit Rate 60% 60% Benchmark from CDC
Primary Care Visits 33,309 24,652 Potential PCP visits
Visit Reason - New Symptom Module 47% 47% Benchmark from CDC
Visits for New Symptoms 15,489 11,463 Potential visit types applicable for UCC
Primary Market Penetration Rate 10% 10% Penetration rate for UCC of potential PCP market
Primary Market Demand Forecast 1,549 1,146 Penetration rate for UCC of potential PCP secondary market
Total (EC & PC) Demand Forecast 6,974 5,298
Table VIII
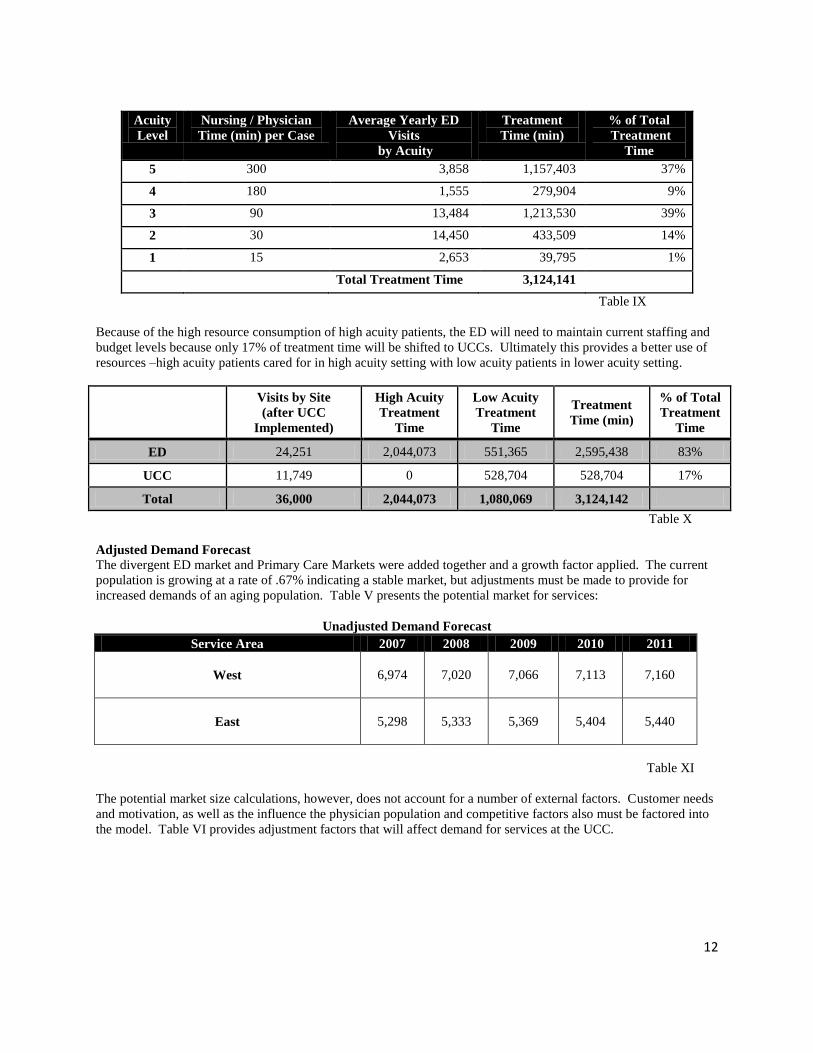
ED Cannibalization Concerns
The potential for a significant volume of ED patients to be offloaded to the UCCs suggests the ED may see its
volumes significantly decline and have to make significant staffing and budget cuts. However, analysis proves that
the majority of treatment time within ED’s are spent on high acuity patients, even though the majority of patients are
low acuity.
12
Acuity
Level
Nursing / Physician
Time (min) per Case
Average Yearly ED
Visits
by Acuity
Treatment
Time (min)
% of Total
Treatment
Time
5 300 3,858 1,157,403 37%
4 180 1,555 279,904 9%
3 90 13,484 1,213,530 39%
2 30 14,450 433,509 14%
1 15 2,653 39,795 1%
Total Treatment Time 3,124,141
Table IX
Because of the high resource consumption of high acuity patients, the ED will need to maintain current staffing and
budget levels because only 17% of treatment time will be shifted to UCCs. Ultimately this provides a better use of
resources –high acuity patients cared for in high acuity setting with low acuity patients in lower acuity setting.
Visits by Site
(after UCC
Implemented)
High Acuity
Treatment
Time
Low Acuity
Treatment
Time
Treatment
Time (min)
% of Total
Treatment
Time
ED 24,251 2,044,073 551,365 2,595,438 83%
UCC 11,749 0 528,704 528,704 17%
Total 36,000 2,044,073 1,080,069 3,124,142
Table X
Adjusted Demand Forecast
The divergent ED market and Primary Care Markets were added together and a growth factor applied. The current
population is growing at a rate of .67% indicating a stable market, but adjustments must be made to provide for
increased demands of an aging population. Table V presents the potential market for services:
Unadjusted Demand Forecast
Service Area 2007 2008 2009 2010 2011
West
6,974 7,020 7,066 7,113 7,160
East
5,298 5,333 5,369 5,404 5,440
Table XI
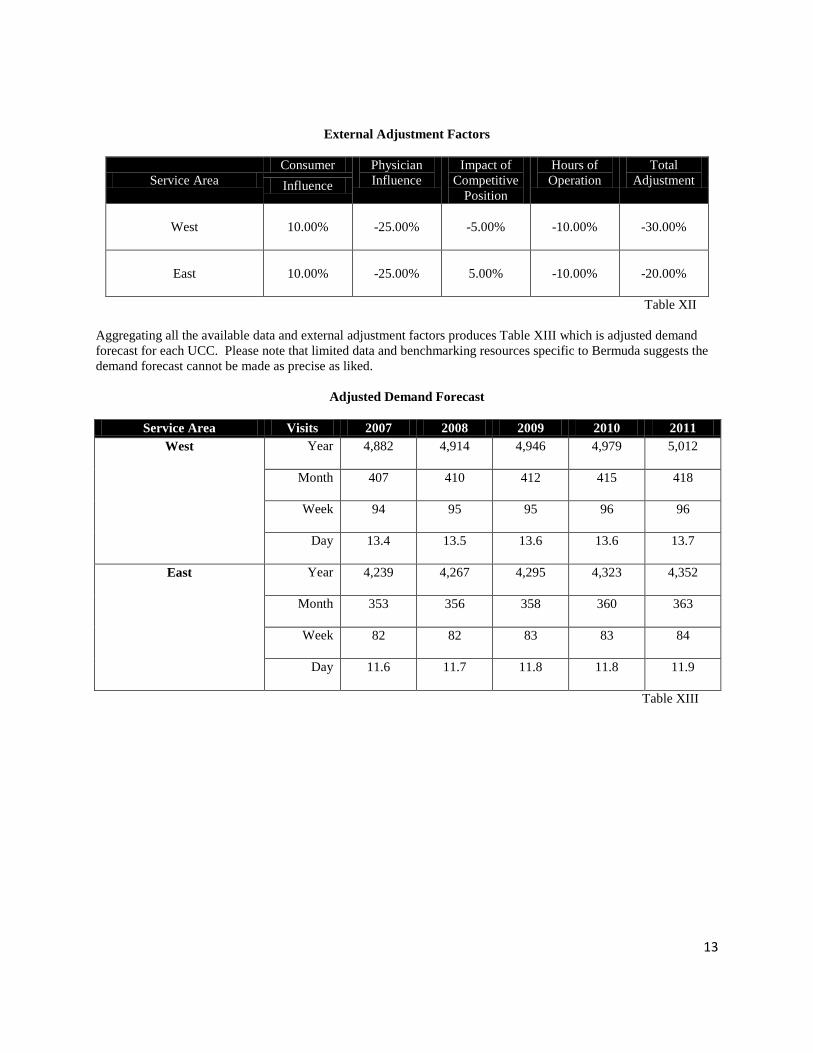
The potential market size calculations, however, does not account for a number of external factors. Customer needs
and motivation, as well as the influence the physician population and competitive factors also must be factored into
the model. Table VI provides adjustment factors that will affect demand for services at the UCC.
13
External Adjustment Factors
Service Area
Consumer Physician
Influence
Impact of
Competitive
Position
Hours of
Operation
Total
Adjustment Influence
West
10.00% -25.00% -5.00% -10.00% -30.00%
East
10.00% -25.00% 5.00% -10.00% -20.00%
Table XII
Aggregating all the available data and external adjustment factors produces Table XIII which is adjusted demand
forecast for each UCC. Please note that limited data and benchmarking resources specific to Bermuda suggests the
demand forecast cannot be made as precise as liked.
Adjusted Demand Forecast
Service Area Visits 2007 2008 2009 2010 2011
West Year 4,882 4,914 4,946 4,979 5,012
Month 407 410 412 415 418
Week 94 95 95 96 96
Day 13.4 13.5 13.6 13.6 13.7
East Year 4,239 4,267 4,295 4,323 4,352
Month 353 356 358 360 363
Week 82 82 83 83 84
Day 11.6 11.7 11.8 11.8 11.9
Table XIII
14
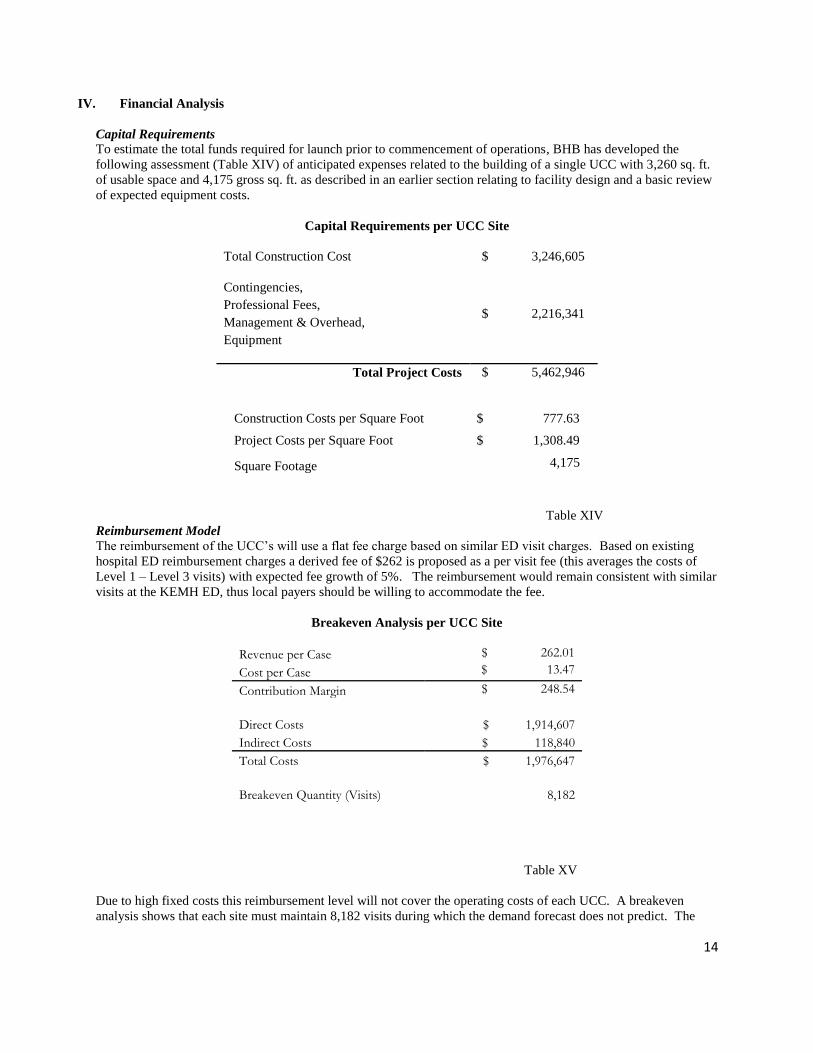
IV. Financial Analysis
Capital Requirements
To estimate the total funds required for launch prior to commencement of operations, BHB has developed the
following assessment (Table XIV) of anticipated expenses related to the building of a single UCC with 3,260 sq. ft.
of usable space and 4,175 gross sq. ft. as described in an earlier section relating to facility design and a basic review
of expected equipment costs.
Capital Requirements per UCC Site
Total Construction Cost $ 3,246,605
Contingencies,
Professional Fees,
Management & Overhead,
Equipment
$ 2,216,341
Total Project Costs $ 5,462,946
Construction Costs per Square Foot $ 777.63
Project Costs per Square Foot $ 1,308.49
Square Footage 4,175
Table XIV
Reimbursement Model
The reimbursement of the UCC’s will use a flat fee charge based on similar ED visit charges. Based on existing
hospital ED reimbursement charges a derived fee of $262 is proposed as a per visit fee (this averages the costs of
Level 1 – Level 3 visits) with expected fee growth of 5%. The reimbursement would remain consistent with similar
visits at the KEMH ED, thus local payers should be willing to accommodate the fee.
Breakeven Analysis per UCC Site
Revenue per Case $ 262.01
Cost per Case $ 13.47
Contribution Margin $ 248.54
Direct Costs $ 1,914,607
Indirect Costs $ 118,840
Total Costs $ 1,976,647
Breakeven Quantity (Visits) 8,182
Table XV
Due to high fixed costs this reimbursement level will not cover the operating costs of each UCC. A breakeven
analysis shows that each site must maintain 8,182 visits during which the demand forecast does not predict. The
15
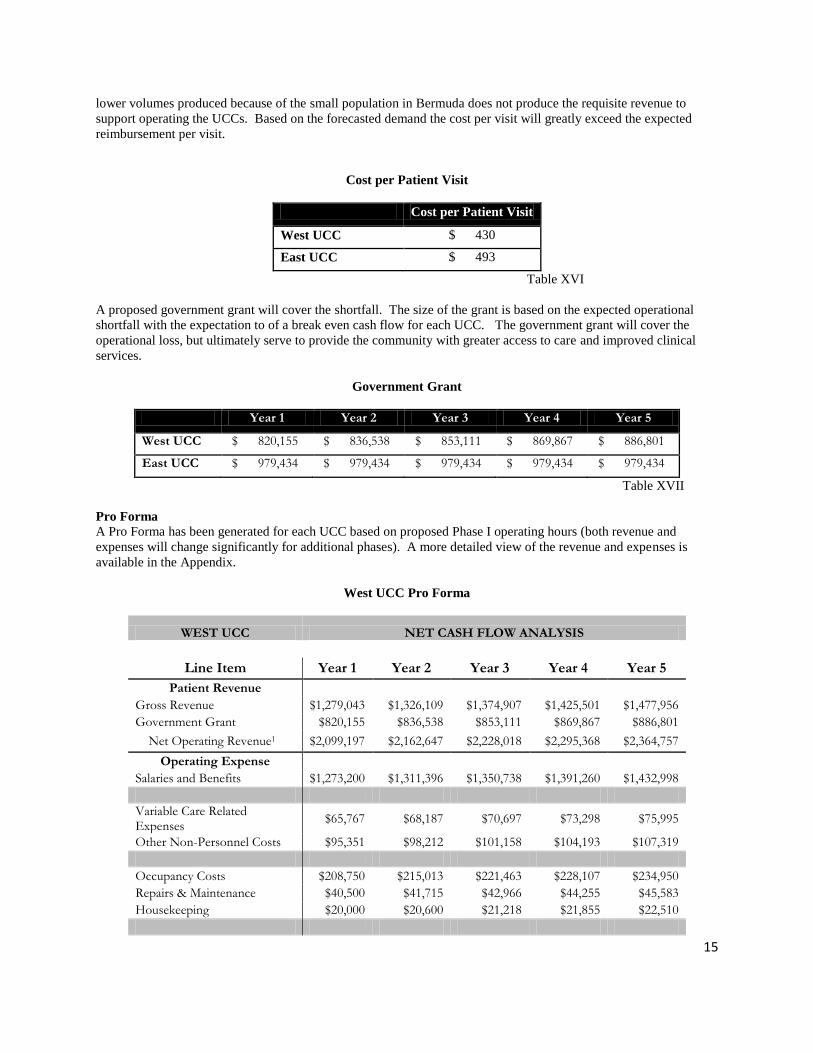
lower volumes produced because of the small population in Bermuda does not produce the requisite revenue to
support operating the UCCs. Based on the forecasted demand the cost per visit will greatly exceed the expected
reimbursement per visit.
Cost per Patient Visit
Cost per Patient Visit
West UCC $ 430
East UCC $ 493
Table XVI
A proposed government grant will cover the shortfall. The size of the grant is based on the expected operational
shortfall with the expectation to of a break even cash flow for each UCC. The government grant will cover the
operational loss, but ultimately serve to provide the community with greater access to care and improved clinical
services.
Government Grant
Year 1 Year 2 Year 3 Year 4 Year 5
West UCC $ 820,155 $ 836,538 $ 853,111 $ 869,867 $ 886,801
East UCC $ 979,434 $ 979,434 $ 979,434 $ 979,434 $ 979,434
Table XVII
Pro Forma
A Pro Forma has been generated for each UCC based on proposed Phase I operating hours (both revenue and
expenses will change significantly for additional phases). A more detailed view of the revenue and expenses is
available in the Appendix.
West UCC Pro Forma
WEST UCC NET CASH FLOW ANALYSIS
Line Item Year 1 Year 2 Year 3 Year 4 Year 5
Patient Revenue
Gross Revenue $1,279,043 $1,326,109 $1,374,907 $1,425,501 $1,477,956
Government Grant $820,155 $836,538 $853,111 $869,867 $886,801
Net Operating Revenue1 $2,099,197 $2,162,647 $2,228,018 $2,295,368 $2,364,757
Operating Expense
Salaries and Benefits $1,273,200 $1,311,396 $1,350,738 $1,391,260 $1,432,998
Variable Care Related Expenses
$65,767 $68,187 $70,697 $73,298 $75,995
Other Non-Personnel Costs $95,351 $98,212 $101,158 $104,193 $107,319
Occupancy Costs $208,750 $215,013 $221,463 $228,107 $234,950
Repairs & Maintenance $40,500 $41,715 $42,966 $44,255 $45,583
Housekeeping $20,000 $20,600 $21,218 $21,855 $22,510
16
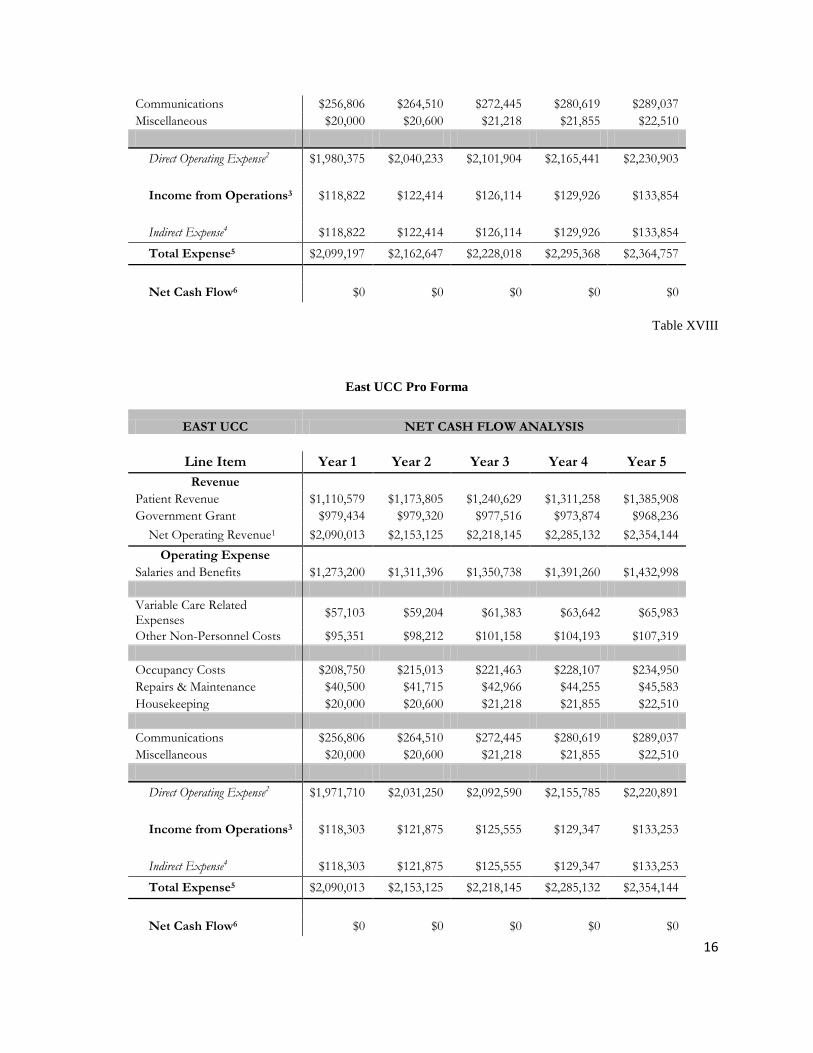
Communications $256,806 $264,510 $272,445 $280,619 $289,037
Miscellaneous $20,000 $20,600 $21,218 $21,855 $22,510
Direct Operating Expense2 $1,980,375 $2,040,233 $2,101,904 $2,165,441 $2,230,903
Income from Operations3 $118,822 $122,414 $126,114 $129,926 $133,854
Indirect Expense4 $118,822 $122,414 $126,114 $129,926 $133,854
Total Expense5 $2,099,197 $2,162,647 $2,228,018 $2,295,368 $2,364,757
Net Cash Flow6 $0 $0 $0 $0 $0
Table XVIII
East UCC Pro Forma
EAST UCC NET CASH FLOW ANALYSIS
Line Item Year 1 Year 2 Year 3 Year 4 Year 5
Revenue
Patient Revenue $1,110,579 $1,173,805 $1,240,629 $1,311,258 $1,385,908
Government Grant $979,434 $979,320 $977,516 $973,874 $968,236
Net Operating Revenue1 $2,090,013 $2,153,125 $2,218,145 $2,285,132 $2,354,144
Operating Expense
Salaries and Benefits $1,273,200 $1,311,396 $1,350,738 $1,391,260 $1,432,998
Variable Care Related Expenses
$57,103 $59,204 $61,383 $63,642 $65,983
Other Non-Personnel Costs $95,351 $98,212 $101,158 $104,193 $107,319
Occupancy Costs $208,750 $215,013 $221,463 $228,107 $234,950
Repairs & Maintenance $40,500 $41,715 $42,966 $44,255 $45,583
Housekeeping $20,000 $20,600 $21,218 $21,855 $22,510
Communications $256,806 $264,510 $272,445 $280,619 $289,037
Miscellaneous $20,000 $20,600 $21,218 $21,855 $22,510
Direct Operating Expense2 $1,971,710 $2,031,250 $2,092,590 $2,155,785 $2,220,891
Income from Operations3 $118,303 $121,875 $125,555 $129,347 $133,253
Indirect Expense4 $118,303 $121,875 $125,555 $129,347 $133,253
Total Expense5 $2,090,013 $2,153,125 $2,218,145 $2,285,132 $2,354,144
Net Cash Flow6 $0 $0 $0 $0 $0

17
Table XIX

18
V. Appendices
West UCC Site
East UCC Site

19
Services Offered
Nursing Triage
Physician Assessments
Potential Diagnoses
Common illness
Respiratory illness
Allergies
Bladder infections
Eye/ear/sinus infection
Strep throat
Mononucleosis
Pregnancy testing
Skin rashes
Sport Injuries/sprains/strains Stabilization of
Services Emergency transfer to KEMH
Vital signs
IV Therapy (Antibiotic, Hydration)
EKG
Wound care
Immunizations, TD, Pneumovax, Flu Vaccines
Minor procedures
Incision and draining of abscess
Excision of skin
Aspiration of cyst
Sutures

20
Lab Services
Blood
Urine
Other
Diagnostic Imaging
Ultrasound
X-ray
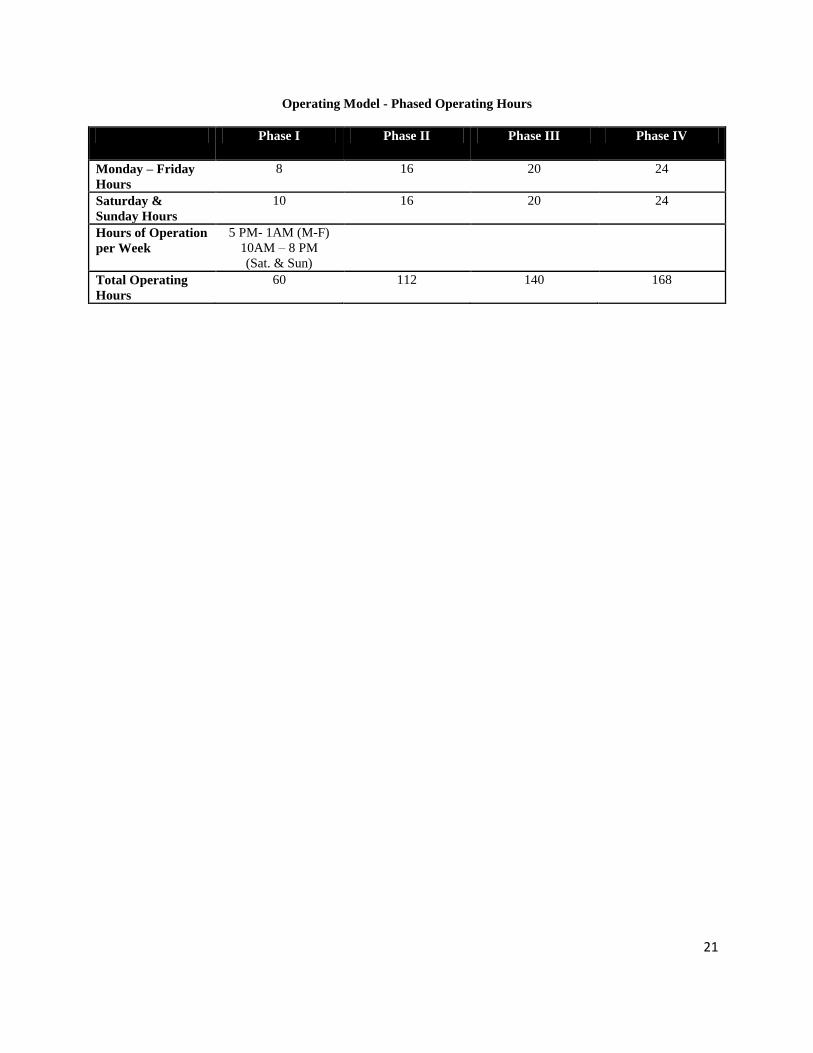
21
Operating Model - Phased Operating Hours
Phase I Phase II Phase III Phase IV
Monday – Friday
Hours
8 16 20 24
Saturday &
Sunday Hours
10 16 20 24
Hours of Operation
per Week
5 PM- 1AM (M-F)
10AM – 8 PM
(Sat. & Sun)
Total Operating
Hours
60 112 140 168
22
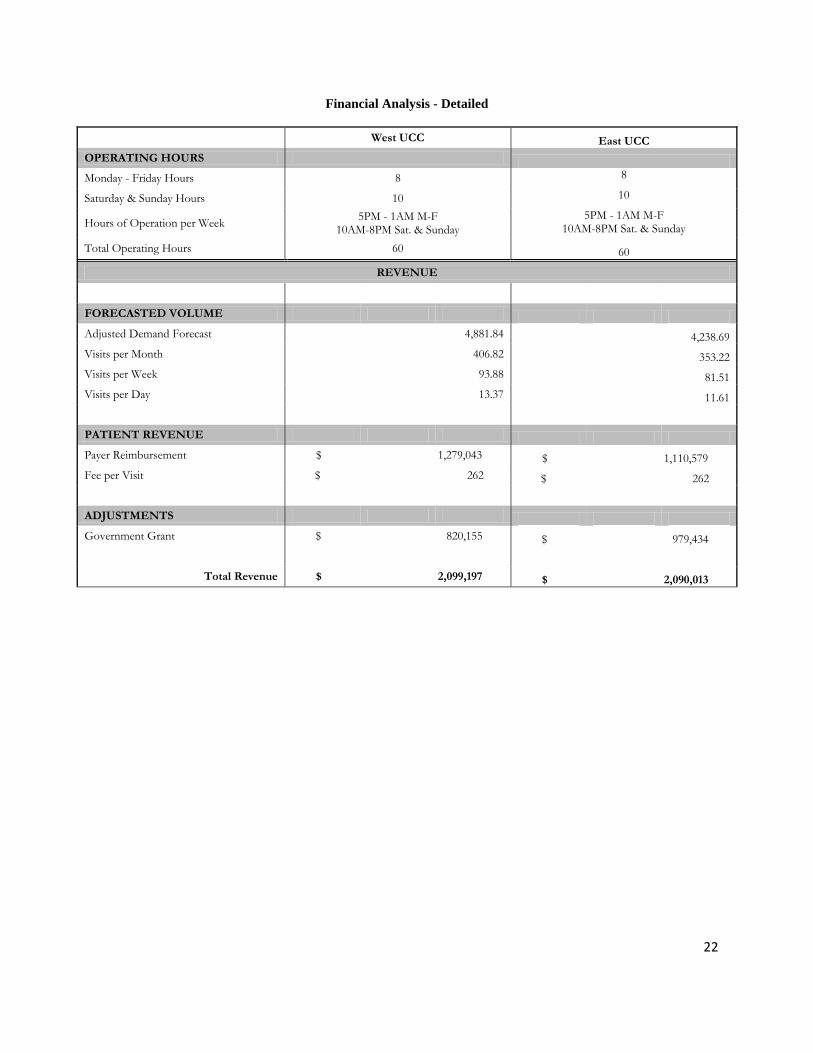
Financial Analysis - Detailed
West UCC East UCC
OPERATING HOURS
Monday - Friday Hours 8 8
Saturday & Sunday Hours 10 10
Hours of Operation per Week 5PM - 1AM M-F
10AM-8PM Sat. & Sunday
5PM - 1AM M-F 10AM-8PM Sat. & Sunday
Total Operating Hours 60 60
REVENUE
FORECASTED VOLUME
Adjusted Demand Forecast 4,881.84 4,238.69
Visits per Month 406.82 353.22
Visits per Week 93.88 81.51
Visits per Day 13.37 11.61
PATIENT REVENUE
Payer Reimbursement $ 1,279,043 $ 1,110,579
Fee per Visit $ 262 $ 262
ADJUSTMENTS
Government Grant $ 820,155 $ 979,434
Total Revenue $ 2,099,197 $ 2,090,013
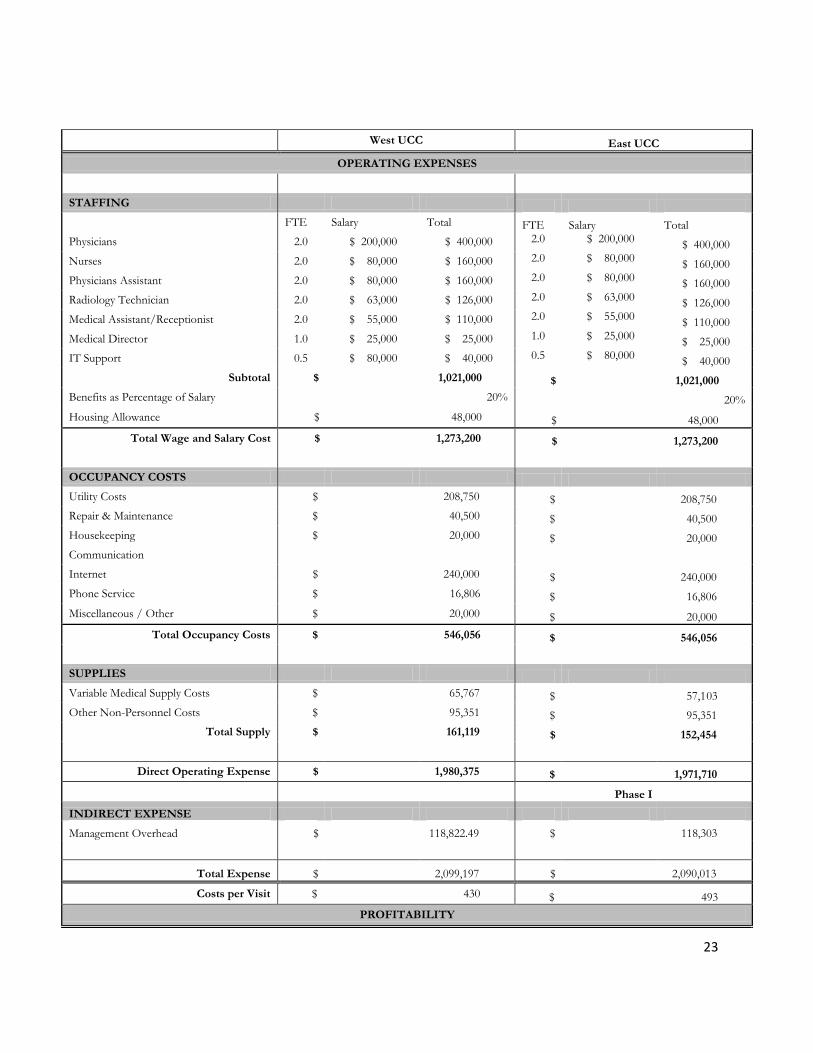
23
West UCC East UCC
OPERATING EXPENSES
STAFFING
FTE Salary Total FTE Salary Total
Physicians 2.0 $ 200,000 $ 400,000 2.0 $ 200,000 $ 400,000
Nurses 2.0 $ 80,000 $ 160,000 2.0 $ 80,000 $ 160,000
Physicians Assistant 2.0 $ 80,000 $ 160,000 2.0 $ 80,000 $ 160,000
Radiology Technician 2.0 $ 63,000 $ 126,000 2.0 $ 63,000 $ 126,000
Medical Assistant/Receptionist 2.0 $ 55,000 $ 110,000 2.0 $ 55,000 $ 110,000
Medical Director 1.0 $ 25,000 $ 25,000 1.0 $ 25,000 $ 25,000
IT Support 0.5 $ 80,000 $ 40,000 0.5 $ 80,000 $ 40,000
Subtotal $ 1,021,000 $ 1,021,000
Benefits as Percentage of Salary 20% 20%
Housing Allowance $ 48,000 $ 48,000
Total Wage and Salary Cost $ 1,273,200 $ 1,273,200
OCCUPANCY COSTS
Utility Costs $ 208,750 $ 208,750
Repair & Maintenance $ 40,500 $ 40,500
Housekeeping $ 20,000 $ 20,000
Communication
Internet $ 240,000 $ 240,000
Phone Service $ 16,806 $ 16,806
Miscellaneous / Other $ 20,000 $ 20,000
Total Occupancy Costs $ 546,056 $ 546,056
SUPPLIES
Variable Medical Supply Costs $ 65,767 $ 57,103
Other Non-Personnel Costs $ 95,351 $ 95,351
Total Supply $ 161,119 $ 152,454
Direct Operating Expense $ 1,980,375 $ 1,971,710
Phase I
INDIRECT EXPENSE
Management Overhead $ 118,822.49 $ 118,303
Total Expense $ 2,099,197 $ 2,090,013
Costs per Visit $ 430 $ 493
PROFITABILITY

24
Operating Income $ - $ s -