Embed Size (px)
Citation preview

U.S. ARMY CIVILIAN HUMAN RESOURCES AGENCY (CHRA)
NONAPPROPRIATED FUNDS (NAF) TURNOVER REPORT
CALENDAR YEAR 2016
13 March 2017

U.S. ARMY CIVILIAN HUMAN RESOURCES AGENCY CALENDAR YEAR 2016 ARMY NAF TURNOVER
U.S. Army Civilian Human Resources Agency © 2016 People powered, Army strong. 2
To provide analysis of Army NAF Turnover
A company with low employment turnover is characterized as having a workforce in which employees are generally satisfied. Employee satisfaction is a contributing factor in increasing productivity and lowering costs. While it is the nature of any business to have turnover, high turnover negatively impacts morale, productivity, and ultimately the Army’s mission. Frequent reviews and analysis of data help identify current trends and specific areas of concern.
Turnover Rates were determined by a formula which calculates the number of separations during CY16 against the average strength of serviced population. The data includes all types of separations and reasons for separations to arrive at the annual totals. No separation actions were excluded as there was no systematic, factual and guaranteed method to exclude only those separations which do not result in a recruitment. Turnover data and separation data are presented in various forms and categorizations for the purpose of determining correlations between the data. Turnover is also categorized into controllable and uncontrollable categories. This classification is determined first by analyzing the separation reason, and in the absence of a separation reason, using the nature of action to determine if the separation was management initiated, or within the control of management (controllable), or not within the control of management (uncontrollable). Turnover cost analysis is also provided within this report.
The separation data is collected directly from the Defense Civilian Personnel Data System (DCPDS) Tier 1 database using the TOAD for Oracle software. The strength and demographic data is collected from the DCPDS CRM database using Business Objects Xi software. Note: DCPDS coding is based on user input and adjustments were made to account for user error as deemed necessary. The raw data used to produce the analysis is available upon request.
PURPOSE
INTRODUCTION
METHODOLOGY
DATA SOURCE

U.S. ARMY CIVILIAN HUMAN RESOURCES AGENCY CALENDAR YEAR 2016 ARMY NAF TURNOVER
U.S. Army Civilian Human Resources Agency © 2016 People powered, Army strong. 3
SUMMARY
The aggregate (non-filtered) percentage (36%) includes turnover for all of Army regardless of type of separation and constitutes the NAF HRO workload assigned to Nature of Actions (NOAs) that result in separation. The actual (filtered) turnover rate for Army NAF, after removing non-turnover types of separation actions (e.g., transfers from one installation to another that is not a loss to Army NAF) is 34%. Both rates have seen an increase since CY14 after 7 years of these rates either decreasing or remaining stable.
Considering all CY16 turnover, 39% fell into the controllable category and the remaining 61% fell into the uncontrollable category. More effective turnover data analysis could be achieved if specific reason for separation was provided each time an employee separates. Since 2011, this has been a challenge across the enterprise. Current efforts to obtain specific reasons for separation include; management requesting the reason from employees at the time of resignation and HR offices collecting the reason for separation during employee outprocessing orientation. Since neither effort yields a guarantee of communication with each separating employee, turnover analysis on the reason for separation is not as informative as it could be, therefore a better solution is warranted.
The greatest number of employees separating in CY16 were found in the 20-39 age group. Another trend reflected a spike in the number of military spouses separating from the rolls, as compared with previous years. Should this trend continue, without supplemental increase in military spouses being hired, there will be decreased military spouse representation in the Army. NAF workforce. The majority of CY16 separations were also from employees in the flexible employment category. Within those separations, 96% were Flex 00, meaning management was not willing to guarantee the employees they would be scheduled any hours per week. Overall CY16 NAF turnover cost Army NAF approximately $54,974,925, a $23,179,339 increase from the CY14.

U.S. ARMY CIVILIAN HUMAN RESOURCES AGENCY CALENDAR YEAR 2016 ARMY NAF TURNOVER
U.S. Army Civilian Human Resources Agency © 2016 People powered, Army strong. 4
TURNOVER
Aggregate vs. Actual Turnover
Historical Actual Turnover Controllable vs. Uncontrollable Turnover
Aggregate turnover includes all separations regardless of type which is useful in determining workload impact.
Actual turnover removes non-turnover type separations (e.g. transfers from one installation to another that is not a loss to Army NAF).
Both aggregate and actual turnover have increased.
In CY 16, Army NAF achieved the fourth lowest actual turnover rate in the 9 year historical period.
Uncontrollable turnover includes all separations whose reason for separation indicates an employee driven reason which management cannot control.
Controllable turnover includes all separations whose reason for separation indicates a management initiated separation or a reason for separation which management has direct control over.

U.S. ARMY CIVILIAN HUMAN RESOURCES AGENCY CALENDAR YEAR 2016 ARMY NAF TURNOVER
U.S. Army Civilian Human Resources Agency © 2016 People powered, Army strong. 5
TURNOVER (CONT)
Turnover by Command
Army NAF is comprised of NAF employees under 21 separate command or agency codes within the Department of the Army or the Department of Defense.
34% (Enterprise Actual
Turnover Rate)
36% (Enterprise Aggregate Turnover Rate)
Since IMCOM employs 85% of the serviced population of Army NAF, its turnover has a higher weight than other commands and has the greatest effect on the enterprise turnover rate.
If IMCOM was excluded the aggregate enterprise turnover rate would drop to 29% and the actual rate would drop to 27% considering only the other commands. Therefore, we recommend other commands use these as benchmark rates.

U.S. ARMY CIVILIAN HUMAN RESOURCES AGENCY CALENDAR YEAR 2016 ARMY NAF TURNOVER
U.S. Army Civilian Human Resources Agency © 2016 People powered, Army strong. 6
TURNOVER (CONT)
Turnover by NAFI
A NAFI is a Nonappropriated Fund Instrumentality. Seventeen NAFIs exist in Army NAF and they exist to keep financials and budgetary operations separate based on separate missions.
Morale, Welfare, and Recreation (MWR), Post Restaurant, Insurance Fund and Lodging Fund NAFI’s all exceeded the enterprise turnover rate of 36%.
34% (Enterprise Actual Turnover Rate)
36% (Enterprise Aggregate Turnover Rate)

U.S. ARMY CIVILIAN HUMAN RESOURCES AGENCY CALENDAR YEAR 2016 ARMY NAF TURNOVER
U.S. Army Civilian Human Resources Agency © 2016 People powered, Army strong. 7
SEPARATIONS
Top 15 Reasons for Separation
Ideal scenario:
#1: RESIGN-NO REASON PROVIDED-NO OTHER INFO AVAILABLE #2: RESIGN-MOVING OUT OF THE AREA #3: RESIGN-PERSONAL REASONS #4: RESIGN-TO ACCEPT POSITION IN PRIVATE INDUSTRY #5: RESIGN-OTHER #6: RESIGN-TO ACCEPT APPOINTMENT IN ANOTHER AGENCY #7: TERMINATION-OTHER #8: RESIGN-TO ACCOMPANY SPOUSE
#9: RETIREMENT-VOLUNTARY #10: RESIGN-PUBLIC LAW 101-508 #11: RESIGN-FURTHER EDUCATION #12: TERM-EXPIRATION OF APPOINTMENT #13: RESIGN-PERMANENT CHANGE OF STATION #14: TERMINATION-ORDINARY NOTICE #15: TERMINATION-ABANDONMENT OF POSITION
Employee Supervisor NAF HR Office Organization HR Officer Leader
Regretfully, the number one reason (23.83% of the time) provided to HR by the employee/ management for resignation is no reason at all.
For this reason, we cannot significantly determine why employees leave.
2016 saw an increased amount of retirements than 2014.
I am resigning
Too bad John resigned. So glad he provided a reason and forwarding address
I need to know who is leaving and why so we
can fix our turnover issue
Actually, we capture that in our system. Here is a customized turnover report
Sorry to see you go, but HR needs a reason and
forwarding address
49% of resignation RPAs are sent to HR on or before the effective date of the resignation in order for HR to potentially schedule an out-processing.
51% of resignation RPAs are sent to HR after the resignation date has passed, at which time it’s too late to out-process the employee.

U.S. ARMY CIVILIAN HUMAN RESOURCES AGENCY CALENDAR YEAR 2016 ARMY NAF TURNOVER
U.S. Army Civilian Human Resources Agency © 2016 People powered, Army strong. 8
SEPARATIONS (CONT)
Demographics & Separations by Age
Demographics & Separations by Educational Background
% of Workforce
% of Calendar Year 2016 Separations
Army NAF is not able to retain the workforce between ages 20 – 39 years of age. This age group accounted for 64% of the CY 16 separating workforce. It is critical to retain this workforce to fill the spots of future retirees and avoid competency and knowledge gaps based on loss in historical knowledge.
Overall, we appear to have a loss by educational category within the same proportion we employ. Therefore, there is no proportionally significant loss in any one educational background.
% of Workforce
% of Calendar Year 2016 Separations

U.S. ARMY CIVILIAN HUMAN RESOURCES AGENCY CALENDAR YEAR 2016 ARMY NAF TURNOVER
U.S. Army Civilian Human Resources Agency © 2016 People powered, Army strong. 9
SEPARATIONS (CONT)
Demographics & Separations by Dependent Status
Demographics & Separations by Employment Category
A significant portion of the flexible workforce is resigning with approximately 51% of those losses having a separation reason which was potentially controllable. In comparison, only 27% of Part Time resignations and 22% of Full Time into this category.
There is a statistically significant trend in losing military spouses from the NAF workforce. If this trend is not supplemented by a commensurate hiring of military spouses in their place, we will see a reduction in the proportion of military spouses we employ as compared to our remaining workforce. % of Calendar Year 2016 Separations
% of Workforce
% of Workforce
% of Calendar Year 2016 Separations
95% of the resigning flexible workforce were guaranteed zero hours per week.

U.S. ARMY CIVILIAN HUMAN RESOURCES AGENCY CALENDAR YEAR 2016 ARMY NAF TURNOVER
U.S. Army Civilian Human Resources Agency © 2016 People powered, Army strong. 10
SEPARATIONS (CONT)
Demographics & Separations by Union Representation
Demographics & Separations by Pay Plan
% of Workforce
% of Calendar Year 2016 Separations
% of Workforce
% of Calendar Year 2016 Separations
Union representation does not appear to have a statistically significant impact on an employee’s decision to leave Army NAF.
There appears to be a slightly higher amount of CY and NA pay plan separations than NF. This could be a result of approximately 51% of the NA workforce being in a Flexible employment category, and 32% of the CY workforce. Only 25% of the NF workforce is Flexible.

U.S. ARMY CIVILIAN HUMAN RESOURCES AGENCY CALENDAR YEAR 2016 ARMY NAF TURNOVER
U.S. Army Civilian Human Resources Agency © 2016 People powered, Army strong. 11
SEPARATIONS (CONT)
Demographics & Separations by Supervisory Status
Demographics & Separations by Occupational Category
% of Workforce
% of Calendar Year 2016 Separations
% of Calendar Year 2016 Separations % of Workforce
The majority of the separating workforce is non-supervisory, suggesting we do not have a significant issue in keeping our supervisors and leaders.
51% of the CY 16 Blue Collar separations fell into the controllable category.
71% of the CY 16 Blue Collar separations were from Flexible positions, 96% of those were from Flexible positions guaranteeing the employee zero hours a week.

U.S. ARMY CIVILIAN HUMAN RESOURCES AGENCY CALENDAR YEAR 2016 ARMY NAF TURNOVER
U.S. Army Civilian Human Resources Agency © 2016 People powered, Army strong. 12
SEPARATIONS (CONT)
Demographics & Separations by White Collar Occupational Group
Demographics & Separations by Blue Collar Occupational Category
% of Workforce #1: 1700 – Education (43%) #2: 0100 – Social Science, Psychology, and Welfare (19%) #3: 0300 – General Admin, Clerical & Office Svcs (13%) #4: 1100 – Business and Industry (8%) #5: 0500 – Accounting and Budget (4%)
% of Calendar Year 2016 Separations #1: 1700 – Education (45%) #2: 0100 – Social Science, Psychology, and Welfare (23%) #3: 0300 – General Admin, Clerical & Office Svcs (12%) #4: 1100 – Business and Industry (6%) #5: 2000 – Supply (3%)
% of Workforce #1: 7400 – Food Preparation and Serving (55%) #2: 3500 – General Services and Support Work (21%) #3: 4700 – General Maintenance and Ops Work (7%) #4: 5700 – Transportation/Mobile Equip Operation (6%) #5: 6900 – Warehousing and Stock Handling (3%)
% of Calendar Year 2016 Separations
#1: 7400 – Food Preparation and Serving (62%)
#2: 3500 – General Services and Support Work (20%)
#3: 5700 – Transportation/Mobile Equip Operation (5%)
#4: 4700 – General Maintenance and Ops Work (4%) #5: 6900 – Warehousing and Stock Handling (3%)

U.S. ARMY CIVILIAN HUMAN RESOURCES AGENCY CALENDAR YEAR 2016 ARMY NAF TURNOVER
U.S. Army Civilian Human Resources Agency © 2016 People powered, Army strong. 13
SERVICED POPULATION
TURNOVER BY CHRA HRO
Turnover by Region
CHRA oversees 54 Human Resources Offices, separated into 7 Regions which provide HR services to 91% of the Army NAF workforce. The remaining 9% are serviced by IMCOM operated NAF HR Offices.
REGIONAL OVERVIEW EUROPE REGION
FAR EAST REGION NORTH CENTRAL REGION
Vicenza is tied with Dugway PG as having the workforce with the highest turnover.
Korea NAF HROs may be experiencing higher turnover due to the second and third order effects of the proposed Korea Transformation plans.
West and Southwest Regions appear to have the highest turnover within their serviced workforce.
HQDA NAF HR saw the lowest turnover in CY 14 and again in CY 16.
North Central Region appears to have not only the lowest aggregate turnover, but also the most amount of transfers.

U.S. ARMY CIVILIAN HUMAN RESOURCES AGENCY CALENDAR YEAR 2016 ARMY NAF TURNOVER
U.S. Army Civilian Human Resources Agency © 2016 People powered, Army strong. 14
SERVICED POPULATION
TURNOVER BY CHRA HRO
NORTHEAST REGION SOUTHWEST REGION
SOUTH CENTRAL REGION WEST REGION
Fort Riley appears to have a high turnover rate for its serviced population, but this may be due to CYSS traditionally accounting for 65% of its workforce.

U.S. ARMY CIVILIAN HUMAN RESOURCES AGENCY CALENDAR YEAR 2016 ARMY NAF TURNOVER
U.S. Army Civilian Human Resources Agency © 2016 People powered, Army strong. 15
TURNOVER COSTS
Turnover costs per employee were determined by a formula which calculated twenty-five percent of the average annual salary of a specific workforce employment category (i.e. regular, flexible…etc.). For regular employees, the approximate cost of benefits is also included. Turnover costs per employee are then multiplied by the number of separations within each employment category to determine the overall turnover cost.
FORMULAS:
CALCULATION:
1. Regular Workforce: $7,290 (25% of Avg Salary) + $2,187 (25% of Cost of Benefits) = $9,477
$9,477 x 4,291 (# of Regular Separations) = $40,665,807
2. Flexible Workforce: $2,934 (25% of Avg Salary) * 4,877 (# of Flex Separations) = $14,309,118
3. Army NAF Calendar Year Turnover Cost: $40,665,807 + $14,309,118 = $54,974,925
In 2014, turnover cost the Army approximately $31,795,586.00.
CY 16 Army NAF Turnover Cost was $54,974,925
There is a significant increase in the cost from CY 14 to CY 16, due primarily in an additional 2,168 regular separations in CY 16 than regular employees who resigned in CY14.

U.S. ARMY CIVILIAN HUMAN RESOURCES AGENCY CALENDAR YEAR 2016 ARMY NAF TURNOVER
U.S. Army Civilian Human Resources Agency © 2016 People powered, Army strong. 16
HIRES & LOSSES
ENCLOSURES
Inherently, almost every loss results in the need for a hire. 9,168 employees left Army NAF rolls in Calendar Year 2016. However, 9,275 employees were hired in the same period. Generally speaking there is no need for a recruitment or hire action, if there is no loss in the first place.
CALENDAR YEAR 2016 HIRES AND LOSSES
Enclosed are command-specific turnover reports. A separate report was generated only for the major NAF commands which comprise the majority of the Army NAF workforce. If your command is not listed, please contact your servicing NAF HR Office for a turnover report.
MONTH LOSSES HIRES HIRES PER LOSS
January 716 671 0.94 February 607 673 1.11 March 719 837 1.16 April 751 813 1.08 May 824 1025 1.24 June 884 1072 1.21 July 813 748 0.92 August 960 804 0.84 September 948 831 0.88 October 695 597 0.86 November 744 530 0.71 December 507 674 1.33
TOTAL: 9168 9275 1.01
In CY16, for every 1.01 Hires, there was 1 Loss.
This is an unsustainable attrition rate.

U.S. ARMY CIVILIAN HUMAN RESOURCES AGENCY CALENDAR YEAR 2016 ARMY NAF TURNOVER
U.S. Army Civilian Human Resources Agency © 2016 People powered, Army strong.
ENCLOSURES:
ENCL 1, TURNOVER BY COMMAND – CHRA ENCL 2, TURNOVER BY COMMAND – IMCOM
ENCL 3, TURNOVER BY COMMAND – MEDCOM ENCL 4, TURNOVER BY COMMAND – STARS & STRIPES
ENCL 5, TURNOVER BY COMMAND – NAF FINANCIAL SERVICES (NFS) ENCL 6, EMPLOYEE RENTENTION REPORT

U.S. ARMY CIVILIAN HUMAN RESOURCES AGENCY CALENDAR YEAR 2016 ARMY NAF TURNOVER
U.S. Army Civilian Human Resources Agency © 2016 People powered, Army strong. Encl 1
TURNOVER BY COMMAND (CHRA)
COMMAND: CIVILIAN HUMAN RESOURCES AGENCY (CHRA)The following data pertains to turnover only within the Civilian Human Resources Agency NAF Human Resources community.
Aggregate vs. Actual Turnover Turnover by Type
Reasons for Separation

U.S. ARMY CIVILIAN HUMAN RESOURCES AGENCY CALENDAR YEAR 2016 ARMY NAF TURNOVER
U.S. Army Civilian Human Resources Agency © 2016 People powered, Army strong. 2
TURNOVER BY COMMAND (CHRA CONT)
All CHRA Regions Europe NAF HR Os
Far East NAF HROs North Central NAF HROs

U.S. ARMY CIVILIAN HUMAN RESOURCES AGENCY CALENDAR YEAR 2016 ARMY NAF TURNOVER
U.S. Army Civilian Human Resources Agency © 2016 People powered, Army strong.
TURNOVER BY COMMAND (CHRA CONT)
Northeast NAF HROs Southwest NAF HROs
South Central NAF HROs West NAF HROs
3

U.S. ARMY CIVILIAN HUMAN RESOURCES AGENCY CALENDAR YEAR 2016 ARMY NAF TURNOVER
U.S. Army Civilian Human Resources Agency © 2016 People powered, Army strong. 4
TURNOVER BY COMMAND (CHRA CONT)
SEPARATIONS BY CATEGORY The following displays the calendar year 2016 separations within CHRA by specific categories.
Age Group Dependent Status
Education Occupational Series

U.S. ARMY CIVILIAN HUMAN RESOURCES AGENCY CALENDAR YEAR 2016 ARMY NAF TURNOVER
U.S. Army Civilian Human Resources Agency © 2016 People powered, Army strong. Encl 2
TURNOVER BY COMMAND (IMCOM)
COMMAND: INSTALLATION MANAGEMENT COMMAND The following data pertains to turnover only within the Installation Management Command NAF workforce.
Aggregate vs. Actual Turnover Turnover by Type
Reasons for Separation

U.S. ARMY CIVILIAN HUMAN RESOURCES AGENCY CALENDAR YEAR 2016 ARMY NAF TURNOVER
U.S. Army Civilian Human Resources Agency © 2016 People powered, Army strong. 2
TURNOVER BY COMMAND (IMCOM CONT)
UIC GARRISON Actual Aggregate Controllable UncontrollableW4QVAA USAG ABERDEEN PG 24% 25% 37% 63%W0LXAA USAG ANNISTON ARMY DEPOT 22% 23% 39% 61%W6FHAA USAG ANSBACH 30% 42% 9% 91%W6E6AA USAG BAUMHOLDER 27% 32% 29% 65%W6FMAA USAG BAVARIA 40% 44% 41% 59%W6EZAA USAG BENELUX 36% 41% 19% 81%W0L7AA USAG BLUEGRASS ARMY DEPOT 47% 47% 47% 53%W6LEAA USAG BRUSSELS 26% 26% 0% 100%W3BHAA USAG CAMP HUMPHREYS 34% 44% 16% 84%W1FDAA USAG CAMP RED CLOUD/CASEY 23% 43% 6% 94%W6CMAA USAG CARLISLE BARRACKS 32% 32% 65% 35%W6B1AA USAG DAEGU 40% 54% 5% 95%W34WAA USAG DETROIT ARSENAL 31% 32% 55% 45%W6B6AA USAG DUGWAY PG 53% 55% 43% 57%W2LQAA USAG FT AP HILL 30% 33% 69% 31%W4VNAA USAG FT BELVOIR 27% 29% 52% 48%W6CRAA USAG FT BENNING 48% 50% 68% 32%W6CLAA USAG FT BLISS 35% 37% 28% 72%W0U3AA USAG FT BRAGG 38% 40% 48% 52%W1H1AA USAG FT BUCHANAN 29% 32% 34% 66%W0U4AA USAG FT CAMPBELL 27% 30% 42% 58%W0VNAA USAG FT CARSON 42% 45% 32% 68%W6B2AA USAG FT DETRICK 39% 43% 45% 55%W0XQAA USAG FT DRUM 40% 43% 40% 59%W6CBAA USAG FT GORDON 31% 32% 62% 38%W6JSAA USAG FT GREELY 17% 20% 21% 79%W4LKAA USAG FT HAMILTON 18% 20% 63% 38%W0VCAA USAG FT HOOD 30% 31% 39% 61%

U.S. ARMY CIVILIAN HUMAN RESOURCES AGENCY CALENDAR YEAR 2016 ARMY NAF TURNOVER
U.S. Army Civilian Human Resources Agency © 2016 People powered, Army strong. 3
TURNOVER BY COMMAND (IMCOM CONT)
UIC GARRISON Actual Aggregate Controllable UncontrollableW6CFAA USAG FT HUACHUCA 33% 34% 18% 82%W6GSAA USAG FT HUNTER LIGGET 68% 74% 56% 44%W4E6AA USAG FT IRWIN 34% 38% 29% 71%W6CCAA USAG FT JACKSON 39% 40% 50% 50%W6CDAA USAG FT KNOX 46% 47% 49% 51%W6B7AA USAG FT LEAVENWORTH 35% 36% 38% 62%W6CPAA USAG FT LEE 29% 32% 48% 52%W6B8AA USAG FT LEONARD WOOD 35% 38% 30% 70%W0XYAA USAG FT MCCOY 34% 34% 37% 63%W35SAA USAG FT MCNAIR 13% 13% 0% 100%W0USAA USAG FT MEADE 31% 33% 29% 71%W0VFAA USAG FT POLK 39% 42% 29% 71%W0VMAA USAG FT RILEY 50% 54% 20% 80%W6CEAA USAG FT RUCKER 46% 47% 39% 61%W6CSAA USAG FT SILL 36% 38% 27% 73%W0VAAA USAG FT STEWART 31% 33% 34% 66%W6L7AA USAG FT WAINWRIGHT 36% 41% 27% 73%W6LGAA USAG GARMISCH 16% 19% 13% 88%W3RBAA USAG HAWAII 30% 33% 27% 73%W6FNAA USAG HOHENFELS 40% 45% 23% 77%W6CYAA USAG JAPAN 23% 27% 8% 93%W0UCAA USAG JB MYER-HENDERSON HALL 15% 17% 53% 47%W12KAA USAG JOINT BASE LEWIS-MCCHORD 48% 51% 57% 43%W0L6AA USAG LETTERKENNY ARMY DEPOT 21% 21% 40% 60%W390AA USAG MCALESTER ARMY AMMUNITION PLANT 33% 33% 43% 57%W1EWAA USAG MIAMI 19% 21% 44% 56%W038AA USAG NATICK 35% 35% 100% 0%W6B3AA USAG PICATINNY ARSENAL 25% 27% 59% 41%
U.S. ARMY CIVILIAN HUMAN RESOURCES AGENCY CALENDAR YEAR 2016 ARMY NAF TURNOVER
U.S. Army Civilian Human Resources Agency © 2016 People powered, Army strong. 4
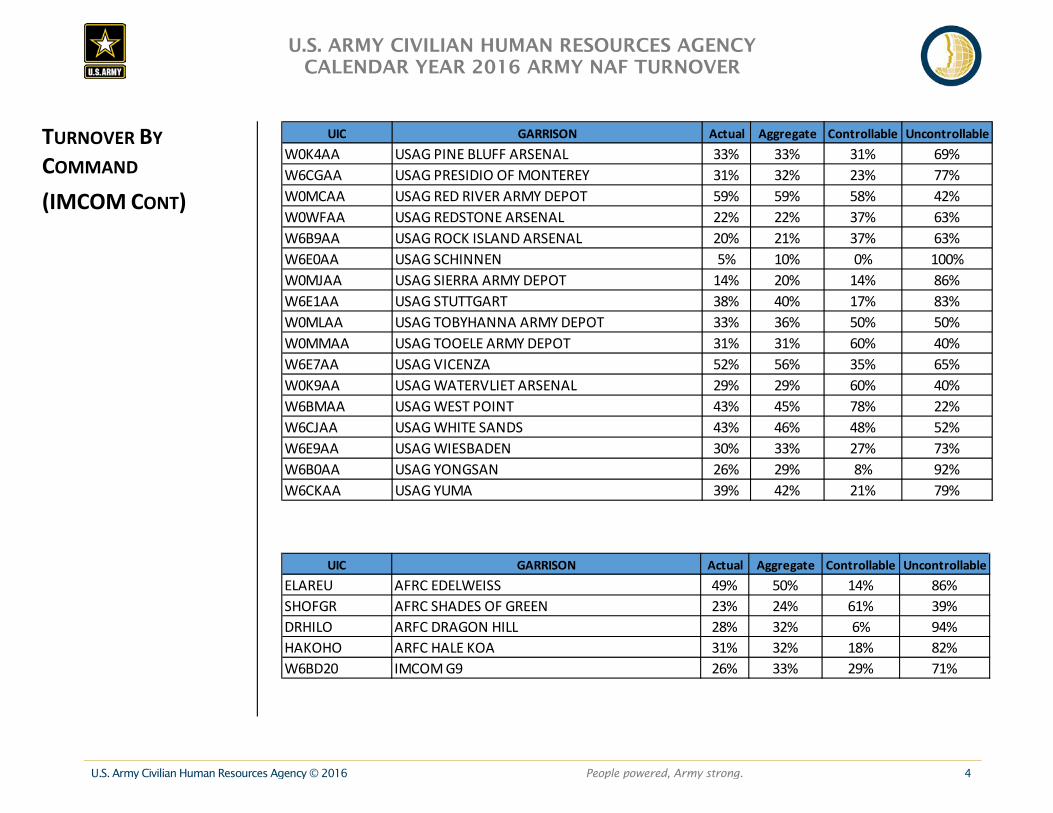
TURNOVER BY COMMAND (IMCOM CONT)
UIC GARRISON Actual Aggregate Controllable UncontrollableW0K4AA USAG PINE BLUFF ARSENAL 33% 33% 31% 69%W6CGAA USAG PRESIDIO OF MONTEREY 31% 32% 23% 77%W0MCAA USAG RED RIVER ARMY DEPOT 59% 59% 58% 42%W0WFAA USAG REDSTONE ARSENAL 22% 22% 37% 63%W6B9AA USAG ROCK ISLAND ARSENAL 20% 21% 37% 63%W6E0AA USAG SCHINNEN 5% 10% 0% 100%W0MJAA USAG SIERRA ARMY DEPOT 14% 20% 14% 86%W6E1AA USAG STUTTGART 38% 40% 17% 83%W0MLAA USAG TOBYHANNA ARMY DEPOT 33% 36% 50% 50%W0MMAA USAG TOOELE ARMY DEPOT 31% 31% 60% 40%W6E7AA USAG VICENZA 52% 56% 35% 65%W0K9AA USAG WATERVLIET ARSENAL 29% 29% 60% 40%W6BMAA USAG WEST POINT 43% 45% 78% 22%W6CJAA USAG WHITE SANDS 43% 46% 48% 52%W6E9AA USAG WIESBADEN 30% 33% 27% 73%W6B0AA USAG YONGSAN 26% 29% 8% 92%W6CKAA USAG YUMA 39% 42% 21% 79%
UIC GARRISON Actual Aggregate Controllable UncontrollableELAREU AFRC EDELWEISS 49% 50% 14% 86%SHOFGR AFRC SHADES OF GREEN 23% 24% 61% 39%DRHILO ARFC DRAGON HILL 28% 32% 6% 94%HAKOHO ARFC HALE KOA 31% 32% 18% 82%W6BD20 IMCOM G9 26% 33% 29% 71%

U.S. ARMY CIVILIAN HUMAN RESOURCES AGENCY CALENDAR YEAR 2016 ARMY NAF TURNOVER
U.S. Army Civilian Human Resources Agency © 2016 People powered, Army strong. 5
TURNOVER BY COMMAND (IMCOM CONT)
SEPARATIONS BY CATEGORY The following displays the calendar year 2016 separations within IMCOM by specific categories.
Age Group Dependent Status
Education Union Representation

U.S. ARMY CIVILIAN HUMAN RESOURCES AGENCY CALENDAR YEAR 2016 ARMY NAF TURNOVER
U.S. Army Civilian Human Resources Agency © 2016 People powered, Army strong. 6
TURNOVER BY COMMAND (IMCOM CONT)
SEPARATIONS BY CATEGORY (CONT) The following displays the calendar year 2016 separations within IMCOM by specific categories.
Pay Plan Drill Down: By CY (Caregiver) Level
Employment Category Drill Down: By Flex Guaranteed Hours

U.S. ARMY CIVILIAN HUMAN RESOURCES AGENCY CALENDAR YEAR 2016 ARMY NAF TURNOVER
U.S. Army Civilian Human Resources Agency © 2016 People powered, Army strong. Encl 3
TURNOVER BY COMMAND (MEDCOM)
COMMAND: MEDICAL COMMAND The following data pertains to turnover only within the Medical Command’s NAF workforce.
SUB COMMAND: U.S. ARMY PUBLIC HEALTH COMMAND – GLOBAL VETERINARY MANAGEMENT PRACTICE
Aggregate vs. Actual Turnover Turnover by Type
Reasons for Separation

U.S. ARMY CIVILIAN HUMAN RESOURCES AGENCY CALENDAR YEAR 2016 ARMY NAF TURNOVER
U.S. Army Civilian Human Resources Agency © 2016 People powered, Army strong. 2
TURNOVER BY COMMAND (MEDCOM CONT)
SEPARATIONS BY CATEGORY The following displays the calendar year 2016 separations within PHC-GVMP by specific categories.
Age Group Dependent Status
Education Employment Category

U.S. ARMY CIVILIAN HUMAN RESOURCES AGENCY CALENDAR YEAR 2016 ARMY NAF TURNOVER
U.S. Army Civilian Human Resources Agency © 2016 People powered, Army strong. 3
TURNOVER BY COMMAND (MEDCOM CONT)
SUB COMMAND: U.S. ARMY FISHER HOUSES
Aggregate vs. Actual Turnover Turnover by Type
Reasons for Separation

U.S. ARMY CIVILIAN HUMAN RESOURCES AGENCY CALENDAR YEAR 2016 ARMY NAF TURNOVER
U.S. Army Civilian Human Resources Agency © 2016 People powered, Army strong. 4
TURNOVER BY COMMAND (MEDCOM CONT)
SEPARATIONS BY CATEGORY The following displays the calendar year 2016 separations within Army Fisher Houses by specific categories.
Age Group Dependent Status
Education Employment Category

U.S. ARMY CIVILIAN HUMAN RESOURCES AGENCY CALENDAR YEAR 2016 ARMY NAF TURNOVER
U.S. Army Civilian Human Resources Agency © 2016 People powered, Army strong. Encl 4
TURNOVER BY COMMAND (STARS & STRIPES)
COMMAND: ARMED FORCES INFORMATION SERVICE - STARS & STRIPES The following data pertains to turnover only within the Stars and Stripes NAF workforce.
Aggregate vs. Actual Turnover Turnover by Type
Reasons for Separation

U.S. ARMY CIVILIAN HUMAN RESOURCES AGENCY CALENDAR YEAR 2016 ARMY NAF TURNOVER
U.S. Army Civilian Human Resources Agency © 2016 People powered, Army strong. 2
TURNOVER BY COMMAND (STARS & STRIPES CONT)
SEPARATIONS BY CATEGORY The following displays the calendar year 2016 separations within Stars & Stripes by specific categories.
Age Group Dependent Status
Education Employment Category

U.S. ARMY CIVILIAN HUMAN RESOURCES AGENCY CALENDAR YEAR 2016 ARMY NAF TURNOVER
U.S. Army Civilian Human Resources Agency © 2016 People powered, Army strong. Encl 5
TURNOVER BY COMMAND (NFS)
COMMAND: DEFENSE FINANCE & ACCOUNTING SERVICE – NAF FINANCIAL SERVICES The following data pertains to turnover only within the NAF Financial Services workforce.
Aggregate vs. Actual Turnover Turnover by Type
Reasons for Separation

U.S. ARMY CIVILIAN HUMAN RESOURCES AGENCY CALENDAR YEAR 2016 ARMY NAF TURNOVER
U.S. Army Civilian Human Resources Agency © 2016 People powered, Army strong. 2
TURNOVER BY COMMAND (NFS CONT)
SEPARATIONS BY CATEGORY The following displays the calendar year 2016 separations within NAF Financial Services by specific categories.
Age Group Dependent Status
0
Education Occupational Series

EmployEE REtEntion REpoRt
32%
Employees with respectful managers
are 32% less likely to think about a new job
30% 28%
Strong management transparency leads
to 30% better employee retention
Micromanaged employees are 28% more likely to think
about a new job
POSITIVE WORK CULTURE40% less likely to think about a new job
BEING BURNT OUT31% more likely to think
about jumping ship
POSITIVE WORK-LIFE BALANCE12% lower chance
of attrition
ENCOURAGED TO USE PTO13% more likely
to stay
NOT FITTING IN CULTURALLY12% less likely to see themselves staying
COMPANY EVENTS10% higher chance of retention
REST & RELAXATIONGoes a Long Way
GROWTHTeams Need It or They’ll Leave
CULTUREMatters a Lot
THE REAL STORY BEHIND YOUR EMPLOYEES LEAVING FOR GOOD
TINYpulse Employee Retention Report
COLLEAGUESHave a Lot of Power
More respect from peers means an 11% higher
chance of staying
Receiving peer recognition makes employees 13%
more likely to stick around
SUPERVISORSMake or Break Retention
THE REAL STORY BEHIND YOUR EMPLOYEES LEAVING FOR GOODTHE REAL STORY BEHIND YOUR EMPLOYEES LEAVING FOR GOOD
PROFESSIONAL DEVELOPMENT ACCESS
10% higher retention
EMPLOYEES OFFERED CROSS TRAINING
10% more likely to
stick with their teams
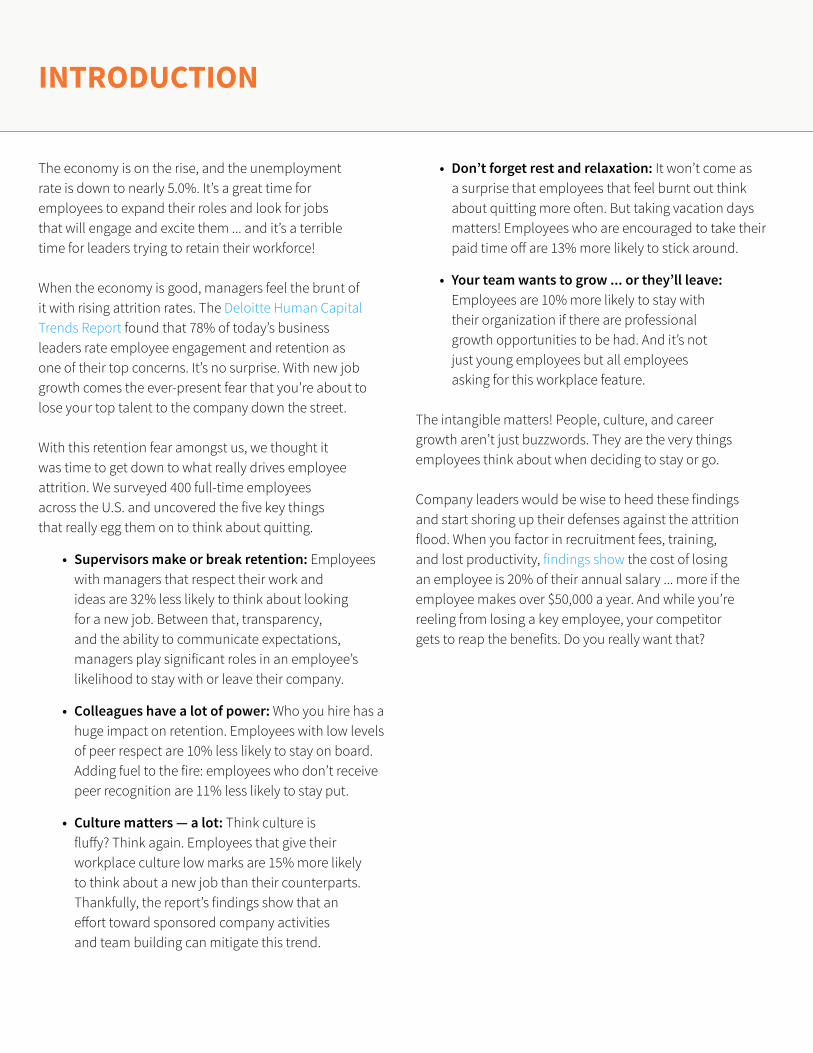
The economy is on the rise, and the unemployment rate is down to nearly 5.0%. It’s a great time for employees to expand their roles and look for jobs that will engage and excite them ... and it’s a terrible time for leaders trying to retain their workforce!
When the economy is good, managers feel the brunt of it with rising attrition rates. The Deloitte Human Capital Trends Report found that 78% of today’s business leaders rate employee engagement and retention as one of their top concerns. It’s no surprise. With new job growth comes the ever-present fear that you’re about to lose your top talent to the company down the street.
With this retention fear amongst us, we thought it was time to get down to what really drives employee attrition. We surveyed 400 full-time employees across the U.S. and uncovered the five key things that really egg them on to think about quitting.
• Supervisorsmakeorbreakretention:Employees with managers that respect their work and ideas are 32% less likely to think about looking for a new job. Between that, transparency, and the ability to communicate expectations, managers play significant roles in an employee’s likelihood to stay with or leave their company.
• Colleagueshavealotofpower: Who you hire has a huge impact on retention. Employees with low levels of peer respect are 10% less likely to stay on board. Adding fuel to the fire: employees who don’t receive peer recognition are 11% less likely to stay put.
• Culturematters—alot:Think culture is fluffy? Think again. Employees that give their workplace culture low marks are 15% more likely to think about a new job than their counterparts. Thankfully, the report’s findings show that an effort toward sponsored company activities and team building can mitigate this trend.
intRoduction
• Don’tforgetrestandrelaxation:It won’t come as a surprise that employees that feel burnt out think about quitting more often. But taking vacation days matters! Employees who are encouraged to take their paid time off are 13% more likely to stick around.
• Yourteamwantstogrow...orthey’llleave:Employees are 10% more likely to stay with their organization if there are professional growth opportunities to be had. And it’s not just young employees but all employees asking for this workplace feature.
The intangible matters! People, culture, and career growth aren’t just buzzwords. They are the very things employees think about when deciding to stay or go.
Company leaders would be wise to heed these findings and start shoring up their defenses against the attrition flood. When you factor in recruitment fees, training, and lost productivity, findings show the cost of losing an employee is 20% of their annual salary ... more if the employee makes over $50,000 a year. And while you’re reeling from losing a key employee, your competitor gets to reap the benefits. Do you really want that?

Ever heard the line “employees don’t quit their job, they quit their boss?” Turns out our data supports this adage wholeheartedly. Employees that report having less-than-stellar manager relationships are also reporting that they’re less likely to stick around on the job.
Let’s look at how general manager satisfaction impacts employee retention. When we looked at respondents’ satisfaction with their senior management team, we were not surprised to find that those with higher satisfaction levels are more likely to plan to stay with their employer (r = .36, p < .001, n = 400). How much more, you ask? How about 13% more likely to stick around.
And sure enough, respect plays a big role in this behavior. Employees that say their managers respect their work and ideas are 32% less likely to think about looking for a new job (rs = -.33, p < .001, n = 400).
SupERViSoRS cAn mAKE oR BREAK EmployEE REtEntion
All those micromanagers out there should really be wary of how their behavior impacts their team’s satisfaction. Employees that have lots of freedom to make decisions on how to do their jobs are pretty satisfied and far less likely to think about finding a new employer. But those unfortunate souls whose hands are regularly tied are 28% more likely to think about greener pastures elsewhere (rs = -.33, p < .001, n = 400).
Of course, let’s not forget how important manager transpar-ency is too. Our earlier engagement report found an incred-ibly high link between manager transparency and employee happiness. Well, this time around, we’re finding that strong management transparency can result in a 30% better chance of an employee sticking around (rs = -.31, p < .001, n = 400).

And part of this is a supervisor’s ability to communicate and set clear goals for their team. Employees that say they do plan on sticking around with their employer are 10% more likely to report having clear goals set out for them (F(1, 398) = 16.20, p < .001, partial η2 = .04).
Wanting to be respected, to have freedom, to be part of the solution, and to have access to the reasons behind decisions in the workplace is not unreasonable. In fact, our earlier research has shown the strong link between feeling valued and appreciated at work and planning to stick with an employer. Now we’re finding that supervisors and senior management (and their ability to show respect and appreciation) play a huge role in an employee’s desire and intent to stick around too.
Employee engagement expert Kevin Sheridan wasn’t all that surprised by these results either. In his own research, he found that major drivers of employee engagement were recognition and relationships with one’s manager. And certainly with better engagement comes better retention.
Kevin points out that the traits that help drive supervisor loyalty in the workplace are those that are great rules to live by in general. “Treat people as human beings and not as pawns on a chessboard of corporate productivity. Show that you truly care. Regularly thank people for their work. Admit when you make a mistake. Apologize.”
Leaders that want high employee retention rates would be well served by showing respect and appreciation to their team. If they choose to bypass this route, they’ll likely find themselves back on the job boards replacing their best talent.
SupERViSoRS cAn mAKE oR BREAK EmployEE REtEntion

collEAGuES HAVE A lot oF poWER
Think about all the day-to-day interactions you have with your colleagues and peers. It would be pretty crummy if you had to work frequently with people that failed to respect you and your work, let alone failed to show their appreciation. Sure enough, the value of our peers impacts our likelihood to want to stay on board or leave.
Let’s just look at respect to begin with. Employees who noted that they did not have high levels of respect from their peers were nearly 10% less likely to see themselves with a long-term tenure at their organization (r = .24 , p < .001, n = 400).
Peer recognition plays a similar role too. When we asked employ-ees about the amount of appreciation and recognition that they get from their peers, those citing low levels of recognition were 11% less likely to plan on staying put (r = .24 , p < .001, n = 400).
This isn’t terribly surprising, is it? In today’s cross-functional, cross-matrixed organizations, we’re far more likely to interact with our colleagues than we are with direct supervisors and senior leaders. Our data shows that those day-to-day interactions can really make or break a work experience.
Mel Kleiman, President of employee assessment and training company Humetrics, agrees. According to Mel, “The number one reason why great people quit is because A players don’t want to play on B teams. When we have fellow employees who we respect and give recognition to, it creates a culture of responsibility and appreciation. And when you have this, you have a space where your A players want to stay.”
Mel goes on to explain that how companies assess candidates during the hiring process plays a key role in creating great interpersonal relationships. “The number one thing employers can do is hire candidates who show an attitude of positivity, innovation, and productivity during their interview. Skills can be taught and tweaked as time goes on, but attitude is the best indicator of compatibility in interviews.”
We can’t say it better than Mel. If you want to create a great place to work, you have to hire people that are great to work with. That means making a candidate’s “fit” just as important as their “skills” when deciding whether or not they get the offer.

Sure, leaders and managers play a role in employee retention, but so does workplace culture in general. Our findings show that the type of culture employees work in, as well as how well they fit into that culture, have significant impacts on an employee’s likelihood to stay with their employer.
Just look at the relationship between work culture and frequency of thinking about a new job. Employees who give their work culture low marks are nearly 15% more likely to think about a new job than their counterparts (rs = -.31, p < .001, n = 400).
Fitting in is really important too. No matter how old we get, we want to relate well to our peers and our environment. Our data shows this certainly holds true in the workplace to. Employees that don’t fit in as well are 12% less likely to see themselves staying with their current employer (r = .36, p < .001, n = 400).
cultuRE mAttERS - A lot
Amazingly, socialization and the ability to have a little fun on the job can turn some of these downers right-side up. Employees who reported working for organizations that sponsor monthly, quarterly, or even yearly company events are more likely to see themselves working for their employer for a longer period of time (F(5, 394) = 3.24, p = .012, partial η2 = .03).
Setting time aside to go out for team happy hours, sporting events, or even local volunteering can help bind team members closer together and show how much their managers and leaders value and appreciate them.
Kevin Oakes, CEO of the i4cp human capital network, seconds this notion. He points out that investments organizations make in culture end up being “catalysts for better productivity, customer service, retention, and other key business measures.”
Kevin points to easy, straightforward solutions he’s seen as successful with i4cp clients, including “assigning new employees a mentor or peer buddy during orientation to provide a personal connection and ambassador for the culture. Other great tools are early career networks and new employee resource groups — both for engagement and to provide a channel for innovative perspectives that new employees may not be able to surface through other outlets.”
Regardless of which tool or channel you use, the point remains that a dedicated commitment to integrating employees within your workplace will go a long way to keeping them as employees of your workplace.

don’t FoRGEt RESt And RElAXAtion
All work and no play makes for dull boys and girls. Or in the case of workplaces, it makes for employees that are ready to quit!
Employees that are tired and burnt out are 31% more likely to think about looking for a new job than their colleagues who feel comfortable with their workload (rs = .35, p < .001, n = 400).
Perhaps more importantly, the opposite holds true too. When we asked employees to rate their work-life balance, we found that those with a positive work-life balance are 12% more likely to see themselves staying with their employer (r = .31, p < .001, n = 400).
Trying to wring the most out of your employees is short-sighted. Sure, you might get some extra work done in the short term. But long term, you’ll likely lose that team member, and with them, you’ll have lost the time, effort, and money it takes to recruit a new employee and fully ramp them up.
It’s even why leveraging paid time off (PTO) is important for your team. While most workers have it, many feel guilty taking their PTO, and some may even feel obligated to not use it. Once again, this is bad news for employers. Employees who report being encouraged to use their PTO are nearly 13% more likely to report planning to stay with their company (F(2, 397) = 12.70, p < .001, partial η2 = .06).
S. Chris Edmonds, Founder of the The Purposeful Culture Group, notes the very serious downsides of burnout, “Burned out employees are not engaged. They don’t serve customers well. They don’t produce effectively.”
He also points out that leaders are largely to blame for creating a culture that is constantly about work. Edmonds notes, “If leaders model 80-hour weeks and they respond to emails at 1:00 a.m., those norms trickle down to employees ... If leaders model taking their vacation time — all four weeks every year — that can trickle down, inspiring managers to take their vacations and to encourage their employees to take their vacations.”
And managers more in tune with their employees’ needs will have more engaged workforces. According to Edmonds, “[Leaders] need real-time dashboards for engagement and for service so they can measure, monitor, and reward traction on these vital metrics — not just on performance.” After all, as Edmonds points out, very few managers were promoted for their ability to manage. Yet this skill will ensure their own success (and that of their workforce).
Burnout is preventable, but only if managers truly understand the downsides of burnout, are attuned to measuring it, and are open to evolving existing practices to stomp it out.

youR tEAm WAntS to GRoW ... oR tHEy’ll lEAVE
We’re increasingly hearing from employees that professional growth and forward-moving career trajectories aren’t just a nice-to-have. They are a need-to-have. And this report’s findings support this very idea.
When we looked at employees’ access to professional development or skills training, those who had it are more likely to stay. Those who don’t have it are more likely to leave. Employees that reported having access to either internal or external professional development were more than 10% more likely to stay with their current employer (F(1, 398) = 26.80, p < .001, partial η2 = .06). And lacking cross-training results in employees being 10% less likely to stay (F(1, 398) = 15.80, p < .001, partial η2 = .04).
This really doesn’t come as a surprise to us. In our recent report on millennials, we found that 75% of millennials say they would consider looking for a new job if they didn’t see any opportunities for professional growth with their current employer. These findings show that this desire goes beyond your youngest employees and applies across workforce generations.
Eric Siu, CEO of digital marketing agency Single Grain and founder of the entrepreneurial podcast Growth Everywhere, adds that there are time-tested ways that organizations can help foster employee growth. “Buying books for employees and creating a learning plan shows that you genuinely care about their growth and are invested in them.”
And Eric points out one reason companies would be foolish to ignore growth opportunities. “Everyone wants to increase their rate of growth as efficiently as possible. If you’re not growing fast enough, you’re falling behind.” And a team that’s not growing fast enough is going to make you sink that much faster.

The obvious question is this: how do you stem the attrition tide? If you’re an organization that’s experiencing employee turnover or is concerned about turnover, your time would be best spent looking at your employees’ satisfaction with leadership, culture, workload expectations, and opportunities for career and professional growth.
Taking stock of these issues may not only improve retention but also employee satisfaction and overall engagement.
• Picktherightmanagersandleaders:With managers playing such a large role in employee retention, it would benefit you to be especially careful with who you bring in to manage your teams, or who you promote from within. Having the skills to do a job are not enough. Candidates must also have the personality traits that encourage loyalty, engagement, and trust.
• Hireforculturalfit:Given the huge impact colleagues have on workplace satisfaction, take a long, hard look at your recruitment practices. Just like supervisors need the right personality traits, so does every member of your team. Make sure your recruiting interviews include questions to judge a candidate’s cultural fit in addition to their ability to get the job done.
• Embraceopportunitiesforsocialization:Team building, company offsites, and other bonding activities can play a strong role in binding your workforce together and helping to create the personal ties that encourage employees to stay on board.
• Openlydiscussworkloadandexpectations:Burnout is a very real problem, especially when managers don’t know everything their team members are tackling. Having regular 1-on-1 meetings with team members is a great way to keep abreast of employee projects, how they’re progressing, and if more resources are needed to achieve expectations.
concluSion
• Keepinmindyouremployees’desiretogrowprofessionally:While it’s tempting to focus just on what your employees are doing today, you will all be better off if you also remember to ask them where they see themselves in 6 to 12 months. Your team members have their professional growth in mind. If you know what they’re aiming for, you’ll be that much better positioned to help them meet those goals ... while they’re still at your organization.
Of course, don’t forget to take a measurement of how your team feels about these very issues. No initiative you take should ever begin without first knowing your starting point. How else will you know the most troublesome areas that need your attention? And how else will you be able to mea-sure your success at turning those problem areas around?

Data from the study was analyzed from 400 survey respondents captured via a third-party platform from July 1st, 2015 through July 13th, 2015. Spearman correlations, Pearson correlations, and ANOVAs were conducted in order to examine relationships and differences among the variables of interest.
Two dependent variables of interest were 1) how often the participant thought about looking for a new job and 2) the likelihood of working for the same organization in six months. The first dependent variable was ordinal in level and measured with six options ranging from “I don’t really think about looking for a new job” to “more than once a week.” Spearman correlations (rs) were conducted for this variable, which accounts for its ordinal nature. The second dependent variable was interval in level and ranged from 1 to 10 in possible responses. Pearson correlations (r) were conducted, which is appropriate for interval-level data. Finally, when examining differences in these dependent variables by a nominal grouping variable, the ANOVA was conducted.
Generally, a correlation is considered strong (large effect size) when the correlation coefficient (r) is greater than .50. Additionally, differences found in the ANOVA are considered moderate when the partial η2 is .06 or above.
We’d like to thank all who contributed to this piece, particularly:
CodyLikavec- TINYpulse Marketing Data Analyst. B.A. in Statistics, University of South Florida.
LauraTroyani - Marketing Director. M.B.A. Harvard Business School, B.A. Harvard College
mEtHodoloGy