Embed Size (px)
Citation preview
US Army Corps of Engineers ®
Omaha D strict
Water Quality Modeling Report
Simulation of Fort Peck Lake Temperature Releases and Downstream Missouri River Temperatures
December 9, 2007
Report Documentation Page Form ApprovedOMB No. 0704-0188
Public reporting burden for the collection of information is estimated to average 1 hour per response, including the time for reviewing instructions, searching existing data sources, gathering andmaintaining the data needed, and completing and reviewing the collection of information Send comments regarding this burden estimate or any other aspect of this collection of information,including suggestions for reducing this burden, to Washington Headquarters Services, Directorate for Information Operations and Reports, 1215 Jefferson Davis Highway, Suite 1204, ArlingtonVA 22202-4302 Respondents should be aware that notwithstanding any other provision of law, no person shall be subject to a penalty for failing to comply with a collection of information if itdoes not display a currently valid OMB control number
1. REPORT DATE 09 DEC 2007 2. REPORT TYPE
3. DATES COVERED 00-00-2007 to 00-00-2007
4. TITLE AND SUBTITLE Simulation of Fort Peck Lake Temperature Releases and DownstreamMissouri River Temperatures
5a. CONTRACT NUMBER
5b. GRANT NUMBER
5c. PROGRAM ELEMENT NUMBER
6. AUTHOR(S) 5d. PROJECT NUMBER
5e. TASK NUMBER
5f. WORK UNIT NUMBER
7. PERFORMING ORGANIZATION NAME(S) AND ADDRESS(ES) U.S. Army Corps of Engineers,Omaha District,1616 Capital Avenue Ste 9000,Omaha,NE,68102
8. PERFORMING ORGANIZATIONREPORT NUMBER
9. SPONSORING/MONITORING AGENCY NAME(S) AND ADDRESS(ES) 10. SPONSOR/MONITOR’S ACRONYM(S)
11. SPONSOR/MONITOR’S REPORT NUMBER(S)
12. DISTRIBUTION/AVAILABILITY STATEMENT Approved for public release; distribution unlimited
13. SUPPLEMENTARY NOTES
14. ABSTRACT
15. SUBJECT TERMS
16. SECURITY CLASSIFICATION OF: 17. LIMITATION OF ABSTRACT Same as
Report (SAR)
18. NUMBEROF PAGES
112
19a. NAME OFRESPONSIBLE PERSON
a REPORT unclassified
b ABSTRACT unclassified
c THIS PAGE unclassified
Standard Form 298 (Rev. 8-98) Prescribed by ANSI Std Z39-18

Water Quality Modeling Report
Simulation of Fort Peck Lake Temperature Releases and Downstream Missouri River Temperatures
Prepared by:
Hydrology & Water Control/Water Quality Sections Hydrologic Engineering Branch
Engineering Division Omaha District
U.S. Army Corps of Engineers
December 9, 2007
iii
For Information Regarding This Document Please Contact: Kevin D. Stamm U.S. Army Corps of Engineers, Omaha District Attention: CENWO-ED-HE 106 South 15th Street Omaha, NE 68102-1619 402-221-4029 [email protected]
iv
EXECUTIVE SUMMARY
Due to low annual runoff in recent years and low pool levels, the U.S. Army Corps of Engineers was unable to perform a “mini-test” followed by a “full test” of discharge and temperature enhancements to the Missouri River downstream of Fort Peck Lake. In lieu of actual flow and temperature enhancements, the U.S. Army Corps of Engineers, Omaha District performed computer simulations of both Fort Peck Lake and the Missouri River to analyze temperature conditions under flow/temperature enhancement operations.
Temperatures in Fort Peck Lake and the Missouri River downstream of Fort Peck Dam were simulated using CE-QUAL-W2, a two-dimensional (longitudinal and vertical) water quality and hydrodynamic model for rivers, estuaries, lakes, reservoirs, and river basin systems. CE-QUAL-W2 was developed by the Environmental Laboratory at the USACE Engineering Research and Development Center (ERDC) in Vicksburg, MS.
Baseline temperature conditions in the lake and river were developed through simulations of existing data; and, the sensitivity of parameters that influence lake and river temperature including lake inflow and outflow, pool elevation, and environmental temperature was determined. Simulations of spillway releases and selective tower withdrawals were performed to analyze the effectiveness of releasing warm water downstream to the Missouri River in order to meet the 18oC target temperature at Frazer Rapids, MT, as prescribed by the 2000 U.S. Fish and Wildlife Service Biological Opinion.
In the baseline lake simulation 17oC temperatures, sufficient for meeting the 18oC temperature target at Frazer Rapids, MT, arise at the lake surface and spillway crest elevation between June 20 and 22 and persist for 96 days. Lake water near the existing powerhouse intake structure does not reach 17oC during any simulation year. The average simulated Missouri River temperature from June through August was 13.2oC at Frazer Rapids with a peak daily temperature of 17.3oC. In the parameter evaluation, low pool elevations and high environmental temperatures caused higher overall Fort Peck Lake pool and discharge temperatures. Similar sensitivity results were produced in the Missouri River simulations.
During spillway “full tests”, the 18oC water temperature was first achieved at Frazer Rapids, MT, on June 24 meeting the target for 37 days at an average temperature of 18.1oC; however, 0.92 million acre-feet (MAF) of additional water was spilled from the lake. In an alternate spillway release the temperature target was first achieved on June 28 meeting the target for 47 days at an average temperature of 18.2oC over the entire release period with only 0.08 MAF of additional water spilled. Tower withdrawals achieved 18oC temperatures for 70 days when all water was passed through the withdrawal tower inlet near the lake surface, and 18oC temperatures were achieved 37 days when water was passed through both the existing and selective withdrawal tower. Tower withdrawals did not require additional water to be spilled from the reservoir because all water was passed through the powerhouse.
v

vi
TABLE OF CONTENTS 1 Introduction............................................................................................................................. 1
1.1 Purpose of Study............................................................................................................. 1 1.2 Fort Peck Lake ................................................................................................................ 1 1.3 Missouri River ................................................................................................................ 2
2 Water Temperature Model...................................................................................................... 5 2.1 CE-QUAL-W2................................................................................................................ 5 2.2 Fort Peck Lake Model..................................................................................................... 5
2.2.1 Lake Bathymetry..................................................................................................... 5 2.2.2 Lake Outlet.............................................................................................................. 7 2.2.3 Lake Spillway ......................................................................................................... 7 2.2.4 Other Model Adjustments....................................................................................... 9
2.3 Missouri River Model ..................................................................................................... 9 2.3.1 River Bathymetry.................................................................................................... 9 2.3.2 River Model Adjustments ..................................................................................... 10
2.4 General Data Sources.................................................................................................... 10 2.4.1 Meteorology.......................................................................................................... 10 2.4.2 Lake Inflows, Discharges, and Flow Temperatures.............................................. 11 2.4.3 Missouri River Discharge and Temperature ......................................................... 11 2.4.4 Tributary Discharge and Temperature .................................................................. 11
2.5 Fort Peck Lake Calibration ........................................................................................... 12 2.5.1 Lake Temperature ................................................................................................. 12 2.5.2 Outlet Temperature ............................................................................................... 12
2.6 Missouri River Calibration Results............................................................................... 12 2.6.1 Stage...................................................................................................................... 12 2.6.2 Temperature .......................................................................................................... 13
2.7 River Temperature Increases ........................................................................................ 13 3 Temperature Analysis under Existing Conditions ................................................................ 18
3.1 Lake and Environmental Statistics................................................................................ 18 3.2 Lake Temperature Analysis .......................................................................................... 19
3.2.1 Baseline Condition Simulation ............................................................................. 19 3.2.2 Annual Inflow ....................................................................................................... 20 3.2.3 Annual Outflow .................................................................................................... 20 3.2.4 Pool Elevation....................................................................................................... 21 3.2.5 Environmental Temperature ................................................................................. 21
3.3 Summary of Existing Management .............................................................................. 22 3.4 River Temperature Analysis ......................................................................................... 33
3.4.1 Typical River Simulation...................................................................................... 33 3.4.2 Annual Discharge.................................................................................................. 34 3.4.3 Pool Elevation....................................................................................................... 34 3.4.4 Environmental Temperature ................................................................................. 34
3.5 Summary of River Analysis.......................................................................................... 35 4 Temperature Analysis under Alternative Releases ............................................................... 40
4.1 Spillway Releases ......................................................................................................... 40 4.1.1 Spillway Full Test ................................................................................................. 40
vii
4.1.2 Alternative Spillway Releases .............................................................................. 41 4.1.3 Spillway Release Results ...................................................................................... 41
4.2 Selective Withdrawal Releases ..................................................................................... 47 4.2.1 Selective Withdrawal Analysis ............................................................................. 47 4.2.2 Selective Withdrawal Results ............................................................................... 48
4.3 Summary of Alternatives .............................................................................................. 54 4.3.1 Lake Performance ................................................................................................. 54 4.3.2 River Temperature Performance........................................................................... 55
5 Conclusions........................................................................................................................... 57 5.1 Existing Conditions Analysis........................................................................................ 57 5.2 Alternative Management Analysis................................................................................ 57
6 References............................................................................................................................. 59 7 Plates ..................................................................................................................................... 60
LIST OF TABLES Table 1. Representative segments for the Fort Peck to Culbertson, MT, Missouri River bathymetry. ..................................................................................................................................... 9 Table 2. Missouri River model location information................................................................... 10 Table 3. Average Missouri River water temperature increases from Fort Peck Dam to Frazer Rapids and Wolf Point, MT. ......................................................................................................... 13 Table 4. Fort Peck Lake, Milk River, Missouri River, and Glasgow air temperature basic statistics......................................................................................................................................... 18 Table 5. Fort Peck Reservoir simulation variations and data years used in the reservoir temperature analysis...................................................................................................................... 19 Table 6. Temperature zone volume/depth analysis of Fort Peck Lake for all existing scenarios.22 Table 7. Time analysis of Fort Peck Lake temperatures at the spillway crest elevation (2225 ft/678.2 m)..................................................................................................................................... 23 Table 8. Missouri River downstream of Fort Peck - simulations and datasets used in the existing management analysis. ................................................................................................................... 33 Table 9. Summary of average and peak river temperatures on the Missouri River at Frazer Rapids, MT. .................................................................................................................................. 35 Table 10. Spillway Full Test and Alternative simulation scenarios. ........................................... 41 Table 11. Tower selective withdrawal (TW) simulation scenarios. ............................................ 48 Table 12. Reservoir performance under normal, full test, spillway alternative, and selective withdrawal alternative simulations. .............................................................................................. 54 Table 13. Missouri River temperature performance at Frazer Rapids, MT, under normal, full test, spillway alternative, and selective withdrawal alternative simulations. ............................... 55
LIST OF FIGURES
Figure 1. Fort Peck Lake and water quality sampling locations.................................................... 3 Figure 2. Missouri River reach model locations............................................................................ 4
viii
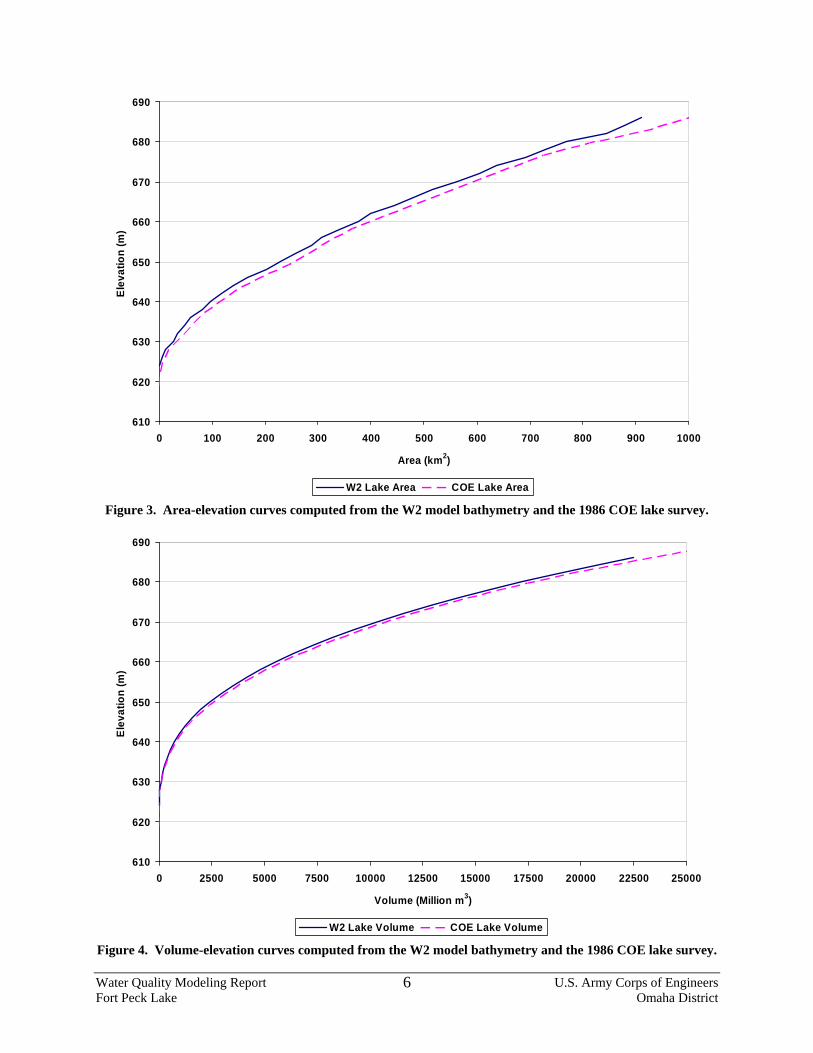
Figure 3. Area-elevation curves computed from the W2 model bathymetry and the 1986 COE lake survey. ..................................................................................................................................... 6 Figure 4. Volume-elevation curves computed from the W2 model bathymetry and the 1986 COE lake survey. ..................................................................................................................................... 6 Figure 5. Fort Peck Lake outlet works schematic.......................................................................... 7 Figure 6. Fort Peck Lake gated spillway control structure cross section....................................... 8 Figure 7. Fort Peck spillway discharge rating curve for 4-open gates........................................... 8 Figure 8. 2004 USGS measured temperature increases in the Missouri River from Fort Peck Dam to Wolf Point. ....................................................................................................................... 15 Figure 9. 2004 simulated temperature increases in the Missouri River from Fort Peck Dam to Wolf Point. .................................................................................................................................... 15 Figure 10. 2005 USGS measured temperature increases in the Missouri River from Fort Peck Dam to Wolf Point. ....................................................................................................................... 16 Figure 11. 2005 simulated temperature increases in the Missouri River from Fort Peck Dam to Wolf Point. .................................................................................................................................... 16 Figure 12. 2006 USGS measured temperature increases in the Missouri River from Fort Peck Dam to Wolf Point. ....................................................................................................................... 17 Figure 13. 2006 simulated temperature increases in the Missouri River from Fort Peck Dam to Wolf Point. .................................................................................................................................... 17 Figure 14. Baseline simulation temperature profiles at the Fort Peck Lake outlet (L1).............. 24 Figure 15. Baseline simulation temperature profiles on July 1. .................................................. 25 Figure 16. Baseline simulation temperature profiles on August 1............................................... 26 Figure 17. Baseline simulation temperature profiles on September 1. ........................................ 27 Figure 18. Baseline Simulation temperatures near the lake surface (1.0-m depth), spillway crest elevation (678.2 m/2225 ft), and powerhouse. ............................................................................. 28 Figure 19. Simulated Fort Peck Dam release temperatures for three annual inflow scenarios. .. 29 Figure 20. Simulated Fort Peck Lake temperatures near the spillway crest elevation (678.2 m/2225 ft) for three annual inflow scenarios................................................................................ 29 Figure 21. Simulated Fort Peck Dam release temperatures for three annual outflow scenarios. 30 Figure 22. Simulated Fort Peck Lake temperatures near the spillway crest elevation (678.2 m/2225 ft) for two annual outflow scenarios. ............................................................................... 30 Figure 23. Simulated Fort Peck Dam release temperatures for three pool elevation scenarios... 31 Figure 24. Simulated Fort Peck Lake temperatures near the spillway crest elevation (678.2 m/2225 ft) for two annual pool elevation scenarios...................................................................... 31 Figure 25. Simulated Fort Peck Dam release temperatures for three environmental temperature scenarios........................................................................................................................................ 32 Figure 26. Simulated Fort Peck Lake temperatures near the spillway crest elevation (678.2 m/2225 ft) for three environmental temperature scenarios........................................................... 32 Figure 27. Missouri R. Baseline Simulation: Fort Peck Dam, Milk River, and combined discharge (cfs)............................................................................................................................... 36 Figure 28. Missouri R. Baseline Simulation: Fort Peck Dam, Milk River, and flow-weighted temperatures.................................................................................................................................. 36 Figure 29. Missouri R. Baseline Simulation: river temperature at Frazer Rapids, Wolf Point, and Culbertson, MT. ..................................................................................................................... 37 Figure 30. Missouri R. Baseline Simulation: discharge temperature increases from Fort Peck Dam............................................................................................................................................... 37
ix
Figure 31. Annual Discharge Scenario Simulations: Missouri River temperatures at Frazer Rapids, MT. .................................................................................................................................. 38 Figure 32. Annual Elevation Scenario Simulations: Missouri River temperatures at Frazer Rapids, MT. .................................................................................................................................. 38 Figure 33. Environmental Temperature Scenario Simulations Set 1 (identical inflow temperatures): Missouri River temperatures at Frazer Rapids, MT. ........................................... 39 Figure 34. Environmental Temperature Scenario Simulations Set 2 (varied inflow temperatures): Missouri River temperatures at Frazer Rapids, MT...................................................................... 39 Figure 35. Full Test 1: powerhouse and spillway discharge and computed temperature bl Fort Peck Dam. ..................................................................................................................................... 42 Figure 36. Full Test 2: powerhouse and spillway discharge and computed temperature bl Fort Peck Dam. ..................................................................................................................................... 42 Figure 37. Full Test 3: powerhouse and spillway discharge and computed temperature bl Fort Peck Dam. ..................................................................................................................................... 43 Figure 38. Comparison of Full Test simulated river temperatures at Frazer Rapids, MT........... 43 Figure 39. Spillway Alt 1: powerhouse and spillway discharge and computed temperature bl Fort Peck Dam. ............................................................................................................................. 45 Figure 40. Spillway Alt 2: powerhouse and spillway discharge and computed temperature bl Fort Peck Dam. ............................................................................................................................. 45 Figure 41. Spillway Alt 3: powerhouse and spillway discharge and computed temperature bl Fort Peck Dam. ............................................................................................................................. 46 Figure 42. Comparison of Spillway Alternative simulated river temperatures at Frazer Rapids, MT................................................................................................................................................. 46 Figure 43. Typical Fort Peck Lake simulation (1998) temperature time series at three proposed intake levels and the powerhouse intake structure........................................................................ 47 Figure 44. Tower and total powerhouse discharge and Fort Peck Dam discharge temperature for TW1. ............................................................................................................................................. 50 Figure 45. Tower and total powerhouse discharge and Fort Peck Dam discharge temperature for TW2. ............................................................................................................................................. 50 Figure 46. Tower and total powerhouse discharge and Fort Peck Dam discharge temperature for TW3. ............................................................................................................................................. 51 Figure 47. Tower Withdrawal Alternative (Elev. 680 m) simulated river temperatures at Frazer Rapids, MT. .................................................................................................................................. 51 Figure 48. Tower and total powerhouse discharge and Fort Peck Dam discharge temperature for TW4. ............................................................................................................................................. 52 Figure 49. Tower and total powerhouse discharge and Fort Peck Dam discharge temperature for TW5. ............................................................................................................................................. 52 Figure 50. Tower and total powerhouse discharge and Fort Peck Dam discharge temperature for TW6. ............................................................................................................................................. 53 Figure 51. Tower Withdrawal Alternative (Elev. 670 m) simulated river temperatures at Frazer Rapids, MT. .................................................................................................................................. 53
x
LIST OF PLATES Plate 1. 2004 Glasgow International Airport (KGGW) hourly air and dew point temperature Celsius........................................................................................................................................... 61 Plate 2. 2004 Glasgow International Airport (KGGW) hourly wind speed (m/s). ...................... 61 Plate 3. 2005 Glasgow International Airport (KGGW) hourly air and dew point temperature... 62 Plate 4. 2005 Glasgow International Airport (KGGW) hourly wind speed (m/s). ...................... 62 Plate 5. 2006 Glasgow International Airport (KGGW) hourly air and dew point temperature... 63 Plate 6. 2006 Glasgow International Airport (KGGW) hourly wind speed (m/s). ...................... 63 Plate 7. 2004 Fort Peck Lake inflows. ......................................................................................... 64 Plate 8. 2005 Fort Peck Lake inflows. ......................................................................................... 64 Plate 9. 2006 Fort Peck Lake inflows. ......................................................................................... 65 Plate 10. Fort Peck Lake inflow temperatures on the Missouri River at Landusky (2004-2006) and assumed tributary temperatures.............................................................................................. 65 Plate 11. 2004 Missouri & Milk River discharge downstream of Fort Peck Reservoir. ............. 66 Plate 12. 2005 Missouri & Milk River discharge downstream of Fort Peck Reservoir. ............. 66 Plate 13. 2006 Missouri & Milk River discharge downstream of Fort Peck Reservoir. ............. 67 Plate 14. 2004 Fort Peck Dam & Milk River discharge temperatures......................................... 68 Plate 15. 2005 Fort Peck Dam & Milk River discharge temperatures......................................... 68 Plate 16. 2006 Fort Peck Dam & Milk River discharge temperatures......................................... 69 Plate 17. Fort Peck Lake observed and simulated lake elevations from 2004 to 2006................ 70 Plate 18. 2004 measured and simulated water temperature profiles at L1 (0 km from the dam) in the Missouri River arm. ................................................................................................................ 71 Plate 19. 2004 measured and simulated water temperature profiles at L2 (10 km from the dam) in the Missouri River arm. ............................................................................................................ 72 Plate 20. 2004 measured and simulated water temperature profiles at L3 (25 km from the dam) in the Missouri River arm. ............................................................................................................ 73 Plate 21. 2004 measured and simulated water temperature profiles at L4 (50 km from the dam) in the Missouri River arm. ............................................................................................................ 74 Plate 22. 2004 measured and simulated water temperature profiles at L5 in the Big Dry arm. .. 75 Plate 23. 2004 measured and simulated water temperature profiles at L6 in the Big Dry arm. .. 76 Plate 24. 2005 measured and simulated water temperature profiles at L1 (0 km from the dam) in the Missouri River arm. ................................................................................................................ 77 Plate 25. 2005 measured and simulated water temperature profiles at L2 (10 km from the dam) in the Missouri River arm. ............................................................................................................ 78 Plate 26. 2005 measured and simulated water temperature profiles at L3 (25 km from the dam) in the Missouri River arm. ............................................................................................................ 79 Plate 27. 2005 measured and simulated water temperature profiles at L4 (50 km from the dam) in the Missouri River arm. ............................................................................................................ 80 Plate 28. 2005 measured and simulated water temperature profiles at L5 in the Big Dry arm. .. 81 Plate 29. 2005 measured and simulated water temperature profiles at L6 in the Big Dry arm. .. 82 Plate 30. 2006 measured and simulated water temperature profiles at L1 (0 km from the dam) in the Missouri River arm. ................................................................................................................ 83 Plate 31. 2006 measured and simulated water temperature profiles at L2 (10 km from the dam) in the Missouri River arm. ............................................................................................................ 84
xi
Plate 32. 2006 measured and simulated water temperature profiles at L3 (25 km from the dam) in the Missouri River arm. ............................................................................................................ 85 Plate 33. 2006 measured and simulated water temperature profiles at L4 (50 km from the dam) in the Missouri River arm. ............................................................................................................ 86 Plate 34. 2006 measured and simulated water temperature profiles at L5 in the Big Dry arm. .. 87 Plate 35. 2006 measured and simulated water temperature profiles at L6 in the Big Dry arm. .. 88 Plate 36. 2004 observed and simulated Fort Peck dam release temperatures.............................. 89 Plate 37. 2005 observed and simulated Fort Peck dam release temperatures.............................. 89 Plate 38. 2006 observed and simulated Fort Peck dam release temperatures.............................. 90 Plate 39. 2004 Missouri River calibrated river stage at Wolf Point, MT gage (W2 Location 129.5 km). ..................................................................................................................................... 91 Plate 40. 2005 Missouri River calibrated river stage at Wolf Point, MT gage (W2 Location 129.5 km). ..................................................................................................................................... 91 Plate 41. 2006 Missouri River calibrated river stage at Wolf Point, MT gage (W2 Location 129.5 km). ..................................................................................................................................... 92 Plate 42. 2004 Missouri River simulated water temperatures calibrated to measured water temperatures.................................................................................................................................. 93 Plate 43. 2005 Missouri River simulated water temperatures calibrated to measured water temperatures.................................................................................................................................. 94 Plate 44. 2006 Missouri River simulated water temperatures calibrated to measured water temperatures.................................................................................................................................. 95 Plate 45. Fort Peck Lake average annual lake elevation and statistics. ....................................... 96 Plate 46. Fort Peck Lake average annual lake inflow and statistics. ........................................... 96 Plate 47. Fort Peck Lake average annual lake outflow and statistics. ......................................... 97 Plate 48. Milk River at Nashua, MT, annual discharge and statistics. ........................................ 97 Plate 49. Missouri River at Culbertson, MT, annual discharge and statistics. ............................ 98 Plate 50. Glasgow, MT, International Airport average annual temperature (oC) and statistics... 98
xii

xiii

xiv
1 INTRODUCTION
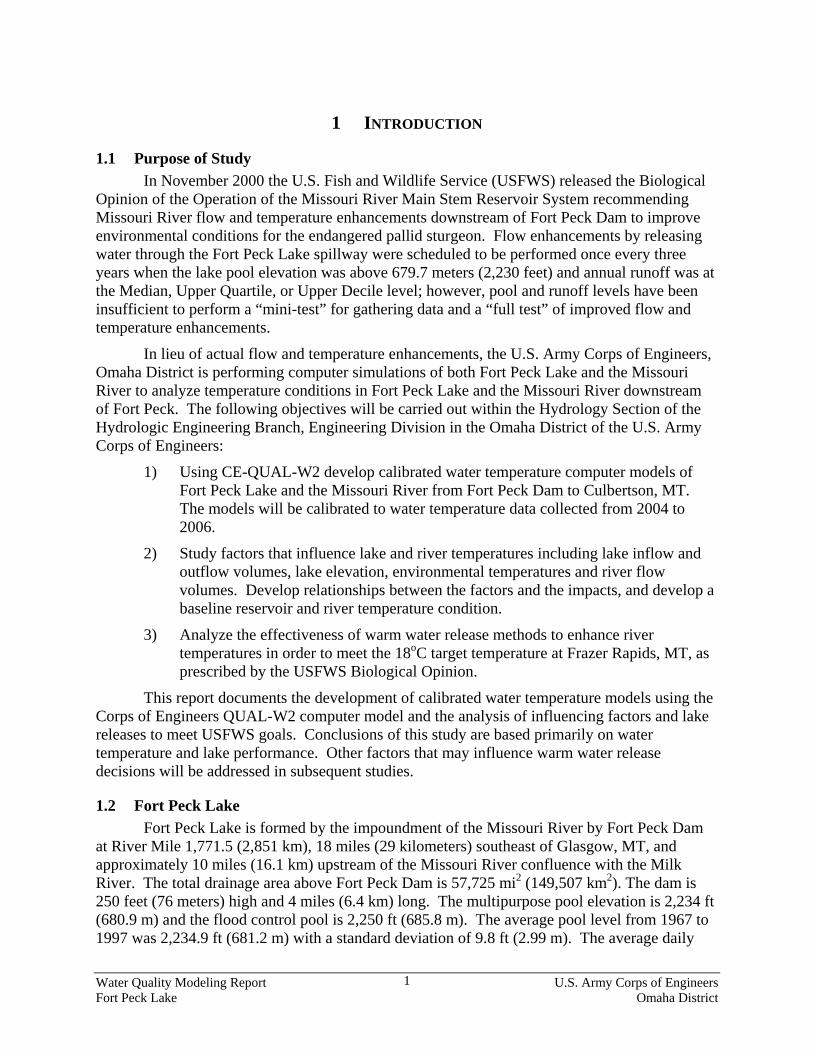
1.1 Purpose of Study In November 2000 the U.S. Fish and Wildlife Service (USFWS) released the Biological
Opinion of the Operation of the Missouri River Main Stem Reservoir System recommending Missouri River flow and temperature enhancements downstream of Fort Peck Dam to improve environmental conditions for the endangered pallid sturgeon. Flow enhancements by releasing water through the Fort Peck Lake spillway were scheduled to be performed once every three years when the lake pool elevation was above 679.7 meters (2,230 feet) and annual runoff was at the Median, Upper Quartile, or Upper Decile level; however, pool and runoff levels have been insufficient to perform a “mini-test” for gathering data and a “full test” of improved flow and temperature enhancements.
In lieu of actual flow and temperature enhancements, the U.S. Army Corps of Engineers, Omaha District is performing computer simulations of both Fort Peck Lake and the Missouri River to analyze temperature conditions in Fort Peck Lake and the Missouri River downstream of Fort Peck. The following objectives will be carried out within the Hydrology Section of the Hydrologic Engineering Branch, Engineering Division in the Omaha District of the U.S. Army Corps of Engineers:
1) Using CE-QUAL-W2 develop calibrated water temperature computer models of Fort Peck Lake and the Missouri River from Fort Peck Dam to Culbertson, MT. The models will be calibrated to water temperature data collected from 2004 to 2006.
2) Study factors that influence lake and river temperatures including lake inflow and outflow volumes, lake elevation, environmental temperatures and river flow volumes. Develop relationships between the factors and the impacts, and develop a baseline reservoir and river temperature condition.
3) Analyze the effectiveness of warm water release methods to enhance river temperatures in order to meet the 18oC target temperature at Frazer Rapids, MT, as prescribed by the USFWS Biological Opinion.
This report documents the development of calibrated water temperature models using the Corps of Engineers QUAL-W2 computer model and the analysis of influencing factors and lake releases to meet USFWS goals. Conclusions of this study are based primarily on water temperature and lake performance. Other factors that may influence warm water release decisions will be addressed in subsequent studies.
1.2 Fort Peck Lake Fort Peck Lake is formed by the impoundment of the Missouri River by Fort Peck Dam
at River Mile 1,771.5 (2,851 km), 18 miles (29 kilometers) southeast of Glasgow, MT, and approximately 10 miles (16.1 km) upstream of the Missouri River confluence with the Milk River. The total drainage area above Fort Peck Dam is 57,725 mi2 (149,507 km2). The dam is 250 feet (76 meters) high and 4 miles (6.4 km) long. The multipurpose pool elevation is 2,234 ft (680.9 m) and the flood control pool is 2,250 ft (685.8 m). The average pool level from 1967 to 1997 was 2,234.9 ft (681.2 m) with a standard deviation of 9.8 ft (2.99 m). The average daily
Water Quality Modeling Report U.S. Army Corps of Engineers Fort Peck Lake Omaha District
1
Water Quality Modeling Report U.S. Army Corps of Engineers Fort Peck Lake Omaha District
2
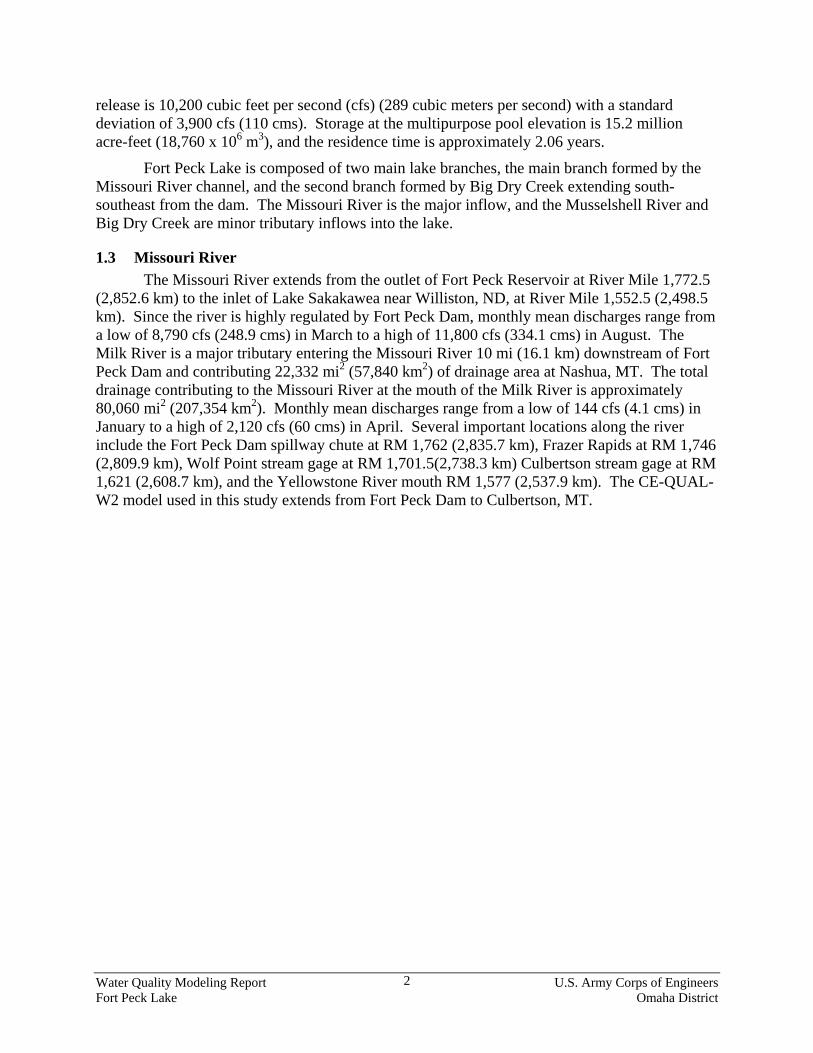
release is 10,200 cubic feet per second (cfs) (289 cubic meters per second) with a standard deviation of 3,900 cfs (110 cms). Storage at the multipurpose pool elevation is 15.2 million acre-feet (18,760 x 106 m3), and the residence time is approximately 2.06 years.
Fort Peck Lake is composed of two main lake branches, the main branch formed by the Missouri River channel, and the second branch formed by Big Dry Creek extending south-southeast from the dam. The Missouri River is the major inflow, and the Musselshell River and Big Dry Creek are minor tributary inflows into the lake.
1.3 Missouri River The Missouri River extends from the outlet of Fort Peck Reservoir at River Mile 1,772.5
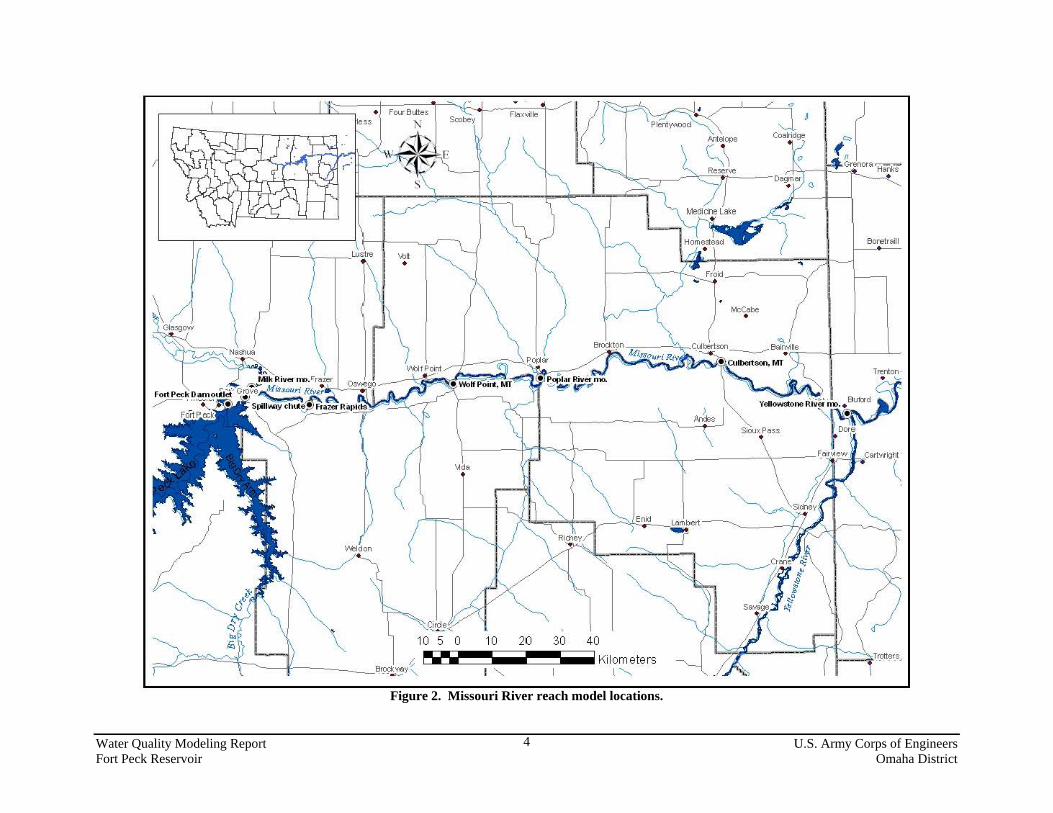
(2,852.6 km) to the inlet of Lake Sakakawea near Williston, ND, at River Mile 1,552.5 (2,498.5 km). Since the river is highly regulated by Fort Peck Dam, monthly mean discharges range from a low of 8,790 cfs (248.9 cms) in March to a high of 11,800 cfs (334.1 cms) in August. The Milk River is a major tributary entering the Missouri River 10 mi (16.1 km) downstream of Fort Peck Dam and contributing 22,332 mi2 (57,840 km2) of drainage area at Nashua, MT. The total drainage contributing to the Missouri River at the mouth of the Milk River is approximately 80,060 mi2 (207,354 km2). Monthly mean discharges range from a low of 144 cfs (4.1 cms) in January to a high of 2,120 cfs (60 cms) in April. Several important locations along the river include the Fort Peck Dam spillway chute at RM 1,762 (2,835.7 km), Frazer Rapids at RM 1,746 (2,809.9 km), Wolf Point stream gage at RM 1,701.5(2,738.3 km) Culbertson stream gage at RM 1,621 (2,608.7 km), and the Yellowstone River mouth RM 1,577 (2,537.9 km). The CE-QUAL-W2 model used in this study extends from Fort Peck Dam to Culbertson, MT.
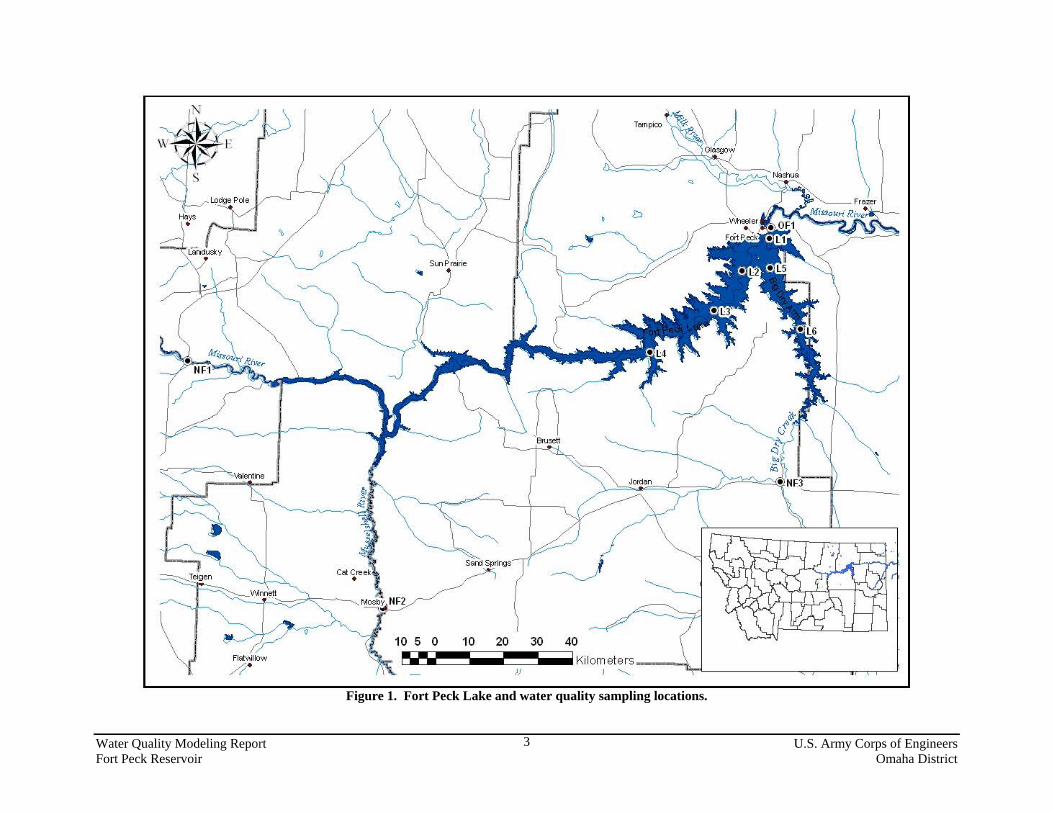
Figure 1. Fort Peck Lake and water quality sampling locations.
Water Quality Modeling Report U.S. Army Corps of Engineers Fort Peck Reservoir Omaha District
3
Water Quality Modeling Report U.S. Army Corps of Engineers Fort Peck Reservoir Omaha District
4
Figure 2. Missouri River reach model locations.
1 Kilometers
l"""'
2 WATER TEMPERATURE MODEL
2.1 CE-QUAL-W2 CE-QUAL-W2 is a two-dimensional (longitudinal and vertical) water quality and
hydrodynamic model for rivers, estuaries, lakes, reservoirs, and river basin systems. CE-QUAL-W2 simulates basic physical, chemical, and biological processes such as temperature, nutrient, algae, dissolved oxygen, organic matter, and sediment relationships. The current model release is Version 3.2 and is supported by the Environmental Lab at the USACE Engineering Research and Development Center (ERDC) in Vicksburg, MS, and Portland State University.
Version 2.0 of the CE-QUAL-W2 model was applied to four of the upper Mainstem System Projects in the early 1990s (i.e., Ft. Peck Lake, Lake Sakakawea, Lake Oahe, and Lake Francis Case). The application of the model was part of the supporting technical documentation of the Environmental Impact Statement (EIS) that was prepared for the Missouri River Master Water Control Manual Review and Update Study. The results of the model application were included as an Appendix to the Review and Update Study – “Volume 7B: Environmental Studies, Reservoir Fisheries, Appendix C – Coldwater Habitat Model, Temperature and Dissolved Oxygen Simulations for the Upper Missouri River Reservoirs” (Cole et. al., 1994).
The current version of the model (3.2) will be applied to Fort Peck Reservoir and the Missouri River downstream of the dam to Culbertson, MT. Predicted temperatures in the lake and river models will be influenced by reservoir inflow volumes and temperatures; environmental factors such as wind, air temperature, and solar radiation; and management factors such as reservoir release rates and outflow structure configurations. Ongoing modeling is being performed under the guidance of Dr. Mark Dortch of the Environmental Lab of ERDC.
2.2 Fort Peck Lake Model
2.2.1 Lake Bathymetry The Fort Peck Lake bathymetry was modified from previous CE-QUAL-W2 bathymetry
used in the Coldwater Habitat Model constructed by Cole et al. (1994) of the U.S. Army Corps of Engineers Waterways Experiment Station in Vicksburg, MS. The reservoir bathymetry consisted of two main branches, 45 active segments and 32 layers. Segments were 5 km (3.1 mi) in length with 2 m (6.56 ft) layer thicknesses. At the multipurpose pool level, segment widths ranged from 11,500 m (37,700 ft) at the dam to 800 m (2,625 ft) at the lake inlet. Segment orientations were adjusted to match their correct geographic orientation. Chezy’s bottom friction coefficients were set to 100. Volume-area-elevation curves constructed from the Corps of Engineers survey and computed from model bathymetry are compared in Figures 3 and 4.
Water Quality Modeling Report U.S. Army Corps of Engineers Fort Peck Lake Omaha District
5
610
620
630
640
650
660
670
680
690
0 100 200 300 400 500 600 700 800 900 1000
Area (km2)
Elev
atio
n (m
)
W2 Lake Area COE Lake Area
Figure 3. Area-elevation curves computed from the W2 model bathymetry and the 1986 COE lake survey.
610
620
630
640
650
660
670
680
690
0 2500 5000 7500 10000 12500 15000 17500 20000 22500 25000
Volume (Million m3)
Elev
atio
n (m
)
W2 Lake Volume COE Lake Volume
Figure 4. Volume-elevation curves computed from the W2 model bathymetry and the 1986 COE lake survey.
Water Quality Modeling Report U.S. Army Corps of Engineers Fort Peck Lake Omaha District
6
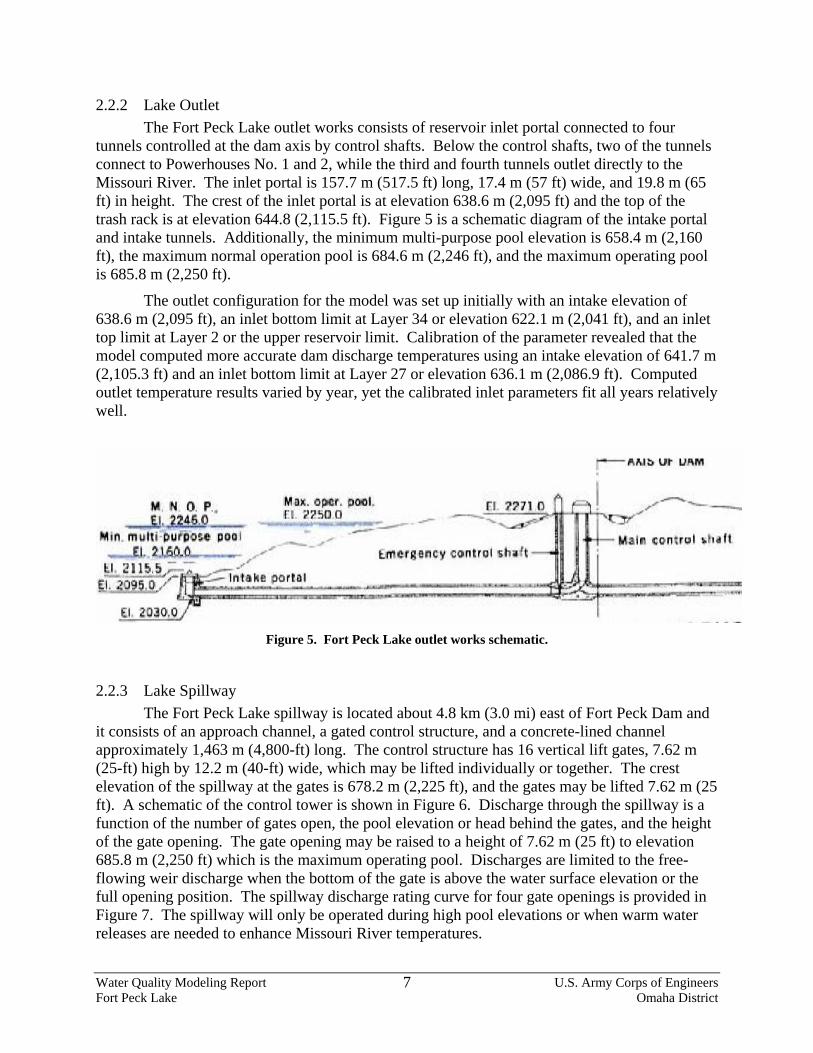
2.2.2 Lake Outlet The Fort Peck Lake outlet works consists of reservoir inlet portal connected to four
tunnels controlled at the dam axis by control shafts. Below the control shafts, two of the tunnels connect to Powerhouses No. 1 and 2, while the third and fourth tunnels outlet directly to the Missouri River. The inlet portal is 157.7 m (517.5 ft) long, 17.4 m (57 ft) wide, and 19.8 m (65 ft) in height. The crest of the inlet portal is at elevation 638.6 m (2,095 ft) and the top of the trash rack is at elevation 644.8 (2,115.5 ft). Figure 5 is a schematic diagram of the intake portal and intake tunnels. Additionally, the minimum multi-purpose pool elevation is 658.4 m (2,160 ft), the maximum normal operation pool is 684.6 m (2,246 ft), and the maximum operating pool is 685.8 m (2,250 ft).
The outlet configuration for the model was set up initially with an intake elevation of 638.6 m (2,095 ft), an inlet bottom limit at Layer 34 or elevation 622.1 m (2,041 ft), and an inlet top limit at Layer 2 or the upper reservoir limit. Calibration of the parameter revealed that the model computed more accurate dam discharge temperatures using an intake elevation of 641.7 m (2,105.3 ft) and an inlet bottom limit at Layer 27 or elevation 636.1 m (2,086.9 ft). Computed outlet temperature results varied by year, yet the calibrated inlet parameters fit all years relatively well.
Figure 5. Fort Peck Lake outlet works schematic.
2.2.3 Lake Spillway The Fort Peck Lake spillway is located about 4.8 km (3.0 mi) east of Fort Peck Dam and
it consists of an approach channel, a gated control structure, and a concrete-lined channel approximately 1,463 m (4,800-ft) long. The control structure has 16 vertical lift gates, 7.62 m (25-ft) high by 12.2 m (40-ft) wide, which may be lifted individually or together. The crest elevation of the spillway at the gates is 678.2 m (2,225 ft), and the gates may be lifted 7.62 m (25 ft). A schematic of the control tower is shown in Figure 6. Discharge through the spillway is a function of the number of gates open, the pool elevation or head behind the gates, and the height of the gate opening. The gate opening may be raised to a height of 7.62 m (25 ft) to elevation 685.8 m (2,250 ft) which is the maximum operating pool. Discharges are limited to the free-flowing weir discharge when the bottom of the gate is above the water surface elevation or the full opening position. The spillway discharge rating curve for four gate openings is provided in Figure 7. The spillway will only be operated during high pool elevations or when warm water releases are needed to enhance Missouri River temperatures.
Water Quality Modeling Report U.S. Army Corps of Engineers Fort Peck Lake Omaha District
7
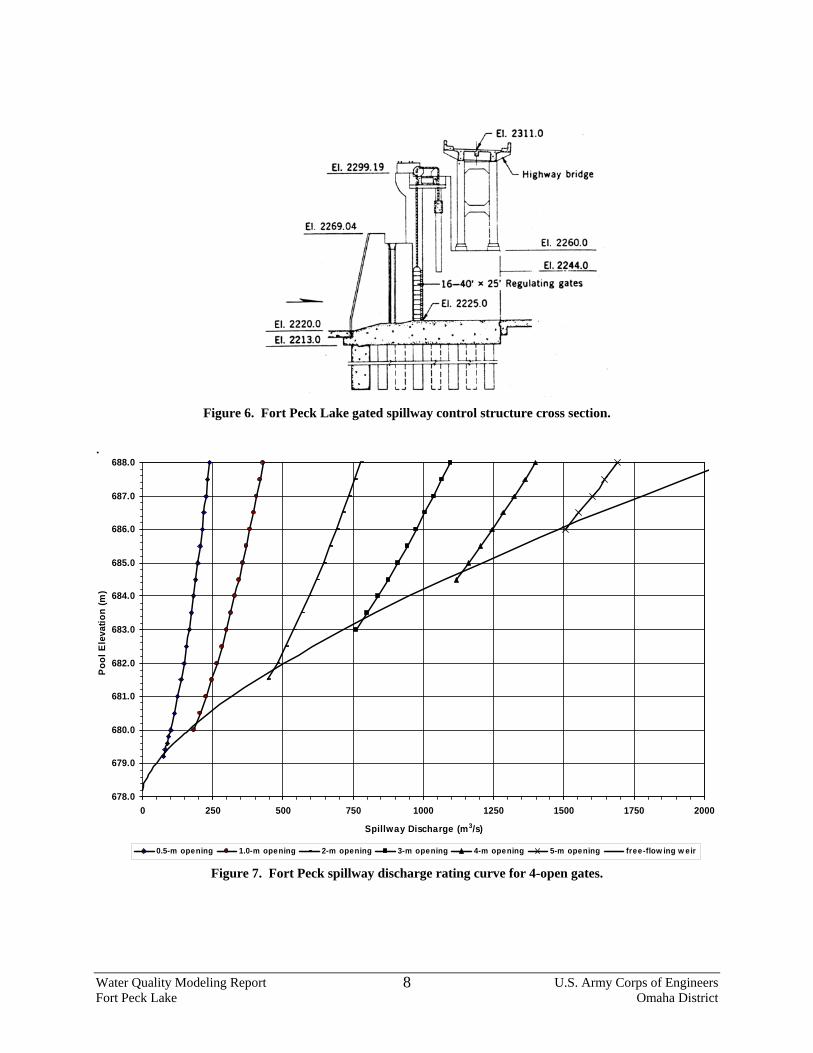
Figure 6. Fort Peck Lake gated spillway control structure cross section.
.
678.0
679.0
680.0
681.0
682.0
683.0
684.0
685.0
686.0
687.0
688.0
0 250 500 750 1000 1250 1500 1750 2000
Spillway Discharge (m3/s)
Poo
l Ele
vatio
n (m
)
0.5-m opening 1.0-m opening 2-m opening 3-m opening 4-m opening 5-m opening free-flow ing w eir
Figure 7. Fort Peck spillway discharge rating curve for 4-open gates.
Water Quality Modeling Report U.S. Army Corps of Engineers Fort Peck Lake Omaha District
8
2.2.4 Other Model Adjustments
The lake model computed temperatures best using the turbulent kinetic energy (TKE) method for ve1iical eddy viscosity. In addition, the model perfonned best using the Teim-byTenn rather than the Equilibrium Temperature Method.
2.3 Missouri River Model
2.3.1 River Bathymetiy
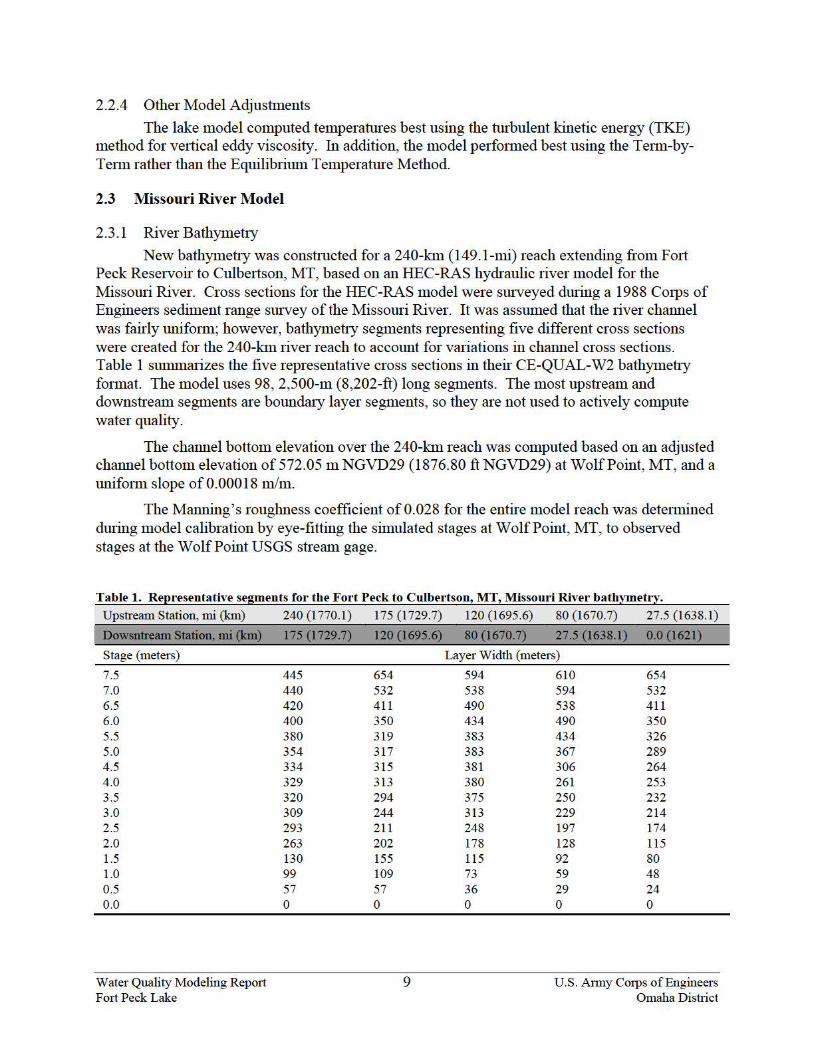
New bathymetiy was constiucted for a 240-km (149.1-mi) reach extending from F01i Peck Reservoir to Culbe1ison, MT, based on an HEC-RAS hydraulic river model for the Missom i River. Cross sections for the HEC-RAS model were surveyed dming a 1988 C01ps of Engineers sediment range survey of the Missouri River. It was assumed that the river channel was fairly lmif01m; however, bathymetry segments representing five different cross sections were created for the 240-km river reach to account for variations in channel cross sections. Table 1 summarizes the five representative cross sections in their CE-QUAL-W2 bathymetry format. The model uses 98, 2,500-m (8,202-ft) long segments. The most upstr·eam and downstr·eam segments are boundruy layer segments, so they ru·e not used to actively compute water quality.
The channel bottom elevation over the 240-km reach was computed based on an adjusted channel bottom elevation of 572.05 m NGVD29 (1876.80 ft NGVD29) at Wolf Point, MT, and a unif01m slope of0.00018 mhn.
The Manning's roughness coefficient of0.028 for the entire model reach was dete1mined during model calibration by eye-fitting the simulated stages at Wolf Point, MT, to observed stages at the Wolf Point USGS sti·erun gage.
Table 1. Re~resentative segments for the Fort Peck to Culber tson, MT, Missouri River bathymetl:r. Upstream Station, mi (km)
( Dowsntream Station, mi (km)
Stage (meters)
7.5 7.0 6.5 6.0 5.5 5.0 4.5 4.0 3.5 3.0 2.5 2.0 1.5 1.0 0.5 0.0
Water Quality Modeling Repmt Fmt Peck Lake
240 (1770.1)
175 (1729.7)
445 440 420 400 380 354 334 329 320 309 293 263 130 99 57 0
175 (1729.7)
120 (1695.6)
654 532 411 350 319 317 315 313 294 244 211 202 155 109 57 0
9
120 (1695.6) 80 (1670.7) 27.5 (1638.1)
80 (1670.7) 27.5 (1638.1) 0.0 (1621)
Layer Width (meters)
594 538 490 434 383 383 381 380 375 313 248 178 115 73 36 0
610 654 594 532 538 411 490 350 434 326 367 289 306 264 261 253 250 232 229 214 197 174 128 115 92 80 59 48 29 24 0 0
U.S. Anny Corps of Engineers Omaha District
The model is constructed in SI units for Missouri River in which locations are generally referenced in river miles. Several important locations along the Missouri River within this model include the Fort Peck Dam outlet; Frazer, MT; Wolf Point, MT; and Culbertson, MT. Table 2 provides location names with corresponding river miles, model bathymetry stations in kilometers, and model bathymetry segments numbers.
Table 2. Missouri River model location information.
Location Name River Station (miles)
BathymetryStation (km)
Bathymetry Segment No.
Fort Peck Dam Outlet (assumed location) below Fort Peck Dam, observed temperature Fort Peck Spillway Chute & Milk River mouth Frazer Rapids, MT, observed temperature Wolf Point, MT Poplar River mouth Culbertson, MT
1770 1765 1762 1746 1701.5 1679 1621
240.0 231.7 226.9 201.2 129.5 93.3 0
2 5 7 17 46 60 97
2.3.2 River Model Adjustments River stage was calibrated to observed stages at Wolf Point, MT, by adjusting the river
channel bottom and the Manning’s roughness coefficient. River channel bottom at Wolf Point was set to an elevation of 572.1 m and all other elevations were determined based on a channel slope of 0.00018 m/m. The roughness coefficient was adjusted from 0.024 to 0.028 to achieve the desired river stage.
The vertical diffusion of momentum is a very important process within the model that determines the degree of vertical mixing in the river model. Vertical diffusion can be controlled by several parameters in the model including the method for computing vertical eddy viscosity. The CE-QUAL-W2 user manual recommended that all methods besides the W2, renormalization group (RNG), and the turbulent kinetic energy (TKE) methods could be used effectively for computing vertical eddy viscosity; however, information in the modeling clinic indicated the W2 method would be appropriated for riverine models. The Nickuradse (NICK) method was initially used resulting in a mildly stratified temperature profile; however, USGS findings indicated that the temperature profile was homeo-thermic. Consequently the W2N method generated a well-mixed, homeo-thermic profile; therefore, it was adopted as the vertical eddy viscosity method.
2.4 General Data Sources
2.4.1 Meteorology Hourly weather data was obtained from the National Climatic Data Center Local
Climatological Data online database for all simulations years. The Wokal Field/Glasgow International Airport (GGW) weather station maintained by the airport and the National Weather Service (NWS) provided hourly air temperature, dew point temperature, wind speed, wind direction, and cloud cover. The station coordinates are 48o12’N latitude, 106o37’W longitude, at a ground elevation of 691.3 m (2268 ft). Wind speed and direction were measured at a 10 meter height. Cloud cover reported qualitatively was converted to a cloud quantity required by the CE-QUAL-W2 program in computing incident solar radiation. Cloud cover is quantified on a scale
Water Quality Modeling Report U.S. Army Corps of Engineers Fort Peck Lake Omaha District
10
of 0 to 10, 10 being the greatest amount of cloud cover. The cloud cover quantities that worked best in the Fort Peck Reservoir and Missouri River simulations were two (2) for clear conditions (CLR) and scattered cloud cover (SCT), six (6) for few (FEW) clouds, eight (8) for broken cover (BKN), and ten (10) for overcast (OVC) days.
Wind sheltering is an important adjustment factor used to reduce wind shear forces at the water surface. In the lake model wind sheltering coefficients were set at 90% of measured wind speed to account for the reduction in wind speed from the measuring location to the lake surface. In the riverine model wind sheltering coefficients were set at 80% to reduce wind due to higher terrain surrounding the river.
Hourly air temperature, dew point temperature, and wind speed for simulation years 2004-2006 are plotted in Plates 1 – 6.
2.4.2 Lake Inflows, Discharges, and Flow Temperatures The Missouri River, Musselshell River, and Big Dry Creek were the sources of Fort Peck
Lake inflows. Missouri River daily streamflow and average daily temperature served as the main inflow to Branch 1. This data was measured by the USGS stream gage at Landusky, MT (Gage no. 06115200). The Musselshell River and Big Dry Creek were minor inflows into Fort Peck Lake. Musselshell River streamflow measured by the USGS at Mosby, MT (Gage no. 06130500) served as a tributary inflow near the lake inlet. Big Dry Creek streamflow measured by the USGS at Van Norman, MT (Gage no. 06131000) served as the Branch 2 inflow. Model inflows are plotted for the calibration years 2004 through 2006 in Plates 7 - 9. Partial year daily temperature data was available at Landusky in 2004 and 2005, while hourly temperature data was available in 2006. Temperature measurements were not made from 2004 to 2006 on the Musselshell River and Big Dry Creek, so a 1978 temperature dataset of Big Dry Creek was used in place of real temperature measurements on the two minor inflows. Inflow temperature data is plotted in Plate 10.
2.4.3 Missouri River Discharge and Temperature Fort Peck Dam outflow is the main discharge and contributor of thermal energy into the
Missouri River CE-QUAL-W2 model. Discharge and temperature data was provided on a daily and hourly time-step by the Corps of Engineers, Omaha District Water Control Section database. Outflow temperatures were measured in the raw water loop in Powerplant No. 2 on an hourly basis with a Hydrolab temperature probe from 2004 to the present. Simulated dam release temperatures calibrated to the measured release temperatures were used in the river simulations.
The USGS maintains stream gages at Wolf Point (Gage no. 06177000) and Culbertson, MT (Gage no. 06185500), which provides daily stage, discharge, and mean temperature. Wolf Point served as a discharge, stage, and temperature calibration point; and, Culbertson served as the boundary condition location for downstream discharge, stage, and temperature. Discharges from Fort Peck Dam and Missouri River discharges at Culbertson, MT, are shown in Plates 11 - 13. Fort Peck Dam and Milk River discharge temperatures are shown in Plates 14 - 16.
2.4.4 Tributary Discharge and Temperature The Milk River, Poplar River, and Big Muddy Creek are tributaries that enter the
Missouri River in the reach extending from Fort Peck Lake to Culbertson, MT. Poplar River and Big Muddy Creek stream flows during the 2004 to 2006 calibration period were insignificant, so
Water Quality Modeling Report U.S. Army Corps of Engineers Fort Peck Lake Omaha District
11
they were not incorporated into the model. The Milk River contributes significant stream flows during wet years, so it was used in all simulation years.
Milk River stage and temperature is measured at Nashua, MT, by the USGS. The Milk River empties into the Missouri River at RM 1762 or model station 226.9 km. Daily temperatures have been recorded on a regular basis by the USGS from May 17 to October 9 since 2001. Year 2000 temperature data was used during the remainder of the calendar year dates. Milk River discharges are shown in Plates 11 - 13, and temperatures are shown in Plates 14 - 16.
2.5 Fort Peck Lake Calibration The water balance routine was used to perform the balance by accounting for deficits and
surpluses that caused deviations from the observed water surface elevation. In each of the calibration years (2004 – 2006), a close fit to observed elevations was achieved (Plate 17).
Water column temperatures in the lake model were calibrated to observed water column temperatures at four locations in the Missouri River branch of Fort Peck and two locations in the Big Dry Creek branch (Big Dry Arm) of Fort Peck. Observed temperatures were measured with Hydrolab probes during the sampling season.
Modeled outlet temperatures were calibrated to hourly Fort Peck Dam powerhouse release temperatures. Release temperatures were measured with a Hydrolab probe inserted into a container receiving water from the powerhouse raw water loop.
2.5.1 Lake Temperature Lake temperatures are plotted for simulations in 2004, 2005, and 2006 in Plates 18 - 35.
Temperature profiles correspond to sampling locations L1, L2, L3, and L4 at distances of 0 km, 10 km, 25 km, and 50 km from the dam in the Missouri River branch; and, locations L5 and L6 at distances of 0 km and 20 km from the downstream boundary of the Big Dry Creek branch. Measured temperature profile dates are included in each profile plot.
The calibrated model provides a relatively good fit to the measured temperature profile data, though the profiles exhibit some deviation especially near the lake bottom. Root-mean-squared (RMS) errors computed for each profile are also provided in the plots. RMS error average over 2004, 2005, and 2006 simulation years were 0.665, 0.945, and 0.846, respectively.
2.5.2 Outlet Temperature Simulated outlet temperatures plotted against measured outlet temperatures in the Fort
Peck powerhouse are shown in Plates 36 - 38. Since warm water releases are desired during the warm season, calibration targeted temperatures from April through September. The model produced a generally good fit during all years, and perhaps the best temperature fit during the 2005 simulation (Plate 37).
2.6 Missouri River Calibration Results
2.6.1 Stage Simulated river stage at Wolf Point, MT (Loc 129.5 km) is plotted in Plates 39 - 41. CE-
QUAL-W2 computed stages to within 0.1 – 0.2 meters of observed stage during the free flowing/non-ice affected seasons, while during the ice-affected season, it underestimated the
Water Quality Modeling Report U.S. Army Corps of Engineers Fort Peck Lake Omaha District
12
simulated stage. Ice-affected observed stages are depicted as gray symbols. CE-QUAL-W2’s computational strength is in two-dimensional water quality modeling, and so it stands to reason that it may not compute stage affected by ice cover and ice jam accurately.
2.6.2 Temperature After adjustments were made to the vertical momentum method and bathymetry,
temperature calibrated to observed data very well. Plates 42 - 44 are time series plots of simulated river temperature and observed temperature below Fort Peck Dam (Loc 231.7 km), at Frazer (Loc 201.2 km), at Wolf Point (Loc 129.5 km), and at Culbertson (Loc 0) from Julian days 50 to 300. Temperatures are reported only at the one-meter depth because the water column profile was well-mixed creating a homo-thermic temperature profile. In all three calibration years (2004 – 2006) a majority of the simulated temperatures appeared to be within 0.5 to 1.0oC, and better at most time steps. Some error is probably present due to the inadequacy of Milk River temperature data.
2.7 River Temperature Increases Missouri River water undergoes natural temperature increases from the outlet of Fort
Peck Dam throughout the Missouri River channel downstream to Lake Sakakawea in North Dakota. Temperature increases are caused primarily solar insolation of the cooler Fort Peck Lake water as it flows downstream. The greatest temperature increases occur during maximum solar insolation during the summer months. A conservative estimate of warming from Fort Peck Dam to Frazer Rapids was determined using calibrated model data and USGS observed temperatures.
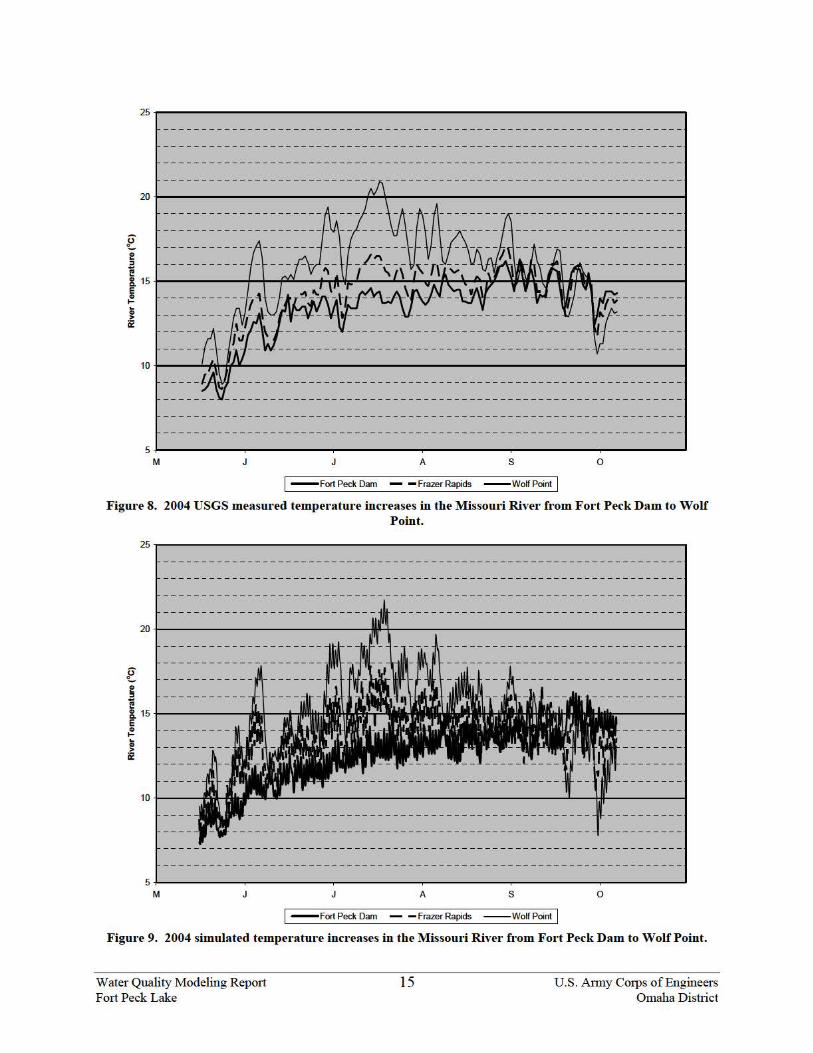
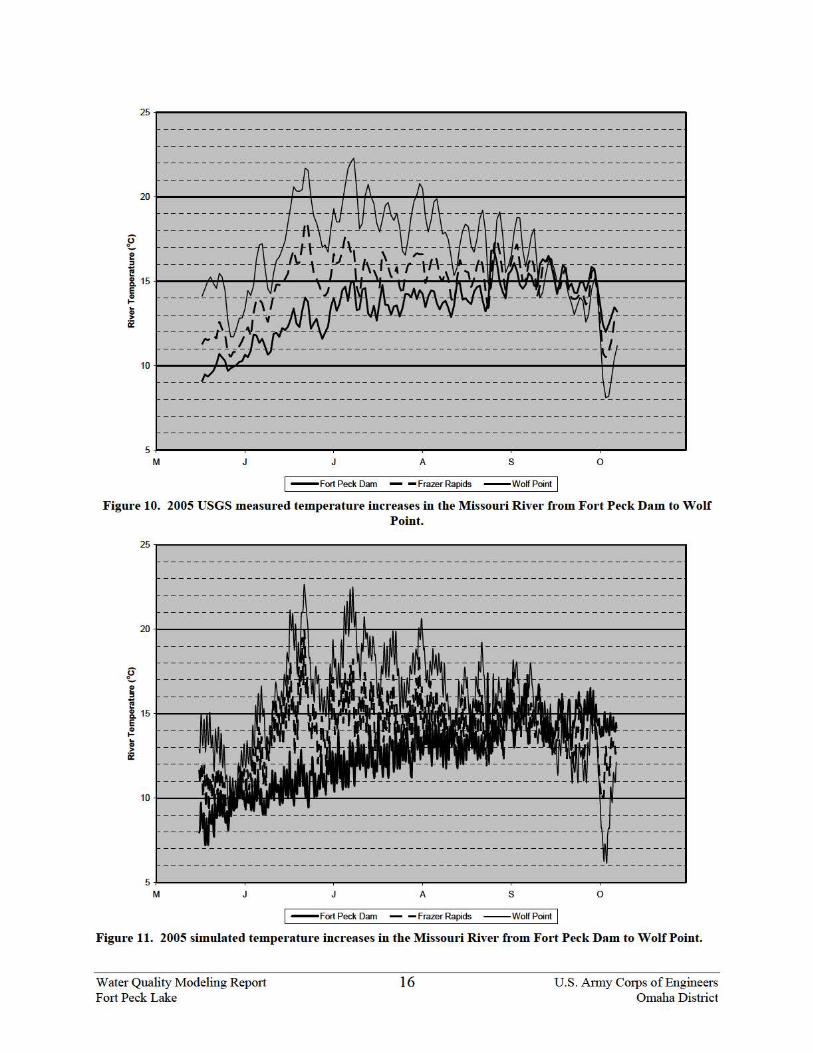
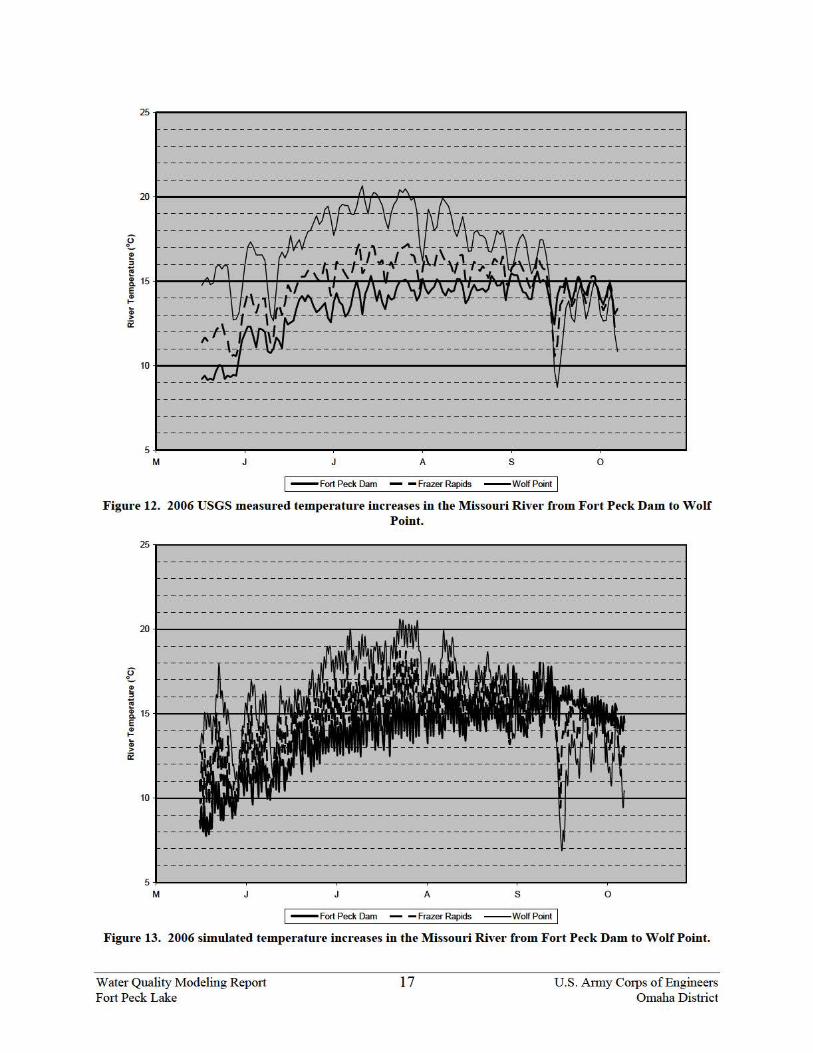
Temperature increases from Fort Peck Dam to Frazer Rapids were evaluated during the 2004-2006 simulation and observation years. The USGS measured daily temperatures in the river at numerous locations from May 17 to October 9 of each year from 2001 to 2007. Plots of simulated and measured daily temperatures in 2004, 2005, and 2006 are provided in Figures 8 - 13. Both plots demonstrate the river temperature increases that occur from Fort Peck Dam to Frazer Rapids to Wolf Point, MT. Average temperature increases are compared during the May 17 to October 9 time period in Table 3. Simulated average seasonal temperature increases at both Frazer Rapids and Wolf Point were higher than measured average seasonal temperature increases; however, differences were less than 0.5oC. A conservative estimate of average temperature increase from Fort Peck Dam to Frazer Rapids throughout the simulation/observing season is 1.25oC or roughly the average of the simulated and measured temperature increases. At Wolf Point, average temperature increases ranging from about 2.5 to 3.5oC occurred in the simulated data and 2.4 to 3.3oC occurred in the measured data. Temperature increases during the warmest part of the season may range from 7.0 to 11.0oC, while during the cool seasons, temperatures decrease after being released from the reservoir. Table 3. Average Missouri River water temperature increases from Fort Peck Dam to Frazer Rapids and Wolf Point, MT.
Frazer Rapids Wolf Point Simulated Measured Simulated Measured
2004 2005 2006 Average
1.20 1.57 1.51 1.43
0.77 1.35 1.24 1.12
2.55 3.15 3.49 3.06
2.43 3.33 3.25 3.00
Water Quality Modeling Report U.S. Army Corps of Engineers Fort Peck Lake Omaha District
13
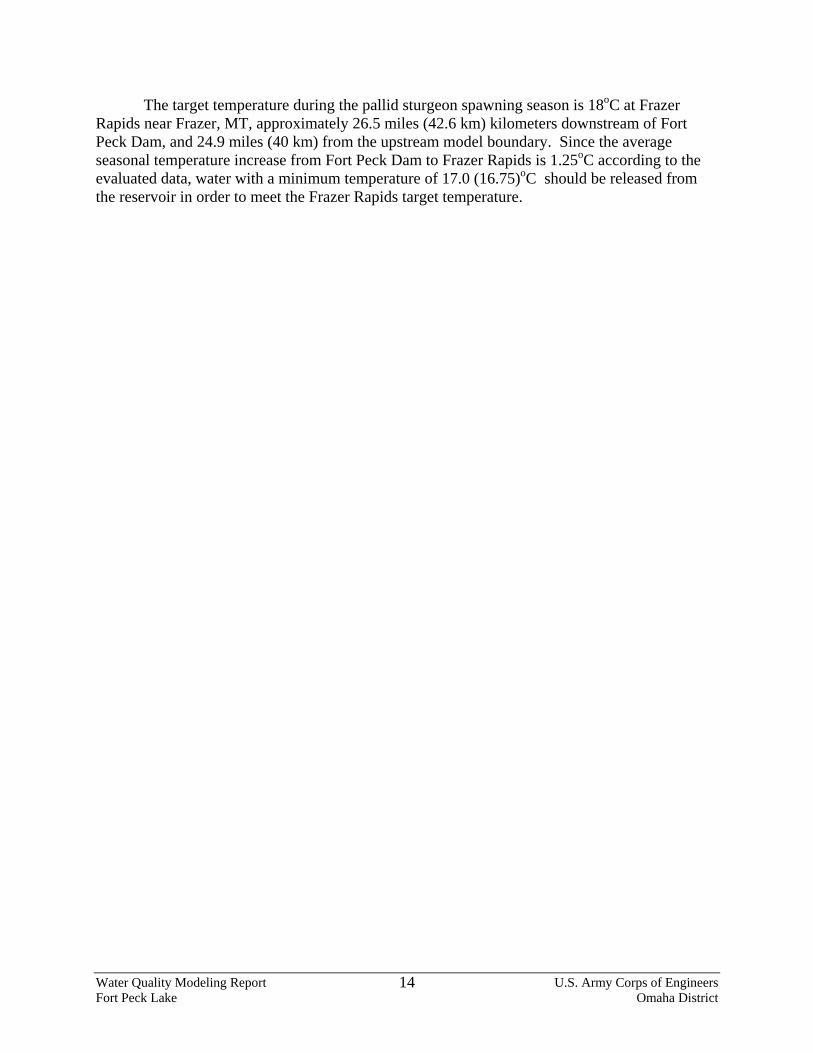
The target temperature during the pallid sturgeon spawning season is 18oC at Frazer Rapids near Frazer, MT, approximately 26.5 miles (42.6 km) kilometers downstream of Fort Peck Dam, and 24.9 miles (40 km) from the upstream model boundary. Since the average seasonal temperature increase from Fort Peck Dam to Frazer Rapids is 1.25oC according to the evaluated data, water with a minimum temperature of 17.0 (16.75)oC should be released from the reservoir in order to meet the Frazer Rapids target temperature.
Water Quality Modeling Report U.S. Army Corps of Engineers Fort Peck Lake Omaha District
14
25 ~-------------------------------------------------------------------,
5 ~--------~----------~--------~----------~--------~~--------~ M J A s 0
1-Fort Peck Dam - - FrazerRapids --WolfPoint I Figure 8. 2004 USGS measured temperature increases in the Missomi River from Fort Peck Dam to Wolf
Point.
25 ~----------------------------------------------------------------------,
5 +-----------~----------~----------~----------~----------~----------~ M J A s 0
1-Fort Peck Dam - - FrazerRapids --WolfPoint I Figure 9. 2004 simulated temperature increases in the Missouri River from Fort Peck Dam to Wolf Poin t.
Water Quality Modeling Repmt Fmt Peck Lake
15 U.S. Anny Corps of Engineers Omaha District
25 ~-------------------------------------------------------------------,
5 ~--------~----------~--------~----------~--------~~--------~ M J A s 0
1-Fort Peck Dam - - FrazerRapids --WolfPoint I Figure 10. 2005 USGS measured temperature incr eases in the Missour i River from Fort Peck Dam to Wolf
Point.
25 ~----------------------------------------------------------------------,
5 +-----------~----------~----------~----------~----------~----------~ M J A s 0
1-Fort Peck Dam - - FrazerRapids --WolfPoint I Figure 11. 2005 simulated temperature increases in the Missom·i Rive1· from Fort Peck Dam to Wolf Point.
Water Quality Modeling Repmt Fmt Peck Lake
16 U.S. Anny Corps of Engineers Omaha District
~~----------------------------------------------------------------~
5 ~--------~----------~--------~----------~----------~--------~ M A s 0
I - Fort Peck Dam - - Frazer Rapids --Wolf Point I Figure 12. 2006 USGS measured temperature increases in the Missouri River from Fort Peck Dam to Wolf
Point.
~ ~----------------------------------------------------------------------~
5 +-----------~----------~----------~----------~------------~--------~ M J J A s 0
I - Fort Peck Dam - - Frazer Rapids --Wolf Point I Figure 13. 2006 simulated temperature increases in the Missomi River from Fort Peck Dam to Wolf Point.
Water Quality Modeling Repmt Fmt Peck Lake
17 U.S. Anny Corps of Engineers Omaha District
3 TEMPERATURE ANALYSIS UNDER EXISTING CONDITIONS
In order to gain an understanding of existing temperature conditions in Fort Peck Lake and the Missouri River downstream of Fort Peck Dam, CE-QUAL-W2 simulations of existing dam operational and environmental conditions were performed. Simulations of Fort Peck Lake and the Missouri River downstream during a normal operating and meteorological year were used to establish a baseline lake and river temperature conditions. Furthermore, simulations evaluated the impact that lake inflow, lake outflow, pool elevation and environmental temperatures have on lake and downstream Missouri river temperatures. Development of a baseline model and evaluation of controlling factors was an important step in assessing the time and volume availability of warm water (greater than 17 – 18oC) in the lake for potential release to the Missouri River.
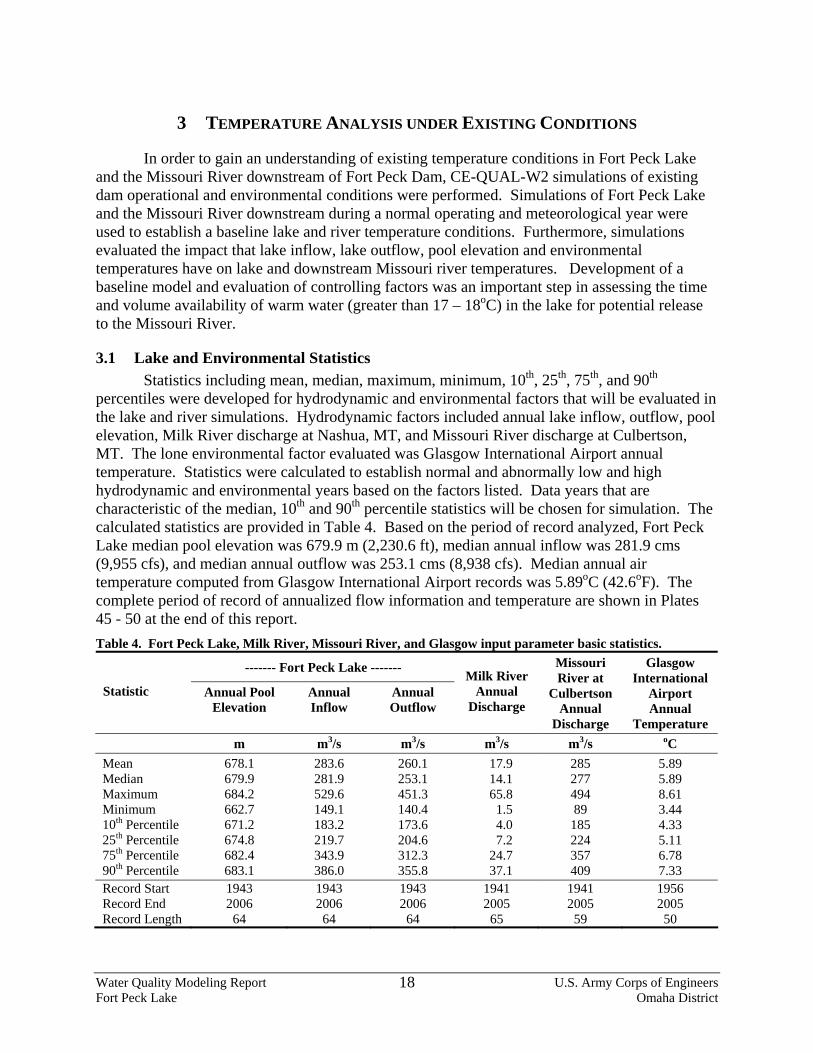
3.1 Lake and Environmental Statistics Statistics including mean, median, maximum, minimum, 10th, 25th, 75th, and 90th
percentiles were developed for hydrodynamic and environmental factors that will be evaluated in the lake and river simulations. Hydrodynamic factors included annual lake inflow, outflow, pool elevation, Milk River discharge at Nashua, MT, and Missouri River discharge at Culbertson, MT. The lone environmental factor evaluated was Glasgow International Airport annual temperature. Statistics were calculated to establish normal and abnormally low and high hydrodynamic and environmental years based on the factors listed. Data years that are characteristic of the median, 10th and 90th percentile statistics will be chosen for simulation. The calculated statistics are provided in Table 4. Based on the period of record analyzed, Fort Peck Lake median pool elevation was 679.9 m (2,230.6 ft), median annual inflow was 281.9 cms (9,955 cfs), and median annual outflow was 253.1 cms (8,938 cfs). Median annual air temperature computed from Glasgow International Airport records was 5.89oC (42.6oF). The complete period of record of annualized flow information and temperature are shown in Plates 45 - 50 at the end of this report. Table 4. Fort Peck Lake, Milk River, Missouri River, and Glasgow input parameter basic statistics.
------- Fort Peck Lake -------
Statistic Annual Pool Elevation
Annual Inflow
Annual Outflow
Milk River Annual
Discharge
Missouri River at
Culbertson Annual
Discharge
Glasgow International
Airport Annual
Temperature m m3/s m3/s m3/s m3/s oC Mean Median Maximum Minimum 10th Percentile 25th Percentile 75th Percentile 90th Percentile
678.1 679.9 684.2 662.7 671.2 674.8 682.4 683.1
283.6 281.9 529.6 149.1 183.2 219.7 343.9 386.0
260.1 253.1 451.3 140.4 173.6 204.6 312.3 355.8
17.9 14.1 65.8 1.5 4.0 7.2
24.7 37.1
285 277 494 89
185 224 357 409
5.89 5.89 8.61 3.44 4.33 5.11 6.78 7.33
Record Start Record End Record Length
1943 2006 64
1943 2006 64
1943 2006 64
1941 2005 65
1941 2005 59
1956 2005 50
Water Quality Modeling Report U.S. Army Corps of Engineers Fort Peck Lake Omaha District
18
3.2 Lake Temperature Analysis CE-QUAL-W2 simulations of lake temperature were performed using a combination of
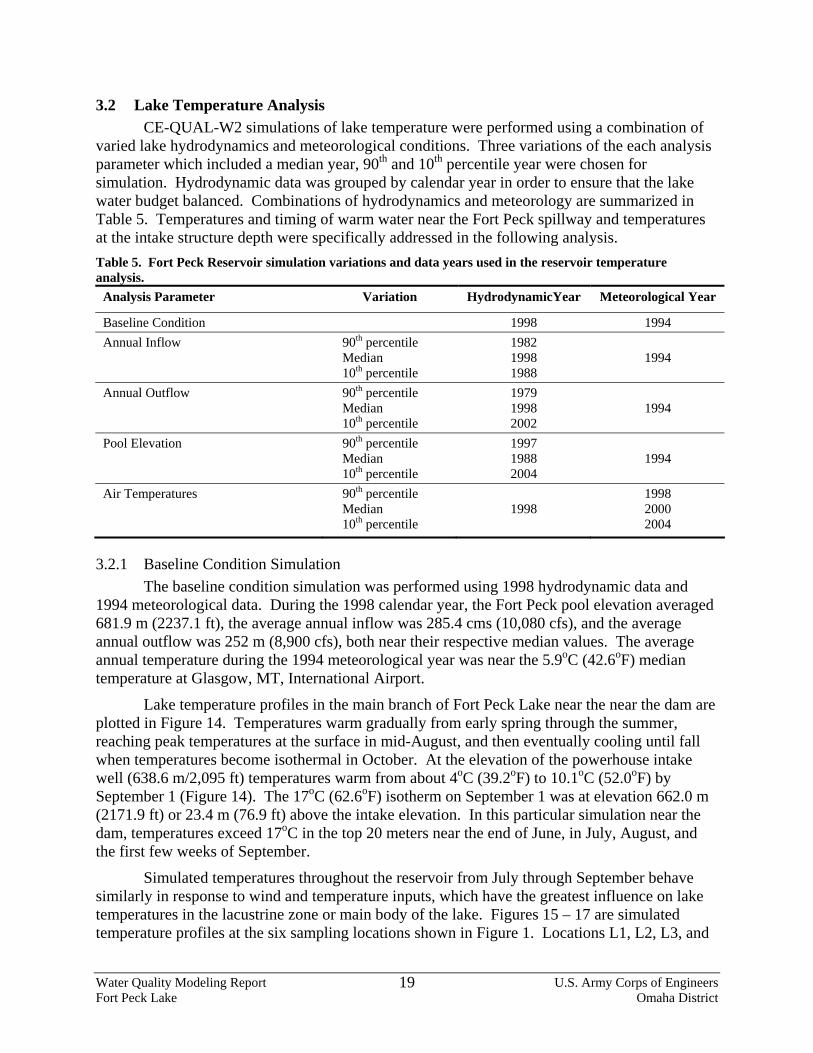
varied lake hydrodynamics and meteorological conditions. Three variations of the each analysis parameter which included a median year, 90th and 10th percentile year were chosen for simulation. Hydrodynamic data was grouped by calendar year in order to ensure that the lake water budget balanced. Combinations of hydrodynamics and meteorology are summarized in Table 5. Temperatures and timing of warm water near the Fort Peck spillway and temperatures at the intake structure depth were specifically addressed in the following analysis. Table 5. Fort Peck Reservoir simulation variations and data years used in the reservoir temperature analysis.
Analysis Parameter Variation HydrodynamicYear Meteorological Year
Baseline Condition 1998 1994 Annual Inflow 90th percentile
Median 10th percentile
1982 1998 1988
1994
Annual Outflow 90th percentile Median 10th percentile
1979 1998 2002
1994
Pool Elevation 90th percentile Median 10th percentile
1997 1988 2004
1994
Air Temperatures 90th percentile Median 10th percentile
1998
1998 2000 2004
3.2.1 Baseline Condition Simulation The baseline condition simulation was performed using 1998 hydrodynamic data and
1994 meteorological data. During the 1998 calendar year, the Fort Peck pool elevation averaged 681.9 m (2237.1 ft), the average annual inflow was 285.4 cms (10,080 cfs), and the average annual outflow was 252 m (8,900 cfs), both near their respective median values. The average annual temperature during the 1994 meteorological year was near the 5.9oC (42.6oF) median temperature at Glasgow, MT, International Airport.
Lake temperature profiles in the main branch of Fort Peck Lake near the near the dam are plotted in Figure 14. Temperatures warm gradually from early spring through the summer, reaching peak temperatures at the surface in mid-August, and then eventually cooling until fall when temperatures become isothermal in October. At the elevation of the powerhouse intake well (638.6 m/2,095 ft) temperatures warm from about 4oC (39.2oF) to 10.1oC (52.0oF) by September 1 (Figure 14). The 17oC (62.6oF) isotherm on September 1 was at elevation 662.0 m (2171.9 ft) or 23.4 m (76.9 ft) above the intake elevation. In this particular simulation near the dam, temperatures exceed 17oC in the top 20 meters near the end of June, in July, August, and the first few weeks of September.
Simulated temperatures throughout the reservoir from July through September behave similarly in response to wind and temperature inputs, which have the greatest influence on lake temperatures in the lacustrine zone or main body of the lake. Figures 15 – 17 are simulated temperature profiles at the six sampling locations shown in Figure 1. Locations L1, L2, L3, and
Water Quality Modeling Report U.S. Army Corps of Engineers Fort Peck Lake Omaha District
19
L5 are all within the lacustrine zone of the reservoir, while L4 is in a transitional zone, and L5 is in the Big Dry Arm in a shallow water location. On July 1 (Figure 15) temperatures show some separation, especially at L1 which may be caused by the lower level outlet drawing a portion of the cold water out of that zone of the reservoir. L5 is similar in temperature to L2 and L3 on July 1, August 1 (Figure 16) and September 1 (Figure 17). On August 1, L4 temperatures in the transitional zone are warmer near the surface due to warmer Missouri River inflows and possibly some vertical mixing in the top 15 to 20 meters. In general, temperatures are similar in the main branch of Fort Peck Lake and the Big Dry Arm with the exception of the shallower, up-lake areas.
Time series of lake temperature 1.0-m below the lake surface, at the spillway crest elevation 678.2 m (2225 ft) and in water discharged through the powerhouse are plotted in Figure 18. Temperatures at the spillway outlet reach 17oC on June 22 and persist until September 27, while temperatures near the lake surface equal or exceed 17oC during that same time period. Powerhouse release temperatures ranged from 5.0oC (41oF) on May 1 to 13.0oC (55.4oF). Temperatures remained at about 13.0oC until cooling of the surface and turnover forced warmer water deeper into the reservoir near the end of September resulting in outlet temperatures of about 14oC (57.2oF). The baseline simulation demonstrates that 17-18oC water sufficient to meet the BiOp temperature criteria at Frazer Rapids is present in the reservoir for several months near the surface; however, it cannot be released through the powerhouse in its existing configuration in a typical year.
3.2.2 Annual Inflow The three annual lake inflow or volume scenarios were evaluated while holding the
meteorological data constant. The three scenarios represent the 90th percentile of inflow (1982), median inflow (1998), and the 10th percentile of inflow (1988). Lake inflow temperature data at Landusky, MT, and van Norman, MT was not recorded during the simulation dataset years, so inflow temperatures synthesized from 2004 and 2005 were used in these simulations and all subsequent simulations in the absence of actual inflow temperatures.
Based on the plot of dam release temperature in Figure 19, it appears the annual lake inflow or volume does not have a major impact on dam discharge temperature. Simulated outflow temperatures ranged from about 12 to 14oC from mid-July through September, then reached a maximum of about 15oC at lake turnover in early October. Also annual inflow variations do not have a major impact on lake temperatures near the spillway crest elevation (Figure 20).
3.2.3 Annual Outflow The three annual lake outflow scenarios were evaluated while holding the meteorological
data constant. The three scenarios represented the 90th percentile of outflow (1979), median outflow (1998), and the 10th percentile of outflow (2002).
Based on the plot of dam release temperature in Figure 21, the 10th percentile outflow year produced about 2oC higher discharge temperatures than both the 90th percentile outflow and median outflow years, which were similar to outflow temperatures simulated in the annual inflow scenarios. This may be explained by the lower pool elevation (676.1 m/2218.3 ft) of the 10th percentile outflow year (2002) compared to the higher pool elevations in the median (1998) and 90th percentile (1979) years which were 681.9m (2237.1 ft) and 683.9 m (2243.9 ft),
Water Quality Modeling Report U.S. Army Corps of Engineers Fort Peck Lake Omaha District
20
respectively. Lower pool elevations allow the thermocline, which is the transition zone between cooler hypolimnion temperatures and warmer epilimnion temperatures, to push to lower elevations in the reservoir closer to the powerhouse intake structure at elevation 638.6 m (2095.0 ft). Temperatures in the 10th percentile year simulation reached maximums of about 16.5oC at lake turnover from late September to early October.
At the spillway crest elevation median outflow scenario temperatures were also slightly warmer than high outflow scenario temperatures (Figure 22). The pool elevation in the low outflow scenario fell below the spillway crest elevation; therefore, lake temperatures at the spillway elevation crest were not computed.
3.2.4 Pool Elevation The three average annual pool elevation scenarios were evaluated while holding the
meteorological data constant. The three years represented the 90th percentile pool (1997), median pool (1988), and the 10th percentile pool (2004).
In the plot of dam release temperature in Figure 23, the 10th percentile outflow scenario (2004) produced 2 to 3oC higher discharge temperatures than both the 90th percentile outflow and median outflow scenarios, which were similar to outflow temperatures in the previous two scenarios. Average annual pool elevations were 683.1 m (2241.3 ft), 679.4 m (2229.1 ft), and 671.4 m (2202.7 ft) for the 90th percentile, median, and 10th percentile scenarios, respectively. The bottom of the simulated thermoclines on August 16 (jday = 228) were 645.6 m (2118.1 ft), 644.0 m (2112.8 ft), and 638.3 m (2094.2 ft) for the 90th percentile, median, and 10th percentile scenarios respectively. The lake outlet in the simulations is defined at elevation 641.7 m (2105.3 ft), so only the 10th percentile thermocline was below the outlet elevation. This explains why the 10th percentile outlet temperatures were warmer than the 90th percentile and median temperatures, which were quite similar because water below the thermocline is moderately isothermal. In general it appears that pool elevation impacts dam release temperature the most when elevations are below the median elevation.
At the spillway crest elevation, median elevation scenario temperatures were slightly warmer than high elevation scenario temperatures (Figure 24). The pool elevation in the low elevation scenario was below the spillway crest elevation; therefore, lake temperatures at the spillway crest elevation were not computed.
3.2.5 Environmental Temperature Three average environmental temperature scenarios were evaluated using 1998
inflow/outflow/ elevation data. The scenarios were represented by the 90th percentile temperature conditions (1998), the median temperature condition (2000), and the 10th percentile temperature condition (2004).
In the plot of dam release temperature in Figure 25, the 90th percentile temperature scenario (1998) produced 2 to 3oC higher outflow temperatures than both the 10th percentile outflow and median outflow scenarios, which were similar to outflow temperatures in the previous three scenarios. The 90th percentile scenario (1998) was one of the five warmest years since 1943 at the Glasgow, MT International Airport. Since lake hydrodynamics were the same in all three simulations, it appears that high environmental temperatures are needed to drive the thermocline deeper into the reservoir.
Water Quality Modeling Report U.S. Army Corps of Engineers Fort Peck Lake Omaha District
21
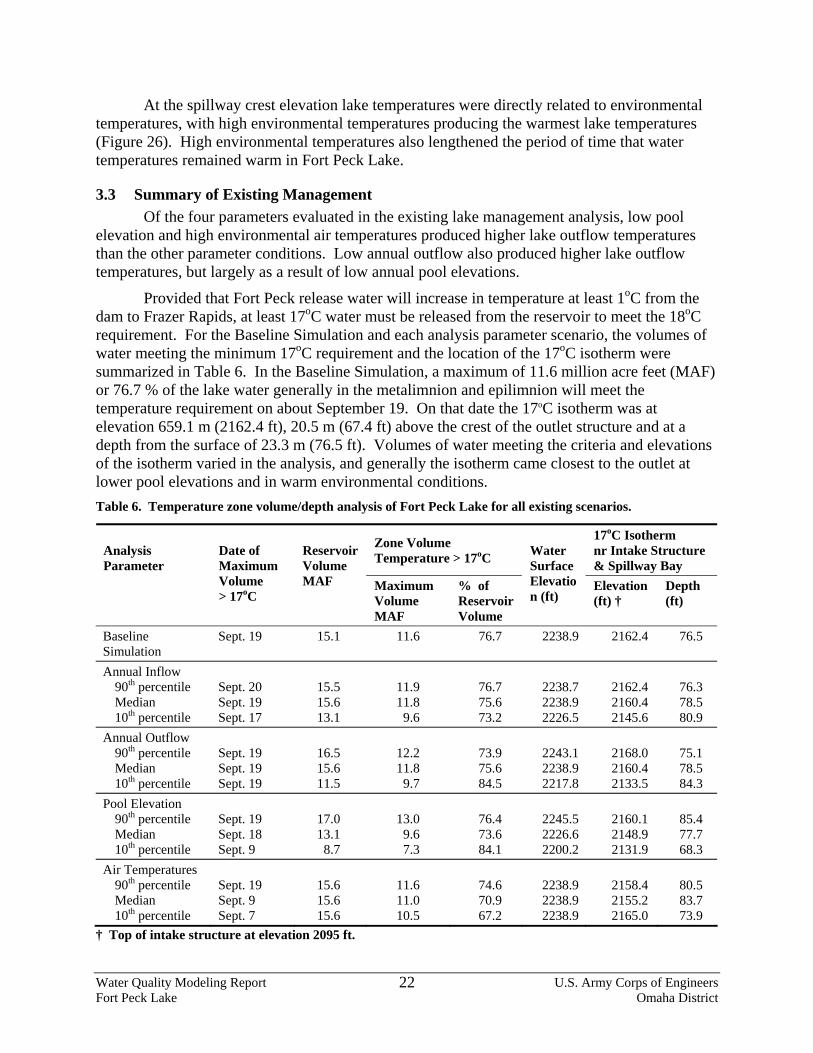
At the spillway crest elevation lake temperatures were directly related to environmental temperatures, with high environmental temperatures producing the warmest lake temperatures (Figure 26). High environmental temperatures also lengthened the period of time that water temperatures remained warm in Fort Peck Lake.
3.3 Summary of Existing Management Of the four parameters evaluated in the existing lake management analysis, low pool
elevation and high environmental air temperatures produced higher lake outflow temperatures than the other parameter conditions. Low annual outflow also produced higher lake outflow temperatures, but largely as a result of low annual pool elevations.
Provided that Fort Peck release water will increase in temperature at least 1oC from the dam to Frazer Rapids, at least 17oC water must be released from the reservoir to meet the 18oC requirement. For the Baseline Simulation and each analysis parameter scenario, the volumes of water meeting the minimum 17oC requirement and the location of the 17oC isotherm were summarized in Table 6. In the Baseline Simulation, a maximum of 11.6 million acre feet (MAF) or 76.7 % of the lake water generally in the metalimnion and epilimnion will meet the temperature requirement on about September 19. On that date the 17oC isotherm was at elevation 659.1 m (2162.4 ft), 20.5 m (67.4 ft) above the crest of the outlet structure and at a depth from the surface of 23.3 m (76.5 ft). Volumes of water meeting the criteria and elevations of the isotherm varied in the analysis, and generally the isotherm came closest to the outlet at lower pool elevations and in warm environmental conditions. Table 6. Temperature zone volume/depth analysis of Fort Peck Lake for all existing scenarios.
† Top of intake structure at elevation 2095 ft.
Zone Volume Temperature > 17oC
17oC Isotherm nr Intake Structure & Spillway Bay
Analysis Parameter
Date of Maximum Volume > 17oC
Reservoir Volume MAF Maximum
Volume MAF
% of Reservoir Volume
Water Surface Elevation (ft)
Elevation (ft) †
Depth (ft)
Baseline Simulation
Sept. 19 15.1 11.6 76.7 2238.9 2162.4 76.5
Annual Inflow 90th percentile Median 10th percentile
Sept. 20 Sept. 19 Sept. 17
15.5 15.6 13.1
11.9 11.8 9.6
76.7 75.6 73.2
2238.7 2238.9 2226.5
2162.4 2160.4 2145.6
76.3 78.5 80.9
Annual Outflow 90th percentile Median 10th percentile
Sept. 19 Sept. 19 Sept. 19
16.5 15.6 11.5
12.2 11.8 9.7
73.9 75.6 84.5
2243.1 2238.9 2217.8
2168.0 2160.4 2133.5
75.1 78.5 84.3
Pool Elevation 90th percentile Median 10th percentile
Sept. 19 Sept. 18 Sept. 9
17.0 13.1 8.7
13.0 9.6 7.3
76.4 73.6 84.1
2245.5 2226.6 2200.2
2160.1 2148.9 2131.9
85.4 77.7 68.3
Air Temperatures 90th percentile Median 10th percentile
Sept. 19 Sept. 9 Sept. 7
15.6 15.6 15.6
11.6 11.0 10.5
74.6 70.9 67.2
2238.9 2238.9 2238.9
2158.4 2155.2 2165.0
80.5 83.7 73.9
Water Quality Modeling Report U.S. Army Corps of Engineers Fort Peck Lake Omaha District
22
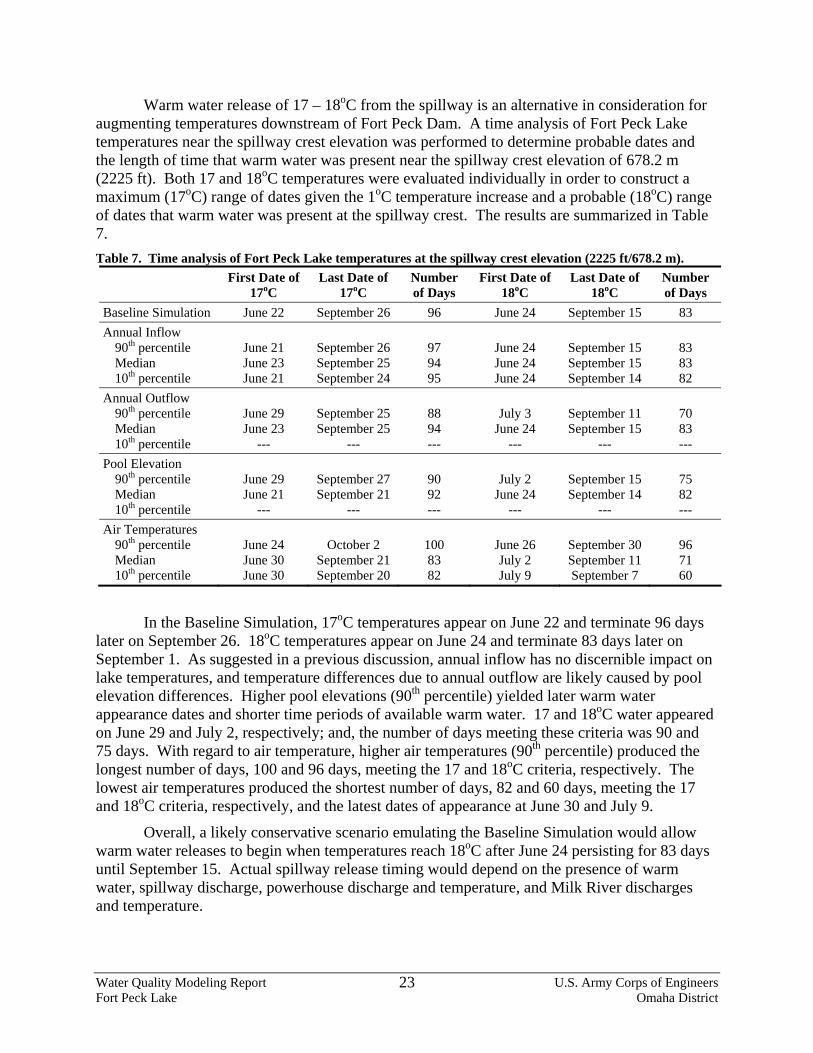
Warm water release of 17 – 18oC from the spillway is an alternative in consideration for augmenting temperatures downstream of Fort Peck Dam. A time analysis of Fort Peck Lake temperatures near the spillway crest elevation was performed to determine probable dates and the length of time that warm water was present near the spillway crest elevation of 678.2 m (2225 ft). Both 17 and 18oC temperatures were evaluated individually in order to construct a maximum (17oC) range of dates given the 1oC temperature increase and a probable (18oC) range of dates that warm water was present at the spillway crest. The results are summarized in Table 7. Table 7. Time analysis of Fort Peck Lake temperatures at the spillway crest elevation (2225 ft/678.2 m).
First Date of 17oC
Last Date of 17oC
Number of Days
First Date of 18oC
Last Date of 18oC
Number of Days
Baseline Simulation June 22 September 26 96 June 24 September 15 83 Annual Inflow 90th percentile Median 10th percentile
June 21 June 23 June 21
September 26 September 25 September 24
97 94 95
June 24 June 24 June 24
September 15 September 15 September 14
83 83 82
Annual Outflow 90th percentile Median 10th percentile
June 29 June 23
---
September 25 September 25
---
88 94 ---
July 3
June 24 ---
September 11 September 15
---
70 83 ---
Pool Elevation 90th percentile Median 10th percentile
June 29 June 21
---
September 27 September 21
---
90 92 ---
July 2
June 24 ---
September 15 September 14
---
75 82 ---
Air Temperatures 90th percentile Median 10th percentile
June 24 June 30 June 30
October 2
September 21 September 20
100 83 82
June 26 July 2 July 9
September 30 September 11 September 7
96 71 60
In the Baseline Simulation, 17oC temperatures appear on June 22 and terminate 96 days later on September 26. 18oC temperatures appear on June 24 and terminate 83 days later on September 1. As suggested in a previous discussion, annual inflow has no discernible impact on lake temperatures, and temperature differences due to annual outflow are likely caused by pool elevation differences. Higher pool elevations (90th percentile) yielded later warm water appearance dates and shorter time periods of available warm water. 17 and 18oC water appeared on June 29 and July 2, respectively; and, the number of days meeting these criteria was 90 and 75 days. With regard to air temperature, higher air temperatures (90th percentile) produced the longest number of days, 100 and 96 days, meeting the 17 and 18oC criteria, respectively. The lowest air temperatures produced the shortest number of days, 82 and 60 days, meeting the 17 and 18oC criteria, respectively, and the latest dates of appearance at June 30 and July 9.
Overall, a likely conservative scenario emulating the Baseline Simulation would allow warm water releases to begin when temperatures reach 18oC after June 24 persisting for 83 days until September 15. Actual spillway release timing would depend on the presence of warm water, spillway discharge, powerhouse discharge and temperature, and Milk River discharges and temperature.
Water Quality Modeling Report U.S. Army Corps of Engineers Fort Peck Lake Omaha District
23
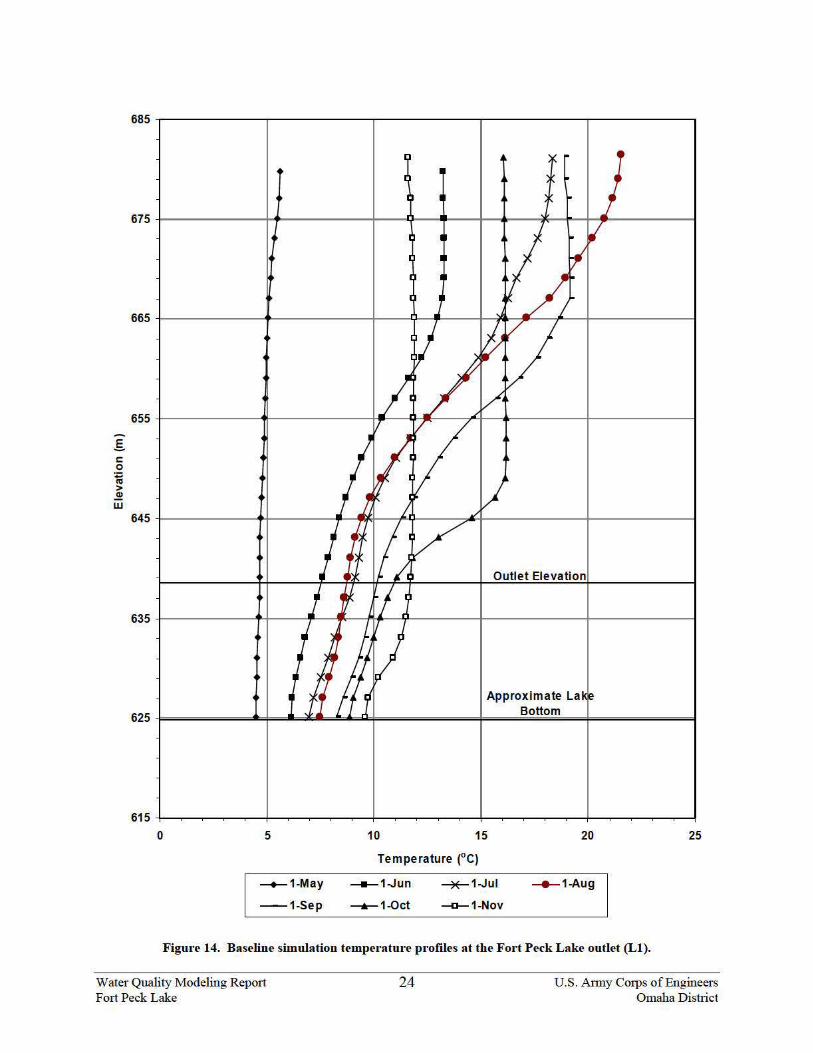
E. c: 0 :;:: ., > ~ w
685 ~-----------r-----------r-----------,------------r-----------,
655
645
Outlet Elevation
Approximate La
625 ~==========~==-=~~~~*===========~=====B=ott=o=m====~==========9
615 0 5 10 15 20 25
Temperature (0 C)
--+- 1-May - 1..Jun ~1..Jul _._1-Aug
--1-Sep ---a-1-0ct --o-- 1-Nov
Figure 14. Baseline simulation temperatm·e profiles at the Fort Peck Lake outlet (Ll).
Water Quality Modeling Repot1 Fmt Peck Lake
24 U.S. Anny Corps of Engineers Omaha District
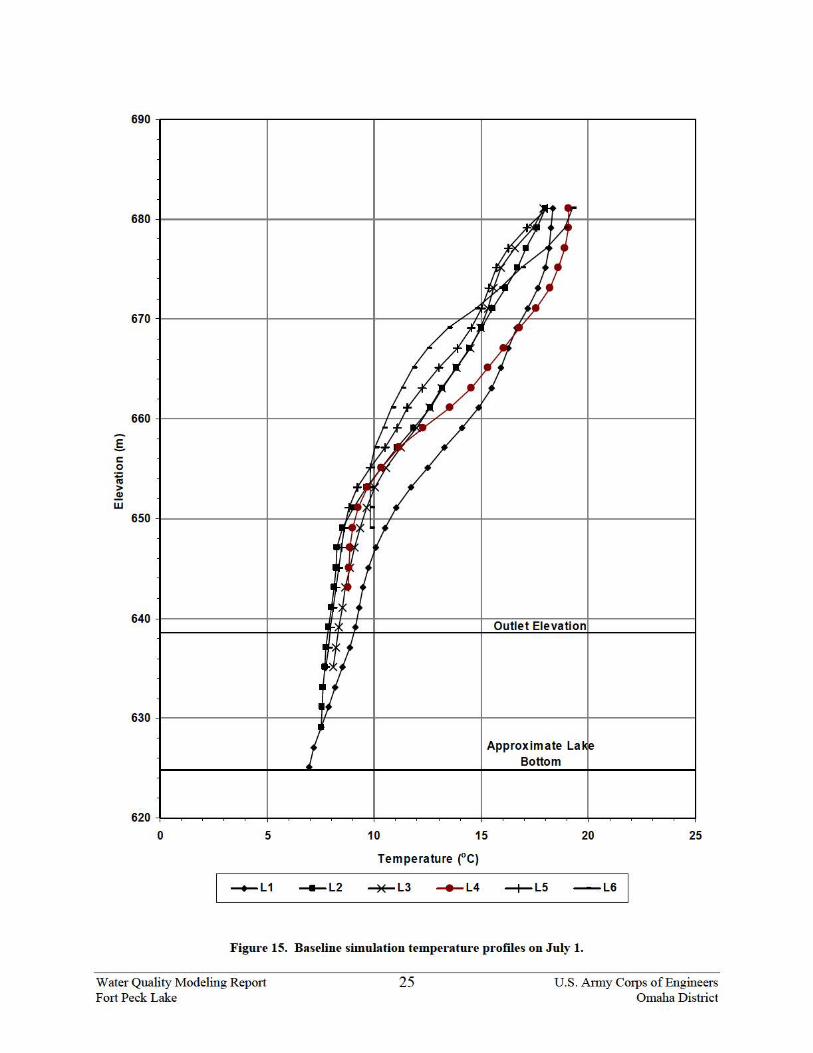
.5. c 0 :;; IV > ~ w
690~-----------r-----------r-----------,------------r-----------,
660
650
630 +------------r----~-----+-----------;------------r-----------;
0 5
-L2
Approximate La Bottom
10 15 20
Temperature (0 C)
- L4 -L6
Figure 15. Baseline simulation temperature profiles on July 1.
25
Water Quality Modeling Repmt Fmt Peck Lake
25 U.S. Anny Corps of Engineers Omaha District
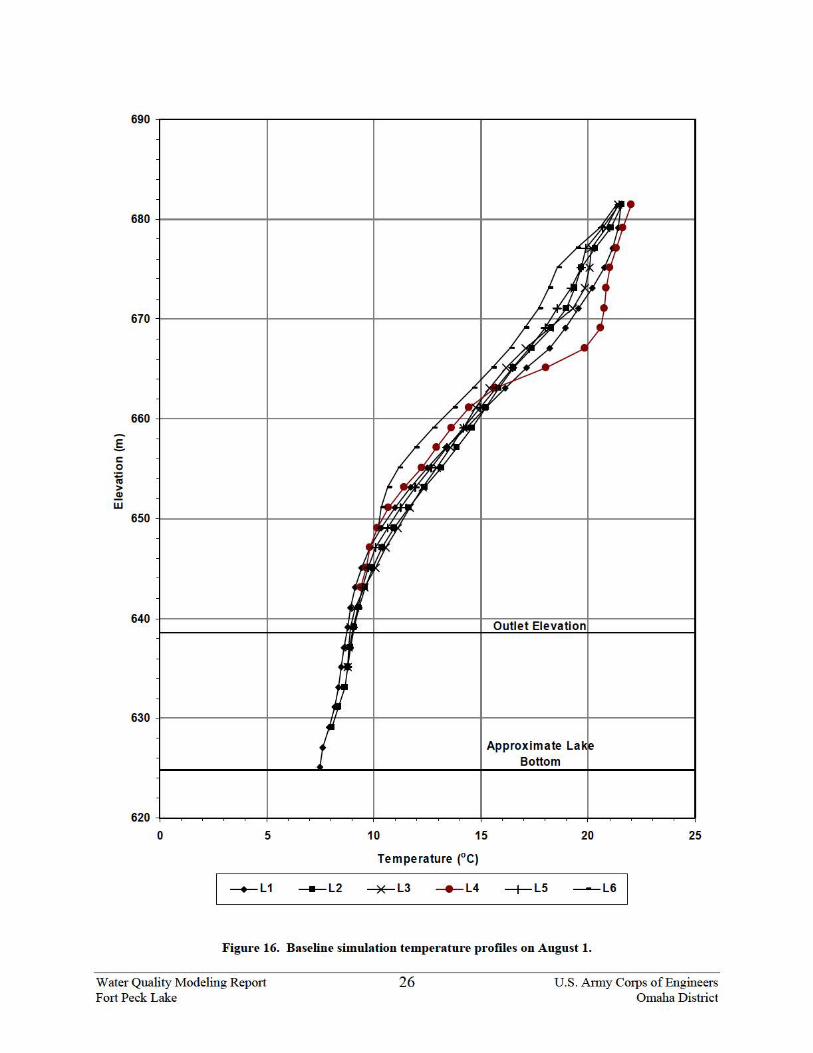
.§.. c 0 :;::; IV > ..2 w
690 ~-----------r-----------r-----------,------------r-----------,
660
650
640 +-------------4---------~~4-------------4-~0~u~t~le~t~E~Ie_v_a~t~io-n4-----------~
630 +------------r------~---+-----------;------------r---------~
0 5
Approximate La Bottom
10 15 20
Temperature (0 C)
_._ L4 -+-L5 -L6
Figure 16. Baseline simulation temperature profiles on August 1.
25
Water Quality Modeling Repmt Fmt Peck Lake
26 U.S. Anny Corps of Engineers Omaha District
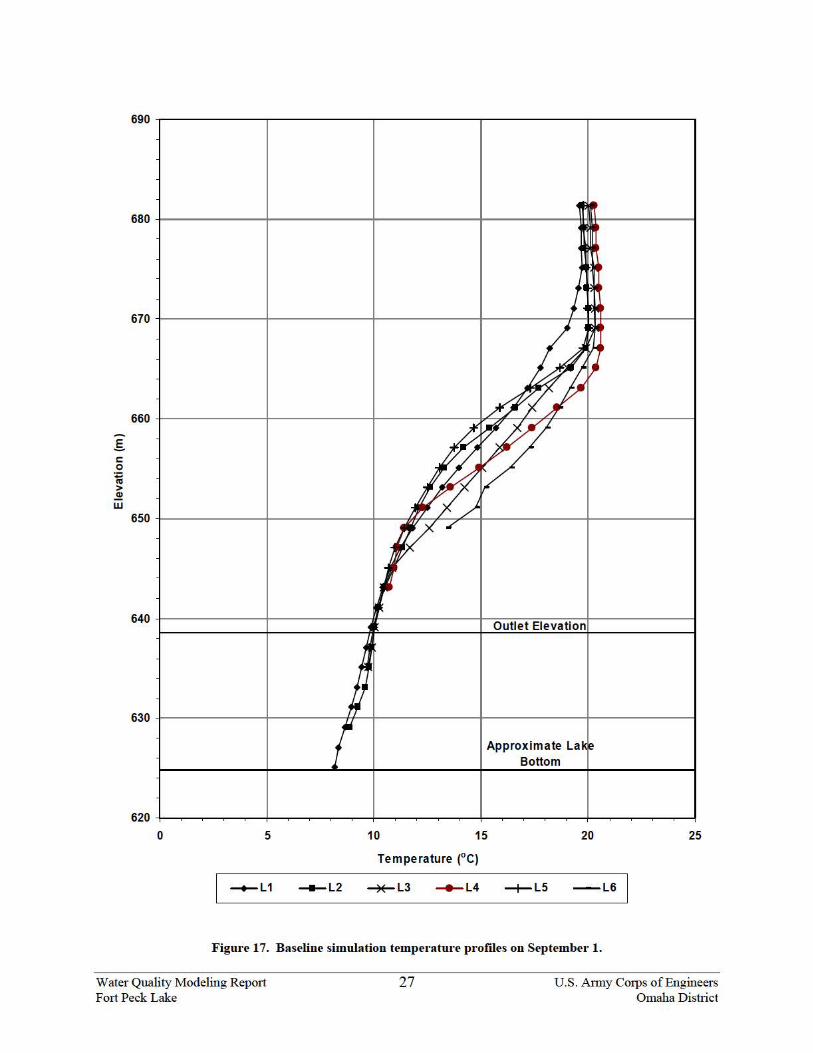
.§.. c 0 :;::; IV > ..2 w
690~-----------r-----------r-----------,------------r-----------,
680 +-----------~-----------+----------~-----------*~--------~
660
650
640 +-------------4-------------~------------4-~0~u~t~le~t~E~Ie_v_a~t~io-n4-----------~
630 +-----------~--------~-+----------~------------r---------~
0 5
~L1
Approximate La Bottom
10 15 20
Temperature (0 C)
~L3 ~L4 ~L5 -L6
Figure 17. Baseline simulation temperature profiles on September 1.
25
Water Quality Modeling Repmt Fmt Peck Lake
27 U.S. Anny Corps of Engineers Omaha District
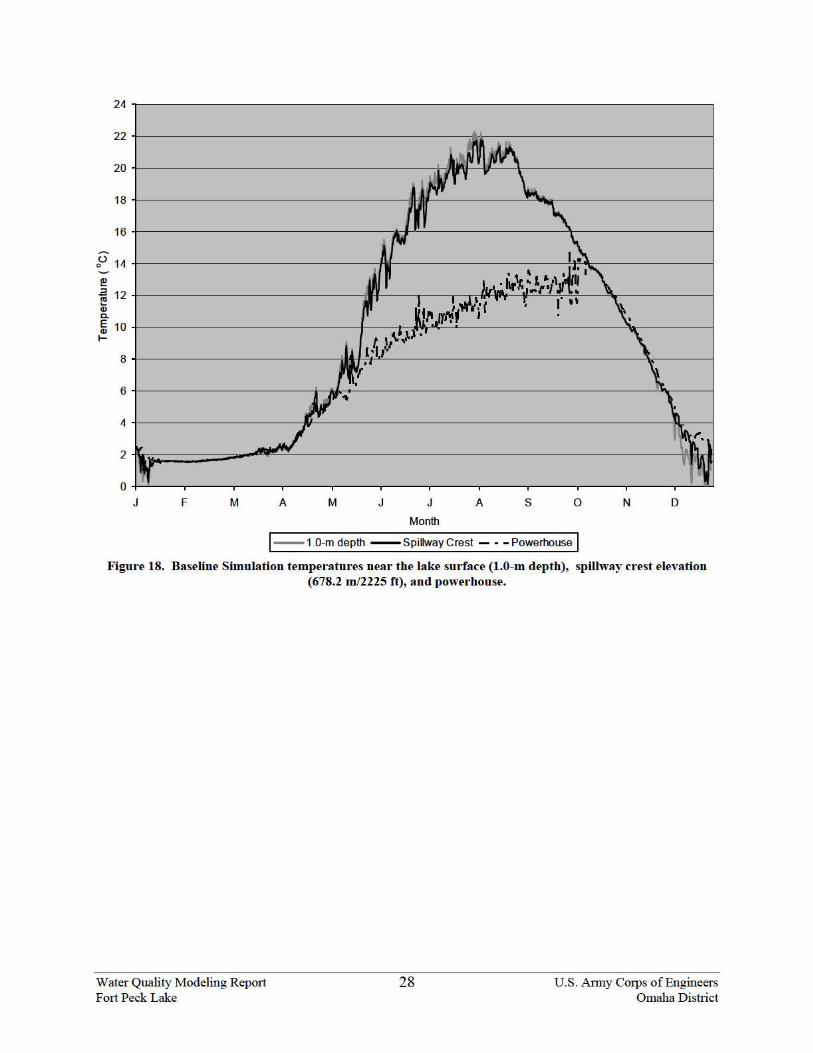
24
22
20
18
16
~
p 14
2! ~ 12 Qj a. E 10 Q)
1-
8
6
4
2
0 J F M A M J J
Month
A s 0
1- 1.0-m depth - Spi llway Crest -· - Powertlouse I
N D
Figure 18. Baseline Simulation temperatures neat· the lake surface (1.0-m depth), spillway crest elevation (678.2 m/2225 ft), and powerhouse.
Water Quality Modeling Repmt Fmt Peck Lake
28 U.S. Anny Corps of Engineers Omaha District
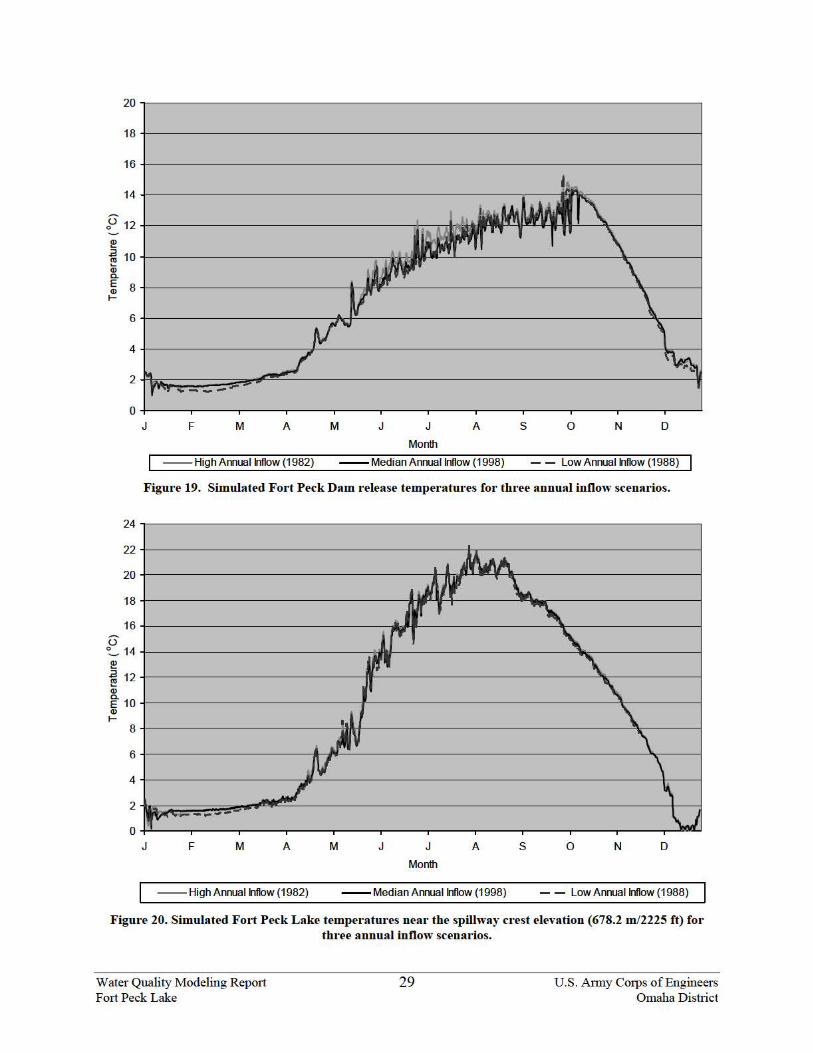
20
18
16
14
P' 12
~ ~ 10 Q; a. E 8 Q) 1-
6
4
2 ____ .,.
0 J F M A
--High Amual tl11ow (1982)
M J J
Month
A
--Median Annual Inflow (1998)
s 0 N D
-- Low Annual t lflow (1988)
Figure 19. Simulated Fort Peck Dam release temperatures for three annual inflow scenar ios.
24
22
20
18
16 u ~ 14 ~
~ 12 Q)
g- 10 Q)
1-8
6
4
2 .....-- .. .., .. 0
J F M A
--High Annual t lflow (1982)
M J J
Month
A
--Median Annual tlflow (1998)
s 0 N D
- - Low Annual Inflow (1988)
Figure 20. Simulated Fot·t Peck Lake temperatures near the spillway crest elevation (678.2 m/2225 ft) for three annual inflow scenarios.
Water Quality Modeling Repmt Fmt Peck Lake
29 U.S. Anny Corps of Engineers Omaha District
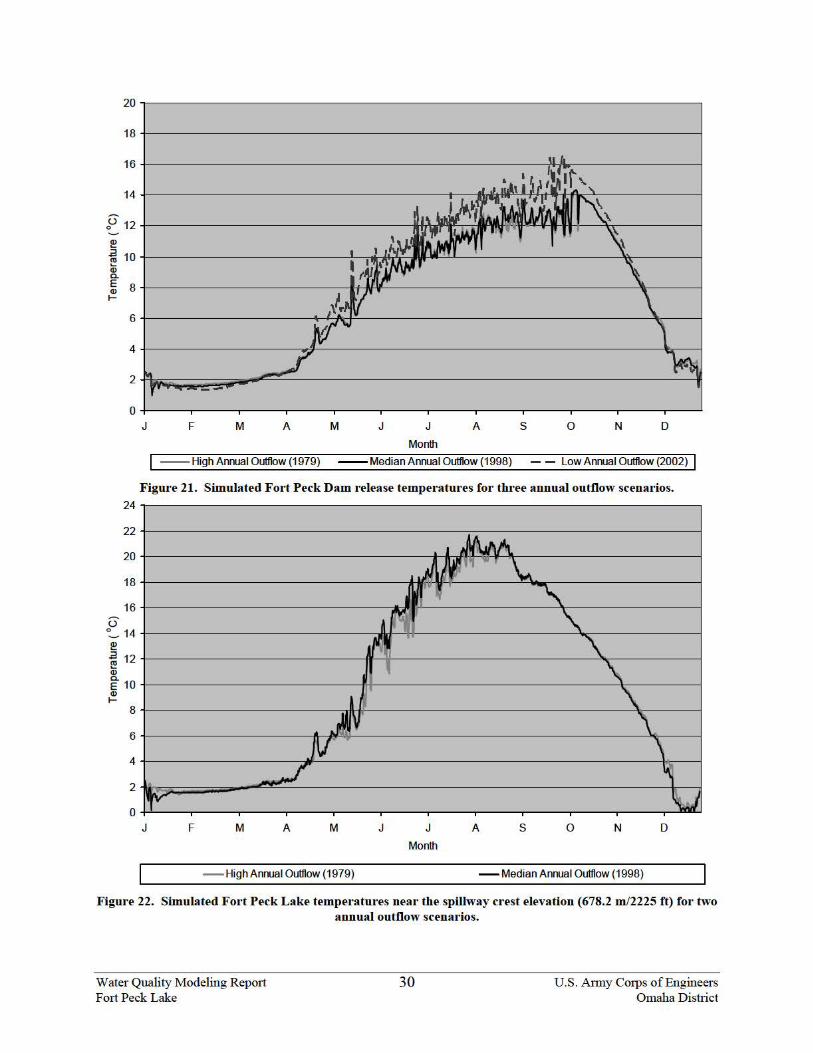
20
18
16
14
}' 12
~ ~ 10 Q; a. E 8 Q) 1-
6
4
2
0 J F M A M J J
Month A s 0 N D
--High Annual Outflow (1979) --Median Annual Outflow (1998) - - Low Annual Outflow (2002) I Figure 21. Simulated Fort Peck Dam release temperatures fot· three annual outflow scenarios.
24~-------------------------------------------------------------------.
u ~ 14+-------------------------------,&~~----------------------~------------~ ~ ~ 12 +---------------------------~~~--------------------------~----------~ l!! Q)
E1o +-----------------------------~--------------------------------~r-------~ Q) 1-
J F M A M J
- High Annual Outflow (1979)
J
Month A s 0 N
-Median Annual Outflow (1998)
D
Figure 22. Simulated Fort Peck Lake temperatures neat· the spillway crest elevation (678.2 m/2225 ft) for two annual outflow scenarios.
Water Quality Modeling Repmt Fmt Peck Lake
30 U.S. Anny Corps of Engineers Omaha District
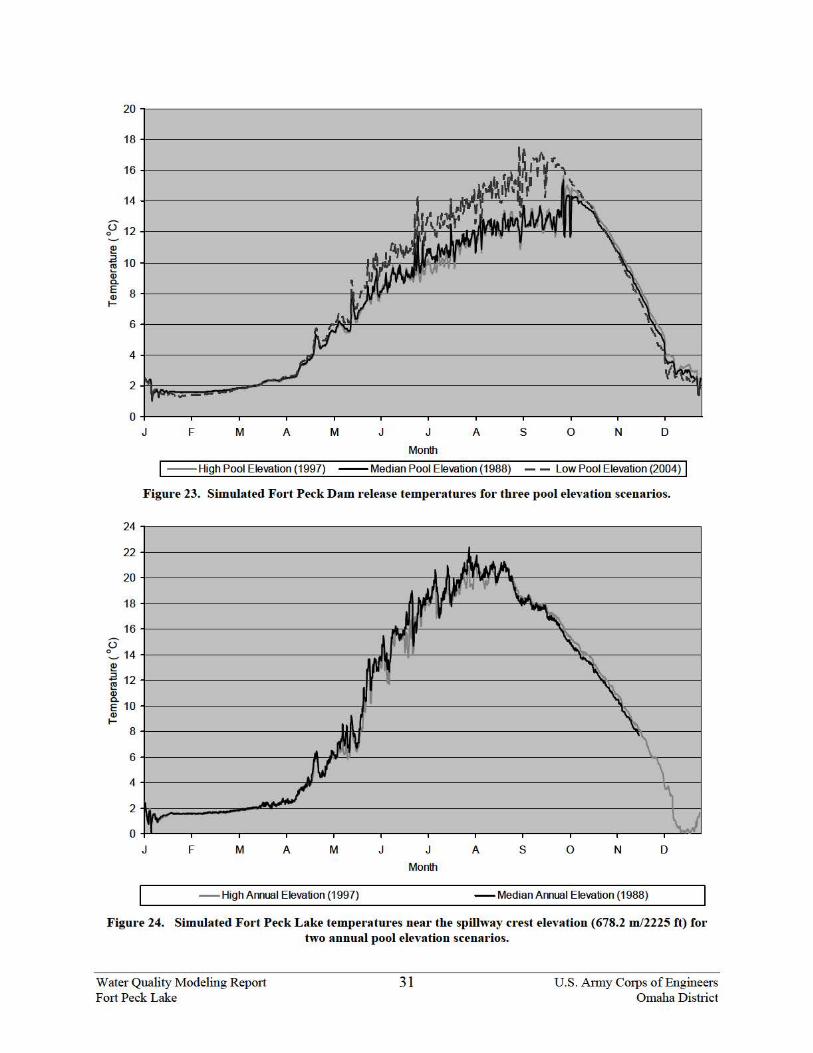
20
18
16
14
~ 12
~ ~ 10 Q; a. E 8 Q) 1-
6
4
2
0 J F M A M J J A s 0 N D
Month
I --High Pool Elevation (1997) --Median Pool Elevation (1988) -- Low Pool Elevation (2004) I Figure 23. Simulated Fort Peck Dam release temperatures fo1· three pool elevation scenarios.
24
22
20
18
16 u ~ 14 ~ .a 12 l!! Q)
E" 10 Q) 1-
8
6
4
2
0 J F M A M
- High Amual Elevation (1997)
J J
Month
A s 0 N D
- Median Amual Elevation (1988)
Figure 24. Simulated Fort Peck Lake temperatures nea1· the spillway crest elevation (678.2 m/2225 ft) for two annual pool elevation scenarios.
Water Quality Modeling Repmt Fmt Peck Lake
31 U.S. Anny Corps of Engineers Omaha District
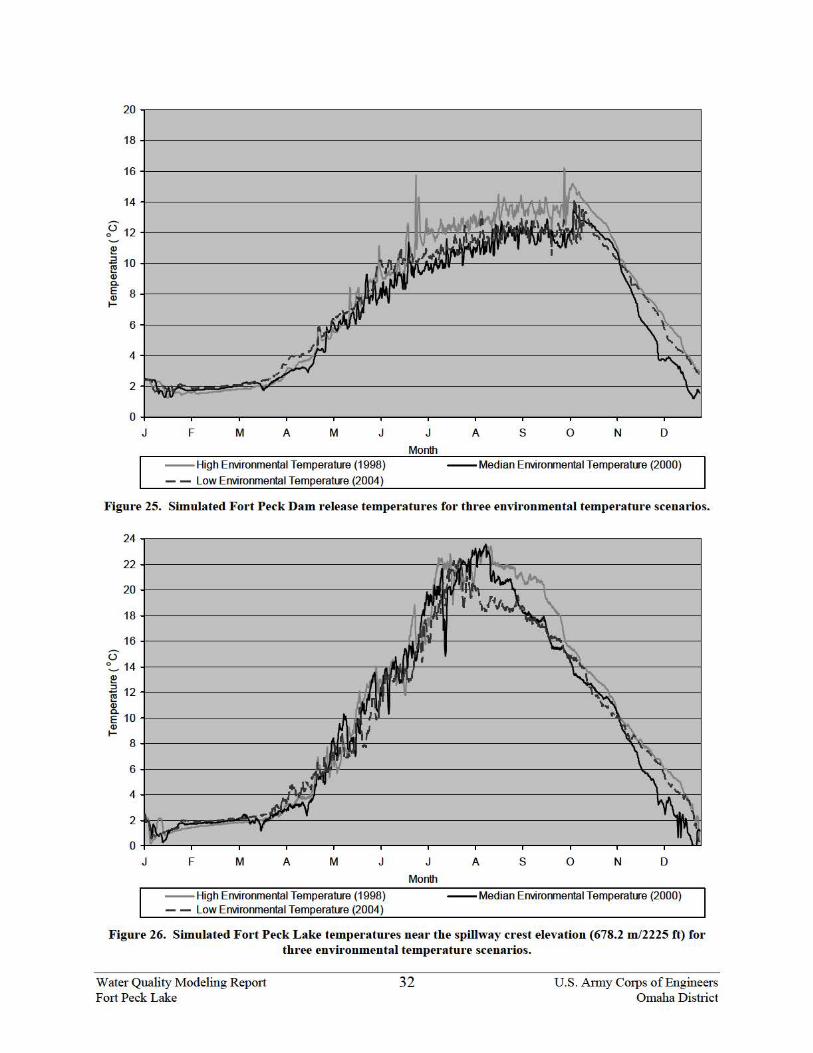
20
18
16
14
p 12
l!! .a 10 !!! Q) a. E 8 Q) 1-
6
4
2
0
J F M A M J
--High Environmental Temperature (1998)
-- Low Environmental Temperature (2004)
J
Month
A s 0 N D
--Median Environmental Temperature (2000)
Figure 25. Simulated Fort Peck Dam release temperatures for three environmental temperature scenarios.
24
22
20
18
16 u
'!..... 14 l!! 2 12 !!! Q)
E" 10 Q) 1-
8
6
4
2
0
J F M A M J
--High Environmental Temperature (1998) -- Low Environmental Temperature (2004)
J
Month
A s 0 N D
--Median Environmental Temperature (2000)
Figure 26. Simulated Fort Peck Lake temperatures near the spillway crest elevation (678.2 m/2225 ft) for three environmental temperature scenarios.
Water Quality Modeling Repmt Fmt Peck Lake
32 U.S. Anny Corps of Engineers Omaha District
3.4 River Temperature Analysis River scenarios were based on Fort Peck Dam discharge and temperature conditions, and
environmental air temperatures during the simulation year. Simulations in each category used measured Fort Peck Dam discharge, simulated discharge temperatures from the calibrated lake model, and measured discharge at the Milk River and the Missouri River at Culbertson, MT. Discharge temperatures at the Milk River and Culbertson, MT were available through USGS measurements performed from May 17 to October 9, 2001 to 2006, but in other years data was sparse.
The datasets chosen for the simulations is summarized in Table 8. Calendar year 1994 worked well as the median temperature meteorological year, though year 2000 was used as the median case in the Air Temperature category. In addition, a baseline simulation using 1998 simulated lake conditions with 1994 meteorology was performed to represent normal river conditions. Table 8. Missouri River downstream of Fort Peck - simulations and datasets used in the existing management analysis.
Analysis Parameter Variation Inflow/Outflow/ Elevation Year
Meteorological Year
Baseline Simulation 1998 1994 Annual Discharge 90th percentile
Median 10th percentile
1979 1998 2002
1994
Pool Elevation 90th percentile Median 10th percentile
1997 1988 2004
1994
Air Temperature Set 90th percentile Median 10th percentile
1998
1998 2000 2004
3.4.1 Typical River Simulation The Baseline Simulation was performed using 1998 hydrodynamic data (Figure 27) and
1994 meteorological data. Both 1998 Milk River and Fort Peck Dam discharges were used in the simulation. During the 1998 calendar year, the Fort Peck pool elevation averaged 681.9 m (2237.1 ft), and the average annual outflow was 252 cms (8,900 cfs). Since the pool elevation was below the 3rd quartile level and annual outflow was near the median value, it was believed the 1998 hydrodynamics were representative of a typical operational year. Milk River discharges in 1998 were generally low (Figure 27). It did not exhibit spring plains snowmelt runoff, but only one major runoff event in early July.
Missouri River discharge temperatures (Figure 28) used simulated Fort Peck Dam release temperatures from the Baseline Simulation at the upstream river model boundary. Milk River temperatures were assembled from May to October 1988 observed data, and other measured data for the remainder of the year. Since Fort Peck Dam releases generally dominate downstream discharges, the Milk River discharge influenced the Milk-Missouri flow-weighted discharge temperatures only during the July runoff event.
Flow-weighted Missouri River inflow temperatures do not exceed 15oC during the simulation year. At Frazer Rapids, temperatures increase several degrees throughout the summer
Water Quality Modeling Report U.S. Army Corps of Engineers Fort Peck Lake Omaha District
33
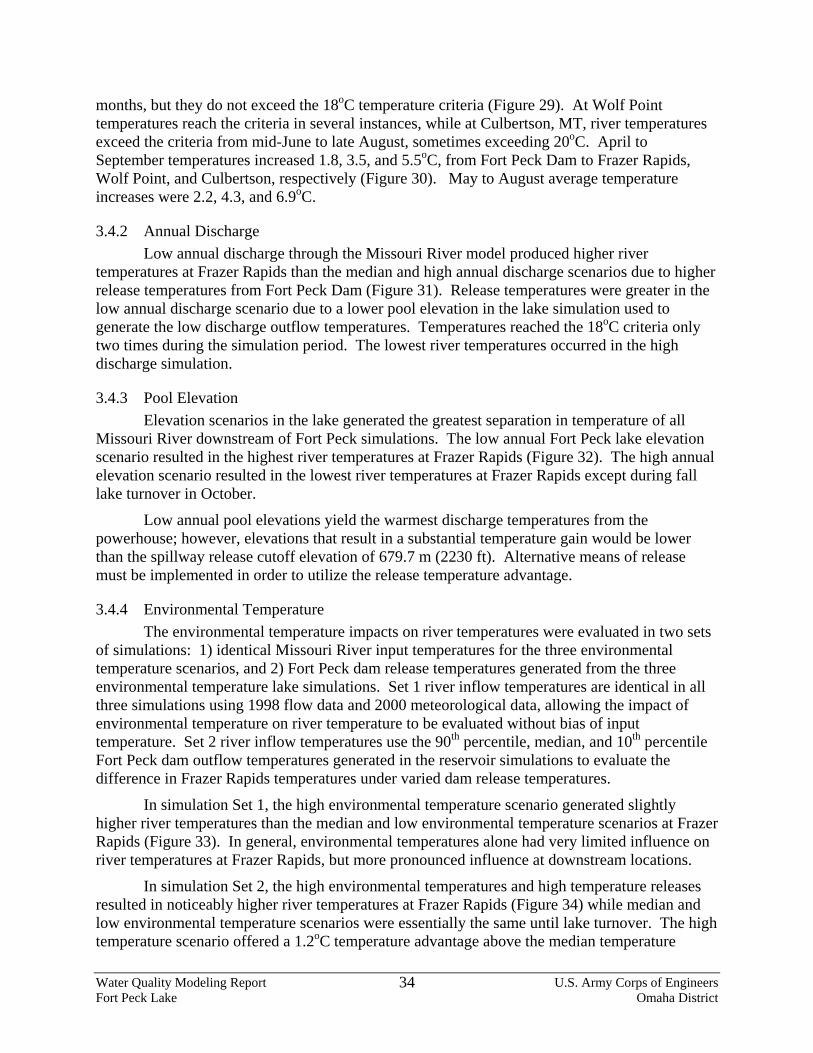
months, but they do not exceed the 18oC temperature criteria (Figure 29). At Wolf Point temperatures reach the criteria in several instances, while at Culbertson, MT, river temperatures exceed the criteria from mid-June to late August, sometimes exceeding 20oC. April to September temperatures increased 1.8, 3.5, and 5.5oC, from Fort Peck Dam to Frazer Rapids, Wolf Point, and Culbertson, respectively (Figure 30). May to August average temperature increases were 2.2, 4.3, and 6.9oC.
3.4.2 Annual Discharge Low annual discharge through the Missouri River model produced higher river
temperatures at Frazer Rapids than the median and high annual discharge scenarios due to higher release temperatures from Fort Peck Dam (Figure 31). Release temperatures were greater in the low annual discharge scenario due to a lower pool elevation in the lake simulation used to generate the low discharge outflow temperatures. Temperatures reached the 18oC criteria only two times during the simulation period. The lowest river temperatures occurred in the high discharge simulation.
3.4.3 Pool Elevation Elevation scenarios in the lake generated the greatest separation in temperature of all
Missouri River downstream of Fort Peck simulations. The low annual Fort Peck lake elevation scenario resulted in the highest river temperatures at Frazer Rapids (Figure 32). The high annual elevation scenario resulted in the lowest river temperatures at Frazer Rapids except during fall lake turnover in October.
Low annual pool elevations yield the warmest discharge temperatures from the powerhouse; however, elevations that result in a substantial temperature gain would be lower than the spillway release cutoff elevation of 679.7 m (2230 ft). Alternative means of release must be implemented in order to utilize the release temperature advantage.
3.4.4 Environmental Temperature The environmental temperature impacts on river temperatures were evaluated in two sets
of simulations: 1) identical Missouri River input temperatures for the three environmental temperature scenarios, and 2) Fort Peck dam release temperatures generated from the three environmental temperature lake simulations. Set 1 river inflow temperatures are identical in all three simulations using 1998 flow data and 2000 meteorological data, allowing the impact of environmental temperature on river temperature to be evaluated without bias of input temperature. Set 2 river inflow temperatures use the 90th percentile, median, and 10th percentile Fort Peck dam outflow temperatures generated in the reservoir simulations to evaluate the difference in Frazer Rapids temperatures under varied dam release temperatures.
In simulation Set 1, the high environmental temperature scenario generated slightly higher river temperatures than the median and low environmental temperature scenarios at Frazer Rapids (Figure 33). In general, environmental temperatures alone had very limited influence on river temperatures at Frazer Rapids, but more pronounced influence at downstream locations.
In simulation Set 2, the high environmental temperatures and high temperature releases resulted in noticeably higher river temperatures at Frazer Rapids (Figure 34) while median and low environmental temperature scenarios were essentially the same until lake turnover. The high temperature scenario offered a 1.2oC temperature advantage above the median temperature
Water Quality Modeling Report U.S. Army Corps of Engineers Fort Peck Lake Omaha District
34
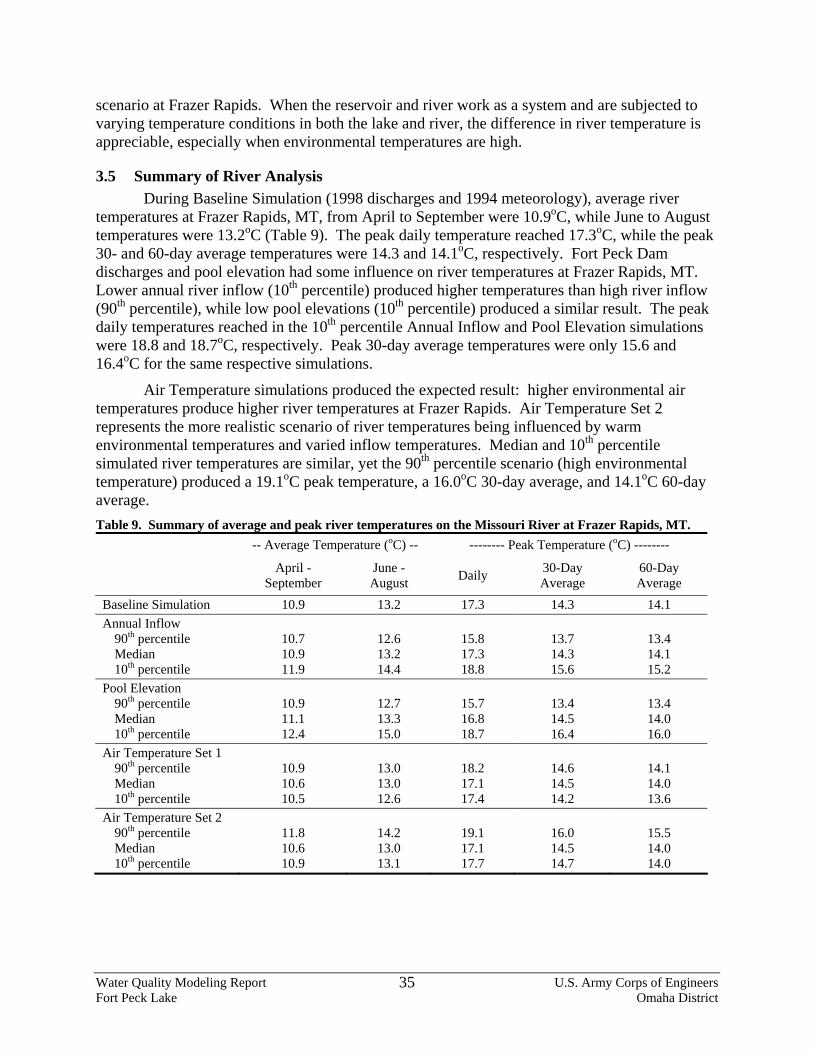
scenario at Frazer Rapids. When the reservoir and river work as a system and are subjected to varying temperature conditions in both the lake and river, the difference in river temperature is appreciable, especially when environmental temperatures are high.
3.5 Summary of River Analysis During Baseline Simulation (1998 discharges and 1994 meteorology), average river
temperatures at Frazer Rapids, MT, from April to September were 10.9oC, while June to August temperatures were 13.2oC (Table 9). The peak daily temperature reached 17.3oC, while the peak 30- and 60-day average temperatures were 14.3 and 14.1oC, respectively. Fort Peck Dam discharges and pool elevation had some influence on river temperatures at Frazer Rapids, MT. Lower annual river inflow (10th percentile) produced higher temperatures than high river inflow (90th percentile), while low pool elevations (10th percentile) produced a similar result. The peak daily temperatures reached in the 10th percentile Annual Inflow and Pool Elevation simulations were 18.8 and 18.7oC, respectively. Peak 30-day average temperatures were only 15.6 and 16.4oC for the same respective simulations.
Air Temperature simulations produced the expected result: higher environmental air temperatures produce higher river temperatures at Frazer Rapids. Air Temperature Set 2 represents the more realistic scenario of river temperatures being influenced by warm environmental temperatures and varied inflow temperatures. Median and 10th percentile simulated river temperatures are similar, yet the 90th percentile scenario (high environmental temperature) produced a 19.1oC peak temperature, a 16.0oC 30-day average, and 14.1oC 60-day average. Table 9. Summary of average and peak river temperatures on the Missouri River at Frazer Rapids, MT.
-- Average Temperature (oC) -- -------- Peak Temperature (oC) --------
April - September
June - August Daily 30-Day
Average 60-Day Average
Baseline Simulation 10.9 13.2 17.3 14.3 14.1 Annual Inflow 90th percentile Median 10th percentile
10.7 10.9 11.9
12.6 13.2 14.4
15.8 17.3 18.8
13.7 14.3 15.6
13.4 14.1 15.2
Pool Elevation 90th percentile Median 10th percentile
10.9 11.1 12.4
12.7 13.3 15.0
15.7 16.8 18.7
13.4 14.5 16.4
13.4 14.0 16.0
Air Temperature Set 1 90th percentile Median 10th percentile
10.9 10.6 10.5
13.0 13.0 12.6
18.2 17.1 17.4
14.6 14.5 14.2
14.1 14.0 13.6
Air Temperature Set 2 90th percentile Median 10th percentile
11.8 10.6 10.9
14.2 13.0 13.1
19.1 17.1 17.7
16.0 14.5 14.7
15.5 14.0 14.0
Water Quality Modeling Report U.S. Army Corps of Engineers Fort Peck Lake Omaha District
35
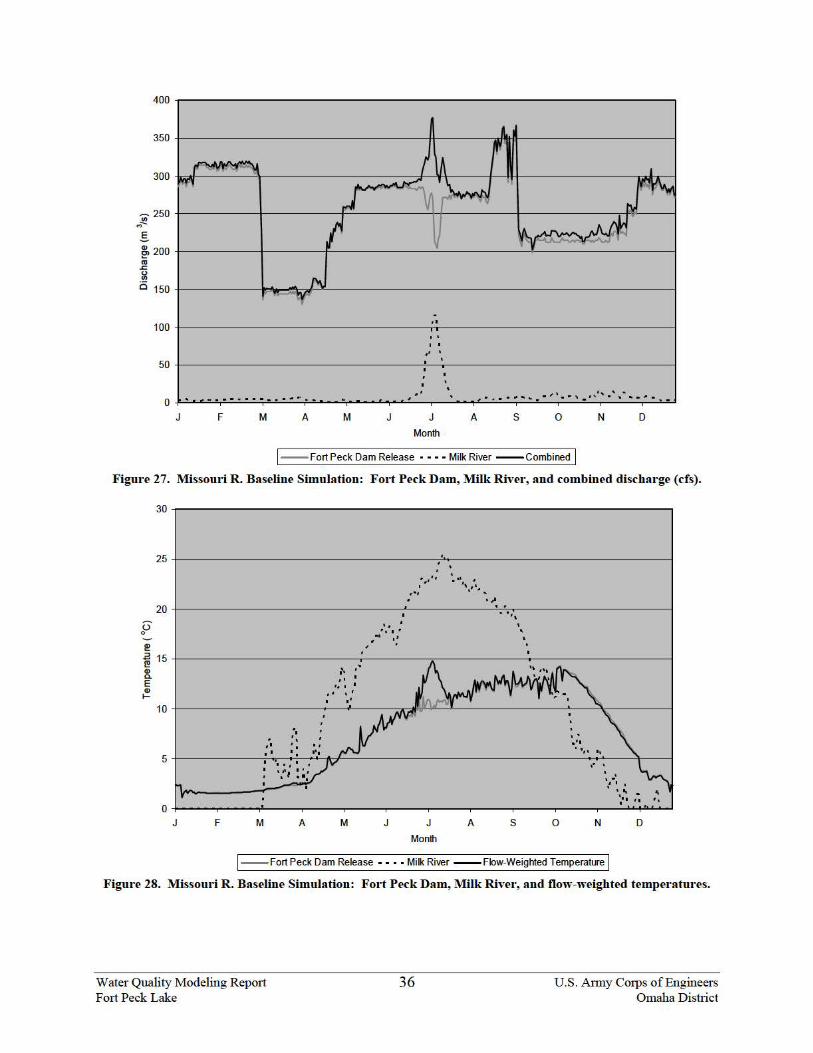
400
350
300
~ 250 "' ,.,-.s ~ 200 .,
.s:: :il a 15o
100
50
0
r -n-"" "t1 ,..., r
t ""' .... trf
. -... . ......... . . . F M A M
A..
I lA If''
I .... ~ '\. ~ - ~ ·"' ·~
n,i
I ~
. o l
I I 0
I I .. . I
. I . I
I . . . . . • '' ·· "' · ., ' . , . .. ......... I' • - .. • • • .
J A s 0 N D
Month
1--Fort Peck Dam Release • ··· Milk River --Combined I Figure 27. Missouri R. Baseline Simulation: F011 Peck Dam, Milk River, and combined discharge (cfs).
u 0
~
30 ~ ............................................................................................................................ _,
25 +-----------------------------------~~--------------------------~
20 .. '• I ' .. . . . , .
... ·· I ... .
' . ~ 15 8. E Q) ~
10
'I . I I
5 ,I
I
.. ... • ' . '
I'
. . . ,•1 .. ,, ..
.- . . . . II I I
'- ' . ... .. 0 +---------~----~~----~--------~--------~----~--------~--------~--------~----~----~~~~
J F M A M A s 0 N D
Month
1--Fort Peck Dam Release ···· Milk River --Flow-Weighted Temperature I Figure 28. Missouri R. Baseline Simulation: Fort Peck Dam, Milk River, and flow-weighted temperatures.
Water Quality Modeling Repmt Fmt Peck Lake
36 U.S. Anny Corps of Engineers Omaha District
18 oC Temperature Criteria
0
5
10
15
20
25
J F M A M J J A S O N D
Month
Tem
pera
ture
(o C)
Frazer Rapids Wolf Point Culbertson Temperature Criteria Figure 29. Missouri R. Baseline Simulation: river temperature at Frazer Rapids, Wolf Point, and
Culbertson, MT.
-10
-5
0
5
10
15
J F M A M J J A S O N DMonth
Tem
pera
ture
Incr
ease
(o C
)
Frazer Rapids Wolf Point Culbertson Figure 30. Missouri R. Baseline Simulation: discharge temperature increases from Fort Peck Dam.
Water Quality Modeling Report U.S. Army Corps of Engineers Fort Peck Lake Omaha District
37
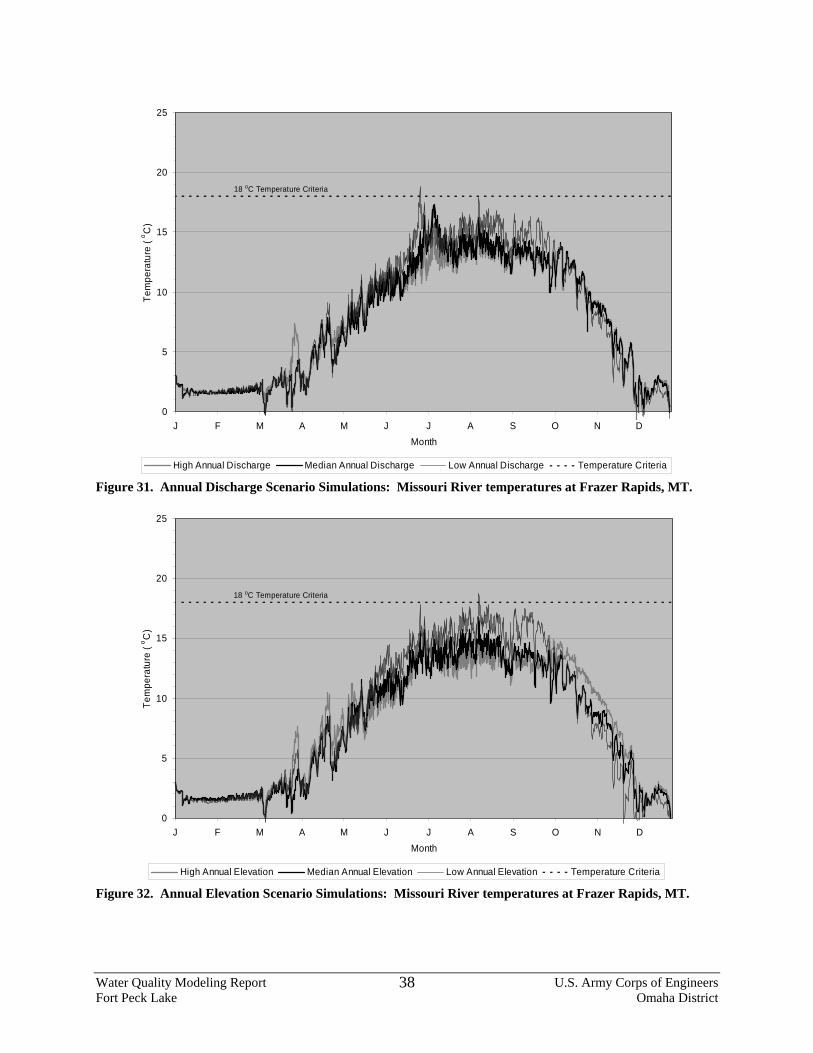
18 oC Temperature Criteria
0
5
10
15
20
25
J F M A M J J A S O N DMonth
Tem
pera
ture
(o C
)
High Annual Discharge Median Annual Discharge Low Annual Discharge Temperature Criteria Figure 31. Annual Discharge Scenario Simulations: Missouri River temperatures at Frazer Rapids, MT.
18 oC Temperature Criteria
0
5
10
15
20
25
J F M A M J J A S O N DMonth
Tem
pera
ture
(o C
)
High Annual Elevation Median Annual Elevation Low Annual Elevation Temperature Criteria Figure 32. Annual Elevation Scenario Simulations: Missouri River temperatures at Frazer Rapids, MT.
Water Quality Modeling Report U.S. Army Corps of Engineers Fort Peck Lake Omaha District
38
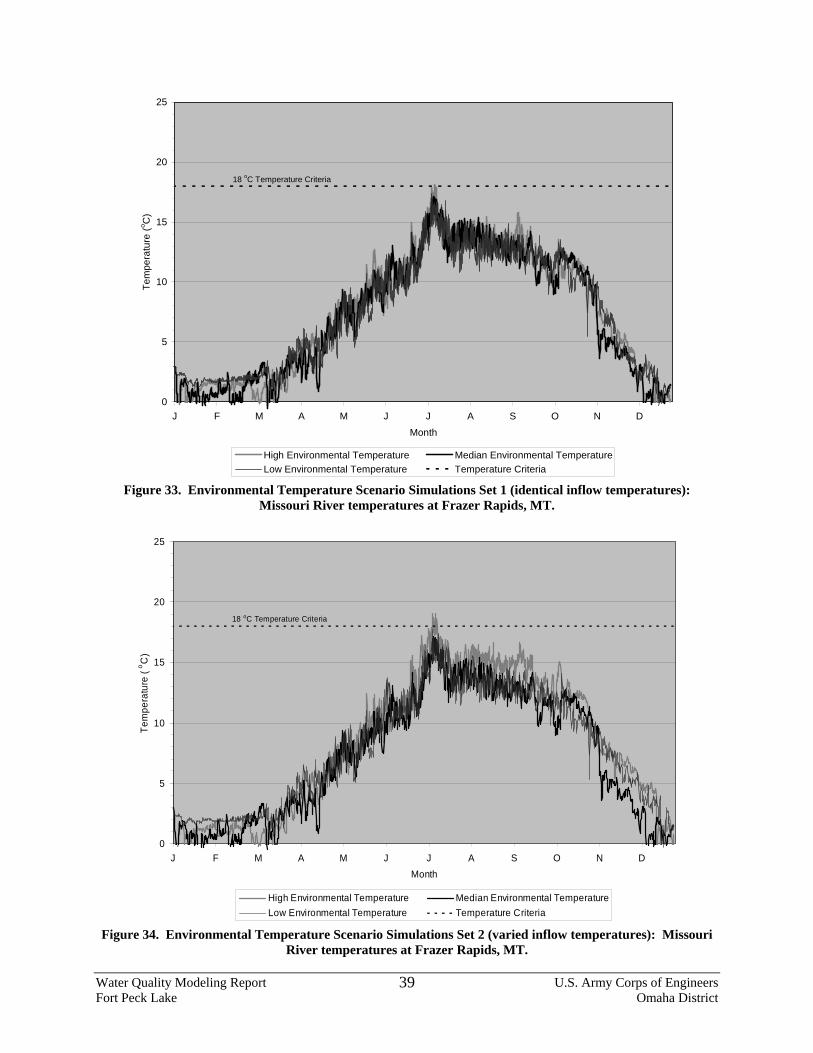
18 oC Temperature Criteria
0
5
10
15
20
25
J F M A M J J A S O N DMonth
Tem
pera
ture
(o C)
High Environmental Temperature Median Environmental TemperatureLow Environmental Temperature Temperature Criteria
Figure 33. Environmental Temperature Scenario Simulations Set 1 (identical inflow temperatures): Missouri River temperatures at Frazer Rapids, MT.
18 oC Temperature Criteria
0
5
10
15
20
25
J F M A M J J A S O N DMonth
Tem
pera
ture
(o C
)
High Environmental Temperature Median Environmental TemperatureLow Environmental Temperature Temperature Criteria
Figure 34. Environmental Temperature Scenario Simulations Set 2 (varied inflow temperatures): Missouri River temperatures at Frazer Rapids, MT.
Water Quality Modeling Report U.S. Army Corps of Engineers Fort Peck Lake Omaha District
39
4 TEMPERATURE ANALYSIS UNDER ALTERNATIVE RELEASES
4.1 Spillway Releases
4.1.1 Spillway Full Test The Spillway Full Test was originally planned to be conducted during the spring of 2002
following the Mini Test. The purpose of the Mini Test was to gain sufficient data on combinations of spillway and powerhouse releases and temperatures to develop discharge temperature relationships for downstream temperature targets; however, a full test can be conducted using the Fort Peck Lake/Missouri River water temperature model. The Full Test will determine what combinations of spillway and powerhouse releases will achieve the 18oC temperature target at Frazer Rapids under the following guidance outlined in the Missouri River Biological Opinion (2000).
a. Releases from the spillway will commence two to three days or up to seven days after the beginning of the rising stage on the Missouri River at the Landusky, MT gauge, but not before May 15.
b. The peak combined discharge will range from 566 to 707.9 cms (20,000 to 25,000 cfs) with a minimum powerhouse release of 113.3 cms (4,000 cfs) for a minimum of three days. Discharges will gradually be reduced after meeting the peak discharge target and time. The combined discharge is the sum of powerhouse and spillway releases and the Milk River discharge.
c. The combined releases should achieve a minimum temperature of 18oC (64.4oF) at Frazer Rapids for a minimum of 30 days.
d. Spillway releases should be made for up to 60 days from the day that the spillway gates are opened in order to achieve the temperature target.
The Full Test simulations were performed using 1998 lake and river hydrodynamic data and 1994 meteorological data to emulate median hydrodynamic and meteorological conditions. During the 1998 calendar year, the Fort Peck pool elevation averaged 681.9 m (2237.1 ft), which is below the 3rd quartile elevation of 682.4 m (2238.8 ft), and the average annual outflow was 252 cms (8,900 cfs) near the median value. Fort Peck Lake release temperatures were determined from 1998 lake hydrodynamics and 1994 meteorological data. Since the spring river rise at Landusky, MT, began on approximately June 20, spillway releases were initiated on June 22. Combined spillway and powerhouse discharges were ramped up in order to meet a 707.9-cms (25,000-cfs) flow target below the mouth of the Milk River over a three-day period while reducing powerhouse releases to 113.3 cms (4,000 cfs). The peak discharge was held for three days, and then the combined flows were sustained with an assumed 1oC powerhouse discharge temperature gain and a 0.5oC spillway and Milk River discharge gain.
The three variations of the Full Test are described in Table 10. In FT 1, 18oC discharges were targeted at Frazer Rapids for a duration of 30 days, after which spillway discharges were ceased and powerhouse discharges were returned to normal. The FT 2 scenario was the same as FT 1; however, after meeting the 18oC temperature target for 30 days, powerhouse discharges were returned to normal and spillway discharges were continued through the end of the 60-day period spillway release period. In FT 3 at the end of the 30-day period temperature period,
Water Quality Modeling Report U.S. Army Corps of Engineers Fort Peck Lake Omaha District
40
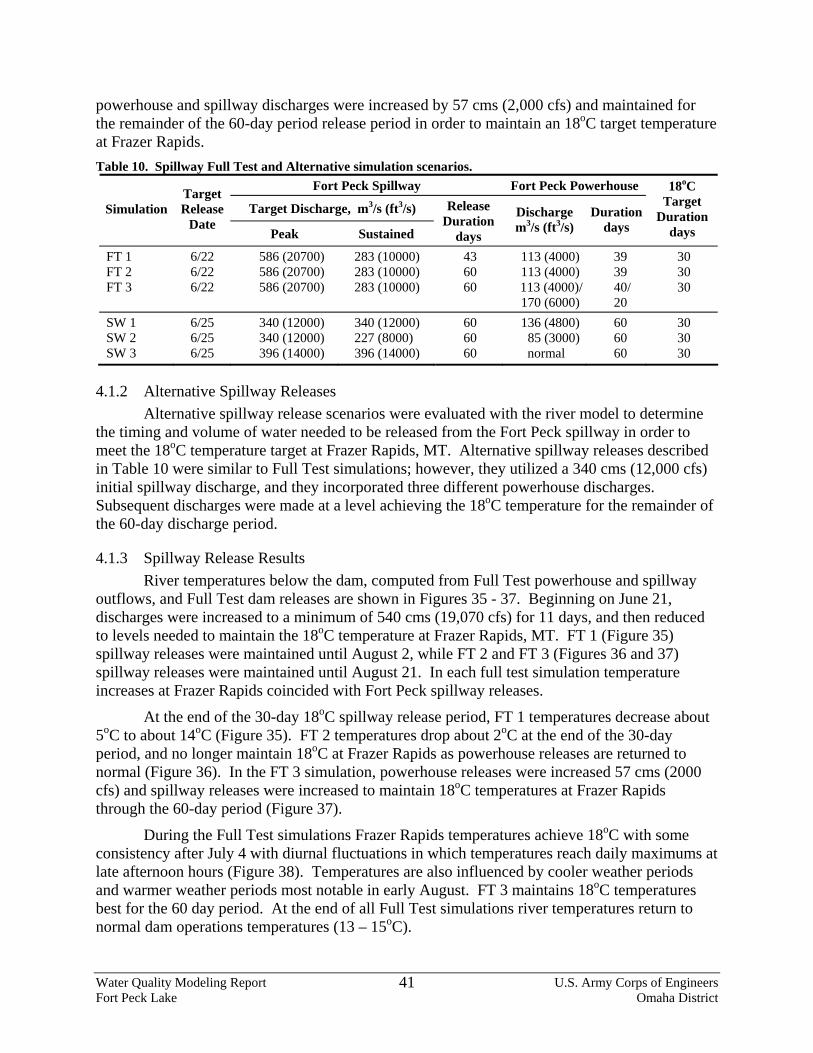
powerhouse and spillway discharges were increased by 57 cms (2,000 cfs) and maintained for the remainder of the 60-day period release period in order to maintain an 18oC target temperature at Frazer Rapids. Table 10. Spillway Full Test and Alternative simulation scenarios.
Fort Peck Spillway Fort Peck Powerhouse
Target Discharge, m3/s (ft3/s) Simulation Target Release
Date Peak Sustained
Release Duration
days
Discharge m3/s (ft3/s)
Duration days
18oC Target
Duration days
FT 1 FT 2 FT 3
6/22 6/22 6/22
586 (20700) 586 (20700) 586 (20700)
283 (10000) 283 (10000) 283 (10000)
43 60 60
113 (4000) 113 (4000)
113 (4000)/ 170 (6000)
39 39 40/ 20
30 30 30
SW 1 SW 2 SW 3
6/25 6/25 6/25
340 (12000) 340 (12000) 396 (14000)
340 (12000) 227 (8000) 396 (14000)
60 60 60
136 (4800) 85 (3000)
normal
60 60 60
30 30 30
4.1.2 Alternative Spillway Releases Alternative spillway release scenarios were evaluated with the river model to determine
the timing and volume of water needed to be released from the Fort Peck spillway in order to meet the 18oC temperature target at Frazer Rapids, MT. Alternative spillway releases described in Table 10 were similar to Full Test simulations; however, they utilized a 340 cms (12,000 cfs) initial spillway discharge, and they incorporated three different powerhouse discharges. Subsequent discharges were made at a level achieving the 18oC temperature for the remainder of the 60-day discharge period.
4.1.3 Spillway Release Results River temperatures below the dam, computed from Full Test powerhouse and spillway
outflows, and Full Test dam releases are shown in Figures 35 - 37. Beginning on June 21, discharges were increased to a minimum of 540 cms (19,070 cfs) for 11 days, and then reduced to levels needed to maintain the 18oC temperature at Frazer Rapids, MT. FT 1 (Figure 35) spillway releases were maintained until August 2, while FT 2 and FT 3 (Figures 36 and 37) spillway releases were maintained until August 21. In each full test simulation temperature increases at Frazer Rapids coincided with Fort Peck spillway releases.
At the end of the 30-day 18oC spillway release period, FT 1 temperatures decrease about 5oC to about 14oC (Figure 35). FT 2 temperatures drop about 2oC at the end of the 30-day period, and no longer maintain 18oC at Frazer Rapids as powerhouse releases are returned to normal (Figure 36). In the FT 3 simulation, powerhouse releases were increased 57 cms (2000 cfs) and spillway releases were increased to maintain 18oC temperatures at Frazer Rapids through the 60-day period (Figure 37).
During the Full Test simulations Frazer Rapids temperatures achieve 18oC with some consistency after July 4 with diurnal fluctuations in which temperatures reach daily maximums at late afternoon hours (Figure 38). Temperatures are also influenced by cooler weather periods and warmer weather periods most notable in early August. FT 3 maintains 18oC temperatures best for the 60 day period. At the end of all Full Test simulations river temperatures return to normal dam operations temperatures (13 – 15oC).
Water Quality Modeling Report U.S. Army Corps of Engineers Fort Peck Lake Omaha District
41
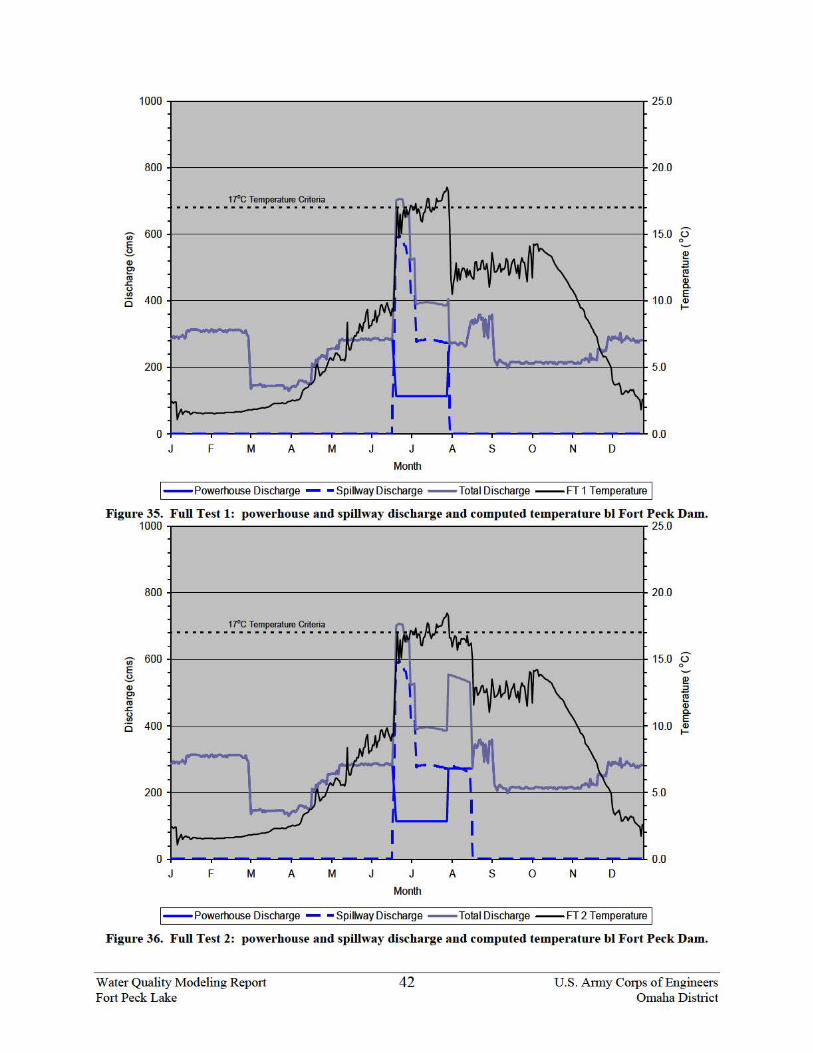
1000 "T"'""--------------------------------.. 25.0
800 +------------------------------+ 20.0
17"C Temperature Criteria ............................
0 +----r- - "T"'""-""""1'--.,.....- ......,.-L-.,.....-......;.,- - -.----.--..,.....- .......,--.L 0.0 J F M A M J J
Month
A s 0 N D
!- Powerhouse Discharge - - Spillway Discharge - Total Discharge --FT 1 Temperature I Figure 35. Full Test 1: powerhouse and spillway discharge and computed temperature bl Fo1·t Peck Dam.
1000 25.0
800 -1--------------------------------+ 20.0
17"C Temperature Criteria ............................
0 -t----..--..-~----...... - ---L-.,.....----.-..:...--- ....... ~-------'- 0.0 J F M A M J J
Month
A s 0 N D
!- Powerhouse Discharge - - Spillway Discharge - Total Discharge --FT 2 Temperature I Figure 36. Full Test 2: powerhouse and spillway discharge and computed temperature bl Fo1·t Peck Dam.
Water Quality Modeling Repmt Fmt Peck Lake
42 U.S. Anny Corps of Engineers Omaha District
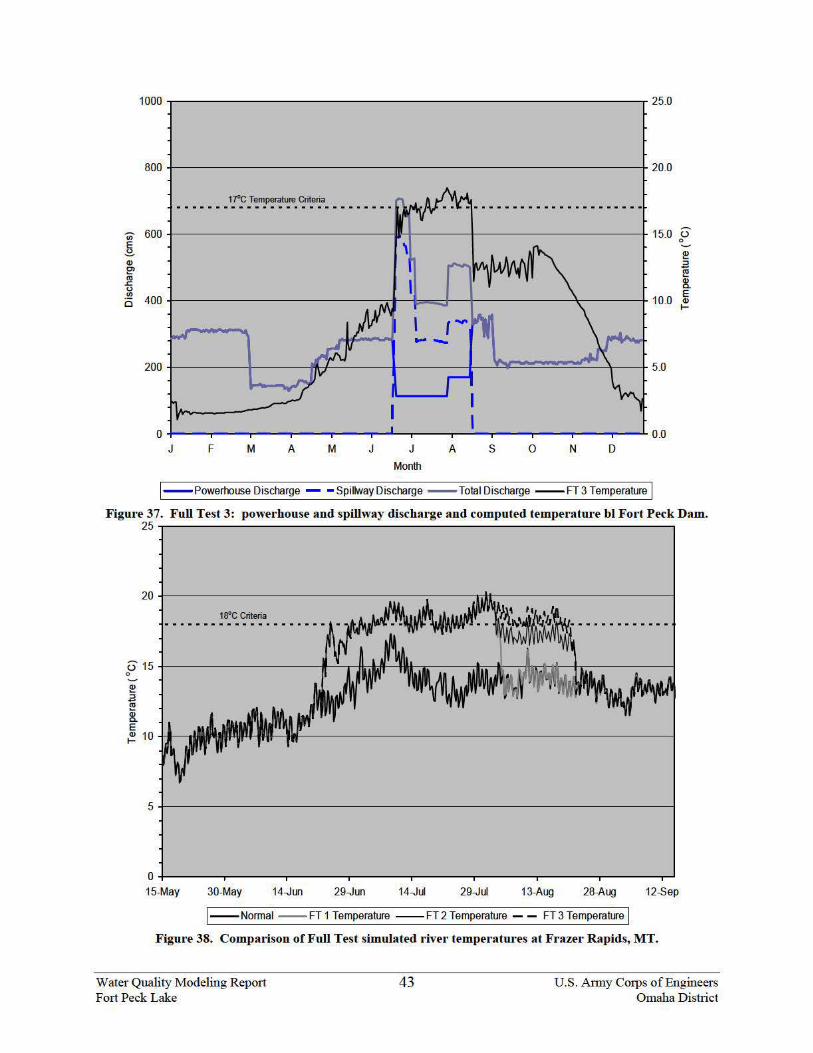
1000 "T"'""-------------------------------.. 25.0
800 +------------------------------+ 20.0
17"C Temperature Criteria ............................
0 +----r- - "T"'""---r----r-- --r-L--r-----.--..,-----r--"T-- ---r---1.. 0.0 J F M A M J J
Month
A s 0 N D
!- Powerhouse Discharge - - Spillway Discharge - Total Discharge --FT3 Temperature I Figure 37. Full Test 3: powerhouse and spillway discharge and computed temperatut·e bl Fot·t Pe.ck Dam.
25 "T"'""-------------------------------,
0 +----"T"'""---r---~~-----.-----r-----r---~----r~
15-May 30-May 14-Jun 29-Jun 14-Jul 29-Jul 13-Aug 28-Aug 12-Sep
1--Normal --FT 1 Temperature --FT 2 Temperature - - FT 3 Temperature I Figure 38. Comparison of Full Test simulated river temperatures at Frazer Rapids, MT.
Water Quality Modeling Repot1 Fmt Peck Lake
43 U.S. Anny Corps of Engineers Omaha District
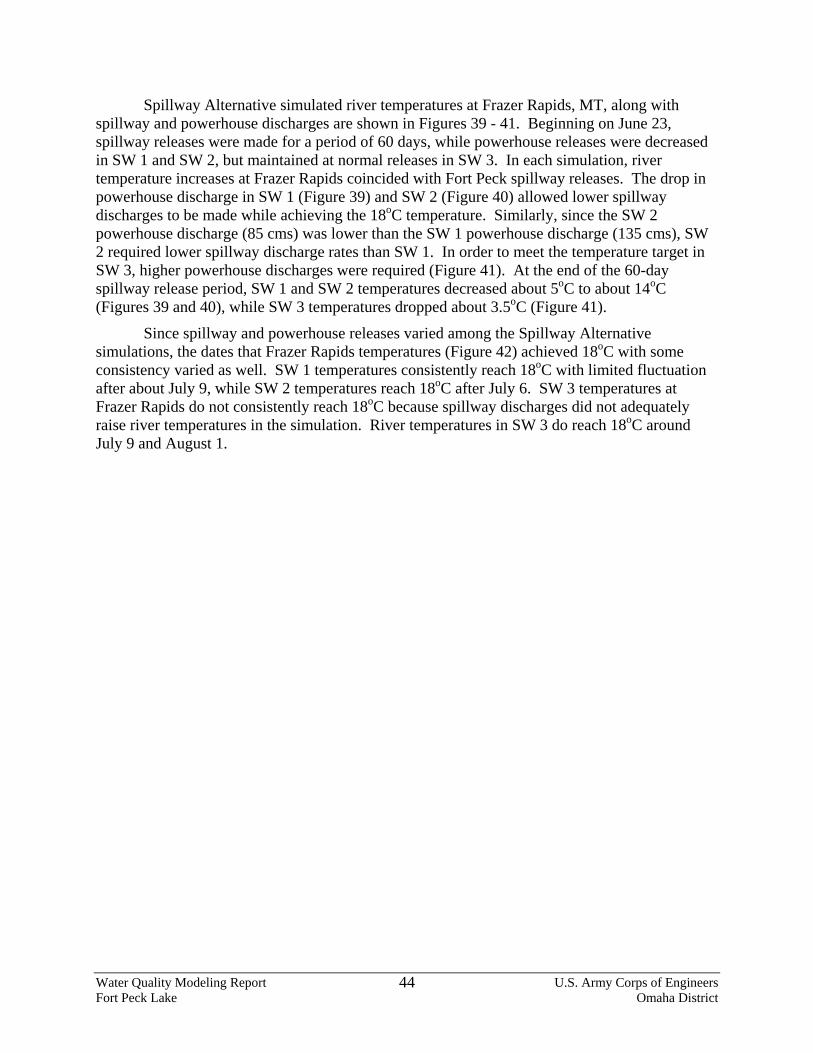
Spillway Alternative simulated river temperatures at Frazer Rapids, MT, along with spillway and powerhouse discharges are shown in Figures 39 - 41. Beginning on June 23, spillway releases were made for a period of 60 days, while powerhouse releases were decreased in SW 1 and SW 2, but maintained at normal releases in SW 3. In each simulation, river temperature increases at Frazer Rapids coincided with Fort Peck spillway releases. The drop in powerhouse discharge in SW 1 (Figure 39) and SW 2 (Figure 40) allowed lower spillway discharges to be made while achieving the 18oC temperature. Similarly, since the SW 2 powerhouse discharge (85 cms) was lower than the SW 1 powerhouse discharge (135 cms), SW 2 required lower spillway discharge rates than SW 1. In order to meet the temperature target in SW 3, higher powerhouse discharges were required (Figure 41). At the end of the 60-day spillway release period, SW 1 and SW 2 temperatures decreased about 5oC to about 14oC (Figures 39 and 40), while SW 3 temperatures dropped about 3.5oC (Figure 41).
Since spillway and powerhouse releases varied among the Spillway Alternative simulations, the dates that Frazer Rapids temperatures (Figure 42) achieved 18oC with some consistency varied as well. SW 1 temperatures consistently reach 18oC with limited fluctuation after about July 9, while SW 2 temperatures reach 18oC after July 6. SW 3 temperatures at Frazer Rapids do not consistently reach 18oC because spillway discharges did not adequately raise river temperatures in the simulation. River temperatures in SW 3 do reach 18oC around July 9 and August 1.
Water Quality Modeling Report U.S. Army Corps of Engineers Fort Peck Lake Omaha District
44
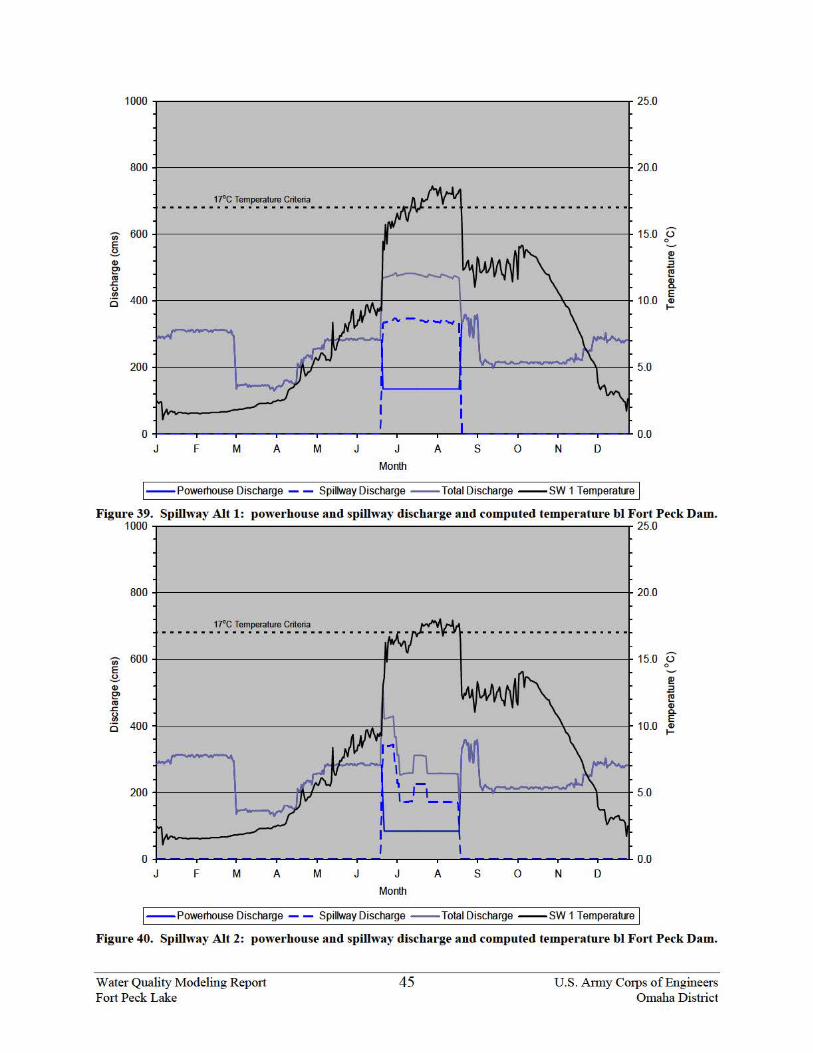
1000 -r---------------------------------.. 25.0
800 +------------------------------+ 20.0
17"C Temperature Criteria ...............................
0 +-- -,.---.---,.---.---,.-- -.-----.-...L.-.-----.---.-----.---L. 0.0 J F M A M J J
Month
A s 0 N D
!--Powerhouse Discharge -- Spillway Discharge --Total Discharge --sw 1 Temperature I Figure 39. Spillway Alt 1: powerhouse and spillway discharge and computed temperature bl Fo1·t Peck Dam.
1000 25.0
800 -1--------------------------------+ 20.0
17"C Temperature Criteria . . . . . . . . . . . . . . . . . . . . . . . . . . . . . . . 15.0
10.0
0 +-- -..--.,...--.....,.--..,.....---- -.-----.-- ..,.....- ---r---.-----r- -'- 0.0 J F M A M J J
Month
A s 0 N D
!--Powerhouse Discharge -- Spillway Discharge --Total Discharge --sw 1 Temperature I
6 0
!!! .3 ~ Q) c. E Q) 1-
Figure 40. Spillway Alt 2: powerhouse and spillway discharge and computed temperature bl Fo1·t Peck Dam.
Water Quality Modeling Repmt Fmt Peck Lake
45 U.S. Anny Corps of Engineers Omaha District
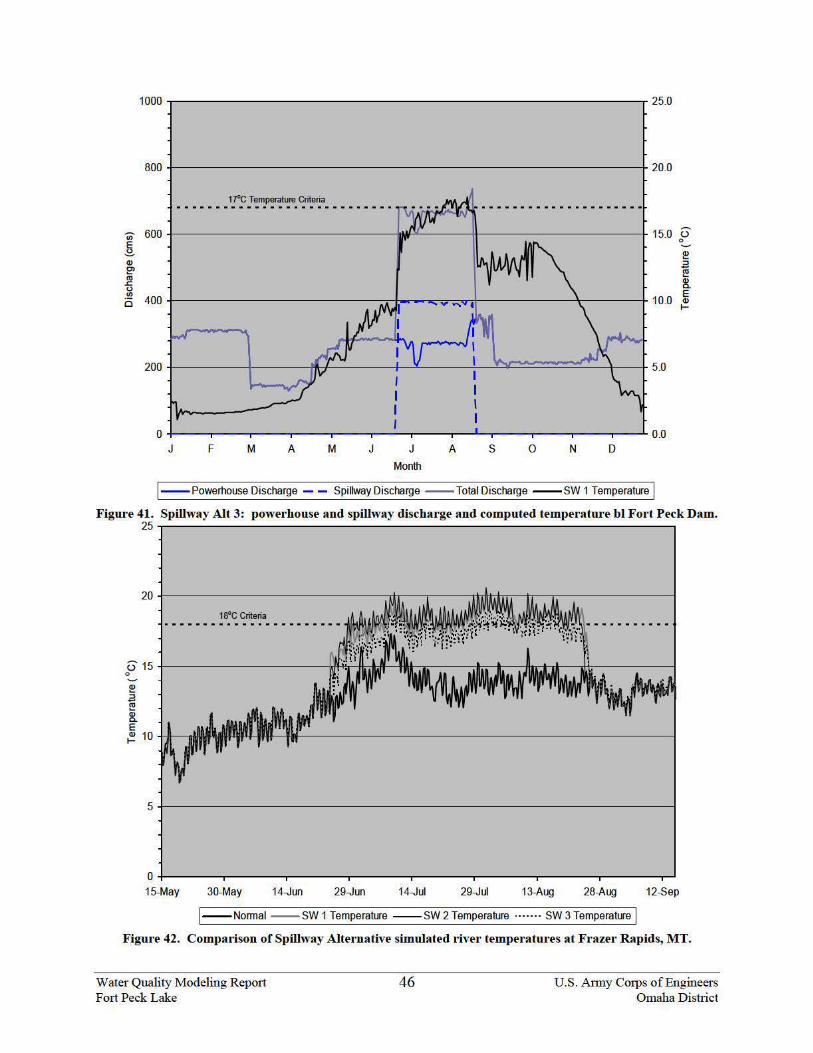
1000 "T"'""-------------------------------.. 25.0
800 +------------------------------+ 20.0
17"C Temperature Criteria ............................ 15.0
10.0
0 +----.---"T"'""---.----.----..,.-- -.----..,.-....I--.-----.---.-----.----1. 0.0 J F M A M J J
Month
A s 0 N D
1--PowerhouseDischarge -- Spillway Discharge --Total Discharge --sw 1 Temperature I
(.) 0
~ 2 ~ 8. E Q) 1-
Figure 41. Spillway Alt 3: powe1·bouse and spillway discharge and computed temperature. bl Fort Peck Dam. 25 "T"'""-------------------------------,
0 +----~---r---~~-----.-----..,.------.----~----r~
15-May 30-May 14-Jun 29-Jun 14-Jul 29-Jul 13-Aug 28-Aug 12-Sep
1--Normal --sw 1 Temperature --SW 2 Temperature ,. _____ SW 3 Temperature I Figure 42. Compa1ison of Spillway Altemative simulated river temperatures at Frazer Rapids, MT.
Water Quality Modeling Repot1 Fmt Peck Lake
46 U.S, Anny Corps of Engineers Omaha District
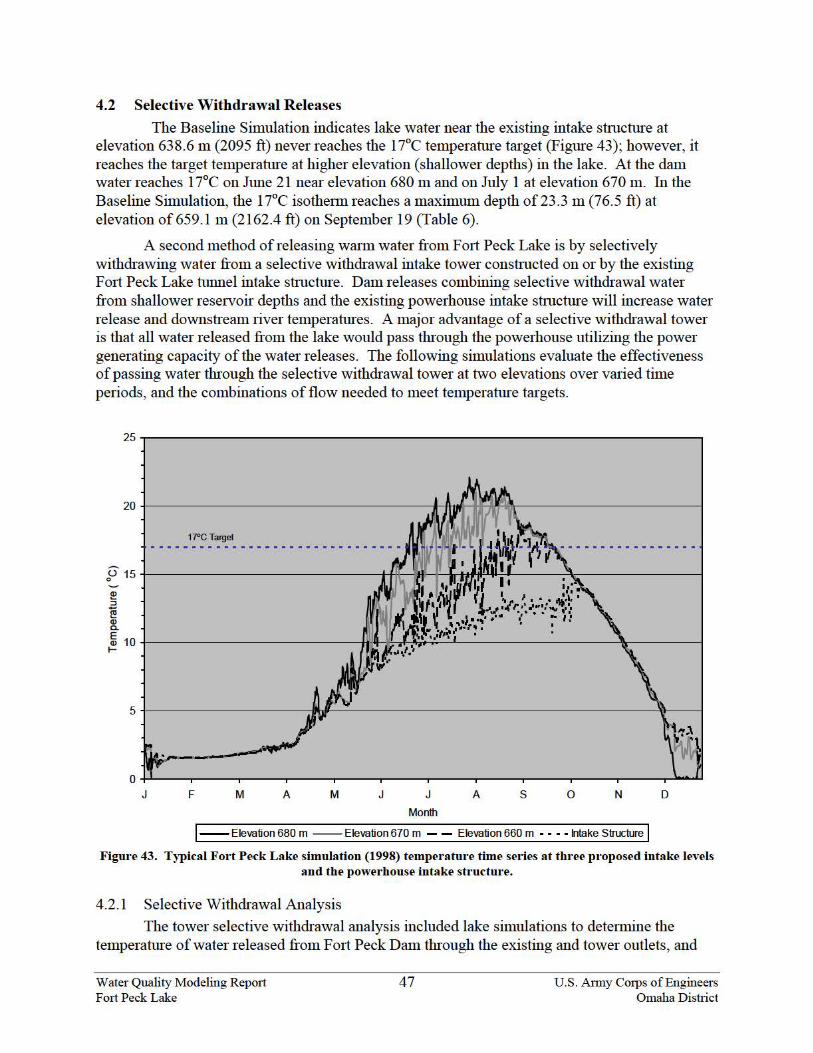
4.2 Selective Withdrawal Releases
The Baseline Simulation indicates lake water near the existing intake stmctm e at elevation 638.6 m (2095 ft) never reaches the 17°C temperatme target (Figme 43); however, it reaches the target temperature at higher elevation (shallower depths) in the lake. At the dam water reaches 17°C on June 21 near elevation 680 m and on July 1 at elevation 670 m. In the Baseline Simulation, the 17°C isothe1m reaches a maximum depth of23.3 m (76.5 ft) at elevation of659.1 m (2162.4 ft) on September 19 (Table 6).
A second method of releasing wrum water from F01t Peck Lake is by selectively withdrawing water from a selective withdrawal intake tower constmcted on or by the existing Fort Peck Lake tunnel intake stm ctme. Dam releases combining selective withdrawal water from shallower reservoir depths and the existing powerhouse intake stmctm e will increase water release and downstream river temperatmes. A major advantage of a selective withdrawal tower is that all water released from the lake would pass through the powerhouse utilizing the power generating capacity of the water releases. The following simulations evaluate the effectiveness of passing water through the selective withdrawal tower at two elevations over vru·ied time periods, and the combinations of flow needed to meet temperature targets.
25~----------------------------------------------------------------~
17"C Target
0 ~----r---~r---~----~-----r----,-----~----r---~----~-----r~-u
J F M A M J J A s 0 N D
Month
1--Elevation 680 m --Elevation 670 m - - Elevation 660 m • • • • ntake Structure I Figure 43. Typical Fort Peck Lake simulation (1998) temperature time series at three proposed intake levels
and the powerhouse intake structure.
4.2.1 Selective Withdrawal Analysis
The tower selective withdrawal analysis included lake simulations to detennine the temperatme of water released from F01t Peck Dam through the existing and tower outlets, and
Water Quality Modeling Repmt Fmt Peck Lake
47 U.S. Anny Corps of Engineers Omaha District
simulations of the Missouri river downstream of Fort Peck to determine river temperatures reached at Frazer Rapids, MT. Selective withdrawal simulations at the Fort Peck intake were performed using two structures simultaneously:
1) the existing powerhouse intake structure at elevation 638.6 m (2095 ft), and
2) a selective tower withdrawal (TW) structure with intake elevations of 680 m (2231 ft) and 670 m (2198.2 ft) evaluated separately.
Dam releases were made using a combination of discharges from the normal structure and the tower structure, and the tower structure alone during time periods when 17oC water could be withdrawn. Flow rates were adjusted in the structures to achieve 17oC at the dam outlet for various time periods. Table 11 outlines how the selective withdrawal simulations were performed. Table 11. Tower selective withdrawal (TW) simulation scenarios.
Simulation Existing Structure Discharge cms (cfs)
Tower Structure Elevation
m (ft)
Tower Structure Discharge
cms
Tower Withdrawal Start Date
Tower Withdrawal
Duration days
TW 1 TW 2 TW 3
85 (3000) 85 (3000) 0 (0)
680 (2231.0) 680 (2231.0) 680 (2231.0)
normala – 85 cms normal – 85 cms normal
June 29 June 1 June 1
90 130 130
TW 4 TW 5 TW 6
85 (3000) 85 (3000) 0 (0)
670 (2198.2) 670 (2198.2) 670 (2198.2)
normal – 85 cms normal – 85 cms normal
July 8 June 1 June 1
90 130 130
a 1998 normal powerhouse discharge.
4.2.2 Selective Withdrawal Results Simulations TW 1, TW 2, and TW 3 used the 680-m (2231 ft) elevation tower
withdrawal structure in combination with the existing structure. In the TW 1 simulation, existing intake discharges were reduced to 85 cms (3000 cfs) on June 29 while the remainder of the existing discharge was routed through the tower structure (Figure 44). The same discharge scheme was applied in TW 2, only discharge through the tower was initiated on June 1 and carried into early October (Figure 45). The result of earlier releases in TW 2 was a smoother increase in dam discharge temperatures than in TW 1. TW 1 and TW 2 discharge temperatures were the same between June 29 and September 27, reaching or exceeding 17oC from late July through late August.
In the TW 3 simulation all dam discharges were routed through the 680-m tower structure from June 1 through early October, greatly increasing the temperatures released from the dam (Figure 46). Temperatures reached 17oC by late June and persisted through mid-September reaching 21oC at times during the summer season.
The TW 3 simulation provided the best chance for reaching the 18oC temperature target at Frazer Rapids, MT, since all release water during the release period was originating from near the 680-m lake elevation. Temperatures at Frazer Rapids were consistently above 18oC from the end of June to the beginning of September (Figure 47). Simulations TW 1 and TW 2 also produced 18oC temperatures but they were generally 2 to 3oC lower than TW 3 and occurred over a shorter period of time.
Water Quality Modeling Report U.S. Army Corps of Engineers Fort Peck Lake Omaha District
48
Simulations TW 4, TW 5, and TW 6 used the 670-m (2231 ft) elevation tower wital structure in combination with the existing structure. TW 4, TW 5, and TW 6 releases mirrored TW 1, TW 2, and TW 3 releases, respectively. Dam discharges through the deeper tower withdrawal intake produced lower release temperatures for a shorter period of time. TW 4 and TW 5 release temperatures reached 17oC (Figures 48 & 49) only in August, which is the peak heating time for Fort Peck Lake.
As in TW 3, TW 6 release temperatures are noticeably better than TW 1 and TW 2 temperatures (Figure 50). TW 6 temperatures reached 17oC by early July and persisted through early to mid-September; however, temperatures were not as warm as TW 3 temperatures.
The 670 m (2198.2 ft) elevation tower structure provides a second alternative elevation when lake pool elevations are lower than 680 m (2231 ft). The 670-m tower structure simulations were performed when the pool was well above 680 m, so they demonstrate that temperatures cooler than the higher outlet will be released through the dam from the lower outlet. Temperatures at Frazer Rapids, MT, intermittently reached 18oC in TW 4 and TW 5, while TW 6 consistently reached or exceeded 18oC from early July to late August (Figure 51).
Water Quality Modeling Report U.S. Army Corps of Engineers Fort Peck Lake Omaha District
49
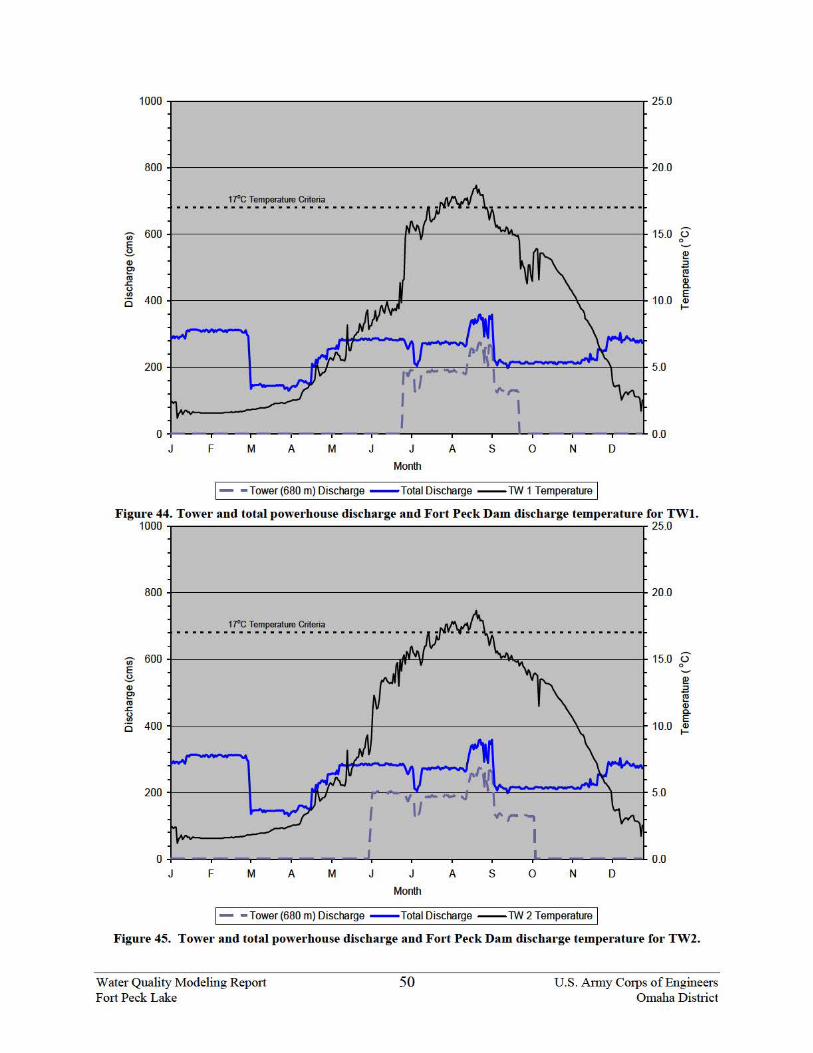
1000 "T"'""--------------------------------.. 25.0
800 +------------------------------+ 20.0
17"C Temperature Criteria ................................
.,..,...
' 0 +----r- - "T"'""-.....,.--.,-- ---.--.,-----.---r--.._, _ _ -r-_---r_ --'- 0.0
J F M A M J J
Month
A s 0 N D
1- - Tower {680m) Discharge - Total Discharge --TW1 Temperature I Figure 44. Tower and total powerhouse discharge and Fort Peck Dam discharge temperature fo1· TWl.
1000 25.0
800 -1---------------------------------+ 20.0
17"C Temperature Criteria ................................
0 -1----..--..------.......-- ........ ---r-----r---r-----. ....... - ---- -L 0.0 J F M A M J J
Month
A s 0 N D
1- - Tower {680m) Discharge - Total Discharge --TW2Temperature I Figure 45. Tower and total powerhouse discharge and Fort Peck Dam discharge temperature for TW2.
Water Quality Modeling Repmt Fmt Peck Lake
50 U.S. Anny Corps of Engineers Omaha District
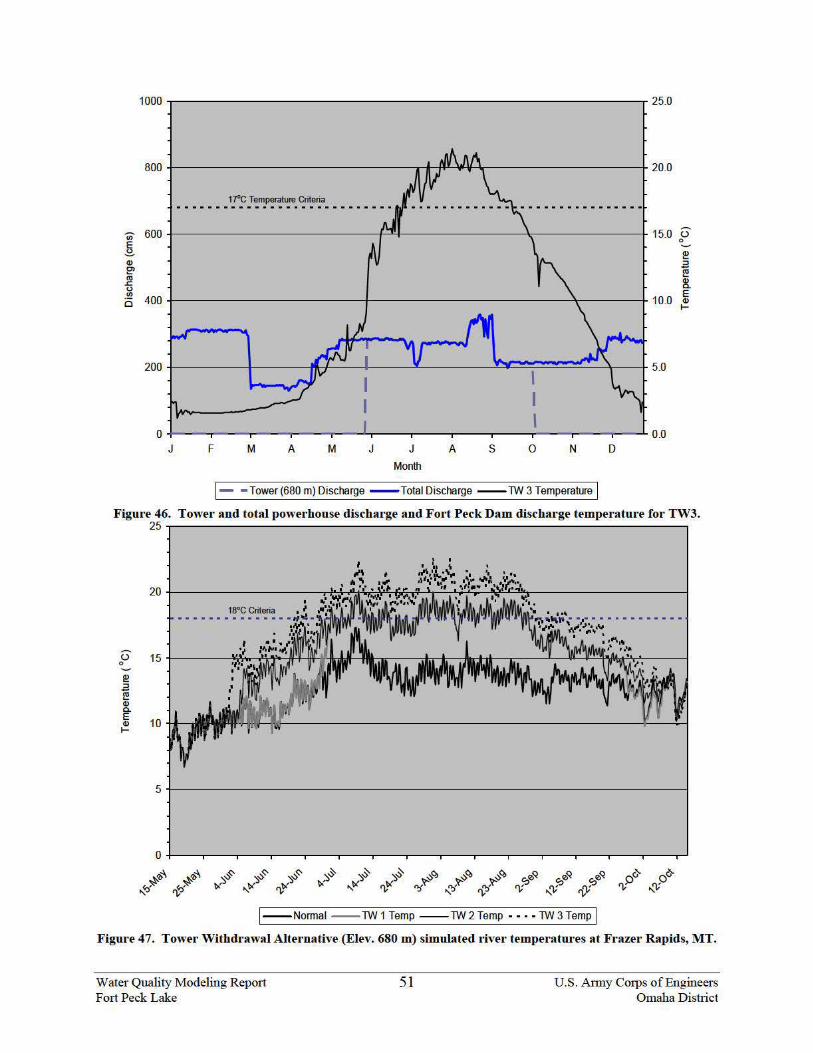
1000 "T"'""-------------------------------.. 25.0
17"C Temperature Criteria ............................
I I I
0 -1----r--"T"'""---r---r-- -'-r---r-----r---r-----r- --r-----r---L. 0.0 J F M A M J J A s 0 N D
Month
1- - Tower {680m)Discharge - Total Discharge --1W3Temperature I
Figul'e 46. Towel' and total powel'house discharge and Fort Peck Dam discharge tempel'ature for TW3. 25 "T"'""--------------------------------,
' ... , f .. .....
0 0
15
!!! ::1
~ <l> Cl. E
10 <l> 1-
5 +---------------------------------------------------------------------~
0 +---r--~--r---r----.-~~-r--"T"'""--r--~--r---r---r----r--~
~q,-\ ~q,-\ "":) "'":)
I--Normai --1W1 Temp --1W 2Temp • • • • 1W3 Temp I
Figure 47. Tower Withdrawal Altemative (Elev. 680 m) simulated river temperatu1·es at Frazel' Rapids, MT.
Water Quality Modeling Repot1 Fmt Peck Lake
51 U.S. Anny Corps of Engineers Omaha District
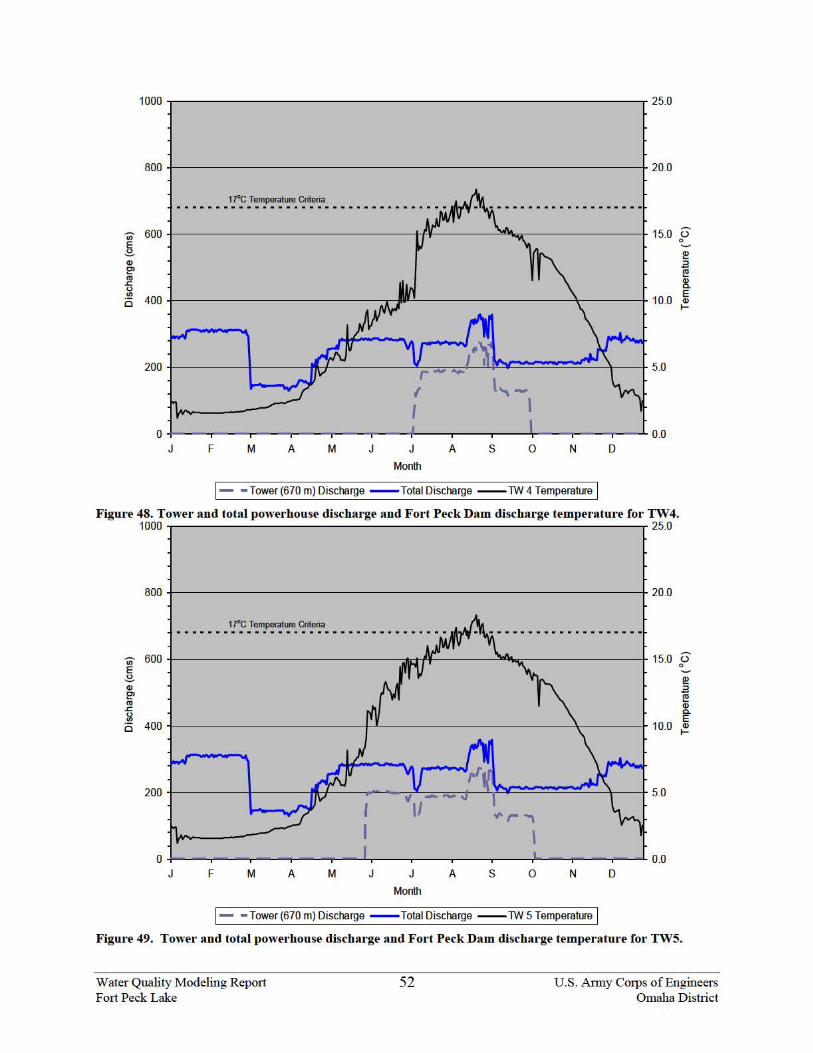
1000 "T"'""--------------------------------.. 25.0
800 +------------------------------+ 20.0
17"C Temperature Criteria ...................................
(
I 0 +----r- - "T"'""-.....,.--.,-- ---.--+-----.---r-----',--.,-- ---.--...1... 0.0
J F M A M J J
Month
A s 0 N D
1- - Tower {670 m) Discharge - Total Discharge --TW 4 Temperature I Figure 48. Tower and total powerhouse discharge and Fort Peck Dam discharge temperature fo1· TW4.
1000 25.0
800 -1---------------------------------+ 20.0
17"C Temperature Criteria ...................................
0 -1----..--..------.......--~--.,-----.---r-----. ....... - ----- ...-L 0.0 J F M A M J J
Month
A s 0 N D
1- - Tower {670m) Discharge - Total Discharge --TW5Temperature I Figure 49. Tower and total powerhouse discharge and Fort Peck Dam discharge temperature fo1· TWS.
Water Quality Modeling Repmt Fmt Peck Lake
52 U.S. Anny Corps of Engineers Omaha District
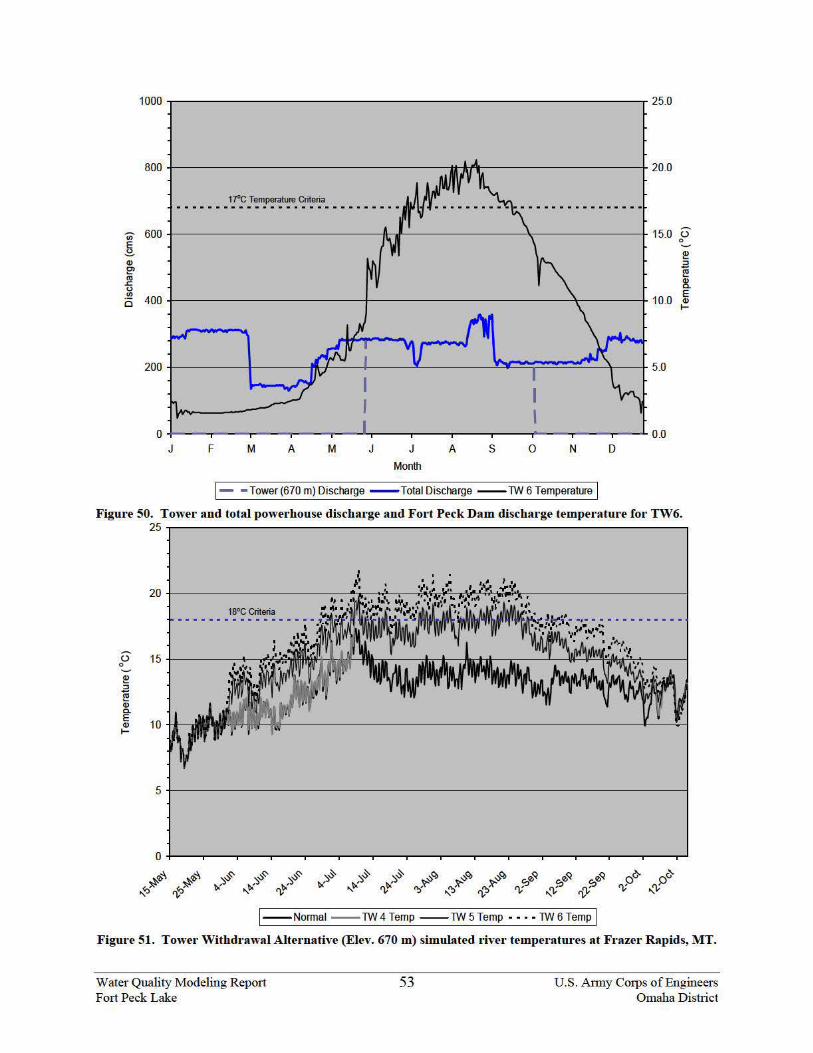
1000 "T"'""-------------------------------.. 25.0
0 -1----r--"T"'""---r---r-- ......... ---r-----r---r-----r---r-----r--L 0.0 J F M A M J J
Month
A s 0 N
1- - Tower {670m)Discharge - Total Discharge --1W6Temperature I
D
Figur(' 50. Tower and total powerhous(' discharg(' a.nd Fort P('ck Dam discharge t('mperature for TW6. 25 "T"'""--------------------------------,
0 0
15
~ .3 m a; c. E
10 Q)
1-
0 +---r---r--r---..----.-~r--r--"T"'""--r---r--r-~---..----.--~
~~~j~ ~~~j~ ,"1 "'"1
1--Normal --lW 4 Temp --lW 5 Temp • • • · lW 6 Temp I Figure 51. ToW('l' Withdrawal Alternativ(' (El('v. 670 m) simulated riv('r temperatures at Fraz('r Rapids, MT.
Water Quality Modeling Repot1 Fmt Peck Lake
53 U.S. Anny Corps of Engineers Omaha District
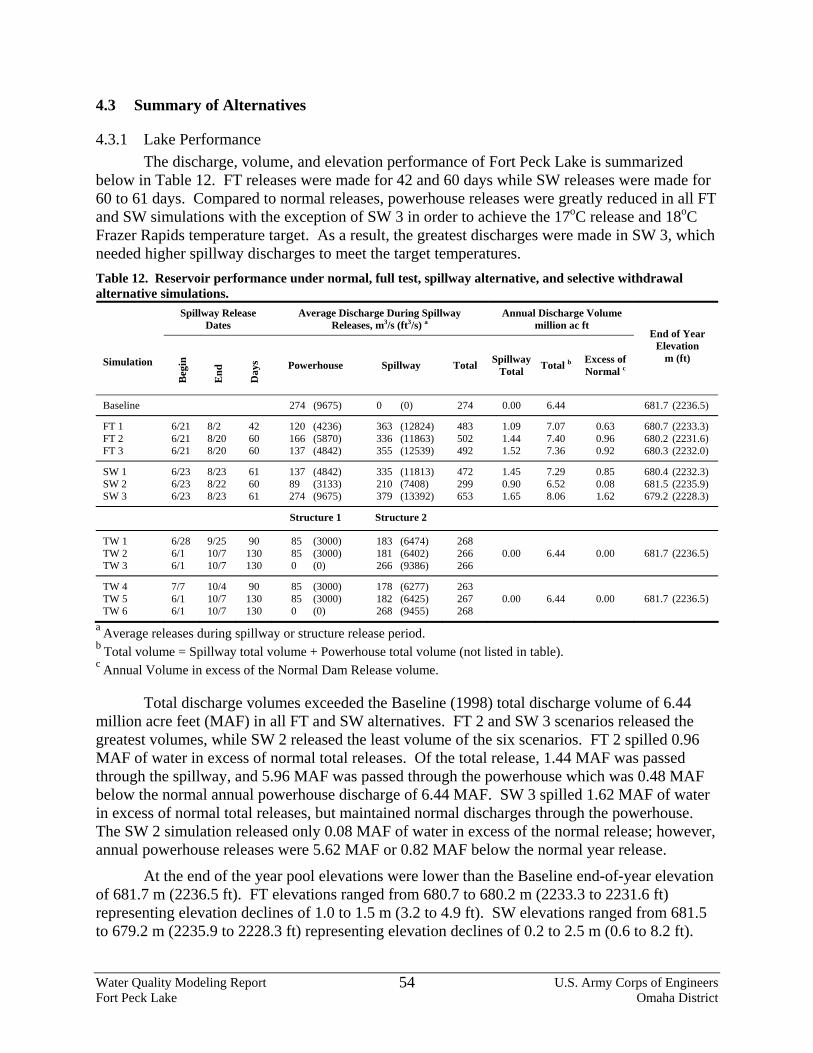
4.3 Summary of Alternatives
4.3.1 Lake Performance The discharge, volume, and elevation performance of Fort Peck Lake is summarized
below in Table 12. FT releases were made for 42 and 60 days while SW releases were made for 60 to 61 days. Compared to normal releases, powerhouse releases were greatly reduced in all FT and SW simulations with the exception of SW 3 in order to achieve the 17oC release and 18oC Frazer Rapids temperature target. As a result, the greatest discharges were made in SW 3, which needed higher spillway discharges to meet the target temperatures. Table 12. Reservoir performance under normal, full test, spillway alternative, and selective withdrawal alternative simulations.
Spillway Release Dates
Average Discharge During Spillway Releases, m3/s (ft3/s) a
Annual Discharge Volume million ac ft
Simulation
Beg
in
End
Day
s Powerhouse Spillway Total SpillwayTotal Total b Excess of
Normal c
End of Year Elevation
m (ft)
Baseline 274 (9675) 0 (0) 274 0.00 6.44 681.7 (2236.5)
FT 1 FT 2 FT 3
6/21 6/21 6/21
8/2 8/20 8/20
42 60 60
120 (4236) 166 (5870) 137 (4842)
363 (12824) 336 (11863) 355 (12539)
483 502 492
1.09 1.44 1.52
7.07 7.40 7.36
0.63 0.96 0.92
680.7 (2233.3) 680.2 (2231.6) 680.3 (2232.0)
SW 1 SW 2 SW 3
6/23 6/23 6/23
8/23 8/22 8/23
61 60 61
137 (4842) 89 (3133) 274 (9675)
335 (11813) 210 (7408) 379 (13392)
472 299 653
1.45 0.90 1.65
7.29 6.52 8.06
0.85 0.08 1.62
680.4 (2232.3) 681.5 (2235.9) 679.2 (2228.3)
Structure 1 Structure 2 TW 1 TW 2 TW 3
6/28 6/1 6/1
9/25 10/7 10/7
90 130 130
85 (3000) 85 (3000) 0 (0)
183 (6474) 181 (6402) 266 (9386)
268 266 266
0.00
6.44
0.00 681.7 (2236.5)
TW 4 TW 5 TW 6
7/7 6/1 6/1
10/4 10/7 10/7
90 130 130
85 (3000) 85 (3000) 0 (0)
178 (6277) 182 (6425) 268 (9455)
263 267 268
0.00
6.44
0.00 681.7 (2236.5)
a Average releases during spillway or structure release period. b Total volume = Spillway total volume + Powerhouse total volume (not listed in table). c Annual Volume in excess of the Normal Dam Release volume.
Total discharge volumes exceeded the Baseline (1998) total discharge volume of 6.44 million acre feet (MAF) in all FT and SW alternatives. FT 2 and SW 3 scenarios released the greatest volumes, while SW 2 released the least volume of the six scenarios. FT 2 spilled 0.96 MAF of water in excess of normal total releases. Of the total release, 1.44 MAF was passed through the spillway, and 5.96 MAF was passed through the powerhouse which was 0.48 MAF below the normal annual powerhouse discharge of 6.44 MAF. SW 3 spilled 1.62 MAF of water in excess of normal total releases, but maintained normal discharges through the powerhouse. The SW 2 simulation released only 0.08 MAF of water in excess of the normal release; however, annual powerhouse releases were 5.62 MAF or 0.82 MAF below the normal year release.
At the end of the year pool elevations were lower than the Baseline end-of-year elevation of 681.7 m (2236.5 ft). FT elevations ranged from 680.7 to 680.2 m (2233.3 to 2231.6 ft) representing elevation declines of 1.0 to 1.5 m (3.2 to 4.9 ft). SW elevations ranged from 681.5 to 679.2 m (2235.9 to 2228.3 ft) representing elevation declines of 0.2 to 2.5 m (0.6 to 8.2 ft).
Water Quality Modeling Report U.S. Army Corps of Engineers Fort Peck Lake Omaha District
54
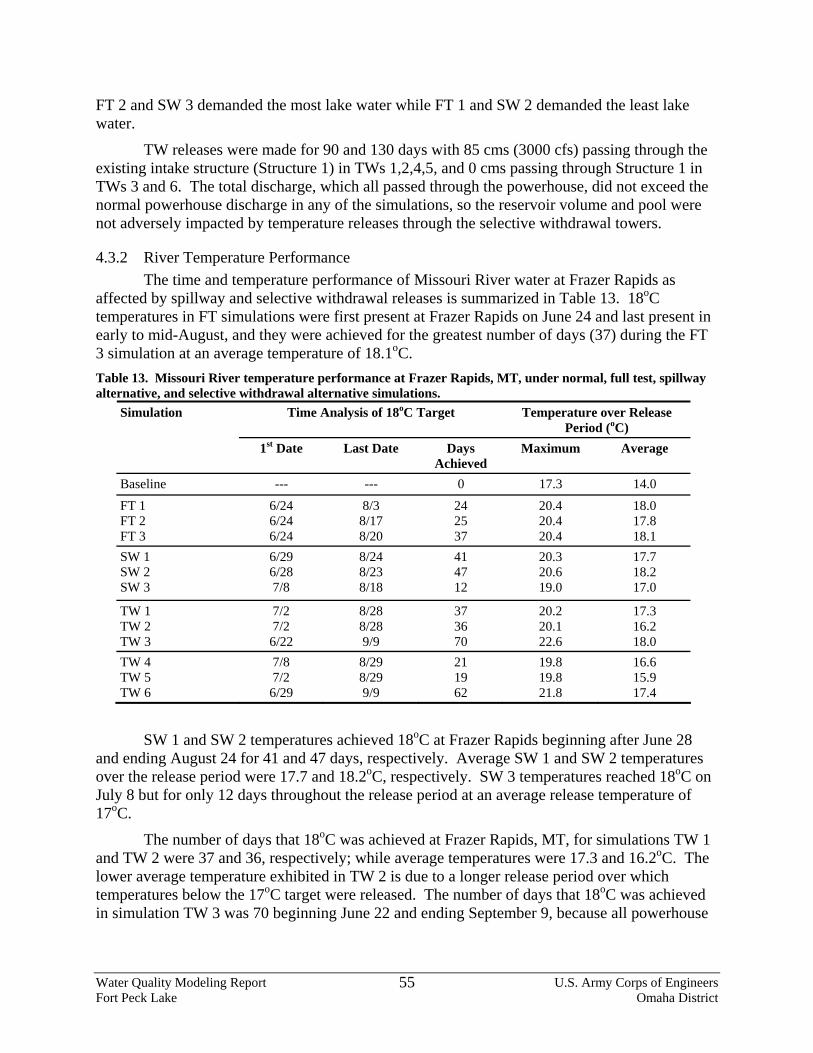
FT 2 and SW 3 demanded the most lake water while FT 1 and SW 2 demanded the least lake water.
TW releases were made for 90 and 130 days with 85 cms (3000 cfs) passing through the existing intake structure (Structure 1) in TWs 1,2,4,5, and 0 cms passing through Structure 1 in TWs 3 and 6. The total discharge, which all passed through the powerhouse, did not exceed the normal powerhouse discharge in any of the simulations, so the reservoir volume and pool were not adversely impacted by temperature releases through the selective withdrawal towers.
4.3.2 River Temperature Performance The time and temperature performance of Missouri River water at Frazer Rapids as
affected by spillway and selective withdrawal releases is summarized in Table 13. 18oC temperatures in FT simulations were first present at Frazer Rapids on June 24 and last present in early to mid-August, and they were achieved for the greatest number of days (37) during the FT 3 simulation at an average temperature of 18.1oC. Table 13. Missouri River temperature performance at Frazer Rapids, MT, under normal, full test, spillway alternative, and selective withdrawal alternative simulations.
Time Analysis of 18oC Target Temperature over Release Period (oC)
Simulation
1st Date Last Date Days Achieved
Maximum Average
Baseline --- --- 0 17.3 14.0 FT 1 FT 2 FT 3
6/24 6/24 6/24
8/3 8/17 8/20
24 25 37
20.4 20.4 20.4
18.0 17.8 18.1
SW 1 SW 2 SW 3
6/29 6/28 7/8
8/24 8/23 8/18
41 47 12
20.3 20.6 19.0
17.7 18.2 17.0
TW 1 TW 2 TW 3
7/2 7/2 6/22
8/28 8/28 9/9
37 36 70
20.2 20.1 22.6
17.3 16.2 18.0
TW 4 TW 5 TW 6
7/8 7/2 6/29
8/29 8/29 9/9
21 19 62
19.8 19.8 21.8
16.6 15.9 17.4
SW 1 and SW 2 temperatures achieved 18oC at Frazer Rapids beginning after June 28 and ending August 24 for 41 and 47 days, respectively. Average SW 1 and SW 2 temperatures over the release period were 17.7 and 18.2oC, respectively. SW 3 temperatures reached 18oC on July 8 but for only 12 days throughout the release period at an average release temperature of 17oC.
The number of days that 18oC was achieved at Frazer Rapids, MT, for simulations TW 1 and TW 2 were 37 and 36, respectively; while average temperatures were 17.3 and 16.2oC. The lower average temperature exhibited in TW 2 is due to a longer release period over which temperatures below the 17oC target were released. The number of days that 18oC was achieved in simulation TW 3 was 70 beginning June 22 and ending September 9, because all powerhouse
Water Quality Modeling Report U.S. Army Corps of Engineers Fort Peck Lake Omaha District
55
releases were drawn from the tower intake near elevation 680 m rather than a combination of the two intakes. The average temperature over the 130 release period was 18oC.
The number of days that 18oC was achieved at Frazer Rapids, MT, for simulations TW 4 and TW 5 were 21 and 19, respectively; while average temperatures were 16.6 and 15.9oC. The number of days that 18oC was achieved in simulation TW 3 was 62 days beginning June 29 and ending September 9. The average temperature over the 130 release period was 17.4oC.
Water Quality Modeling Report U.S. Army Corps of Engineers Fort Peck Lake Omaha District
56
5 CONCLUSIONS
5.1 Existing Conditions Analysis One of the primary purposes of this study was to develop a calibrated water temperature
model of Fort Peck Lake and the Missouri River downstream to Culbertson, MT, then develop baseline temperature conditions to compare management changes against. Baseline temperature conditions were developed using 1998 lake and river hydrodynamic data and 1994 meteorological data. The following conclusions were made from the lake and river model Baseline Simulation and parameter simulations.
Since average Missouri River temperature increases from Fort Peck Dam to Frazer Rapids, MT were about 1oC, the warm water target temperature in Fort Peck Lake was designated as 17oC. In the Baseline Simulation 17oC temperatures develop at the lake surface and spillway crest elevation between June 20 and 22 and persist for 96 days until late September. Lake water near the existing intake structure does not reach 17oC during any simulation year. Also temperatures in the lacustrine zones of the Big Dry Arm and main branch of Fort Peck Lake are not appreciably different.
The Baseline Simulation revealed that maximum 30-day average river temperature at Frazer Rapids, MT, was 14.3oC during August. The June through August average temperature at Frazer Rapids was 13.2oC, and the peak daily temperature was 17.3oC. The daily temperature never reached 18oC at Frazer Rapids.
The influence of lake inflow, outflow, pool elevation, and environmental air temperature were evaluated by simulating 90th percentile, median and 10th percentile parameters in the calibrated lake and river models. Of the four parameters evaluated, pool elevation and environmental temperature had the greatest influence on lake and river temperatures. Elevations near the 10th percentile produced higher lake release temperatures than median and 90th percentile pool elevations. In addition, high environmental temperatures cause the lake to heat more rapidly, in effect raising the temperature of release water. The same relationships applied to the river temperature simulations. Parameter variations, however, did not affect lake and river temperatures enough to achieve the 18oC temperature target at Frazer Rapids.
5.2 Alternative Management Analysis Lake discharge and volume and river temperature were the main factors considered in
this study in evaluating the effectiveness of temperature release scenarios. Decreased generator efficiency and power generation or geotechnical stability of the spillway may be a consideration; however, these factors were not considered in this study.
Spillway Full Test (FT) and Alternative Spillway (SW) scenarios made great demands on lake water volume and discharge, while Selective Tower Withdrawal (TW) scenarios had no impact to lake volume and discharge. Of the FT scenarios, FT 1 demanded the least volume of water because releases were performed for only 42 days. SW 2 demanded the least volume of water from all FT and SW scenarios because powerhouse discharges were drastically cut allowing warm water spillway discharges to be scaled back. TW scenarios did not make any adverse demands on lake volumes during the simulations.
The number of days that 18oC water temperatures were achieved on the Missouri River at Frazer Rapids, MT, during the release periods was 37 days for FT 3, 47 days for SW 2, 70 days
Water Quality Modeling Report U.S. Army Corps of Engineers Fort Peck Lake Omaha District
57
for TW 3, and 62 days for TW 6. Average temperatures in FT 3 and SW 2 were above 18oC, and TW 3 and TW 6 average temperatures were 18.0 and 17.4oC, respectively. The earliest that 18oC temperatures were achieved at Frazer Rapids was June 22 in TW 3. FT 3 achieved 18oC on June 24 and SW 2 achieved 18oC on June 28.
Considering all spillway release options, releases made in a manner similar to SW 2 are the best spillway option because it demands the least lake water volume and produces a high average temperature (18.2oC) over 47 days; however, much of the release water bypasses the powerhouse. Selective tower withdrawal is a good release option because it routes all warm water releases through the powerhouse taking advantage of the discharge water for power generation. Tower withdrawal achieved 18oC temperatures for 70 days when all water was passed through the 680-m (2231-ft) elevation selective withdrawal tower and 37 days when water was passed through the existing and selective withdrawal tower.
Water Quality Modeling Report U.S. Army Corps of Engineers Fort Peck Lake Omaha District
58
6 REFERENCES
Thornton, K.W., Kimmel, B.L., and Payne, F.E. (eds.). 1990. Reservoir Limnology – Ecological Perspectives. John Wiley & Sons, Inc., New York, New York.
U.S. Army Corps of Engineers. 1987. Engineer Manual (EM) 1110-2-1201, Engineering and design – Reservoir Water Quality Analysis. U.S. Army Corps of Engineers, Department of the Army, Washington, D.C.
Cole, T.M., and Wells, S.A. 2003. CE-QUAL-W2: A Two-Dimensional, Laterally Averaged, Hydrodynamic and Water Quality Model, Version 3.2. Instruction Report EL-03-1, U.S. Army Engineering and Research Development Center, Vicksburg, MS.
U.S. Army Corps of Engineers, Omaha District. 2004. Environmental Assessment – Fort Peck Flow Modification Mini-Test. U.S. Army Corps of Engineers, Department of Army, Omaha, NE.
U.S. Army Corps of Engineers, Omaha District. 2007. Water Quality Special Study Report – Water Quality Conditions Monitored at the Corps’ Fort Peck Project in Montana during the 3-Year Period 2004 through 2006. U.S. Army Corps of Engineers, Department of Army, Omaha, NE.
U.S. Fish and Wildlife Service. 2000. Biological Opinion on the Operation of the Missouri River Main Stem Reservoir System, Operation and Maintenance of the Missouri River Bank Stabilization and Navigation Project, and Operation of the Kansas River Reservoir System. U.S. Fish and Wildlife Service, Denver, CO, Fort Snelling, MN.
Water Quality Modeling Report U.S. Army Corps of Engineers Fort Peck Lake Omaha District
59
7 PLATES
Water Quality Modeling Report U.S. Army Corps of Engineers Fort Peck Lake Omaha District
60
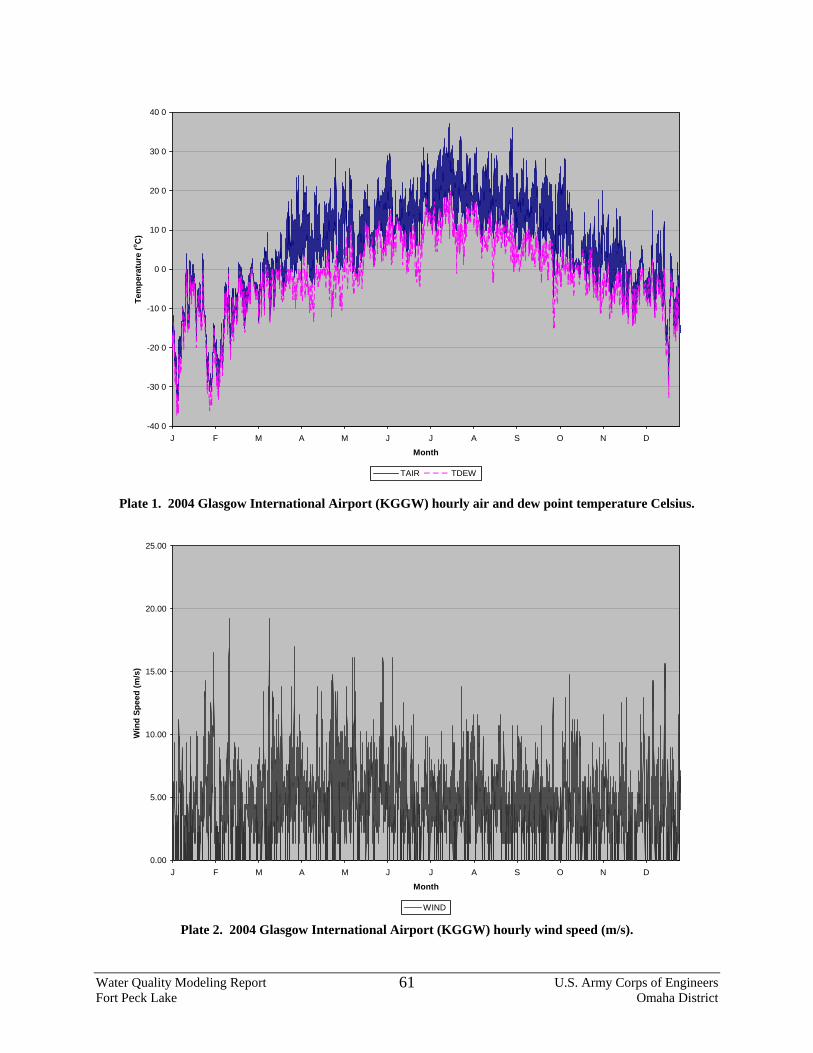
-40 0
-30 0
-20 0
-10 0
0 0
10 0
20 0
30 0
40 0
J F M A M J J A S O N D
Month
Tem
pera
ture
(o C)
TAIR TDEW
Plate 1. 2004 Glasgow International Airport (KGGW) hourly air and dew point temperature Celsius.
0.00
5.00
10.00
15.00
20.00
25.00
J F M A M J J A S O N D
Month
Win
d Sp
eed
(m/s
)
WIND
Plate 2. 2004 Glasgow International Airport (KGGW) hourly wind speed (m/s).
Water Quality Modeling Report U.S. Army Corps of Engineers Fort Peck Lake Omaha District
61
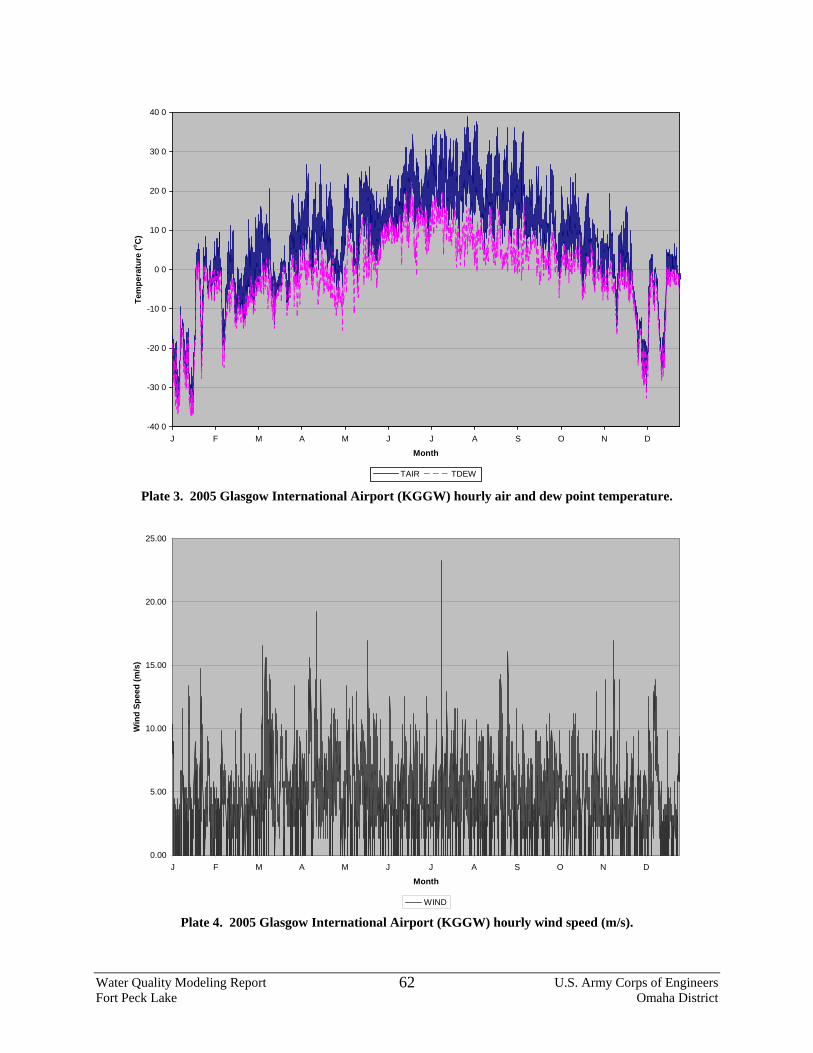
-40 0
-30 0
-20 0
-10 0
0 0
10 0
20 0
30 0
40 0
J F M A M J J A S O N D
Month
Tem
pera
ture
(o C)
TAIR TDEW
Plate 3. 2005 Glasgow International Airport (KGGW) hourly air and dew point temperature.
0.00
5.00
10.00
15.00
20.00
25.00
J F M A M J J A S O N D
Month
Win
d Sp
eed
(m/s
)
WIND
Plate 4. 2005 Glasgow International Airport (KGGW) hourly wind speed (m/s).
Water Quality Modeling Report U.S. Army Corps of Engineers Fort Peck Lake Omaha District
62
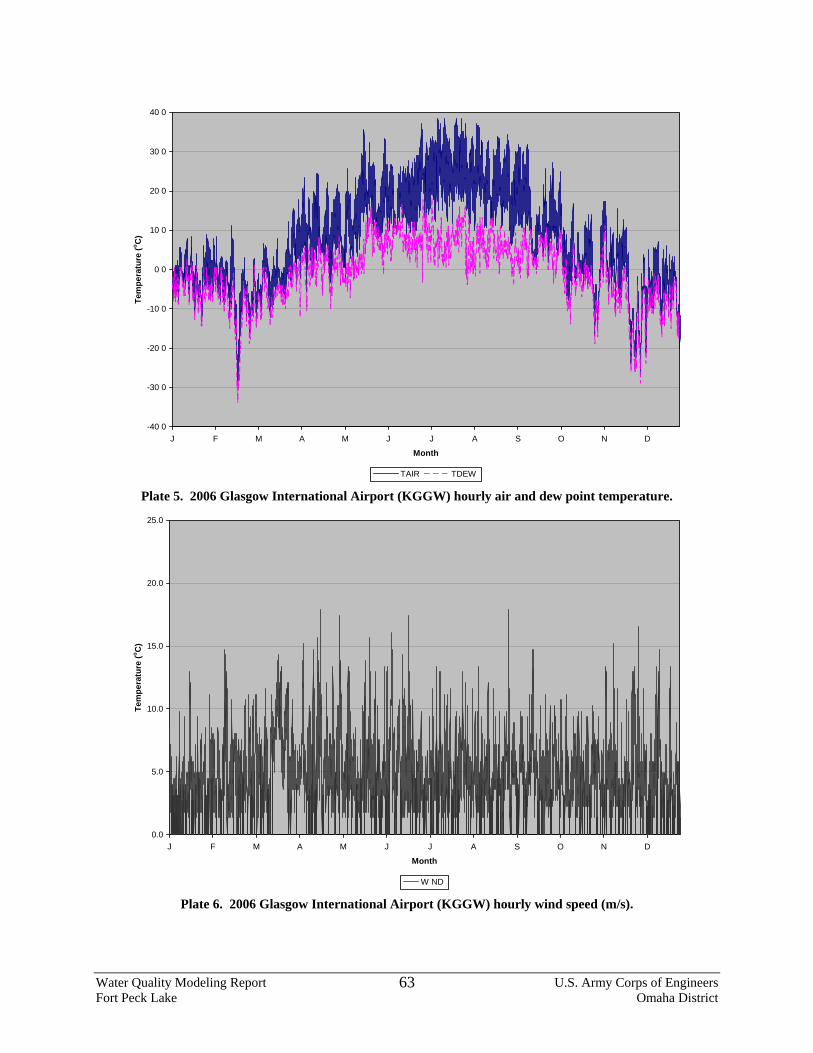
-40 0
-30 0
-20 0
-10 0
0 0
10 0
20 0
30 0
40 0
J F M A M J J A S O N D
Month
Tem
pera
ture
(o C)
TAIR TDEW
Plate 5. 2006 Glasgow International Airport (KGGW) hourly air and dew point temperature.
0.0
5.0
10.0
15.0
20.0
25.0
J F M A M J J A S O N D
Month
Tem
pera
ture
(o C)
W ND
Plate 6. 2006 Glasgow International Airport (KGGW) hourly wind speed (m/s).
Water Quality Modeling Report U.S. Army Corps of Engineers Fort Peck Lake Omaha District
63
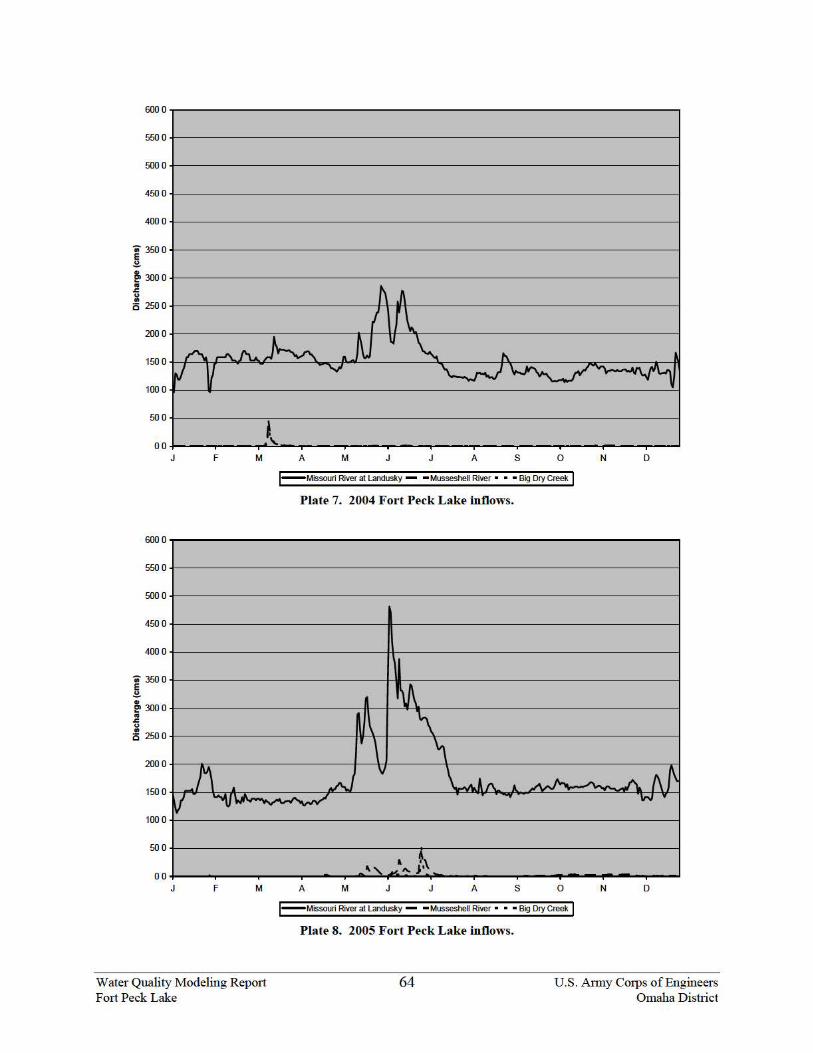
6000
5500
5000
4500
4000
.. 3500 E .!:!.
~ 3000 .. "" ~ 2500
/\.A
I "\_ A r-1\..l'u. ~ 1\_ N
""" 1\ •
2000
1500
1000
500
00
6000
5500
5000
4500
4000
.. 3500 E .!:!. • !:!' 300 0 .. "" ~ 2500
2000
,J v ,,
F M
.!\ .
v '-.,;-J~r~
A M J A s 0 N 0
!-Missouri River at Landusky - - Musseshell River • • • Big Dry Creek I Plate 7. 2004 Fort Peck Lake inflows.
• V\ '\ \ \ , v
LA~ ~(\~ ..A.) A. 1500 v ""11~~ .... W"
1000
500
00 F M
Water Quality Modeling Repmt Fmt Peck Lake
,, _:,.. j~ A M J A s 0 N 0
!-Missouri River at Landusky - - Musseshell River • • • Big Dry Creek I Plate 8. 2005 Fort Peck Lake inflows.
64 U.S. Anny Corps of Engineers Omaha District
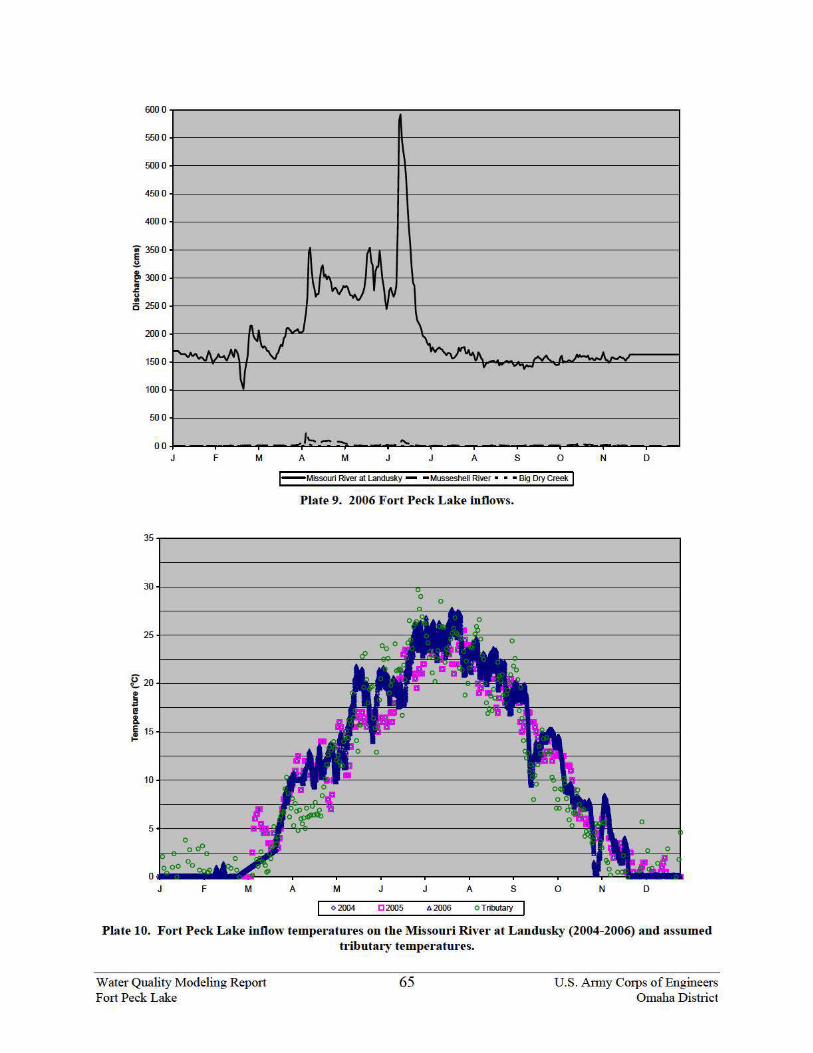
6000
5500
5000
4500
4000
I 3500
~ 3000 .. .II!
~ 2500
2000
1500
1000
500
00
~
~
J F
A. ~ v-~,
A tvJ
'V
''"'- .... M A M
\1' \
~ J'VI... A.-...A ..- ....,.., -
"'-J A s 0 N D
I-Missouri River at Landusky - - Musseshell River • • • Big Dry Creek I Plate 9. 2006 Fort Peck Lake inflows.
~20 +-------------------------~
s I! &. i 1 5 +-------------------~ .-
J F M A M
<> 2004
J A s 0 2005 1> 2006 OTributary
0 N D
Plate 10. Fort Peck Lake inflow temperatures on the Missouri River at Lao dusky (2004-2006) and assumed tributary tempemtures.
Water Quality Modeling Repot1 Fmt Peck Lake
65 U.S. Anny Corps of Engineers Omaha District
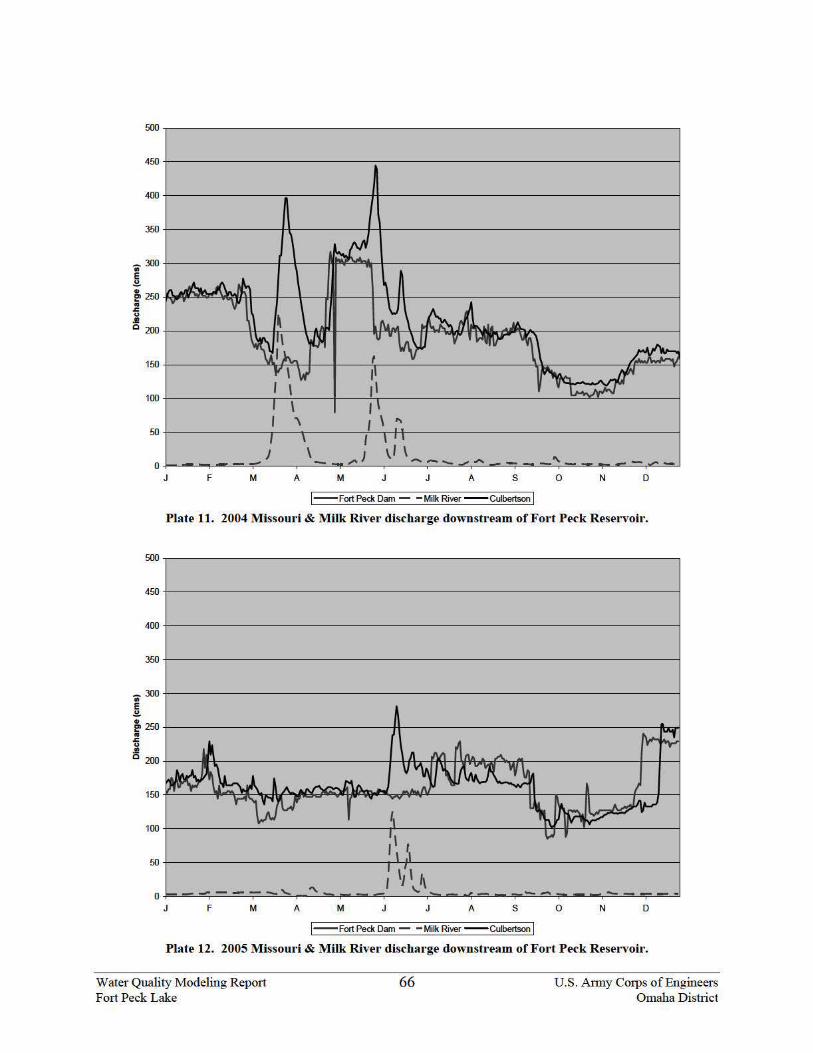
~0 .------------------------------------------------------------------------.
4~ +-----------------------------------------------------------------------~
400 +----------------.-----------,H-----------------------------------------~
' J \ _,.} \1 \ -"--- ......... ._ .....
F M A M J A s 0 N D
Fort Peck Dam -Milk River Culbertson I Plate 11. 2004 Missouri & Milk River discharge downstream of Fort Peck Reservoil'.
500
450
400
350
-300 • e .2.
e. 250 .. .t:!
j Q 200
1~
100
50
0 _ _,_ ___ ..... , " -- ------
J F M A M J A s 0 N D
I--Fort Peck Dam- -Milk River --Culbertson I Plate 12. 2005 Missoul'i & Milk Rivet· discharge downstream of Fort Peck Reservoir.
Water Quality Modeling Repot1 Fmt Peck Lake
66 U.S. Anny Corps of Engineers Omaha District
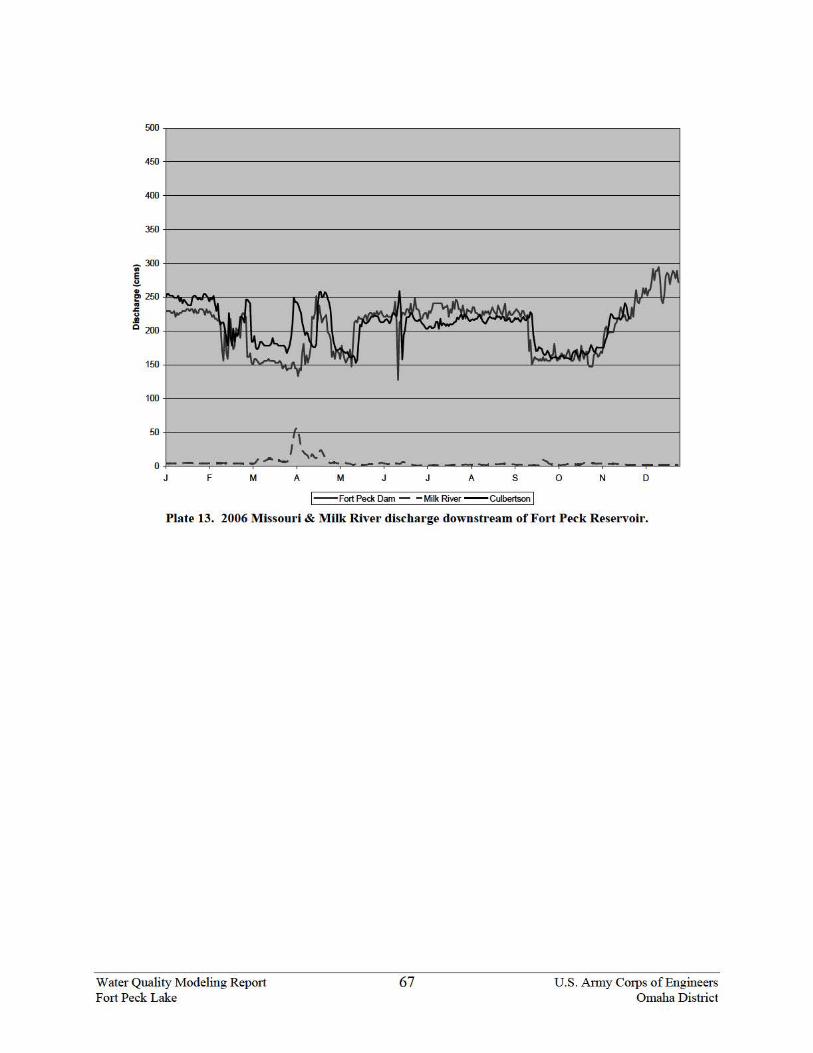
500
450
400
350
- 300 • E .!:!.
; 250 .. "" .. .II c 200
150
100
50
0
\
I '"'" ----J~~ __ _, J F M A M J A s 0 N D
Fort Peck Dam -Milk River Culbertson I Plate 13. 2006 Missouri & Milk River discharge downstream of Fort Peck Reservok.
Water Quality Modeling Repmt Fmt Peck Lake
67 U.S. Anny Corps of Engineers Omaha District
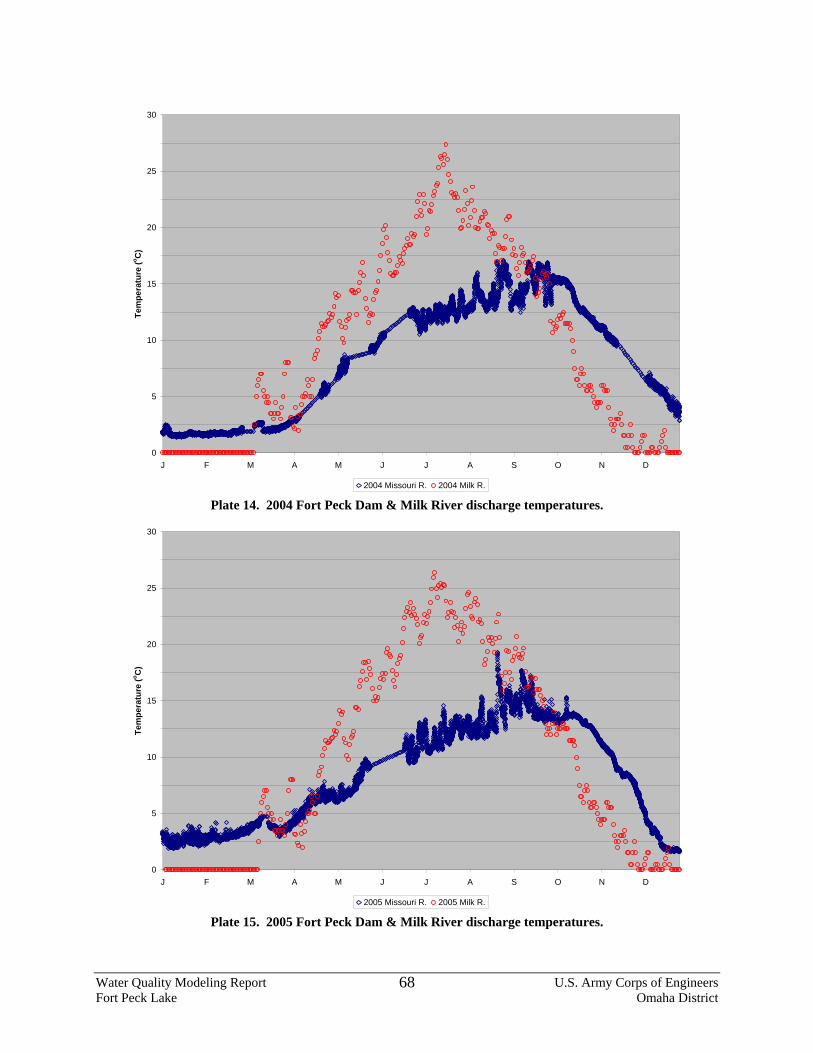
0
5
10
15
20
25
30
J F M A M J J A S O N D
Tem
pera
ture
(o C)
2004 Missouri R. 2004 Milk R. Plate 14. 2004 Fort Peck Dam & Milk River discharge temperatures.
0
5
10
15
20
25
30
J F M A M J J A S O N D
Tem
pera
ture
(o C)
2005 Missouri R. 2005 Milk R. Plate 15. 2005 Fort Peck Dam & Milk River discharge temperatures.
Water Quality Modeling Report U.S. Army Corps of Engineers Fort Peck Lake Omaha District
68
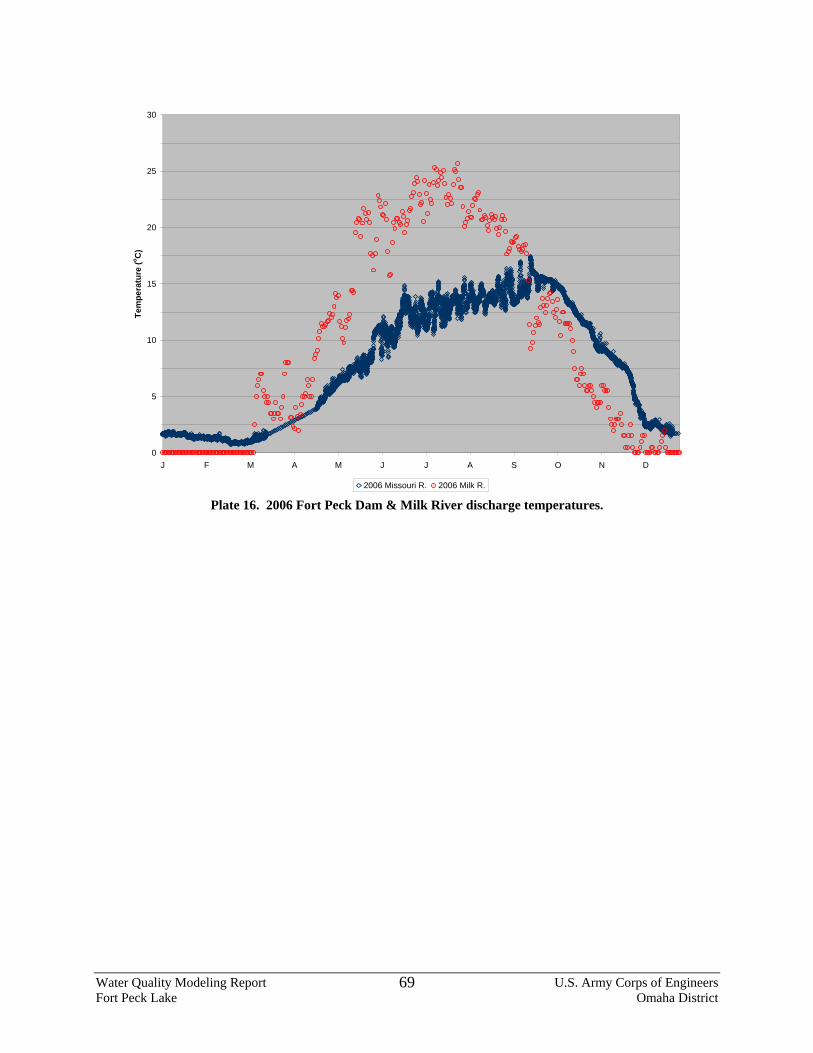
0
5
10
15
20
25
30
J F M A M J J A S O N D
Tem
pera
ture
(o C)
2006 Missouri R. 2006 Milk R. Plate 16. 2006 Fort Peck Dam & Milk River discharge temperatures.
Water Quality Modeling Report U.S. Army Corps of Engineers Fort Peck Lake Omaha District
69
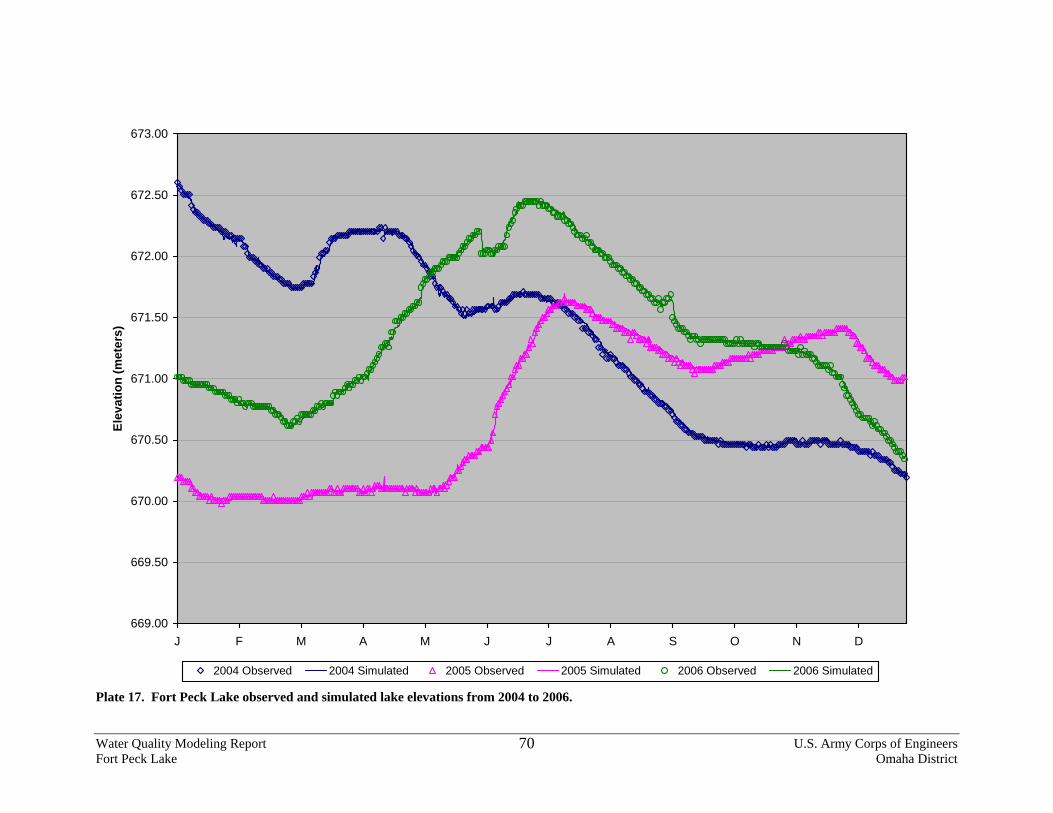
669.00
669.50
670.00
670.50
671.00
671.50
672.00
672.50
673.00
J F M A M J J A S O N D
Elev
atio
n (m
eter
s)
2004 Observed 2004 Simulated 2005 Observed 2005 Simulated 2006 Observed 2006 Simulated
Plate 17. Fort Peck Lake observed and simulated lake elevations from 2004 to 2006.
Water Quality Modeling Report U.S. Army Corps of Engineers Fort Peck Lake Omaha District
70
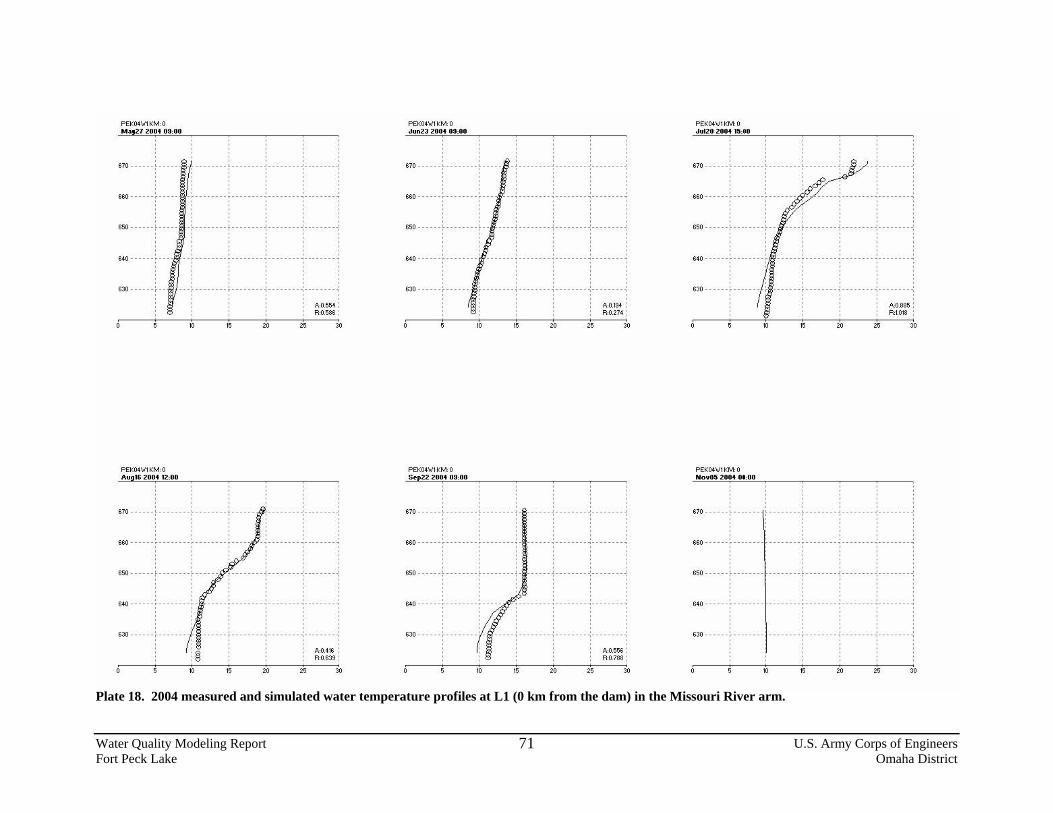
Plate 18. 2004 measured and simulated water temperature profiles at L1 (0 km from the dam) in the Missouri River arm.
Water Quality Modeling Report U.S. Army Corps of Engineers Fort Peck Lake Omaha District
71
PEK04\o/1 KM: 0 Mat27 2004 OS:OO
670 ------ ~------
660 ------:-----
650 ----- _,-----
640 ------ ~----
630 ------ ~--
PEK04\o/1 KM: 0 Auq16 2004 12:00
10
670 ------ ~--------
660 ------:--------
650 ----- _,--------
640 ------ ~--------
630 ------ ~--------
15 20
15 20
25
25
A:0.554 R,0.586
30
A:0.416 R,0.639
30
PEK04\o/1 KM: 0 Jun23 2004 OS:OO
670 ------ ~--------
660 ------:--------
650 ----- _,--------
640 ------ ~--------
630 ------ ~------
PEK04\o/1 KM: 0 S~p22 2004 OS:OO
670 ------ ~--------
660 ------:--------
650 ----- _,--------
640 ------ ~--------
630 ------ ~--------
15
15
20 25
20 25
A:0.194 R:0.274
30
A,0.556 R,0.788
30
PEK04\o/1 KM: 0 Jul20 2004 15:1)0
670 ------ ~-- ------
660 ------:--------
650 ----- _,-- ------
640 ------ ~-- ------
630 ------ ~-- -----
PEK04\o/1 KM: 0 Nov05 2004 Ot:OO
670 ------ ~-- -----
660 ------:--------
650 ----- _,-- ------
15 20 25
A,0.885 R,1.018
30
640 ------ ~-- ------ -------- -------- -------- --------
630 ------ ~-- ------
10 15 20 25 30

Plate 19. 2004 measured and simulated water temperature profiles at L2 (10 km from the dam) in the Missouri River arm.
Water Quality Modeling Report U.S. Army Corps of Engineers Fort Peck Lake Omaha District
72
PEK04\o/1 KM: 10 Mat29 2004 00:00
670 ------ ~--------
660 ------:-------
650 ----- _,------
640 ------~---- ---~-------- -------- -------- --------
630 ------ ~----
PEK04\o/1 KM: 10 Auq16 2004 09:00
10
670 ------ ~--------
660 ------:--------
650 ----- _,--------
640 ------ ~--------
630 ------ ~--------
10
15
15
20
20
25 30
A,0.629 R,0.750
25 30
PEK04\o/1 KM: 10 Jun23 2004 12:00
670 ------ ~--------
660 ------:--------
650 ----- _,--------
640 ------ ~-------
630 ------ ~------
PEK04\o/1 KM: 10 s~p23 2004 06:oo
10
670 ------ ~--------
660 ------:--------
15 20
A:0.456 R:0.540
25 30
650 ----- _,-------- -------- - ----- -------- --------
640 ------ ~--------
630 ------ ~--------
10 15 20
A,0.352 R:0.486
25 30
PEK04\o/1 KM: 10 Jul20 2004 15:1)0
670 ------ ~-- ------
660 ------:--------
650 ----- _,-- ------
640 ----- -~-- ------ ------ ·--------~--------
630 ------ ~-- -----
PEK04\o/1 KM: 10 Nov05 2004 Ot:OO
10
670 ------ ~-- ------
660 ------:--------
15 20
A,0.631 R,0.823
25 30
650 ----- _,-- ------:-------- -------- -------- --------
640 ------ ~-- ------: -------- -------- -------- --------
630 ------ ~-- ------' --------
10 15 20 25 30

Plate 20. 2004 measured and simulated water temperature profiles at L3 (25 km from the dam) in the Missouri River arm.
Water Quality Modeling Report U.S. Army Corps of Engineers Fort Peck Lake Omaha District
73
PEK04\o/1 KM: 25 Mat29 2004 00:00
670 ------ ~--------
660 ------:------ •• --------
650 ----- _,---- ------------ -------- -------- --------
640 ------~---- ---~-------- -------- -------- --------
630 ----- -~------- -~--------
PEK04\o/1 KM: 25 Auq16 2004 18:00
10
670 ------ ~--------
660 ------:--------
650 ----- _,--------
640 ------ ~--------
630 ------ ~--------
10
15
15
20 25
20 25
30
A:0.616 R,0.869
30
PEK04\o/1 KM: 25 Jun23 2004 18:00
670 ------ ~--------
660 ------:--------
650 ----- _,--------
640 ------ ~-------
630 - - - - - - ~ - - - - - - - - ~ - - - - - - - - ; - - - - - - - -
PEK04\o/1 KM: 25 s~p22 2004 12:oo
10
670 ------ ~--------
660 ------:--------
650 ----- _,--------
640 ------ ~--------
630 ------ ~--------
10
15 20
15 20
25
25
A,0.863 R,0.963
30
A:0.466 R,0.690
30
PEK04\o/1 KM: 25 Jul21 2004 06:1)0
670 • • • • • • ~ • • •• • • • • • • • • • • • • I • • • • • • • •
0 660 ------:--------
650 ----- _,-- ------ ---------------------
640 ----- -~-- ------ ------ ·--------~--------
630 - - - - - - ~ - - -- - --- ~ -------- ; -------- ~--- - - - - -
PEK04\o/1 KM: 25 Nov05 2004 Ot:OO
670 ------ ~-- ----
660 ------:-------
10 15 20 25
A,0.813 R,0.879
30
650 ----- _,-- ----- -------- -------- -------- --------
640 ------ ~-- ----- -------- -------- -------- --------
630 ------ ~-- ------
10 15 20 25 30
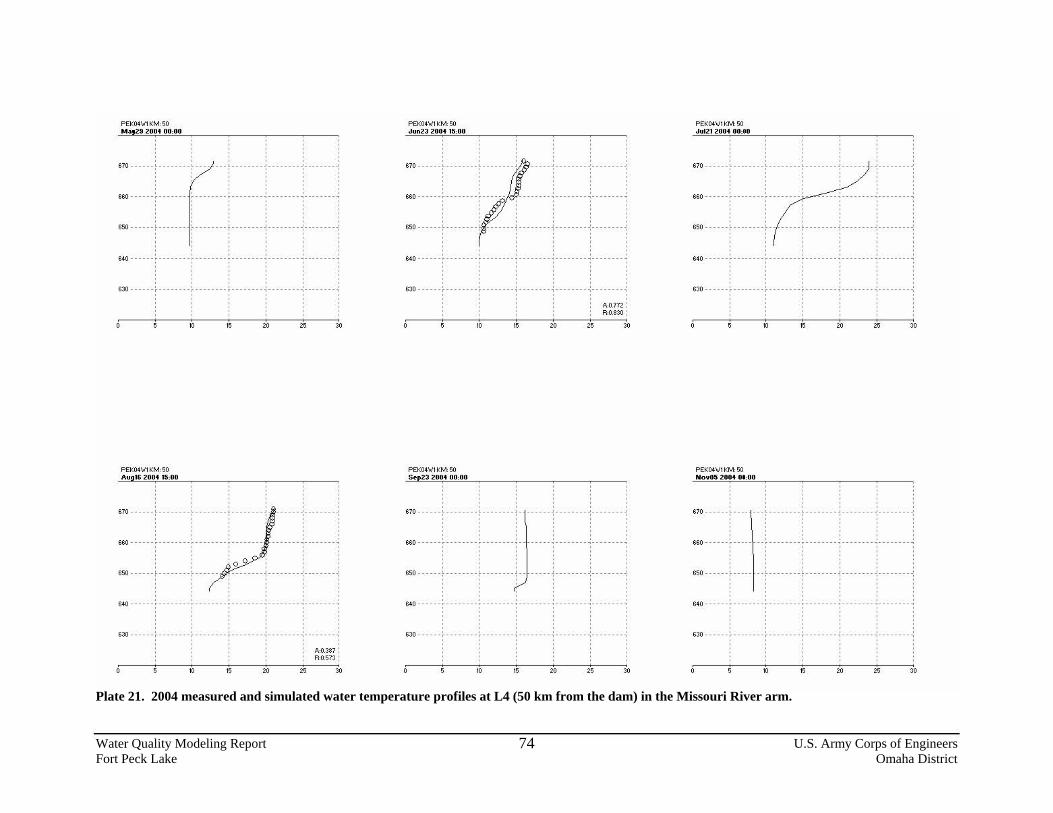
Plate 21. 2004 measured and simulated water temperature profiles at L4 (50 km from the dam) in the Missouri River arm.
Water Quality Modeling Report U.S. Army Corps of Engineers Fort Peck Lake Omaha District
74
PEK04\o/1 KM: 50 Mat29 2004 00:00
670 ------ ~--------
660 ------:-------
650 ----- _,------- -------- -------- --------
640 ------~--------~-------- -------- -------- --------
630 ----- -~------- -~--------
PEK04\o/1 KM: 50 Auq16 2004 15:00
10
670 ------ ~--------
660 ------:--------
650 ----- _,--------
640 ------ ~--------
630 ------ ~--------
10
15
15
20 25
20 25
30
A,0.387 R,0.573
30
PEK04\o/1 KM: 50 Jun23 2004 15:00
670 ------ ~--------
660 ------:--------
640 ------~--------~--------:-------- -------- --------
- - -- - -- - -- - -- - -
630 - - - - - - ~ - - - - - - - - ~ - - - - - - - - ; - - - - - - - -
PEK04\o/1 KM: 50 s~p23 2004 oo:oo
10
670 ------ ~--------
660 ------:--------
650 ----- _,--------
640 ------ ~--------
630 ------ ~--------
10
15 20
--------u·------, 15 20
25
25
A,0.772 R,0.830
30
30
PEK04\o/1 KM: 50 Jul21 2004 OO:GO
670 ------ ~-- ------
660 ------:--------
650 ----- _,-- ------ -----------------------
640 ------~-------- --------·--------~--------
630 ------ ~-- ------
PEK04\o/1 KM: 50 Nov05 2004 Ot:OO
10
670 _____ -: ____
1
__ 660 ----- ·:-- --- --
650 ----- _,-- --- --
640 ------ ~-- ------
630 ------ ~-- ------
10
15 20
15 20
25 30
25 30
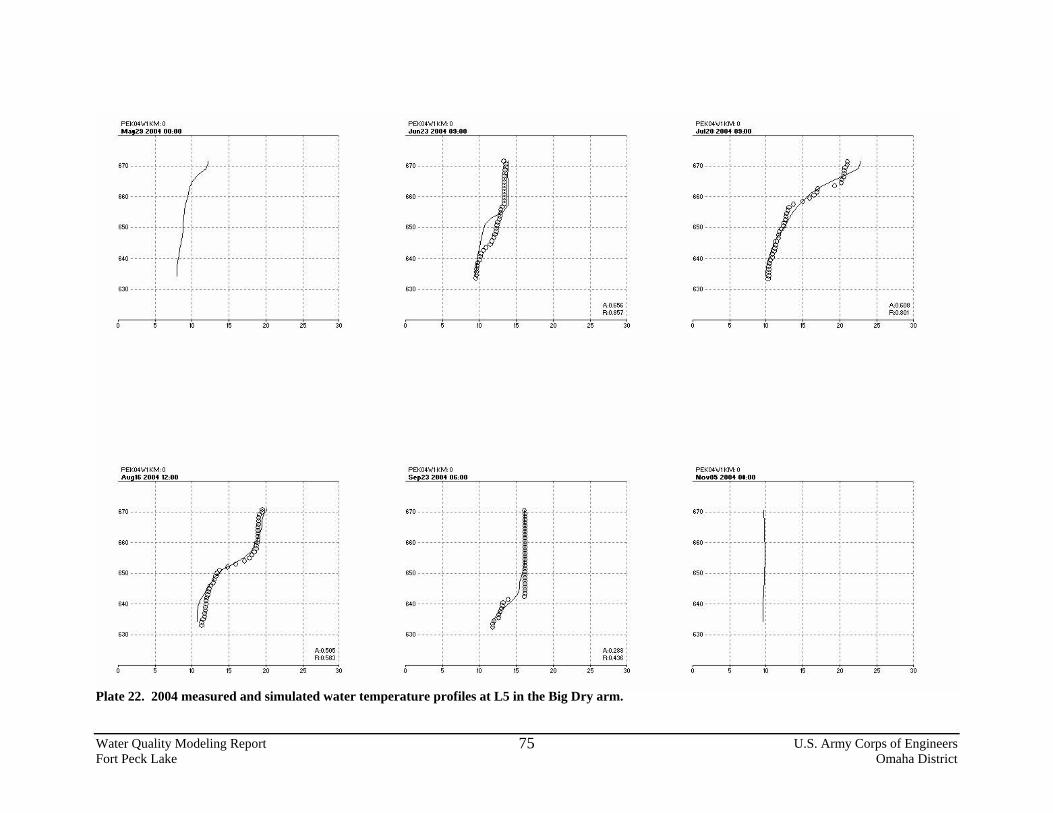
Plate 22. 2004 measured and simulated water temperature profiles at L5 in the Big Dry arm.
Water Quality Modeling Report U.S. Army Corps of Engineers Fort Peck Lake Omaha District
75
PEK04\o/1 KM: 0 Mat29 2004 00:00
670 ------ ~--------
660 ------:-------
650 ----- _,------
640 ----- -~------- -~--------
630 ----- -~------- -~--------
PEK04\o/1 KM: 0 Auq16 2004 12:00
10
670 ------ ~--------
660 ------:--------
650 ----- _,--------
640 ------ ~--------
630 ------ ~--------
10
15
15
20 25
20 25
30
A,0.505 R,0.583
30
PEK04\o/1 KM: 0 Jun23 2004 09:00
670 ------ ~--------
660 ------:--------
650 ----- _,--------
640 ------ ~-------
630 ----- -~------- -~--------
PEK04\o/1 KM: 0 s~p23 2004 06:oo
10
670 ------ ~--------
660 ------:--------
650 ----- _,--------
640 ------ ~--------
630 ------ ~--------
10
15 20
0 _; _______ _
15 20
25
25
A,0.656 R,0.857
30
A,0.288 R:0.436
30
PEK04\o/1 KM: 0 Jul20 2004 09:00
670 ------ ~-- ------
660 ------:--------
650 ----- _,-- ------
640 ------ ~-- ------
630 - - - - - - ~ - - -- - - - - ~ - - - - - - -- ; -------- ~--- - - - - -
PEK04\o/1 KM: 0 Nov05 2004 Ot:OO
670 ------ ~-- -----
10 15
660 ------:--------
650 ----- _,-- ----- _,--------
640 ------ ~-- -----
630 ----- -~-- ----- -~---- ----
10 15
20
20
25
25
A,o.6os R,0.801
30
30
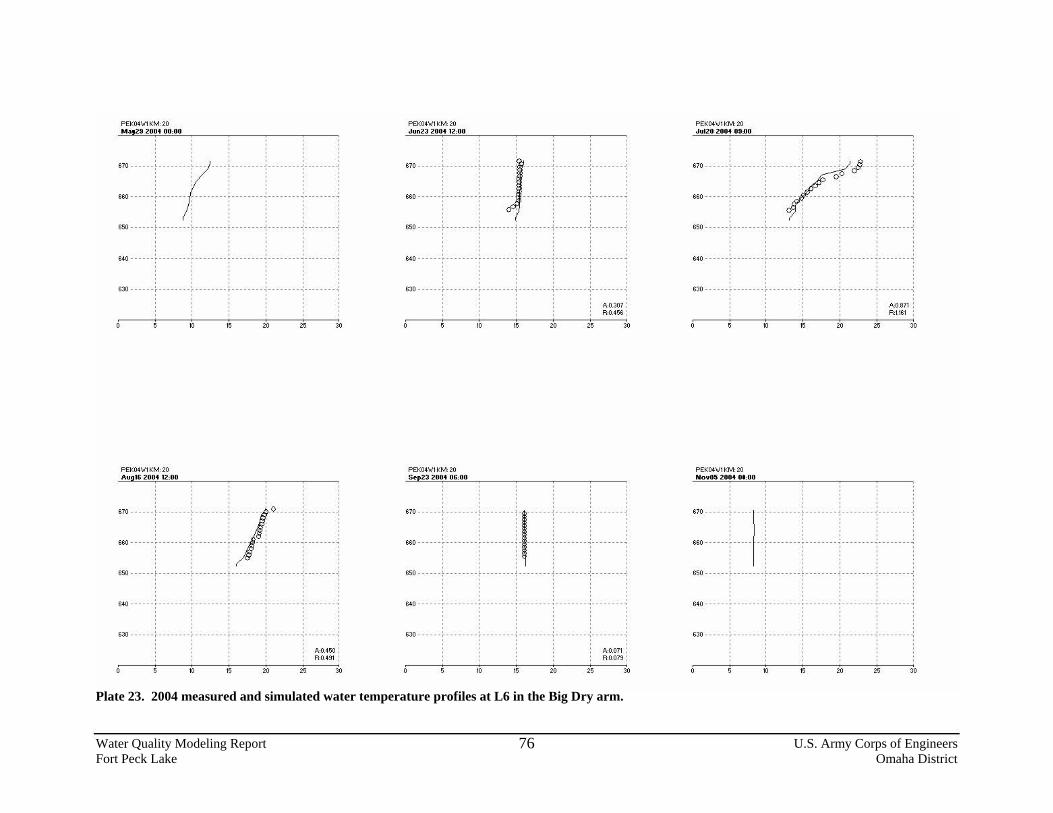
Plate 23. 2004 measured and simulated water temperature profiles at L6 in the Big Dry arm.
Water Quality Modeling Report U.S. Army Corps of Engineers Fort Peck Lake Omaha District
76
PEK04\o/1 KM: 20 Mat29 2004 00:00
670 ------~--------;----
660 ------:------;r --------
650 ----- _,------- _,--------
640 ----- -~------- -~--------
630 ----- -~------- -~--------
PEK04\o/1 KM: 20 Auq16 2004 12:00
10
670 ------ ~--------
660 ------:--------
650 ----- _,--------
640 ------ ~--------
630 ------ ~--------
10
15
15
20 25
-----~Q _____ _
-;;~-:--------
20 25
30
A:0.450 R:0.491
30
PEK04\o/1 KM: 20 Jun23 2004 12:00
670 ------ ~--------
660 ------:--------
650 ----- _,--------
640 ------ ~--------
630 ------ ~--------
PEK04\o/1 KM: 20 s~p23 2004 06:oo
10
670 ------ ~--------
660 ------:--------
650 ----- _,--------
640 ------ ~--------
630 ------ ~--------
10
-------- ~-------
------~-------
15 20
-~------
- ------
15 20
25
25
A,0.307 R:0.456
30
A,0.071 R,0.079
30
PEK04\o/1 KM: 20 Jul20 2004 09:00
670 ------ ~-- ------
660 ------:--------
650 ----- _,-- ------
640 ------ ~-- ------
630 ------ ~-- ------
PEK04\o/1 KM: 20 Nov05 2004 Ot:OO
670 ------ ~-- ---
660 ------:-----
10
--------:? ·#--····r ······:·-------
15 20 25
A,0.871 R,1.161
650 ----- _,-- ------ -------- -------- -------- --------
640 ------ ~-- ------ -------- -------- -------- --------
630 ------ ~-- ------
10 15 20 25
30
30
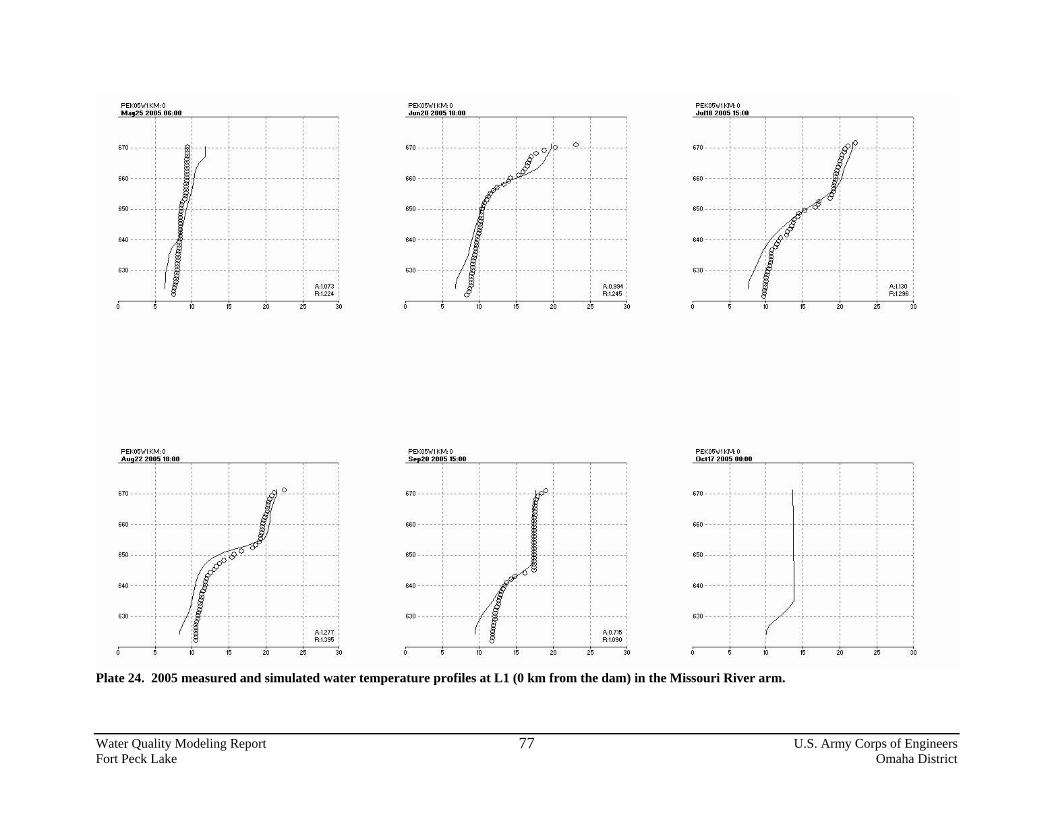
Plate 24. 2005 measured and simulated water temperature profiles at L1 (0 km from the dam) in the Missouri River arm.
Water Quality Modeling Report U.S. Army Corps of Engineers Fort Peck Lake Omaha District
77
PEK05\o/1 KM: 0 Mat25 2005 06:00
670 ------ ~------
660 ------:------
650 ----- _,-----
640 ------ ~----
PEK05\o/1 KM: 0 Aus22 2005 18:00
10
670 ------ ~--------
660 ------:--------
650 ----- _,--------
640 ------ ~--------
630 ------ ~-------
15
15
20 25
_q __ _
20 25
M073 R:1.224
M277 R,1.395
30
30
PEK05\o/1 KM: 0 Jun20 2005 18:00
670 ------ ~--------
660 ------:--------
650 ----- _,--------
640 ------ ~------
630 ------ ~---
PEK05\o/1 KM: 0 s~p20 20o5 15:oo
670 ------ ~--------
660 ------:--------
--- .C! --
- - -r········r·······-,········
15 20 25
A:0.994 R:1.245
30
650 ----- _,-------- -------- --- --- -------- --------
640 ------ ~--------
630 ------ ~--------
15 20 25
A,0.715 R,1.090
30
PEK05\o/1 KM: 0 Jul18 2005 15:(10
670 ----- -~-- -- ----~--------
660 ------:--------:--------
650 ----- _,-- ----- _,--------
- r - -640 ------~--------~- ----·--------~--------- - -- - -. . . . . . . . . . . . . . . .
630 ------~----- -- -------;--------~--------- - -- - -- - -- - -- - -- - -
PEK05\o/1 KM: 0 Oct17 2005 00:00
10
670 ------ ~-- ------
660 ------:--------
15 20 25
M130 R,1.296
650 ----- _,-- ------ ------ - -------- -------- --------
640 ------ ~-- ------ ------ - -------- -------- --------
630 ------ ~-- ------
10 15 20 25
30
30

Plate 25. 2005 measured and simulated water temperature profiles at L2 (10 km from the dam) in the Missouri River arm.
Water Quality Modeling Report U.S. Army Corps of Engineers Fort Peck Lake Omaha District
78
PEK05\o/1 KM: 10 Mat25 2005 06:00
670 ------ ~--------
660 ------:--------
650 ----- _,------- -------- -------- --------
640 ------~--- ----~-------- -------- -------- --------
630 ------ ~--
PEK05\o/1 KM: 10 Auq22 2005 15:00
10
670 ------ ~--------
660 ------:--------
650 ----- _,--------
640 ------ ~--------
15 20
630 ------ ~------. . . ·r········r·······-,········
10 15 20
25
25
30
A,0.650 R,0.765
30
PEK05\o/1 KM: 10 Jun20 2005 18:00
670 ------ ~--------
660 ------:--------
650 ----- _,-------- -------------------------
640 ------ ~-----
630 ------ ~---
PEK05\o/1 KM: 10 s~p20 20o5 12:oo
10
670 ------ ~--------
660 ------:--------
650 ----- _,--------
640 ------ ~--------
630 ------ ~--------
10
15 20
15 20
25
25
A:0.340 R:0.437
30
A,0.258 R,0.350
30
PEK05\o/1 KM: 10 Jul18 2005 15:(10
670 ------ ~-- ------
660 ------:--------
650 ----- _,-- ------
0
640 ----- -~-- ------ ------ ·--------~--------
PEK05\o/1 KM: 10 Oct17 2005 00:00
10
670 ------ ~-- ------
660 ------:--------
650 ----- _,-- ------
15 20 25
A,0.963 R,1.180
30
640 ------ ~-- ------ ------ - -------- -------- --------
630 ------ ~-- ------
10 15 20 25 30
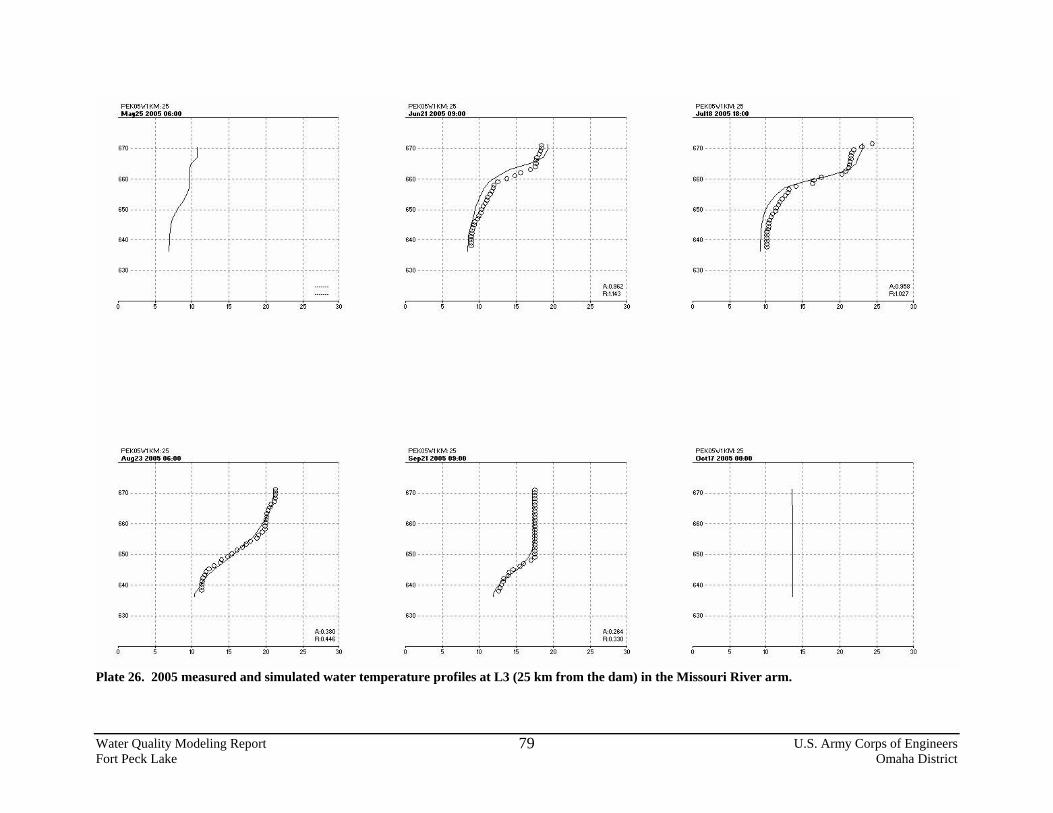
Plate 26. 2005 measured and simulated water temperature profiles at L3 (25 km from the dam) in the Missouri River arm.
Water Quality Modeling Report U.S. Army Corps of Engineers Fort Peck Lake Omaha District
79
PEK05\o/1 KM: 25 Mat25 2005 06:00
670 ------ ~--------
660 ------:------- • --------
650 ----- _,----
640 ------ ~--
630 ----- -~------- -~--------
PEK05\o/1 KM: 25 Auq23 2005 06:00
10
670 ------ ~--------
660 ------:--------
650 ----- _,--------
640 ------ ~--------
630 ------ ~--------
10
15
15
20 25
20 25
30
A,0.380 R:0.446
30
PEK05\o/1 KM: 25 Jun21 2005 OS:OO
670 ------ ~--------
660 ------:--------
650 ----- _,-------
640 ------ ~-----
630 - - - - - - ~ - - - - - - - - ~ - - - - - - - - ; - - - - - - - -
PEK05\o/1 KM: 25 S~p21 2005 OS:OO
10
670 ------ ~--------
660 ------:--------
650 ----- _,--------
640 ------ ~--------
630 ------ ~--------
10
15 20
15 20
25
25
A,0.962 R:1.143
30
A:0.264 R,0.330
30
PEK05\o/1 KM: 25 Jul18 2005 18:(10
670 ------ ~-- ------
660 ------:--------
650 ----- _,-- ------
640 ------ ~-- -----
-~~--------
-----;-------- ~-------- -:--------. . . . . . . . . . . . . . . . . . ------- 0-------- ~-------- ... -------. . . . . . . . . . . . . . . . . .
630 - - - - - - ~ - - -- - - - - ~ - - - - - --- ; -------- ~--- - - - - - ~- - - - - - - -
PEK05\o/1 KM: 25 Oct17 2005 00:00
10
670 ------ ~-- ------
660 ------:--------
650 ----- _,-- ------
640 ------ ~-- ------
630 ------ ~-- ------
10
15
15
20 25
20 25
A,0.958 R,1.027
30
30
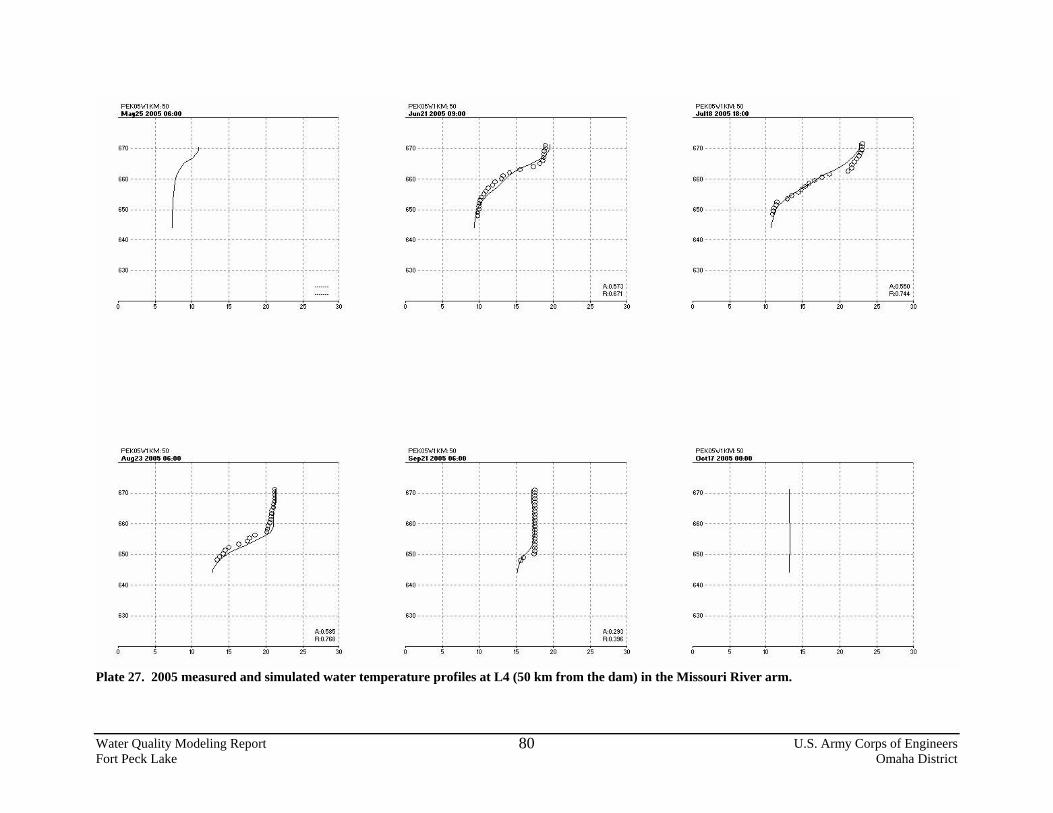
Plate 27. 2005 measured and simulated water temperature profiles at L4 (50 km from the dam) in the Missouri River arm.
Water Quality Modeling Report U.S. Army Corps of Engineers Fort Peck Lake Omaha District
80
PEK05\o/1 KM: 50 Mat25 2005 06:00
670 ----- -~---~--- -~--------
660 ------:---- ---:--------
650 ----- _,--- --- _,--------
640 ------~--------~-------- -------- -------- --------
630 ----- -~------- -~--------
PEK05\o/1 KM: 50 Auq23 2005 06:00
10
670 ------ ~--------
660 ------:--------
650 ----- _,--------
640 ------ ~--------
630 ------ ~--------
10
15
15
20 25
20 25
30
A,0.585 R,0.768
30
PEK05\o/1 KM: 50 Jun21 2005 OS:OO
670 ------ ~--------
660 ------:--------
650 ----- _,-------
0
640 ------~--------~--------:-------- -------- --------
- - -- - -- - -- - -- - -
630 - - - - - - ~ - - - - - - - - ~ - - - - - - - - ; - - - - - - - -
PEK05\o/1 KM: 50 s~p21 20o5 06:oo
10
670 ------ ~--------
660 ------:--------
650 ----- _,--------
640 ------ ~--------
630 ------ ~--------
10
15 20
15 20
25
25
A,0.573 R,0.671
30
A,0.293 R,0.396
30
PEK05\o/1 KM: 50 Jul18 2005 18:(10
670 ------ ~-- ------
660 ------:--------
650 ----- _,-- ------
640 ------~-------- --------·--------~--------
630 ------ ~-- ------
PEK05\o/1 KM: 50 Oct17 2005 00:00
10
670 ------ ~-- ------
660 ------:--------
650 ----- _,-- ------
640 ------ ~-- ------
630 ------ ~-- ------
10
15 20
15 20
25
25
A,0.550 R:0.744
30
30
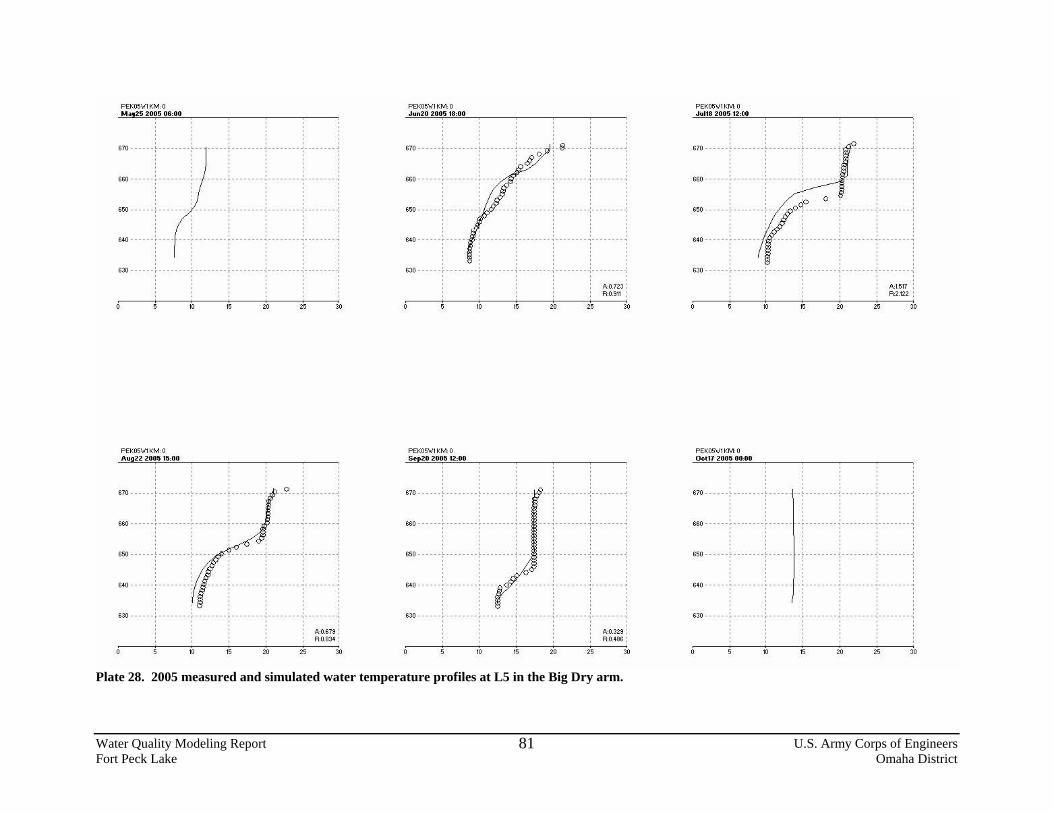
Plate 28. 2005 measured and simulated water temperature profiles at L5 in the Big Dry arm.
Water Quality Modeling Report U.S. Army Corps of Engineers Fort Peck Lake Omaha District
81
PEK05\o/1 KM: 0 Mat25 2005 06:00
670 ------ ~--------
660 ------:--------
650 ----- _,--------
640 ------~---- ---~-------- -------- -------- --------
630 ----- -~------- -~--------
PEK05\o/1 KM: 0 Auq22 2005 15:00
10
670 ------ ~--------
660 ------:--------
650 ----- _,--------
640 ------ ~--------
15 20
630 - - - - - - ~ - - - - - - - - ~ - - - - - - - - ; - - - - - - - - ~ - - - - - - - -
10 15 20
25
25
30
A,0.679 R:0.834
30
PEK05\o/1 KM: 0 Jun20 2005 18:00
670 ------ ~--------
660 ------:--------
650 ----- _,--------
640 ------ ~------
-8 ----- --------
630 - - - - - - ~ - - - - - - - - ~ - - - - - - - - ; - - - - - - - -
PEK05\o/1 KM: 0 s~p20 20o5 12:oo
10
670 ------ ~--------
660 ------:--------
650 ----- _,--------
640 ------ ~--------
630 ------ ~--------
10
15
15
20 25
20 25
A,0.723 R,0.911
30
A,0.329 R:0.486
30
PEK05\o/1 KM: 0 Jul18 2005 12:00
670 ----- -~-- ----- -~--------
660 ------:--------:--------
630 - - - - - - ~ - - -- - - - - ~ - - - - - - -- ; -------- ~--- - - - - -
PEK05\o/1 KM: 0 Oct17 2005 00:00
10
670 ------ ~-- ------
660 ------:--------
650 ----- _,-- ------
15 20 25
M517 R:2.122
640 ------ ~-- ------ ------ - -------- -------- --------
630 ------ ~-- ------
10 15 20 25
30
30
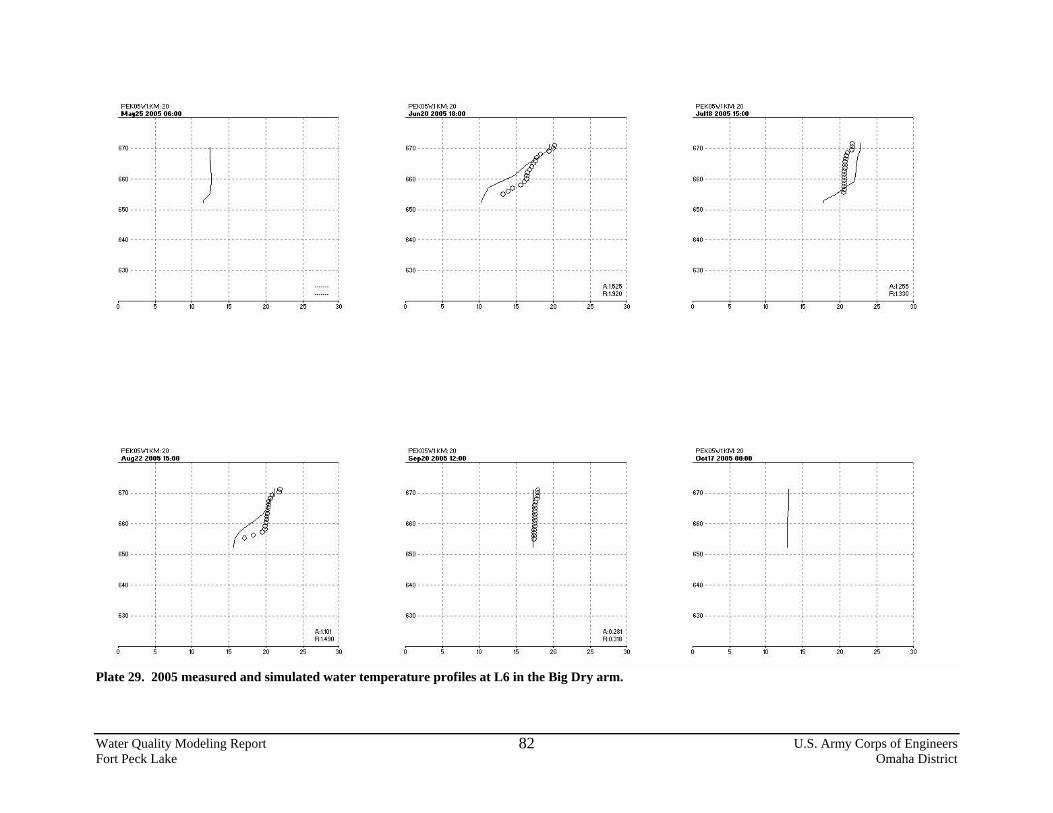
Plate 29. 2005 measured and simulated water temperature profiles at L6 in the Big Dry arm.
Water Quality Modeling Report U.S. Army Corps of Engineers Fort Peck Lake Omaha District
82
PEK05\o/1 KM: 20 Mat25 2005 06:00
670 ------ ~--------
660 ------:--------
650 ----- _,--------
640 ------ ~--------
630 ------ ~--------
PEK05\o/1 KM: 20 Auq22 2005 15:00
10
670 ------ ~--------
660 ------:--------
650 ----- _,--------
640 ------ ~--------
630 ------ ~--------
10
"") """" ---- ---
15
15
20
-------18 ....
"(~~~--
20
25
25
M101 R:1.490
30
30
PEK05\o/1 KM: 20 Jun20 2005 18:00
--~ 670 ----- -~------- -~--------!------- -------. . . . . . . . . . . . . . . .
- - -660 ------:--------:----- -:- -----:--------
: : ooO: : . . . . . . . . 650 ----- _,------- _,--------;-------- ;--------
640 - - - - - - ~ - - - - - - - - ~ - - - - - - - - : - - - - - - - - ~ - - - - - - - -. . . . . . . . . . . . . . . . . . . . 630 - - - - - - ~ - - - - - - - - ~ - - - - - - - - ; - - - - - - - - ~ - - - - - - - -
PEK05\o/1 KM: 20 s~p20 20o5 12:oo
10
670 ------ ~--------
660 ------:--------
650 ----- _,--------
640 ------ ~--------
630 ------ ~--------
10
15 20
15 20
25
25
M525 R,1.920
A,0.281 R,0.318
30
30
PEK05\o/1 KM: 20 Jul18 2005 15:(10
670 ------ ~-- ------
660 ------:--------
650 ----- _,-- ------
640 ------ ~-- ------
630 ------ ~-- ------
PEK05\o/1 KM: 20 Oct17 2005 00:00
10
670 ------ ~-- ------
660 ------:--------
650 ----- _,-- ------
640 ------ ~-- ------
630 ------ ~-- ------
10
-----jJ··j·· ----------- ~ - ----
15 20
15 20
25
25
M255 R,1.330
30
30
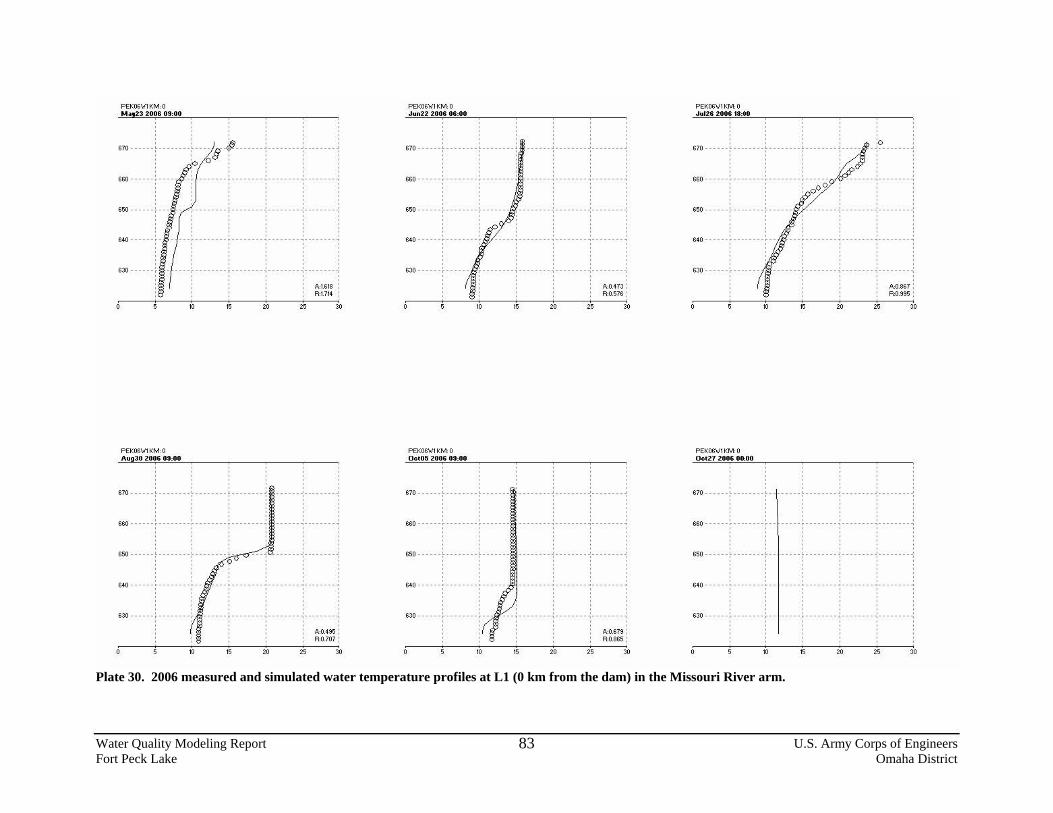
Plate 30. 2006 measured and simulated water temperature profiles at L1 (0 km from the dam) in the Missouri River arm.
Water Quality Modeling Report U.S. Army Corps of Engineers Fort Peck Lake Omaha District
83
PEK06\o/1 KM: 0 Mat23 2006 OS:OO
670 ------:--------l--~u -r -------- -
660 ------:-----
630 ------ ~
PEK06\o/1 KM: 0 Auq30 2006 OS:OO
10 15 20
670 • • • • • • ~ • • • • • • • • • • • • • • • • I • • • • • • • •
660 ------:-------- --------.--------
650 ----- _,--------
640 ------ ~--------
630 ------ ~--------
10 15 20
25
25
A:1.618 R:1.714
30
A:0.495 R,0.707
30
PEK06\o/1 KM: 0 Jun22 2006 06:00
670 ------ ~--------
660 ------:--------
650 ----- _,--------
640 ------ ~--------
630 ------ ~------
PEK06\o/1 KM: 0 Oct05 2006 OS:OO
670 ------ ~--------
660 ------:--------
15 20 25
A:0.473 R,0.576
30
650 ----- _,-------- ------- -------- -------- --------
640 ------ ~-------- -------- --------
630 ------ ~--------
20 25
A,0.679 R,0.865
30
PEK06\o/1 KM: 0 Jul26 2006 18:1)0
670 ------ ~-- ------
660 ------:--------
650 ----- _,-- ------
640 ------ ~-- ------
630 ------ ~-- -----
PEK06\o/1 KM: 0 Oct27 2006 00:00
670 ------ ~-- ------
660 ------:--------
-~? ...... .
-------- ~-------- -:--------
--- 0-------- ~-------- ... -------. . . . . . . . . . . . . . . . . . . . . -------,--------,--------..,--------
15 20 25
A,0.867 R,0.995
30
650 ----- _,-- ------ -- ----- -------- -------- --------
640 ------ ~-- ------ -- ----- -------- -------- --------
630 ------ ~-- ------
10 15 20 25 30

Plate 31. 2006 measured and simulated water temperature profiles at L2 (10 km from the dam) in the Missouri River arm.
Water Quality Modeling Report U.S. Army Corps of Engineers Fort Peck Lake Omaha District
84
PEK06\o/1 KM: 10 Mat23 2006 OS:OO
670 ------ ~--------
660 ------:------- • --------
650 ----- _,-------
640 ------ ~------
630 ------ ~---
PEK06\o/1 KM: 10 Auq30 2006 06:00
10
670 ------ ~--------
660 ------:--------
650 ----- _,--------
640 ------ ~--------
630 ------ ~--------
10
15 20
________ , ________ ' --------·-------- ------
-~ ------
15 20
25
25
M032 R:1.244
30
30
PEK06\o/1 KM: 10 Jun22 2006 06:00
670 ------ ~--------
660 ------:--------
650 ----- _,--------
640 ------ ~-------
630 ------ ~-----
PEK06\o/1 KM: 10 Oct05 2006 OS:OO
10
670 ------ ~--------
660 ------:--------
650 ----- _,--------
640 ------ ~--------
630 ------ ~--------
10
15 20
15 20
25
25
A,0.529 R,0.616
30
A:0.477 R,0.508
30
PEK06\o/1 KM: 10 Jul26 2006 15:1)0
670 ------ ~-- ------
660 ------:--------
650 ----- _,-- ------
640 ------ ~-- ------
- ~~----
630 ------~-------- --------;--------~--------
PEK06\o/1 KM: 10 Oct27 2006 00:00
10
670 ------ ~-- ------
660 ------:--------
650 ----- _,-- ------
640 ------ ~-- ------
630 ------ ~-- ------
10
15 20
15 20
25
25
0
A,0.706 R:0.904
30
30
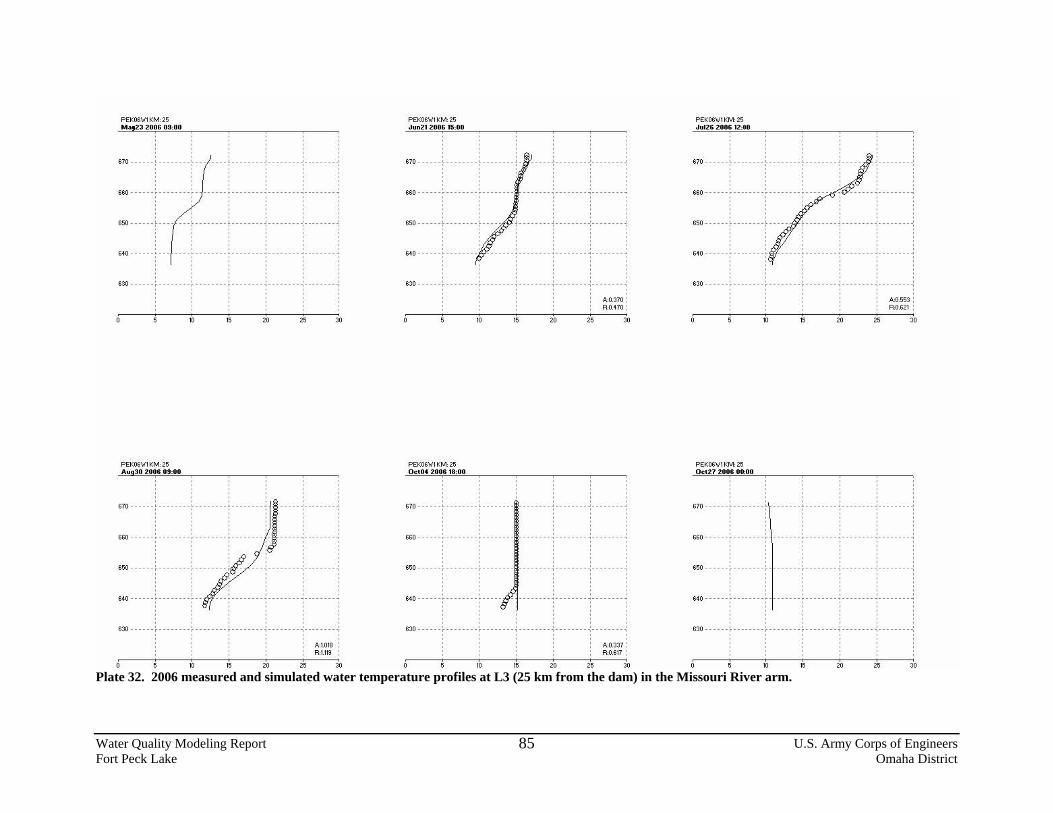
Plate 32. 2006 measured and simulated water temperature profiles at L3 (25 km from the dam) in the Missouri River arm.
Water Quality Modeling Report U.S. Army Corps of Engineers Fort Peck Lake Omaha District
85
PEK06\o/1 KM: 25 Mat23 2006 OS:OO
670 ------ ~--------
660 ------:--------
650 ----- _,---- ------------ -------- -------- --------
640 ------~--- ----~-------- -------- -------- --------
630 ----- -~------- -~--------
PEK06\o/1 KM: 25 Auq30 2006 OS:OO
10
670 ------ ~--------
660 ------:--------
650 ----- _,--------
640 ------ ~--------
630 ------ ~--------
10
15 20
' l --------i~ ---: ....... .
15 20
25
25
30
30
PEK06\o/1 KM: 25 Jun21 2006 15:00
670 ------ ~--------
660 ------:--------
650 ----- _,--------
640 ------ ~--------
630 - - - - - - ~ - - - - - - - - ~ - - - - - - - - ; - - - - - - - -
PEK06\o/1 KM: 25 Oct04 2006 18:00
10
670 ------ ~--------
660 ------:--------
650 ----- _,--------
640 ------ ~--------
630 ------ ~--------
10
15 20
15 20
25
25
A,0.370 R:0.470
30
A,0.337 R,0.617
30
PEK06\o/1 KM: 25 Jul26 2006 12:1)0
670 ------ ~-- ------
660 ------:--------
650 ----- _,-- ------
640 ----- -~-- ------ ------0- -------~--------
630 ------ ~-- ------
PEK06\o/1 KM: 25 Oct27 2006 00:00
10
670 ------ ~-- ------
660 ------:--------
650 ----- _,-- ------
640 ------ ~-- ------
630 ------ ~-- ------
10
15 20
15 20
25
25
A,0.553 R,0.621
30
30
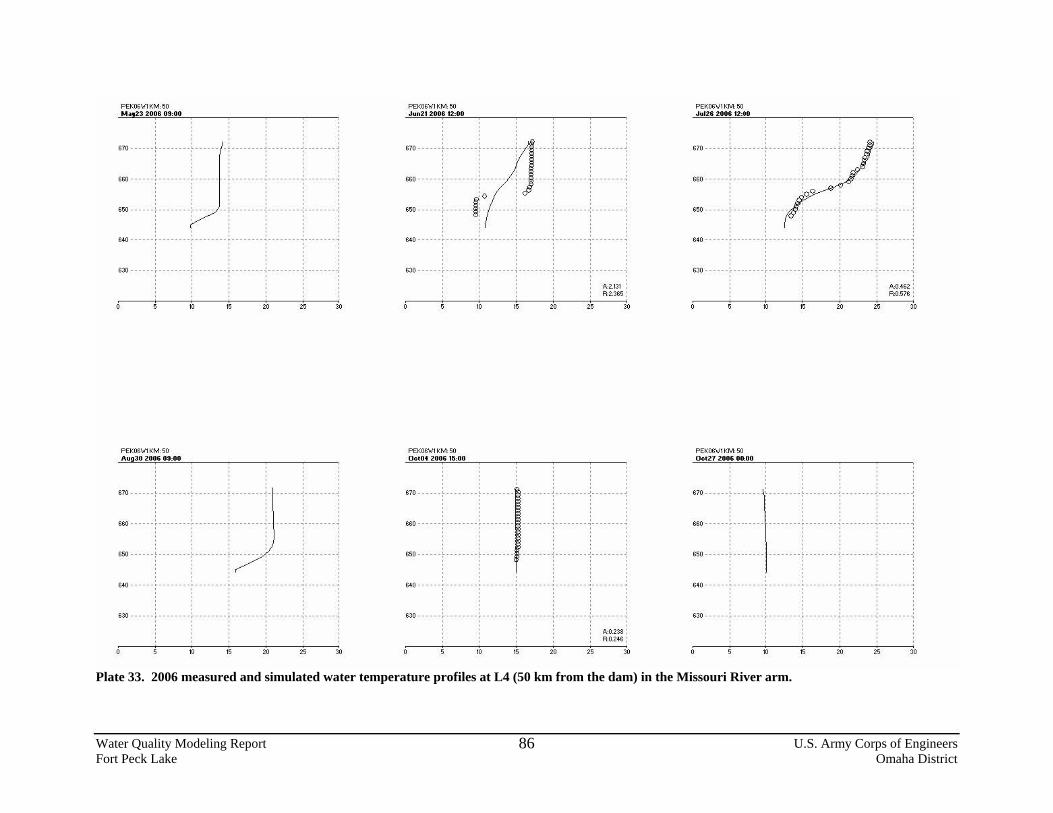
Plate 33. 2006 measured and simulated water temperature profiles at L4 (50 km from the dam) in the Missouri River arm.
Water Quality Modeling Report U.S. Army Corps of Engineers Fort Peck Lake Omaha District
86
PEK06\o/1 KM: 50 Mat23 2006 OS:OO
670 ------ ~--------
sso ...... : ........
S5o ...... , ........
640 ------~--------~-------- -------- -------- --------
630 ----- -~------- -~--------
PEK06\o/1 KM: 50 Auq30 2006 OS:OO
10
670 ------ ~--------
sso ...... : ........
S5o ...... , ........
640 ------ ~--------
630 ------ ~--------
10
15
15
20 25
20 25
30
30
PEK06\o/1 KM: 50 Jun21 2006 12:00
670 ----- -~------- -~-------"1 ss0 ...... : ........ : ...... -~ .......
: :o s5o .... < ....... ~~-640 - - - - - - ~ - - - - - - - - ~ - - - - - - - - : - - - - - - - -. . . . . . . . . . . . . . . 630 - - - - - - ~ - - - - - - - - ~ - - - - - - - - ; - - - - - - - -
PEK06\o/1 KM: 50 Oct04 2006 15:00
10
670 ------ ~--------
sso ...... : ........
15 20 25
M.131 R,2.3S5
30
S5o ...... , ...................................... ..
640 ------ ~-------- --------0-------- -------- --------
630 ------ ~--------
10 15 20 25
A,0.238 R:0.246
30
PEK06\o/1 KM: 50 Jul26 2006 12:1)0
670 • • • • • • ~ • • •• • • • • • • • • • • • • I • • • • • • • •
sso ...... : ........
S5o ...... ,........ .. .............. ..
640 ------~-------- --------·--------~--------
630 ------ ~-- ------
PEK06\o/1 KM: 50 Oct27 2006 00:00
670 ------ ~-- -----
10
sso ...... : ........
15 20 25
A:0.462 R,0.57S
30
S5o ...... ,........ .. .................... ..
640 ------~--------~-------- -------- -------- --------
630 ----- -~-- -- ----~--------
10 15 20 25 30
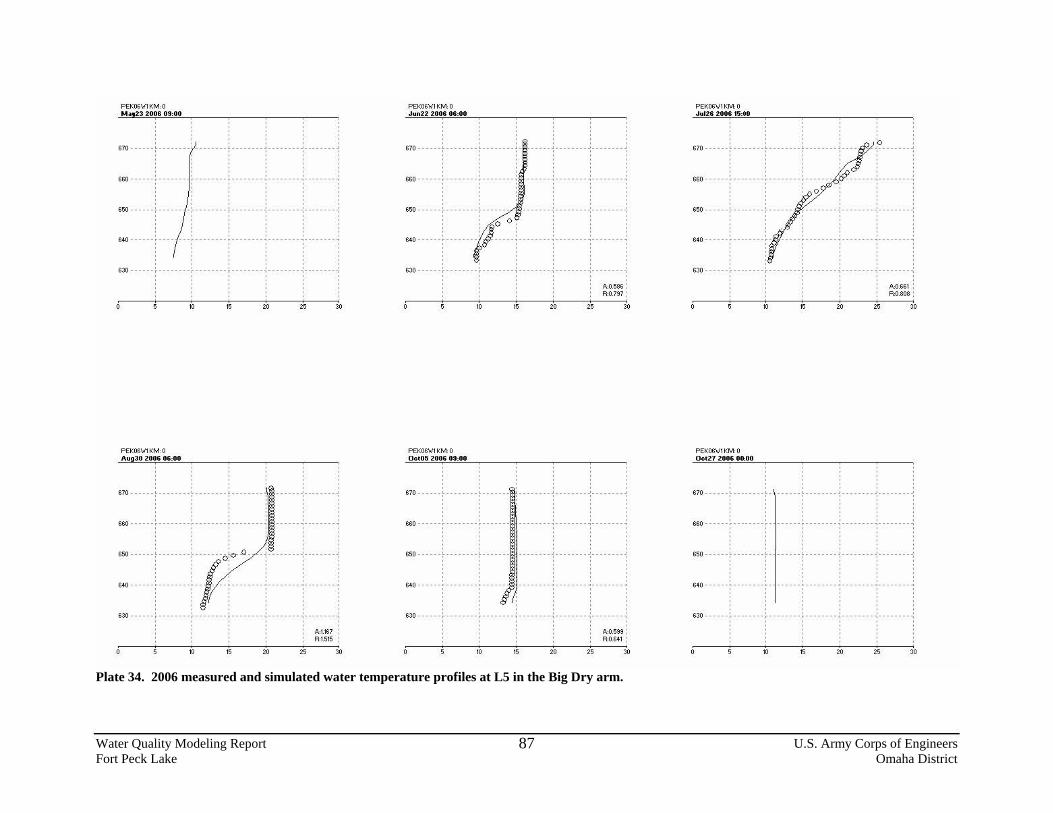
Plate 34. 2006 measured and simulated water temperature profiles at L5 in the Big Dry arm.
Water Quality Modeling Report U.S. Army Corps of Engineers Fort Peck Lake Omaha District
87
PEK06\o/1 KM: 0 Mat23 2006 OS:OO
670 ------ ~--------
660 ------:------- • --------
650 ----- _,------
640 ------~---- ---~--------
630 ----- -~------- -~--------
PEK06\o/1 KM: 0 Auq30 2006 06:00
10
670 ------ ~--------
660 -- -- -- : -- -- -- --
650 -- -- -- ' -- -- -- --
640 ------ ~--------
630 ------ ~--------
10
15
15
20 25
20 25
30
30
PEK06\o/1 KM: 0 Jun22 2006 06:00
670 ------ ~--------
660 ------:--------
650 ----- _,--------
6<0 ----- -f-------- . IJ~ -~- i--------630 - - - - - - ~ - - - - - - - - ~ - - - - - - - - ; - - - - - - - -
PEK06\o/1 KM: 0 Oct05 2006 OS:OO
10
670 ------ ~--------
660 -- -- -- : -- -- -- --
650 -- -- -- ' -- -- -- --
640 ------ ~--------
630 ------ ~--------
10
15 20
15 20
25
25
A,0.586 R,0.797
30
A,0.599 R:0.641
30
PEK06\o/1 KM: 0 Jul26 2006 15:1)0
670 ------ ~-- ------
660 ------:--------
650 ------;--------
640 ------ ~-- ------
630 ------ ~-- ------
PEK06\o/1 KM: 0 Oct27 2006 00:00
10
670 ------ ~-- ------
660 ------:--------
650 ------;--------
640 ------ ~-- ------
630 ------ ~-- ------
10
~? ...... .
fss?------ ~- -------
-------- ~-------- -:--------
----- 0-------- ~-------- ... -------. . . . . . . . . . . . . . . . . . . . . --------,--------,--------..,--------
15 20
15 20
25
25
A,0.661 R,0.808
30
30

Water Quality Modeling Report U.S. Army Corps of Engineers Fort Peck Lake Omaha District
88
Plate 35. 2006 measured and simulated water temperature profiles at L6 in the Big Dry arm.
PEK06\o/1 KM: 20 Mat23 2006 OS:OO
670 _____ -~ ____ -r-___ _ 660 _____ -: ____
1
__ -: _______ _
650 ----- _,------- _,--------
640 ----- -~------- -~--------
630 ----- -~------- -~--------
PEK06\o/1 KM: 20 Auq30 2006 15:00
10 15 20
670 ------ ~-------- --------:----A---~~ ----. o . -------Tie _T _____ _ 660 ------:--------
650 ----- _,--------
640 ------ ~--------
630 ------ ~--------
10 15 20
25
25
M208 R,1.265
30
30
PEK06\o/1 KM: 20 Jun21 2006 06:00
670 ------ ~--------
660 ------:--------
650 ----- _,--------
640 ------ ~--------
630 ------ ~--------
PEK06\o/1 KM: 20 Oct05 2006 OS:OO
10
670 ------ ~--------
660 ------:--------
650 ----- _,--------
640 ------ ~--------
630 ------ ~--------
10
·J····· , ..... 15 20
------ ~
------~
15 20
25
25
A:0.345 R,0.387
30
A,0.218 R,0.251
30
PEK06\o/1 KM: 20 Jul27 2006 06:00
670 ------ ~-- ------
660 ------:--------
650 ----- _,-- ------
640 ------ ~-- ------
630 ------ ~-- ------
PEK06\o/1 KM: 20 Oct27 2006 00:00
10
670 _____ -: ______
1 660 ----- ·:-- ---- -
650 ----- _,-- ------
640 ------ ~-- ------
630 ------ ~-- ------
10
15
15
--------:~ -~~trr------
20
20
25
25
A,0.392 R:0.543
30
30
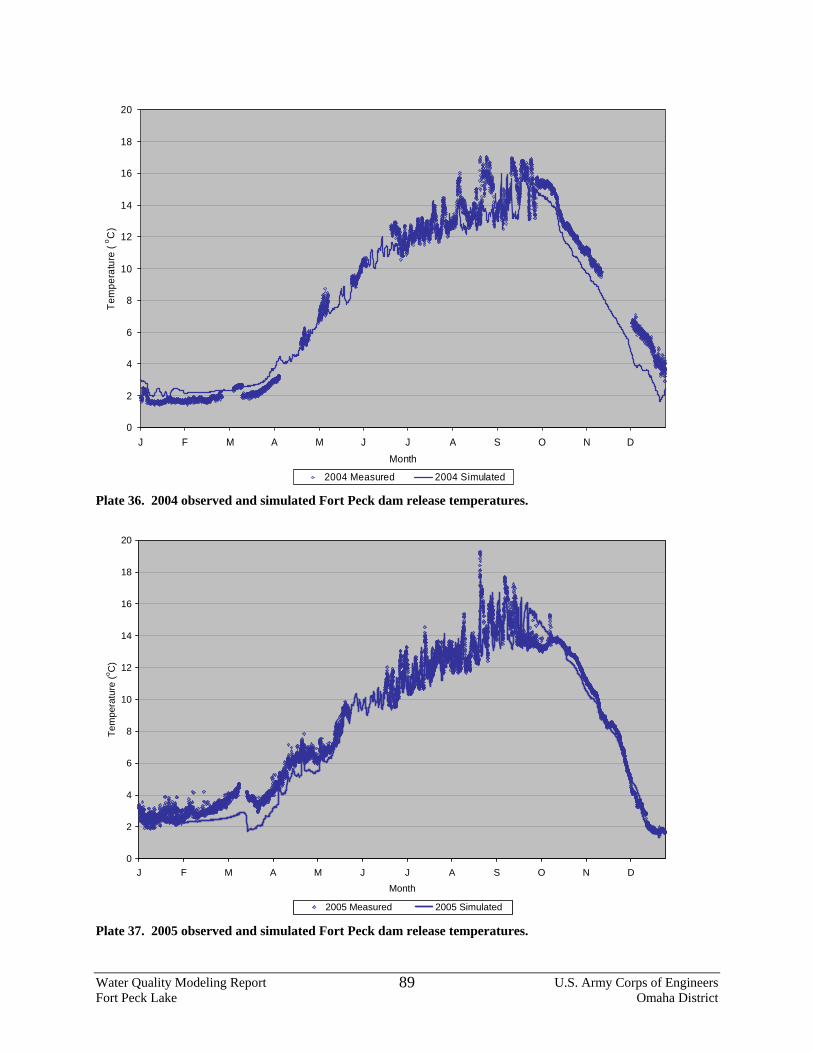
0
2
4
6
8
10
12
14
16
18
20
J F M A M J J A S O N DMonth
Tem
pera
ture
(o C
)
2004 Measured 2004 Simulated
Plate 36. 2004 observed and simulated Fort Peck dam release temperatures.
0
2
4
6
8
10
12
14
16
18
20
J F M A M J J A S O N DMonth
Tem
pera
ture
(o C)
2005 Measured 2005 Simulated
Plate 37. 2005 observed and simulated Fort Peck dam release temperatures.
Water Quality Modeling Report U.S. Army Corps of Engineers Fort Peck Lake Omaha District
89
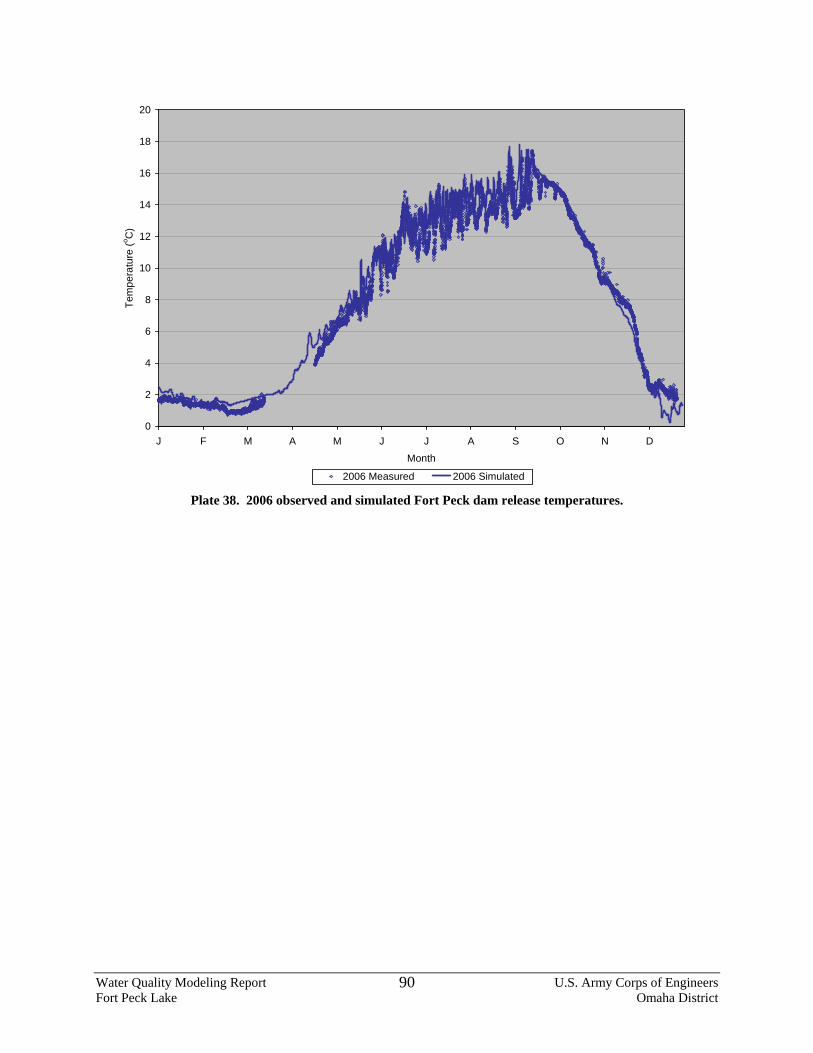
0
2
4
6
8
10
12
14
16
18
20
J F M A M J J A S O N D
Month
Tem
pera
ture
(o C)
2006 Measured 2006 Simulated
Plate 38. 2006 observed and simulated Fort Peck dam release temperatures.
Water Quality Modeling Report U.S. Army Corps of Engineers Fort Peck Lake Omaha District
90
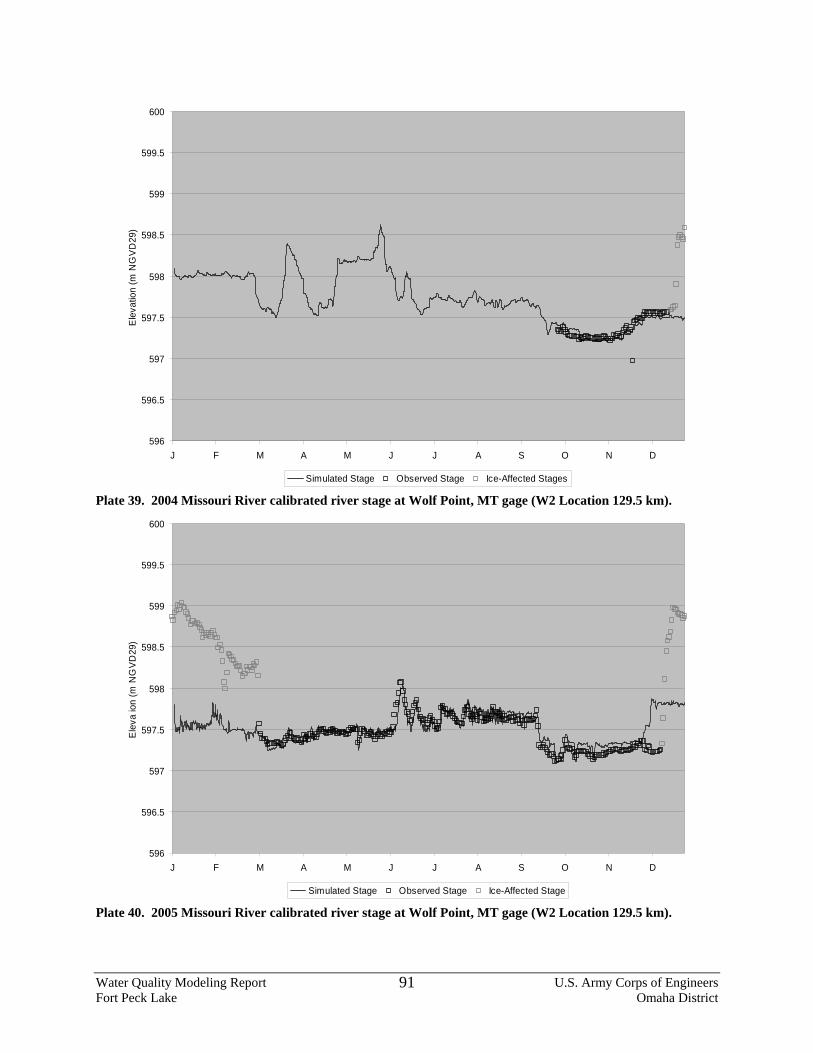
596
596.5
597
597.5
598
598.5
599
599.5
600
J F M A M J J A S O N D
Ele
vatio
n (m
NG
VD29
)
Simulated Stage Observed Stage Ice-Affected Stages
Plate 39. 2004 Missouri River calibrated river stage at Wolf Point, MT gage (W2 Location 129.5 km).
596
596.5
597
597.5
598
598.5
599
599.5
600
J F M A M J J A S O N D
Ele
vaio
n (m
NG
VD29
)
Simulated Stage Observed Stage Ice-Affected Stage
Plate 40. 2005 Missouri River calibrated river stage at Wolf Point, MT gage (W2 Location 129.5 km).
Water Quality Modeling Report U.S. Army Corps of Engineers Fort Peck Lake Omaha District
91
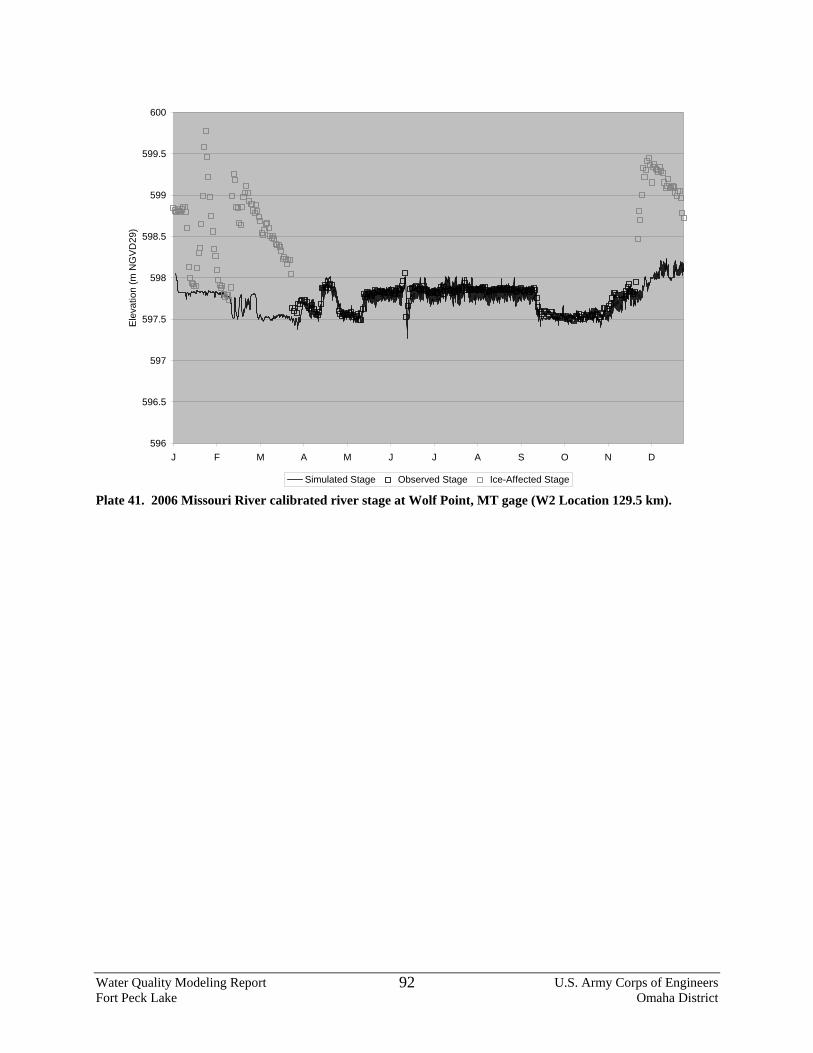
596
596.5
597
597.5
598
598.5
599
599.5
600
J F M A M J J A S O N D
Ele
vatio
n (m
NG
VD
29)
Simulated Stage Observed Stage Ice-Affected Stage Plate 41. 2006 Missouri River calibrated river stage at Wolf Point, MT gage (W2 Location 129.5 km).
Water Quality Modeling Report U.S. Army Corps of Engineers Fort Peck Lake Omaha District
92
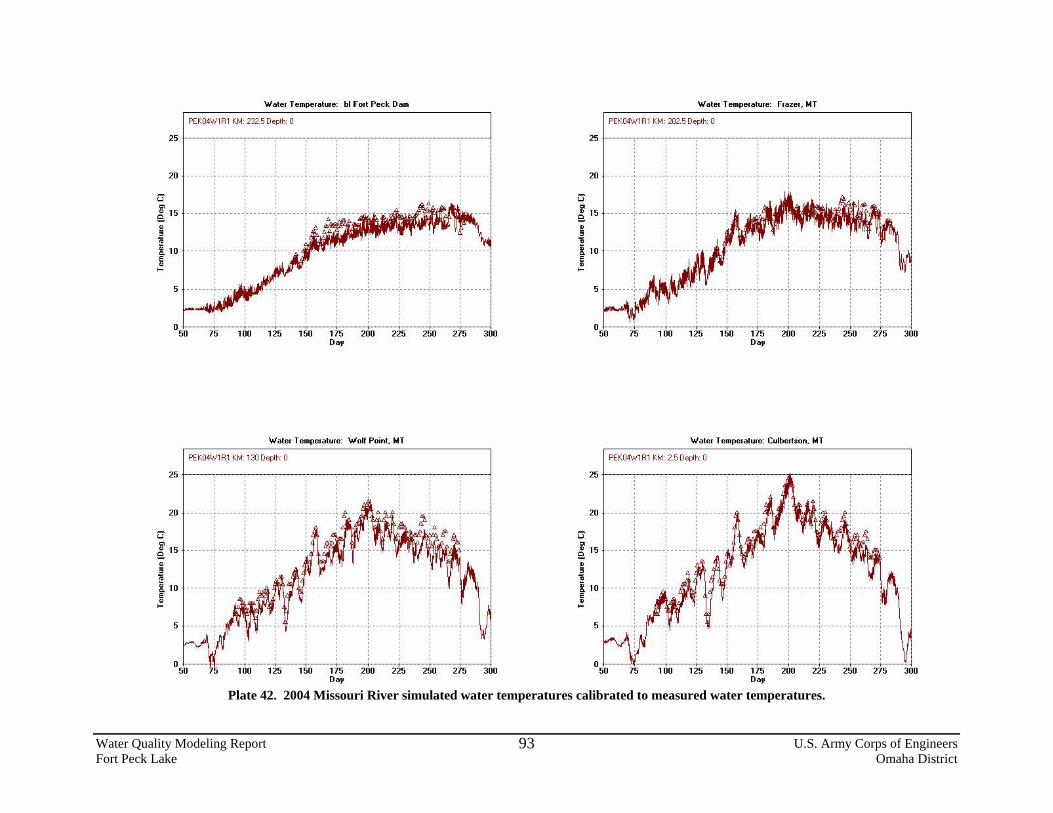
Plate 42. 2004 Missouri River simulated water temperatures calibrated to measured water temperatures.
Water Quality Modeling Report U.S. Army Corps of Engineers Fort Peck Lake Omaha District
93
Water Temperature: bl Fort Peck Dam
PEK04W1R1 KM: 232.5 Depth: 0
25 ~--~--~----~--~--~----~--~--~----~--~
20 ······-~-------:-------~-------~-------~---· ---~-------:---···· . . . . . . . . . . . . . . . . . . . . . . . . . . . . . . . . . . . . . . . . . . . . . . . . . .. e. 15 · · · · ·- -~------- -~------ ·1------- ~----·a -:---- -- ·-
u ..
. . . . . . . . . . . . . . . . . . . . . . ' . . . . ------ ... ------ -·------- ~------ -- ~---- -- ... ------ -·------- ... ------.-------. . . . . . . . I I I I I . . . . . . . . . . . . . . . . . . . . . . . . . . . . . .
5 . . . . . . . • • ,. • • • • • "T" • -----r--· · · · ·r· · · · · · -,- · · · · · · ..,. · · · · · "T" • • • • • • . . . . . . . . . . . . . . . . . . . . . . . . . . . . . . . . . . . . . . . . . . . . . . . . . . . . . . . .
05~0--~7t5----10~0~-1~2~5---1~5~0---1~7~5---2~0~0---2~2~5---2~5~0--~2~7~5--~300 Da.v
Water Temperature: Wolf Point. MT
PEK04W1R1 KM: 130 Depth: 0
20
e. 15
i ~ 10 ~ ...
. . . . . . • • • • T • • • • • • • r • • • • • • ·r · · · · · · .,. · · · · · · ..,. · · · · · · T • • • •
05~0---1!---~~~~--1~5~0---1~7~5---2~0~0---2~2~5---2~5~0--~2~7~5--~300 Da.v
Water Temperature: Frazer. MT
PEK04W1R1 KM: 202.5 Depth: 0
25 ~--~--~----~--~--~----~--~--~~--~--~
20 ······-~-------:-------~-------~-------~-------~-------:---···· . . . . . . . . . . . . . . . . . . . . . . . . . . . . . . . . . . . . . . . . . . . . .. ------ -:------- -:------- ~-------;-. . . . e. 15 . . . . . . . ' . . . . . . . . . . . . ~
llO -------~-------: ....... ;. ·-------~-------~-------:·------~-------·---- -
! ' ' .\~ ·------·-- ' - . -· ~
..
~~~·' : : : : : : : : 05~0--~7~5--~10~0~-1~2~5---1~5~0---1~7~5---2~0~0--~2~2~5--~2~5~0--~2~75~~300
Da.v
Water Temperature: Culbertson, MT
PEK04W1R1 KM: 2.5 Depth: 0
20 ....... ~-------:-------~-------~-. . . . . . . . . . . . . . . . . . . . . . . . . . ------ -:------- -:------- ~------- -. . . e. 15 . . .
5 . . . . . . • • • • T • • • • • • • r • • • • • • ·r · · · · · · .,. · · · · · · ..,. · · · · · · T • • • •
05~0--~~--~~-1~2~5---1~5~0---1~7~5---2~0~0--~2~2~5--~2~5~0--~2~75~~300 Da.v
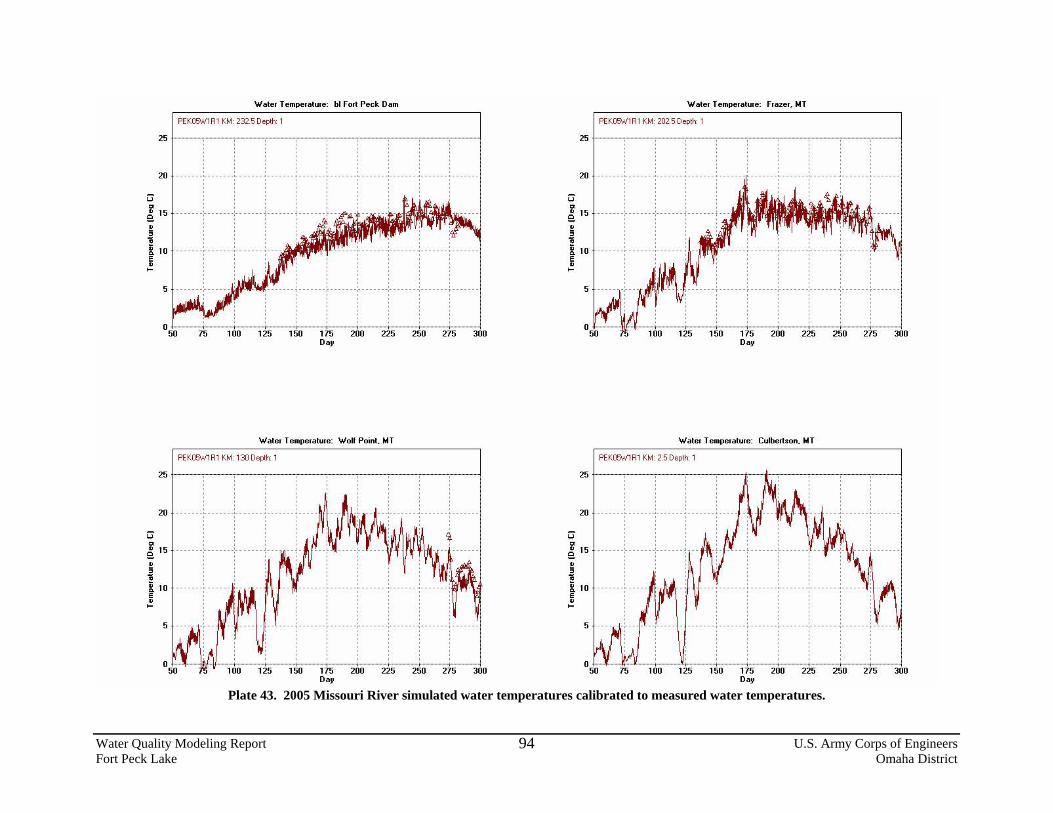
Plate 43. 2005 Missouri River simulated water temperatures calibrated to measured water temperatures.
Water Quality Modeling Report U.S. Army Corps of Engineers Fort Peck Lake Omaha District
94
Water Temperature: bl Fort Peck Dam
PEK05W1R1 KM: 232.5 Depth: 1
25 ~--~--~----~--~--~----~--~--~----~--~
20 ······-~-------:-- ····-~-------~-------~-------~-------:---····
.. e. 15
5
. . . . . . . . . . . . . . . . . . . . . . . . . . . . . . . . . . . . . . . . . . . . . . . . . ····--·:------·-:-- '''''1'''''''1'''''J. '' '#'.S' ..
. . . -------~------·:-- -----~-----aral'll"tJ"t'
100 125 150 175 Day
200 225
Water Temperature: Wolf Point. MT
PEK05W1R1 KM: 130 Depth: 1
250 275 300
25 ~--~----~--~----~--~--~~--~--~----~--~
20
u .. e. 15
i ~ 10 ~ ...
100 125
------- ~------ ... ------ -·------- ... ------ 0 . . . . . . . . . . . . . . . . . . . . . . . . . . . . . . . . . . . . . . . . . . . . . . • • • • T • • • • • • • r • • • • • • ·r • • • • • • -,- • • • • • • ..,. • • • • • • T • • • • • • • . . . . . . . . . . . . . . . . . . . . . . . . . . . . . . . . . . . . . . . . . .
I I I I I I
150 175 Day
200 225 250 275 300
Water Temperature: Frazer. MT
PEK05W1R1 KM: 202.5 Depth: 1
25 ~--~--~----~--~--~----~--~--~----~--~
20
u .. e. 15
i ~ 10
~ ...
. . . ------ -·------- ~------- 0------
. . . ------ ~------ ... ------ -·-------. . . . . . . . . . . . . . . . . . . . . . . .
Day
Water Temperature: Culbertson, MT
PEK05W1R1 KM: 2.5 Depth: 1
20 ....... ~-------:-------~-------~-----
u .. e. 15
i ~ 10 ~ ...
. . . . . . . . . . . .
150 175 Day
200 225 250 275 300
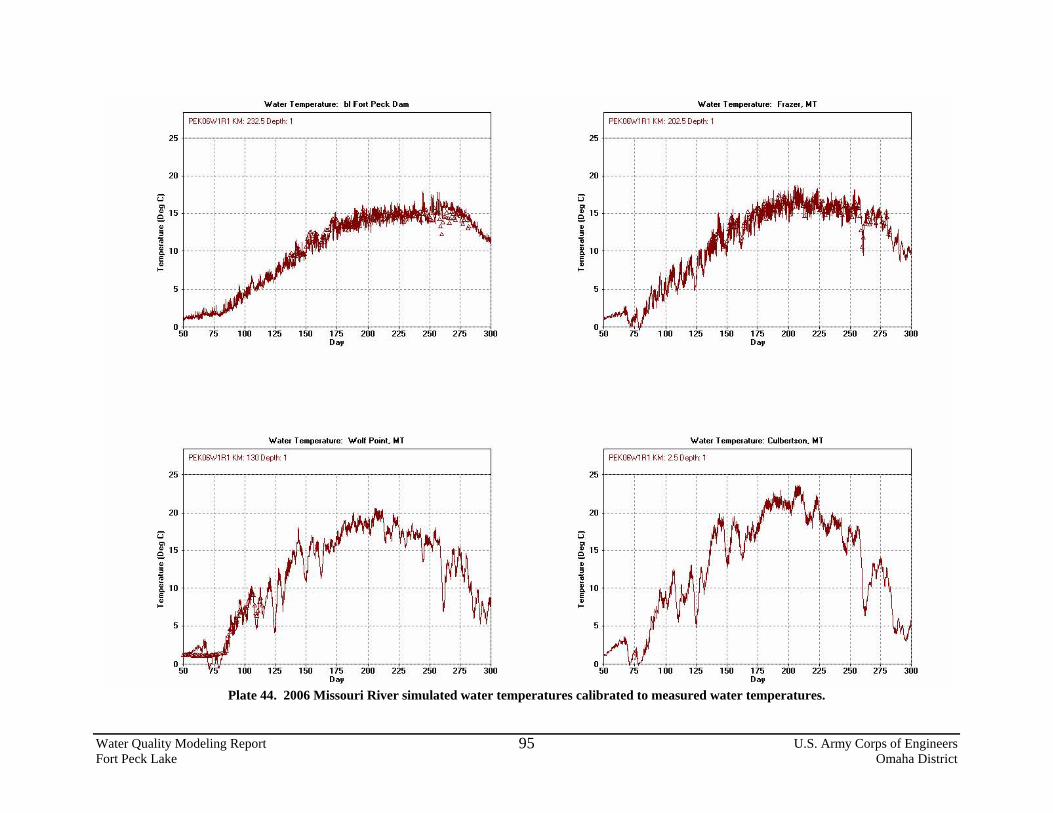
Water Quality Modeling Report U.S. Army Corps of Engineers Fort Peck Lake Omaha District
95
Plate 44. 2006 Missouri River simulated water temperatures calibrated to measured water temperatures.
Water Temperature: bl Fort Peck Dam
PEK06W1R1 KM: 232.5 Depth: 1
25 ~--~--~----~--~--~----~--~--~----~--~
20 ······-~-------:-------~-------~-------~---· ---~-------:---····
.. e. 15
5
20
u .. e. 15
i ~ 10 ~ ...
5
. . . . . . . . . . . . . . . . . . . . . . . . . . . . . . . . . . . . . . . . . . . . . . . ------ -:------- -:------- ~-------;------. . . . . . . . . . . . . . . . . . . ' . . . . . . . . . . . . . ------ ... ------ -·------- ~--- ---- ~---- -- ... ------ -·------- ... ------.-------. . . . . . . .
100
~ I I I I I . . . . . . . . . . . . . . . . . . . . . . . . . . . . . . . . . . . . .
· · ,. · · · · · ·y·------r--· · · · ·r· · · · · · -,- · · · · · · ..,. · · · · · "T" • • • • • • . . . . . . . . . . . . . . . . . . . . . . . . . . . . . . . . . . . . . . . . . . . . . . . . . . . . . . . . 125 150 175
Da.v 200 225
Water Temperature: Wolf Point. MT
250 275 300
PEK06W1R1 KM: 130 Depth: 1
---- 0------- ~---- -- ... ------ -·------- ... --. . . . . . . . . . . . . . . . . . . . . . . . . . . . . . . . . . . . . . . . . . . . . . • • • • • • • • • • T • • • • • • • r • • • • • • ·r · · · · · · .,. · · · · · · ..,. · · · · · · T • • • • • • •
125 150 175 Da.v
200 225 250 275 300
Water Temperature: Frazer. MT
PEK06W1R1 KM: 202.5 Depth: 1
25 ~--~--~----~--~--~----~--~--~~--~--~
20 ······-~-------:-------~-------~-------~-------~-------:---····
.. e. 15
5
. . . . . . . . . . . . ' . . . . . . ' . . . . . ' . . . . . . . . . . . . . ------ -:------- -:------- ~-----. . . . . . . . . . . . . . . . . . . . . . . . ------ ... ------ -·------- ~
100 125 150 175 Da.v
200 225
Water Temperature: Culbertson, MT
PEK06W1R1 KM: 2.5 Depth: 1
20 ....... ~-------:-------~-----. . . . . . . . . . . . . . . . . . . . . .. e. 15
5
100 125 150 175 Da.v
200 225
250
250
275 300
275 300
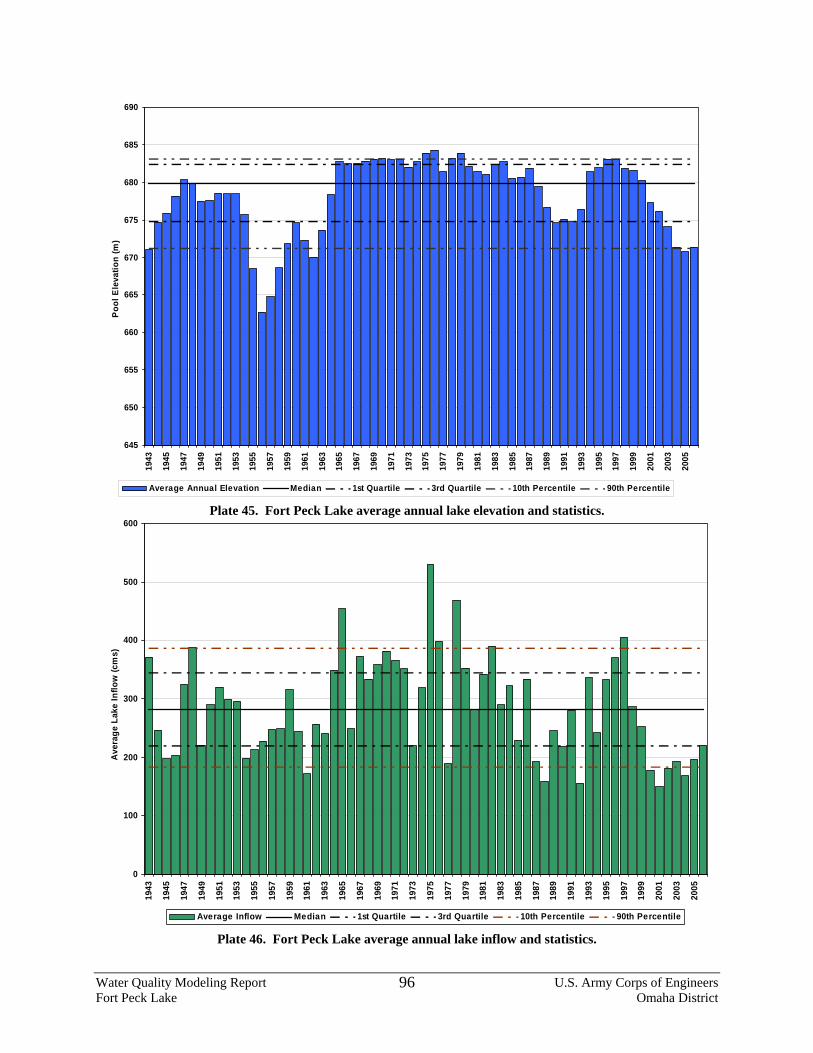
645
650
655
660
665
670
675
680
685
690
1943
1945
1947
1949
1951
1953
1955
1957
1959
1961
1963
1965
1967
1969
1971
1973
1975
1977
1979
1981
1983
1985
1987
1989
1991
1993
1995
1997
1999
2001
2003
2005
Poo
l Ele
vatio
n (m
)
Average Annual Elevation Median 1st Quartile 3rd Quartile 10th Percentile 90th Percentile
Plate 45. Fort Peck Lake average annual lake elevation and statistics.
0
100
200
300
400
500
600
1943
1945
1947
1949
1951
1953
1955
1957
1959
1961
1963
1965
1967
1969
1971
1973
1975
1977
1979
1981
1983
1985
1987
1989
1991
1993
1995
1997
1999
2001
2003
2005
Ave
rage
Lak
e In
flow
(cm
s)
Average Inflow Median 1st Quartile 3rd Quartile 10th Percentile 90th Percentile
Plate 46. Fort Peck Lake average annual lake inflow and statistics.
Water Quality Modeling Report U.S. Army Corps of Engineers Fort Peck Lake Omaha District
96
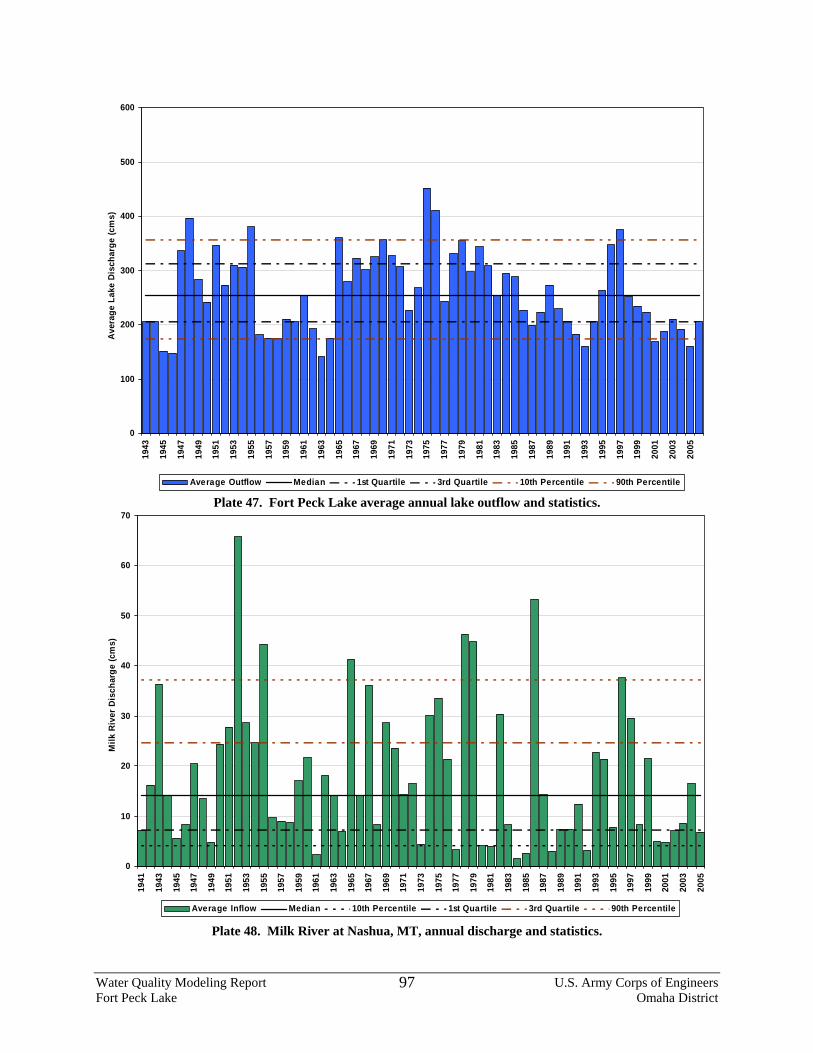
0
100
200
300
400
500
600
1943
1945
1947
1949
1951
1953
1955
1957
1959
1961
1963
1965
1967
1969
1971
1973
1975
1977
1979
1981
1983
1985
1987
1989
1991
1993
1995
1997
1999
2001
2003
2005
Ave
rage
Lak
e D
isch
arge
(cm
s)
Average Outflow Median 1st Quartile 3rd Quartile 10th Percentile 90th Percentile Plate 47. Fort Peck Lake average annual lake outflow and statistics.
0
10
20
30
40
50
60
70
1941
1943
1945
1947
1949
1951
1953
1955
1957
1959
1961
1963
1965
1967
1969
1971
1973
1975
1977
1979
1981
1983
1985
1987
1989
1991
1993
1995
1997
1999
2001
2003
2005
Milk
Riv
er D
isch
arge
(cm
s)
Average Inflow Median 10th Percentile 1st Quartile 3rd Quartile 90th Percentile
Plate 48. Milk River at Nashua, MT, annual discharge and statistics.
Water Quality Modeling Report U.S. Army Corps of Engineers Fort Peck Lake Omaha District
97
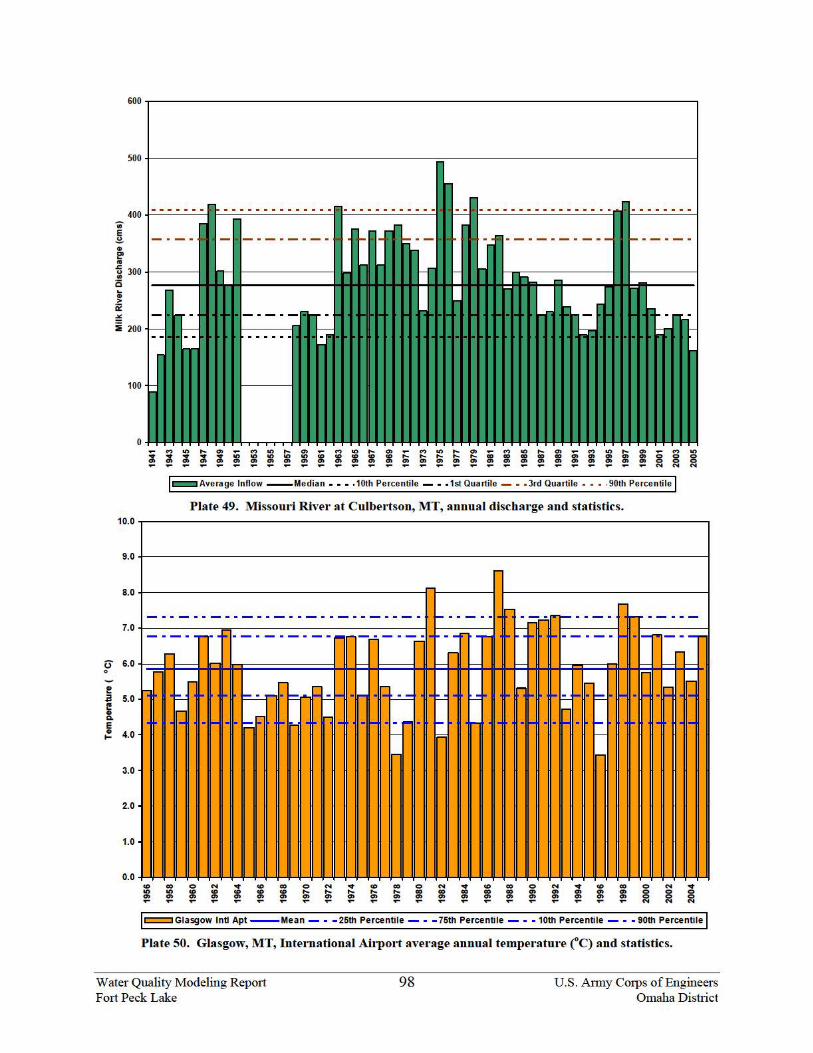
u 0
! .. I! X. i 1-
.. e .!:!. • !!' .. ~ 300 +----0 ~ • > ii: :!!: i 200
100
0
10.0
9.0
8.0
7.0
6.0
5.0
4.0
3.0
2.0
1.0
0.0
- Average lnftow --Median •••• 10th Percentile - •• 1st Quartile - •• 3rd Quartile •••. 90th Percentile
Plate 49. Missouri Rive1· at Culbe11son, MT, annual discharge and statistics.
- .. - .. -----·-· ·-· --------. - .. - .. ___ ... _____ . -.--
-- ·-· .. --------- ~ ~ ---·-· 1- ·- · r- r- . ---·-· - · I- I"" -.-
r-- - r- 1--- - r- - r- r- r-
-· - ~ ·- ~ . F " =- ..::. . . =-= r-= =- . .
1- . - -. ...... - r- • 1- - r- .. -. - - I· . .. r- . r-- r- I· -- r= r-
.:::::::::::J Glasgow Inti Apt --Mean - • - 25th Percentile - • - 75th Percentile - •• 10th Percentile - •• 90th Percentile
Plate 50. Glasgow, MT, International Aiq>ol·t average annual temperature tC) and statistics.
Water Quality Modeling Repmt Fmt Peck Lake
98 U.S. Anny Corps of Engineers Omaha District