Embed Size (px)
Citation preview
U.S. Department of Housing and Urban Development
Financial Status of the FHA Mutual Mortgage Insurance Fund FY 2018 1
Secretary’s Foreword
I am pleased to present the Annual Report to Congress on the financial health of the Federal Housing Administration’s (FHA) Mutual Mortgage Insurance Fund (MMIF) for Fiscal Year (FY) 2018.
FHA’s role remains important and substantial in supporting the nation’s single-family homebuyers. In FY 2018, FHA insured more than one million mortgages for single-family homes, and nearly 83 percent of FHA purchase mortgages served first-time homebuyers. In addition, the agency insured over 48,000 reverse mortgages through the Home Equity Conversion Mortgage (HECM) program, helping seniors remain in their homes and age in place. As of September 30, 2018, the MMIF had $1.26 trillion of insurance-in-force for over 8 million of the nation’s home mortgages. The general economic condition of the MMIF is sound, aided by favorable economic conditions and prudent stewardship of the program. FHA’s MMIF Capital Ratio for FY 2018 is 2.76 percent, remaining above the 2.00 percent statutory minimum, and increasing from last year’s revised level of 2.18 percent. The Economic Net Worth of the MMIF is $34.86 billion, an increase of over $8.12 billion from FY 2017. While we have made progress over the past fiscal year, the stand-alone forward and reverse portfolio capital ratios and economic net worth highlight the work that must continue in order to stabilize the financial performance of the HECM program. This year’s Annual Report continues our commitment to provide exceptional transparency, consistency, and accountability. In the chapters within, we offer a detailed narrative of FHA’s vigorous response to assist homeowners whose lives were devastated by natural disasters, including through new loss mitigation options that allow eligible borrowers to remain in their homes while reducing losses for FHA. The report also contains more robust insights into the factors driving the financial performance of the MMIF, including detailed discussions of the main risks we see emerging in our Single Family book of business.
U.S. Department of Housing and Urban Development
Financial Status of the FHA Mutual Mortgage Insurance Fund FY 2018 2
FHA now has a new Commissioner who is leading our continued effort to preserve affordable and sustainable access to mortgage credit, to manage the risks of a large and complex mortgage insurance portfolio, and to modernize an antiquated FHA. Federal Housing Commissioner Brian Montgomery and his team are working to make certain we remain true to FHA’s core mission to serve qualified first-time, low- and moderate-income and minority homebuyers, and seniors who choose to age in place.
As we present this Annual Report to Congress, we are firm in our duty to make certain the FHA remains a trusted beacon for future generations hoping to share in the opportunities that come with owning a home, while fulfilling our statutory duty to fiscal responsibility.
Ben Carson Secretary U.S. Department of Housing and Urban Development
U.S. Department of Housing and Urban Development
Financial Status of the FHA Mutual Mortgage Insurance Fund FY 2018 3
A Message from the Assistant Secretary for Housing
and Federal Housing Commissioner
Fiscal Year 2018 once again highlighted the scope and complexity of the Federal Housing
Administration’s (FHA) Single Family mortgage insurance portfolio. During the past year, over one
million individuals and families benefitted from the value of an FHA insurance endorsement to
purchase or refinance their homes, including over 640,000 first-time homebuyers and over
48,000 seniors. It is FHA’s eight decades of providing enduring value to the nation’s homebuyers
that continues to impress me – in my first term as FHA Commissioner nine years ago, and during
the five months into my second appointment to the role.
Providing enduring value comes with great responsibility. As Secretary Carson mentioned in his
Foreword to this report, as of September 30, 2018, FHA’s Single Family insurance portfolio was
$1.26 trillion of Insurance-in-Force, and had an economic net worth of $34.86 billion. The dollar
amounts involved, alone, require precise management and constant focus. And when you factor
in our Multifamily and Healthcare insurance portfolios, although not covered in this report, sound
stewardship of this fiduciary and social responsibility backed by taxpayer dollars is vital.
The actions FHA took throughout this past fiscal year to help those devastated by Hurricanes
Harvey, Irma, and Maria and other natural disasters highlight the complexity of this dual
responsibility. Disaster relief loss mitigation efforts will continue to be a prominent example as
we focus efforts on the continued recovery in the hardest hit states and U.S. territories. In this
report, you’ll find additional details about how we are helping the victims of the 2017 natural
disasters, and the impact the disasters had on FHA’s Mutual Mortgage Insurance Fund (MMIF).
We are also working now with the homeowners and communities devastated by the recent
Hurricanes Florence and Michael.
U.S. Department of Housing and Urban Development
Financial Status of the FHA Mutual Mortgage Insurance Fund FY 2018 4
As we look to the future, FHA must continue to seek the right balance between managing risk
and fulfilling our role, so that we can continue to step in when and where the nation needs us
most. To do this, I’ve established three guiding principles going forward for our work in Fiscal
Year 2019:
1. Staying true to our core mission. FHA must focus its efforts on those things that promote
access to sustainable mortgage credit for qualified first-time, low- and moderate-income
and minority homebuyers, and seniors who choose to age in place with the help of our
reverse mortgage program.
2. Strengthening the foundation of our work. To be successful long term, FHA must
maintain the integrity of our insurance endorsements and attract additional quality
lender participants. We need to assess the drivers behind the increase in higher-risk credit
characteristics in the portfolio and make prudent and necessary changes so that FHA
financing is widely available throughout the housing finance system. Our program should
once again work for both depository and non-depository institutions that want to
originate and service loans according to our requirements.
3. Appropriately managing risks on behalf of borrowers, lender participants, and the U.S.
taxpayer. As of September 30, 2018, the MMIF Capital Ratio was 2.76 percent, slightly
above the 2.00 percent required by Congress. While an increase from Fiscal Year 2017,
this is a thin margin, and taxpayers should never be put at risk again.
The lack of modern technology is the greatest risk and the greatest challenge FHA faces. Without
technology that works, and works well, we cannot maintain a complex insurance business, nor
will we be in a strong position to provide a counter-cyclical role in times of housing market stress.
I am encouraged by the support Congress and the housing industry has exhibited in recent
months for funding FHA technology.
In the following pages you will find additional details about the actions we have taken this past
fiscal year to address both our opportunities and challenges, and the work we must do to
maintain a strong FHA in the coming years.
Brian D. Montgomery Assistant Secretary for Housing and Federal Housing Commissioner
U.S. Department of Housing and Urban Development
Financial Status of the FHA Mutual Mortgage Insurance Fund FY 2018 5
Table of Contents
Secretary’s Foreword ...................................................................................................................... 1
A Message from the Assistant Secretary for Housing and Federal Housing Commissioner .......... 3
Annual Report Overview ................................................................................................................. 7
Introduction................................................................................................................................. 7
Capital Ratio and Economic Net Worth ...................................................................................... 7
Adjustments to Certain Fiscal Year 2017 Calculations ............................................................ 8
Key Forward Mortgage Highlights ............................................................................................... 9
Baseline Assessment of the 2017 Hurricanes’ Impact on the MMIF .................................... 14
Key HECM Portfolio Highlights .................................................................................................. 14
Addressing HECM Portfolio Volatility .................................................................................... 15
Barriers to Protection of the MMIF and Success of FHA’s Single Family Mortgage Insurance
Programs ................................................................................................................................... 16
A Note on the Actuarial Review Process Enhancements Introduced in the FY 2017 Annual
Report ........................................................................................................................................ 16
Capital Ratio Tested Under Alternative Economic Scenarios ................................................ 17
A Note About Cash Flow NPV: Meaning and Risks ................................................................... 18
Other FHA Programs and Exposures ......................................................................................... 18
Report Structure ........................................................................................................................ 19
Chapter I: FHA Single Family Mortgage and Borrower Characteristics ........................................ 20
FHA Forward Mortgage Program: New Endorsement Trends and Composition ..................... 20
Forward Mortgage Program: Portfolio Overview and Performance Trends ............................ 35
Downpayment Assistance ..................................................................................................... 38
Impact of the Hurricanes ....................................................................................................... 40
Home Equity Conversion Mortgage (HECM) Program .............................................................. 45
Overview ................................................................................................................................ 45
Chapter II: Condition of the Mutual Mortgage Insurance Fund ................................................... 63
Summary ................................................................................................................................... 63
Capital Ratio and Economic Net Worth Increased in FY 2018 .............................................. 63
Capital Adequacy is Tested .................................................................................................... 64
Independent Actuary for FY 2018 Confirms Baseline Projections Are Reasonable .............. 64
U.S. Department of Housing and Urban Development
Financial Status of the FHA Mutual Mortgage Insurance Fund FY 2018 6
MMIF Capital Ratio .................................................................................................................... 65
Stand-Alone Capital Ratios for Forward Mortgages and HECMs .............................................. 66
Cash Flow from Insurance Operations ...................................................................................... 75
Capital Ratio Sensitivity to Assumptions ................................................................................... 78
Comparison to Independent Actuary’s Results ........................................................................ 79
Capital Adequacy ....................................................................................................................... 80
Capital Adequacy Testing: Distribution of Cash Flow NPV .................................................... 80
Capital Adequacy Testing: MMIF Capital Ratio Outcomes .................................................... 84
Chapter III: Federal Housing Administration Objectives .............................................................. 87
FHA’s Significant Role in Disaster Recovery .............................................................................. 87
Enhanced Loss Mitigation for Borrowers Impacted by 2017 Disasters ................................ 88
Puerto Rico Update ............................................................................................................... 88
Future Impact of Hurricanes and Other Natural Disasters.................................................... 89
Strengthening the HECM Program ............................................................................................ 89
HECM Appraisal Accuracy ...................................................................................................... 90
Downpayment Assistance Programs in Conjunction with FHA-insured Mortgages ................. 91
Barriers to Resolution of Downpayment Assistance Concerns ............................................. 92
Lender Enforcement and the Role of the Mortgagee Review Board ....................................... 92
Appendix A: Data Tables for Annual Report Overview ................................................................. 94
Appendix B: Data Tables for Chapter I .......................................................................................... 96
Appendix C: Data Tables for Chapter II ....................................................................................... 121
Appendix D: FHA Single Family Housing Mortgagee Letters Published Fiscal Year 2018 .......... 127
U.S. Department of Housing and Urban Development
Financial Status of the FHA Mutual Mortgage Insurance Fund FY 2018 7
Annual Report Overview
Introduction
This overview highlights the key data presented in the Federal Housing Administration (FHA) Annual Report to Congress Regarding the Financial Status of the Mutual Mortgage Insurance Fund for Fiscal Year (FY) 2018 (Annual Report).
FHA manages the largest mortgage insurance portfolio in the U.S. mortgage finance system— Single Family Insurance-in-Force (IIF) for FY 2018 totaled $1.26 trillion, an increase of 3.08 percent from FY 2017. FHA’s IIF represents approximately 10.91 percent of all U.S. single-family residential mortgage debt outstanding.1
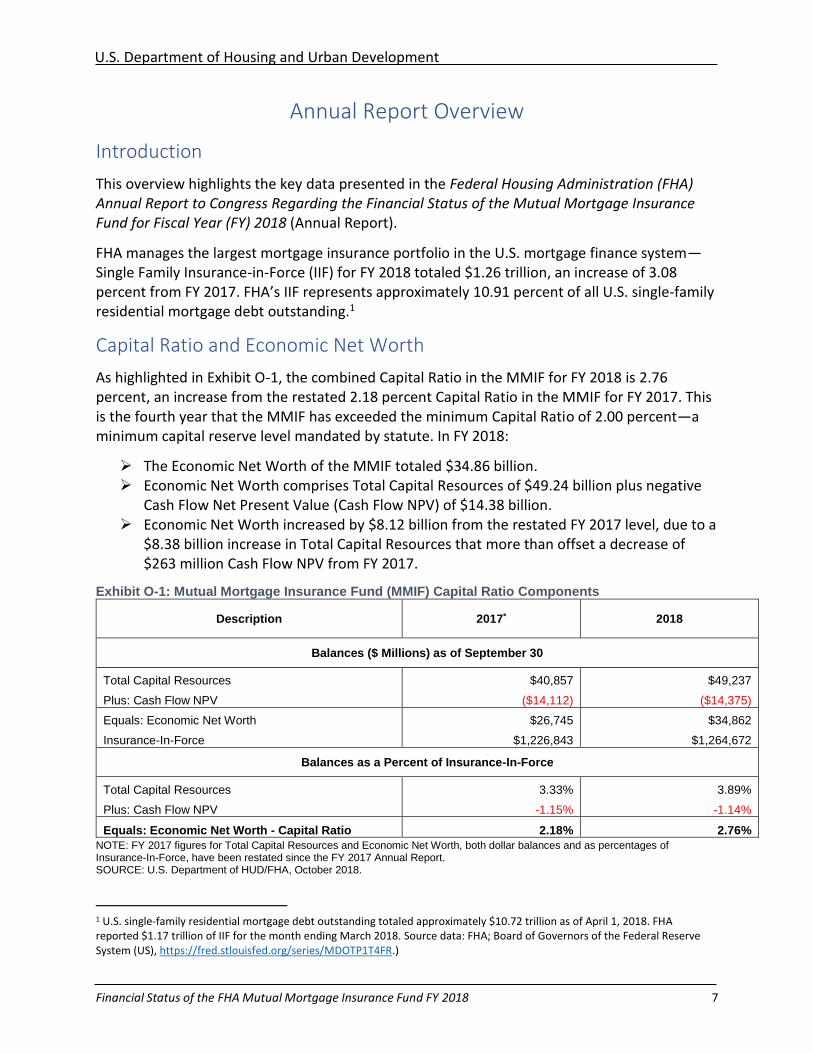
Capital Ratio and Economic Net Worth
As highlighted in Exhibit O-1, the combined Capital Ratio in the MMIF for FY 2018 is 2.76 percent, an increase from the restated 2.18 percent Capital Ratio in the MMIF for FY 2017. This is the fourth year that the MMIF has exceeded the minimum Capital Ratio of 2.00 percent—a minimum capital reserve level mandated by statute. In FY 2018:
➢ The Economic Net Worth of the MMIF totaled $34.86 billion. ➢ Economic Net Worth comprises Total Capital Resources of $49.24 billion plus negative
Cash Flow Net Present Value (Cash Flow NPV) of $14.38 billion. ➢ Economic Net Worth increased by $8.12 billion from the restated FY 2017 level, due to a
$8.38 billion increase in Total Capital Resources that more than offset a decrease of $263 million Cash Flow NPV from FY 2017.
Exhibit O-1: Mutual Mortgage Insurance Fund (MMIF) Capital Ratio Components
Description 2017* 2018
Balances ($ Millions) as of September 30
Total Capital Resources $40,857 $49,237
Plus: Cash Flow NPV ($14,112) ($14,375)
Equals: Economic Net Worth $26,745 $34,862
Insurance-In-Force $1,226,843 $1,264,672
Balances as a Percent of Insurance-In-Force
Total Capital Resources 3.33% 3.89%
Plus: Cash Flow NPV -1.15% -1.14%
Equals: Economic Net Worth - Capital Ratio 2.18% 2.76%
NOTE: FY 2017 figures for Total Capital Resources and Economic Net Worth, both dollar balances and as percentages of Insurance-In-Force, have been restated since the FY 2017 Annual Report. SOURCE: U.S. Department of HUD/FHA, October 2018.
1 U.S. single-family residential mortgage debt outstanding totaled approximately $10.72 trillion as of April 1, 2018. FHA reported $1.17 trillion of IIF for the month ending March 2018. Source data: FHA; Board of Governors of the Federal Reserve System (US), https://fred.stlouisfed.org/series/MDOTP1T4FR.)
U.S. Department of Housing and Urban Development
Financial Status of the FHA Mutual Mortgage Insurance Fund FY 2018 8
In addition to the fiscal condition of the MMIF, FHA has once again provided stand-alone reporting on the financial status of both the Forward mortgage and HECM portfolios.
Stand-Alone Forward Mortgage Portfolio Highlights Include:
➢ The Capital Ratio for the Forward mortgage portfolio is 3.93 percent for FY 2018, an increase from 3.33 percent in FY 2017.
➢ The Forward mortgage portfolio continues to have a positive Economic Net Worth of $46.81 billion, an increase of $8.40 billion from FY 2017.
Stand-Alone HECM Mortgage Portfolio Highlights Include2:
➢ The Capital Ratio for the HECM portfolio is negative 18.83 percent, a further decline from the restated negative 18.30 percent for FY 2017.
➢ The HECM portfolio has an Economic Net Worth of negative $13.63 billion. ➢ Total Capital Resources in the HECM portfolio totaled $2.11 billion for FY 2018, which
was offset by a negative $15.75 billion in Cash Flow NPV.
In October 2017, FHA made changes to HECM Principal Limit Factors (PLFs) and HECM Mortgage Insurance Premiums, which were made effective for FHA HECM case numbers assigned on or after October 2, 2017. Due to the lag time between case number assignment and FHA endorsement, FHA did not realize a full year of the beneficial effects of these changes.
The stand-alone reporting procedure was introduced to the Actuarial Review process in FY 2017, presenting a more granular reflection of the financial performance of the Forward and HECM portfolios and the cumulative contributions of each portfolio to the MMIF. Like last year, the capital adequacy of the Forward mortgage portfolio remained materially better than the HECM portfolio for FY 2018.
Adjustments to Certain Fiscal Year 2017 Calculations
In its FY 2018 Consolidated Balance Sheet and other financial statements, FHA corrected material errors to recognize a $1.12 billion understatement of its net position in FY 2017 in the MMIF. This material error directly impacted FHA’s calculation of its Capital Ratio. In order to properly reflect the corrections made to the financial statements, the calculations contained in this report for the FY 2017 MMIF reflect the following adjustments:
➢ The MMIF Capital Ratio was recalculated to be 2.18 percent for FY 2017, an increase of 0.09 percent from the originally report amount of 2.09 percent;
➢ The Economic Net Worth of the MMIF was recalculated to be $26.744 billion for FY 2017, an increase of $1.120 billion;
2 The FY 2018 Annual Report only includes figures for the performance of HECMs held in the MMIF. The financial performance for HECMs presented in the MMIF only account for a portion of the overall number of these mortgages. 22.66 percent of HECM Maximum Claim Amount (MCA) and 26.52 percent of mortgages are held in the General Risk/Special Risk Insurance (GI/SRI) Fund. FHA’s Production Report, available on https://www.hud.gov/program_offices/housing/hsgrroom provides additional information about HECMs covered under the GI/SRI Fund.
U.S. Department of Housing and Urban Development
Financial Status of the FHA Mutual Mortgage Insurance Fund FY 2018 9
➢ The stand-alone Capital Ratio for the HECM portfolio was recalculated to be negative 18.30 percent for FY 2017, compared to the originally reported Capital Ratio of negative 19.84 percent; and
➢ The Economic Net Worth of the HECM portfolio increased $1.120 billion from negative $14.474 billion to negative $13.354 billion for FY 2017.
The corrections to FHA’s FY 2017 net position are the result of a discounting error in the HECM program’s Return on Assets calculation. A detailed description of the causes and effects of this correction can be found in FHA’s Annual Management Report for Fiscal Year 2018, available at www.hud.gov/program_offices/housing/hsgrroom/fhaamr.
Key Forward Mortgage Highlights
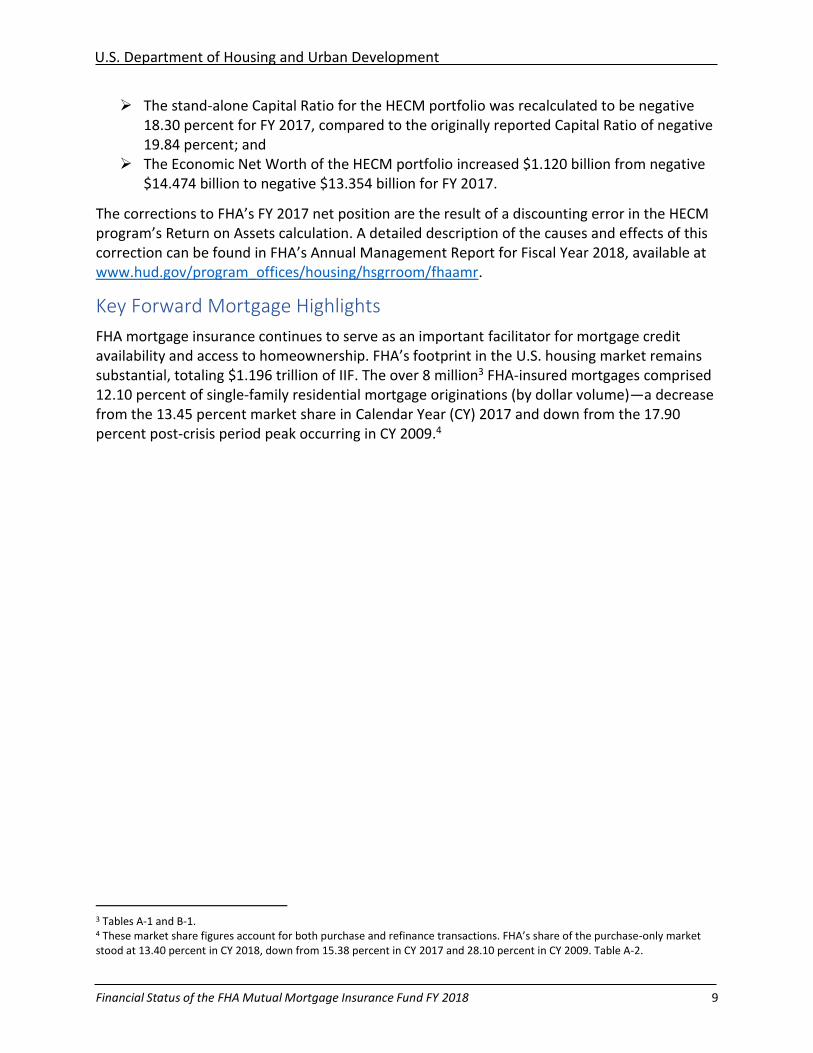
FHA mortgage insurance continues to serve as an important facilitator for mortgage credit availability and access to homeownership. FHA’s footprint in the U.S. housing market remains substantial, totaling $1.196 trillion of IIF. The over 8 million3 FHA-insured mortgages comprised 12.10 percent of single-family residential mortgage originations (by dollar volume)—a decrease from the 13.45 percent market share in Calendar Year (CY) 2017 and down from the 17.90 percent post-crisis period peak occurring in CY 2009.4
3 Tables A-1 and B-1. 4 These market share figures account for both purchase and refinance transactions. FHA’s share of the purchase-only market stood at 13.40 percent in CY 2018, down from 15.38 percent in CY 2017 and 28.10 percent in CY 2009. Table A-2.
U.S. Department of Housing and Urban Development
Financial Status of the FHA Mutual Mortgage Insurance Fund FY 2018 10
Exhibit O-2: FHA Single Family Forward Mortgage Insurance-in-Force
SOURCE: U.S. Department of HUD/FHA, October 2018. Refer to data table A-1 in Appendix A
0
1,000
2,000
3,000
4,000
5,000
6,000
7,000
8,000
9,000
$0
$200
$400
$600
$800
$1,000
$1,200
$1,400
Mo
rtg
ag
es
UP
B (
$ B
illio
ns)
Endorsement Fiscal Year
Insurance-in-Force ($ billions) Mortgage Count (millions)
U.S. Department of Housing and Urban Development
Financial Status of the FHA Mutual Mortgage Insurance Fund FY 2018 11
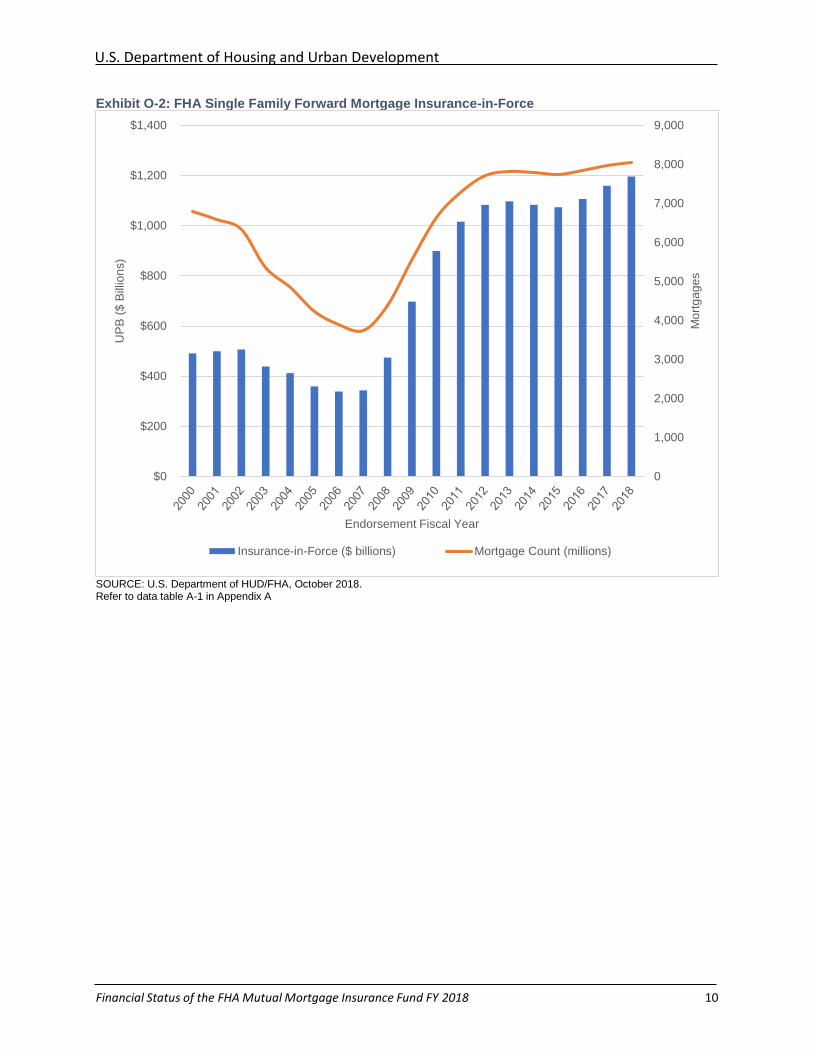
Exhibit O-3: FHA Share of Market by Calendar Year (Percentage of Dollar Volume)
NOTE: The FY 2017 Annual Report used share of mortgage counts, whereas the FY 2018 Annual Report uses share of mortgage
amounts. Originations based on beginning amortization dates. Includes all conventional and government single family forward
originations. 2018 Market Share is calculated through June 30, 2018. Source: U.S. Department of HUD as of October 6, 2018. Mortgage Bankers Association of America, “MBA Mortgage Finance
Forecast,” September 2018, and Corelogic TrueStandings ® as of October 6, 2018. Refer to data table A-2 in Appendix A.
Key highlights from the FY 2018 Forward mortgage portfolio include:
➢ FHA endorsed 1,014,609 Forward mortgages totaling $209.05 billion in unpaid principal balance (UPB).5
➢ Purchase mortgages represented 76.51 percent of FY 2018 endorsements, and the share for first-time homebuyers remained relatively stable at 82.69 percent in FY 2018.6
➢ 33.76 percent of FHA’s mortgage endorsements served minority borrowers in FY 2018, and 57.39 percent served low- to moderate-income borrowers.7
➢ The average mortgage amount for Forward mortgages was $206,041 in FY 2018, an increase of 2.34 percent from FY 2017.
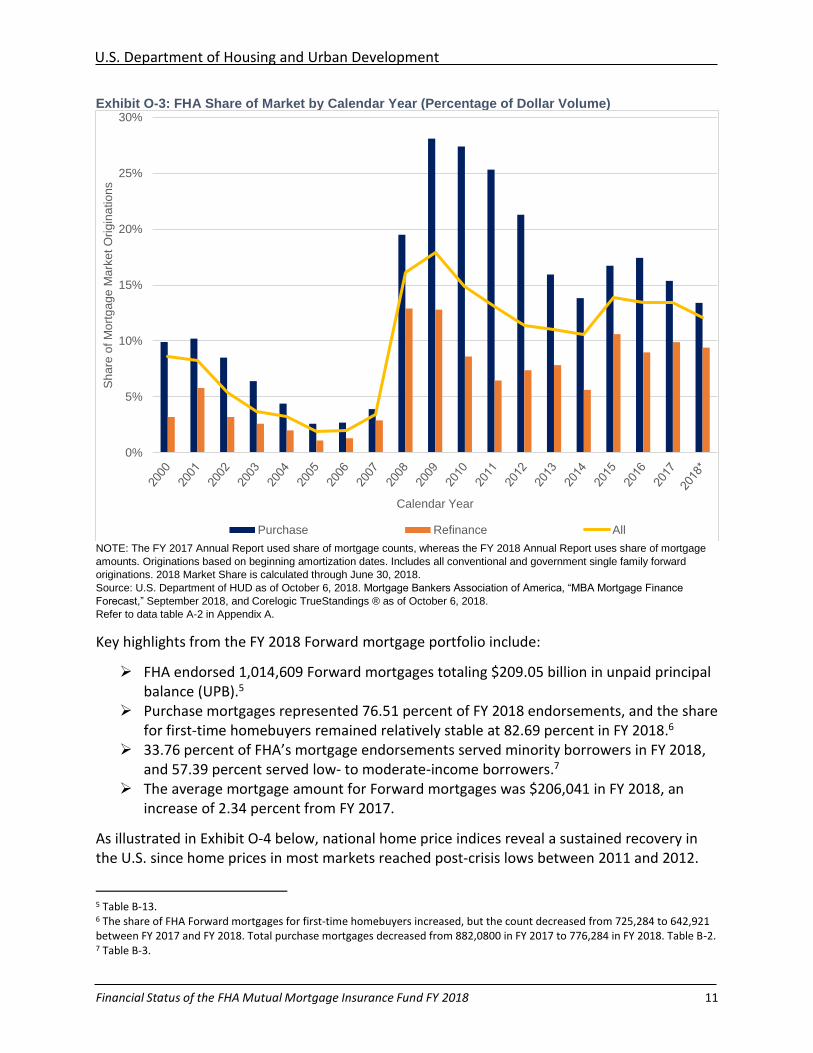
As illustrated in Exhibit O-4 below, national home price indices reveal a sustained recovery in the U.S. since home prices in most markets reached post-crisis lows between 2011 and 2012.
5 Table B-13. 6 The share of FHA Forward mortgages for first-time homebuyers increased, but the count decreased from 725,284 to 642,921 between FY 2017 and FY 2018. Total purchase mortgages decreased from 882,0800 in FY 2017 to 776,284 in FY 2018. Table B-2. 7 Table B-3.
0%
5%
10%
15%
20%
25%
30%S
ha
re o
f M
ort
ga
ge
Ma
rke
t O
rig
ina
tio
ns
Calendar Year
Purchase Refinance All
U.S. Department of Housing and Urban Development
Financial Status of the FHA Mutual Mortgage Insurance Fund FY 2018 12
Indeed, national home price growth, aided by low interest rates and a strengthening economy, has averaged over six percent annually since January 2012 as shown in the U.S. Monthly House Price Index published by the Federal Housing Finance Agency (FHFA). Overall, favorable economic conditions and general improvements in housing markets across the U.S., combined with risk management actions taken by FHA8, have resulted in favorable trends in most key FHA portfolio credit metrics.
Exhibit O-4: Monthly House Price Index for U.S.
NOTE: Purchase Only, Seasonally Adjusted Index, January 1991-July 2018. SOURCE: Federal Housing Finance Agency, October 2018.
Additional FY 2018 Forward mortgage portfolio performance indicators include:
➢ Early Payment Default (EPD) rates remain relatively stable and decreased to 0.44
percent in FY 2018, and down from 0.77 percent in FY 2017.9 FY 2017 EPD rates were
materially impacted by the natural disasters occurring in the fall of 2017.
➢ Serious Delinquency (SDQ) rates continue to decrease, ending FY 2018 at 4.11 percent,
down from 4.32 percent a year ago. The SDQ rates in the U.S. Virgin Islands, Puerto Rico,
8 In the FY 2017 Annual Report, FHA estimated that had the reduction in the Annual Mortgage Insurance Premium (Mortgagee Letter 2017-01) taken effect, the MMIF Capital Ratio would have fallen below the statutory minimum Capital Ratio of 2.00 percent to 1.85 percent. Annual Report to Congress Regarding the Financial Status of the FHA Mutual Mortgage Insurance Fund for Fiscal Year 2017. 9 Table B-14.
100.00
120.00
140.00
160.00
180.00
200.00
220.00
240.00
260.00
Jan
-91
Dec-9
1
Nov-9
2
Oct-
93
Se
p-9
4
Au
g-9
5
Jul-
96
Jun
-97
Ma
y-9
8
Ap
r-99
Ma
r-0
0
Fe
b-0
1
Jan
-02
Dec-0
2
Nov-0
3
Oct-
04
Se
p-0
5
Au
g-0
6
Jul-
07
Jun
-08
Ma
y-0
9
Ap
r-10
Ma
r-1
1
Fe
b-1
2
Jan
-13
Dec-1
3
Nov-1
4
Oct-
15
Se
p-1
6
Au
g-1
7
Jul-
18
FH
FA
Hom
e P
rice
In
de
x V
alu
es (
19
91
=1
00
)
Compound Annual Growth Rate Since January 1991: 3.61%Compound Annual Growth Rate Since January 2000: 3.61%Compound Annual Growth Rate Since January 2012: 6.12%
U.S. Department of Housing and Urban Development
Financial Status of the FHA Mutual Mortgage Insurance Fund FY 2018 13
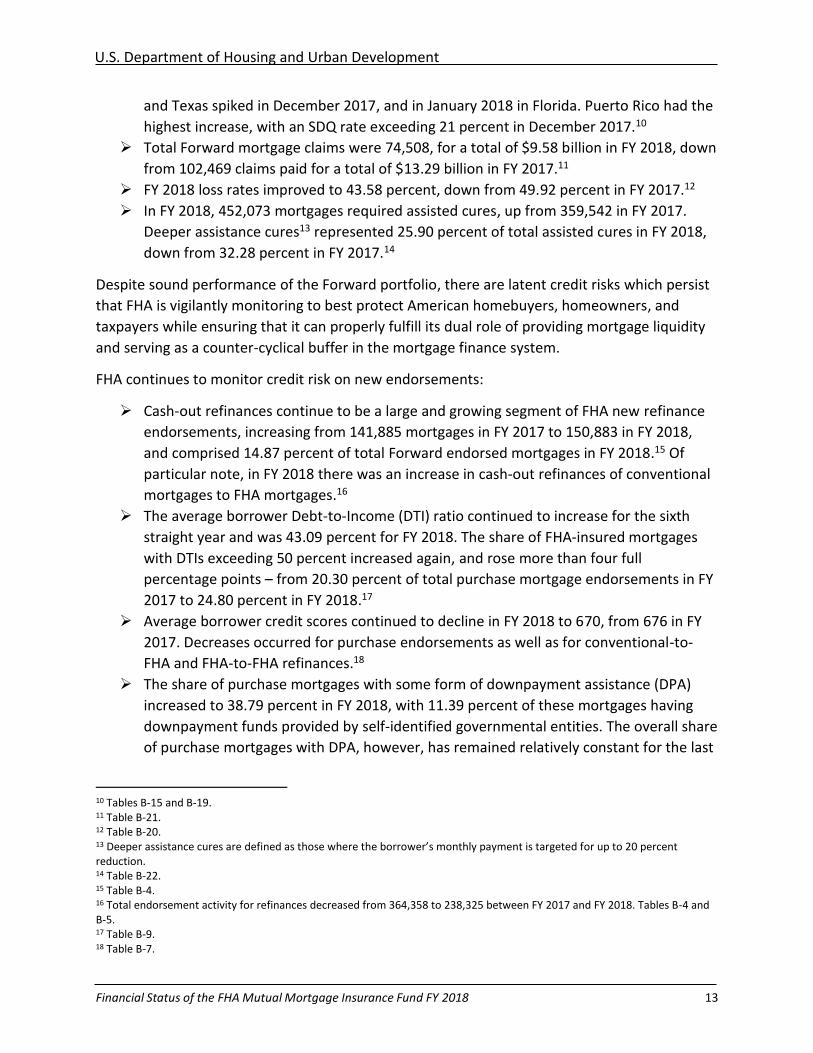
and Texas spiked in December 2017, and in January 2018 in Florida. Puerto Rico had the
highest increase, with an SDQ rate exceeding 21 percent in December 2017.10
➢ Total Forward mortgage claims were 74,508, for a total of $9.58 billion in FY 2018, down
from 102,469 claims paid for a total of $13.29 billion in FY 2017.11
➢ FY 2018 loss rates improved to 43.58 percent, down from 49.92 percent in FY 2017.12
➢ In FY 2018, 452,073 mortgages required assisted cures, up from 359,542 in FY 2017.
Deeper assistance cures13 represented 25.90 percent of total assisted cures in FY 2018,
down from 32.28 percent in FY 2017.14
Despite sound performance of the Forward portfolio, there are latent credit risks which persist
that FHA is vigilantly monitoring to best protect American homebuyers, homeowners, and
taxpayers while ensuring that it can properly fulfill its dual role of providing mortgage liquidity
and serving as a counter-cyclical buffer in the mortgage finance system.
FHA continues to monitor credit risk on new endorsements:
➢ Cash-out refinances continue to be a large and growing segment of FHA new refinance
endorsements, increasing from 141,885 mortgages in FY 2017 to 150,883 in FY 2018,
and comprised 14.87 percent of total Forward endorsed mortgages in FY 2018.15 Of
particular note, in FY 2018 there was an increase in cash-out refinances of conventional
mortgages to FHA mortgages.16
➢ The average borrower Debt-to-Income (DTI) ratio continued to increase for the sixth
straight year and was 43.09 percent for FY 2018. The share of FHA-insured mortgages
with DTIs exceeding 50 percent increased again, and rose more than four full
percentage points – from 20.30 percent of total purchase mortgage endorsements in FY
2017 to 24.80 percent in FY 2018.17
➢ Average borrower credit scores continued to decline in FY 2018 to 670, from 676 in FY
2017. Decreases occurred for purchase endorsements as well as for conventional-to-
FHA and FHA-to-FHA refinances.18
➢ The share of purchase mortgages with some form of downpayment assistance (DPA)
increased to 38.79 percent in FY 2018, with 11.39 percent of these mortgages having
downpayment funds provided by self-identified governmental entities. The overall share
of purchase mortgages with DPA, however, has remained relatively constant for the last
10 Tables B-15 and B-19. 11 Table B-21. 12 Table B-20. 13 Deeper assistance cures are defined as those where the borrower’s monthly payment is targeted for up to 20 percent reduction. 14 Table B-22. 15 Table B-4. 16 Total endorsement activity for refinances decreased from 364,358 to 238,325 between FY 2017 and FY 2018. Tables B-4 and B-5. 17 Table B-9. 18 Table B-7.
U.S. Department of Housing and Urban Development
Financial Status of the FHA Mutual Mortgage Insurance Fund FY 2018 14
three fiscal year cohorts.19 Mortgages with DPA generally exhibit higher rates of
delinquency and default20, and those with such assistance financed by self-identified
governmental entities have higher rates of default than those with other forms of
DPA.21
➢ The share of FHA mortgages endorsed by depository institutions decreased again in FY 2018 to 13.35 percent, down from 14.09 percent in FY 2017 and significantly below the 43.58 percent reached in 2010.22 The continuing decrease in depository institution participation in the program could have a significant impact on FHA’s business. This decrease has been driven in part by concern with exposure arising from perceived False Claims Act liability. FHA believes that this trend impacts consumer access to credit and increases counterparty risk to FHA’s Single Family mortgage insurance programs. FHA continues to monitor operational and counterparty risks that have arisen due to the decreasing share of depository institutions participating in the program.
Baseline Assessment of the 2017 Hurricanes’ Impact on the MMIF
In this report, FHA is providing a baseline assessment of the impact of the 2017 Hurricanes
Harvey, Irma, and Maria on the MMIF, and the actions FHA has taken to assist those whose
lives and homes were devastated by these and other disasters. Chapter I of this report includes
an analysis of FHA SDQ and EPD rates for those states most severely impacted by the
hurricanes. Chapter III of this report includes a description of the policy actions FHA took
throughout FY 2018 to assist homeowners with FHA-insured mortgages in Puerto Rico, the U.S.
Virgin Islands, Texas, Florida, and other areas severely impacted by natural disasters. These
actions included initiating multiple extensions of the foreclosure moratorium and deadlines to
initiate foreclosure, the development of a special Stand-Alone Partial Claim loan modification
option, and revisions to the Disaster Loss Mitigation Waterfall.
Financial and other loss projections in the MMIF for FY 2018 do not include any estimated
impacts from the effects of the fall 2018 Hurricanes Florence and Michael. FHA anticipates
future claims and losses as a result of these hurricanes, but at this time the expected loss from
the damage caused by them, given that they occurred late in FY 2018, cannot be reasonably
estimated.
Key HECM Portfolio Highlights
The HECM program continues to provide eligible seniors with a financing option that allows
them to “age in place.” While several reverse mortgage lenders have begun offering proprietary
19 Table B-10. 20 Tables B-16 and B-17 illustrate the comparative performance using EPD and SDQ rates for mortgages with DPA and without such assistance. 21 Tables B-16 and B-17. 22 Table B-11.
U.S. Department of Housing and Urban Development
Financial Status of the FHA Mutual Mortgage Insurance Fund FY 2018 15
products, FHA continues to have a dominant presence in the reverse mortgage market. HECMs
in the MMIF total 402,444 mortgages with IIF totaling $72.41 billion.23
Key highlights from the FY 2018 HECM portfolio include:
➢ FHA endorsed 48,327 HECMs in FY 2018 with a Maximum Claim Amount (MCA)24 of
$16.19 billion. This is 6,964 endorsements fewer than FY 2017 and $1.50 billion less in
MCA.25
➢ Average MCA per HECM reached $334,989 FY 2018.26
➢ The HECM portfolio grew to $72.41 billion of IIF, $111.34 billion in total outstanding
MCA, and $87.13 billion in total current Principal Limit.27
➢ Average borrower age for a newly endorsed HECM increased minimally, from 73.16
years of age in FY 2017 to 73.34 years of age in FY 2018.28
➢ By far the largest state for HECM endorsements by MCA is California at 33.17 percent,
followed by Florida at 6.79 percent, and Colorado at 6.67 percent. HECMs are more
geographically concentrated than Forward mortgages.29
➢ Claims from HECMs continued to increase in FY 2018. The overall amount paid on HECM
claims increased to $5.69 billion, up from $5.03 billion in FY 2017 and a substantial
increase from the $0.29 billion of claims paid in FY 2009.30
➢ As a result of rising claims, FY 2018 net cash flow from insurance operations was negative 21.75 percent of HECM average IIF.31
Addressing HECM Portfolio Volatility
The financial performance of the HECM portfolio has been historically volatile, largely due to
uncertainty in future home prices, interest rates, and other factors
In FY 2017, FHA took significant actions to improve the fiscal condition of the HECM program by
implementing updated PLFs effective with case numbers issued on or after October 2, 2017.
The full impact from updated PLFs was only recognized in September 2018 when nearly 100
23 The IIF in the HECM portfolio totaled 547,721 mortgages and $143.87 billion as of September 2018, with 402,444 mortgages and $111.27 billion covered in the MMIF. Table B-24. 24 Maximum Claim Amount is the lesser of the appraised value or purchase price of the property, but not to exceed FHA’s HECM loan limit (currently $679,650). 25 Table B-23. 26 Table B-26. 27 Table B-24. 28 Table B-28. 29 Table B-33. 30 Since the transition to the MMIF in 2009, Claim Type 2 (those representing the dollar volume of claims resulting from the assignment of the mortgage to the Secretary of HUD when the mortgage reaches 98 percent of the MCA) has increased significantly. In FY 2009, the claims paid out on Claim Type 2 was $281 million. Claims under Claim Type 2 have increased to $5.50 billion in FY 2018. While less in total amount, a similar trend has occurred in the amount paid on Claim Type 1, which represents the dollar volume of claims generated when the borrower no longer occupies the home and the property is sold at a loss, and without the mortgage being assigned to the Secretary. In FY 2009, Claim Type 1 totaled $5,818, and by FY 2018 totaled $612 million, down from $755 million in FY 2015. Table B-25. 31 Table II-9.
U.S. Department of Housing and Urban Development
Financial Status of the FHA Mutual Mortgage Insurance Fund FY 2018 16
percent of new HECMs were endorsed under the new PLFs. As a result of the transition,
Principal Limits (PL) as a share of MCA declined through the course of FY 2018 from 59.97
percent to 50.23 percent. A full discussion of the impact of these changes can be found in
Chapters I and II of this report.
To further mitigate risks for new HECM endorsements, FHA made revisions to collateral
valuation (property appraisal) practices for HECM endorsements beginning in FY 2019. As of
October 1, 2018, FHA performs a collateral (property appraisal) risk assessment on all HECMs
submitted for insurance endorsement. Lenders are required to provide a second independent
property appraisal in cases where FHA determines there may be inflated property valuations.
Financial soundness of FHA’s reverse mortgage program is contingent upon an accurate
determination of a property’s value and condition. The property value is used to determine the
amount of equity that is available to the borrower, and it is also used by FHA to determine the
amount of insurance benefits paid to a lender. A larger discussion of this policy change is
contained in Chapter III of this report. FHA will continue to assess the HECM portfolio
throughout FY 2019 and consider other changes as warranted.
Barriers to Protection of the MMIF and Success of FHA’s Single Family
Mortgage Insurance Programs
Chapter III of this Annual Report details emerging risks in FHA’s Single Family programs, and
barriers impacting FHA’s ability to adequately address the identified risks in its programs. These
barriers include specific statutory provisions impacting FHA’s ability to manage its programs, in
the following key areas:
➢ Prohibited Sources of Downpayment Assistance;
➢ Mortgagee Review Board Authorities; and
➢ Limitations on Civil Money Penalties.
A Note on the Actuarial Review Process Enhancements Introduced in the FY 2017 Annual Report
As part of a multi-year plan to revise the MMIF Actuarial Review process, FHA implemented in the FY 2017 Annual Report enhancements to roles, responsibilities, and methodologies with regard to preparation of its annual report. The FY 2018 Annual Report maintains these enhancements:
➢ Greater Consistency with FHA Audited Financial Statements—FHA produced the baseline estimate of Cash Flow NPV, resulting in more consistent results by harmonizing its financial and budgetary reporting. This change enabled FHA to standardize the underlying data and reporting methodologies used to produce Cash Flow NPV with those utilized to estimate the Liability for Loan Guarantees (LLG).
➢ Federal Credit Reform Act of 1990 (FCRA) Compliance—The baseline estimate and related sensitivities were developed by FHA in accordance with the requirements of
U.S. Department of Housing and Urban Development
Financial Status of the FHA Mutual Mortgage Insurance Fund FY 2018 17
FCRA. The baseline estimates were developed utilizing the President’s FY 2018 Mid-Session Review budget assumptions. All estimates of Cash Flow NPV are based on IIF as of the end of FY 2018 with no future endorsements.
➢ Critical Role for Independent Actuary—By serving as an important check on FHA’s methodology and results, an independent Actuarial Review remains an integral part of the Annual Report. As with the FY 2017 report, the independent actuary was responsible for providing an independent assessment and opinion regarding the reasonableness of FHA’s Cash Flow NPV estimate.
• Pinnacle Actuarial Resources, Inc. (“Pinnacle”) is the independent actuary that prepared the review of the MMIF for the FY 2018 Actuarial Review. Selected results from Pinnacle’s reports for both Single Family Forward mortgages and HECMs are referenced throughout the report. To read the complete review of the MMIF provided by Pinnacle, please visit https://www.hud.gov/program_offices/housing/rmra/oe/rpts/actr/actrmenu.
• FHA’s estimates of Cash Flow NPV are well within Pinnacle’s reasonable range of Actuarial estimates, and Pinnacle’s Actuarial central estimates for the MMIF exceeded FHA’s and differ by only 0.29 percent of IIF.
➢ Better Alignment to Statutory Requirements—For the purposes of calculating the MMIF Capital Ratio, as well as the stand-alone capital ratio for HECM, IIF for HECM was calculated using aggregate Unpaid Principal Balance (UPB)32 versus the prior practice of using aggregate MCA. This change more appropriately aligns to statutory requirements and the treatment of the Forward portfolio and addresses the tendency of the prior methodology to overstate the HECM capital ratio when Economic Net Worth is negative, as it has been for the last several fiscal years.
Capital Ratio Tested Under Alternative Economic Scenarios
Understanding the capital adequacy of the MMIF, and the Forward mortgage and HECM portfolios on a stand-alone basis, allows FHA to effectively manage risk. Such an assessment of capital adequacy across a range of economic environments is a critical component of evaluating future policy decisions, such as Mortgage Insurance Premium (MIP) adjustments, and overall portfolio risk tolerance.
Consistent with last year’s report, this year’s Annual Report provides an assessment of the financial performance of the MMIF under 100 alternative historical economic scenarios using assumptions spanning from highly stressed economic conditions to robust positive growth in the economy and housing market.
Based on current Forward mortgage and HECM IIF (and existing Total Capital Resources), this stress testing illustrates that:
➢ The MMIF Capital Ratio would remain at or above the 2.00 percent statutory minimum requirement in 94 outcomes;
32 UPB is the current outstanding principal balance due on the mortgage.
U.S. Department of Housing and Urban Development
Financial Status of the FHA Mutual Mortgage Insurance Fund FY 2018 18
➢ In an additional four outcomes, the MMIF Capital Ratio would fall below 2.00 percent but remain above zero; and
➢ The remaining two outcomes would result in the MMIF Capital Ratio falling below zero.
Importantly, the stress testing illustrates the asymmetric distribution of risk and return that the MMIF faces33. As detailed in the discussion and shown in Exhibits II-17 through II-19 in Chapter II, severely adverse scenarios generally result in greater negative impact on the MMIF than corresponding gains under favorable economic conditions.
A Note About Cash Flow NPV: Meaning and Risks
As noted earlier, Cash Flow NPV is a critical component of Economic Net Worth and the MMIF Capital Ratio, and is calculated according to the requirements of FCRA based on a single economic scenario.34 Thus, Cash Flow NPV does not represent the fair value that willing market participants would pay for the future net cash flows of the MMIF.
According to the Congressional Budget Office (CBO), “Unlike FCRA estimates, fair-value estimates account for the cost of the market risk that taxpayers face because federal payments to cover losses on guaranteed mortgages tend to be high when economic and financial conditions are poor and resources therefore more valuable.”35
When modeled across a range of economic scenarios, Cash Flow NPV demonstrates that the decrease in present value in stressful economic scenarios is substantially greater than the increase in present value in favorable economic scenarios. Again, this asymmetric risk profile, generally applicable to all mortgage credit risk-bearing activity such as mortgage insurance, is evident in FHA’s capital adequacy testing results presented in Chapter II.
In addition, estimates of Cash Flow NPV are dependent on a variety of assumptions, critical estimates, complex models, and projections for economic variables such as future national and regional home prices, and interest rates.
HECM estimates present added uncertainty due to reliance on long-dated future projections of home prices and interest rates, assumptions regarding the timing and amount of borrower draws from any available credit line, mobility (the degree to which borrowers move out of the home while still living), mortality, and the risk and uncertainty created by appraisal bias.
Other FHA Programs and Exposures
This Annual Report is statutorily required to address mortgages insured in the MMIF. FHA has various other programs, including its Single Family Title I program, Multifamily, and Healthcare
33 FHA refers readers to Chapter II for a complete discussion of the sensitivity analysis of the MMIF’s capital adequacy. Exhibit II-16, for example, illustrates the Capital Ratio sensitivity due to changes in interest rates compared to changes in home price appreciation. 34 FHA is required by statute to report fund solvency according to the standards provided in FCRA, but this does not preclude FHA from implementing additional risk management methodologies that may be better suited to capturing the tail risk for each fiscal year cohort of mortgages that populate the MMIF. Also, the distribution of risk in FHA’s portfolio is not uniform: it may very likely not be appropriate to use a normal central estimate when there is substantial risk in the tails of the Fund. 35 CBO report titled “Options to Manage FHA’s Exposure to Risk from Guaranteeing Single-Family Mortgages” dated September 2017. Excerpt is from footnote c. in Table 1 on page 3 of the report.
U.S. Department of Housing and Urban Development
Financial Status of the FHA Mutual Mortgage Insurance Fund FY 2018 19
Facility insurance programs that are not part of the MMIF. Readers interested in a comprehensive view of all of FHA’s programs, exposures, and the related audited financial statements should see the FHA Annual Management Report for Fiscal Year 2018.36
Report Structure
The remainder of this report is structured as follows:
➢ Chapter I presents a summary of the credit portfolio for both the Forward mortgage
Program and the HECM program. Chapter One includes notable trends affecting the risk
characteristics for new endorsements to the MMIF from both programs during FY 2018.
➢ Chapter II contains an analysis of the performance of the MMIF, which includes a
detailed breakdown of the MMIF Capital Ratio and the stand-alone capital ratios for the
Forward and HECM portfolios. This chapter provides key highlights from the
Independent Actuary’s audit and stress test of the capital adequacy of the MMIF.
➢ Chapter III provides a discussion of FHA’s Office of Single Family Housing’s response to
the fall 2017 disasters, and discusses emerging risk characteristics. The chapter also
identifies important legislative barriers impacting the financial performance and
operational integrity of its Single Family programs that FHA lacks the ability to address
independently to further its efforts to protect the MMIF.
36 https://www.hud.gov/program_offices/housing/hsgrroom/fhaamr
U.S. Department of Housing and Urban Development
Financial Status of the FHA Mutual Mortgage Insurance Fund FY 2018 20
Chapter I:
FHA Single Family Mortgage and Borrower Characteristics
FHA Forward Mortgage Program: New Endorsement Trends and
Composition
Through its Title II Forward mortgage insurance programs, FHA plays an important role in the
single-family residential mortgage market. FHA insurance facilitates the availability of mortgage
credit for the purchase of a home or to refinance an existing mortgage, including both fixed- and
adjustable-rate mortgages. By absorbing mortgage credit risk for lenders, FHA insurance expands
liquidity and enables access to secondary market securitization. Borrowers and lenders rely more
heavily on FHA-insured mortgages when access to other sources of mortgage financing is
constrained, such as during the 2008 financial crisis when FHA played a substantial counter-
cyclical role.
In addition, some borrowers may choose FHA insurance because it provides more flexible
underwriting requirements and better terms than alternatives available in the market. As a
result, FHA-insured mortgages play a major role for borrowers traditionally underserved by the
conventional mortgage market, with a majority of new endorsements serving first-time
homebuyers. FHA-insured mortgages also continue to serve as an important source of financing
for minority homebuyers.
U.S. Department of Housing and Urban Development
Financial Status of the FHA Mutual Mortgage Insurance Fund FY 2018 21
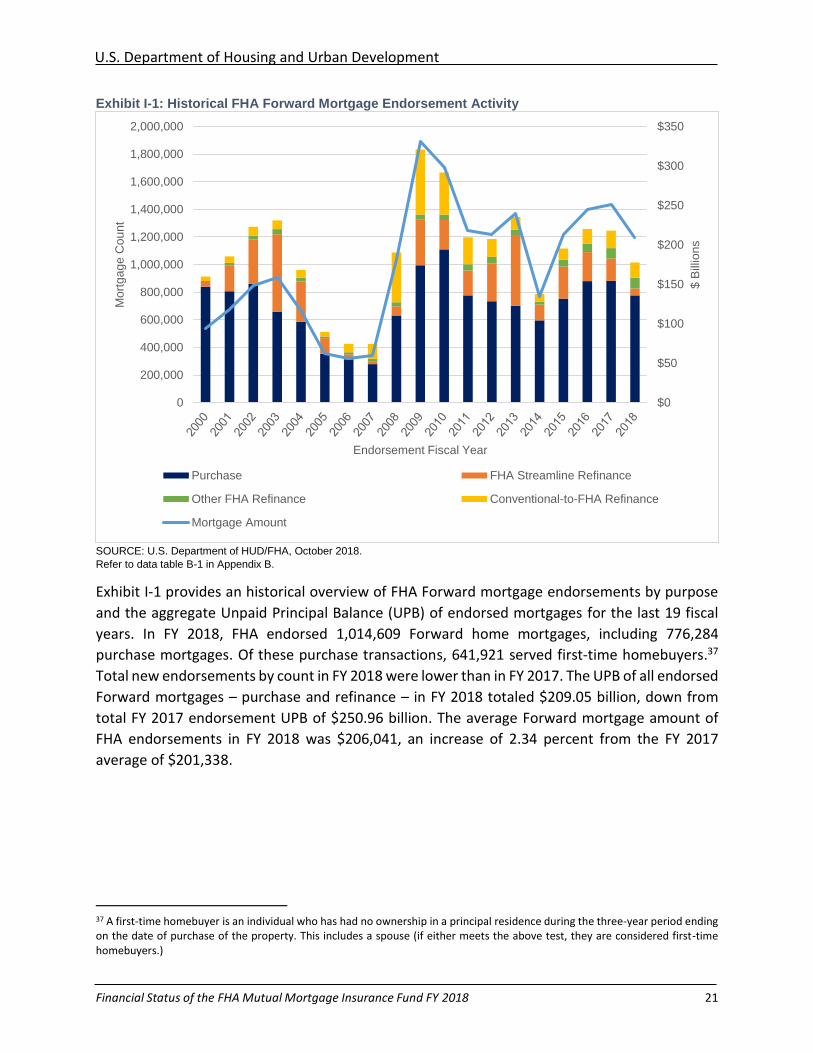
Exhibit I-1: Historical FHA Forward Mortgage Endorsement Activity
SOURCE: U.S. Department of HUD/FHA, October 2018.
Refer to data table B-1 in Appendix B.
Exhibit I-1 provides an historical overview of FHA Forward mortgage endorsements by purpose
and the aggregate Unpaid Principal Balance (UPB) of endorsed mortgages for the last 19 fiscal
years. In FY 2018, FHA endorsed 1,014,609 Forward home mortgages, including 776,284
purchase mortgages. Of these purchase transactions, 641,921 served first-time homebuyers.37
Total new endorsements by count in FY 2018 were lower than in FY 2017. The UPB of all endorsed
Forward mortgages – purchase and refinance – in FY 2018 totaled $209.05 billion, down from
total FY 2017 endorsement UPB of $250.96 billion. The average Forward mortgage amount of
FHA endorsements in FY 2018 was $206,041, an increase of 2.34 percent from the FY 2017
average of $201,338.
37 A first-time homebuyer is an individual who has had no ownership in a principal residence during the three-year period ending on the date of purchase of the property. This includes a spouse (if either meets the above test, they are considered first-time homebuyers.)
$0
$50
$100
$150
$200
$250
$300
$350
0
200,000
400,000
600,000
800,000
1,000,000
1,200,000
1,400,000
1,600,000
1,800,000
2,000,000
$ B
illio
ns
Mo
rtg
ag
e C
ou
nt
Endorsement Fiscal Year
Purchase FHA Streamline Refinance
Other FHA Refinance Conventional-to-FHA Refinance
Mortgage Amount
U.S. Department of Housing and Urban Development
Financial Status of the FHA Mutual Mortgage Insurance Fund FY 2018 22
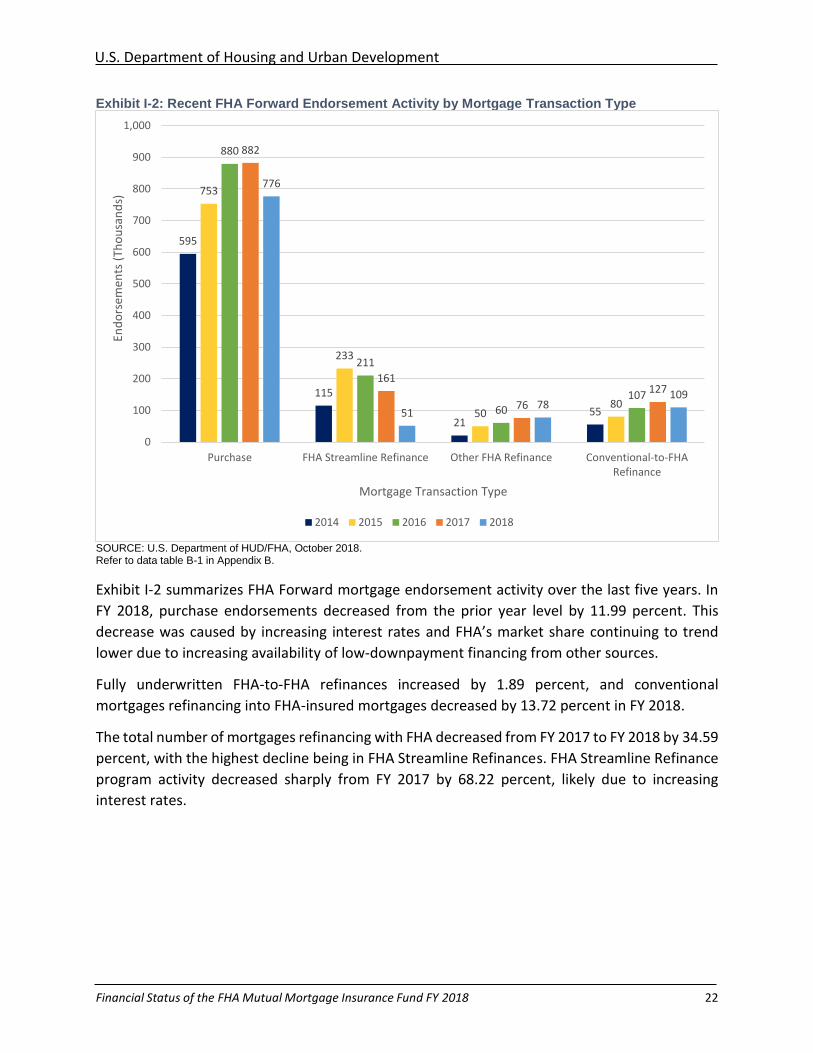
Exhibit I-2: Recent FHA Forward Endorsement Activity by Mortgage Transaction Type
SOURCE: U.S. Department of HUD/FHA, October 2018. Refer to data table B-1 in Appendix B.
Exhibit I-2 summarizes FHA Forward mortgage endorsement activity over the last five years. In
FY 2018, purchase endorsements decreased from the prior year level by 11.99 percent. This
decrease was caused by increasing interest rates and FHA’s market share continuing to trend
lower due to increasing availability of low-downpayment financing from other sources.
Fully underwritten FHA-to-FHA refinances increased by 1.89 percent, and conventional
mortgages refinancing into FHA-insured mortgages decreased by 13.72 percent in FY 2018.
The total number of mortgages refinancing with FHA decreased from FY 2017 to FY 2018 by 34.59
percent, with the highest decline being in FHA Streamline Refinances. FHA Streamline Refinance
program activity decreased sharply from FY 2017 by 68.22 percent, likely due to increasing
interest rates.
595
115
2155
753
233
5080
880
211
60107
882
161
76
127
776
5178
109
0
100
200
300
400
500
600
700
800
900
1,000
Purchase FHA Streamline Refinance Other FHA Refinance Conventional-to-FHARefinance
End
ors
emen
ts (
Tho
usa
nd
s)
Mortgage Transaction Type
2014 2015 2016 2017 2018
U.S. Department of Housing and Urban Development
Financial Status of the FHA Mutual Mortgage Insurance Fund FY 2018 23
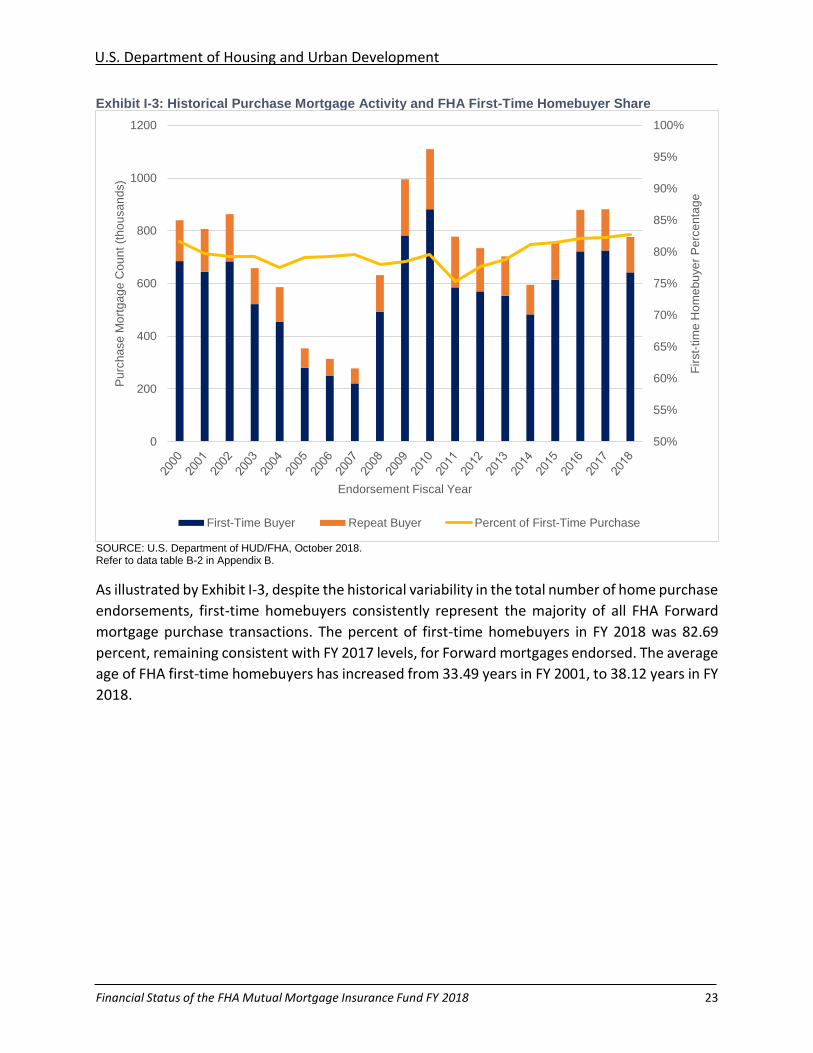
Exhibit I-3: Historical Purchase Mortgage Activity and FHA First-Time Homebuyer Share
SOURCE: U.S. Department of HUD/FHA, October 2018. Refer to data table B-2 in Appendix B.
As illustrated by Exhibit I-3, despite the historical variability in the total number of home purchase
endorsements, first-time homebuyers consistently represent the majority of all FHA Forward
mortgage purchase transactions. The percent of first-time homebuyers in FY 2018 was 82.69
percent, remaining consistent with FY 2017 levels, for Forward mortgages endorsed. The average
age of FHA first-time homebuyers has increased from 33.49 years in FY 2001, to 38.12 years in FY
2018.
50%
55%
60%
65%
70%
75%
80%
85%
90%
95%
100%
0
200
400
600
800
1000
1200
Fir
st-
tim
e H
om
eb
uye
r P
erc
en
tag
e
Pu
rch
ase
Mo
rtg
ag
e C
ou
nt (t
ho
usa
nd
s)
Endorsement Fiscal Year
First-Time Buyer Repeat Buyer Percent of First-Time Purchase
U.S. Department of Housing and Urban Development
Financial Status of the FHA Mutual Mortgage Insurance Fund FY 2018 24
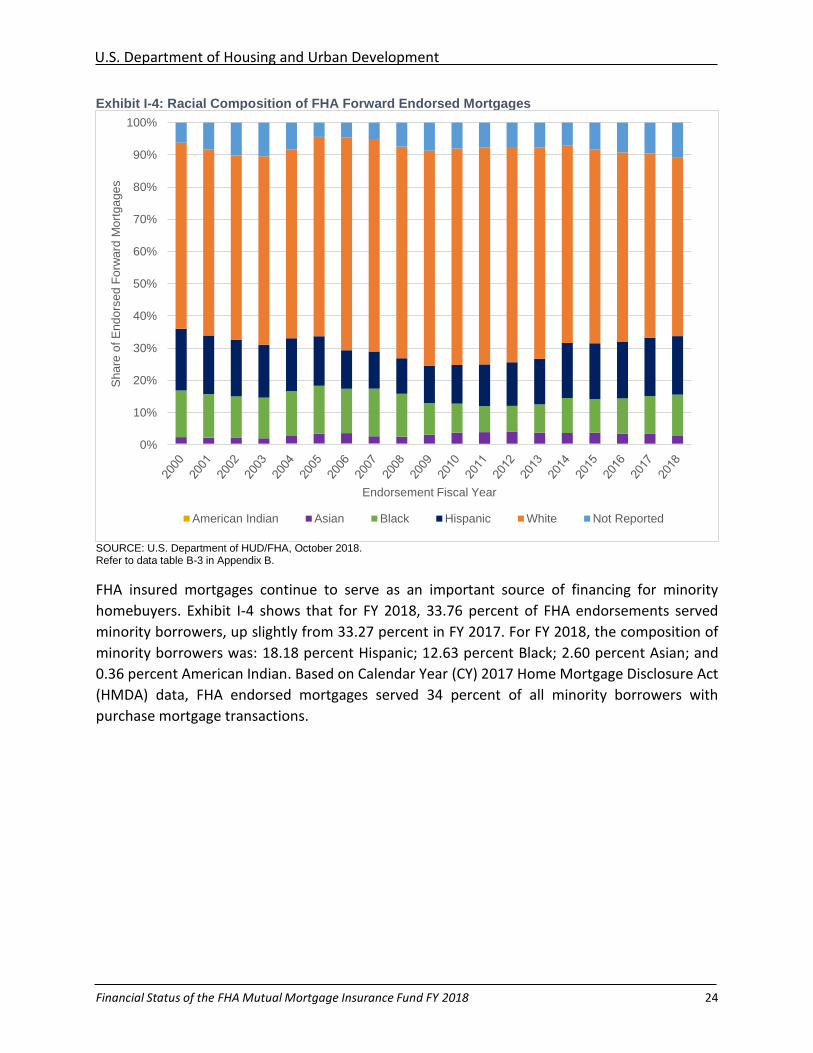
Exhibit I-4: Racial Composition of FHA Forward Endorsed Mortgages
SOURCE: U.S. Department of HUD/FHA, October 2018. Refer to data table B-3 in Appendix B.
FHA insured mortgages continue to serve as an important source of financing for minority
homebuyers. Exhibit I-4 shows that for FY 2018, 33.76 percent of FHA endorsements served
minority borrowers, up slightly from 33.27 percent in FY 2017. For FY 2018, the composition of
minority borrowers was: 18.18 percent Hispanic; 12.63 percent Black; 2.60 percent Asian; and
0.36 percent American Indian. Based on Calendar Year (CY) 2017 Home Mortgage Disclosure Act
(HMDA) data, FHA endorsed mortgages served 34 percent of all minority borrowers with
purchase mortgage transactions.
0%
10%
20%
30%
40%
50%
60%
70%
80%
90%
100%S
ha
re o
f E
nd
ors
ed
Fo
rwa
rd M
ort
ga
ge
s
Endorsement Fiscal Year
American Indian Asian Black Hispanic White Not Reported
U.S. Department of Housing and Urban Development
Financial Status of the FHA Mutual Mortgage Insurance Fund FY 2018 25
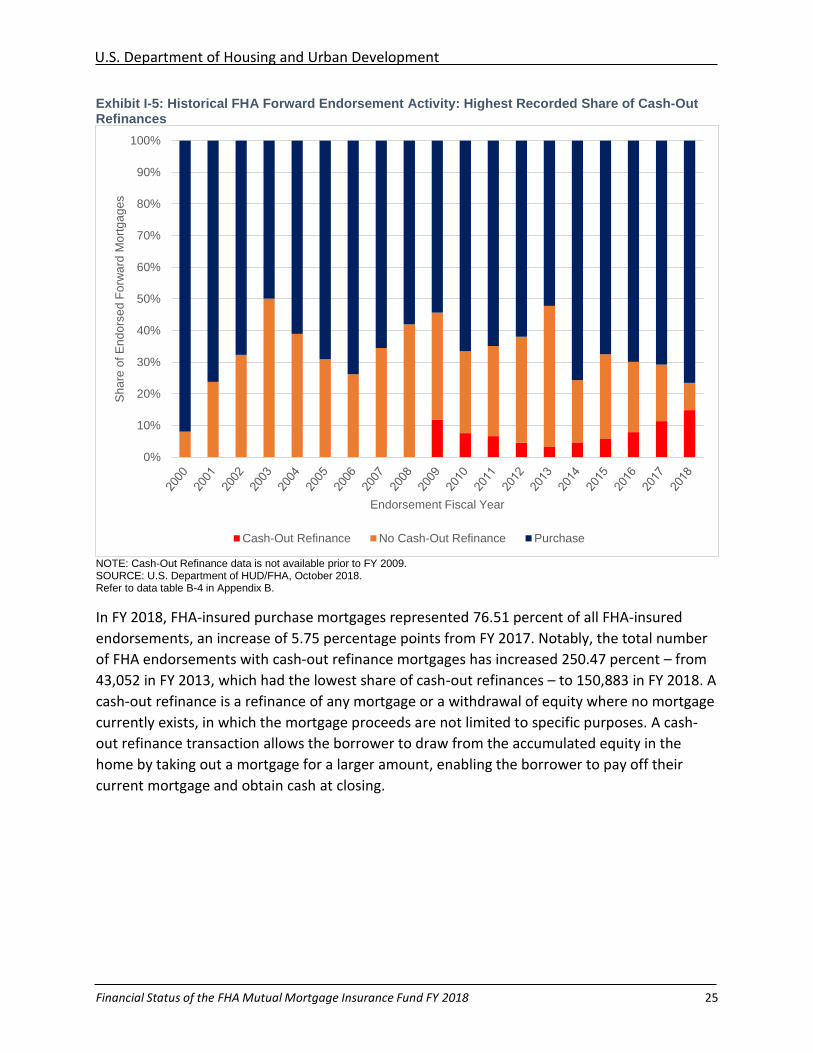
Exhibit I-5: Historical FHA Forward Endorsement Activity: Highest Recorded Share of Cash-Out Refinances
NOTE: Cash-Out Refinance data is not available prior to FY 2009. SOURCE: U.S. Department of HUD/FHA, October 2018. Refer to data table B-4 in Appendix B.
In FY 2018, FHA-insured purchase mortgages represented 76.51 percent of all FHA-insured
endorsements, an increase of 5.75 percentage points from FY 2017. Notably, the total number
of FHA endorsements with cash-out refinance mortgages has increased 250.47 percent – from
43,052 in FY 2013, which had the lowest share of cash-out refinances – to 150,883 in FY 2018. A
cash-out refinance is a refinance of any mortgage or a withdrawal of equity where no mortgage
currently exists, in which the mortgage proceeds are not limited to specific purposes. A cash-
out refinance transaction allows the borrower to draw from the accumulated equity in the
home by taking out a mortgage for a larger amount, enabling the borrower to pay off their
current mortgage and obtain cash at closing.
0%
10%
20%
30%
40%
50%
60%
70%
80%
90%
100%
Sh
are
of E
nd
ors
ed
Fo
rwa
rd M
ort
ga
ge
s
Endorsement Fiscal Year
Cash-Out Refinance No Cash-Out Refinance Purchase
U.S. Department of Housing and Urban Development
Financial Status of the FHA Mutual Mortgage Insurance Fund FY 2018 26
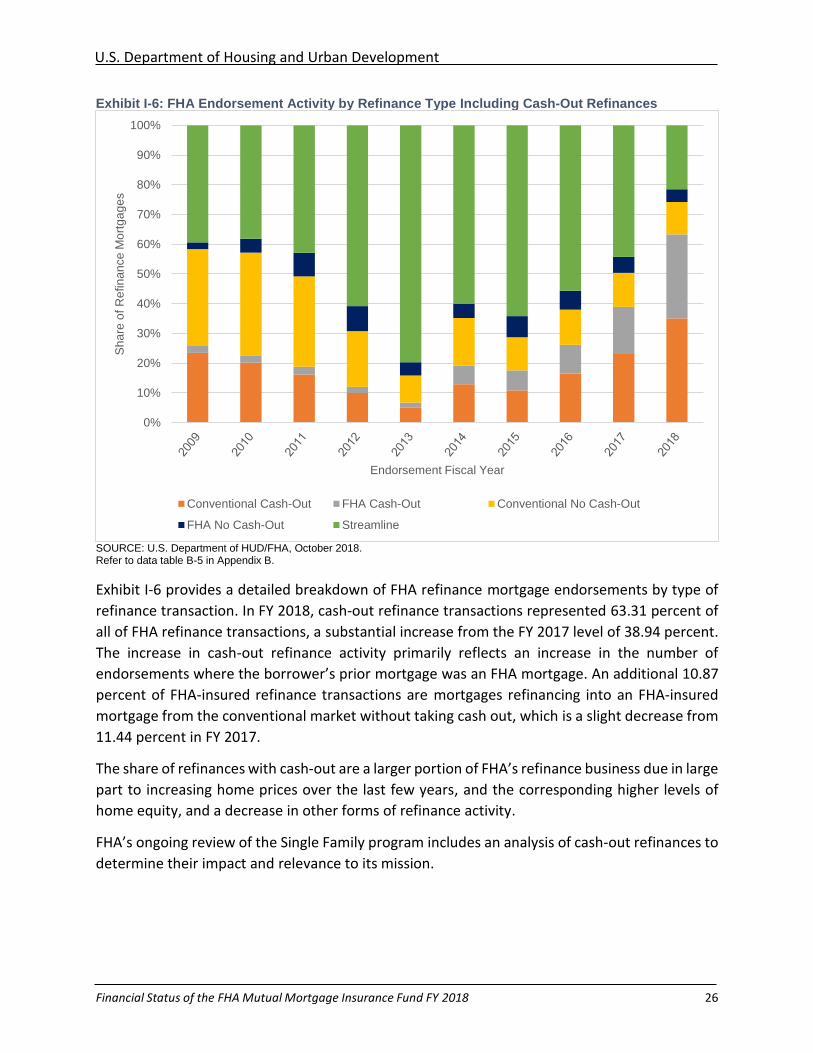
Exhibit I-6: FHA Endorsement Activity by Refinance Type Including Cash-Out Refinances
SOURCE: U.S. Department of HUD/FHA, October 2018. Refer to data table B-5 in Appendix B.
Exhibit I-6 provides a detailed breakdown of FHA refinance mortgage endorsements by type of
refinance transaction. In FY 2018, cash-out refinance transactions represented 63.31 percent of
all of FHA refinance transactions, a substantial increase from the FY 2017 level of 38.94 percent.
The increase in cash-out refinance activity primarily reflects an increase in the number of
endorsements where the borrower’s prior mortgage was an FHA mortgage. An additional 10.87
percent of FHA-insured refinance transactions are mortgages refinancing into an FHA-insured
mortgage from the conventional market without taking cash out, which is a slight decrease from
11.44 percent in FY 2017.
The share of refinances with cash-out are a larger portion of FHA’s refinance business due in large
part to increasing home prices over the last few years, and the corresponding higher levels of
home equity, and a decrease in other forms of refinance activity.
FHA’s ongoing review of the Single Family program includes an analysis of cash-out refinances to
determine their impact and relevance to its mission.
0%
10%
20%
30%
40%
50%
60%
70%
80%
90%
100%S
ha
re o
f R
efin
an
ce
Mo
rtg
ag
es
Endorsement Fiscal Year
Conventional Cash-Out FHA Cash-Out Conventional No Cash-Out
FHA No Cash-Out Streamline
U.S. Department of Housing and Urban Development
Financial Status of the FHA Mutual Mortgage Insurance Fund FY 2018 27
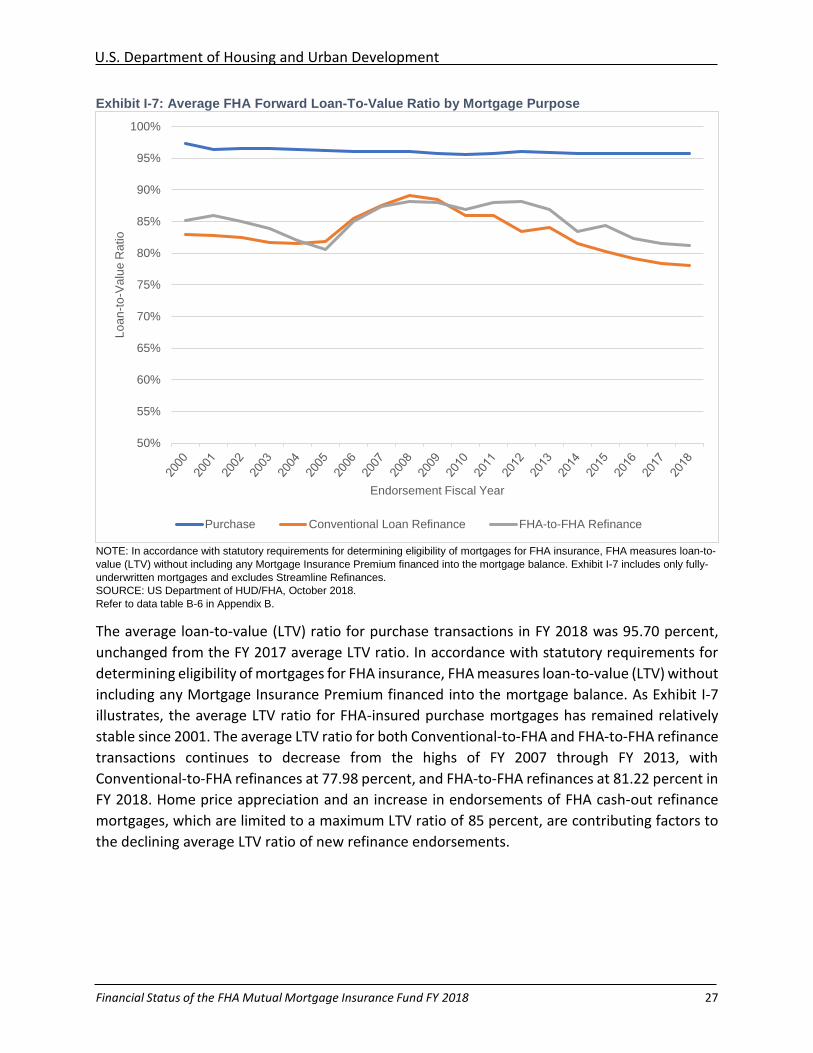
Exhibit I-7: Average FHA Forward Loan-To-Value Ratio by Mortgage Purpose
NOTE: In accordance with statutory requirements for determining eligibility of mortgages for FHA insurance, FHA measures loan-to-
value (LTV) without including any Mortgage Insurance Premium financed into the mortgage balance. Exhibit I-7 includes only fully-
underwritten mortgages and excludes Streamline Refinances.
SOURCE: US Department of HUD/FHA, October 2018. Refer to data table B-6 in Appendix B.
The average loan-to-value (LTV) ratio for purchase transactions in FY 2018 was 95.70 percent,
unchanged from the FY 2017 average LTV ratio. In accordance with statutory requirements for
determining eligibility of mortgages for FHA insurance, FHA measures loan-to-value (LTV) without
including any Mortgage Insurance Premium financed into the mortgage balance. As Exhibit I-7
illustrates, the average LTV ratio for FHA-insured purchase mortgages has remained relatively
stable since 2001. The average LTV ratio for both Conventional-to-FHA and FHA-to-FHA refinance
transactions continues to decrease from the highs of FY 2007 through FY 2013, with
Conventional-to-FHA refinances at 77.98 percent, and FHA-to-FHA refinances at 81.22 percent in
FY 2018. Home price appreciation and an increase in endorsements of FHA cash-out refinance
mortgages, which are limited to a maximum LTV ratio of 85 percent, are contributing factors to
the declining average LTV ratio of new refinance endorsements.
50%
55%
60%
65%
70%
75%
80%
85%
90%
95%
100%L
oa
n-t
o-V
alu
e R
atio
Endorsement Fiscal Year
Purchase Conventional Loan Refinance FHA-to-FHA Refinance
U.S. Department of Housing and Urban Development
Financial Status of the FHA Mutual Mortgage Insurance Fund FY 2018 28
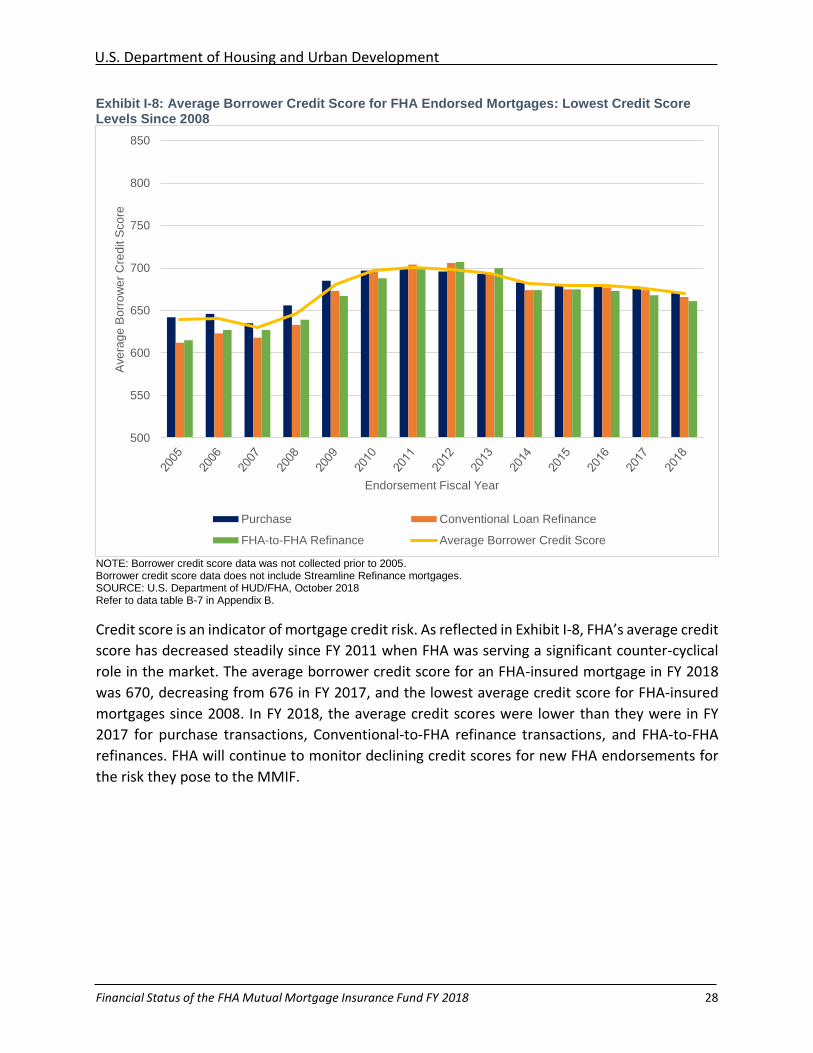
Exhibit I-8: Average Borrower Credit Score for FHA Endorsed Mortgages: Lowest Credit Score Levels Since 2008
NOTE: Borrower credit score data was not collected prior to 2005. Borrower credit score data does not include Streamline Refinance mortgages. SOURCE: U.S. Department of HUD/FHA, October 2018 Refer to data table B-7 in Appendix B.
Credit score is an indicator of mortgage credit risk. As reflected in Exhibit I-8, FHA’s average credit
score has decreased steadily since FY 2011 when FHA was serving a significant counter-cyclical
role in the market. The average borrower credit score for an FHA-insured mortgage in FY 2018
was 670, decreasing from 676 in FY 2017, and the lowest average credit score for FHA-insured
mortgages since 2008. In FY 2018, the average credit scores were lower than they were in FY
2017 for purchase transactions, Conventional-to-FHA refinance transactions, and FHA-to-FHA
refinances. FHA will continue to monitor declining credit scores for new FHA endorsements for
the risk they pose to the MMIF.
500
550
600
650
700
750
800
850
Ave
rag
e B
orr
ow
er
Cre
dit S
co
re
Endorsement Fiscal Year
Purchase Conventional Loan Refinance
FHA-to-FHA Refinance Average Borrower Credit Score
U.S. Department of Housing and Urban Development
Financial Status of the FHA Mutual Mortgage Insurance Fund FY 2018 29
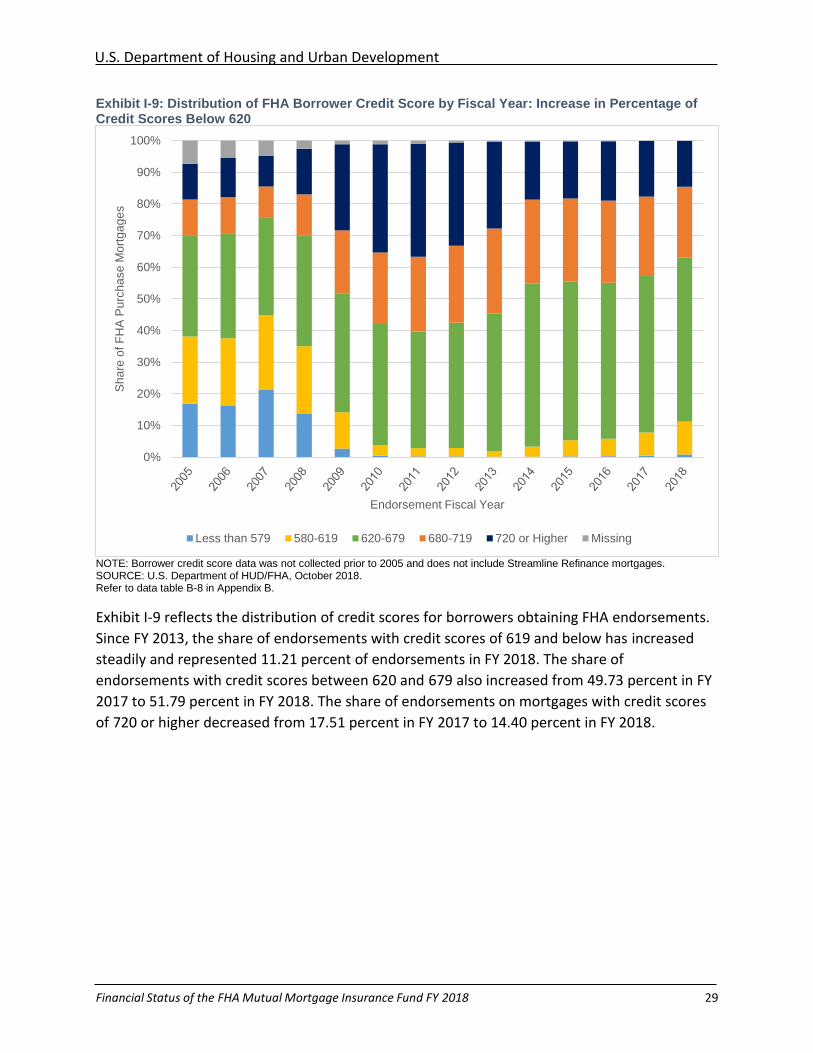
Exhibit I-9: Distribution of FHA Borrower Credit Score by Fiscal Year: Increase in Percentage of Credit Scores Below 620
NOTE: Borrower credit score data was not collected prior to 2005 and does not include Streamline Refinance mortgages. SOURCE: U.S. Department of HUD/FHA, October 2018. Refer to data table B-8 in Appendix B.
Exhibit I-9 reflects the distribution of credit scores for borrowers obtaining FHA endorsements.
Since FY 2013, the share of endorsements with credit scores of 619 and below has increased
steadily and represented 11.21 percent of endorsements in FY 2018. The share of
endorsements with credit scores between 620 and 679 also increased from 49.73 percent in FY
2017 to 51.79 percent in FY 2018. The share of endorsements on mortgages with credit scores
of 720 or higher decreased from 17.51 percent in FY 2017 to 14.40 percent in FY 2018.
0%
10%
20%
30%
40%
50%
60%
70%
80%
90%
100%
Sh
are
of F
HA
Pu
rch
ase
Mo
rtg
ag
es
Endorsement Fiscal Year
Less than 579 580-619 620-679 680-719 720 or Higher Missing
U.S. Department of Housing and Urban Development
Financial Status of the FHA Mutual Mortgage Insurance Fund FY 2018 30
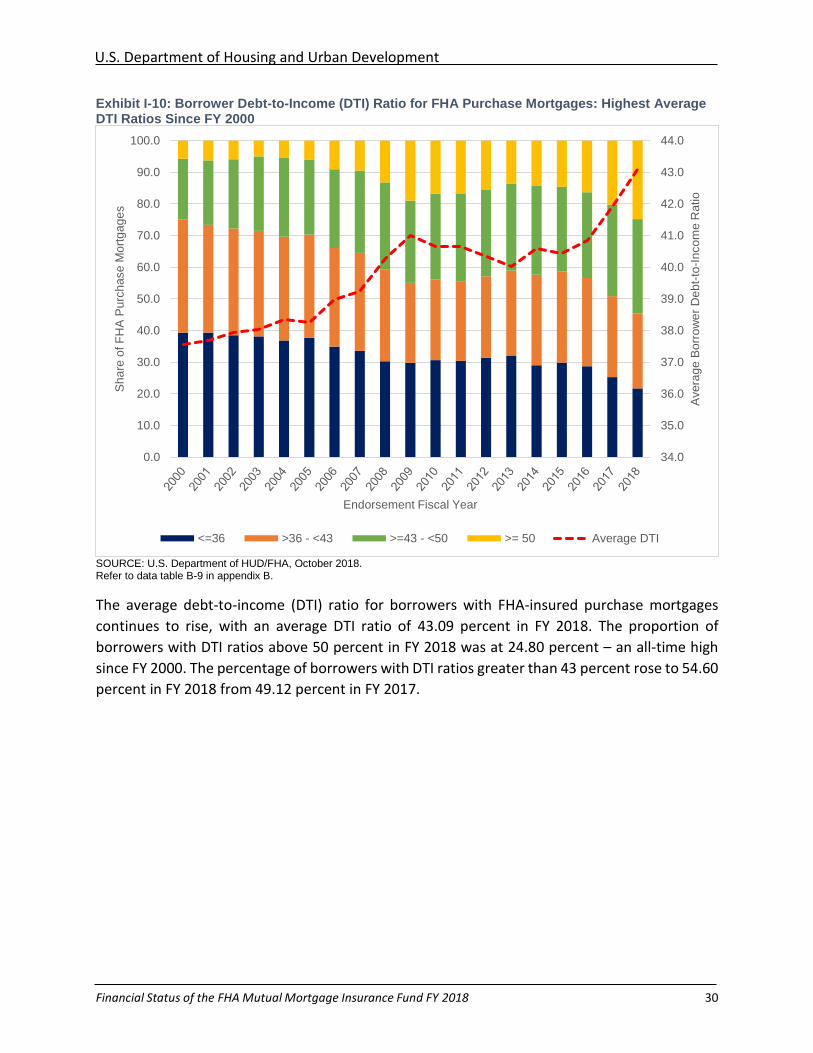
Exhibit I-10: Borrower Debt-to-Income (DTI) Ratio for FHA Purchase Mortgages: Highest Average DTI Ratios Since FY 2000
SOURCE: U.S. Department of HUD/FHA, October 2018. Refer to data table B-9 in appendix B.
The average debt-to-income (DTI) ratio for borrowers with FHA-insured purchase mortgages
continues to rise, with an average DTI ratio of 43.09 percent in FY 2018. The proportion of
borrowers with DTI ratios above 50 percent in FY 2018 was at 24.80 percent – an all-time high
since FY 2000. The percentage of borrowers with DTI ratios greater than 43 percent rose to 54.60
percent in FY 2018 from 49.12 percent in FY 2017.
34.0
35.0
36.0
37.0
38.0
39.0
40.0
41.0
42.0
43.0
44.0
0.0
10.0
20.0
30.0
40.0
50.0
60.0
70.0
80.0
90.0
100.0
Ave
rag
e B
orr
ow
er
De
bt-
to-I
nco
me
Ra
tio
Sh
are
of F
HA
Pu
rch
ase
Mo
rtg
ag
es
Endorsement Fiscal Year
<=36 >36 - <43 >=43 - <50 >= 50 Average DTI
U.S. Department of Housing and Urban Development
Financial Status of the FHA Mutual Mortgage Insurance Fund FY 2018 31
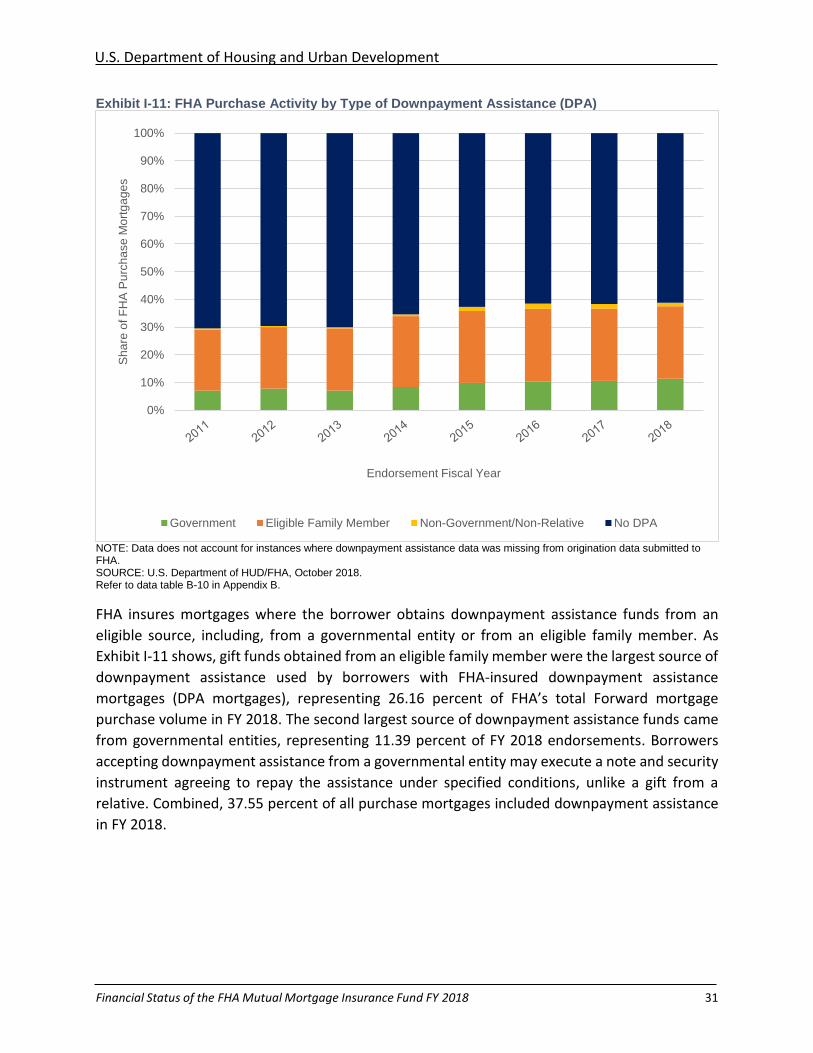
Exhibit I-11: FHA Purchase Activity by Type of Downpayment Assistance (DPA)
NOTE: Data does not account for instances where downpayment assistance data was missing from origination data submitted to FHA. SOURCE: U.S. Department of HUD/FHA, October 2018. Refer to data table B-10 in Appendix B.
FHA insures mortgages where the borrower obtains downpayment assistance funds from an
eligible source, including, from a governmental entity or from an eligible family member. As
Exhibit I-11 shows, gift funds obtained from an eligible family member were the largest source of
downpayment assistance used by borrowers with FHA-insured downpayment assistance
mortgages (DPA mortgages), representing 26.16 percent of FHA’s total Forward mortgage
purchase volume in FY 2018. The second largest source of downpayment assistance funds came
from governmental entities, representing 11.39 percent of FY 2018 endorsements. Borrowers
accepting downpayment assistance from a governmental entity may execute a note and security
instrument agreeing to repay the assistance under specified conditions, unlike a gift from a
relative. Combined, 37.55 percent of all purchase mortgages included downpayment assistance
in FY 2018.
0%
10%
20%
30%
40%
50%
60%
70%
80%
90%
100%S
ha
re o
f F
HA
Pu
rch
ase
Mo
rtg
ag
es
Endorsement Fiscal Year
Government Eligible Family Member Non-Government/Non-Relative No DPA
U.S. Department of Housing and Urban Development
Financial Status of the FHA Mutual Mortgage Insurance Fund FY 2018 32
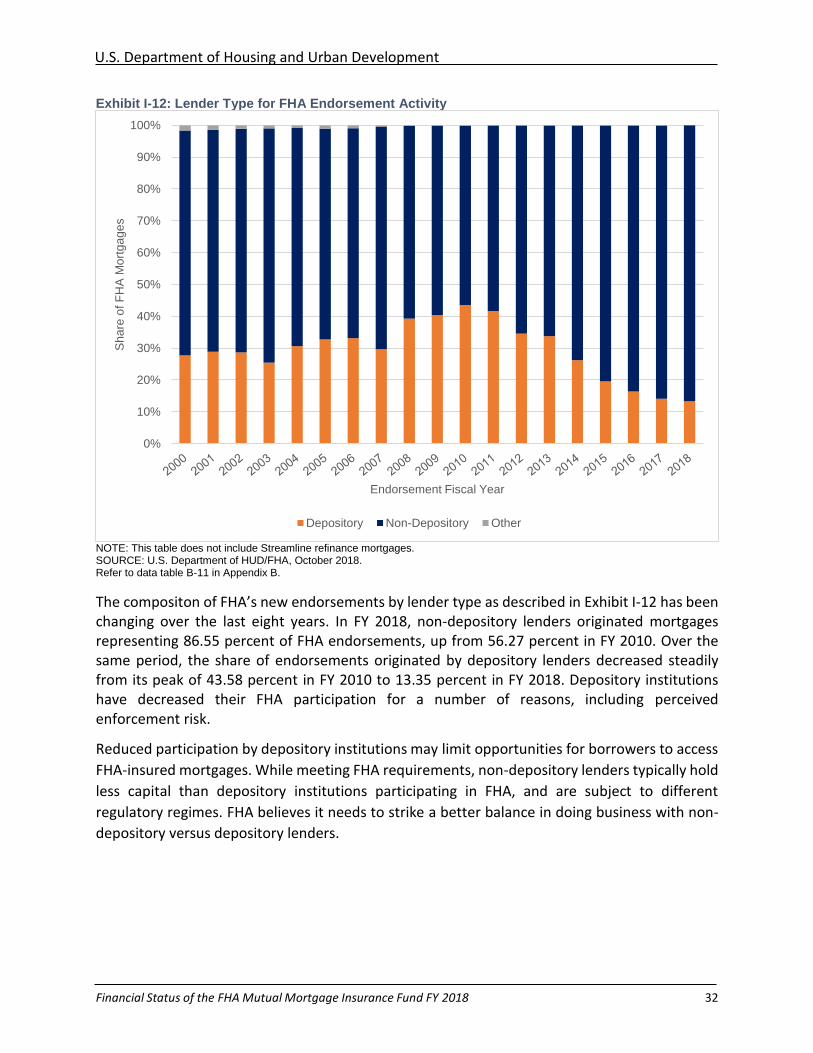
Exhibit I-12: Lender Type for FHA Endorsement Activity
NOTE: This table does not include Streamline refinance mortgages. SOURCE: U.S. Department of HUD/FHA, October 2018. Refer to data table B-11 in Appendix B.
The compositon of FHA’s new endorsements by lender type as described in Exhibit I-12 has been changing over the last eight years. In FY 2018, non-depository lenders originated mortgages representing 86.55 percent of FHA endorsements, up from 56.27 percent in FY 2010. Over the same period, the share of endorsements originated by depository lenders decreased steadily from its peak of 43.58 percent in FY 2010 to 13.35 percent in FY 2018. Depository institutions have decreased their FHA participation for a number of reasons, including perceived enforcement risk.
Reduced participation by depository institutions may limit opportunities for borrowers to access
FHA-insured mortgages. While meeting FHA requirements, non-depository lenders typically hold
less capital than depository institutions participating in FHA, and are subject to different
regulatory regimes. FHA believes it needs to strike a better balance in doing business with non-
depository versus depository lenders.
0%
10%
20%
30%
40%
50%
60%
70%
80%
90%
100%S
ha
re o
f F
HA
Mo
rtg
ag
es
Endorsement Fiscal Year
Depository Non-Depository Other
U.S. Department of Housing and Urban Development
Financial Status of the FHA Mutual Mortgage Insurance Fund FY 2018 33
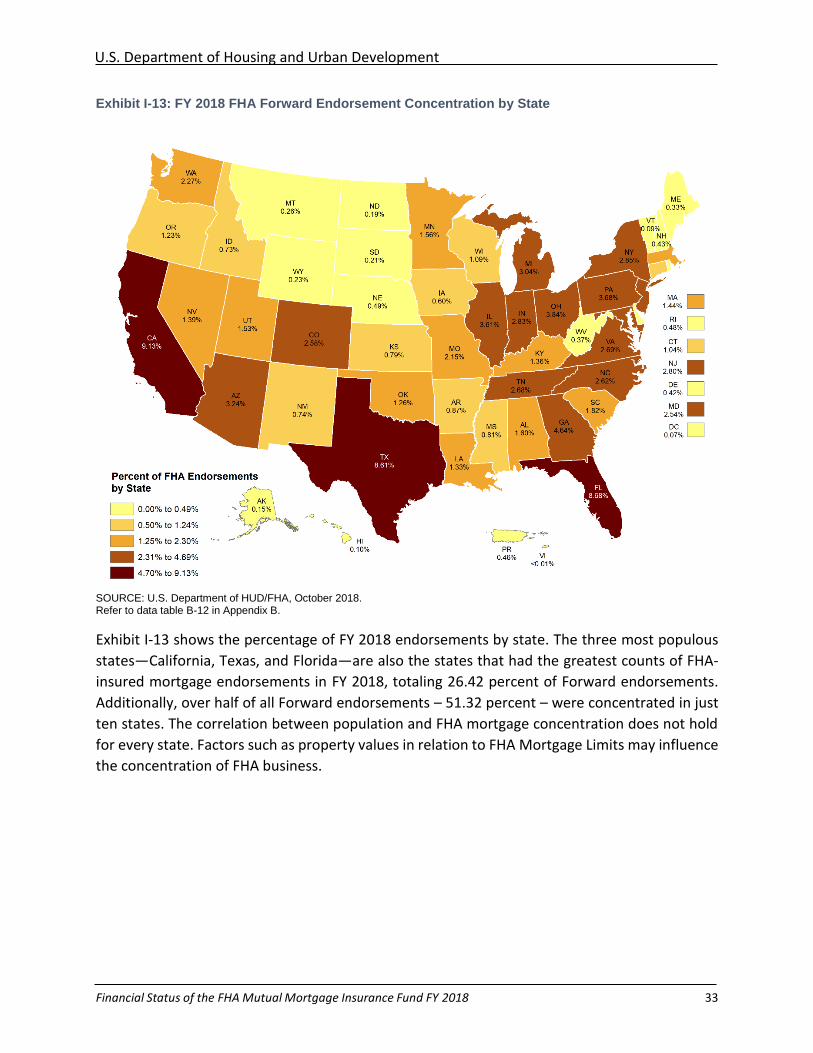
Exhibit I-13: FY 2018 FHA Forward Endorsement Concentration by State
SOURCE: U.S. Department of HUD/FHA, October 2018. Refer to data table B-12 in Appendix B.
Exhibit I-13 shows the percentage of FY 2018 endorsements by state. The three most populous
states—California, Texas, and Florida—are also the states that had the greatest counts of FHA-
insured mortgage endorsements in FY 2018, totaling 26.42 percent of Forward endorsements.
Additionally, over half of all Forward endorsements – 51.32 percent – were concentrated in just
ten states. The correlation between population and FHA mortgage concentration does not hold
for every state. Factors such as property values in relation to FHA Mortgage Limits may influence
the concentration of FHA business.
U.S. Department of Housing and Urban Development
Financial Status of the FHA Mutual Mortgage Insurance Fund FY 2018 34
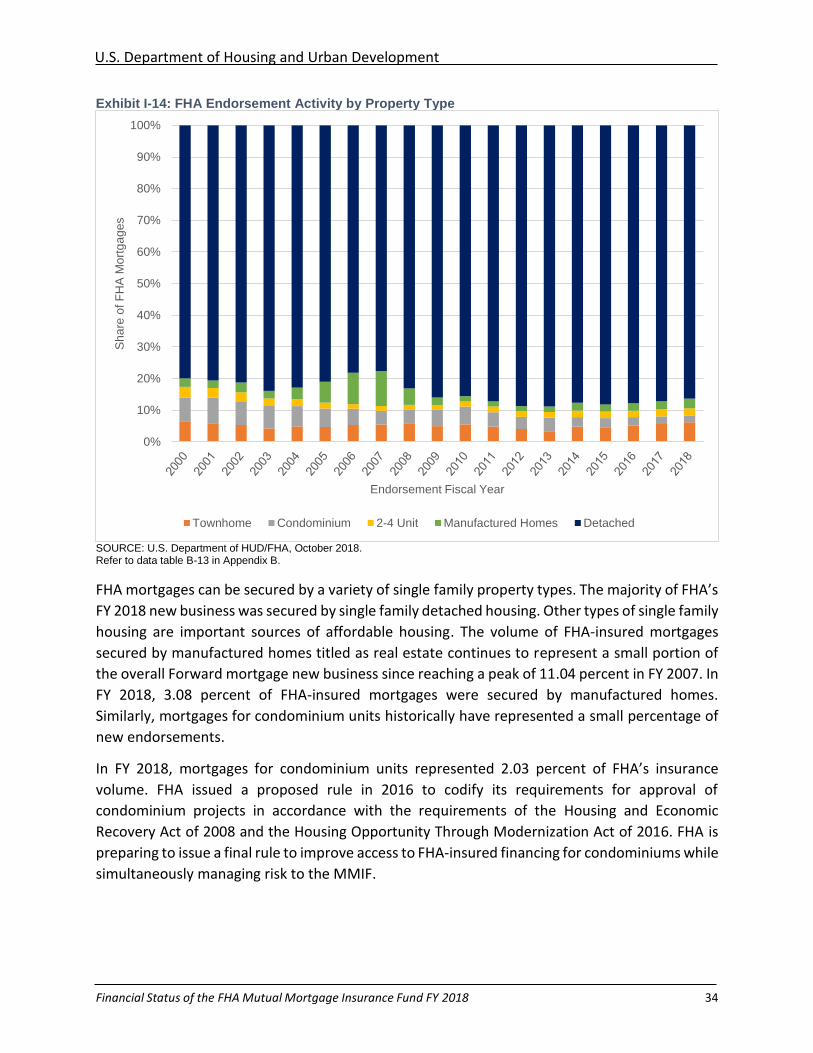
Exhibit I-14: FHA Endorsement Activity by Property Type
SOURCE: U.S. Department of HUD/FHA, October 2018. Refer to data table B-13 in Appendix B.
FHA mortgages can be secured by a variety of single family property types. The majority of FHA’s
FY 2018 new business was secured by single family detached housing. Other types of single family
housing are important sources of affordable housing. The volume of FHA-insured mortgages
secured by manufactured homes titled as real estate continues to represent a small portion of
the overall Forward mortgage new business since reaching a peak of 11.04 percent in FY 2007. In
FY 2018, 3.08 percent of FHA-insured mortgages were secured by manufactured homes.
Similarly, mortgages for condominium units historically have represented a small percentage of
new endorsements.
In FY 2018, mortgages for condominium units represented 2.03 percent of FHA’s insurance
volume. FHA issued a proposed rule in 2016 to codify its requirements for approval of
condominium projects in accordance with the requirements of the Housing and Economic
Recovery Act of 2008 and the Housing Opportunity Through Modernization Act of 2016. FHA is
preparing to issue a final rule to improve access to FHA-insured financing for condominiums while
simultaneously managing risk to the MMIF.
0%
10%
20%
30%
40%
50%
60%
70%
80%
90%
100%S
ha
re o
f F
HA
Mo
rtg
ag
es
Endorsement Fiscal Year
Townhome Condominium 2-4 Unit Manufactured Homes Detached
U.S. Department of Housing and Urban Development
Financial Status of the FHA Mutual Mortgage Insurance Fund FY 2018 35
Forward Mortgage Program: Portfolio Overview and Performance
Trends
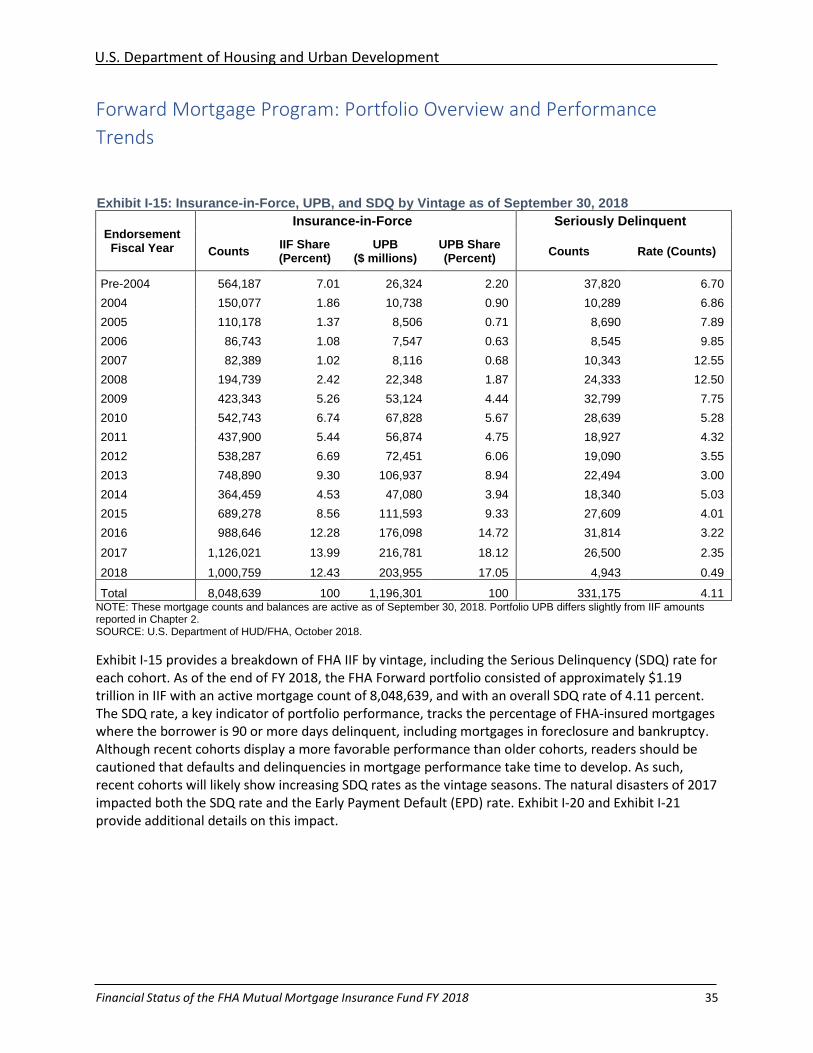
Exhibit I-15: Insurance-in-Force, UPB, and SDQ by Vintage as of September 30, 2018
Endorsement Fiscal Year
Insurance-in-Force Seriously Delinquent
Counts IIF Share (Percent)
UPB ($ millions)
UPB Share (Percent)
Counts Rate (Counts)
Pre-2004 564,187 7.01 26,324 2.20 37,820 6.70
2004 150,077 1.86 10,738 0.90 10,289 6.86
2005 110,178 1.37 8,506 0.71 8,690 7.89
2006 86,743 1.08 7,547 0.63 8,545 9.85
2007 82,389 1.02 8,116 0.68 10,343 12.55
2008 194,739 2.42 22,348 1.87 24,333 12.50
2009 423,343 5.26 53,124 4.44 32,799 7.75
2010 542,743 6.74 67,828 5.67 28,639 5.28
2011 437,900 5.44 56,874 4.75 18,927 4.32
2012 538,287 6.69 72,451 6.06 19,090 3.55
2013 748,890 9.30 106,937 8.94 22,494 3.00
2014 364,459 4.53 47,080 3.94 18,340 5.03
2015 689,278 8.56 111,593 9.33 27,609 4.01
2016 988,646 12.28 176,098 14.72 31,814 3.22
2017 1,126,021 13.99 216,781 18.12 26,500 2.35
2018 1,000,759 12.43 203,955 17.05 4,943 0.49
Total 8,048,639 100 1,196,301 100 331,175 4.11 NOTE: These mortgage counts and balances are active as of September 30, 2018. Portfolio UPB differs slightly from IIF amounts reported in Chapter 2. SOURCE: U.S. Department of HUD/FHA, October 2018.
Exhibit I-15 provides a breakdown of FHA IIF by vintage, including the Serious Delinquency (SDQ) rate for each cohort. As of the end of FY 2018, the FHA Forward portfolio consisted of approximately $1.19 trillion in IIF with an active mortgage count of 8,048,639, and with an overall SDQ rate of 4.11 percent. The SDQ rate, a key indicator of portfolio performance, tracks the percentage of FHA-insured mortgages where the borrower is 90 or more days delinquent, including mortgages in foreclosure and bankruptcy. Although recent cohorts display a more favorable performance than older cohorts, readers should be cautioned that defaults and delinquencies in mortgage performance take time to develop. As such, recent cohorts will likely show increasing SDQ rates as the vintage seasons. The natural disasters of 2017 impacted both the SDQ rate and the Early Payment Default (EPD) rate. Exhibit I-20 and Exhibit I-21 provide additional details on this impact.
U.S. Department of Housing and Urban Development
Financial Status of the FHA Mutual Mortgage Insurance Fund FY 2018 36
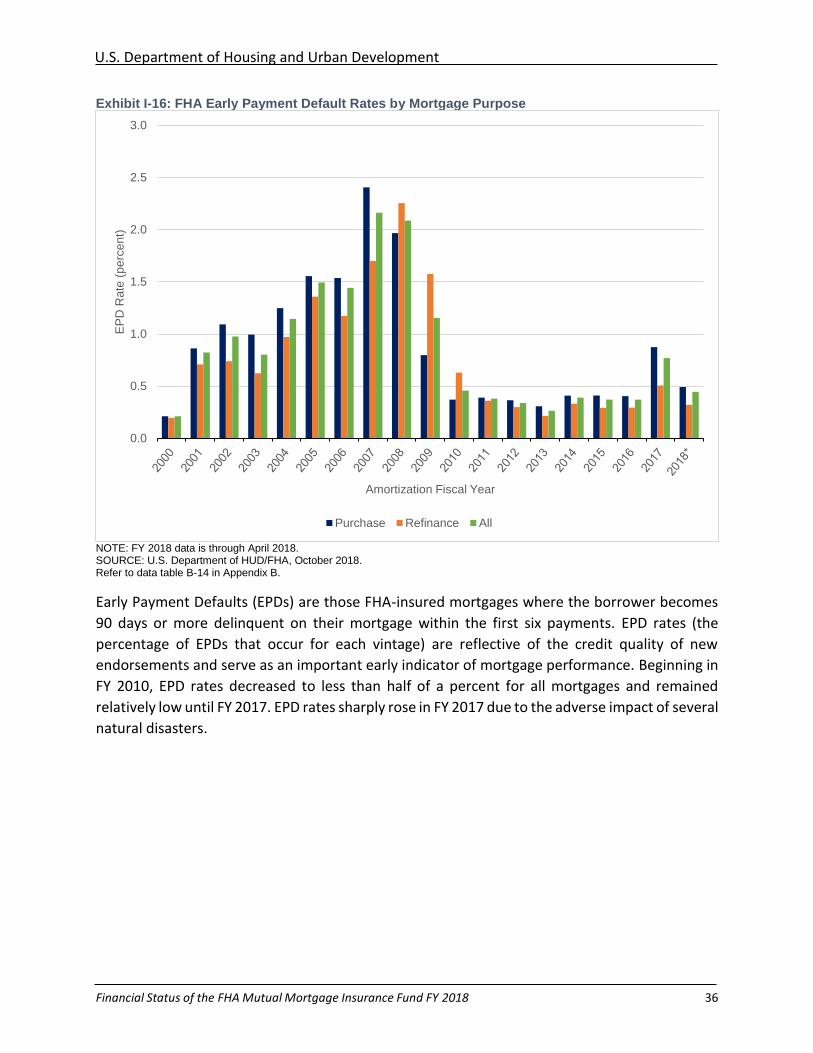
Exhibit I-16: FHA Early Payment Default Rates by Mortgage Purpose
NOTE: FY 2018 data is through April 2018. SOURCE: U.S. Department of HUD/FHA, October 2018. Refer to data table B-14 in Appendix B.
Early Payment Defaults (EPDs) are those FHA-insured mortgages where the borrower becomes
90 days or more delinquent on their mortgage within the first six payments. EPD rates (the
percentage of EPDs that occur for each vintage) are reflective of the credit quality of new
endorsements and serve as an important early indicator of mortgage performance. Beginning in
FY 2010, EPD rates decreased to less than half of a percent for all mortgages and remained
relatively low until FY 2017. EPD rates sharply rose in FY 2017 due to the adverse impact of several
natural disasters.
0.0
0.5
1.0
1.5
2.0
2.5
3.0E
PD
Ra
te (
pe
rce
nt)
Amortization Fiscal Year
Purchase Refinance All
U.S. Department of Housing and Urban Development
Financial Status of the FHA Mutual Mortgage Insurance Fund FY 2018 37
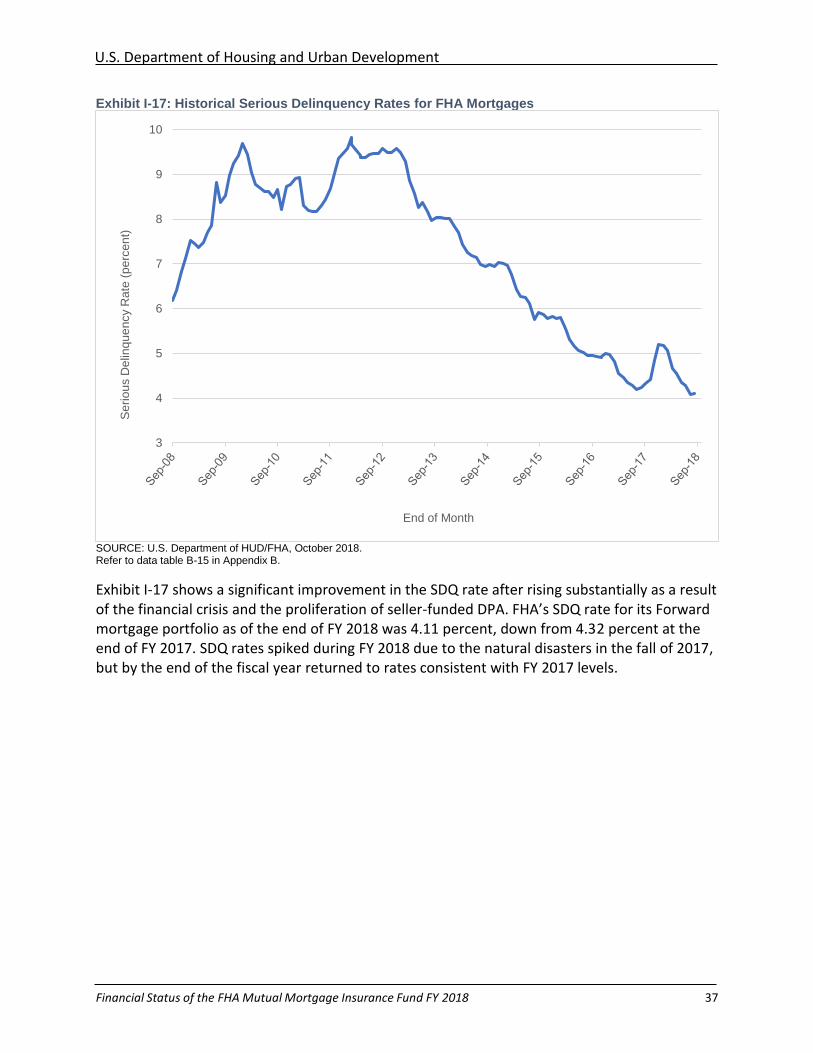
Exhibit I-17: Historical Serious Delinquency Rates for FHA Mortgages
SOURCE: U.S. Department of HUD/FHA, October 2018. Refer to data table B-15 in Appendix B.
Exhibit I-17 shows a significant improvement in the SDQ rate after rising substantially as a result of the financial crisis and the proliferation of seller-funded DPA. FHA’s SDQ rate for its Forward mortgage portfolio as of the end of FY 2018 was 4.11 percent, down from 4.32 percent at the end of FY 2017. SDQ rates spiked during FY 2018 due to the natural disasters in the fall of 2017, but by the end of the fiscal year returned to rates consistent with FY 2017 levels.
3
4
5
6
7
8
9
10
End of Month
Se
rio
us D
elin
qu
en
cy R
ate
(p
erc
en
t)
U.S. Department of Housing and Urban Development
Financial Status of the FHA Mutual Mortgage Insurance Fund FY 2018 38
Downpayment Assistance
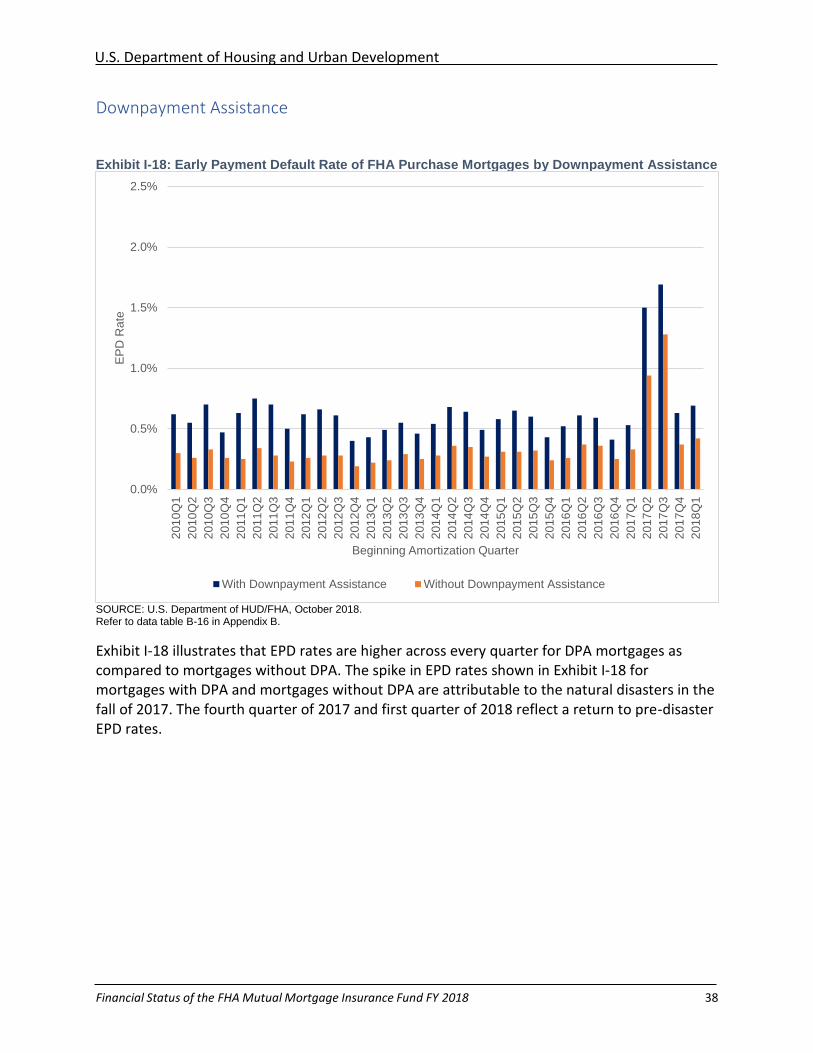
Exhibit I-18: Early Payment Default Rate of FHA Purchase Mortgages by Downpayment Assistance
SOURCE: U.S. Department of HUD/FHA, October 2018. Refer to data table B-16 in Appendix B.
Exhibit I-18 illustrates that EPD rates are higher across every quarter for DPA mortgages as compared to mortgages without DPA. The spike in EPD rates shown in Exhibit I-18 for mortgages with DPA and mortgages without DPA are attributable to the natural disasters in the fall of 2017. The fourth quarter of 2017 and first quarter of 2018 reflect a return to pre-disaster EPD rates.
0.0%
0.5%
1.0%
1.5%
2.0%
2.5%2
01
0Q
1
201
0Q
2
201
0Q
3
201
0Q
4
201
1Q
1
201
1Q
2
201
1Q
3
201
1Q
4
201
2Q
1
201
2Q
2
201
2Q
3
201
2Q
4
201
3Q
1
201
3Q
2
201
3Q
3
201
3Q
4
201
4Q
1
201
4Q
2
201
4Q
3
201
4Q
4
201
5Q
1
201
5Q
2
201
5Q
3
201
5Q
4
201
6Q
1
201
6Q
2
201
6Q
3
201
6Q
4
201
7Q
1
201
7Q
2
201
7Q
3
201
7Q
4
201
8Q
1
EP
D R
ate
Beginning Amortization Quarter
With Downpayment Assistance Without Downpayment Assistance
U.S. Department of Housing and Urban Development
Financial Status of the FHA Mutual Mortgage Insurance Fund FY 2018 39
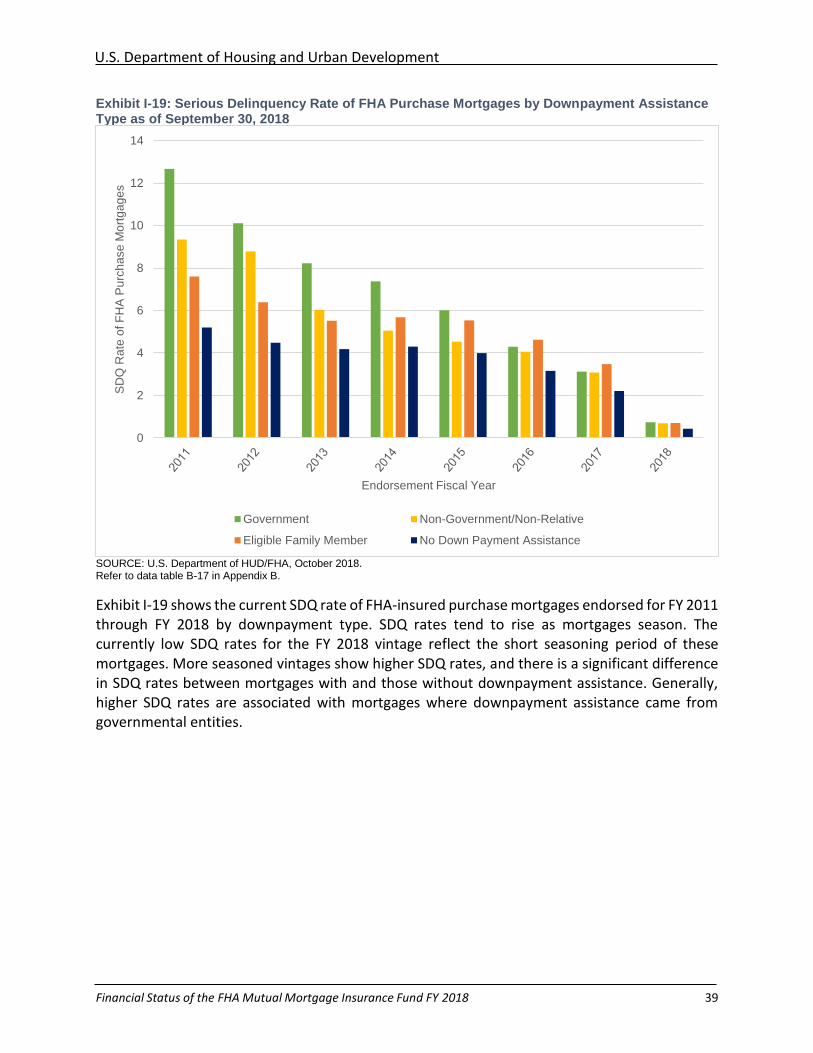
Exhibit I-19: Serious Delinquency Rate of FHA Purchase Mortgages by Downpayment Assistance Type as of September 30, 2018
SOURCE: U.S. Department of HUD/FHA, October 2018. Refer to data table B-17 in Appendix B.
Exhibit I-19 shows the current SDQ rate of FHA-insured purchase mortgages endorsed for FY 2011 through FY 2018 by downpayment type. SDQ rates tend to rise as mortgages season. The currently low SDQ rates for the FY 2018 vintage reflect the short seasoning period of these mortgages. More seasoned vintages show higher SDQ rates, and there is a significant difference in SDQ rates between mortgages with and those without downpayment assistance. Generally, higher SDQ rates are associated with mortgages where downpayment assistance came from governmental entities.
0
2
4
6
8
10
12
14
SD
Q R
ate
of F
HA
Pu
rch
ase
Mo
rtg
ag
es
Endorsement Fiscal Year
Government Non-Government/Non-Relative
Eligible Family Member No Down Payment Assistance
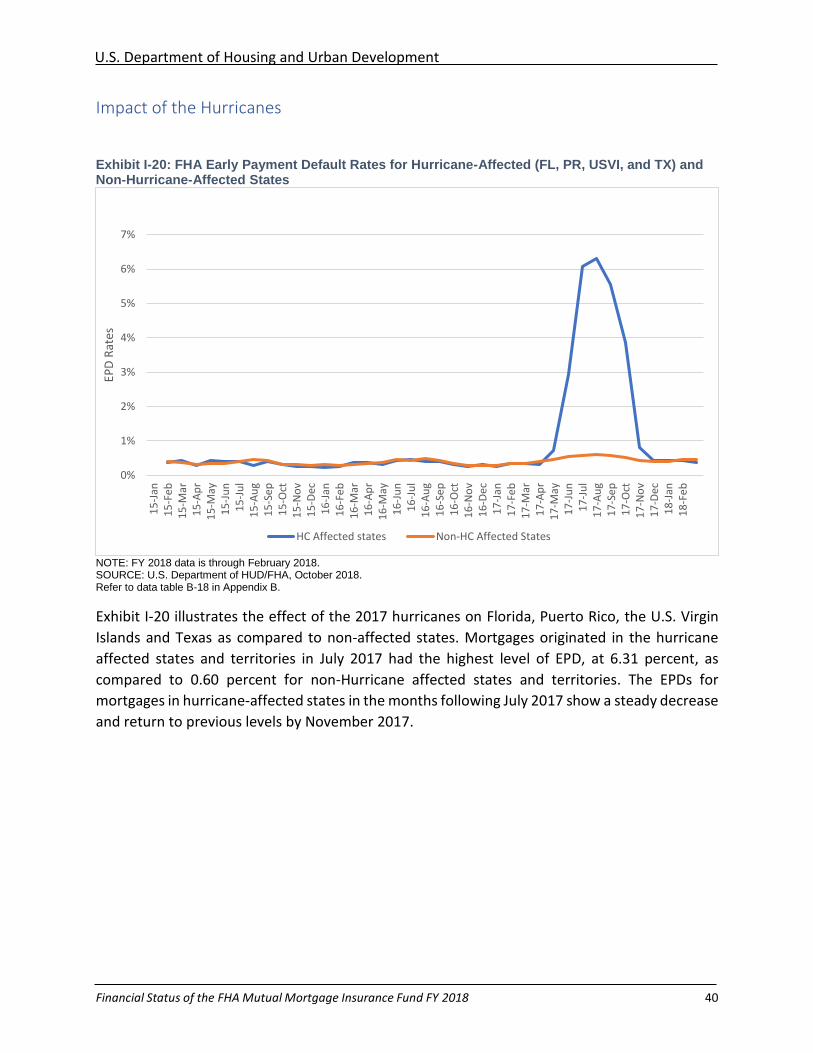
U.S. Department of Housing and Urban Development
Financial Status of the FHA Mutual Mortgage Insurance Fund FY 2018 40
Impact of the Hurricanes
Exhibit I-20: FHA Early Payment Default Rates for Hurricane-Affected (FL, PR, USVI, and TX) and Non-Hurricane-Affected States
NOTE: FY 2018 data is through February 2018. SOURCE: U.S. Department of HUD/FHA, October 2018. Refer to data table B-18 in Appendix B.
Exhibit I-20 illustrates the effect of the 2017 hurricanes on Florida, Puerto Rico, the U.S. Virgin
Islands and Texas as compared to non-affected states. Mortgages originated in the hurricane
affected states and territories in July 2017 had the highest level of EPD, at 6.31 percent, as
compared to 0.60 percent for non-Hurricane affected states and territories. The EPDs for
mortgages in hurricane-affected states in the months following July 2017 show a steady decrease
and return to previous levels by November 2017.
0%
1%
2%
3%
4%
5%
6%
7%
15
-Jan
15
-Fe
b1
5-M
ar1
5-A
pr
15
-May
15
-Ju
n1
5-J
ul
15
-Au
g1
5-S
ep
15
-Oct
15
-No
v1
5-D
ec1
6-J
an1
6-F
eb
16
-Mar
16
-Ap
r1
6-M
ay1
6-J
un
16
-Ju
l1
6-A
ug
16
-Se
p1
6-O
ct1
6-N
ov
16
-Dec
17
-Jan
17
-Fe
b1
7-M
ar1
7-A
pr
17
-May
17
-Ju
n1
7-J
ul
17
-Au
g1
7-S
ep
17
-Oct
17
-No
v1
7-D
ec1
8-J
an1
8-F
eb
EPD
Rat
es
HC Affected states Non-HC Affected States
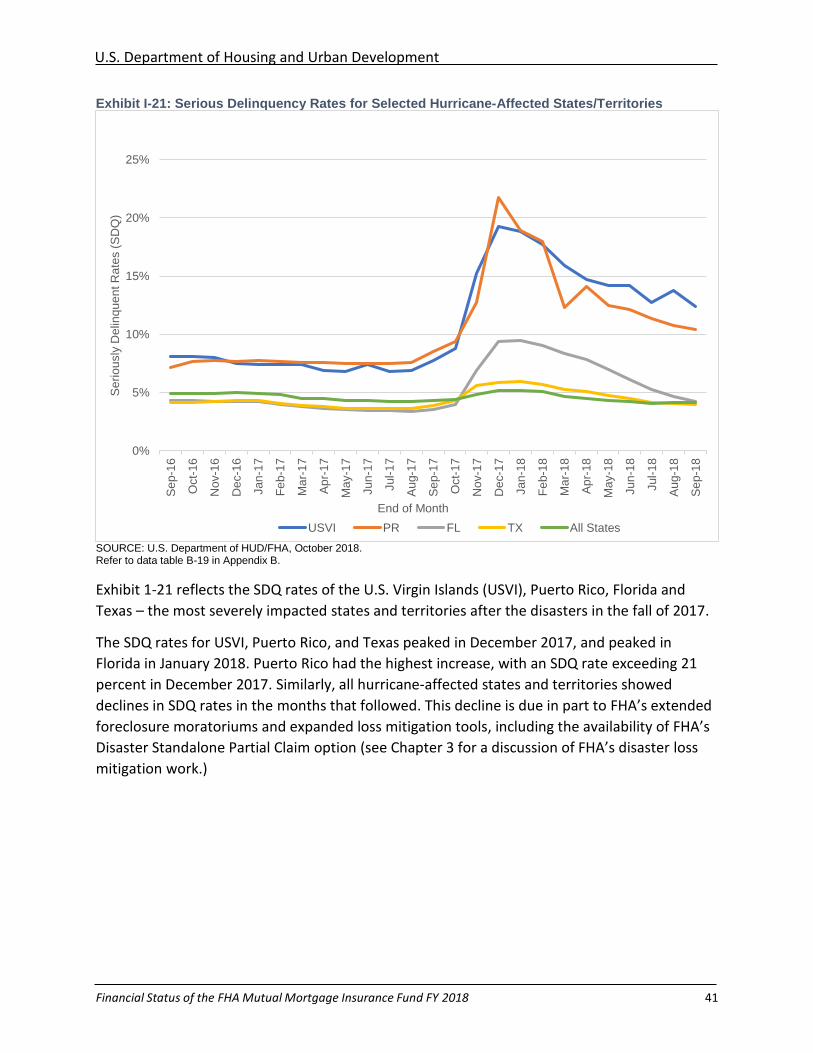
U.S. Department of Housing and Urban Development
Financial Status of the FHA Mutual Mortgage Insurance Fund FY 2018 41
Exhibit I-21: Serious Delinquency Rates for Selected Hurricane-Affected States/Territories
SOURCE: U.S. Department of HUD/FHA, October 2018. Refer to data table B-19 in Appendix B.
Exhibit 1-21 reflects the SDQ rates of the U.S. Virgin Islands (USVI), Puerto Rico, Florida and
Texas – the most severely impacted states and territories after the disasters in the fall of 2017.
The SDQ rates for USVI, Puerto Rico, and Texas peaked in December 2017, and peaked in
Florida in January 2018. Puerto Rico had the highest increase, with an SDQ rate exceeding 21
percent in December 2017. Similarly, all hurricane-affected states and territories showed
declines in SDQ rates in the months that followed. This decline is due in part to FHA’s extended
foreclosure moratoriums and expanded loss mitigation tools, including the availability of FHA’s
Disaster Standalone Partial Claim option (see Chapter 3 for a discussion of FHA’s disaster loss
mitigation work.)
0%
5%
10%
15%
20%
25%S
ep-1
6
Oct-
16
Nov-1
6
Dec-1
6
Jan
-17
Fe
b-1
7
Ma
r-1
7
Ap
r-17
Ma
y-1
7
Jun
-17
Jul-
17
Au
g-1
7
Se
p-1
7
Oct-
17
Nov-1
7
Dec-1
7
Jan
-18
Fe
b-1
8
Ma
r-1
8
Ap
r-18
Ma
y-1
8
Jun
-18
Jul-
18
Au
g-1
8
Se
p-1
8
Se
rio
usly
De
linq
ue
nt R
ate
s (
SD
Q)
End of Month
USVI PR FL TX All States
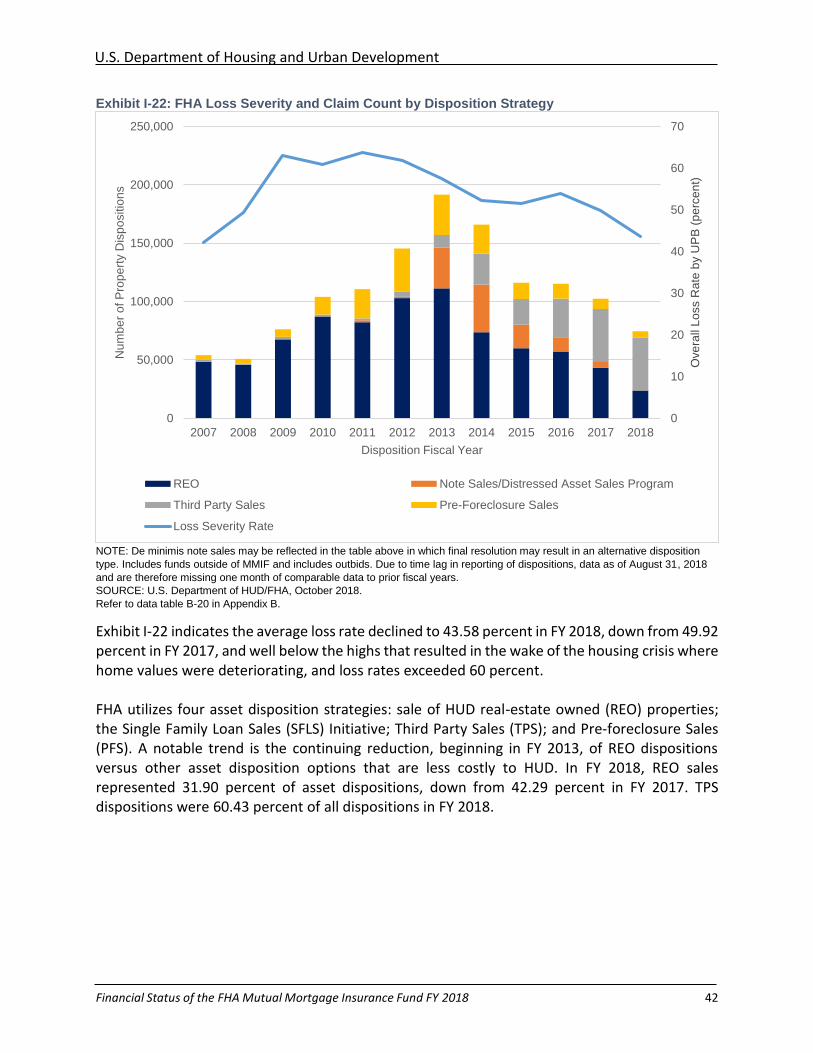
U.S. Department of Housing and Urban Development
Financial Status of the FHA Mutual Mortgage Insurance Fund FY 2018 42
Exhibit I-22: FHA Loss Severity and Claim Count by Disposition Strategy
NOTE: De minimis note sales may be reflected in the table above in which final resolution may result in an alternative disposition
type. Includes funds outside of MMIF and includes outbids. Due to time lag in reporting of dispositions, data as of August 31, 2018
and are therefore missing one month of comparable data to prior fiscal years.
SOURCE: U.S. Department of HUD/FHA, October 2018.
Refer to data table B-20 in Appendix B.
Exhibit I-22 indicates the average loss rate declined to 43.58 percent in FY 2018, down from 49.92 percent in FY 2017, and well below the highs that resulted in the wake of the housing crisis where home values were deteriorating, and loss rates exceeded 60 percent. FHA utilizes four asset disposition strategies: sale of HUD real-estate owned (REO) properties; the Single Family Loan Sales (SFLS) Initiative; Third Party Sales (TPS); and Pre-foreclosure Sales (PFS). A notable trend is the continuing reduction, beginning in FY 2013, of REO dispositions versus other asset disposition options that are less costly to HUD. In FY 2018, REO sales represented 31.90 percent of asset dispositions, down from 42.29 percent in FY 2017. TPS dispositions were 60.43 percent of all dispositions in FY 2018.
0
10
20
30
40
50
60
70
0
50,000
100,000
150,000
200,000
250,000
2007 2008 2009 2010 2011 2012 2013 2014 2015 2016 2017 2018
Ove
rall
Lo
ss R
ate
by U
PB
(p
erc
en
t)
Nu
mb
er
of P
rop
ert
y D
isp
ositio
ns
Disposition Fiscal Year
REO Note Sales/Distressed Asset Sales Program
Third Party Sales Pre-Foreclosure Sales
Loss Severity Rate
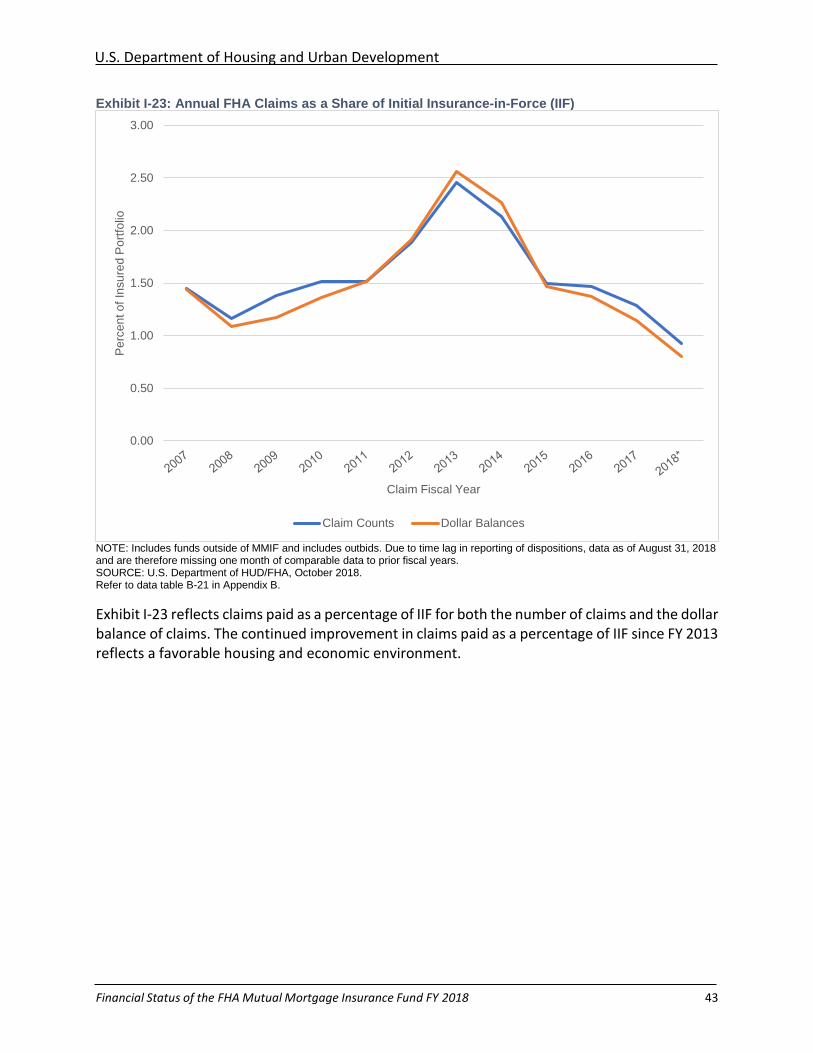
U.S. Department of Housing and Urban Development
Financial Status of the FHA Mutual Mortgage Insurance Fund FY 2018 43
Exhibit I-23: Annual FHA Claims as a Share of Initial Insurance-in-Force (IIF)
NOTE: Includes funds outside of MMIF and includes outbids. Due to time lag in reporting of dispositions, data as of August 31, 2018 and are therefore missing one month of comparable data to prior fiscal years. SOURCE: U.S. Department of HUD/FHA, October 2018. Refer to data table B-21 in Appendix B.
Exhibit I-23 reflects claims paid as a percentage of IIF for both the number of claims and the dollar balance of claims. The continued improvement in claims paid as a percentage of IIF since FY 2013 reflects a favorable housing and economic environment.
0.00
0.50
1.00
1.50
2.00
2.50
3.00P
erc
en
t o
f In
su
red
Po
rtfo
lio
Claim Fiscal Year
Claim Counts Dollar Balances
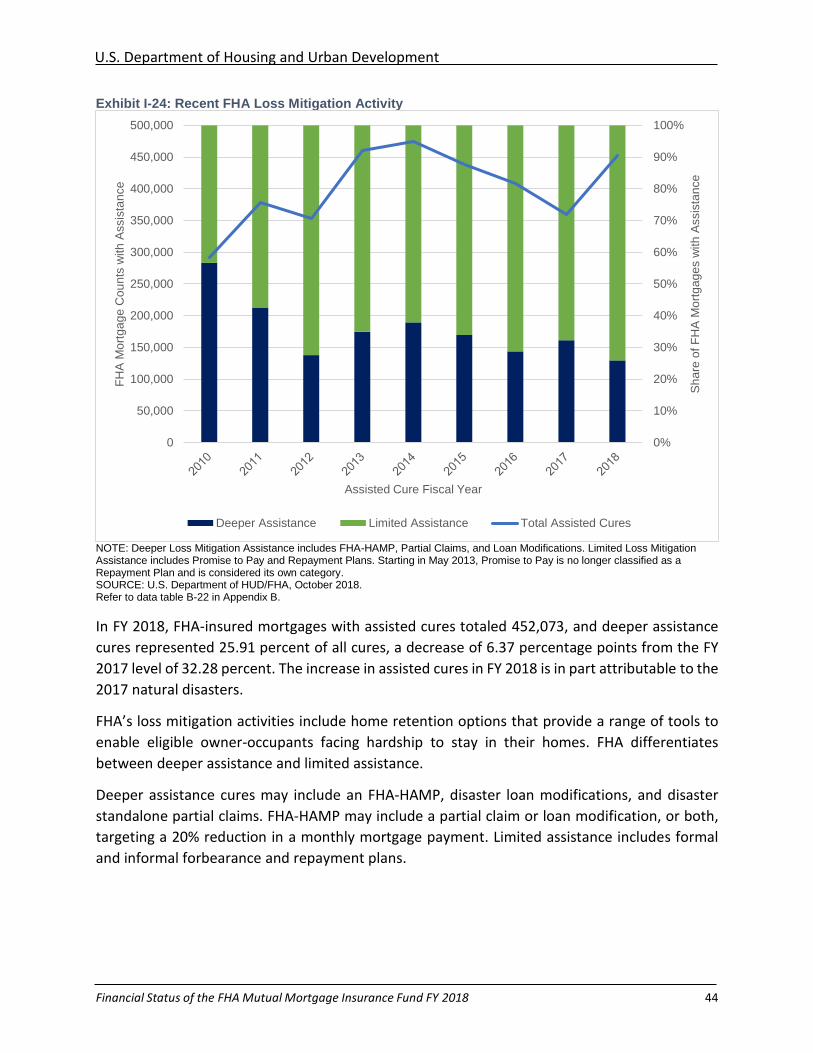
U.S. Department of Housing and Urban Development
Financial Status of the FHA Mutual Mortgage Insurance Fund FY 2018 44
Exhibit I-24: Recent FHA Loss Mitigation Activity
NOTE: Deeper Loss Mitigation Assistance includes FHA-HAMP, Partial Claims, and Loan Modifications. Limited Loss Mitigation Assistance includes Promise to Pay and Repayment Plans. Starting in May 2013, Promise to Pay is no longer classified as a Repayment Plan and is considered its own category. SOURCE: U.S. Department of HUD/FHA, October 2018. Refer to data table B-22 in Appendix B.
In FY 2018, FHA-insured mortgages with assisted cures totaled 452,073, and deeper assistance
cures represented 25.91 percent of all cures, a decrease of 6.37 percentage points from the FY
2017 level of 32.28 percent. The increase in assisted cures in FY 2018 is in part attributable to the
2017 natural disasters.
FHA’s loss mitigation activities include home retention options that provide a range of tools to
enable eligible owner-occupants facing hardship to stay in their homes. FHA differentiates
between deeper assistance and limited assistance.
Deeper assistance cures may include an FHA-HAMP, disaster loan modifications, and disaster
standalone partial claims. FHA-HAMP may include a partial claim or loan modification, or both,
targeting a 20% reduction in a monthly mortgage payment. Limited assistance includes formal
and informal forbearance and repayment plans.
0%
10%
20%
30%
40%
50%
60%
70%
80%
90%
100%
0
50,000
100,000
150,000
200,000
250,000
300,000
350,000
400,000
450,000
500,000
Sh
are
of F
HA
Mo
rtg
ag
es w
ith
Assis
tan
ce
FH
A M
ort
ga
ge
Co
un
ts w
ith
Assis
tan
ce
Assisted Cure Fiscal Year
Deeper Assistance Limited Assistance Total Assisted Cures
U.S. Department of Housing and Urban Development
Financial Status of the FHA Mutual Mortgage Insurance Fund FY 2018 45
Home Equity Conversion Mortgage (HECM) Program
Overview
Through the Home Equity Conversion Mortgage (HECM) program, FHA provides insurance on the
vast majority of all reverse mortgages available in the nation. When initially authorized by the
Housing and Community Development Act of 1987, the HECM program was made available on a
limited basis and all HECMs were obligations of the General Insurance Fund (GIF). Over time, the
program expanded significantly, with $30 billion of HECM Maximum Claim Amount (MCA)
insured by FHA in FY 2009. Beginning in FY 2009, all new HECM endorsements are obligations of
the MMIF.
The HECM program enables senior homeowners, aged 62 or older, who meet various borrower,
property ownership, and financial requirements to withdraw a portion of the value of their home
without any corresponding periodic requirement to repay amounts borrowed. Instead, the
principal borrowed, along with interest, Mortgage Insurance Premiums, and servicing fees are
added to the mortgage balance over time. As a result, HECM balances may eventually equal or
exceed the value of the home. HECM borrowers remain responsible for the payment of taxes,
insurance, and property charges.
Subject to the nationwide limits on claim amounts, the amount of funds that any borrower can
access through a HECM depends on a variety of factors, including the value of the property, the
age of the youngest borrower or eligible non-borrowing spouse,38 and the interest rate charged
to the borrower.39
The lender will calculate the amount of money that can be made available to the borrower. First,
the lender determines the Maximum Claim Amount (MCA) for the HECM, which is the lesser of:
the appraised value of the home40 or the nationwide HECM maximum claim limit (currently
$679,650). Next, the lender determines the appropriate Principal Limit Factor (PLF) based on the
age of the youngest borrower or eligible non-borrowing spouse, and the expected applicable
interest rate. The lender then multiplies the MCA by the PLF to determine what Principal Limit
(PL) will be established for the HECM. This PL will grow monthly by a factor of one-twelfth of the
actual interest rate for the HECM and one-twelfth of the annual Mortgage Insurance Premium.
At origination, a HECM borrower is permitted to draw up to 60 percent of the PL or some higher
portion of the PL that is equal to the sum of the borrower’s mandatory obligations, which include
items such as outstanding debt secured by the property, plus cash to the borrower of up to 10
38 The inclusion of a non-borrowing spouse was made for all HECMs after August 4, 2014; HECMs originated prior to that date allow for the deferral of due and payable status at the discretion of the lender when certain eligibility criteria are met. 39 The age of the youngest non-borrowing spouse was first introduced as a factor on August 4, 2014. 40 In HECM for Purchase transactions, the appraised value is deemed to be the lesser of the appraised value or the sales price of the home.
U.S. Department of Housing and Urban Development
Financial Status of the FHA Mutual Mortgage Insurance Fund FY 2018 46
percent of the PL. The borrower can select from a variety of payment options to receive funds
under the HECM, including: Lines of Credit (LOC), tenure payments, term payments, Lump Sum,
or a combination of the LOC with a term or tenure payment option. The borrower can change
payment plans at any time, provided there are funds available under the PL. If no funds remain
under the PL, the borrower cannot request additional funds. Payments under the HECM tenure
plan, which essentially functions as an annuity, continue under the terms of the tenure plan
regardless of the technical availability of funds under the PL.
A HECM is only required to be repaid when it becomes due and payable, which occurs when the
last surviving borrower or eligible non-borrowing spouse dies or ceases to occupy the property
as their principal residence, or when certain other events of default occur, including the failure
to pay taxes, insurance, or property charges due on the property. Because a HECM is non-
recourse, lenders and FHA can only look to the value of the property for recovery of losses. If the
balance of the mortgage exceeds the appraised value of the property when the mortgage
becomes due and payable and the property is sold via foreclosure or private sale, the lender is
entitled to file a mortgage insurance claim with FHA.41 All claims associated with HECMs endorsed
on or after FY 2009 are paid by the MMIF.
Additionally, lenders are also permitted to file mortgage insurance claims where the balance of
the HECM reaches 98 percent of the MCA. The lender will assign the HECM to the Secretary of
HUD in exchange for claim payment. The Secretary will then hold and service the HECM until the
HECM becomes due and payable. Since 2009, these assigned HECMs are held by the Secretary as
assets of the MMIF. When a HECM held by the Secretary becomes due and payable. Several
disposition strategies are then considered. Ultimately, HUD will sell the property or note and
return the proceeds to the MMIF.42
Finally, where the borrower dies and there is an eligible non-borrowing spouse, the lender is
permitted to assign the mortgage to the Secretary in exchange for claim payment. Before August
2014, HECMs did not provide protections for non-borrowing spouses; however, following
litigation, HUD has made available an assignment option that allows the lender to choose to defer
the due and payable status of the HECM and assign the HECM in exchange for claim payment
without foreclosing the HECM.43 HUD holds these HECMs until the period of deferral of due and
payable status ends due to death, failure to reside in the property, or the failure to meet other
obligations under the HECM. Because these spouses were not considered at the time the HECM
was originated, the MCA and PL calculations did not consider risk characteristics of these spouses.
Since August 2014, the HECM program has provided protections for non-borrowing spouses, and
the risk characteristics of these individuals are factored into the origination of the HECM. The age
41 This type of claim is referred to as a Claim Type 1. 42 This type of claim is referred to as a Claim Type 2. 43 This assignment claim is referred to as the Mortgagee Optional Election (MOE) Assignment, a subset of Claim Type 2.
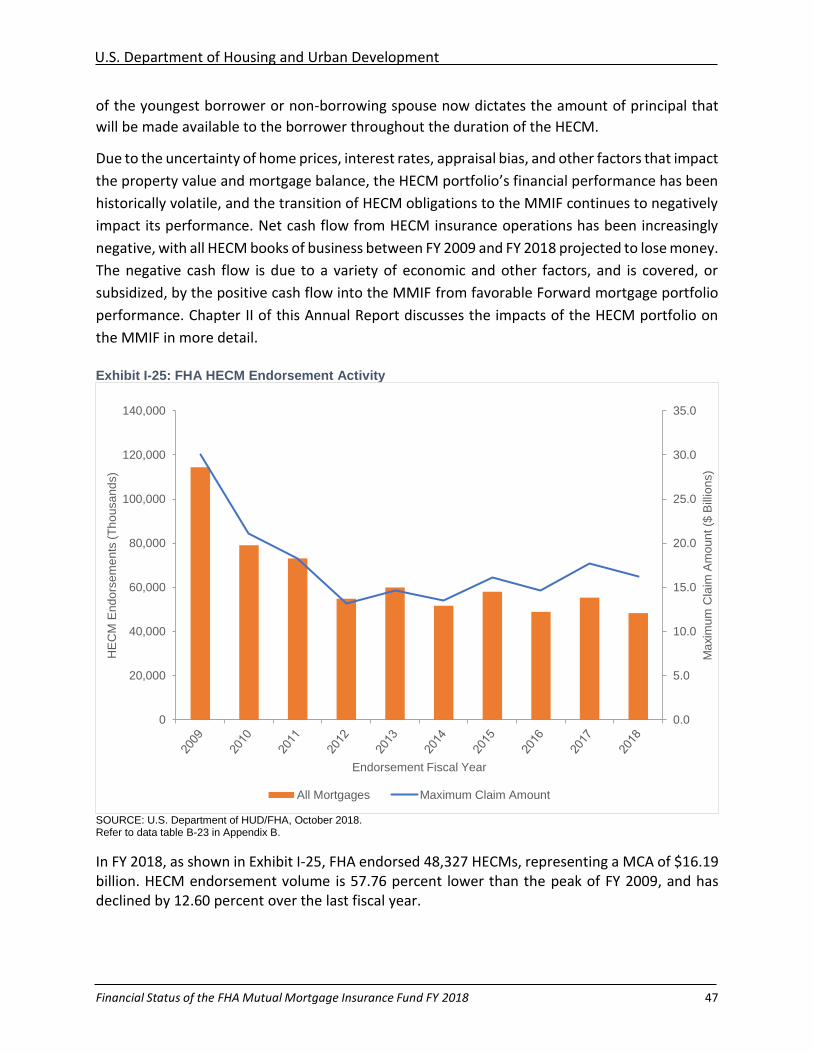
U.S. Department of Housing and Urban Development
Financial Status of the FHA Mutual Mortgage Insurance Fund FY 2018 47
of the youngest borrower or non-borrowing spouse now dictates the amount of principal that
will be made available to the borrower throughout the duration of the HECM.
Due to the uncertainty of home prices, interest rates, appraisal bias, and other factors that impact
the property value and mortgage balance, the HECM portfolio’s financial performance has been
historically volatile, and the transition of HECM obligations to the MMIF continues to negatively
impact its performance. Net cash flow from HECM insurance operations has been increasingly
negative, with all HECM books of business between FY 2009 and FY 2018 projected to lose money.
The negative cash flow is due to a variety of economic and other factors, and is covered, or
subsidized, by the positive cash flow into the MMIF from favorable Forward mortgage portfolio
performance. Chapter II of this Annual Report discusses the impacts of the HECM portfolio on
the MMIF in more detail.
Exhibit I-25: FHA HECM Endorsement Activity
SOURCE: U.S. Department of HUD/FHA, October 2018. Refer to data table B-23 in Appendix B.
In FY 2018, as shown in Exhibit I-25, FHA endorsed 48,327 HECMs, representing a MCA of $16.19 billion. HECM endorsement volume is 57.76 percent lower than the peak of FY 2009, and has declined by 12.60 percent over the last fiscal year.
0.0
5.0
10.0
15.0
20.0
25.0
30.0
35.0
0
20,000
40,000
60,000
80,000
100,000
120,000
140,000
Ma
xim
um
Cla
im A
mo
un
t ($
Bill
ion
s)
HE
CM
En
do
rse
me
nts
(T
ho
usa
nd
s)
Endorsement Fiscal Year
All Mortgages Maximum Claim Amount
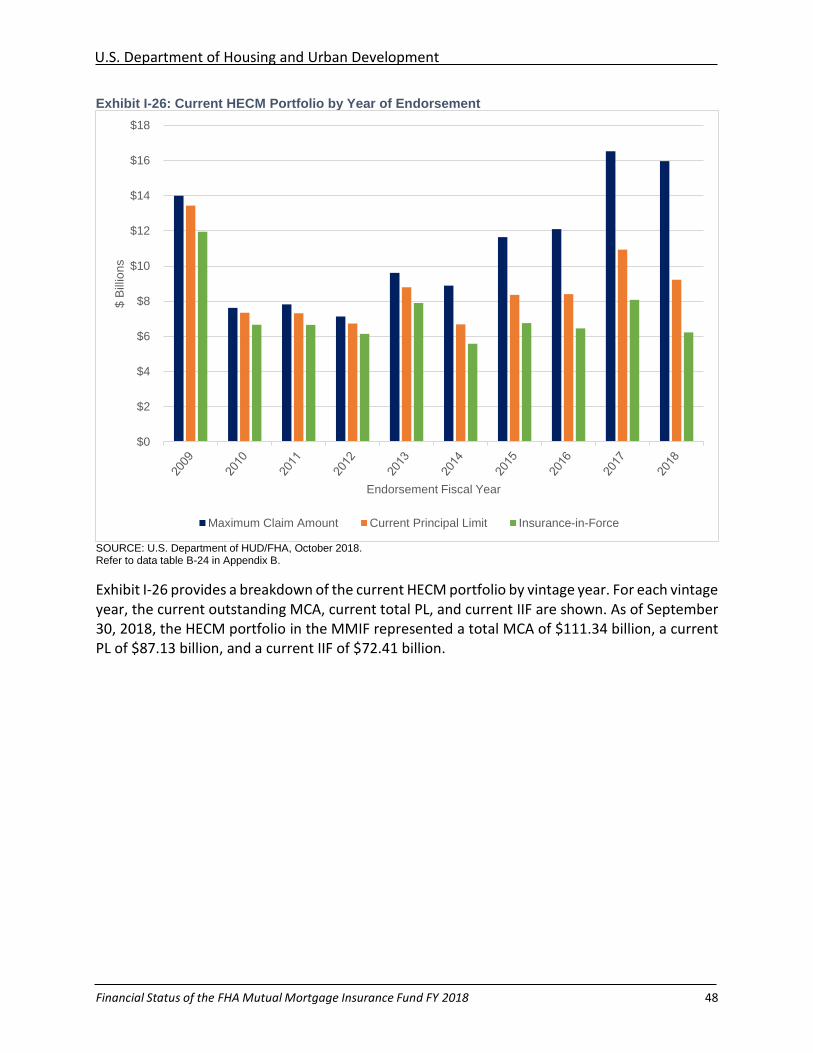
U.S. Department of Housing and Urban Development
Financial Status of the FHA Mutual Mortgage Insurance Fund FY 2018 48
Exhibit I-26: Current HECM Portfolio by Year of Endorsement
SOURCE: U.S. Department of HUD/FHA, October 2018. Refer to data table B-24 in Appendix B.
Exhibit I-26 provides a breakdown of the current HECM portfolio by vintage year. For each vintage year, the current outstanding MCA, current total PL, and current IIF are shown. As of September 30, 2018, the HECM portfolio in the MMIF represented a total MCA of $111.34 billion, a current PL of $87.13 billion, and a current IIF of $72.41 billion.
$0
$2
$4
$6
$8
$10
$12
$14
$16
$18$
Bill
ion
s
Endorsement Fiscal Year
Maximum Claim Amount Current Principal Limit Insurance-in-Force
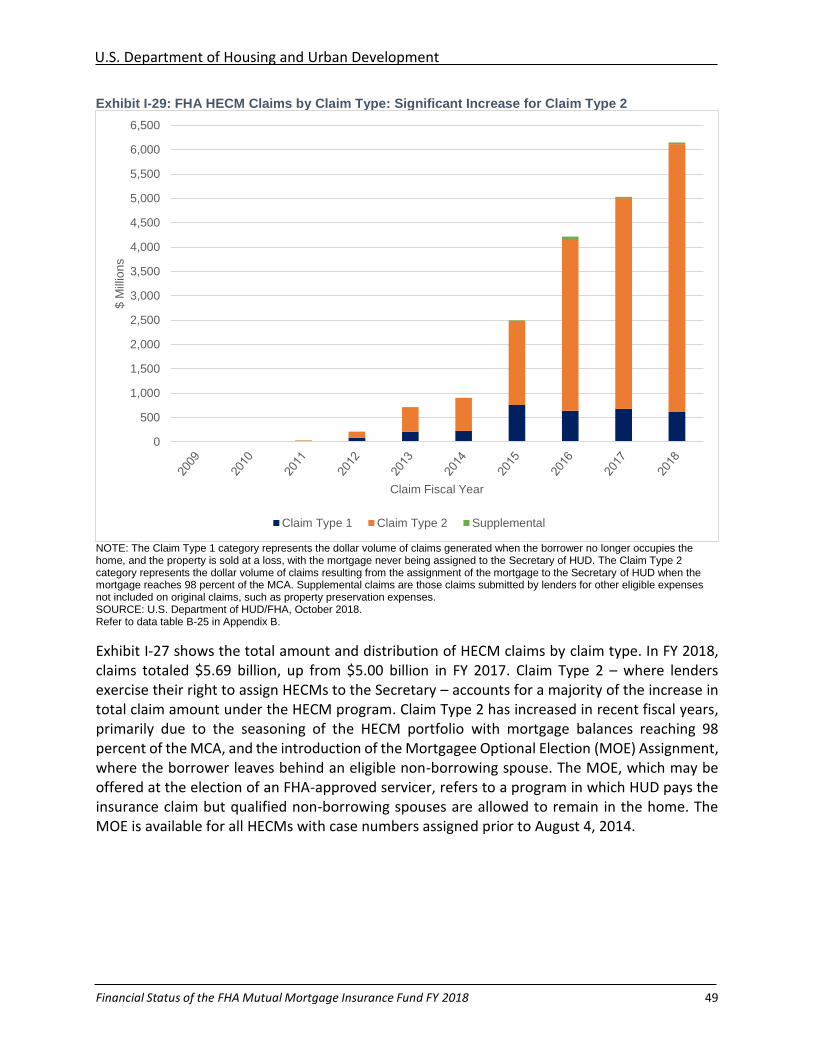
U.S. Department of Housing and Urban Development
Financial Status of the FHA Mutual Mortgage Insurance Fund FY 2018 49
Exhibit I-29: FHA HECM Claims by Claim Type: Significant Increase for Claim Type 2
NOTE: The Claim Type 1 category represents the dollar volume of claims generated when the borrower no longer occupies the home, and the property is sold at a loss, with the mortgage never being assigned to the Secretary of HUD. The Claim Type 2 category represents the dollar volume of claims resulting from the assignment of the mortgage to the Secretary of HUD when the mortgage reaches 98 percent of the MCA. Supplemental claims are those claims submitted by lenders for other eligible expenses not included on original claims, such as property preservation expenses. SOURCE: U.S. Department of HUD/FHA, October 2018. Refer to data table B-25 in Appendix B.
Exhibit I-27 shows the total amount and distribution of HECM claims by claim type. In FY 2018, claims totaled $5.69 billion, up from $5.00 billion in FY 2017. Claim Type 2 – where lenders exercise their right to assign HECMs to the Secretary – accounts for a majority of the increase in total claim amount under the HECM program. Claim Type 2 has increased in recent fiscal years, primarily due to the seasoning of the HECM portfolio with mortgage balances reaching 98 percent of the MCA, and the introduction of the Mortgagee Optional Election (MOE) Assignment, where the borrower leaves behind an eligible non-borrowing spouse. The MOE, which may be offered at the election of an FHA-approved servicer, refers to a program in which HUD pays the insurance claim but qualified non-borrowing spouses are allowed to remain in the home. The MOE is available for all HECMs with case numbers assigned prior to August 4, 2014.
0
500
1,000
1,500
2,000
2,500
3,000
3,500
4,000
4,500
5,000
5,500
6,000
6,500$
Mill
ion
s
Claim Fiscal Year
Claim Type 1 Claim Type 2 Supplemental
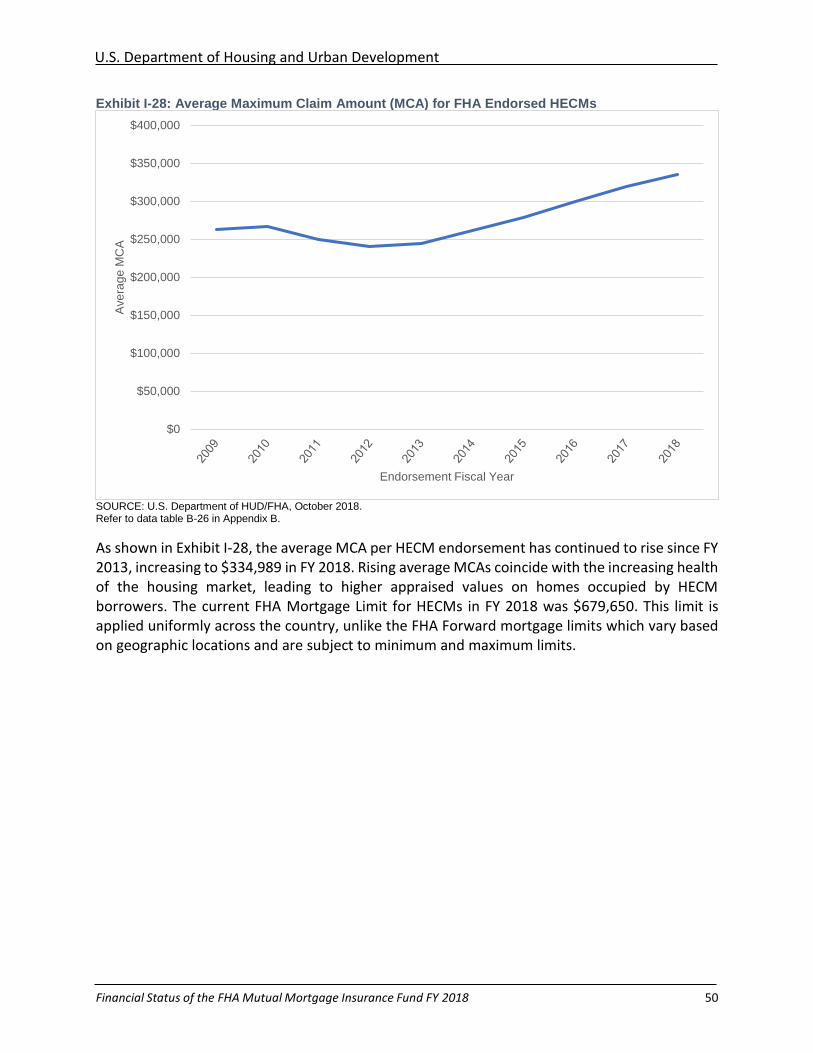
U.S. Department of Housing and Urban Development
Financial Status of the FHA Mutual Mortgage Insurance Fund FY 2018 50
Exhibit I-28: Average Maximum Claim Amount (MCA) for FHA Endorsed HECMs
SOURCE: U.S. Department of HUD/FHA, October 2018. Refer to data table B-26 in Appendix B.
As shown in Exhibit I-28, the average MCA per HECM endorsement has continued to rise since FY 2013, increasing to $334,989 in FY 2018. Rising average MCAs coincide with the increasing health of the housing market, leading to higher appraised values on homes occupied by HECM borrowers. The current FHA Mortgage Limit for HECMs in FY 2018 was $679,650. This limit is applied uniformly across the country, unlike the FHA Forward mortgage limits which vary based on geographic locations and are subject to minimum and maximum limits.
$0
$50,000
$100,000
$150,000
$200,000
$250,000
$300,000
$350,000
$400,000A
ve
rag
e M
CA
Endorsement Fiscal Year
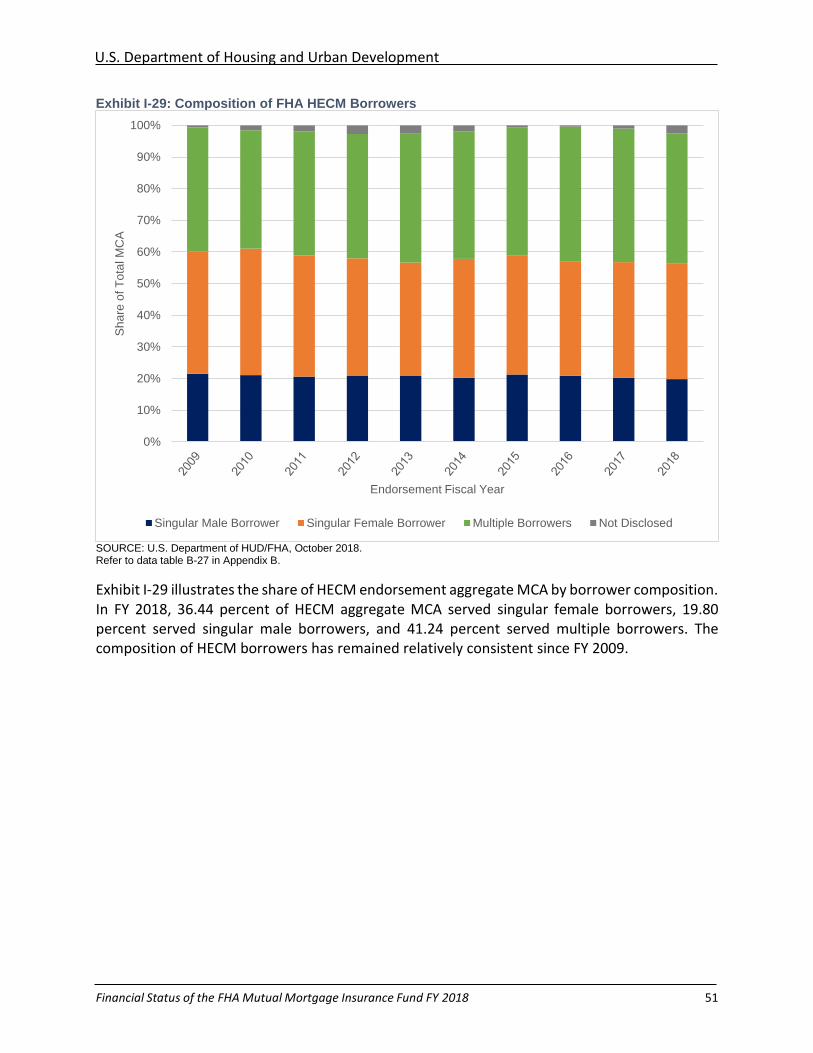
U.S. Department of Housing and Urban Development
Financial Status of the FHA Mutual Mortgage Insurance Fund FY 2018 51
Exhibit I-29: Composition of FHA HECM Borrowers
SOURCE: U.S. Department of HUD/FHA, October 2018. Refer to data table B-27 in Appendix B.
Exhibit I-29 illustrates the share of HECM endorsement aggregate MCA by borrower composition. In FY 2018, 36.44 percent of HECM aggregate MCA served singular female borrowers, 19.80 percent served singular male borrowers, and 41.24 percent served multiple borrowers. The composition of HECM borrowers has remained relatively consistent since FY 2009.
0%
10%
20%
30%
40%
50%
60%
70%
80%
90%
100%S
ha
re o
f T
ota
l M
CA
Endorsement Fiscal Year
Singular Male Borrower Singular Female Borrower Multiple Borrowers Not Disclosed
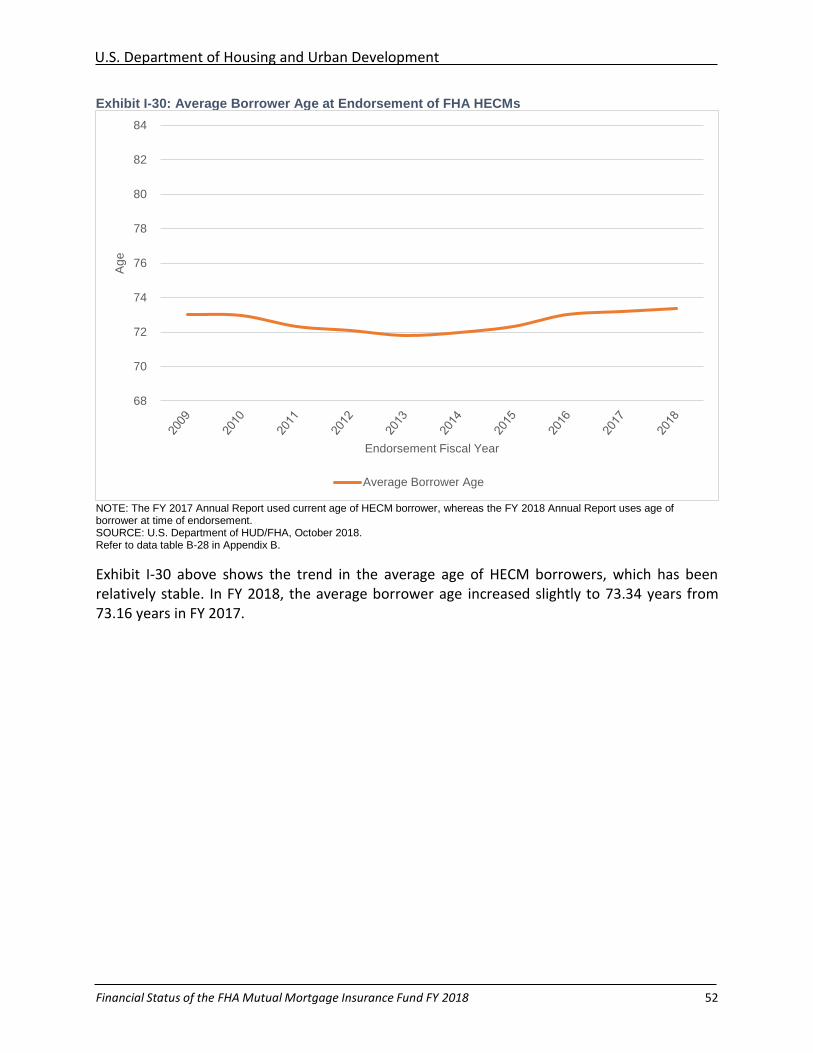
U.S. Department of Housing and Urban Development
Financial Status of the FHA Mutual Mortgage Insurance Fund FY 2018 52
Exhibit I-30: Average Borrower Age at Endorsement of FHA HECMs
NOTE: The FY 2017 Annual Report used current age of HECM borrower, whereas the FY 2018 Annual Report uses age of borrower at time of endorsement. SOURCE: U.S. Department of HUD/FHA, October 2018. Refer to data table B-28 in Appendix B.
Exhibit I-30 above shows the trend in the average age of HECM borrowers, which has been relatively stable. In FY 2018, the average borrower age increased slightly to 73.34 years from 73.16 years in FY 2017.
68
70
72
74
76
78
80
82
84A
ge
Endorsement Fiscal Year
Average Borrower Age
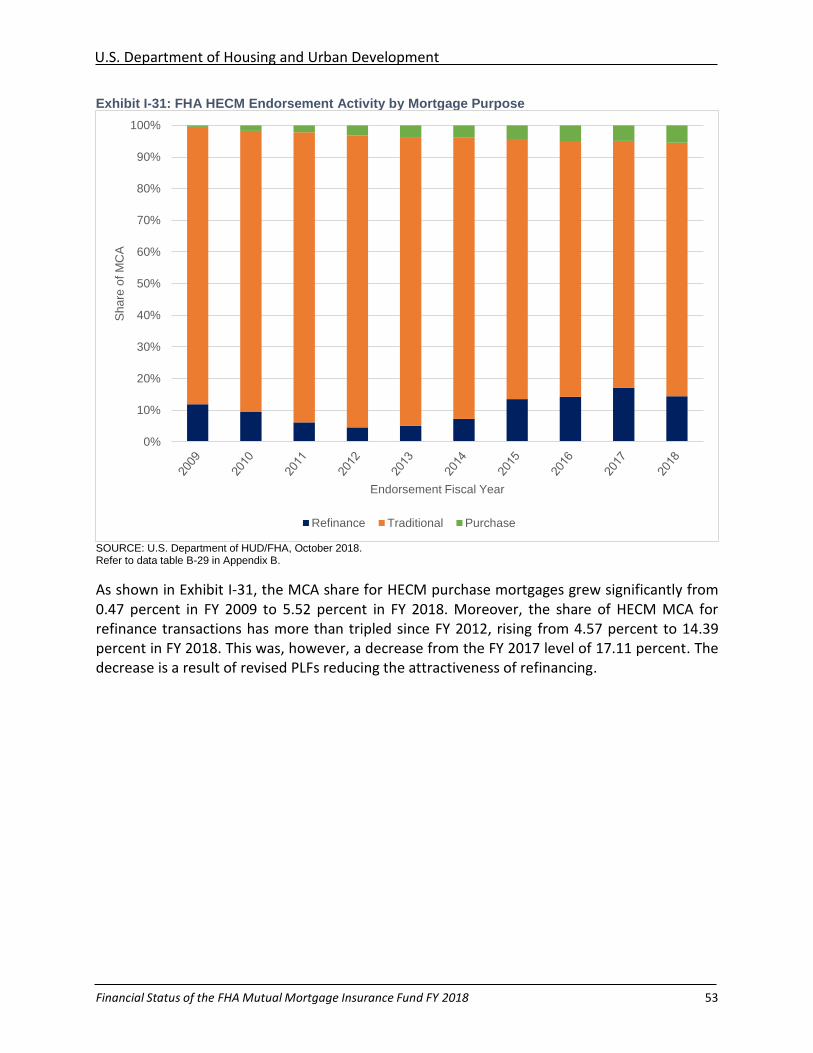
U.S. Department of Housing and Urban Development
Financial Status of the FHA Mutual Mortgage Insurance Fund FY 2018 53
Exhibit I-31: FHA HECM Endorsement Activity by Mortgage Purpose
SOURCE: U.S. Department of HUD/FHA, October 2018. Refer to data table B-29 in Appendix B.
As shown in Exhibit I-31, the MCA share for HECM purchase mortgages grew significantly from 0.47 percent in FY 2009 to 5.52 percent in FY 2018. Moreover, the share of HECM MCA for refinance transactions has more than tripled since FY 2012, rising from 4.57 percent to 14.39 percent in FY 2018. This was, however, a decrease from the FY 2017 level of 17.11 percent. The decrease is a result of revised PLFs reducing the attractiveness of refinancing.
0%
10%
20%
30%
40%
50%
60%
70%
80%
90%
100%S
ha
re o
f M
CA
Endorsement Fiscal Year
Refinance Traditional Purchase
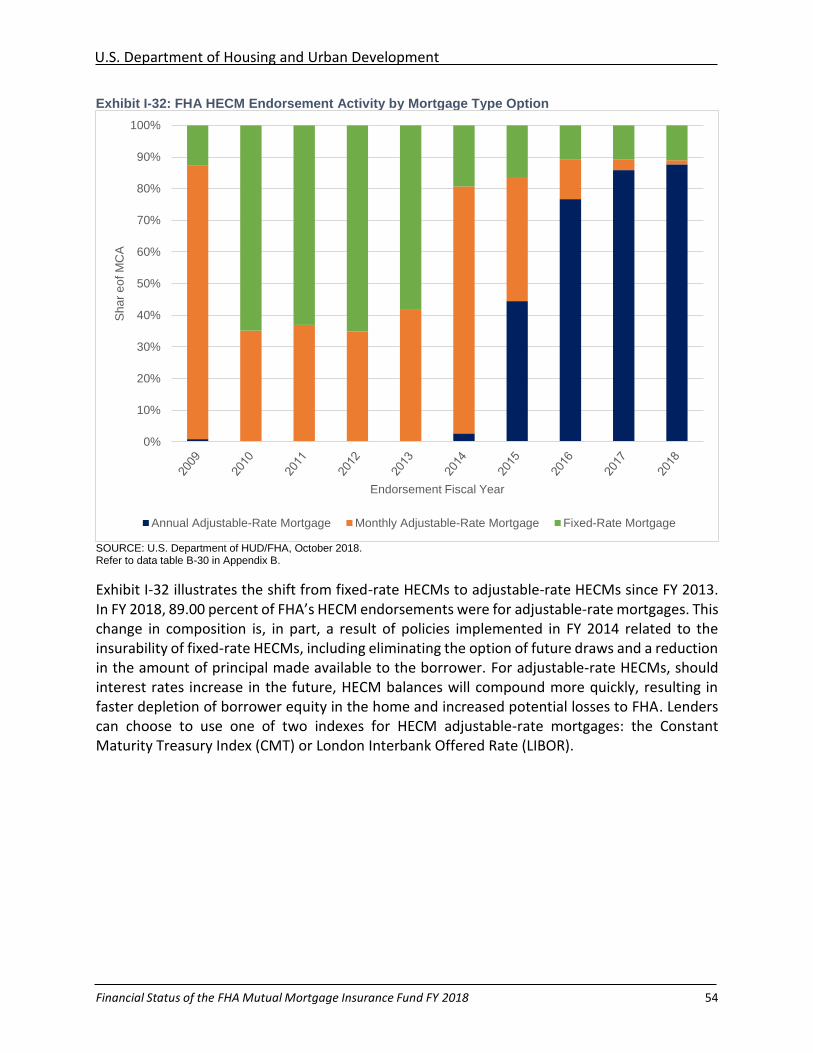
U.S. Department of Housing and Urban Development
Financial Status of the FHA Mutual Mortgage Insurance Fund FY 2018 54
Exhibit I-32: FHA HECM Endorsement Activity by Mortgage Type Option
SOURCE: U.S. Department of HUD/FHA, October 2018. Refer to data table B-30 in Appendix B.
Exhibit I-32 illustrates the shift from fixed-rate HECMs to adjustable-rate HECMs since FY 2013. In FY 2018, 89.00 percent of FHA’s HECM endorsements were for adjustable-rate mortgages. This change in composition is, in part, a result of policies implemented in FY 2014 related to the insurability of fixed-rate HECMs, including eliminating the option of future draws and a reduction in the amount of principal made available to the borrower. For adjustable-rate HECMs, should interest rates increase in the future, HECM balances will compound more quickly, resulting in faster depletion of borrower equity in the home and increased potential losses to FHA. Lenders can choose to use one of two indexes for HECM adjustable-rate mortgages: the Constant Maturity Treasury Index (CMT) or London Interbank Offered Rate (LIBOR).
0%
10%
20%
30%
40%
50%
60%
70%
80%
90%
100%S
ha
r e
of M
CA
Endorsement Fiscal Year
Annual Adjustable-Rate Mortgage Monthly Adjustable-Rate Mortgage Fixed-Rate Mortgage
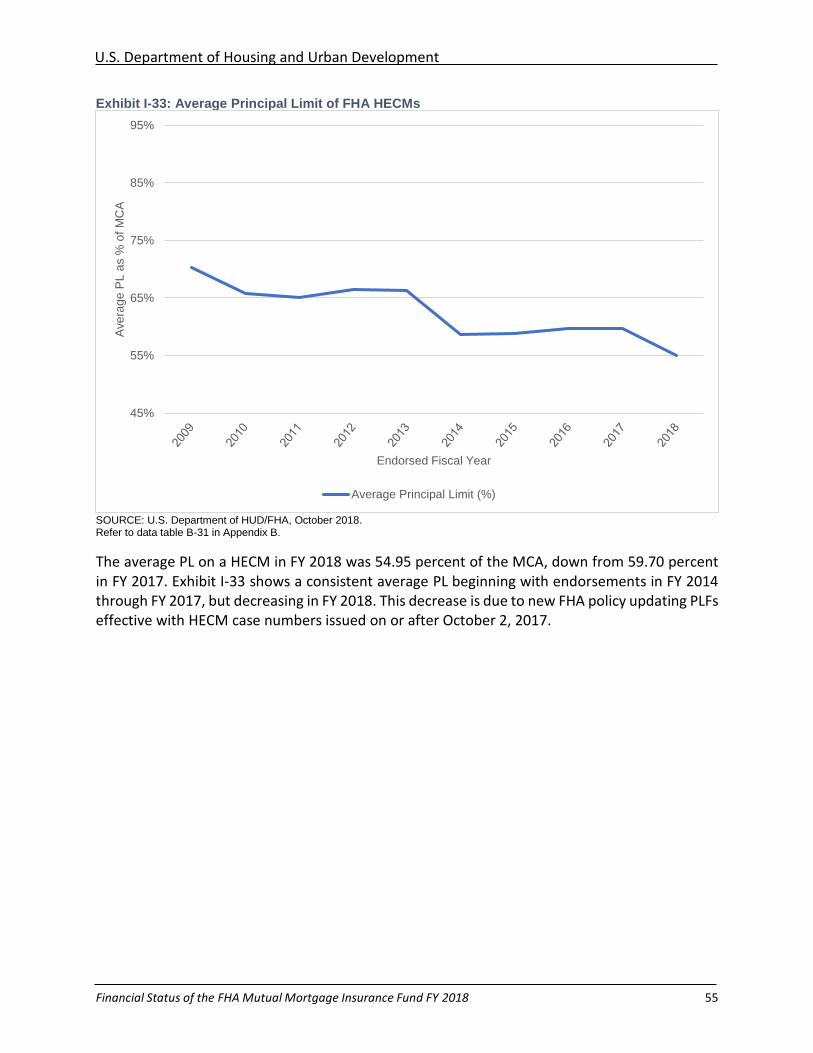
U.S. Department of Housing and Urban Development
Financial Status of the FHA Mutual Mortgage Insurance Fund FY 2018 55
Exhibit I-33: Average Principal Limit of FHA HECMs
SOURCE: U.S. Department of HUD/FHA, October 2018. Refer to data table B-31 in Appendix B.
The average PL on a HECM in FY 2018 was 54.95 percent of the MCA, down from 59.70 percent in FY 2017. Exhibit I-33 shows a consistent average PL beginning with endorsements in FY 2014 through FY 2017, but decreasing in FY 2018. This decrease is due to new FHA policy updating PLFs effective with HECM case numbers issued on or after October 2, 2017.
45%
55%
65%
75%
85%
95%A
ve
rag
e P
L a
s %
of
MC
A
Endorsed Fiscal Year
Average Principal Limit (%)
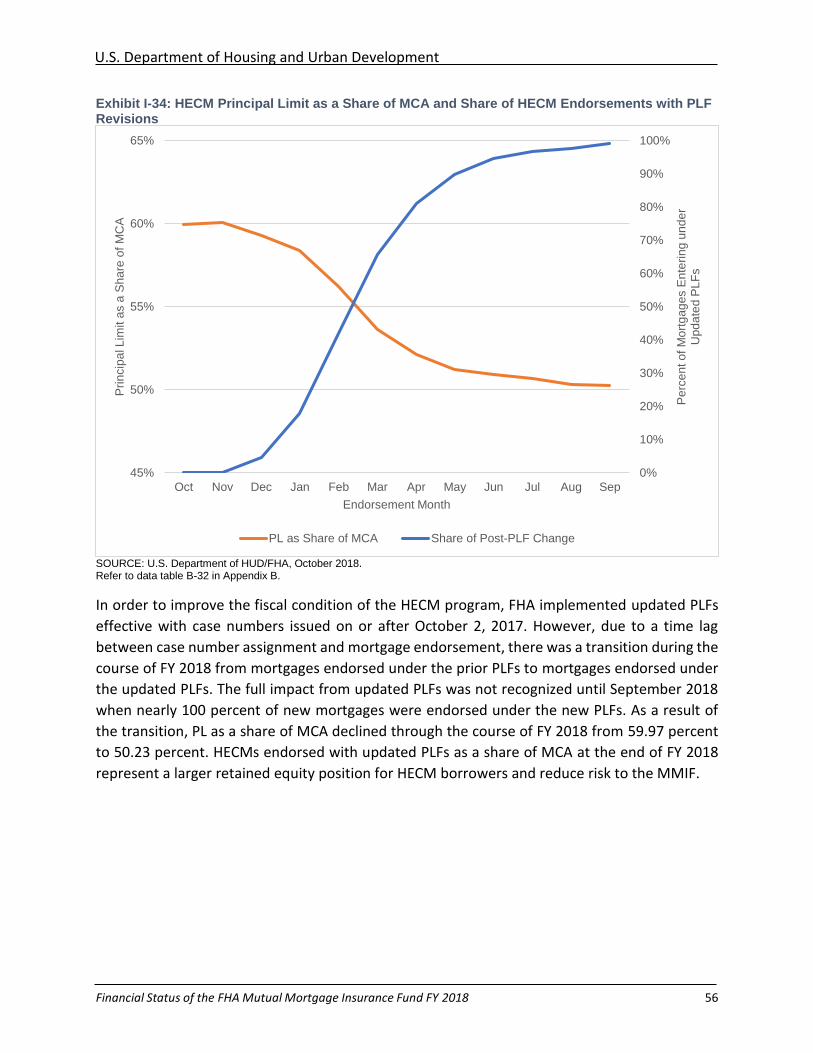
U.S. Department of Housing and Urban Development
Financial Status of the FHA Mutual Mortgage Insurance Fund FY 2018 56
Exhibit I-34: HECM Principal Limit as a Share of MCA and Share of HECM Endorsements with PLF Revisions
SOURCE: U.S. Department of HUD/FHA, October 2018. Refer to data table B-32 in Appendix B.
In order to improve the fiscal condition of the HECM program, FHA implemented updated PLFs
effective with case numbers issued on or after October 2, 2017. However, due to a time lag
between case number assignment and mortgage endorsement, there was a transition during the
course of FY 2018 from mortgages endorsed under the prior PLFs to mortgages endorsed under
the updated PLFs. The full impact from updated PLFs was not recognized until September 2018
when nearly 100 percent of new mortgages were endorsed under the new PLFs. As a result of
the transition, PL as a share of MCA declined through the course of FY 2018 from 59.97 percent
to 50.23 percent. HECMs endorsed with updated PLFs as a share of MCA at the end of FY 2018
represent a larger retained equity position for HECM borrowers and reduce risk to the MMIF.
0%
10%
20%
30%
40%
50%
60%
70%
80%
90%
100%
45%
50%
55%
60%
65%
Oct Nov Dec Jan Feb Mar Apr May Jun Jul Aug Sep
Pe
rce
nt o
f M
ort
ga
ge
s E
nte
rin
g u
nd
er
Up
da
ted
PL
Fs
Pri
ncip
al L
imit a
s a
Sh
are
of
MC
A
Endorsement Month
PL as Share of MCA Share of Post-PLF Change
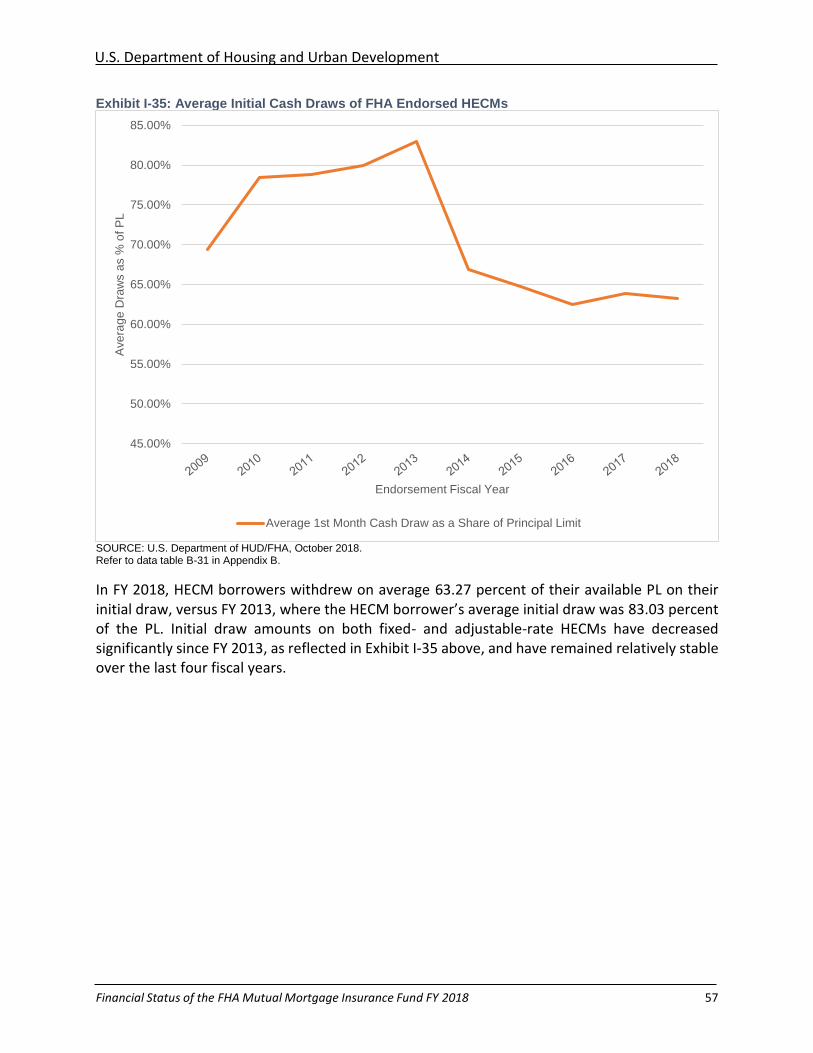
U.S. Department of Housing and Urban Development
Financial Status of the FHA Mutual Mortgage Insurance Fund FY 2018 57
Exhibit I-35: Average Initial Cash Draws of FHA Endorsed HECMs
SOURCE: U.S. Department of HUD/FHA, October 2018. Refer to data table B-31 in Appendix B.
In FY 2018, HECM borrowers withdrew on average 63.27 percent of their available PL on their initial draw, versus FY 2013, where the HECM borrower’s average initial draw was 83.03 percent of the PL. Initial draw amounts on both fixed- and adjustable-rate HECMs have decreased significantly since FY 2013, as reflected in Exhibit I-35 above, and have remained relatively stable over the last four fiscal years.
45.00%
50.00%
55.00%
60.00%
65.00%
70.00%
75.00%
80.00%
85.00%A
ve
rag
e D
raw
s a
s %
of P
L
Endorsement Fiscal Year
Average 1st Month Cash Draw as a Share of Principal Limit
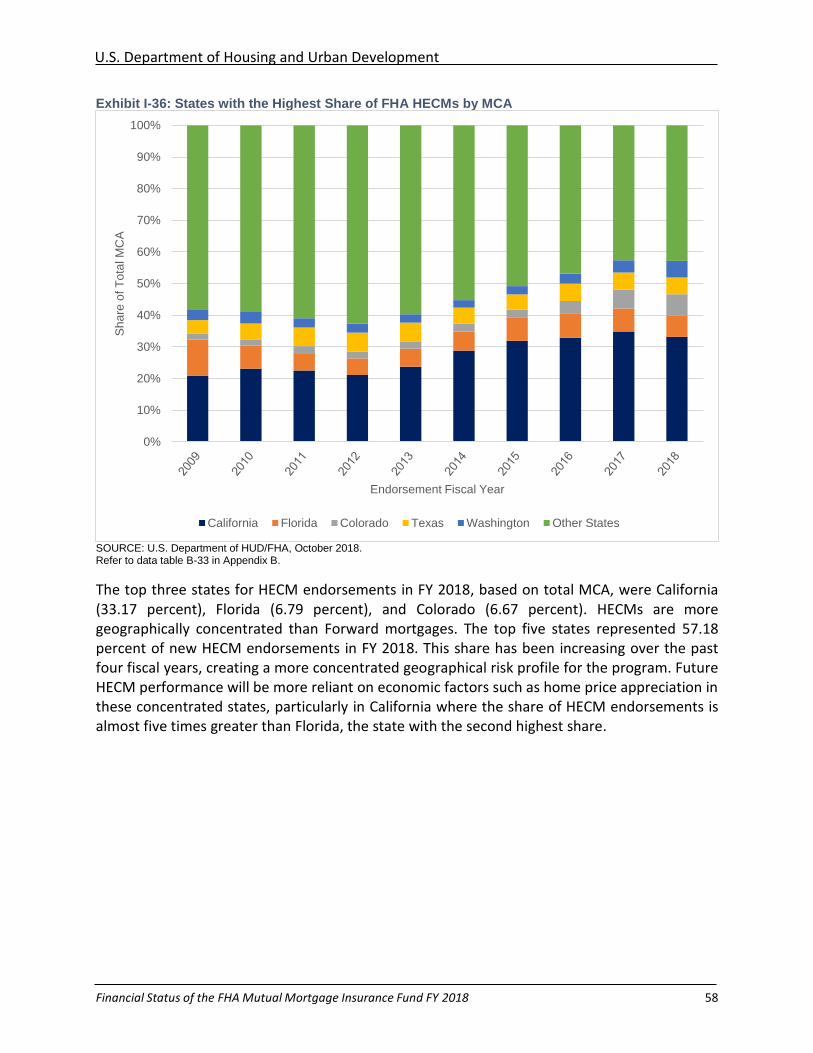
U.S. Department of Housing and Urban Development
Financial Status of the FHA Mutual Mortgage Insurance Fund FY 2018 58
Exhibit I-36: States with the Highest Share of FHA HECMs by MCA
SOURCE: U.S. Department of HUD/FHA, October 2018. Refer to data table B-33 in Appendix B.
The top three states for HECM endorsements in FY 2018, based on total MCA, were California (33.17 percent), Florida (6.79 percent), and Colorado (6.67 percent). HECMs are more geographically concentrated than Forward mortgages. The top five states represented 57.18 percent of new HECM endorsements in FY 2018. This share has been increasing over the past four fiscal years, creating a more concentrated geographical risk profile for the program. Future HECM performance will be more reliant on economic factors such as home price appreciation in these concentrated states, particularly in California where the share of HECM endorsements is almost five times greater than Florida, the state with the second highest share.
0%
10%
20%
30%
40%
50%
60%
70%
80%
90%
100%S
ha
re o
f T
ota
l M
CA
Endorsement Fiscal Year
California Florida Colorado Texas Washington Other States
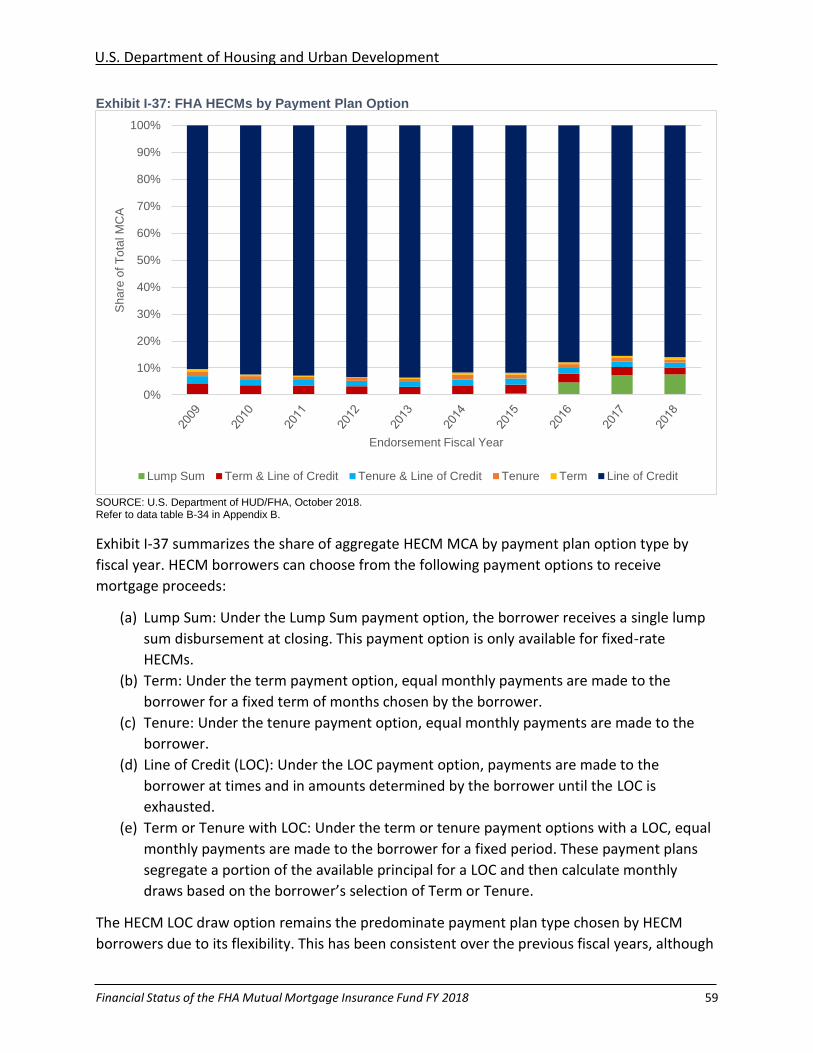
U.S. Department of Housing and Urban Development
Financial Status of the FHA Mutual Mortgage Insurance Fund FY 2018 59
Exhibit I-37: FHA HECMs by Payment Plan Option
SOURCE: U.S. Department of HUD/FHA, October 2018. Refer to data table B-34 in Appendix B.
Exhibit I-37 summarizes the share of aggregate HECM MCA by payment plan option type by
fiscal year. HECM borrowers can choose from the following payment options to receive
mortgage proceeds:
(a) Lump Sum: Under the Lump Sum payment option, the borrower receives a single lump
sum disbursement at closing. This payment option is only available for fixed-rate
HECMs.
(b) Term: Under the term payment option, equal monthly payments are made to the
borrower for a fixed term of months chosen by the borrower.
(c) Tenure: Under the tenure payment option, equal monthly payments are made to the
borrower.
(d) Line of Credit (LOC): Under the LOC payment option, payments are made to the
borrower at times and in amounts determined by the borrower until the LOC is
exhausted.
(e) Term or Tenure with LOC: Under the term or tenure payment options with a LOC, equal
monthly payments are made to the borrower for a fixed period. These payment plans
segregate a portion of the available principal for a LOC and then calculate monthly
draws based on the borrower’s selection of Term or Tenure.
The HECM LOC draw option remains the predominate payment plan type chosen by HECM
borrowers due to its flexibility. This has been consistent over the previous fiscal years, although
0%
10%
20%
30%
40%
50%
60%
70%
80%
90%
100%S
ha
re o
f T
ota
l M
CA
Endorsement Fiscal Year
Lump Sum Term & Line of Credit Tenure & Line of Credit Tenure Term Line of Credit
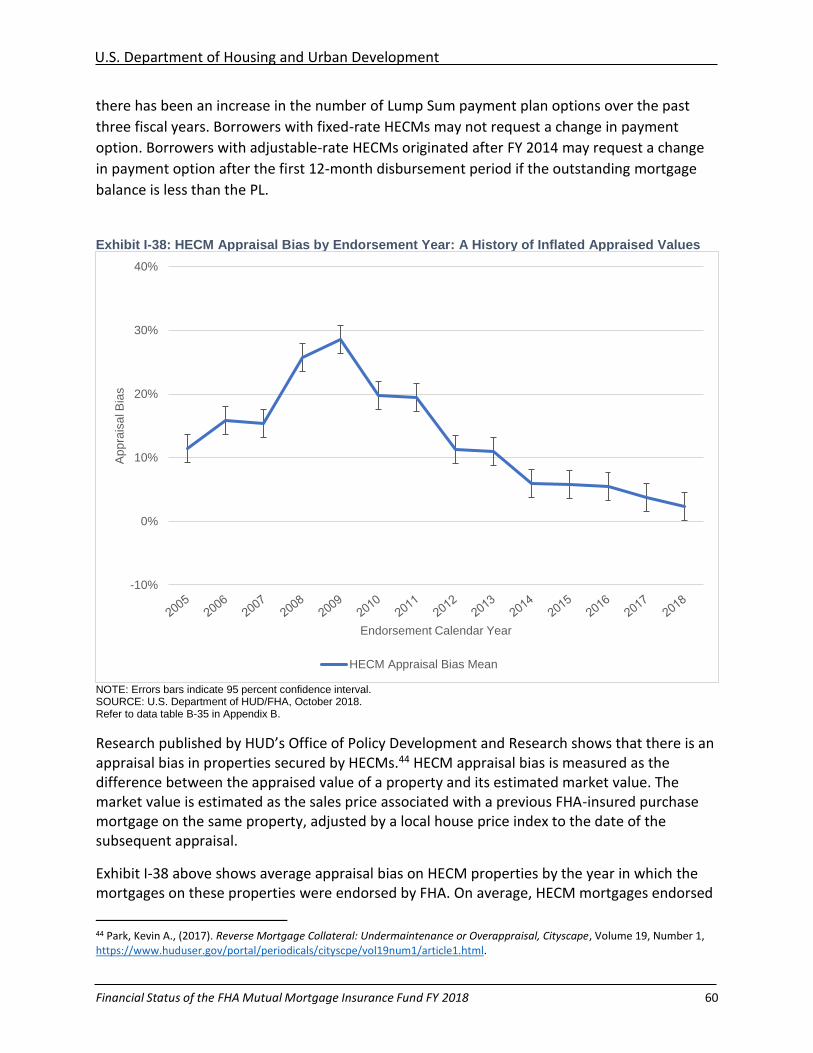
U.S. Department of Housing and Urban Development
Financial Status of the FHA Mutual Mortgage Insurance Fund FY 2018 60
there has been an increase in the number of Lump Sum payment plan options over the past
three fiscal years. Borrowers with fixed-rate HECMs may not request a change in payment
option. Borrowers with adjustable-rate HECMs originated after FY 2014 may request a change
in payment option after the first 12-month disbursement period if the outstanding mortgage
balance is less than the PL.
Exhibit I-38: HECM Appraisal Bias by Endorsement Year: A History of Inflated Appraised Values
NOTE: Errors bars indicate 95 percent confidence interval. SOURCE: U.S. Department of HUD/FHA, October 2018. Refer to data table B-35 in Appendix B.
Research published by HUD’s Office of Policy Development and Research shows that there is an appraisal bias in properties secured by HECMs.44 HECM appraisal bias is measured as the difference between the appraised value of a property and its estimated market value. The market value is estimated as the sales price associated with a previous FHA-insured purchase mortgage on the same property, adjusted by a local house price index to the date of the subsequent appraisal.
Exhibit I-38 above shows average appraisal bias on HECM properties by the year in which the mortgages on these properties were endorsed by FHA. On average, HECM mortgages endorsed
44 Park, Kevin A., (2017). Reverse Mortgage Collateral: Undermaintenance or Overappraisal, Cityscape, Volume 19, Number 1, https://www.huduser.gov/portal/periodicals/cityscpe/vol19num1/article1.html.
-10%
0%
10%
20%
30%
40%
Ap
pra
isa
l Bia
s
Endorsement Calendar Year
HECM Appraisal Bias Mean
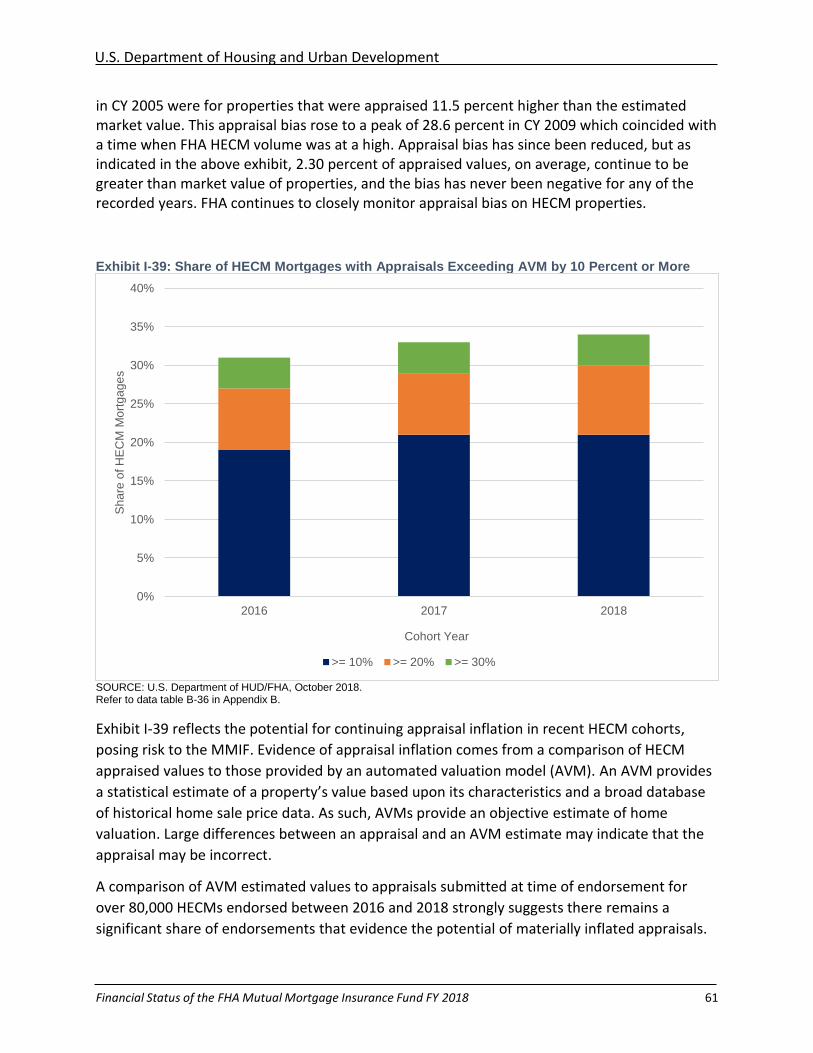
U.S. Department of Housing and Urban Development
Financial Status of the FHA Mutual Mortgage Insurance Fund FY 2018 61
in CY 2005 were for properties that were appraised 11.5 percent higher than the estimated market value. This appraisal bias rose to a peak of 28.6 percent in CY 2009 which coincided with a time when FHA HECM volume was at a high. Appraisal bias has since been reduced, but as indicated in the above exhibit, 2.30 percent of appraised values, on average, continue to be greater than market value of properties, and the bias has never been negative for any of the recorded years. FHA continues to closely monitor appraisal bias on HECM properties.
Exhibit I-39: Share of HECM Mortgages with Appraisals Exceeding AVM by 10 Percent or More
SOURCE: U.S. Department of HUD/FHA, October 2018. Refer to data table B-36 in Appendix B.
Exhibit I-39 reflects the potential for continuing appraisal inflation in recent HECM cohorts,
posing risk to the MMIF. Evidence of appraisal inflation comes from a comparison of HECM
appraised values to those provided by an automated valuation model (AVM). An AVM provides
a statistical estimate of a property’s value based upon its characteristics and a broad database
of historical home sale price data. As such, AVMs provide an objective estimate of home
valuation. Large differences between an appraisal and an AVM estimate may indicate that the
appraisal may be incorrect.
A comparison of AVM estimated values to appraisals submitted at time of endorsement for
over 80,000 HECMs endorsed between 2016 and 2018 strongly suggests there remains a
significant share of endorsements that evidence the potential of materially inflated appraisals.
0%
5%
10%
15%
20%
25%
30%
35%
40%
2016 2017 2018
Sh
are
of H
EC
M M
ort
ga
ge
s
Cohort Year
>= 10% >= 20% >= 30%

U.S. Department of Housing and Urban Development
Financial Status of the FHA Mutual Mortgage Insurance Fund FY 2018 62
Over this period, 21 percent of the HECMs compared had an appraisal that was 10 percent or
more above the AVM estimate, and material amounts exceeded even higher thresholds. For the
same period, nine percent had inflated appraisals of more than 20 percent and four percent
had inflated appraisals of 30 percent or more.
To address appraisal bias, on September 28, 2018, FHA issued policy requiring a second appraisal where the first appraised value exceeds FHA’s value variance tolerance. These new requirements became effective for all HECM originations with FHA case numbers assigned on or after October 1, 2018 through September 30, 2019.
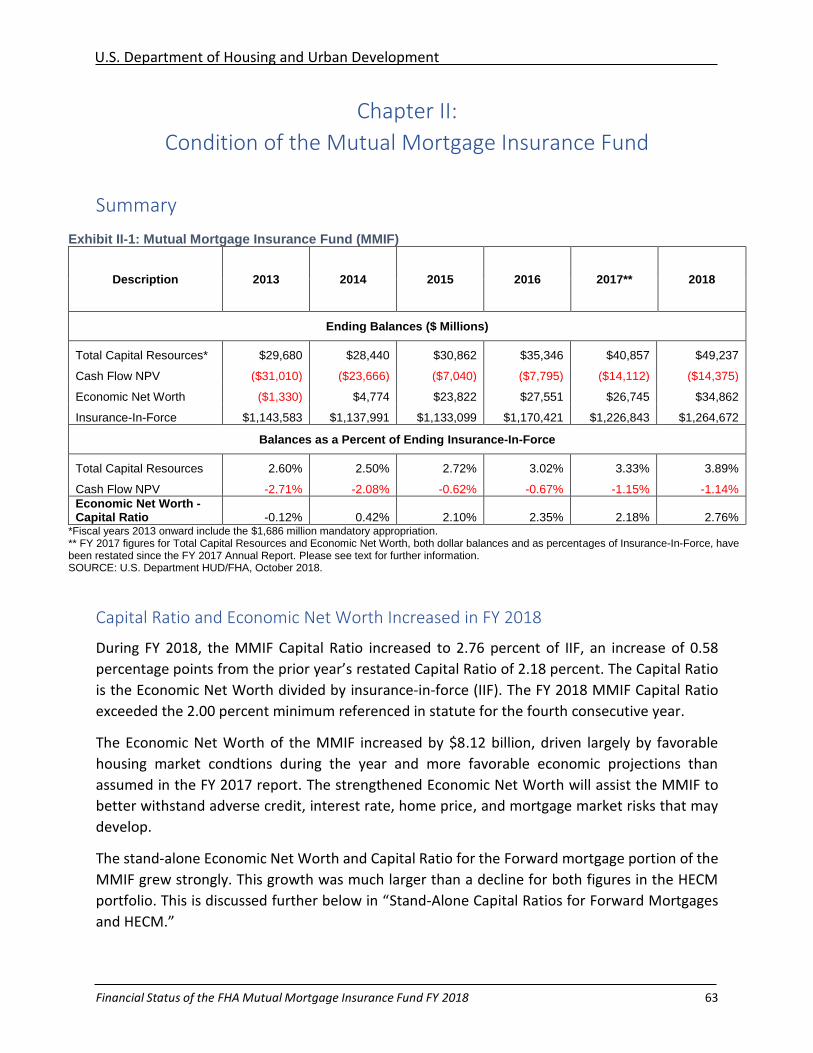
U.S. Department of Housing and Urban Development
Financial Status of the FHA Mutual Mortgage Insurance Fund FY 2018 63
Chapter II:
Condition of the Mutual Mortgage Insurance Fund
Summary
Exhibit II-1: Mutual Mortgage Insurance Fund (MMIF)
Description 2013 2014 2015 2016 2017** 2018
Ending Balances ($ Millions)
Total Capital Resources* $29,680 $28,440 $30,862 $35,346 $40,857 $49,237
Cash Flow NPV ($31,010) ($23,666) ($7,040) ($7,795) ($14,112) ($14,375)
Economic Net Worth ($1,330) $4,774 $23,822 $27,551 $26,745 $34,862
Insurance-In-Force $1,143,583 $1,137,991 $1,133,099 $1,170,421 $1,226,843 $1,264,672
Balances as a Percent of Ending Insurance-In-Force
Total Capital Resources 2.60% 2.50% 2.72% 3.02% 3.33% 3.89%
Cash Flow NPV -2.71% -2.08% -0.62% -0.67% -1.15% -1.14%
Economic Net Worth - Capital Ratio -0.12% 0.42% 2.10% 2.35% 2.18% 2.76%
*Fiscal years 2013 onward include the $1,686 million mandatory appropriation. ** FY 2017 figures for Total Capital Resources and Economic Net Worth, both dollar balances and as percentages of Insurance-In-Force, have been restated since the FY 2017 Annual Report. Please see text for further information. SOURCE: U.S. Department HUD/FHA, October 2018.
Capital Ratio and Economic Net Worth Increased in FY 2018
During FY 2018, the MMIF Capital Ratio increased to 2.76 percent of IIF, an increase of 0.58
percentage points from the prior year’s restated Capital Ratio of 2.18 percent. The Capital Ratio
is the Economic Net Worth divided by insurance-in-force (IIF). The FY 2018 MMIF Capital Ratio
exceeded the 2.00 percent minimum referenced in statute for the fourth consecutive year.
The Economic Net Worth of the MMIF increased by $8.12 billion, driven largely by favorable
housing market condtions during the year and more favorable economic projections than
assumed in the FY 2017 report. The strengthened Economic Net Worth will assist the MMIF to
better withstand adverse credit, interest rate, home price, and mortgage market risks that may
develop.
The stand-alone Economic Net Worth and Capital Ratio for the Forward mortgage portion of the
MMIF grew strongly. This growth was much larger than a decline for both figures in the HECM
portfolio. This is discussed further below in “Stand-Alone Capital Ratios for Forward Mortgages
and HECM.”
U.S. Department of Housing and Urban Development
Financial Status of the FHA Mutual Mortgage Insurance Fund FY 2018 64
FHA restated its FY 2017 assets in its FY 2018 audited financial statement to correct a material
error which resulted in an understatement of net position in FY 2017. As a result, the FY 2017
Economic Net Worth and Capital Ratio in this report were revised from those in the FY 2017
Annual Report. In Exhibit II-1, the Economic Net Worth increased by $1.12 billion and the Capital
Ratio grew by 0.09 percentage points due to the restatement for FY 2017.
Capital Adequacy is Tested
Capital adequacy is the ability of the MMIF to meet its statutory obligation of maintaining a
minimum 2.00 percent Capital Ratio across a range of economic conditions assuming no new
books of business. Because Economic Net Worth includes the result of forecasted Cash Flow Net
Present Value (Cash Flow NPV), FHA tested the effects of a variety of economic scenarios on the
MMIF Capital Ratio. This Annual Report includes the results of the tests of the capital adequacy
of the MMIF to absorb risk under varying economic conditions using 100 economic scenarios,
similar to those that have happened in the past. Test results indicated that, with the current
insured portfolio and existing Capital Resources, the MMIF Capital Ratio would remain at or
above the 2.00 percent statutory minimum requirement in 94 outcomes. In an additional two
outcomes, the Capital Ratio would fall below 2.00 percent but remain above zero. The remaining
four outcomes resulted in Capital Ratios below zero.
Independent Actuary for FY 2018 Confirms Baseline Projections Are Reasonable
Forecast scenarios of Cash Flow NPV were estimated by FHA, and tested for reasonableness by
the independent actuary, Pinnacle Actuarial Resources (“Pinnacle”). Consistency in reporting of
FHA financial results is achieved by harmonizing the processes used to produce the estimated
Cash Flow NPV evaluated by Pinnacle with the Liability for Loan Guarantees (LLG) reported in
FHA’s annual audited financial statements. The role of the independent actuary is to serve as a
critically important independent check on FHA’s methodology and results.
For FY 2018, Pinnacle concluded that FHA’s Cash Flow NPV is reasonable and within Pinnacle’s
reasonable range of Actuarial Estimates. Pinnacle’s Actuarial central estimate of Cash Flow NPV
from the Forward portfolio is $3.46 billion, compared with FHA’s baseline estimate of $1.37
billion. Pinnacle’s Actuarial central estimate of HECM Cash Flow NPV is negative $14.22 billion,
compared with FHA’s baseline estimate of negative $15.75 billion. Pinnacle’s Cash Flow NPV
estimates for the Forward and HECM portfolio combined total negative $10.76 billion, versus the
negative $14.37 billion FHA baseline estimate. The difference between the two estimates of
$3.62 billion is 0.29 percent of IIF.
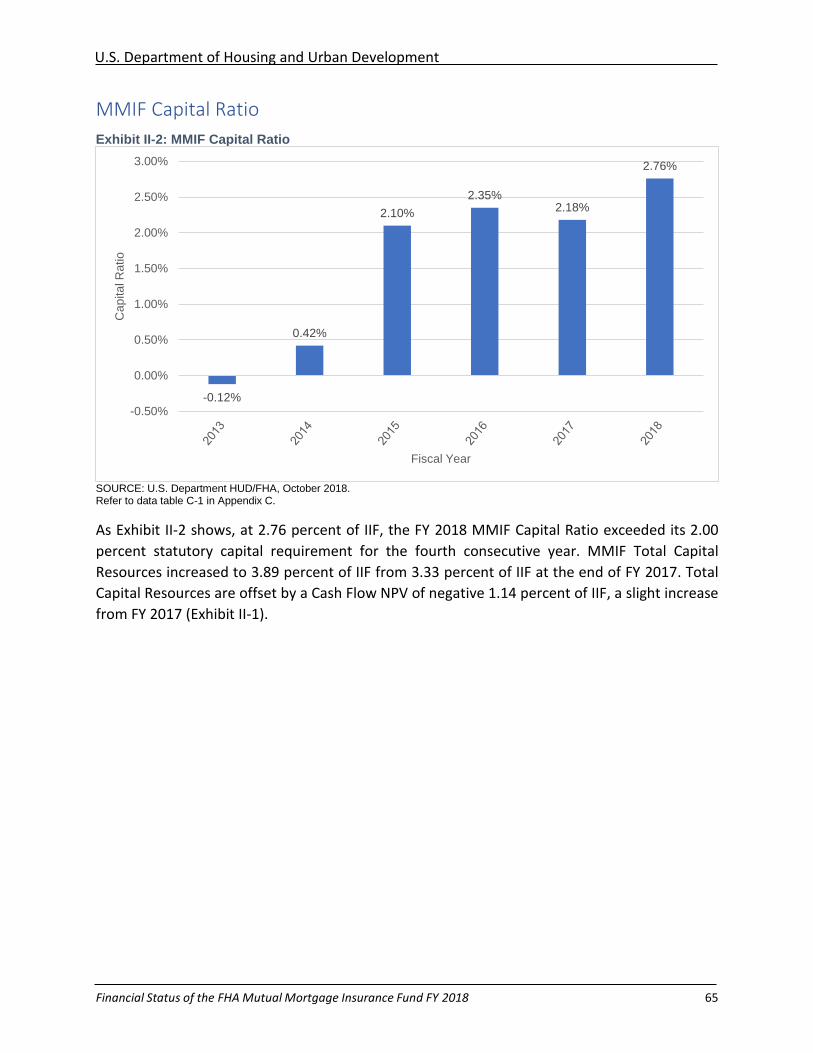
U.S. Department of Housing and Urban Development
Financial Status of the FHA Mutual Mortgage Insurance Fund FY 2018 65
MMIF Capital Ratio
Exhibit II-2: MMIF Capital Ratio
SOURCE: U.S. Department HUD/FHA, October 2018. Refer to data table C-1 in Appendix C.
As Exhibit II-2 shows, at 2.76 percent of IIF, the FY 2018 MMIF Capital Ratio exceeded its 2.00
percent statutory capital requirement for the fourth consecutive year. MMIF Total Capital
Resources increased to 3.89 percent of IIF from 3.33 percent of IIF at the end of FY 2017. Total
Capital Resources are offset by a Cash Flow NPV of negative 1.14 percent of IIF, a slight increase
from FY 2017 (Exhibit II-1).
-0.12%
0.42%
2.10%
2.35%2.18%
2.76%
-0.50%
0.00%
0.50%
1.00%
1.50%
2.00%
2.50%
3.00%
Ca
pita
l R
atio
Fiscal Year
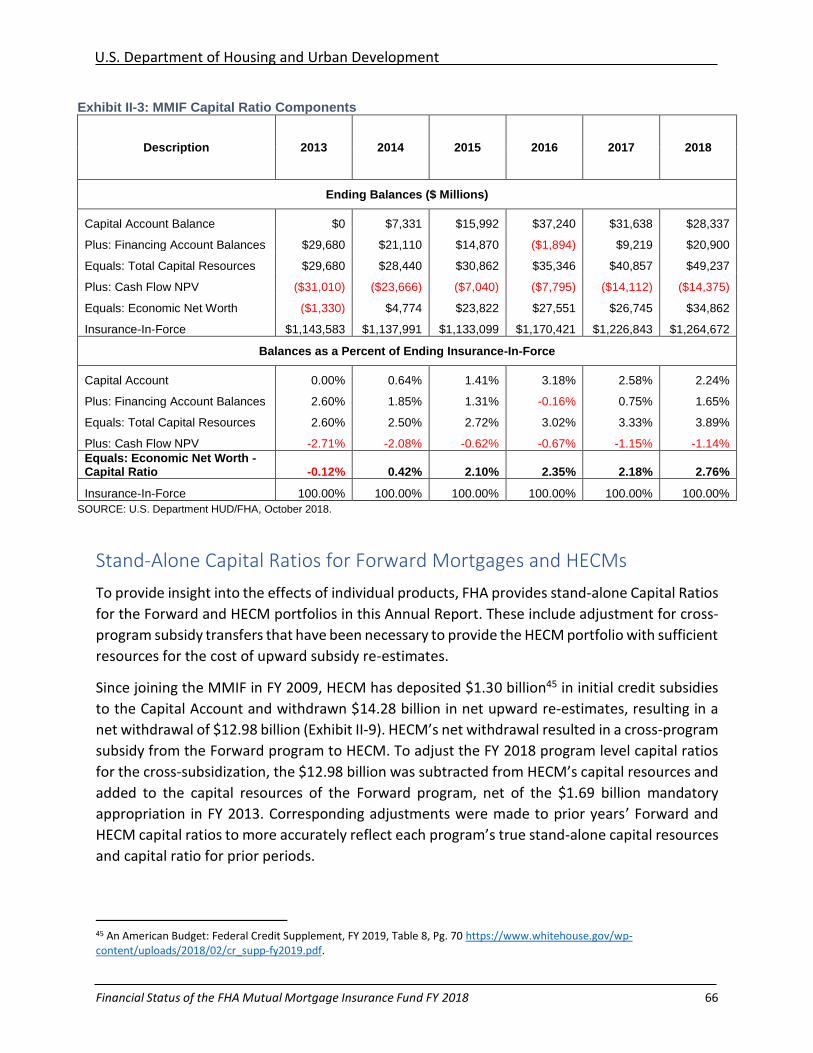
U.S. Department of Housing and Urban Development
Financial Status of the FHA Mutual Mortgage Insurance Fund FY 2018 66
Exhibit II-3: MMIF Capital Ratio Components
Description 2013 2014 2015 2016 2017 2018
Ending Balances ($ Millions)
Capital Account Balance $0 $7,331 $15,992 $37,240 $31,638 $28,337
Plus: Financing Account Balances $29,680 $21,110 $14,870 ($1,894) $9,219 $20,900
Equals: Total Capital Resources $29,680 $28,440 $30,862 $35,346 $40,857 $49,237
Plus: Cash Flow NPV ($31,010) ($23,666) ($7,040) ($7,795) ($14,112) ($14,375)
Equals: Economic Net Worth ($1,330) $4,774 $23,822 $27,551 $26,745 $34,862
Insurance-In-Force $1,143,583 $1,137,991 $1,133,099 $1,170,421 $1,226,843 $1,264,672
Balances as a Percent of Ending Insurance-In-Force
Capital Account 0.00% 0.64% 1.41% 3.18% 2.58% 2.24%
Plus: Financing Account Balances 2.60% 1.85% 1.31% -0.16% 0.75% 1.65%
Equals: Total Capital Resources 2.60% 2.50% 2.72% 3.02% 3.33% 3.89%
Plus: Cash Flow NPV -2.71% -2.08% -0.62% -0.67% -1.15% -1.14%
Equals: Economic Net Worth - Capital Ratio -0.12% 0.42% 2.10% 2.35% 2.18% 2.76%
Insurance-In-Force 100.00% 100.00% 100.00% 100.00% 100.00% 100.00%
SOURCE: U.S. Department HUD/FHA, October 2018.
Stand-Alone Capital Ratios for Forward Mortgages and HECMs
To provide insight into the effects of individual products, FHA provides stand-alone Capital Ratios
for the Forward and HECM portfolios in this Annual Report. These include adjustment for cross-
program subsidy transfers that have been necessary to provide the HECM portfolio with sufficient
resources for the cost of upward subsidy re-estimates.
Since joining the MMIF in FY 2009, HECM has deposited $1.30 billion45 in initial credit subsidies
to the Capital Account and withdrawn $14.28 billion in net upward re-estimates, resulting in a
net withdrawal of $12.98 billion (Exhibit II-9). HECM’s net withdrawal resulted in a cross-program
subsidy from the Forward program to HECM. To adjust the FY 2018 program level capital ratios
for the cross-subsidization, the $12.98 billion was subtracted from HECM’s capital resources and
added to the capital resources of the Forward program, net of the $1.69 billion mandatory
appropriation in FY 2013. Corresponding adjustments were made to prior years’ Forward and
HECM capital ratios to more accurately reflect each program’s true stand-alone capital resources
and capital ratio for prior periods.
45 An American Budget: Federal Credit Supplement, FY 2019, Table 8, Pg. 70 https://www.whitehouse.gov/wp-content/uploads/2018/02/cr_supp-fy2019.pdf.
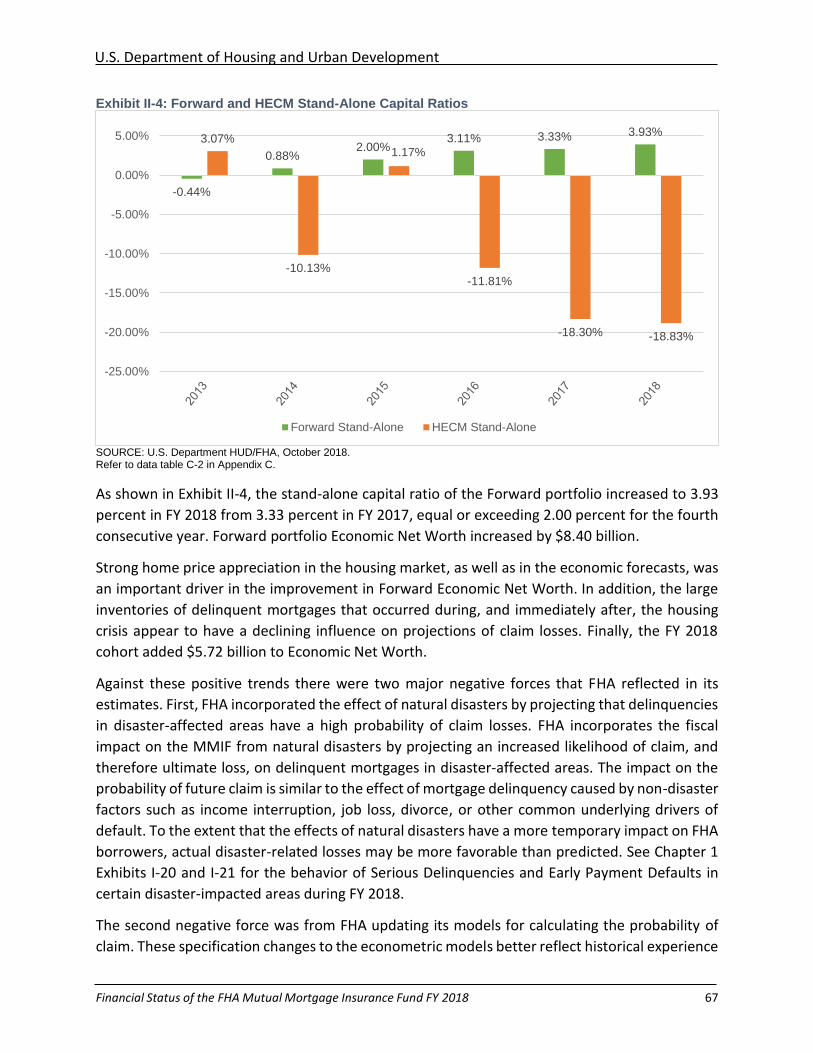
U.S. Department of Housing and Urban Development
Financial Status of the FHA Mutual Mortgage Insurance Fund FY 2018 67
Exhibit II-4: Forward and HECM Stand-Alone Capital Ratios
SOURCE: U.S. Department HUD/FHA, October 2018. Refer to data table C-2 in Appendix C.
As shown in Exhibit II-4, the stand-alone capital ratio of the Forward portfolio increased to 3.93
percent in FY 2018 from 3.33 percent in FY 2017, equal or exceeding 2.00 percent for the fourth
consecutive year. Forward portfolio Economic Net Worth increased by $8.40 billion.
Strong home price appreciation in the housing market, as well as in the economic forecasts, was
an important driver in the improvement in Forward Economic Net Worth. In addition, the large
inventories of delinquent mortgages that occurred during, and immediately after, the housing
crisis appear to have a declining influence on projections of claim losses. Finally, the FY 2018
cohort added $5.72 billion to Economic Net Worth.
Against these positive trends there were two major negative forces that FHA reflected in its
estimates. First, FHA incorporated the effect of natural disasters by projecting that delinquencies
in disaster-affected areas have a high probability of claim losses. FHA incorporates the fiscal
impact on the MMIF from natural disasters by projecting an increased likelihood of claim, and
therefore ultimate loss, on delinquent mortgages in disaster-affected areas. The impact on the
probability of future claim is similar to the effect of mortgage delinquency caused by non-disaster
factors such as income interruption, job loss, divorce, or other common underlying drivers of
default. To the extent that the effects of natural disasters have a more temporary impact on FHA
borrowers, actual disaster-related losses may be more favorable than predicted. See Chapter 1
Exhibits I-20 and I-21 for the behavior of Serious Delinquencies and Early Payment Defaults in
certain disaster-impacted areas during FY 2018.
The second negative force was from FHA updating its models for calculating the probability of
claim. These specification changes to the econometric models better reflect historical experience
-0.44%
0.88%2.00%
3.11% 3.33% 3.93%3.07%
-10.13%
1.17%
-11.81%
-18.30% -18.83%
-25.00%
-20.00%
-15.00%
-10.00%
-5.00%
0.00%
5.00%
Forward Stand-Alone HECM Stand-Alone

U.S. Department of Housing and Urban Development
Financial Status of the FHA Mutual Mortgage Insurance Fund FY 2018 68
than the prior models and improve statistical validity. The changes result in higher probabilities
of claim when keeping economic forecasts constant. This factor reduced but did not eliminate
the effect of more favorable economic conditions.
Exhibit II-5: Forward Mortgage Insurance Program Stand-Alone Capital Ratio Components
Description 2013 2014 2015 2016 2017 2018
Balances ($ Millions) as of September 30
Net Cross-Program Subsidy Paid* $3,107 $3,568 $4,303 ($1,097) $10,010 $11,298
Plus: Capital Account Balance $0 $7,331 $15,992 $37,240 $31,638 $28,337
Plus: Financing Account Balance $20,561 $12,285 $5,238 ($5,916) ($4,593) $5,803
Equals: Total Capital Resources $23,668 $23,183 $25,533 $30,227 $37,056 $45,438
Plus: Cash Flow NPV ($28,432) ($13,684) ($4,186) $3,948 $1,357 $1,372
Equals: Economic Net Worth ($4,764) $9,499 $21,347 $34,175 $38,413 $46,810
Insurance-In-Force $1,086,647 $1,074,732 $1,065,360 $1,100,046 $1,153,875 $1,192,283
Balances as a Percent of Insurance-In-Force
Net Cross-Program Subsidy Paid 0.29% 0.33% 0.40% -0.10% 0.87% 0.95%
Capital Account 0.00% 0.68% 1.50% 3.39% 2.74% 2.38%
Plus: Financing Account Balance 1.89% 1.14% 0.49% -0.54% -0.40% 0.49%
Equals: Total Capital Resources 2.18% 2.16% 2.40% 2.75% 3.21% 3.81%
Plus: Cash Flow NPV -2.62% -1.27% -0.39% 0.36% 0.12% 0.12%
Equals: Economic Net Worth - Capital Ratio -0.44% 0.88% 2.00% 3.11% 3.33% 3.93%
Insurance-In-Force 100.00% 100.00% 100.00% 100.00% 100.00% 100.00% NOTE: Net Cross-Program Subsidy Paid excludes the $1,686 million mandatory appropriation in FY 2013 through FY 2018. SOURCE: U.S. Department HUD/FHA, October 2018.
As evidenced by Exhibit II-6, the stand-alone Capital Ratios of Forward mortgages turned positive beginning with the FY 2010 cohort and remain positive after that, with a peak value in FY 2015. This trend generally reflects the health of the economy and housing market in the years subsequent to endorsement, as well as the credit profile of FHA borrowers. Cohorts from FY 2004 through FY 2009 represent an era where the credit quality of FHA borrowers was weak, seller-funded downpayment assistance was common, and the effects of the recession and the deflation of the housing bubble adversely affected mortgage performance. After FY 2009, the mortgage performance of the cohorts benefited from economic recovery, an improvement in FHA borrower credit quality, and higher Mortgage Insurance Premium (MIP) rates.
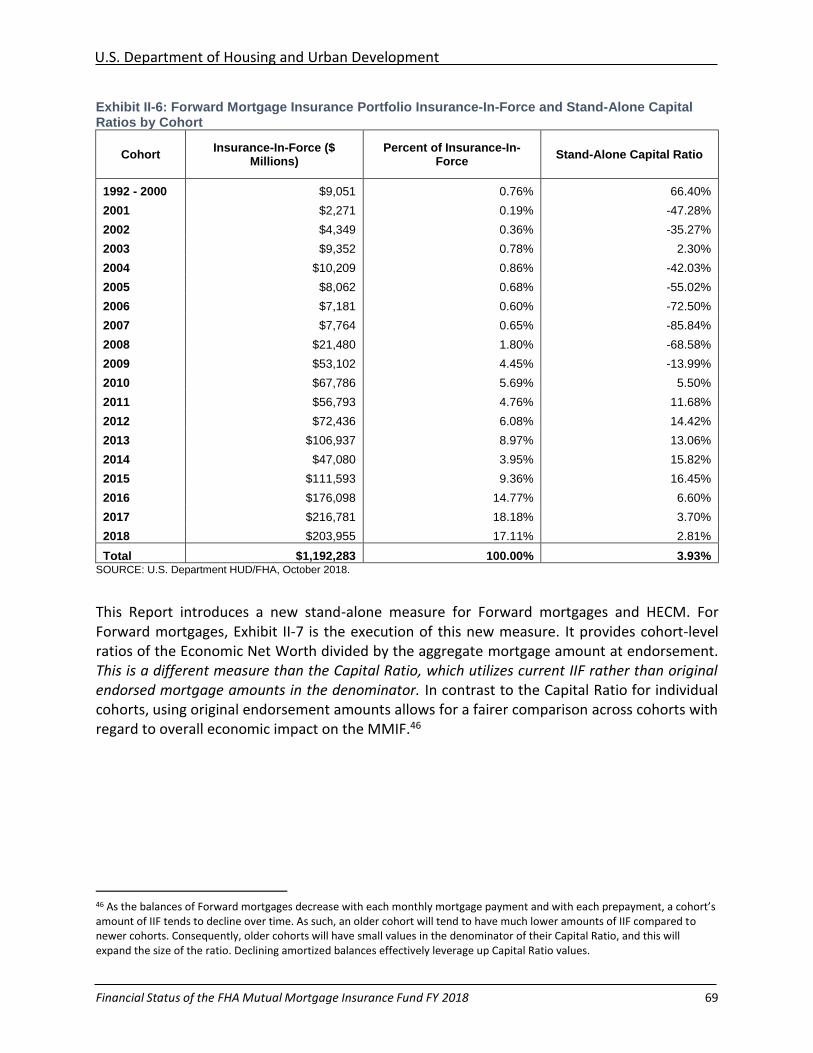
U.S. Department of Housing and Urban Development
Financial Status of the FHA Mutual Mortgage Insurance Fund FY 2018 69
Exhibit II-6: Forward Mortgage Insurance Portfolio Insurance-In-Force and Stand-Alone Capital Ratios by Cohort
Cohort Insurance-In-Force ($ Millions)
Percent of Insurance-In-Force
Stand-Alone Capital Ratio
1992 - 2000 $9,051 0.76% 66.40%
2001 $2,271 0.19% -47.28%
2002 $4,349 0.36% -35.27%
2003 $9,352 0.78% 2.30%
2004 $10,209 0.86% -42.03%
2005 $8,062 0.68% -55.02%
2006 $7,181 0.60% -72.50%
2007 $7,764 0.65% -85.84%
2008 $21,480 1.80% -68.58%
2009 $53,102 4.45% -13.99%
2010 $67,786 5.69% 5.50%
2011 $56,793 4.76% 11.68%
2012 $72,436 6.08% 14.42%
2013 $106,937 8.97% 13.06%
2014 $47,080 3.95% 15.82%
2015 $111,593 9.36% 16.45%
2016 $176,098 14.77% 6.60%
2017 $216,781 18.18% 3.70%
2018 $203,955 17.11% 2.81%
Total $1,192,283 100.00% 3.93% SOURCE: U.S. Department HUD/FHA, October 2018.
This Report introduces a new stand-alone measure for Forward mortgages and HECM. For Forward mortgages, Exhibit II-7 is the execution of this new measure. It provides cohort-level ratios of the Economic Net Worth divided by the aggregate mortgage amount at endorsement. This is a different measure than the Capital Ratio, which utilizes current IIF rather than original endorsed mortgage amounts in the denominator. In contrast to the Capital Ratio for individual cohorts, using original endorsement amounts allows for a fairer comparison across cohorts with regard to overall economic impact on the MMIF.46
46 As the balances of Forward mortgages decrease with each monthly mortgage payment and with each prepayment, a cohort’s amount of IIF tends to decline over time. As such, an older cohort will tend to have much lower amounts of IIF compared to newer cohorts. Consequently, older cohorts will have small values in the denominator of their Capital Ratio, and this will expand the size of the ratio. Declining amortized balances effectively leverage up Capital Ratio values.
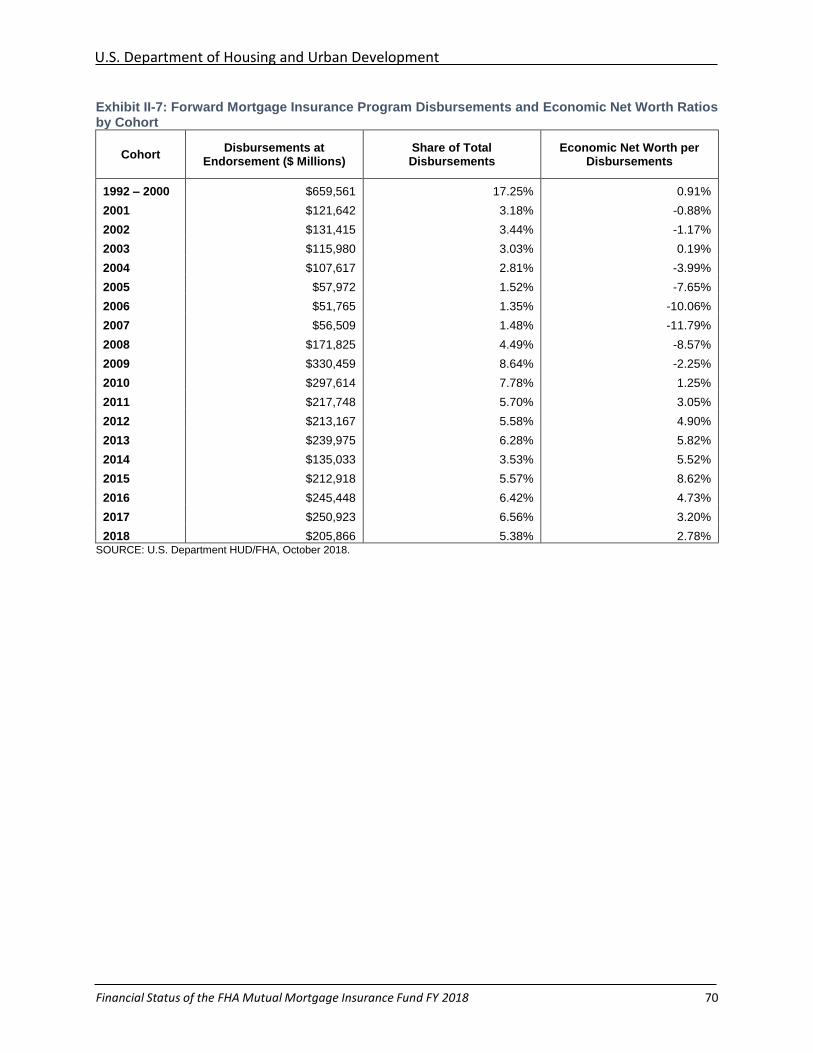
U.S. Department of Housing and Urban Development
Financial Status of the FHA Mutual Mortgage Insurance Fund FY 2018 70
Exhibit II-7: Forward Mortgage Insurance Program Disbursements and Economic Net Worth Ratios by Cohort
Cohort Disbursements at Endorsement ($ Millions)
Share of Total Disbursements
Economic Net Worth per Disbursements
1992 – 2000 $659,561 17.25% 0.91%
2001 $121,642 3.18% -0.88%
2002 $131,415 3.44% -1.17%
2003 $115,980 3.03% 0.19%
2004 $107,617 2.81% -3.99%
2005 $57,972 1.52% -7.65%
2006 $51,765 1.35% -10.06%
2007 $56,509 1.48% -11.79%
2008 $171,825 4.49% -8.57%
2009 $330,459 8.64% -2.25%
2010 $297,614 7.78% 1.25%
2011 $217,748 5.70% 3.05%
2012 $213,167 5.58% 4.90%
2013 $239,975 6.28% 5.82%
2014 $135,033 3.53% 5.52%
2015 $212,918 5.57% 8.62%
2016 $245,448 6.42% 4.73%
2017 $250,923 6.56% 3.20%
2018 $205,866 5.38% 2.78% SOURCE: U.S. Department HUD/FHA, October 2018.
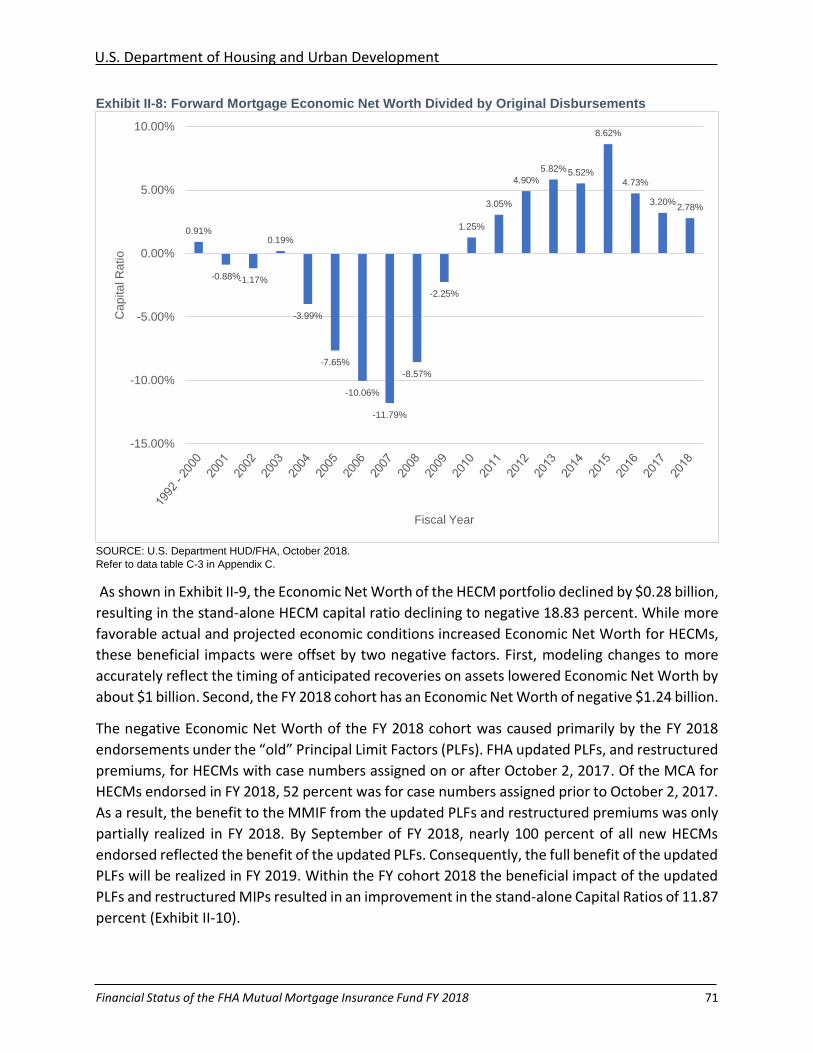
U.S. Department of Housing and Urban Development
Financial Status of the FHA Mutual Mortgage Insurance Fund FY 2018 71
Exhibit II-8: Forward Mortgage Economic Net Worth Divided by Original Disbursements
SOURCE: U.S. Department HUD/FHA, October 2018.
Refer to data table C-3 in Appendix C.
As shown in Exhibit II-9, the Economic Net Worth of the HECM portfolio declined by $0.28 billion,
resulting in the stand-alone HECM capital ratio declining to negative 18.83 percent. While more
favorable actual and projected economic conditions increased Economic Net Worth for HECMs,
these beneficial impacts were offset by two negative factors. First, modeling changes to more
accurately reflect the timing of anticipated recoveries on assets lowered Economic Net Worth by
about $1 billion. Second, the FY 2018 cohort has an Economic Net Worth of negative $1.24 billion.
The negative Economic Net Worth of the FY 2018 cohort was caused primarily by the FY 2018
endorsements under the “old” Principal Limit Factors (PLFs). FHA updated PLFs, and restructured
premiums, for HECMs with case numbers assigned on or after October 2, 2017. Of the MCA for
HECMs endorsed in FY 2018, 52 percent was for case numbers assigned prior to October 2, 2017.
As a result, the benefit to the MMIF from the updated PLFs and restructured premiums was only
partially realized in FY 2018. By September of FY 2018, nearly 100 percent of all new HECMs
endorsed reflected the benefit of the updated PLFs. Consequently, the full benefit of the updated
PLFs will be realized in FY 2019. Within the FY cohort 2018 the beneficial impact of the updated
PLFs and restructured MIPs resulted in an improvement in the stand-alone Capital Ratios of 11.87
percent (Exhibit II-10).
0.91%
-0.88%-1.17%
0.19%
-3.99%
-7.65%
-10.06%
-11.79%
-8.57%
-2.25%
1.25%
3.05%
4.90%
5.82%5.52%
8.62%
4.73%
3.20%2.78%
-15.00%
-10.00%
-5.00%
0.00%
5.00%
10.00%C
ap
ita
l R
atio
Fiscal Year
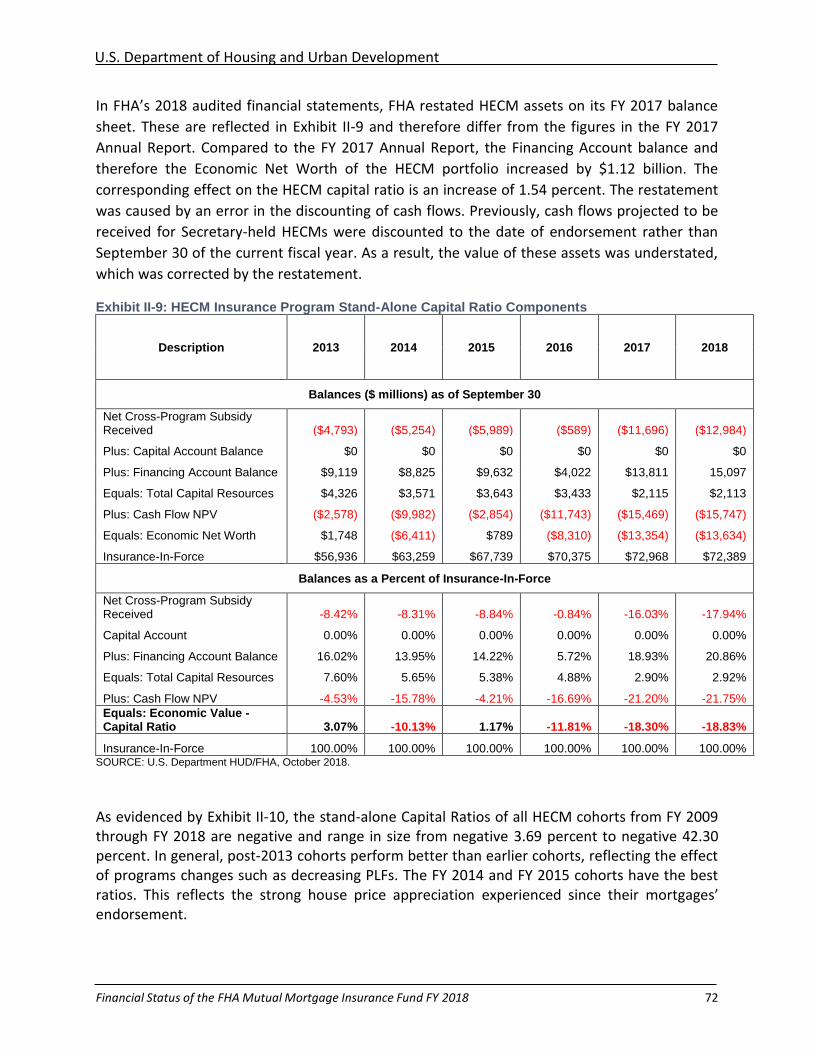
U.S. Department of Housing and Urban Development
Financial Status of the FHA Mutual Mortgage Insurance Fund FY 2018 72
In FHA’s 2018 audited financial statements, FHA restated HECM assets on its FY 2017 balance
sheet. These are reflected in Exhibit II-9 and therefore differ from the figures in the FY 2017
Annual Report. Compared to the FY 2017 Annual Report, the Financing Account balance and
therefore the Economic Net Worth of the HECM portfolio increased by $1.12 billion. The
corresponding effect on the HECM capital ratio is an increase of 1.54 percent. The restatement
was caused by an error in the discounting of cash flows. Previously, cash flows projected to be
received for Secretary-held HECMs were discounted to the date of endorsement rather than
September 30 of the current fiscal year. As a result, the value of these assets was understated,
which was corrected by the restatement.
Exhibit II-9: HECM Insurance Program Stand-Alone Capital Ratio Components
Description 2013 2014 2015 2016 2017 2018
Balances ($ millions) as of September 30
Net Cross-Program Subsidy Received ($4,793) ($5,254) ($5,989) ($589) ($11,696) ($12,984)
Plus: Capital Account Balance $0 $0 $0 $0 $0 $0
Plus: Financing Account Balance $9,119 $8,825 $9,632 $4,022 $13,811 15,097
Equals: Total Capital Resources $4,326 $3,571 $3,643 $3,433 $2,115 $2,113
Plus: Cash Flow NPV ($2,578) ($9,982) ($2,854) ($11,743) ($15,469) ($15,747)
Equals: Economic Net Worth $1,748 ($6,411) $789 ($8,310) ($13,354) ($13,634)
Insurance-In-Force $56,936 $63,259 $67,739 $70,375 $72,968 $72,389
Balances as a Percent of Insurance-In-Force
Net Cross-Program Subsidy Received -8.42% -8.31% -8.84% -0.84% -16.03% -17.94%
Capital Account 0.00% 0.00% 0.00% 0.00% 0.00% 0.00%
Plus: Financing Account Balance 16.02% 13.95% 14.22% 5.72% 18.93% 20.86%
Equals: Total Capital Resources 7.60% 5.65% 5.38% 4.88% 2.90% 2.92%
Plus: Cash Flow NPV -4.53% -15.78% -4.21% -16.69% -21.20% -21.75%
Equals: Economic Value - Capital Ratio 3.07% -10.13% 1.17% -11.81% -18.30% -18.83%
Insurance-In-Force 100.00% 100.00% 100.00% 100.00% 100.00% 100.00% SOURCE: U.S. Department HUD/FHA, October 2018.
As evidenced by Exhibit II-10, the stand-alone Capital Ratios of all HECM cohorts from FY 2009 through FY 2018 are negative and range in size from negative 3.69 percent to negative 42.30 percent. In general, post-2013 cohorts perform better than earlier cohorts, reflecting the effect of programs changes such as decreasing PLFs. The FY 2014 and FY 2015 cohorts have the best ratios. This reflects the strong house price appreciation experienced since their mortgages’ endorsement.
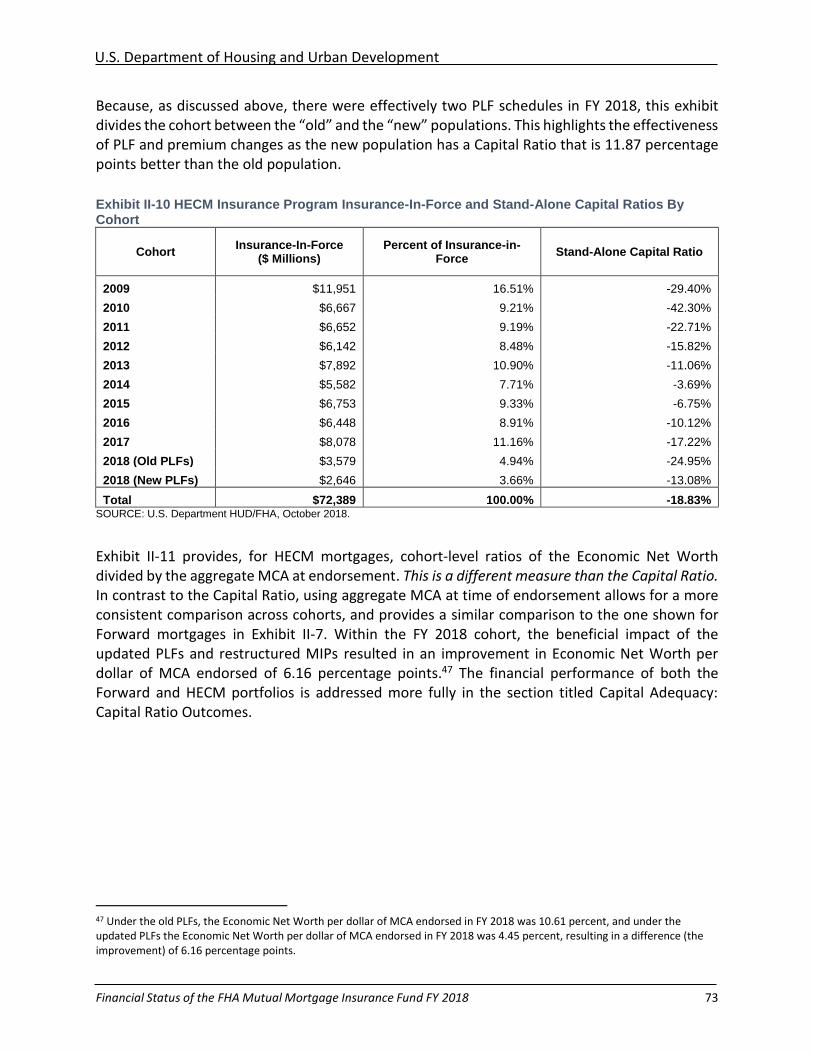
U.S. Department of Housing and Urban Development
Financial Status of the FHA Mutual Mortgage Insurance Fund FY 2018 73
Because, as discussed above, there were effectively two PLF schedules in FY 2018, this exhibit divides the cohort between the “old” and the “new” populations. This highlights the effectiveness of PLF and premium changes as the new population has a Capital Ratio that is 11.87 percentage points better than the old population.
Exhibit II-10 HECM Insurance Program Insurance-In-Force and Stand-Alone Capital Ratios By Cohort
Cohort Insurance-In-Force
($ Millions) Percent of Insurance-in-
Force Stand-Alone Capital Ratio
2009 $11,951 16.51% -29.40%
2010 $6,667 9.21% -42.30%
2011 $6,652 9.19% -22.71%
2012 $6,142 8.48% -15.82%
2013 $7,892 10.90% -11.06%
2014 $5,582 7.71% -3.69%
2015 $6,753 9.33% -6.75%
2016 $6,448 8.91% -10.12%
2017 $8,078 11.16% -17.22%
2018 (Old PLFs) $3,579 4.94% -24.95%
2018 (New PLFs) $2,646 3.66% -13.08%
Total $72,389 100.00% -18.83% SOURCE: U.S. Department HUD/FHA, October 2018.
Exhibit II-11 provides, for HECM mortgages, cohort-level ratios of the Economic Net Worth divided by the aggregate MCA at endorsement. This is a different measure than the Capital Ratio. In contrast to the Capital Ratio, using aggregate MCA at time of endorsement allows for a more consistent comparison across cohorts, and provides a similar comparison to the one shown for Forward mortgages in Exhibit II-7. Within the FY 2018 cohort, the beneficial impact of the updated PLFs and restructured MIPs resulted in an improvement in Economic Net Worth per dollar of MCA endorsed of 6.16 percentage points.47 The financial performance of both the Forward and HECM portfolios is addressed more fully in the section titled Capital Adequacy: Capital Ratio Outcomes.
47 Under the old PLFs, the Economic Net Worth per dollar of MCA endorsed in FY 2018 was 10.61 percent, and under the updated PLFs the Economic Net Worth per dollar of MCA endorsed in FY 2018 was 4.45 percent, resulting in a difference (the improvement) of 6.16 percentage points.
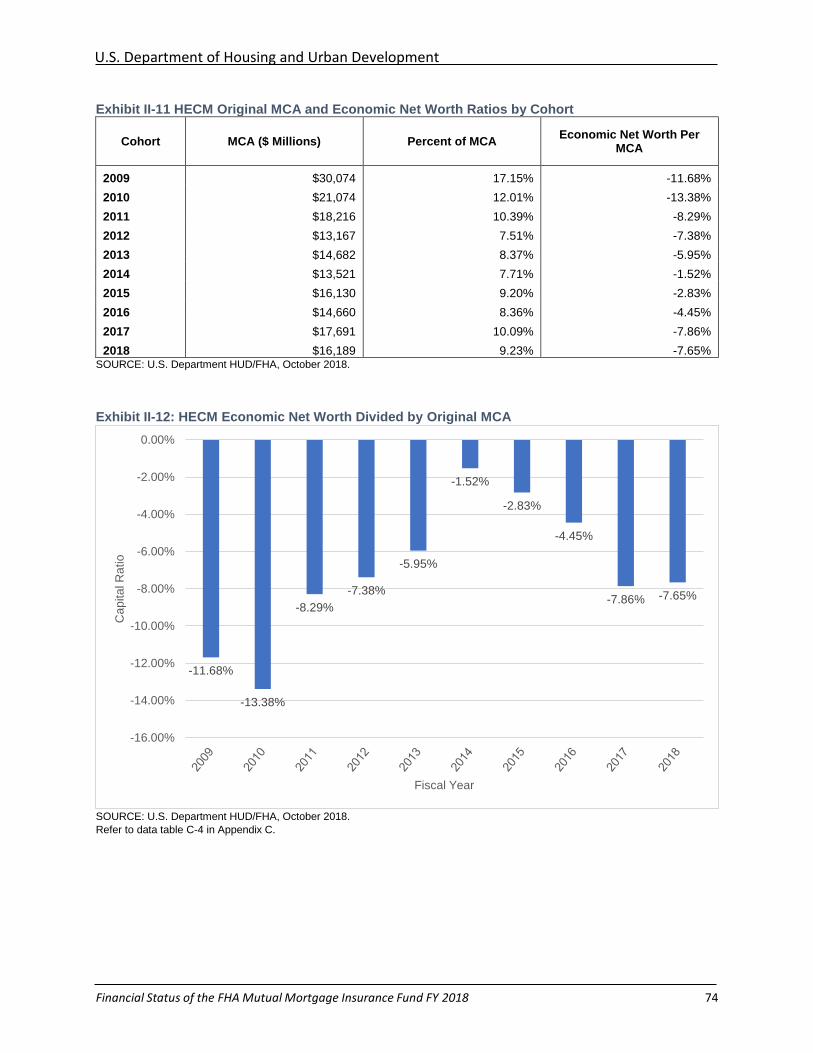
U.S. Department of Housing and Urban Development
Financial Status of the FHA Mutual Mortgage Insurance Fund FY 2018 74
Exhibit II-11 HECM Original MCA and Economic Net Worth Ratios by Cohort
Cohort MCA ($ Millions) Percent of MCA Economic Net Worth Per
MCA
2009 $30,074 17.15% -11.68%
2010 $21,074 12.01% -13.38%
2011 $18,216 10.39% -8.29%
2012 $13,167 7.51% -7.38%
2013 $14,682 8.37% -5.95%
2014 $13,521 7.71% -1.52%
2015 $16,130 9.20% -2.83%
2016 $14,660 8.36% -4.45%
2017 $17,691 10.09% -7.86%
2018 $16,189 9.23% -7.65% SOURCE: U.S. Department HUD/FHA, October 2018.
Exhibit II-12: HECM Economic Net Worth Divided by Original MCA
SOURCE: U.S. Department HUD/FHA, October 2018.
Refer to data table C-4 in Appendix C.
-11.68%
-13.38%
-8.29%
-7.38%
-5.95%
-1.52%
-2.83%
-4.45%
-7.86% -7.65%
-16.00%
-14.00%
-12.00%
-10.00%
-8.00%
-6.00%
-4.00%
-2.00%
0.00%
Cap
ita
l R
atio
Fiscal Year
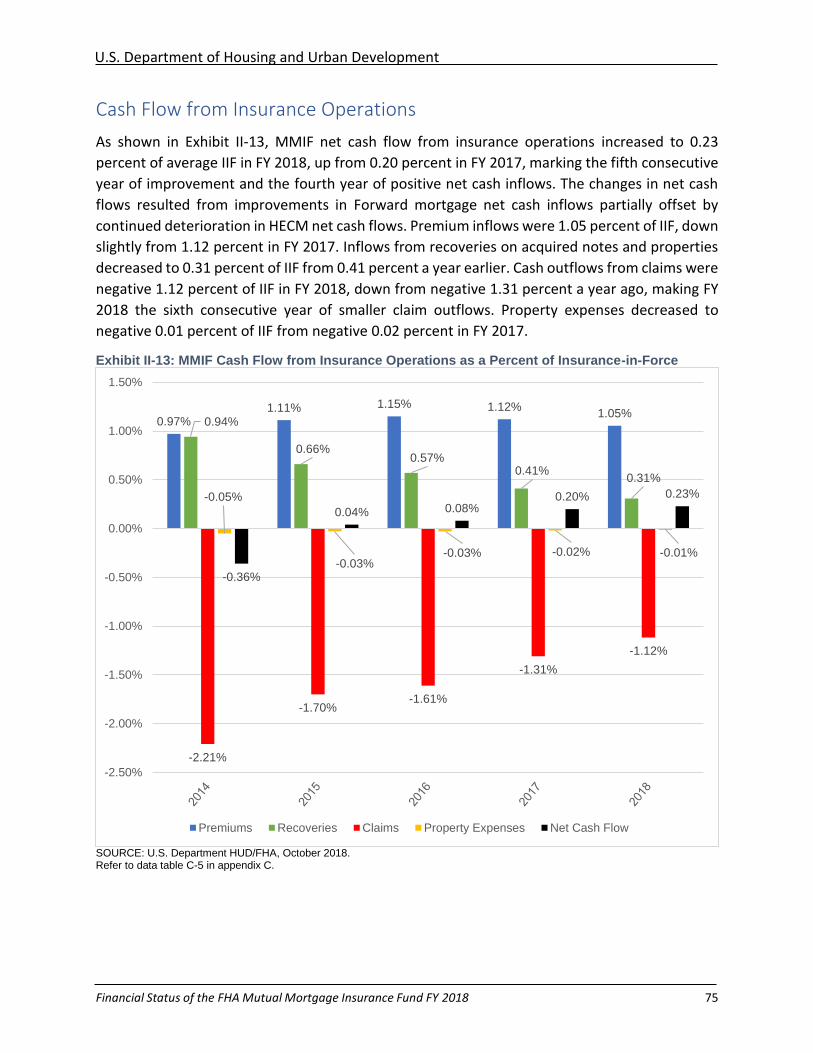
U.S. Department of Housing and Urban Development
Financial Status of the FHA Mutual Mortgage Insurance Fund FY 2018 75
Cash Flow from Insurance Operations
As shown in Exhibit II-13, MMIF net cash flow from insurance operations increased to 0.23
percent of average IIF in FY 2018, up from 0.20 percent in FY 2017, marking the fifth consecutive
year of improvement and the fourth year of positive net cash inflows. The changes in net cash
flows resulted from improvements in Forward mortgage net cash inflows partially offset by
continued deterioration in HECM net cash flows. Premium inflows were 1.05 percent of IIF, down
slightly from 1.12 percent in FY 2017. Inflows from recoveries on acquired notes and properties
decreased to 0.31 percent of IIF from 0.41 percent a year earlier. Cash outflows from claims were
negative 1.12 percent of IIF in FY 2018, down from negative 1.31 percent a year ago, making FY
2018 the sixth consecutive year of smaller claim outflows. Property expenses decreased to
negative 0.01 percent of IIF from negative 0.02 percent in FY 2017.
Exhibit II-13: MMIF Cash Flow from Insurance Operations as a Percent of Insurance-in-Force
SOURCE: U.S. Department HUD/FHA, October 2018. Refer to data table C-5 in appendix C.
0.97%1.11% 1.15% 1.12%
1.05%0.94%
0.66%0.57%
0.41%0.31%
-2.21%
-1.70%-1.61%
-1.31%
-1.12%
-0.05%
-0.03%-0.03% -0.02% -0.01%
-0.36%
0.04% 0.08%0.20% 0.23%
-2.50%
-2.00%
-1.50%
-1.00%
-0.50%
0.00%
0.50%
1.00%
1.50%
Premiums Recoveries Claims Property Expenses Net Cash Flow
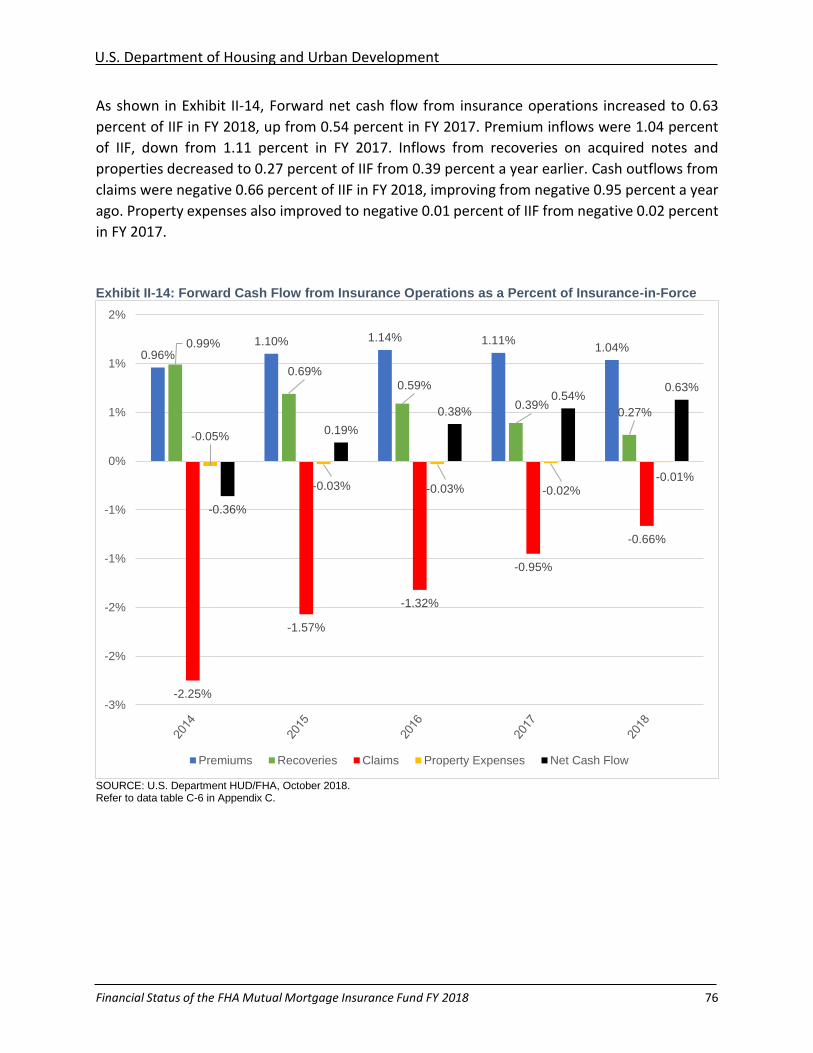
U.S. Department of Housing and Urban Development
Financial Status of the FHA Mutual Mortgage Insurance Fund FY 2018 76
As shown in Exhibit II-14, Forward net cash flow from insurance operations increased to 0.63
percent of IIF in FY 2018, up from 0.54 percent in FY 2017. Premium inflows were 1.04 percent
of IIF, down from 1.11 percent in FY 2017. Inflows from recoveries on acquired notes and
properties decreased to 0.27 percent of IIF from 0.39 percent a year earlier. Cash outflows from
claims were negative 0.66 percent of IIF in FY 2018, improving from negative 0.95 percent a year
ago. Property expenses also improved to negative 0.01 percent of IIF from negative 0.02 percent
in FY 2017.
Exhibit II-14: Forward Cash Flow from Insurance Operations as a Percent of Insurance-in-Force
SOURCE: U.S. Department HUD/FHA, October 2018. Refer to data table C-6 in Appendix C.
0.96%1.10% 1.14% 1.11%
1.04%0.99%
0.69%
0.59%
0.39%0.27%
-2.25%
-1.57%
-1.32%
-0.95%
-0.66%
-0.05%
-0.03% -0.03% -0.02%-0.01%
-0.36%
0.19%
0.38%
0.54%0.63%
-3%
-2%
-2%
-1%
-1%
0%
1%
1%
2%
Premiums Recoveries Claims Property Expenses Net Cash Flow
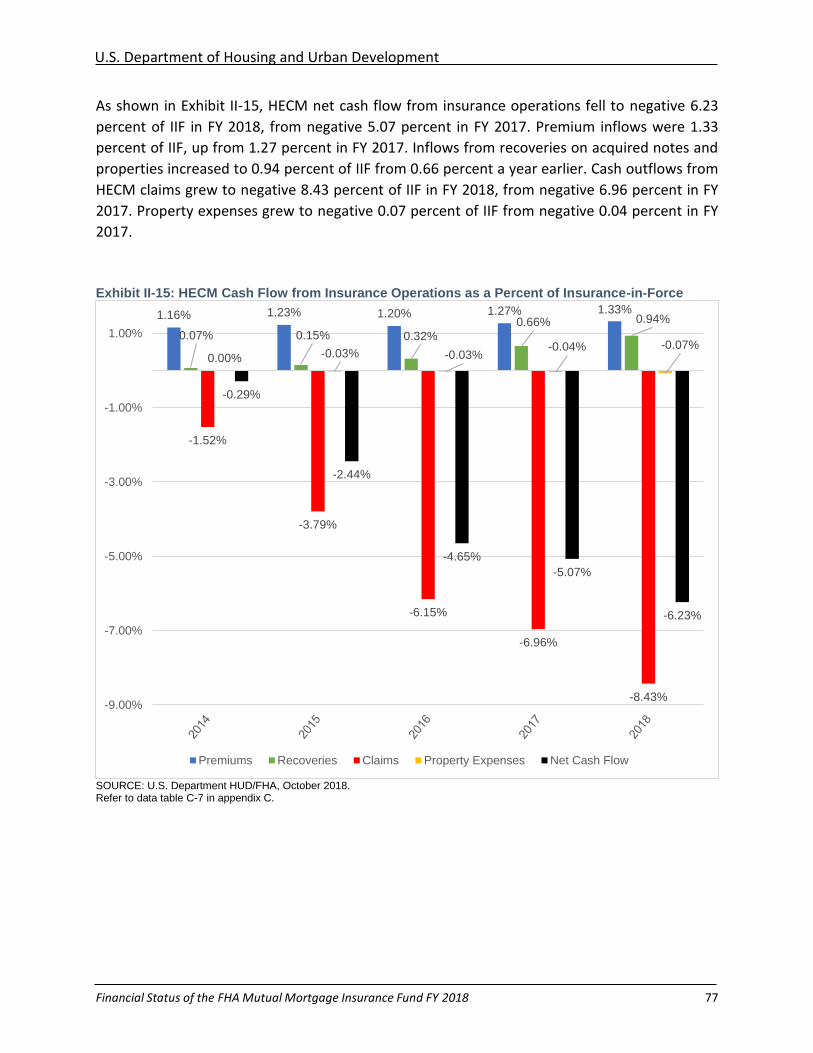
U.S. Department of Housing and Urban Development
Financial Status of the FHA Mutual Mortgage Insurance Fund FY 2018 77
As shown in Exhibit II-15, HECM net cash flow from insurance operations fell to negative 6.23
percent of IIF in FY 2018, from negative 5.07 percent in FY 2017. Premium inflows were 1.33
percent of IIF, up from 1.27 percent in FY 2017. Inflows from recoveries on acquired notes and
properties increased to 0.94 percent of IIF from 0.66 percent a year earlier. Cash outflows from
HECM claims grew to negative 8.43 percent of IIF in FY 2018, from negative 6.96 percent in FY
2017. Property expenses grew to negative 0.07 percent of IIF from negative 0.04 percent in FY
2017.
Exhibit II-15: HECM Cash Flow from Insurance Operations as a Percent of Insurance-in-Force
SOURCE: U.S. Department HUD/FHA, October 2018. Refer to data table C-7 in appendix C.
1.16% 1.23% 1.20% 1.27% 1.33%
0.07% 0.15% 0.32%
0.66% 0.94%
-1.52%
-3.79%
-6.15%
-6.96%
-8.43%
0.00% -0.03% -0.03%-0.04% -0.07%
-0.29%
-2.44%
-4.65%
-5.07%
-6.23%
-9.00%
-7.00%
-5.00%
-3.00%
-1.00%
1.00%
Premiums Recoveries Claims Property Expenses Net Cash Flow
U.S. Department of Housing and Urban Development
Financial Status of the FHA Mutual Mortgage Insurance Fund FY 2018 78
Capital Ratio Sensitivity to Assumptions
Consistent with the Federal Credit Reform Act of 1990 (FCRA), the Net Present Value (NPV) of
future MMIF cash flows was estimated using the underlying economic assumptions in the
President’s FY 2018 Mid-Session Review. These assumptions set the future path of interest rates
and house price appreciation, both of which influence future cash flows to and from MMIF
insurance operations. Changes in these critical assumptions revise the estimated NPV of future
cash flows and therefore the Economic Net Worth of the MMIF. Economic Net Worth of the
MMIF in FY 2018 totaled $34.86 billion, comprising $49.24 billion in Total Capital Resources offset
by negative $14.38 billion in Cash Flow NPV.
One method used to test the sensitivity of the MMIF Capital Ratio to changing economic
conditions is to shift the future path of home prices and interest rates upward and downward by
equal amounts. This analysis, summarized in Exhibit II-16, shows that a one percent parallel
upward shift in future interest rates would increase the MMIF Capital Ratio to 2.95 percent from
2.76 percent, and a one percent downward shift in interest rates would reduce the Capital Ratio
to 2.56 percent. Compared with interest rates, the MMIF Capital Ratio is relatively more sensitive
to changes in house prices. A one percent upward shift in the long-term rate of house price
appreciation would increase the MMIF Capital Ratio to 3.89 percent. Conversely, a one percent
downward shift in the long-term rate of house price appreciation would cause the MMIF Capital
Ratio to fall to 1.36 percent, well below the 2.00 percent minimum requirement.
On a stand-alone basis, the Forward portfolio is less sensitive to changes in assumptions than the
MMIF overall. A one percent parallel upward shift in future interest rates would increase the
Forward portfolio Capital Ratio to 4.25 percent from 3.93 percent, and a one percent downward
shift in interest rates would reduce the Forward portfolio capital ratio to 3.56 percent. A one
percent upward shift in the long-term rate of house price appreciation would increase the
Forward portfolio capital ratio to 4.60 percent. Conversely, a one percent downward shift in the
long-term rate of house price appreciation would cause the forward portfolio capital ratio to fall
to 2.92 percent, remaining above the 2.00 percent minimum statutory requirement.
On a stand-alone basis, HECM is considerably more sensitive to changes in assumptions than the
MMIF overall. A one percent parallel upward shift in future interest rates would shift the HECM
stand-alone capital ratio to negative 20.82 percent from negative 18.83 percent, and a one
percent downward shift in interest rates would improve the HECM portfolio capital ratio to
negative 16.25 percent. The greater sensitivity of the HECM portfolio to a change in interest rates
than the Forward portfolio reflects the fact that many HECMs have adjustable rates. Higher
interest rates increase the rate at which HECM mortgage balances grow, reducing equity in the
home at a faster rate and increasing losses to FHA. A one percent upward shift in the long-term
rate of house price appreciation would improve the HECM capital ratio to negative 10.12 percent.
Conversely, a one percent downward shift in the long-term rate of house price appreciation
would cause the HECM capital ratio to deteriorate to negative 26.73 percent.
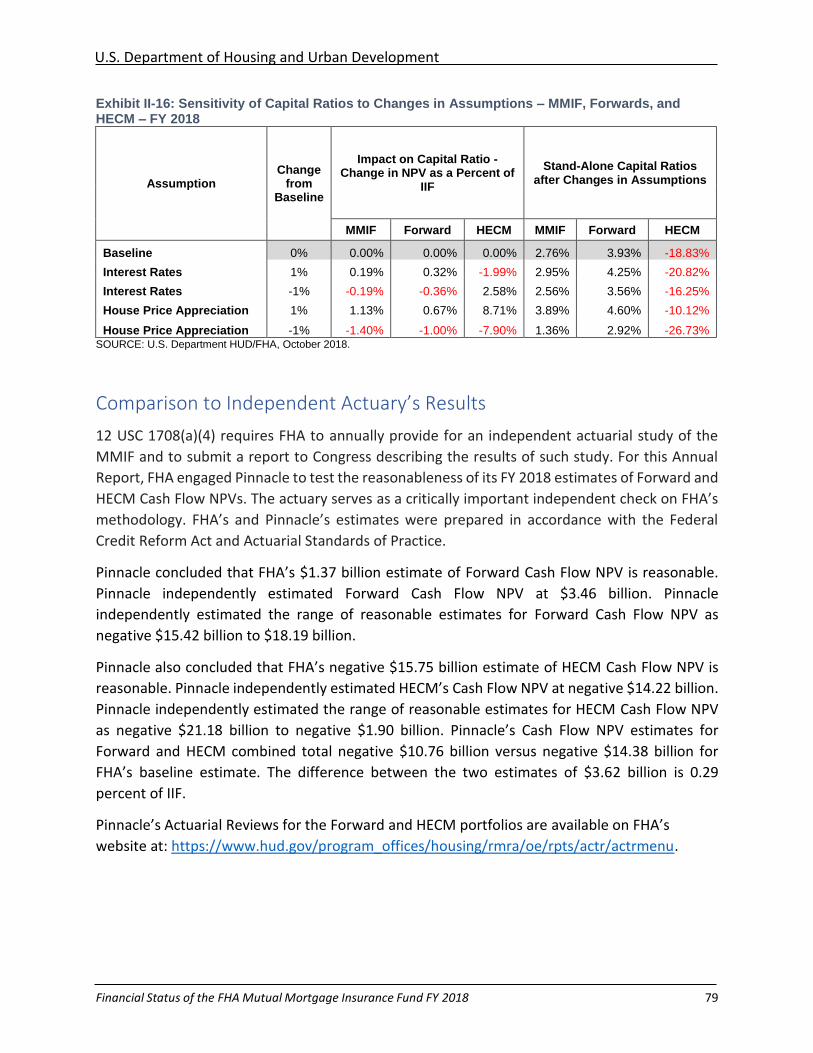
U.S. Department of Housing and Urban Development
Financial Status of the FHA Mutual Mortgage Insurance Fund FY 2018 79
Exhibit II-16: Sensitivity of Capital Ratios to Changes in Assumptions – MMIF, Forwards, and HECM – FY 2018
Assumption Change
from Baseline
Impact on Capital Ratio - Change in NPV as a Percent of
IIF
Stand-Alone Capital Ratios after Changes in Assumptions
MMIF Forward HECM MMIF Forward HECM
Baseline 0% 0.00% 0.00% 0.00% 2.76% 3.93% -18.83%
Interest Rates 1% 0.19% 0.32% -1.99% 2.95% 4.25% -20.82%
Interest Rates -1% -0.19% -0.36% 2.58% 2.56% 3.56% -16.25%
House Price Appreciation 1% 1.13% 0.67% 8.71% 3.89% 4.60% -10.12%
House Price Appreciation -1% -1.40% -1.00% -7.90% 1.36% 2.92% -26.73% SOURCE: U.S. Department HUD/FHA, October 2018.
Comparison to Independent Actuary’s Results
12 USC 1708(a)(4) requires FHA to annually provide for an independent actuarial study of the
MMIF and to submit a report to Congress describing the results of such study. For this Annual
Report, FHA engaged Pinnacle to test the reasonableness of its FY 2018 estimates of Forward and
HECM Cash Flow NPVs. The actuary serves as a critically important independent check on FHA’s
methodology. FHA’s and Pinnacle’s estimates were prepared in accordance with the Federal
Credit Reform Act and Actuarial Standards of Practice.
Pinnacle concluded that FHA’s $1.37 billion estimate of Forward Cash Flow NPV is reasonable.
Pinnacle independently estimated Forward Cash Flow NPV at $3.46 billion. Pinnacle
independently estimated the range of reasonable estimates for Forward Cash Flow NPV as
negative $15.42 billion to $18.19 billion.
Pinnacle also concluded that FHA’s negative $15.75 billion estimate of HECM Cash Flow NPV is
reasonable. Pinnacle independently estimated HECM’s Cash Flow NPV at negative $14.22 billion.
Pinnacle independently estimated the range of reasonable estimates for HECM Cash Flow NPV
as negative $21.18 billion to negative $1.90 billion. Pinnacle’s Cash Flow NPV estimates for
Forward and HECM combined total negative $10.76 billion versus negative $14.38 billion for
FHA’s baseline estimate. The difference between the two estimates of $3.62 billion is 0.29
percent of IIF.
Pinnacle’s Actuarial Reviews for the Forward and HECM portfolios are available on FHA’s
website at: https://www.hud.gov/program_offices/housing/rmra/oe/rpts/actr/actrmenu.
U.S. Department of Housing and Urban Development
Financial Status of the FHA Mutual Mortgage Insurance Fund FY 2018 80
Capital Adequacy
Capital Adequacy Testing: Distribution of Cash Flow NPV
The baseline value of the MMIF’s Economic Net Worth presented in Exhibit II-1 of this report is
estimated using a single economic scenario. The purpose of the MMIF capital adequacy tests
reported in this section is to assess the MMIF’s capacity to absorb risk under varying economic
conditions, including scenarios that are more stressful than those reflected in the baseline
assumptions. The MMIF Economic Net Worth and Capital Ratio depend critically upon Cash Flow
NPV, which is uncertain because Cash Flow NPV varies with the performance of the insured
mortgages which, in turn, varies with economic conditions. The distribution of the resulting gains
and losses compared with current Capital Resources determines the adequacy of the MMIF’s
current capital to bear risk. Understanding this distribution is a step toward understanding the
MMIF’s capital adequacy.
To analyze Cash Flow NPV and the resulting impact on MMIF Capital Ratios, historical 30-year
economic scenarios were constructed from actual coincident quarterly changes in interest rates
and house prices starting in 1954 and continuing through 2008. Scenarios with less than 30 years
of actual results were completed using the President’s FY 2018 Mid-Session Review budget
assumptions, but no scenario has less than eight years of actual historical data. Generally, the
economic conditions experienced by a mortgage during its initial three to seven years are most
impactful to how that mortgage will perform. One hundred of these scenarios were selected
randomly and used to test changes in Cash Flow NPV and the resulting MMIF Capital Ratio.
Testing was carried out by substituting the actual quarter-by-quarter changes in interest rates
and house prices of each scenario for the economic assumptions underlying the President’s FY
2018 Mid-Session Review budget.
The results of the scenarios tested reveal that the MMIF faces an asymmetrical distribution of
risk and return as shown in Exhibit II-17. Potential gains in Cash Flow NPV are limited by mortgage
pre-payments but decreases in Cash Flow NPV may be catastrophic. In the 100 historical
scenarios tested the second worst loss is almost four times larger than the second best gain, and
the fifth worst loss is almost two times larger than the fifth best gain.
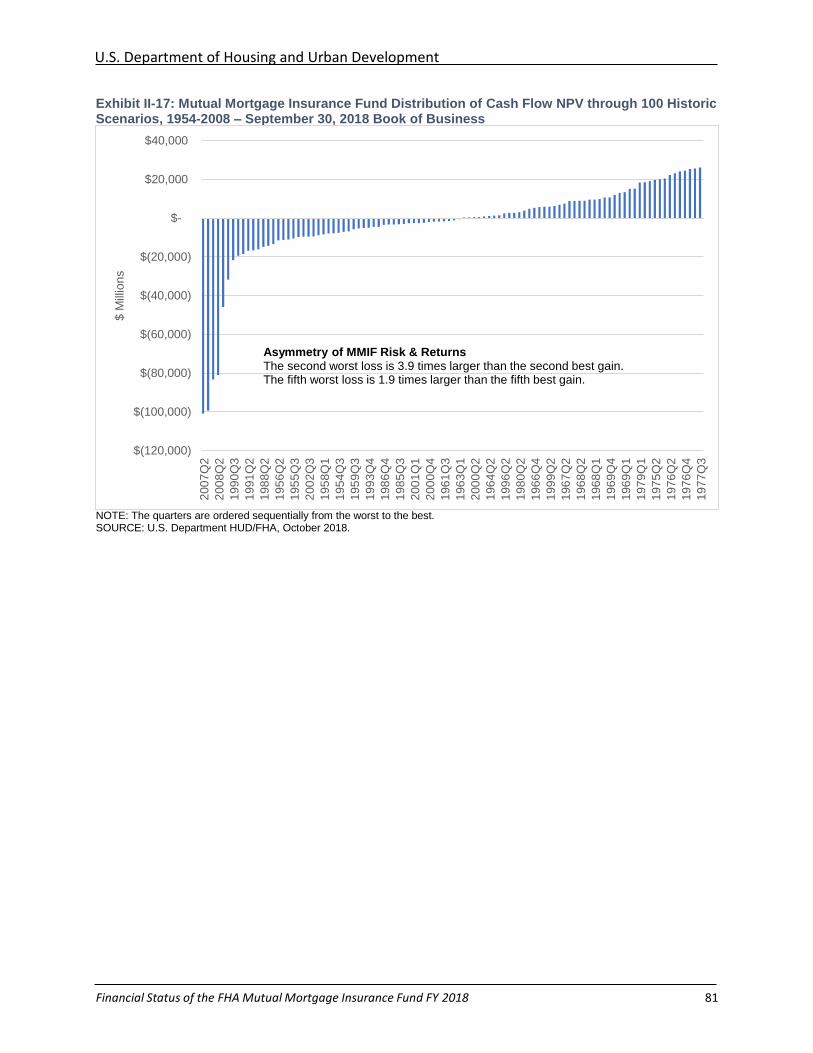
U.S. Department of Housing and Urban Development
Financial Status of the FHA Mutual Mortgage Insurance Fund FY 2018 81
Exhibit II-17: Mutual Mortgage Insurance Fund Distribution of Cash Flow NPV through 100 Historic Scenarios, 1954-2008 – September 30, 2018 Book of Business
NOTE: The quarters are ordered sequentially from the worst to the best. SOURCE: U.S. Department HUD/FHA, October 2018.
$(120,000)
$(100,000)
$(80,000)
$(60,000)
$(40,000)
$(20,000)
$-
$20,000
$40,000
200
7Q
2
200
8Q
2
199
0Q
3
199
1Q
2
198
8Q
2
195
6Q
2
195
5Q
3
200
2Q
3
195
8Q
1
195
4Q
3
195
9Q
3
199
3Q
4
198
6Q
4
198
5Q
3
200
1Q
1
200
0Q
4
196
1Q
3
196
3Q
1
200
0Q
2
196
4Q
2
199
6Q
2
198
0Q
2
196
6Q
4
199
9Q
2
196
7Q
2
196
8Q
2
196
8Q
1
196
9Q
4
196
9Q
1
197
9Q
1
197
5Q
2
197
6Q
2
197
6Q
4
197
7Q
3
$ M
illio
ns
Asymmetry of MMIF Risk & ReturnsThe second worst loss is 3.9 times larger than the second best gain.The fifth worst loss is 1.9 times larger than the fifth best gain.
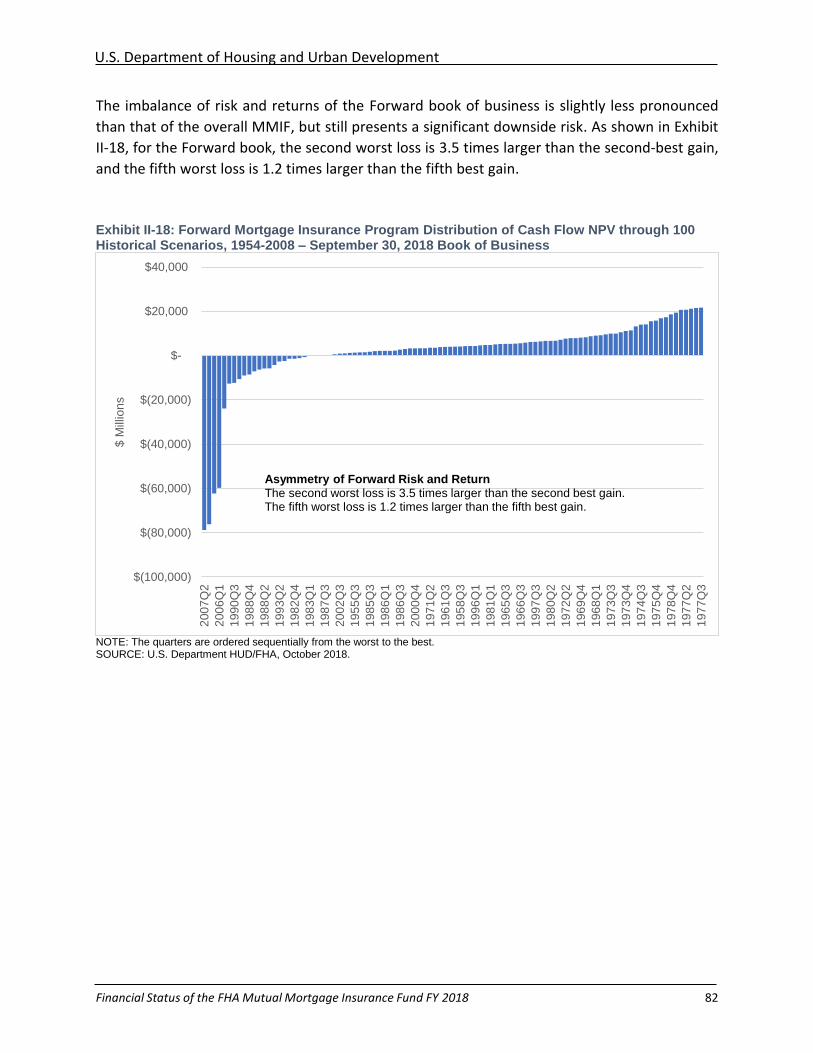
U.S. Department of Housing and Urban Development
Financial Status of the FHA Mutual Mortgage Insurance Fund FY 2018 82
The imbalance of risk and returns of the Forward book of business is slightly less pronounced
than that of the overall MMIF, but still presents a significant downside risk. As shown in Exhibit
II-18, for the Forward book, the second worst loss is 3.5 times larger than the second-best gain,
and the fifth worst loss is 1.2 times larger than the fifth best gain.
Exhibit II-18: Forward Mortgage Insurance Program Distribution of Cash Flow NPV through 100 Historical Scenarios, 1954-2008 – September 30, 2018 Book of Business
NOTE: The quarters are ordered sequentially from the worst to the best. SOURCE: U.S. Department HUD/FHA, October 2018.
$(100,000)
$(80,000)
$(60,000)
$(40,000)
$(20,000)
$-
$20,000
$40,000
200
7Q
2
200
6Q
1
199
0Q
3
198
8Q
4
198
8Q
2
199
3Q
2
198
2Q
4
198
3Q
1
198
7Q
3
200
2Q
3
195
5Q
3
198
5Q
3
198
6Q
1
198
6Q
3
200
0Q
4
197
1Q
2
196
1Q
3
195
8Q
3
199
6Q
1
198
1Q
1
196
5Q
3
196
6Q
3
199
7Q
3
198
0Q
2
197
2Q
2
196
9Q
4
196
8Q
1
197
3Q
3
197
3Q
4
197
4Q
3
197
5Q
4
197
8Q
4
197
7Q
2
197
7Q
3
$ M
illio
ns
Asymmetry of Forward Risk and ReturnThe second worst loss is 3.5 times larger than the second best gain.The fifth worst loss is 1.2 times larger than the fifth best gain.
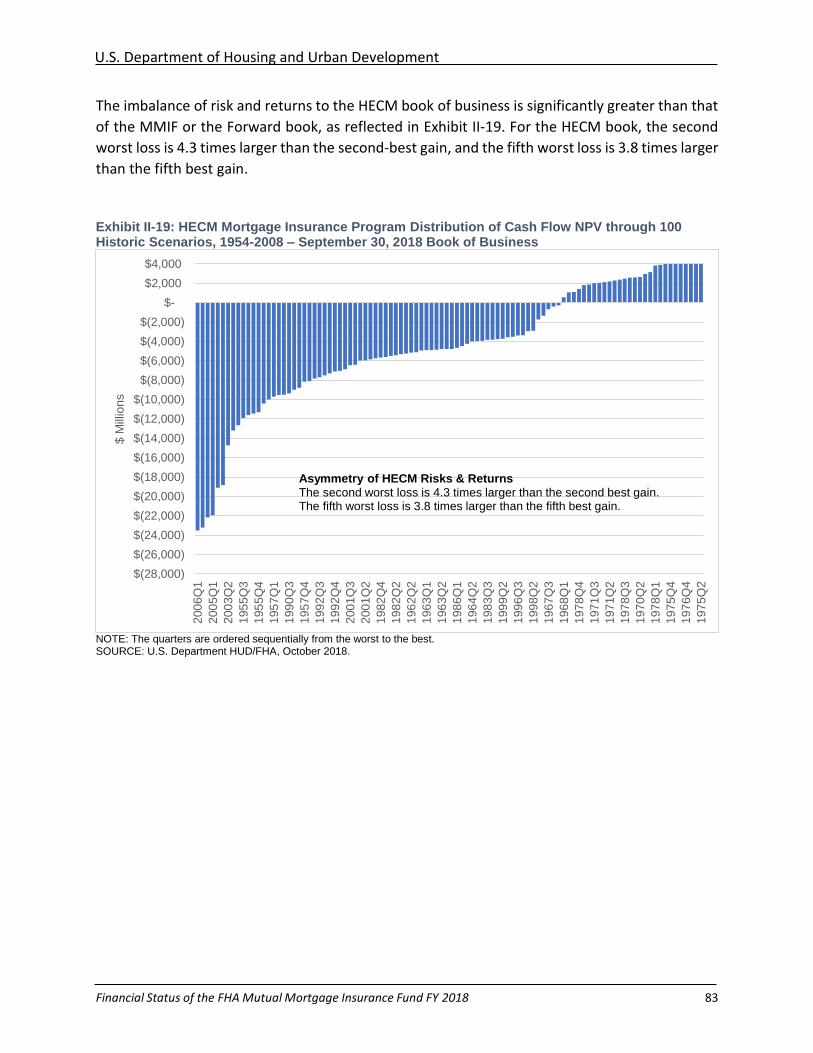
U.S. Department of Housing and Urban Development
Financial Status of the FHA Mutual Mortgage Insurance Fund FY 2018 83
The imbalance of risk and returns to the HECM book of business is significantly greater than that
of the MMIF or the Forward book, as reflected in Exhibit II-19. For the HECM book, the second
worst loss is 4.3 times larger than the second-best gain, and the fifth worst loss is 3.8 times larger
than the fifth best gain.
Exhibit II-19: HECM Mortgage Insurance Program Distribution of Cash Flow NPV through 100 Historic Scenarios, 1954-2008 – September 30, 2018 Book of Business
NOTE: The quarters are ordered sequentially from the worst to the best. SOURCE: U.S. Department HUD/FHA, October 2018.
$(28,000)
$(26,000)
$(24,000)
$(22,000)
$(20,000)
$(18,000)
$(16,000)
$(14,000)
$(12,000)
$(10,000)
$(8,000)
$(6,000)
$(4,000)
$(2,000)
$-
$2,000
$4,000
200
6Q
1
200
5Q
1
200
3Q
2
195
5Q
3
195
5Q
4
195
7Q
1
199
0Q
3
195
7Q
4
199
2Q
3
199
2Q
4
200
1Q
3
200
1Q
2
198
2Q
4
198
2Q
2
196
2Q
2
196
3Q
1
196
3Q
2
198
6Q
1
196
4Q
2
198
3Q
3
199
9Q
2
199
6Q
3
199
8Q
2
196
7Q
3
196
8Q
1
197
8Q
4
197
1Q
3
197
1Q
2
197
8Q
3
197
0Q
2
197
8Q
1
197
5Q
4
197
6Q
4
197
5Q
2
$ M
illio
ns
Asymmetry of HECM Risks & ReturnsThe second worst loss is 4.3 times larger than the second best gain.The fifth worst loss is 3.8 times larger than the fifth best gain.
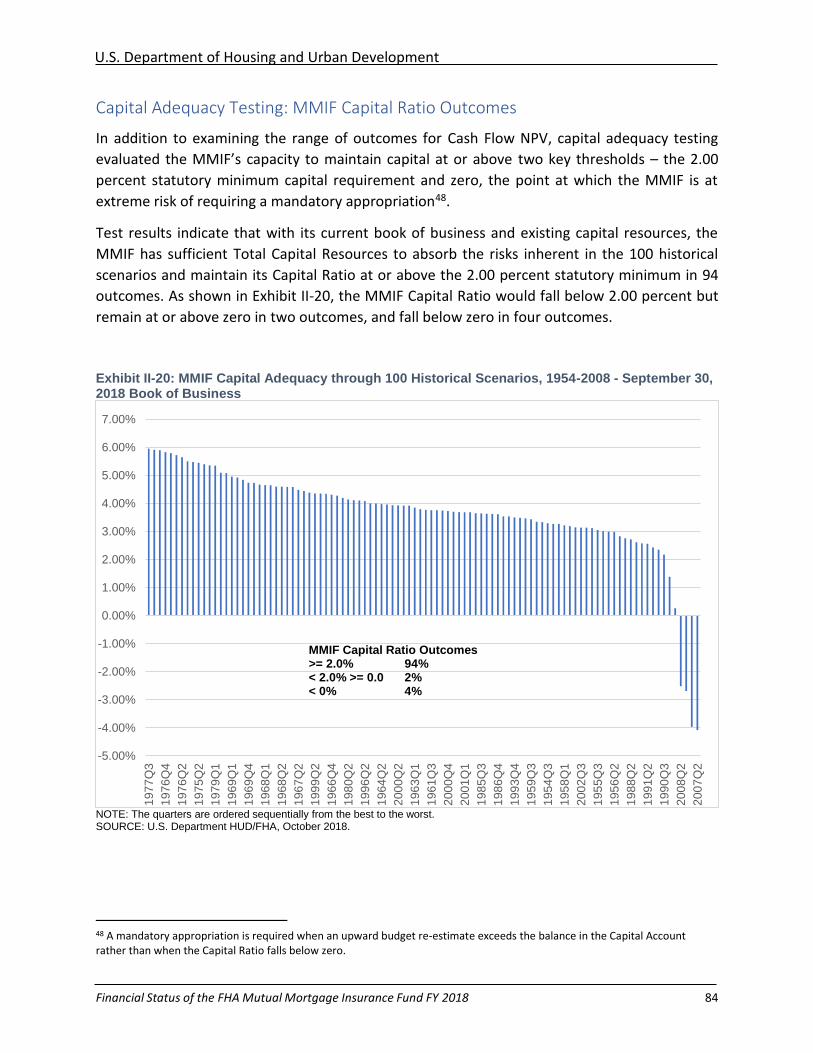
U.S. Department of Housing and Urban Development
Financial Status of the FHA Mutual Mortgage Insurance Fund FY 2018 84
Capital Adequacy Testing: MMIF Capital Ratio Outcomes
In addition to examining the range of outcomes for Cash Flow NPV, capital adequacy testing
evaluated the MMIF’s capacity to maintain capital at or above two key thresholds – the 2.00
percent statutory minimum capital requirement and zero, the point at which the MMIF is at
extreme risk of requiring a mandatory appropriation48.
Test results indicate that with its current book of business and existing capital resources, the
MMIF has sufficient Total Capital Resources to absorb the risks inherent in the 100 historical
scenarios and maintain its Capital Ratio at or above the 2.00 percent statutory minimum in 94
outcomes. As shown in Exhibit II-20, the MMIF Capital Ratio would fall below 2.00 percent but
remain at or above zero in two outcomes, and fall below zero in four outcomes.
Exhibit II-20: MMIF Capital Adequacy through 100 Historical Scenarios, 1954-2008 - September 30, 2018 Book of Business
NOTE: The quarters are ordered sequentially from the best to the worst. SOURCE: U.S. Department HUD/FHA, October 2018.
48 A mandatory appropriation is required when an upward budget re-estimate exceeds the balance in the Capital Account rather than when the Capital Ratio falls below zero.
-5.00%
-4.00%
-3.00%
-2.00%
-1.00%
0.00%
1.00%
2.00%
3.00%
4.00%
5.00%
6.00%
7.00%
197
7Q
3
197
6Q
4
197
6Q
2
197
5Q
2
197
9Q
1
196
9Q
1
196
9Q
4
196
8Q
1
196
8Q
2
196
7Q
2
199
9Q
2
196
6Q
4
198
0Q
2
199
6Q
2
196
4Q
2
200
0Q
2
196
3Q
1
196
1Q
3
200
0Q
4
200
1Q
1
198
5Q
3
198
6Q
4
199
3Q
4
195
9Q
3
195
4Q
3
195
8Q
1
200
2Q
3
195
5Q
3
195
6Q
2
198
8Q
2
199
1Q
2
199
0Q
3
200
8Q
2
200
7Q
2
MMIF Capital Ratio Outcomes >= 2.0% 94% < 2.0% >= 0.0 2% < 0% 4%
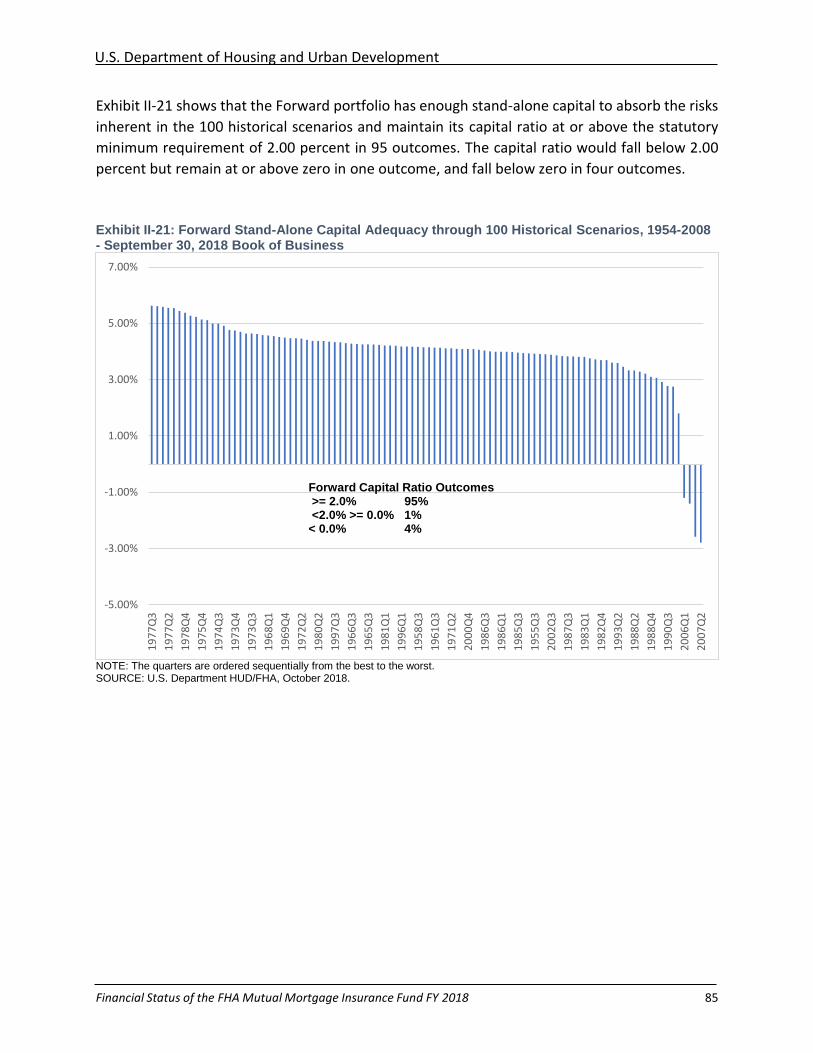
U.S. Department of Housing and Urban Development
Financial Status of the FHA Mutual Mortgage Insurance Fund FY 2018 85
Exhibit II-21 shows that the Forward portfolio has enough stand-alone capital to absorb the risks
inherent in the 100 historical scenarios and maintain its capital ratio at or above the statutory
minimum requirement of 2.00 percent in 95 outcomes. The capital ratio would fall below 2.00
percent but remain at or above zero in one outcome, and fall below zero in four outcomes.
Exhibit II-21: Forward Stand-Alone Capital Adequacy through 100 Historical Scenarios, 1954-2008 - September 30, 2018 Book of Business
NOTE: The quarters are ordered sequentially from the best to the worst. SOURCE: U.S. Department HUD/FHA, October 2018.
-5.00%
-3.00%
-1.00%
1.00%
3.00%
5.00%
7.00%
19
77
Q3
19
77
Q2
19
78
Q4
19
75
Q4
19
74
Q3
19
73
Q4
19
73
Q3
19
68
Q1
19
69
Q4
19
72
Q2
19
80
Q2
19
97
Q3
19
66
Q3
19
65
Q3
19
81
Q1
19
96
Q1
19
58
Q3
19
61
Q3
19
71
Q2
20
00
Q4
19
86
Q3
19
86
Q1
19
85
Q3
19
55
Q3
20
02
Q3
19
87
Q3
19
83
Q1
19
82
Q4
19
93
Q2
19
88
Q2
19
88
Q4
19
90
Q3
20
06
Q1
20
07
Q2
Forward Capital Ratio Outcomes>= 2.0% 95%<2.0% >= 0.0% 1%
< 0.0% 4%
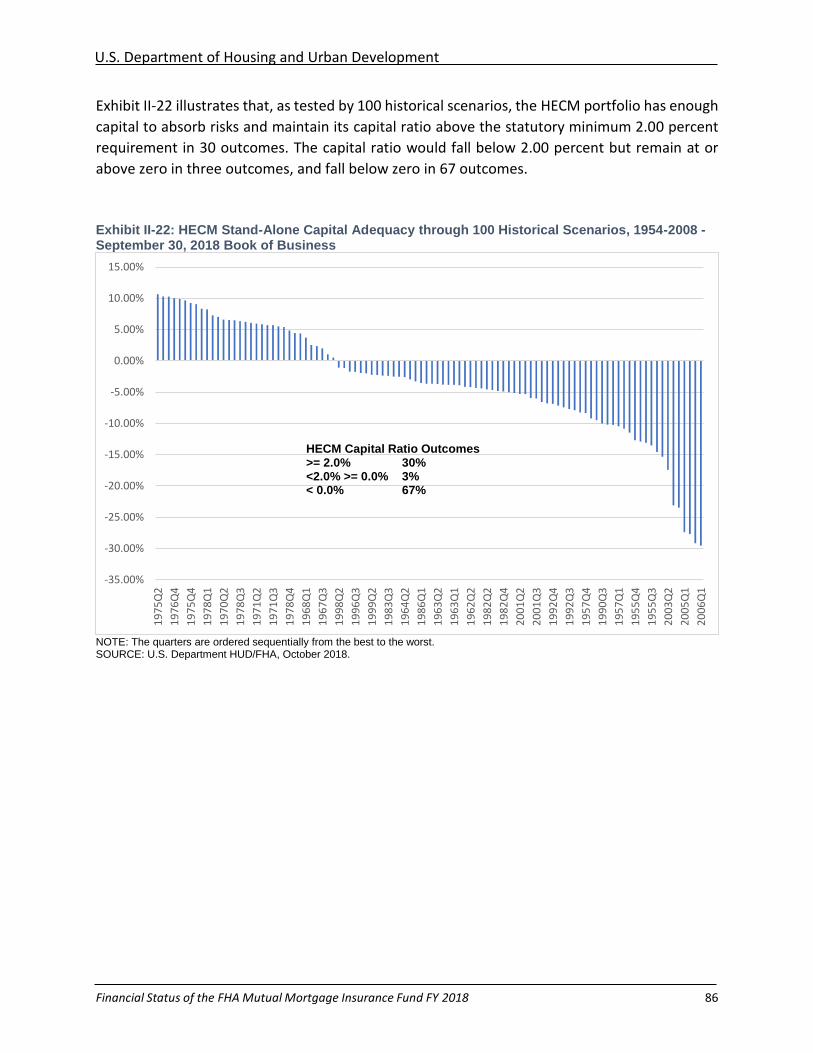
U.S. Department of Housing and Urban Development
Financial Status of the FHA Mutual Mortgage Insurance Fund FY 2018 86
Exhibit II-22 illustrates that, as tested by 100 historical scenarios, the HECM portfolio has enough
capital to absorb risks and maintain its capital ratio above the statutory minimum 2.00 percent
requirement in 30 outcomes. The capital ratio would fall below 2.00 percent but remain at or
above zero in three outcomes, and fall below zero in 67 outcomes.
Exhibit II-22: HECM Stand-Alone Capital Adequacy through 100 Historical Scenarios, 1954-2008 - September 30, 2018 Book of Business
NOTE: The quarters are ordered sequentially from the best to the worst. SOURCE: U.S. Department HUD/FHA, October 2018.
-35.00%
-30.00%
-25.00%
-20.00%
-15.00%
-10.00%
-5.00%
0.00%
5.00%
10.00%
15.00%
19
75
Q2
19
76
Q4
19
75
Q4
19
78
Q1
19
70
Q2
19
78
Q3
19
71
Q2
19
71
Q3
19
78
Q4
19
68
Q1
19
67
Q3
19
98
Q2
19
96
Q3
19
99
Q2
19
83
Q3
19
64
Q2
19
86
Q1
19
63
Q2
19
63
Q1
19
62
Q2
19
82
Q2
19
82
Q4
20
01
Q2
20
01
Q3
19
92
Q4
19
92
Q3
19
57
Q4
19
90
Q3
19
57
Q1
19
55
Q4
19
55
Q3
20
03
Q2
20
05
Q1
20
06
Q1
HECM Capital Ratio Outcomes>= 2.0% 30%<2.0% >= 0.0% 3%< 0.0% 67%
U.S. Department of Housing and Urban Development
Financial Status of the FHA Mutual Mortgage Insurance Fund FY 2018 87
Chapter III:
Federal Housing Administration Objectives
FHA conducts business by balancing its obligation to protect the Mutual Mortgage Insurance
Fund (MMIF) and providing American taxpayers with affordable, sustainable homeownership
opportunities to creditworthy borrowers. FHA operated throughout FY 2018 cognizant of this
critical balance, and will continue to do so in FY 2019.
FHA’s Significant Role in Disaster Recovery
The fall of 2017 marked one of the worst periods of natural disaster in the Nation’s history. In the
wake of Hurricanes Irma, Harvey, Maria, and the California wildfires and mudslides, FHA has
played a significant role in relief and recovery efforts in affected areas, while taking immediate
actions to protect FHA’s assets and financial exposure. To assist homeowners with FHA-insured
mortgages who live or work in Presidentially-Declared Major Disaster Areas (PDMDAs), FHA
provided an initial 90-day moratorium on foreclosures for Forward mortgages, and subsequently
extended the moratorium for an additional 90 days for properties located in certain PDMDAs
receiving Individual Assistance within Hurricane Harvey, Irma, and Maria impacted areas.
Recognizing the substantial damage caused by Hurricane Maria, FHA further extended the
foreclosure moratorium for 60 days for all borrowers and then, an additional 120 days for eligible
borrowers in certain Individual Assistance areas within Hurricane Maria PDMDAs.
For HUD real-estate owned (REO) assets in affected areas, FHA moved quickly to conduct
inspections and secure properties, assess damage, and safeguard these assets.
Further, FHA provided regulatory relief to lenders as they sought to work with their customers
impacted by the disasters. Specifically, FHA waived its requirement that lenders perform quality
control reviews for early payment default (EPD) mortgages in PDMDAs that went into default
following the disaster, recognizing that the EPD was likely caused by the natural disasters rather
than poor underwriting.
As these heavily impacted areas sought to recover from the disasters, FHA provided further
regulatory relief by waiving policies that hindered access to mortgage credit or unnecessarily
burdened borrowers, including the requirement that the re-inspection of properties located in a
disaster area be inspected after FEMA’s incident end date before a mortgage can close or be
endorsed. Where FHA was able to determine that the threat of further property damage
following the disaster had abated, FHA waived this requirement to allow inspections to take place
even though FEMA’s incident end date might not be announced until well after the disaster area
had stabilized. This waiver avoided unnecessary delays in inspecting properties and getting
financing into the hands of borrowers.
U.S. Department of Housing and Urban Development
Financial Status of the FHA Mutual Mortgage Insurance Fund FY 2018 88
Additionally, FHA continues to make available up to 100 percent financing for disaster victims
through its 203(h) Disaster Mortgage Insurance Program.
Enhanced Loss Mitigation for Borrowers Impacted by 2017 Disasters
Loss mitigation enables qualified borrowers to continue to reside in their homes, and may create
a better financial outcome for FHA as loss mitigation is less costly to the MMIF than paying full
mortgage insurance claims following foreclosure. FHA’s primary focus was, and continues to be,
getting delinquent FHA-insured borrowers in disaster areas into permanent loss mitigation
solutions as quickly as possible.
To help facilitate expedited loss mitigation solutions in these disaster areas, FHA issued
Mortgagee Letter 2018-01, Loss Mitigation for Borrowers in the PDMDAs Adversely Impacted by
Hurricanes Harvey, Irma, Maria and Certain California Wildfires in February 2018. Mortgagee
Letter 2018-01 authorized lenders to provide permanent loss mitigation solutions for FHA-
insured homeowners who live or work in areas impacted by Hurricanes Harvey, Irma, and Maria
as well as by the California wildfires and subsequent mudslides, and who had been provided with
temporary loss mitigation post-disaster in the form of forbearance.
A forbearance allows borrowers to suspend or reduce mortgage payments for a period of time
to help them get back on their feet. Mortgage Letter 2018-01 was designed to help address the
debt that resulted from the forbearance through the establishment of the Disaster Standalone
Partial Claim. The Disaster Standalone Partial Claim enables borrowers to resume their pre-
disaster mortgage payment since they will not need to repay arrearages until they sell their home
or refinance their mortgage. The Disaster Standalone Partial Claim amount is the total of the
arrearages in an interest free subordinate mortgage loan. To qualify, borrowers had to be current
with their mortgage payments when the disaster struck, their income must have been equal to
or more than their pre-disaster income, and the property must have been owner-occupied.
Puerto Rico Update
FHA has a significant presence in Puerto Rico and plays a key role in creating access to mortgage
credit in the Commonwealth. In FY 2017, FHA insured 48.7 percent of all purchase mortgages in
the Commonwealth.49 Due to the significant devastation caused by Hurricane Maria and FHA’s
prevalence in the island’s mortgage market, FHA focused significant attention on the recovery of
borrowers on the island.
After Hurricane Maria struck, FHA issued a policy waiver for Puerto Rico to allow borrowers to
make greater use of FHA’s Limited 203(k) Rehabilitation Mortgage Insurance Loan Program.
Specifically, FHA waived the 15-day occupancy requirement for borrowers under the Limited
203(k) program, allowing borrowers to access the less burdensome Limited 203(k) program
49 Home Mortgage Disclosure Act data collection from Calendar Year 2017.
U.S. Department of Housing and Urban Development
Financial Status of the FHA Mutual Mortgage Insurance Fund FY 2018 89
because of the difficulty in finding contractors to complete needed repairs in the normal Limited
203(k) time frames.
As previously noted, FHA provided additional foreclosure moratorium extensions totaling 240
days from the date of the disaster declaration for all FHA borrowers, and an additional 120 days
for borrowers meeting certain conditions in Hurricane Maria PDMDAs receiving Individual
Assistance. FHA also extend the HECM foreclosure timelines from March 19, 2018 through
September 15, 2018, in Individual Assistance Areas within Hurricane Maria PDMDAs.
Further, FHA revised its loss mitigation guidance in response to concerns that significant numbers
of delinquent borrowers with well-seasoned mortgages averaging over 8 years, would not accept
loan modifications in which the amortization period for their mortgage would be recast to a full
thirty-year term. To respond to this concern, FHA issued Mortgagee Letter 2018-05, Updated Loss
Mitigation for Mortgagees Servicing Loans for Borrowers with FHA-insured Mortgages… Located
in the PDMDAs of Puerto Rico and U.S. Virgin Islands, in August 2018. Mortgagee Letter 2018-05
allows lenders to evaluate borrowers in affected areas for the Disaster Standalone Partial Claim
before performing the loan modification review. This change is designed to get more FHA
borrowers into permanent loss mitigation solutions while offsetting risks and costs to FHA. FHA
expects to see an increase permanent loss mitigation uptake resulting from this policy change
before it sunsets on May 1, 2019.
FHA continues to provide training and outreach to servicers to ensure they are understanding
and complying with their obligations to timely perform loss mitigation in accordance with FHA
policies. FHA also conducted outreach to borrowers, including through newspaper articles and
press releases, to remind them of the importance of connecting with their mortgage servicer if
they cannot make their mortgage payment. These efforts are aimed at getting delinquent
borrowers into permanent, sustainable loss mitigation solutions as quickly as possible, thereby
reducing the risk of loss to the MMIF.
Future Impact of Hurricanes and Other Natural Disasters
Between the natural disasters in the fall of 2017, and, more recently, in the aftermath of
Hurricanes Florence and Michael, FHA remains vigilant in monitoring the impact of natural
disasters on the MMIF. Likewise, FHA remains committed to ensuring the most effective loss
mitigation policies are put in place following such disasters to ensure FHA’s exposure does not
result in significant losses to the MMIF.
Strengthening the HECM Program
FHA’s Home Equity Conversion Mortgage (HECM) program has long provided a key financial
resource for aging homeowners by providing seniors an opportunity to stay in their homes and
age in place. To ensure the HECM program remains financially viable, FHA periodically makes
adjustments to the HECM program, based on internal monitoring, evaluation, and analysis, as
well as external research.
U.S. Department of Housing and Urban Development
Financial Status of the FHA Mutual Mortgage Insurance Fund FY 2018 90
On August 29, 2017, FHA published revised initial and annual Mortgage Insurance Premium (MIP)
rates and Principal Limit Factors (PLF) for all HECMs in Mortgagee Letter 2017-12, Home Equity
Conversion Mortgage (HECM) Program: Mortgage Insurance Premium Rates and Principal Limit
Factors. These changes were necessary to ensure the HECM program could operate on a self-
sustaining basis without requiring an appropriated subsidy.
Under Mortgagee Letter 2017-12, the initial MIP rate changed to two percent (2.00%) of the
Maximum Claim Amount (MCA). The initial MIP rate is applicable to all borrowers and is no longer
associated with disbursements made to or on behalf of the borrower at closing or during the first
12-month disbursement period. The annual MIP rate was reduced to one-half of one percent
(0.50%) of the outstanding mortgage balance.
Further, FHA revised PLFs with case numbers issued on or after October 2, 2017, in an effort to
improve the financial condition of the HECM program. However, as a result of HECM
endorsements with case numbers issued prior to October 2, 2017, the full impact from lower
PLFs was not recognized until September 2018 when nearly 100 percent of new HECMs were
endorsed under the new PLFs. As a result of the change, PLFs as a share of MCA declined through
the course of FY 2018 from approximately 60 percent in October 2017 to slightly above 50
percent in September 2018. Lower PLFs as a share of MCA enable borrowers to maintain equity
while reducing risk to the MMIF. (See Chapter I, Exhibit I-34).
HECM Appraisal Accuracy
During FY 2018, FHA became aware of concerns with the accuracy of appraisals used to originate
HECMs. A comparison of over 80,000 HECMs endorsed between 2016 and 2018 strongly
suggested that certain appraisals used in FHA’s HECM program were overvaluing the collateral
and generating inflated property appraised values. Over this period, 21 percent of the population
had an appraisal that was 10 percent or more above the automated valuation model (AVM)
estimate. Over the same period, nine percent of appraisals were inflated by 20 percent or more,
and four percent of appraisals were inflated by more than 30 percent (see Exhibit I-39, Chapter
1.) An AVM is a tool that provides an alternative estimate of a property’s value based upon its’
characteristics and a broad database of historical home sale price data.
Due to the non-recourse nature of the HECM and the key role of the appraisal in determining the
amount of principal to be made available to a borrower, FHA determined that the risk of loss
resulting from an overvalued appraisal warranted the introduction of additional safeguards to
prevent inflated appraisals from being used in connection with HECM transactions.50
On September 28, 2018, FHA published revised appraisal requirements in Mortgagee Letter
2018-06, Home Equity Conversion Mortgage (HECM) Program – Changes to Appraisal Submission
50 Originating a HECM based on an inflated appraisal means that borrowers will be able to draw more based on the increased
Principal Limit, leaving less equity in the property. This is a risky outcome for FHA because FHA pays a claim filed by a lender when
the mortgage amount exceeds the appraised value of the property.
U.S. Department of Housing and Urban Development
Financial Status of the FHA Mutual Mortgage Insurance Fund FY 2018 91
and Assessment for all HECM Originations. This Mortgagee Letter requires that a second appraisal
be obtained where an FHA-performed collateral risk assessment of the first appraisal determines
that additional support for the collateral valuation is required. The lender must use the lowest
appraised value obtained in originating the HECM. The provisions of this Mortgagee Letter are
effective for all HECM originations with FHA case numbers issued on or after October 1, 2018
through September 30, 2019. FHA will later determine if the appraisal review process should
continue after FY 2019.
Downpayment Assistance Programs in Conjunction with FHA-insured
Mortgages
FHA continues to review the risks, benefits, and policy considerations of downpayment
assistance (DPA) programs used in connection with FHA-insured mortgages.
To qualify a mortgage for FHA mortgage insurance, the homebuyer is required to meet the 3.5
percent downpayment minimum. FHA permits the borrower to receive a gift or utilize
secondary financing from permissible governmental entities— i.e., Federal, State, and local
entities and their agencies and instrumentalities – to satisfy the 3.5 percent minimum cash
investment requirement, provided that the source does not constitute a “prohibited source”
under section 203(b)(9)(c) of the National Housing Act (NHA).
The “prohibited source” provision came about after a lengthy attempt by FHA to restrict the
damaging seller-funded downpayment programs in operation between 2000 and 2008.
According to an Actuarial report on FHA’s Forward mortgages from fiscal year 2016, the high
claim rates for mortgages with seller-funded downpayment assistance contributed negative
$16.50 billion to the economic value of the MMIF as of the end of FY 2016. 51 The passage of the
Housing and Economic Recovery Act (HERA), amending NHA section 203(b)(9)(c), prohibited the
endorsement of seller-funded downpayment assistance after October 1, 2008. While NHA
section 203(b)(9)(c) put an end to seller-funded DPA programs, currently, FHA is concerned that
certain entities may be interpreting the statute more broadly than intended by Congress, and
creating riskier DPA programs that are of concern to FHA given the risk posed to the MMIF.
FHA began more closely reviewing DPA programs in light of recent data that reflects increasing
exposure and risk due to insuring mortgages with certain types of DPA. FHA recognizes the
value of DPA in promoting access to mortgage credit but must manage the risk, in light of its
fiduciary responsibility to the MMIF. Purchase endorsements with DPA now represent 37.55
percent of all purchase endorsements, with 11.39 percent of those from self-identified
government entities. From 2010 to 2018, early payment defaults (EPDs) were higher for
mortgages with DPA than for mortgages with no DPA. In first quarter 2018, the EPD rate for
51 Actuarial Review of the Federal Housing Administration Mutual Mortgage Insurance Fund Forward Loans for Fiscal Year 2016, U.S. Department of Housing and Urban Development, November 15, 2016. https://www.hud.gov/sites/documents/ACTUARIALMMIFFORWARD2016.PDF
U.S. Department of Housing and Urban Development
Financial Status of the FHA Mutual Mortgage Insurance Fund FY 2018 92
mortgages with DPA was 0.69 percent, and for mortgages without DPA it was 0.42 percent. For
mortgages originated from 2011 to 2015, the serious delinquency (SDQ) rate for mortgages
with downpayment assistance provided by self-identified governments is much higher. SDQ
rates tend to rise as mortgages season. In 2014, mortgages with self-identified government DPA
had an SDQ rate of 7.37 percent as compared to mortgages with no DPA that had an SDQ rate
of 4.3 percent. (See Exhibit I-19 in Chapter 1.)
Barriers to Resolution of Downpayment Assistance Concerns
HERA amended the NHA to prohibit DPA where such assistance is provided by a “prohibited
source,” which includes the property seller or other party that financially benefits from the
transaction.
HUD has observed that certain entities continue the practice of interpreting the provision
broadly to implement DPA programs that increase risk to the MMIF. FHA is concerned that
certain entities are now operating these DPA programs on a nationwide basis and in ways that
generate benefits for the provider that do not appear to comport with the intent of the
“prohibited source” provision. These programs also appear to increase costs, but not benefits,
to the borrower and put the MMIF at an unreasonable risk.
HUD believes that greater clarity and certainty as to the meaning of “prohibited sources” and
indeed, when an entity may be said to “financially benefit from the transaction,” is necessary to
ensure the future safety and soundness of the MMIF. Without swift and decisive action to
address these programs, FHA may be unable to avoid the types of losses that it previously
experienced with seller-funded downpayment assistance.
Lender Enforcement and the Role of the Mortgagee Review Board
The Mortgagee Review Board (MRB) is responsible for the oversight and sanctioning of
mortgagees (lenders) that conduct business with FHA. FHA and the MRB continues to take strong
enforcement actions against lenders who defraud borrowers and taxpayers or make routine,
material errors that strain FHA’s resources. To address lender misconduct, the MRB may impose
civil money penalties (CMPs) and a range of administrative sanctions, including letters of
reprimand, suspension of approval, probation, and withdrawal of approval. Over the course of
FY 2018, the MRB assessed $28.1 million in CMPs for violations of FHA program requirements
related to underwriting, quality control, program fraud, annual recertification requirements, and
other egregious violations of FHA requirements.
In order to enhance its enforcement regime, FHA has begun revising its defect taxonomy, which
makes clear the various defect categories and how FHA views the severity of each defect. FHA is
also revising certifications which lenders attest to for each FHA loan as well as lenders’ annual
certifications. These revisions will provide lenders additional certainty and clarity on FHA’s
requirements, and help FHA quickly recognize when lenders are failing to meet those
requirements.
U.S. Department of Housing and Urban Development
Financial Status of the FHA Mutual Mortgage Insurance Fund FY 2018 93
FHA supports changes that would give the MRB additional authorities under the law. Currently,
FHA has statutory limitations which result in the MRB’s limited use of administrative sanctions
authority set forth in 12 U.S.C. § 1708(c) for serious and material violations of FHA’s
requirements. For example, the limitations placed on CMP authorities for each independent
violation and annual cap found in § 1735-f-14(a)(2)(e) often disincentivize compliance with FHA
requirements where the cost of the penalty that may be imposed is less than the cost to the
lender of compliance with the requirements. FHA recommends a statutory change to increase
the limit for CMP authorities beginning with a minimum of one month with no cap.
In addition, one of FHA’s enforcement tools authorizes the MRB to suspend a lender’s approval
under certain prohibited circumstances, but its effectiveness is limited. § 1708(c) requires
suspensions to be no less than six months and no longer than one year, while allowing for an
additional six-month extension if in the public interest. The six-month minimum requirement
creates a disincentive to its use, particularly when the sanction could put the lender out of
business and further limit borrowers’ access to credit. This remedy could be deployed more
readily to ensure violations are cured, without causing lasting negative consequences, if the MRB
had more flexible suspension authority.
Finally, the duration and utility of the MRB’s probationary authority is severely constrained. More
robust and flexible probation authority could allow the MRB to place targeted limits on a lender’s
loan production and servicing volume for a period of time, helping to mitigate risks to the MMIF
posed by the lender’s non-compliance. This flexibility could help the MRB ensure lenders take
compliance seriously.
The MRB will continue to take responsible and appropriate enforcement actions against FHA-
approved lenders to ensure program compliance and protect taxpayers, within the statutory
limitations on MRB sanctions and CMP authorities. A strong MRB with robust and flexible
enforcement tools could better serve the interests of the FHA program, in some instances, than
False Claims Act litigation that may curb participation by compliant lenders deciding to withdraw
from the program altogether.
Lenders who lend responsibly and adhere to FHA policies should feel confident about
participating in FHA programs. Participation by a well-diversified group of lenders not only
protects the MMIF and taxpayers from undue losses, but it also ensures that borrowers ready for
homeownership have a range of reliable choices for accessing FHA-insured mortgage credit.
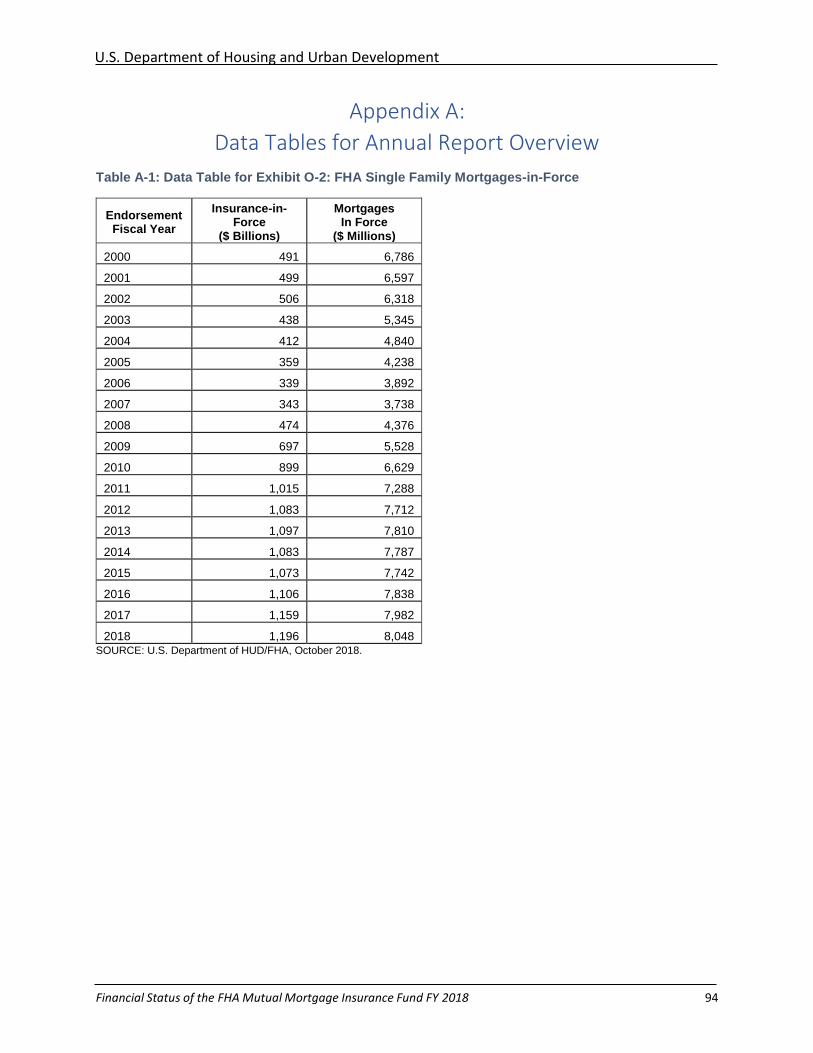
U.S. Department of Housing and Urban Development
Financial Status of the FHA Mutual Mortgage Insurance Fund FY 2018 94
Appendix A:
Data Tables for Annual Report Overview
Table A-1: Data Table for Exhibit O-2: FHA Single Family Mortgages-in-Force
Endorsement Fiscal Year
Insurance-in-Force
($ Billions)
Mortgages In Force
($ Millions)
2000 491 6,786
2001 499 6,597
2002 506 6,318
2003 438 5,345
2004 412 4,840
2005 359 4,238
2006 339 3,892
2007 343 3,738
2008 474 4,376
2009 697 5,528
2010 899 6,629
2011 1,015 7,288
2012 1,083 7,712
2013 1,097 7,810
2014 1,083 7,787
2015 1,073 7,742
2016 1,106 7,838
2017 1,159 7,982
2018 1,196 8,048 SOURCE: U.S. Department of HUD/FHA, October 2018.
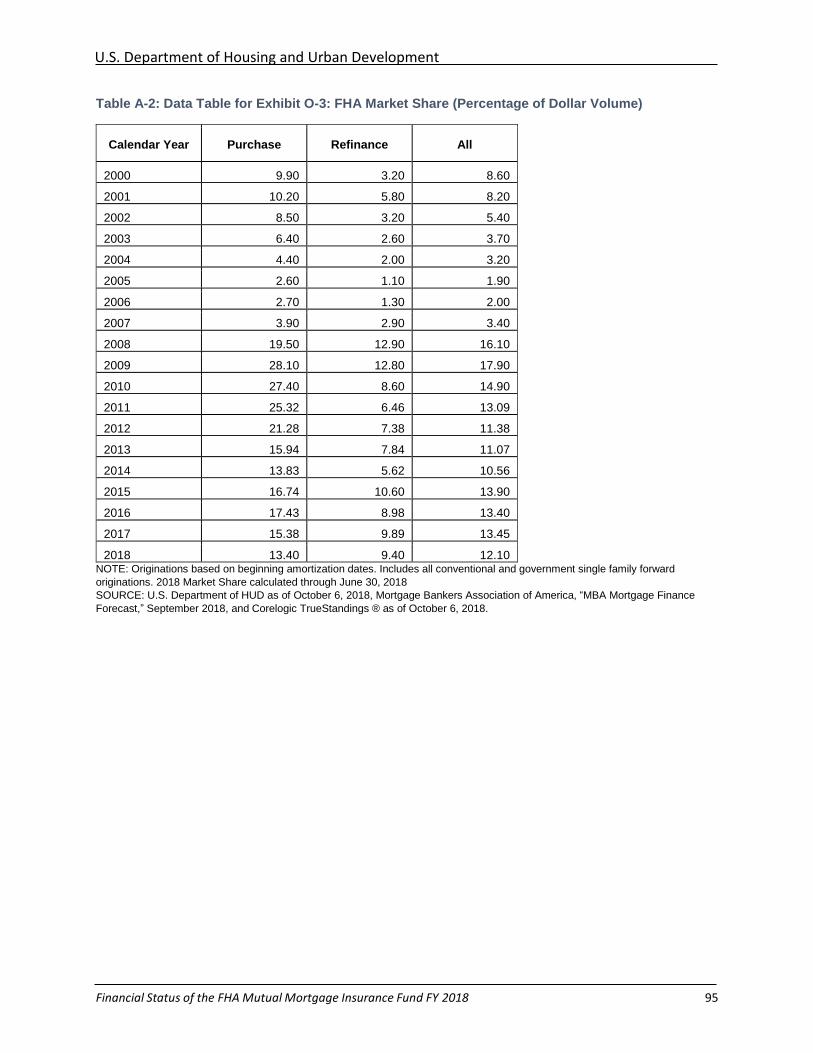
U.S. Department of Housing and Urban Development
Financial Status of the FHA Mutual Mortgage Insurance Fund FY 2018 95
Table A-2: Data Table for Exhibit O-3: FHA Market Share (Percentage of Dollar Volume)
Calendar Year Purchase Refinance All
2000 9.90 3.20 8.60
2001 10.20 5.80 8.20
2002 8.50 3.20 5.40
2003 6.40 2.60 3.70
2004 4.40 2.00 3.20
2005 2.60 1.10 1.90
2006 2.70 1.30 2.00
2007 3.90 2.90 3.40
2008 19.50 12.90 16.10
2009 28.10 12.80 17.90
2010 27.40 8.60 14.90
2011 25.32 6.46 13.09
2012 21.28 7.38 11.38
2013 15.94 7.84 11.07
2014 13.83 5.62 10.56
2015 16.74 10.60 13.90
2016 17.43 8.98 13.40
2017 15.38 9.89 13.45
2018 13.40 9.40 12.10 NOTE: Originations based on beginning amortization dates. Includes all conventional and government single family forward
originations. 2018 Market Share calculated through June 30, 2018
SOURCE: U.S. Department of HUD as of October 6, 2018, Mortgage Bankers Association of America, “MBA Mortgage Finance
Forecast,” September 2018, and Corelogic TrueStandings ® as of October 6, 2018.
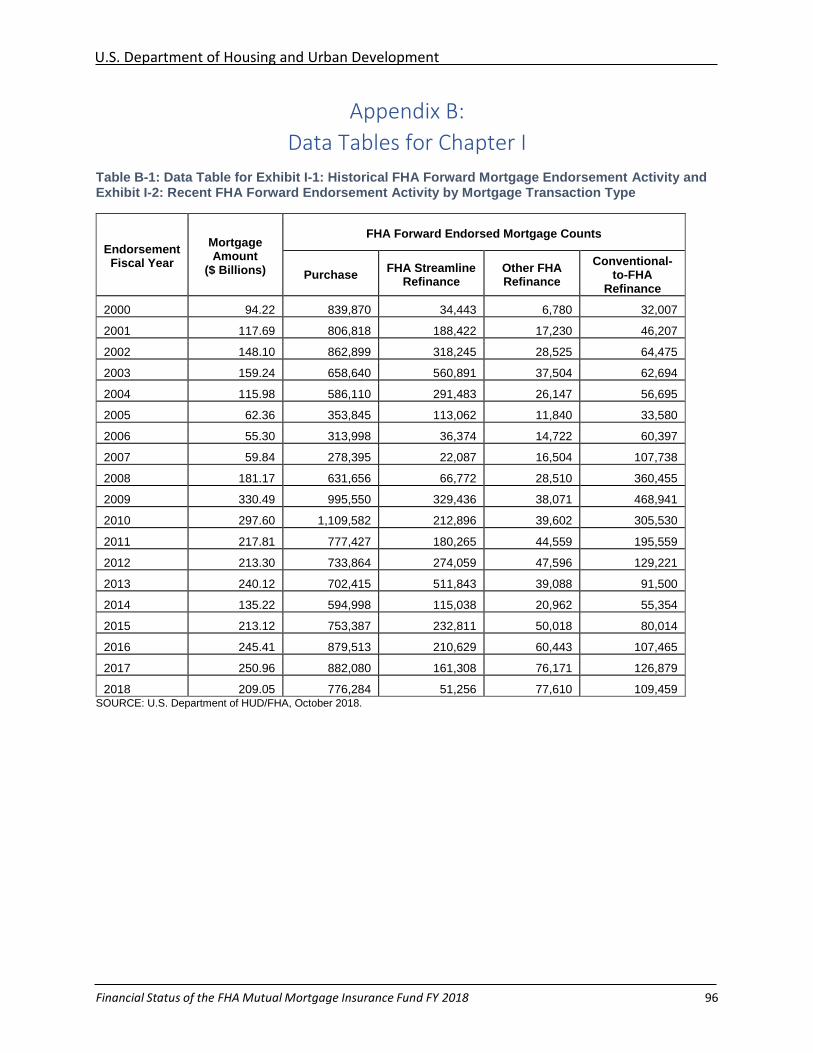
U.S. Department of Housing and Urban Development
Financial Status of the FHA Mutual Mortgage Insurance Fund FY 2018 96
Appendix B:
Data Tables for Chapter I
Table B-1: Data Table for Exhibit I-1: Historical FHA Forward Mortgage Endorsement Activity and Exhibit I-2: Recent FHA Forward Endorsement Activity by Mortgage Transaction Type
Endorsement Fiscal Year
Mortgage Amount
($ Billions)
FHA Forward Endorsed Mortgage Counts
Purchase FHA Streamline
Refinance Other FHA Refinance
Conventional-to-FHA
Refinance
2000 94.22 839,870 34,443 6,780 32,007
2001 117.69 806,818 188,422 17,230 46,207
2002 148.10 862,899 318,245 28,525 64,475
2003 159.24 658,640 560,891 37,504 62,694
2004 115.98 586,110 291,483 26,147 56,695
2005 62.36 353,845 113,062 11,840 33,580
2006 55.30 313,998 36,374 14,722 60,397
2007 59.84 278,395 22,087 16,504 107,738
2008 181.17 631,656 66,772 28,510 360,455
2009 330.49 995,550 329,436 38,071 468,941
2010 297.60 1,109,582 212,896 39,602 305,530
2011 217.81 777,427 180,265 44,559 195,559
2012 213.30 733,864 274,059 47,596 129,221
2013 240.12 702,415 511,843 39,088 91,500
2014 135.22 594,998 115,038 20,962 55,354
2015 213.12 753,387 232,811 50,018 80,014
2016 245.41 879,513 210,629 60,443 107,465
2017 250.96 882,080 161,308 76,171 126,879
2018 209.05 776,284 51,256 77,610 109,459 SOURCE: U.S. Department of HUD/FHA, October 2018.
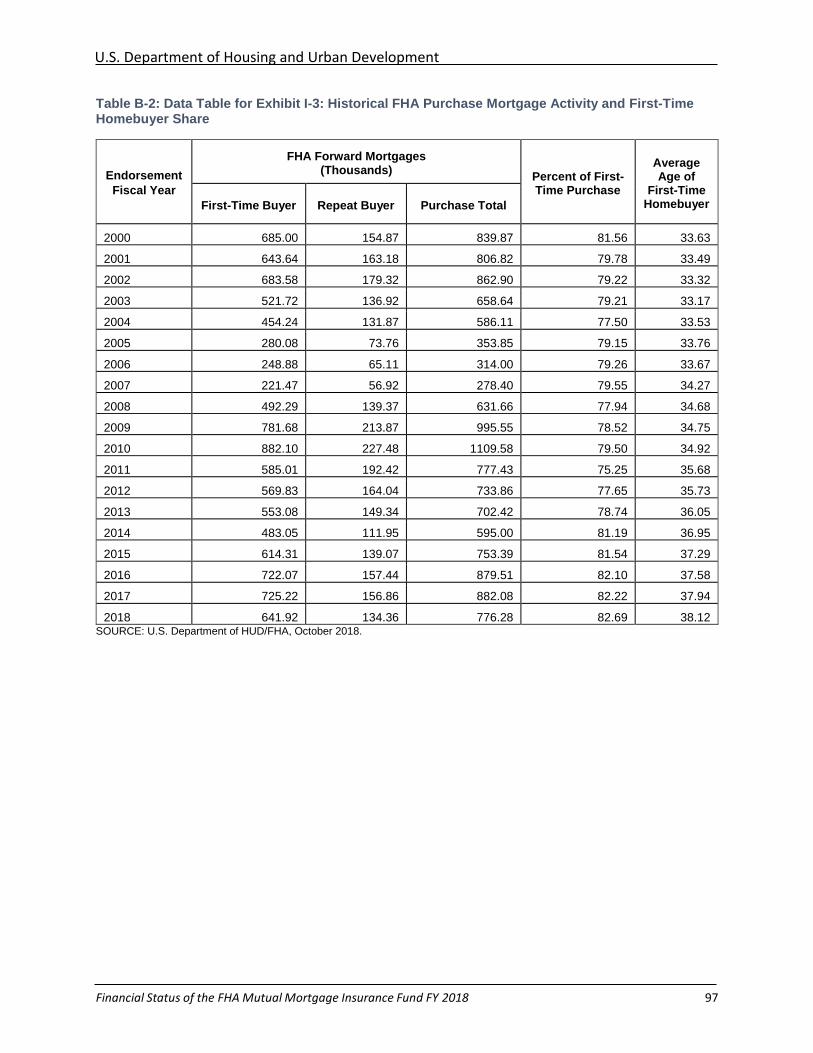
U.S. Department of Housing and Urban Development
Financial Status of the FHA Mutual Mortgage Insurance Fund FY 2018 97
Table B-2: Data Table for Exhibit I-3: Historical FHA Purchase Mortgage Activity and First-Time Homebuyer Share
Endorsement
Fiscal Year
FHA Forward Mortgages (Thousands)
Percent of First-Time Purchase
Average Age of
First-Time Homebuyer First-Time Buyer Repeat Buyer Purchase Total
2000 685.00 154.87 839.87 81.56 33.63
2001 643.64 163.18 806.82 79.78 33.49
2002 683.58 179.32 862.90 79.22 33.32
2003 521.72 136.92 658.64 79.21 33.17
2004 454.24 131.87 586.11 77.50 33.53
2005 280.08 73.76 353.85 79.15 33.76
2006 248.88 65.11 314.00 79.26 33.67
2007 221.47 56.92 278.40 79.55 34.27
2008 492.29 139.37 631.66 77.94 34.68
2009 781.68 213.87 995.55 78.52 34.75
2010 882.10 227.48 1109.58 79.50 34.92
2011 585.01 192.42 777.43 75.25 35.68
2012 569.83 164.04 733.86 77.65 35.73
2013 553.08 149.34 702.42 78.74 36.05
2014 483.05 111.95 595.00 81.19 36.95
2015 614.31 139.07 753.39 81.54 37.29
2016 722.07 157.44 879.51 82.10 37.58
2017 725.22 156.86 882.08 82.22 37.94
2018 641.92 134.36 776.28 82.69 38.12 SOURCE: U.S. Department of HUD/FHA, October 2018.
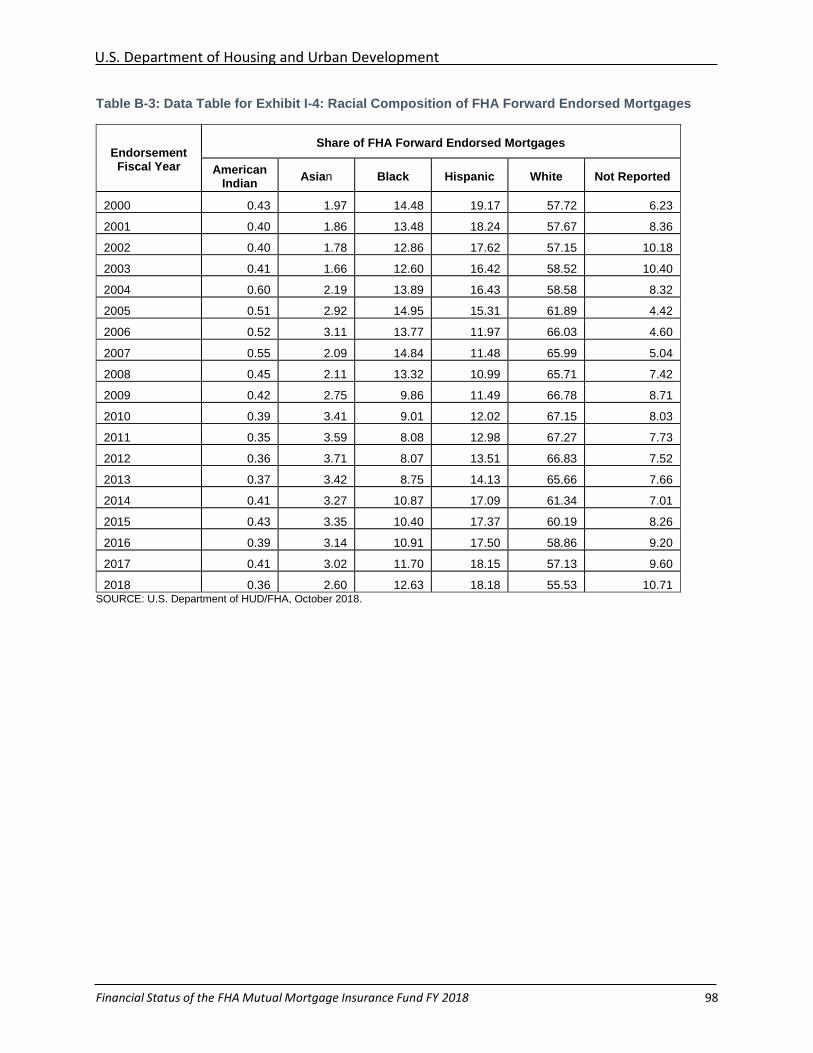
U.S. Department of Housing and Urban Development
Financial Status of the FHA Mutual Mortgage Insurance Fund FY 2018 98
Table B-3: Data Table for Exhibit I-4: Racial Composition of FHA Forward Endorsed Mortgages
Endorsement Fiscal Year
Share of FHA Forward Endorsed Mortgages
American Indian
Asian Black Hispanic White Not Reported
2000 0.43 1.97 14.48 19.17 57.72 6.23
2001 0.40 1.86 13.48 18.24 57.67 8.36
2002 0.40 1.78 12.86 17.62 57.15 10.18
2003 0.41 1.66 12.60 16.42 58.52 10.40
2004 0.60 2.19 13.89 16.43 58.58 8.32
2005 0.51 2.92 14.95 15.31 61.89 4.42
2006 0.52 3.11 13.77 11.97 66.03 4.60
2007 0.55 2.09 14.84 11.48 65.99 5.04
2008 0.45 2.11 13.32 10.99 65.71 7.42
2009 0.42 2.75 9.86 11.49 66.78 8.71
2010 0.39 3.41 9.01 12.02 67.15 8.03
2011 0.35 3.59 8.08 12.98 67.27 7.73
2012 0.36 3.71 8.07 13.51 66.83 7.52
2013 0.37 3.42 8.75 14.13 65.66 7.66
2014 0.41 3.27 10.87 17.09 61.34 7.01
2015 0.43 3.35 10.40 17.37 60.19 8.26
2016 0.39 3.14 10.91 17.50 58.86 9.20
2017 0.41 3.02 11.70 18.15 57.13 9.60
2018 0.36 2.60 12.63 18.18 55.53 10.71 SOURCE: U.S. Department of HUD/FHA, October 2018.
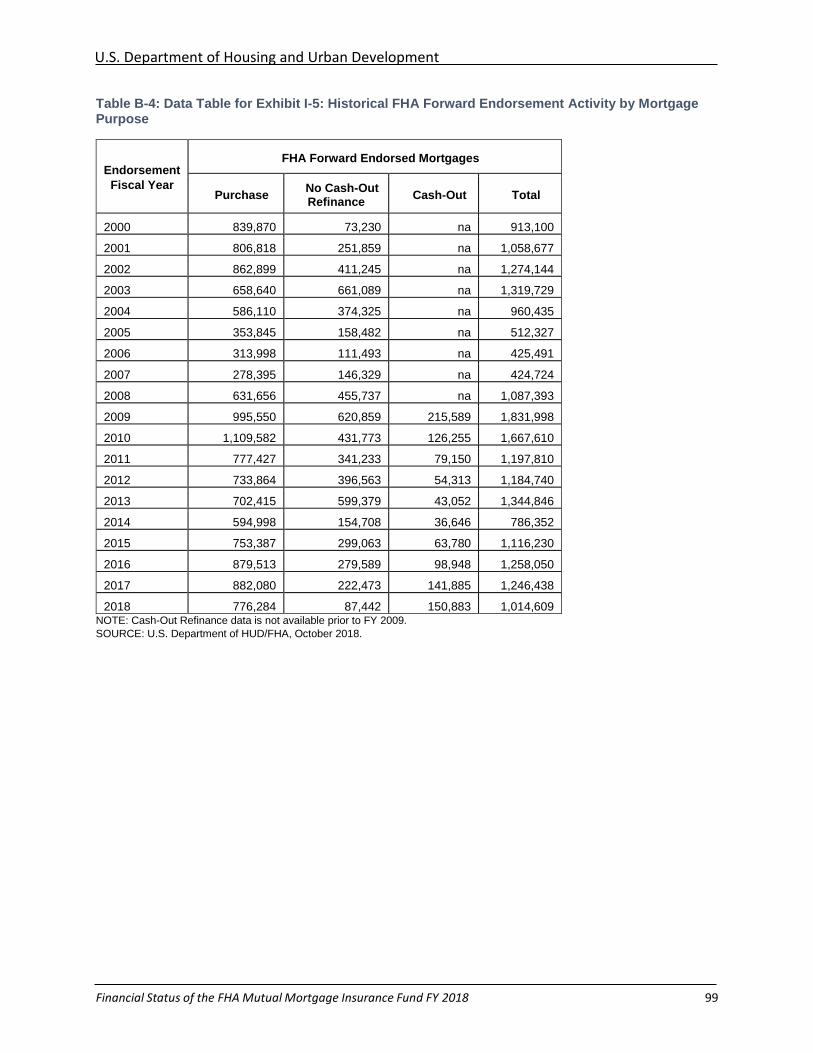
U.S. Department of Housing and Urban Development
Financial Status of the FHA Mutual Mortgage Insurance Fund FY 2018 99
Table B-4: Data Table for Exhibit I-5: Historical FHA Forward Endorsement Activity by Mortgage Purpose
Endorsement
Fiscal Year
FHA Forward Endorsed Mortgages
Purchase No Cash-Out Refinance
Cash-Out Total
2000 839,870 73,230 na 913,100
2001 806,818 251,859 na 1,058,677
2002 862,899 411,245 na 1,274,144
2003 658,640 661,089 na 1,319,729
2004 586,110 374,325 na 960,435
2005 353,845 158,482 na 512,327
2006 313,998 111,493 na 425,491
2007 278,395 146,329 na 424,724
2008 631,656 455,737 na 1,087,393
2009 995,550 620,859 215,589 1,831,998
2010 1,109,582 431,773 126,255 1,667,610
2011 777,427 341,233 79,150 1,197,810
2012 733,864 396,563 54,313 1,184,740
2013 702,415 599,379 43,052 1,344,846
2014 594,998 154,708 36,646 786,352
2015 753,387 299,063 63,780 1,116,230
2016 879,513 279,589 98,948 1,258,050
2017 882,080 222,473 141,885 1,246,438
2018 776,284 87,442 150,883 1,014,609 NOTE: Cash-Out Refinance data is not available prior to FY 2009.
SOURCE: U.S. Department of HUD/FHA, October 2018.
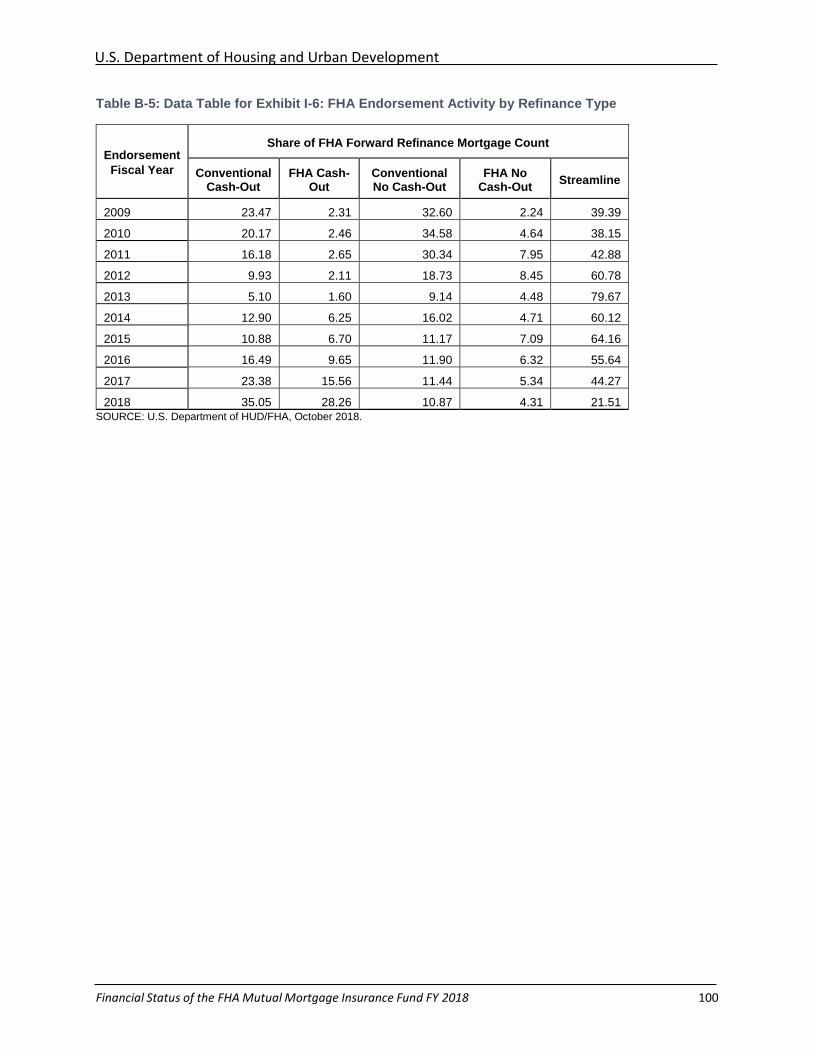
U.S. Department of Housing and Urban Development
Financial Status of the FHA Mutual Mortgage Insurance Fund FY 2018 100
Table B-5: Data Table for Exhibit I-6: FHA Endorsement Activity by Refinance Type
Endorsement
Fiscal Year
Share of FHA Forward Refinance Mortgage Count
Conventional Cash-Out
FHA Cash-Out
Conventional No Cash-Out
FHA No Cash-Out
Streamline
2009 23.47 2.31 32.60 2.24 39.39
2010 20.17 2.46 34.58 4.64 38.15
2011 16.18 2.65 30.34 7.95 42.88
2012 9.93 2.11 18.73 8.45 60.78
2013 5.10 1.60 9.14 4.48 79.67
2014 12.90 6.25 16.02 4.71 60.12
2015 10.88 6.70 11.17 7.09 64.16
2016 16.49 9.65 11.90 6.32 55.64
2017 23.38 15.56 11.44 5.34 44.27
2018 35.05 28.26 10.87 4.31 21.51 SOURCE: U.S. Department of HUD/FHA, October 2018.
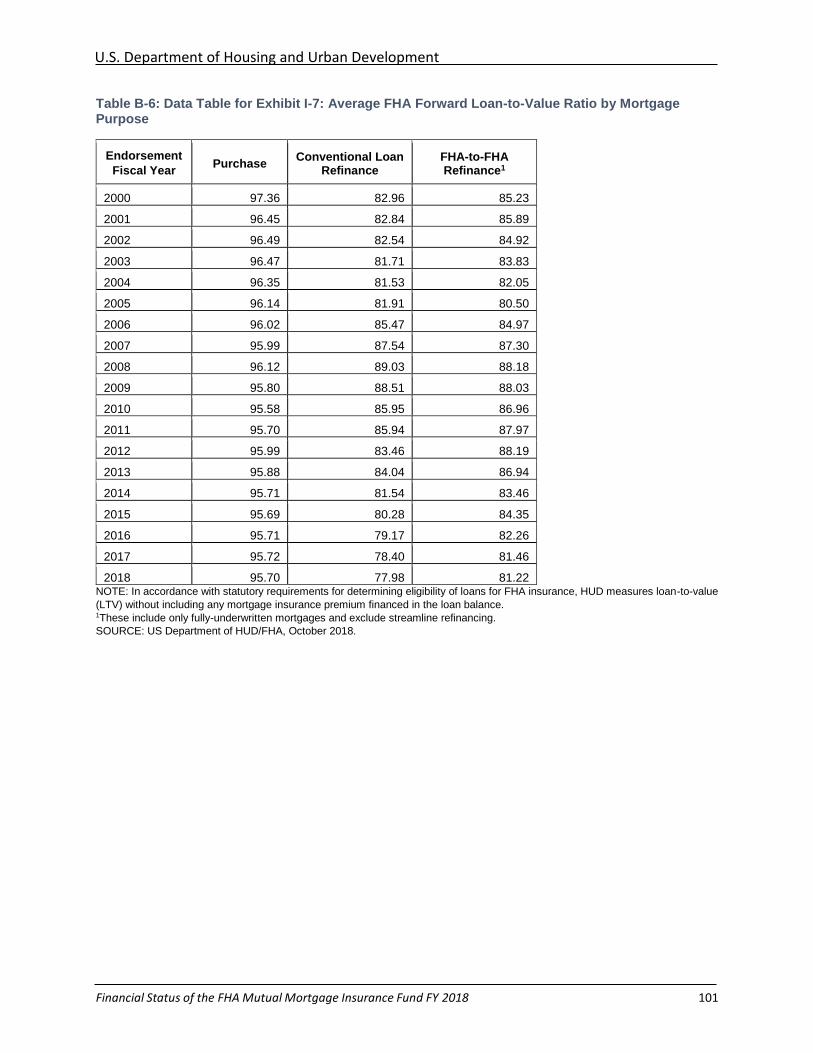
U.S. Department of Housing and Urban Development
Financial Status of the FHA Mutual Mortgage Insurance Fund FY 2018 101
Table B-6: Data Table for Exhibit I-7: Average FHA Forward Loan-to-Value Ratio by Mortgage Purpose
Endorsement
Fiscal Year Purchase
Conventional Loan Refinance
FHA-to-FHA Refinance1
2000 97.36 82.96 85.23
2001 96.45 82.84 85.89
2002 96.49 82.54 84.92
2003 96.47 81.71 83.83
2004 96.35 81.53 82.05
2005 96.14 81.91 80.50
2006 96.02 85.47 84.97
2007 95.99 87.54 87.30
2008 96.12 89.03 88.18
2009 95.80 88.51 88.03
2010 95.58 85.95 86.96
2011 95.70 85.94 87.97
2012 95.99 83.46 88.19
2013 95.88 84.04 86.94
2014 95.71 81.54 83.46
2015 95.69 80.28 84.35
2016 95.71 79.17 82.26
2017 95.72 78.40 81.46
2018 95.70 77.98 81.22 NOTE: In accordance with statutory requirements for determining eligibility of loans for FHA insurance, HUD measures loan-to-value
(LTV) without including any mortgage insurance premium financed in the loan balance. 1These include only fully-underwritten mortgages and exclude streamline refinancing.
SOURCE: US Department of HUD/FHA, October 2018.
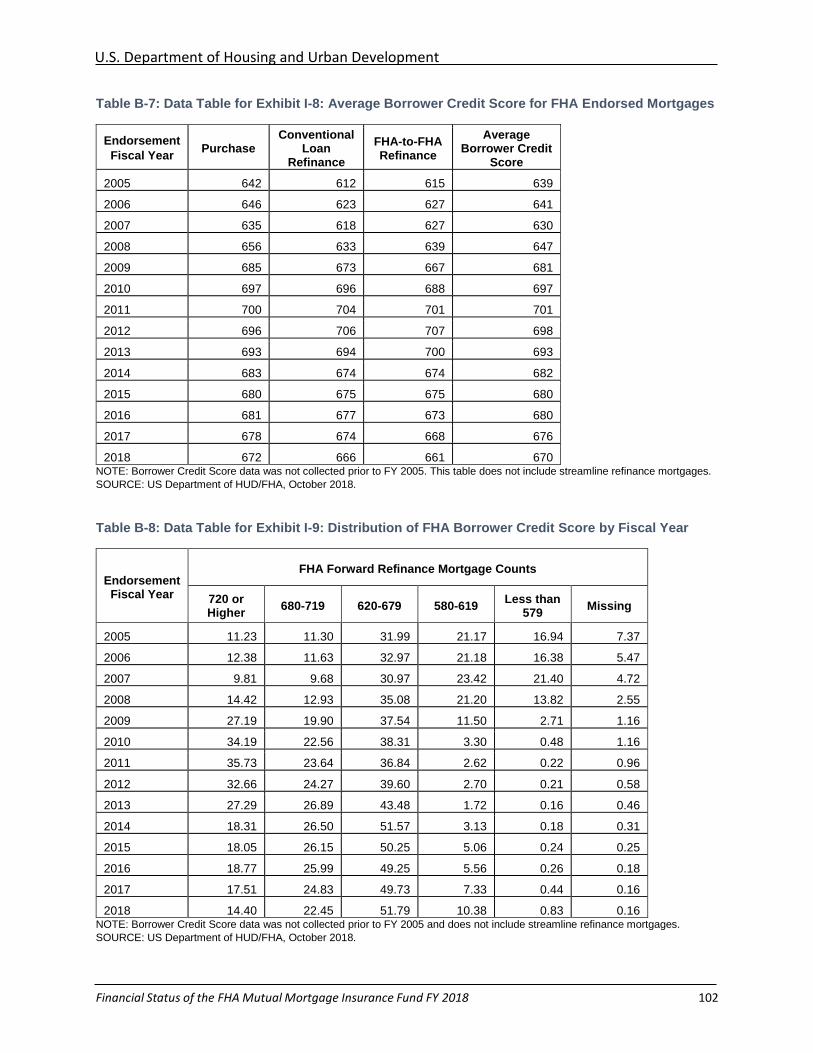
U.S. Department of Housing and Urban Development
Financial Status of the FHA Mutual Mortgage Insurance Fund FY 2018 102
Table B-7: Data Table for Exhibit I-8: Average Borrower Credit Score for FHA Endorsed Mortgages
Endorsement
Fiscal Year Purchase
Conventional Loan
Refinance
FHA-to-FHA Refinance
Average Borrower Credit
Score
2005 642 612 615 639
2006 646 623 627 641
2007 635 618 627 630
2008 656 633 639 647
2009 685 673 667 681
2010 697 696 688 697
2011 700 704 701 701
2012 696 706 707 698
2013 693 694 700 693
2014 683 674 674 682
2015 680 675 675 680
2016 681 677 673 680
2017 678 674 668 676
2018 672 666 661 670 NOTE: Borrower Credit Score data was not collected prior to FY 2005. This table does not include streamline refinance mortgages.
SOURCE: US Department of HUD/FHA, October 2018.
Table B-8: Data Table for Exhibit I-9: Distribution of FHA Borrower Credit Score by Fiscal Year
Endorsement Fiscal Year
FHA Forward Refinance Mortgage Counts
720 or Higher
680-719 620-679 580-619 Less than
579 Missing
2005 11.23 11.30 31.99 21.17 16.94 7.37
2006 12.38 11.63 32.97 21.18 16.38 5.47
2007 9.81 9.68 30.97 23.42 21.40 4.72
2008 14.42 12.93 35.08 21.20 13.82 2.55
2009 27.19 19.90 37.54 11.50 2.71 1.16
2010 34.19 22.56 38.31 3.30 0.48 1.16
2011 35.73 23.64 36.84 2.62 0.22 0.96
2012 32.66 24.27 39.60 2.70 0.21 0.58
2013 27.29 26.89 43.48 1.72 0.16 0.46
2014 18.31 26.50 51.57 3.13 0.18 0.31
2015 18.05 26.15 50.25 5.06 0.24 0.25
2016 18.77 25.99 49.25 5.56 0.26 0.18
2017 17.51 24.83 49.73 7.33 0.44 0.16
2018 14.40 22.45 51.79 10.38 0.83 0.16 NOTE: Borrower Credit Score data was not collected prior to FY 2005 and does not include streamline refinance mortgages.
SOURCE: US Department of HUD/FHA, October 2018.
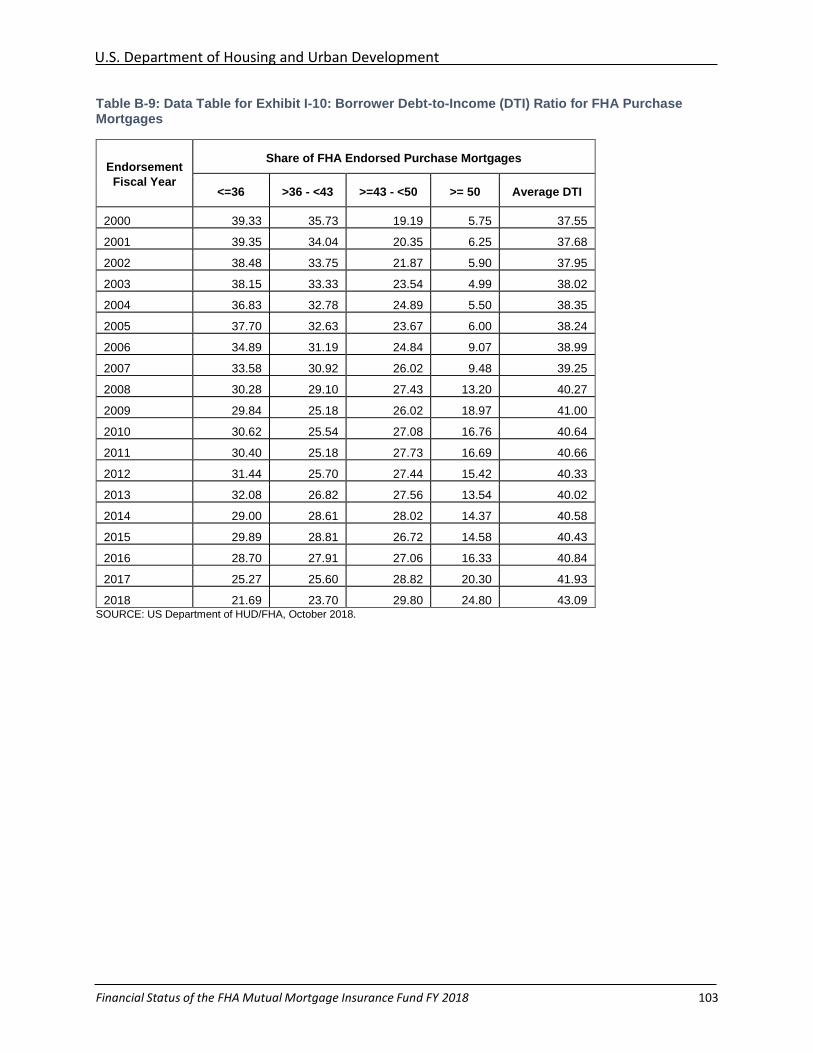
U.S. Department of Housing and Urban Development
Financial Status of the FHA Mutual Mortgage Insurance Fund FY 2018 103
Table B-9: Data Table for Exhibit I-10: Borrower Debt-to-Income (DTI) Ratio for FHA Purchase Mortgages
Endorsement
Fiscal Year
Share of FHA Endorsed Purchase Mortgages
<=36 >36 - <43 >=43 - <50 >= 50 Average DTI
2000 39.33 35.73 19.19 5.75 37.55
2001 39.35 34.04 20.35 6.25 37.68
2002 38.48 33.75 21.87 5.90 37.95
2003 38.15 33.33 23.54 4.99 38.02
2004 36.83 32.78 24.89 5.50 38.35
2005 37.70 32.63 23.67 6.00 38.24
2006 34.89 31.19 24.84 9.07 38.99
2007 33.58 30.92 26.02 9.48 39.25
2008 30.28 29.10 27.43 13.20 40.27
2009 29.84 25.18 26.02 18.97 41.00
2010 30.62 25.54 27.08 16.76 40.64
2011 30.40 25.18 27.73 16.69 40.66
2012 31.44 25.70 27.44 15.42 40.33
2013 32.08 26.82 27.56 13.54 40.02
2014 29.00 28.61 28.02 14.37 40.58
2015 29.89 28.81 26.72 14.58 40.43
2016 28.70 27.91 27.06 16.33 40.84
2017 25.27 25.60 28.82 20.30 41.93
2018 21.69 23.70 29.80 24.80 43.09 SOURCE: US Department of HUD/FHA, October 2018.
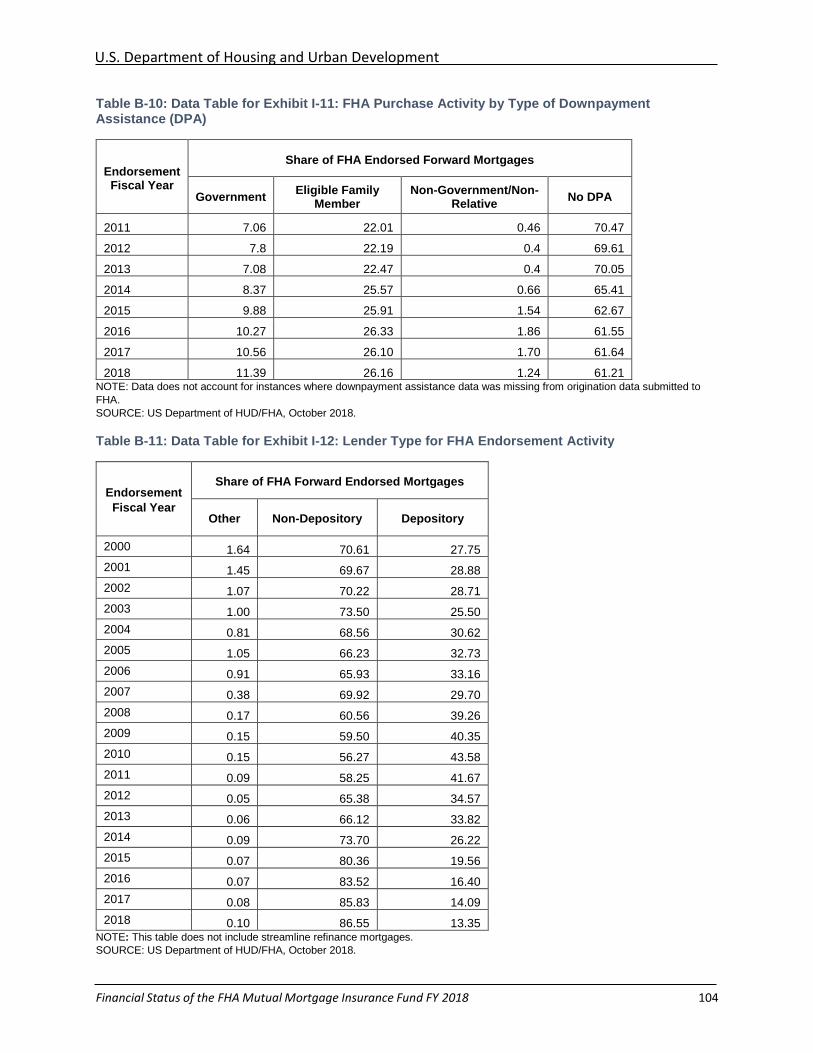
U.S. Department of Housing and Urban Development
Financial Status of the FHA Mutual Mortgage Insurance Fund FY 2018 104
Table B-10: Data Table for Exhibit I-11: FHA Purchase Activity by Type of Downpayment Assistance (DPA)
Endorsement Fiscal Year
Share of FHA Endorsed Forward Mortgages
Government Eligible Family
Member Non-Government/Non-
Relative No DPA
2011 7.06 22.01 0.46 70.47
2012 7.8 22.19 0.4 69.61
2013 7.08 22.47 0.4 70.05
2014 8.37 25.57 0.66 65.41
2015 9.88 25.91 1.54 62.67
2016 10.27 26.33 1.86 61.55
2017 10.56 26.10 1.70 61.64
2018 11.39 26.16 1.24 61.21 NOTE: Data does not account for instances where downpayment assistance data was missing from origination data submitted to
FHA.
SOURCE: US Department of HUD/FHA, October 2018.
Table B-11: Data Table for Exhibit I-12: Lender Type for FHA Endorsement Activity
Endorsement
Fiscal Year
Share of FHA Forward Endorsed Mortgages
Other Non-Depository Depository
2000 1.64 70.61 27.75
2001 1.45 69.67 28.88
2002 1.07 70.22 28.71
2003 1.00 73.50 25.50
2004 0.81 68.56 30.62
2005 1.05 66.23 32.73
2006 0.91 65.93 33.16
2007 0.38 69.92 29.70
2008 0.17 60.56 39.26
2009 0.15 59.50 40.35
2010 0.15 56.27 43.58
2011 0.09 58.25 41.67
2012 0.05 65.38 34.57
2013 0.06 66.12 33.82
2014 0.09 73.70 26.22
2015 0.07 80.36 19.56
2016 0.07 83.52 16.40
2017 0.08 85.83 14.09
2018 0.10 86.55 13.35 NOTE: This table does not include streamline refinance mortgages.
SOURCE: US Department of HUD/FHA, October 2018.
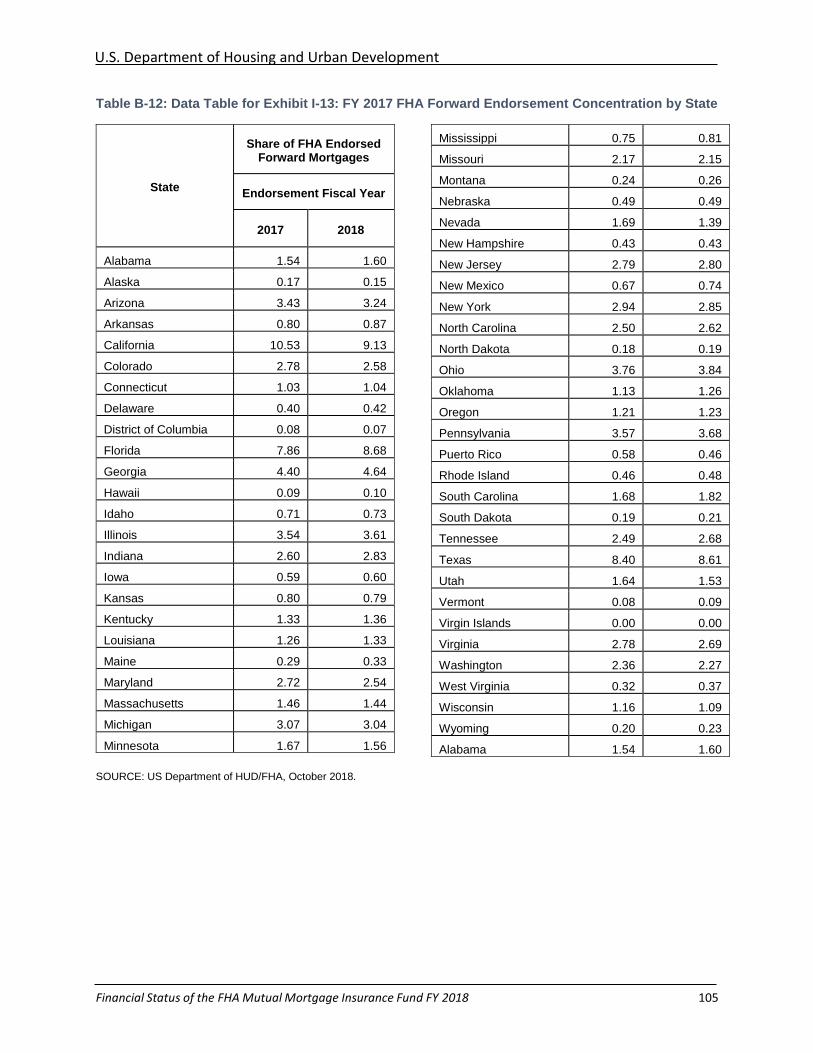
U.S. Department of Housing and Urban Development
Financial Status of the FHA Mutual Mortgage Insurance Fund FY 2018 105
Table B-12: Data Table for Exhibit I-13: FY 2017 FHA Forward Endorsement Concentration by State
State
Share of FHA Endorsed Forward Mortgages
Endorsement Fiscal Year
2017 2018
Alabama 1.54 1.60
Alaska 0.17 0.15
Arizona 3.43 3.24
Arkansas 0.80 0.87
California 10.53 9.13
Colorado 2.78 2.58
Connecticut 1.03 1.04
Delaware 0.40 0.42
District of Columbia 0.08 0.07
Florida 7.86 8.68
Georgia 4.40 4.64
Hawaii 0.09 0.10
Idaho 0.71 0.73
Illinois 3.54 3.61
Indiana 2.60 2.83
Iowa 0.59 0.60
Kansas 0.80 0.79
Kentucky 1.33 1.36
Louisiana 1.26 1.33
Maine 0.29 0.33
Maryland 2.72 2.54
Massachusetts 1.46 1.44
Michigan 3.07 3.04
Minnesota 1.67 1.56
Mississippi 0.75 0.81
Missouri 2.17 2.15
Montana 0.24 0.26
Nebraska 0.49 0.49
Nevada 1.69 1.39
New Hampshire 0.43 0.43
New Jersey 2.79 2.80
New Mexico 0.67 0.74
New York 2.94 2.85
North Carolina 2.50 2.62
North Dakota 0.18 0.19
Ohio 3.76 3.84
Oklahoma 1.13 1.26
Oregon 1.21 1.23
Pennsylvania 3.57 3.68
Puerto Rico 0.58 0.46
Rhode Island 0.46 0.48
South Carolina 1.68 1.82
South Dakota 0.19 0.21
Tennessee 2.49 2.68
Texas 8.40 8.61
Utah 1.64 1.53
Vermont 0.08 0.09
Virgin Islands 0.00 0.00
Virginia 2.78 2.69
Washington 2.36 2.27
West Virginia 0.32 0.37
Wisconsin 1.16 1.09
Wyoming 0.20 0.23
Alabama 1.54 1.60
SOURCE: US Department of HUD/FHA, October 2018.
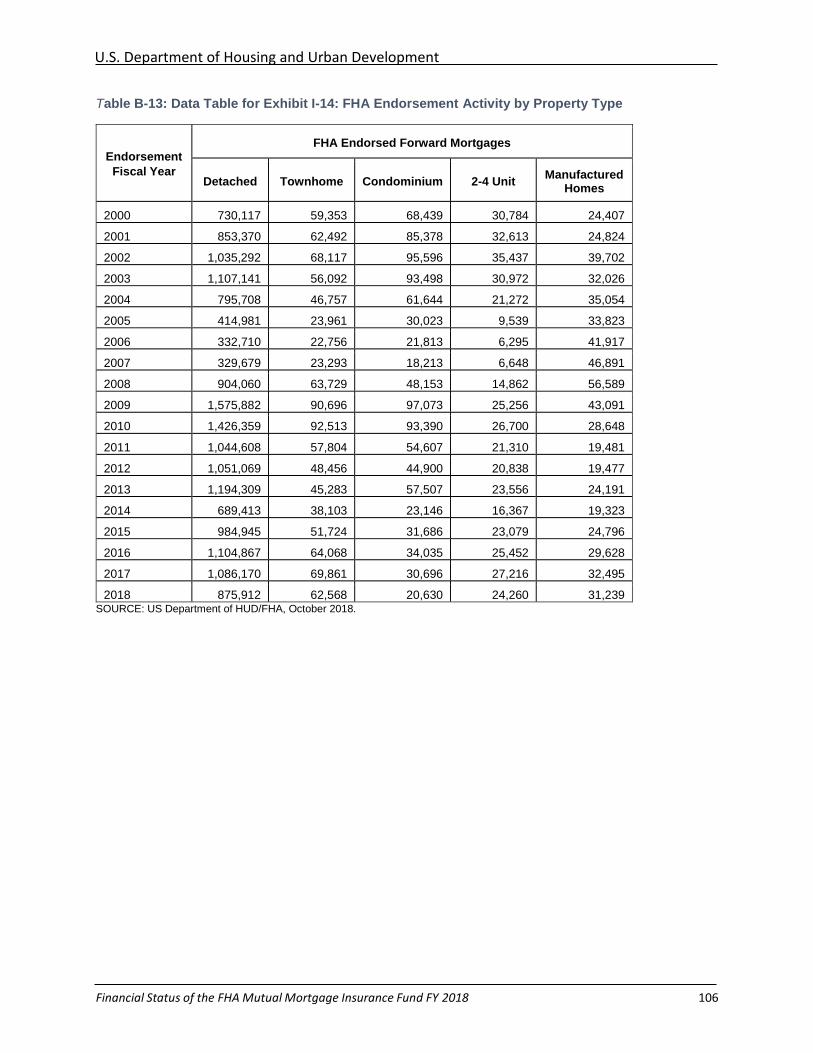
U.S. Department of Housing and Urban Development
Financial Status of the FHA Mutual Mortgage Insurance Fund FY 2018 106
Table B-13: Data Table for Exhibit I-14: FHA Endorsement Activity by Property Type
Endorsement
Fiscal Year
FHA Endorsed Forward Mortgages
Detached Townhome Condominium 2-4 Unit Manufactured
Homes
2000 730,117 59,353 68,439 30,784 24,407
2001 853,370 62,492 85,378 32,613 24,824
2002 1,035,292 68,117 95,596 35,437 39,702
2003 1,107,141 56,092 93,498 30,972 32,026
2004 795,708 46,757 61,644 21,272 35,054
2005 414,981 23,961 30,023 9,539 33,823
2006 332,710 22,756 21,813 6,295 41,917
2007 329,679 23,293 18,213 6,648 46,891
2008 904,060 63,729 48,153 14,862 56,589
2009 1,575,882 90,696 97,073 25,256 43,091
2010 1,426,359 92,513 93,390 26,700 28,648
2011 1,044,608 57,804 54,607 21,310 19,481
2012 1,051,069 48,456 44,900 20,838 19,477
2013 1,194,309 45,283 57,507 23,556 24,191
2014 689,413 38,103 23,146 16,367 19,323
2015 984,945 51,724 31,686 23,079 24,796
2016 1,104,867 64,068 34,035 25,452 29,628
2017 1,086,170 69,861 30,696 27,216 32,495
2018 875,912 62,568 20,630 24,260 31,239 SOURCE: US Department of HUD/FHA, October 2018.
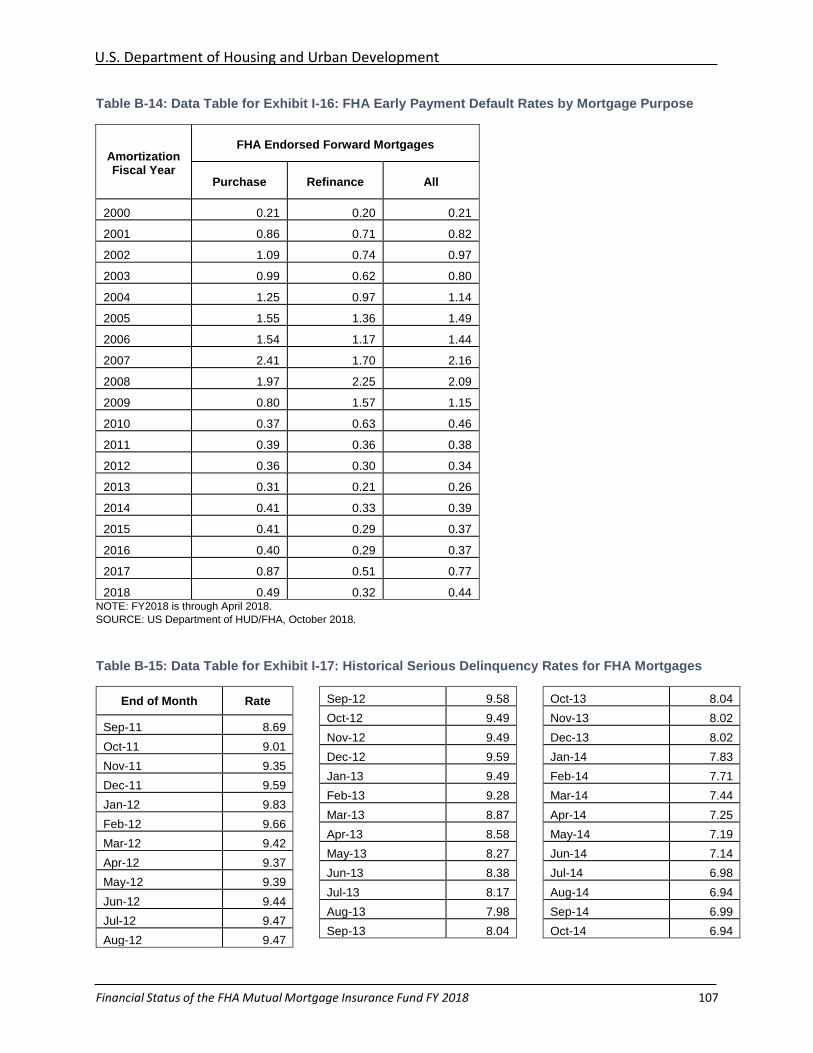
U.S. Department of Housing and Urban Development
Financial Status of the FHA Mutual Mortgage Insurance Fund FY 2018 107
Table B-14: Data Table for Exhibit I-16: FHA Early Payment Default Rates by Mortgage Purpose
Amortization Fiscal Year
FHA Endorsed Forward Mortgages
Purchase Refinance All
2000 0.21 0.20 0.21
2001 0.86 0.71 0.82
2002 1.09 0.74 0.97
2003 0.99 0.62 0.80
2004 1.25 0.97 1.14
2005 1.55 1.36 1.49
2006 1.54 1.17 1.44
2007 2.41 1.70 2.16
2008 1.97 2.25 2.09
2009 0.80 1.57 1.15
2010 0.37 0.63 0.46
2011 0.39 0.36 0.38
2012 0.36 0.30 0.34
2013 0.31 0.21 0.26
2014 0.41 0.33 0.39
2015 0.41 0.29 0.37
2016 0.40 0.29 0.37
2017 0.87 0.51 0.77
2018 0.49 0.32 0.44 NOTE: FY2018 is through April 2018.
SOURCE: US Department of HUD/FHA, October 2018.
Table B-15: Data Table for Exhibit I-17: Historical Serious Delinquency Rates for FHA Mortgages
End of Month Rate
Sep-11 8.69
Oct-11 9.01
Nov-11 9.35
Dec-11 9.59
Jan-12 9.83
Feb-12 9.66
Mar-12 9.42
Apr-12 9.37
May-12 9.39
Jun-12 9.44
Jul-12 9.47
Aug-12 9.47
Sep-12 9.58
Oct-12 9.49
Nov-12 9.49
Dec-12 9.59
Jan-13 9.49
Feb-13 9.28
Mar-13 8.87
Apr-13 8.58
May-13 8.27
Jun-13 8.38
Jul-13 8.17
Aug-13 7.98
Sep-13 8.04
Oct-13 8.04
Nov-13 8.02
Dec-13 8.02
Jan-14 7.83
Feb-14 7.71
Mar-14 7.44
Apr-14 7.25
May-14 7.19
Jun-14 7.14
Jul-14 6.98
Aug-14 6.94
Sep-14 6.99
Oct-14 6.94
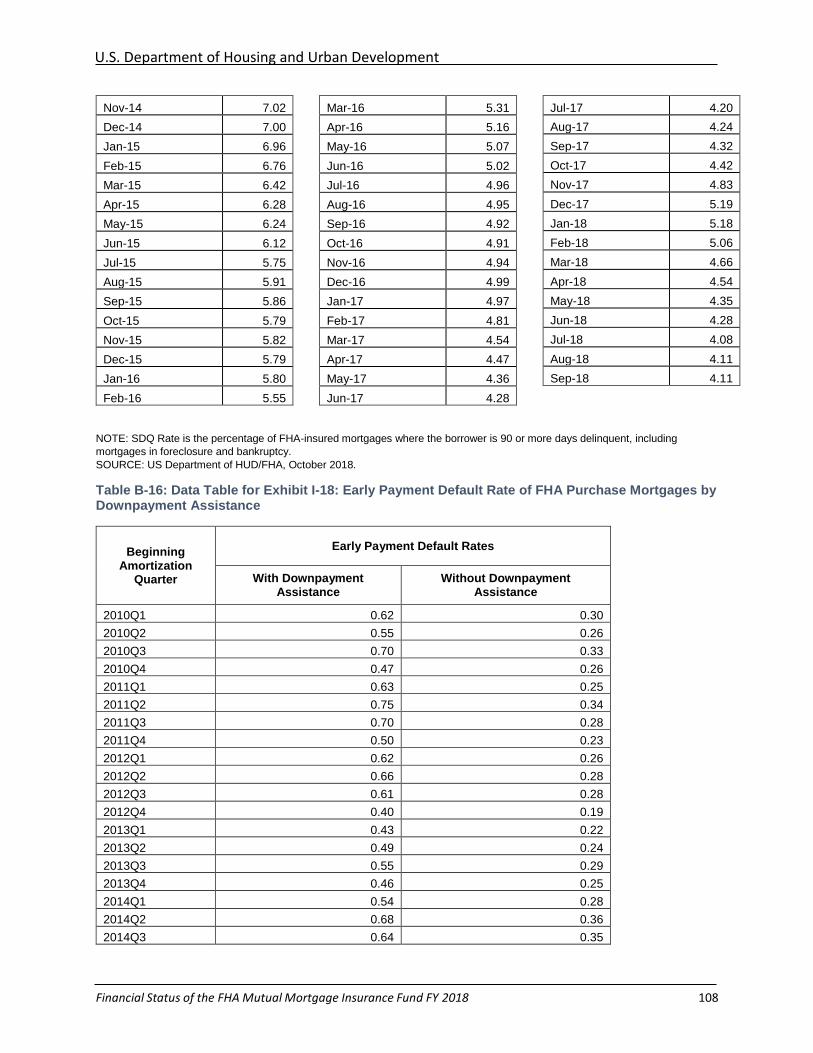
U.S. Department of Housing and Urban Development
Financial Status of the FHA Mutual Mortgage Insurance Fund FY 2018 108
Nov-14 7.02
Dec-14 7.00
Jan-15 6.96
Feb-15 6.76
Mar-15 6.42
Apr-15 6.28
May-15 6.24
Jun-15 6.12
Jul-15 5.75
Aug-15 5.91
Sep-15 5.86
Oct-15 5.79
Nov-15 5.82
Dec-15 5.79
Jan-16 5.80
Feb-16 5.55
Mar-16 5.31
Apr-16 5.16
May-16 5.07
Jun-16 5.02
Jul-16 4.96
Aug-16 4.95
Sep-16 4.92
Oct-16 4.91
Nov-16 4.94
Dec-16 4.99
Jan-17 4.97
Feb-17 4.81
Mar-17 4.54
Apr-17 4.47
May-17 4.36
Jun-17 4.28
Jul-17 4.20
Aug-17 4.24
Sep-17 4.32
Oct-17 4.42
Nov-17 4.83
Dec-17 5.19
Jan-18 5.18
Feb-18 5.06
Mar-18 4.66
Apr-18 4.54
May-18 4.35
Jun-18 4.28
Jul-18 4.08
Aug-18 4.11
Sep-18 4.11
NOTE: SDQ Rate is the percentage of FHA-insured mortgages where the borrower is 90 or more days delinquent, including
mortgages in foreclosure and bankruptcy.
SOURCE: US Department of HUD/FHA, October 2018.
Table B-16: Data Table for Exhibit I-18: Early Payment Default Rate of FHA Purchase Mortgages by Downpayment Assistance
Beginning Amortization
Quarter
Early Payment Default Rates
With Downpayment Assistance
Without Downpayment Assistance
2010Q1 0.62 0.30
2010Q2 0.55 0.26
2010Q3 0.70 0.33
2010Q4 0.47 0.26
2011Q1 0.63 0.25
2011Q2 0.75 0.34
2011Q3 0.70 0.28
2011Q4 0.50 0.23
2012Q1 0.62 0.26
2012Q2 0.66 0.28
2012Q3 0.61 0.28
2012Q4 0.40 0.19
2013Q1 0.43 0.22
2013Q2 0.49 0.24
2013Q3 0.55 0.29
2013Q4 0.46 0.25
2014Q1 0.54 0.28
2014Q2 0.68 0.36
2014Q3 0.64 0.35
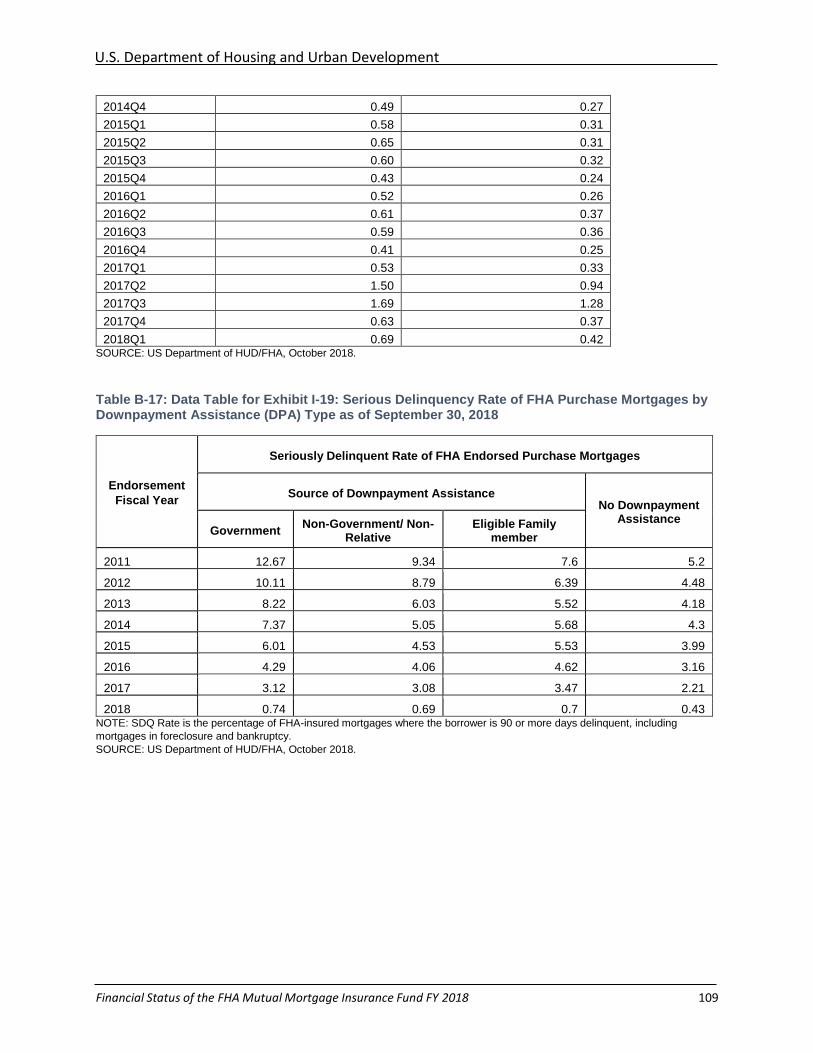
U.S. Department of Housing and Urban Development
Financial Status of the FHA Mutual Mortgage Insurance Fund FY 2018 109
2014Q4 0.49 0.27
2015Q1 0.58 0.31
2015Q2 0.65 0.31
2015Q3 0.60 0.32
2015Q4 0.43 0.24
2016Q1 0.52 0.26
2016Q2 0.61 0.37
2016Q3 0.59 0.36
2016Q4 0.41 0.25
2017Q1 0.53 0.33
2017Q2 1.50 0.94
2017Q3 1.69 1.28
2017Q4 0.63 0.37
2018Q1 0.69 0.42 SOURCE: US Department of HUD/FHA, October 2018.
Table B-17: Data Table for Exhibit I-19: Serious Delinquency Rate of FHA Purchase Mortgages by Downpayment Assistance (DPA) Type as of September 30, 2018
Endorsement
Fiscal Year
Seriously Delinquent Rate of FHA Endorsed Purchase Mortgages
Source of Downpayment Assistance No Downpayment
Assistance Government
Non-Government/ Non-Relative
Eligible Family member
2011 12.67 9.34 7.6 5.2
2012 10.11 8.79 6.39 4.48
2013 8.22 6.03 5.52 4.18
2014 7.37 5.05 5.68 4.3
2015 6.01 4.53 5.53 3.99
2016 4.29 4.06 4.62 3.16
2017 3.12 3.08 3.47 2.21
2018 0.74 0.69 0.7 0.43 NOTE: SDQ Rate is the percentage of FHA-insured mortgages where the borrower is 90 or more days delinquent, including
mortgages in foreclosure and bankruptcy.
SOURCE: US Department of HUD/FHA, October 2018.
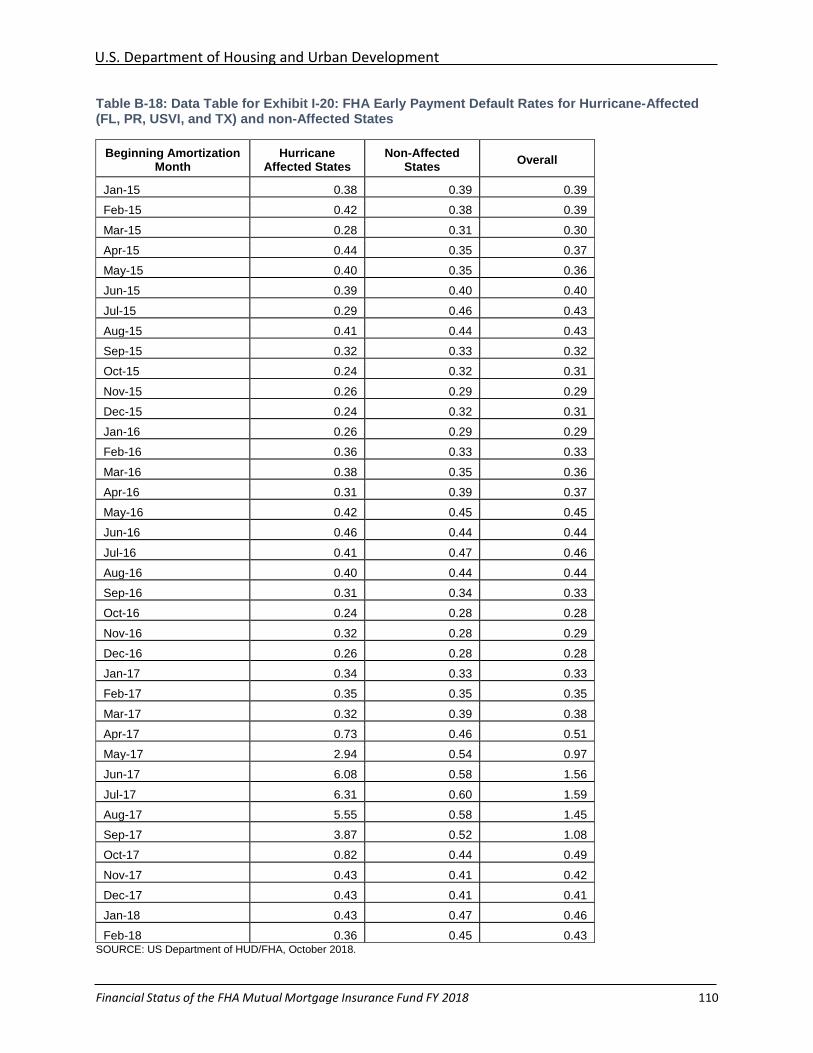
U.S. Department of Housing and Urban Development
Financial Status of the FHA Mutual Mortgage Insurance Fund FY 2018 110
Table B-18: Data Table for Exhibit I-20: FHA Early Payment Default Rates for Hurricane-Affected (FL, PR, USVI, and TX) and non-Affected States
Beginning Amortization Month
Hurricane Affected States
Non-Affected States
Overall
Jan-15 0.38 0.39 0.39
Feb-15 0.42 0.38 0.39
Mar-15 0.28 0.31 0.30
Apr-15 0.44 0.35 0.37
May-15 0.40 0.35 0.36
Jun-15 0.39 0.40 0.40
Jul-15 0.29 0.46 0.43
Aug-15 0.41 0.44 0.43
Sep-15 0.32 0.33 0.32
Oct-15 0.24 0.32 0.31
Nov-15 0.26 0.29 0.29
Dec-15 0.24 0.32 0.31
Jan-16 0.26 0.29 0.29
Feb-16 0.36 0.33 0.33
Mar-16 0.38 0.35 0.36
Apr-16 0.31 0.39 0.37
May-16 0.42 0.45 0.45
Jun-16 0.46 0.44 0.44
Jul-16 0.41 0.47 0.46
Aug-16 0.40 0.44 0.44
Sep-16 0.31 0.34 0.33
Oct-16 0.24 0.28 0.28
Nov-16 0.32 0.28 0.29
Dec-16 0.26 0.28 0.28
Jan-17 0.34 0.33 0.33
Feb-17 0.35 0.35 0.35
Mar-17 0.32 0.39 0.38
Apr-17 0.73 0.46 0.51
May-17 2.94 0.54 0.97
Jun-17 6.08 0.58 1.56
Jul-17 6.31 0.60 1.59
Aug-17 5.55 0.58 1.45
Sep-17 3.87 0.52 1.08
Oct-17 0.82 0.44 0.49
Nov-17 0.43 0.41 0.42
Dec-17 0.43 0.41 0.41
Jan-18 0.43 0.47 0.46
Feb-18 0.36 0.45 0.43 SOURCE: US Department of HUD/FHA, October 2018.
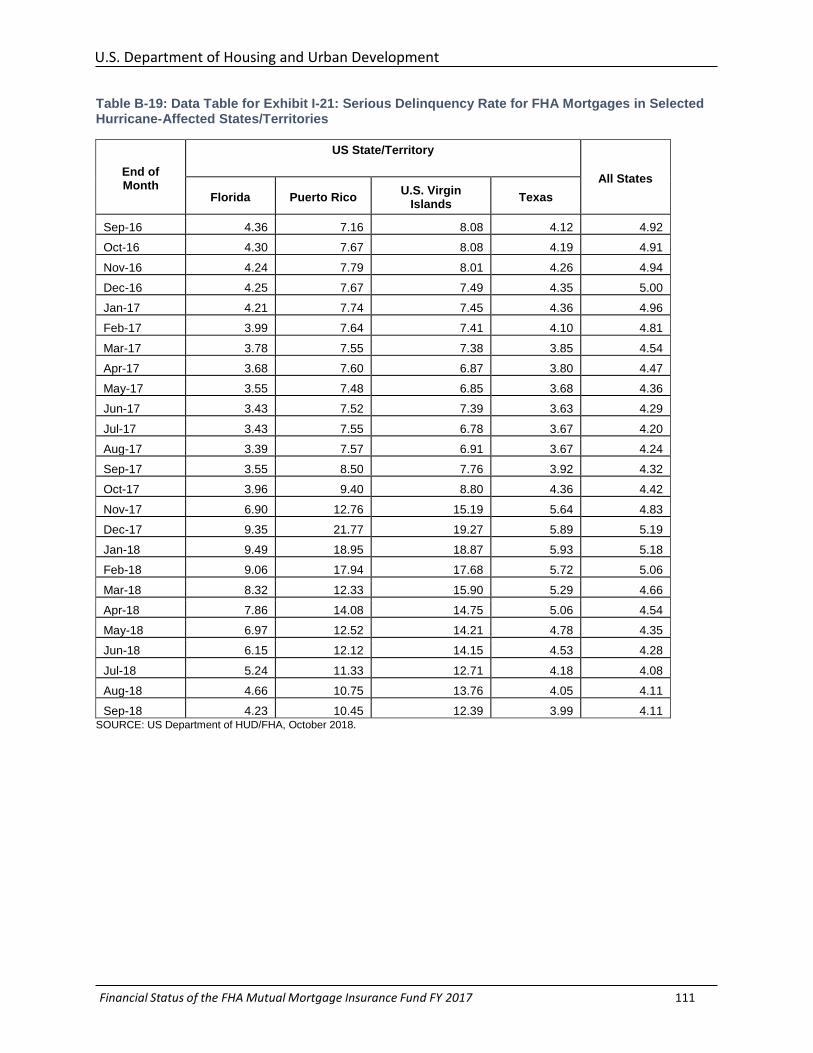
U.S. Department of Housing and Urban Development
Financial Status of the FHA Mutual Mortgage Insurance Fund FY 2017 111
Table B-19: Data Table for Exhibit I-21: Serious Delinquency Rate for FHA Mortgages in Selected Hurricane-Affected States/Territories
End of Month
US State/Territory
All States
Florida Puerto Rico U.S. Virgin
Islands Texas
Sep-16 4.36 7.16 8.08 4.12 4.92
Oct-16 4.30 7.67 8.08 4.19 4.91
Nov-16 4.24 7.79 8.01 4.26 4.94
Dec-16 4.25 7.67 7.49 4.35 5.00
Jan-17 4.21 7.74 7.45 4.36 4.96
Feb-17 3.99 7.64 7.41 4.10 4.81
Mar-17 3.78 7.55 7.38 3.85 4.54
Apr-17 3.68 7.60 6.87 3.80 4.47
May-17 3.55 7.48 6.85 3.68 4.36
Jun-17 3.43 7.52 7.39 3.63 4.29
Jul-17 3.43 7.55 6.78 3.67 4.20
Aug-17 3.39 7.57 6.91 3.67 4.24
Sep-17 3.55 8.50 7.76 3.92 4.32
Oct-17 3.96 9.40 8.80 4.36 4.42
Nov-17 6.90 12.76 15.19 5.64 4.83
Dec-17 9.35 21.77 19.27 5.89 5.19
Jan-18 9.49 18.95 18.87 5.93 5.18
Feb-18 9.06 17.94 17.68 5.72 5.06
Mar-18 8.32 12.33 15.90 5.29 4.66
Apr-18 7.86 14.08 14.75 5.06 4.54
May-18 6.97 12.52 14.21 4.78 4.35
Jun-18 6.15 12.12 14.15 4.53 4.28
Jul-18 5.24 11.33 12.71 4.18 4.08
Aug-18 4.66 10.75 13.76 4.05 4.11
Sep-18 4.23 10.45 12.39 3.99 4.11 SOURCE: US Department of HUD/FHA, October 2018.
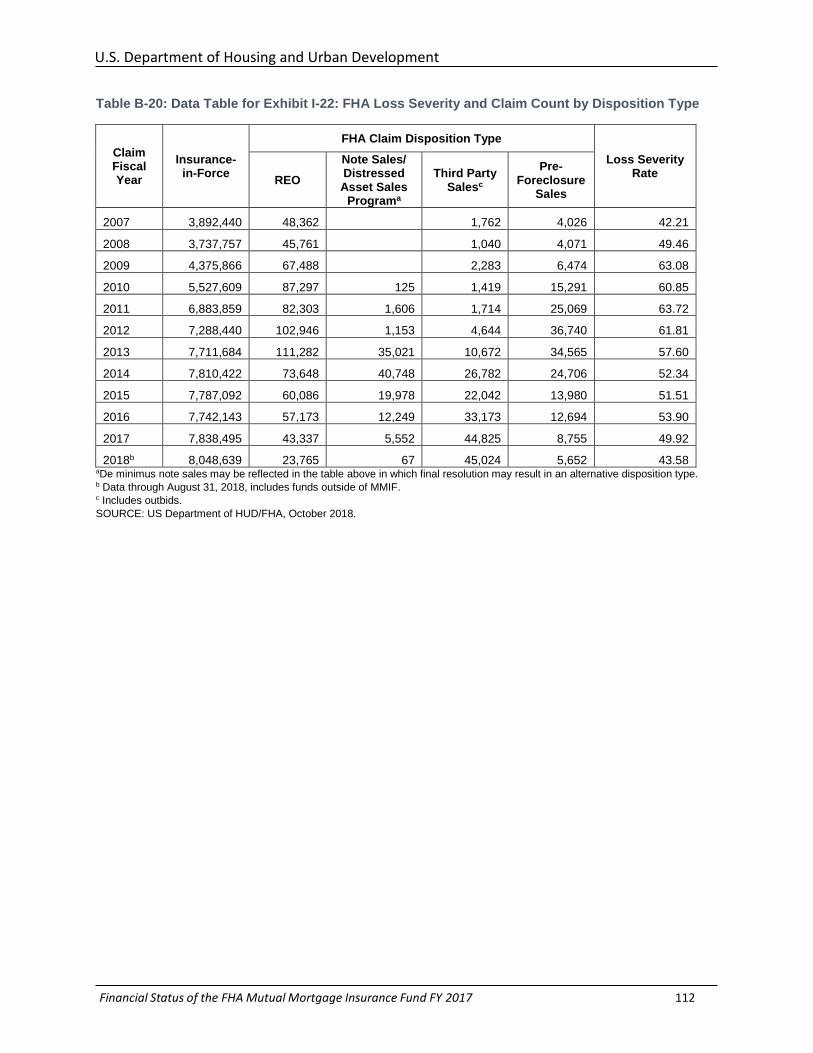
U.S. Department of Housing and Urban Development
Financial Status of the FHA Mutual Mortgage Insurance Fund FY 2017 112
Table B-20: Data Table for Exhibit I-22: FHA Loss Severity and Claim Count by Disposition Type
Claim Fiscal Year
Insurance-in-Force
FHA Claim Disposition Type
Loss Severity Rate
REO
Note Sales/ Distressed Asset Sales
Programa
Third Party Salesc
Pre-Foreclosure
Sales
2007 3,892,440 48,362 1,762 4,026 42.21
2008 3,737,757 45,761 1,040 4,071 49.46
2009 4,375,866 67,488 2,283 6,474 63.08
2010 5,527,609 87,297 125 1,419 15,291 60.85
2011 6,883,859 82,303 1,606 1,714 25,069 63.72
2012 7,288,440 102,946 1,153 4,644 36,740 61.81
2013 7,711,684 111,282 35,021 10,672 34,565 57.60
2014 7,810,422 73,648 40,748 26,782 24,706 52.34
2015 7,787,092 60,086 19,978 22,042 13,980 51.51
2016 7,742,143 57,173 12,249 33,173 12,694 53.90
2017 7,838,495 43,337 5,552 44,825 8,755 49.92
2018b 8,048,639 23,765 67 45,024 5,652 43.58 aDe minimus note sales may be reflected in the table above in which final resolution may result in an alternative disposition type. b Data through August 31, 2018, includes funds outside of MMIF. c Includes outbids.
SOURCE: US Department of HUD/FHA, October 2018.
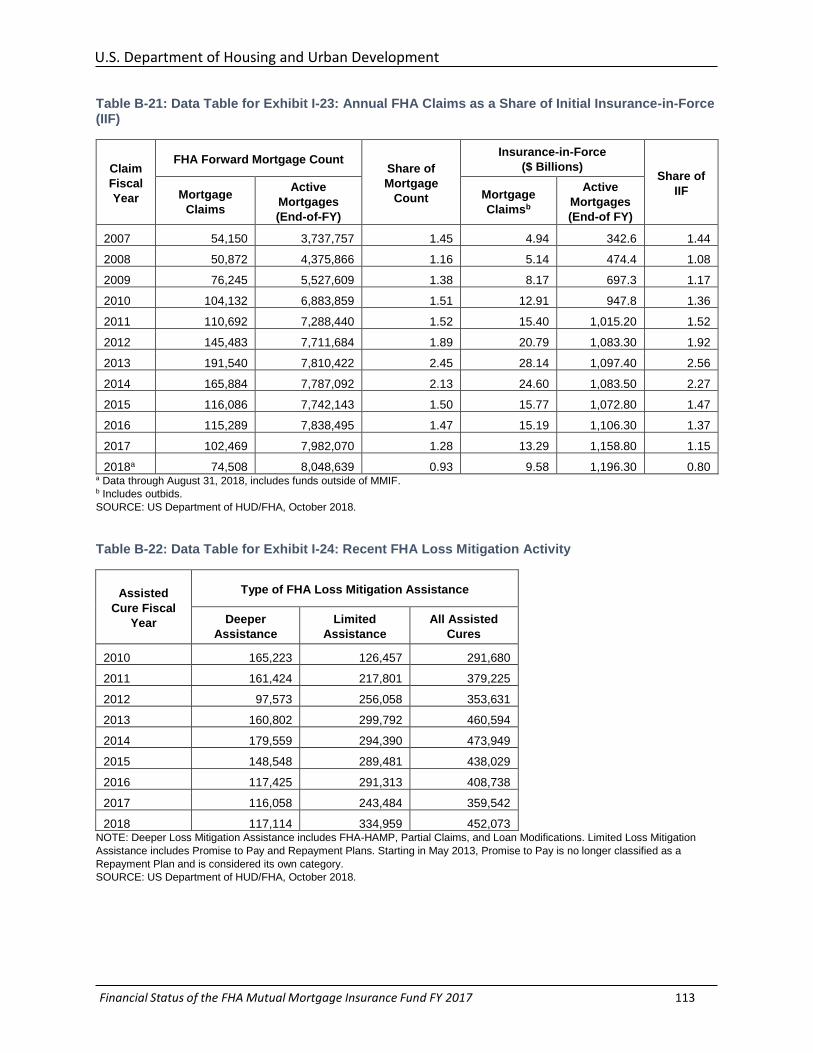
U.S. Department of Housing and Urban Development
Financial Status of the FHA Mutual Mortgage Insurance Fund FY 2017 113
Table B-21: Data Table for Exhibit I-23: Annual FHA Claims as a Share of Initial Insurance-in-Force (IIF)
Claim
Fiscal
Year
FHA Forward Mortgage Count Share of
Mortgage
Count
Insurance-in-Force
($ Billions) Share of
IIF Mortgage
Claims
Active
Mortgages
(End-of-FY)
Mortgage
Claimsb
Active
Mortgages
(End-of FY)
2007 54,150 3,737,757 1.45 4.94 342.6 1.44
2008 50,872 4,375,866 1.16 5.14 474.4 1.08
2009 76,245 5,527,609 1.38 8.17 697.3 1.17
2010 104,132 6,883,859 1.51 12.91 947.8 1.36
2011 110,692 7,288,440 1.52 15.40 1,015.20 1.52
2012 145,483 7,711,684 1.89 20.79 1,083.30 1.92
2013 191,540 7,810,422 2.45 28.14 1,097.40 2.56
2014 165,884 7,787,092 2.13 24.60 1,083.50 2.27
2015 116,086 7,742,143 1.50 15.77 1,072.80 1.47
2016 115,289 7,838,495 1.47 15.19 1,106.30 1.37
2017 102,469 7,982,070 1.28 13.29 1,158.80 1.15
2018a 74,508 8,048,639 0.93 9.58 1,196.30 0.80 a Data through August 31, 2018, includes funds outside of MMIF. b Includes outbids.
SOURCE: US Department of HUD/FHA, October 2018.
Table B-22: Data Table for Exhibit I-24: Recent FHA Loss Mitigation Activity
Assisted
Cure Fiscal
Year
Type of FHA Loss Mitigation Assistance
Deeper
Assistance
Limited
Assistance
All Assisted
Cures
2010 165,223 126,457 291,680
2011 161,424 217,801 379,225
2012 97,573 256,058 353,631
2013 160,802 299,792 460,594
2014 179,559 294,390 473,949
2015 148,548 289,481 438,029
2016 117,425 291,313 408,738
2017 116,058 243,484 359,542
2018 117,114 334,959 452,073 NOTE: Deeper Loss Mitigation Assistance includes FHA-HAMP, Partial Claims, and Loan Modifications. Limited Loss Mitigation
Assistance includes Promise to Pay and Repayment Plans. Starting in May 2013, Promise to Pay is no longer classified as a
Repayment Plan and is considered its own category.
SOURCE: US Department of HUD/FHA, October 2018.
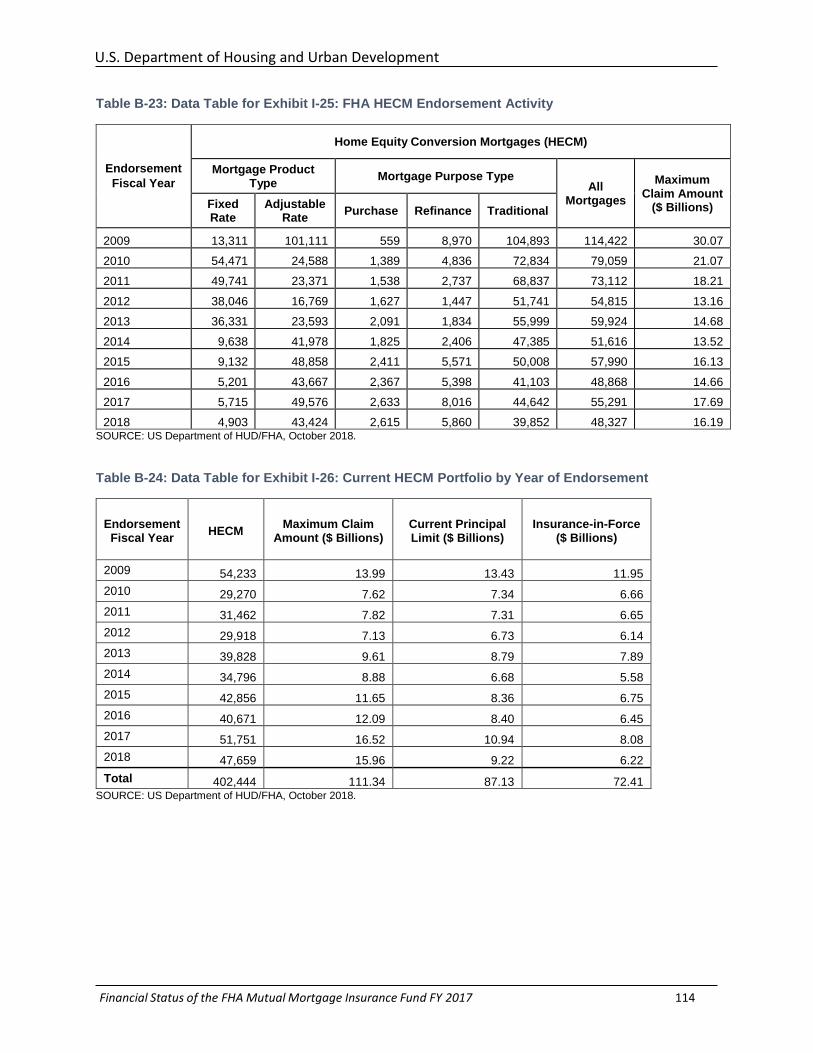
U.S. Department of Housing and Urban Development
Financial Status of the FHA Mutual Mortgage Insurance Fund FY 2017 114
Table B-23: Data Table for Exhibit I-25: FHA HECM Endorsement Activity
Endorsement
Fiscal Year
Home Equity Conversion Mortgages (HECM)
Mortgage Product Type
Mortgage Purpose Type All
Mortgages
Maximum Claim Amount
($ Billions) Fixed Rate
Adjustable Rate
Purchase Refinance Traditional
2009 13,311 101,111 559 8,970 104,893 114,422 30.07
2010 54,471 24,588 1,389 4,836 72,834 79,059 21.07
2011 49,741 23,371 1,538 2,737 68,837 73,112 18.21
2012 38,046 16,769 1,627 1,447 51,741 54,815 13.16
2013 36,331 23,593 2,091 1,834 55,999 59,924 14.68
2014 9,638 41,978 1,825 2,406 47,385 51,616 13.52
2015 9,132 48,858 2,411 5,571 50,008 57,990 16.13
2016 5,201 43,667 2,367 5,398 41,103 48,868 14.66
2017 5,715 49,576 2,633 8,016 44,642 55,291 17.69
2018 4,903 43,424 2,615 5,860 39,852 48,327 16.19 SOURCE: US Department of HUD/FHA, October 2018.
Table B-24: Data Table for Exhibit I-26: Current HECM Portfolio by Year of Endorsement
Endorsement Fiscal Year
HECM Maximum Claim
Amount ($ Billions) Current Principal Limit ($ Billions)
Insurance-in-Force ($ Billions)
2009 54,233 13.99 13.43 11.95
2010 29,270 7.62 7.34 6.66
2011 31,462 7.82 7.31 6.65
2012 29,918 7.13 6.73 6.14
2013 39,828 9.61 8.79 7.89
2014 34,796 8.88 6.68 5.58
2015 42,856 11.65 8.36 6.75
2016 40,671 12.09 8.40 6.45
2017 51,751 16.52 10.94 8.08
2018 47,659 15.96 9.22 6.22
Total 402,444 111.34 87.13 72.41 SOURCE: US Department of HUD/FHA, October 2018.
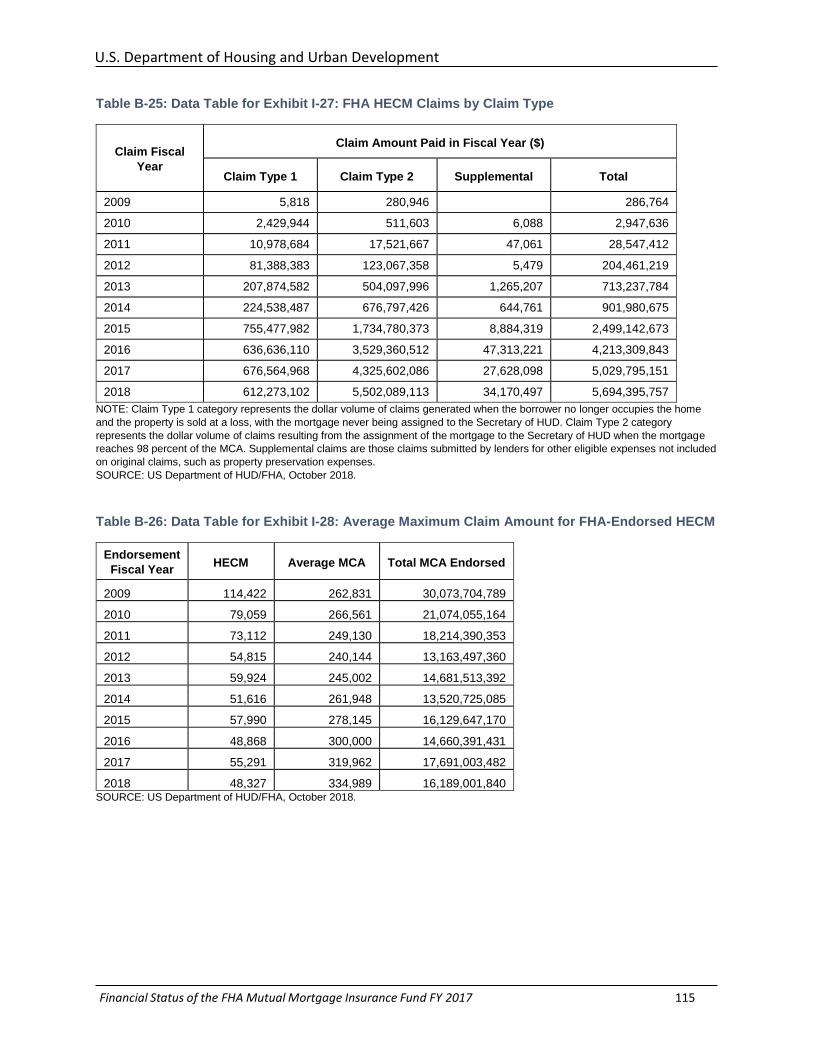
U.S. Department of Housing and Urban Development
Financial Status of the FHA Mutual Mortgage Insurance Fund FY 2017 115
Table B-25: Data Table for Exhibit I-27: FHA HECM Claims by Claim Type
Claim Fiscal
Year
Claim Amount Paid in Fiscal Year ($)
Claim Type 1 Claim Type 2 Supplemental Total
2009 5,818 280,946 286,764
2010 2,429,944 511,603 6,088 2,947,636
2011 10,978,684 17,521,667 47,061 28,547,412
2012 81,388,383 123,067,358 5,479 204,461,219
2013 207,874,582 504,097,996 1,265,207 713,237,784
2014 224,538,487 676,797,426 644,761 901,980,675
2015 755,477,982 1,734,780,373 8,884,319 2,499,142,673
2016 636,636,110 3,529,360,512 47,313,221 4,213,309,843
2017 676,564,968 4,325,602,086 27,628,098 5,029,795,151
2018 612,273,102 5,502,089,113 34,170,497 5,694,395,757
NOTE: Claim Type 1 category represents the dollar volume of claims generated when the borrower no longer occupies the home
and the property is sold at a loss, with the mortgage never being assigned to the Secretary of HUD. Claim Type 2 category
represents the dollar volume of claims resulting from the assignment of the mortgage to the Secretary of HUD when the mortgage
reaches 98 percent of the MCA. Supplemental claims are those claims submitted by lenders for other eligible expenses not included
on original claims, such as property preservation expenses.
SOURCE: US Department of HUD/FHA, October 2018.
Table B-26: Data Table for Exhibit I-28: Average Maximum Claim Amount for FHA-Endorsed HECM
Endorsement
Fiscal Year HECM Average MCA Total MCA Endorsed
2009 114,422 262,831 30,073,704,789
2010 79,059 266,561 21,074,055,164
2011 73,112 249,130 18,214,390,353
2012 54,815 240,144 13,163,497,360
2013 59,924 245,002 14,681,513,392
2014 51,616 261,948 13,520,725,085
2015 57,990 278,145 16,129,647,170
2016 48,868 300,000 14,660,391,431
2017 55,291 319,962 17,691,003,482
2018 48,327 334,989 16,189,001,840 SOURCE: US Department of HUD/FHA, October 2018.
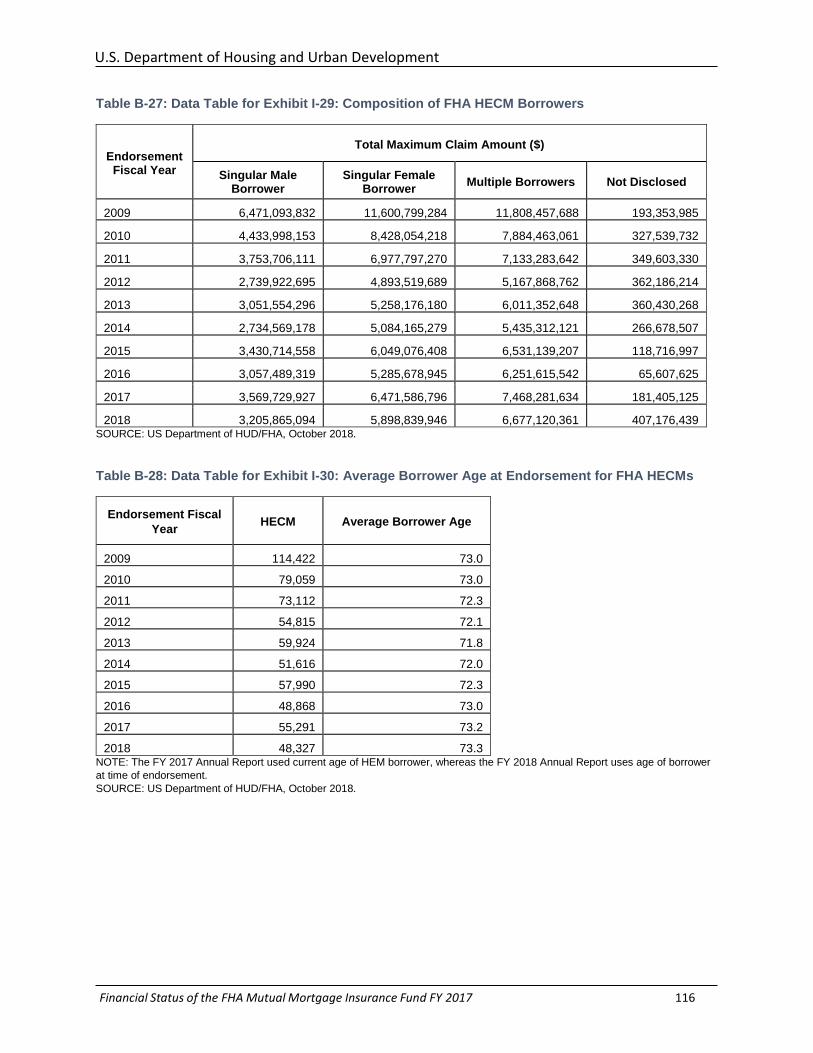
U.S. Department of Housing and Urban Development
Financial Status of the FHA Mutual Mortgage Insurance Fund FY 2017 116
Table B-27: Data Table for Exhibit I-29: Composition of FHA HECM Borrowers
Endorsement Fiscal Year
Total Maximum Claim Amount ($)
Singular Male Borrower
Singular Female Borrower
Multiple Borrowers Not Disclosed
2009 6,471,093,832 11,600,799,284 11,808,457,688 193,353,985
2010 4,433,998,153 8,428,054,218 7,884,463,061 327,539,732
2011 3,753,706,111 6,977,797,270 7,133,283,642 349,603,330
2012 2,739,922,695 4,893,519,689 5,167,868,762 362,186,214
2013 3,051,554,296 5,258,176,180 6,011,352,648 360,430,268
2014 2,734,569,178 5,084,165,279 5,435,312,121 266,678,507
2015 3,430,714,558 6,049,076,408 6,531,139,207 118,716,997
2016 3,057,489,319 5,285,678,945 6,251,615,542 65,607,625
2017 3,569,729,927 6,471,586,796 7,468,281,634 181,405,125
2018 3,205,865,094 5,898,839,946 6,677,120,361 407,176,439 SOURCE: US Department of HUD/FHA, October 2018.
Table B-28: Data Table for Exhibit I-30: Average Borrower Age at Endorsement for FHA HECMs
Endorsement Fiscal
Year HECM Average Borrower Age
2009 114,422 73.0
2010 79,059 73.0
2011 73,112 72.3
2012 54,815 72.1
2013 59,924 71.8
2014 51,616 72.0
2015 57,990 72.3
2016 48,868 73.0
2017 55,291 73.2
2018 48,327 73.3 NOTE: The FY 2017 Annual Report used current age of HEM borrower, whereas the FY 2018 Annual Report uses age of borrower
at time of endorsement.
SOURCE: US Department of HUD/FHA, October 2018.
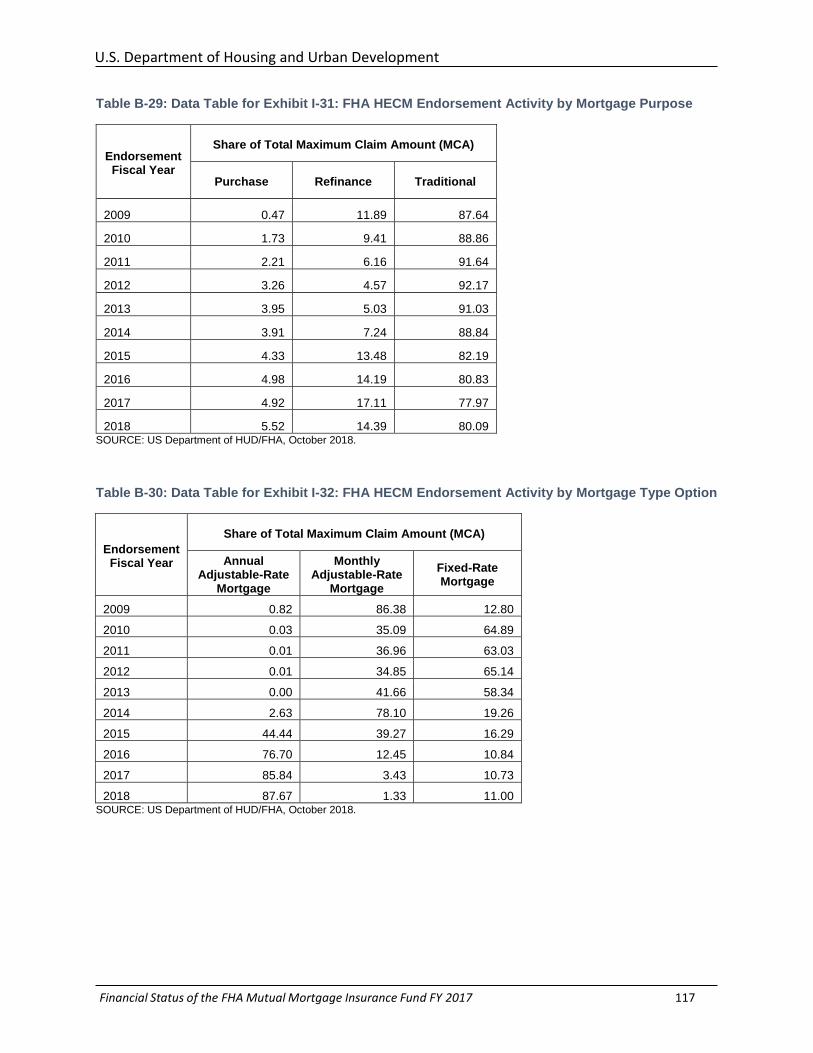
U.S. Department of Housing and Urban Development
Financial Status of the FHA Mutual Mortgage Insurance Fund FY 2017 117
Table B-29: Data Table for Exhibit I-31: FHA HECM Endorsement Activity by Mortgage Purpose
Endorsement Fiscal Year
Share of Total Maximum Claim Amount (MCA)
Purchase Refinance Traditional
2009 0.47 11.89 87.64
2010 1.73 9.41 88.86
2011 2.21 6.16 91.64
2012 3.26 4.57 92.17
2013 3.95 5.03 91.03
2014 3.91 7.24 88.84
2015 4.33 13.48 82.19
2016 4.98 14.19 80.83
2017 4.92 17.11 77.97
2018 5.52 14.39 80.09 SOURCE: US Department of HUD/FHA, October 2018.
Table B-30: Data Table for Exhibit I-32: FHA HECM Endorsement Activity by Mortgage Type Option
Endorsement Fiscal Year
Share of Total Maximum Claim Amount (MCA)
Annual Adjustable-Rate
Mortgage
Monthly Adjustable-Rate
Mortgage
Fixed-Rate Mortgage
2009 0.82 86.38 12.80
2010 0.03 35.09 64.89
2011 0.01 36.96 63.03
2012 0.01 34.85 65.14
2013 0.00 41.66 58.34
2014 2.63 78.10 19.26
2015 44.44 39.27 16.29
2016 76.70 12.45 10.84
2017 85.84 3.43 10.73
2018 87.67 1.33 11.00 SOURCE: US Department of HUD/FHA, October 2018.
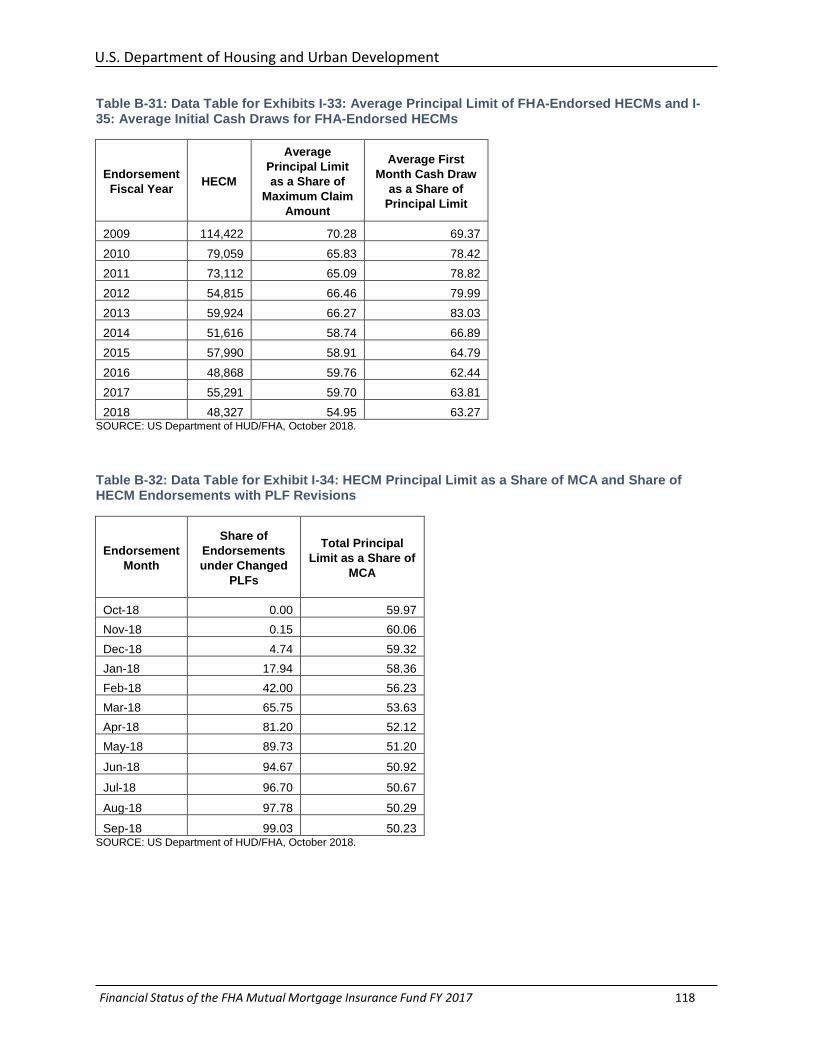
U.S. Department of Housing and Urban Development
Financial Status of the FHA Mutual Mortgage Insurance Fund FY 2017 118
Table B-31: Data Table for Exhibits I-33: Average Principal Limit of FHA-Endorsed HECMs and I-35: Average Initial Cash Draws for FHA-Endorsed HECMs
Endorsement
Fiscal Year HECM
Average
Principal Limit
as a Share of
Maximum Claim
Amount
Average First
Month Cash Draw
as a Share of
Principal Limit
2009 114,422 70.28 69.37
2010 79,059 65.83 78.42
2011 73,112 65.09 78.82
2012 54,815 66.46 79.99
2013 59,924 66.27 83.03
2014 51,616 58.74 66.89
2015 57,990 58.91 64.79
2016 48,868 59.76 62.44
2017 55,291 59.70 63.81
2018 48,327 54.95 63.27 SOURCE: US Department of HUD/FHA, October 2018.
Table B-32: Data Table for Exhibit I-34: HECM Principal Limit as a Share of MCA and Share of HECM Endorsements with PLF Revisions
Endorsement
Month
Share of
Endorsements
under Changed
PLFs
Total Principal
Limit as a Share of
MCA
Oct-18 0.00 59.97
Nov-18 0.15 60.06
Dec-18 4.74 59.32
Jan-18 17.94 58.36
Feb-18 42.00 56.23
Mar-18 65.75 53.63
Apr-18 81.20 52.12
May-18 89.73 51.20
Jun-18 94.67 50.92
Jul-18 96.70 50.67
Aug-18 97.78 50.29
Sep-18 99.03 50.23 SOURCE: US Department of HUD/FHA, October 2018.
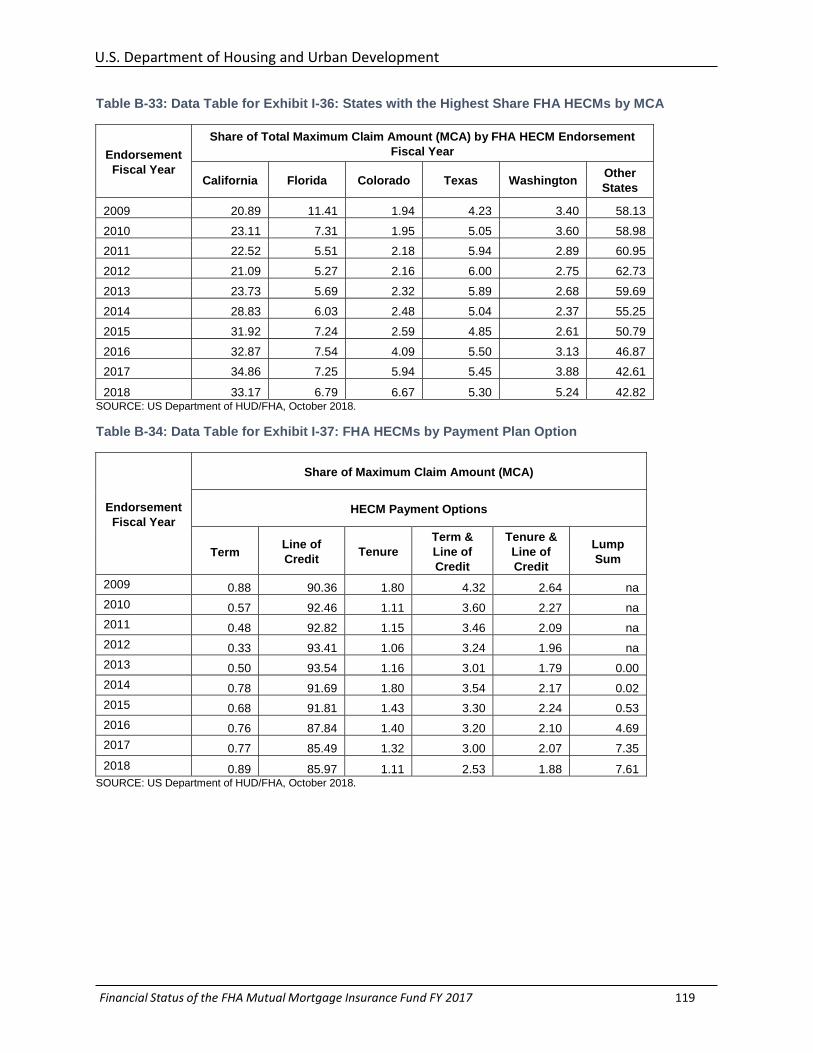
U.S. Department of Housing and Urban Development
Financial Status of the FHA Mutual Mortgage Insurance Fund FY 2017 119
Table B-33: Data Table for Exhibit I-36: States with the Highest Share FHA HECMs by MCA
Endorsement
Fiscal Year
Share of Total Maximum Claim Amount (MCA) by FHA HECM Endorsement
Fiscal Year
California Florida Colorado Texas Washington Other
States
2009 20.89 11.41 1.94 4.23 3.40 58.13
2010 23.11 7.31 1.95 5.05 3.60 58.98
2011 22.52 5.51 2.18 5.94 2.89 60.95
2012 21.09 5.27 2.16 6.00 2.75 62.73
2013 23.73 5.69 2.32 5.89 2.68 59.69
2014 28.83 6.03 2.48 5.04 2.37 55.25
2015 31.92 7.24 2.59 4.85 2.61 50.79
2016 32.87 7.54 4.09 5.50 3.13 46.87
2017 34.86 7.25 5.94 5.45 3.88 42.61
2018 33.17 6.79 6.67 5.30 5.24 42.82 SOURCE: US Department of HUD/FHA, October 2018.
Table B-34: Data Table for Exhibit I-37: FHA HECMs by Payment Plan Option
Endorsement
Fiscal Year
Share of Maximum Claim Amount (MCA)
HECM Payment Options
Term Line of
Credit Tenure
Term &
Line of
Credit
Tenure &
Line of
Credit
Lump
Sum
2009 0.88 90.36 1.80 4.32 2.64 na
2010 0.57 92.46 1.11 3.60 2.27 na
2011 0.48 92.82 1.15 3.46 2.09 na
2012 0.33 93.41 1.06 3.24 1.96 na
2013 0.50 93.54 1.16 3.01 1.79 0.00
2014 0.78 91.69 1.80 3.54 2.17 0.02
2015 0.68 91.81 1.43 3.30 2.24 0.53
2016 0.76 87.84 1.40 3.20 2.10 4.69
2017 0.77 85.49 1.32 3.00 2.07 7.35
2018 0.89 85.97 1.11 2.53 1.88 7.61 SOURCE: US Department of HUD/FHA, October 2018.
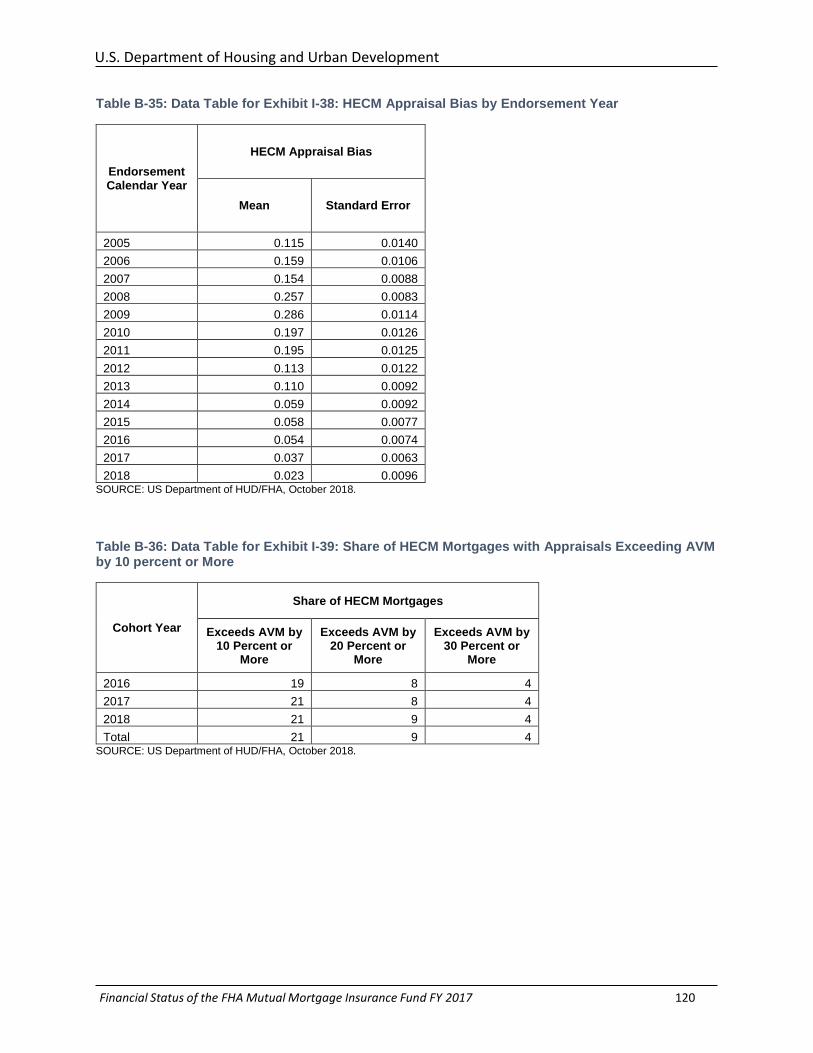
U.S. Department of Housing and Urban Development
Financial Status of the FHA Mutual Mortgage Insurance Fund FY 2017 120
Table B-35: Data Table for Exhibit I-38: HECM Appraisal Bias by Endorsement Year
Endorsement Calendar Year
HECM Appraisal Bias
Mean Standard Error
2005 0.115 0.0140
2006 0.159 0.0106
2007 0.154 0.0088
2008 0.257 0.0083
2009 0.286 0.0114
2010 0.197 0.0126
2011 0.195 0.0125
2012 0.113 0.0122
2013 0.110 0.0092
2014 0.059 0.0092
2015 0.058 0.0077
2016 0.054 0.0074
2017 0.037 0.0063
2018 0.023 0.0096 SOURCE: US Department of HUD/FHA, October 2018.
Table B-36: Data Table for Exhibit I-39: Share of HECM Mortgages with Appraisals Exceeding AVM by 10 percent or More
Cohort Year
Share of HECM Mortgages
Exceeds AVM by 10 Percent or
More
Exceeds AVM by 20 Percent or
More
Exceeds AVM by 30 Percent or
More
2016 19 8 4
2017 21 8 4
2018 21 9 4
Total 21 9 4 SOURCE: US Department of HUD/FHA, October 2018.
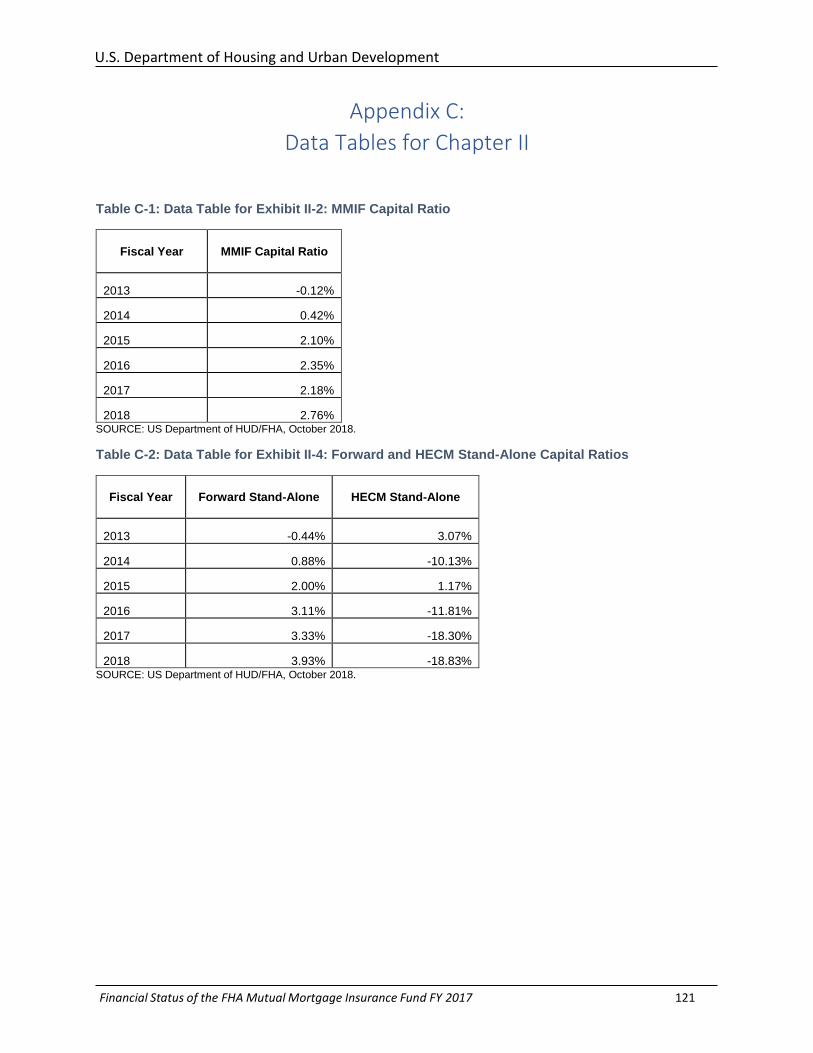
U.S. Department of Housing and Urban Development
Financial Status of the FHA Mutual Mortgage Insurance Fund FY 2017 121
Appendix C:
Data Tables for Chapter II
Table C-1: Data Table for Exhibit II-2: MMIF Capital Ratio
Fiscal Year MMIF Capital Ratio
2013 -0.12%
2014 0.42%
2015 2.10%
2016 2.35%
2017 2.18%
2018 2.76% SOURCE: US Department of HUD/FHA, October 2018.
Table C-2: Data Table for Exhibit II-4: Forward and HECM Stand-Alone Capital Ratios
Fiscal Year Forward Stand-Alone HECM Stand-Alone
2013 -0.44% 3.07%
2014 0.88% -10.13%
2015 2.00% 1.17%
2016 3.11% -11.81%
2017 3.33% -18.30%
2018 3.93% -18.83% SOURCE: US Department of HUD/FHA, October 2018.
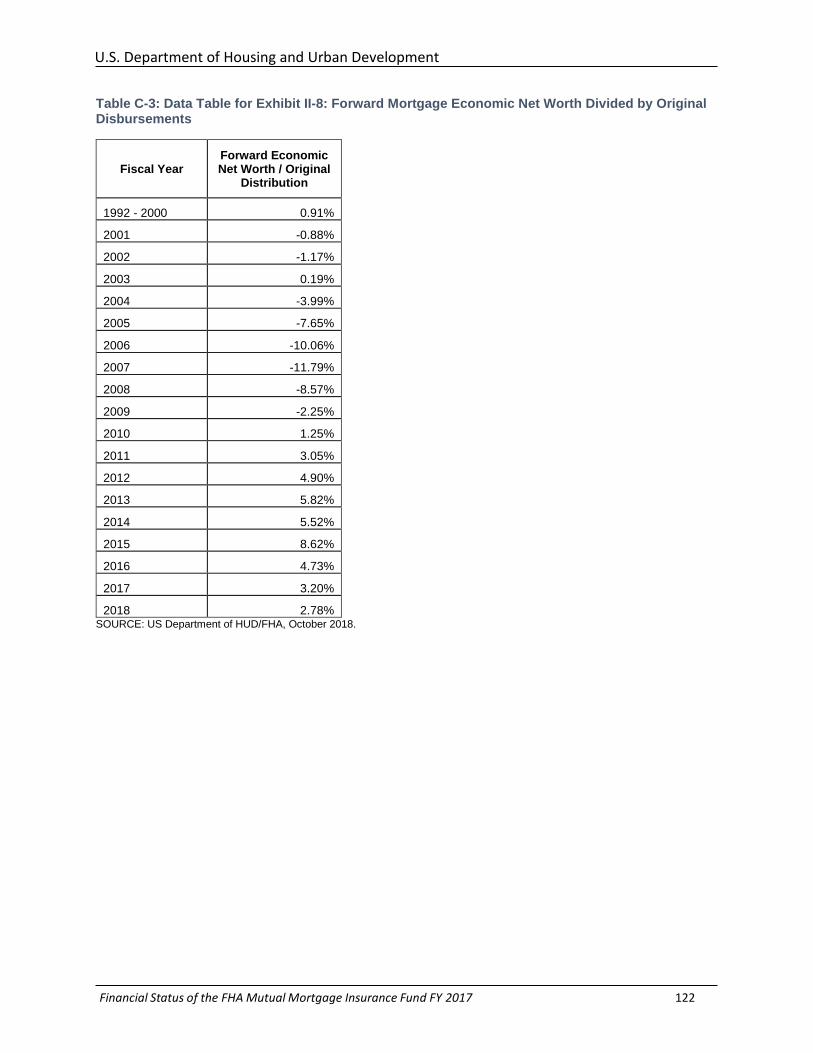
U.S. Department of Housing and Urban Development
Financial Status of the FHA Mutual Mortgage Insurance Fund FY 2017 122
Table C-3: Data Table for Exhibit II-8: Forward Mortgage Economic Net Worth Divided by Original Disbursements
Fiscal Year Forward Economic Net Worth / Original
Distribution
1992 - 2000 0.91%
2001 -0.88%
2002 -1.17%
2003 0.19%
2004 -3.99%
2005 -7.65%
2006 -10.06%
2007 -11.79%
2008 -8.57%
2009 -2.25%
2010 1.25%
2011 3.05%
2012 4.90%
2013 5.82%
2014 5.52%
2015 8.62%
2016 4.73%
2017 3.20%
2018 2.78% SOURCE: US Department of HUD/FHA, October 2018.
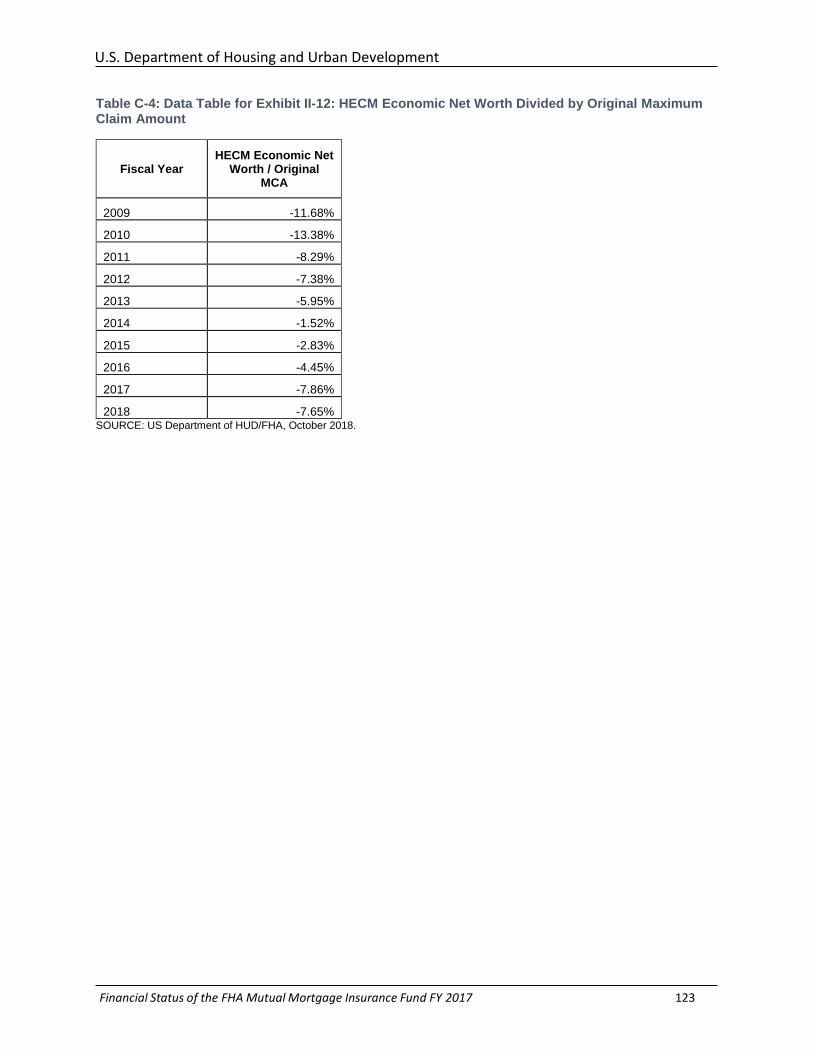
U.S. Department of Housing and Urban Development
Financial Status of the FHA Mutual Mortgage Insurance Fund FY 2017 123
Table C-4: Data Table for Exhibit II-12: HECM Economic Net Worth Divided by Original Maximum Claim Amount
Fiscal Year HECM Economic Net
Worth / Original MCA
2009 -11.68%
2010 -13.38%
2011 -8.29%
2012 -7.38%
2013 -5.95%
2014 -1.52%
2015 -2.83%
2016 -4.45%
2017 -7.86%
2018 -7.65% SOURCE: US Department of HUD/FHA, October 2018.
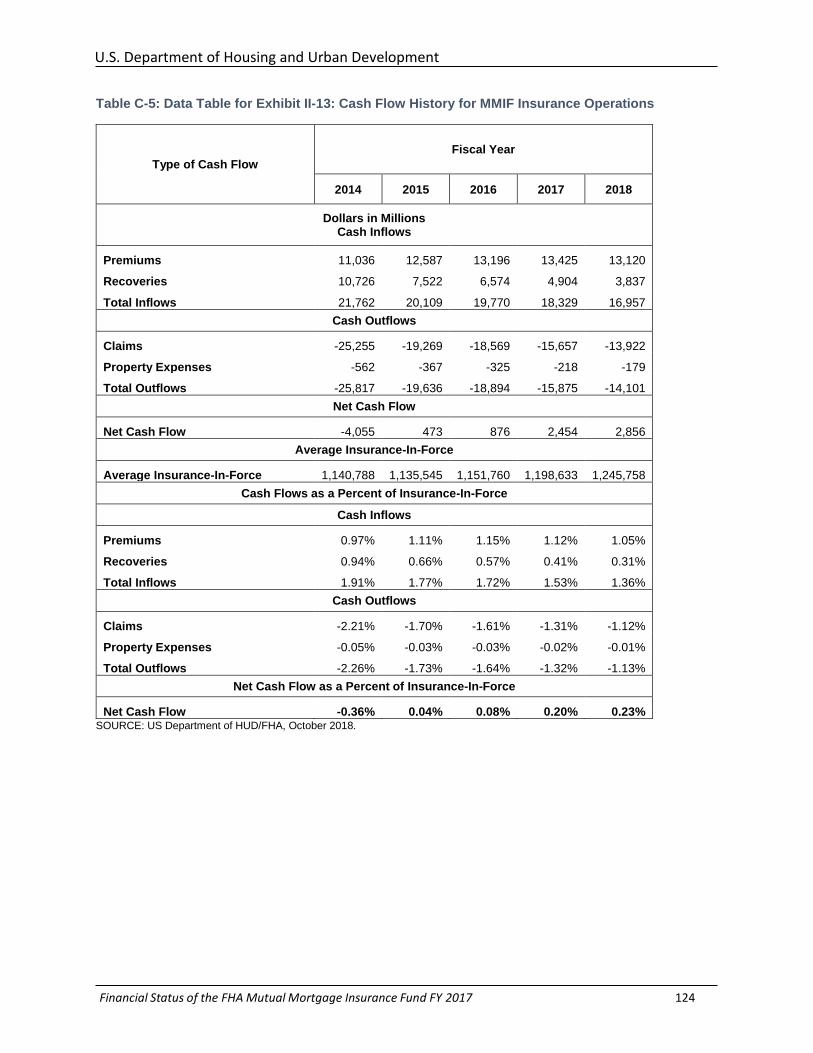
U.S. Department of Housing and Urban Development
Financial Status of the FHA Mutual Mortgage Insurance Fund FY 2017 124
Table C-5: Data Table for Exhibit II-13: Cash Flow History for MMIF Insurance Operations
Type of Cash Flow
Fiscal Year
2014 2015 2016 2017 2018
Dollars in Millions Cash Inflows
Premiums 11,036 12,587 13,196 13,425 13,120
Recoveries 10,726 7,522 6,574 4,904 3,837
Total Inflows 21,762 20,109 19,770 18,329 16,957
Cash Outflows
Claims -25,255 -19,269 -18,569 -15,657 -13,922
Property Expenses -562 -367 -325 -218 -179
Total Outflows -25,817 -19,636 -18,894 -15,875 -14,101
Net Cash Flow
Net Cash Flow -4,055 473 876 2,454 2,856
Average Insurance-In-Force
Average Insurance-In-Force 1,140,788 1,135,545 1,151,760 1,198,633 1,245,758
Cash Flows as a Percent of Insurance-In-Force
Cash Inflows
Premiums 0.97% 1.11% 1.15% 1.12% 1.05%
Recoveries 0.94% 0.66% 0.57% 0.41% 0.31%
Total Inflows 1.91% 1.77% 1.72% 1.53% 1.36%
Cash Outflows
Claims -2.21% -1.70% -1.61% -1.31% -1.12%
Property Expenses -0.05% -0.03% -0.03% -0.02% -0.01%
Total Outflows -2.26% -1.73% -1.64% -1.32% -1.13%
Net Cash Flow as a Percent of Insurance-In-Force
Net Cash Flow -0.36% 0.04% 0.08% 0.20% 0.23% SOURCE: US Department of HUD/FHA, October 2018.
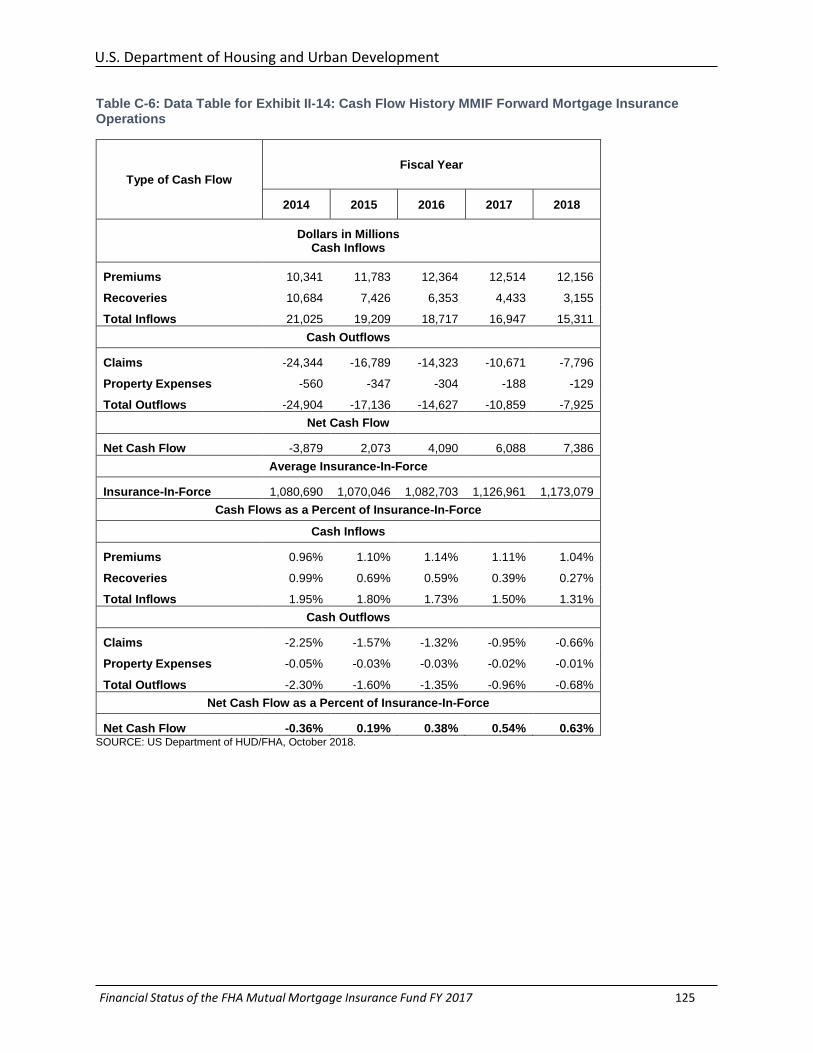
U.S. Department of Housing and Urban Development
Financial Status of the FHA Mutual Mortgage Insurance Fund FY 2017 125
Table C-6: Data Table for Exhibit II-14: Cash Flow History MMIF Forward Mortgage Insurance Operations
Type of Cash Flow
Fiscal Year
2014 2015 2016 2017 2018
Dollars in Millions Cash Inflows
Premiums 10,341 11,783 12,364 12,514 12,156
Recoveries 10,684 7,426 6,353 4,433 3,155
Total Inflows 21,025 19,209 18,717 16,947 15,311
Cash Outflows
Claims -24,344 -16,789 -14,323 -10,671 -7,796
Property Expenses -560 -347 -304 -188 -129
Total Outflows -24,904 -17,136 -14,627 -10,859 -7,925
Net Cash Flow
Net Cash Flow -3,879 2,073 4,090 6,088 7,386
Average Insurance-In-Force
Insurance-In-Force 1,080,690 1,070,046 1,082,703 1,126,961 1,173,079
Cash Flows as a Percent of Insurance-In-Force
Cash Inflows
Premiums 0.96% 1.10% 1.14% 1.11% 1.04%
Recoveries 0.99% 0.69% 0.59% 0.39% 0.27%
Total Inflows 1.95% 1.80% 1.73% 1.50% 1.31%
Cash Outflows
Claims -2.25% -1.57% -1.32% -0.95% -0.66%
Property Expenses -0.05% -0.03% -0.03% -0.02% -0.01%
Total Outflows -2.30% -1.60% -1.35% -0.96% -0.68%
Net Cash Flow as a Percent of Insurance-In-Force
Net Cash Flow -0.36% 0.19% 0.38% 0.54% 0.63% SOURCE: US Department of HUD/FHA, October 2018.
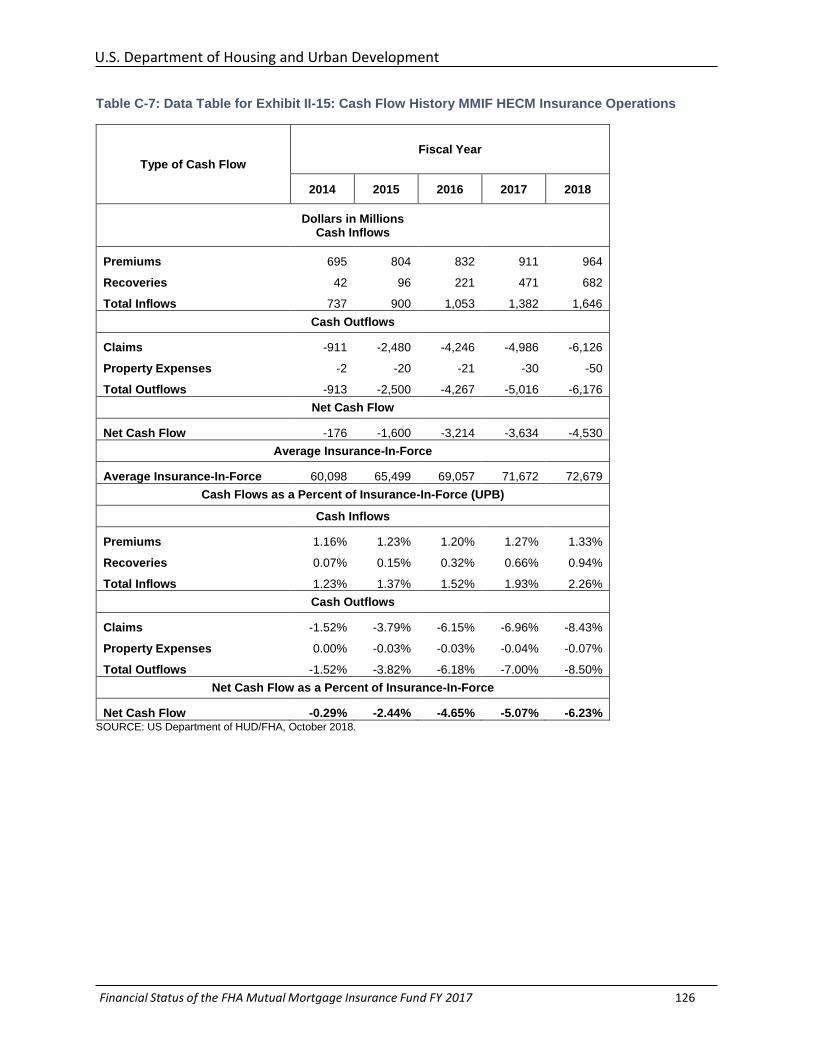
U.S. Department of Housing and Urban Development
Financial Status of the FHA Mutual Mortgage Insurance Fund FY 2017 126
Table C-7: Data Table for Exhibit II-15: Cash Flow History MMIF HECM Insurance Operations
Type of Cash Flow
Fiscal Year
2014 2015 2016 2017 2018
Dollars in Millions Cash Inflows
Premiums 695 804 832 911 964
Recoveries 42 96 221 471 682
Total Inflows 737 900 1,053 1,382 1,646
Cash Outflows
Claims -911 -2,480 -4,246 -4,986 -6,126
Property Expenses -2 -20 -21 -30 -50
Total Outflows -913 -2,500 -4,267 -5,016 -6,176
Net Cash Flow
Net Cash Flow -176 -1,600 -3,214 -3,634 -4,530
Average Insurance-In-Force
Average Insurance-In-Force 60,098 65,499 69,057 71,672 72,679
Cash Flows as a Percent of Insurance-In-Force (UPB)
Cash Inflows
Premiums 1.16% 1.23% 1.20% 1.27% 1.33%
Recoveries 0.07% 0.15% 0.32% 0.66% 0.94%
Total Inflows 1.23% 1.37% 1.52% 1.93% 2.26%
Cash Outflows
Claims -1.52% -3.79% -6.15% -6.96% -8.43%
Property Expenses 0.00% -0.03% -0.03% -0.04% -0.07%
Total Outflows -1.52% -3.82% -6.18% -7.00% -8.50%
Net Cash Flow as a Percent of Insurance-In-Force
Net Cash Flow -0.29% -2.44% -4.65% -5.07% -6.23% SOURCE: US Department of HUD/FHA, October 2018.
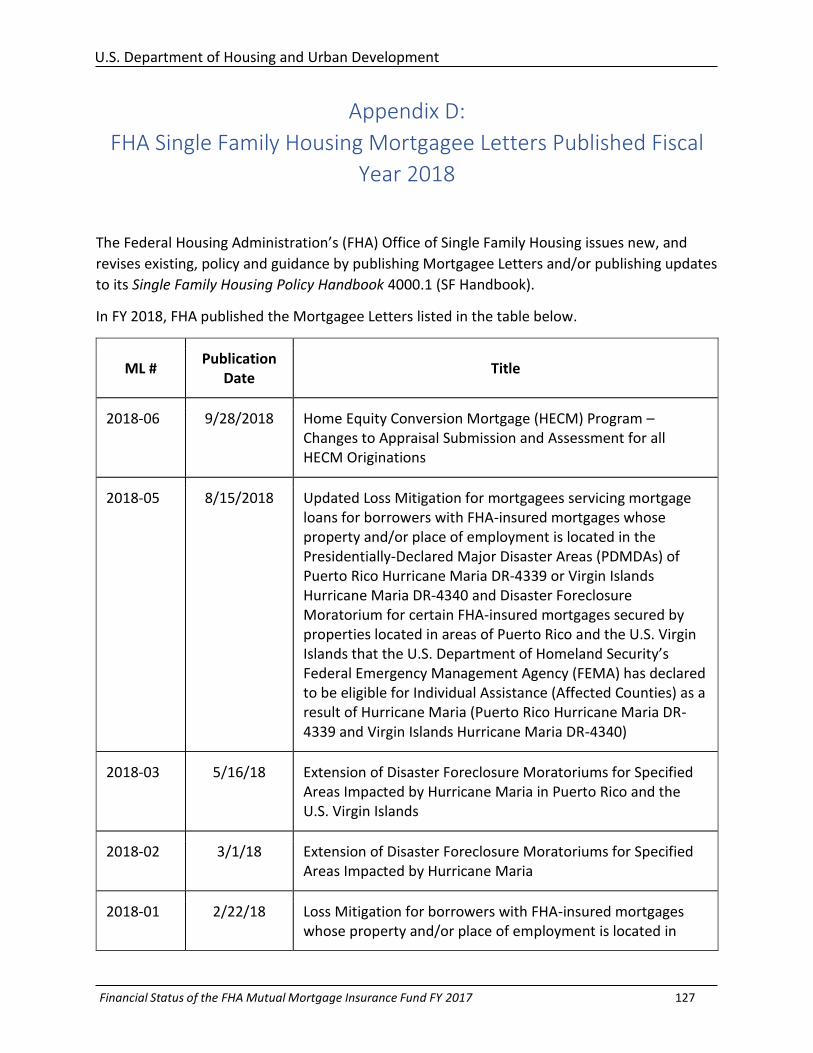
U.S. Department of Housing and Urban Development
Financial Status of the FHA Mutual Mortgage Insurance Fund FY 2017 127
Appendix D:
FHA Single Family Housing Mortgagee Letters Published Fiscal
Year 2018
The Federal Housing Administration’s (FHA) Office of Single Family Housing issues new, and
revises existing, policy and guidance by publishing Mortgagee Letters and/or publishing updates
to its Single Family Housing Policy Handbook 4000.1 (SF Handbook).
In FY 2018, FHA published the Mortgagee Letters listed in the table below.
ML # Publication
Date Title
2018-06 9/28/2018 Home Equity Conversion Mortgage (HECM) Program – Changes to Appraisal Submission and Assessment for all HECM Originations
2018-05 8/15/2018 Updated Loss Mitigation for mortgagees servicing mortgage loans for borrowers with FHA-insured mortgages whose property and/or place of employment is located in the Presidentially-Declared Major Disaster Areas (PDMDAs) of Puerto Rico Hurricane Maria DR-4339 or Virgin Islands Hurricane Maria DR-4340 and Disaster Foreclosure Moratorium for certain FHA-insured mortgages secured by properties located in areas of Puerto Rico and the U.S. Virgin Islands that the U.S. Department of Homeland Security’s Federal Emergency Management Agency (FEMA) has declared to be eligible for Individual Assistance (Affected Counties) as a result of Hurricane Maria (Puerto Rico Hurricane Maria DR-4339 and Virgin Islands Hurricane Maria DR-4340)
2018-03 5/16/18 Extension of Disaster Foreclosure Moratoriums for Specified Areas Impacted by Hurricane Maria in Puerto Rico and the U.S. Virgin Islands
2018-02 3/1/18 Extension of Disaster Foreclosure Moratoriums for Specified Areas Impacted by Hurricane Maria
2018-01 2/22/18 Loss Mitigation for borrowers with FHA-insured mortgages whose property and/or place of employment is located in
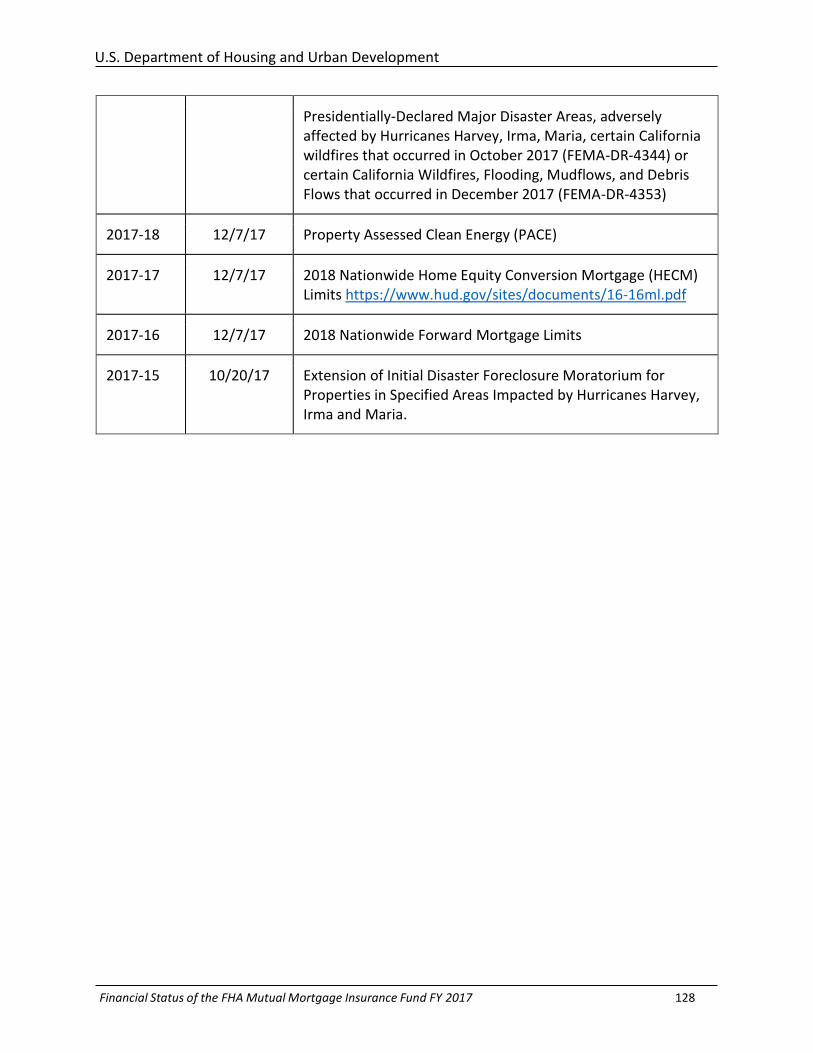
U.S. Department of Housing and Urban Development
Financial Status of the FHA Mutual Mortgage Insurance Fund FY 2017 128
Presidentially-Declared Major Disaster Areas, adversely affected by Hurricanes Harvey, Irma, Maria, certain California wildfires that occurred in October 2017 (FEMA-DR-4344) or certain California Wildfires, Flooding, Mudflows, and Debris Flows that occurred in December 2017 (FEMA-DR-4353)
2017-18 12/7/17 Property Assessed Clean Energy (PACE)
2017-17 12/7/17 2018 Nationwide Home Equity Conversion Mortgage (HECM) Limits https://www.hud.gov/sites/documents/16-16ml.pdf
2017-16 12/7/17 2018 Nationwide Forward Mortgage Limits
2017-15 10/20/17 Extension of Initial Disaster Foreclosure Moratorium for Properties in Specified Areas Impacted by Hurricanes Harvey, Irma and Maria.