Embed Size (px)
Citation preview
F o o d R e t a i l
I m p l i c a t i o n s f o r U . S
G r o c e r y S h o p p e r T r e n d s
J u l y 1 8 , 2 0 1 7
2pm ET
Conference line : 866 -269-6685 Conference ID: 9680617
International Dial In: +1-647-427-3128
FMI Antitrust Compliance
• It is FMI’s policy to comply in all respects with the antitrust laws.
• All participants in FMI meetings and events are expected to comply with applicable antitrust and competition laws.
• Avoid discussions of sensitive topics that can create antitrust concerns. o Agreements to fix prices, allocate markets, engage in product boycotts and to
refuse to deal with third parties are illegal.
o Discussions of prices (including elements of prices such as allowances and credit terms), quality ratings of suppliers, and discussions that may cause a competitor to cease purchasing from a particular supplier, or selling to a particular customer, should be avoided.
o No discussion that might be interpreted as a dividing up of territories.
• It is important to avoid even the appearance of unlawful activity.
• Questions or concerns? Please consult with FMI staff.
2

3
MEET YOUR PRESENTERS
Hilary Thesmar Chief Food & Product Safety Officer
David Fikes VP, Communications &
Consumer/Community Affairs
Sue Borra Chief Health & Wellness Officer
4
RESEARCH BACKGROUND For more than four decades, FMI has been tracking the trends of
grocery shoppers in the U.S., taking note of where they shop, how
they shop and what issues are most important to them as food
shoppers. For the past three years, FMI has partnered with the
Hartman Group to conduct this research.
METHODOLOGY:
Quantitative Research
• A 25-minute survey fielded online February 6-14, 2017 to 2,145
U.S. shoppers aged 18 and older. The sample was split to cover a
wider range of topics, with each sub-sample having n>1,000.
• Shoppers surveyed are responsible for at least 50% or more of the
grocery shopping in their household.
• Additional analysis includes previous FMI survey data, U.S. Census,
Bureau of Labor Statistics and Hartman Group syndicated reports.
Qualitative Research
• In-depth one-on-one 3-hour interviews with 9 consumers from 4
multi-person households and 1 single-person household in the
Atlanta area October 26-27, 2016.
• Five in-depth one-on-one virtual interviews with 5 shoppers across
the nation. These interviews were augmented with homework and
images provided by the consumer.
• 2013-2016 Hartman Group ethnographic research into cooking,
eating and shopping.
5
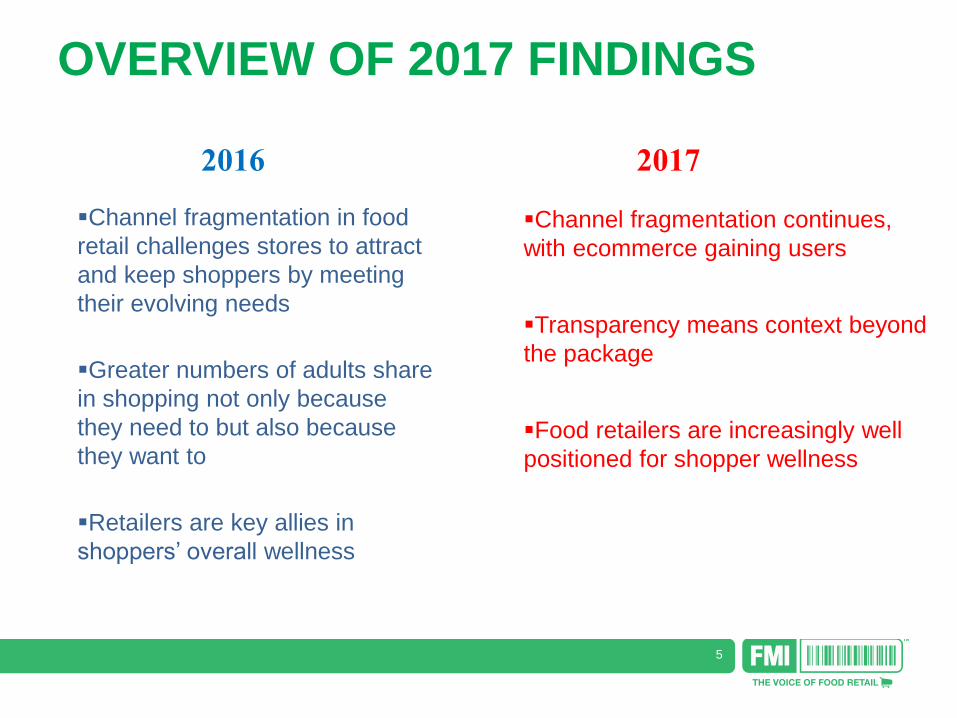
OVERVIEW OF 2017 FINDINGS
Channel fragmentation in food
retail challenges stores to attract
and keep shoppers by meeting
their evolving needs
Greater numbers of adults share
in shopping not only because
they need to but also because
they want to
Retailers are key allies in
shoppers’ overall wellness
Channel fragmentation continues,
with ecommerce gaining users
Transparency means context beyond
the package
Food retailers are increasingly well
positioned for shopper wellness
2016 2017
6
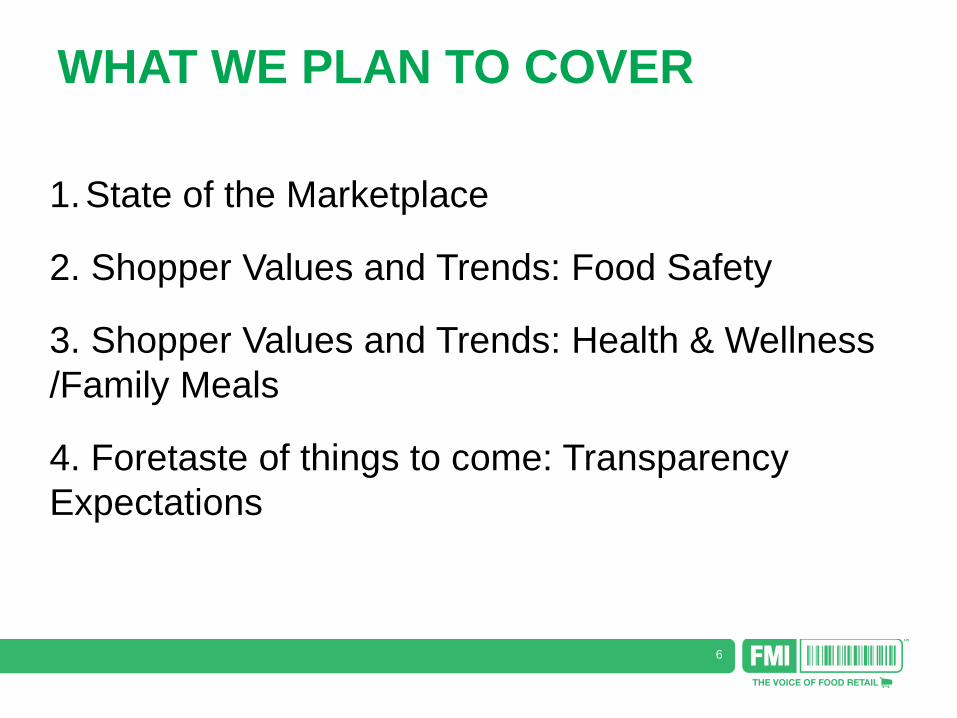
WHAT WE PLAN TO COVER
1.State of the Marketplace
2. Shopper Values and Trends: Food Safety
3. Shopper Values and Trends: Health & Wellness
/Family Meals
4. Foretaste of things to come: Transparency
Expectations
7
© 2
01
7 T
he
Har
tman
Gro
up
, In
c.
State of the Marketplace 01
8
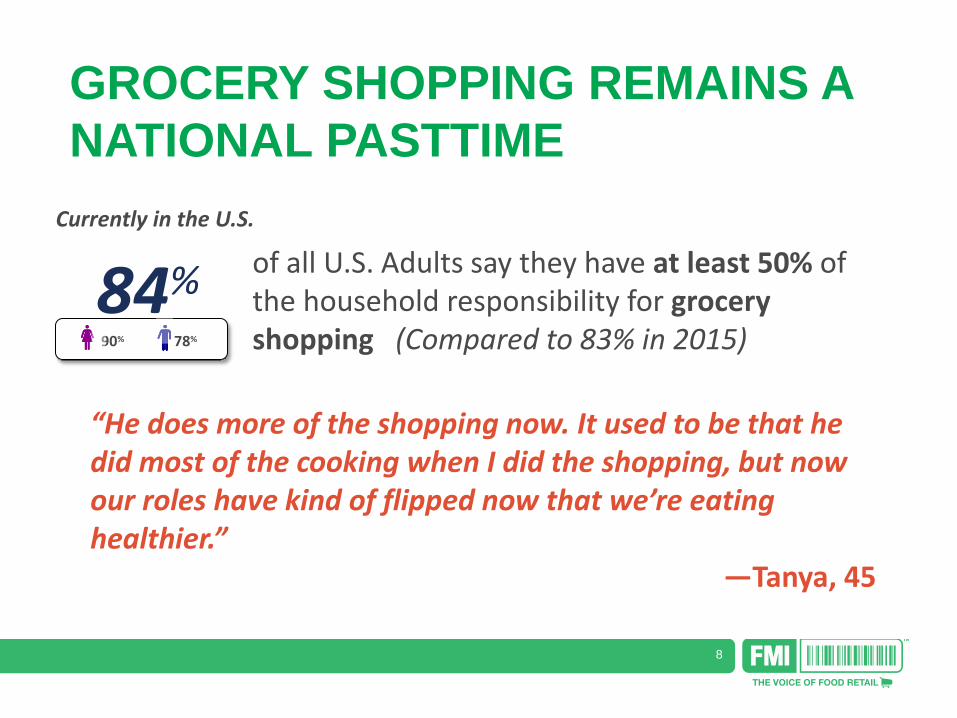
GROCERY SHOPPING REMAINS A
NATIONAL PASTTIME
of all U.S. Adults say they have at least 50% of the household responsibility for grocery shopping (Compared to 83% in 2015)
84%
“He does more of the shopping now. It used to be that he did most of the cooking when I did the shopping, but now our roles have kind of flipped now that we’re eating healthier.”
—Tanya, 45
Currently in the U.S.
90% 78%
9
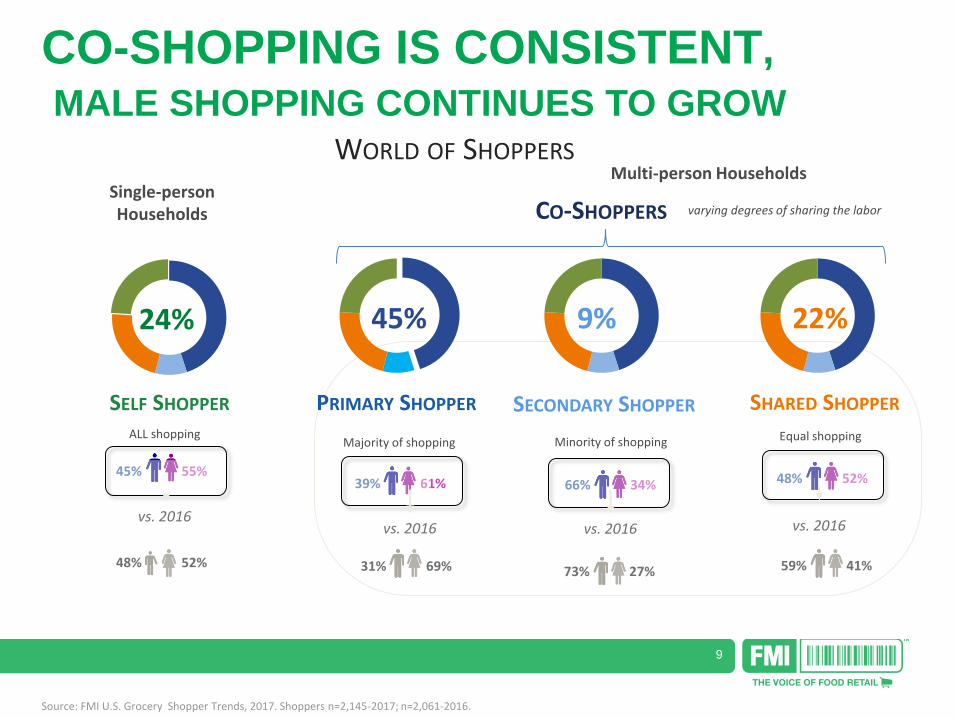
CO-SHOPPING IS CONSISTENT,
MALE SHOPPING CONTINUES TO GROW
Source: FMI U.S. Grocery Shopper Trends, 2017. Shoppers n=2,145-2017; n=2,061-2016.
Single-person Households
SELF SHOPPER
Majority of shopping Minority of shopping Equal shopping
Multi-person Households
ALL shopping
CO-SHOPPERS
WORLD OF SHOPPERS
45% 55% 39% 61% 66% 34% 48% 52%
24% 45% 22% 9%
PRIMARY SHOPPER SECONDARY SHOPPER SHARED SHOPPER
varying degrees of sharing the labor
48% 52% 31% 69% 73% 27% 59% 41%
vs. 2016 vs. 2016 vs. 2016 vs. 2016
10
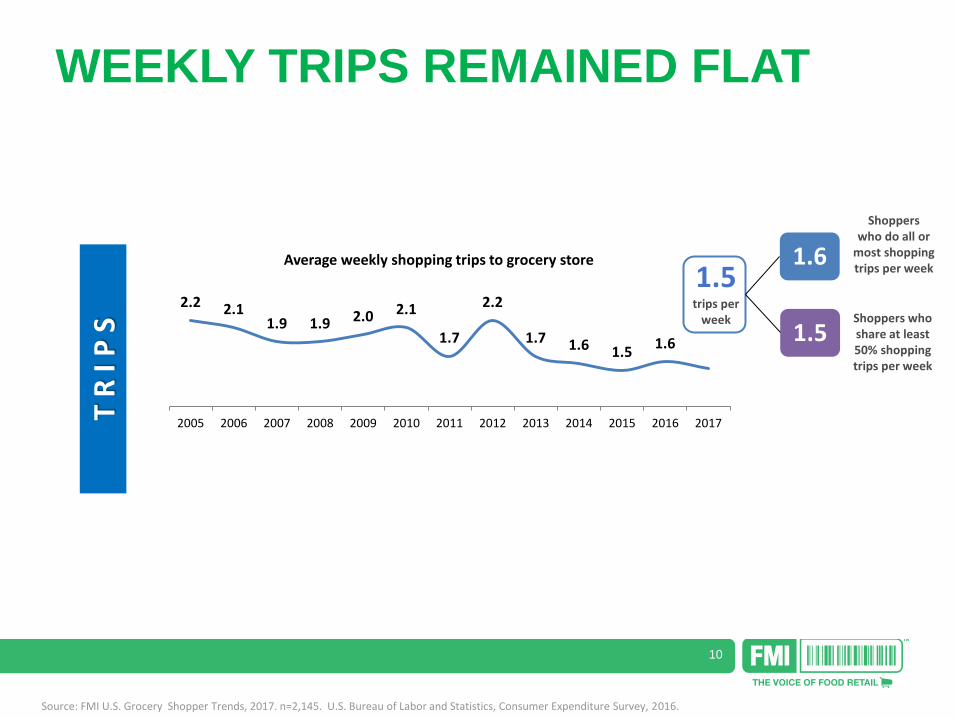
WEEKLY TRIPS REMAINED FLAT
2.2 2.1 1.9 1.9 2.0 2.1
1.7
2.2
1.7 1.6 1.5 1.6
2005 2006 2007 2008 2009 2010 2011 2012 2013 2014 2015 2016 2017
Average weekly shopping trips to grocery store
Source: FMI U.S. Grocery Shopper Trends, 2017. n=2,145. U.S. Bureau of Labor and Statistics, Consumer Expenditure Survey, 2016.
T R
I P
S
1.6
1.5
Shoppers who do all or
most shopping trips per week
Shoppers who share at least 50% shopping trips per week
1.5 trips per
week
11
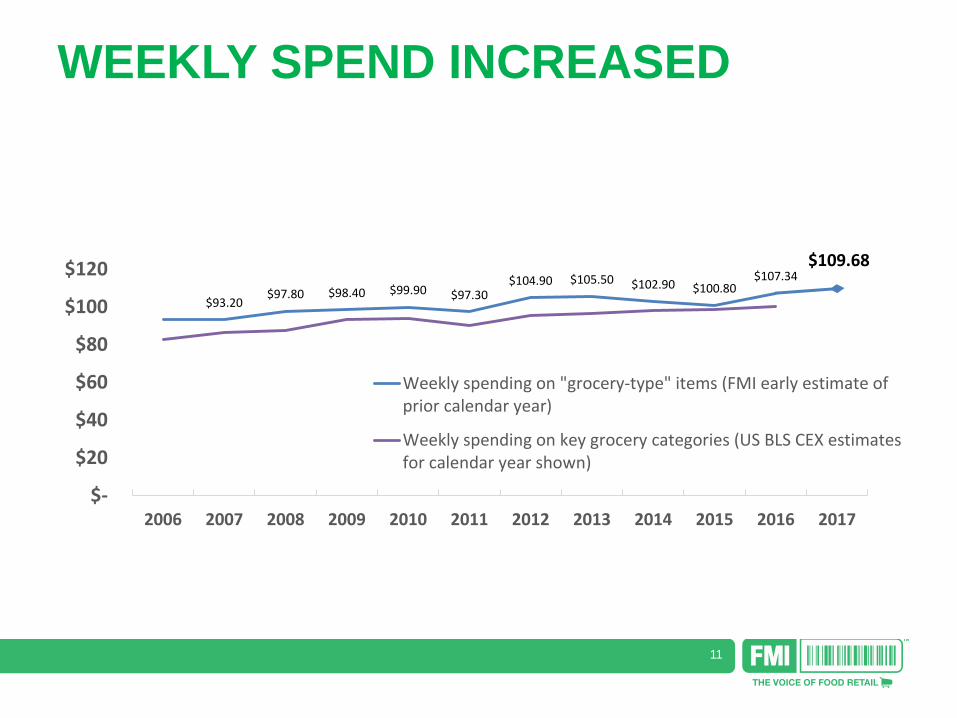
WEEKLY SPEND INCREASED
$93.20 $97.80 $98.40 $99.90 $97.30
$104.90 $105.50 $102.90 $100.80 $107.34
$109.68
$-
$20
$40
$60
$80
$100
$120
2006 2007 2008 2009 2010 2011 2012 2013 2014 2015 2016 2017
Weekly spending on "grocery-type" items (FMI early estimate ofprior calendar year)
Weekly spending on key grocery categories (US BLS CEX estimatesfor calendar year shown)
12
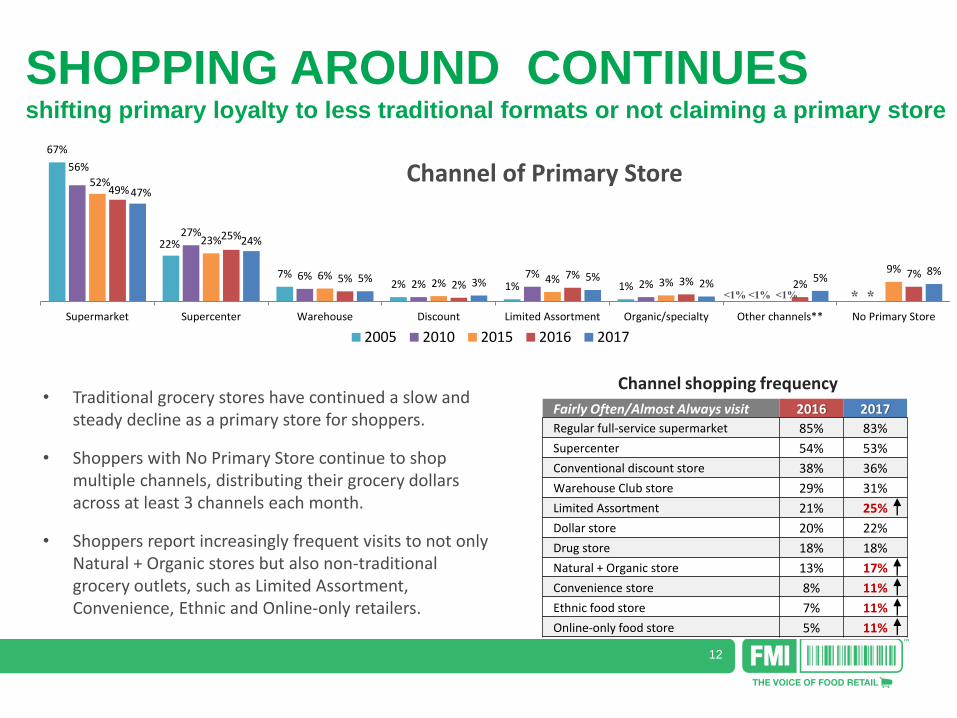
SHOPPING AROUND CONTINUES shifting primary loyalty to less traditional formats or not claiming a primary store
67%
22%
7% 2% 1% 1%
56%
27%
6% 2%
7% 2%
52%
23%
6% 2% 4% 3%
9%
49%
25%
5% 2%
7% 3% 2%
7%
47%
24%
5% 3% 5% 2% 5%
8%
Supermarket Supercenter Warehouse Discount Limited Assortment Organic/specialty Other channels** No Primary Store
2005 2010 2015 2016 2017
Channel of Primary Store
* *
• Traditional grocery stores have continued a slow and steady decline as a primary store for shoppers.
• Shoppers with No Primary Store continue to shop multiple channels, distributing their grocery dollars across at least 3 channels each month.
• Shoppers report increasingly frequent visits to not only Natural + Organic stores but also non-traditional grocery outlets, such as Limited Assortment, Convenience, Ethnic and Online-only retailers.
Fairly Often/Almost Always visit 2016 2017
Regular full-service supermarket 85% 83%
Supercenter 54% 53%
Conventional discount store 38% 36%
Warehouse Club store 29% 31%
Limited Assortment 21% 25%
Dollar store 20% 22%
Drug store 18% 18%
Natural + Organic store 13% 17%
Convenience store 8% 11%
Ethnic food store 7% 11%
Online-only food store 5% 11%
Channel shopping frequency
<1% <1% <1%
13
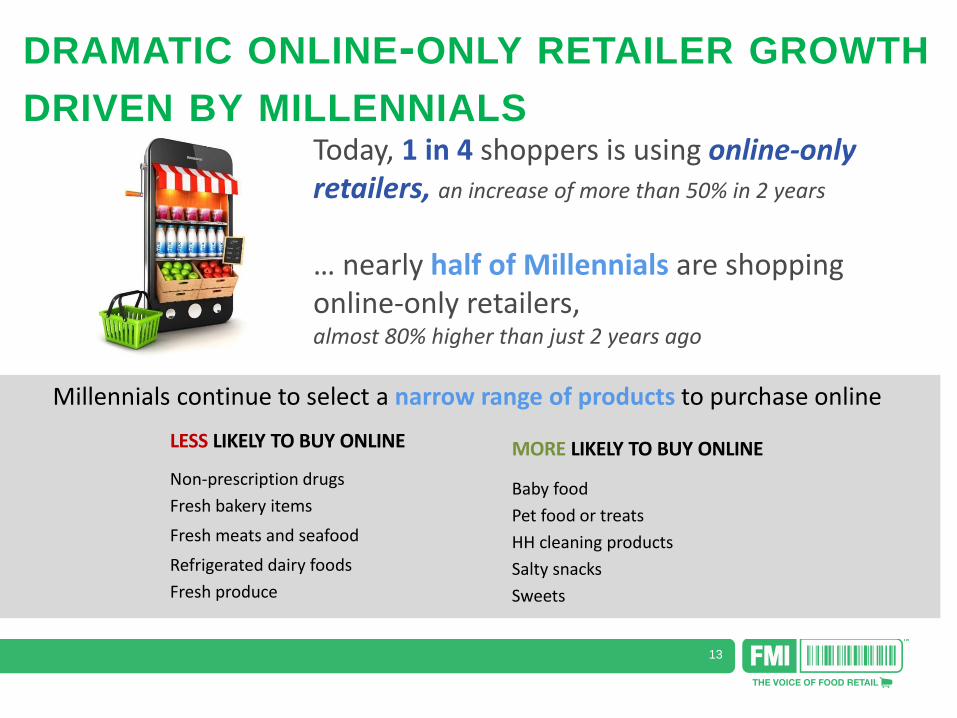
DRAMATIC ONLINE-ONLY RETAILER GROWTH
DRIVEN BY MILLENNIALS Today, 1 in 4 shoppers is using online-only retailers, an increase of more than 50% in 2 years
… nearly half of Millennials are shopping online-only retailers, almost 80% higher than just 2 years ago
LESS LIKELY TO BUY ONLINE
Non-prescription drugs
Fresh bakery items
Fresh meats and seafood
Refrigerated dairy foods
Fresh produce
Millennials continue to select a narrow range of products to purchase online
MORE LIKELY TO BUY ONLINE
Baby food
Pet food or treats
HH cleaning products
Salty snacks
Sweets
14
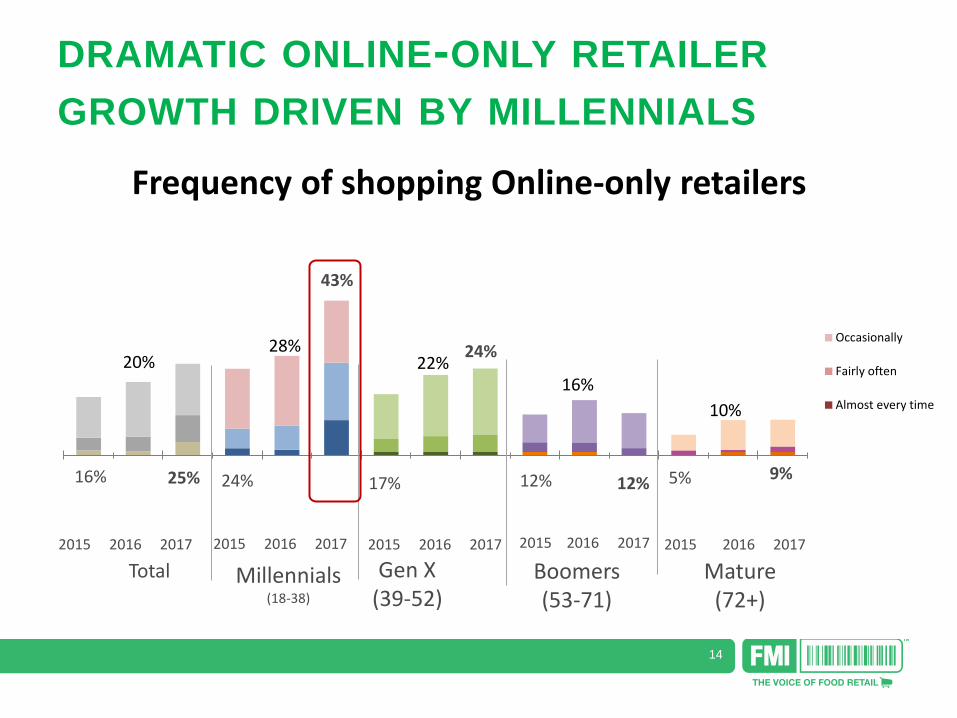
DRAMATIC ONLINE-ONLY RETAILER
GROWTH DRIVEN BY MILLENNIALS
Frequency of shopping Online-only retailers
Occasionally
Fairly often
Almost every time
20% 28%
22% 16%
10%
16% 24% 17% 12% 5% 25%
43%
24%
12% 9%
Total Millennials
(18-38)
Gen X (39-52)
Boomers (53-71)
Mature (72+)
2015 2016 2017 2015 2016 2017 2015 2016 2017 2015 2016 2017 2015 2016 2017
15
© 2
01
7 T
he
Har
tman
Gro
up
, In
c.
Shopper Trends and Values: Food Safety
02
16
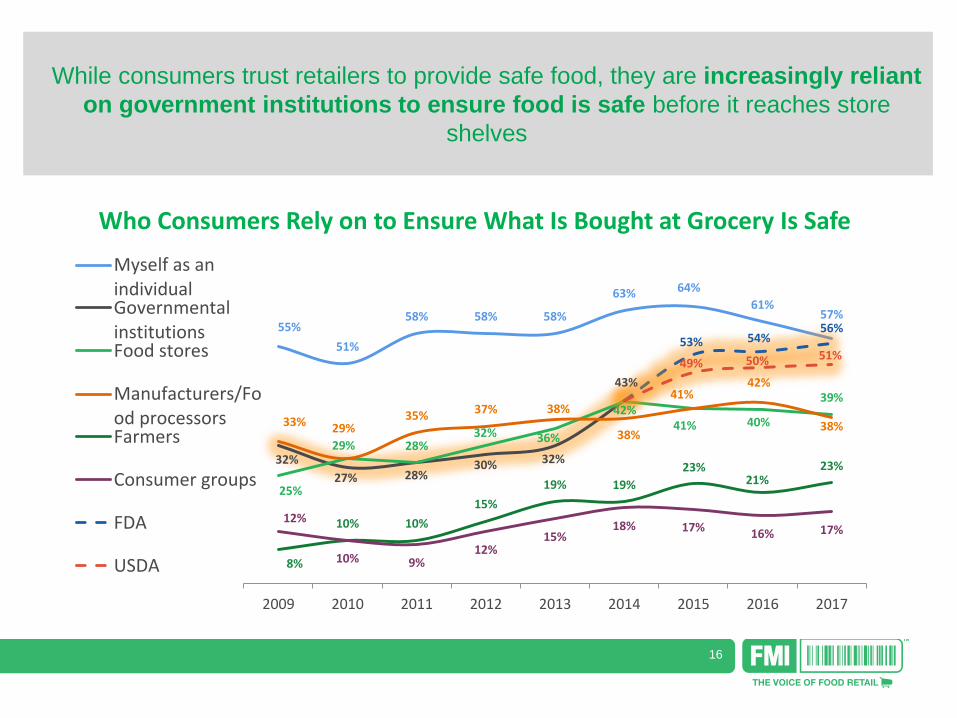
55%
51%
58% 58% 58%
63% 64%
61% 57%
32%
27% 28% 30% 32%
43%
25%
29% 28% 32% 36%
42% 41% 40%
39%
33% 29% 35% 37% 38%
38%
41% 42%
38%
8%
10% 10%
15%
19% 19%
23% 21%
23%
12%
10% 9% 12%
15% 18% 17% 16% 17%
53% 54% 56%
49% 50% 51%
2009 2010 2011 2012 2013 2014 2015 2016 2017
Myself as anindividualGovernmentalinstitutionsFood stores
Manufacturers/Food processorsFarmers
Consumer groups
FDA
USDA
Who Consumers Rely on to Ensure What Is Bought at Grocery Is Safe
While consumers trust retailers to provide safe food, they are increasingly reliant
on government institutions to ensure food is safe before it reaches store
shelves
17
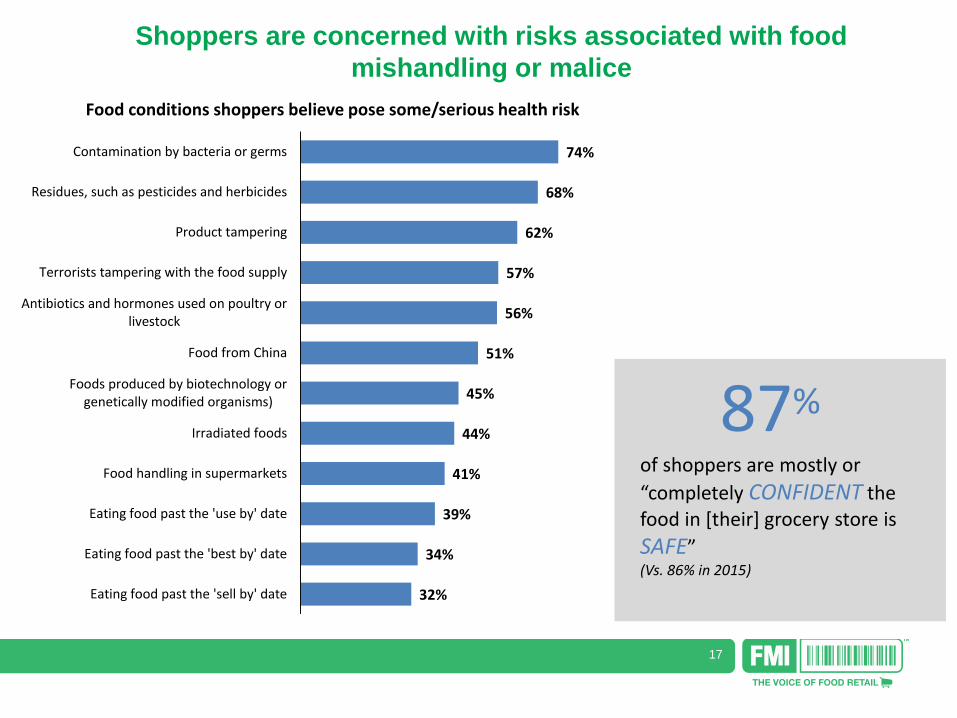
74%
68%
62%
57%
56%
51%
45%
44%
41%
39%
34%
32%
Contamination by bacteria or germs
Residues, such as pesticides and herbicides
Product tampering
Terrorists tampering with the food supply
Antibiotics and hormones used on poultry orlivestock
Food from China
Foods produced by biotechnology orgenetically modified organisms)
Irradiated foods
Food handling in supermarkets
Eating food past the 'use by' date
Eating food past the 'best by' date
Eating food past the 'sell by' date
Food conditions shoppers believe pose some/serious health risk
Shoppers are concerned with risks associated with food
mishandling or malice
87%
of shoppers are mostly or
“completely CONFIDENT the food in [their] grocery store is
SAFE” (Vs. 86% in 2015)
18
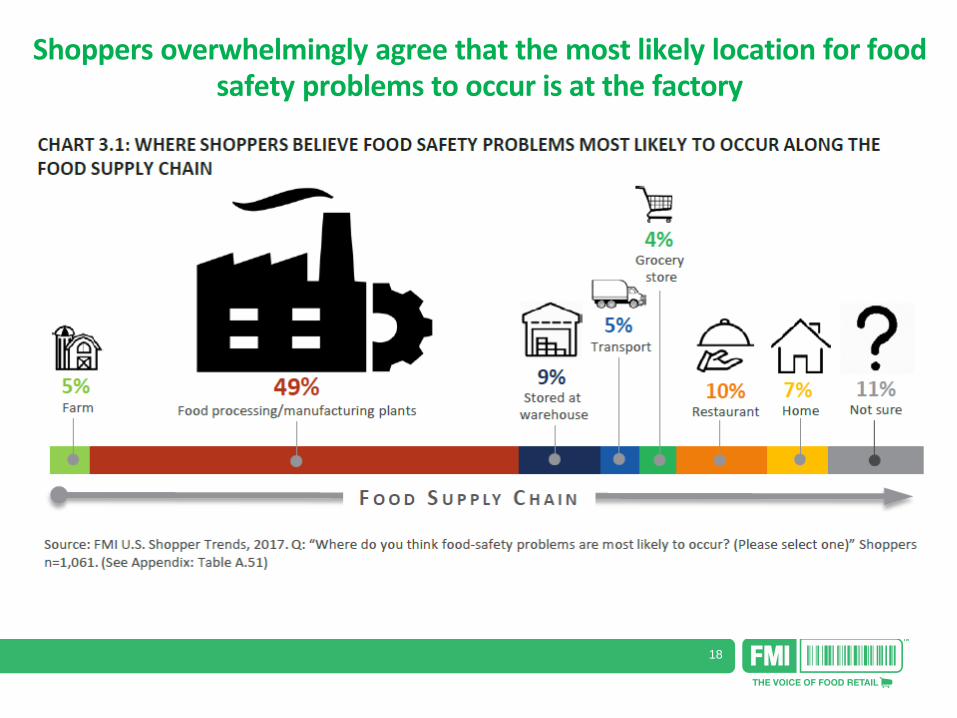
Shoppers overwhelmingly agree that the most likely location for food
safety problems to occur is at the factory
19
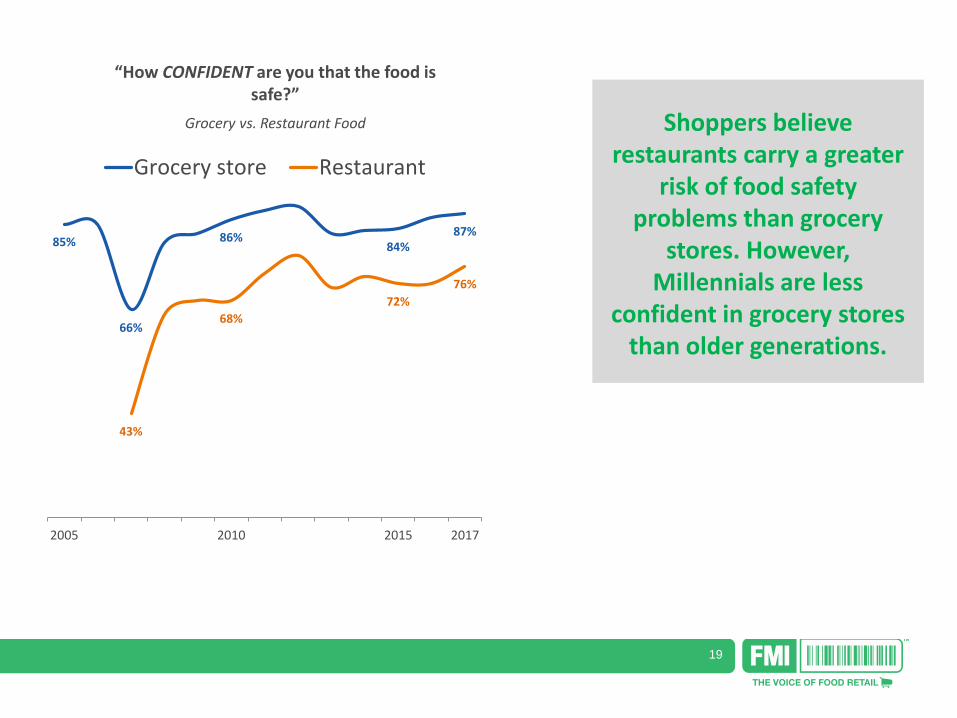
Shoppers believe restaurants carry a greater
risk of food safety problems than grocery
stores. However, Millennials are less
confident in grocery stores than older generations.
“How CONFIDENT are you that the food is safe?”
Grocery vs. Restaurant Food
85%
66%
86% 84%
87%
43%
68%
72%
76%
2005 2010 2015 2017
Grocery store Restaurant
20
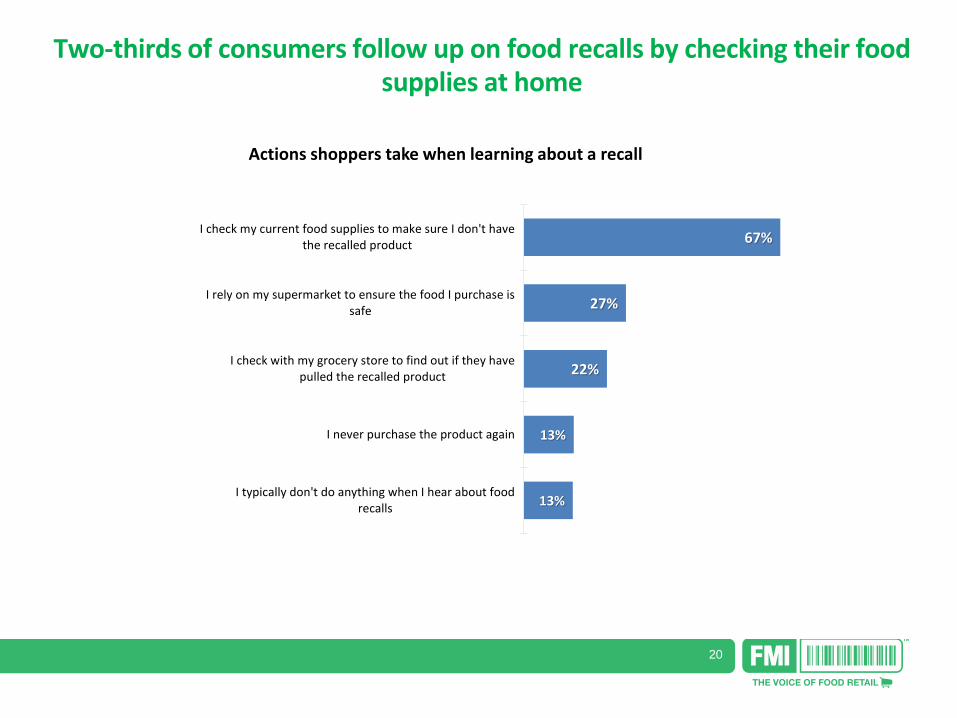
Two-thirds of consumers follow up on food recalls by checking their food
supplies at home
67%
27%
22%
13%
13%
I check my current food supplies to make sure I don't havethe recalled product
I rely on my supermarket to ensure the food I purchase issafe
I check with my grocery store to find out if they havepulled the recalled product
I never purchase the product again
I typically don't do anything when I hear about foodrecalls
Actions shoppers take when learning about a recall
21
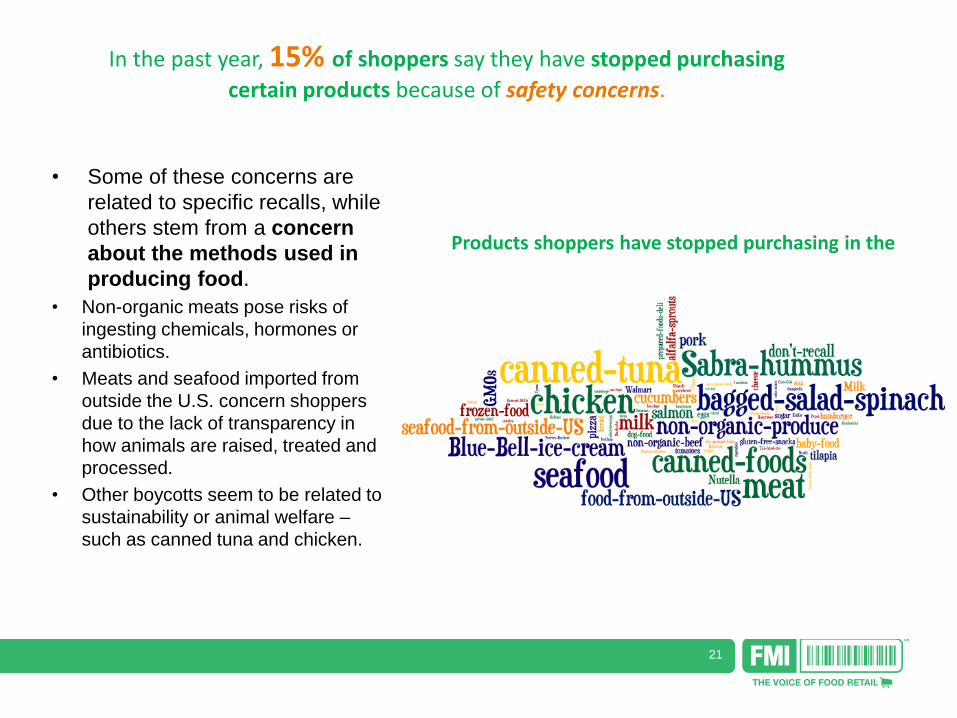
Products shoppers have stopped purchasing in the past year due to safety concerns
• Some of these concerns are
related to specific recalls, while
others stem from a concern
about the methods used in
producing food.
• Non-organic meats pose risks of
ingesting chemicals, hormones or
antibiotics.
• Meats and seafood imported from
outside the U.S. concern shoppers
due to the lack of transparency in
how animals are raised, treated and
processed.
• Other boycotts seem to be related to
sustainability or animal welfare –
such as canned tuna and chicken.
In the past year, 15% of shoppers say they have stopped purchasing
certain products because of safety concerns.
22
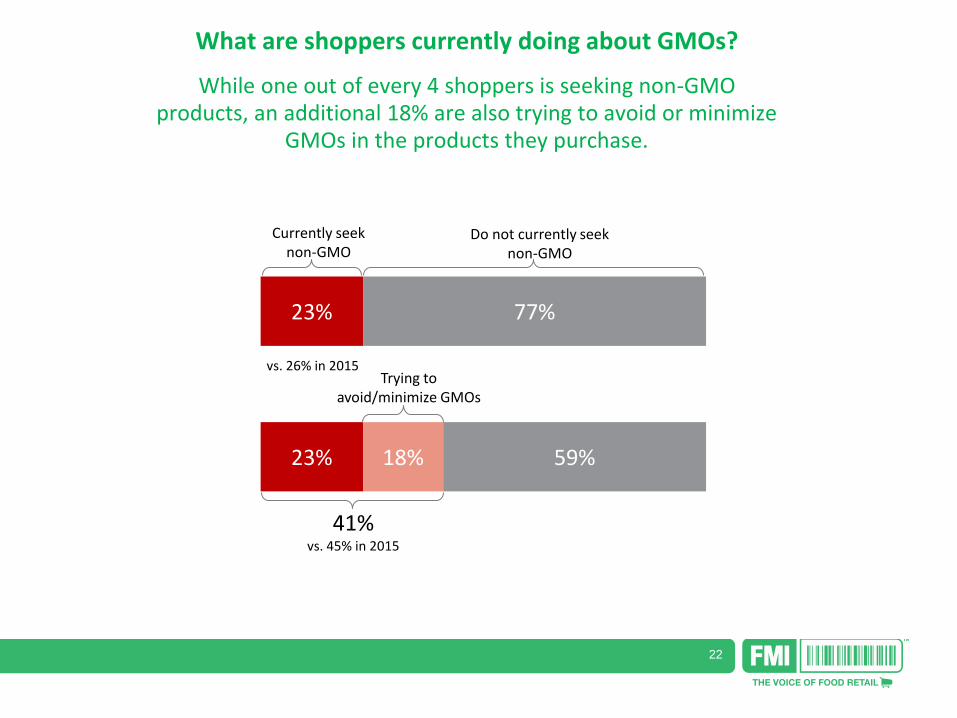
23%
23% 18%
77%
59%
41% vs. 45% in 2015
Currently seek non-GMO
Do not currently seek non-GMO
Trying to avoid/minimize GMOs
vs. 26% in 2015
What are shoppers currently doing about GMOs?
While one out of every 4 shoppers is seeking non-GMO products, an additional 18% are also trying to avoid or minimize
GMOs in the products they purchase.
23
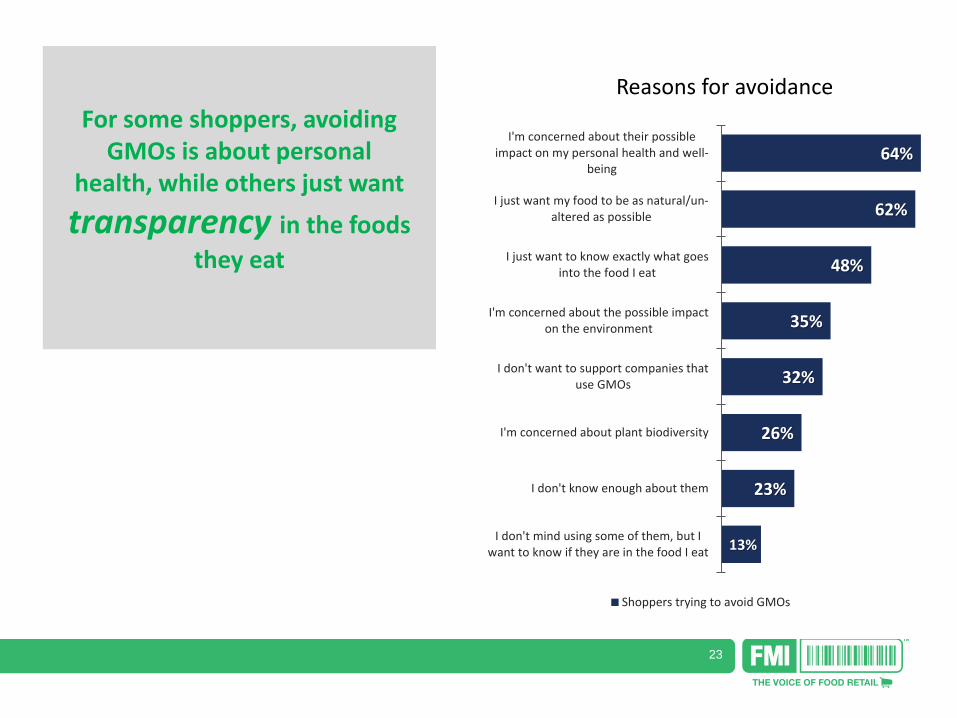
For some shoppers, avoiding GMOs is about personal
health, while others just want
transparency in the foods
they eat
64%
62%
48%
35%
32%
26%
23%
13%
I'm concerned about their possibleimpact on my personal health and well-
being
I just want my food to be as natural/un-altered as possible
I just want to know exactly what goesinto the food I eat
I'm concerned about the possible impacton the environment
I don't want to support companies thatuse GMOs
I'm concerned about plant biodiversity
I don't know enough about them
I don't mind using some of them, but Iwant to know if they are in the food I eat
Shoppers trying to avoid GMOs
Reasons for avoidance
24
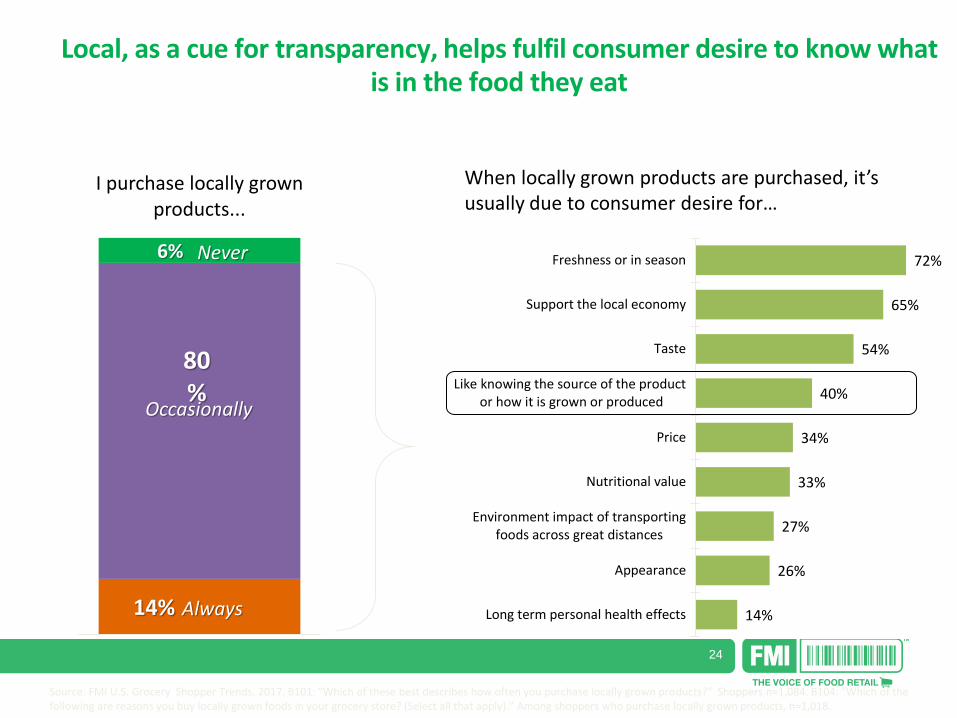
14%
80%
6%
I purchase locally grown products...
72%
65%
54%
40%
34%
33%
27%
26%
14%
Freshness or in season
Support the local economy
Taste
Like knowing the source of the product or how it is grown or produced
Price
Nutritional value
Environment impact of transportingfoods across great distances
Appearance
Long term personal health effects
When locally grown products are purchased, it’s usually due to consumer desire for…
Local, as a cue for transparency, helps fulfil consumer desire to know what
is in the food they eat
Never
Occasionally
Always
Source: FMI U.S. Grocery Shopper Trends, 2017. B101: “Which of these best describes how often you purchase locally grown products?” Shoppers n=1,084. B104: “Which of the following are reasons you buy locally grown foods in your grocery store? (Select all that apply).” Among shoppers who purchase locally grown products, n=1,018.
25
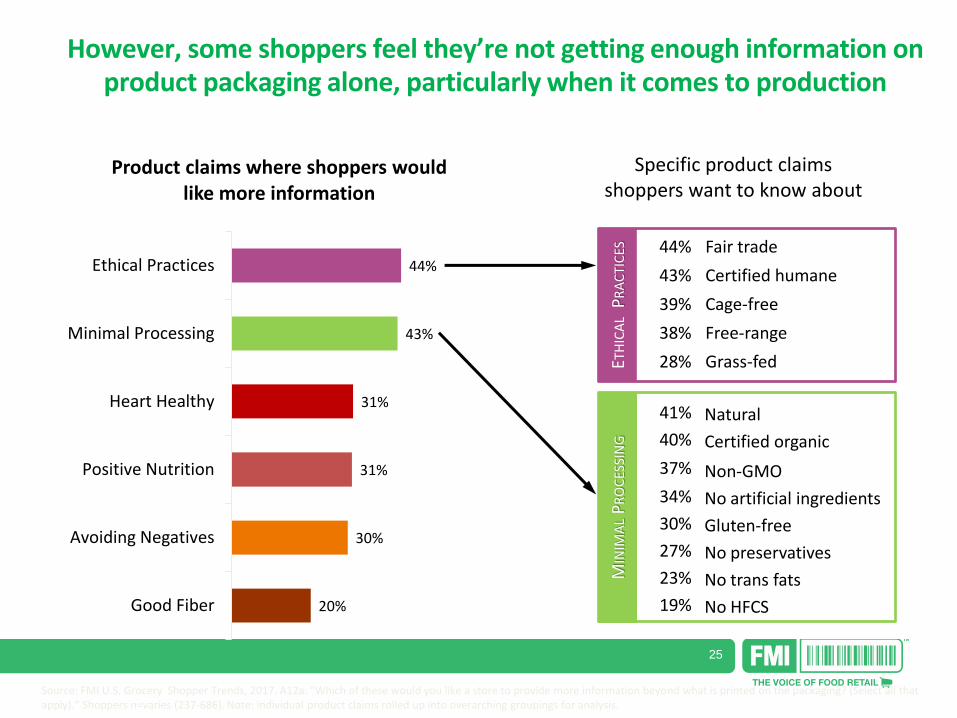
However, some shoppers feel they’re not getting enough information on product packaging alone, particularly when it comes to production
44%
43%
31%
31%
30%
20%
Ethical Practices
Minimal Processing
Heart Healthy
Positive Nutrition
Avoiding Negatives
Good Fiber
Product claims where shoppers would like more information
44% Fair trade
43% Certified humane
39% Cage-free
38% Free-range
28% Grass-fed
41% Natural
40% Certified organic
37% Non-GMO
34% No artificial ingredients
30% Gluten-free
27% No preservatives
23% No trans fats
19% No HFCS
Specific product claims shoppers want to know about
ETH
ICA
L P
RA
CTI
CES
M
INIM
AL
PR
OC
ESSI
NG
Source: FMI U.S. Grocery Shopper Trends, 2017. A12a: “Which of these would you like a store to provide more information beyond what is printed on the packaging? (Select all that apply).” Shoppers n=varies (237-686). Note: individual product claims rolled up into overarching groupings for analysis.
26
© 2
01
7 T
he
Har
tman
Gro
up
, In
c.
Shopper Trends and Values: Health & Wellness 03
27
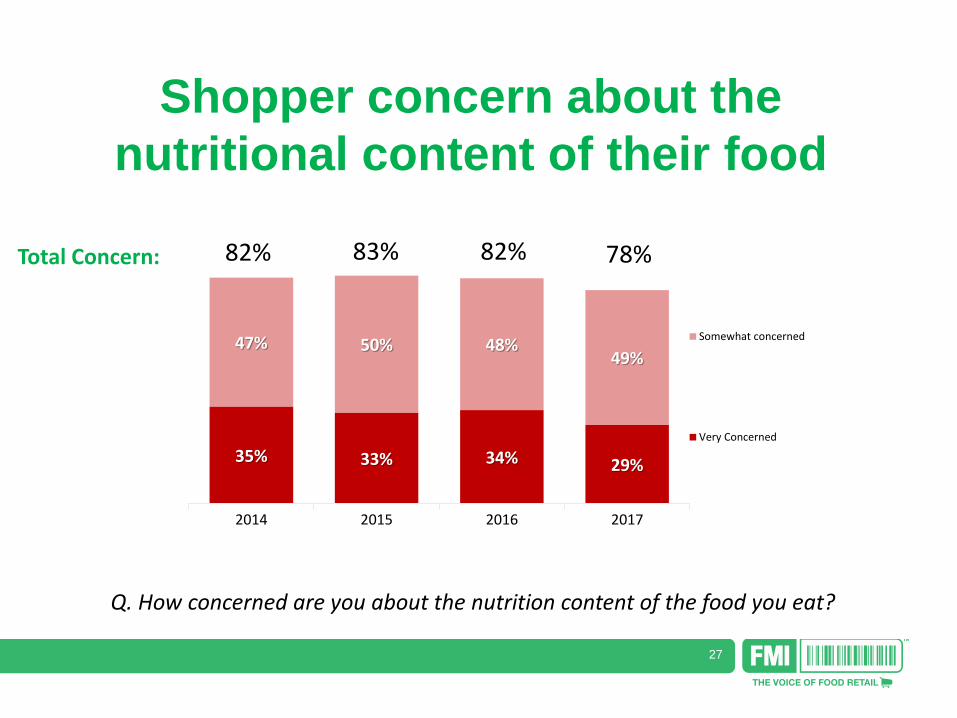
35% 33% 34% 29%
47% 50% 48% 49%
2014 2015 2016 2017
Somewhat concerned
Very Concerned
83% 82% 82% 78% Total Concern:
Shopper concern about the
nutritional content of their food
Q. How concerned are you about the nutrition content of the food you eat?
28
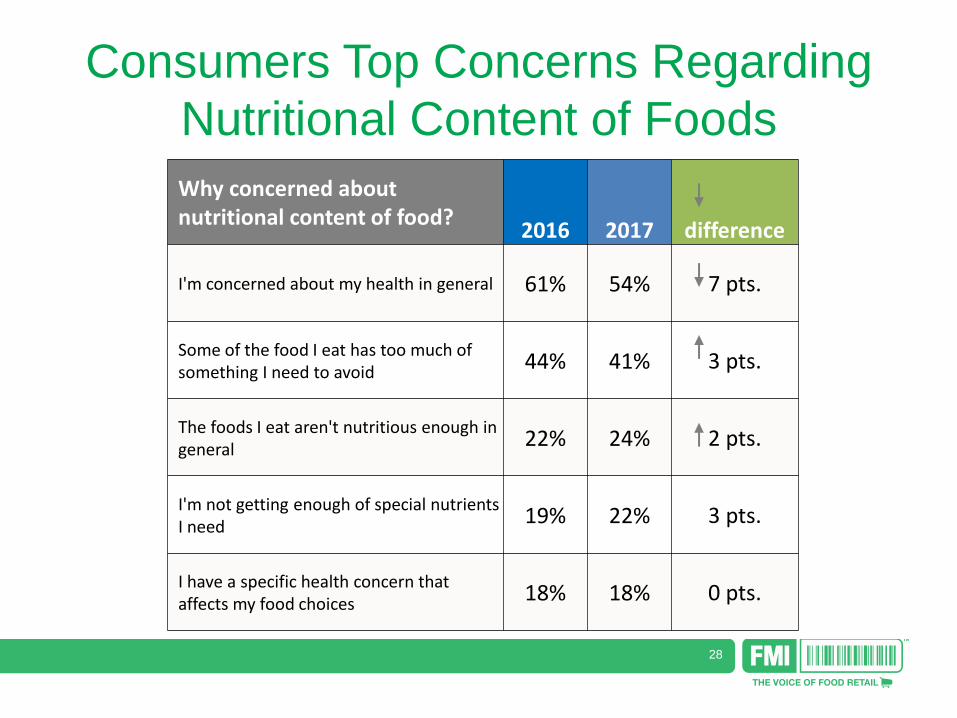
Why concerned about nutritional content of food?
2016 2017 difference
I'm concerned about my health in general 61% 54% 7 pts.
Some of the food I eat has too much of something I need to avoid
44% 41% 3 pts.
The foods I eat aren't nutritious enough in general
22% 24% 2 pts.
I'm not getting enough of special nutrients I need
19% 22% 3 pts.
I have a specific health concern that affects my food choices
18% 18% 0 pts.
Consumers Top Concerns Regarding
Nutritional Content of Foods
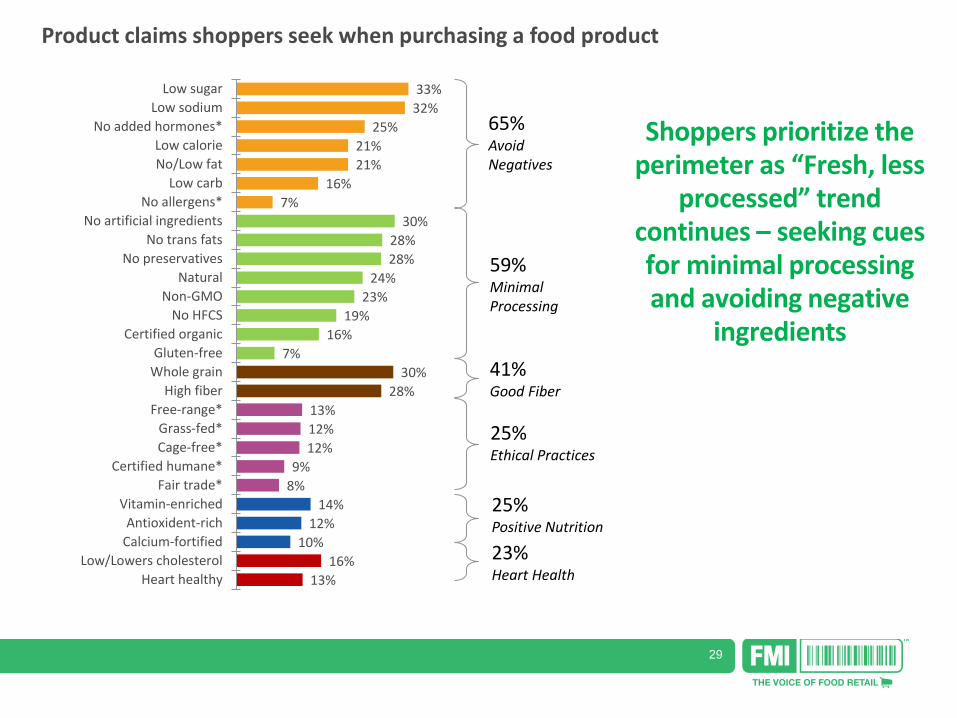
29
33%
32%
25%
21%
21%
16%
7%
30%
28%
28%
24%
23%
19%
16%
7%
30%
28%
13%
12%
12%
9%
8%
14%
12%
10%
16%
13%
Low sugar
Low sodium
No added hormones*
Low calorie
No/Low fat
Low carb
No allergens*
No artificial ingredients
No trans fats
No preservatives
Natural
Non-GMO
No HFCS
Certified organic
Gluten-free
Whole grain
High fiber
Free-range*
Grass-fed*
Cage-free*
Certified humane*
Fair trade*
Vitamin-enriched
Antioxident-rich
Calcium-fortified
Low/Lowers cholesterol
Heart healthy
Product claims shoppers seek when purchasing a food product
65% Avoid Negatives
59% Minimal Processing
41% Good Fiber
25% Ethical Practices
25% Positive Nutrition
23% Heart Health
Shoppers prioritize the perimeter as “Fresh, less
processed” trend continues – seeking cues for minimal processing and avoiding negative
ingredients
30
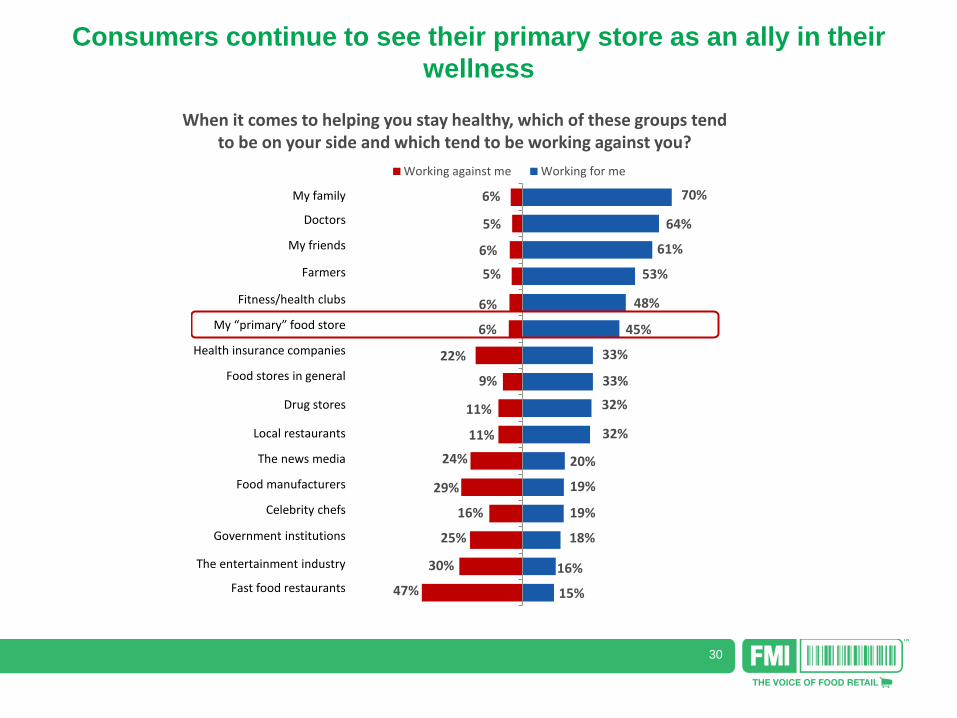
6%
5%
6%
5%
6%
6%
22%
9%
11%
11%
24%
29%
16%
25%
30%
47%
70%
64%
61%
53%
48%
45%
33%
33%
32%
32%
20%
19%
19%
18%
16%
15%
Working against me Working for me
My family
Doctors
My friends
Farmers
Fitness/health clubs
My “primary” food store
Health insurance companies
Food stores in general
Drug stores
Local restaurants
The news media
Food manufacturers
Celebrity chefs
Government institutions
The entertainment industry
Fast food restaurants
When it comes to helping you stay healthy, which of these groups tend to be on your side and which tend to be working against you?
Consumers continue to see their primary store as an ally in their
wellness
31
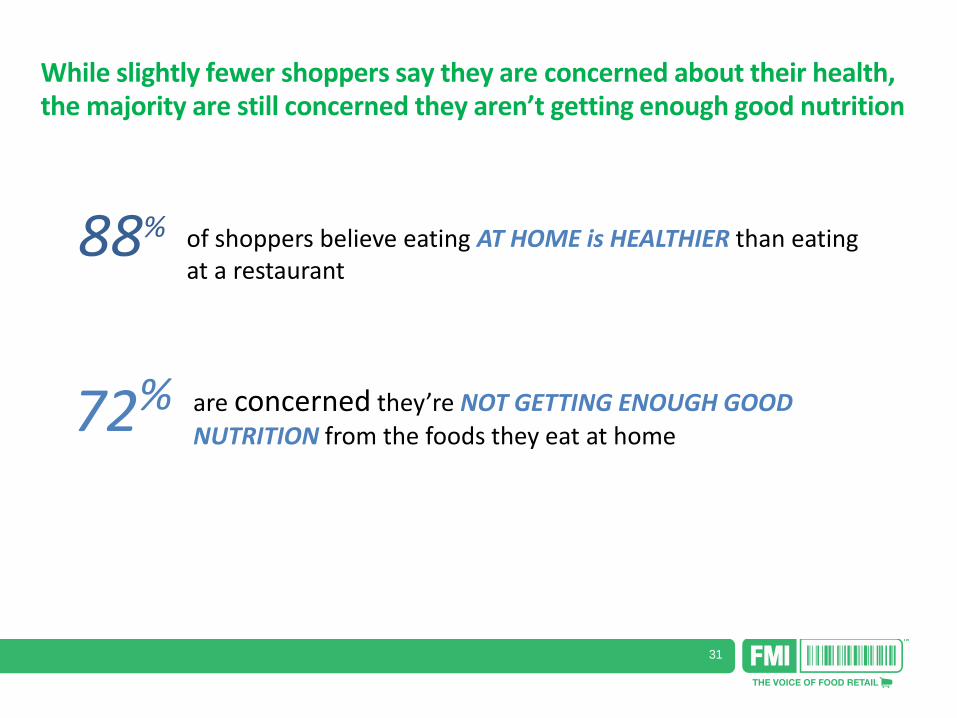
88% of shoppers believe eating AT HOME is HEALTHIER than eating at a restaurant
are concerned they’re NOT GETTING ENOUGH GOOD
NUTRITION from the foods they eat at home
While slightly fewer shoppers say they are concerned about their health, the majority are still concerned they aren’t getting enough good nutrition
72%
32
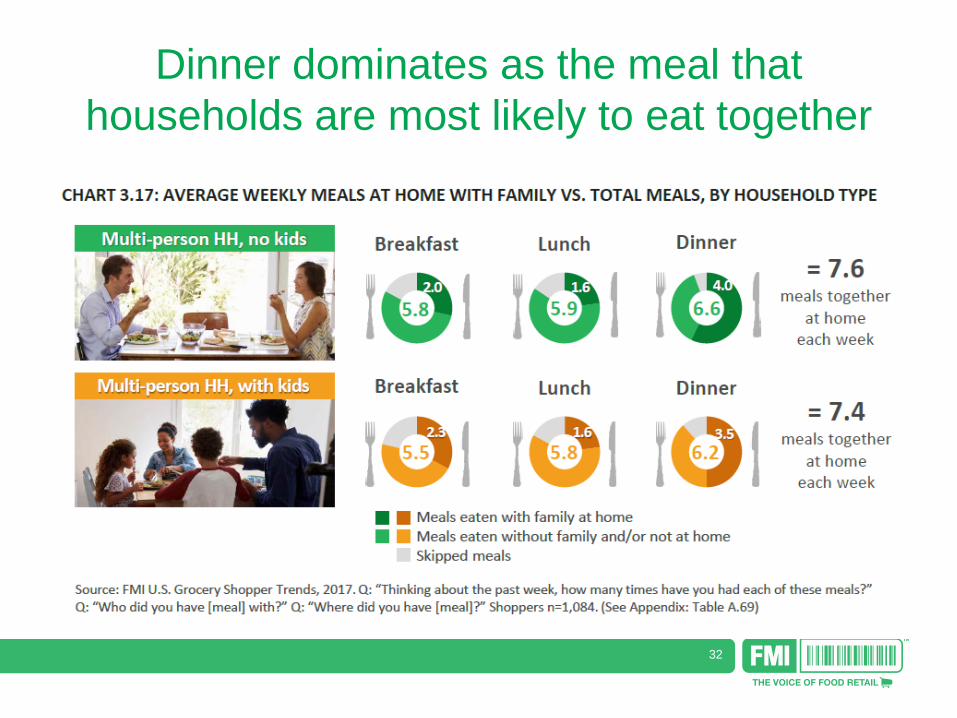
Dinner dominates as the meal that
households are most likely to eat together
33
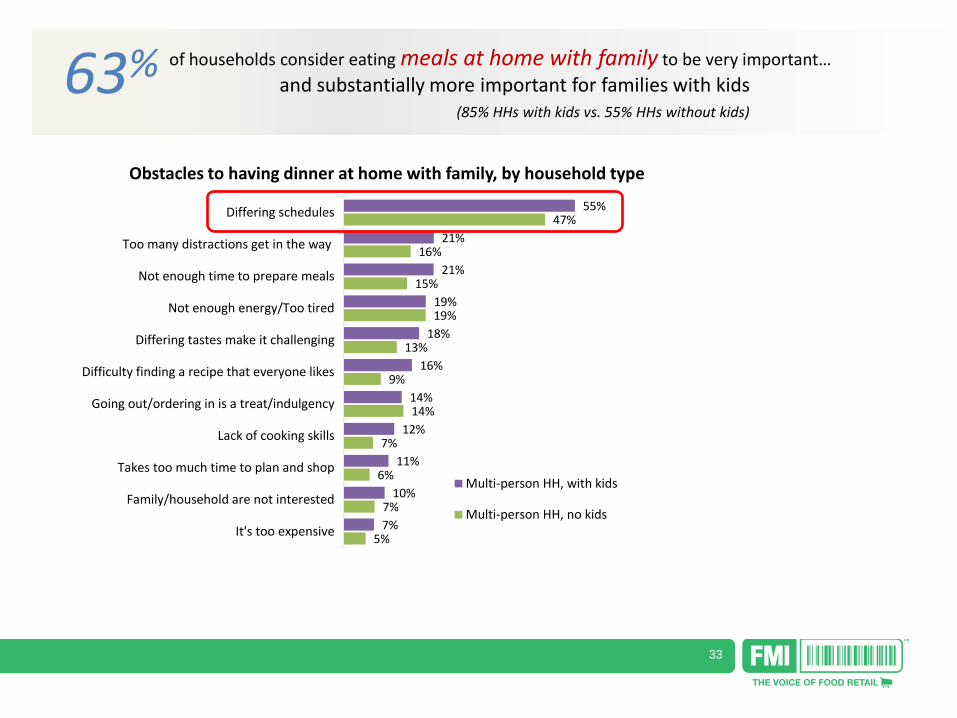
55%
21%
21%
19%
18%
16%
14%
12%
11%
10%
7%
47%
16%
15%
19%
13%
9%
14%
7%
6%
7%
5%
Differing schedules
Too many distractions get in the way
Not enough time to prepare meals
Not enough energy/Too tired
Differing tastes make it challenging
Difficulty finding a recipe that everyone likes
Going out/ordering in is a treat/indulgency
Lack of cooking skills
Takes too much time to plan and shop
Family/household are not interested
It's too expensive
Obstacles to having dinner at home with family, by household type
Multi-person HH, with kids
Multi-person HH, no kids
63% of households consider eating meals at home with family to be very important…
and substantially more important for families with kids (85% HHs with kids vs. 55% HHs without kids)
34
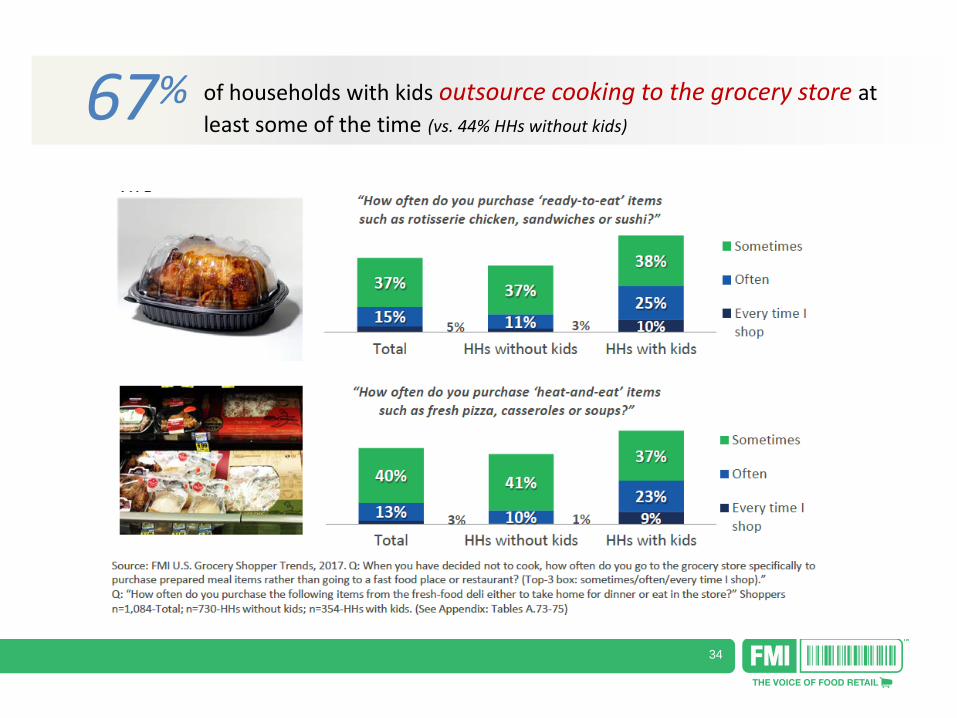
67% of households with kids outsource cooking to the grocery store at
least some of the time (vs. 44% HHs without kids)
35
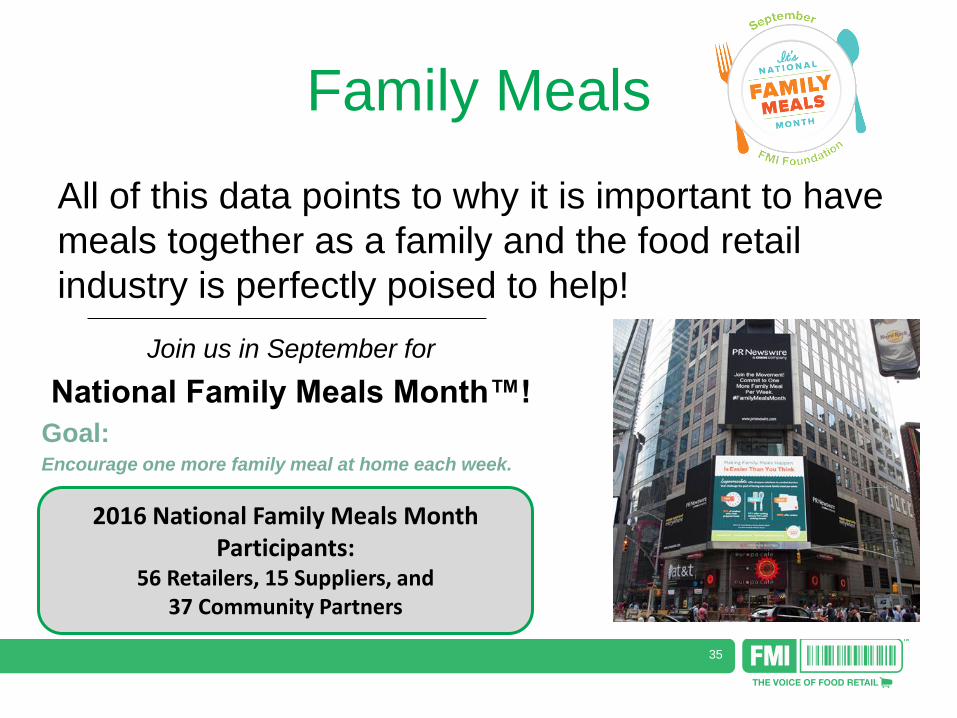
Family Meals
All of this data points to why it is important to have
meals together as a family and the food retail
industry is perfectly poised to help!
Join us in September for
National Family Meals Month™!
Goal: Encourage one more family meal at home each week.
2016 National Family Meals Month Participants:
56 Retailers, 15 Suppliers, and 37 Community Partners
36
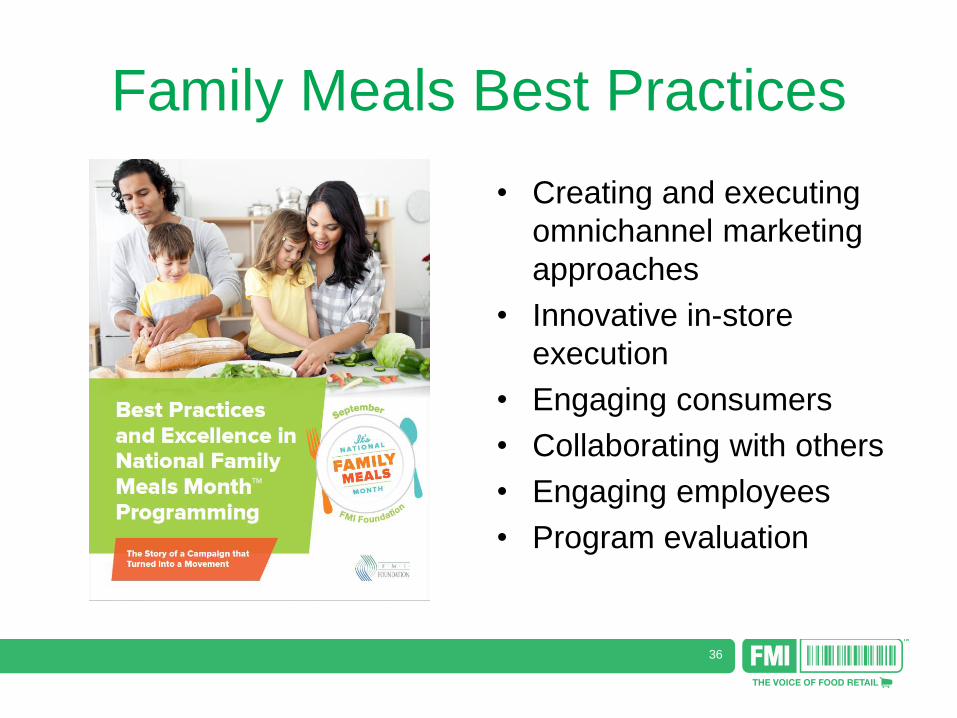
Family Meals Best Practices
• Creating and executing
omnichannel marketing
approaches
• Innovative in-store
execution
• Engaging consumers
• Collaborating with others
• Engaging employees
• Program evaluation
37
New -2017 Retailer Contributions to
Health and Wellness
• 2017 Health and Wellness Offerings
• Connecting Consumers to Better-
for-you
• In-Store Health Professionals
• Building Credibility with Community
Partners
• Healthy Eating Expectations in the
Aisles
• Cooking up Wellness

38
© 2
01
7 T
he
Har
tman
Gro
up
, In
c.
Transparency
04
39
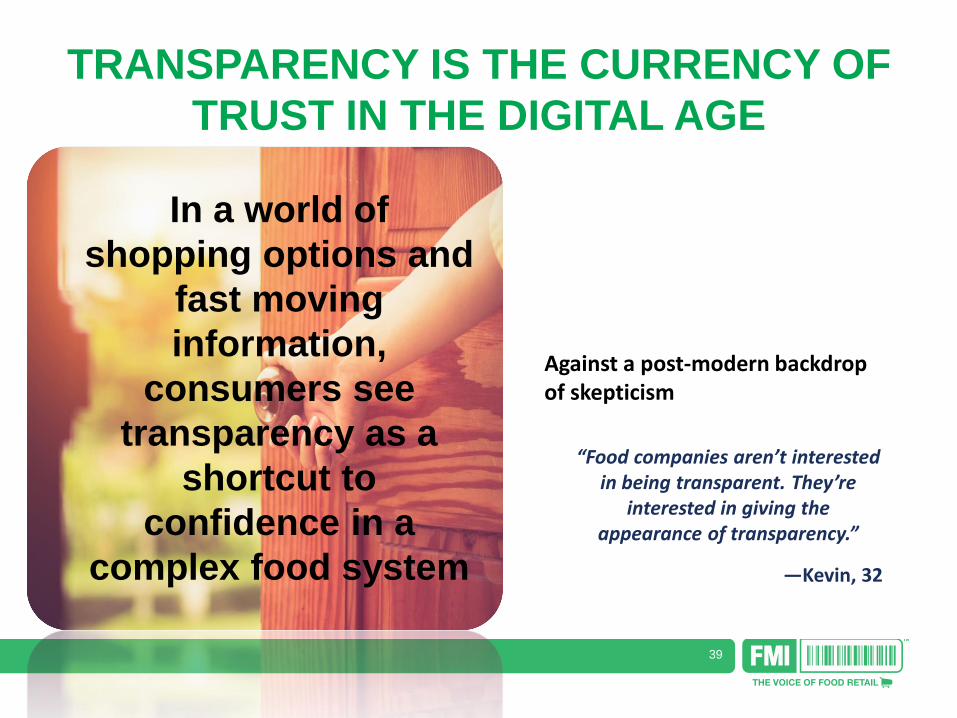
TRANSPARENCY IS THE CURRENCY OF
TRUST IN THE DIGITAL AGE
In a world of
shopping options and
fast moving
information,
consumers see
transparency as a
shortcut to
confidence in a
complex food system
“Food companies aren’t interested in being transparent. They’re
interested in giving the appearance of transparency.”
—Kevin, 32
Against a post-modern backdrop of skepticism
40
FMI’s Transparency Webinar will
• Parse out what transparency is and what it isn’t • Distinguish where Consumers hold Manufacturers
accountable and areas where they hold Retailers to a higher level of responsibility
• Inform you of the transparency expectations that if satisfied best drive customer loyalty
• Point you to the customer expectations create the greatest credibility halo?
41
Learn more about Grocery Shopping Trends and download the full report at: www.fmi.org/grocerytrends