Embed Size (px)
Citation preview
NCAR-TN/164+EDDNCAR TECHNICAL NOTE
November 1980
U.S. Monsoon Experiment (MONEX)Rawinsonde/Radiometersonde System
Gerald A. MeehlRobert B. McBethWilliam C. BolhoferSushil Unninayar
U.S. MONEX PROJECT OFFICE
NATIONAL CENTER FOR ATMOSPHERIC RESEARCHBOULDER, COLORADO
- I- L Ilell I -SI I I I -II · ssL~~~~~~~~~~~~~~~~~~~~~~~~~~~~~~~~~~~~~~~~~~~~~~~~~~~~~~~~~~~~~~~~~~~
- -· -- II --- I~~~~~~~~~~~~~~~~~~~~~~~~~~~~~~~~~~~~~~~~~~~~~~~~~~~~~~I
-'--

i i i
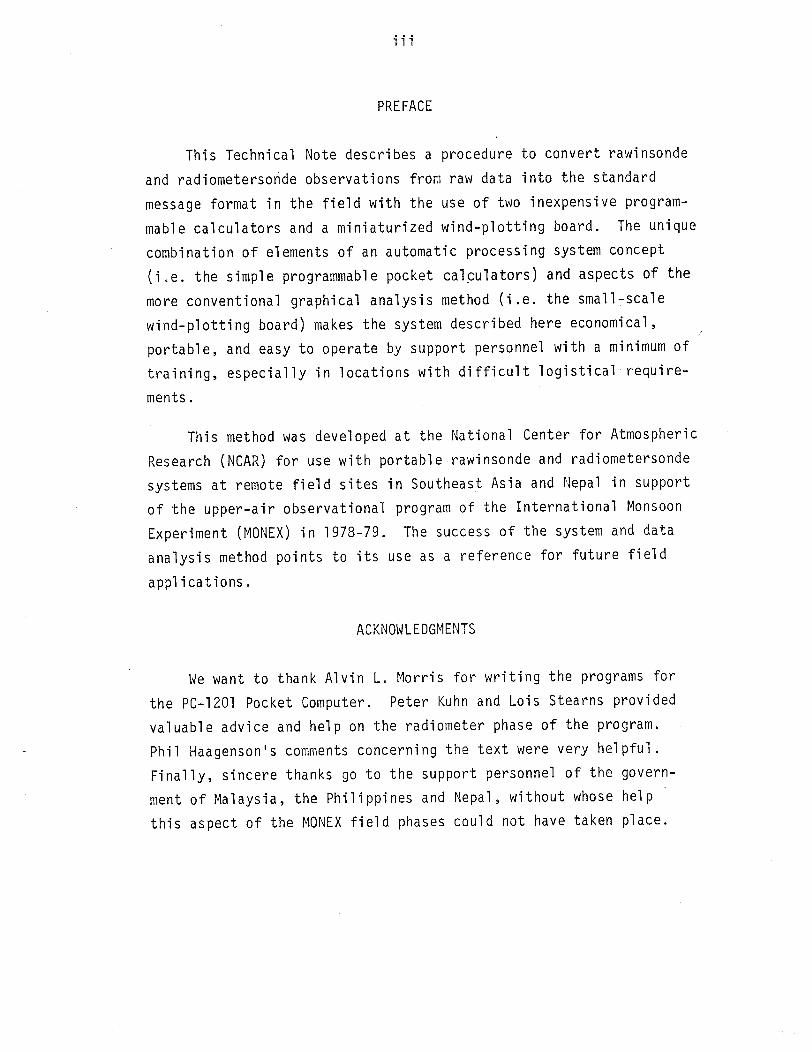
PRE FACE
This Technical Note describes a procedure to convert rawinsonde
and radiometersonde observations from raw data into the standard
message format in the field with the use of two inexpensive program-
mable calculators and a miniaturized wind-plotting board. The unique
combination of elements of an automatic processing system concept
(i.e. the simple programmable pocket calculators) and aspects of the
more conventional graphical analysis method (i.e. the small-scale
wind-plotting board) makes the system described here economical,
portable, and easy to operate by support personnel with a minimum of
training, especially in locations with difficult logistical require-
ments.
This method was developed at the National Center for Atmospheric
Research (NCAR) for use with portable rawinsonde and radiometersonde
systems at remote field sites in Southeast Asia and Nepal in support
of the upper-air observational program of the International Monsoon
Experiment (MONEX) in 1978-79. The success of the system and data
analysis method points to its use as a reference for future field
appl ications.
ACKNOWLEDGMENTS
We want to thank Alvin L. Morris for writing the programs for
the PC-1201 Pocket Computer. Peter Kuhn and Lois Stearns provided
valuable advice and help on the radiometer phase of the program.
Phil Haagenson's comments concerning the text were very helpful.
Finally, sincere thanks go to the support personnel of the govern-
ment of Malaysia, the Philippines and Nepal, without whose help
this aspect of the MONEX field phases could not have taken place.

v
Table of Contents
Preface . . . . . . . . . . . . . .
Acknowl edgements ....... .
1. Introduction .........
2. System Description . . . ...
3. Operating Procedure . . ....
a. Rawinsonde ........
b. Radiometersonde .. . .
4. Conclusions and Recommendations
Appendices
A. Height and Dew Point Calculations
B. Winds Aloft Computations ...
C. Wind Graphing and Coding ...
D. Radiometersonde Procedures . .
E. Field Site Operations .....
. .. . . . . iii
2
2
6
1 0
1 3
2 1
29
33
39
. . . . . . .. 1
. ............ 2 1
. . . . . . .. 13
. . . . . . .. 21
. . . . . . .. 29
. . . . . . .. 33
. . . . . . . . 39
References . . . 51
-1-
1. Introduction
The International Monsoon Experiment (MONEX) was the first compre-
hensive attempt by mankind to study the two monsoon systems of Asia.
The winter phase (Winter MONEX) was designed to study the Southeast Asian
Monsoon and took place from December 1978 through February 1979. The
summer phase (Summer MONEX) was designed to collect data during the Indian
Monsoon and included the period of May through August 1979. In support
of U.S. participation in Winter MONEX, the U.S. MONEX Project Office de-
ployed three portable rawinsonde stations: one in Sarawak, East Malaysia,
and two others in the Philippines. During Summer MONEX, the Project
Office conducted radiometersonde observations from Kathmandu, Nepal, using
radiosondes modified to accommodate radiometers, and ground receiving
equipment and data analysis method identical to that used in Winter MONEX.
This Technical Note describes the method used to reduce and encode the
radiosonde and radiometersonde data. This method was specifically devel-
oped in response to MONEX logistical and operational considerations.
2. System Description
The nature of the MONEX field program required that both rawinsonde
and radiometersonde observations satisfy certain operational criteria:
primarily, that coded observational data from remote field locations be
made available in real time to the MONEX operations centers. This was
accomplished through judicious selection of field equipment and stream-
lined data reduction techniques.
Since the MONEX field sites were all located in remote areas with
difficult logistical requirements, RD-65 Auto Track Rawin Sets were
chosen because of their light weight and portability. The radiosonde
expendables, produced through NOAA, were 1680 MHz VIZ accu-lock models
with precision pre-base-lined sensors. Each field station was provided
with 300 gram latex sounding balloons and standard paper parachutes and
used hydrogen gas for lift.
The radiosonde reports would eventually be transmitted over the
Global Telecommunications Systems (GTS), requiring the encoding of upper
air soundings in standard radiosonde code format for the W1MO region.
Minicomputing equipment for automatic processsing of each station's data
was not desirable because of the cost and potential maintenance problems.
Manual reduction techniques, which require the use of adiabatic forms,
tables, and wind vector and graphing boards were also unsuitable because
such techniques are cumbersome and time-consuming, requiring larger staff
with considerably more training. Consequently, a method of data analysis
was designed to combine simplified and economical aspects of both the
automatic processing concept and the manual reduction techniques. A re-
duced wind graphing sheet attached to a small drafting board was used
with a T-square to plot winds for interpolation to thousand foot levels,
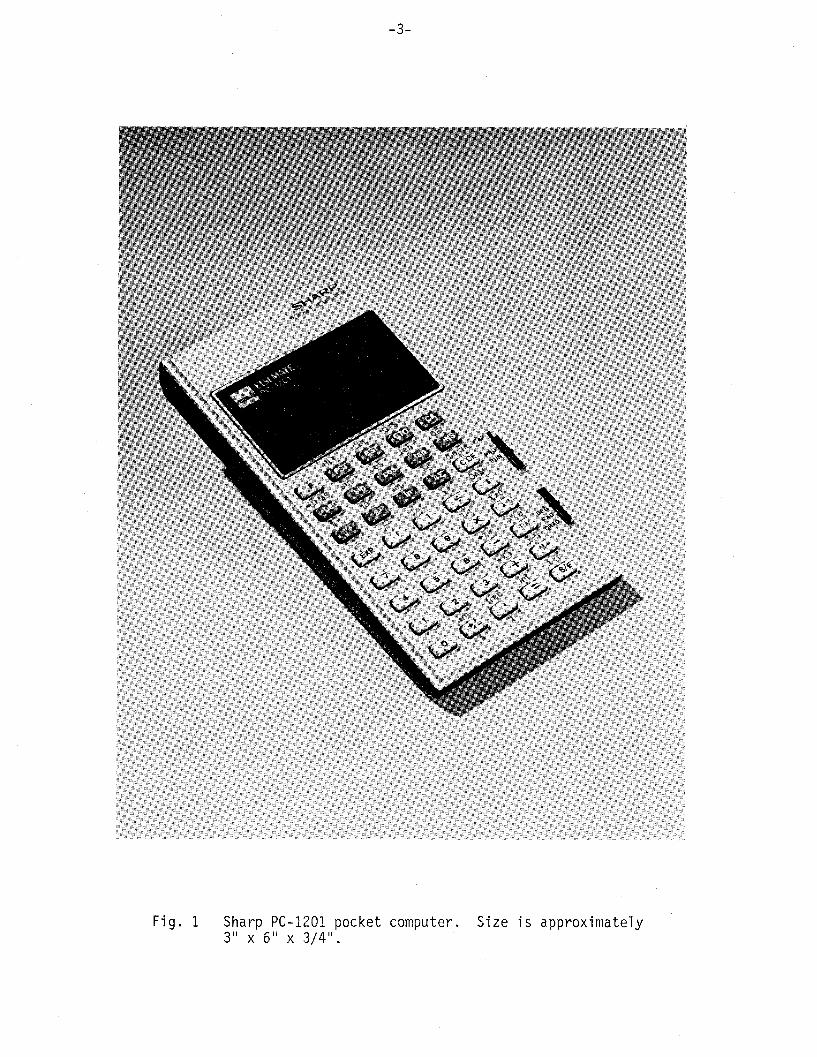
and two simple programmable pocket calculators, Sharp PC-1201's (see Fig. 1),
were used at each site to compute height, dew point, and winds aloft.
Some of the reasons for the choice of the Sharp were:
a. One PC-1201 with 128 programming steps is sufficient to accom-
modate equations for radiosonde height and dew point calculations. A
second PC-1201 can perform all the operations necessary to derive winds
aloft. During a rawinsonde ascent there is a distinct advantage in
using two computers since adiabatic and wind computations can be made
concurrently as the sounding balloon is ascending, thus substantially
reducing the time necessary to encode the report.
b. Low cost (about $85) and portability of the PC-1201 offer
distinct advantages over graphing and vector boards, adiabatic forms,
tables, and other materials required for more traditional analysis.
c. The PC-1201 retains program memory when the main power is off,
so there is no need to reenter the programs for each subsequent use.
d. The PC-1201 allows use of the calculator for routine computa-
tions while not disturbing the program in memory.
3. Operating Procedure
a) Rawinsonde analysis
Standard techniques as described in the Federal Meteorological
Handbook No. 3 on radiosonde observations were used in obtaining upper
air soundings. This procedure is different in that the programmable
calculators were used to obtain radiosonde height and dew point depres-
sion and to calculate winds aloft. Radiosonde data are obtained by first
taking levels from the strip chart recorder record (both mandatory and
-3-
Fig. 1 Sharp PC-1201 pocket computer. Size is approximately3" x 6" x 3/4".
-4-
significant) and entering them on a data sheet. Values entered are:
contact, temperature frequency, and relative humidity frequency. The
radiosonde operator converts the contact to a pressure value by use of
the calibration sheet provided with each sonde. The temperature and
humidity frequencies are converted to temperatures (0C) and humidities
(%1) by use of standard radiosonde evaluators. The pressure, temperature,
and relative humidity are entered into the appropriately programmed
Sharp PC-1201 to compute height and dew point depression for that level
To compute winds aloft, elevation and azimuth angles for each minute
from the RD-65 digital recorder are copied onto the rawin data sheet.
The height of the balloon for each minute is obtained by dividing the
elapsed time of the sounding by the height (in meters) at selected levels.
For example, if the balloon's height at 500 mb was 5800 meters 20 minutes
after launch, the height divided by the elapsed time would give the aver-
age ascent rate of the balloon up until that time (5800 divided by 20
equals 290 meters/minute). It is then simply a matter of using that ascent
rate to compute the balloon's height at each minute (e.g.,ll minutes
after launch at an ascent rate of 290 meters per minute, the balloon
would be at a height of 11 x 290 = 3190 meters). The PC-1201 can be
used in calculator mode for this computation. The height and elevation
and azimuth angles are then entered into the second calculator programmed
to compute wind speed in knots and direction to 3600 at each minute.
MONEX stations reported winds aloft at required thousand foot levels
as well as mandatory pressure levels. Limited calculator program memory
space necessitated a more economical graphical method to perform this
interpolation through the use of a simplified version of a standard wind
plotting board. Calculators with adequate memory space for the inter-
polation, as well as the standard computations required on site, were not
feasible due to cost. Therefore a 24" x 24" drawing board and fitted
T-square with wind scales inscribed on the leading edges were used to
plot the minute by minute wind speeds and directions from the sounding
on a wind graphing sheet tacked to the plotting board. From the plot,
conversions could then be made to thousand foot levels as required.
-5-
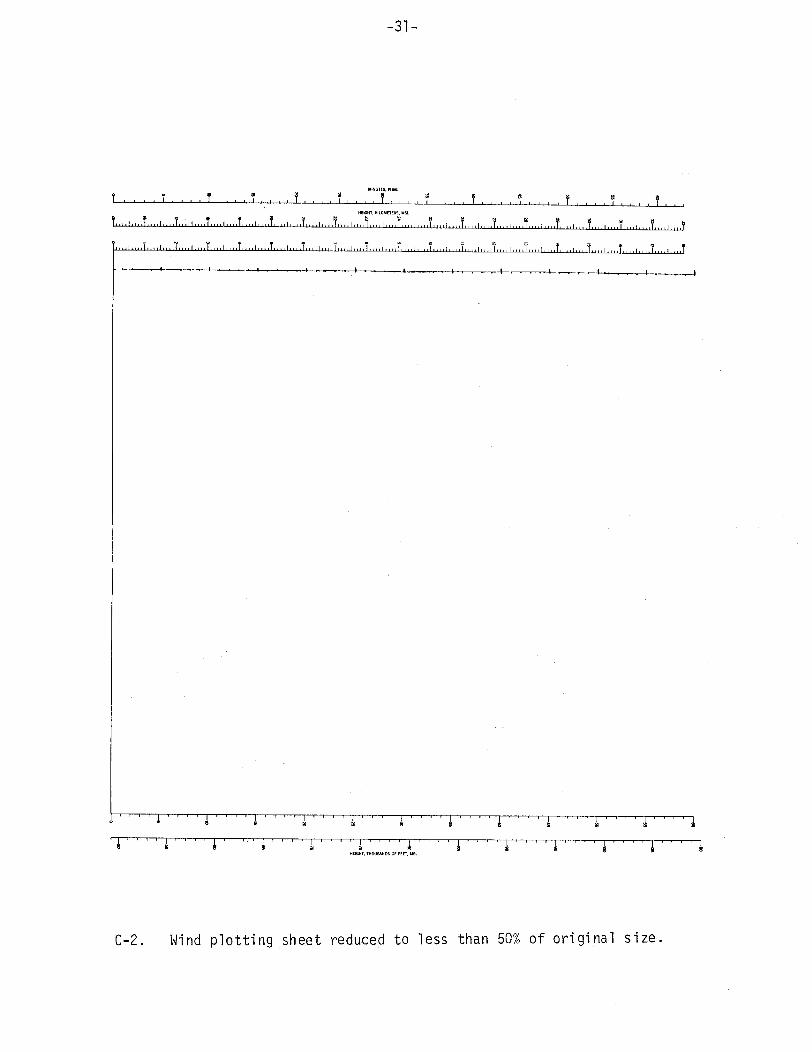
The wind graphing sheet was photographically reduced from a standard
winds aloft graphing board by a horizontal planar camera system. This
insured accurate reduction (without skewing) of the plotting board scales.
The full-size negative was then used by the NCAR print shop to produce the
plotting sheets. The negative is presently on file with the NCAR's Field
Observing Facility. The plotting sheet size (and resulting drawing board
size) was an arbitrary decision. It was felt that a 24" x 24" drawing
board was adequate and convenient. A smaller board would have meant a
smaller plotting chart, resulting in less accurate winds. The wind scales
inscribed on the T-square were reduced (from the normal plotting board
size) to correspond with the reduced plotting sheet size.
Appendices A and B describe the height, dew point, and winds aloft
calculations, respectively, and their associated calculator procedures.
Appendix C contains further details on the wind graphing and coding oper-
ations.
-6-
b) Radiometersonde application
During Summer MONEX, radiometersonde stations were operated in Nepal
and Diego Garcia to complement the existing Indian-USSR radiometersonde
network. The Nepal site used equipment and data analysis techniques
similar to the Winter MONEX rawinsonde program with a few alterations in
hardware and analysis to accommodate the addition of the radiometer data.
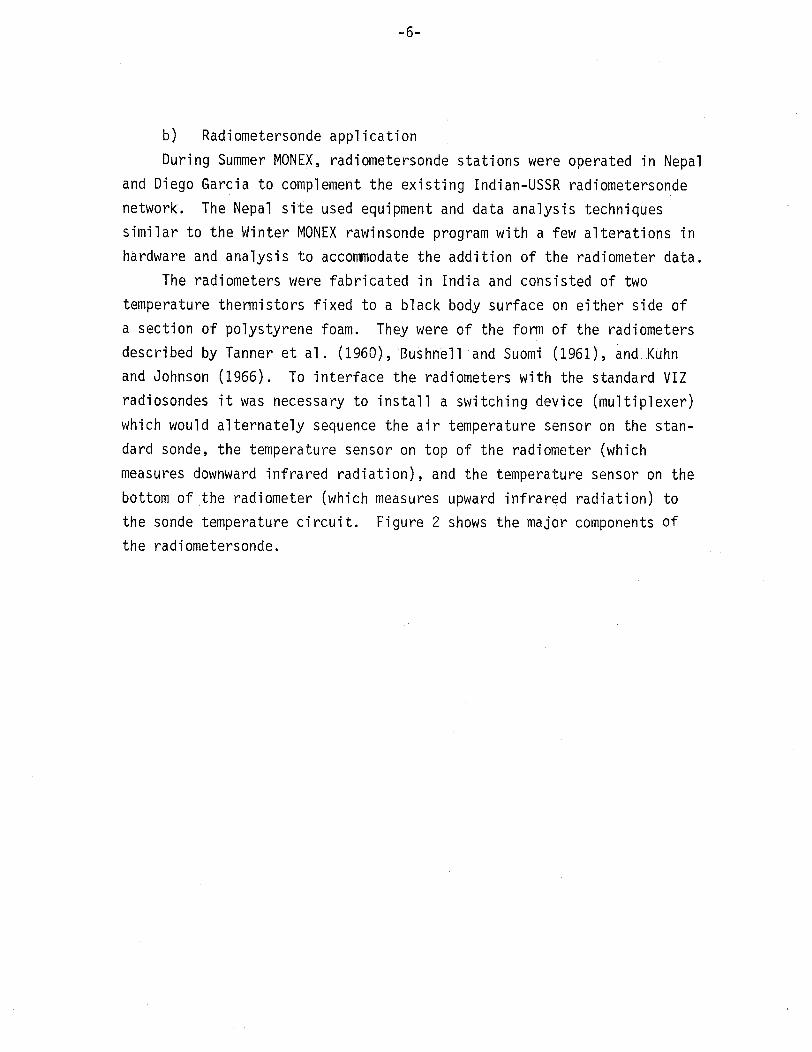
The radiometers were fabricated in India and consisted of two
temperature thermistors fixed to a black body surface on either side of
a section of polystyrene foam. They were of the form of the radiometers
described by Tanner et al. (1960), Bushnell and Suomi (1961), and Kuhn
and Johnson (1966). To interface the radiometers with the standard VIZ
radiosondes it was necessary to install a switching device (multiplexer)
which would alternately sequence the air temperature sensor on the stan-
dard sonde, the temperature sensor on top of the radiometer (which
measures downward infrared radiation), and the temperature sensor on the
bottom of the radiometer (which measures upward infrared radiation) to
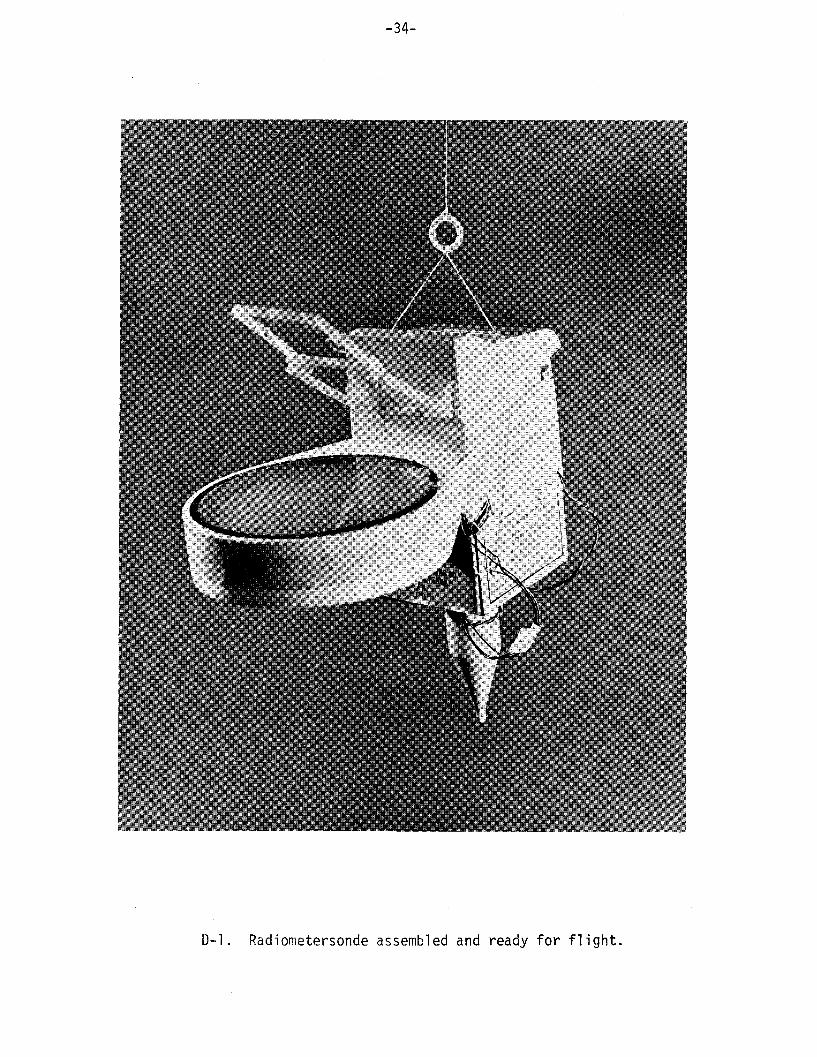
the sonde temperature circuit. Figure 2 shows the major components of
the radiometersonde.
-7-
Fig. 2 Radiometersonde partially dis-assembled showing 1) VIZ Accu-lock radiosonde (USWB), 2) radiometer (bottom identical totop), and 3) solid-state multiplexer circuit board. Uponassembly the radiometer is taped to side of radiosonde near(4), the multiplexer is placed in battery compartment (5), andthe sonde is closed and tied shut in the conventional manner.A fully assembled radiometersonde ready for flight appears inFig. 1, Appendix D.
-8-
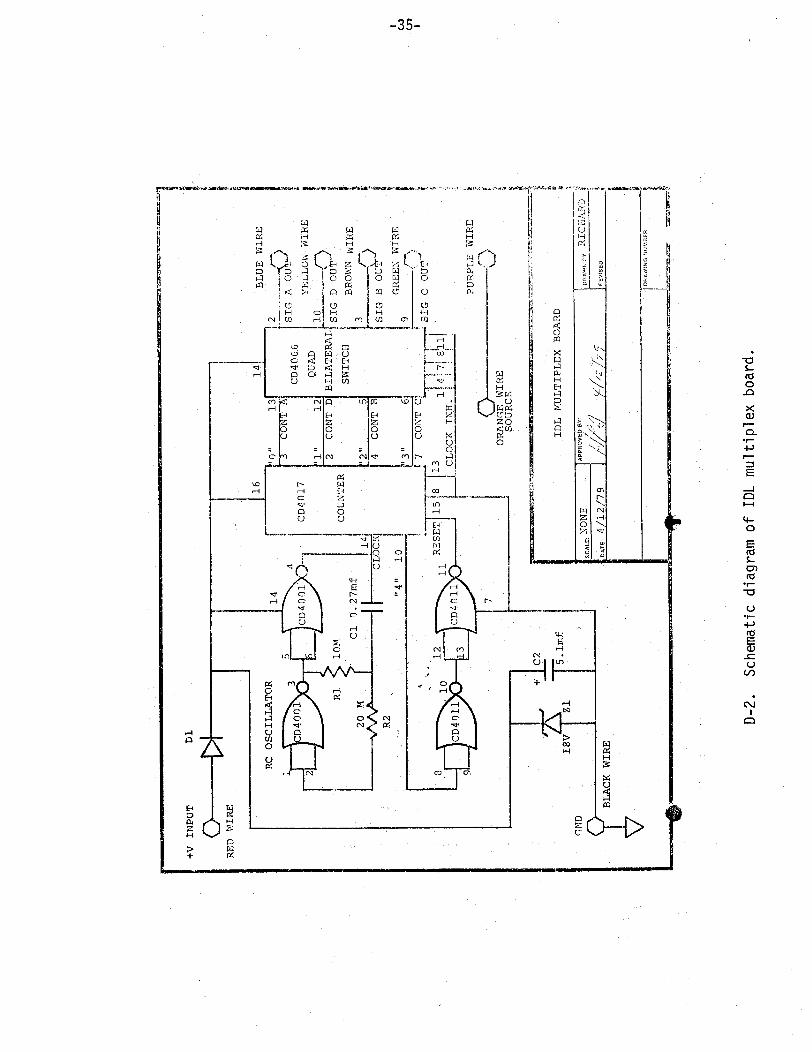
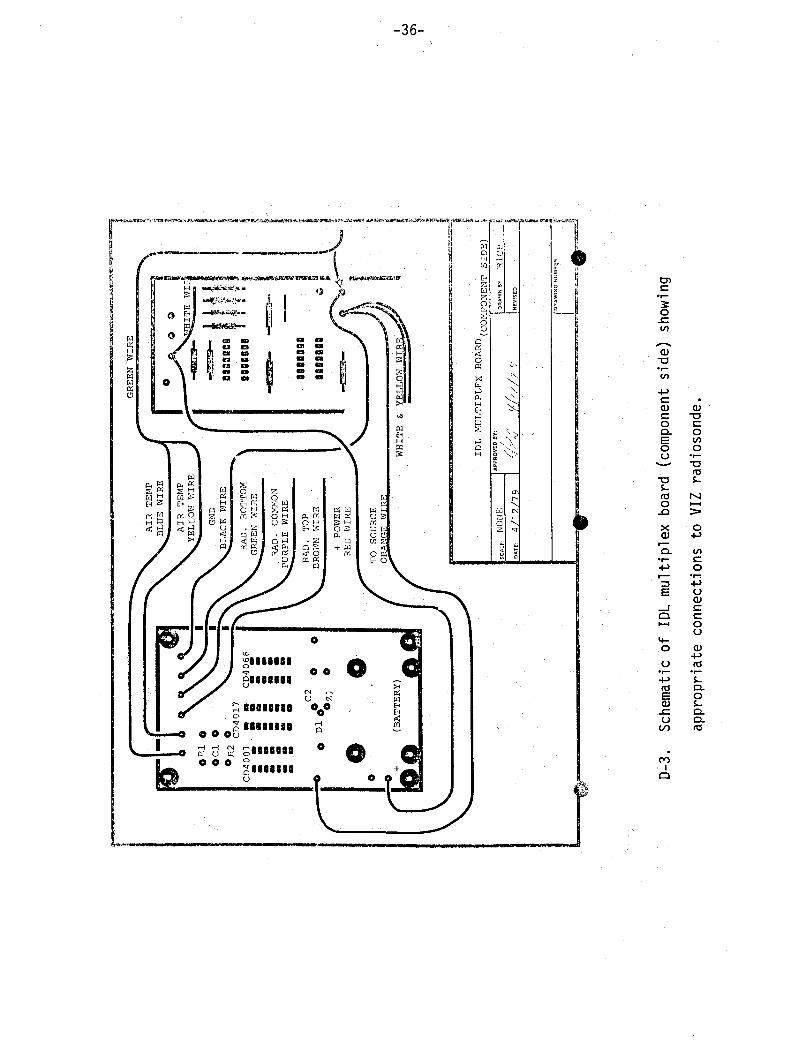
With assistance from the University of Colorado's Electronic Research
Laboratories (Boulder) a solid state multiplexer circuit board was designed
and produced. The multiplexer board was connected to the radiosonde (see
Appendix D for schematic wiring diagrams) and then placed in the sonde's
battery compartment. Heat from the discharging battery provided a fairly
uniform thermal environment for the circuit board, thereby insuring uniform
sequence times throughout the flight.
During operation, when the aneroid pointer in the sonde positioned
on a temperature contact, the multiplexer would sequence through the three
temperature sensors registering three different (usually) values of
temperature on the recording strip chart. Radiometer temperatures refer
to the temperatures measured by the radiometer thermistor sensitive to
infrared radiation. The bottom radiometer temperature was usually the
warmest of the three temperatures while the top radiometer temperature
was usually the coldest of three. The relative humidity and reference
contact readings were not altered. Therefore, the task of the operators
was to sort out which trace was top, which was bottom, and which was air
temperature for each temperature contact. To facilitate this, (the length
of) the air temperature trace was timed to run for twice as long as a top
or bottom temperature trace.
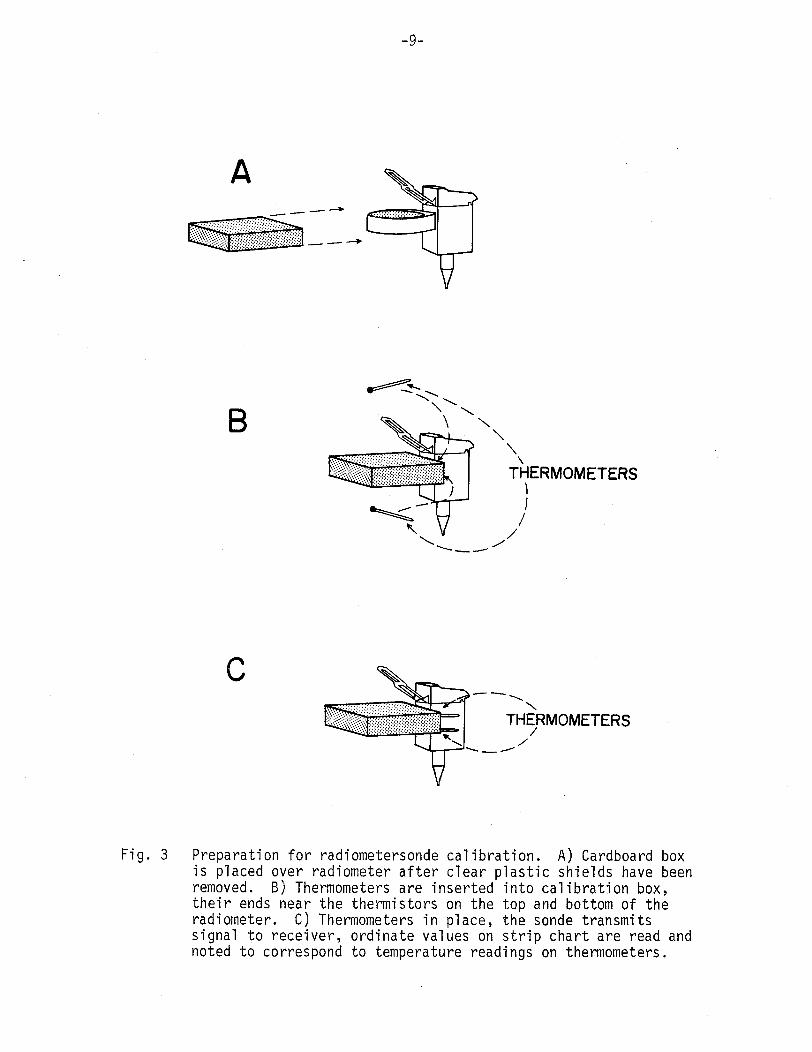
Before launch, the radiometer was calibrated by removing the two
clear polyethylene insulating shields over each (top and bottom) radi-
ometer temperature sensor, placing a cardboard cover box over the radi-
ometer, and inserting a thermometer near each sensor (Fig. 3). The box
prevented transient air currents of varying temperatures from affecting
the sensor readings. With the sonde battery connected, the aneroid
pointer was positioned on a temperature contact, and the sonde itself
was oriented to maximize the signal received by the rawin antenna. As
the multiplexer alternately switched from top to bottom to air temper-
ature, the temperature readings were received and recorded as traces on
the strip chart recorder. The readings were allowed to stabilize, and
then the strip chart ordinate values for the top and bottom temperaturesensors and their corresponding real temperature readings from the two
-9-
A
\
THERMOMETERS
/ I/
THERMOMETERS/
Fig. 3 Preparation for radiometersonde calibration. A) Cardboard boxis placed over radiometer after clear plastic shields have beenremoved. B) Thermometers are inserted into calibration box,their ends near the thermistors on the top and bottom of theradiometer. C) Thermometers in place, the sonde transmitssignal to receiver, ordinate values on strip chart are read andnoted to correspond to temperature readings on thermometers.
"I'\' 11
-10-
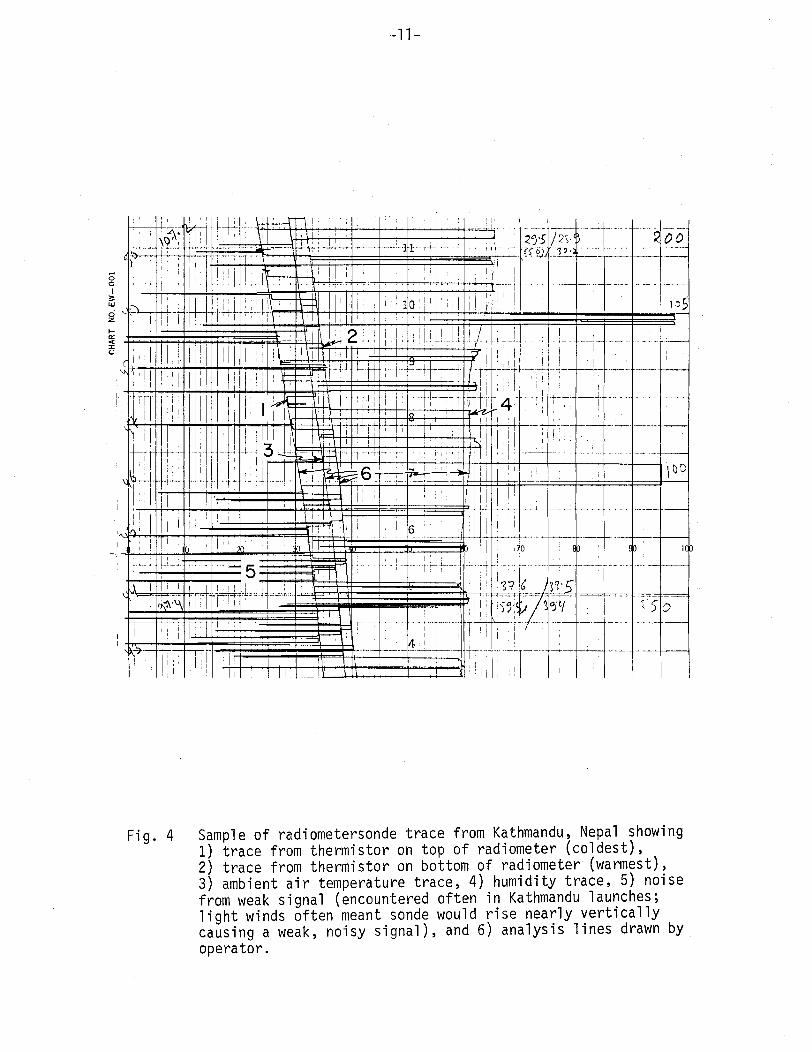
respective thermometers were recorded. This calibration provided lock-in
values for the temperature evaluators for subsequent conversion of temp-
erature frequencies into centigrade temperatures. Figure 4 shows a sample
radiometersonde trace.
The basic method of data analysis required for the radiometer soundings
was identical to that described in the previous section for rawinsonde
soundings. The only difference between the rawinsonde and radiometersonde
procedures was that for the latter, more mandatory levels were required
to be computed and recorded in the field for later use in radiation calcu-
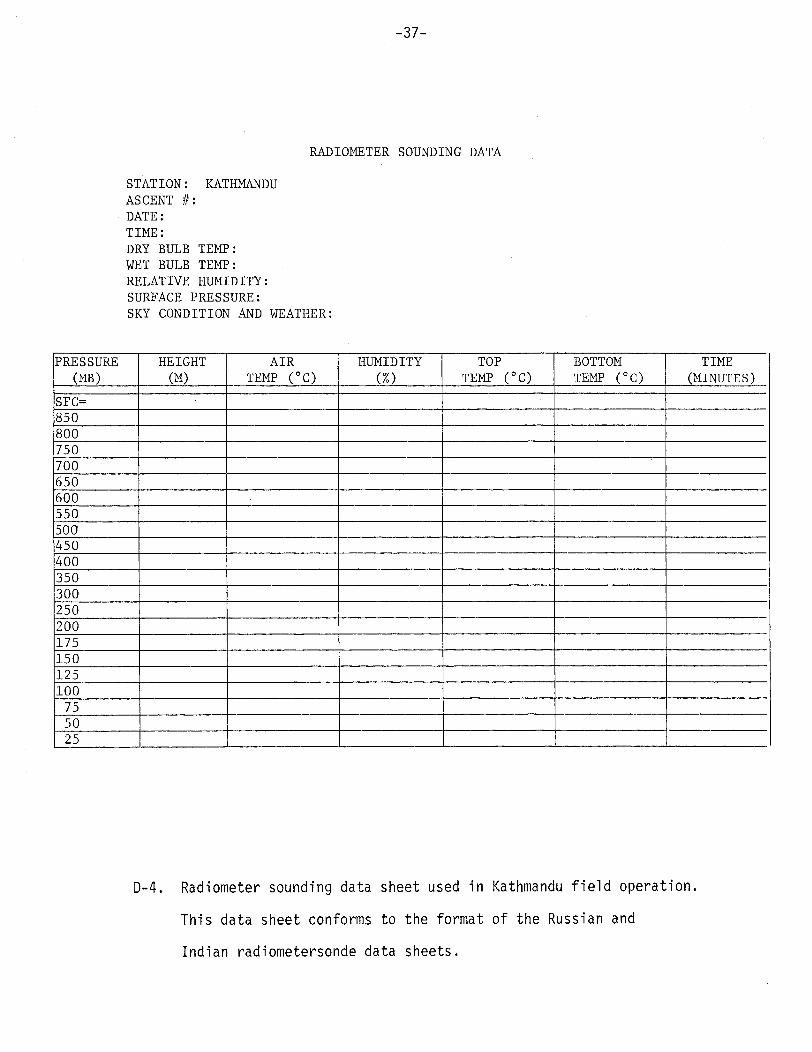
lations. A special radiometer data sheet was filled out for each sounding
following the format of the USSR and Indian radiometer data sheets list-
ing all data for levels at intervals of 50 mb up to 200 mb, and then
levels at every 25 mb above that pressure. Data at each of these levels
included height, air temperature, relative humidity, top and bottom
radiometer temperatures, and the time after launch. From these data the
Indian Meteorological Office later computed upward and downward radiation
fluxes and net radiation in a manner similar to that of Kuhn and Johnson
(1966), Bushnell and Suomi (1961), and Tanner et al. (1960). (See
Appendix D for pictures of the radiometersonde system, a sample radiometer
data sheet, and a further description of the radiometersonde system.)
4. Conclusions and Recommendations
We feel that the NCAR MONEX rawinsonde/radiometersonde system and data
analysis method could lend itself to future field applications for the
following reasons:
1. The system is portable in that it is lightweight and easy to
break down and transport to remote field sites as a set of
relatively small components.
2. The data analysis procedure is made straightforward, uncompli-
cated, efficient, and easy to learn. This method is unique in
that it effectively and economically combines simplified aspects
of an automatic processing concept (i.e., the programmable pocket
calculators), and the conventional graphical analysis method
(miniaturized wind plotting sheets with a small drafting board
and T-square).
~-11-
I~--,
I ''
I i I .I i II i II-1--T
....
i .i i
.I � .
� � II
4~
+ :*~~~ + ~~ + -~ i ~~
IIii I I I� i I
I Ii 1 1 1I
I t�
I -±Iti 4 -H4- 4 -! - -h- r -~ - --a ----- 4 4 -4
I , I ;, i i I I I--I iI i I "--t- - - .--I - t n ! -:- .- -.I I1 11 I I1i ~ ~~ i , . ! i ~~~~~~ ~~ i .4 ! , !it ill 1 I , I 1 ; I i ; 1 . , r 1 I : ! i "~~~~~~~~~~~~~~~K i~ I
.i l l : J )- I 1 .
It4 H rtPii IVI thr'-H- 4 4-~~~~~~~~~~~~~~~~~~ 4-H- 4-H- 4~~~~~~~~~~~~~~~~~~~~I ~ - --t i-
Ii iII 1
I
-I.J.3
I .i-I �..--I I-,,- I � '-4 I, /~~~~~~~~~~~~~~I
I ' 6 ii
-4 ''
+ i44 44-aI
Ft 'I i o 1
i I ' I I I
-F - I I -1 16T 1 1
I - Lii
I. - I~
I5=I.1 :4'=' .4=
I I I I - I lkI\ I IT I --
I .I
iII
i II
4 � II I
I1 Ii -..I - .~ I. i .I
- 1;I', 257
j -,I
I II. IIIII II ;I
II.II
I"411.111: i..I I�U-! !I
I
I. i �I , .
II
-t-- -.-11;I
i� 1 �I , ,II ---
0
I
I ;1 8
13?15
-� I/
I
i
Fig. 4 Sample of radiometersonde trace from Kathmandu, Nepal showing1) trace from thermistor on top of radiometer (coldest),2) trace from thermistor on bottom of radiometer (warmest),3) ambient air temperature trace, 4) humidity trace, 5) noisefrom weak signal (encountered often in Kathmandu launches;light winds often meant sonde would rise nearly verticallycausing a weak, noisy signal), and 6) analysis lines drawn byoperator.
C
w6zC-
r
II
F-T
0
4 -4 1 1 1 i i a i i .
1 1 I - Ii-I'7 'T ---� I-- -; I -j --'t I i --- ---i i - Ij .1, I -, ; , I , 1 -1 I " ! I , 1 , 1 . I I I I I . .� I
I I I ; I I
1- I. 1. �- -.-- .-I , I I 1 1 1 1 1 . I i I I i 1 ", i ii I I I i I -- � I .1I I I i I i II ,- I , i I. I I I I --- I I ------- "
I . . .- . I I I L I I . , I � I I I i I I I I I I I
I , i OF-If- + iI i i i I i i i i -L-
i I i i i i 5 I ! i I i I 0 i 4 i A i e
� :�!::, 1 ;.!!! 'I Ii i k i 0 1 i i I I i j
. . I . . . I I .. . P. . - : i T i i i , I i 1 i � 1 ! I I f, I l i II I : I I I -- I . I . . I I I ,I I I I I I .
A i 4� � I i i I I i i i id � i i I +f
= 7� -A i I i ! i i : i i � i i i A i i �
i i Ii . i iI II --II1A==;9m9 i �i � i , , i � i i . � -�� i i � � i
-I 1 1 - . . . I . w . . i. i i . j i . . q i 4-i- i i i F
I " - I I.............7
:, : , T : , , , I ; : , , I , I I I i - q I . i i iI I III-, -v 4---
. i I
II' ! I �N-,,\-A l I I 1 1 1I IA -i-. I
i I F7F-- 1 7
I i � iI I -4
1 : i . I . .11
i
ii
I
....
i
l i a b l e 1 1 I -
1 1" -, ---- I -I-rR . + I -- -4 --- I -
),.)5ii . 0:I[ II II I i
I ;Ii Lid il
I �
I L I --ILI II
I
II i.
III.i -I-I
: I
II
i
i
:I
I :i
Ii
IIi iII
a
F FFT I I I. � ll� il jrj I I
i 1 i�- -I I i �iI
ii
i . :. . II . l iI--,-I
II
I
I
I .
.-.- ---. I
9
-... :Z-. -7:- 1
I iii I
rl��II i . I I-i I II-
tI- . _; -IIi I i ; I
I
I
I
i.- - -
I-�l 1;�i--!Ii � i
.-;;1-7F I - Ii
.h II. iii
i , � I � � i. � - -I !_ 1i i I I 'i
I I I I II i I I
I
� II 1-110
I
-
I i ; 1 I I i I. i
I 1 . 'I--�m
I- .. ... . . . . . . . - ----
i-
I
! Ib I i
-4 �, i;
I.I ;i. iiI
1 1,Ii Iq I
1
I I !. I
i
I : " 11
I.I--
f
i . --T- '- I� i �I I I H 7
� i; I -7
-12-
3. Two operators can perform the entire launch, data collection,
analysis, and coding on site in less than two hours.
4. The solid state multiplexer units effectively interface the
radiometers with the standard VIZ radiosondes.
In addition, we would like to make the following recommendations:
1. A trained electronics technician should be available during
the initial -setup phase to properly troubleshoot and repair
any malfunctioning system hardware on site.
2. Local meteorological office personnel with a basic background
in observation and analysis should be trained on a minimum of
6-10 soundings.
3. A transformer can safely be used to convert 220 V power supply
to 110 V to recharge the pocket calculators but the PC-1201
only functions correctly on 60 cycles and must be unplugged
and operated on the enclosed battery pack to work properly
when the local power supply is not 60 cycle.
-13-
Appendix A
Height and Dew 'Point Calculations
-14-
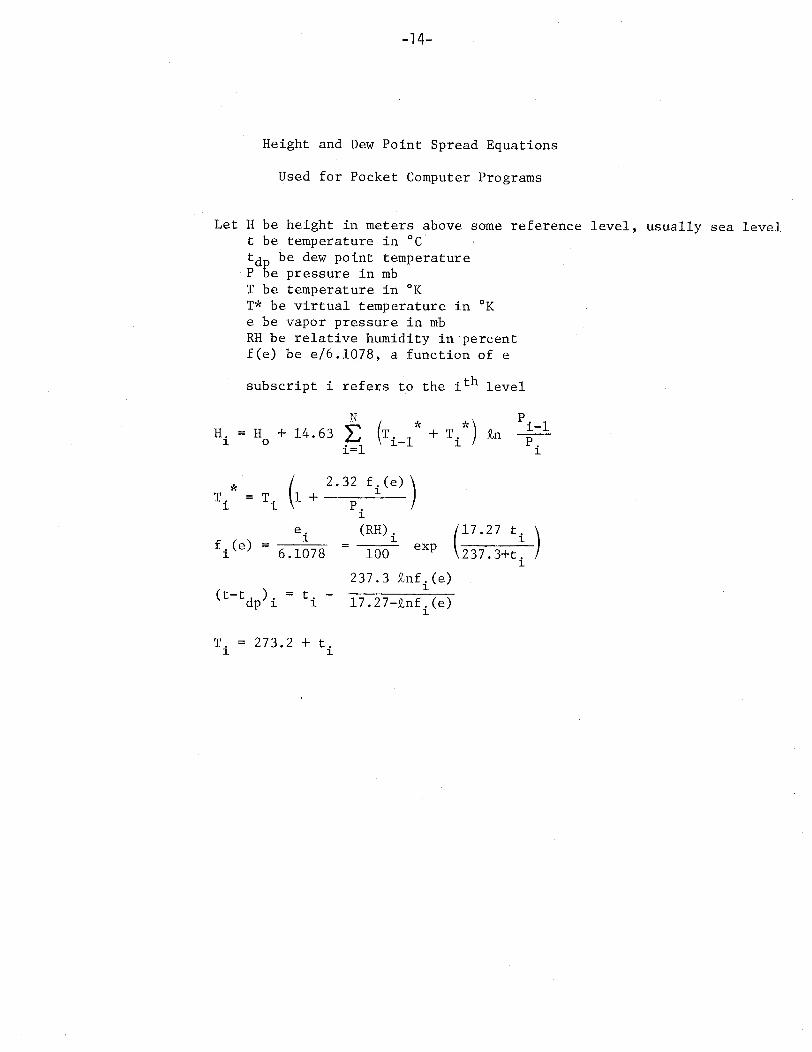
Height and Dew Point Spread Equations
Used for Pocket Computer Programs
Let H be height in meters above some reference level, usually sea levelt be temperature in °Ctdn be dew point temperatureP be pressure in mbT be temperature in °KT* be virtual temperature in °Ke be vapor pressure in mbRH be relative humidity in percentf(e) be e/6.1078, a function of e
subscript i refers to the ith level
H. = H + 14.63i o E (Ti-l + Ti ) n
i=l
i-P.i
T =T (/ + 2.32 fi(e)\
i1 = 1T i [ + P.1i
e.f (e) = ii 6.1078
(RH).
100 exp
(17.27 ti )237.3+t.
1
(t-tdp)ip i
237.3 Znfi(e)
ti 1 17.27-jQnf.(e)
T. = 273.2 + t.1 1
-15-
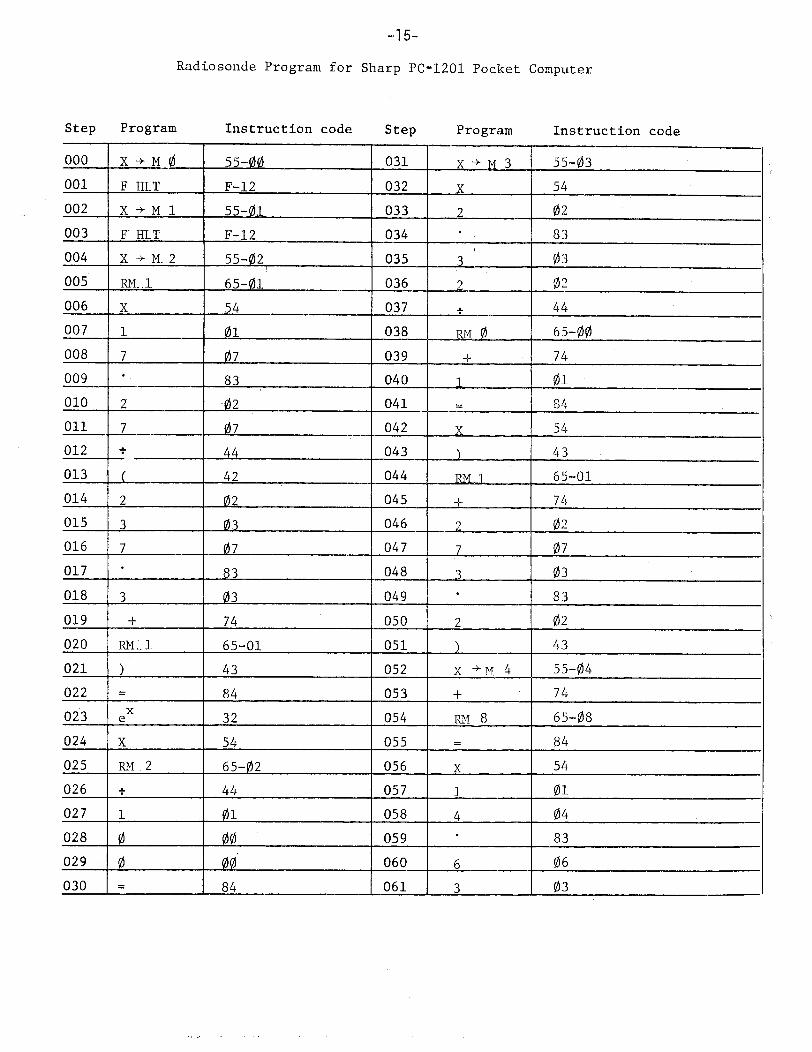
Radiosonde Program for Sharp PC-1201 Pocket Computer
Step Program Instruction code Step Program Instruction code
000 x -* m0 55-00- 031 x ~M 3 55-03001 F HLT F-12 032 x 54
002 X *M 1 55-01 033 202
003 F HLT F-12 034 .83
004 x > ÷m. 2 55-02, 035 303
005 RM-l . 65-01 036 2 02
006 x 54 037 44
007 1 01 -038 RM 0 65-00
_____ 7_ _ __ _ _ _ _ ___7__ _ __ _ 039 +74
009_ 83_ __ _ __ _ __ _ _ 040 1 01
_____ 202041 =84
Oil__ 7_ _ _ _ _ _ _ _ __ _ _ _ _ _ _ _ _ 042 54
013__ 42___________044 RM 1- 65-01
014__ 2_ _ _ __ _ 2 045_ _ __ _ __ __ _ __ _ __ _
_____ 3_ _ __ _ 03- 046__ 02__ _ __ _
016__ 7_ _ __ _ 0.7 047_ __ _ ___7__ __07_ _
017__ 83 080
_____ 3_ __ _ __ 03 049 83
019__ 74 050 2 02
020 RM4'-- 1, 65-01 051 43
021 43 ~~~~~~~052 x ~m 4 55-04
022 =84 053' + 74
02'3 eX 32 054 RM 8) 65-08
024 x 54 055 =84
025 RM. 2 65-02 056 x 54
026 - 44 057 1 01
027 101 058 4 04028 0 00 059 83
029 0 0060 606
030 = 84 -061 3 03
-16-
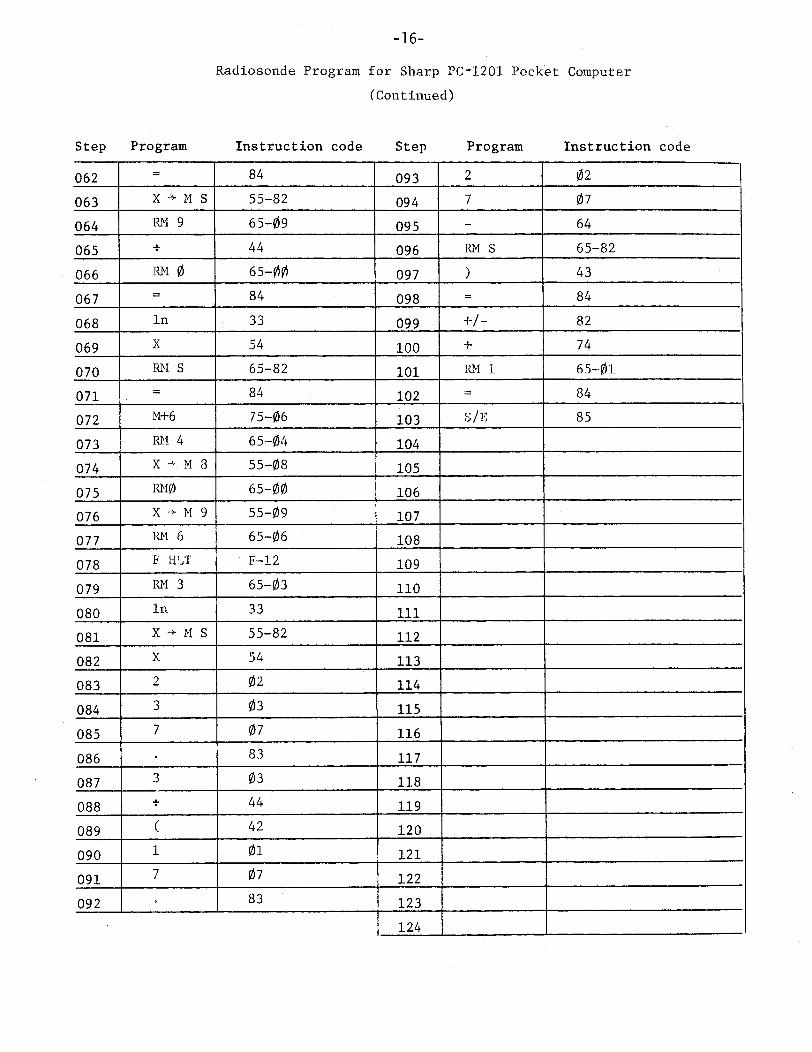
Radiosonde Program
Step Program Instruction code
for Sharp PC-1201 Pocket Computer
(Continued)
Step Program Instruction code
062 -84 093 2 02
063 X-MS 55-82 094 7 07
064 RNM 9 65-09 095 - 64
065 t44 096 RIM S 65-82
066 RIM40 65-00 097 )43
067 -84 098 -84
068 in 33 099 +-82
069 X 5 4 100 + 74
070 RM S 65-82 101 RM 1 65-01
071 -84 102 =84
072 14+6 75-06 103 SE 85
073 RN 4 65-04 104 ______ ____________
074 X M>1 3 55-08 105__ _ _ _ _ _ _ _ _ _ _ _
075 RHNO 65-00 106 ______
076 X +* M 9 55-09 107 _______
077 ~RM 6 65-0610__ _ _ _ _ _ _ _ _ _ _ _
078 FILF12109 _____________
079 RM 3 65-03 110 _ _ _ _ _ _ _ _ _ _ _ _ _ _ _ _ _ _ _ _
080 in 3311
081 x- 4S 5-2112 ____________________
082 x 54 113 ____________________
083 2 02 114 _ _ _ _ _ _ _ _ _ _ _ _ _ _ _ _ _ _ _ _
084 303 115 _ _ _ _ _ _ _ _ _ _ _ _ _ _ _ _ _ _ _ _
085 7 07 116 _ _ _ _ _ _ _ _ _ _ _ _ _ _ _ _ _ _ _ _
086 83 117 _ _ _ _ _ _ _ _ _ _ _ _ _ _ _ _ _ _ _
087 03118 _ _ _ _ _ _ _ _ _ _ _ _ _ _ _ _ _ _ _ _
088 44 119
089 ( 2120 __ _ _ _ _ _
090 01121 _ _ _ _ _ _
091 707 122 ___ ____
092 83 123 _ _ _ _ _ _ _ _ _ _ _ _ _ _ _ _ _ _
124I I
-17-
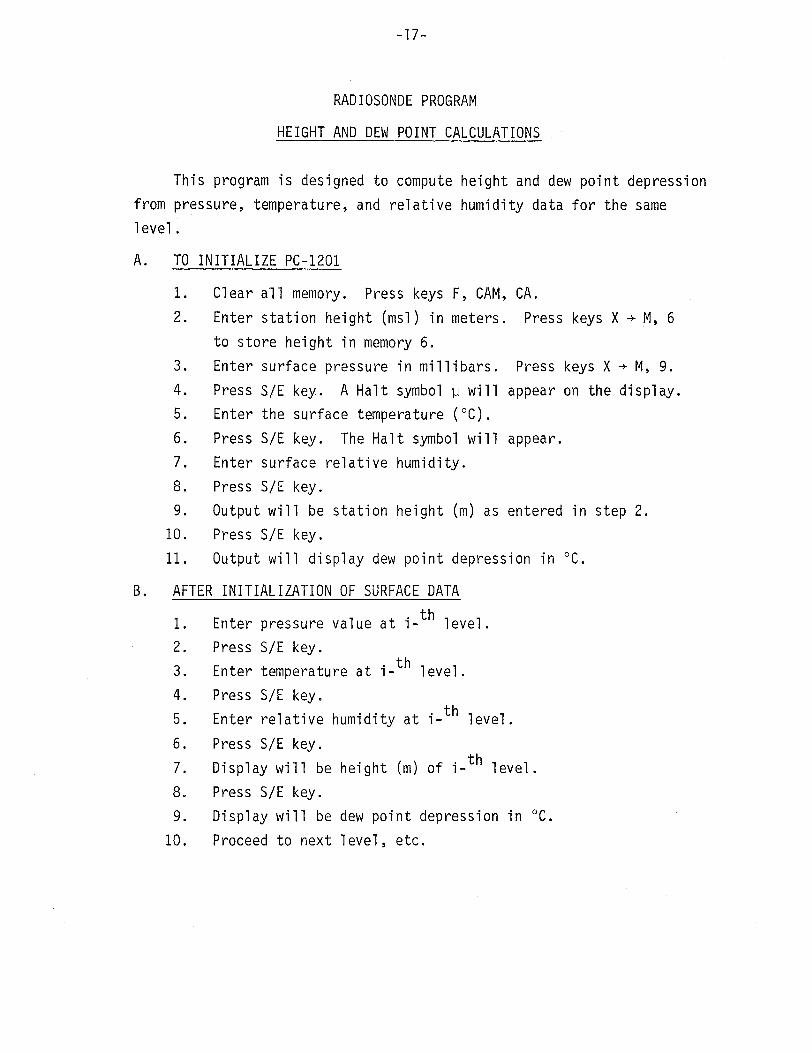
RADIOSONDE PROGRAM
HEIGHT AND DEW POINT CALCULATIONS
This program is designed to compute height and dew point depression
from pressure, temperature, and relative humidity data for the same
level.
A. TO INITIALIZE PC-1201
Clear all memory. Press keys F, CAM, CA.
Enter station height (msl) in meters. Press ke
to store height in memory 6.
Enter surface pressure in millibars. Press key
Press S/E key. A Halt symbol i will appear on
Enter the surface temperature (°C).
Press S/E key. The Halt symbol will appear.
Enter surface relative humidity.
Press S/E key.
Output will be station height (m) as entered in
Press S/E key.
Output will display dew point depression in °C.
ys X + M, 6
s X - M, 9.
the display.
step 2.
B. AFTER INITIALIZATION OF SURFACE DATA
tfhEnter pressure value at i-th level.
Press S/E key.
Enter temperature at i- th level.
Press S/E key.t h
Enter relative humidity at i- th level.
Press S/E key.t*h
Display will be height (m) of i- th level.
Press S/E key.
Display will be dew point depression in °C.
Proceed to next level, etc.
1.
2.
3.
4.
5.
6.
7.
8.
9.
10.
11.
1.
2.
3.
4.
5.
6.
7.
8.
9.
10.
-18-
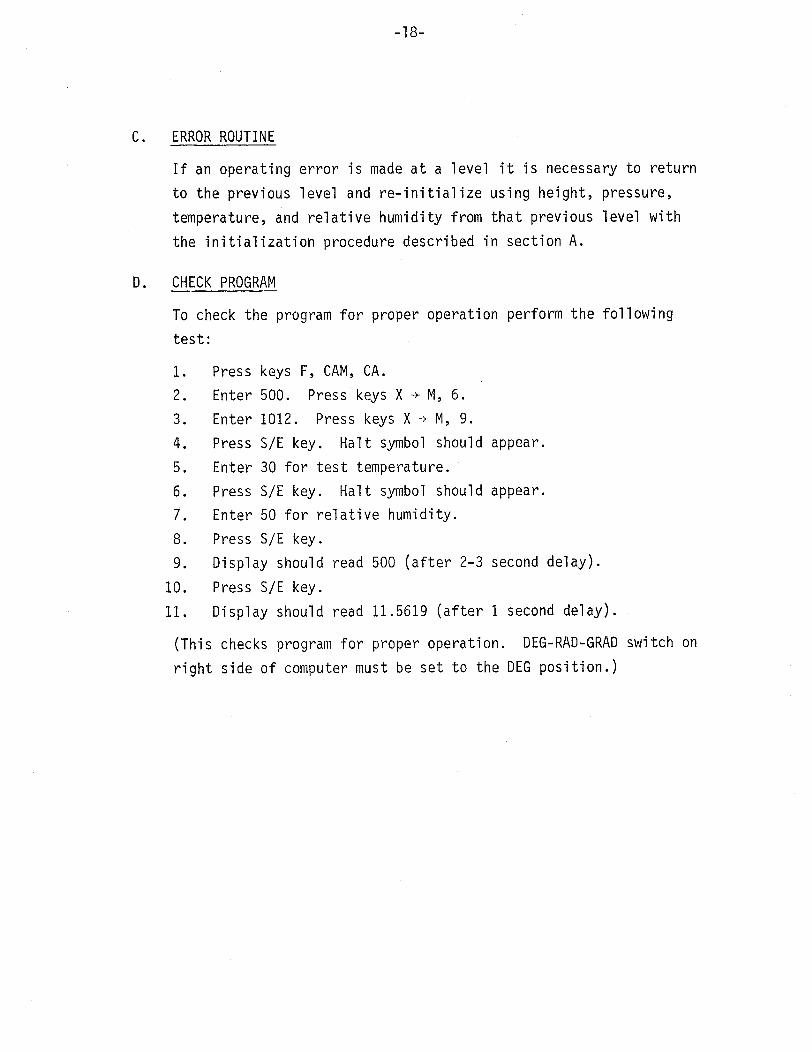
C. ERROR ROUTINE
If an operating error is made at a level it is necessary to return
to the previous level and re-initialize using height, pressure,
temperature, and relative humidity from that previous level with
the initialization procedure described in section A.
D. CHECK PROGRAM
To check the program for proper operation perform the following
test:
1. Press keys F, CAM, CA.
2. Enter 500. Press keys X - M, 6.
3. Enter 1012. Press keys X -> M, 9.
4. Press S/E key. Halt symbol should appear.
5. Enter 30 for test temperature.
6. Press S/E key. Halt symbol should appear.
7. Enter 50 for relative humidity.
8. Press S/E key.
9. Display should read 500 (after 2-3 second delay).
10. Press S/E key.
11. Display should read 11.5619 (after 1 second delay).
(This checks program for proper operation. DEG-RAD-GRAD switch on
right side of computer must be set to the DEG position.)
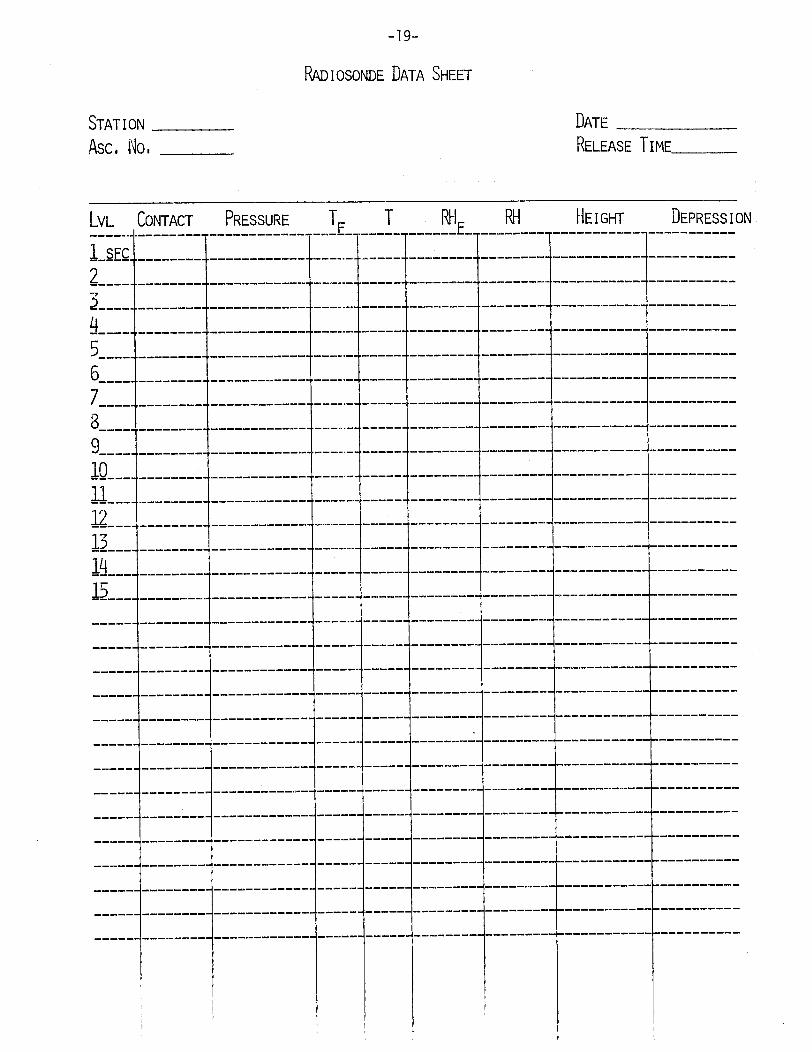
-19-
RADIOSONDE DATA SHEET
STATION __ _ _ _
As o. IN 'o. _ _ _ _
LVL CONTACT PRESSURE TFR H RH
DATE
RELEASE TIME____
HE I GHT DEPRESSION--- -- -- -- --- -- -- -- ----- L ------ --- --- -- - . -- -
I-S ECC--- - - - - - - -- --- - - - --- - - --- - - - --- - ---- - - - - - - -
3----------------------------------- -------.- - ---------
--- - - - -- - - - - --- - --- - - -- - -- - - - - - - --- - -- - - - - - -
4 ---- - ---- -- - --------- - - -. - -------.-------- --- - ---- --- -- -- -
- --- - -- - --- - - - --- - -- - - - --- -- - --- - - - - - - - - - - - - - -
7- - -- ----------- ,-----.----------- ---- ---- - - ---- - - - - --- -- -.- ---- - - -
i - - - ---- - - - - --- - -- - - ---- - - - - - - - - - - - - - - - - - -
15 -.--------------------------------------------- -- --
…-- - - - - - - - - - - - - - - - - - - - - - - - - - - - - - - - - - - - - - -
II
I


-21-
Appendix B
Winds Aloft Computations
-22-
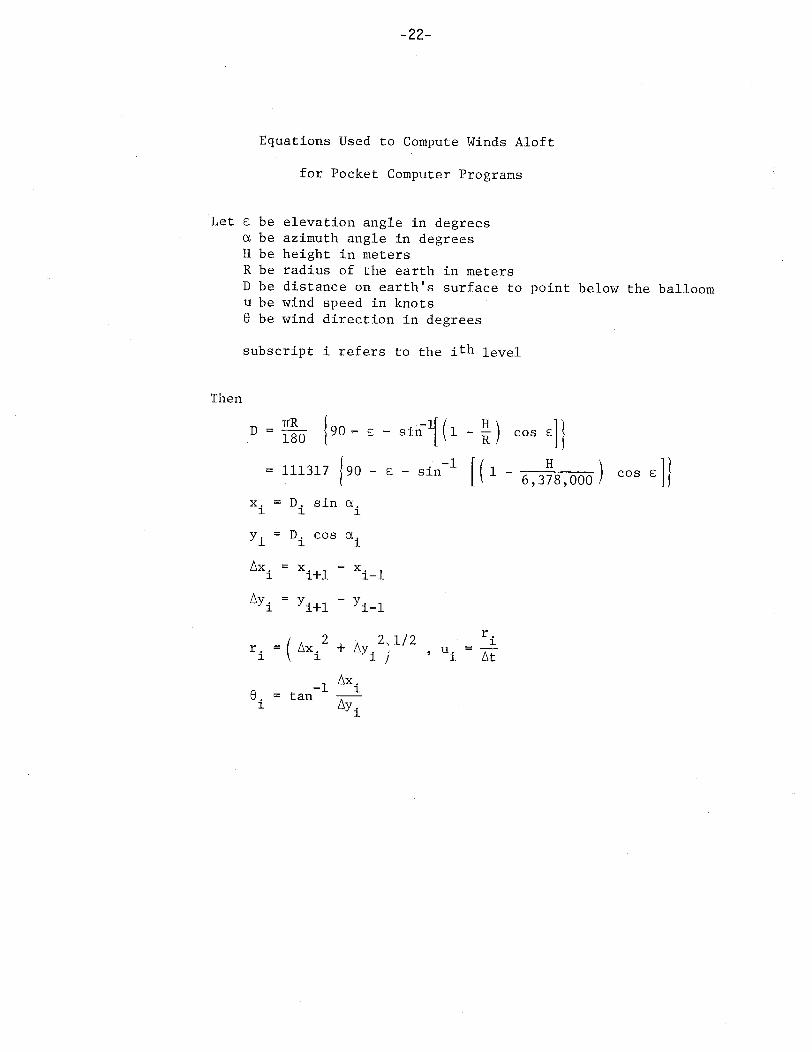
Equations Used to Compute Winds Aloft
for Pocket Computer Programs
Let £ be elevation angle in degreesa be azimuth angle in degreesH be height in metersR be radius of the earth in metersD be distance on earth's surface to point below the balloomu be wind speed in knots0 be wind direction in degrees
subscript i refers to the ith level
Then
D =- {o - sin 5 (1 -1) cos ]
= 111317 {90 - - sin -1 [1 - 6 378000) cos
x. = D. sin a.
y. = D. cos a
Ax! x\+ -x.-i i+l i-l
Ay i Yi+l i-l
2 2,1/2 1r. (Ax. +Ay / ,
- Ax0. = tan
i t~Ay
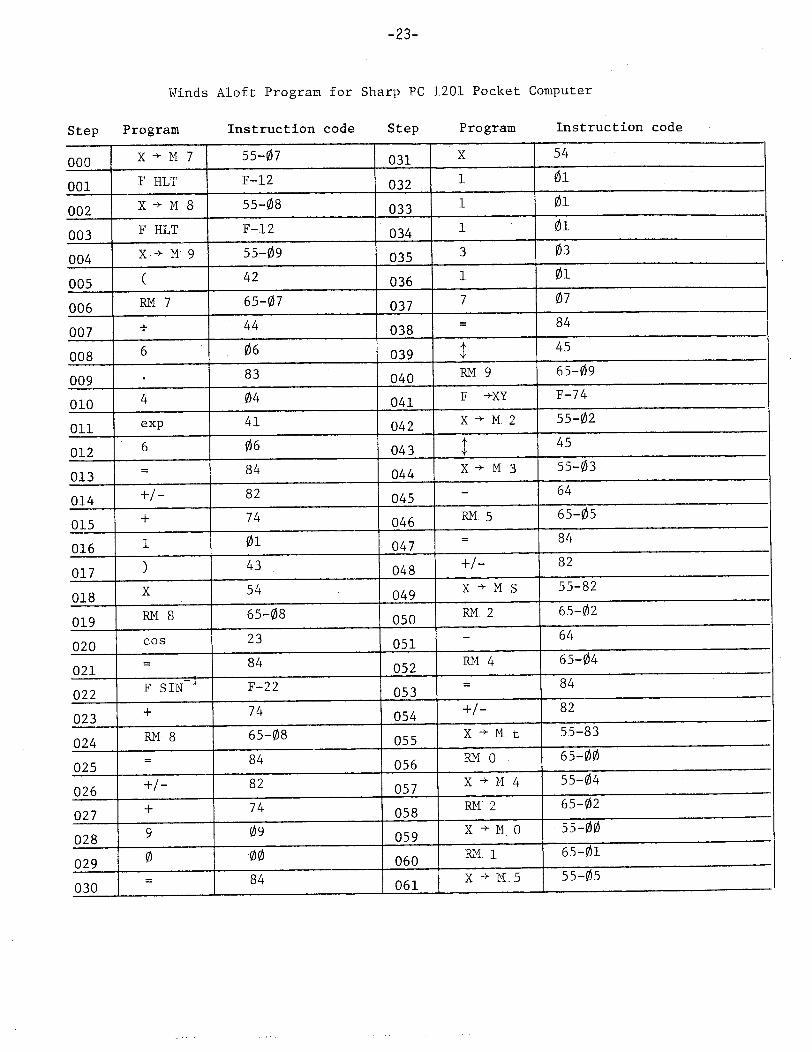
-23-
Winds Aloft Program for Sharp PC 1201 Pocket Computer
Step Program Instruction code Step Program Instruction code
000 X -*M 7 55-07 031 54
001 ~F ULT F-12 02 1 01
002 X -* M8 55-08 033 1 01
003 F HLT F-12 034 1 01
004 X ->. N9 55-09 035 30 3
005 (42 036 1 01
006 R~M 7 65-07 037
007 __ _ _ _ _ _ _ _ _ _ _ _ _ _ _ _ _ 038 -8
008 606 039 4
009 ~~~~~8 3 00 RM49 65-09
010 ~404 01 F -±XY F-74
011 ~exp 41 042 XM,2 55-02
012 606 043 45______________
013 -84 044 X MN3 55-03
014 82 045 -64
015 + ~~~~74046 RM. 5 65-05
016 101 047 -84
017 43____________ 048 8
018 x 4049 X *M S 55-82
019 ~RMN 8 65-08 00 RMN 2 65-02
020 ~Cos 23 01 -64
021 -84 052 RM 4650
022 F SIN1 F-22 053 -84
023 + 74 054 82
024 RNM8 65-08 055 X *M. t 55-83
025 84 056 RN 0650
026 ~~~~~82 057 X -* N 4 55-04
027 + 74 058 RNM 2 65-02
028 909 059 XNM 0 55-00
029 0 -00 060 RI~165-01
030 84 061 X mi ,5 55-05
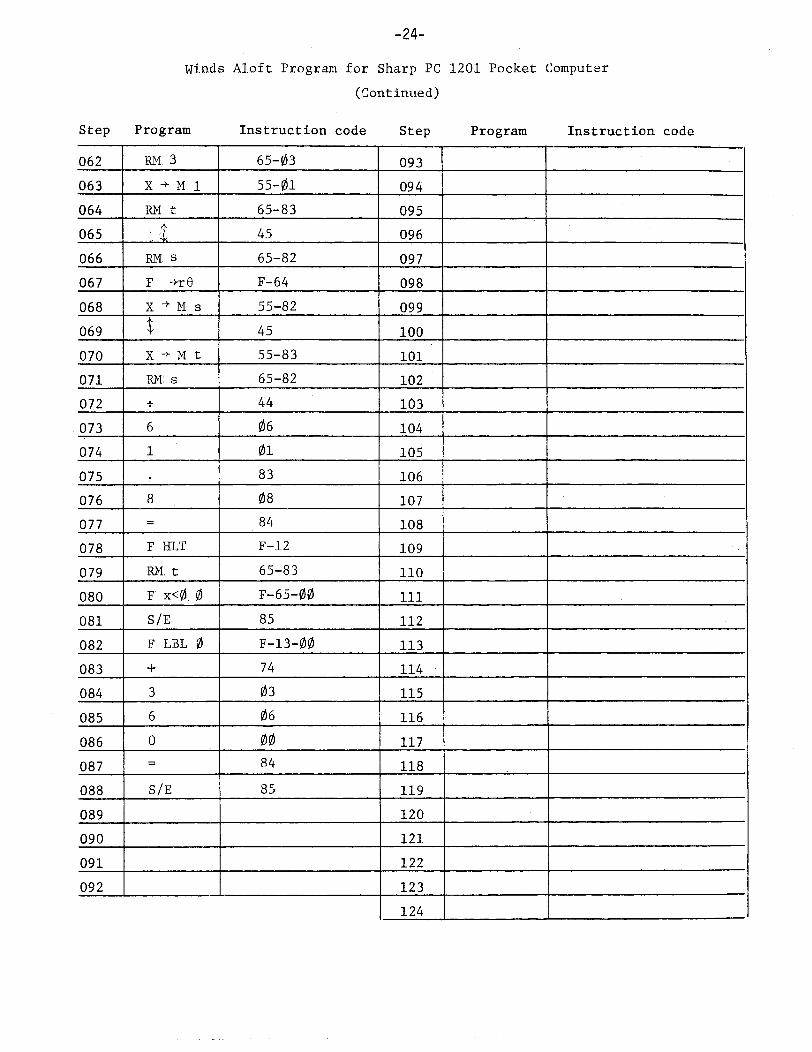
-24-
Winds Aloft Program, for Sharp PC
(CO-ontinued)
1201 Pocket Computer
Step Program Instruction code Step Pro gram Instruction code
062 RN. 3 65-03 093 _____________
063 X -NM1 55-01 094 _ _ _ _ _ _ _ _ _
064 RMN t: 65-83 095
065 _____ 45 096
066 RMN S 65-82 097 _______
067 F -*OF-64 098__ _ _ _ _ _ _ _ _ _ _ _
068 X MNs 55-82 099 __ _ _ _ _ _ _ _ _ _ _ _ _
069 $45 100__ _ _ _ _ _ _ _ _ _ _ _
070 X M.- t 55-83 101__ ___________
071 RNI s 65-82 102 _____________
072 _______ 44 103
073 6 06 104
074 1 01 105 _ _ _ _ _ _ _ _ _ _ _ _ _ _ _ _ _ _ _ _
075 83 106 _ _ _ _ _ _ _ _ _ _ _ _ _
076 8 08 107
077 - 84 108 __ _ _ _ _ _ __ _ _ _ _ _ _ _ _ _ _ _
078 F HLT F-12 109
079 RN. t 65-83 110 _ _ _ _ _ _ _ _ _ _ _ _ _ _ _ _ _ _ _ _
080 F x< 0. 0 F-65-00 11ill_ __ _ _ _ _ __ _ _ _ _ __ _ _ _ _
081 S/E 85 112
082 F LBL 0 F-13-00 113 __ _ _ _ _ _ __ _ _ _ _ _ _ _ _ _ _ _
083 + 74 114 _ _ _ _ _ _ _ _ _ _ _ _ _ _ _ _ _ _ _ _
084 3 03 115 __ _ _ _ _ _ __ _ _ _ _ _ _ _ _ _ _ _ _
085 6 06 116__ _ _ _ _ _ _ _ _ _ _ _ _
086 0 00 117 _ _ _ _ _ _ _ _ _ _ _ _
087 -84 118 _ _ _ _ _ _ _ _ _ _ _ _ _
088 S/E 85 119
089 120
090 121 ____ ___
091 -1-2-2 __ _ _ _ _
092 __ _ __ _ _ __ _ _ _ __ _ _ _ 123 _ _ _ _ _ _ _ _ _ _ _ _ _ _ _ _ _ _ _ _
124I
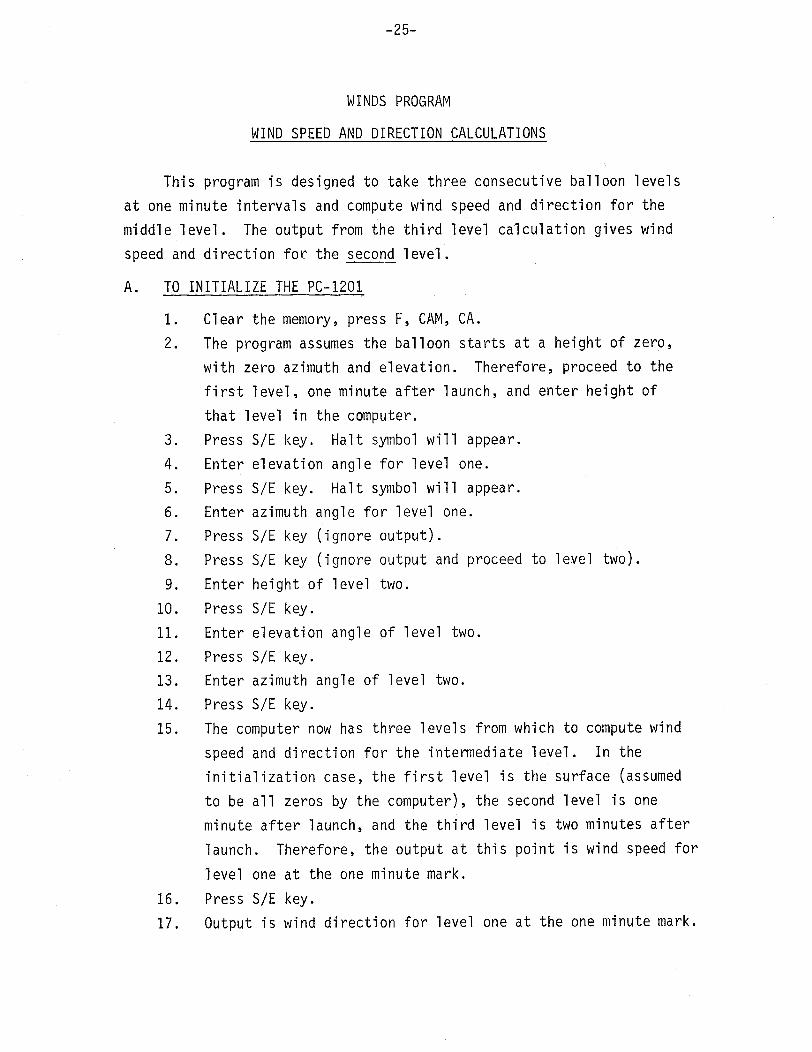
-25-
WINDS PROGRAM
WIND SPEED AND DIRECTION CALCULATIONS
This program is designed to take three consecutive balloon levels
at one minute intervals and compute wind speed and direction for the
middle level. The output from the third level calculation gives wind
speed and direction for the second level.
A. TO INITIALIZE THE PC-1201
1. Clear the memory, press F, CAM, CA.
2. The program assumes the balloon starts at a height of zero,
with zero azimuth and elevation. Therefore, proceed to the
first level, one minute after launch, and enter height of
that level in the computer.
3. Press S/E key. Halt symbol will appear.
4. Enter elevation angle for level one.
5. Press S/E key. Halt symbol will appear.
6. Enter azimuth angle for level one.
7. Press S/E key (ignore output).
8. Press S/E key (ignore output and proceed to level two).
9. Enter height of level two.
10. Press S/E key.
11. Enter elevation angle of level two.
12. Press S/E key.
13. Enter azimuth angle of level two.
14. Press S/E key.
15. The computer now has three levels from which to compute wind
speed and direction for the intermediate level. In the
initialization case, the first level is the surface (assumed
to be all zeros by the computer), the second level is one
minute after launch, and the third level is two minutes after
launch. Therefore, the output at this point is wind speed for
level one at the one minute mark.
16. Press S/E key.
17. Output is wind direction for level one at the one minute mark.
-26-
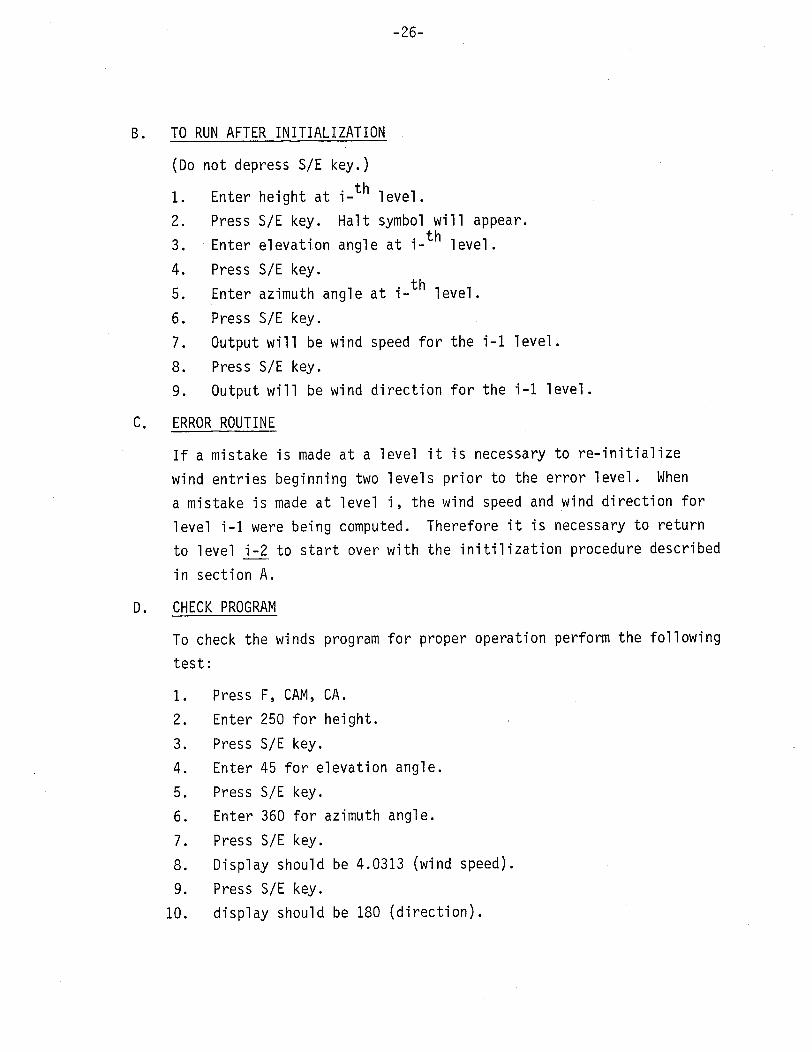
B. TO RUN AFTER INITIALIZATION
(Do not depress S/E key.)
1. Enter height at i- level.
2. Press S/E key. Halt symbol will appear.
3. Enter elevation angle at i- th level.
4. Press S/E key.
5. Enter azimuth angle at i- th level.
6. Press S/E key.
7. Output will be wind speed for the i-1 le
8. Press S/E key.
9. Output will be wind direction for the i-
vel.
1 level.
C. ERROR ROUTINE
If a mistake is made at a level it is necessary to re-initialize
wind entries beginning two levels prior to the error level. When
a mistake is made at level i, the wind speed and wind direction for
level i-1 were being computed. Therefore it is necessary to return
to level i-2 to start over with the initilization procedure described
in section A.
D. CHECK PROGRAM
To check the winds program for proper operation perform the following
test:
1. Press F, CAM, CA.
2. Enter 250 for height.
3. Press S/E key.
4. Enter 45 for elevation angle.
5. Press S/E key.
6. Enter 360 for azimuth angle.
7. Press S/E key.
8. Display should be 4.0313 (wind speed).
9. Press S/E key.
10. display should be 180 (direction).
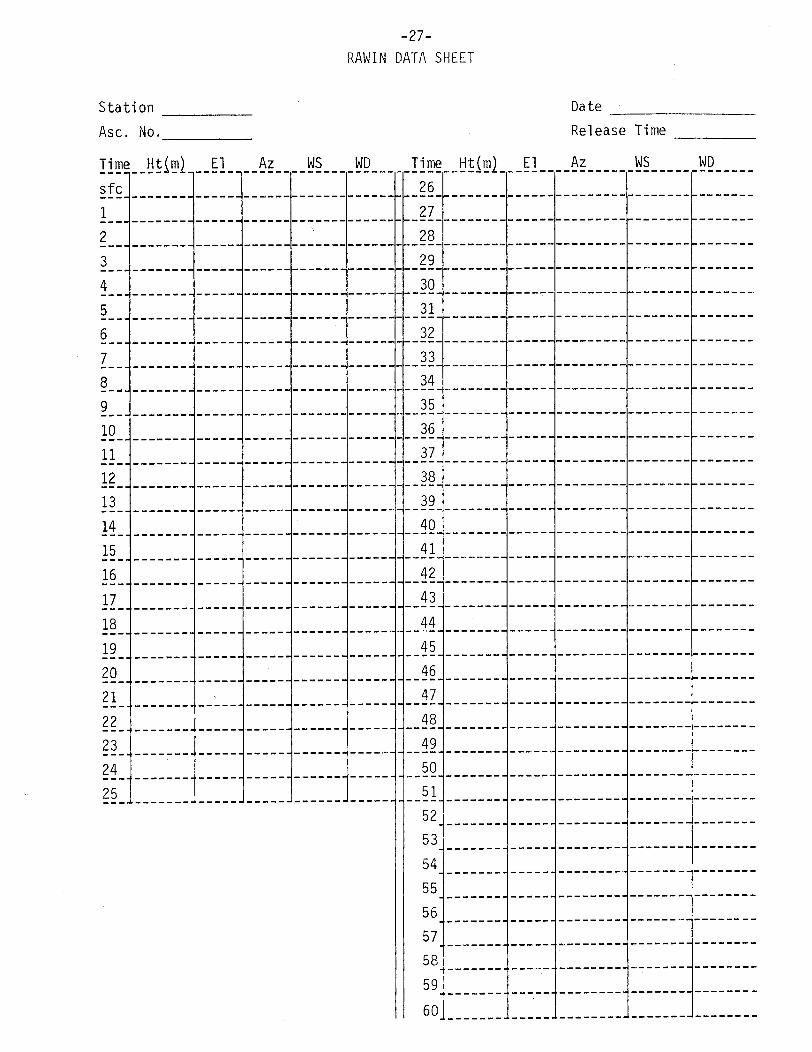
-27-
RAWIN DATA SHEET
Station Date
Asc. No. Release Time
Time Ht(m) E1 Az -- WS WD Time Ht(m) E1 Az WS WD ----
s fc 26.- ...
2 .. .28.3 1 --- 1-----1-- --- - -------- ------- -- ------------------ -------------3 29
4 ---------- 30 28 . ...--- -
5 ---------------- 31------ ---------
6 -------------- 32 . .....
7 ----------------- 33----
10 -. - 3-- -
12 38
13 - ------------- 3914-- -------------- 40
15 41
16-.-- ------------------------- I------------- -------------------17 43------4------ ----
18 -- .4--4 --- -----------. 44 ---.19- ------- 45--
20- -.------. . .. 46
21 - -- ----- . . 47- - - -22 ~ ~ -------- ------------------------ ----- ----- ----- -
23 49
24-.-- ----- ---50-----------------50
25 51
52 ._ .
53 …
54 … __556-_ -56--57- - .. . . . .. . ... ..58 ...----- .--- -----
59 . ---------------
60 .---.---.----.--------

-29-
Appendix C
Wind Graphing and Coding
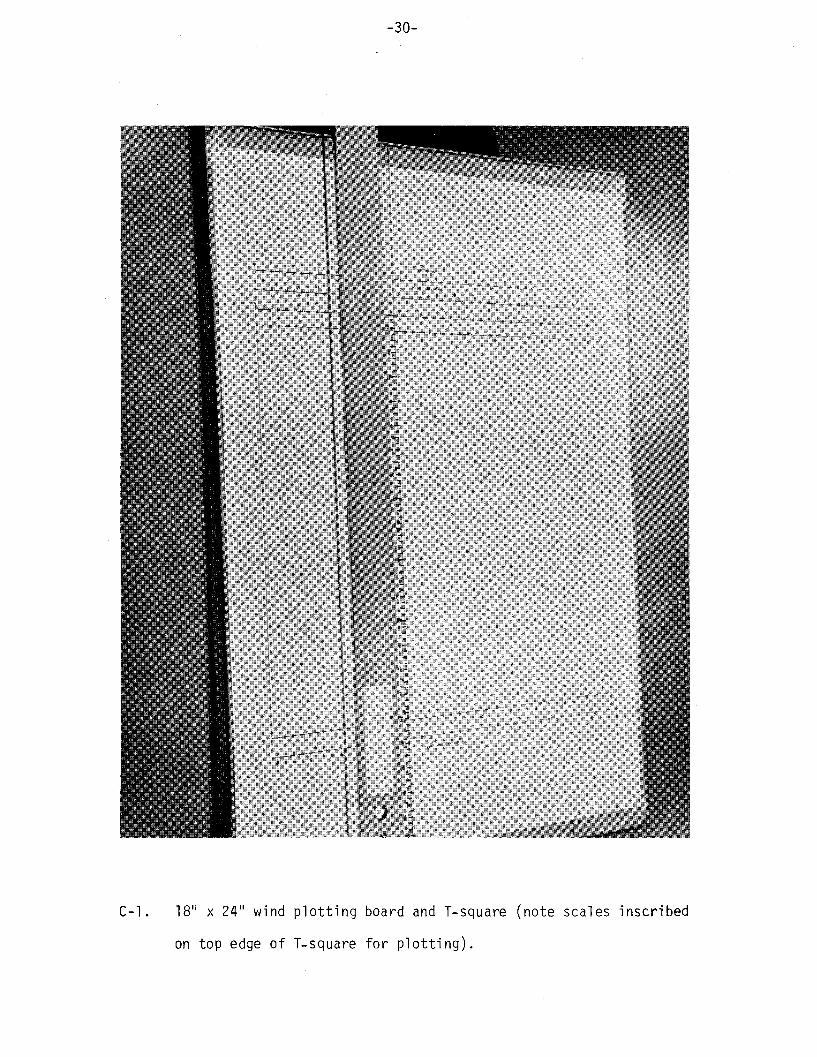
-30-
C-1 . 18" x 24" wind plotting board and T-square (note scales inscribed
on top edge of T-square for plotting).
-31 -
MINUTES PISHI
HEIGHT, KILOMETERS, ISS.
, - I -- . I I I I 4 - I i I- . t I- ~
i I - - - I - I I I I I I . I I I I I I I I I . I I I I I I I I � I , I , , I I I I I I I I -1 I I I I Ia Di 8 Di 8 t% I . . . . I ' is -r-l
1 1 I - I I I I . I I I I I I I I I . I I I I I I I I I . I I . I . I I I I I I I I I I I I I I I
8 I
s I . . .'' I al .1 i ' ' at 9 I ' ' aHEIGHT, THOUSANDS OF FEE-T. WSL
C-2. Wind plotting sheet reduced to less than 50% of original size.
---- ------- -- ... .. ...... ...... .. ... ........... .... .. ......... .... . .... .......I � I I I I .. .I. ... I ...I .... I .... I. .. �1 - .l
TTAA
00
70
25
1588
77
99 __ __
85
______ 50 ___ ___
_____ 30 ___ ___
____ ___ 20 _
_10 _
// OR 88999
0 OR 77799
TTBB __ 0 ____
22 33 44 ___ 55 __
66_ _ 77 __ ___ 88 99
11 .__ 22__. __ 33
51515 101 0
PPBB .0 ____ 90012 ____ ___ ___90346 __
90789 91246
_____ ____ 9____ ____ ____ ________ ____0
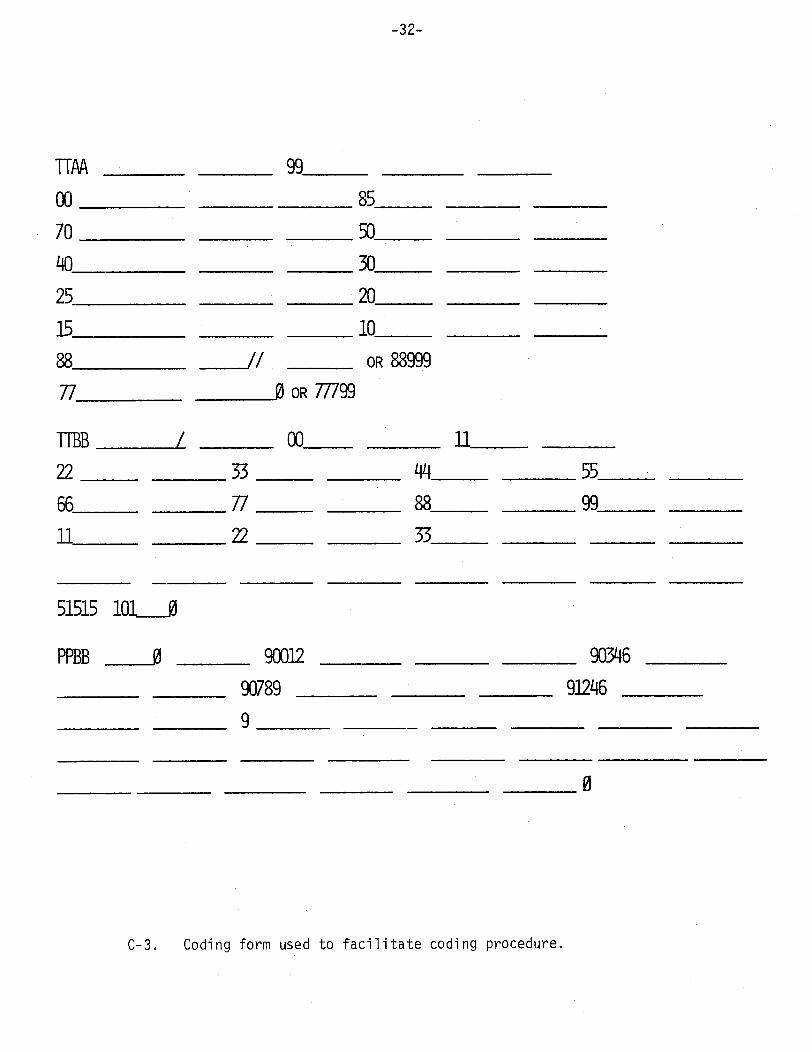
C-3. Coding form used to facilitate coding procedure.

-33-
Appendix D
Radiometersonde Procedures
-34-
D-1. Radiometersonde assembled and ready for flight.
.-35-
r0:-0S-o
0~
-0
E
I
E-wLUr(/)
H
I
-36-
I -"A- f.,iyVU,7 AL*w.OrW'i . LiIr i iI I . 1,11 i ..
y I~ ~ ~~~~~~~~~~~~~~~~~~~~~~~~~~~~~~~~L0 - 'U ~~~~~~~~~~~~~~~~0
L ~ m a g * I ~ 1 Ii C aan~~~~~~~~,J-
Li 0 V)~~~~~~~0
EA~~~~~~~H 0 -~ ~ ~ C l)E
0 00 o~~~~~ r-
Z ~ ~ 1P ~ 0 P ~ E 01 O H P t"4 N
0 z~~~~~~~~~~~~~~u :4 E-4 0 ~ 0 U
W 0 ~ ~ ~ ~ ~ ~ ~ ~ ~ ~ ~ ~~ -
~~~~~~4 U) ~ ~ ~ ~ ~ ~ ~ ~ ~ ~ ~ ~ ~ ~ ~ ~ U
0 0 In ~ ~ ~ ~ ~ ~ ~ ~ ~ 3-P4 ~~~~~~~~~~~0
E-4~ ~ ~ ~~~ ~~~~~~~~~~~~~~~~~~~~~*-
0 Ou~ ~ ~ ~ ~ ~ ~
0 0 0 C:) ~ ~ ~ ~ ~ ~ ~ ~ ~ 0
I
41i
i
iiIII VaiI
i :2
t�l
-37-
RADIOMETER SOUNDING DATA
STATION: KATHMANDUASCENT #:DATE:TIME:DRY BULB TEMP:WET BULB TEMP:RELATIVE HUMIDITY:SURFACE PRESSURE:SKY CONDITION AND WEATHER:
PRESSURE HEIGHT AIR HUMIDITY TOP BOTTOM TIME(MB) (M) TEMP (°C) (%) TEMP (°C) TEMP ('C) (MINUTES)
SFC=850800750
700650600550500450_____________400350300250200_______175 ___
150125100
75___________________5025 _._ __
D-4. Radiometer sounding data sheet used in Kathmandu field operation.
This data sheet conforms to the format of the Russian and
Indian radiometersonde data sheets.

-39-
Appendix E
Field Site Operations
-40-
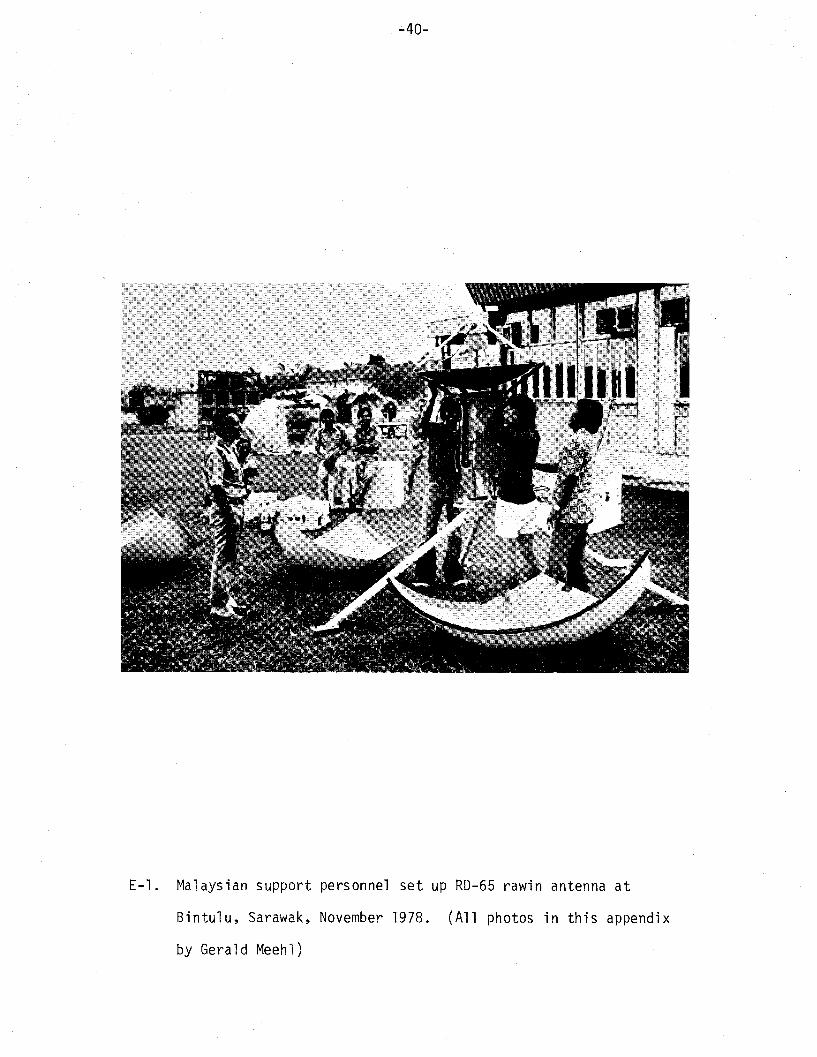
E-1. Malaysian support personnel set up RD-65 rawin antenna at
Bintulu, Sarawak, November 1978. (All photos in this appendix
by Gerald Meehl)
-41-
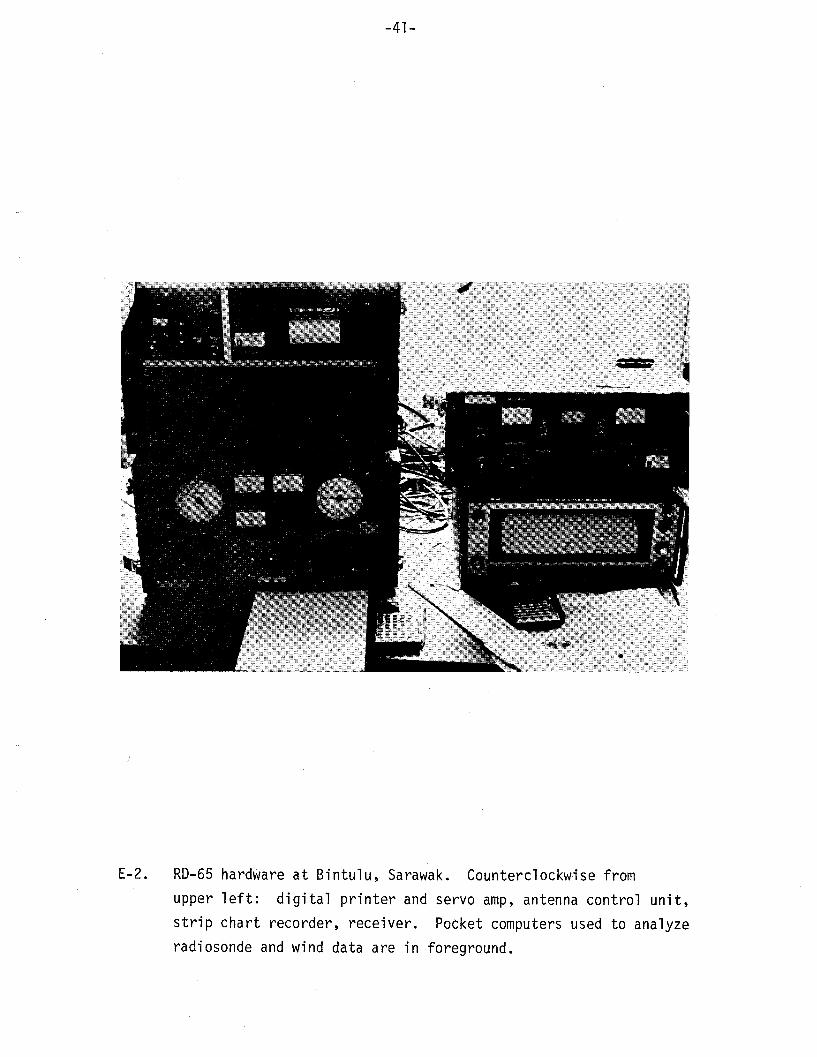
E-2. RD-65 hardware at Bintulu, Sarawak. Counterclockwise from
upper left: digital printer and servo amp, antenna control unit,
strip chart recorder, receiver. Pocket computers used to analyze
radiosonde and wind data are in foreground.
-42-
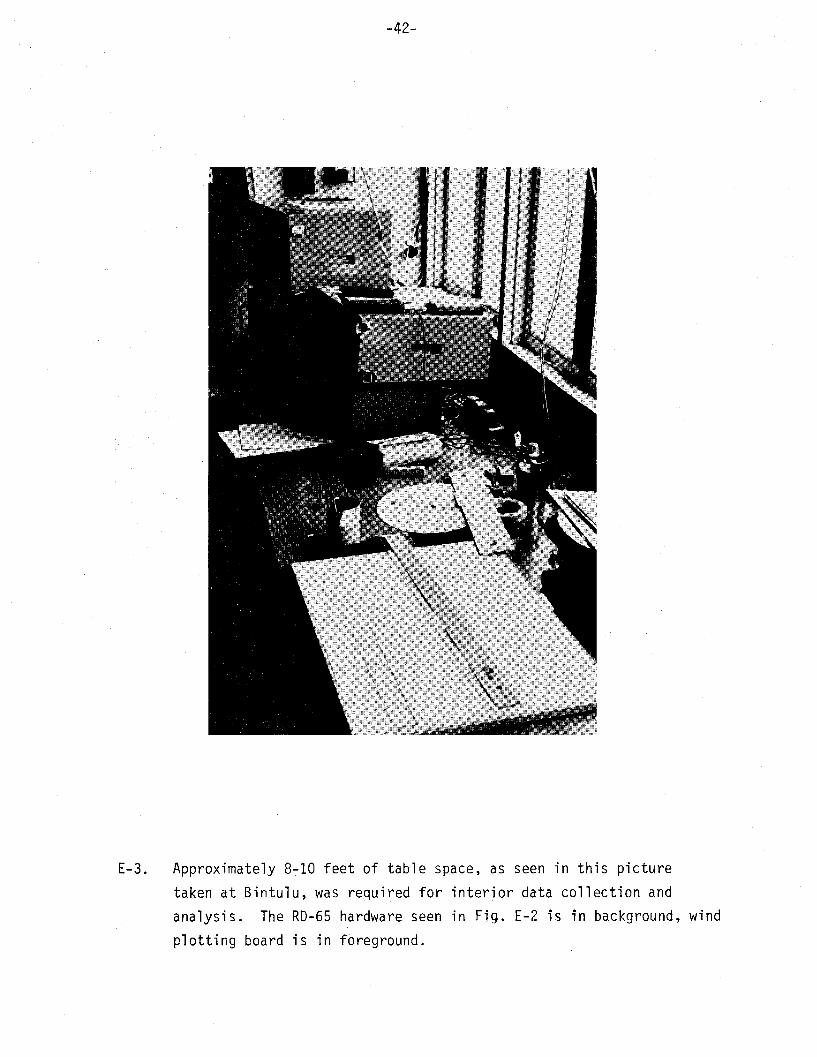
E-3. Approximately 8-10 feet of table space, as seen in this picture
taken at Bintulu, was required for interior data collection and
analysis. The RD-65 hardware seen in Fig. E-2 is in background, wind
plotting board is in foreground.
-43-
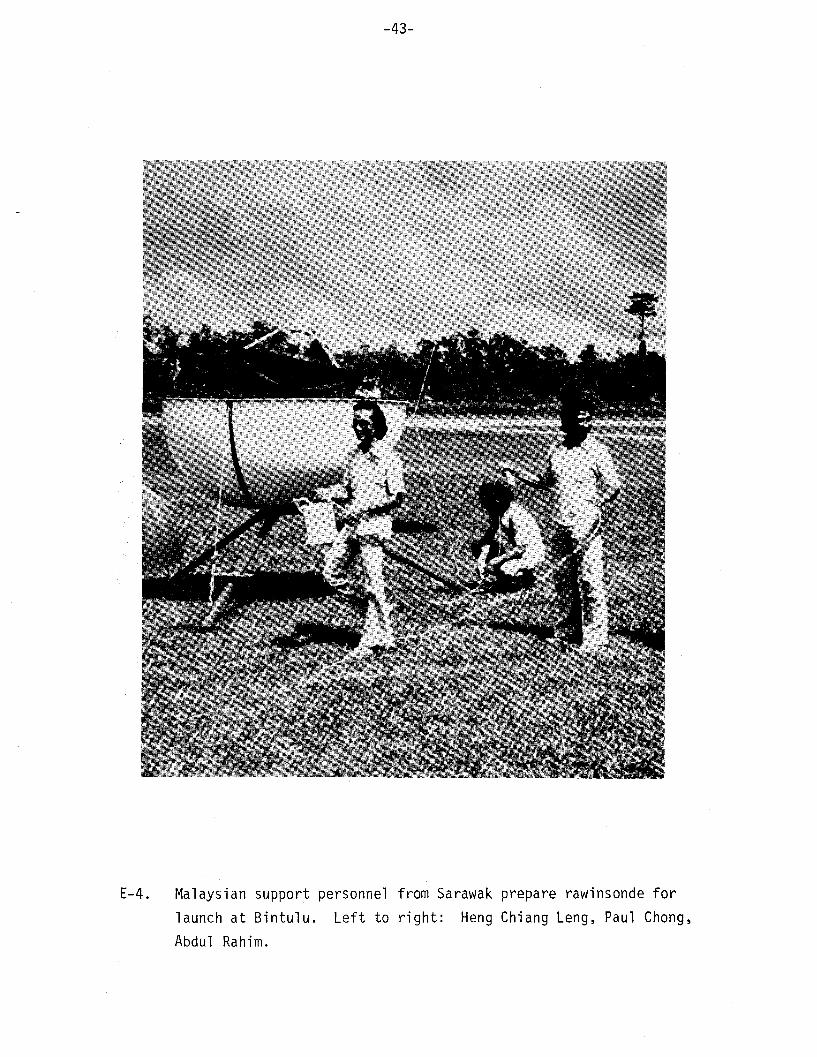
E-4. Malaysian support personnel from Sarawak prepare rawinsonde for
launch at Bintulu. Left to right: Heng Chiang Leng, Paul Chong,
Abdul Rahim.
-44-
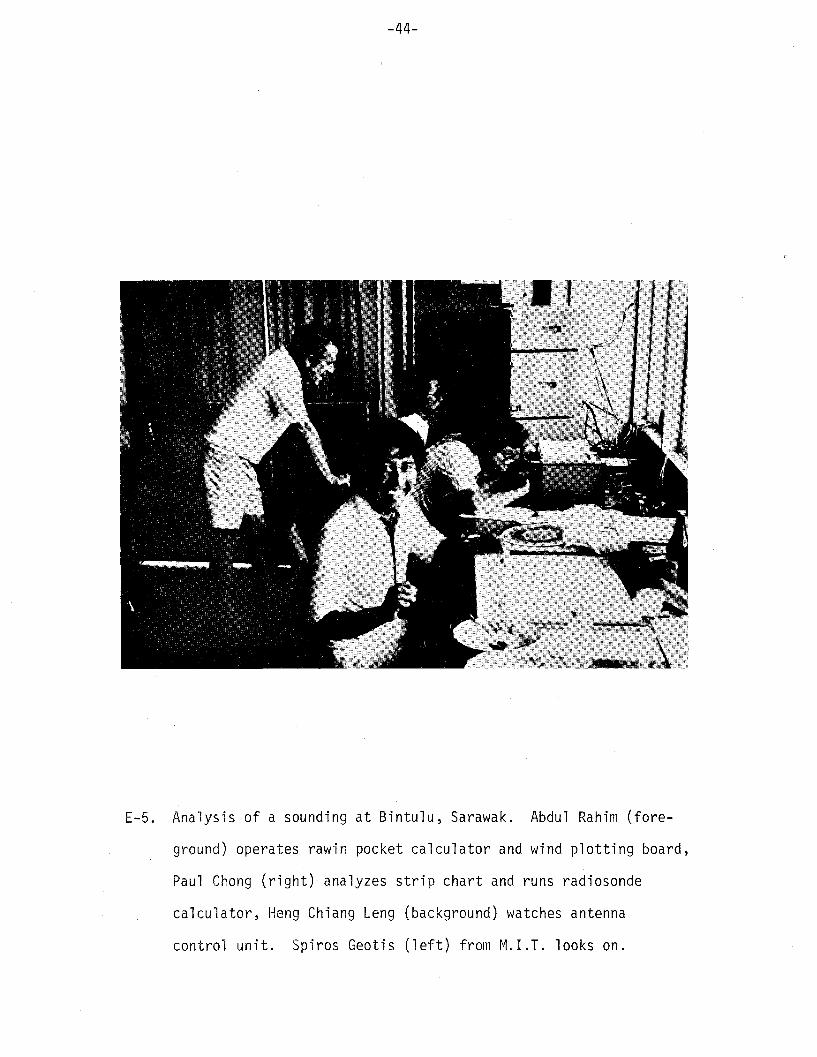
E-5. Analysis of a sounding at Bintulu, Sarawak. Abdul Rahim (fore-
ground) operates rawin pocket calculator and wind plotting board,
Paul Chong (right) analyzes strip chart and runs radiosonde
calculator, Heng Chiang Leng (background) watches antenna
control unit. Spiros Geotis (left) from M.I.T. looks on.
-45-
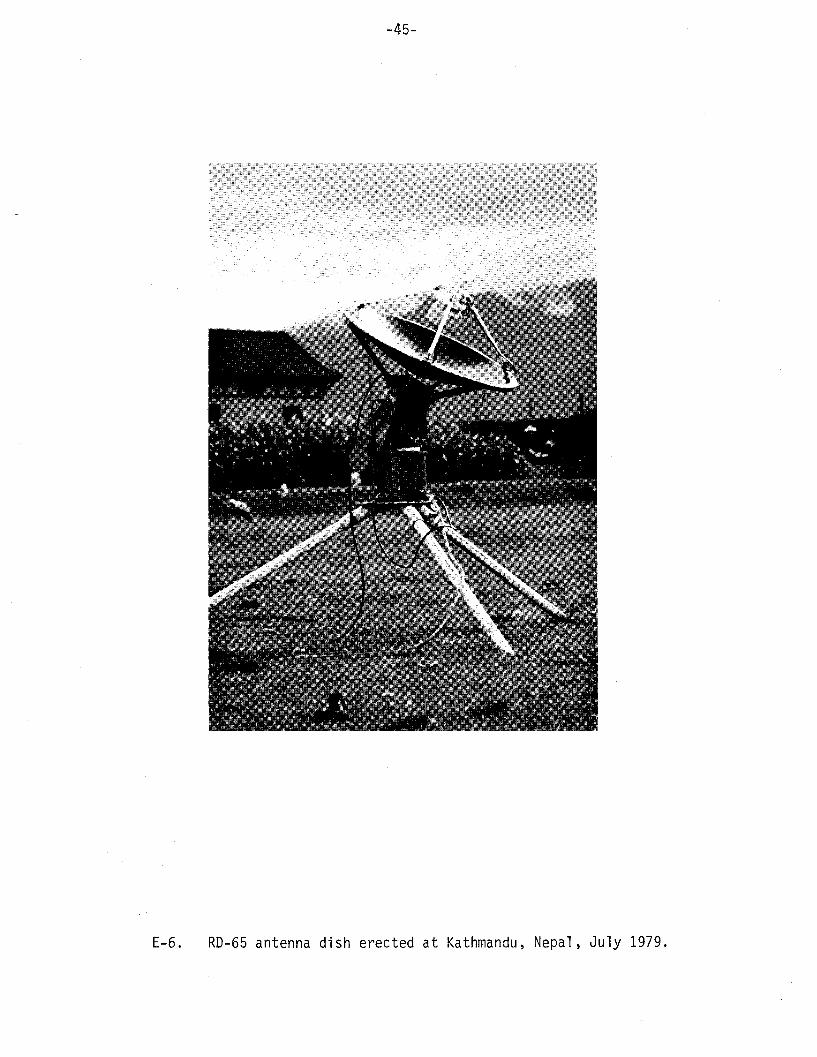
E-6. RD-65 antenna dish erected at Kathmandu, Nepal, July 1979.
-46-
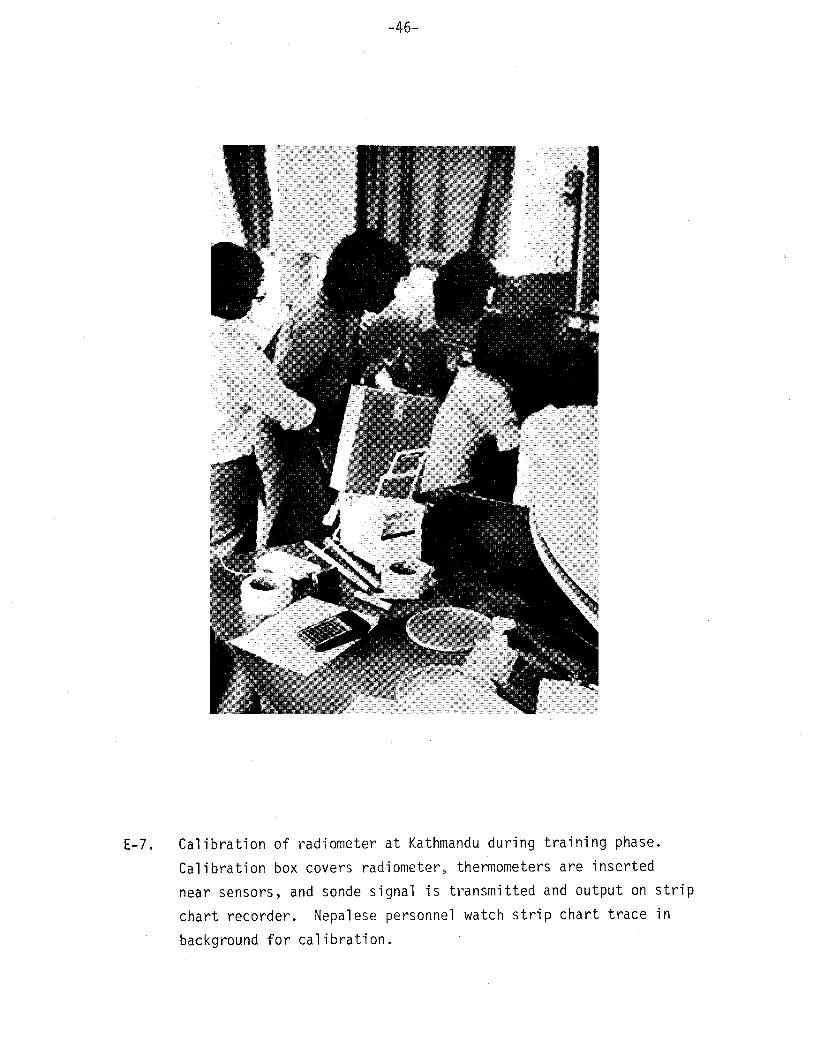
E-7. Calibration of radiometer at Kathmandu during training phase.
Calibration box covers radiometer, thermometers are inserted
near sensors, and sonde signal is transmitted and output on strip
chart recorder. Nepalese personnel watch strip chart trace in
. background for calibration.
-47-
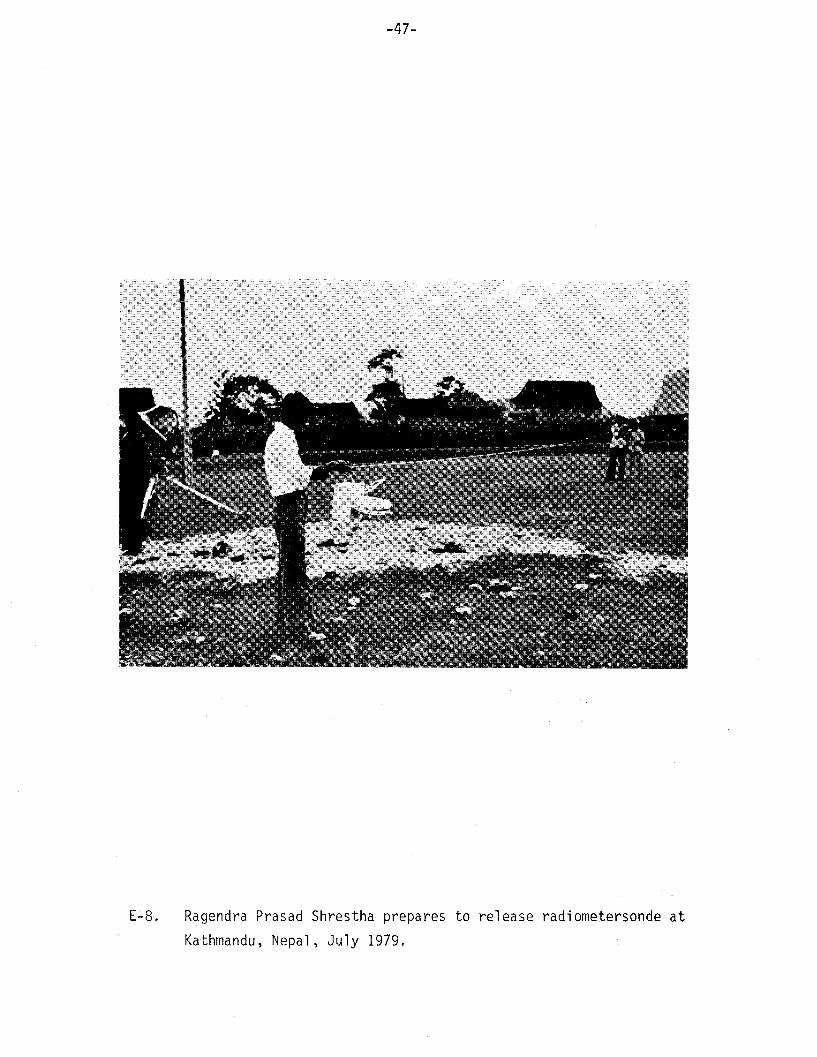
E-8. Ragendra Prasad Shrestha prepares to release radiometersonde at
Kathmandu, Nepal, July 1979.
-48-
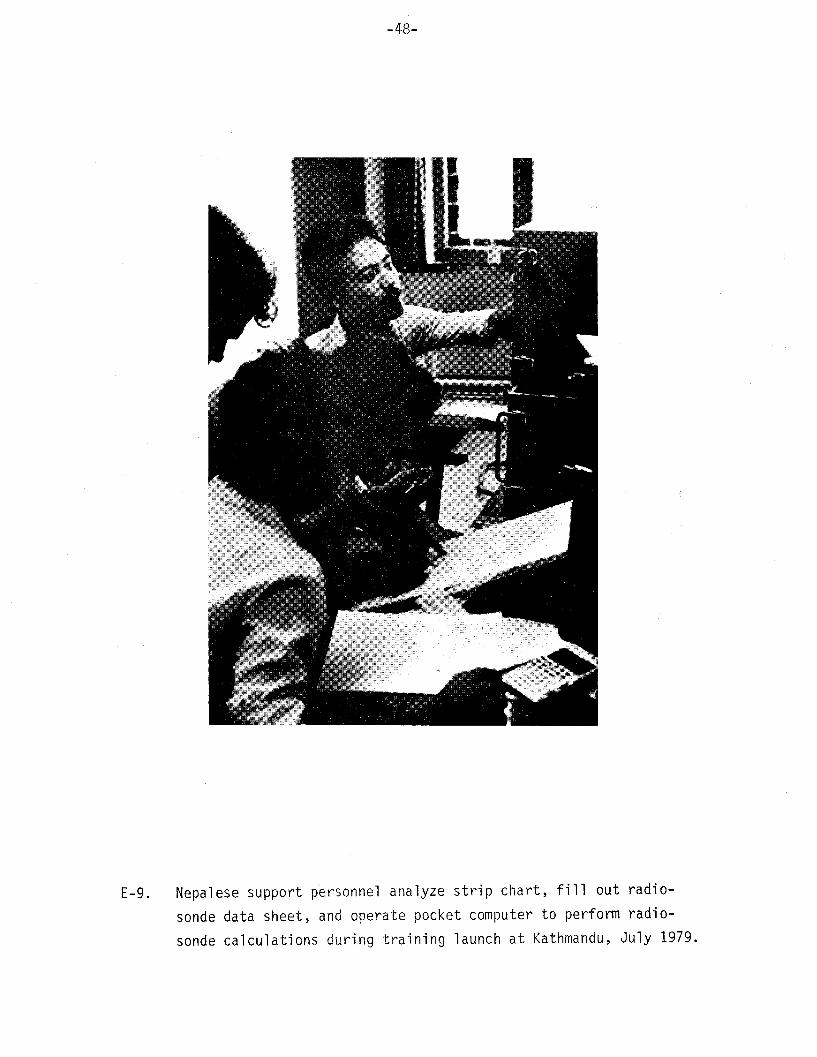
E-9. Nepalese support personnel analyze strip chart, fill out radio-
sonde data sheet, and operate pocket computer to perform radio-
sonde calculations during training launch at Kathmandu, July 1979.
-49-
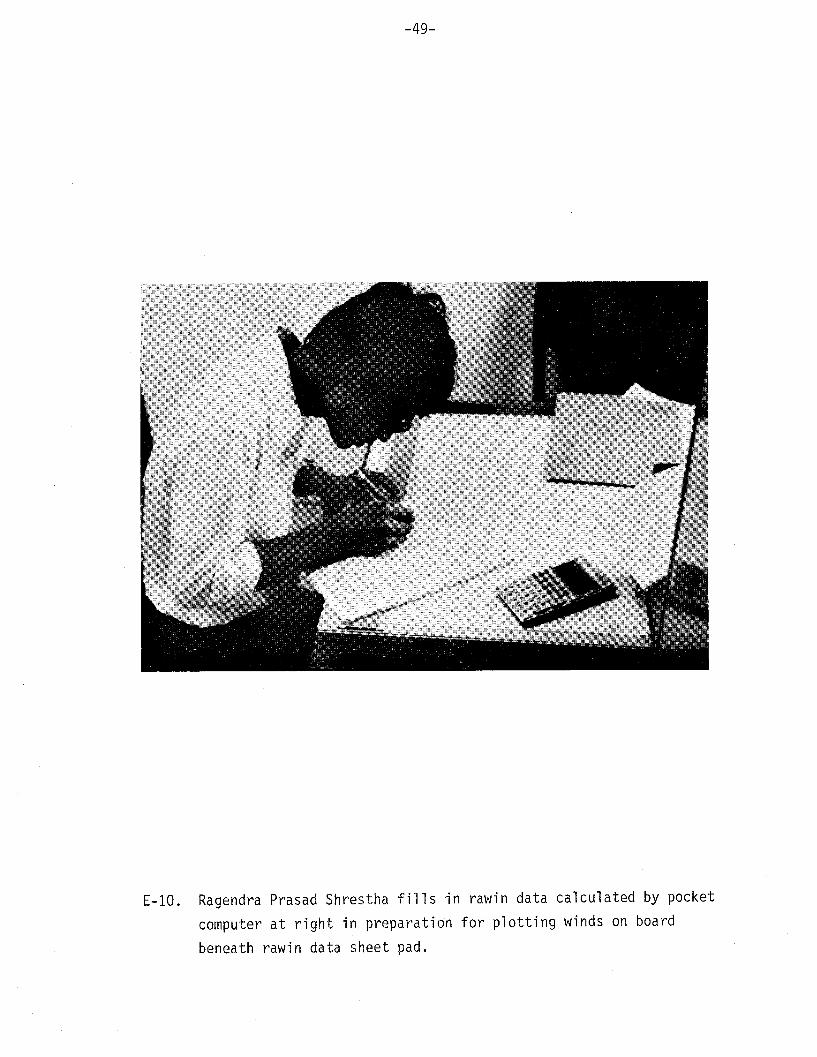
E-10. Ragendra Prasad Shrestha fills in rawin data calculated by pocket
computer at right in preparation for plotting winds on board
beneath rawin data sheet pad.

-51-
References
Bushnell, R.H., and V.E. Suomi, 1961: Experimental flight verificationof the economical net radiometer. J. Geophys. Res., 66, 2843-2848.
Kuhn, P.M., and D.R. Johnson, 1966: Improved radiometersonde observationsof atmospheric infrared irradiance. J. Geophys. Res., 71, 367-373.
Suomi, V.E., and P.M. Kuhn, 1958: An economical net radiometer. Tellus,10, 160-163.
Tanner, C.B., J.A. Businger, and P.M. Kuhn, 1960: The economical netradiometer. J. Geophys. Res., 65, 3657-3667.