Embed Size (px)
Citation preview
37 November 2013
U.S. Multinational Companies Operations of U.S. Parents and Foreign Affiliates in 2011 By Kevin B. Barefoot
THE BUREAU of Economic Analysis (BEA) has just released preliminary results from the 2011 Annual
Survey of U.S. Direct Investment Abroad. The statistics collected on this survey cover the worldwide operations of U.S. multinational companies (MNCs). The survey collects data on the finance and operations of U.S. MNCs, including balance sheet and income statement details, employment and employee compensation, sales, capital expenditures, trade in goods, and expenditures for research and development (see the box “Data Availability”). Unlike previous years, BEA
Data Availability Detailed preliminary statistics from the 2011 Annual Survey of U.S. Direct Investment Abroad have been posted in electronic files that can be downloaded free of charge from BEA’s Web site at www.bea.gov. Revised statistics will be released in 2014. Detailed statistics on U.S. MNC operations for 1983–2010 are also available on BEA’s Web site.
More information about these products and how to access them is available at www.bea.gov/international/ di1usdop.htm.
will not publish an article that analyzes these statistics (see the box “Impact of Sequestration on Analytical Articles”), but some major results are noted below.
The worldwide operations of a U.S. MNC can be split between its domestic operations, represented by the U.S. parent company, and its foreign operations, represented by foreign affiliates. Data for foreign affiliates are presented for two categories—all affiliates and majority-owned foreign affiliates (MOFAs), which are those that are owned more than 50 percent by their U.S. parents. Most foreign affiliates are in fact majority-owned; MOFAs accounted for 86.1 percent of employment by all foreign affiliates in 2011. Data are available in greater detail for MOFAs because some data items are collected only for MOFAs. A focus on MOFAs puts the statistics on foreign affiliates on the same basis as the statistics on U.S. parents, which are defined to include all domestic operations that are majority-owned. For the remainder of this report, U.S. MNCs refers to the combined operations of U.S. parent companies and their MOFAs.
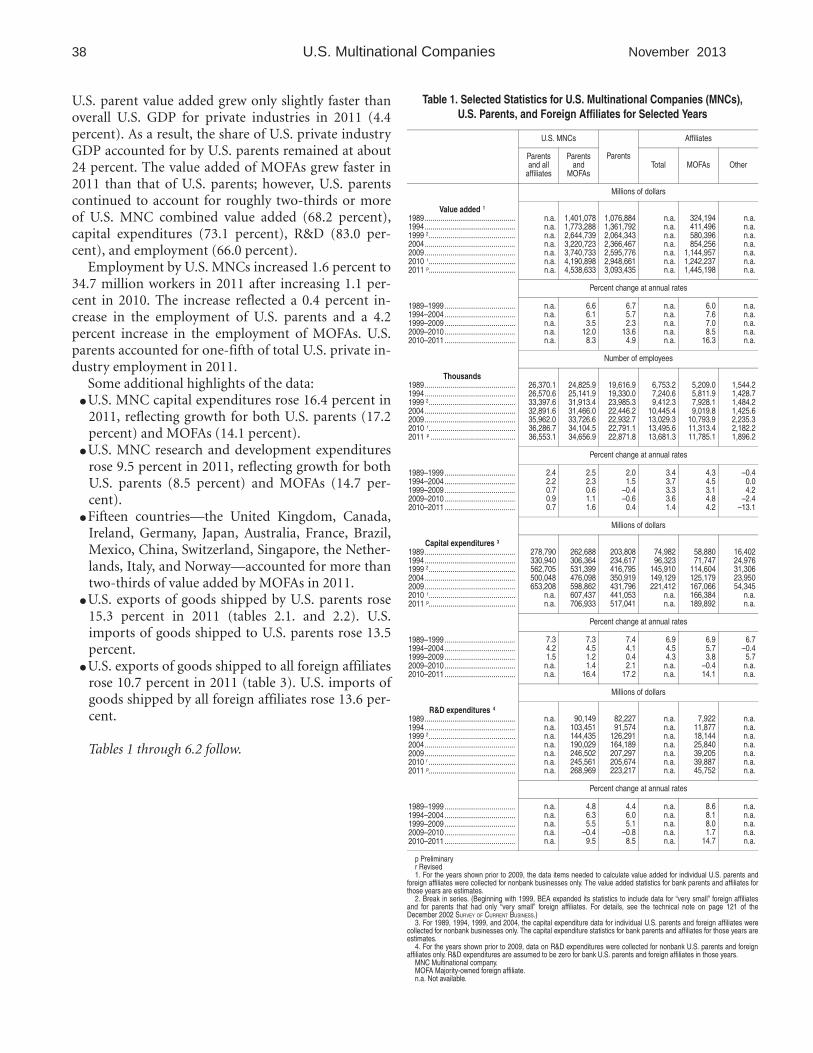
The value added of U.S. MNCs rose 8.3 percent to $4,538.6 billion in 2011 after rising 12.0 percent in 2010 (table 1). The increase reflected a 4.9 percent increase in the value added of U.S. parents and a 16.3 percent increase in the value added of their MOFAs.
Impact of Sequestration on Analytical Articles The automatic federal government spending cuts that nies is unaffected by sequestration reductions. The went into effect in January 2013—known as the se- BEA Web site presents the full set of 2011 statistics on questration—necessitated that the Bureau of Economic the finance and operations of U.S. multinational compa-Analysis (BEA) eliminate analytical activities related to nies. foreign direct investment and the operations of multina- BEA understands that all of its analytical products and tional companies. This includes elimination of the statistical programs are of high value to public and pridetailed analytical SURVEY OF CURRENT BUSINESS article that vate sector decisionmakers. Very careful consideration has historically accompanied the release of statistics from was given to program reductions in an effort to minimize BEA’s Annual Survey of U.S. Direct Investment Abroad. the impact on data users. For more information, see The collection of data on direct investment flows and “BEA FY 2013 Budget Impacts” at www.bea.gov under on the finance and operations of multinational compa- “Media,” “News Releases,” and “What’s New.”
38 U.S. Multinational Companies November 2013
U.S. parent value added grew only slightly faster than overall U.S. GDP for private industries in 2011 (4.4 percent). As a result, the share of U.S. private industry GDP accounted for by U.S. parents remained at about 24 percent. The value added of MOFAs grew faster in 2011 than that of U.S. parents; however, U.S. parents continued to account for roughly two-thirds or more of U.S. MNC combined value added (68.2 percent), capital expenditures (73.1 percent), R&D (83.0 percent), and employment (66.0 percent).
Employment by U.S. MNCs increased 1.6 percent to 34.7 million workers in 2011 after increasing 1.1 percent in 2010. The increase reflected a 0.4 percent increase in the employment of U.S. parents and a 4.2 percent increase in the employment of MOFAs. U.S. parents accounted for one-fifth of total U.S. private industry employment in 2011.
Some additional highlights of the data: ● U.S. MNC capital expenditures rose 16.4 percent in
2011, reflecting growth for both U.S. parents (17.2 percent) and MOFAs (14.1 percent).
● U.S. MNC research and development expenditures rose 9.5 percent in 2011, reflecting growth for both U.S. parents (8.5 percent) and MOFAs (14.7 percent).
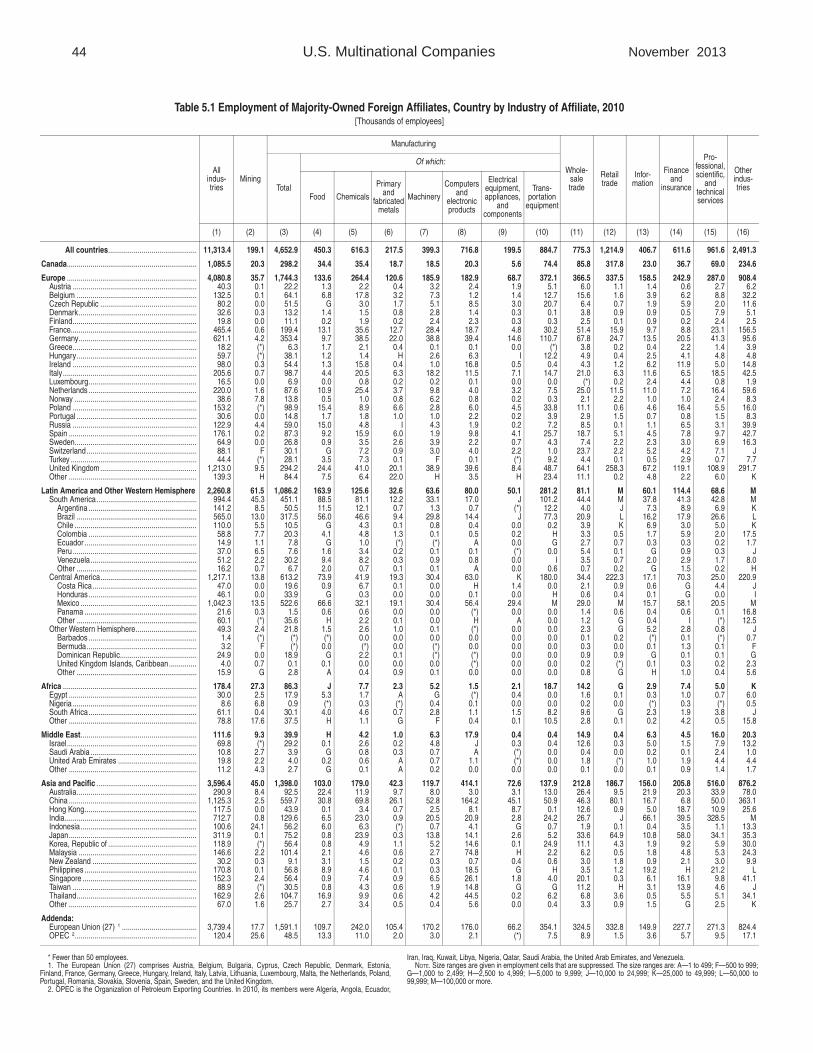
● Fifteen countries—the United Kingdom, Canada, Ireland, Germany, Japan, Australia, France, Brazil, Mexico, China, Switzerland, Singapore, the Netherlands, Italy, and Norway—accounted for more than two-thirds of value added by MOFAs in 2011.
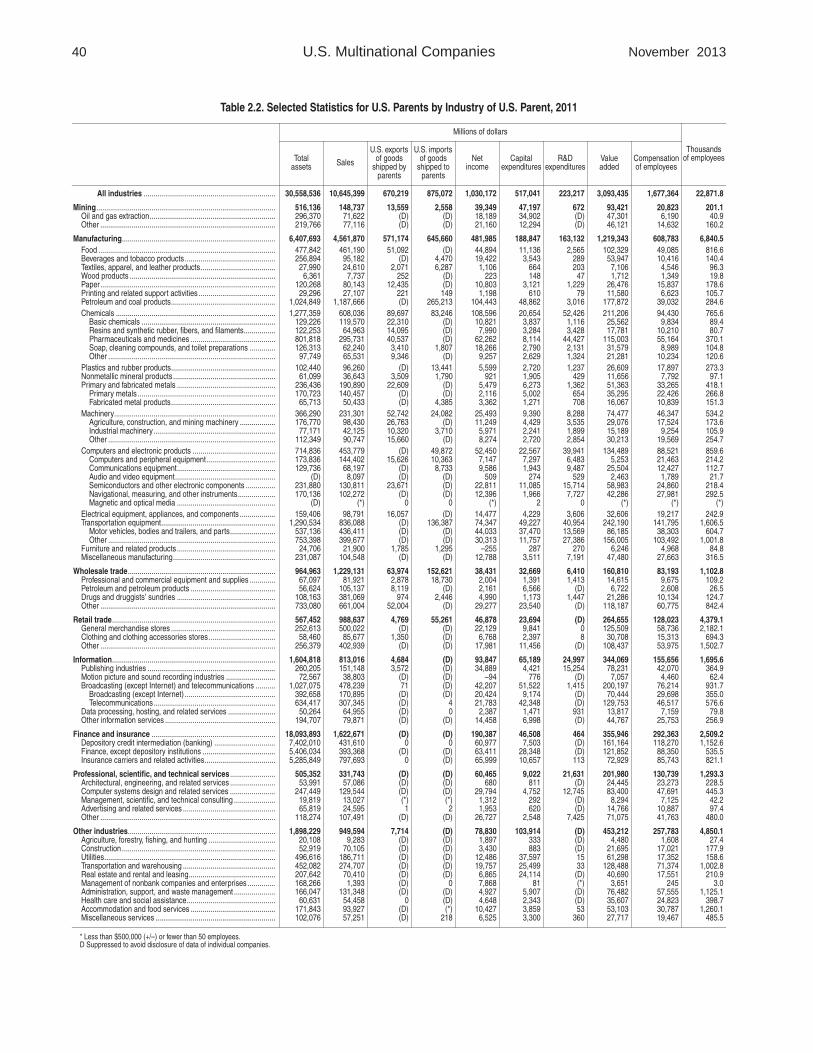
● U.S. exports of goods shipped by U.S. parents rose 15.3 percent in 2011 (tables 2.1. and 2.2). U.S. imports of goods shipped to U.S. parents rose 13.5 percent.
● U.S. exports of goods shipped to all foreign affiliates rose 10.7 percent in 2011 (table 3). U.S. imports of goods shipped by all foreign affiliates rose 13.6 percent.
Tables 1 through 6.2 follow.
Table 1. Selected Statistics for U.S. Multinational Companies (MNCs), U.S. Parents, and Foreign Affiliates for Selected Years
U.S. MNCs
Parents
Affiliates
Parents and all
affiliates
Parents and
MOFAs Total MOFAs Other
Value added 1
1989 .............................................. 1994 .............................................. 1999 2............................................ 2004 .............................................. 2009 .............................................. 2010 r............................................ 2011 p............................................
1989–1999 .................................... 1994–2004 .................................... 1999–2009 .................................... 2009–2010 .................................... 2010–2011 ....................................
Thousands 1989 .............................................. 1994 .............................................. 1999 2............................................ 2004 .............................................. 2009 .............................................. 2010 r............................................ 2011 p ...........................................
1989–1999 .................................... 1994–2004 .................................... 1999–2009 .................................... 2009–2010 .................................... 2010–2011 ....................................
Capital expenditures 3
1989 .............................................. 1994 .............................................. 1999 2............................................ 2004 .............................................. 2009 .............................................. 2010 r............................................ 2011 p............................................
1989–1999 .................................... 1994–2004 .................................... 1999–2009 .................................... 2009–2010 .................................... 2010–2011 ....................................
R&D expenditures 4
1989 .............................................. 1994 .............................................. 1999 2............................................ 2004 .............................................. 2009 .............................................. 2010 r ............................................ 2011 p............................................
1989–1999 .................................... 1994–2004 .................................... 1999–2009 .................................... 2009–2010 .................................... 2010–2011 ....................................
Millions of dollars
n.a. n.a. n.a. n.a. n.a. n.a. n.a.
1,401,078 1,773,288 2,644,739 3,220,723 3,740,733 4,190,898 4,538,633
1,076,884 1,361,792 2,064,343 2,366,467 2,595,776 2,948,661 3,093,435
n.a. n.a. n.a. n.a. n.a. n.a. n.a.
324,194 411,496 580,396 854,256
1,144,957 1,242,237 1,445,198
n.a. n.a. n.a. n.a. n.a. n.a. n.a.
Percent change at annual rates
n.a. n.a. n.a. n.a. n.a.
6.6 6.1 3.5
12.0 8.3
6.7 5.7 2.3
13.6 4.9
n.a. n.a. n.a. n.a. n.a.
6.0 7.6 7.0 8.5
16.3
n.a. n.a. n.a. n.a. n.a.
Number of employees
26,370.1 26,570.6 33,397.6 32,891.6 35,962.0 36,286.7 36,553.1
24,825.9 25,141.9 31,913.4 31,466.0 33,726.6 34,104.5 34,656.9
19,616.9 19,330.0 23,985.3 22,446.2 22,932.7 22,791.1 22,871.8
6,753.2 7,240.6 9,412.3
10,445.4 13,029.3 13,495.6 13,681.3
5,209.0 5,811.9 7,928.1 9,019.8
10,793.9 11,313.4 11,785.1
1,544.2 1,428.7 1,484.2 1,425.6 2,235.3 2,182.2 1,896.2
Percent change at annual rates
2.4 2.2 0.7 0.9 0.7
2.5 2.3 0.6 1.1 1.6
2.0 1.5
–0.4 –0.6 0.4
3.4 3.7 3.3 3.6 1.4
4.3 4.5 3.1 4.8 4.2
–0.4 0.0 4.2
–2.4 –13.1
Millions of dollars
278,790 330,940 562,705 500,048 653,208
n.a. n.a.
262,688 306,364 531,399 476,098 598,862 607,437 706,933
203,808 234,617 416,795 350,919 431,796 441,053 517,041
74,982 96,323
145,910 149,129 221,412
n.a. n.a.
58,880 71,747
114,604 125,179 167,066 166,384 189,892
16,402 24,976 31,306 23,950 54,345
n.a. n.a.
Percent change at annual rates
7.3 4.2 1.5
n.a. n.a.
7.3 4.5 1.2 1.4
16.4
7.4 4.1 0.4 2.1
17.2
6.9 4.5 4.3 n.a. n.a.
6.9 5.7 3.8
–0.4 14.1
6.7 –0.4 5.7 n.a. n.a.
Millions of dollars
n.a. n.a. n.a. n.a. n.a. n.a. n.a.
90,149 103,451 144,435 190,029 246,502 245,561 268,969
82,227 91,574
126,291 164,189 207,297 205,674 223,217
n.a. n.a. n.a. n.a. n.a. n.a. n.a.
7,922 11,877 18,144 25,840 39,205 39,887 45,752
n.a. n.a. n.a. n.a. n.a. n.a. n.a.
Percent change at annual rates
n.a. n.a. n.a. n.a. n.a.
4.8 6.3 5.5
–0.4 9.5
4.4 6.0 5.1
–0.8 8.5
n.a. n.a. n.a. n.a. n.a.
8.6 8.1 8.0 1.7
14.7
n.a. n.a. n.a. n.a. n.a.
p Preliminary r Revised 1. For the years shown prior to 2009, the data items needed to calculate value added for individual U.S. parents and
foreign affiliates were collected for nonbank businesses only. The value added statistics for bank parents and affiliates for those years are estimates.
2. Break in series. (Beginning with 1999, BEA expanded its statistics to include data for “very small” foreign affiliates and for parents that had only “very small” foreign affiliates. For details, see the technical note on page 121 of the December 2002 SUR VEY OF CURRENT BUSINESS.)
3. For 1989, 1994, 1999, and 2004, the capital expenditure data for individual U.S. parents and foreign affiliates were collected for nonbank businesses only. The capital expenditure statistics for bank parents and affiliates for those years are estimates.
4. For the years shown prior to 2009, data on R&D expenditures were collected for nonbank U.S. parents and foreign affiliates only. R&D expenditures are assumed to be zero for bank U.S. parents and foreign affiliates in those years.
MNC Multinational company. MOFA Majority-owned foreign affiliate. n.a. Not available.

39 November 2013 SURVEY OF CURRENT BUSINESS
Table 2.1. Selected Statistics for U.S. Parents by Industry of U.S. Parent, 2010
Millions of dollars
Thousands of employees Total
assets Sales
U.S. exports of goods
shipped by parents
U.S. impor ts of goods
shipped to parents
Net income
Capital expenditures
R&D expenditures
Value added
Compensation of employees
All industries ................................................................... 29,546,451 9,774,337 581,318 770,789 909,686 441,053 205,674 2,948,661 1,618,713 22,791.1
Mining........................................................................................... 466,085 125,238 13,016 2,672 34,582 35,118 556 74,862 19,210 194.9 Oil and gas extraction................................................................ 276,898 59,512 (D) (D) 17,838 26,282 (D) 40,750 4,915 37.2 Other ......................................................................................... 189,187 65,727 (D) (D) 16,744 8,836 (D) 34,112 14,295 157.7
Manufacturing ............................................................................. 6,140,083 4,035,643 494,703 551,663 411,044 158,250 152,855 1,147,233 596,953 6,893.0 Food .......................................................................................... 441,296 420,109 42,046 15,104 35,536 11,762 2,196 95,948 45,700 830.8 Beverages and tobacco products .............................................. 233,389 85,543 (D) (D) 21,501 3,030 313 49,311 10,258 136.2 Textiles, apparel, and leather products...................................... 27,143 23,454 1,951 5,560 961 428 216 7,336 4,655 94.5 Wood products .......................................................................... 11,422 11,327 495 673 154 215 87 2,658 2,040 36.1 Paper......................................................................................... 132,239 89,518 12,953 (D) 13,328 2,479 1,150 31,756 18,278 213.6 Printing and related support activities ....................................... 28,369 24,959 227 135 1,501 553 74 11,203 6,513 106.4 Petroleum and coal products..................................................... 937,745 925,014 (D) 209,901 62,723 43,686 3,249 135,324 37,897 295.3 Chemicals ................................................................................. 1,236,544 566,575 83,981 76,297 104,218 17,497 49,878 197,377 94,389 795.5
Basic chemicals .................................................................... 131,333 104,492 (D) 14,943 16,758 3,395 1,014 21,227 10,321 98.6 Resins and synthetic rubber, fibers, and filaments................ 117,701 53,784 13,252 (D) 6,872 2,196 3,233 15,325 8,166 75.6 Pharmaceuticals and medicines ........................................... 776,541 284,857 (D) (D) 56,755 7,391 41,614 112,934 55,576 385.2 Soap, cleaning compounds, and toilet preparations ............. 114,455 59,406 (D) 1,562 18,159 2,512 1,936 28,715 9,041 108.6 Other ..................................................................................... 96,513 64,036 9,996 (D) 5,675 2,003 2,081 19,175 11,285 127.6
Plastics and rubber products..................................................... 104,425 91,899 (D) (D) 4,496 2,526 1,249 27,833 17,533 276.6 Nonmetallic mineral products .................................................... 57,368 33,206 3,006 1,424 1,069 1,747 383 10,536 7,227 94.4 Primary and fabricated metals .................................................. 219,629 168,303 18,611 11,035 5,542 6,285 1,224 46,985 30,760 389.5
Primary metals ...................................................................... 144,207 115,953 (D) (D) 2,258 5,142 482 30,223 19,708 228.4 Fabricated metal products..................................................... 75,422 52,350 (D) (D) 3,284 1,144 743 16,762 11,052 161.2
Machinery ................................................................................. 350,298 212,914 45,553 19,508 18,090 6,349 7,771 68,815 44,984 536.5 Agriculture, construction, and mining machinery .................. 157,523 85,970 20,954 (D) 8,278 2,890 2,912 22,795 14,452 151.1 Industrial machinery.............................................................. 77,335 39,271 10,157 2,410 4,564 1,181 1,996 14,939 8,450 109.9 Other ..................................................................................... 115,439 87,674 14,442 (D) 5,248 2,278 2,863 31,081 22,082 275.5
Computers and electronic products .......................................... 680,427 402,974 (D) 48,548 71,024 15,019 34,535 154,956 85,148 835.3 Computers and peripheral equipment................................... 169,344 123,592 13,296 14,466 27,717 4,869 4,918 37,527 19,242 202.5 Communications equipment.................................................. 129,111 58,944 (D) 5,996 9,743 1,442 8,059 27,566 13,488 103.9 Audio and video equipment................................................... (D) 7,070 (D) (D) 370 189 682 1,912 1,670 21.0 Semiconductors and other electronic components ............... 222,893 119,889 25,687 (D) 23,807 6,832 13,648 50,872 24,531 219.2 Navigational, measuring, and other instruments................... 150,128 93,479 (D) (D) 9,388 1,685 7,228 37,079 26,217 288.7 Magnetic and optical media .................................................. (D) (*) 0 0 (*) 2 0 1 (*) (*)
Electrical equipment, appliances, and components .................. 149,851 88,439 13,792 (D) 10,166 2,591 3,059 27,143 18,170 238.0 Transportation equipment.......................................................... 1,293,862 774,007 (D) 122,853 50,028 40,418 40,224 229,299 141,820 1,624.4
Motor vehicles, bodies and trailers, and parts....................... 498,713 378,306 (D) (D) 22,292 30,027 12,387 83,165 37,431 588.8 Other ..................................................................................... 795,149 395,701 (D) (D) 27,736 10,392 27,837 146,134 104,390 1,035.6
Furniture and related products .................................................. 18,243 17,979 1,512 1,000 –801 307 216 5,429 4,529 75.4 Miscellaneous manufacturing.................................................... 217,834 99,422 (D) 11,196 11,507 3,355 7,030 45,325 27,051 314.5
Wholesale trade........................................................................... 940,829 1,121,755 55,425 146,396 32,879 27,502 6,299 142,599 79,005 1,080.6 Professional and commercial equipment and supplies ............. 66,944 76,496 2,647 (D) 1,595 977 1,638 13,041 9,296 109.0 Petroleum and petroleum products ........................................... 49,832 87,558 7,107 (D) 1,064 5,973 (D) 5,179 2,356 25.3 Drugs and druggists’ sundries .................................................. 107,033 360,579 924 2,193 4,585 1,042 1,363 18,854 9,539 120.2 Other ......................................................................................... 717,020 597,122 44,748 (D) 25,635 19,511 (D) 105,524 57,814 826.1
Retail trade................................................................................... 554,331 943,361 4,327 53,105 45,269 19,884 (D) 257,162 123,233 4,313.2 General merchandise stores ..................................................... 243,903 485,604 (D) (D) 21,308 8,494 0 122,004 57,804 2,185.0 Clothing and clothing accessories stores.................................. 57,739 80,536 1,188 (D) 6,883 2,318 (D) 32,107 14,860 680.7 Other ......................................................................................... 252,689 377,221 (D) (D) 17,078 9,073 (D) 103,051 50,569 1,447.5
Information .................................................................................. 1,504,658 741,453 4,019 (D) 97,322 61,537 22,577 333,154 140,022 1,626.4 Publishing industries ................................................................. 243,794 137,112 3,057 (D) 29,285 4,124 14,713 72,406 40,119 352.6 Motion picture and sound recording industries ......................... 70,889 38,785 (D) (D) 713 933 (D) 7,824 4,680 62.1 Broadcasting (except Internet) and telecommunications .......... 978,964 434,456 (D) (D) 51,909 49,289 1,157 203,463 69,728 898.6
Broadcasting (except Internet) .............................................. 251,528 111,240 (D) (D) 11,076 3,720 (D) 41,109 17,862 219.4 Telecommunications.............................................................. 727,436 323,216 (D) 4 40,833 45,569 (D) 162,354 51,866 679.2
Data processing, hosting, and related services ........................ 40,943 62,004 (D) 0 2,142 926 805 12,781 6,501 73.8 Other information services ........................................................ 170,067 69,095 (D) (D) 13,274 6,265 (D) 36,681 18,994 239.4
Finance and insurance ............................................................... 17,645,992 1,591,294 (D) (D) 170,062 37,228 384 356,980 285,274 2,479.2 Depository credit intermediation (banking) ............................... 7,160,942 461,775 0 0 46,647 7,907 (D) 138,957 114,717 1,139.4 Finance, except depository institutions ..................................... 5,278,681 356,820 (D) (D) 65,037 20,394 (D) 133,863 86,842 527.6 Insurance carriers and related activities.................................... 5,206,369 772,700 0 (D) 58,378 8,926 71 84,160 83,714 812.1
Professional, scientific, and technical services ....................... 488,374 310,092 (D) (D) 55,906 8,956 18,056 196,294 124,516 1,250.6 Architectural, engineering, and related services ....................... 43,445 49,506 248 (D) 2,235 828 118 24,380 20,481 206.9 Computer systems design and related services ....................... 239,034 121,073 (D) (D) 25,383 4,690 11,135 79,834 46,334 433.8 Management, scientific, and technical consulting ..................... 26,454 15,665 (*) (*) 1,430 292 (D) 10,295 8,897 54.2 Advertising and related services ............................................... 75,212 22,264 2 2 824 530 (D) 13,471 9,259 85.0 Other ......................................................................................... 104,229 101,584 (D) (D) 26,034 2,617 6,715 68,315 39,545 470.8
Other industries .......................................................................... 1,806,100 905,500 (D) (D) 62,621 92,578 (D) 440,377 250,499 4,953.2 Agriculture, forestry, fishing, and hunting .................................. 3,847 2,786 (D) (D) 150 93 (D) 1,047 631 17.2 Construction .............................................................................. 48,636 72,089 (D) (D) 2,638 851 (D) 24,089 19,462 201.2 Utilities....................................................................................... 463,435 171,558 (D) (D) 9,145 31,595 12 60,705 16,453 150.6 Transportation and warehousing ............................................... 435,623 256,729 (D) (D) 14,191 22,435 55 115,783 68,066 1,010.6 Real estate and rental and leasing............................................ 195,306 65,351 (D) (D) 2,948 22,525 (D) 35,073 15,846 210.8 Management of nonbank companies and enterprises .............. 171,518 911 (D) 0 15,049 184 (*) 11,663 181 2.2 Administration, support, and waste management ..................... 159,863 134,890 (D) (D) 4,313 5,730 988 72,839 55,812 1,150.9 Health care and social assistance............................................. 56,680 56,260 0 (D) 3,854 1,894 (D) 35,082 24,693 441.2 Accommodation and food services ........................................... 167,850 89,275 (D) (D) 8,787 3,114 51 53,632 30,146 1,276.7 Miscellaneous services ............................................................. 103,342 55,650 (D) (D) 1,546 4,155 338 30,464 19,210 491.8
* Less than $500,000 (+/–) or fewer than 50 employees. D Suppressed to avoid disclosure of data of individual companies.
40 U.S. Multinational Companies November 2013
Table 2.2. Selected Statistics for U.S. Parents by Industry of U.S. Parent, 2011
Millions of dollars
Thousands of employees Total
assets Sales
U.S. expor ts of goods
shipped by parents
U.S. impor ts of goods
shipped to parents
Net income
Capital expenditures
R&D expenditures
Value added
Compensation of employees
All industries ................................................................... 30,558,536 10,645,399 670,219 875,072 1,030,172 517,041 223,217 3,093,435 1,677,364 22,871.8
Mining........................................................................................... 516,136 148,737 13,559 2,558 39,349 47,197 672 93,421 20,823 201.1 Oil and gas extraction................................................................ 296,370 71,622 (D) (D) 18,189 34,902 (D) 47,301 6,190 40.9 Other ......................................................................................... 219,766 77,116 (D) (D) 21,160 12,294 (D) 46,121 14,632 160.2
Manufacturing.............................................................................. 6,407,693 4,561,870 571,174 645,660 481,985 188,847 163,132 1,219,343 608,783 6,840.5 Food .......................................................................................... 477,842 461,190 51,092 (D) 44,894 11,136 2,565 102,329 49,085 816.6 Beverages and tobacco products .............................................. 256,894 95,182 (D) 4,470 19,422 3,543 289 53,947 10,416 140.4 Textiles, apparel, and leather products ...................................... 27,990 24,610 2,071 6,287 1,106 664 203 7,106 4,546 96.3 Wood products .......................................................................... 6,361 7,737 252 (D) 223 148 47 1,712 1,349 19.8 Paper ......................................................................................... 120,268 80,143 12,435 (D) 10,803 3,121 1,229 26,476 15,837 178.6 Printing and related support activities ....................................... 29,296 27,107 221 149 1,198 610 79 11,580 6,623 105.7 Petroleum and coal products..................................................... 1,024,849 1,187,666 (D) 265,213 104,443 48,862 3,016 177,872 39,032 284.6 Chemicals ................................................................................. 1,277,359 608,036 89,697 83,246 108,596 20,654 52,426 211,206 94,430 765.6
Basic chemicals .................................................................... 129,226 119,570 22,310 (D) 10,821 3,837 1,116 25,562 9,834 89.4 Resins and synthetic rubber, fibers, and filaments................ 122,253 64,963 14,095 (D) 7,990 3,284 3,428 17,781 10,210 80.7 Pharmaceuticals and medicines ........................................... 801,818 295,731 40,537 (D) 62,262 8,114 44,427 115,003 55,164 370.1 Soap, cleaning compounds, and toilet preparations ............. 126,313 62,240 3,410 1,807 18,266 2,790 2,131 31,579 8,989 104.8 Other ..................................................................................... 97,749 65,531 9,346 (D) 9,257 2,629 1,324 21,281 10,234 120.6
Plastics and rubber products..................................................... 102,440 96,260 (D) 13,441 5,599 2,720 1,237 26,609 17,897 273.3 Nonmetallic mineral products .................................................... 61,099 36,643 3,509 1,790 921 1,905 429 11,656 7,792 97.1 Primary and fabricated metals .................................................. 236,436 190,890 22,609 (D) 5,479 6,273 1,362 51,363 33,265 418.1
Primary metals ...................................................................... 170,723 140,457 (D) (D) 2,116 5,002 654 35,295 22,426 266.8 Fabricated metal products ..................................................... 65,713 50,433 (D) 4,385 3,362 1,271 708 16,067 10,839 151.3
Machinery.................................................................................. 366,290 231,301 52,742 24,082 25,493 9,390 8,288 74,477 46,347 534.2 Agriculture, construction, and mining machinery .................. 176,770 98,430 26,763 (D) 11,249 4,429 3,535 29,076 17,524 173.6 Industrial machinery .............................................................. 77,171 42,125 10,320 3,710 5,971 2,241 1,899 15,189 9,254 105.9 Other ..................................................................................... 112,349 90,747 15,660 (D) 8,274 2,720 2,854 30,213 19,569 254.7
Computers and electronic products .......................................... 714,836 453,779 (D) 49,872 52,450 22,567 39,941 134,489 88,521 859.6 Computers and peripheral equipment ................................... 173,836 144,402 15,626 10,363 7,147 7,297 6,483 5,253 21,463 214.2 Communications equipment.................................................. 129,736 68,197 (D) 8,733 9,586 1,943 9,487 25,504 12,427 112.7 Audio and video equipment................................................... (D) 8,097 (D) (D) 509 274 529 2,463 1,789 21.7 Semiconductors and other electronic components ............... 231,880 130,811 23,671 (D) 22,811 11,085 15,714 58,983 24,860 218.4 Navigational, measuring, and other instruments ................... 170,136 102,272 (D) (D) 12,396 1,966 7,727 42,286 27,981 292.5 Magnetic and optical media .................................................. (D) (*) 0 0 (*) 2 0 (*) (*) (*)
Electrical equipment, appliances, and components .................. 159,406 98,791 16,057 (D) 14,477 4,229 3,606 32,606 19,217 242.9 Transportation equipment.......................................................... 1,290,534 836,088 (D) 136,387 74,347 49,227 40,954 242,190 141,795 1,606.5
Motor vehicles, bodies and trailers, and parts....................... 537,136 436,411 (D) (D) 44,033 37,470 13,569 86,185 38,303 604.7 Other ..................................................................................... 753,398 399,677 (D) (D) 30,313 11,757 27,386 156,005 103,492 1,001.8
Furniture and related products .................................................. 24,706 21,900 1,785 1,295 –255 287 270 6,246 4,968 84.8 Miscellaneous manufacturing .................................................... 231,087 104,548 (D) (D) 12,788 3,511 7,191 47,480 27,663 316.5
Wholesale trade ........................................................................... 964,963 1,229,131 63,974 152,621 38,431 32,669 6,410 160,810 83,193 1,102.8 Professional and commercial equipment and supplies ............. 67,097 81,921 2,878 18,730 2,004 1,391 1,413 14,615 9,675 109.2 Petroleum and petroleum products ........................................... 56,624 105,137 8,119 (D) 2,161 6,566 (D) 6,722 2,608 26.5 Drugs and druggists’ sundries .................................................. 108,163 381,069 974 2,446 4,990 1,173 1,447 21,286 10,134 124.7 Other ......................................................................................... 733,080 661,004 52,004 (D) 29,277 23,540 (D) 118,187 60,775 842.4
Retail trade ................................................................................... 567,452 988,637 4,769 55,261 46,878 23,694 (D) 264,655 128,023 4,379.1 General merchandise stores ..................................................... 252,613 500,022 (D) (D) 22,129 9,841 0 125,509 58,736 2,182.1 Clothing and clothing accessories stores .................................. 58,460 85,677 1,350 (D) 6,768 2,397 8 30,708 15,313 694.3 Other ......................................................................................... 256,379 402,939 (D) (D) 17,981 11,456 (D) 108,437 53,975 1,502.7
Information................................................................................... 1,604,818 813,016 4,684 (D) 93,847 65,189 24,997 344,069 155,656 1,695.6 Publishing industries ................................................................. 260,205 151,148 3,572 (D) 34,889 4,421 15,254 78,231 42,070 364.9 Motion picture and sound recording industries ......................... 72,567 38,803 (D) (D) –94 776 (D) 7,057 4,460 62.4 Broadcasting (except Internet) and telecommunications .......... 1,027,075 478,239 71 (D) 42,207 51,522 1,415 200,197 76,214 931.7
Broadcasting (except Internet) .............................................. 392,658 170,895 (D) (D) 20,424 9,174 (D) 70,444 29,698 355.0 Telecommunications .............................................................. 634,417 307,345 (D) 4 21,783 42,348 (D) 129,753 46,517 576.6
Data processing, hosting, and related services ........................ 50,264 64,955 (D) 0 2,387 1,471 931 13,817 7,159 79.8 Other information services ........................................................ 194,707 79,871 (D) (D) 14,458 6,998 (D) 44,767 25,753 256.9
Finance and insurance ............................................................... 18,093,893 1,622,671 (D) (D) 190,387 46,508 464 355,946 292,363 2,509.2 Depository credit intermediation (banking) ............................... 7,402,010 431,610 0 0 60,977 7,503 (D) 161,164 118,270 1,152.6 Finance, except depository institutions ..................................... 5,406,034 393,368 (D) (D) 63,411 28,348 (D) 121,852 88,350 535.5 Insurance carriers and related activities.................................... 5,285,849 797,693 0 (D) 65,999 10,657 113 72,929 85,743 821.1
Professional, scientific, and technical services ....................... 505,352 331,743 (D) (D) 60,465 9,022 21,631 201,980 130,739 1,293.3 Architectural, engineering, and related services ....................... 53,991 57,086 (D) (D) 680 811 (D) 24,445 23,273 228.5 Computer systems design and related services ....................... 247,449 129,544 (D) (D) 29,794 4,752 12,745 83,400 47,691 445.3 Management, scientific, and technical consulting ..................... 19,819 13,027 (*) (*) 1,312 292 (D) 8,294 7,125 42.2 Adver tising and related services ............................................... 65,819 24,595 1 2 1,953 620 (D) 14,766 10,887 97.4 Other ......................................................................................... 118,274 107,491 (D) (D) 26,727 2,548 7,425 71,075 41,763 480.0
Other industries........................................................................... 1,898,229 949,594 7,714 (D) 78,830 103,914 (D) 453,212 257,783 4,850.1 Agriculture, forestry, fishing, and hunting .................................. 20,108 9,283 (D) (D) 1,897 333 (D) 4,480 1,608 27.4 Construction .............................................................................. 52,919 70,105 (D) (D) 3,430 883 (D) 21,695 17,021 177.9 Utilities....................................................................................... 496,616 186,711 (D) (D) 12,486 37,597 15 61,298 17,352 158.6 Transportation and warehousing ............................................... 452,082 274,707 (D) (D) 19,757 25,499 33 128,488 71,374 1,002.8 Real estate and rental and leasing............................................ 207,642 70,410 (D) (D) 6,865 24,114 (D) 40,690 17,551 210.9 Management of nonbank companies and enterprises .............. 168,266 1,393 (D) 0 7,868 81 (*) 3,651 245 3.0 Administration, support, and waste management ..................... 166,047 131,348 (D) (D) 4,927 5,907 (D) 76,482 57,555 1,125.1 Health care and social assistance............................................. 60,631 54,458 0 (D) 4,648 2,343 (D) 35,607 24,823 398.7 Accommodation and food services ........................................... 171,843 93,927 (D) (*) 10,427 3,859 53 53,103 30,787 1,260.1 Miscellaneous services ............................................................. 102,076 57,251 (D) 218 6,525 3,300 360 27,717 19,467 485.5
* Less than $500,000 (+/–) or fewer than 50 employees. D Suppressed to avoid disclosure of data of individual companies.

41 November 2013 SURVEY OF CURRENT BUSINESS
Table 3. Selected Statistics for Foreign Affiliates by Country of Affiliate, 2010 and 2011
2010 2011
Millions of dollars
Thousands of employees
Millions of dollars
Thousands of employees Total
assets Sales Net income
U.S. exports of
goods shipped to affiliates
U.S. imports of
goods shipped by
affiliates
Compensation of
employees
Total assets Sales Net
income
U.S. expor ts of goods
shipped to affiliates
U.S. imports of
goods shipped by
affiliates
Compensation of
employees
All countries ............................................ 23,264,511 6,066,670 1,145,989 259,437 308,607 559,135 13,495.6 22,906,514 6,951,733 1,223,189 287,221 350,494 598,426 13,681.3
Canada ................................................................. 1,224,161 600,161 79,840 (D) (D) 58,917 1,102.2 1,282,065 688,835 90,882 80,461 (D) 62,716 1,134.0
Europe .................................................................. 12,309,182 2,799,255 629,585 69,377 79,239 288,508 4,598.2 13,247,447 3,161,883 652,797 74,874 86,737 309,595 4,708.4 Austria ............................................................... (D) 20,222 3,739 276 159 3,306 40.9 (D) 21,308 3,039 268 242 3,615 44.1 Belgium ............................................................. (D) 130,775 (D) 5,163 3,424 12,162 143.4 (D) 153,305 (D) 5,707 5,766 13,281 143.3 Czech Republic ................................................. (D) 18,636 1,606 160 (D) (D) L (D) 20,478 1,616 (D) (D) (D) L Denmark............................................................ (D) (D) (D) 335 295 (D) K (D) (D) (D) 358 381 (D) K Finland............................................................... 15,433 10,643 804 141 175 1,514 20.1 16,910 12,050 782 166 248 (D) 21.1 France ............................................................... 399,934 211,677 8,790 (D) (D) 36,611 503.1 391,073 233,829 9,628 (D) (D) 39,694 506.8 Germany............................................................ 890,001 363,995 12,982 8,951 7,276 50,462 668.2 924,674 404,190 20,069 8,005 (D) 54,576 681.0 Greece............................................................... (D) (D) (D) 175 3 (D) L (D) (D) –1,275 172 5 (D) L Hungary............................................................. 52,439 19,039 2,017 142 618 1,679 61.8 46,344 20,164 2,951 226 479 1,792 65.0 Ireland ............................................................... 845,349 271,794 95,671 8,090 28,769 7,290 L 994,931 323,413 (D) 9,311 29,232 7,687 101.2 Italy .................................................................... 187,678 131,316 5,436 1,152 1,565 15,206 238.5 215,586 139,979 6,307 1,180 1,587 16,990 239.2 Luxembourg....................................................... 1,254,607 28,923 95,235 489 322 (D) 17.5 1,510,601 36,157 (D) 569 357 (D) J Netherlands ....................................................... 1,812,144 242,155 159,112 (D) (D) 17,140 232.2 1,916,605 277,169 155,180 (D) (D) 18,391 233.9 Norway .............................................................. (D) 51,486 13,411 193 801 4,139 39.6 116,695 61,495 13,219 1,275 1,434 4,735 42.1 Poland ............................................................... 63,956 40,124 2,733 470 288 4,223 178.9 67,637 45,184 3,316 519 358 4,481 188.2 Portugal ............................................................. (D) 13,935 (D) 91 88 1,464 33.0 (D) 14,007 (D) 53 83 1,559 31.9 Russia ............................................................... 62,231 41,474 5,871 299 56 2,901 129.2 75,456 52,321 6,248 568 149 4,351 157.2 Spain ................................................................. 195,410 100,793 13,801 (D) 919 11,975 198.8 186,474 105,461 10,151 (D) (D) 12,294 193.3 Sweden ............................................................. 121,423 32,332 1,091 439 344 (D) L (D) 37,321 2,877 467 383 (D) L Switzerland ........................................................ 542,275 275,761 55,663 (D) (D) 10,323 102.7 627,339 312,542 56,599 (D) (D) 11,688 M Turkey ................................................................ (D) 40,122 (D) 227 38 3,064 78.9 37,321 36,016 –383 265 (D) 2,654 62.9 United Kingdom ................................................. 4,907,688 658,153 97,392 (D) 12,814 86,654 1,398.6 5,206,639 745,956 92,784 13,334 16,334 90,534 1,451.1 Other ................................................................. 152,327 53,609 17,461 (D) (D) 3,469 149.7 180,135 64,663 24,958 574 (D) 3,728 153.0
Latin America and Other Western Hemisphere 3,947,192 728,550 204,467 52,654 63,122 59,565 2,751.2 3,872,715 828,769 209,821 65,446 72,847 65,430 2,805.3 South America................................................... 567,422 337,836 38,347 10,374 (D) 32,840 1,089.5 602,582 398,774 36,965 13,771 (D) 37,197 1,110.2
Argentina ....................................................... 62,682 44,287 3,922 1,147 (D) 4,220 151.5 61,856 52,859 3,865 1,677 5,229 4,698 146.2 Brazil ............................................................. 293,725 187,351 17,823 (D) 3,061 19,368 594.3 323,186 222,294 14,899 7,519 (D) 22,059 611.4 Chile .............................................................. 79,335 32,645 5,440 897 673 3,083 123.1 79,894 37,203 5,852 1,051 373 3,353 129.2 Colombia ....................................................... (D) 24,004 (D) (D) 574 2,175 72.8 (D) (D) (D) (D) 436 (D) L Ecuador ......................................................... (D) (D) (D) 182 (D) (D) J (D) (D) (D) (D) (D) (D) J Peru ............................................................... (D) 13,722 (D) (D) (D) (D) K (D) 16,027 (D) (D) (D) (D) K Venezuela...................................................... (D) 23,803 (D) 1,107 17 2,146 67.8 (D) 29,106 (D) (D) (D) 2,485 68.2 Other ............................................................. (D) (D) 720 134 (D) (D) J 16,757 8,868 806 267 (D) 442 16.2
Central America................................................. 469,494 265,059 22,519 40,693 50,185 24,180 1,547.6 472,820 295,197 25,132 45,273 54,640 25,613 1,582.9 Costa Rica..................................................... (D) (D) (D) 388 1,605 (D) L (D) (D) (D) (D) 1,584 (D) L Honduras ....................................................... (D) 5,057 (D) 548 (D) 499 55.0 (D) 5,596 (D) 737 (D) 507 54.5 Mexico ........................................................... 378,627 227,473 18,694 38,295 46,938 20,866 1,302.4 378,760 252,111 21,359 42,125 50,751 22,241 1,340.1 Panama ......................................................... (D) 10,907 (D) (D) 0 (D) K (D) 13,612 (D) (D) 1 (D) K Other ............................................................. 14,420 (D) 764 (D) (D) 906 83.2 14,246 (D) 605 (D) (D) 887 81.0
Other Western Hemisphere............................... 2,910,276 125,656 143,601 1,587 (D) 2,544 114.1 2,797,313 134,798 147,724 6,401 (D) 2,620 112.2 Barbados ....................................................... 51,937 10,216 2,881 (D) (D) 54 1.4 57,792 10,477 (D) (D) (D) 51 1.4 Bermuda........................................................ 957,474 50,686 84,573 370 (*) (D) K 995,564 46,129 74,756 798 58 (D) K Dominican Republic ...................................... 8,647 5,960 514 (D) (D) 329 L 8,404 6,638 (D) (D) (D) (D) L United Kingdom Islands, Caribbean .............. 1,289,915 34,346 45,196 180 (D) 262 4.4 1,069,228 41,690 56,375 (D) 94 199 4.5 Other ............................................................. 602,303 24,447 10,436 593 1,627 (D) 29.2 666,325 29,864 (D) (D) 6,073 947 K
Africa .................................................................... 309,296 118,227 34,302 1,888 3,937 7,703 247.5 349,262 139,257 38,087 2,052 3,881 8,680 256.5 Egypt ................................................................. 22,874 14,952 2,797 (D) (D) 784 45.3 26,096 17,327 3,113 (D) 3 918 48.1 Nigeria ............................................................... 65,700 22,912 (D) 25 (D) (D) 9.4 (D) (D) (D) 25 (D) (D) 8.6 South Africa....................................................... 44,875 36,411 3,149 (D) (D) 3,764 97.3 56,370 45,580 3,831 (D) (D) 4,414 102.4 Other ................................................................. 175,848 43,952 (D) 529 2,276 (D) 95.5 (D) (D) (D) (D) 2,349 (D) 97.4
Middle East .......................................................... 220,770 149,858 35,244 (D) (D) 8,252 139.4 244,206 210,911 55,836 1,198 6,157 9,155 138.8 Israel.................................................................. 37,718 18,539 1,902 152 (D) 3,862 77.5 39,563 17,216 1,480 162 (D) 4,223 73.3 Saudi Arabia ...................................................... 32,896 26,593 (D) (D) (D) 1,215 18.5 39,219 39,403 (D) (D) (D) 1,475 19.6 United Arab Emirates ........................................ 24,785 (D) 1,644 (D) 174 (D) 23.2 30,030 61,001 2,085 (D) 83 (D) 24.7 Other ................................................................. 125,371 (D) (D) (D) 1,678 (D) 20.2 135,395 93,292 (D) 13 577 (D) 21.3
Asia and Pacific ................................................... 5,253,910 1,670,620 162,552 59,045 57,330 136,190 4,657.1 3,910,820 1,922,079 175,766 63,190 (D) 142,851 4,638.3 Australia............................................................. 535,391 185,329 18,019 (D) 2,888 24,690 345.7 607,619 216,418 25,336 (D) 3,807 27,731 347.2 China ................................................................. (D) 303,281 39,471 7,423 8,278 25,394 1,637.5 330,429 294,947 27,029 8,385 7,738 18,711 1,445.6 Hong Kong......................................................... 354,937 110,000 15,742 4,039 6,139 7,237 133.1 390,895 126,119 14,983 4,692 6,540 7,679 135.6 India................................................................... 119,267 65,621 4,749 1,055 (D) 11,748 836.8 140,017 79,334 5,103 1,336 (D) 14,050 947.2 Indonesia........................................................... 61,423 34,144 9,486 490 255 2,101 110.3 66,105 38,328 10,466 595 231 2,288 109.1 Japan................................................................. (D) 303,618 10,116 11,834 5,449 35,933 547.4 1,203,929 349,824 16,599 12,796 5,230 39,101 547.3 Korea, Republic of ............................................. 186,845 107,154 7,485 2,615 2,175 6,393 138.1 195,895 130,917 7,717 2,776 3,402 7,226 141.5 Malaysia ............................................................ 66,363 57,286 6,566 2,647 (D) 2,682 151.3 77,581 65,787 6,500 1,867 (D) 2,985 161.5 New Zealand ..................................................... 19,302 13,592 328 163 54 1,394 32.9 23,540 16,539 1,219 178 107 1,713 35.0 Philippines ......................................................... 36,561 21,190 2,115 (D) 485 1,962 178.4 38,902 24,774 2,231 (D) 911 2,256 192.0 Singapore .......................................................... 518,736 (D) 35,621 (D) (D) 9,003 163.7 569,999 (D) 44,638 (D) (D) 10,738 185.8 Taiwan ............................................................... 148,451 46,516 3,849 (D) (D) 2,919 99.6 90,580 40,148 3,090 (D) (D) 2,981 98.2 Thailand............................................................. 107,990 57,996 6,264 (D) (D) 3,057 206.5 112,852 66,971 6,878 (D) (D) 3,339 200.9 Other ................................................................. 49,062 (D) 2,742 167 292 1,678 75.9 62,477 (D) 3,976 192 272 2,052 91.5
Addenda: European Union (27) 1 ...................................... 11,354,864 2,359,141 533,740 (D) (D) 266,948 4,198.3 12,252,720 2,659,035 552,967 (D) (D) 285,053 4,288.5 OPEC 2.............................................................. 351,334 196,517 53,989 2,571 (D) 7,978 160.3 406,333 269,616 77,834 2,801 7,084 8,931 164.1
* Less than $500,000 (+/–). 2. OPEC is the Organization of Petroleum Exporting Countries. In 2010 and 2011, its members were Algeria, Angola, D Suppressed to avoid disclosure of data on individual companies. Ecuador, Iran, Iraq, Kuwait, Libya, Nigeria, Qatar, Saudi Arabia, the United Arab Emirates, and Venezuela. 1. The European Union (27) comprises Austria, Belgium, Bulgaria, Cyprus, Czech Republic, Denmark, Estonia, NOTE. Size ranges are given in employment cells that are suppressed. The size ranges are: A—1 to 499; F—500 to 999;
Finland, France, Germany, Greece, Hungary, Ireland, Italy, Latvia, Lithuania, Luxembourg, Malta, the Netherlands, Poland, G—1,000 to 2,499; H—2,500 to 4,999; I—5,000 to 9,999; J—10,000 to 24,999; K—25,000 to 49,999; L—50,000 to Portugal, Romania, Slovakia, Slovenia, Spain, Sweden, and the United Kingdom. 99,999; M—100,000 or more.

42 U.S. Multinational Companies November 2013
Table 4.1. Selected Statistics for Majority-Owned Foreign Affiliates by Country of Affiliate, 2010
Millions of dollars
Thousands of employees Total
Sales Net Capital R&D
U.S. exports of goods
U.S. impor ts of goods Value Compensation
assets Total Goods supplied
Services supplied Other 1 income expenditures expenditures shipped to
MOFAs shipped by
MOFAs added of employees
All countries............................................. 19,582,476 5,168,635 3,706,043 1,250,252 212,339 1,026,365 166,384 39,887 249,283 298,640 1,242,237 493,629 11,313.4
Canada.................................................................. 1,170,385 575,184 430,725 123,979 20,480 77,847 22,863 2,765 72,638 97,412 130,571 57,434 1,085.5
Europe .................................................................. 11,325,199 2,506,916 1,777,442 644,391 85,082 590,196 56,430 23,902 66,798 78,956 601,005 265,473 4,080.8 Austria ............................................................... 35,340 20,125 15,648 4,356 121 3,753 650 278 276 159 5,748 3,288 40.3 Belgium ............................................................. 346,331 123,228 97,444 20,940 4,845 18,133 1,991 2,031 5,160 3,424 24,741 11,080 132.5 Czech Republic ................................................. 28,740 16,605 12,723 3,496 386 1,248 333 56 158 226 5,514 2,137 80.2 Denmark ............................................................ 56,802 19,075 14,464 4,442 169 7,065 646 199 335 295 8,986 3,051 32.6 Finland............................................................... 14,861 10,344 8,149 2,099 96 784 161 221 141 175 2,786 1,487 19.8 France................................................................ 373,084 197,592 149,136 45,453 3,004 7,297 4,097 2,021 4,815 5,359 50,240 34,211 465.4 Germany............................................................ 645,727 312,184 248,747 57,212 6,225 10,551 7,379 6,717 8,949 7,273 85,451 48,016 621.1 Greece............................................................... 9,832 7,130 5,356 1,525 249 –161 106 27 175 3 3,053 1,128 18.2 Hungary ............................................................. 50,767 18,074 14,431 3,375 268 1,952 450 65 142 618 4,096 1,629 59.7 Ireland ............................................................... 840,882 269,639 182,203 81,795 5,642 95,344 4,908 1,431 8,086 28,769 61,741 7,190 98.0 Italy .................................................................... 155,883 112,160 84,256 26,388 1,516 2,857 2,490 596 1,081 1,510 28,301 13,886 205.6 Luxembourg....................................................... 1,237,307 26,837 11,083 9,919 5,835 95,084 276 (D) 489 322 3,120 1,389 16.5 Netherlands ....................................................... 1,686,369 196,966 140,572 48,484 7,910 149,665 2,876 1,282 9,435 4,040 25,036 16,004 220.0 Norway .............................................................. 111,354 50,755 44,578 5,992 186 13,313 6,236 136 193 801 26,134 4,054 38.6 Poland ............................................................... 59,421 35,429 28,166 6,062 1,202 2,089 1,073 135 470 285 10,532 3,776 153.2 Portugal ............................................................. 33,886 11,476 7,794 3,320 362 3,541 316 56 91 88 4,538 1,360 30.6 Russia ............................................................... 47,818 34,191 (D) (D) 717 4,738 1,483 65 295 56 9,300 2,756 122.9 Spain ................................................................. 172,603 84,004 66,067 15,879 2,057 12,200 1,855 361 1,719 917 17,508 10,648 176.1 Sweden.............................................................. 117,341 30,713 21,979 8,243 491 1,019 452 400 439 344 5,892 4,662 64.9 Switzerland ........................................................ 535,946 268,723 195,605 70,901 2,216 55,339 1,611 1,588 11,163 11,211 33,555 9,749 88.1 Turkey ................................................................ 22,386 21,422 (D) (D) 284 2,756 471 54 217 38 7,876 1,819 44.4 United Kingdom ................................................. 4,596,903 590,095 340,851 208,621 40,623 84,796 12,284 5,788 12,509 12,812 153,330 78,843 1,213.0 Other ................................................................. 145,617 50,148 43,873 5,595 681 16,833 4,284 (D) 461 230 23,528 3,308 139.3
Latin America and Other Western Hemisphere 3,701,991 625,184 436,592 143,815 44,777 190,412 24,365 2,553 50,453 60,366 153,250 50,015 2,260.8 South America ................................................... 467,292 301,676 233,249 57,972 10,455 33,855 15,867 (D) 9,945 10,720 89,428 29,997 994.4
Argentina ....................................................... 58,259 41,703 33,271 7,528 905 3,746 2,922 117 1,145 4,756 16,498 3,936 141.2 Brazil ............................................................. 241,572 171,794 134,302 30,927 6,565 16,812 8,512 1,389 5,559 3,019 44,338 18,068 565.0 Chile .............................................................. 70,837 28,367 18,917 8,501 949 5,010 1,783 21 896 672 9,137 2,615 110.0 Colombia ....................................................... 22,453 20,578 15,776 4,223 580 1,905 1,044 (D) 825 574 6,458 1,876 58.8 Ecuador ......................................................... 4,381 4,114 3,206 849 59 239 55 1 182 (D) 971 301 14.9 Peru ............................................................... 23,963 12,281 (D) (D) 114 2,588 919 8 207 (D) 5,688 926 37.0 Venezuela ...................................................... 28,902 16,041 12,096 (D) (D) 2,834 467 27 996 17 4,958 1,898 51.2 Other ............................................................. 16,926 6,797 (D) 1,270 (D) 721 164 (D) 134 (D) 1,382 376 16.2
Central America................................................. 383,462 214,954 162,447 43,679 8,828 17,088 6,014 365 39,019 47,748 42,107 18,553 1,217.1 Costa Rica ..................................................... 29,109 7,483 (D) 1,507 (D) 944 188 20 387 1,605 1,788 750 47.0 Honduras ....................................................... 2,869 3,665 (D) 364 (D) 135 30 3 548 755 756 402 46.1 Mexico ........................................................... 328,928 187,526 141,658 37,542 8,326 15,399 5,235 337 36,637 44,660 36,610 16,265 1,042.3 Panama ......................................................... 9,909 6,847 (D) (D) 86 –96 243 2 681 0 814 456 21.6 Other ............................................................. 12,646 9,433 6,846 (D) (D) 707 318 2 766 727 2,139 679 60.1
Other Western Hemisphere ............................... 2,851,238 108,555 40,897 42,164 25,494 139,469 2,485 (D) 1,489 1,897 21,715 1,465 49.3 Barbados ....................................................... 49,941 10,186 5,714 2,675 1,797 2,884 (D) (*) (D) (D) 1,758 53 1.4 Bermuda ........................................................ 928,086 41,786 (D) (D) 13,716 81,778 528 (D) 370 (*) 8,070 378 3.2 Dominican Republic....................................... 4,109 4,636 3,102 1,527 6 375 153 2 380 (D) 1,022 228 24.9 United Kingdom Islands, Caribbean .............. 1,275,223 33,917 (D) (D) 8,233 44,864 620 2 180 (D) 5,389 241 4.0 Other ............................................................. 593,878 18,031 7,948 8,340 1,743 9,569 (D) 1 (D) (D) 5,475 565 15.9
Africa .................................................................... 274,958 97,853 84,140 12,612 1,101 31,602 14,507 86 1,782 3,846 55,131 6,060 178.4 Egypt ................................................................. 19,614 12,281 10,689 1,427 165 2,374 1,666 6 (D) (D) 5,551 655 30.0 Nigeria ............................................................... 62,234 21,700 (D) (D) (D) (D) 3,532 3 23 (D) 18,595 608 8.6 South Africa ....................................................... 29,458 23,548 18,389 4,677 482 1,218 699 71 1,009 361 5,803 2,488 61.1 Other ................................................................. 163,652 40,323 (D) (D) (D) (D) 8,610 6 (D) (D) 25,183 2,309 78.8
Middle East........................................................... 122,736 64,126 37,384 25,867 875 12,469 3,171 2,016 613 2,693 23,289 6,297 111.6 Israel .................................................................. 34,913 15,740 (D) 4,095 (D) 1,539 660 2,000 152 (D) 6,934 3,675 69.8 Saudi Arabia ...................................................... 12,524 5,991 3,819 2,126 46 (D) 199 1 (D) (D) 1,253 664 10.8 United Arab Emirates ........................................ 19,151 27,507 10,899 16,349 260 1,338 263 15 339 174 5,861 1,169 19.8 Other ................................................................. 56,148 14,887 (D) 3,298 (D) (D) 2,048 1 (D) (D) 9,242 790 11.2
Asia and Pacific ................................................... 2,987,207 1,299,372 939,761 299,588 60,024 123,839 45,048 8,564 56,999 55,368 278,991 108,349 3,596.4 Australia............................................................. 494,608 151,498 96,164 46,752 8,582 17,481 10,945 982 5,976 2,888 49,165 21,876 290.9 China ................................................................. 209,320 169,828 137,994 30,522 1,312 14,449 7,642 1,535 7,354 7,948 36,984 13,684 1,125.3 Hong Kong......................................................... 270,589 102,815 64,413 35,664 2,737 13,079 1,033 148 4,039 6,139 13,718 6,572 117.5 India................................................................... 88,883 49,301 27,573 19,543 2,186 4,522 2,270 1,716 914 1,033 17,719 10,359 712.7 Indonesia ........................................................... 52,007 25,731 22,534 2,714 482 7,896 2,227 28 490 254 16,563 1,971 100.6 Japan ................................................................. 951,445 246,223 145,523 70,456 30,245 9,425 4,348 1,812 11,482 4,677 47,928 28,021 311.9 Korea, Republic of ............................................. 134,697 55,149 39,901 11,521 3,727 3,355 1,811 824 2,230 1,850 11,169 5,352 118.9 Malaysia ............................................................ 54,837 50,433 42,897 7,226 310 6,163 2,509 348 2,641 7,203 12,417 2,551 146.6 New Zealand ..................................................... 16,225 11,593 8,303 2,764 526 195 252 21 163 54 1,962 1,272 30.2 Philippines ......................................................... 28,460 18,154 13,707 4,269 178 1,895 1,413 54 1,005 484 5,044 1,834 170.8 Singapore .......................................................... 454,118 308,775 261,767 44,104 2,904 33,639 4,677 738 15,779 17,017 27,210 8,334 152.3 Taiwan ............................................................... 141,735 44,270 28,085 9,902 6,283 4,106 1,275 278 2,544 2,185 6,158 2,727 88.9 Thailand............................................................. 48,354 47,659 43,178 4,206 275 5,207 2,365 75 2,216 3,346 13,780 2,315 162.9 Other ................................................................. 41,929 17,942 7,721 9,946 276 2,428 2,281 2 167 292 19,173 1,481 67.0
Addenda: European Union (27) 2 ...................................... 10,499,404 2,101,297 1,464,865 554,958 81,474 498,823 43,007 22,046 54,724 66,759 506,516 245,984 3,739.4 OPEC 3.............................................................. 231,270 104,150 75,234 27,391 1,525 30,318 10,488 49 1,941 4,275 52,086 5,929 120.4
* Less than $500,000 (+/–). included in services supplied). In industries other than finance and insurance, investment income is generally considered D Suppressed to avoid disclosure of data of individual companies. to be an incidental revenue source; this income is included in the income statement in a separate “other income” category, 1. “Other” consists largely of investment income that is included in “sales or gross operating revenues” in the income but is not included in sales or in this column.
statement. In finance and insurance, investment income is included in sales because it is generated by a primary activity of 2. The European Union (27) comprises Austria, Belgium, Bulgaria, Cyprus, Czech Republic, Denmark, Estonia, the company. For insurance, “other” consists of investment income remaining after BEA’s estimate of investment income Finland, France, Germany, Greece, Hungary, Ireland, Italy, Latvia, Lithuania, Luxembourg, Malta, the Netherlands, Poland, earned on funds insurers hold on behalf of policyholders is removed (and included in the services supplied measure) plus Portugal, Romania, Slovakia, Slovenia, Spain, Sweden, and the United Kingdom. the portion of premiums set aside for the settlement of expected or “normal” losses. For banks, “other” consists of the 3. OPEC is the Organization of Petroleum Exporting Countries. In 2010, its members were Algeria, Angola, Ecuador, investment income remaining after BEA’s estimate of the value of implicit services provided by banks is excluded (and Iran, Iraq, Kuwait, Libya, Nigeria, Qatar, Saudi Arabia, the United Arab Emirates, and Venezuela.

43 November 2013 SURVEY OF CURRENT BUSINESS
Table 4.2. Selected Statistics for Majority-Owned Foreign Affiliates by Country of Affiliate, 2011
Millions of dollars
Thousands of employees Total
assets
Sales Net
income Capital
expenditures R&D
expenditures
U.S. exports of goods
shipped to MOFAs
U.S. impor ts of goods
shipped by MOFAs
Value added
Compensation of
employees Total Goods supplied
Services supplied Other 1
All countries ............................................ 20,698,909 5,968,678 4,355,206 1,388,981 224,491 1,115,185 189,892 45,752 276,171 338,795 1,445,198 535,683 11,785.1
Canada ................................................................. 1,218,973 662,010 509,766 133,009 19,235 87,092 26,037 3,399 76,783 116,829 145,380 61,023 1,115.7
Europe .................................................................. 12,175,050 2,847,781 2,052,134 698,500 97,147 621,870 63,582 27,656 72,697 86,440 697,761 283,300 4,191.4 Austria ............................................................... 41,146 21,206 16,353 4,745 108 3,035 659 288 268 242 5,247 3,597 43.5 Belgium ............................................................. 354,471 144,096 117,261 22,436 4,399 11,822 2,275 2,427 5,705 5,766 24,499 12,023 131.9 Czech Republic ................................................. 29,489 18,354 14,401 3,622 331 1,306 392 129 184 242 5,910 2,311 87.3 Denmark ............................................................ 61,247 21,171 16,063 4,786 322 2,807 797 187 358 381 9,883 3,066 32.1 Finland............................................................... 16,598 11,819 9,337 2,329 153 780 280 230 166 248 3,383 1,547 20.8 France ............................................................... 368,520 220,300 166,498 50,173 3,629 9,515 4,825 2,179 5,249 3,941 56,663 37,248 470.0 Germany............................................................ 673,864 352,743 280,697 65,325 6,721 17,456 7,656 7,268 8,003 8,264 94,872 51,109 632.2 Greece............................................................... 10,281 7,218 5,458 1,472 288 –249 107 26 172 5 3,134 1,130 17.9 Hungary............................................................. 44,670 19,217 15,561 3,304 351 2,928 458 77 226 479 5,028 1,695 62.6 Ireland ............................................................... 988,694 320,921 216,656 96,254 8,012 143,871 6,221 1,322 9,307 29,232 96,101 7,362 98.4 Italy .................................................................... 164,557 121,054 91,465 27,582 2,008 5,277 2,471 931 1,112 1,530 32,305 15,143 207.8 Luxembourg....................................................... 1,422,641 33,471 14,515 11,837 7,119 76,108 275 (D) 569 357 3,939 1,209 13.6 Netherlands ....................................................... 1,789,640 228,316 163,377 54,649 10,289 149,058 3,894 1,434 10,043 4,796 34,803 17,192 222.2 Norway .............................................................. 115,589 60,776 54,275 6,320 180 13,050 4,611 146 1,275 1,434 30,519 4,671 41.3 Poland ............................................................... 58,956 40,024 32,287 6,634 1,104 2,618 1,177 197 519 355 12,150 3,935 155.9 Portugal ............................................................. 44,119 11,438 7,703 3,342 393 5,683 251 58 53 83 2,618 1,368 29.7 Russia ............................................................... 61,144 45,756 (D) (D) 892 5,628 1,822 163 565 149 13,019 4,215 150.8 Spain ................................................................. 162,739 89,194 70,073 16,893 2,227 7,460 1,940 375 1,617 1,008 18,183 11,219 175.7 Sweden ............................................................. 120,760 36,116 25,708 9,793 616 2,751 520 487 467 383 7,419 5,451 65.3 Switzerland ........................................................ 620,372 304,431 222,422 79,186 2,823 56,318 1,948 2,285 12,938 10,967 38,804 11,122 91.8 Turkey ................................................................ 19,340 23,153 18,877 3,856 420 –792 388 61 252 (D) 7,830 1,934 44.6 United Kingdom ................................................. 4,835,194 655,521 402,042 209,601 43,878 80,902 16,424 6,883 13,074 16,318 160,869 81,253 1,252.7 Other ................................................................. 171,020 61,486 (D) (D) 882 24,537 4,191 (D) 574 (D) 30,582 3,498 143.5
Latin America and Other Western Hemisphere 3,637,270 716,007 509,764 161,710 44,534 195,835 27,814 2,851 63,003 69,504 169,204 55,349 2,285.1 South America................................................... 501,736 355,589 271,822 70,272 13,495 31,300 18,142 1,748 13,228 11,404 96,918 34,177 1,005.6
Argentina ....................................................... 57,181 49,798 40,247 8,337 1,214 3,583 3,477 136 1,677 5,226 17,986 4,362 135.0 Brazil ............................................................. 267,455 203,611 155,769 39,024 8,818 13,170 9,382 1,492 7,154 3,058 46,699 20,600 568.9 Chile .............................................................. 71,747 32,386 21,640 9,757 989 5,442 2,167 21 1,050 372 10,493 2,979 116.4 Colombia ....................................................... 25,687 23,505 (D) (D) 796 2,231 1,063 32 1,322 435 7,062 2,228 61.8 Ecuador ......................................................... 4,160 4,657 3,712 880 64 231 83 2 98 (D) 958 303 15.6 Peru ............................................................... 25,333 14,182 11,683 2,372 127 2,608 1,258 8 363 (D) 6,091 1,186 39.7 Venezuela...................................................... 33,443 18,598 14,083 (D) (D) 3,229 501 54 1,297 (D) 6,074 2,080 52.0 Other ............................................................. 16,731 8,852 (D) (D) (D) 806 211 3 267 (D) 1,555 439 16.1
Central America................................................. 394,409 241,252 185,633 47,960 7,659 20,379 6,316 (D) 43,477 51,694 51,369 19,745 1,231.1 Costa Rica ..................................................... 29,910 8,363 6,758 (D) (D) 720 260 38 491 1,584 1,762 832 47.0 Honduras ....................................................... 2,671 4,055 (D) 405 (D) 132 69 3 737 1,337 770 407 45.5 Mexico ........................................................... 338,519 209,326 160,414 41,743 7,169 18,769 5,641 332 40,348 47,965 46,195 17,413 1,059.9 Panama ......................................................... 11,059 9,154 (D) (D) 99 210 195 2 826 1 591 427 20.7 Other ............................................................. 12,250 10,354 7,483 (D) (D) 548 151 (D) 1,075 807 2,050 666 58.0
Other Western Hemisphere............................... 2,741,125 119,167 52,309 43,479 23,379 144,156 3,356 (D) 6,298 6,407 20,918 1,427 48.4 Barbados ....................................................... 55,835 10,444 5,689 2,814 1,940 3,990 (D) 1 (D) (D) 3,032 50 1.3 Bermuda........................................................ 965,894 38,744 (D) (D) 9,408 72,555 595 (D) 798 58 4,319 390 3.5 Dominican Republic ...................................... 4,178 5,148 3,568 1,575 6 445 176 1 (D) (D) 1,168 220 23.2 United Kingdom Islands, Caribbean .............. 1,056,475 41,289 17,716 13,138 10,435 56,206 652 (*) (D) 94 6,939 183 4.2 Other ............................................................. 658,743 23,541 (D) (D) 1,590 10,961 (D) 1 (D) (D) 5,460 584 16.2
Africa .................................................................... 296,368 111,359 96,869 13,487 1,002 35,743 12,672 102 1,899 3,754 63,026 6,711 187.3 Egypt ................................................................. 22,518 14,336 12,706 1,481 149 2,739 1,657 2 (D) 2 7,318 782 32.0 Nigeria ............................................................... 74,102 27,000 (D) (D) (D) (D) 3,306 3 (D) (D) 23,122 639 7.8 South Africa....................................................... 32,503 27,344 21,649 5,327 369 1,373 588 90 1,181 246 6,534 2,851 65.1 Other ................................................................. 167,246 42,678 (D) (D) (D) (D) 7,121 7 509 (D) 26,052 2,439 82.4
Middle East .......................................................... 141,126 84,611 52,612 31,058 941 19,961 6,316 2,076 855 5,960 35,961 7,042 115.2 Israel.................................................................. 38,370 16,109 11,619 4,277 214 1,398 2,750 2,061 162 1,493 7,431 4,079 70.7 Saudi Arabia ...................................................... 18,299 10,810 8,268 2,505 37 2,550 342 1 130 (D) 4,467 872 12.3 United Arab Emirates ........................................ 24,126 41,747 20,768 20,697 282 1,758 (D) 13 550 83 13,761 1,377 21.5 Other ................................................................. 60,330 15,944 11,957 3,579 408 14,256 (D) 1 13 (D) 10,301 714 10.6
Asia and Pacific ................................................... 3,230,121 1,546,909 1,134,061 351,216 61,632 154,683 53,472 9,668 60,933 56,306 333,866 122,258 3,890.4 Australia............................................................. 562,375 177,765 114,547 53,522 9,696 25,343 14,344 1,079 6,367 3,807 57,942 25,023 307.5 China ................................................................. 243,457 206,091 167,836 36,585 1,670 20,858 8,287 1,646 8,150 7,284 45,420 15,576 1,232.3 Hong Kong......................................................... 299,698 118,224 75,458 39,407 3,360 11,507 1,119 157 4,692 6,540 15,548 6,926 119.3 India................................................................... 98,398 58,727 32,648 23,322 2,757 4,924 2,590 2,075 1,200 828 19,864 12,127 812.8 Indonesia........................................................... 56,884 30,426 26,668 3,243 515 9,510 2,587 17 595 228 18,364 2,165 102.0 Japan................................................................. 1,025,074 290,391 179,220 78,929 32,243 13,212 4,812 2,129 11,828 4,468 59,451 30,961 320.2 Korea, Republic of ............................................. 137,016 64,445 48,084 12,389 3,972 4,299 2,692 860 2,422 2,996 13,477 5,988 121.2 Malaysia ............................................................ 65,855 54,040 45,893 7,759 388 6,140 3,316 379 1,859 3,410 13,289 2,816 156.4 New Zealand ..................................................... 20,289 14,159 9,841 3,945 373 1,014 443 (D) 178 107 3,309 1,429 31.5 Philippines ......................................................... 30,842 21,168 16,207 4,755 206 1,880 1,092 60 471 911 5,491 2,123 184.2 Singapore .......................................................... 499,118 394,104 329,550 60,139 4,415 42,360 5,272 848 18,387 19,918 36,844 9,895 168.0 Taiwan ............................................................... 84,625 37,882 29,019 7,455 1,408 3,738 1,074 233 2,151 2,198 7,591 2,754 86.9 Thailand............................................................. 54,227 55,248 50,188 4,689 370 6,194 2,574 111 2,442 3,340 13,781 2,623 165.6 Other ................................................................. 52,264 24,239 8,903 15,077 259 3,705 3,271 (D) 192 272 23,496 1,853 82.6
Addenda: European Union (27) 2 ...................................... 11,225,148 2,373,936 1,683,071 598,389 92,476 523,803 51,459 24,987 57,389 73,796 583,177 260,271 3,815.1 OPEC 3.............................................................. 268,399 130,849 96,456 32,661 1,733 40,857 10,418 75 2,333 (D) 67,770 6,520 123.4
* Less than $500,000 (+/–). included in services supplied). In industries other than finance and insurance, investment income is generally considered D Suppressed to avoid disclosure of data of individual companies. to be an incidental revenue source; this income is included in the income statement in a separate “other income” category, 1. “Other” consists largely of investment income that is included in “sales or gross operating revenues” in the income but is not included in sales or in this column.
statement. In finance and insurance, investment income is included in sales because it is generated by a primary activity of 2. The European Union (27) comprises Austria, Belgium, Bulgaria, Cyprus, Czech Republic, Denmark, Estonia, the company. For insurance, “other” consists of investment income remaining after BEA’s estimate of investment income Finland, France, Germany, Greece, Hungary, Ireland, Italy, Latvia, Lithuania, Luxembourg, Malta, the Netherlands, Poland, earned on funds insurers hold on behalf of policyholders is removed (and included in the services supplied measure) plus Portugal, Romania, Slovakia, Slovenia, Spain, Sweden, and the United Kingdom. the portion of premiums set aside for the settlement of expected or “normal” losses. For banks, “other” consists of the 3. OPEC is the Organization of Petroleum Exporting Countries. In 2011, its members were Algeria, Angola, Ecuador, investment income remaining after BEA’s estimate of the value of implicit services provided by banks is excluded (and Iran, Iraq, Kuwait, Libya, Nigeria, Qatar, Saudi Arabia, the United Arab Emirates, and Venezuela.
44 U.S. Multinational Companies November 2013
Table 5.1 Employment of Majority-Owned Foreign Affiliates, Country by Industry of Affiliate, 2010 [Thousands of employees]
All industries
Mining
Manufacturing
Wholesale trade
Retail trade
Information
Finance and
insurance
Professional, scientific,
and technical services
Other industries Total
Of which:
Food Chemicals
Primary and
fabricated metals
Machinery
Computers and
electronic products
Electrical equipment, appliances,
and components
Transportation
equipment
(1) (2) (3) (4) (5) (6) (7) (8) (9) (10) (11) (12) (13) (14) (15) (16)
All countries............................................. 11,313.4 199.1 4,652.9 450.3 616.3 217.5 399.3 716.8 199.5 884.7 775.3 1,214.9 406.7 611.6 961.6 2,491.3
Canada.................................................................. 1,085.5 20.3 298.2 34.4 35.4 18.7 18.5 20.3 5.6 74.4 85.8 317.8 23.0 36.7 69.0 234.6
Europe .................................................................. 4,080.8 35.7 1,744.3 133.6 264.4 120.6 185.9 182.9 68.7 372.1 366.5 337.5 158.5 242.9 287.0 908.4 Austria ............................................................... 40.3 0.1 22.2 1.3 2.2 0.4 3.2 2.4 1.9 5.1 6.0 1.1 1.4 0.6 2.7 6.2 Belgium ............................................................. 132.5 0.1 64.1 6.8 17.8 3.2 7.3 1.2 1.4 12.7 15.6 1.6 3.9 6.2 8.8 32.2 Czech Republic ................................................. 80.2 0.0 51.5 G 3.0 1.7 5.1 8.5 3.0 20.7 6.4 0.7 1.9 5.9 2.0 11.6 Denmark ............................................................ 32.6 0.3 13.2 1.4 1.5 0.8 2.8 1.4 0.3 0.1 3.8 0.9 0.9 0.5 7.9 5.1 Finland............................................................... 19.8 0.0 11.1 0.2 1.9 0.2 2.4 2.3 0.3 0.3 2.5 0.1 0.9 0.2 2.4 2.5 France................................................................ 465.4 0.6 199.4 13.1 35.6 12.7 28.4 18.7 4.8 30.2 51.4 15.9 9.7 8.8 23.1 156.5 Germany............................................................ 621.1 4.2 353.4 9.7 38.5 22.0 38.8 39.4 14.6 110.7 67.8 24.7 13.5 20.5 41.3 95.6 Greece............................................................... 18.2 (*) 6.3 1.7 2.1 0.4 0.1 0.1 0.0 (*) 3.8 0.2 0.4 2.2 1.4 3.9 Hungary ............................................................. 59.7 (*) 38.1 1.2 1.4 H 2.6 6.3 I 12.2 4.9 0.4 2.5 4.1 4.8 4.8 Ireland ............................................................... 98.0 0.3 54.4 1.3 15.8 0.4 1.0 16.8 0.5 0.4 4.3 1.2 6.2 11.9 5.0 14.8 Italy .................................................................... 205.6 0.7 98.7 4.4 20.5 6.3 18.2 11.5 7.1 14.7 21.0 6.3 11.6 6.5 18.5 42.5 Luxembourg....................................................... 16.5 0.0 6.9 0.0 0.8 0.2 0.2 0.1 0.0 0.0 (*) 0.2 2.4 4.4 0.8 1.9 Netherlands ....................................................... 220.0 1.6 87.6 10.9 25.4 3.7 9.8 4.0 3.2 7.5 25.0 11.5 11.0 7.2 16.4 59.6 Norway .............................................................. 38.6 7.8 13.8 0.5 1.0 0.8 6.2 0.8 0.2 0.3 2.1 2.2 1.0 1.0 2.4 8.3 Poland ............................................................... 153.2 (*) 98.9 15.4 8.9 6.6 2.8 6.0 4.5 33.8 11.1 0.6 4.6 16.4 5.5 16.0 Por tugal ............................................................. 30.6 0.0 14.8 1.7 1.8 1.0 1.0 2.2 0.2 3.9 2.9 1.5 0.7 0.8 1.5 8.3 Russia ............................................................... 122.9 4.4 59.0 15.0 4.8 I 4.3 1.9 0.2 7.2 8.5 0.1 1.1 6.5 3.1 39.9 Spain ................................................................. 176.1 0.2 87.3 9.2 15.9 6.0 1.9 9.8 4.1 25.7 18.7 5.1 4.5 7.8 9.7 42.7 Sweden.............................................................. 64.9 0.0 26.8 0.9 3.5 2.6 3.9 2.2 0.7 4.3 7.4 2.2 2.3 3.0 6.9 16.3 Switzerland ........................................................ 88.1 F 30.1 G 7.2 0.9 3.0 4.0 2.2 1.0 23.7 2.2 5.2 4.2 7.1 J Turkey ................................................................ 44.4 (*) 28.1 3.5 7.3 0.1 F 0.1 (*) 9.2 4.4 0.1 0.5 2.9 0.7 7.7 United Kingdom ................................................. 1,213.0 9.5 294.2 24.4 41.0 20.1 38.9 39.6 8.4 48.7 64.1 258.3 67.2 119.1 108.9 291.7 Other ................................................................. 139.3 H 84.4 7.5 6.4 22.0 H 3.5 H 23.4 11.1 0.2 4.8 2.2 6.0 K
Latin America and Other Western Hemisphere 2,260.8 61.5 1,086.2 163.9 125.6 32.6 63.6 80.0 50.1 281.2 81.1 M 60.1 114.4 68.6 M South America ................................................... 994.4 45.3 451.1 88.5 81.1 12.2 33.1 17.0 J 101.2 44.4 M 37.8 41.3 42.8 M
Argentina ....................................................... 141.2 8.5 50.5 11.5 12.1 0.7 1.3 0.7 (*) 12.2 4.0 J 7.3 8.9 6.9 K Brazil ............................................................. 565.0 13.0 317.5 56.0 46.6 9.4 29.8 14.4 J 77.3 20.9 L 16.2 17.9 26.6 L Chile .............................................................. 110.0 5.5 10.5 G 4.3 0.1 0.8 0.4 0.0 0.2 3.9 K 6.9 3.0 5.0 K Colombia ....................................................... 58.8 7.7 20.3 4.1 4.8 1.3 0.1 0.5 0.2 H 3.3 0.5 1.7 5.9 2.0 17.5 Ecuador ......................................................... 14.9 1.1 7.8 G 1.0 (*) (*) A 0.0 G 2.7 0.7 0.3 0.3 0.2 1.7 Peru ............................................................... 37.0 6.5 7.6 1.6 3.4 0.2 0.1 0.1 (*) 0.0 5.4 0.1 G 0.9 0.3 J Venezuela ...................................................... 51.2 2.2 30.2 9.4 8.2 0.3 0.9 0.8 0.0 I 3.5 0.7 2.0 2.9 1.7 8.0 Other ............................................................. 16.2 0.7 6.7 2.0 0.7 0.1 0.1 A 0.0 0.6 0.7 0.2 G 1.5 0.2 H
Central America................................................. 1,217.1 13.8 613.2 73.9 41.9 19.3 30.4 63.0 K 180.0 34.4 222.3 17.1 70.3 25.0 220.9 Costa Rica ..................................................... 47.0 0.0 19.6 0.9 6.7 0.1 0.0 H 1.4 0.0 2.1 0.9 0.6 G 4.4 J Honduras ....................................................... 46.1 0.0 33.9 G 0.3 0.0 0.0 0.1 0.0 H 0.6 0.4 0.1 G 0.0 I Mexico ........................................................... 1,042.3 13.5 522.6 66.6 32.1 19.1 30.4 56.4 29.4 M 29.0 M 15.7 58.1 20.5 M Panama ......................................................... 21.6 0.3 1.5 0.6 0.6 0.0 0.0 (*) 0.0 0.0 1.4 0.6 0.4 0.6 0.1 16.8 Other ............................................................. 60.1 (*) 35.6 H 2.2 0.1 0.0 H A 0.0 1.2 G 0.4 I (*) 12.5
Other Western Hemisphere ............................... 49.3 2.4 21.8 1.5 2.6 1.0 0.1 (*) 0.0 0.0 2.3 G 5.2 2.8 0.8 J Barbados ....................................................... 1.4 (*) (*) (*) 0.0 0.0 0.0 0.0 0.0 0.0 0.1 0.2 (*) 0.1 (*) 0.7 Bermuda ........................................................ 3.2 F (*) 0.0 (*) 0.0 (*) 0.0 0.0 0.0 0.3 0.0 0.1 1.3 0.1 F Dominican Republic....................................... 24.9 0.0 18.9 G 2.2 0.1 (*) (*) 0.0 0.0 0.9 0.9 G 0.1 0.1 G United Kingdom Islands, Caribbean .............. 4.0 0.7 0.1 0.1 0.0 0.0 0.0 (*) 0.0 0.0 0.2 (*) 0.1 0.3 0.2 2.3 Other ............................................................. 15.9 G 2.8 A 0.4 0.9 0.1 0.0 0.0 0.0 0.8 G H 1.0 0.4 5.6
Africa .................................................................... 178.4 27.3 86.3 J 7.7 2.3 5.2 1.5 2.1 18.7 14.2 G 2.9 7.4 5.0 K Egypt ................................................................. 30.0 2.5 17.9 5.3 1.7 A G (*) 0.4 0.0 1.6 0.1 0.3 1.0 0.7 6.0 Nigeria ............................................................... 8.6 6.8 0.9 (*) 0.3 (*) 0.4 0.1 0.0 0.0 0.2 0.0 (*) 0.3 (*) 0.5 South Africa ....................................................... 61.1 0.4 30.1 4.0 4.6 0.7 2.8 1.1 1.5 8.2 9.6 G 2.3 1.9 3.8 J Other ................................................................. 78.8 17.6 37.5 H 1.1 G F 0.4 0.1 10.5 2.8 0.1 0.2 4.2 0.5 15.8
Middle East........................................................... 111.6 9.3 39.9 H 4.2 1.0 6.3 17.9 0.4 0.4 14.9 0.4 6.3 4.5 16.0 20.3 Israel .................................................................. 69.8 (*) 29.2 0.1 2.6 0.2 4.8 J 0.3 0.4 12.6 0.3 5.0 1.5 7.9 13.2 Saudi Arabia ...................................................... 10.8 2.7 3.9 G 0.8 0.3 0.7 A (*) 0.0 0.4 0.0 0.2 0.1 2.4 1.0 United Arab Emirates ........................................ 19.8 2.2 4.0 0.2 0.6 A 0.7 1.1 (*) 0.0 1.8 (*) 1.0 1.9 4.4 4.4 Other ................................................................. 11.2 4.3 2.7 G 0.1 A 0.2 0.0 0.0 0.0 0.1 0.0 0.1 0.9 1.4 1.7
Asia and Pacific ................................................... 3,596.4 45.0 1,398.0 103.0 179.0 42.3 119.7 414.1 72.6 137.9 212.8 186.7 156.0 205.8 516.0 876.2 Australia............................................................. 290.9 8.4 92.5 22.4 11.9 9.7 8.0 3.0 3.1 13.0 26.4 9.5 21.9 20.3 33.9 78.0 China ................................................................. 1,125.3 2.5 559.7 30.8 69.8 26.1 52.8 164.2 45.1 50.9 46.3 80.1 16.7 6.8 50.0 363.1 Hong Kong......................................................... 117.5 0.0 43.9 0.1 3.4 0.7 2.5 8.1 8.7 0.1 12.6 0.9 5.0 18.7 10.9 25.6 India ................................................................... 712.7 0.8 129.6 6.5 23.0 0.9 20.5 20.9 2.8 24.2 26.7 J 66.1 39.5 328.5 M Indonesia ........................................................... 100.6 24.1 56.2 6.0 6.3 (*) 0.7 4.1 G 0.7 1.9 0.1 0.4 3.5 1.1 13.3 Japan ................................................................. 311.9 0.1 75.2 0.8 23.9 0.3 13.8 14.1 2.6 5.2 33.6 64.9 10.8 58.0 34.1 35.3 Korea, Republic of ............................................. 118.9 (*) 56.4 0.8 4.9 1.1 5.2 14.6 0.1 24.9 11.1 4.3 1.9 9.2 5.9 30.0 Malaysia ............................................................ 146.6 2.2 101.4 2.1 4.6 0.6 2.7 74.8 H 2.2 6.2 0.5 1.8 4.8 5.3 24.3 New Zealand ..................................................... 30.2 0.3 9.1 3.1 1.5 0.2 0.3 0.7 0.4 0.6 3.0 1.8 0.9 2.1 3.0 9.9 Philippines ......................................................... 170.8 0.1 56.8 8.9 4.6 0.1 0.3 18.5 G H 3.5 1.2 19.2 H 21.2 L Singapore .......................................................... 152.3 2.4 56.4 0.9 7.4 0.9 6.5 26.1 1.8 4.0 20.1 0.3 6.1 16.1 9.8 41.1 Taiwan ............................................................... 88.9 (*) 30.5 0.8 4.3 0.6 1.9 14.8 G G 11.2 H 3.1 13.9 4.6 J Thailand............................................................. 162.9 2.6 104.7 16.9 9.9 0.6 4.2 44.5 0.2 6.2 6.8 3.6 0.5 5.5 5.1 34.1 Other ................................................................. 67.0 1.6 25.7 2.7 3.4 0.5 0.4 5.6 0.0 0.4 3.3 0.9 1.5 G 2.5 K
Addenda: European Union (27) 1 ...................................... 3,739.4 17.7 1,591.1 109.7 242.0 105.4 170.2 176.0 66.2 354.1 324.5 332.8 149.9 227.7 271.3 824.4 OPEC 2.............................................................. 120.4 25.6 48.5 13.3 11.0 2.0 3.0 2.1 (*) 7.5 8.9 1.5 3.6 5.7 9.5 17.1
* Fewer than 50 employees. Iran, Iraq, Kuwait, Libya, Nigeria, Qatar, Saudi Arabia, the United Arab Emirates, and Venezuela. 1. The European Union (27) comprises Austria, Belgium, Bulgaria, Cyprus, Czech Republic, Denmark, Estonia, NOTE. Size ranges are given in employment cells that are suppressed. The size ranges are: A—1 to 499; F—500 to 999;
Finland, France, Germany, Greece, Hungary, Ireland, Italy, Latvia, Lithuania, Luxembourg, Malta, the Netherlands, Poland, G—1,000 to 2,499; H—2,500 to 4,999; I—5,000 to 9,999; J—10,000 to 24,999; K—25,000 to 49,999; L—50,000 to Portugal, Romania, Slovakia, Slovenia, Spain, Sweden, and the United Kingdom. 99,999; M—100,000 or more.
2. OPEC is the Organization of Petroleum Exporting Countries. In 2010, its members were Algeria, Angola, Ecuador,
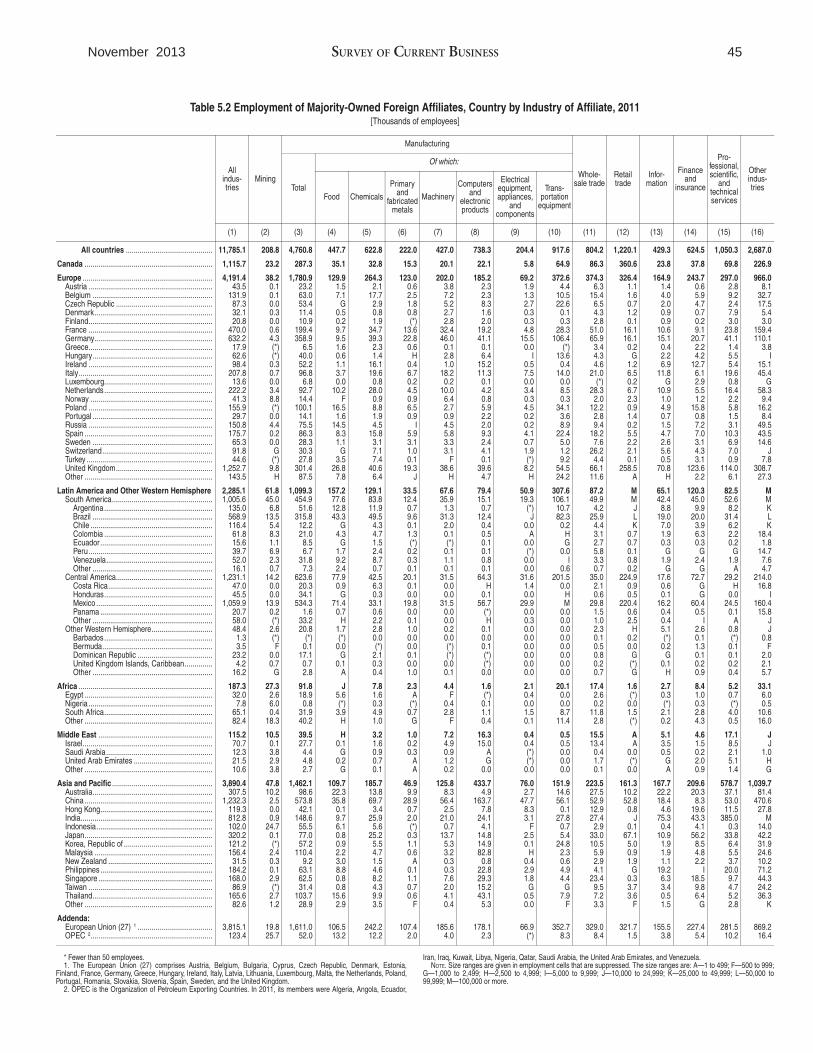
45 November 2013 SURVEY OF CURRENT BUSINESS
Table 5.2 Employment of Majority-Owned Foreign Affiliates, Country by Industry of Affiliate, 2011 [Thousands of employees]
All industries
Mining
Manufacturing
Wholesale trade
Retail trade
Information
Finance and
insurance
Professional, scientific,
and technical services
Other industries Total
Of which:
Food Chemicals
Primary and
fabricated metals
Machinery
Computers and
electronic products
Electrical equipment, appliances,
and components
Transportation
equipment
(1) (2) (3) (4) (5) (6) (7) (8) (9) (10) (11) (12) (13) (14) (15) (16)
All countries ............................................ 11,785.1 208.8 4,760.8 447.7 622.8 222.0 427.0 738.3 204.4 917.6 804.2 1,220.1 429.3 624.5 1,050.3 2,687.0
Canada ................................................................. 1,115.7 23.2 287.3 35.1 32.8 15.3 20.1 22.1 5.8 64.9 86.3 360.6 23.8 37.8 69.8 226.9
Europe .................................................................. 4,191.4 38.2 1,780.9 129.9 264.3 123.0 202.0 185.2 69.2 372.6 374.3 326.4 164.9 243.7 297.0 966.0 Austria ............................................................... 43.5 0.1 23.2 1.5 2.1 0.6 3.8 2.3 1.9 4.4 6.3 1.1 1.4 0.6 2.8 8.1 Belgium ............................................................. 131.9 0.1 63.0 7.1 17.7 2.5 7.2 2.3 1.3 10.5 15.4 1.6 4.0 5.9 9.2 32.7 Czech Republic ................................................. 87.3 0.0 53.4 G 2.9 1.8 5.2 8.3 2.7 22.6 6.5 0.7 2.0 4.7 2.4 17.5 Denmark ............................................................ 32.1 0.3 11.4 0.5 0.8 0.8 2.7 1.6 0.3 0.1 4.3 1.2 0.9 0.7 7.9 5.4 Finland............................................................... 20.8 0.0 10.9 0.2 1.9 (*) 2.8 2.0 0.3 0.3 2.8 0.1 0.9 0.2 3.0 3.0 France ............................................................... 470.0 0.6 199.4 9.7 34.7 13.6 32.4 19.2 4.8 28.3 51.0 16.1 10.6 9.1 23.8 159.4 Germany............................................................ 632.2 4.3 358.9 9.5 39.3 22.8 46.0 41.1 15.5 106.4 65.9 16.1 15.1 20.7 41.1 110.1 Greece............................................................... 17.9 (*) 6.5 1.6 2.3 0.6 0.1 0.1 0.0 (*) 3.4 0.2 0.4 2.2 1.4 3.8 Hungary............................................................. 62.6 (*) 40.0 0.6 1.4 H 2.8 6.4 I 13.6 4.3 G 2.2 4.2 5.5 I Ireland ............................................................... 98.4 0.3 52.2 1.1 16.1 0.4 1.0 15.2 0.5 0.4 4.6 1.2 6.9 12.7 5.4 15.1 Italy .................................................................... 207.8 0.7 96.8 3.7 19.6 6.7 18.2 11.3 7.5 14.0 21.0 6.5 11.8 6.1 19.6 45.4 Luxembourg....................................................... 13.6 0.0 6.8 0.0 0.8 0.2 0.2 0.1 0.0 0.0 (*) 0.2 G 2.9 0.8 G Netherlands ....................................................... 222.2 3.4 92.7 10.2 28.0 4.5 10.0 4.2 3.4 8.5 28.3 6.7 10.9 5.5 16.4 58.3 Norway .............................................................. 41.3 8.8 14.4 F 0.9 0.9 6.4 0.8 0.3 0.3 2.0 2.3 1.0 1.2 2.2 9.4 Poland ............................................................... 155.9 (*) 100.1 16.5 8.8 6.5 2.7 5.9 4.5 34.1 12.2 0.9 4.9 15.8 5.8 16.2 Portugal ............................................................. 29.7 0.0 14.1 1.6 1.9 0.9 0.9 2.2 0.2 3.6 2.8 1.4 0.7 0.8 1.5 8.4 Russia ............................................................... 150.8 4.4 75.5 14.5 4.5 I 4.5 2.0 0.2 8.9 9.4 0.2 1.5 7.2 3.1 49.5 Spain ................................................................. 175.7 0.2 86.3 8.3 15.8 5.9 5.8 9.3 4.1 22.4 18.2 5.5 4.7 7.0 10.3 43.5 Sweden ............................................................. 65.3 0.0 28.3 1.1 3.1 3.1 3.3 2.4 0.7 5.0 7.6 2.2 2.6 3.1 6.9 14.6 Switzerland ........................................................ 91.8 G 30.3 G 7.1 1.0 3.1 4.1 1.9 1.2 26.2 2.1 5.6 4.3 7.0 J Turkey ................................................................ 44.6 (*) 27.8 3.5 7.4 0.1 F 0.1 (*) 9.2 4.4 0.1 0.5 3.1 0.9 7.8 United Kingdom ................................................. 1,252.7 9.8 301.4 26.8 40.6 19.3 38.6 39.6 8.2 54.5 66.1 258.5 70.8 123.6 114.0 308.7 Other ................................................................. 143.5 H 87.5 7.8 6.4 J H 4.7 H 24.2 11.6 A H 2.2 6.1 27.3
Latin America and Other Western Hemisphere 2,285.1 61.8 1,099.3 157.2 129.1 33.5 67.6 79.4 50.9 307.6 87.2 M 65.1 120.3 82.5 M South America ................................................... 1,005.6 45.0 454.9 77.6 83.8 12.4 35.9 15.1 19.3 106.1 49.9 M 42.4 45.0 52.6 M
Argentina ....................................................... 135.0 6.8 51.6 12.8 11.9 0.7 1.3 0.7 (*) 10.7 4.2 J 8.8 9.9 8.2 K Brazil ............................................................. 568.9 13.5 315.8 43.3 49.5 9.6 31.3 12.4 J 82.3 25.9 L 19.0 20.0 31.4 L Chile .............................................................. 116.4 5.4 12.2 G 4.3 0.1 2.0 0.4 0.0 0.2 4.4 K 7.0 3.9 6.2 K Colombia ....................................................... 61.8 8.3 21.0 4.3 4.7 1.3 0.1 0.5 A H 3.1 0.7 1.9 6.3 2.2 18.4 Ecuador ......................................................... 15.6 1.1 8.5 G 1.5 (*) (*) 0.1 0.0 G 2.7 0.7 0.3 0.3 0.2 1.8 Peru ............................................................... 39.7 6.9 6.7 1.7 2.4 0.2 0.1 0.1 (*) 0.0 5.8 0.1 G G G 14.7 Venezuela...................................................... 52.0 2.3 31.8 9.2 8.7 0.3 1.1 0.8 0.0 I 3.3 0.8 1.9 2.4 1.9 7.6 Other ............................................................. 16.1 0.7 7.3 2.4 0.7 0.1 0.1 0.1 0.0 0.6 0.7 0.2 G G A 4.7
Central America................................................. 1,231.1 14.2 623.6 77.9 42.5 20.1 31.5 64.3 31.6 201.5 35.0 224.9 17.6 72.7 29.2 214.0 Costa Rica ..................................................... 47.0 0.0 20.3 0.9 6.3 0.1 0.0 H 1.4 0.0 2.1 0.9 0.6 G H 16.8 Honduras ....................................................... 45.5 0.0 34.1 G 0.3 0.0 0.0 0.1 0.0 H 0.6 0.5 0.1 G 0.0 I Mexico ........................................................... 1,059.9 13.9 534.3 71.4 33.1 19.8 31.5 56.7 29.9 M 29.8 220.4 16.2 60.4 24.5 160.4 Panama ......................................................... 20.7 0.2 1.6 0.7 0.6 0.0 0.0 (*) 0.0 0.0 1.5 0.6 0.4 0.5 0.1 15.8 Other ............................................................. 58.0 (*) 33.2 H 2.2 0.1 0.0 H 0.3 0.0 1.0 2.5 0.4 I A J
Other Western Hemisphere............................... 48.4 2.6 20.8 1.7 2.8 1.0 0.2 0.1 0.0 0.0 2.3 H 5.1 2.6 0.8 J Barbados ....................................................... 1.3 (*) (*) (*) 0.0 0.0 0.0 0.0 0.0 0.0 0.1 0.2 (*) 0.1 (*) 0.8 Bermuda........................................................ 3.5 F 0.1 0.0 (*) 0.0 (*) 0.1 0.0 0.0 0.5 0.0 0.2 1.3 0.1 F Dominican Republic ...................................... 23.2 0.0 17.1 G 2.1 0.1 (*) (*) 0.0 0.0 0.8 G G 0.1 0.1 2.0 United Kingdom Islands, Caribbean .............. 4.2 0.7 0.7 0.1 0.3 0.0 0.0 (*) 0.0 0.0 0.2 (*) 0.1 0.2 0.2 2.1 Other ............................................................. 16.2 G 2.8 A 0.4 1.0 0.1 0.0 0.0 0.0 0.7 G H 0.9 0.4 5.7
Africa .................................................................... 187.3 27.3 91.8 J 7.8 2.3 4.4 1.6 2.1 20.1 17.4 1.6 2.7 8.4 5.2 33.1 Egypt ................................................................. 32.0 2.6 18.9 5.6 1.6 A F (*) 0.4 0.0 2.6 (*) 0.3 1.0 0.7 6.0 Nigeria ............................................................... 7.8 6.0 0.8 (*) 0.3 (*) 0.4 0.1 0.0 0.0 0.2 0.0 (*) 0.3 (*) 0.5 South Africa....................................................... 65.1 0.4 31.9 3.9 4.9 0.7 2.8 1.1 1.5 8.7 11.8 1.5 2.1 2.8 4.0 10.6 Other ................................................................. 82.4 18.3 40.2 H 1.0 G F 0.4 0.1 11.4 2.8 (*) 0.2 4.3 0.5 16.0
Middle East .......................................................... 115.2 10.5 39.5 H 3.2 1.0 7.2 16.3 0.4 0.5 15.5 A 5.1 4.6 17.1 J Israel.................................................................. 70.7 0.1 27.7 0.1 1.6 0.2 4.9 15.0 0.4 0.5 13.4 A 3.5 1.5 8.5 J Saudi Arabia ...................................................... 12.3 3.8 4.4 G 0.9 0.3 0.9 A (*) 0.0 0.4 0.0 0.5 0.2 2.1 1.0 United Arab Emirates ........................................ 21.5 2.9 4.8 0.2 0.7 A 1.2 G (*) 0.0 1.7 (*) G 2.0 5.1 H Other ................................................................. 10.6 3.8 2.7 G 0.1 A 0.2 0.0 0.0 0.0 0.1 0.0 A 0.9 1.4 G
Asia and Pacific ................................................... 3,890.4 47.8 1,462.1 109.7 185.7 46.9 125.8 433.7 76.0 151.9 223.5 161.3 167.7 209.6 578.7 1,039.7 Australia............................................................. 307.5 10.2 98.6 22.3 13.8 9.9 8.3 4.9 2.7 14.6 27.5 10.2 22.2 20.3 37.1 81.4 China ................................................................. 1,232.3 2.5 573.8 35.8 69.7 28.9 56.4 163.7 47.7 56.1 52.9 52.8 18.4 8.3 53.0 470.6 Hong Kong......................................................... 119.3 0.0 42.1 0.1 3.4 0.7 2.5 7.8 8.3 0.1 12.9 0.8 4.6 19.6 11.5 27.8 India................................................................... 812.8 0.9 148.6 9.7 25.9 2.0 21.0 24.1 3.1 27.8 27.4 J 75.3 43.3 385.0 M Indonesia........................................................... 102.0 24.7 55.5 6.1 5.6 (*) 0.7 4.1 F 0.7 2.9 0.1 0.4 4.1 0.3 14.0 Japan................................................................. 320.2 0.1 77.0 0.8 25.2 0.3 13.7 14.8 2.5 5.4 33.0 67.1 10.9 56.2 33.8 42.2 Korea, Republic of ............................................. 121.2 (*) 57.2 0.9 5.5 1.1 5.3 14.9 0.1 24.8 10.5 5.0 1.9 8.5 6.4 31.9 Malaysia ............................................................ 156.4 2.4 110.4 2.2 4.7 0.6 3.2 82.8 H 2.3 5.9 0.9 1.9 4.8 5.5 24.6 New Zealand ..................................................... 31.5 0.3 9.2 3.0 1.5 A 0.3 0.8 0.4 0.6 2.9 1.9 1.1 2.2 3.7 10.2 Philippines ......................................................... 184.2 0.1 63.1 8.8 4.6 0.1 0.3 22.8 2.9 4.9 4.1 G 19.2 I 20.0 71.2 Singapore .......................................................... 168.0 2.9 62.5 0.8 8.2 1.1 7.6 29.3 1.8 4.4 23.4 0.3 6.3 18.5 9.7 44.3 Taiwan ............................................................... 86.9 (*) 31.4 0.8 4.3 0.7 2.0 15.2 G G 9.5 3.7 3.4 9.8 4.7 24.2 Thailand............................................................. 165.6 2.7 103.7 15.6 9.9 0.6 4.1 43.1 0.5 7.9 7.2 3.6 0.5 6.4 5.2 36.3 Other ................................................................. 82.6 1.2 28.9 2.9 3.5 F 0.4 5.3 0.0 F 3.3 F 1.5 G 2.8 K
Addenda: European Union (27) 1 ...................................... 3,815.1 19.8 1,611.0 106.5 242.2 107.4 185.6 178.1 66.9 352.7 329.0 321.7 155.5 227.4 281.5 869.2 OPEC 2.............................................................. 123.4 25.7 52.0 13.2 12.2 2.0 4.0 2.3 (*) 8.3 8.4 1.5 3.8 5.4 10.2 16.4
* Fewer than 50 employees. Iran, Iraq, Kuwait, Libya, Nigeria, Qatar, Saudi Arabia, the United Arab Emirates, and Venezuela. 1. The European Union (27) comprises Austria, Belgium, Bulgaria, Cyprus, Czech Republic, Denmark, Estonia, NOTE. Size ranges are given in employment cells that are suppressed. The size ranges are: A—1 to 499; F—500 to 999;
Finland, France, Germany, Greece, Hungary, Ireland, Italy, Latvia, Lithuania, Luxembourg, Malta, the Netherlands, Poland, G—1,000 to 2,499; H—2,500 to 4,999; I—5,000 to 9,999; J—10,000 to 24,999; K—25,000 to 49,999; L—50,000 to Portugal, Romania, Slovakia, Slovenia, Spain, Sweden, and the United Kingdom. 99,999; M—100,000 or more.
2. OPEC is the Organization of Petroleum Exporting Countries. In 2011, its members were Algeria, Angola, Ecuador,
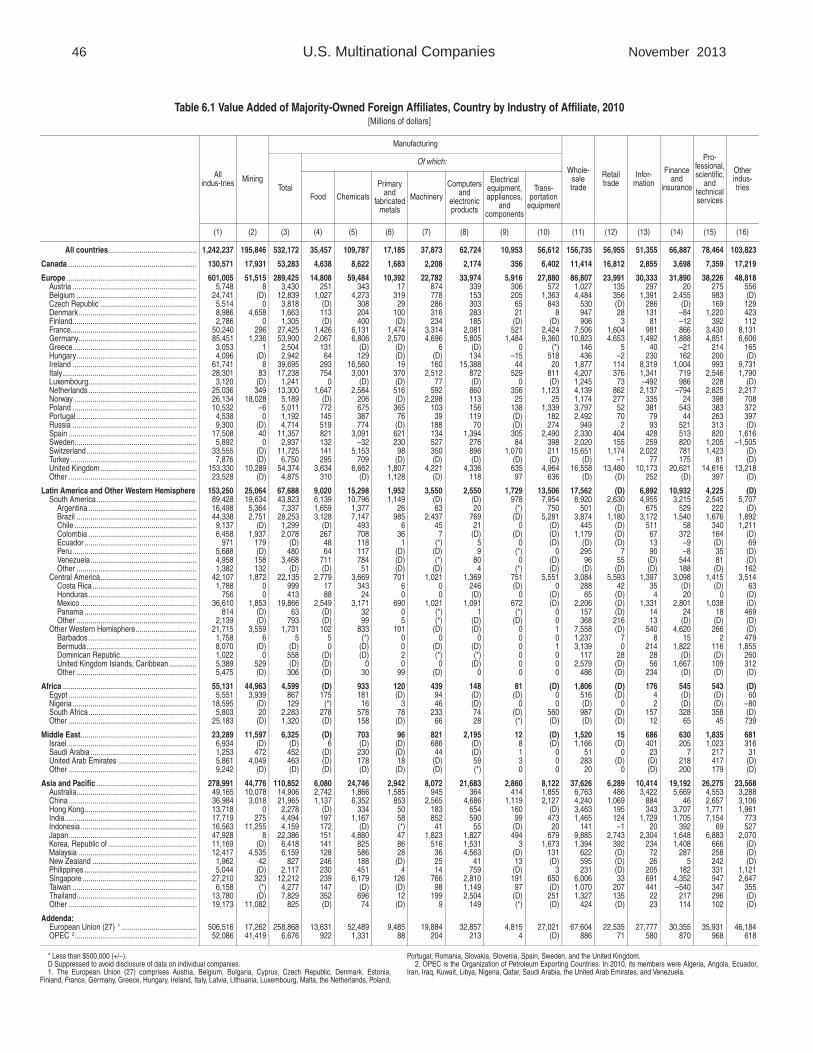
46 U.S. Multinational Companies November 2013
Table 6.1 Value Added of Majority-Owned Foreign Affiliates, Country by Industry of Affiliate, 2010 [Millions of dollars]
All indus-tries Mining
Manufacturing
Wholesale trade
Retail trade
Information
Finance and
insurance
Professional, scientific,
and technical services
Other industries Total
Of which:
Food Chemicals
Primary and
fabricated metals
Machinery
Computers and
electronic products
Electrical equipment, appliances,
and components
Transportation
equipment
(1) (2) (3) (4) (5) (6) (7) (8) (9) (10) (11) (12) (13) (14) (15) (16)
All countries............................................. 1,242,237 195,846 532,172 35,457 109,787 17,185 37,873 62,724 10,953 56,612 156,735 56,955 51,355 66,887 78,464 103,823
Canada.................................................................. 130,571 17,931 53,283 4,638 8,622 1,683 2,208 2,174 356 6,402 11,414 16,812 2,855 3,698 7,359 17,219
Europe .................................................................. 601,005 51,515 289,425 14,808 59,484 10,392 22,782 33,974 5,916 27,880 86,807 23,991 30,333 31,890 38,226 48,818 Austria ............................................................... 5,748 8 3,430 251 343 17 874 339 306 572 1,027 135 297 20 275 556 Belgium ............................................................. 24,741 (D) 12,839 1,027 4,273 319 778 153 205 1,363 4,484 356 1,391 2,455 983 (D) Czech Republic ................................................. 5,514 0 3,818 (D) 308 29 286 303 65 843 530 (D) 286 (D) 169 129 Denmark ............................................................ 8,986 4,658 1,663 113 204 100 316 283 21 8 947 28 131 –84 1,220 423 Finland............................................................... 2,786 0 1,305 (D) 400 (D) 234 185 (D) (D) 906 3 81 –12 392 112 France................................................................ 50,240 296 27,425 1,426 6,131 1,474 3,314 2,081 521 2,424 7,506 1,604 981 866 3,430 8,131 Germany............................................................ 85,451 1,236 53,900 2,067 6,806 2,570 4,696 5,805 1,484 9,360 10,823 4,653 1,492 1,888 4,851 6,606 Greece............................................................... 3,053 1 2,504 131 (D) (D) 6 (D) 0 (*) 146 5 40 –21 214 165 Hungary ............................................................. 4,096 (D) 2,942 64 129 (D) (D) 134 –15 518 436 –2 230 162 200 (D) Ireland ............................................................... 61,741 8 39,695 293 16,560 19 160 15,388 44 20 1,877 114 8,319 1,004 993 9,731 Italy .................................................................... 28,301 83 17,238 754 3,001 370 2,512 872 529 811 4,207 376 1,341 719 2,546 1,790 Luxembourg....................................................... 3,120 (D) 1,241 0 (D) (D) 77 (D) 0 (D) 1,245 73 –492 986 228 (D) Netherlands ....................................................... 25,036 349 13,300 1,647 2,584 516 592 860 356 1,123 4,139 862 2,137 –794 2,825 2,217 Norway .............................................................. 26,134 18,028 5,189 (D) 206 (D) 2,298 113 25 25 1,174 277 335 24 398 708 Poland ............................................................... 10,532 –6 5,011 772 675 365 103 156 138 1,339 3,797 52 381 543 383 372 Por tugal ............................................................. 4,538 0 1,192 145 387 76 39 119 (D) 182 2,492 70 79 44 263 397 Russia ............................................................... 9,300 (D) 4,714 519 774 (D) 188 70 (D) 274 949 2 93 521 313 (D) Spain ................................................................. 17,508 40 11,357 821 3,091 621 134 1,394 305 2,490 2,330 404 428 513 820 1,616 Sweden.............................................................. 5,892 0 2,937 132 –32 230 527 276 84 398 2,020 155 259 820 1,205 –1,505 Switzerland ........................................................ 33,555 (D) 11,725 141 5,153 98 350 896 1,070 211 15,651 1,174 2,022 781 1,423 (D) Turkey ................................................................ 7,876 (D) 6,750 295 709 (D) (D) (D) (D) (D) (D) –1 77 175 81 (D) United Kingdom ................................................. 153,330 10,289 54,374 3,634 6,662 1,807 4,221 4,336 635 4,964 16,558 13,480 10,173 20,621 14,616 13,218 Other ................................................................. 23,528 (D) 4,875 310 (D) 1,128 (D) 118 97 636 (D) (D) 252 (D) 397 (D)
Latin America and Other Western Hemisphere 153,250 25,064 67,688 9,020 15,298 1,952 3,550 2,550 1,729 13,506 17,562 (D) 6,892 10,932 4,225 (D) South America ................................................... 89,428 19,634 43,823 6,139 10,796 1,149 (D) (D) 978 7,954 6,920 2,630 4,955 3,215 2,545 5,707
Argentina ....................................................... 16,498 5,364 7,337 1,659 1,377 26 63 20 (*) 750 501 (D) 675 529 222 (D) Brazil ............................................................. 44,338 2,751 28,253 3,128 7,147 985 2,437 769 (D) 5,281 3,874 1,180 3,172 1,540 1,676 1,892 Chile .............................................................. 9,137 (D) 1,299 (D) 493 6 45 21 0 (D) 445 (D) 511 58 340 1,211 Colombia ....................................................... 6,458 1,937 2,078 267 708 36 7 (D) (D) (D) 1,179 (D) 67 372 164 (D) Ecuador ......................................................... 971 179 (D) 48 118 1 (*) 5 0 (D) (D) (D) 13 –9 (D) 69 Peru ............................................................... 5,688 (D) 480 64 117 (D) (D) 9 (*) 0 295 7 90 –8 35 (D) Venezuela ...................................................... 4,958 158 3,468 711 784 (D) (*) 80 0 (D) 96 55 (D) 544 81 (D) Other ............................................................. 1,382 132 (D) (D) 51 (D) (D) 4 (*) (D) (D) (D) (D) 188 (D) 162
Central America................................................. 42,107 1,872 22,135 2,779 3,669 701 1,021 1,369 751 5,551 3,084 5,593 1,397 3,098 1,415 3,514 Costa Rica ..................................................... 1,788 0 999 17 343 6 0 246 (D) 0 288 42 35 (D) (D) 63 Honduras ....................................................... 756 0 413 88 24 0 0 (D) 0 (D) 65 (D) 4 20 0 (D) Mexico ........................................................... 36,610 1,853 19,866 2,549 3,171 690 1,021 1,091 672 (D) 2,206 (D) 1,331 2,801 1,038 (D) Panama ......................................................... 814 (D) 63 (D) 32 0 (*) 1 (*) 0 157 (D) 14 24 18 469 Other ............................................................. 2,139 (D) 793 (D) 99 5 (*) (D) (D) 0 368 216 13 (D) (D) (D)
Other Western Hemisphere ............................... 21,715 3,559 1,731 102 833 101 (D) (D) 0 1 7,558 (D) 540 4,620 266 (D) Barbados ....................................................... 1,758 6 5 5 (*) 0 0 0 0 0 1,237 7 8 15 2 479 Bermuda ........................................................ 8,070 (D) (D) 0 (D) 0 (D) (D) 0 1 3,139 0 214 1,822 116 1,855 Dominican Republic....................................... 1,022 0 558 (D) (D) 2 (*) (*) 0 0 117 28 28 (D) (D) 260 United Kingdom Islands, Caribbean .............. 5,389 529 (D) (D) 0 0 0 (D) 0 0 2,579 (D) 56 1,667 109 312 Other ............................................................. 5,475 (D) 306 (D) 30 99 (D) 0 0 0 486 (D) 234 (D) (D) (D)
Africa .................................................................... 55,131 44,963 4,599 (D) 933 120 439 148 81 (D) 1,806 (D) 176 545 543 (D) Egypt ................................................................. 5,551 3,939 867 175 181 (D) 94 (D) (D) 0 516 (D) 4 (D) (D) 60 Nigeria ............................................................... 18,595 (D) 129 (*) 16 3 46 (D) 0 0 (D) 0 2 (D) (D) –80 South Africa ....................................................... 5,803 20 2,283 278 578 78 233 74 (D) 560 987 (D) 157 328 358 (D) Other ................................................................. 25,183 (D) 1,320 (D) 158 (D) 66 28 (*) (D) (D) (D) 12 65 45 739
Middle East........................................................... 23,289 11,597 6,325 (D) 703 96 821 2,195 12 (D) 1,520 15 686 630 1,835 681 Israel .................................................................. 6,934 (D) (D) 6 (D) (D) 686 (D) 8 (D) 1,166 (D) 401 205 1,023 316 Saudi Arabia ...................................................... 1,253 472 452 (D) 230 (D) 44 (D) 1 0 51 0 23 7 217 31 United Arab Emirates ........................................ 5,861 4,049 463 (D) 178 18 (D) 59 3 0 283 (D) (D) 218 417 (D) Other ................................................................. 9,242 (D) (D) (D) (D) (D) (D) (*) 0 0 20 0 (D) 200 179 (D)
Asia and Pacific ................................................... 278,991 44,776 110,852 6,080 24,746 2,942 8,072 21,683 2,860 8,122 37,626 6,289 10,414 19,192 26,275 23,568 Australia............................................................. 49,165 10,078 14,906 2,742 1,866 1,585 945 364 414 1,855 6,763 486 3,422 5,669 4,553 3,288 China ................................................................. 36,984 3,018 21,965 1,137 6,352 853 2,565 4,686 1,119 2,127 4,240 1,069 884 46 2,657 3,106 Hong Kong......................................................... 13,718 0 2,278 (D) 334 50 183 654 160 (D) 3,463 195 343 3,707 1,771 1,961 India................................................................... 17,719 275 4,494 197 1,167 58 852 590 99 473 1,465 124 1,729 1,705 7,154 773 Indonesia ........................................................... 16,563 11,255 4,159 172 (D) (*) 41 55 (D) 20 141 –1 20 392 69 527 Japan ................................................................. 47,928 8 22,386 151 4,880 47 1,823 1,827 494 679 9,885 2,743 2,304 1,648 6,883 2,070 Korea, Republic of ............................................. 11,169 (D) 6,418 141 825 86 516 1,531 3 1,673 1,394 392 234 1,408 666 (D) Malaysia ............................................................ 12,417 4,535 6,159 128 586 28 36 4,563 (D) 131 622 (D) 72 287 258 (D) New Zealand ..................................................... 1,962 42 827 246 188 (D) 25 41 13 (D) 595 (D) 26 5 242 (D) Philippines ......................................................... 5,044 (D) 2,117 230 451 4 14 759 (D) 3 231 (D) 205 182 331 1,121 Singapore .......................................................... 27,210 323 12,212 239 6,179 126 766 2,810 191 650 6,006 33 691 4,352 947 2,647 Taiwan ............................................................... 6,158 (*) 4,277 147 (D) (D) 98 1,149 97 (D) 1,070 207 441 –540 347 355 Thailand............................................................. 13,780 (D) 7,829 352 696 12 199 2,504 (D) 251 1,327 135 22 217 296 (D) Other ................................................................. 19,173 11,082 825 (D) 74 (D) 9 149 (*) (D) 424 (D) 23 114 102 (D)
Addenda: European Union (27) 1 ...................................... 506,516 17,262 258,868 13,631 52,489 9,485 19,884 32,857 4,815 27,021 67,604 22,535 27,777 30,355 35,931 46,184 OPEC 2.............................................................. 52,086 41,419 6,676 922 1,331 88 204 213 4 (D) 886 71 580 870 968 618
* Less than $500,000 (+/–). Portugal, Romania, Slovakia, Slovenia, Spain, Sweden, and the United Kingdom. D Suppressed to avoid disclosure of data on individual companies. 2. OPEC is the Organization of Petroleum Exporting Countries. In 2010, its members were Algeria, Angola, Ecuador, 1. The European Union (27) comprises Austria, Belgium, Bulgaria, Cyprus, Czech Republic, Denmark, Estonia, Iran, Iraq, Kuwait, Libya, Nigeria, Qatar, Saudi Arabia, the United Arab Emirates, and Venezuela.
Finland, France, Germany, Greece, Hungary, Ireland, Italy, Latvia, Lithuania, Luxembourg, Malta, the Netherlands, Poland,
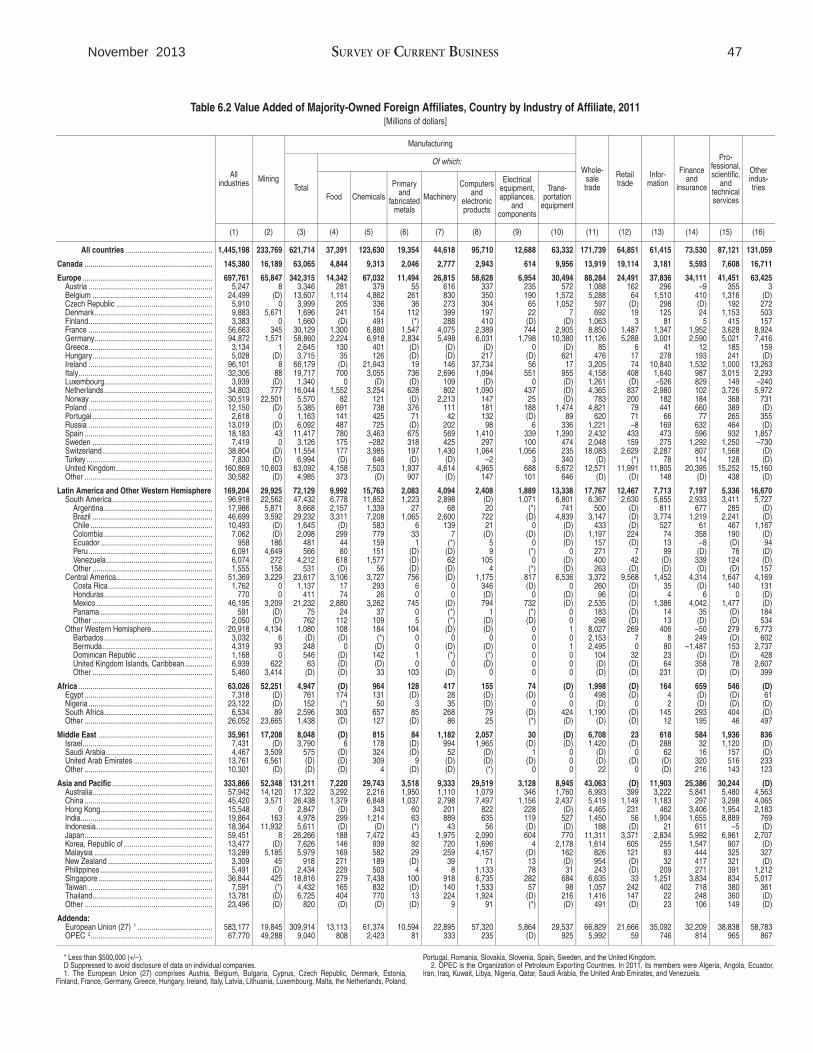
47 November 2013 SURVEY OF CURRENT BUSINESS
Table 6.2 Value Added of Majority-Owned Foreign Affiliates, Country by Industry of Affiliate, 2011 [Millions of dollars]
All industries Mining
Manufacturing
Wholesale trade
Retail trade
Information
Finance and
insurance
Professional, scientific,
and technical services
Other industries Total
Of which:
Food Chemicals
Primary and
fabricated metals
Machinery
Computers and
electronic products
Electrical equipment, appliances,
and components
Transportation
equipment
(1) (2) (3) (4) (5) (6) (7) (8) (9) (10) (11) (12) (13) (14) (15) (16)
All countries ............................................ 1,445,198 233,769 621,714 37,391 123,630 19,354 44,618 95,710 12,688 63,332 171,739 64,851 61,415 73,530 87,121 131,059
Canada ................................................................. 145,380 16,189 63,065 4,844 9,313 2,046 2,777 2,943 614 9,956 13,919 19,114 3,181 5,593 7,608 16,711
Europe .................................................................. 697,761 65,847 342,315 14,342 67,032 11,494 26,815 58,628 6,954 30,494 88,284 24,491 37,836 34,111 41,451 63,425 Austria ............................................................... 5,247 8 3,346 281 379 55 616 337 235 572 1,088 162 296 –9 355 3 Belgium ............................................................. 24,499 (D) 13,607 1,114 4,862 261 830 350 190 1,572 5,288 64 1,510 410 1,316 (D) Czech Republic ................................................. 5,910 0 3,999 205 336 36 273 304 65 1,052 597 (D) 298 (D) 192 272 Denmark............................................................ 9,883 5,671 1,696 241 154 112 399 197 22 7 692 19 125 24 1,153 503 Finland............................................................... 3,383 0 1,660 (D) 491 (*) 288 410 (D) (D) 1,063 3 81 5 415 157 France ............................................................... 56,663 345 30,129 1,300 6,880 1,547 4,075 2,389 744 2,905 8,850 1,487 1,347 1,952 3,628 8,924 Germany............................................................ 94,872 1,571 58,860 2,224 6,918 2,834 5,498 6,031 1,798 10,380 11,126 5,288 3,001 2,590 5,021 7,416 Greece............................................................... 3,134 1 2,645 130 401 (D) (D) (D) 0 (D) 85 6 41 12 185 159 Hungary............................................................. 5,028 (D) 3,715 35 126 (D) (D) 217 (D) 621 476 17 278 193 241 (D) Ireland ............................................................... 96,101 8 66,179 (D) 21,943 19 146 37,734 56 17 3,205 74 10,840 1,532 1,000 13,263 Italy .................................................................... 32,305 88 19,717 700 3,055 736 2,696 1,094 551 955 4,158 408 1,640 987 3,015 2,293 Luxembourg....................................................... 3,939 (D) 1,340 0 (D) (D) 109 (D) 0 (D) 1,261 (D) –526 829 149 –240 Netherlands ....................................................... 34,803 777 16,044 1,552 3,254 628 802 1,090 437 (D) 4,365 837 2,980 102 3,726 5,972 Norway .............................................................. 30,519 22,501 5,570 82 121 (D) 2,213 147 25 (D) 783 200 182 184 368 731 Poland ............................................................... 12,150 (D) 5,385 691 738 376 111 181 188 1,474 4,821 79 441 660 389 (D) Portugal ............................................................. 2,618 0 1,163 141 425 71 42 132 (D) 89 620 71 66 77 265 355 Russia ............................................................... 13,019 (D) 6,092 487 725 (D) 202 98 6 336 1,221 –8 169 632 464 (D) Spain ................................................................. 18,183 43 11,417 780 3,463 675 569 1,410 339 1,390 2,432 433 473 596 932 1,857 Sweden ............................................................. 7,419 0 3,126 175 –282 318 425 297 100 474 2,048 159 275 1,292 1,250 –730 Switzerland ........................................................ 38,804 (D) 11,554 177 3,985 197 1,430 1,064 1,056 235 18,083 2,629 2,287 807 1,568 (D) Turkey ................................................................ 7,830 (D) 6,994 (D) 646 (D) (D) –2 3 340 (D) (*) 78 114 128 (D) United Kingdom ................................................. 160,869 10,603 63,092 4,158 7,503 1,937 4,614 4,965 688 5,672 12,571 11,991 11,805 20,395 15,252 15,160 Other ................................................................. 30,582 (D) 4,985 373 (D) 907 (D) 147 101 646 (D) (D) 148 (D) 438 (D)
Latin America and Other Western Hemisphere 169,204 29,925 72,129 9,992 15,763 2,083 4,094 2,408 1,889 13,338 17,767 12,467 7,713 7,197 5,336 16,670 South America................................................... 96,918 22,562 47,432 6,778 11,852 1,223 2,898 (D) 1,071 6,801 6,367 2,630 5,855 2,933 3,411 5,727
Argentina ....................................................... 17,986 5,871 8,668 2,157 1,339 27 68 20 (*) 741 500 (D) 811 677 285 (D) Brazil ............................................................. 46,699 3,592 29,232 3,311 7,208 1,065 2,600 722 (D) 4,839 3,147 (D) 3,774 1,219 2,241 (D) Chile .............................................................. 10,493 (D) 1,645 (D) 583 6 139 21 0 (D) 433 (D) 527 61 467 1,167 Colombia ....................................................... 7,062 (D) 2,098 299 779 33 7 (D) (D) (D) 1,197 224 74 358 190 (D) Ecuador ......................................................... 958 186 481 44 159 1 (*) 5 0 (D) 157 (D) 13 –8 (D) 94 Peru ............................................................... 6,091 4,649 566 80 151 (D) (D) 9 (*) 0 271 7 99 (D) 76 (D) Venezuela...................................................... 6,074 272 4,212 618 1,577 (D) 62 105 0 (D) 400 42 (D) 339 124 (D) Other ............................................................. 1,555 158 531 (D) 56 (D) (D) 4 (*) (D) 263 (D) (D) (D) (D) 157
Central America................................................. 51,369 3,229 23,617 3,106 3,727 756 (D) 1,175 817 6,536 3,372 9,568 1,452 4,314 1,647 4,169 Costa Rica..................................................... 1,762 0 1,137 17 293 6 0 346 (D) 0 260 (D) 35 (D) 140 131 Honduras ....................................................... 770 0 411 74 26 0 0 (D) 0 (D) 96 (D) 4 6 0 (D) Mexico ........................................................... 46,195 3,209 21,232 2,880 3,262 745 (D) 794 732 (D) 2,535 (D) 1,386 4,042 1,477 (D) Panama ......................................................... 591 (D) 75 24 37 0 (*) 1 (*) 0 183 (D) 14 35 (D) 184 Other ............................................................. 2,050 (D) 762 112 109 5 (*) (D) (D) 0 298 (D) 13 (D) (D) 534
Other Western Hemisphere............................... 20,918 4,134 1,080 108 184 104 (D) (D) 0 1 8,027 269 406 –50 279 6,773 Barbados ....................................................... 3,032 6 (D) (D) (*) 0 0 0 0 0 2,153 7 8 249 (D) 602 Bermuda........................................................ 4,319 93 248 0 (D) 0 (D) (D) 0 1 2,495 0 80 –1,487 153 2,737 Dominican Republic ...................................... 1,168 0 546 (D) 142 1 (*) (*) 0 0 104 32 23 (D) (D) 428 United Kingdom Islands, Caribbean .............. 6,939 622 63 (D) (D) 0 0 (D) 0 0 (D) (D) 64 358 78 2,607 Other ............................................................. 5,460 3,414 (D) (D) 33 103 (D) 0 0 0 (D) (D) 231 (D) (D) 399
Africa .................................................................... 63,026 52,251 4,947 (D) 964 128 417 155 74 (D) 1,998 (D) 164 659 546 (D) Egypt ................................................................. 7,318 (D) 761 174 131 (D) 28 (D) (D) 0 498 (D) 4 (D) (D) 61 Nigeria ............................................................... 23,122 (D) 152 (*) 50 3 35 (D) 0 0 (D) 0 2 (D) (D) (D) South Africa....................................................... 6,534 89 2,596 303 657 85 268 79 (D) 424 1,190 (D) 145 293 404 (D) Other ................................................................. 26,052 23,665 1,438 (D) 127 (D) 86 25 (*) (D) (D) (D) 12 195 46 497
Middle East .......................................................... 35,961 17,208 8,048 (D) 815 84 1,182 2,057 30 (D) 6,708 23 618 584 1,936 836 Israel.................................................................. 7,431 (D) 3,790 6 178 (D) 994 1,965 (D) (D) 1,420 (D) 288 32 1,120 (D) Saudi Arabia ...................................................... 4,467 3,509 575 (D) 324 (D) 52 (D) 1 0 (D) 0 62 16 157 (D) United Arab Emirates ........................................ 13,761 6,561 (D) (D) 309 9 (D) (D) (D) 0 (D) (D) (D) 320 516 233 Other ................................................................. 10,301 (D) (D) (D) 4 (D) (D) (*) 0 0 22 0 (D) 216 143 123
Asia and Pacific ................................................... 333,866 52,348 131,211 7,220 29,743 3,518 9,333 29,519 3,128 8,945 43,063 (D) 11,903 25,386 30,244 (D) Australia............................................................. 57,942 14,120 17,322 3,292 2,216 1,950 1,110 1,079 346 1,760 6,993 399 3,222 5,841 5,480 4,563 China ................................................................. 45,420 3,571 26,438 1,379 6,848 1,037 2,798 7,497 1,156 2,437 5,419 1,149 1,183 297 3,298 4,065 Hong Kong......................................................... 15,548 0 2,847 (D) 343 60 201 822 228 (D) 4,465 231 462 3,406 1,954 2,183 India................................................................... 19,864 163 4,978 299 1,214 63 889 635 119 527 1,450 56 1,904 1,655 8,889 769 Indonesia........................................................... 18,364 11,932 5,611 (D) (D) (*) 43 56 (D) (D) 188 (D) 21 611 –5 (D) Japan................................................................. 59,451 8 26,266 188 7,472 43 1,975 2,090 604 770 11,311 3,371 2,834 5,992 6,961 2,707 Korea, Republic of ............................................. 13,477 (D) 7,626 146 939 92 720 1,696 4 2,178 1,614 605 255 1,547 907 (D) Malaysia ............................................................ 13,289 5,185 5,979 169 582 29 259 4,157 (D) 162 826 121 83 444 325 327 New Zealand ..................................................... 3,309 45 918 271 189 (D) 39 71 13 (D) 954 (D) 32 417 321 (D) Philippines ......................................................... 5,491 (D) 2,434 229 503 4 8 1,133 78 31 243 (D) 209 271 391 1,212 Singapore .......................................................... 36,844 425 18,816 279 7,438 100 918 6,735 282 684 6,635 33 1,251 3,834 834 5,017 Taiwan ............................................................... 7,591 (*) 4,432 165 832 (D) 140 1,533 57 98 1,057 242 402 718 380 361 Thailand............................................................. 13,781 (D) 6,725 404 770 13 224 1,924 (D) 216 1,416 147 22 248 360 (D) Other ................................................................. 23,496 (D) 820 (D) (D) (D) 9 91 (*) (D) 491 (D) 23 106 149 (D)
Addenda: European Union (27) 1 ...................................... 583,177 19,845 309,914 13,113 61,374 10,594 22,895 57,320 5,864 29,537 66,829 21,666 35,092 32,209 38,838 58,783 OPEC 2.............................................................. 67,770 49,288 9,040 808 2,423 81 333 235 (D) 925 5,992 59 746 814 965 867
* Less than $500,000 (+/–). Portugal, Romania, Slovakia, Slovenia, Spain, Sweden, and the United Kingdom. D Suppressed to avoid disclosure of data on individual companies. 2. OPEC is the Organization of Petroleum Exporting Countries. In 2011, its members were Algeria, Angola, Ecuador, 1. The European Union (27) comprises Austria, Belgium, Bulgaria, Cyprus, Czech Republic, Denmark, Estonia, Iran, Iraq, Kuwait, Libya, Nigeria, Qatar, Saudi Arabia, the United Arab Emirates, and Venezuela.
Finland, France, Germany, Greece, Hungary, Ireland, Italy, Latvia, Lithuania, Luxembourg, Malta, the Netherlands, Poland,