Embed Size (px)
Citation preview
P a g e | 1
Program for the International Assessment of Adult Competencies (PIAAC) International Data Explorer
Help Guide
Contents I. Background on the Program for the International Assessment of Adult
Competencies (PIAAC) and the PIAAC International Data Explorer (IDE) ............................. 3
II. Computer Requirements for the IDE ......................................................................................... 5
III. General Overview and Steps to Explore Data .......................................................................... 6
1. Select Criteria .......................................................................................................................... 6
1.A. Overview.......................................................................................................................... 6
1.B. Choose Subject and Display ............................................................................................ 7
1.C. Choose Year/Study(s) ...................................................................................................... 8
1.D. Choose Measure(s) .......................................................................................................... 8
1.E. Choose Jurisdiction(s) ...................................................................................................... 9
2. Select Variables ..................................................................................................................... 10
2.A. Overview........................................................................................................................ 10
2.B. Search Using Category and Sub Category Lists ............................................................ 11
2.C. Search Function ............................................................................................................. 13
3. Edit Reports ........................................................................................................................... 14
3.A. Overview........................................................................................................................ 14
3.B. Preview Report............................................................................................................... 15
3.D. Create New Variables .................................................................................................... 16
3.E. Create New Report ......................................................................................................... 18
3.F. Format Options ............................................................................................................... 20
3.C. Edit Report..................................................................................................................... 15
P a g e | 2
3.G. Statistics Options ........................................................................................................... 21
3.H. Select Reports to Build .................................................................................................. 25
4. Build Reports......................................................................................................................... 26
4.A. Overview........................................................................................................................ 26
4.B. View Reports as Data Tables ......................................................................................... 27
4.C. Charts ............................................................................................................................. 27
4.D. Create Charts – Data Options ........................................................................................ 28
4.E. Create Charts – Chart Options ....................................................................................... 28
4.F. Significance Tests........................................................................................................... 33
4.G. Gap Analysis .................................................................................................................. 36
4.H. Regression Analysis....................................................................................................... 38
4.I. Export Reports................................................................................................................. 41
IV. PIAAC International Data Explorer Definitions........................................................................... 43
1. Criteria ................................................................................................................................... 43
2. Variables................................................................................................................................ 46
3. Statistics Options ................................................................................................................... 47
4. Cross-tabulations ................................................................................................................... 53
5. Statistical Notations and Other Notes ................................................................................... 54
P a g e | 3
PIAAC International Data Explorer Help Guide
I. Background on the Program for the International Assessment ofAdult Competencies (PIAAC) and the PIAAC International DataExplorer (IDE)
The Program for the International Assessment of Adult Competencies (PIAAC) International Data Explorer (IDE) is a web-based application for accessing data from PIAAC, supported by the U.S. National Center for Education Statistics (NCES) and the Organization for Economic Cooperation and Development (OECD). The PIAAC IDE is available on both the NCES and OECD websites, however only the NCES PIAAC IDE includes the U.S. National Supplement adult sample population variables and all variables following national routing for analysis. Meanwhile, for other countries, NCES PIAAC IDE disseminates data contained in their public-use files, resulting in some variables being available for all countries in OECD PIAAC IDE, but not available in NCES PIAAC IDE (such as [EARNHR] 'Averages for hourly earnings excluding bonuses for wage and salary earners (derived)'); or some variables available for all countries in OECD PIAAC IDE, but not available for certain countries in NCES PIAAC IDE (such as [BQ02B] 'Education – Current qualification – Level' for Canada and Estonia).
PIAAC is a household study that has been developed under the auspices of the OECD. PIAAC was first administered in 2011-12 in the United States and 23 other countries. The goal of PIAAC is to assess and compare the basic skills and the broad range of competencies of adults around the world. The assessment focuses on cognitive and workplace skills needed for successful participation in 21st-century society and the global economy. Specifically, PIAAC measures relationships between individuals' educational background, workplace experiences and skills, occupational attainment, use of information and communications technology, and cognitive skills in the areas of literacy, numeracy, and problem solving in technology-rich environments (TRE).
PIAAC is a complex assessment. The data collection is conducted in multiple languages and in numerous countries with diverse populations, cultures, education and life experiences. All participating countries follow the quality assurance guidelines set by the OECD consortium, and closely follow all the agreed-upon standards set for survey design, implementation of the assessment, and the reporting of results.
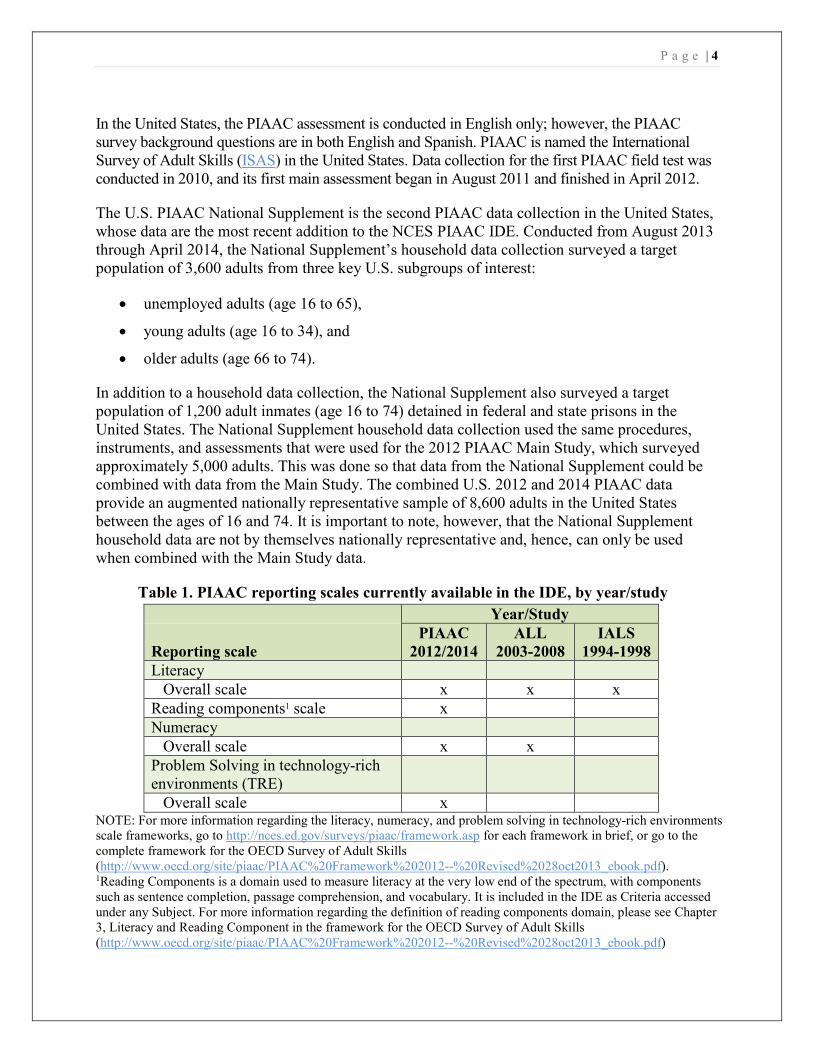
PIAAC builds on knowledge and experiences gained from previous international adult assessments - the International Adult Literacy Survey (IALS) and the Adult Literacy and Lifeskills Survey (ALL). PIAAC enhances and expands on these previous assessments' frameworks and, at the same time, improves upon their design and methodologies. Trends in literacy have been established between the three surveys and trends in numeracy have been established between PIAAC and ALL. Data from all three surveys are available in the PIAAC IDE (see Table 1).
P a g e | 4
In the United States, the PIAAC assessment is conducted in English only; however, the PIAAC survey background questions are in both English and Spanish. PIAAC is named the International Survey of Adult Skills (ISAS) in the United States. Data collection for the first PIAAC field test was conducted in 2010, and its first main assessment began in August 2011 and finished in April 2012.
The U.S. PIAAC National Supplement is the second PIAAC data collection in the United States, whose data are the most recent addition to the NCES PIAAC IDE. Conducted from August 2013 through April 2014, the National Supplement’s household data collection surveyed a target population of 3,600 adults from three key U.S. subgroups of interest:
• unemployed adults (age 16 to 65),
• young adults (age 16 to 34), and
• older adults (age 66 to 74).
In addition to a household data collection, the National Supplement also surveyed a target population of 1,200 adult inmates (age 16 to 74) detained in federal and state prisons in the United States. The National Supplement household data collection used the same procedures, instruments, and assessments that were used for the 2012 PIAAC Main Study, which surveyed approximately 5,000 adults. This was done so that data from the National Supplement could be combined with data from the Main Study. The combined U.S. 2012 and 2014 PIAAC data provide an augmented nationally representative sample of 8,600 adults in the United States between the ages of 16 and 74. It is important to note, however, that the National Supplement household data are not by themselves nationally representative and, hence, can only be used when combined with the Main Study data.
Table 1. PIAAC reporting scales currently available in the IDE, by year/study Year/Study
Reporting scalePIAAC
2012/2014ALL
2003-2008IALS
1994-1998Literacy
Overall scale x x x Reading components1 scale x Numeracy
Overall scale x x Problem Solving in technology-rich environments (TRE)
Overall scale x NOTE: For more information regarding the literacy, numeracy, and problem solving in technology-rich environments scale frameworks, go to http://nces.ed.gov/surveys/piaac/framework.asp for each framework in brief, or go to the complete framework for the OECD Survey of Adult Skills (http://www.oecd.org/site/piaac/PIAAC%20Framework%202012--%20Revised%2028oct2013_ebook.pdf). 1Reading Components is a domain used to measure literacy at the very low end of the spectrum, with components such as sentence completion, passage comprehension, and vocabulary. It is included in the IDE as Criteria accessed under any Subject. For more information regarding the definition of reading components domain, please see Chapter 3, Literacy and Reading Component in the framework for the OECD Survey of Adult Skills (http://www.oecd.org/site/piaac/PIAAC%20Framework%202012--%20Revised%2028oct2013_ebook.pdf)
P a g e | 5
II. Computer Requirements for the IDE
• Screen resolution should be 1024 x 768 pixels.
• Browsers: Internet Explorer (IE) version 7 or higher, Safari, Firefox, or Google Chrome. For rendering and scrolling pages with large tables, Firefox 2.0 is faster than IE7 (Firefox 3.0 or higher is recommended).
• Enable JavaScript and pop-ups in your browser.
• The IDE requires Flash version 9.0.115 or higher (download Adobe Flash Player at http://get.adobe.com/flashplayer/).
• Exports of files to Microsoft Office require Office 2003 or later.
• Screen reader software should be Jaws 8.0 or higher.
If you encounter an error, please send us the details through Contact Us (located in the upper-right portion of the screen on each page of the IDE website). When writing, include your browser version and operating system version, and as many other details as possible. Be sure to provide an e-mail address so that we can contact you.
Screenshots throughout this Help Guide were made using the Google Chrome browser. Other browsers may vary the way the IDE is displayed.
P a g e | 6
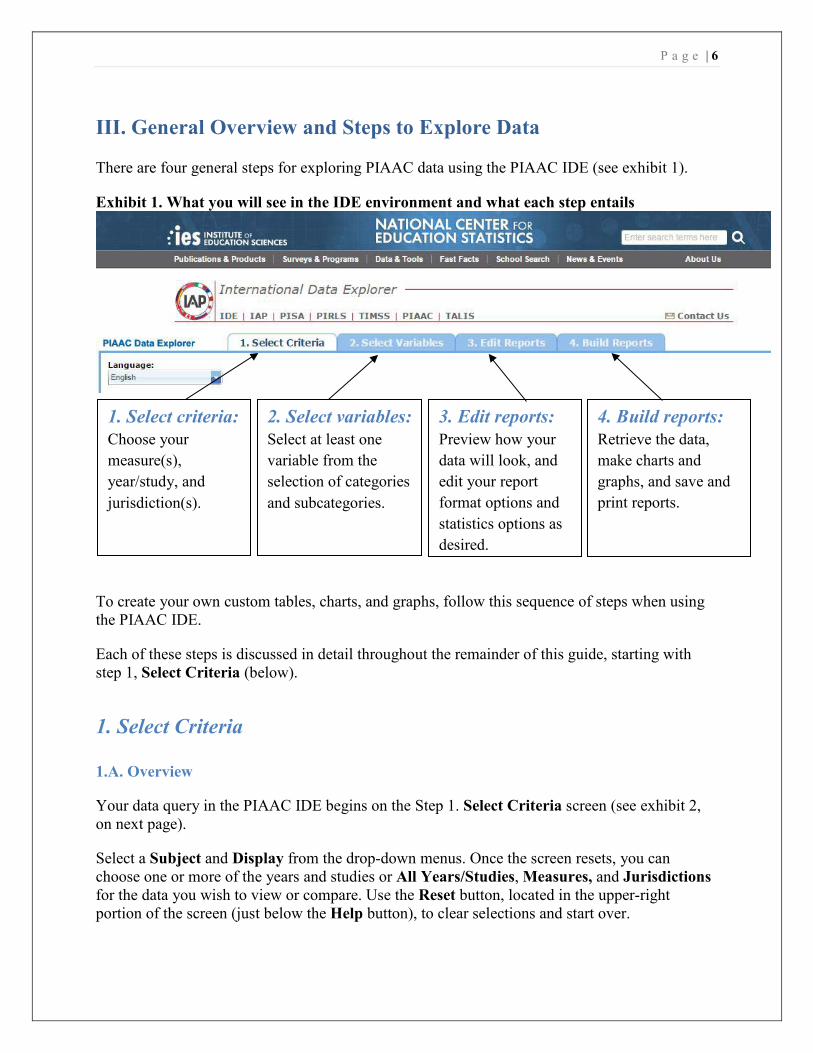
III. General Overview and Steps to Explore Data
There are four general steps for exploring PIAAC data using the PIAAC IDE (see exhibit 1).
Exhibit 1. What you will see in the IDE environment and what each step entails
1. Select criteria: Choose your measure(s), year/study, and jurisdiction(s).
3. Edit reports: Preview how your data will look, and edit your report format options and statistics options as desired.
2. Select variables: Select at least one variable from the selection of categories and subcategories.
4. Build reports: Retrieve the data, make charts and graphs, and save and print reports.
To create your own custom tables, charts, and graphs, follow this sequence of steps when using the PIAAC IDE.
Each of these steps is discussed in detail throughout the remainder of this guide, starting with step 1, Select Criteria (below).
1. Select Criteria
1.A. Overview
Your data query in the PIAAC IDE begins on the Step 1. Select Criteria screen (see exhibit 2, on next page).
Select a Subject and Display from the drop-down menus. Once the screen resets, you can choose one or more of the years and studies or All Years/Studies, Measures, and Jurisdictions for the data you wish to view or compare. Use the Reset button, located in the upper-right portion of the screen (just below the Help button), to clear selections and start over.
P a g e | 7
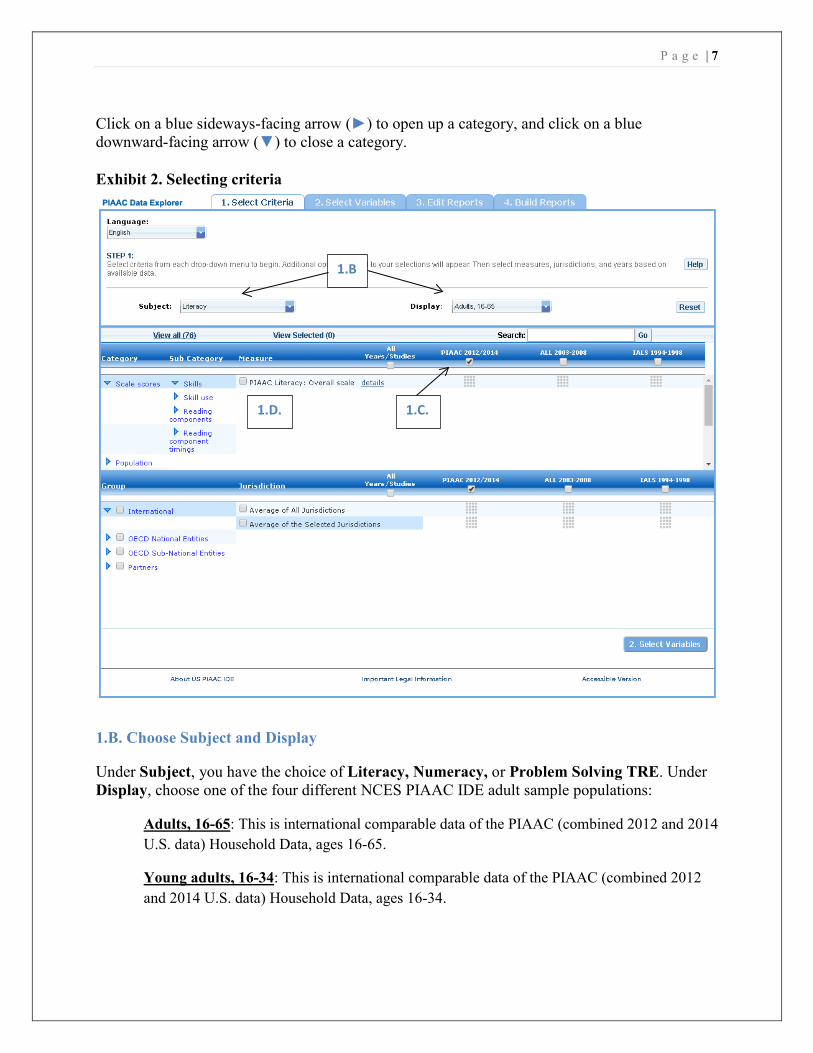
Click on a blue sideways-facing arrow (►) to open up a category, and click on a blue downward-facing arrow (▼) to close a category.
Exhibit 2. Selecting criteria
1.B
1.C. 1.D.
1.B. Choose Subject and Display
Under Subject, you have the choice of Literacy, Numeracy, or Problem Solving TRE. Under Display, choose one of the four different NCES PIAAC IDE adult sample populations:
Adults, 16-65: This is international comparable data of the PIAAC (combined 2012 and 2014 U.S. data) Household Data, ages 16-65.
Young adults, 16-34: This is international comparable data of the PIAAC (combined 2012 and 2014 U.S. data) Household Data, ages 16-34.
P a g e | 8
U.S. Adults, 16-74 (household and prison): This is U.S.-only comparable data of the PIAAC (combined 2012 and 2014 U.S. data) Household and Prison Data, ages 16-74.
Adults, 16-65 (2013 Release): This is international comparable data of the PIAAC (2012 U.S. data) Household Data, released in 2013, ages 16-65. This data should be used primarily to verify published results from the 2012 sample.
Once a subject and display are chosen, the screen resets and you can select one or more of the years and studies or All Years/Studies, Measure(s), and Jurisdiction(s).
1.C. Choose Year/Study(s)
In the same horizontal bar as the Measure and Jurisdiction sections, you have the choice of selecting PIAAC 2012/2014, ALL 2003-2008, and/or IALS 1994-1998 by checking the appropriate box. To include data from all studies, check the All Years/Studies box to the left of the individual year and study options.
If the Display chosen is Adults, 16-65, Young adults, 16-34, or Adults, 16-65 (2013 Release) - you can choose one or more years and studies between PIAAC 2012/2014, ALL 2003-2008, and IALS 1994-1998. Note that for the Adults, 16-65 (2013 Release), the data presented does not include the combined 2012/2014 sample, although the IDE label will display PIAAC 2012/2014. U.S. Adults, 16-74 (household and prison) data is only available for PIAAC 2012/2014.
1.D. Choose Measure(s)
After choosing a Subject, you can then choose a Measure within the Select Criteria tab. Note that the PIAAC overall scale is the default. You can browse for other reporting scales using the Category and Sub Category lists or by using the Search function.
There are a number of continuous variables other than scale scores that you may choose as a measure of analysis. These variables are generally continuous variables from the international and U.S. national background questionnaires (such as earnings or hours of work per week) and derived variables from PIAAC, ALL, and IALS. Derived variables from PIAAC include indices of literacy, numeracy, and computer use at work and at home and imputed years of formal education, among others. Analysis of the continuous variables in terms of the literacy, numeracy and problem solving TRE domains is not possible, unless a relevant categorized variable exists in the list of Variables. However, one can compute (for example, the average years of formal education for all adults) using the continuous variables in the list of Measures.
Percentage across full sample: The adults in the sample population that did not answer the assessment will be displayed along with those that did answer the assessment if you select the Percentage across full sample measure under the Population category and Population subcategory.
Reading components: There is a separate reporting scale, not included in the Subject selection, for the Reading Components domain of the PIAAC survey. The Reading
P a g e | 9
Components domain is used to measure literacy at the very low end of the spectrum, with components such as sentence completion, passage comprehension, and vocabulary. This domain was given to respondents who decided not to take the computer-based assessment or who did not pass a set of core information and computer technology tasks and failed a set of core literacy/numeracy tasks.
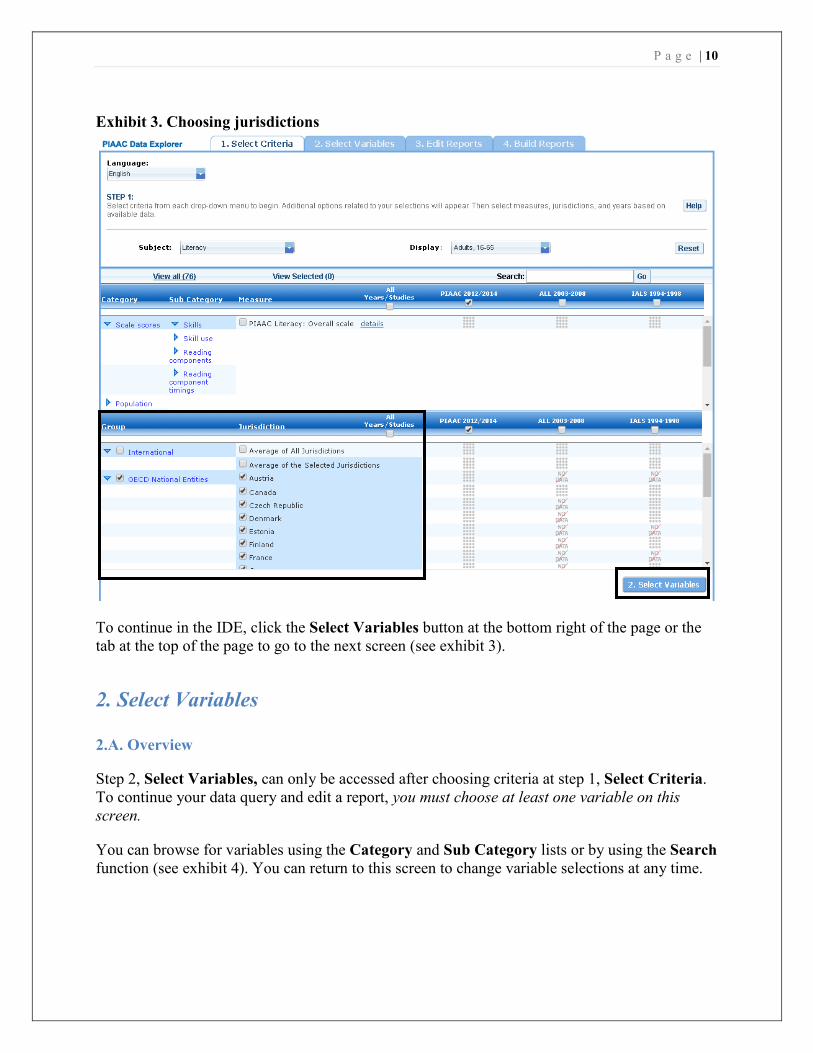
1.E. Choose Jurisdiction(s)
With your Measure(s), one or more of the years and studies or All Years/Studies selected, next choose at least one Jurisdiction.
Jurisdictions are found under OECD National Entities, OECD Sub-National Entities and Partners. The Partners category is only for the subjects Literacy and Numeracy.
There is also a group category called International, with options to display the Average of All Jurisdictions and the Average of the Selected Jurisdictions. Please note that selecting Average of All Jurisdictions or Average of the Selected Jurisdictions increases the frequency of receiving an error message in the Build Reports step due to the high volume of information contained in these groups.
The general procedures for selecting one or more jurisdictions are as follows:
1. To open groups of jurisdictions, click on the arrow (►). Jurisdictions in the group are open and can be selected when the blue arrow points down (▼) (see exhibit 3).
2. Click the checkboxes next to the specific jurisdictions that you are interested in, or uncheck those jurisdictions that you wish to deselect. If you click the checkbox next to the group name (e.g., "OECD National Entities”), you will select all the jurisdictions within that group. If desired, uncheck the group name to deselect all.
3. If you want to close a group (for example, close the list of OECD National Entities jurisdictions in order to readily see the OECD Sub-National Entities jurisdictions), click the blue arrow pointing down (▼) next to the group name. The closed group’s arrow will now point to the right (►). Be advised that closing the group will not deselect your choices.
NOTE: Data in the PIAAC IDE from the U.S. PIAAC National Supplement household and prison adult samples is only available for the United States in the Jurisdiction menu. However, users may choose to work with the U.S. prison sample, or the U.S. household sample, or select both for analysis as jurisdictions.
P a g e | 10
Exhibit 3. Choosing jurisdictions
To continue in the IDE, click the Select Variables button at the bottom right of the page or the tab at the top of the page to go to the next screen (see exhibit 3).
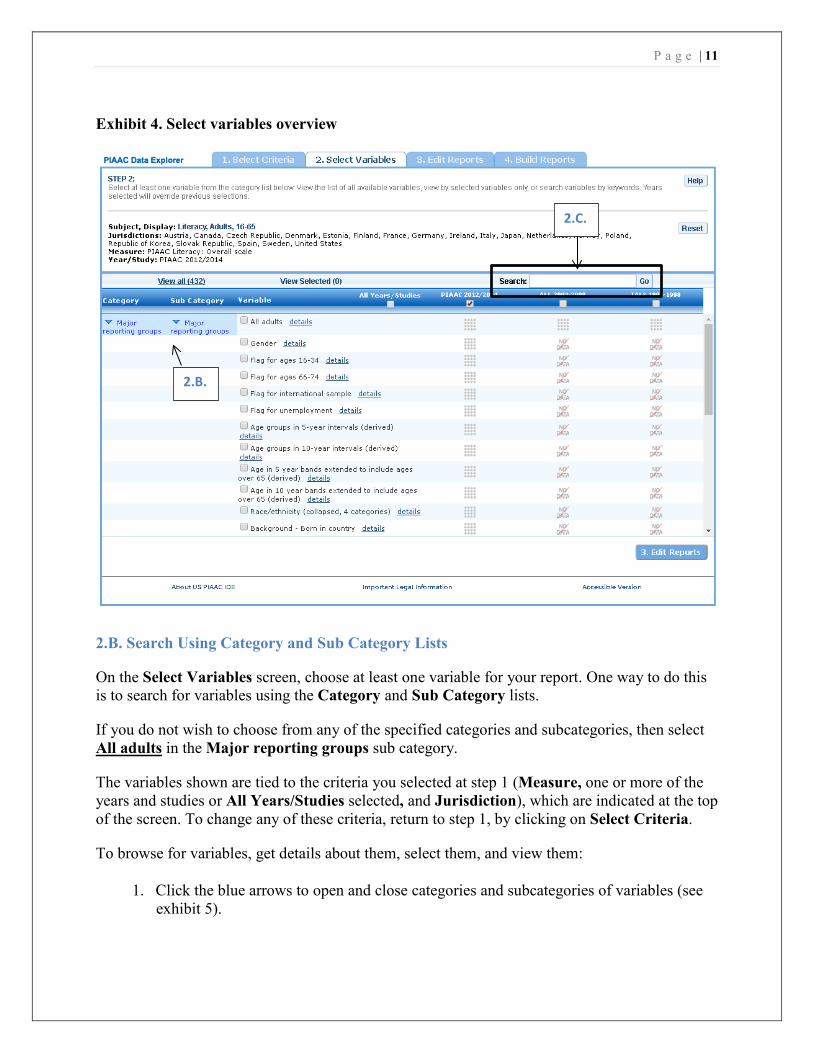
2. Select Variables
2.A. Overview
Step 2, Select Variables, can only be accessed after choosing criteria at step 1, Select Criteria. To continue your data query and edit a report, you must choose at least one variable on this screen.
You can browse for variables using the Category and Sub Category lists or by using the Search function (see exhibit 4). You can return to this screen to change variable selections at any time.
P a g e | 11
Exhibit 4. Select variables overview
2.B.
2.C.
2.B. Search Using Category and Sub Category Lists
On the Select Variables screen, choose at least one variable for your report. One way to do this is to search for variables using the Category and Sub Category lists.
If you do not wish to choose from any of the specified categories and subcategories, then select All adults in the Major reporting groups sub category.
The variables shown are tied to the criteria you selected at step 1 (Measure, one or more of the years and studies or All Years/Studies selected, and Jurisdiction), which are indicated at the top of the screen. To change any of these criteria, return to step 1, by clicking on Select Criteria.
To browse for variables, get details about them, select them, and view them:
1. Click the blue arrows to open and close categories and subcategories of variables (see exhibit 5).
P a g e | 12
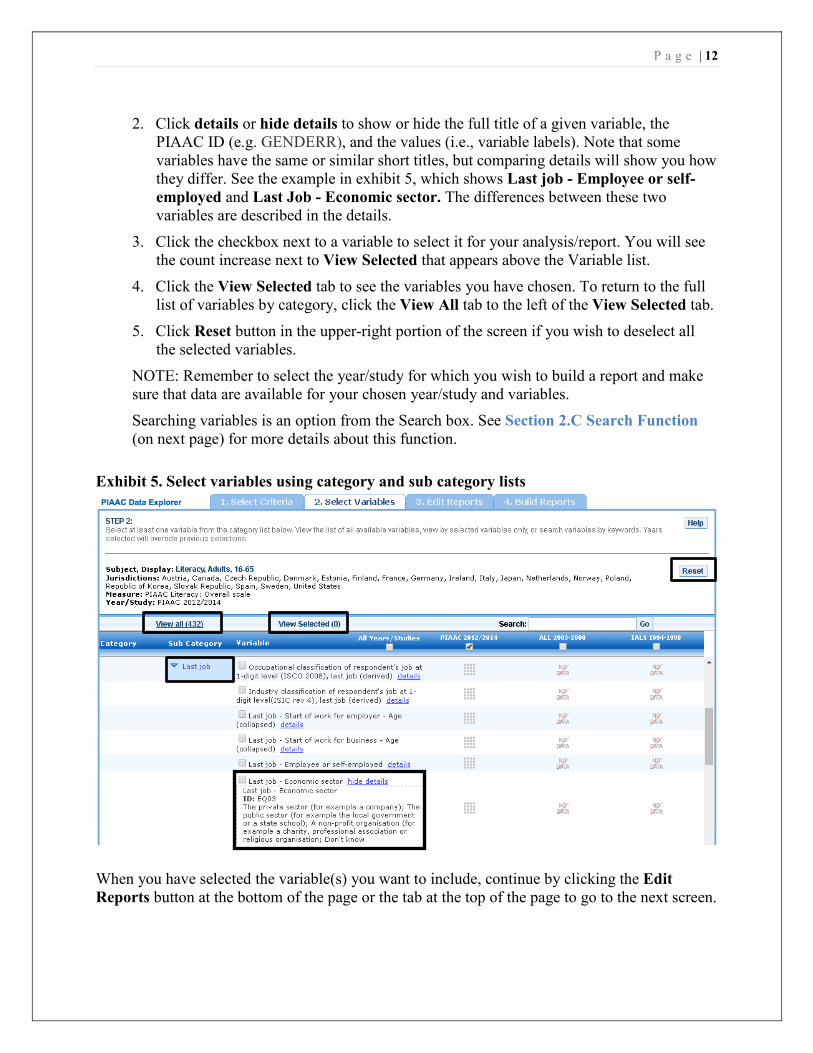
2. Click details or hide details to show or hide the full title of a given variable, the PIAAC ID (e.g. GENDERR), and the values (i.e., variable labels). Note that some variables have the same or similar short titles, but comparing details will show you how they differ. See the example in exhibit 5, which shows Last job - Employee or self-employed and Last Job - Economic sector. The differences between these two variables are described in the details.
3. Click the checkbox next to a variable to select it for your analysis/report. You will see the count increase next to View Selected that appears above the Variable list.
4. Click the View Selected tab to see the variables you have chosen. To return to the full list of variables by category, click the View All tab to the left of the View Selected tab.
5. Click Reset button in the upper-right portion of the screen if you wish to deselect all the selected variables.
NOTE: Remember to select the year/study for which you wish to build a report and make sure that data are available for your chosen year/study and variables.
Searching variables is an option from the Search box. See Section 2.C Search Function (on next page) for more details about this function.
Exhibit 5. Select variables using category and sub category lists
When you have selected the variable(s) you want to include, continue by clicking the Edit Reports button at the bottom of the page or the tab at the top of the page to go to the next screen.
P a g e | 13
2.C. Search Function
The second way to search for variables is to use the Search function on the Select Variables screen.
Type a term in the Search box and click Go (or hit “Enter” on your keyboard) to find variables by keywords in the question and/or details for the variable (see exhibit 6). The search function operates on whole words or on an exact phrase (if it is contained in quotes). To search for less than a whole word or exact phrase, include an asterisk (*) after the search term. If you use multiple keywords, “and” is assumed. You can narrow your search by using “or,” “not,” or “and not.”
Exhibit 6. Select variables using the search function
When you have selected the variable(s) you want to include, continue by clicking the Edit Reports button at the bottom of the page or the tab at the top of the page to go to the next screen.
P a g e | 14
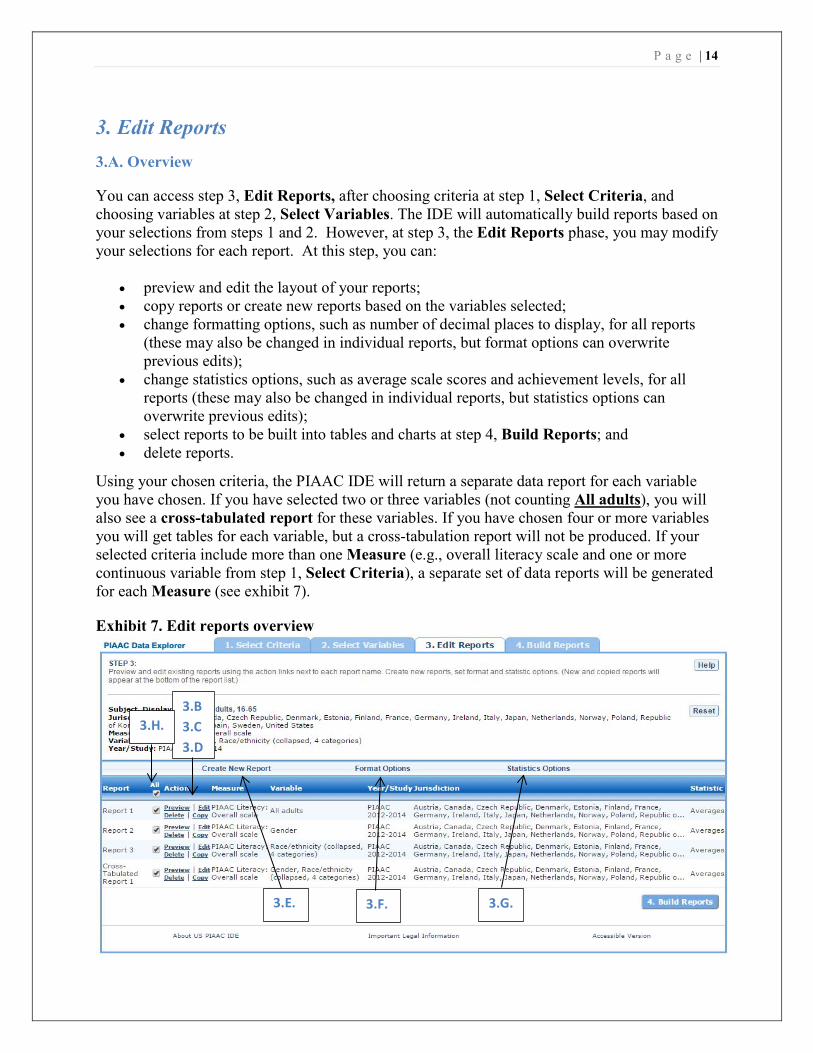
3. Edit Reports 3.A. Overview
You can access step 3, Edit Reports, after choosing criteria at step 1, Select Criteria, and choosing variables at step 2, Select Variables. The IDE will automatically build reports based on your selections from steps 1 and 2. However, at step 3, the Edit Reports phase, you may modify your selections for each report. At this step, you can:
• preview and edit the layout of your reports; • copy reports or create new reports based on the variables selected; • change formatting options, such as number of decimal places to display, for all reports
(these may also be changed in individual reports, but format options can overwrite previous edits);
• change statistics options, such as average scale scores and achievement levels, for all reports (these may also be changed in individual reports, but statistics options can overwrite previous edits);
• select reports to be built into tables and charts at step 4, Build Reports; and • delete reports.
Using your chosen criteria, the PIAAC IDE will return a separate data report for each variable you have chosen. If you have selected two or three variables (not counting All adults), you will also see a cross-tabulated report for these variables. If you have chosen four or more variables you will get tables for each variable, but a cross-tabulation report will not be produced. If your selected criteria include more than one Measure (e.g., overall literacy scale and one or more continuous variable from step 1, Select Criteria), a separate set of data reports will be generated for each Measure (see exhibit 7).
Exhibit 7. Edit reports overview
3.B 3.C 3.D
3.E. 3.F. 3.G.
3.H.
P a g e | 15
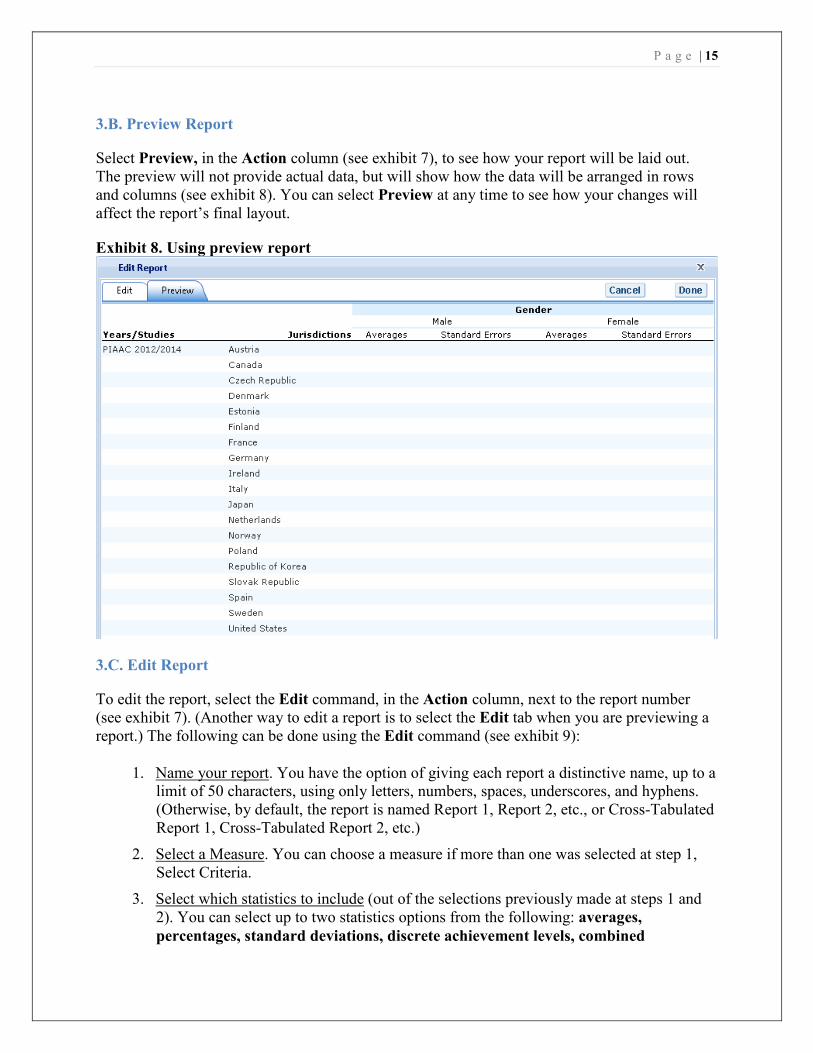
3.B. Preview Report
Select Preview, in the Action column (see exhibit 7), to see how your report will be laid out. The preview will not provide actual data, but will show how the data will be arranged in rows and columns (see exhibit 8). You can select Preview at any time to see how your changes will affect the report’s final layout.
Exhibit 8. Using preview report
3.C. Edit Report
To edit the report, select the Edit command, in the Action column, next to the report number (see exhibit 7). (Another way to edit a report is to select the Edit tab when you are previewing a report.) The following can be done using the Edit command (see exhibit 9):
1. Name your report. You have the option of giving each report a distinctive name, up to a limit of 50 characters, using only letters, numbers, spaces, underscores, and hyphens. (Otherwise, by default, the report is named Report 1, Report 2, etc., or Cross-Tabulated Report 1, Cross-Tabulated Report 2, etc.)
2. Select a Measure. You can choose a measure if more than one was selected at step 1, Select Criteria.
3. Select which statistics to include (out of the selections previously made at steps 1 and 2). You can select up to two statistics options from the following: averages, percentages, standard deviations, discrete achievement levels, combined
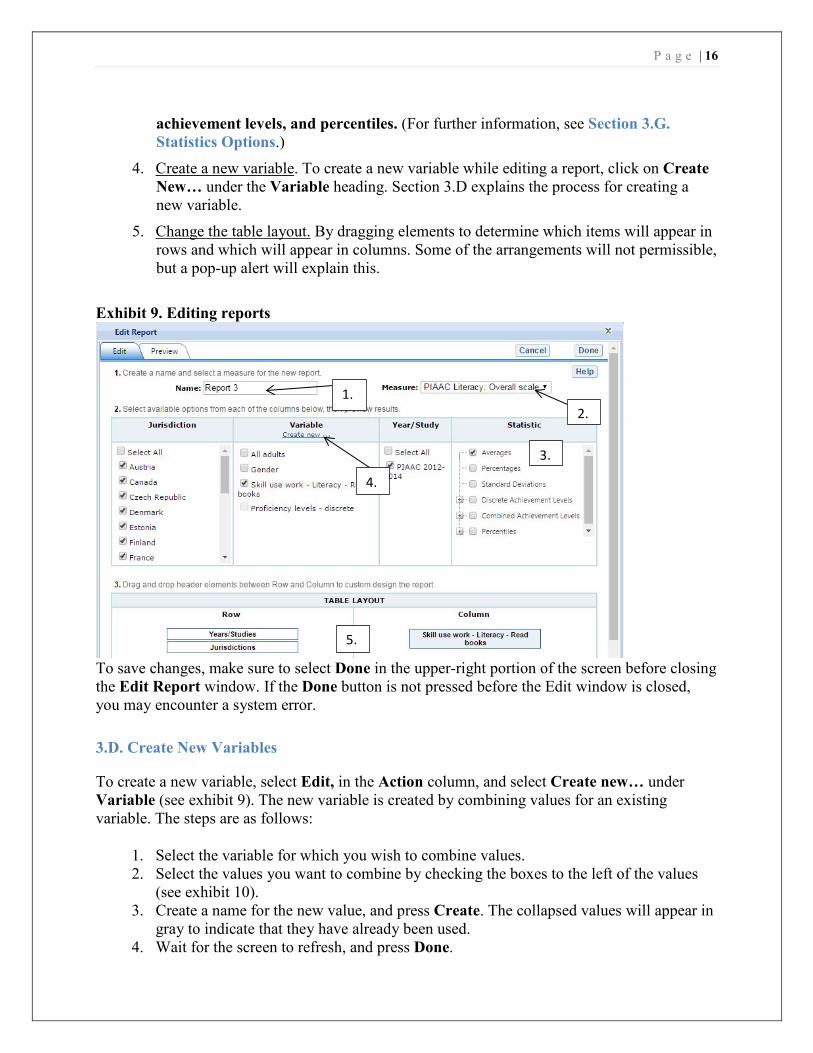
P a g e | 16
achievement levels, and percentiles. (For further information, see Section 3.G. Statistics Options.)
4. Create a new variable. To create a new variable while editing a report, click on Create New… under the Variable heading. Section 3.D explains the process for creating a new variable.
5. Change the table layout. By dragging elements to determine which items will appear in rows and which will appear in columns. Some of the arrangements will not permissible, but a pop-up alert will explain this.
Exhibit 9. Editing reports
1. 2.
4.
3.
5.
To save changes, make sure to select Done in the upper-right portion of the screen before closing the Edit Report window. If the Done button is not pressed before the Edit window is closed, you may encounter a system error.
3.D. Create New Variables
To create a new variable, select Edit, in the Action column, and select Create new… under Variable (see exhibit 9). The new variable is created by combining values for an existing variable. The steps are as follows:
1. Select the variable for which you wish to combine values. 2. Select the values you want to combine by checking the boxes to the left of the values
(see exhibit 10). 3. Create a name for the new value, and press Create. The collapsed values will appear in
gray to indicate that they have already been used. 4. Wait for the screen to refresh, and press Done.
P a g e | 17
Exhibit 10. Creating new variables
4.
5. The new variable will appear in the Variable list in the Edit Report window or Create New Report window, designated as “collapsed.”
6. Check the box next to the new variable to view it in the report. You can click Preview to see how the table will be laid out before retrieving data.
P a g e | 18
Exhibit 11. Edit reports with collapsed variables
5.
6.
A new variable that you create is applicable only to a specific report; it does not apply to the other reports listed on the Edit Reports screen. For example, if you selected multiple measures of literacy for analysis, then you would need to create the new variable for each measure, or create a copy of the report and edit it accordingly. To do the latter, click on Copy report on the Edit Reports screen (copied reports appear at the end of the list of reports) and then, for the new copy, click on Edit (using the above example, you can change the measure and give the report a new name). You cannot save the new variable for reference or future use.
You can repeat the process and combine different values of a variable to create additional new variables. Using the Create New Report function, you can create a new report for each new variable that you create. (For further information, see section 3.E. Create New Report on next page.)
If you selected two or three variables from which to create new variables, you can repeat the process for each of them. Using the Create New Report or Edit Report function, these collapsed variables will be listed and available for cross-tabulation (see exhibit 11). If you have chosen four or more variables (not counting All adults) you will not get the cross-tabulation. You can click Preview to see how the table will be laid out before retrieving data.
3.E. Create New Report
From the main Edit Reports screen, clicking on Create New Report brings up the same options as Edit Report, but with no checkboxes marked and without any new variables you may have created. Thus, Create New Report (see exhibit 12a and 12b) provides a clean slate for your selections from the first two steps, Select Criteria and Select Variables. Each new report you create will appear at the end of the list of reports. If you do not give the report a specific name, it will be called “New Report.” If you create a second new report, the system will attempt to save it
P a g e | 19
with the “New Report” name again; however, it will fail and will prompt you to enter a different name in the Name text box.
Exhibit 12a. Creating new reports
Exhibit 12b. Creating new reports

P a g e | 20
3.F. Format Options
From the main Edit Reports screen, clicking on Format Options will allow you to make formatting changes applicable to all the reports listed. The following formatting options are available using this function (see exhibit 13):
1. Variable Labels (Long) displays a more detailed description of the variables selected in a query than the default short label. For variables from the background questionnaire, the full text of the question is displayed. Be advised that the length of the extra detail may sometimes interfere with table formatting.
2. Show data for values categorized as “missing” will include the percentage of adults in the total sample or in a reporting group for whom membership in a particular response category is unknown because no response was given by the adults. The percentage of “missing” will be shown in the right-most table column. Missing data are available only for queries that involve percentages as the statistic type. Unless you check this option, the default is for missing responses not to be included in the percentage distribution shown.
3. Decimal Places allow you to specify a greater level of precision for a particular statistic (one or two decimal places) than does the default, which is whole numbers. Note that only integer-level precision is allowed for percentages; that is, the number of decimal places is fixed at “none” for percentages. Also, standard errors will be shown to one more decimal place than is shown for a particular statistic. For example, if you request that average scores be displayed to one decimal place, the corresponding standard errors will be displayed to two decimal places. If you export to Excel, you will be able to increase the number of decimal places in most cases.
4. Include gives you the option of showing standard errors. By default, standard errors are shown inside parentheses, but you have the option of choosing to show them without parentheses. You can preview the effects of your selection in the Sample Display area (see the blue-shaded box at the bottom of exhibit 13).
P a g e | 21
Exhibit 13. Format options
1.
2.
3.
5.
4.
Be advised that the choices you make in the Format Options window will apply to all reports and cannot be changed for individual reports. Use the Reset button, located in the upper-right portion of the main Edit Reports screen (just below the Help button), to restore the Format Options to the default settings (although caution is advised, as this will also delete any new reports that you have created).
3.G. Statistics Options
Available only from the main Edit Reports screen, clicking on Statistics Options allows you to designate up to two statistics (with the exception of the Combined achievement levels and Discrete achievement levels, that cannot be selected at the same time). The selections you make are applicable to all the reports listed, although you can also change the statistics for an individual report when you edit it. (For further information, see Section 3.C. Edit Report.)
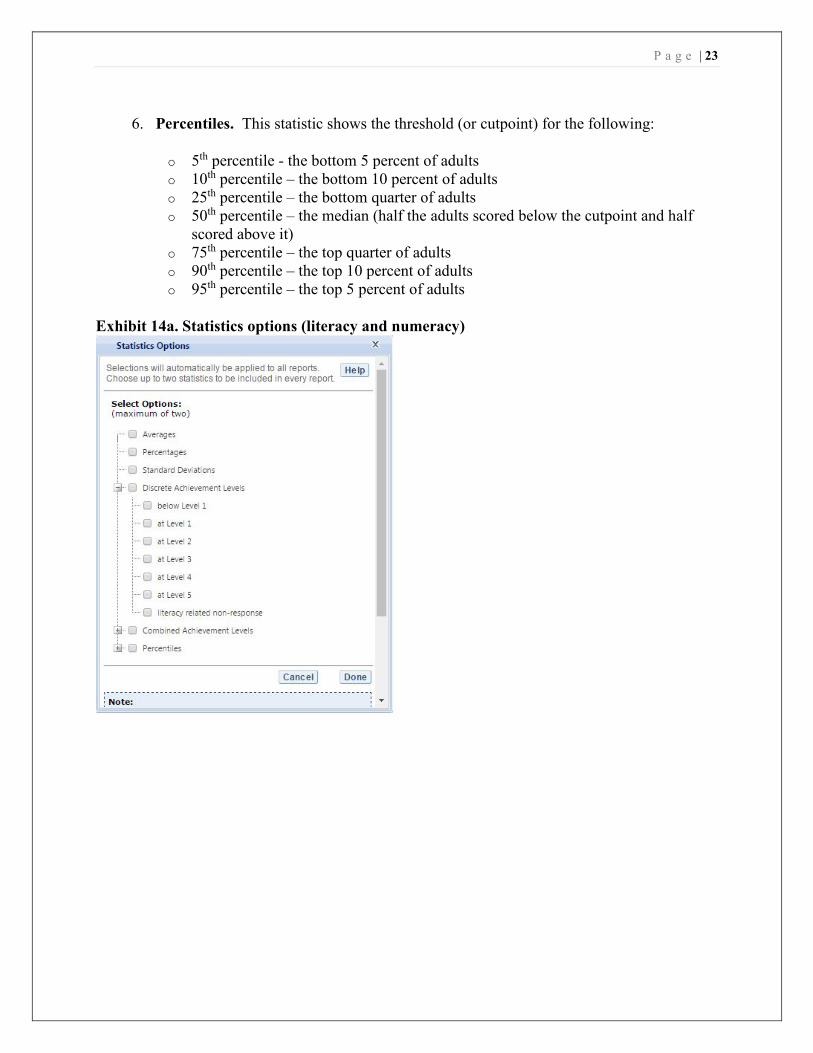
The following statistics options are available (see exhibits 14a and 14b):
1. Averages. For the PIAAC assessment, adult performance is reported on scales that range from 0 to 500. PIAAC reports the average scale score for a variety of demographic
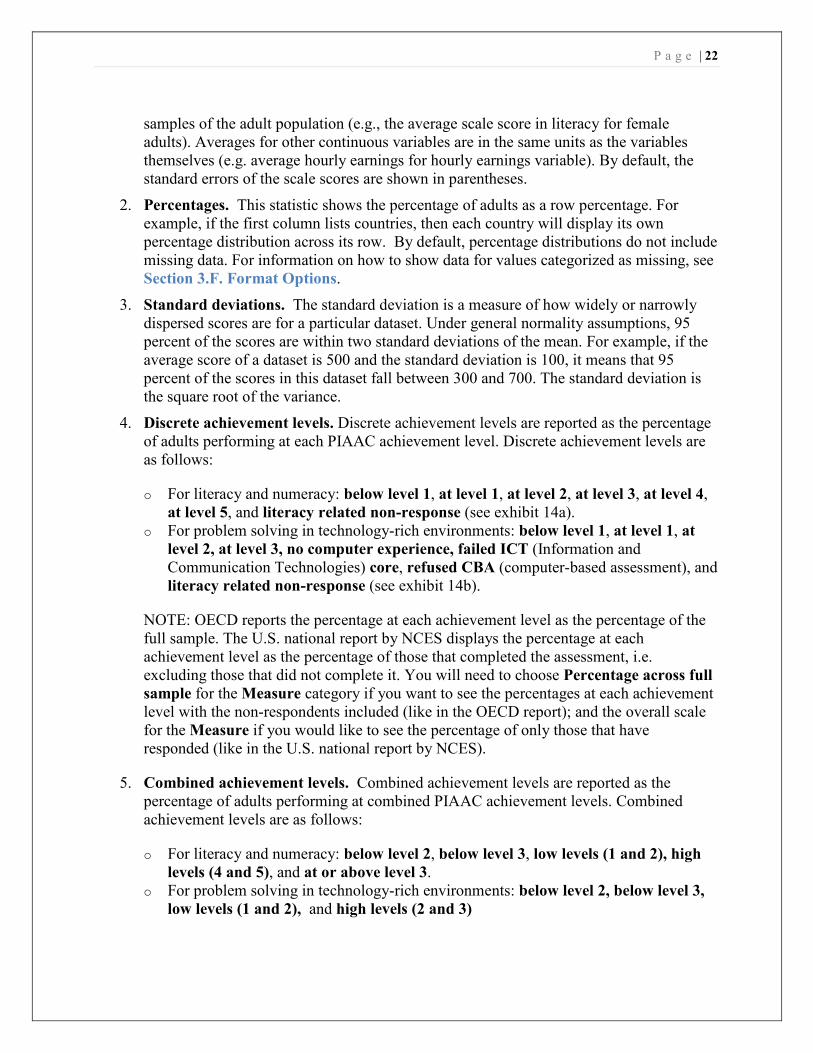
P a g e | 22
samples of the adult population (e.g., the average scale score in literacy for female adults). Averages for other continuous variables are in the same units as the variables themselves (e.g. average hourly earnings for hourly earnings variable). By default, the standard errors of the scale scores are shown in parentheses.
2. Percentages. This statistic shows the percentage of adults as a row percentage. For example, if the first column lists countries, then each country will display its own percentage distribution across its row. By default, percentage distributions do not include missing data. For information on how to show data for values categorized as missing, see Section 3.F. Format Options.
3. Standard deviations. The standard deviation is a measure of how widely or narrowly dispersed scores are for a particular dataset. Under general normality assumptions, 95 percent of the scores are within two standard deviations of the mean. For example, if the average score of a dataset is 500 and the standard deviation is 100, it means that 95 percent of the scores in this dataset fall between 300 and 700. The standard deviation is the square root of the variance.
4. Discrete achievement levels. Discrete achievement levels are reported as the percentage of adults performing at each PIAAC achievement level. Discrete achievement levels are as follows:
o For literacy and numeracy: below level 1, at level 1, at level 2, at level 3, at level 4, at level 5, and literacy related non-response (see exhibit 14a).
o For problem solving in technology-rich environments: below level 1, at level 1, at level 2, at level 3, no computer experience, failed ICT (Information and Communication Technologies) core, refused CBA (computer-based assessment), and literacy related non-response (see exhibit 14b).
NOTE: OECD reports the percentage at each achievement level as the percentage of the full sample. The U.S. national report by NCES displays the percentage at each achievement level as the percentage of those that completed the assessment, i.e. excluding those that did not complete it. You will need to choose Percentage across full sample for the Measure category if you want to see the percentages at each achievement level with the non-respondents included (like in the OECD report); and the overall scale for the Measure if you would like to see the percentage of only those that have responded (like in the U.S. national report by NCES).
5. Combined achievement levels. Combined achievement levels are reported as the percentage of adults performing at combined PIAAC achievement levels. Combined achievement levels are as follows:
o For literacy and numeracy: below level 2, below level 3, low levels (1 and 2), high levels (4 and 5), and at or above level 3.
o For problem solving in technology-rich environments: below level 2, below level 3, low levels (1 and 2), and high levels (2 and 3)
P a g e | 23
6. Percentiles. This statistic shows the threshold (or cutpoint) for the following:
o 5th percentile - the bottom 5 percent of adults o 10th percentile – the bottom 10 percent of adults o 25th percentile – the bottom quarter of adults o 50th percentile – the median (half the adults scored below the cutpoint and half
scored above it) o 75th percentile – the top quarter of adults o 90th percentile – the top 10 percent of adults o 95th percentile – the top 5 percent of adults
Exhibit 14a. Statistics options (literacy and numeracy)
P a g e | 24
Exhibit 14b. Statistics options (problem solving in technology-rich environments)
As previously noted, the selections you make in Statistics Options will be applied automatically to all reports, although you can change the statistics for an individual report if you use the Edit command in the Action column. Be advised that if you use Statistics Options after editing the statistics in one or more of your individual reports, the statistics options selected will overwrite your previously edited selections. If you wish to use the same criteria and variables in a report with a different selection of statistics, consider using the Create New Report function to generate a new report with different statistics. (For further information, see Section 3.E. Create New Report.) You can also make a copy of an individual report.
You can use the Reset button, located in the upper-right portion of the main Edit Reports screen (just below the Help button), to restore the Statistics Options to the default setting, which is the average for all reports (this will also delete any new reports that you created).
Not all statistics are available for all reports. Their availability depends on other selections you have made to define the content and format of your report:
• Percentages will not display if jurisdictions or years appear in columns. • Achievement level results can only be displayed in rows. • Achievement level results are available only for the composite or overall scale.
NOTE: The statistics produced by the IDE may not match the statistics in reports published by the OECD or in the OECD PIAAC IDE, due to differences in certain statistical standards. In particular, NCES and the OECD may differ in the minimum sample sizes required for publishing
P a g e | 25
adult scores, as well as in the requirements for stability of estimates for results to be reportable. For more details on the differences in statistical standards, refer to the technical notes in the NCES First Look report1.
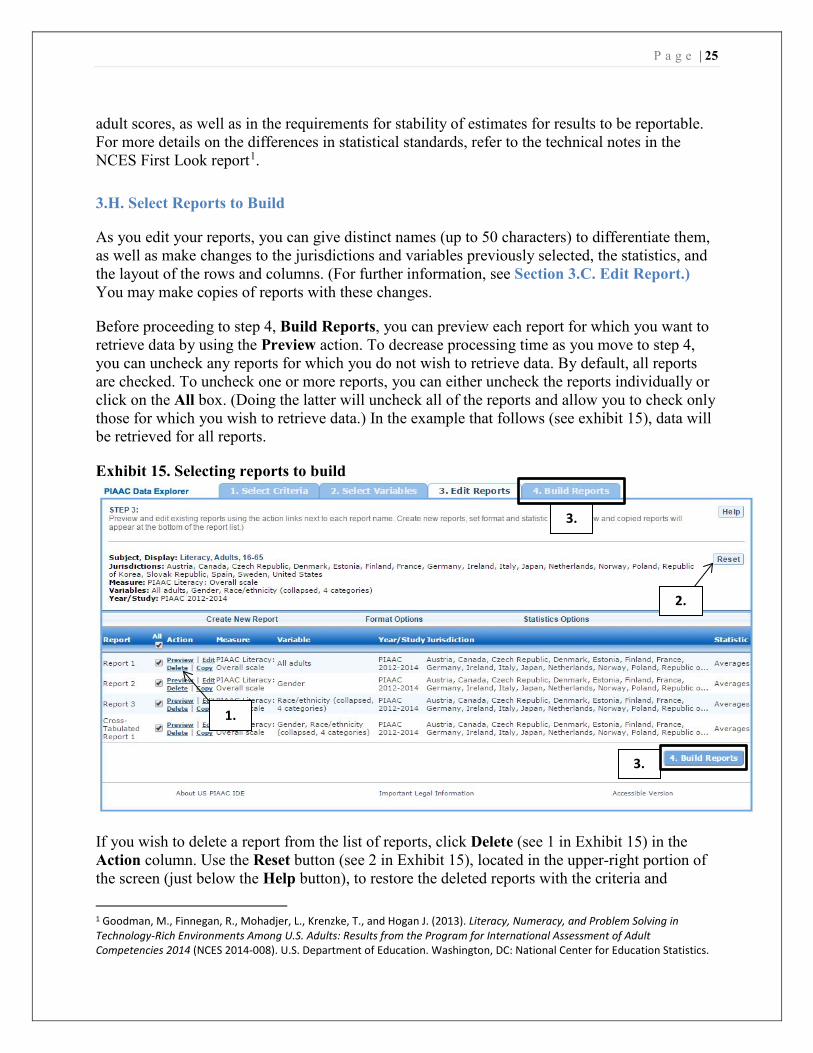
3.H. Select Reports to Build
As you edit your reports, you can give distinct names (up to 50 characters) to differentiate them, as well as make changes to the jurisdictions and variables previously selected, the statistics, and the layout of the rows and columns. (For further information, see Section 3.C. Edit Report.) You may make copies of reports with these changes.
Before proceeding to step 4, Build Reports, you can preview each report for which you want to retrieve data by using the Preview action. To decrease processing time as you move to step 4, you can uncheck any reports for which you do not wish to retrieve data. By default, all reports are checked. To uncheck one or more reports, you can either uncheck the reports individually or click on the All box. (Doing the latter will uncheck all of the reports and allow you to check only those for which you wish to retrieve data.) In the example that follows (see exhibit 15), data will be retrieved for all reports.
Exhibit 15. Selecting reports to build
1.
2.
3.
3.
If you wish to delete a report from the list of reports, click Delete (see 1 in Exhibit 15) in the Action column. Use the Reset button (see 2 in Exhibit 15), located in the upper-right portion of the screen (just below the Help button), to restore the deleted reports with the criteria and 1 Goodman, M., Finnegan, R., Mohadjer, L., Krenzke, T., and Hogan J. (2013). Literacy, Numeracy, and Problem Solving in Technology-Rich Environments Among U.S. Adults: Results from the Program for International Assessment of Adult Competencies 2014 (NCES 2014-008). U.S. Department of Education. Washington, DC: National Center for Education Statistics.
P a g e | 26
variables selected in the previous steps (although caution is advised, as this will not restore any new reports or variables that you created in the session and will delete any new reports and variables that you most recently created; the Reset action will also restore the Format Options and Statistics Options to the default settings).
To continue to the last step in the IDE, click the Build Reports button at the bottom of the page (see 3 in Exhibit 15) or the tab at the top of the page to go to the next screen.
4. Build Reports
4.A. Overview
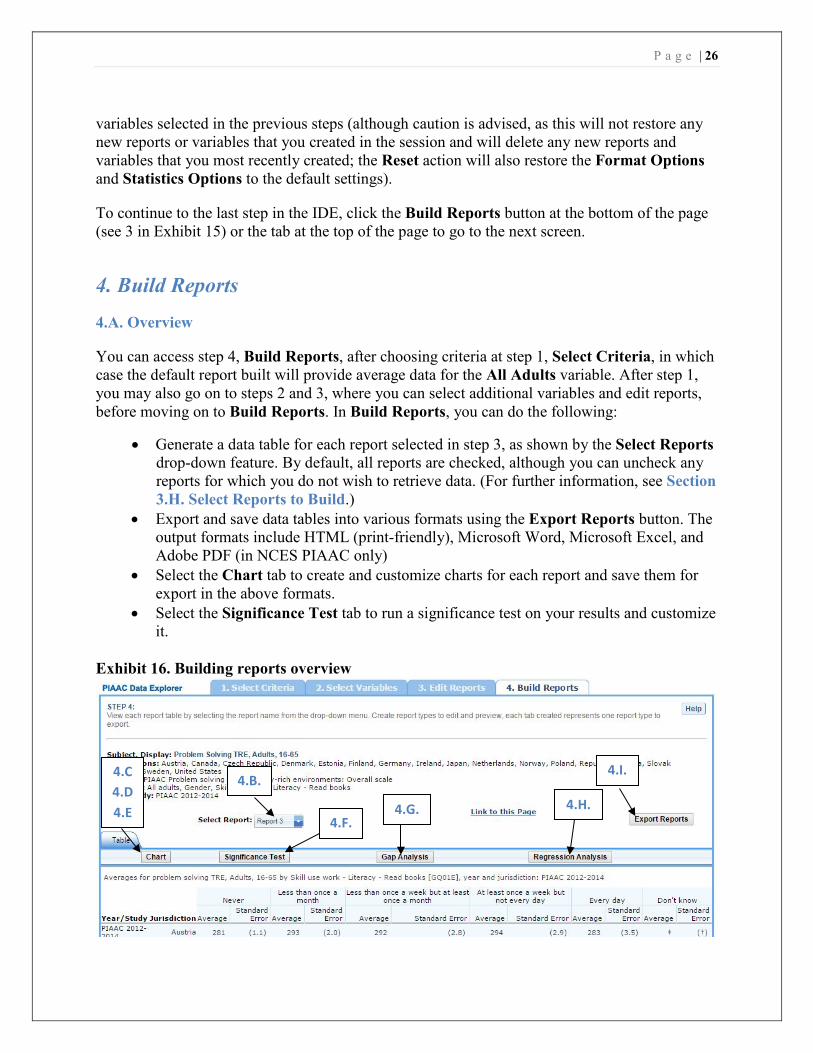
You can access step 4, Build Reports, after choosing criteria at step 1, Select Criteria, in which case the default report built will provide average data for the All Adults variable. After step 1, you may also go on to steps 2 and 3, where you can select additional variables and edit reports, before moving on to Build Reports. In Build Reports, you can do the following:
• Generate a data table for each report selected in step 3, as shown by the Select Reports drop-down feature. By default, all reports are checked, although you can uncheck any reports for which you do not wish to retrieve data. (For further information, see Section 3.H. Select Reports to Build.)
• Export and save data tables into various formats using the Export Reports button. The output formats include HTML (print-friendly), Microsoft Word, Microsoft Excel, and Adobe PDF (in NCES PIAAC only)
• Select the Chart tab to create and customize charts for each report and save them for export in the above formats.
• Select the Significance Test tab to run a significance test on your results and customize it.
Exhibit 16. Building reports overview
4.B. 4.I. 4.C
4.D 4.E
4.F. 4.G. 4.H.
P a g e | 27
4.B. View Reports as Data Tables
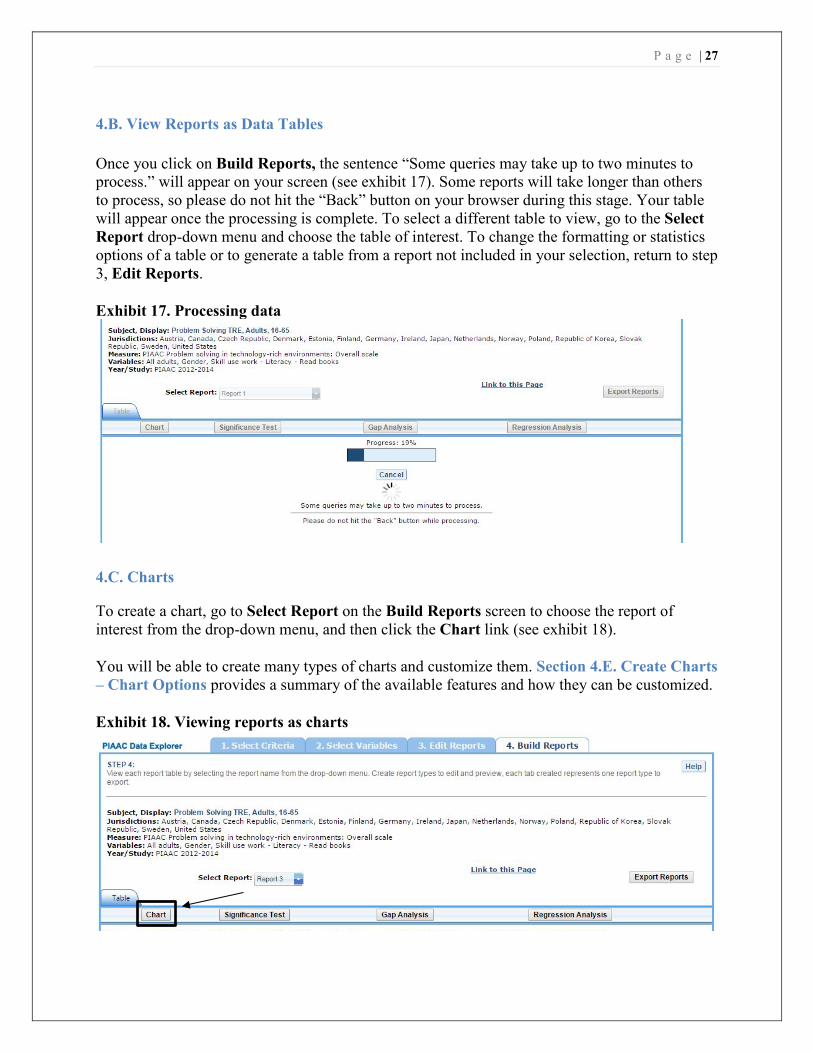
Once you click on Build Reports, the sentence “Some queries may take up to two minutes to process.” will appear on your screen (see exhibit 17). Some reports will take longer than others to process, so please do not hit the “Back” button on your browser during this stage. Your table will appear once the processing is complete. To select a different table to view, go to the Select Report drop-down menu and choose the table of interest. To change the formatting or statistics options of a table or to generate a table from a report not included in your selection, return to step 3, Edit Reports.
Exhibit 17. Processing data
4.C. Charts
To create a chart, go to Select Report on the Build Reports screen to choose the report of interest from the drop-down menu, and then click the Chart link (see exhibit 18).
You will be able to create many types of charts and customize them. Section 4.E. Create Charts – Chart Options provides a summary of the available features and how they can be customized.
Exhibit 18. Viewing reports as charts
P a g e | 28
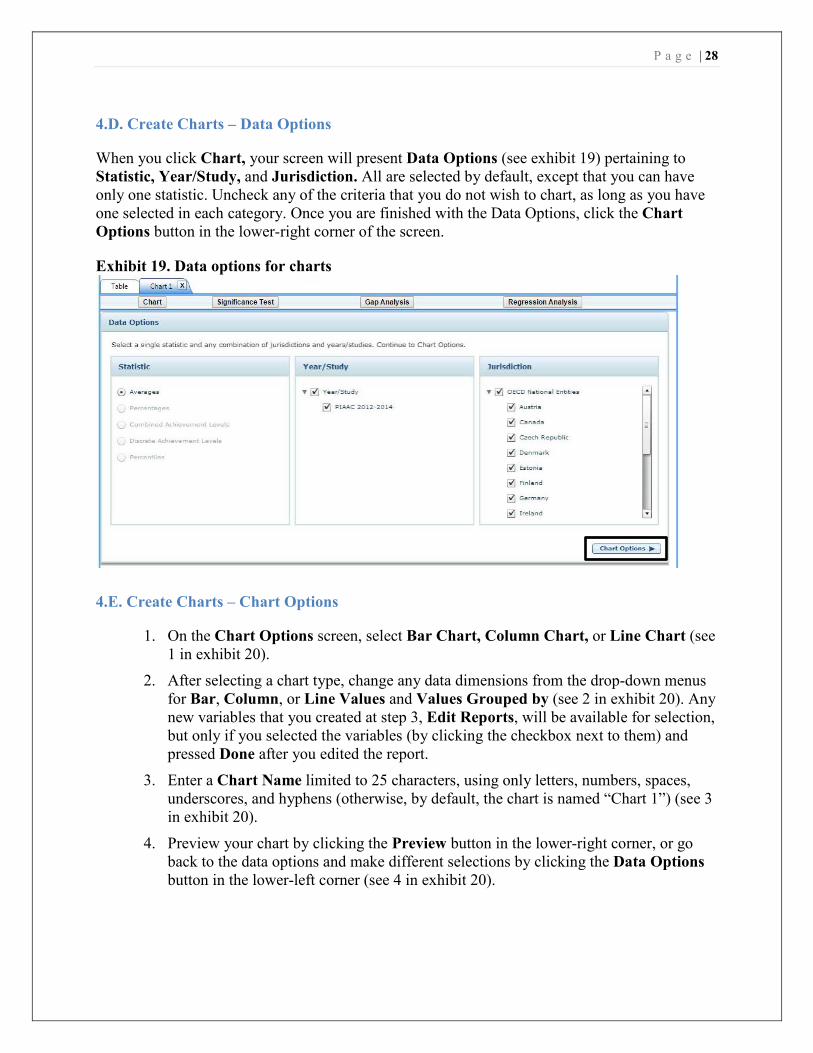
4.D. Create Charts – Data Options
When you click Chart, your screen will present Data Options (see exhibit 19) pertaining to Statistic, Year/Study, and Jurisdiction. All are selected by default, except that you can have only one statistic. Uncheck any of the criteria that you do not wish to chart, as long as you have one selected in each category. Once you are finished with the Data Options, click the Chart Options button in the lower-right corner of the screen.
Exhibit 19. Data options for charts
4.E. Create Charts – Chart Options
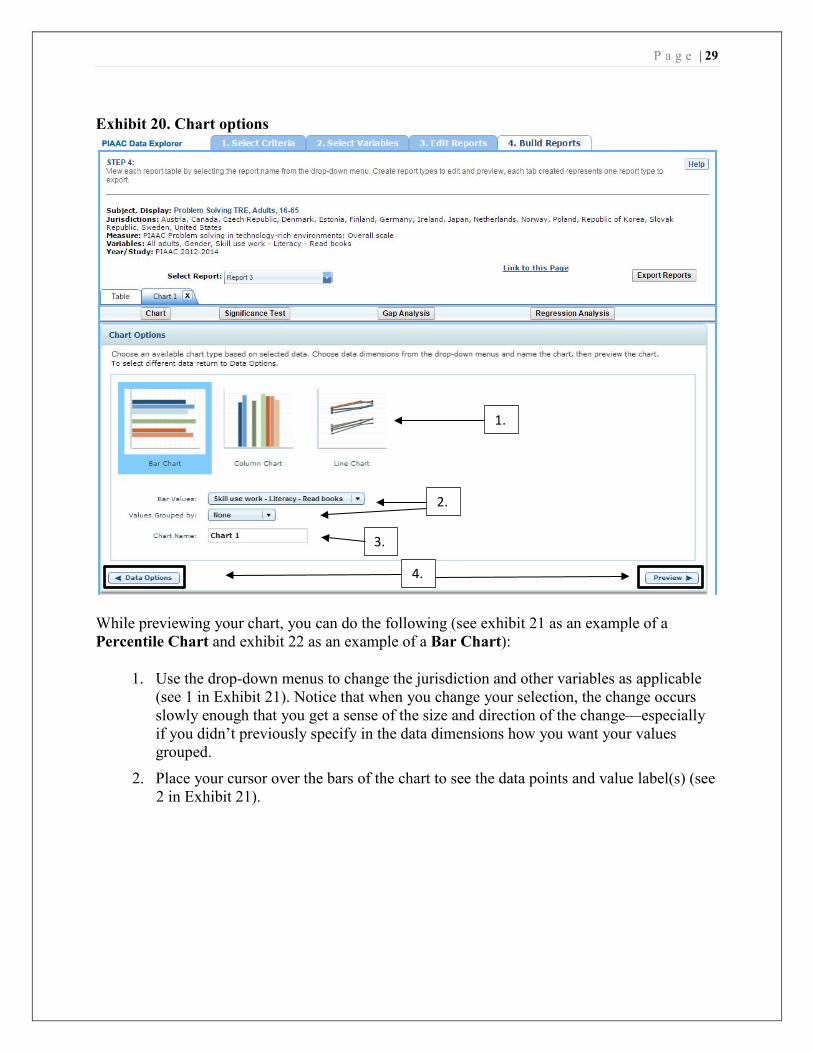
1. On the Chart Options screen, select Bar Chart, Column Chart, or Line Chart (see 1 in exhibit 20).
2. After selecting a chart type, change any data dimensions from the drop-down menus for Bar, Column, or Line Values and Values Grouped by (see 2 in exhibit 20). Any new variables that you created at step 3, Edit Reports, will be available for selection, but only if you selected the variables (by clicking the checkbox next to them) and pressed Done after you edited the report.
3. Enter a Chart Name limited to 25 characters, using only letters, numbers, spaces, underscores, and hyphens (otherwise, by default, the chart is named “Chart 1”) (see 3 in exhibit 20).
4. Preview your chart by clicking the Preview button in the lower-right corner, or go back to the data options and make different selections by clicking the Data Options button in the lower-left corner (see 4 in exhibit 20).
P a g e | 29
Exhibit 20. Chart options
1.
2.
3.
4.
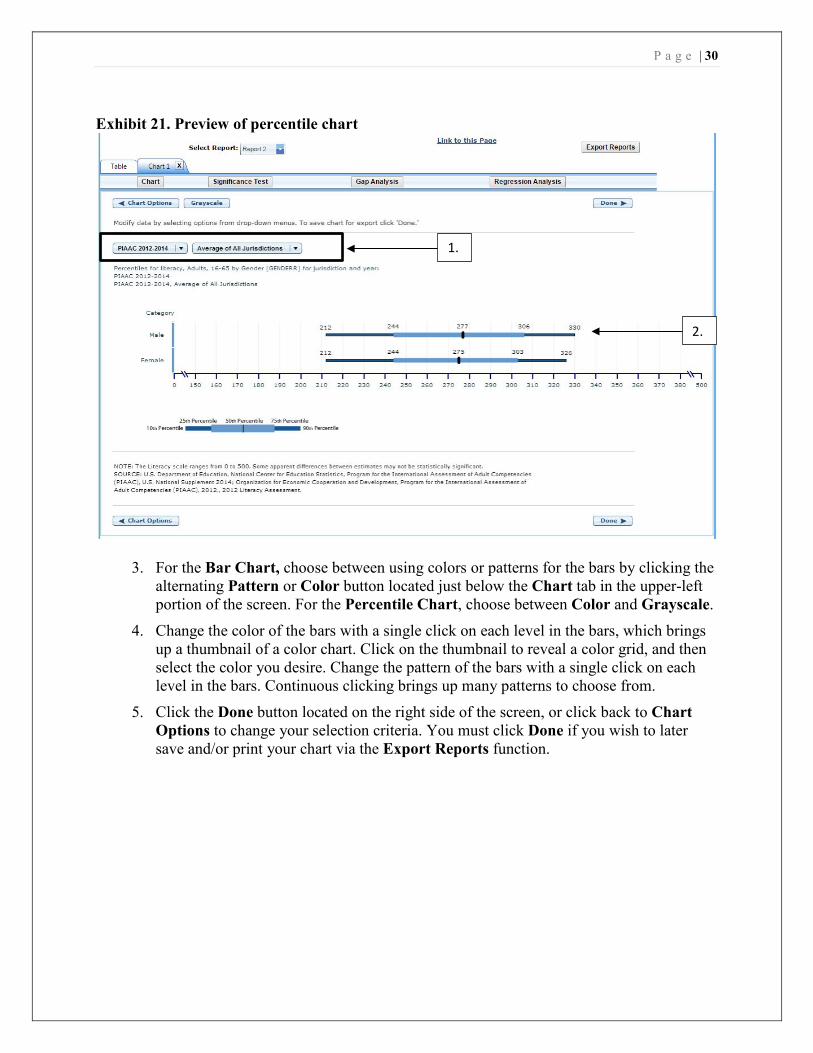
While previewing your chart, you can do the following (see exhibit 21 as an example of a Percentile Chart and exhibit 22 as an example of a Bar Chart):
1. Use the drop-down menus to change the jurisdiction and other variables as applicable (see 1 in Exhibit 21). Notice that when you change your selection, the change occurs slowly enough that you get a sense of the size and direction of the change—especially if you didn’t previously specify in the data dimensions how you want your values grouped.
2. Place your cursor over the bars of the chart to see the data points and value label(s) (see 2 in Exhibit 21).
P a g e | 30
Exhibit 21. Preview of percentile chart
2.
1.
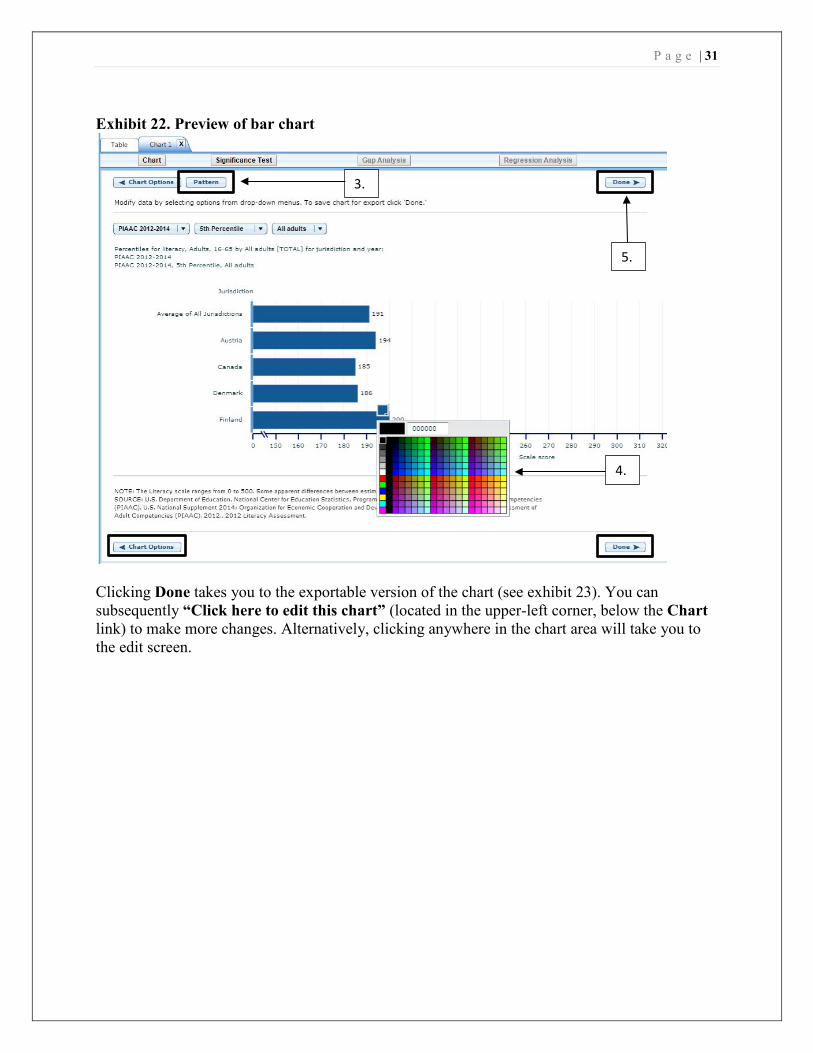
3. For the Bar Chart, choose between using colors or patterns for the bars by clicking the alternating Pattern or Color button located just below the Chart tab in the upper-left portion of the screen. For the Percentile Chart, choose between Color and Grayscale.
4. Change the color of the bars with a single click on each level in the bars, which brings up a thumbnail of a color chart. Click on the thumbnail to reveal a color grid, and then select the color you desire. Change the pattern of the bars with a single click on each level in the bars. Continuous clicking brings up many patterns to choose from.
5. Click the Done button located on the right side of the screen, or click back to Chart Options to change your selection criteria. You must click Done if you wish to later save and/or print your chart via the Export Reports function.
P a g e | 31
Exhibit 22. Preview of bar chart
3.
5.
4.
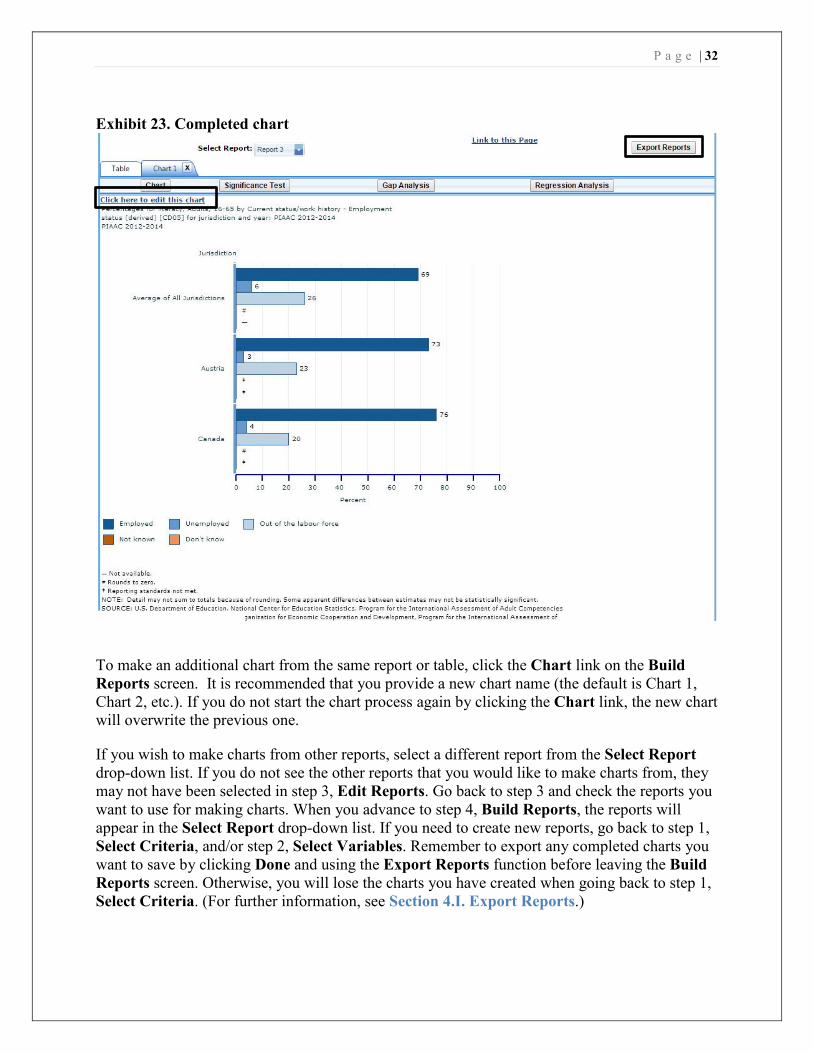
Clicking Done takes you to the exportable version of the chart (see exhibit 23). You can subsequently “Click here to edit this chart” (located in the upper-left corner, below the Chart link) to make more changes. Alternatively, clicking anywhere in the chart area will take you to the edit screen.
P a g e | 32
Exhibit 23. Completed chart
To make an additional chart from the same report or table, click the Chart link on the Build Reports screen. It is recommended that you provide a new chart name (the default is Chart 1, Chart 2, etc.). If you do not start the chart process again by clicking the Chart link, the new chart will overwrite the previous one.
If you wish to make charts from other reports, select a different report from the Select Report drop-down list. If you do not see the other reports that you would like to make charts from, they may not have been selected in step 3, Edit Reports. Go back to step 3 and check the reports you want to use for making charts. When you advance to step 4, Build Reports, the reports will appear in the Select Report drop-down list. If you need to create new reports, go back to step 1, Select Criteria, and/or step 2, Select Variables. Remember to export any completed charts you want to save by clicking Done and using the Export Reports function before leaving the Build Reports screen. Otherwise, you will lose the charts you have created when going back to step 1, Select Criteria. (For further information, see Section 4.I. Export Reports.)
P a g e | 33
4.F. Significance Tests
Tests for statistical significance indicate whether observed differences between assessment results are likely to have occurred because of sampling error or chance. “Significance” here does not imply any judgment about absolute magnitude or educational relevance. It refers only to the statistical nature of the difference and whether that difference likely reflects a true difference in the population.
With your report of interest selected, click the Significance Test link, which is located to the right of the Chart link (see exhibit 23). You first need to decide which variable you want to test and the criterion by which you want to test it (i.e., between jurisdictions, within variables, or across years). You will compare or “look across” the variable’s range of values, so it must have more than one value. You can look across jurisdictions for a variable (that is, compare two or more jurisdictions) or you can look across the values within a variable for a single jurisdiction. Once the primary criterion is chosen, all other criteria must be restricted to a single value.
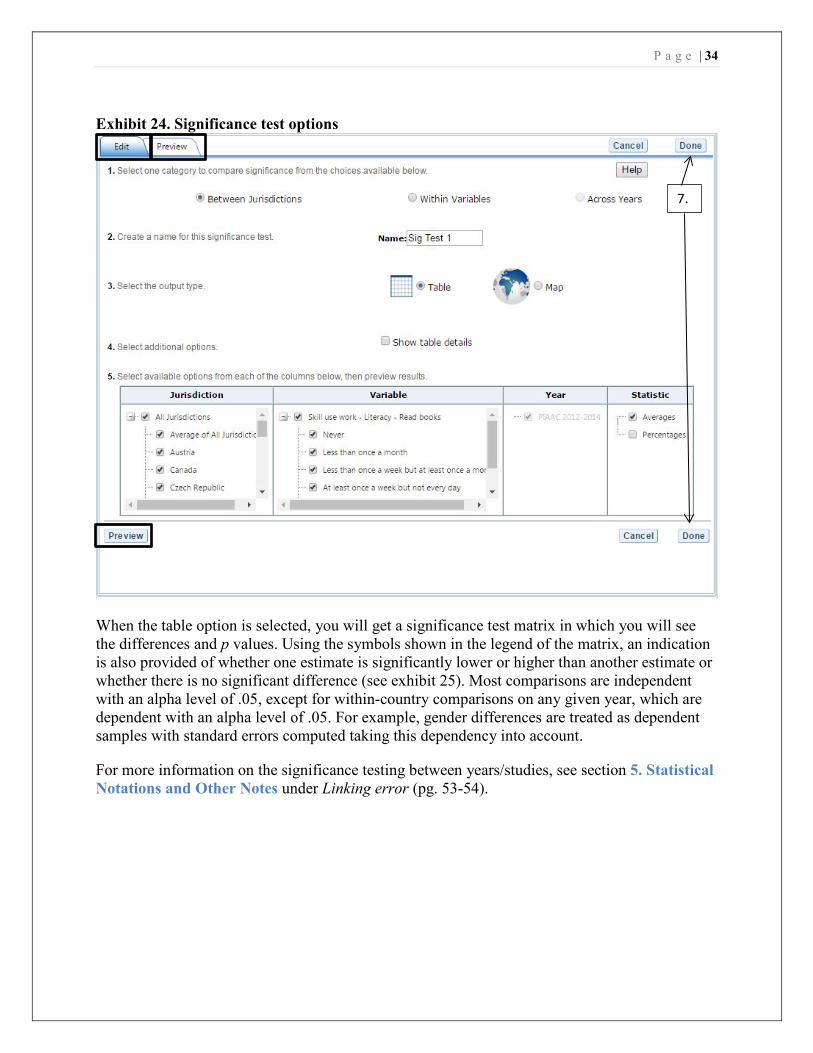
The general steps for running significance tests are as follows (see exhibit 24):
1. In the Significance Test window, select Between Jurisdictions, Within Variables, or Across Years. Then, select the appropriate jurisdiction(s), variable(s), one or more of the years and studies, and statistic(s). For Between Jurisdictions, select at least two jurisdictions. For Within Variables, select one or more jurisdictions. For Across Years, more than one year/study needs to be selected.
2. Enter a Name limited to 25 characters, using only letters, numbers, spaces, underscores, and hyphens (otherwise, by default, the test is named “Sig Test 1”).
3. Select the output type as either Table or Map or Comparison. The table option will show the significance test results as a matrix. The comparison option will show the jurisdictions selected which are significantly higher, not different, or lower to each other in score and statistical significance. The map option will show the significance test results on a world map, highlighting the selected countries different from the one that has been identified as the benchmark. Identifying a benchmark country is done on the map itself (see exhibit 26). The map output is only available when Between Jurisdictions is selected in the first step.
4. Additional options allow you to select Show Score Details to display the estimates and standard errors for the table cells. If you selected a map, this option is not applicable, as the map will automatically show score details.
5. Click the Preview tab located in the upper-left corner, or the Preview button located in the bottom-left corner.
6. Click the Edit tab in the upper-left corner of the screen if you wish to go back and make changes to the selections you made for running the significance tests.
7. Click the Done button in the upper- or lower-right corner of the screen to run the significance tests.
P a g e | 34
Exhibit 24. Significance test options
7.
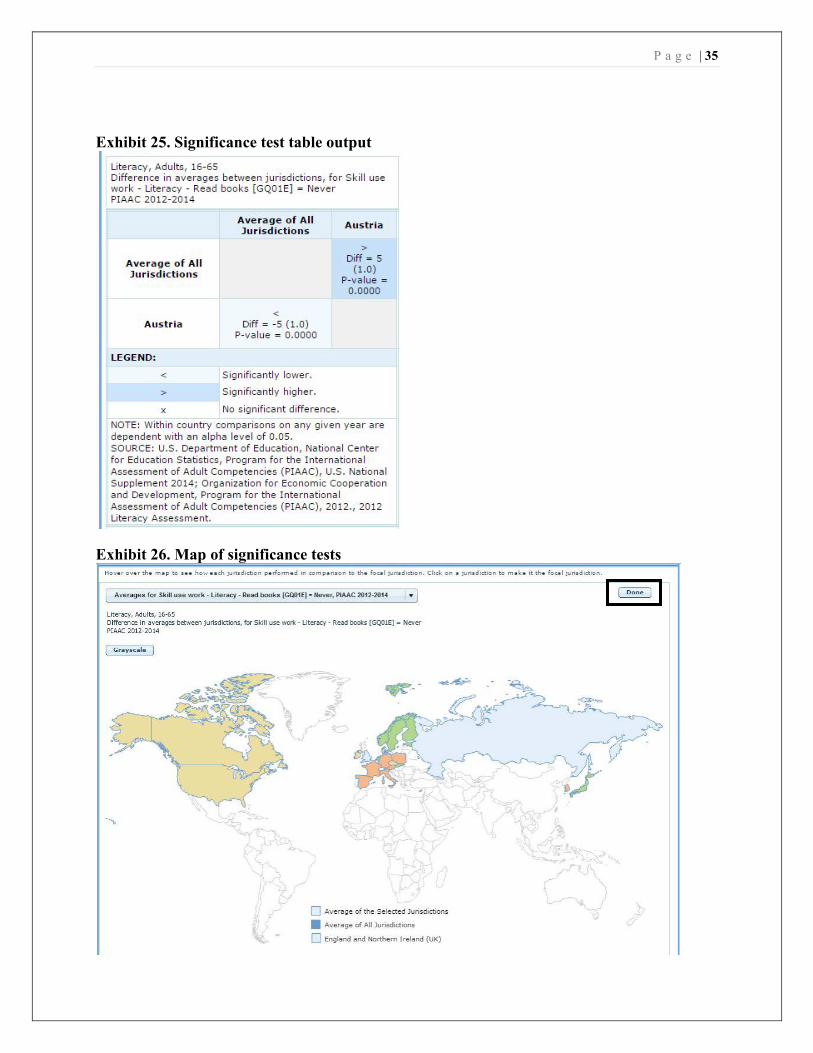
When the table option is selected, you will get a significance test matrix in which you will see the differences and p values. Using the symbols shown in the legend of the matrix, an indication is also provided of whether one estimate is significantly lower or higher than another estimate or whether there is no significant difference (see exhibit 25). Most comparisons are independent with an alpha level of .05, except for within-country comparisons on any given year, which are dependent with an alpha level of .05. For example, gender differences are treated as dependent samples with standard errors computed taking this dependency into account.
For more information on the significance testing between years/studies, see section 5. Statistical Notations and Other Notes under Linking error (pg. 53-54).
P a g e | 35
Exhibit 25. Significance test table output
Exhibit 26. Map of significance tests
P a g e | 36
When the map option is selected, a global map is shown with the selected countries shaded (see exhibit 26, on previous page). The focal jurisdiction is shaded in blue and represents a comparison for all the other countries. The other countries are shaded in colors that indicate whether they are higher, lower, or not significantly different from the focal jurisdiction on whatever measure has been selected. (Note that a lighter shade of blue is the default color for countries categorized as “not selected for comparison.”) When you scroll over a country a text bubble pops up describing the strength of the difference between that country and the focal jurisdiction. At any point, you may choose a different focal jurisdiction by selecting another country of your choosing.
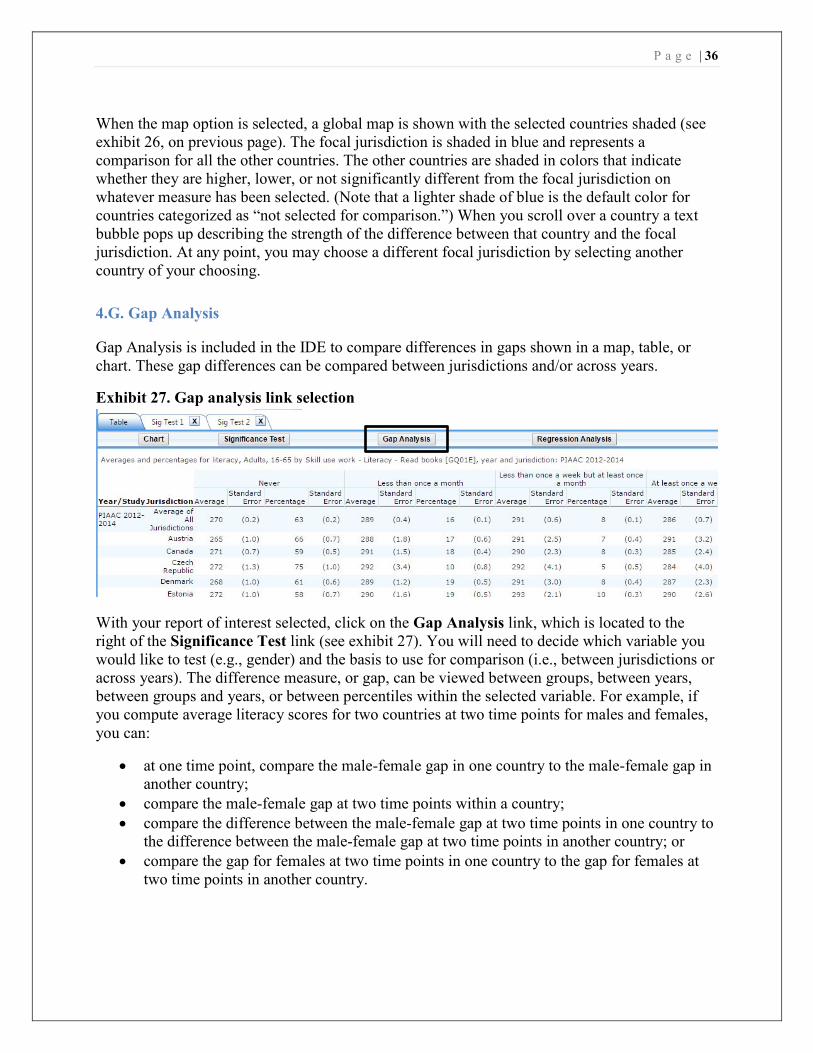
4.G. Gap Analysis
Gap Analysis is included in the IDE to compare differences in gaps shown in a map, table, or chart. These gap differences can be compared between jurisdictions and/or across years.
Exhibit 27. Gap analysis link selection
With your report of interest selected, click on the Gap Analysis link, which is located to the right of the Significance Test link (see exhibit 27). You will need to decide which variable you would like to test (e.g., gender) and the basis to use for comparison (i.e., between jurisdictions or across years). The difference measure, or gap, can be viewed between groups, between years, between groups and years, or between percentiles within the selected variable. For example, if you compute average literacy scores for two countries at two time points for males and females, you can:
• at one time point, compare the male-female gap in one country to the male-female gap in another country;
• compare the male-female gap at two time points within a country; • compare the difference between the male-female gap at two time points in one country to
the difference between the male-female gap at two time points in another country; or • compare the gap for females at two time points in one country to the gap for females at
two time points in another country.
P a g e | 37
Exhibit 28. Gap analysis options
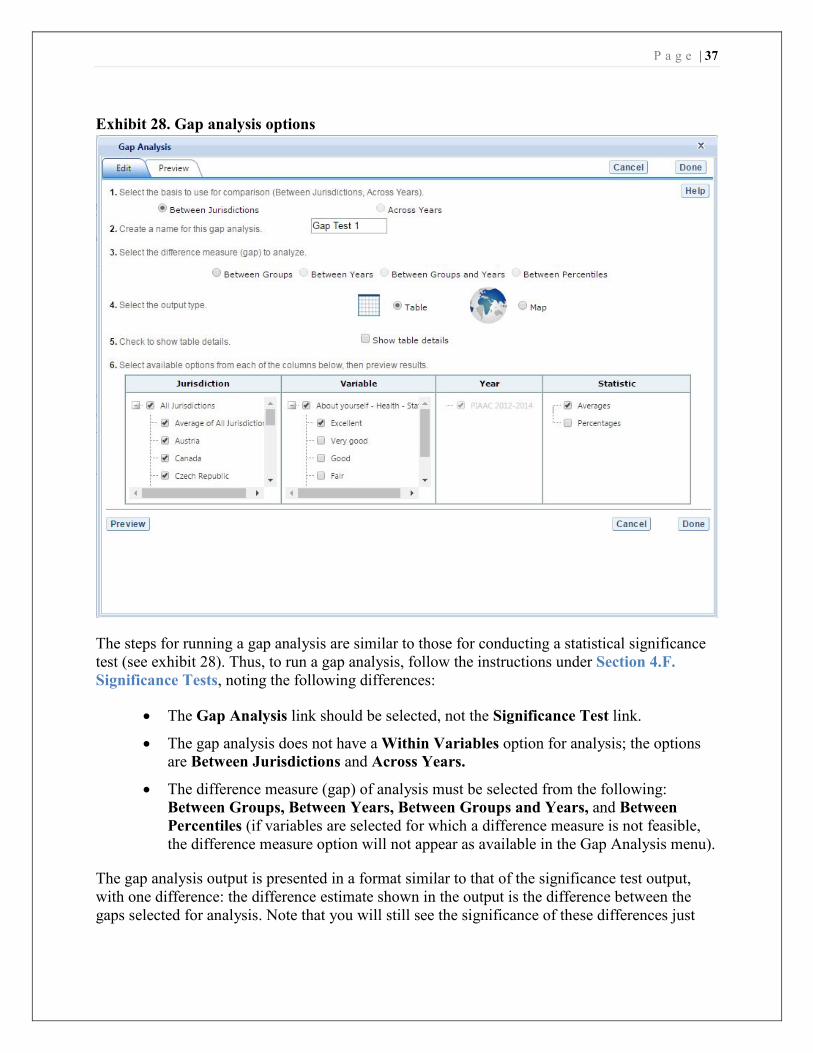
The steps for running a gap analysis are similar to those for conducting a statistical significance test (see exhibit 28). Thus, to run a gap analysis, follow the instructions under Section 4.F. Significance Tests, noting the following differences:
• The Gap Analysis link should be selected, not the Significance Test link.
• The gap analysis does not have a Within Variables option for analysis; the options are Between Jurisdictions and Across Years.
• The difference measure (gap) of analysis must be selected from the following: Between Groups, Between Years, Between Groups and Years, and Between Percentiles (if variables are selected for which a difference measure is not feasible, the difference measure option will not appear as available in the Gap Analysis menu).
The gap analysis output is presented in a format similar to that of the significance test output, with one difference: the difference estimate shown in the output is the difference between the gaps selected for analysis. Note that you will still see the significance of these differences just
P a g e | 38
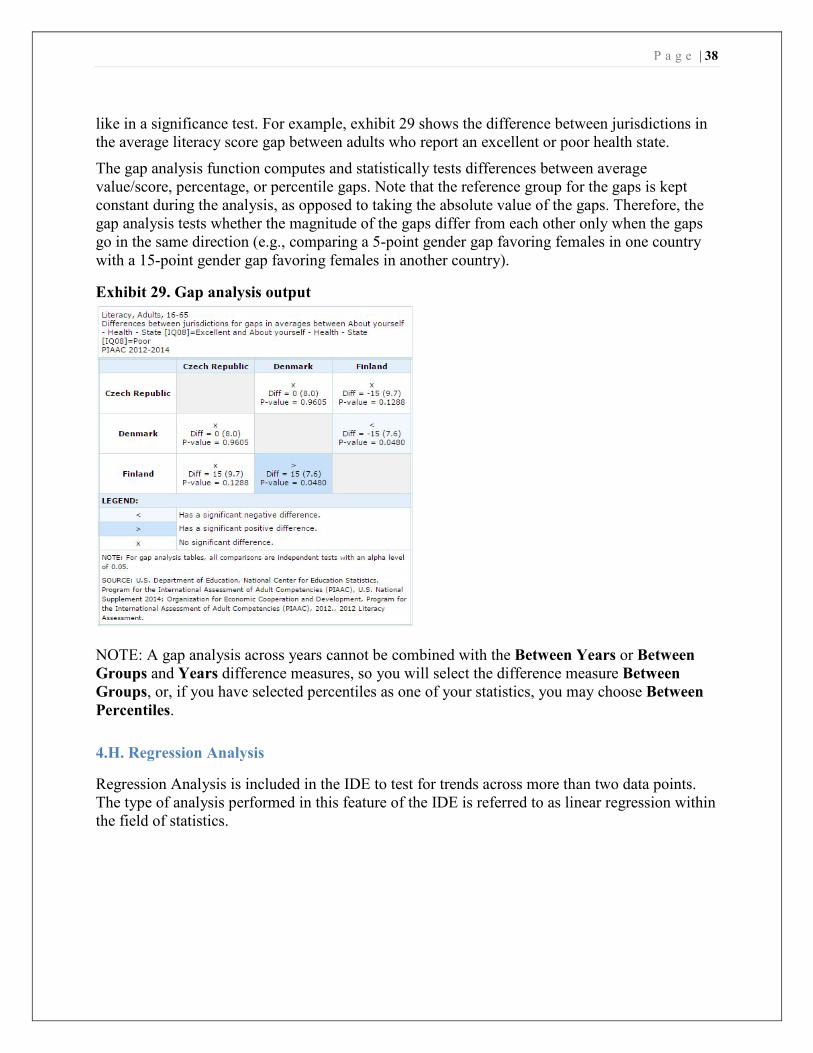
like in a significance test. For example, exhibit 29 shows the difference between jurisdictions in the average literacy score gap between adults who report an excellent or poor health state.
The gap analysis function computes and statistically tests differences between average value/score, percentage, or percentile gaps. Note that the reference group for the gaps is kept constant during the analysis, as opposed to taking the absolute value of the gaps. Therefore, the gap analysis tests whether the magnitude of the gaps differ from each other only when the gaps go in the same direction (e.g., comparing a 5-point gender gap favoring females in one country with a 15-point gender gap favoring females in another country).
Exhibit 29. Gap analysis output
NOTE: A gap analysis across years cannot be combined with the Between Years or Between Groups and Years difference measures, so you will select the difference measure Between Groups, or, if you have selected percentiles as one of your statistics, you may choose Between Percentiles.
4.H. Regression Analysis
Regression Analysis is included in the IDE to test for trends across more than two data points. The type of analysis performed in this feature of the IDE is referred to as linear regression within the field of statistics.
P a g e | 39
Exhibit 30. Regression analysis link selection
Exhibit 31: Regression analysis options
3 and 4.
5.
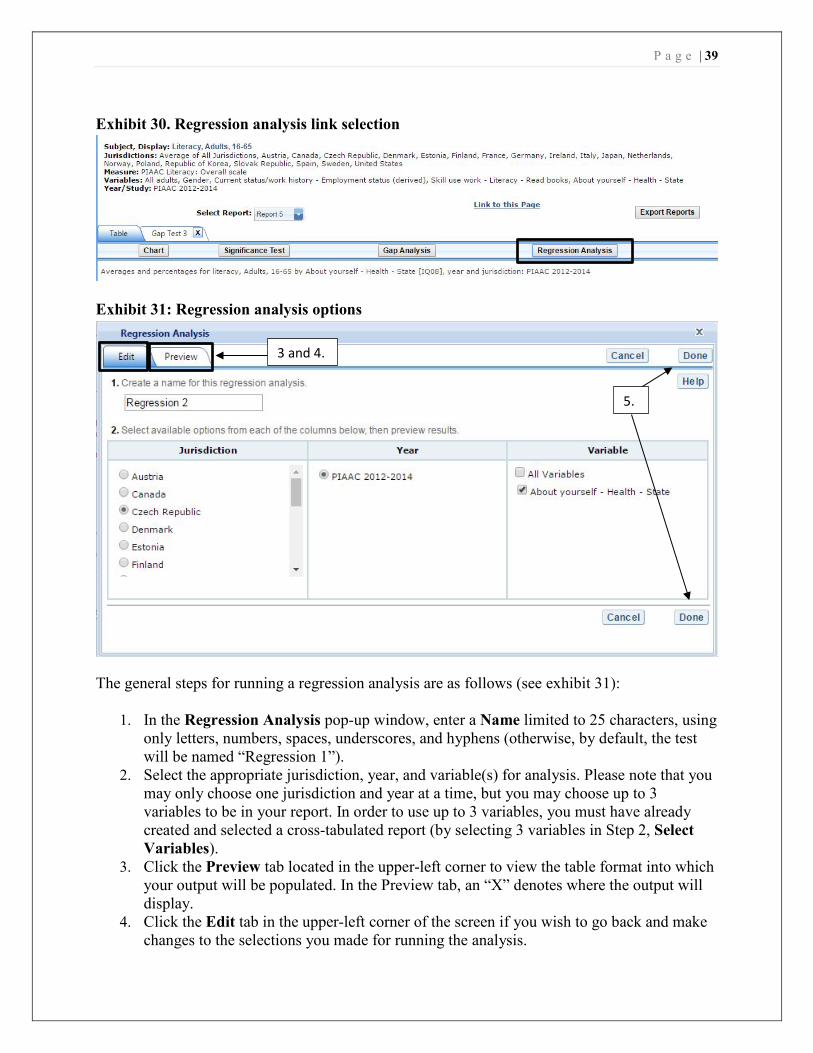
The general steps for running a regression analysis are as follows (see exhibit 31):
1. In the Regression Analysis pop-up window, enter a Name limited to 25 characters, using only letters, numbers, spaces, underscores, and hyphens (otherwise, by default, the test will be named “Regression 1”).
2. Select the appropriate jurisdiction, year, and variable(s) for analysis. Please note that you may only choose one jurisdiction and year at a time, but you may choose up to 3 variables to be in your report. In order to use up to 3 variables, you must have already created and selected a cross-tabulated report (by selecting 3 variables in Step 2, Select Variables).
3. Click the Preview tab located in the upper-left corner to view the table format into which your output will be populated. In the Preview tab, an “X” denotes where the output will display.
4. Click the Edit tab in the upper-left corner of the screen if you wish to go back and make changes to the selections you made for running the analysis.
P a g e | 40
5. Click the Done button in the upper- or lower-right corner of the screen to run the regression analysis.
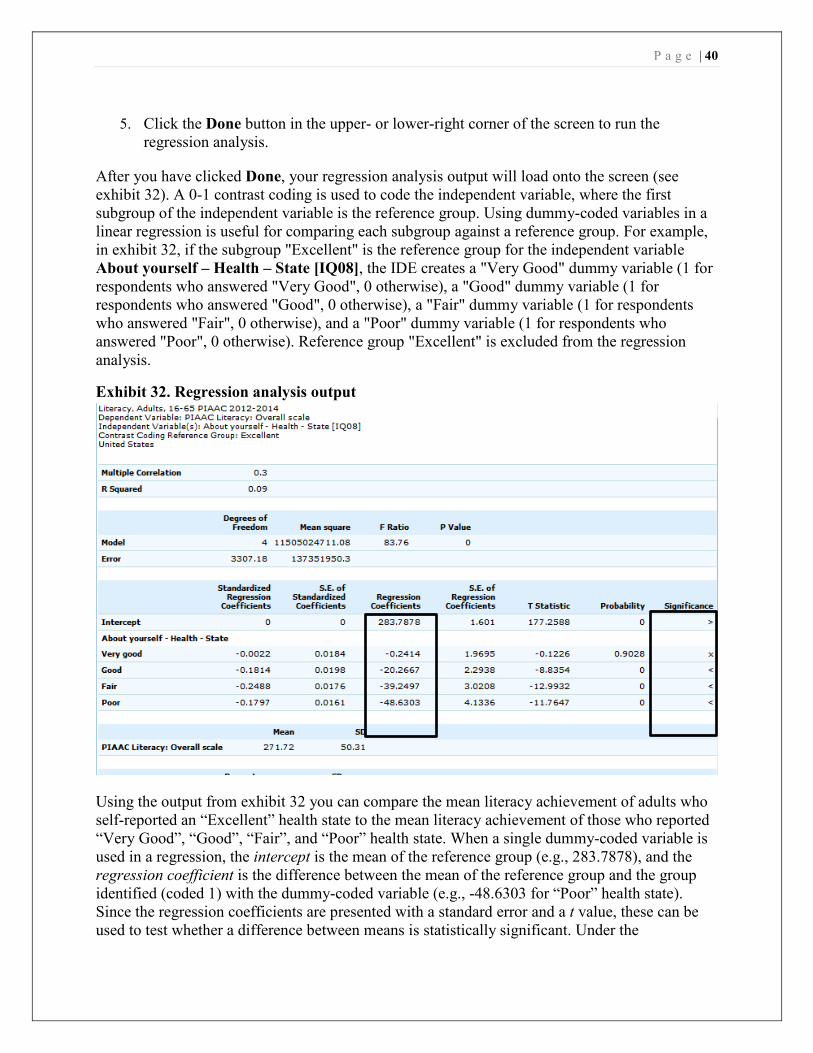
After you have clicked Done, your regression analysis output will load onto the screen (see exhibit 32). A 0-1 contrast coding is used to code the independent variable, where the first subgroup of the independent variable is the reference group. Using dummy-coded variables in a linear regression is useful for comparing each subgroup against a reference group. For example, in exhibit 32, if the subgroup "Excellent" is the reference group for the independent variable About yourself – Health – State [IQ08], the IDE creates a "Very Good" dummy variable (1 for respondents who answered "Very Good", 0 otherwise), a "Good" dummy variable (1 for respondents who answered "Good", 0 otherwise), a "Fair" dummy variable (1 for respondents who answered "Fair", 0 otherwise), and a "Poor" dummy variable (1 for respondents who answered "Poor", 0 otherwise). Reference group "Excellent" is excluded from the regression analysis.
Exhibit 32. Regression analysis output
Using the output from exhibit 32 you can compare the mean literacy achievement of adults who self-reported an “Excellent” health state to the mean literacy achievement of those who reported “Very Good”, “Good”, “Fair”, and “Poor” health state. When a single dummy-coded variable is used in a regression, the intercept is the mean of the reference group (e.g., 283.7878), and the regression coefficient is the difference between the mean of the reference group and the group identified (coded 1) with the dummy-coded variable (e.g., -48.6303 for “Poor” health state). Since the regression coefficients are presented with a standard error and a t value, these can be used to test whether a difference between means is statistically significant. Under the
P a g e | 41
Significance column in the output you will see 3 possible signs: 1) < signifies a significant negative difference, 2) > signifies a significant positive difference, and 3) x signifies the difference is not statistically significant.
4.I. Export Reports
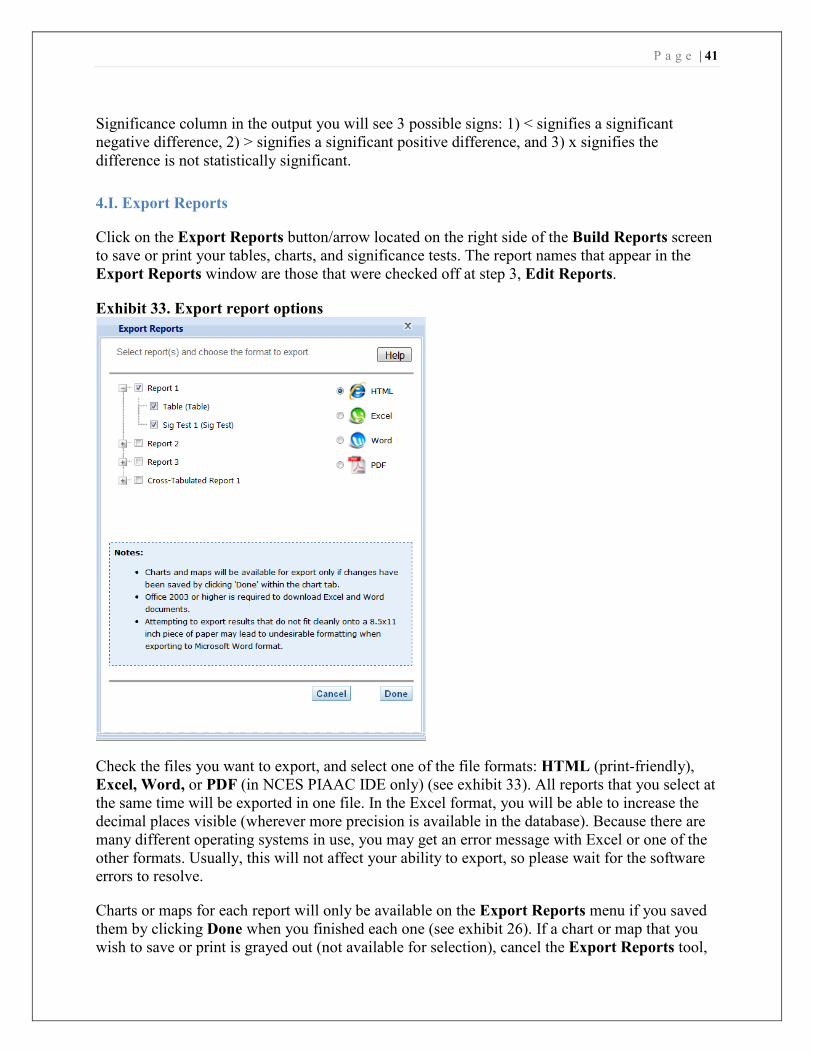
Click on the Export Reports button/arrow located on the right side of the Build Reports screen to save or print your tables, charts, and significance tests. The report names that appear in the Export Reports window are those that were checked off at step 3, Edit Reports.
Exhibit 33. Export report options
Check the files you want to export, and select one of the file formats: HTML (print-friendly), Excel, Word, or PDF (in NCES PIAAC IDE only) (see exhibit 33). All reports that you select at the same time will be exported in one file. In the Excel format, you will be able to increase the decimal places visible (wherever more precision is available in the database). Because there are many different operating systems in use, you may get an error message with Excel or one of the other formats. Usually, this will not affect your ability to export, so please wait for the software errors to resolve.
Charts or maps for each report will only be available on the Export Reports menu if you saved them by clicking Done when you finished each one (see exhibit 26). If a chart or map that you wish to save or print is grayed out (not available for selection), cancel the Export Reports tool,
P a g e | 42
go back to your chart or map, and be sure to click Done on the last screen. After that, it will be available for export.
If you wish to edit tables or charts before saving or printing them, remember to do this via the Export Reports function before leaving the Build Reports screen. If you return to prior screens to edit the table formats or change variables or criteria, you will overwrite the tables and charts.
P a g e | 43
IV. PIAAC International Data Explorer Definitions
This section describes the kinds of criteria and variables that are used to form data queries, as well as the kinds of data available and the statistical methods used to assess them.
These topics include the following:
1. Criteriao Subjecto Displayo Year/Studyo Measureo Jurisdiction
2. Variables3. Statistics options
o Averageso Percentageso Standard deviationso Discrete achievement levelso Combined achievement levelso Percentiles
4. Cross-tabulations5. Statistical notations and other notes
o Calculation of averageso Linking error
1. CriteriaEach data query must include at least one selection from five criteria choices: subject, display, year/study, measure, and jurisdiction. Shown below is an outline of these selection criteria followed by a brief description.
a) Subject:
o Literacyo Numeracyo Problem solving TRE
b) Display
o Adults, 16-65o Young adults, 16-34
P a g e | 44
o U.S. Adults, 16-74 (household and prison) (data available for PIAAC 2012/2014 only)
o Adults, 16-65 (2013 Release) (This data should be used primarily to verify published results from the 2012 sample)
c) Year/Study:
o PIAAC 2012/2014 (data available for literacy, numeracy and problem solving in technology-rich environments)
o ALL 2003-2008 (data available for literacy and numeracy) o IALS 1994-1998 (data available for literacy)
d) Measure:
o PIAAC Literacy: Overall scale i. PIAAC Reading Components scale
o PIAAC Numeracy: Overall scale o PIAAC Problem solving in technology-rich environments: Overall scale o Other continuous variables from the background questionnaire, including
international variables, derived variables, and U.S. national adaptations and additions to the International background questionnaire.
e) Jurisdiction:
o Average of All Jurisdictions o Average of the Selected Jurisdictions o OECD National Entities o OECD Sub-National Entities o Partners (in literacy and numeracy)
NOTE: Data in the PIAAC IDE from the U.S. PIAAC National Supplement household and prison adult samples is only available for the United States in the Jurisdiction menu. However, users may choose to work with the U.S. prison sample, or the U.S. household sample, or select both for analysis as jurisdictions.
Subject
PIAAC assesses three major domains: Literacy, Numeracy, Problem solving in technology-rich environments (TRE), which can be selected in the Subject drop down menu.
Display
The PIAAC IDE contains four different adult sample populations which can be selected for analysis from the Display drop down menu.
Adults, 16-65: This is international comparable data of the PIAAC (combined 2012 and 2014 U.S. data) Household Data, ages 16-65
P a g e | 45
Young adults, 16-34: This is international comparable data of the PIAAC (combined 2012 and 2014 U.S. data) Household Data, ages 16-34
U.S. Adults, 16-74 (household and prison): This is U.S. only comparable data of the PIAAC (combined 2012 and 2014 U.S. data) Household and Prison Data, ages 16-74
Adults, 16-65 (2013 Release): This is international comparable data of the PIAAC (2012 U.S. data) Household Data, released in 2013, ages 16-65. This data should be used primarily to verify published results from the 2012 sample.
Measures
You can choose the overall scale, which is each subject's default measure in the PIAAC IDE or there are also a number of continuous variables other than scale scores that you may choose as a measure of analysis. These variables are continuous variables from the international and U.S. national background questionnaire (such as earnings or hours of work per week) and derived variables from PIAAC, ALL, and IALS. Derived variables from PIAAC include indices of literacy, numeracy, and computer use at work and at home and imputed years of formal education, among others.
A fourth domain, called Reading Components, measures literacy at the very low end of the spectrum, in areas such as sentence completion, passage comprehension, and vocabulary. This domain was given to respondents who decided not to take the computer-based assessment or who did not pass a set of core information and computer technology tasks and a set of core literacy/numeracy tasks.
The adults in the sample population that did not answer the assessment will be displayed along with those that did answer the assessment if you select Percentage across full sample under the Population category.
Year/Study
Currently, data availability in the PIAAC IDE is dependent on the Display and Measure selected in step 1, Select Criteria.
If the Display chosen is Adults, 16-65, Young adults, 16-34, or Adults, 16-65 (2013 Release) - you can choose one or more years and studies between PIAAC 2012/2014, ALL 2003-2008, and IALS 1994-1998. Note that for the Adults, 16-65 (2013 Release), the data presented does not include the combined 2012/2014 sample, although the IDE label will display PIAAC 2012/2014. U.S. Adults, 16-74 (household and prison) data is only available for PIAAC 2012/2014.
If you select the PIAAC literacy scale for the Subject in step 1, Select Criteria, you can choose one or more years and studies between PIAAC 2012/2014, ALL 2003-2008, and IALS 1994-1998. If the Subject selected is the PIAAC numeracy scale, you can choose PIAAC 2012/2014 and/or ALL 2003-2008 years/studies. If you selected the problem solving in technology-rich
P a g e | 46
environments (TRE) scale from the Subject menu, data are only available for PIAAC 2012/2014.
Jurisdictions
All listed jurisdictions can be selected for any analyses, provided data are available for the selected year/study range. When PIAAC was first administered in 2012, a total of 24 jurisdictions participated, including the United States. Data for these jurisdictions, with the exception of two, are available within the Adults, age 16-65; Adults, age 16-34; Adults, age 16-65 (2013 Release) sample populations. Data for two jurisdictions, Australia and Russian Federation, are not available: Australia’s data is suppressed in the PIAAC IDE because of national restrictions on the use of their data; Russian Federation’s data is suppressed in the PIAAC IDE because the data do not represent the entire resident population aged 16-65 years in Russia. Jurisdictions include some subnational entities, such as England/N. Ireland. Data are not available for some of these 24 jurisdictions for ALL 2003-2008 or IALS 1994-1998, either because they did not participate in that assessment or because their data were suppressed due to reporting standards not being met (see Table 2).
Data are available for 5 jurisdictions in ALL 2003-2008, and 15 jurisdictions in IALS 1994-1998. Jurisdictions for which data are not available for a selected year are identified by the icon representing “no data”— .
Table 2. PIAAC IDE jurisdictions with available data by year/study
Jurisdiction Groups PIAAC
2012/2014 ALL
2003-2008 IALS
1994-1998 OECD National Entities 19 5 12 OECD Sub-National Entities 4 0 3 Partners 1 0 0
Total Jurisdictions* 24 5 15 *The count of countries and subnational education systems which have data in the PIAAC IDE is different from those listed as participating in the OECD PIAAC International Report. This is due to the omission of Australia and Russian Federation data from the PIAAC IDE.
NOTE: Data in the PIAAC IDE from the U.S. PIAAC National Supplement household and prison adult samples is only available for the United States in the Jurisdiction menu. However, users may choose to work with the U.S. prison sample, or the U.S. household sample, or select both for analysis as jurisdictions.
2. Variables PIAAC requires in-person interviews to complete the background questionnaire before administering the direct assessments (i.e., literacy, numeracy, reading components, and/or problem solving in technology-rich environments (TRE)). In the PIAAC IDE, measures are derived from two instruments: the computer-based assessment (CBA), given to respondents who
P a g e | 47
were comfortable taking the assessment on a computer, and the paper-based assessment (PBA), given to respondents that were not familiar with computers or chose not to take the assessment on a computer. Variables derived from the background questionnaire were administered to each participating adult. Variables are organized into categories that have shared characteristics and can be selected as a group (category) when examining and generating tables.
Content category and subcategory titles may overlap, but specific variables appear only once in a subcategory. Use Search in the Select Variables step to locate variables.
Note that some variables might be similar in content, but not comparable over the years, either due to differences in the question asked or differences in their response categories. The icon representing “no data”— —will help in identifying the year for which the variable has data available for analysis. Except for the estimates for All Adults, the variables that can be compared across years are located under a special category called Trend Variables, sub-category Trends to IALS and ALL. Note that common variables such as age and gender, among others, can appear in other categories and sub-categories with the “no data” icon, but have data when selected under the Trends Variables category.
3. Statistics Options The IDE reports PIAAC data with several statistics options:
• Averages • Percentages • Standard deviations • Achievement levels - (discrete and combined) • Percentiles
Averages
This statistic provides the average value for a selected continuous variable or the average scale score. For the PIAAC assessment, adult performance is reported on scales that range from 0 to 500.PIAAC scales are produced using item response theory (IRT) to estimate average scores for literacy, numeracy, and problem solving in technology-rich environments (TRE) for each jurisdiction. IRT identifies patterns of response and uses statistical models to predict the probability of answering an item correctly as a function of the adults’ achievement in answering other questions. That is, all participants’ responses to the assessment questions are compiled and analyzed to determine the percentage of adults responding correctly to each multiple-choice question and the percentage of adults achieving each of the score categories for constructed-response questions.
Percentages
This statistic shows the percentage of adults as a row percentage. For example, if the first column lists countries, then each country will display its own percentage distribution across its row. By
P a g e | 48
default, percentage distributions do not include missing data, although there is an option to include them.
The adults in the sample population that did not answer the assessment will be displayed along with those that did answer the assessment if you select Percentage across full sample under the Population category.
Standard deviations
The standard deviation is a measure of how widely or narrowly dispersed scores are for a particular dataset. Under general normality assumptions, 95 percent of the scores are within two standard deviations of the mean. For example, if the average score of a dataset is 500 and the standard deviation is 100, it means that 95 percent of the scores in this dataset fall between 300 and 700. The standard deviation is the square root of the variance.
Achievement levels (discrete and combined)
In addition to average scale scores, achievement results for PIAAC are reported using achievement levels for literacy, numeracy, and problem solving in technology-rich environments (TRE). Discrete achievement levels are reported as the percentage of adults performing at each PIAAC achievement level. Combined achievement levels are reported as the percentage of adults performing at combined PIAAC achievement levels (such as levels 1 and 2 together, or levels 4 and 5 together). Increasing levels represent the knowledge, skills, and capabilities needed to perform tasks of increasing complexity. As a result, the findings are reported in terms of percentages of the adult population at each of the predefined levels.
Literacy and numeracy results in PIAAC 2012/2014, ALL 2003-2008, and IALS 1994-1998 were reported using five achievement levels: level 1, level 2, level 3, level 4, and level 5. A sixth level, below level 1, was established to include adults whose abilities could not be accurately described based on their responses. When using discrete achievement levels for literacy and numeracy scales, a 7th level, literacy related non-response, is also available.
The number of achievement levels in problem solving in technology-rich environments (TRE) differs from the number in literacy and numeracy for PIAAC 2012/2014, ALL 2003-2008 and IALS 1994-1998, where three achievement levels were used: level 1, level 2, and level 3. A fourth level, below level 1, was established to include adults whose abilities could not be accurately described based on their responses. Four other levels are also available in problem solving in technology-rich environments (TRE) discrete achievement levels: no computer experience, failed ICT core, refused CBA, and literacy related non-response (which are further explained in the Description of PIAAC problem solving in technology-rich environments (TRE) achievement levels table below.)
Descriptions that characterize typical adult performance in literacy, numeracy, and problem solving in technology-rich environments (TRE) at each achievement level available in the IDE are shown in the following tables.
P a g e | 49
Description of PIAAC literacy discrete achievement levels Achievement level and score range Task descriptions
Below Level 1 0 - 175
The tasks at this level require the respondent to read brief texts on familiar topics to locate a single piece of specific information. There is seldom any competing information in the text and the requested information is identical in form to information in the question or directive. The respondent may be required to locate information in short continuous texts. However, in this case, the information can be located as if the text were non-continuous in format. Only basic vocabulary knowledge is required, and the reader is not required to understand the structure of sentences or paragraphs or make use of other text features. Tasks below Level 1 do not make use of any features specific to digital texts.
Level 1 176 - 225
Most of the tasks at this level require the respondent to read relatively short digital or print continuous, non-continuous, or mixed texts to locate a single piece of information that is identical to or synonymous with the information given in the question or directive. Some tasks, such as those involving non-continuous texts, may require the respondent to enter personal information onto a document. Little, if any, competing information is present. Some tasks may require simple cycling through more than one piece of information. Knowledge and skill in recognizing basic vocabulary determining the meaning of sentences, and reading paragraphs of text is expected.
Level 2 226 - 275
At this level, the medium of texts may be digital or printed, and texts may comprise continuous, non-continuous, or mixed types. Tasks at this level require respondents to make matches between the text and information, and may require paraphrasing or low-level inferences. Some competing pieces of information may be present. Some tasks require the respondent to
• cycle through or integrate two or more pieces of information based on criteria;
• compare and contrast or reason about information requested in the question; or
• navigate within digital texts to access and identify information from various parts of a document.
P a g e | 50
Level 3
276 - 325
Texts at this level are often dense or lengthy, and include continuous, non-continuous, mixed, or multiple pages of text. Understanding text and rhetorical structures become more central to successfully completing tasks, especially navigating complex digital texts. Tasks require the respondent to identify, interpret, or evaluate one or more pieces of information, and often require varying levels of inference. Many tasks require the respondent to construct meaning across larger chunks of text or perform multi-step operations in order to identify and formulate responses. Often tasks also demand that the respondent disregard irrelevant or inappropriate content to answer accurately. Competing information is often present, but it is not more prominent than the correct information.
Level 4
326 - 375
Tasks at this level often require respondents to perform multiple-step operations to integrate, interpret, or synthesize information from complex or lengthy continuous, non-continuous, mixed, or multiple type texts. Complex inferences and application of background knowledge may be needed to perform the task successfully. Many tasks require identifying and understanding one or more specific, non-central idea(s) in the text in order to interpret or evaluate subtle evidence-claim or persuasive discourse relationships. Conditional information is frequently present in tasks at this level and must be taken into consideration by the respondent. Competing information is present and sometimes seemingly as prominent as correct information.
Level 5
376 - 500
At this level, tasks may require the respondent to search for and integrate information across multiple, dense texts; construct syntheses of similar and contrasting ideas or points of view; or evaluate evidence based arguments. Application and evaluation of logical and conceptual models of ideas may be required to accomplish tasks. Evaluating reliability of evidentiary sources and selecting key information is frequently a requirement. Tasks often require respondents to be aware of subtle, rhetorical cues and to make high-level inferences or use specialized background knowledge.
NOTE: Information about the procedures used to set the achievement levels is available in the OECD PIAAC Technical Standards and Guidelines. SOURCE: OECD PIAAC International report [http://www.oecd.org/site/piaac/publications.htm].
Description of PIAAC numeracy discrete achievement levels Achievement level and score range Task descriptions
Below Level 1
0 - 175
Tasks at this level require the respondents to carry out simple processes such as counting, sorting, performing basic arithmetic operations with whole numbers or money, or recognizing common spatial representations in concrete, familiar contexts where the mathematical content is explicit with little or no text or distractors.
P a g e | 51
Level 1
176 - 225
Tasks at this level require the respondent to carry out basic mathematical processes in common, concrete contexts where the mathematical content is explicit with little text and minimal distractors. Tasks usually require one-step or simple processes involving counting, sorting, performing basic arithmetic operations, understanding simple percents such as 50%, and locating and identifying elements of simple or common graphical or spatial representations.
Level 2
226 - 275
Tasks at this level require the respondent to identify and act on mathematical information and ideas embedded in a range of common contexts where the mathematical content is fairly explicit or visual with relatively few distractors. Tasks tend to require the application of two or more steps or processes involving calculation with whole numbers and common decimals, percents and fractions; simple measurement and spatial representation; estimation; and interpretation of relatively simple data and statistics in texts, tables and graphs.
Level 3
276 - 325
Tasks at this level require the respondent to understand mathematical information that may be less explicit, embedded in contexts that are not always familiar and represented in more complex ways. Tasks require several steps and may involve the choice of problem-solving strategies and relevant processes. Tasks tend to require the application of number sense and spatial sense; recognizing and working with mathematical relationships, patterns, and proportions expressed in verbal or numerical form; and interpretation and basic analysis of data and statistics in texts, tables and graphs.
Level 4
326 - 375
Tasks at this level require the respondent to understand a broad range of mathematical information that may be complex, abstract or embedded in unfamiliar contexts. These tasks involve undertaking multiple steps and choosing relevant problem-solving strategies and processes. Tasks tend to require analysis and more complex reasoning about quantities and data; statistics and chance; spatial relationships; and change, proportions and formulas. Tasks at this level may also require understanding arguments or communicating well-reasoned explanations for answers or choices.
Level 5
376 - 500
Tasks at this level require the respondent to understand complex representations and abstract and formal mathematical and statistical ideas, possibly embedded in complex texts. Respondents may have to integrate multiple types of mathematical information where considerable translation or interpretation is required; draw inferences; develop or work with mathematical arguments or models; and justify, evaluate and critically reflect upon solutions or choices.
NOTE: Information about the procedures used to set the achievement levels is available in the OECD PIAAC Technical Standards and Guidelines. SOURCE: OECD PIAAC International report [http://www.oecd.org/site/piaac/publications.htm].
P a g e | 52
Description of PIAAC problem solving in technology-rich environments (TRE) discrete achievement levels
Achievement level and score
range Task descriptions Failed ICT core
Not applicable
Adults in this category had prior computer experience but failed the ICT core test, which assesses basic ICT (Information and Communication Technologies) skills, such as the capacity to use a mouse or scroll through a web page, needed to take the computer-based assessment. Therefore, they did not take part in computer-based assessment, but took the paper-based version of the assessment, which does not include the problem solving in technology-rich environment domain.
"Opted out" of taking computer-based assessment
Not applicable
Adults in this category opted to take the paper-based assessment without first taking the ICT core assessment, even if they reported some prior experience with computers. They also did not take part in the computer-based assessment, but took the paper-based version of the assessment, which does not include the problem solving in technology-rich environment domain.
Below Level 1
0 - 240
Tasks are based on well-defined problems involving the use of only one function within a generic interface to meet one explicit criterion without any categorical or inferential reasoning, or transforming of information. Few steps are required and no sub-goal has to be generated.
Level 1
241 - 290
At this level, tasks typically require the use of widely available and familiar technology applications, such as e-mail software or a web browser. There is little or no navigation required to access the information or commands required to solve the problem. The problem may be solved regardless of the respondent’s awareness and use of specific tools and functions (e.g. a sort function). The tasks involve few steps and a minimal number of operators. At the cognitive level, the respondent can readily infer the goal from the task statement; problem resolution requires the respondent to apply explicit criteria; and there are few monitoring demands (e.g. the respondent does not have to check whether he or she has used the appropriate procedure or made progress towards the solution). Identifying content and operators can be done through simple match. Only simple forms of reasoning, such as assigning items to categories, are required; there is no need to contrast or integrate information.
P a g e | 53
Level 2
291 - 340
At this level, tasks typically require the use of both generic and more specific technology applications. For instance, the respondent may have to make use of a novel online form. Some navigation across pages and applications is required to solve the problem. The use of tools (e.g. a sort function) can facilitate the resolution of the problem. The task may involve multiple steps and operators. The goal of the problem may have to be defined by the respondent, though the criteria to be met are explicit. There are higher monitoring demands. Some unexpected outcomes or impasses may appear. The task may require evaluating the relevance of a set of items to discard distractors. Some integration and inferential reasoning may be needed.
Level 3
341 - 500
At this level, tasks typically require the use of both generic and more specific technology applications. Some navigation across pages and applications is required to solve the problem. The use of tools (e.g. a sort function) is required to make progress towards the solution. The task may involve multiple steps and operators. The goal of the problem may have to be defined by the respondent, and the criteria to be met may or may not be explicit. There are typically high monitoring demands. Unexpected outcomes and impasses are likely to occur. The task may require evaluating the relevance and reliability of information in order to discard distractors. Integration and inferential reasoning may be needed to a large extent.
NOTE: Information about the procedures used to set the achievement levels is available in the OECD PIAAC Technical Standards and Guidelines. SOURCE: OECD PIAAC International report [http://www.oecd.org/site/piaac/publications.htm].
Percentiles
This statistic shows the threshold (or cutpoint) score for the following:
• 5th percentile – the bottom 5 percent of adults • 10th percentile – the bottom 10 percent of adults • 25th percentile – the bottom quarter of adults • 50th percentile – the median (half the adults scored below the cutpoint and half scored
above it) • 75th percentile – the top quarter of adults • 90th percentile – the top 10 percent of adults • 95th percentile – the top 5 percent of adults
4. Cross-tabulations Cross-tabulation is a method of combining separate variables into a single table. Normally, each variable has its own table. If you have selected two or three variables (not counting All Adults), when you go to the Edit Reports step, you will automatically get a list with one table for each
P a g e | 54
variable (including one for All Adults); at the end of that list, you will get one cross-tabulation for the two or three variables selected.
If you have chosen four or more variables (not counting All Adults) you will get tables for each variable, but you will not get the cross-tabulation.
Be advised that if you go back to add another variable without removing one variable (to keep the total under four) you will lose any edits you might have made to the cross-tabulation.
5. Statistical Notations and Other Notes Statistical notations and other notes are found at the end of a data table, as applicable to that table:
— Not available. † Not applicable. (Data were not collected or not reported.) # The statistic rounds to zero. ‡ Reporting standards not met. (Did not meet reporting standard.) NOTE: A general note pertains to any special characteristics of the data in the table. SOURCE: Source information is listed for all PIAAC data and should be cited when data are used in a publication or presentation.
Calculation of averages
The IDE generates the average of all jurisdictions included in the IDE for the selected measures and variables if Average of All Jurisdictions is chosen under Jurisdiction. This average generated by the IDE is based on 19 OECD national and 4 sub-national entities [Flanders (Belgium), England and Northern Ireland (UK)] and 1 partner country (Cyprus) in PIAAC 2012/2014, 5 OECD national or sub-national entities in ALL 2003-2008, and 15 OECD national or sub-national entities in IALS 1994-1998.
Please note that there might be differences between the averages generated by the IDE and the OECD averages for literacy, numeracy and problem solving in technology-rich environments (PS-TRE) published in the PIAAC 2012/2014 OECD and NCES reports. Furthermore, the Average of All Jurisdictions generated by the IDE might differ from previously published results in OECD and NCES reports using PIAAC 2012/2014, ALL 2003-2008, and IALS 1994-1998 data. These differences might be due to the country composition of the averages.
Linking error
PIAAC 2012/2014, ALL 2003-2008, and IALS 1994-1998 are linked assessments. That is, the sets of items used to assess literacy, numeracy and problem solving in technology-rich environments in these years and studies include a subset of common items, referred to as trend items. To establish common reporting metrics for PIAAC, the difficulty of the link items, measured on different occasions, is compared. The comparison of the item difficulties on the
P a g e | 55
different occasions is used to determine a score transformation that allows the reporting of the data on a common scale.
As each item provides slightly different information about the link transformation, it follows that the chosen sample of link items will influence the estimated transformation. The consequence is an uncertainty in the transformation due to the sampling of link items, just as there is an uncertainty in country means due to the sampling of adults.
The uncertainty that results from the link-item sampling is referred to as linking error, and this error must be taken into account when making certain comparisons using the PIAAC 2012/2014, ALL 2003-2008, and IALS 1994-1998 data. As with sampling errors, the likely range of magnitude for the errors is represented as a standard error. Significance tests for scores across years within the IDE take into account the linking errors applicable to each subject.