Embed Size (px)
Citation preview
U.S. Retail IndustryHome Depot | Costco | Walmart
Presented By:
Caitlin LloydHans TantioJacob KlimowiczJoe ZhouPascal Setiadi
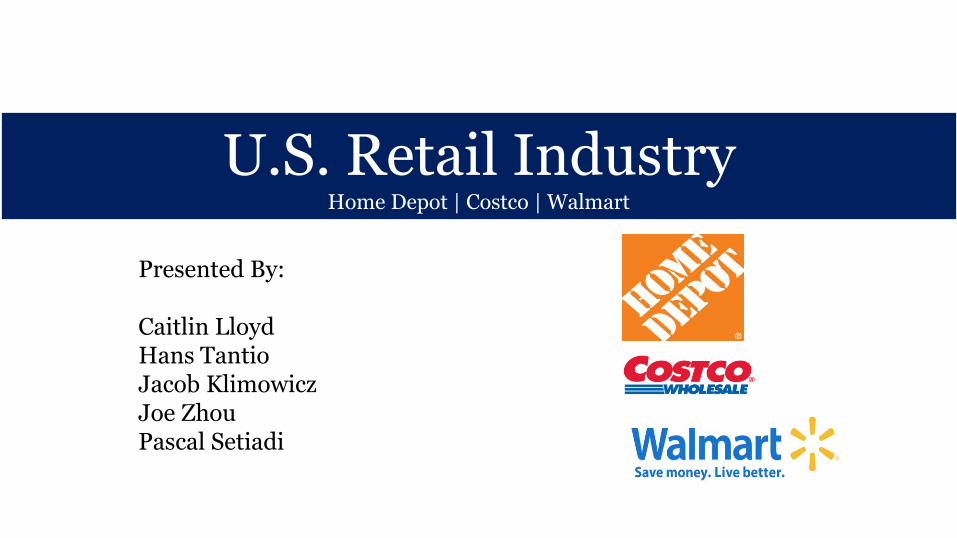
• Retail is the process of selling consumer goods and/or services to customers through multiple channels of distribution to earn a profit.
• According to IBISWorld, retail sales in the U.S. reached $4.49 trillion in 2015. Globally, retail sales surpassed $24 trillion in 2015.
U.S. Retail Industry Overview
2
U.S. Retail Industry OverviewU.S. Retail Industry Overview
3
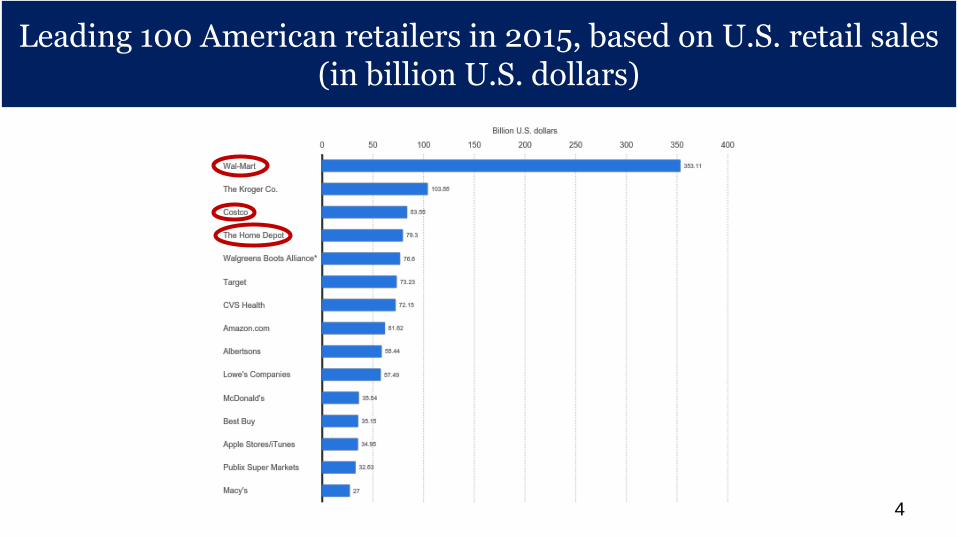
Leading 100 American retailers in 2015, based on U.S. retail sales (in billion U.S. dollars)
Leading 100 American retailers in 2015, based on U.S. retail sales (in billion U.S. dollars)
4
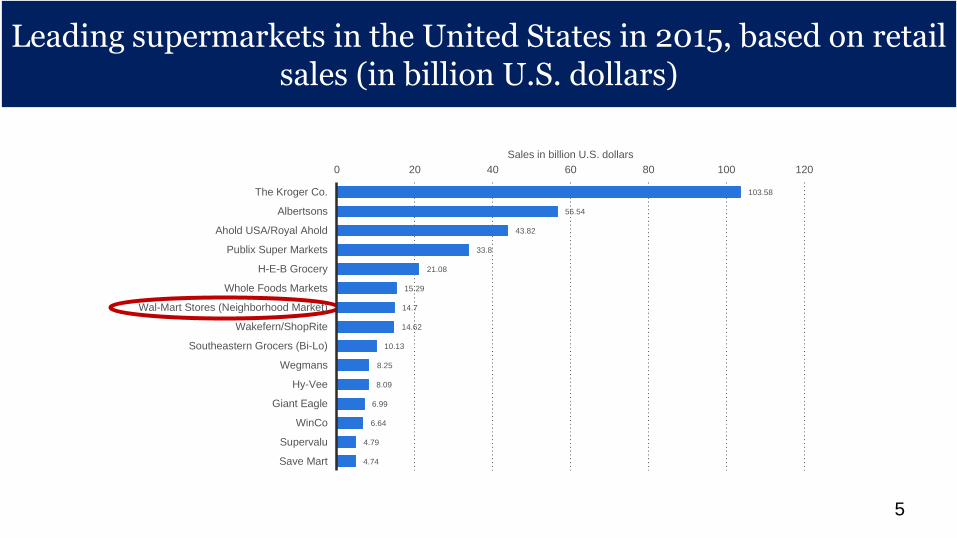
Leading supermarkets in the United States in 2015, based on retail sales (in billion U.S. dollars)
Leading supermarkets in the United States in 2015, based on retail sales (in billion U.S. dollars)
5
103.58
56.54
43.82
33.8
21.08
15.29
14.7
14.62
10.13
8.25
8.09
6.99
6.64
4.79
4.74
0 20 40 60 80 100 120
The Kroger Co.
Albertsons
Ahold USA/Royal Ahold
Publix Super Markets
H-E-B Grocery
Whole Foods Markets
Wal-Mart Stores (Neighborhood Market)
Wakefern/ShopRite
Southeastern Grocers (Bi-Lo)
Wegmans
Hy-Vee
Giant Eagle
WinCo
Supervalu
Save Mart
Sales in billion U.S. dollars
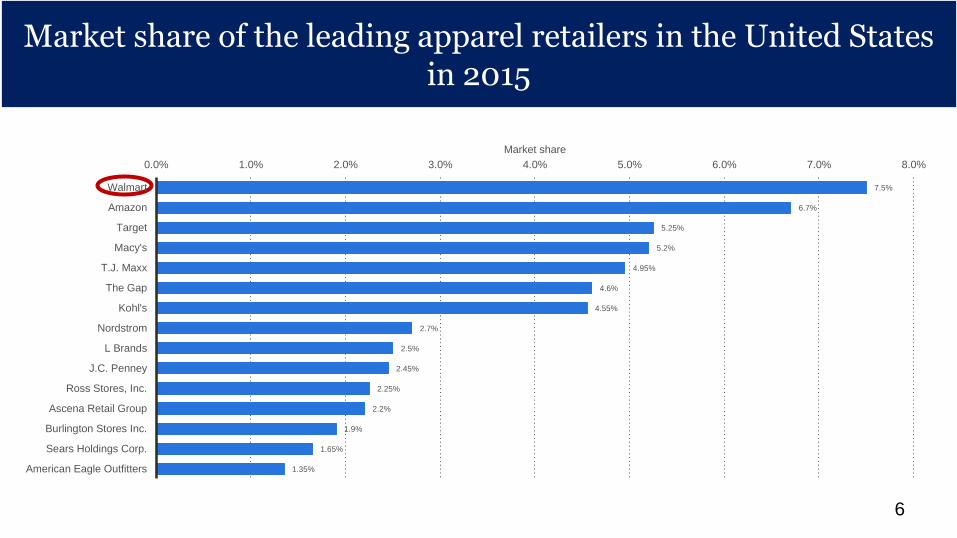
Market share of the leading apparel retailers in the United States in 2015
Market share of the leading apparel retailers in the United States in 2015
6
7.5%
6.7%
5.25%
5.2%
4.95%
4.6%
4.55%
2.7%
2.5%
2.45%
2.25%
2.2%
1.9%
1.65%
1.35%
0.0% 1.0% 2.0% 3.0% 4.0% 5.0% 6.0% 7.0% 8.0%
Walmart
Amazon
Target
Macy's
T.J. Maxx
The Gap
Kohl's
Nordstrom
L Brands
J.C. Penney
Ross Stores, Inc.
Ascena Retail Group
Burlington Stores Inc.
Sears Holdings Corp.
American Eagle Outfitters
Market share
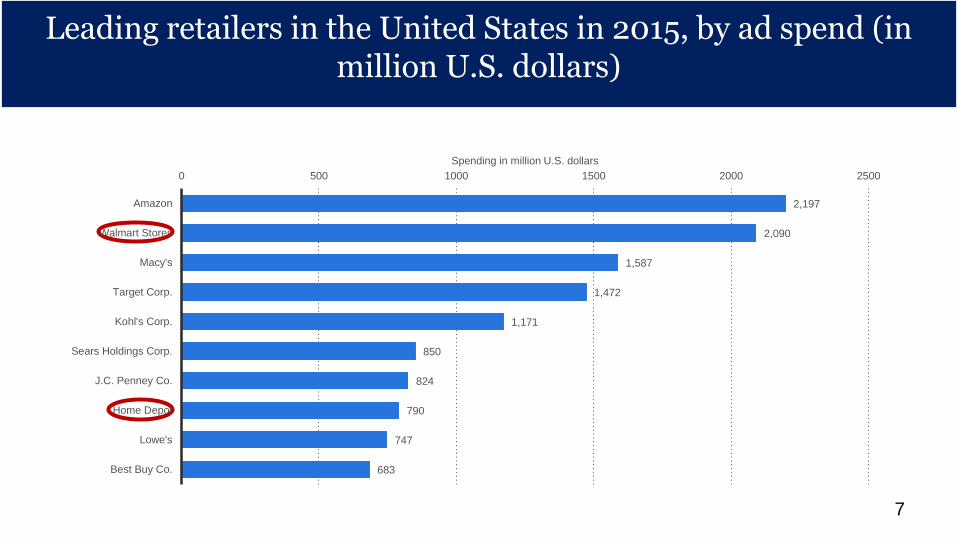
Leading retailers in the United States in 2015, by ad spend (in million U.S. dollars)
Leading retailers in the United States in 2015, by ad spend (in million U.S. dollars)
7
2,197
2,090
1,587
1,472
1,171
850
824
790
747
683
0 500 1000 1500 2000 2500
Amazon
Walmart Stores
Macy's
Target Corp.
Kohl's Corp.
Sears Holdings Corp.
J.C. Penney Co.
Home Depot
Lowe's
Best Buy Co.
Spending in million U.S. dollars
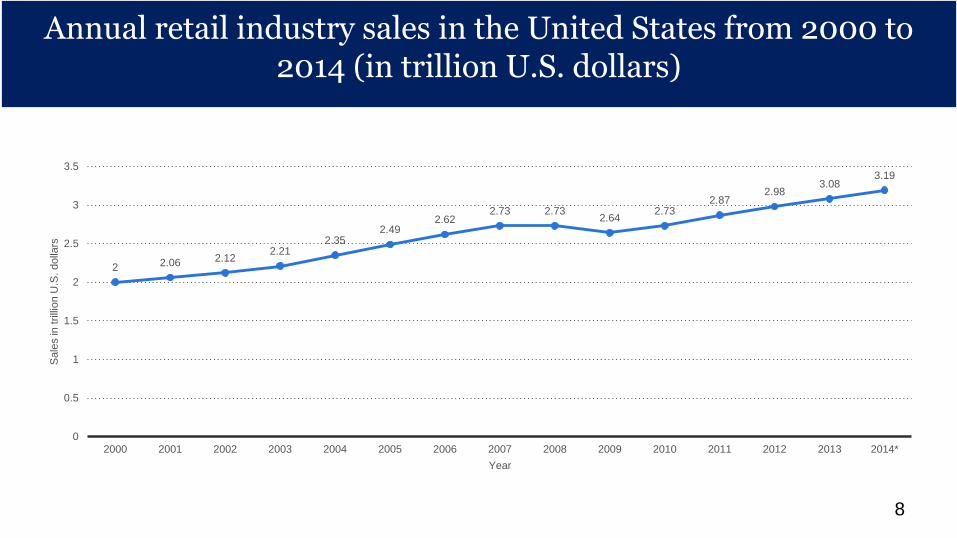
Annual retail industry sales in the United States from 2000 to 2014 (in trillion U.S. dollars)
Annual retail industry sales in the United States from 2000 to 2014 (in trillion U.S. dollars)
8
2 2.06 2.122.21
2.352.49
2.622.73 2.73
2.642.73
2.872.98
3.083.19
0
0.5
1
1.5
2
2.5
3
3.5
2000 2001 2002 2003 2004 2005 2006 2007 2008 2009 2010 2011 2012 2013 2014*
Sale
s in
trilli
on U
.S. dolla
rs
Year
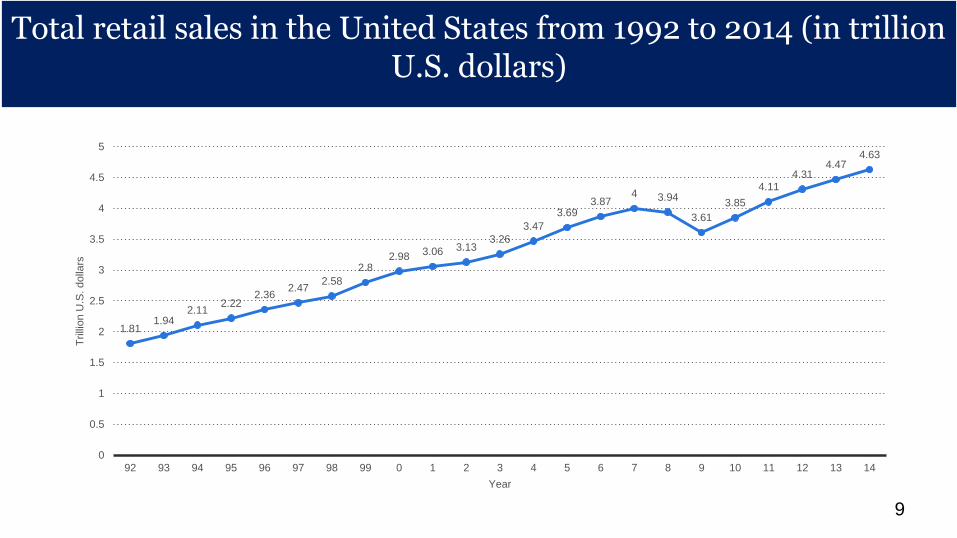
Total retail sales in the United States from 1992 to 2014 (in trillion U.S. dollars)
Total retail sales in the United States from 1992 to 2014 (in trillion U.S. dollars)
9
1.811.94
2.112.22
2.362.47
2.58
2.82.98 3.06 3.13
3.26
3.47
3.693.87
4 3.94
3.61
3.85
4.114.31
4.474.63
0
0.5
1
1.5
2
2.5
3
3.5
4
4.5
5
92 93 94 95 96 97 98 99 0 1 2 3 4 5 6 7 8 9 10 11 12 13 14
Trilli
on U
.S. dolla
rs
Year
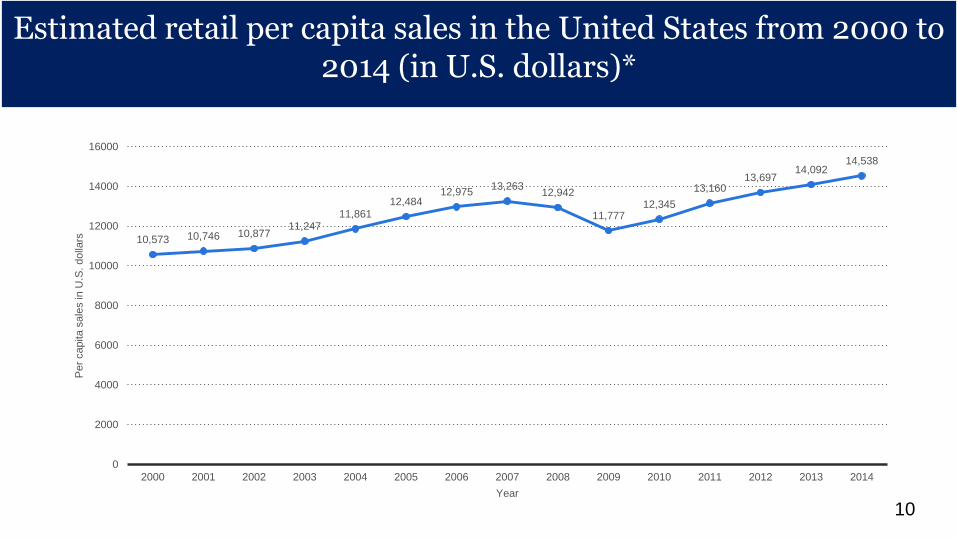
Estimated retail per capita sales in the United States from 2000 to 2014 (in U.S. dollars)*
Estimated retail per capita sales in the United States from 2000 to 2014 (in U.S. dollars)*
10
10,573 10,746 10,87711,247
11,86112,484
12,97513,263
12,942
11,77712,345
13,16013,697
14,09214,538
0
2000
4000
6000
8000
10000
12000
14000
16000
2000 2001 2002 2003 2004 2005 2006 2007 2008 2009 2010 2011 2012 2013 2014
Per
capita s
ale
s in
U.S
. dolla
rs
Year
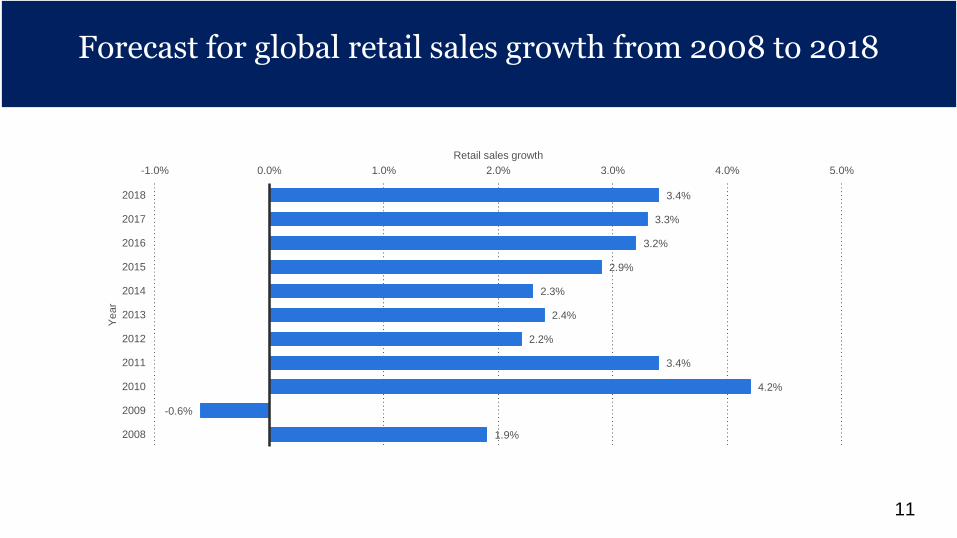
Forecast for global retail sales growth from 2008 to 2018Forecast for global retail sales growth from 2008 to 2018
11
3.4%
3.3%
3.2%
2.9%
2.3%
2.4%
2.2%
3.4%
4.2%
-0.6%
1.9%
-1.0% 0.0% 1.0% 2.0% 3.0% 4.0% 5.0%
2018
2017
2016
2015
2014
2013
2012
2011
2010
2009
2008
Retail sales growth
Year
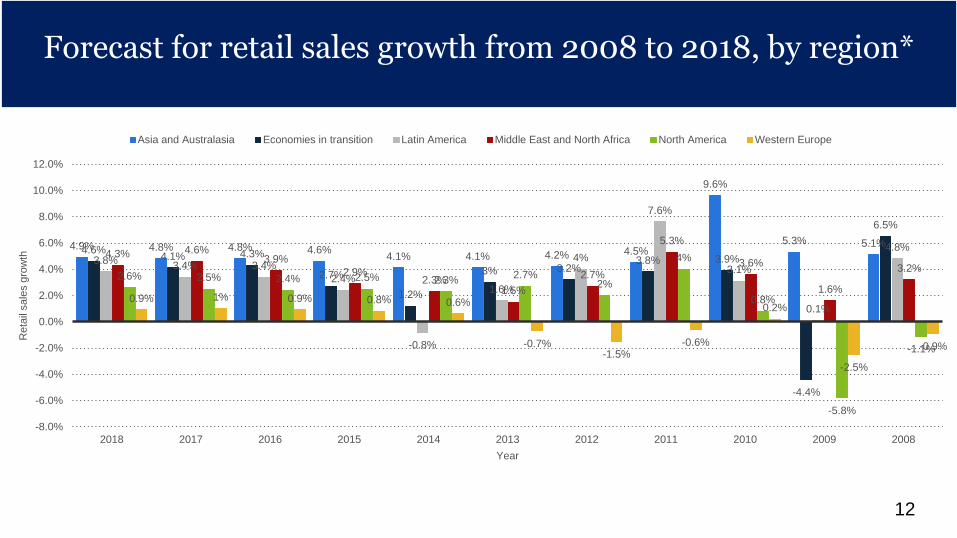
Forecast for retail sales growth from 2008 to 2018, by region*
Forecast for retail sales growth from 2008 to 2018, by region*
12
4.9% 4.8% 4.8% 4.6%4.1% 4.1% 4.2% 4.5%
9.6%
5.3% 5.1%4.6%
4.1% 4.3%
2.7%
1.2%
3% 3.2%3.8% 3.9%
-4.4%
6.5%
3.8%3.4% 3.4%
2.4%
-0.8%
1.6%
4%
7.6%
3.1%
0.1%
4.8%4.3% 4.6%
3.9%
2.9%2.3%
1.5%
2.7%
5.3%
3.6%
1.6%
3.2%2.6% 2.5% 2.4% 2.5% 2.3%
2.7%2%
4%
0.8%
-5.8%
-1.1%
0.9% 1% 0.9% 0.8% 0.6%
-0.7%-1.5%
-0.6%
0.2%
-2.5%
-0.9%
-8.0%
-6.0%
-4.0%
-2.0%
0.0%
2.0%
4.0%
6.0%
8.0%
10.0%
12.0%
2018 2017 2016 2015 2014 2013 2012 2011 2010 2009 2008
Reta
il sale
s g
row
th
Year
Asia and Australasia Economies in transition Latin America Middle East and North Africa North America Western Europe
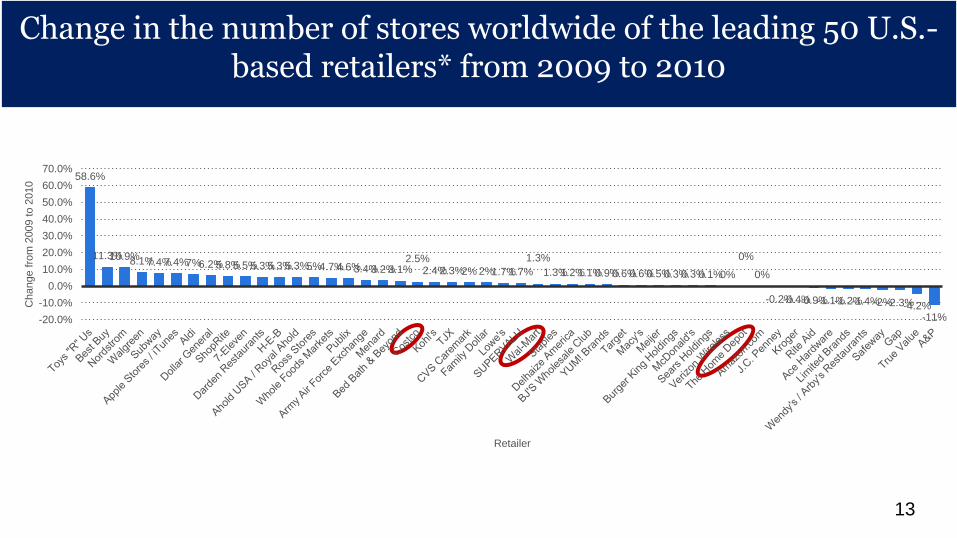
Change in the number of stores worldwide of the leading 50 U.S.-based retailers* from 2009 to 2010
Change in the number of stores worldwide of the leading 50 U.S.-based retailers* from 2009 to 2010
13
58.6%
11.3%10.9%8.1%7.4%7.4%7%6.2%5.8%5.5%5.3%5.3%5.3%5%4.7%4.6%3.4%3.2%3.1%2.5%
2.4%2.3%2% 2%1.7%1.7%
1.3%
1.3%1.2%1.1%0.9%0.6%0.6%0.5%0.3%0.3%0.1%0%
0%
0%
-0.2%-0.4%-0.9%-1.1%-1.2%-1.4%-2%-2.3%-4.2%-11%-20.0%
-10.0%
0.0%
10.0%
20.0%
30.0%
40.0%
50.0%
60.0%
70.0%
Change f
rom
2009 t
o 2
010
Retailer
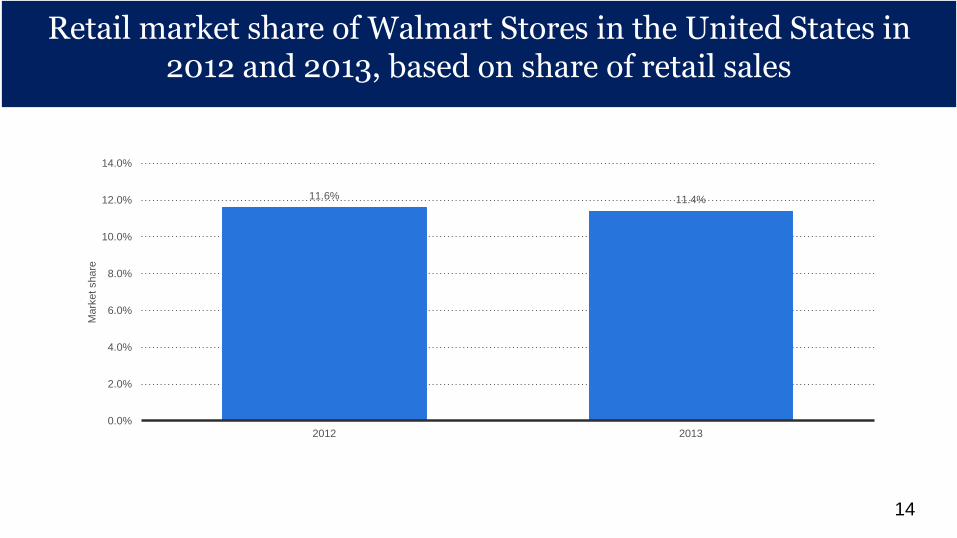
Retail market share of Walmart Stores in the United States in 2012 and 2013, based on share of retail sales
Retail market share of Walmart Stores in the United States in 2012 and 2013, based on share of retail sales
14
11.6% 11.4%
0.0%
2.0%
4.0%
6.0%
8.0%
10.0%
12.0%
14.0%
2012 2013
Mark
et share
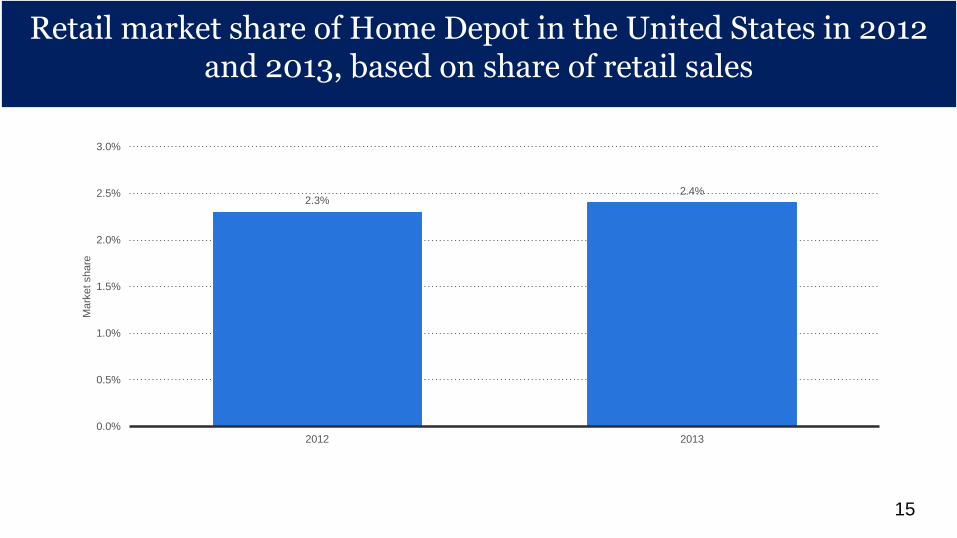
Retail market share of Home Depot in the United States in 2012 and 2013, based on share of retail sales
Retail market share of Home Depot in the United States in 2012 and 2013, based on share of retail sales
15
2.3%2.4%
0.0%
0.5%
1.0%
1.5%
2.0%
2.5%
3.0%
2012 2013
Mark
et share
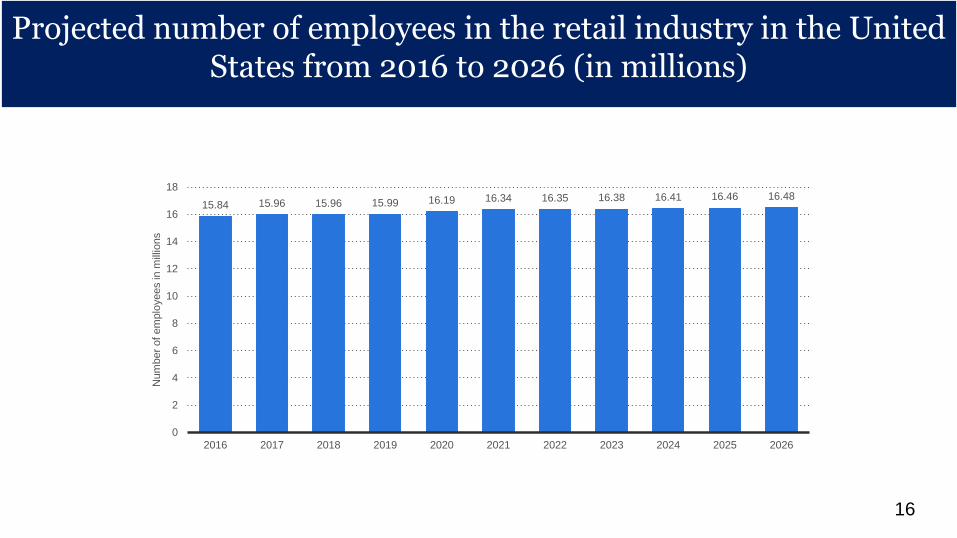
Projected number of employees in the retail industry in the United States from 2016 to 2026 (in millions)
Projected number of employees in the retail industry in the United States from 2016 to 2026 (in millions)
16
15.84 15.96 15.96 15.99 16.19 16.34 16.35 16.38 16.41 16.46 16.48
0
2
4
6
8
10
12
14
16
18
2016 2017 2018 2019 2020 2021 2022 2023 2024 2025 2026
Num
ber
of em
plo
yees in
mill
ions
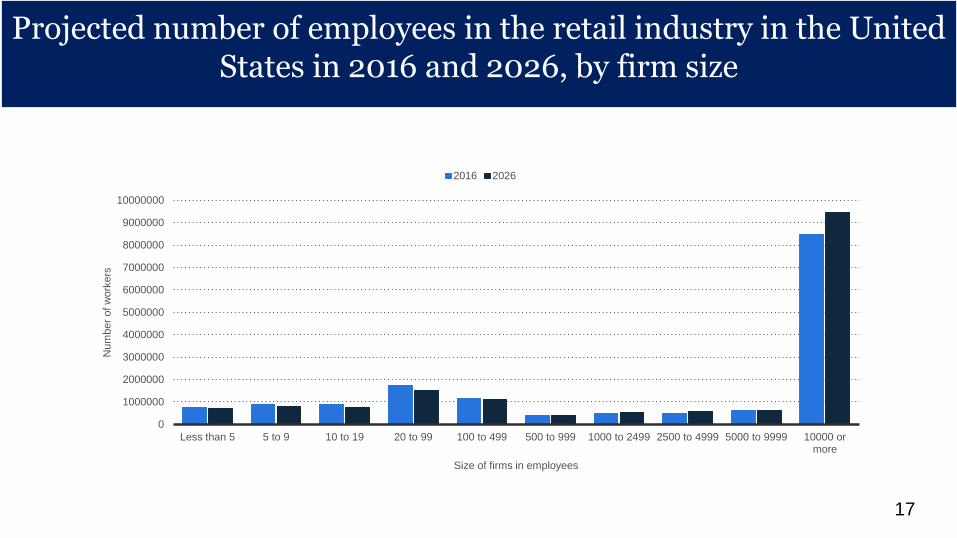
Projected number of employees in the retail industry in the United States in 2016 and 2026, by firm size
Projected number of employees in the retail industry in the United States in 2016 and 2026, by firm size
17
0
1000000
2000000
3000000
4000000
5000000
6000000
7000000
8000000
9000000
10000000
Less than 5 5 to 9 10 to 19 20 to 99 100 to 499 500 to 999 1000 to 2499 2500 to 4999 5000 to 9999 10000 ormore
Num
ber
of w
ork
ers
Size of firms in employees
2016 2026
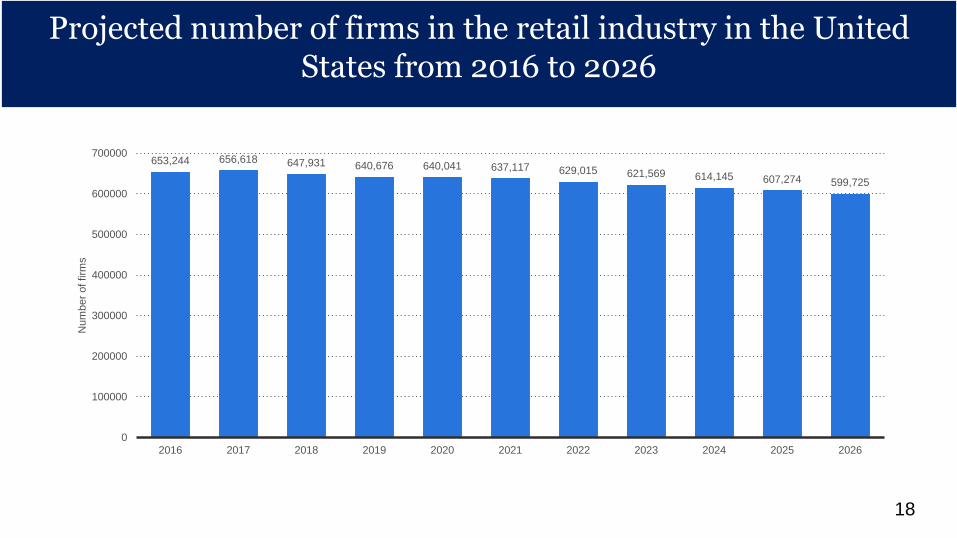
Projected number of firms in the retail industry in the United States from 2016 to 2026
Projected number of firms in the retail industry in the United States from 2016 to 2026
18
653,244 656,618 647,931 640,676 640,041 637,117 629,015 621,569 614,145 607,274 599,725
0
100000
200000
300000
400000
500000
600000
700000
2016 2017 2018 2019 2020 2021 2022 2023 2024 2025 2026
Num
ber
of firm
s
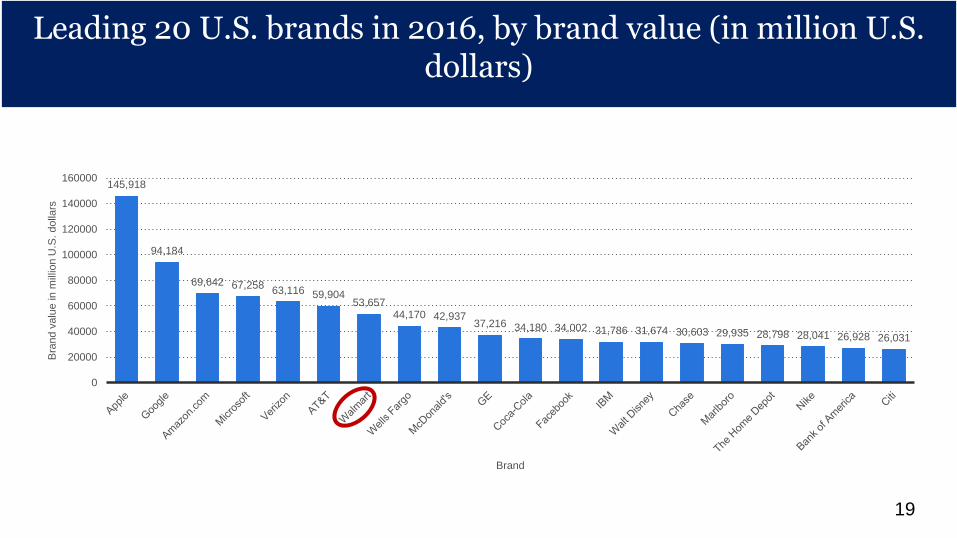
Leading 20 U.S. brands in 2016, by brand value (in million U.S. dollars)
Leading 20 U.S. brands in 2016, by brand value (in million U.S. dollars)
19
145,918
94,184
69,642 67,25863,116 59,904
53,65744,170 42,937
37,216 34,180 34,002 31,786 31,674 30,603 29,935 28,798 28,041 26,928 26,031
0
20000
40000
60000
80000
100000
120000
140000
160000
Bra
nd v
alu
e in
mill
ion U
.S. dolla
rs
Brand
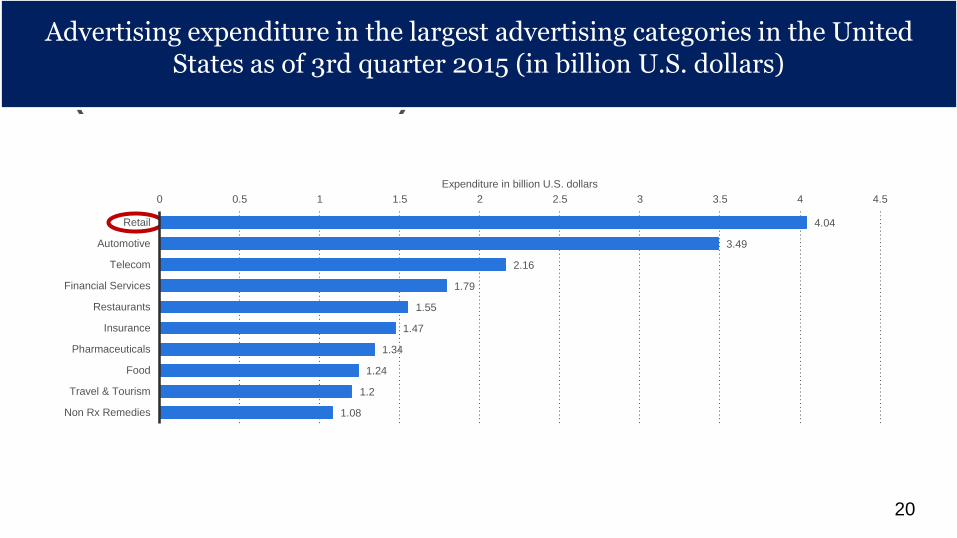
Advertising expenditure in the largest advertising categories in the United States as of 3rd quarter 2015 (in billion U.S. dollars)
Advertising expenditure in the largest advertising categories in the United States as of 3rd quarter 2015 (in billion U.S. dollars)
20
4.04
3.49
2.16
1.79
1.55
1.47
1.34
1.24
1.2
1.08
0 0.5 1 1.5 2 2.5 3 3.5 4 4.5
Retail
Automotive
Telecom
Financial Services
Restaurants
Insurance
Pharmaceuticals
Food
Travel & Tourism
Non Rx Remedies
Expenditure in billion U.S. dollars
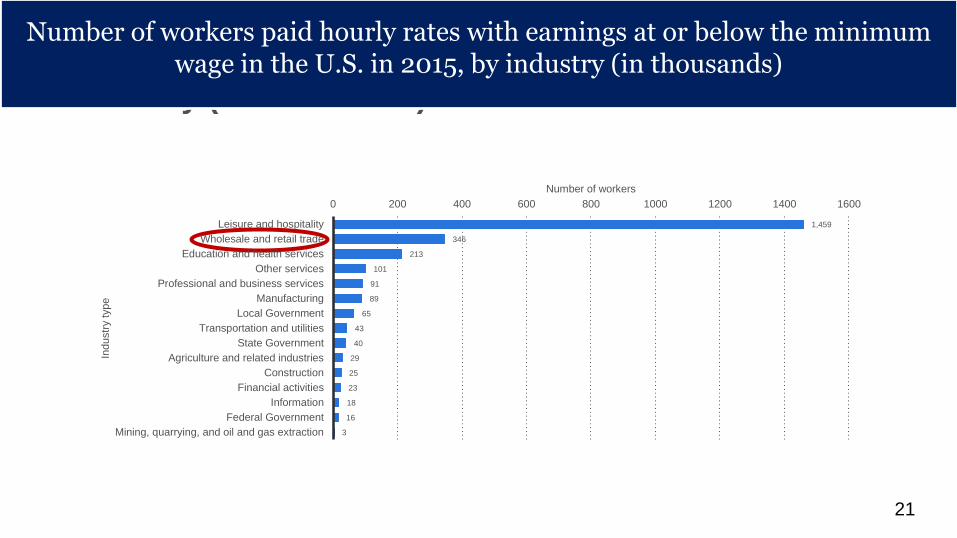
Number of workers paid hourly rates with earnings at or below the minimum wage in the U.S. in 2015, by industry (in thousands)
Number of workers paid hourly rates with earnings at or below the minimum wage in the U.S. in 2015, by industry (in thousands)
21
1,459
346
213
101
91
89
65
43
40
29
25
23
18
16
3
0 200 400 600 800 1000 1200 1400 1600
Leisure and hospitality
Wholesale and retail trade
Education and health services
Other services
Professional and business services
Manufacturing
Local Government
Transportation and utilities
State Government
Agriculture and related industries
Construction
Financial activities
Information
Federal Government
Mining, quarrying, and oil and gas extraction
Number of workers
Industr
y type
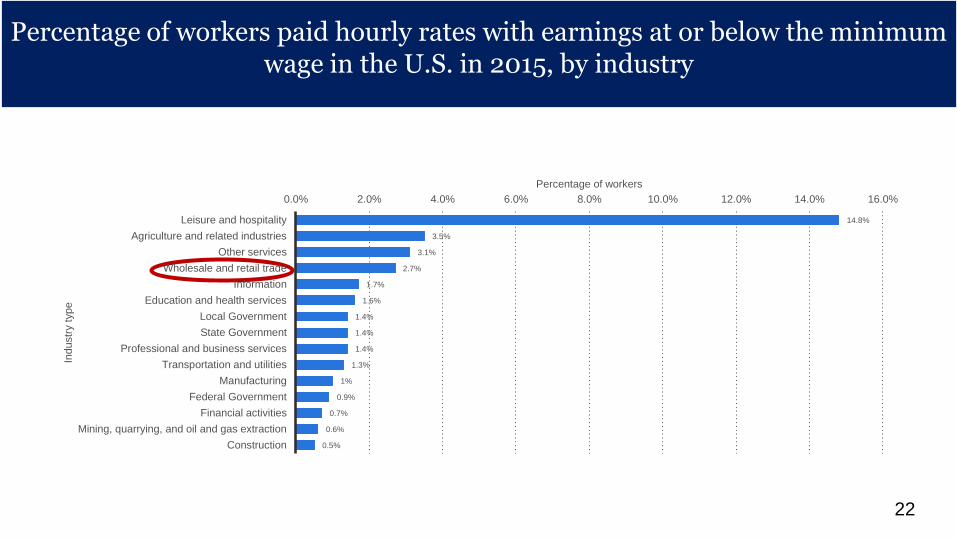
Percentage of workers paid hourly rates with earnings at or below the minimum wage in the U.S. in 2015, by industry
22
14.8%
3.5%
3.1%
2.7%
1.7%
1.6%
1.4%
1.4%
1.4%
1.3%
1%
0.9%
0.7%
0.6%
0.5%
0.0% 2.0% 4.0% 6.0% 8.0% 10.0% 12.0% 14.0% 16.0%
Leisure and hospitality
Agriculture and related industries
Other services
Wholesale and retail trade
Information
Education and health services
Local Government
State Government
Professional and business services
Transportation and utilities
Manufacturing
Federal Government
Financial activities
Mining, quarrying, and oil and gas extraction
Construction
Percentage of workers
Industr
y type
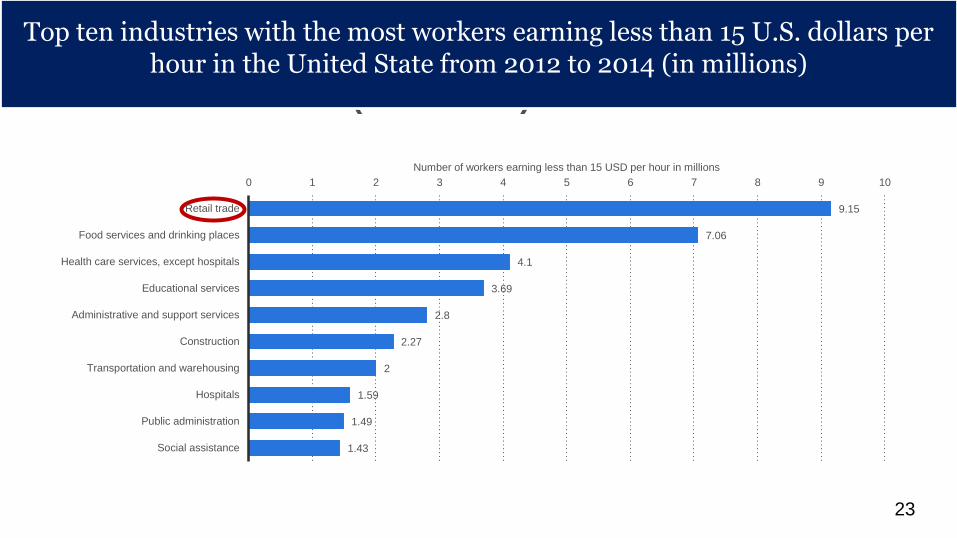
Top ten industries with the most workers earning less than 15 U.S. dollars per hour in the United State from 2012 to 2014 (in millions)
Top ten industries with the most workers earning less than 15 U.S. dollars per hour in the United State from 2012 to 2014 (in millions)
23
9.15
7.06
4.1
3.69
2.8
2.27
2
1.59
1.49
1.43
0 1 2 3 4 5 6 7 8 9 10
Retail trade
Food services and drinking places
Health care services, except hospitals
Educational services
Administrative and support services
Construction
Transportation and warehousing
Hospitals
Public administration
Social assistance
Number of workers earning less than 15 USD per hour in millions
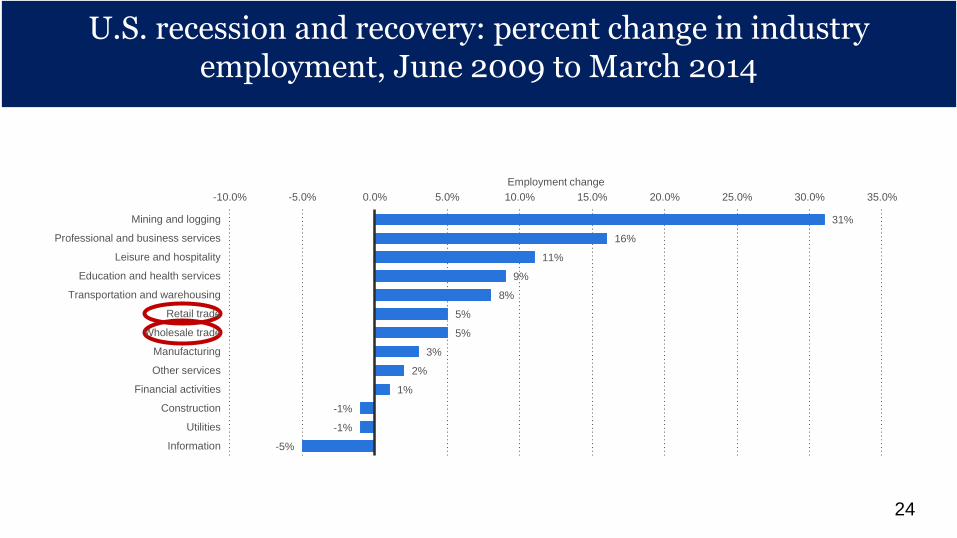
U.S. recession and recovery: percent change in industry employment, June 2009 to March 2014
U.S. recession and recovery: percent change in industry employment, June 2009 to March 2014
24
31%
16%
11%
9%
8%
5%
5%
3%
2%
1%
-1%
-1%
-5%
-10.0% -5.0% 0.0% 5.0% 10.0% 15.0% 20.0% 25.0% 30.0% 35.0%
Mining and logging
Professional and business services
Leisure and hospitality
Education and health services
Transportation and warehousing
Retail trade
Wholesale trade
Manufacturing
Other services
Financial activities
Construction
Utilities
Information
Employment change
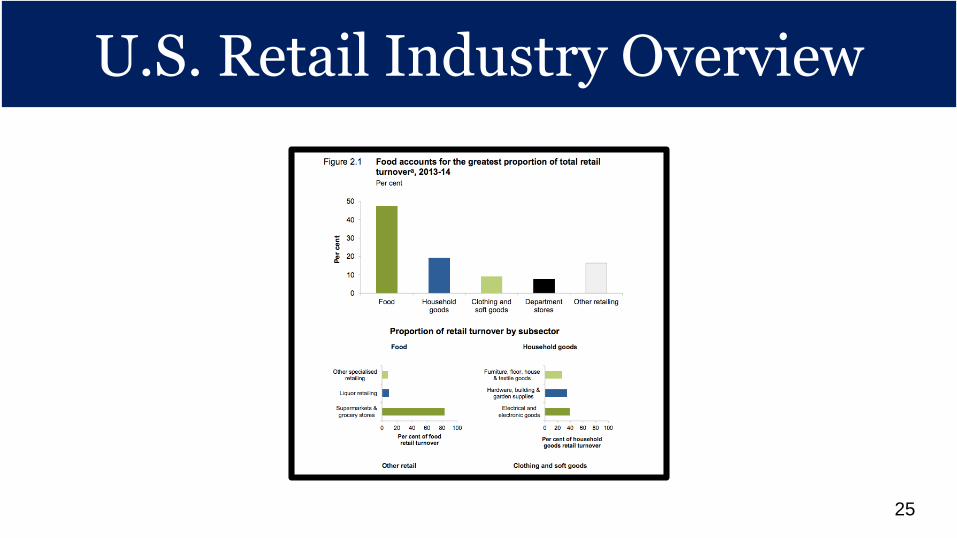
U.S. Retail Industry OverviewU.S. Retail Industry Overview
25
U.S. retail industry overview
• Sales per square foot is a popular sales metric used in the retailing industry. Sales per square foot is simply the average revenue a retail business creates for every square foot of sales space.
• Retail sales per square foot is a popular way for retailers to determine how successful store sales have been.
• The average regional mall sales per square foot is $341 and most big box retailers average between $250 to $350.
U.S. Retail Industry Overview
26
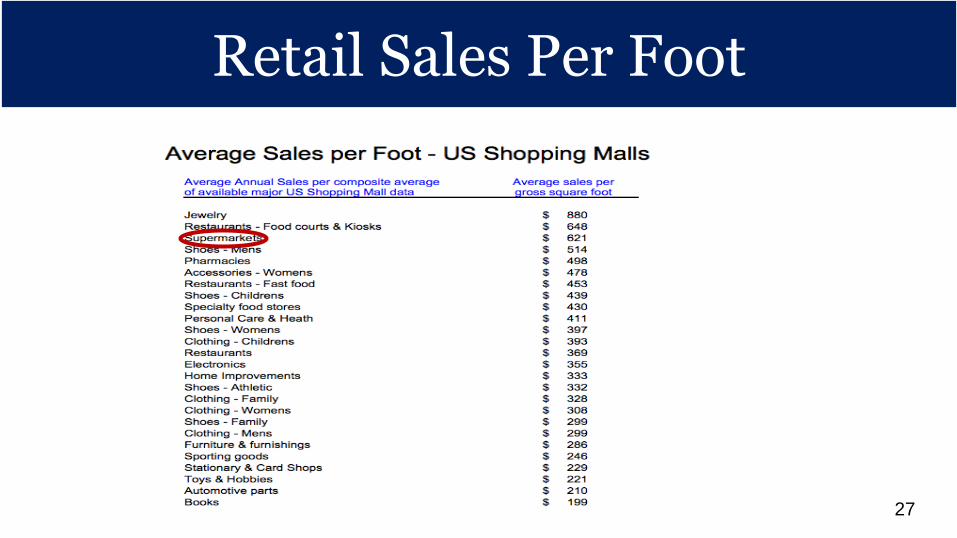
Retail sales per footRetail Sales Per Foot
27
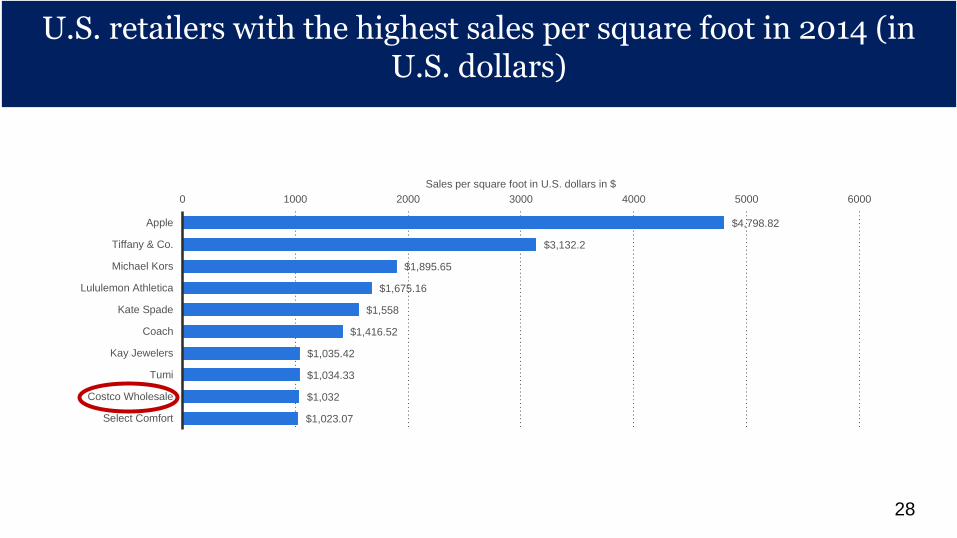
U.S. retailers with the highest sales per square foot in 2014 (in U.S. dollars)
U.S. retailers with the highest sales per square foot in 2014 (in U.S. dollars)
28
$4,798.82
$3,132.2
$1,895.65
$1,675.16
$1,558
$1,416.52
$1,035.42
$1,034.33
$1,032
$1,023.07
0 1000 2000 3000 4000 5000 6000
Apple
Tiffany & Co.
Michael Kors
Lululemon Athletica
Kate Spade
Coach
Kay Jewelers
Tumi
Costco Wholesale
Select Comfort
Sales per square foot in U.S. dollars in $
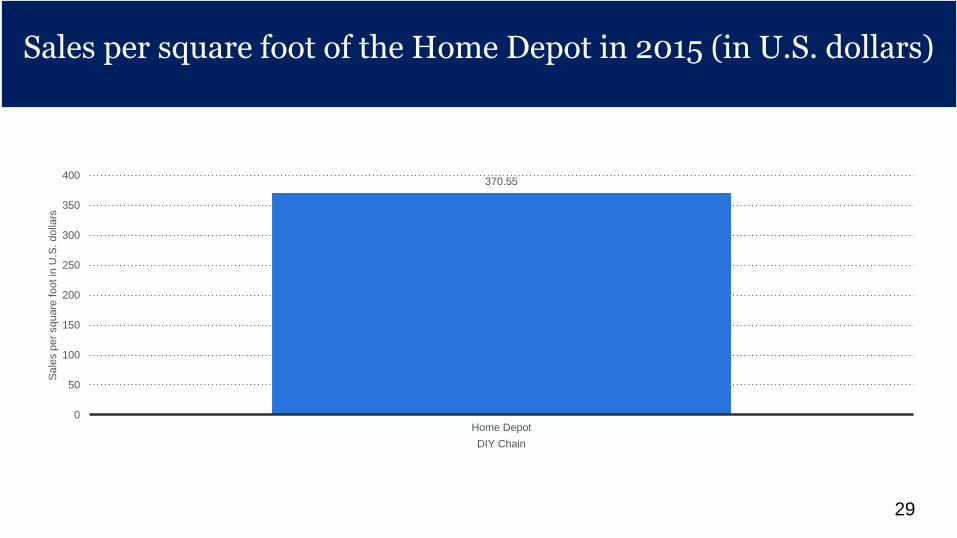
Sales per square foot of the Home Depot in 2015 (in U.S. dollars)
Sales per square foot of the Home Depot in 2015 (in U.S. dollars)
29
370.55
0
50
100
150
200
250
300
350
400
Home Depot
Sale
s p
er
square
foot in
U.S
. dolla
rs
DIY Chain
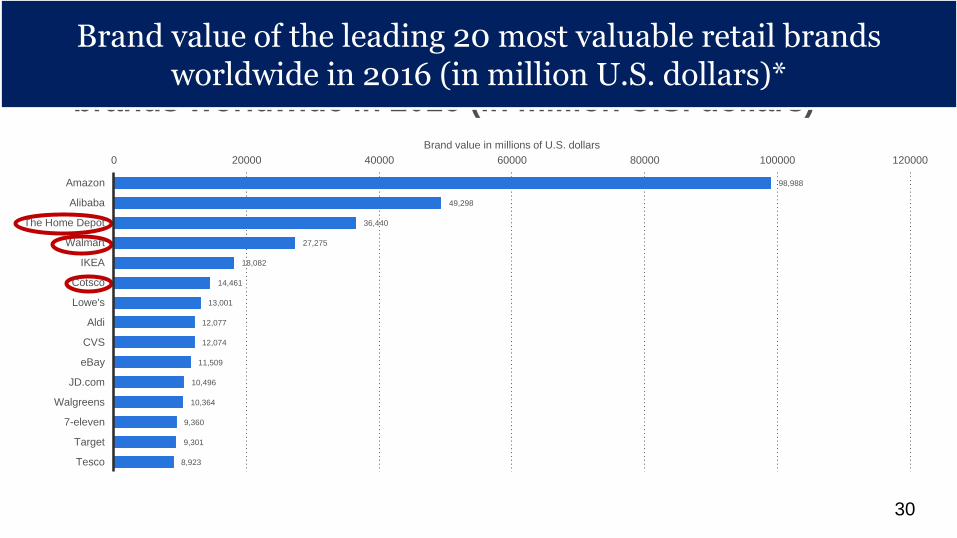
Brand value of the leading 20 most valuable retail
brands worldwide in 2016 (in million U.S. dollars)*
Brand value of the leading 20 most valuable retail brands worldwide in 2016 (in million U.S. dollars)*
30
98,988
49,298
36,440
27,275
18,082
14,461
13,001
12,077
12,074
11,509
10,496
10,364
9,360
9,301
8,923
0 20000 40000 60000 80000 100000 120000
Amazon
Alibaba
The Home Depot
Walmart
IKEA
Cotsco
Lowe's
Aldi
CVS
eBay
JD.com
Walgreens
7-eleven
Target
Tesco
Brand value in millions of U.S. dollars
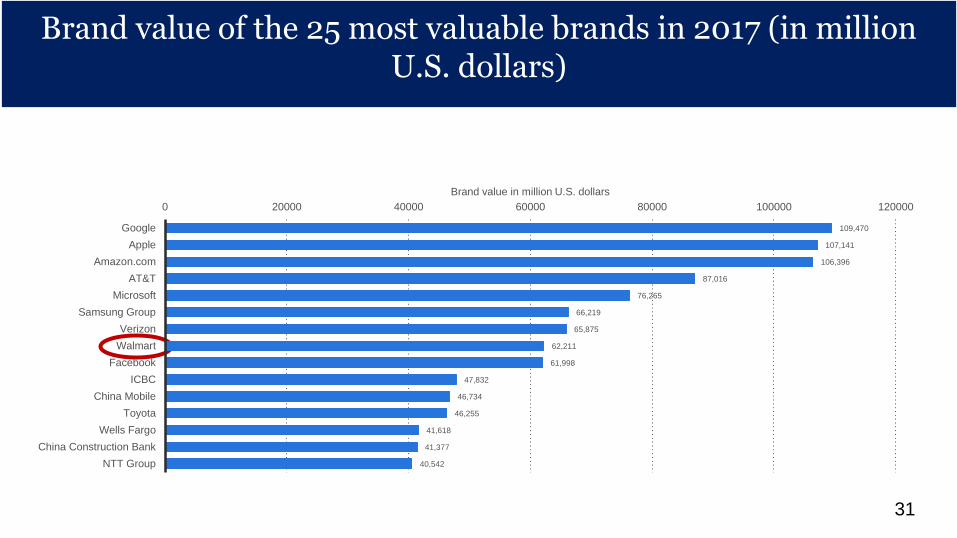
Brand value of the 25 most valuable brands in 2017 (in million U.S. dollars)
Brand value of the 25 most valuable brands in 2017 (in million U.S. dollars)
31
109,470
107,141
106,396
87,016
76,265
66,219
65,875
62,211
61,998
47,832
46,734
46,255
41,618
41,377
40,542
0 20000 40000 60000 80000 100000 120000
Apple
Amazon.com
AT&T
Microsoft
Samsung Group
Verizon
Walmart
ICBC
China Mobile
Toyota
Wells Fargo
China Construction Bank
NTT Group
Brand value in million U.S. dollars
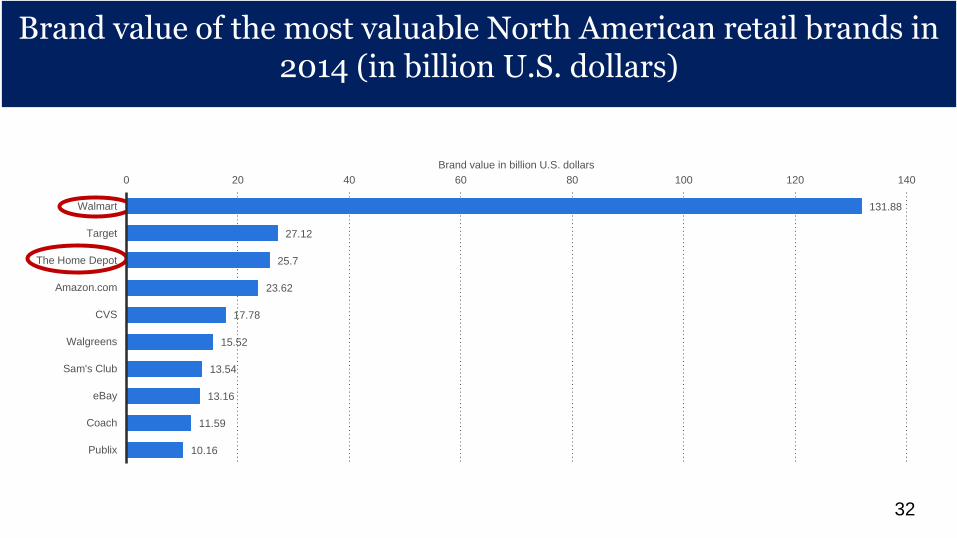
Brand value of the most valuable North American retail brands in 2014 (in billion U.S. dollars)
Brand value of the most valuable North American retail brands in 2014 (in billion U.S. dollars)
32
131.88
27.12
25.7
23.62
17.78
15.52
13.54
13.16
11.59
10.16
0 20 40 60 80 100 120 140
Walmart
Target
The Home Depot
Amazon.com
CVS
Walgreens
Sam's Club
eBay
Coach
Publix
Brand value in billion U.S. dollars
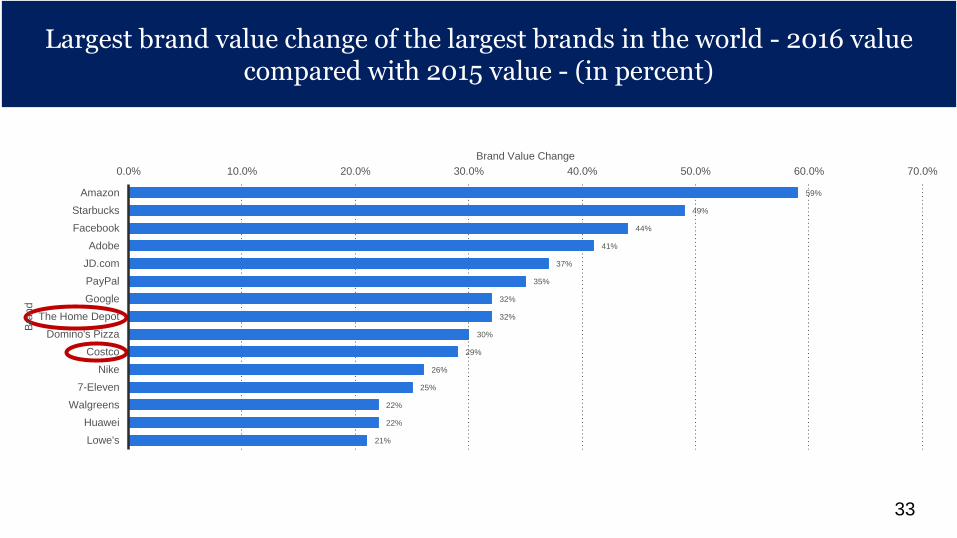
Largest brand value change of the largest brands in the world - 2016 value compared with 2015 value - (in percent)
33
59%
49%
44%
41%
37%
35%
32%
32%
30%
29%
26%
25%
22%
22%
21%
0.0% 10.0% 20.0% 30.0% 40.0% 50.0% 60.0% 70.0%
Amazon
Starbucks
Adobe
JD.com
PayPal
The Home Depot
Domino's Pizza
Costco
Nike
7-Eleven
Walgreens
Huawei
Lowe's
Brand Value Change
Bra
nd
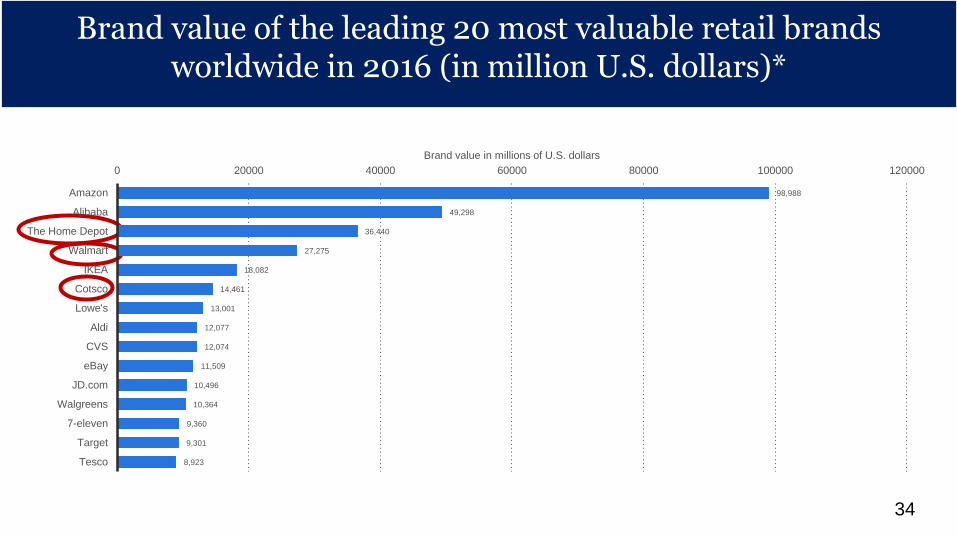
Brand value of the leading 20 most valuable retail brands worldwide in 2016 (in million U.S. dollars)*
Brand value of the leading 20 most valuable retail brands worldwide in 2016 (in million U.S. dollars)*
34
98,988
49,298
36,440
27,275
18,082
14,461
13,001
12,077
12,074
11,509
10,496
10,364
9,360
9,301
8,923
0 20000 40000 60000 80000 100000 120000
Amazon
Alibaba
The Home Depot
Walmart
IKEA
Cotsco
Lowe's
Aldi
CVS
eBay
JD.com
Walgreens
7-eleven
Target
Tesco
Brand value in millions of U.S. dollars
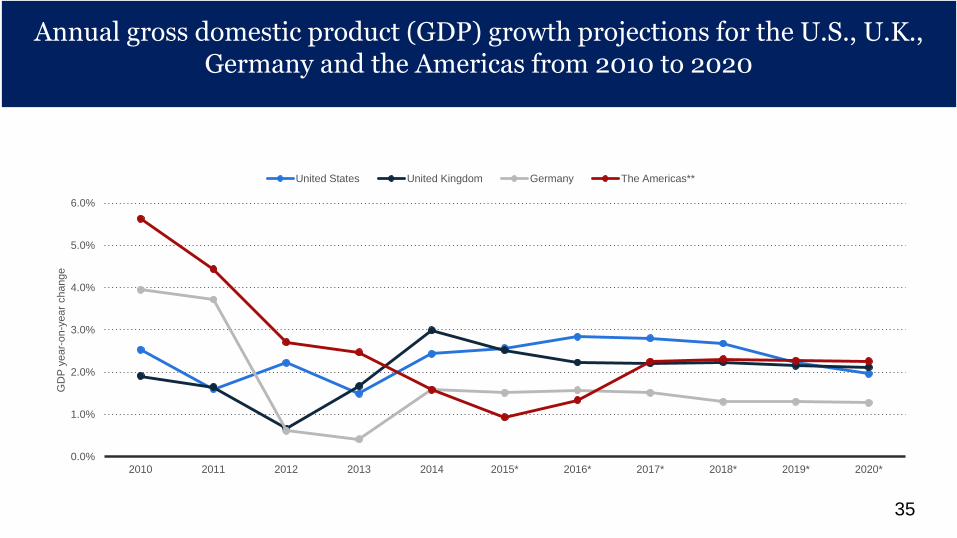
Annual gross domestic product (GDP) growth projections for the U.S., U.K., Germany and the Americas from 2010 to 2020
Annual gross domestic product (GDP) growth projections for the U.S., U.K., Germany and the Americas from 2010 to 2020
35
0.0%
1.0%
2.0%
3.0%
4.0%
5.0%
6.0%
2010 2011 2012 2013 2014 2015* 2016* 2017* 2018* 2019* 2020*
GD
P y
ear-
on-y
ear
change
United States United Kingdom Germany The Americas**
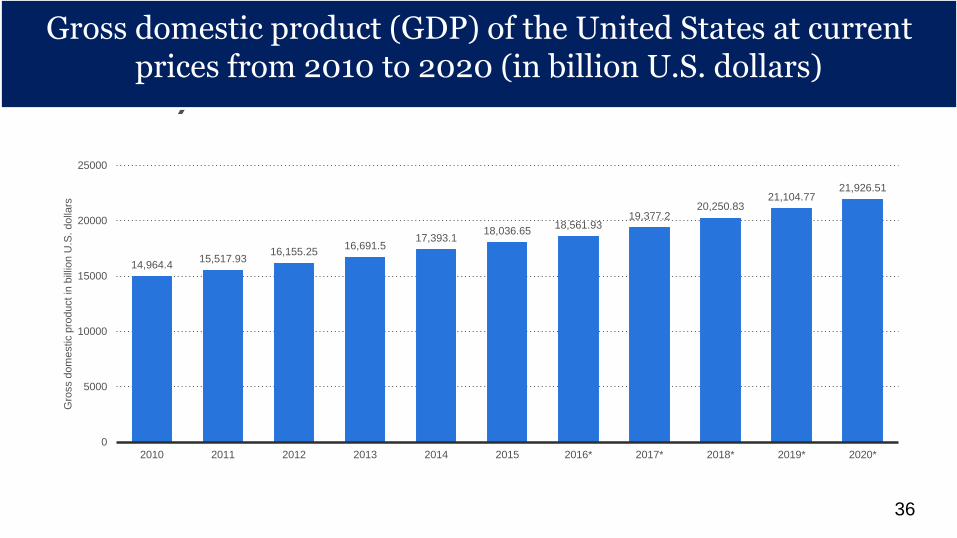
Gross domestic product (GDP) of the United States at current prices from 2010 to 2020 (in billion U.S. dollars)
Gross domestic product (GDP) of the United States at current prices from 2010 to 2020 (in billion U.S. dollars)
36
14,964.415,517.93
16,155.2516,691.5
17,393.118,036.65
18,561.9319,377.2
20,250.8321,104.77
21,926.51
0
5000
10000
15000
20000
25000
2010 2011 2012 2013 2014 2015 2016* 2017* 2018* 2019* 2020*
Gro
ss d
om
estic p
roduct in
bill
ion U
.S. dolla
rs
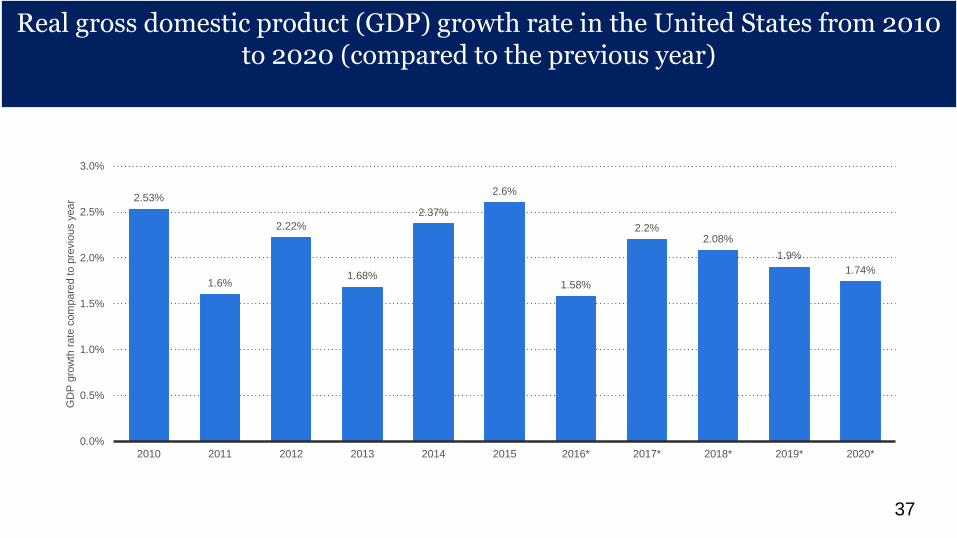
Real gross domestic product (GDP) growth rate in the United States from 2010 to 2020 (compared to the previous year)
Real gross domestic product (GDP) growth rate in the United States from 2010 to 2020 (compared to the previous year)
37
2.53%
1.6%
2.22%
1.68%
2.37%
2.6%
1.58%
2.2%2.08%
1.9%
1.74%
0.0%
0.5%
1.0%
1.5%
2.0%
2.5%
3.0%
2010 2011 2012 2013 2014 2015 2016* 2017* 2018* 2019* 2020*
GD
P g
row
th r
ate
com
pare
d to p
revio
us y
ear
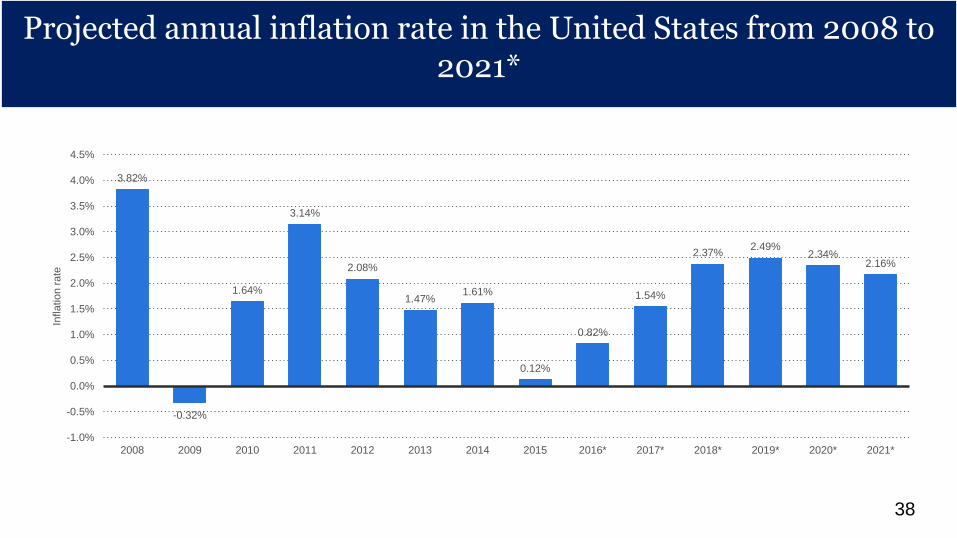
Projected annual inflation rate in the United States from 2008 to 2021*
Projected annual inflation rate in the United States from 2008 to 2021*
38
3.82%
-0.32%
1.64%
3.14%
2.08%
1.47%1.61%
0.12%
0.82%
1.54%
2.37%2.49%
2.34%2.16%
-1.0%
-0.5%
0.0%
0.5%
1.0%
1.5%
2.0%
2.5%
3.0%
3.5%
4.0%
4.5%
2008 2009 2010 2011 2012 2013 2014 2015 2016* 2017* 2018* 2019* 2020* 2021*
Infla
tio
n r
ate
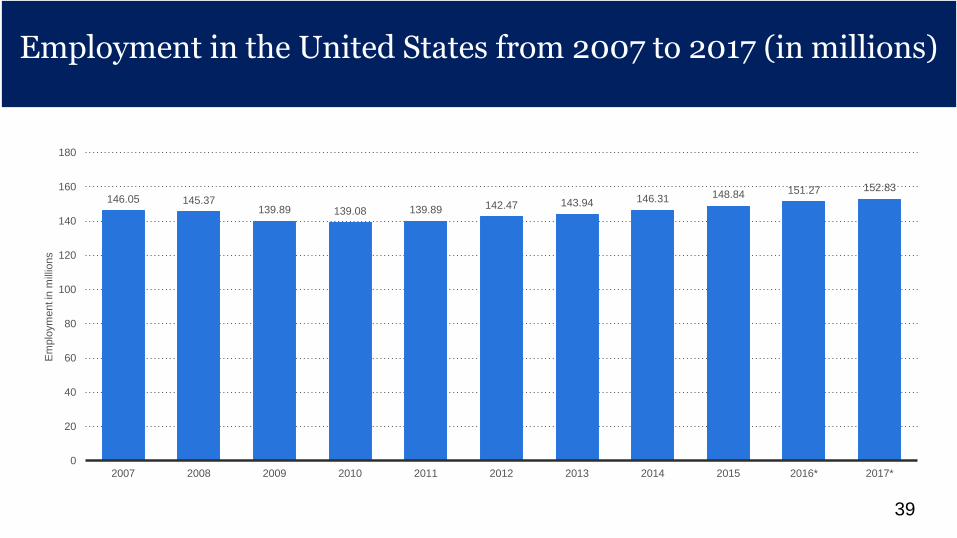
Employment in the United States from 2007 to 2017 (in millions)
Employment in the United States from 2007 to 2017 (in millions)
39
146.05 145.37139.89 139.08 139.89 142.47 143.94 146.31 148.84 151.27 152.83
0
20
40
60
80
100
120
140
160
180
2007 2008 2009 2010 2011 2012 2013 2014 2015 2016* 2017*
Em
plo
ym
ent in
mill
ions
Big-Box & Department Store Retailers:
•Broad range of general merchandise, such as apparel, jewelry, cosmetics, home furnishings, general household products, toys, appliances and sporting goods
•Discount department stores are also included
•Walmart, Best Buy, The Home Depot and Ikea
Warehouse Club & Supercenter Retailers:
•General line of grocery products, along with merchandise items.
•Warehouse clubs offer customers a wide selection of goods (often in bulk) at discounted prices, in exchange for a membership fee paid by each customer.
•Costco and BJ’s Wholesale Club
Structure of the Industry: competition and market dynamics
40
Supermarkets & Grocery Stores:
•General lines of food products, including fresh and prepared meats, poultry and seafood, canned and frozen foods, fresh fruits and vegetables and various dairy products
•Safeway, Whole Foods Market and The Kroger Company
E-tailers:
•Selling retail goods on the Internet
•Including e-commerce and online auction websites whose primary activity is selling goods online
Dell and Amazon.com
Structure of the Industry: competition and market dynamics
41
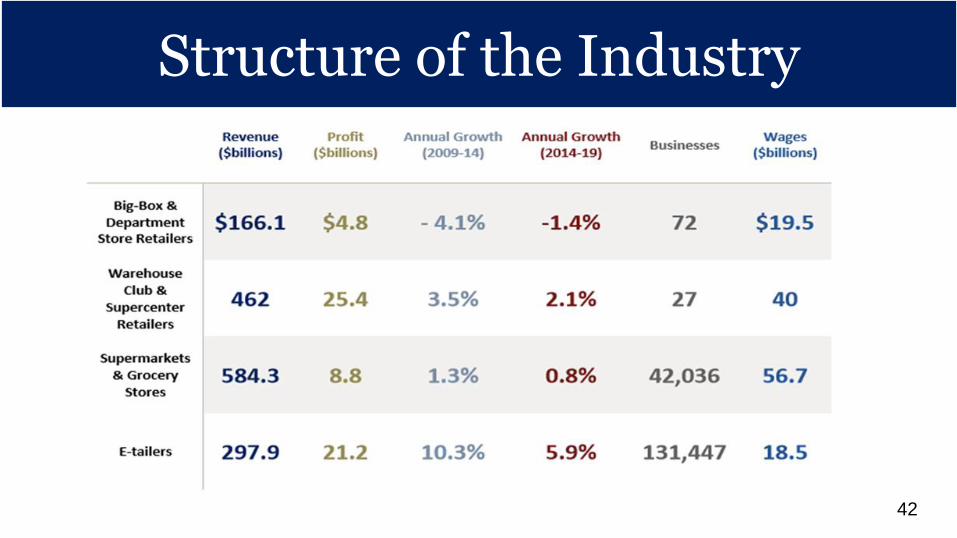
Structure of the IndustryStructure of the Industry
42
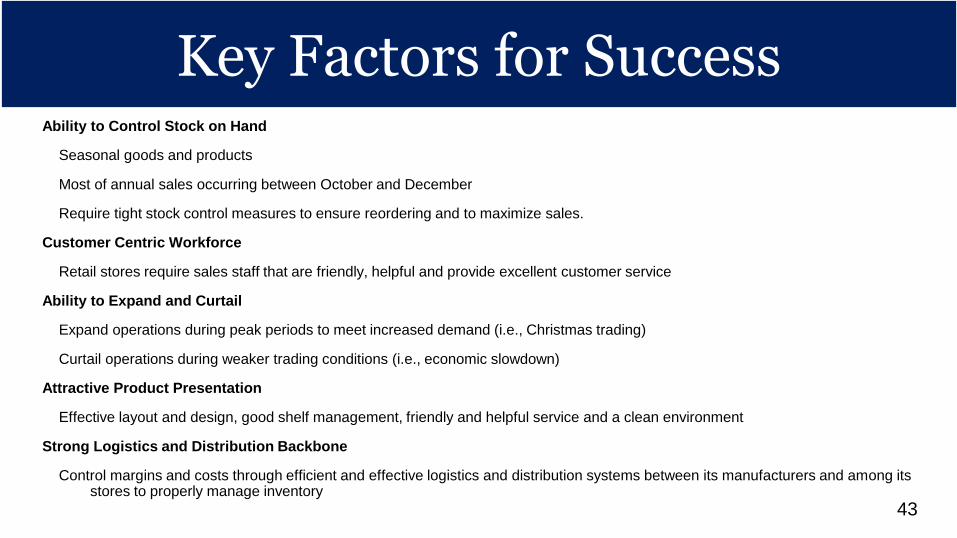
Key Factors for Success
Ability to Control Stock on Hand
Seasonal goods and products
Most of annual sales occurring between October and December
Require tight stock control measures to ensure reordering and to maximize sales.
Customer Centric Workforce
Retail stores require sales staff that are friendly, helpful and provide excellent customer service
Ability to Expand and Curtail
Expand operations during peak periods to meet increased demand (i.e., Christmas trading)
Curtail operations during weaker trading conditions (i.e., economic slowdown)
Attractive Product Presentation
Effective layout and design, good shelf management, friendly and helpful service and a clean environment
Strong Logistics and Distribution Backbone
Control margins and costs through efficient and effective logistics and distribution systems between its manufacturers and among its stores to properly manage inventory
Key Factors for Success
43
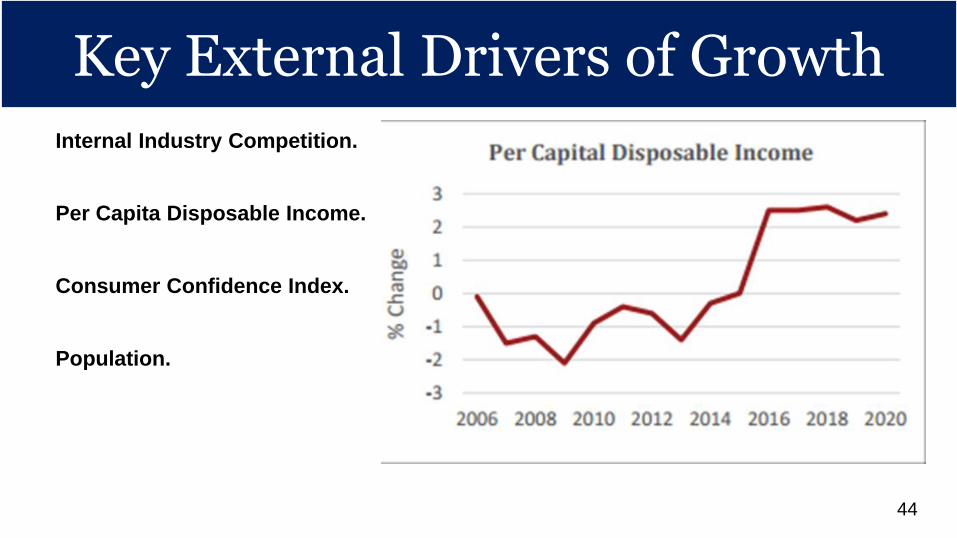
Key External Drivers of Growth
Internal Industry Competition.
Per Capita Disposable Income.
Consumer Confidence Index.
Population.
Key External Drivers of Growth
44
Retail Industry Mature Life Cycle
Industry value added (IVA): a measure of an industry or industry segment’s contribution to the U.S. economy
Decline phase: IVA falls below GDP
Growth phase: IVA outpaces GDP
Mature phase: IVA mirrors GDP
U.S. GDP is anticipated to rise an at annualized rate of 2.5% in the 10 years to 2020.
Retail Industry Mature Life Cycle
4545
Retail Industry Mature Life Cycle
The Big-Box & Department Store Retailer:
Decline phase
In the 10 years to 2020, IVA is expected to decline at an annualized rate of about 4.6%
The Warehouse Club & Supercenter Retailer:
Mature phase
In the 10 years to 2020, IVA is forecast to increase at a rate of 2.5% per year on average, mirroring U.S. GDP
Retail Industry Mature Life Cycle
46
Retail Industry Mature Life Cycle The Supermarkets and Grocery Stores:
Mature phase
The Supermarkets and Grocery Stores industry is in the mature stage of its life cycle. However, in the 10 years to 2020, IVA is expected to increase at a relatively slow rate of 0.6% per year on average.
The E-tailer:
Growth phase
In the 10 years to 2020, IVA is expected to increase at an average annual rate of 12.8%. High IVA growth relative to the economy as a whole is highly indicative of a growing life cycle stage.
Retail Industry Mature Life Cycle
47
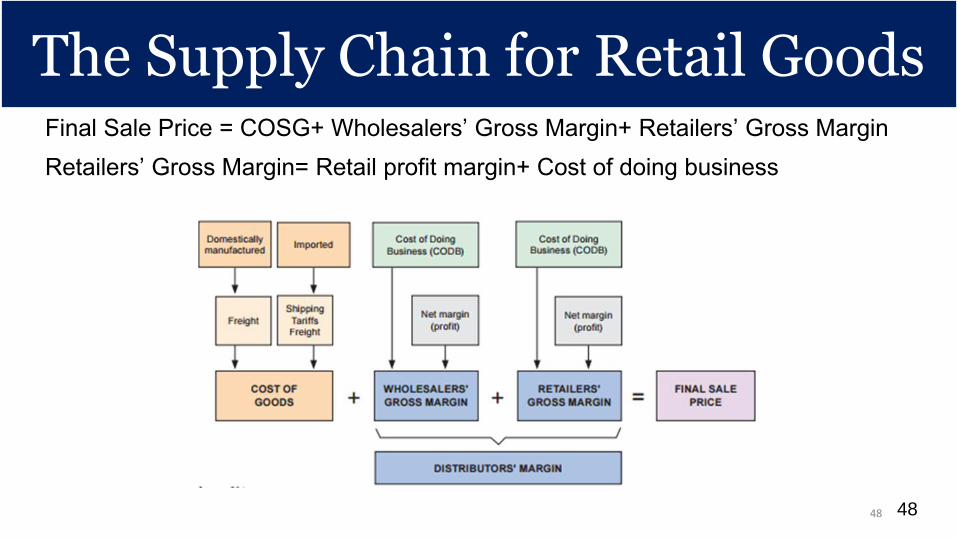
The Supply Chain for Retail GoodsFinal Sale Price = COSG+ Wholesalers’ Gross Margin+ Retailers’ Gross Margin
Retailers’ Gross Margin= Retail profit margin+ Cost of doing business
The Supply Chain for Retail Goods
4848
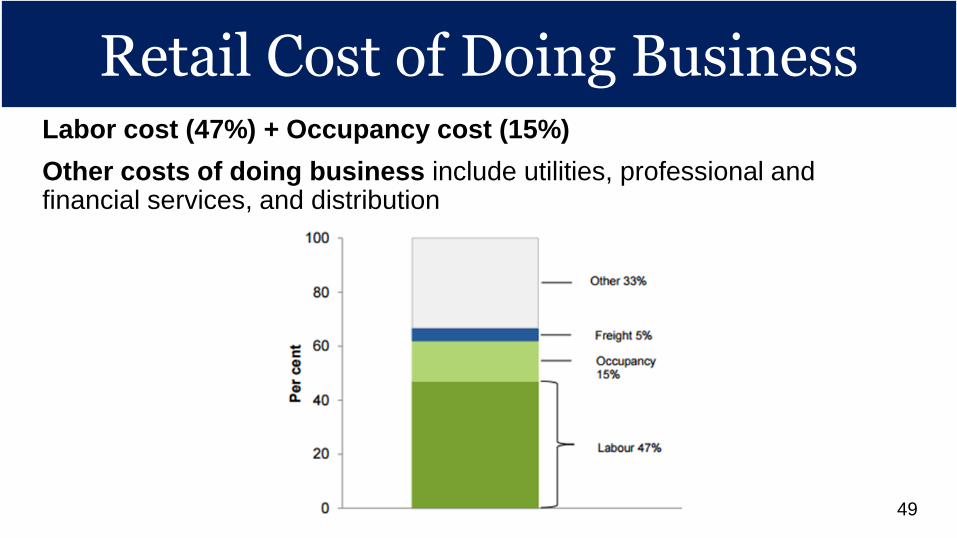
Retail Cost of Doing Business Labor cost (47%) + Occupancy cost (15%)
Other costs of doing business include utilities, professional and financial services, and distribution
Retail Cost of Doing Business
49
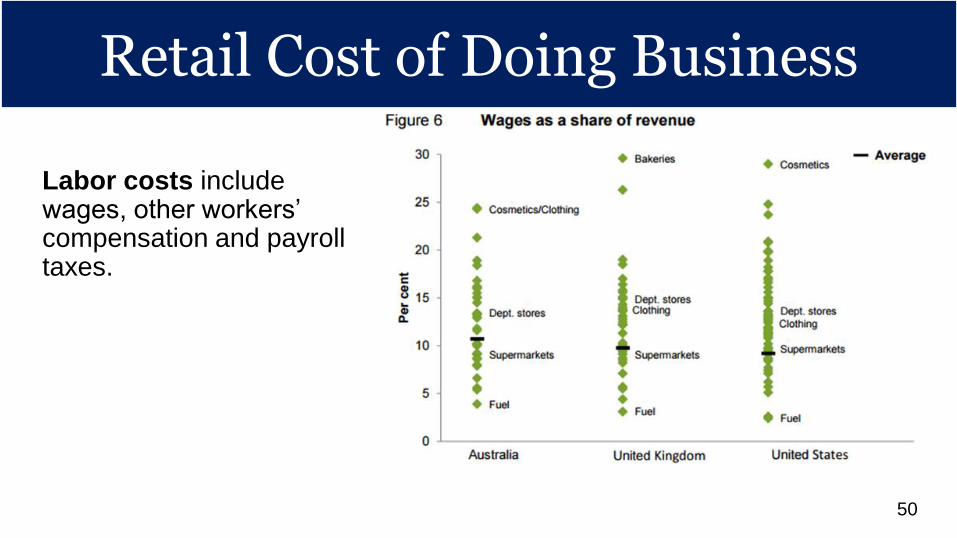
Retail Cost of Doing Business
Labor costs include wages, other workers’ compensation and payroll taxes.
Retail Cost of Doing Business
50
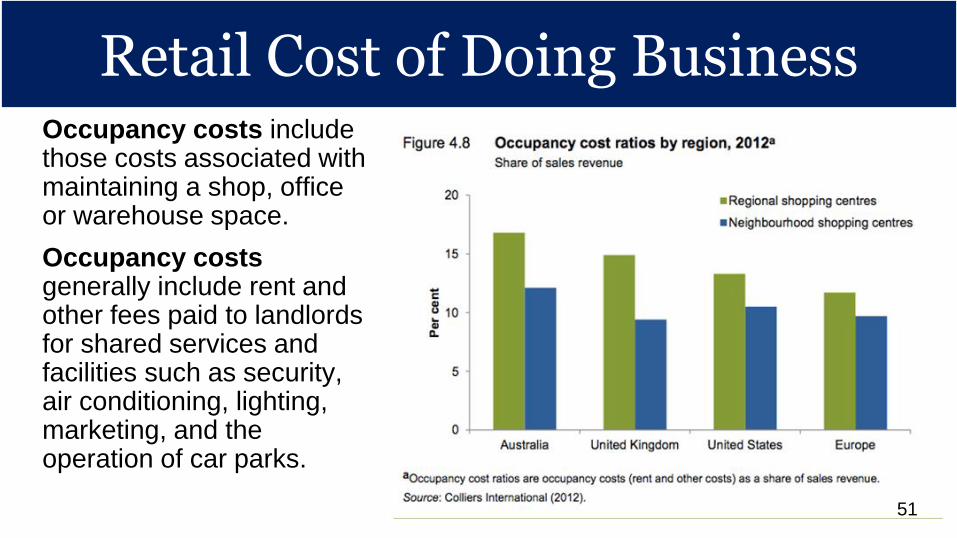
Retail Cost of Doing Business Occupancy costs include those costs associated with maintaining a shop, office or warehouse space.
Occupancy costs generally include rent and other fees paid to landlords for shared services and facilities such as security, air conditioning, lighting, marketing, and the operation of car parks.
Retail Cost of Doing Business
51
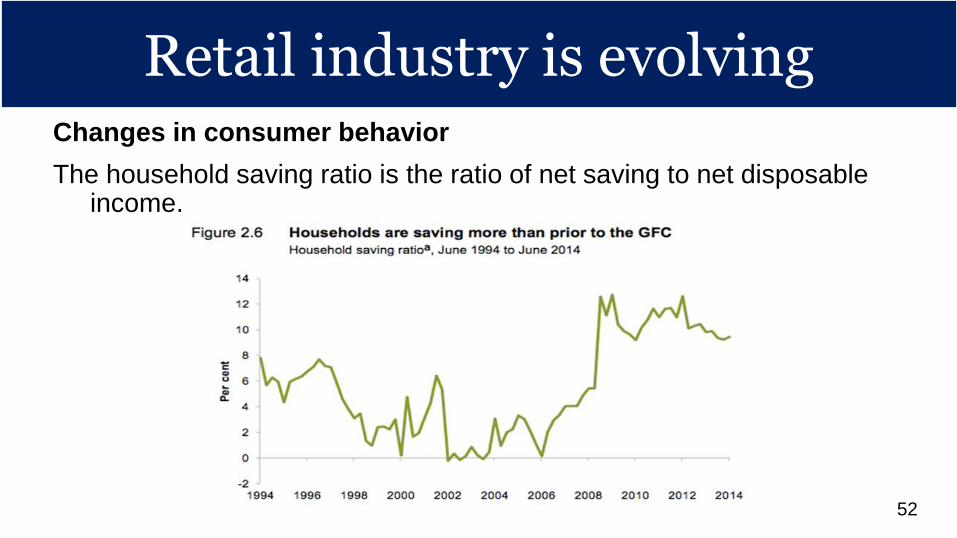
Retail industry is evolvingChanges in consumer behavior
The household saving ratio is the ratio of net saving to net disposable income.
Retail industry is evolving
52
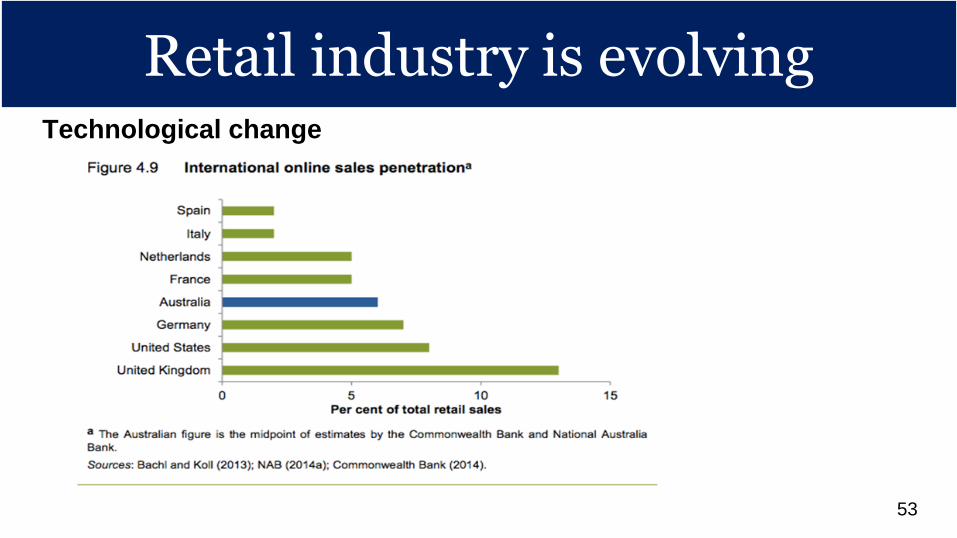
Retail industry is evolvingTechnological change
Retail industry is evolving
53
54
55
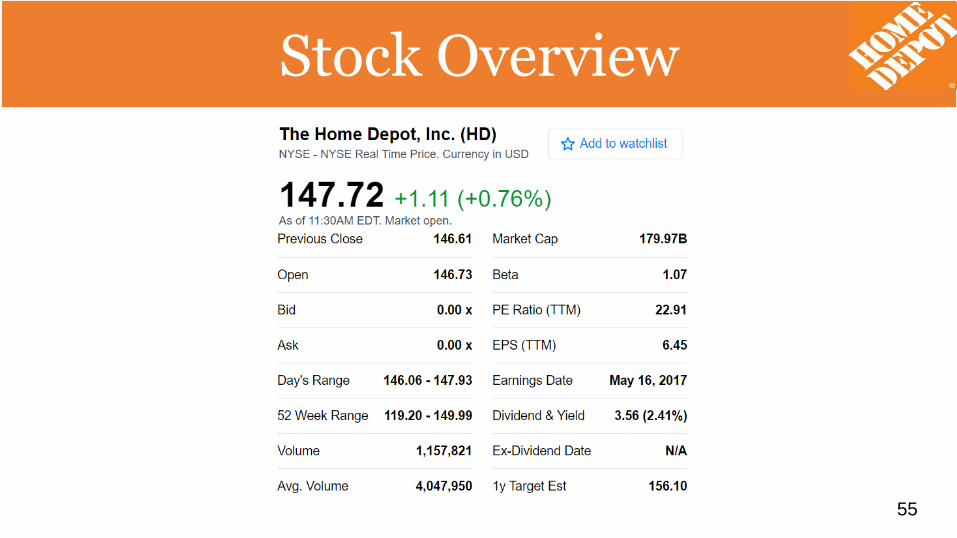
Stock Overview
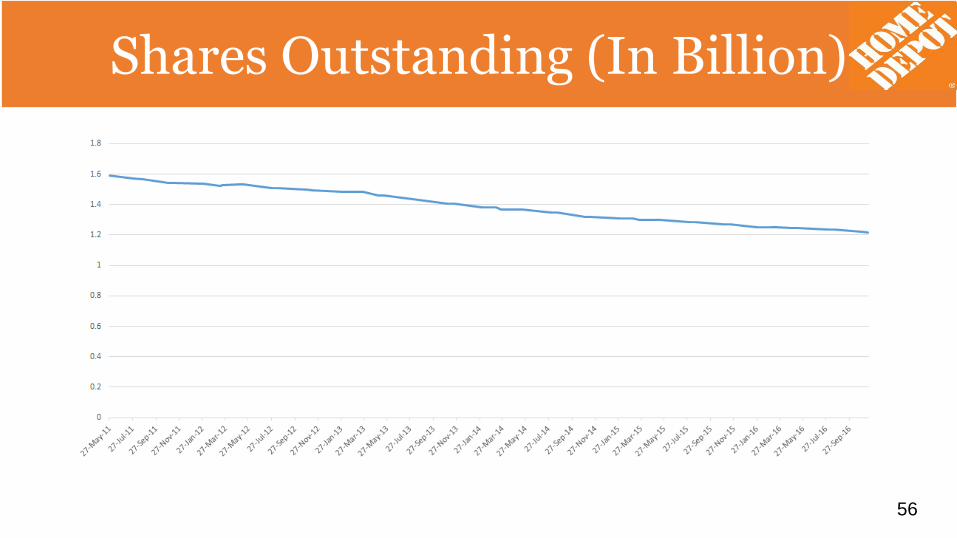
Shares Outstanding (In Billion)
56
Shares Outstanding (In Billion)
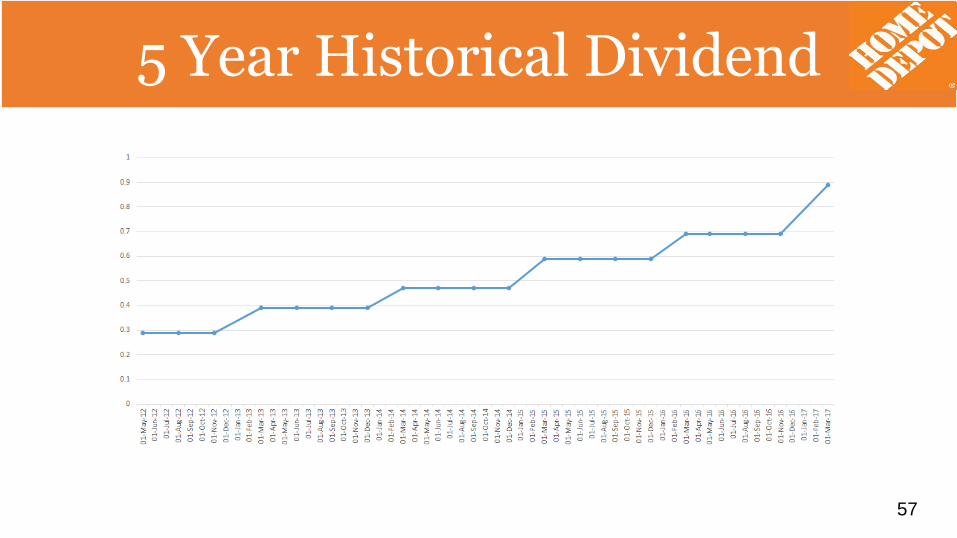
5-Year Historical Dividend
57
5 Year Historical Dividend
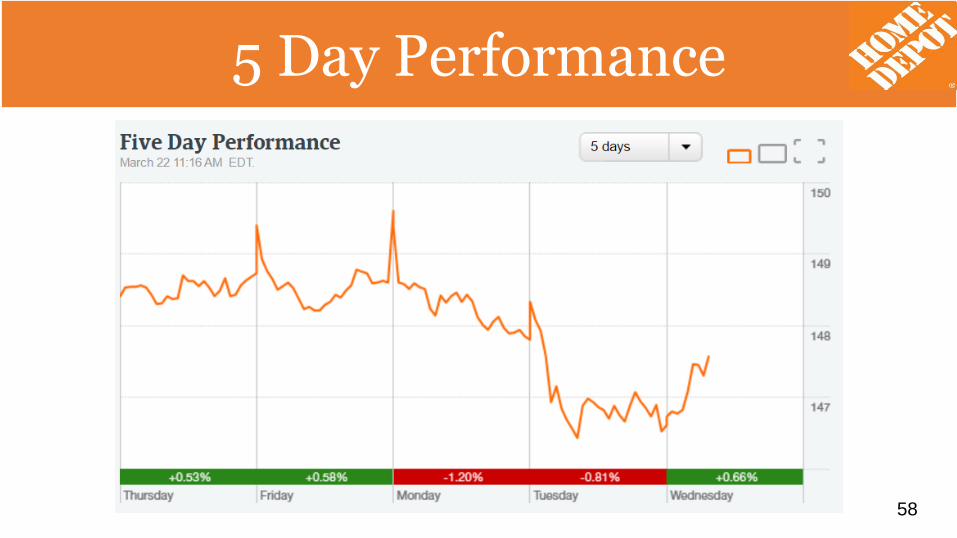
5 Day Performance
58
5 Day Performance
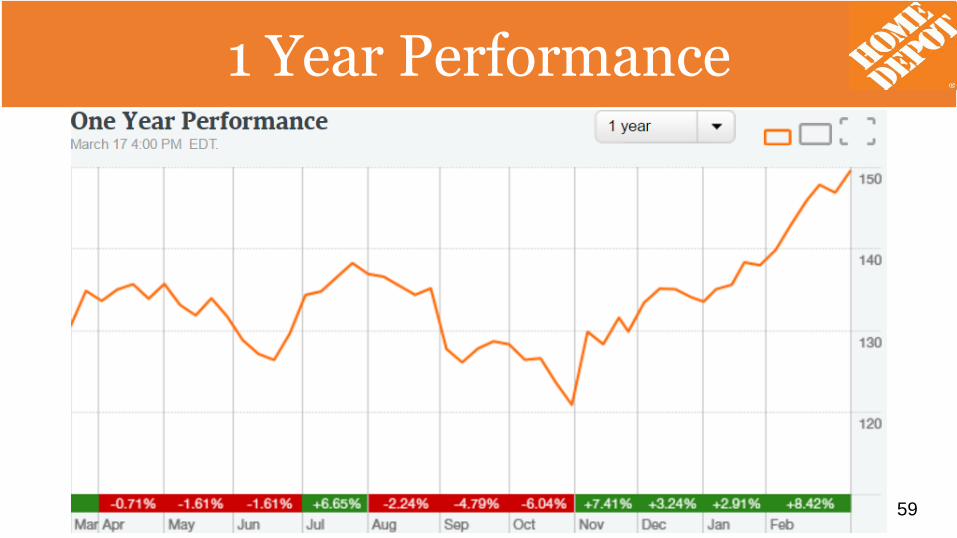
1 Year Performance
59
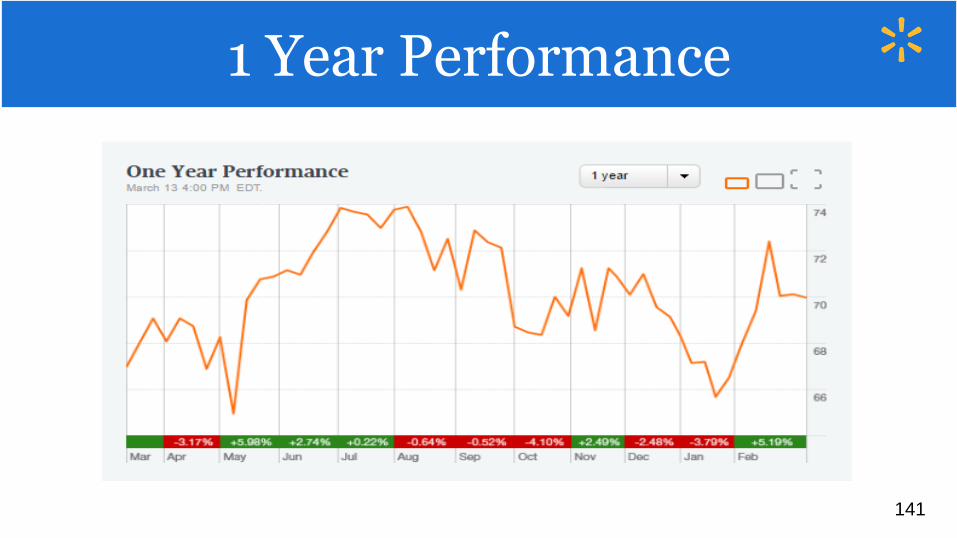
1 Year Performance
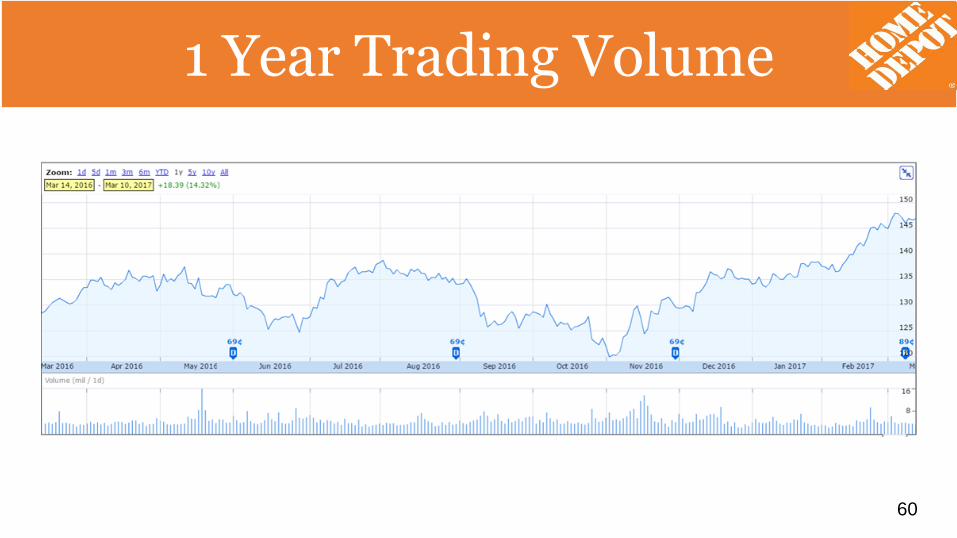
1 Year Trading Volume
60
1 Year Trading Volume
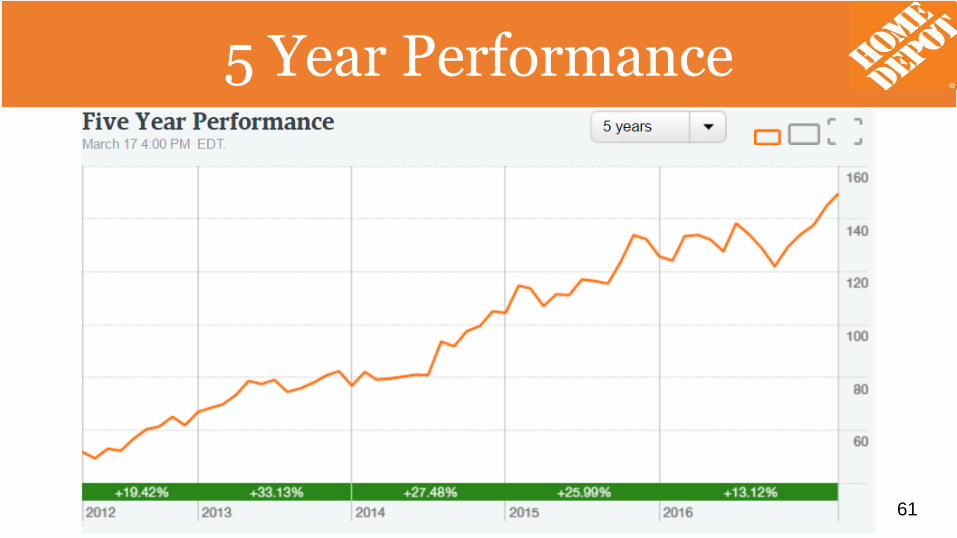
5 Year Performance
61
5 Year Performance
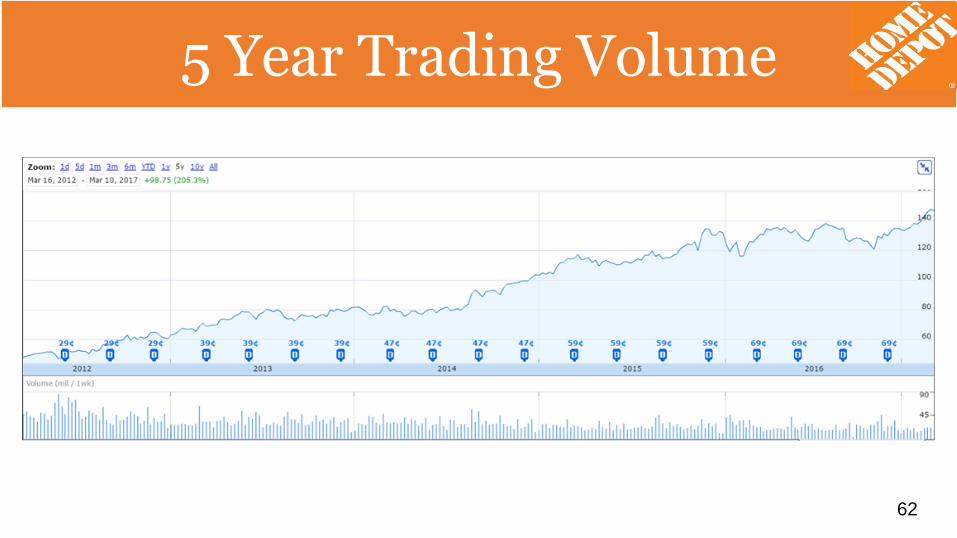
5 Year Trading Volume
62
5 Year Trading Volume
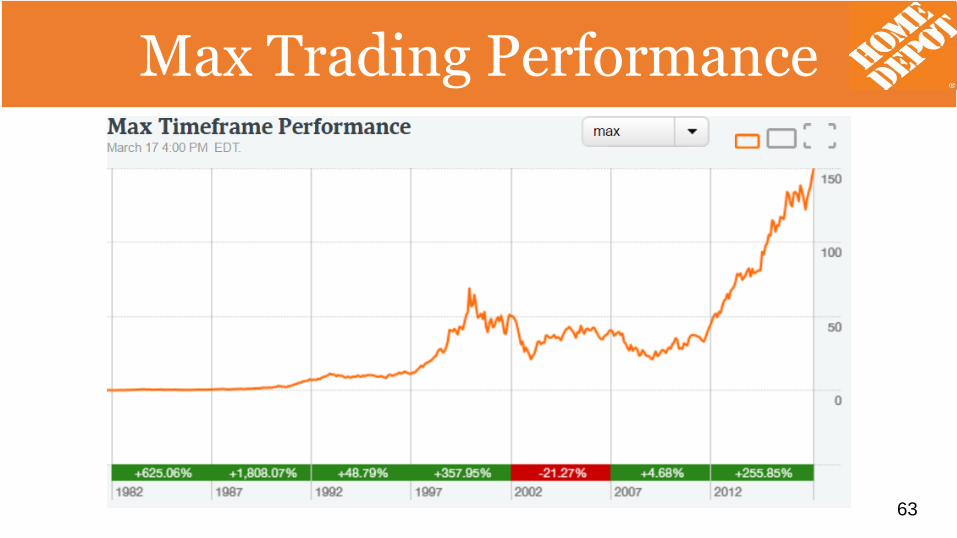
Max Trading Performance
63
Max Trading Performance
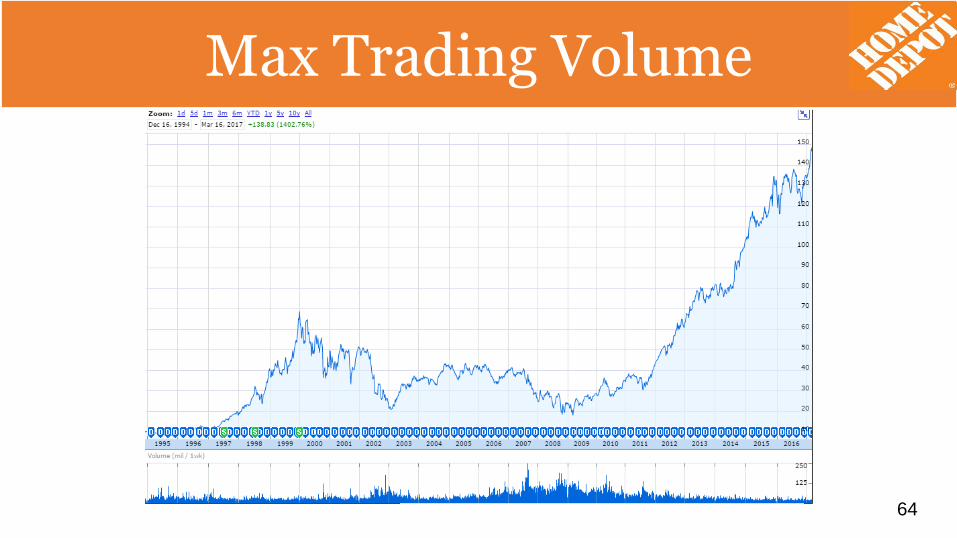
Max Trading Volume
64
Max Trading Volume
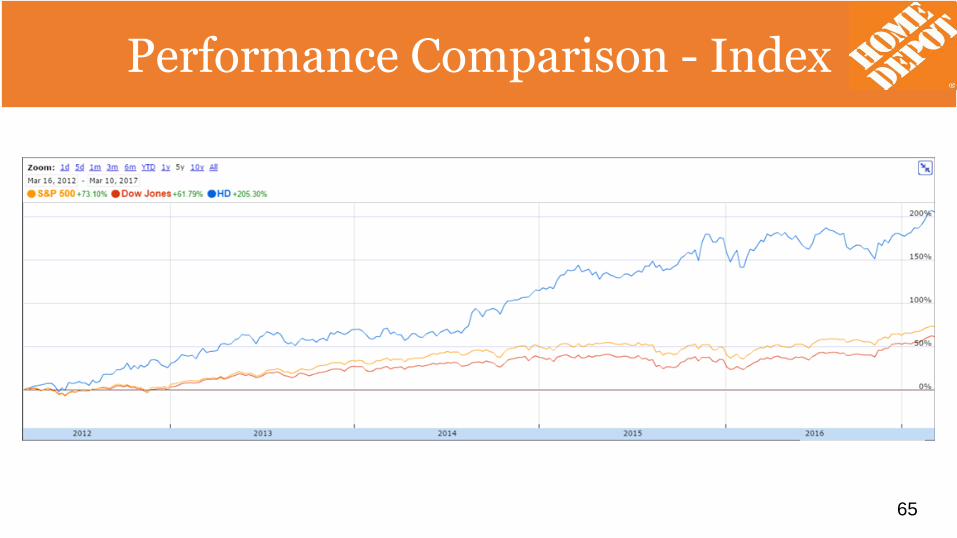
Performance Comparison - Index
65
Performance Comparison - Index
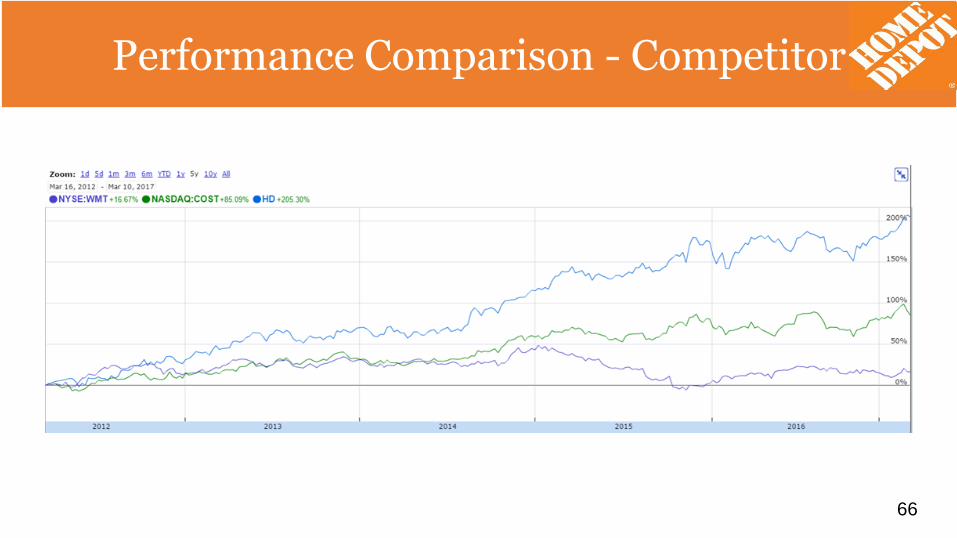
Performance Comparison - Competitors
66
Performance Comparison - Competitor
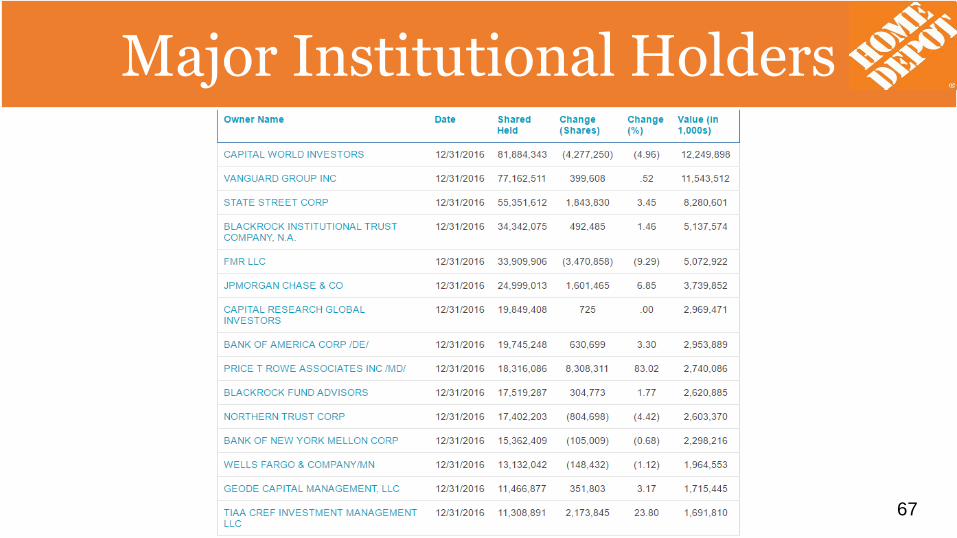
Home Depot Major Institutional Holders
67
Major Institutional Holders
Home Depot History
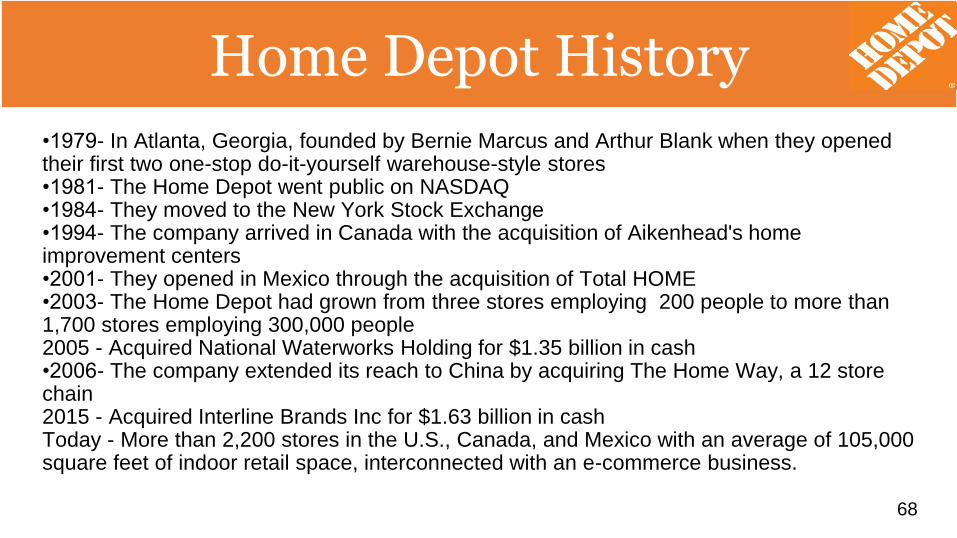
•1979- In Atlanta, Georgia, founded by Bernie Marcus and Arthur Blank when they opened their first two one-stop do-it-yourself warehouse-style stores•1981- The Home Depot went public on NASDAQ•1984- They moved to the New York Stock Exchange •1994- The company arrived in Canada with the acquisition of Aikenhead's home improvement centers•2001- They opened in Mexico through the acquisition of Total HOME•2003- The Home Depot had grown from three stores employing 200 people to more than 1,700 stores employing 300,000 people2005 - Acquired National Waterworks Holding for $1.35 billion in cash•2006- The company extended its reach to China by acquiring The Home Way, a 12 store chain2015 - Acquired Interline Brands Inc for $1.63 billion in cashToday - More than 2,200 stores in the U.S., Canada, and Mexico with an average of 105,000 square feet of indoor retail space, interconnected with an e-commerce business.
68
Home Depot History
Home Depot Founders
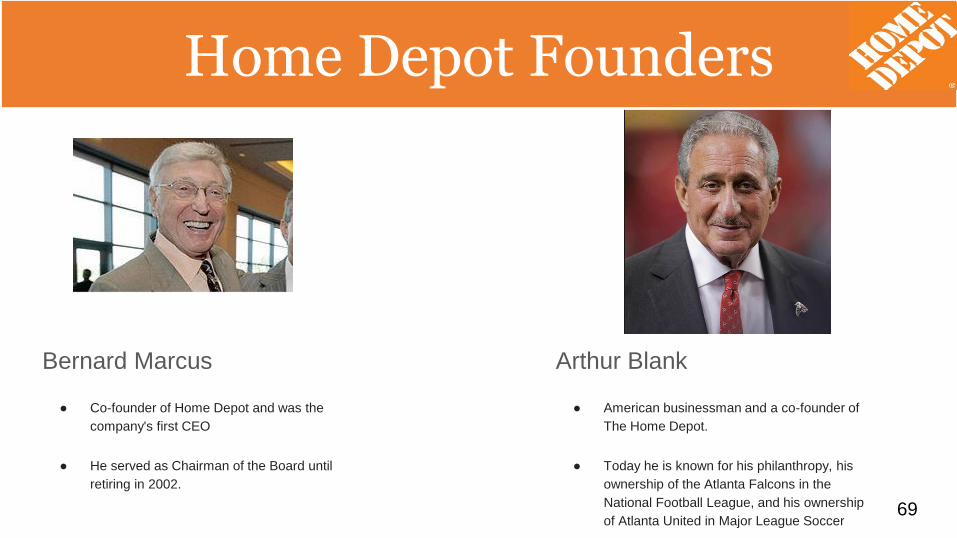
Bernard Marcus
● Co-founder of Home Depot and was the
company's first CEO
● He served as Chairman of the Board until
retiring in 2002.
Arthur Blank
● American businessman and a co-founder of
The Home Depot.
● Today he is known for his philanthropy, his
ownership of the Atlanta Falcons in the
National Football League, and his ownership
of Atlanta United in Major League Soccer69
Home Depot Founders
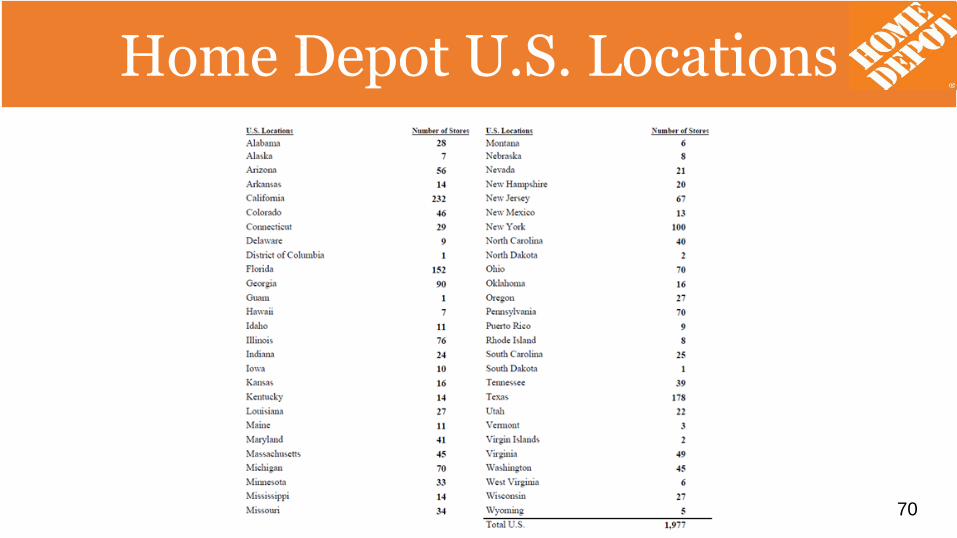
Home Depot U.S. Locations
70
Home Depot U.S. Locations
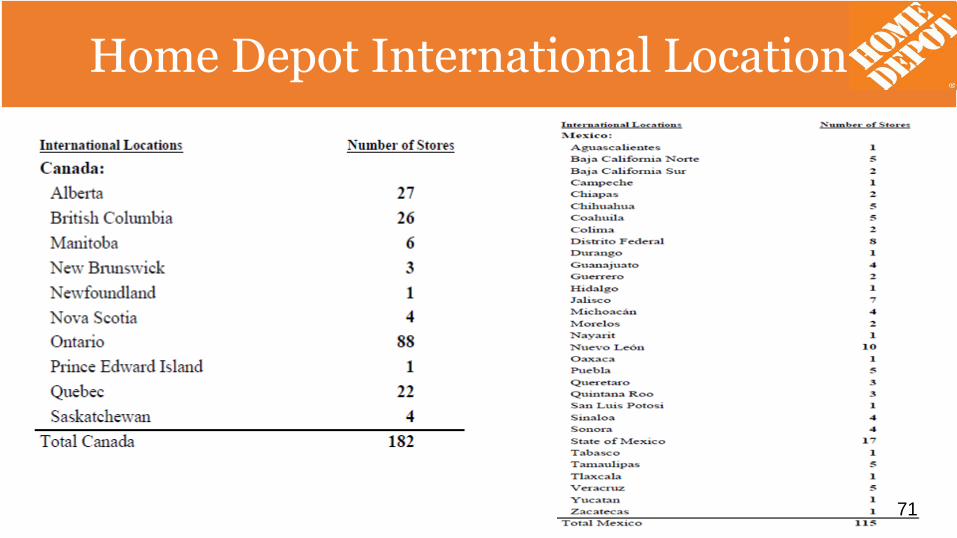
Home Depot International Locations
71
Home Depot International Locations
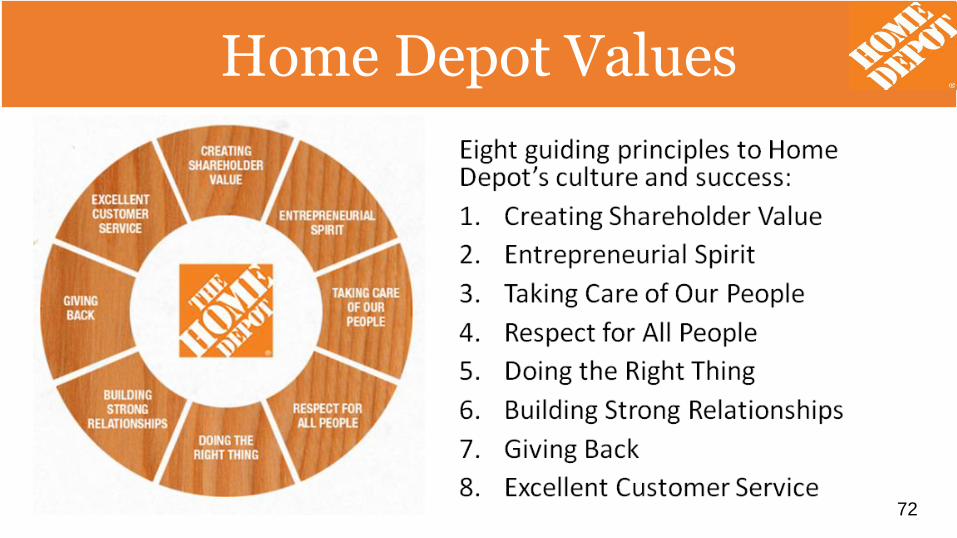
Home Depot Values
72
Home Depot Values
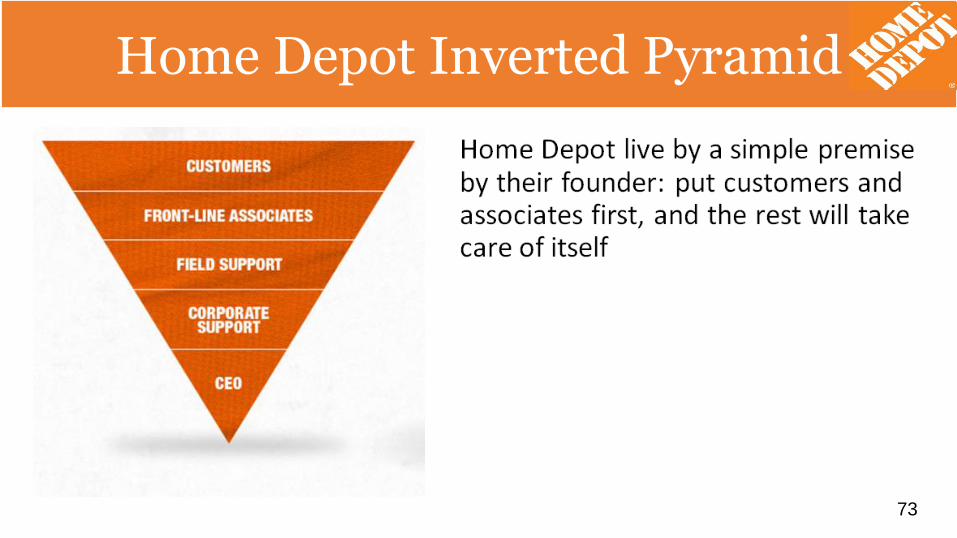
Home Depot Inverted Pyramid
73
Home Depot Inverted Pyramid
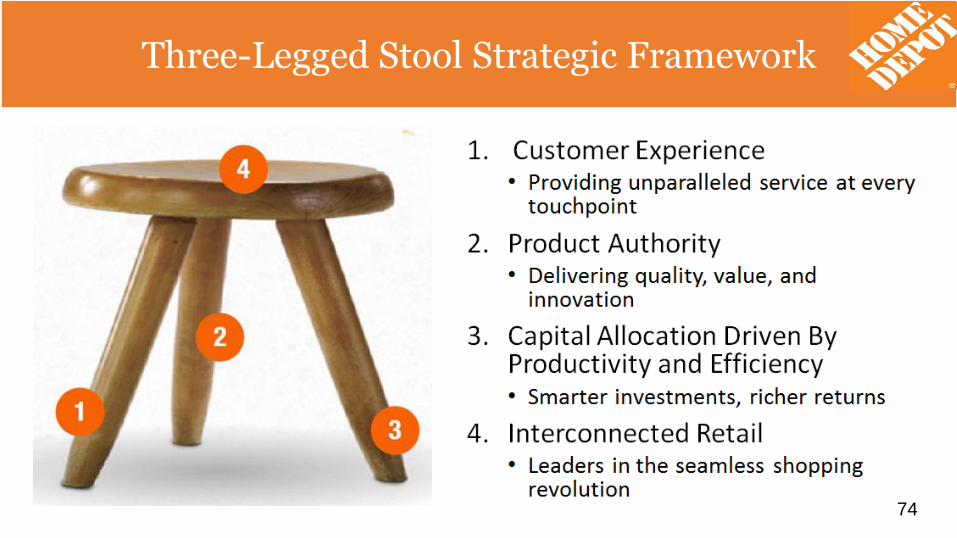
Three-Legged Stool Strategic Framework
74
Three-Legged Stool Strategic Framework
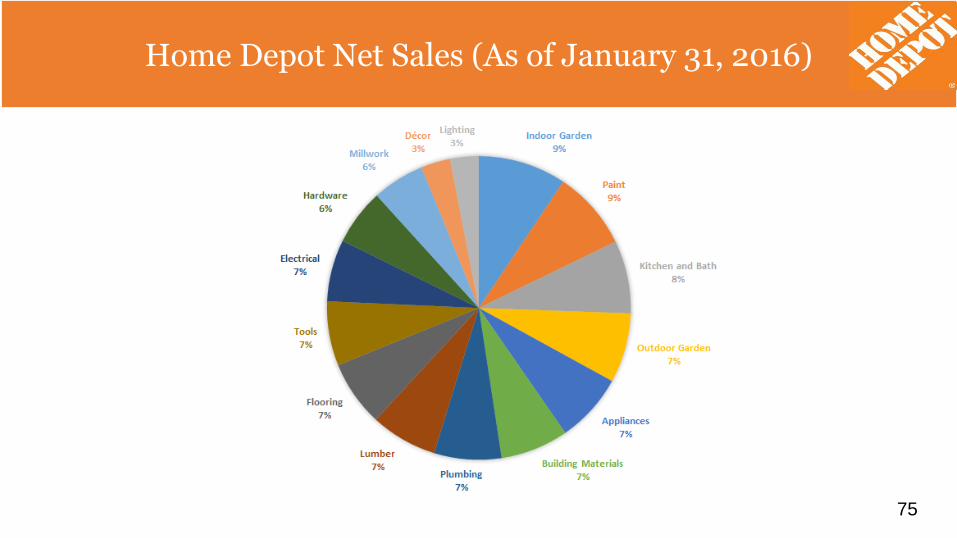
Home Depot Net Sales (As of January 31, 2016)
75
Home Depot Net Sales (As of January 31, 2016)
Home Depot Net Sales (As of January 31, 2016)
•The Company operates within a single reportable segment primarily within North America.
•Net Sales for the Company outside the U.S. were $8.0 billion, $8.5 billion and $8.5 billion for fiscal 2015, 2014 and 2013, respectively.
•Long-lived assets outside the U.S. totaled $2.3 billion and $2.5 billion as of January 31, 2016 and February 1, 2015, respectively.
76
Home Depot Net Sales (As of January 31, 2016)
Looking Ahead
Home Depot set forth their new long-term financial targets. By the end of fiscal 2018, they expect to grow sales to $101 billion while achieving a 14.5 percent operating margin and a 35 percent return on invested capital.
77
Looking Ahead
Home Depot E-Commerce
78
Home Depot E-Commerce
Home Depot and Renewable Energy
79
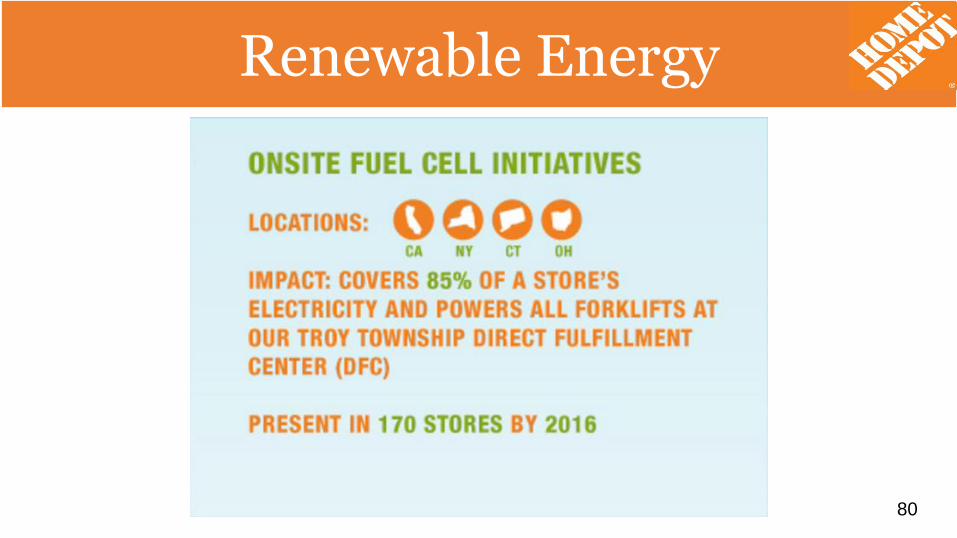
Renewable Energy
Home Depot and Renewable Energy
80
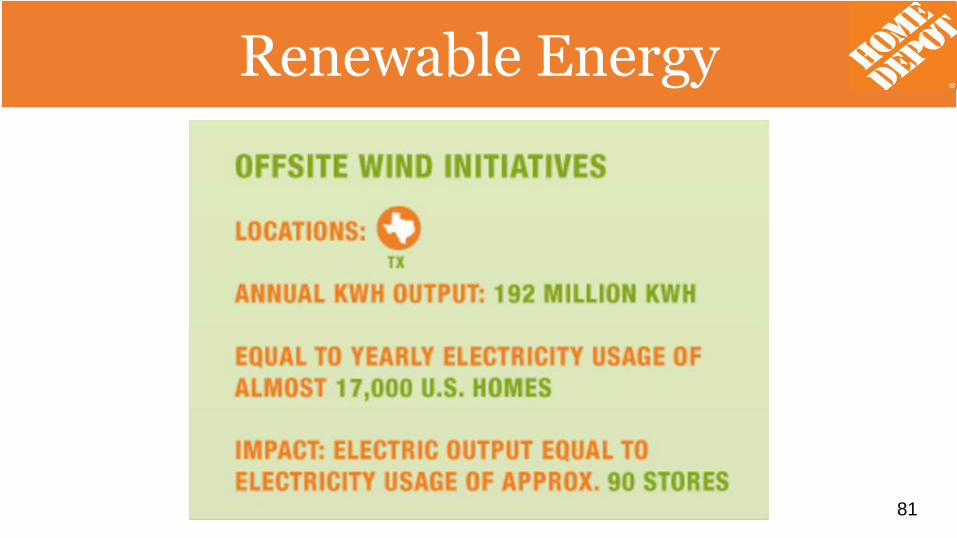
Renewable Energy
Home Depot and Renewable Energy
81
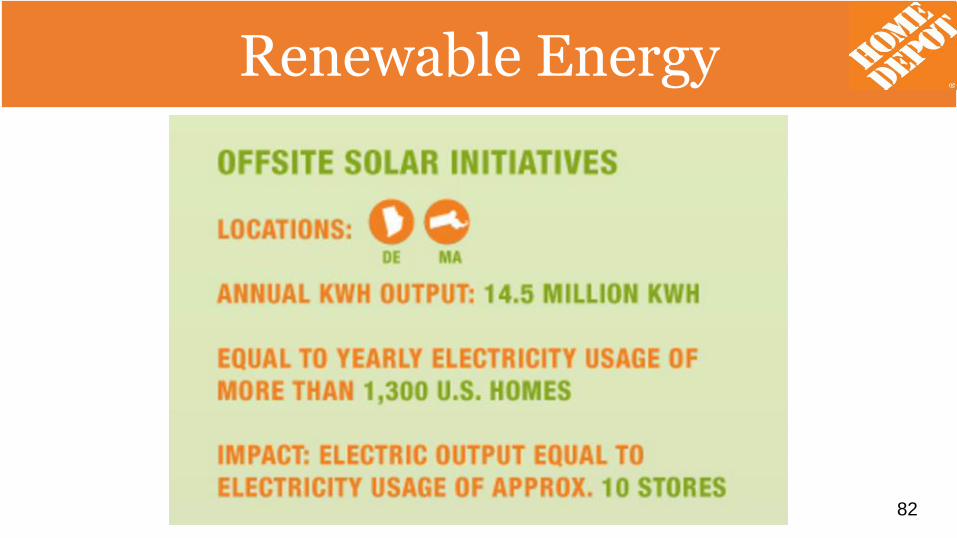
Renewable Energy
Home Depot and Renewable Energy
82
Renewable Energy
Home Depot Management
83
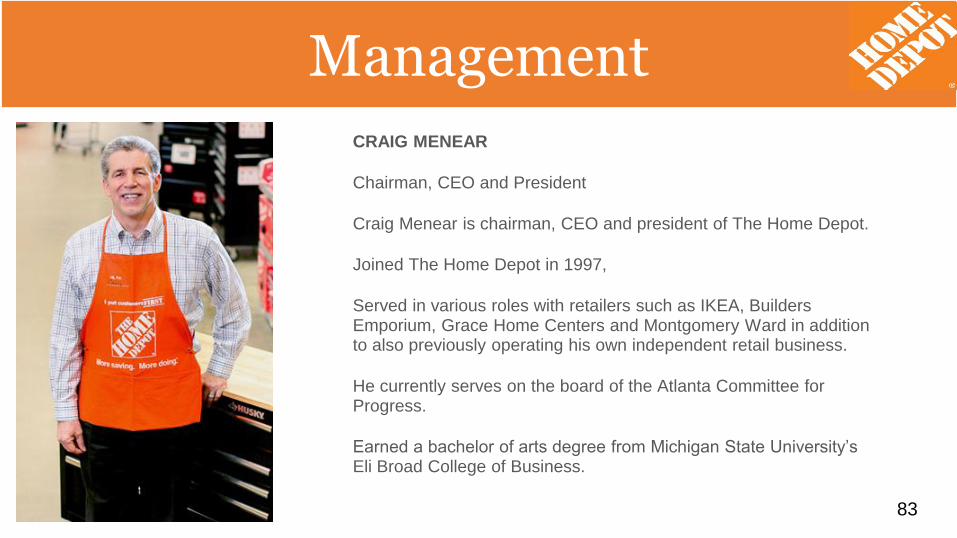
Management
CRAIG MENEAR
Chairman, CEO and President
Craig Menear is chairman, CEO and president of The Home Depot.
Joined The Home Depot in 1997,
Served in various roles with retailers such as IKEA, Builders Emporium, Grace Home Centers and Montgomery Ward in addition to also previously operating his own independent retail business.
He currently serves on the board of the Atlanta Committee for Progress.
Earned a bachelor of arts degree from Michigan State University’s Eli Broad College of Business.
Home Depot Management
84
ManagementANN-MARIE CAMPBELL
Executive Vice President - U.S. Stores
Joined The Home Depot in 1985 as a cashier in South Florida
During her career at the company, she has served in a variety of positions, including store manager, district manager and regional vice president. She has also served as vice president of operations, vice president of merchandising and special orders, vice president of retail marketing and sales for Home Depot Direct, vice president of vendor services and, most recently, president of the Southern Division of The Home Depot.
In 2014, Fortune Magazine listed her among the top 50 most powerful women in business.
Graduated from Georgia State University, where she earned a bachelor’s degree in philosophy and a master’s degree in business administration.
Home Depot Management
85
ManagementCAROL B. TOMÉ
Chief Financial Officer & Executive Vice President – Corporate Services
• Served as chief financial officer since May 2001 and was named executive vice president of corporate services at The Home Depot in January 2007.
• Joined The Home Depot in 1995. She was vice president and treasurer of Riverwood International Corporation. Carol began her career as a commercial lender with United Bank of Denver (now Wells Fargo) and then spent several years as director of banking for the Johns-Manville Corporation.
• In 2012, The Wall Street Journal ranked Carol No. 2 on its list of the best chief financial officers in corporate America and in 2013, Fortune magazine listed her among the top 50 Most Powerful Women in Business, for the second consecutive year. In 2013, Carol was named a laureate and a member of the Junior Achievement of Georgia Business Hall of Fame. She ranked No. 16 in Forbes magazine’s 2008 list of the World’s 100 Most Powerful Women and was included by The Wall Street Journal on its list of 50 Women to Watch in 2007.
• Holds a bachelor’s degree in communication from the University of Wyoming and a Master of Business Administration in finance from the University of Denver.
Home Depot Management
86
ManagementMATT CAREY
Executive Vice President & Chief Information Officer
Joined The Home Depot in 2008
Matt’s team designed and launched an industry-first proprietary mobile device we call the
“First Phone,” which functions as a phone and walkie-talkie with the added functionality of
mobile checkout, inventory management, product search and business analytics.
Before joining The Home Depot in 2008, Matt served as senior vice president and chief
technology officer at eBay.
Matt spent more than 20 years with Wal-Mart, where he was senior vice president and chief
technology officer. During his tenure at Wal-Mart, he managed the rollout of the wireless RF
infrastructure, had responsibility for the company’s Mainframe Large Systems and Data
Warehouse, and led the implementation and integration of Walmart.com, Samsclub.com
and the grocery home delivery business in the U.K. He also was responsible for
implementing Goodlinks, which provided wireless real-time email and calendaring functions.
Matt earned an associate’s degree in information systems from Oklahoma State University
– Okmulgee.
Home Depot Management
87
ManagementTIM CROW
Executive Vice President – Human Resources
• Joined The Home Depot in 2002
• During his tenure, the company has dramatically increased Success Sharing, our profit sharing program for frontline hourly and non-management associates. The company also reinstated its equity awards program for assistant store managers, the only program of its kind in retail. Previously, Tim was senior vice president of organization, talent and performance systems.
• Served as senior vice president of human resources at Kmart.
• Spent almost 20 years with Sears, Roebuck & Co.
• Earned a bachelor’s degree from California State University at Northridge.
Home Depot Management
88
ManagementTED DECKER
Executive Vice President – Merchandising
• Joined The Home Depot on Feb. 14, 2000 as director of business valuation.
• Worked in business development, strategic planning, finance and treasury at Kimberly-Clark Corp. and Scott Paper Co. Prior to that, Ted held various corporate finance, lending and credit positions at PNC Bank.
• He has extensive international experience, having lived and worked in London, England, and Sydney, Australia.
• Ted earned a bachelor’s degree in English from The College of William and Mary and a master’s degree in business administration from Carnegie Mellon University.
Home Depot Management
89
ManagementMARK HOLIFIELD
Executive Vice President - Supply Chain & Product Development
• Joined The Home Depot in 2006 as senior vice president of supply chain.
• Prior to The Home Depot, he most recently served as executive vice president of supply chain management at Office Depot
• Prior to Office Depot, Mark worked in supply chain roles at Dallas Systems Corporation, Frito-Lay North America Inc., and H.E. Butt Grocery Company.
• Mark earned his bachelor’s degree in business administration with honors from the University of Texas and his master’s degree in business administration from Baylor University.
Home Depot Management
90
ManagementBILL LENNIE
Executive Vice President – Outside Sales & Service
• Previously, Bill served as president of The Home Depot Canada where he was responsible for the sales, merchandising, ecommerce, supply chain, human resources, IT development and operations of 182 stores in Canada.
• Bill returned to The Home Depot in 2009 from Dick’s Sporting Goods where he was senior vice president of merchandising, hardlines. His career at The Home Depot began in 1992, when he joined as a merchant for Millwork and Building Materials. In 2001, Bill focused his leadership on the Company’s Kitchen, Bath and Appliance departments and was promoted to senior vice president of décor in 2002.
• Before joining The Home Depot, Bill was a divisional merchandise manager for Lowe’s. Prior to that, he spent eight years with Menards in Eau Claire, Wis., as the millwork plant manager for its manufacturing division.
Home Depot Management
91
ManagementTERESA WYNN ROSEBOROUGH
Executive Vice President – General Counsel and Corporate Secretary
• Joined The Home Depot in 2011
• Held several positions in the legal department of MetLife, including deputy general counsel and senior chief counsel for litigation and compliance
• Was a partner at Sutherland Asbill & Brennan LLP,
• Teresa was named one of 25 Influential Black Women in Business by The Network Journal and as one of America’s top black attorneys by Black Enterprise.
• Teresa earned a bachelor of arts degree from the University of Virginia, a master’s degree in education from Boston University, and a juris doctor with high honors from the University of North Carolina School of Law, where she was editor-in-chief of the Law Review.
Balance Sheet (Latest from News Releases)
92
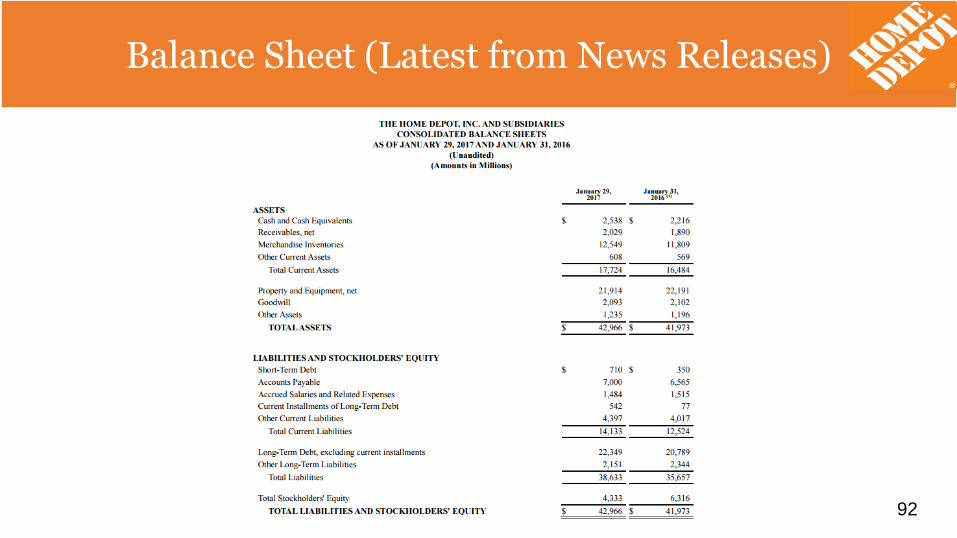
Balance Sheet (Latest from News Releases)
Statement of Earnings (Latest from News Releases)
93
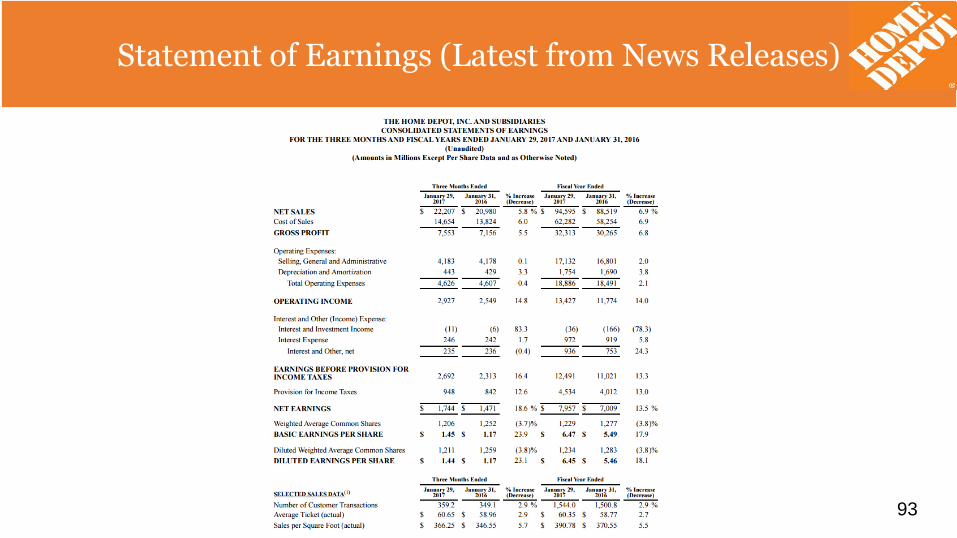
Statement of Earnings (Latest from News Releases)
Statement of Cashflows (Latest from News Releases)
94
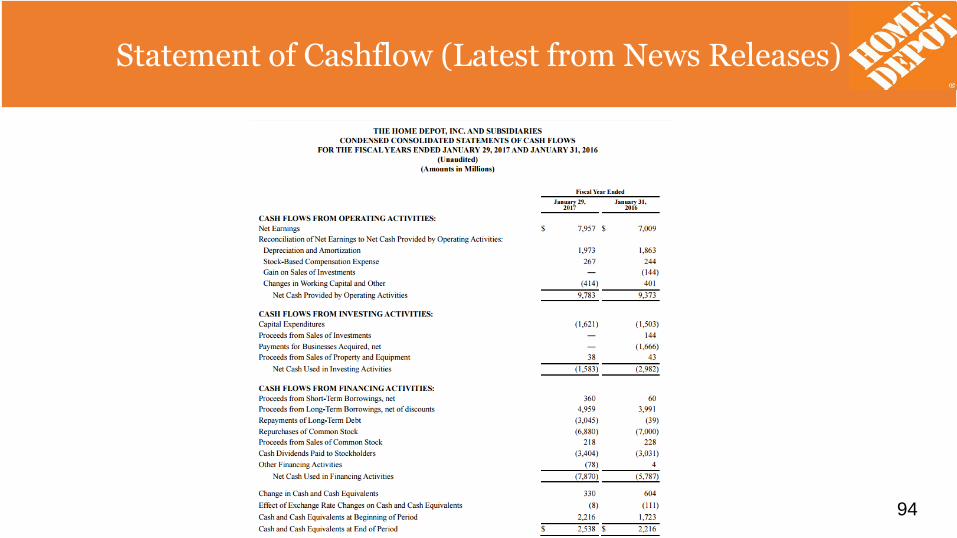
Statement of Cashflow (Latest from News Releases)
Recommendation
95
Recommendation
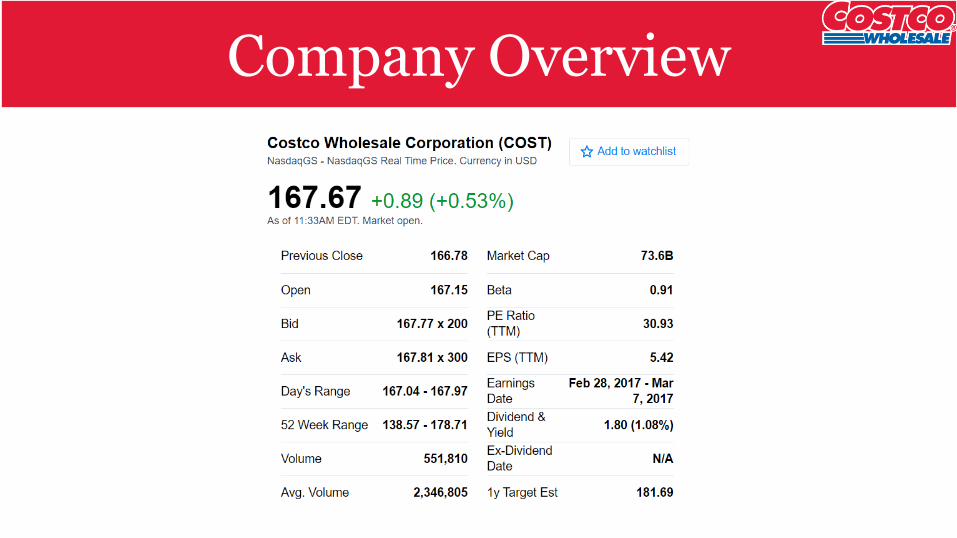
Company Overview
Company History
• First store opened in San Diego, CA in 1976 under the name Price Club
• Costco was founded in 1983 in Seattle, WA
• Costco was the first company to ever grow from $0 to $3B in sales in less than 6 years
• In 1993, the companies merged under the Costco name
• "keep costs down and pass on the savings to our members"
Company History
97
Company History
• 1948: Sol Price opened Fed Mart
• 1976: Opened first store as Price Club in San Diego
• 1983: Founders James Sinegal and Jeffrey Brotman opened first warehouse in Seattle
• 1993: Costco and Price Club merged to PriceCostco
• 1994: Founders of Price Club left Costco
• 1997: Company name was changed to Costco Wholesaler
Company History
98
Costco’s Code of Ethics
1. Obey the law
2. Take care of our members
3. Take care of our employees
4. Respect our suppliers
if we do these four things throughout our organization, then we will achieve our ultimate goal, which is to:
5. Reward our shareholders
Costco’s Code of Ethics
99
Company Overview
• Listed on Nasdaq
• Included in S&P 500, Russell 1000
• Ticker symbol: COST
• Industry: Discount variety store
• 2nd largest retail company in the United States (Wal-Mart is 1st)
Company Overview
100
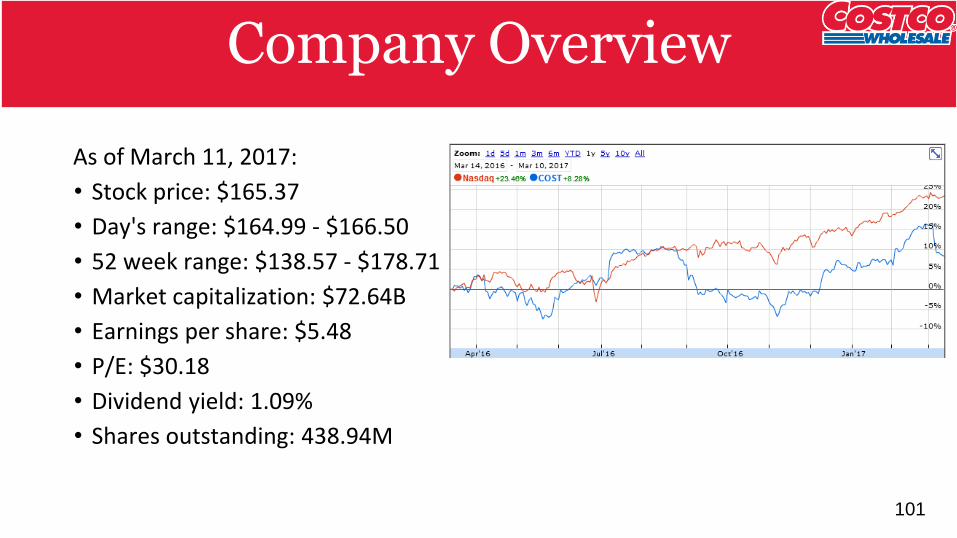
Company Overview
As of March 11, 2017:
• Stock price: $165.37
• Day's range: $164.99 - $166.50
• 52 week range: $138.57 - $178.71
• Market capitalization: $72.64B
• Earnings per share: $5.48
• P/E: $30.18
• Dividend yield: 1.09%
• Shares outstanding: 438.94M
Company Overview
101
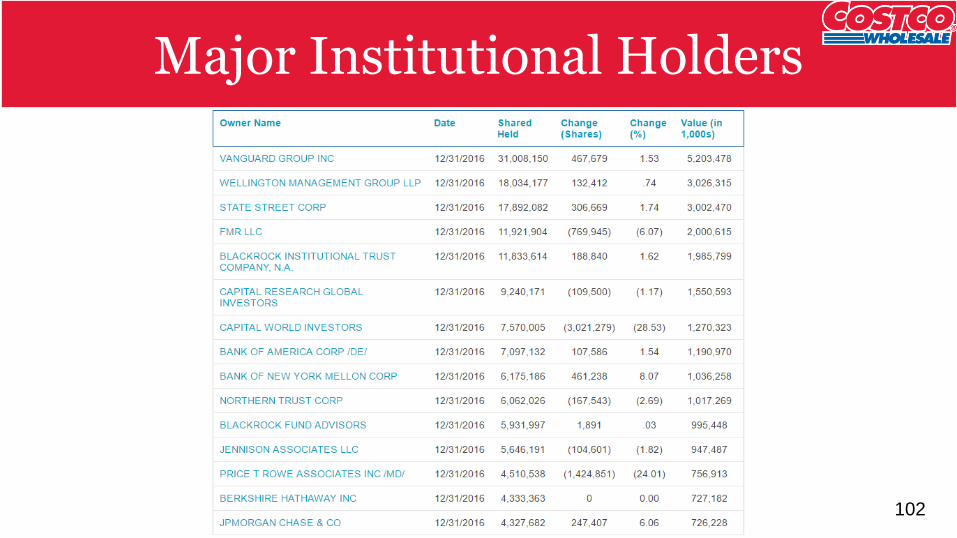
Major Institutional HoldersMajor Institutional Holders
102
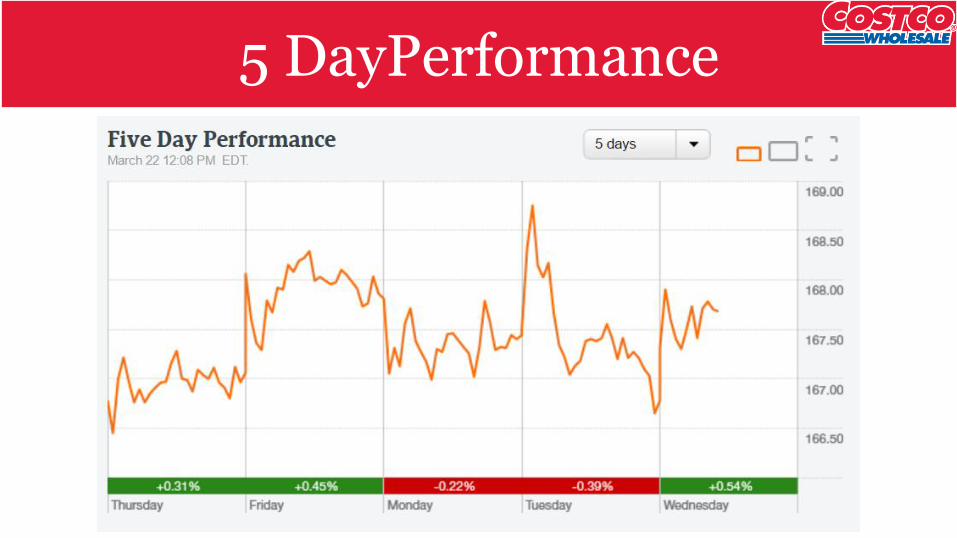
5 DayPerformance
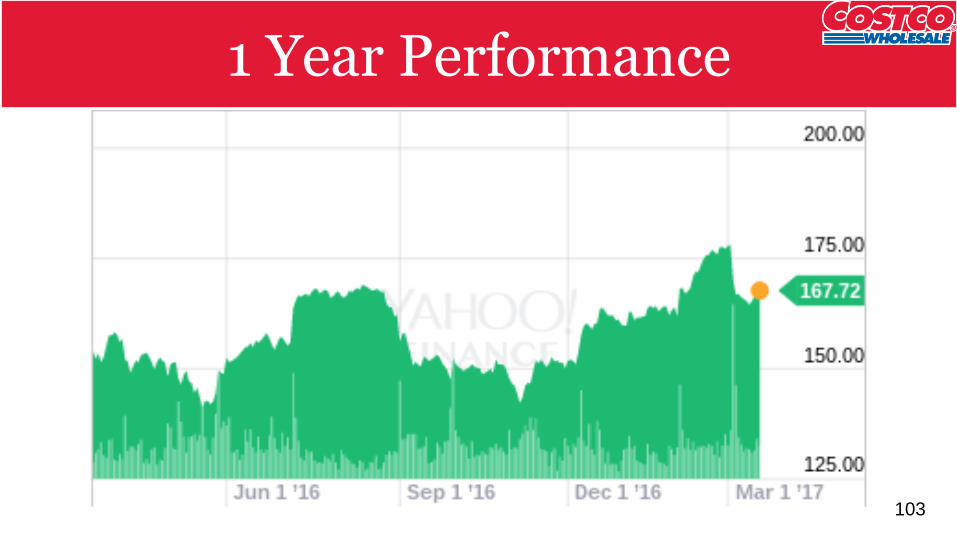
1 Year 1 Year Performance
103
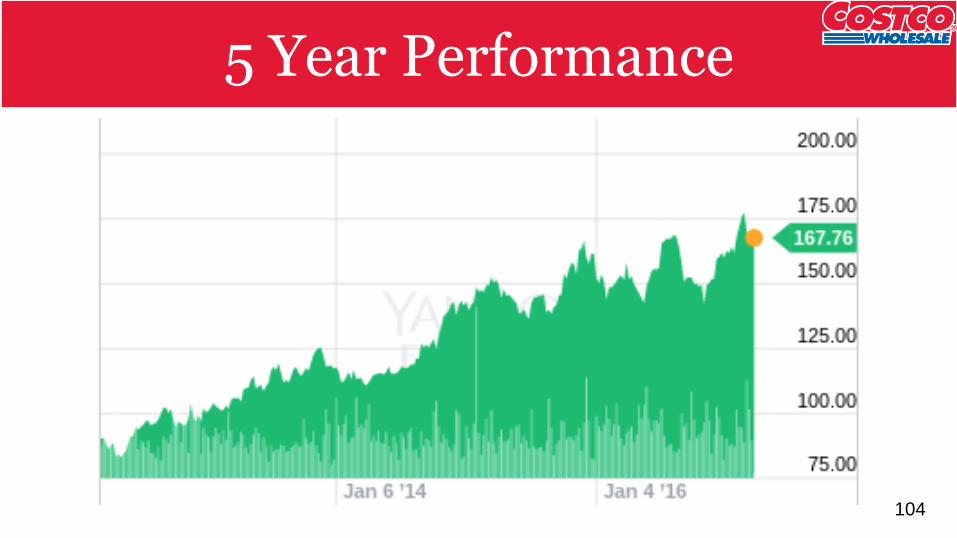
5 Year 5 Year Performance
104

Max Max Performance
105
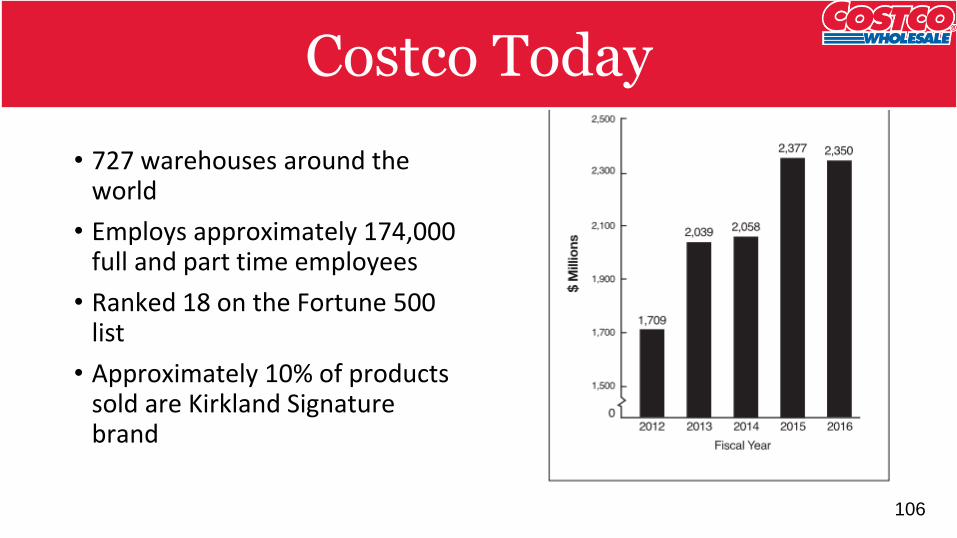
Costco Today
• 727 warehouses around the world
• Employs approximately 174,000 full and part time employees
• Ranked 18 on the Fortune 500 list
• Approximately 10% of products sold are Kirkland Signature brand
Costco Today
106
ManagementJames Sinegal, Former President and CEO (1994 - 2012)
• Co-founder and first CEO• Earned $583,000 annually in salary
and bonuses• Business Administration graduate
from San Diego State University• One of Time’s 100 Most Influential
People of 2006
Management
107
Management
W. Craig Jelinek, President and CEO since 2012.
• Salary: $700,000 plus a bonus of up to $81,600
• Studied at San Diego State University
• Cares about employees, paying higher than industry average salaries and allowing them to take holidays off
Management
108
Management
Jeffrey Brotman, Co-founder and chairman of the board since 1994.
• Salary: $650,000 plus a bonus of up to $81,000
• Studied law at the University of Washington
• 2rd generation of his family as a retail entrepreneur
• Former director at Starbucks and Sweet Factory
Management
109
Competition
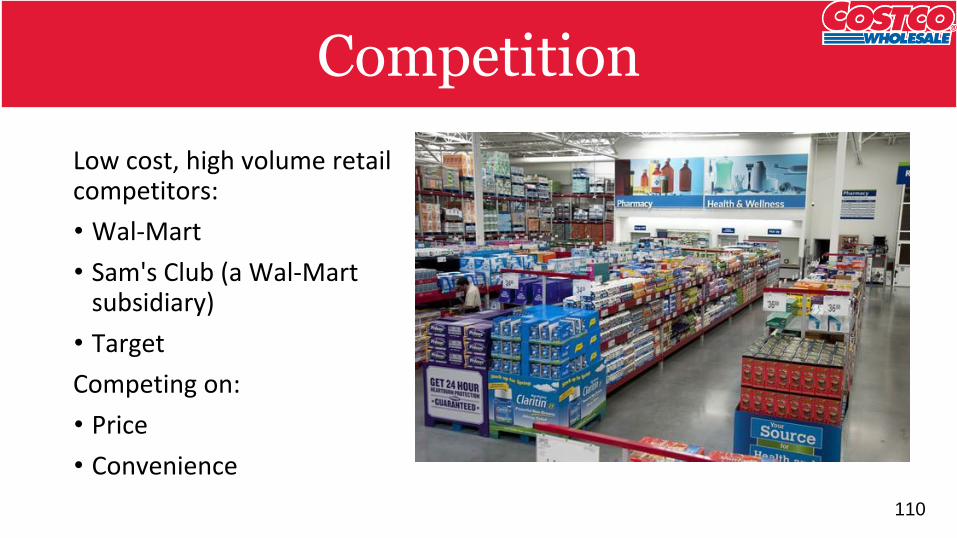
Low cost, high volume retail competitors:
• Wal-Mart
• Sam's Club (a Wal-Mart subsidiary)
• Target
Competing on:
• Price
• Convenience
Competition
110
Competition
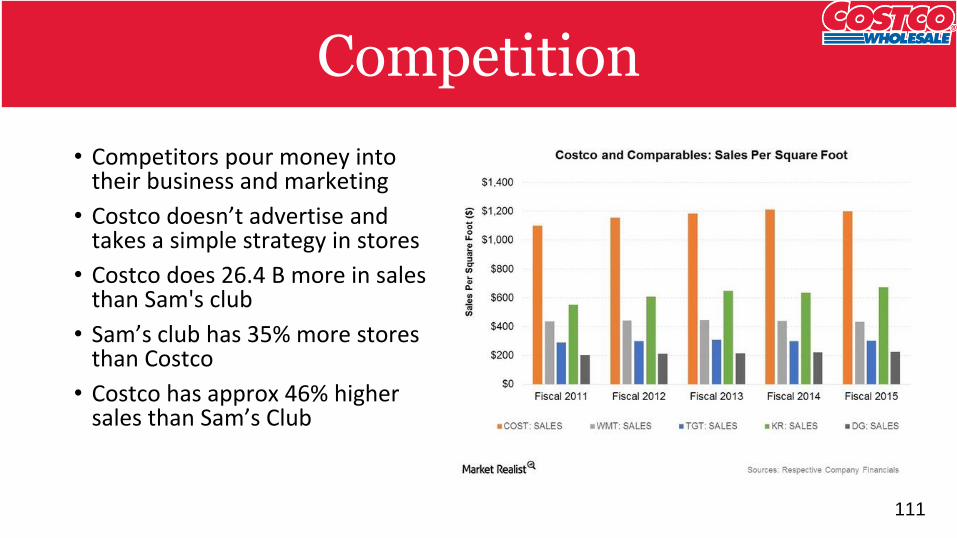
• Competitors pour money into their business and marketing
• Costco doesn’t advertise and takes a simple strategy in stores
• Costco does 26.4 B more in sales than Sam's club
• Sam’s club has 35% more stores than Costco
• Costco has approx 46% higher sales than Sam’s Club
Competition
111
Cost Structure and Revenue Composition
• Goods sold in stores just cover costs, don’t act as a source of revenue
• Revenue is generated through membership sales
Cost Structure and Revenue Composition
112
Cost Structure and Revenue Composition
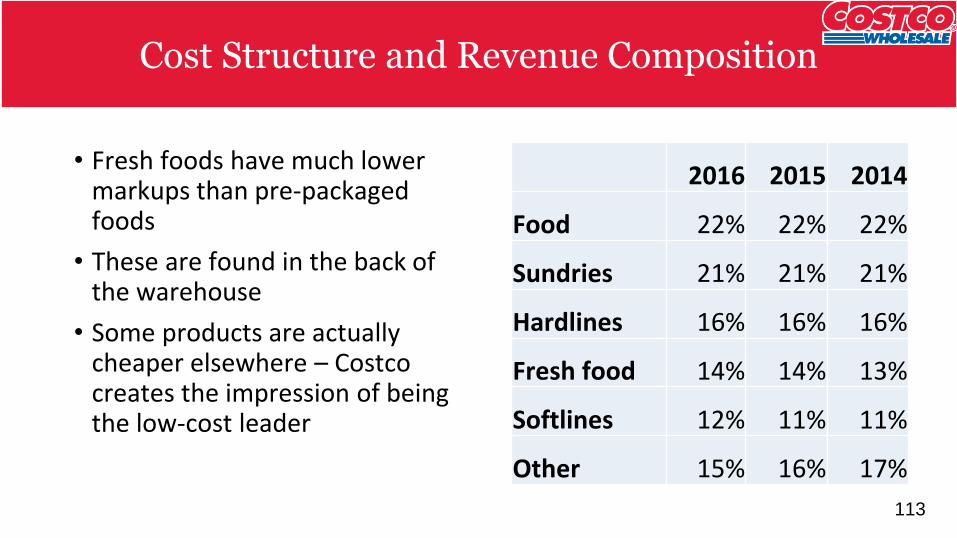
• Fresh foods have much lower markups than pre-packaged foods
• These are found in the back of the warehouse
• Some products are actually cheaper elsewhere – Costco creates the impression of being the low-cost leader
2016 2015 2014
Food 22% 22% 22%
Sundries 21% 21% 21%
Hardlines 16% 16% 16%
Fresh food 14% 14% 13%
Softlines 12% 11% 11%
Other 15% 16% 17%
Cost Structure and Revenue Composition
113
Strategy: Revenue Production
• Membership costs $55-$110
• Average markup is approximately 10%, slightly higher with the Kirkland Signature house brand
• Slim markups just cover costs, profit is generated by annual membership costs
• Store layout to entice buyers to purchase items with higher markups
• Rapid inventory turnover
Strategy: Revenue Production
114
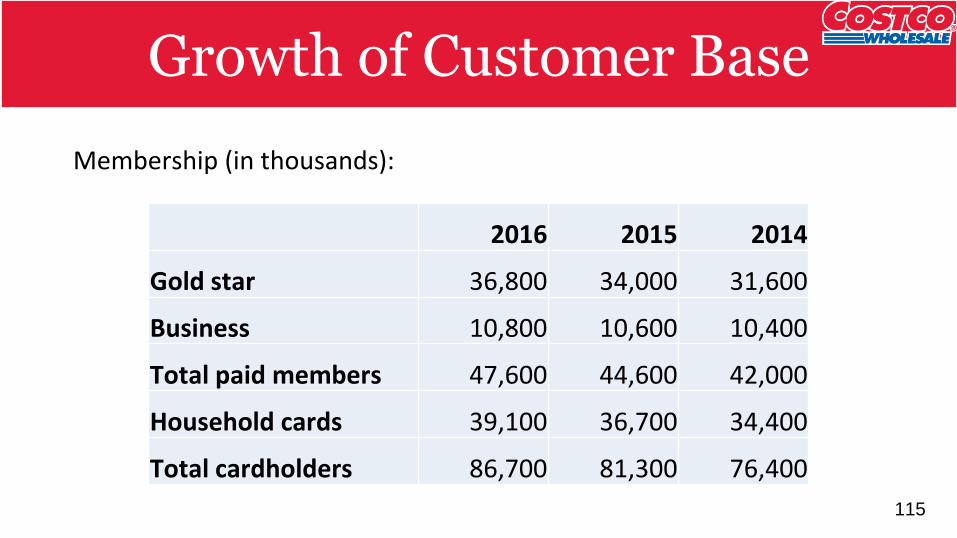
Growth of Customer Base
Membership (in thousands):
2016 2015 2014
Gold star 36,800 34,000 31,600
Business 10,800 10,600 10,400
Total paid members 47,600 44,600 42,000
Household cards 39,100 36,700 34,400
Total cardholders 86,700 81,300 76,400
Growth of Customer Base
115
Strategy: Cost Control
• SG&A: 10.4% of sales
• No advertising
• Lowest shrinkage in the industry
• Entrances and exits are controlled
• Membership format limits theft
• Good relations among employees limits internal theft
Strategy: Cost Control
116

Strategy: Cost Control
• Volume purchasing
• Purchasing directly from manufacturers
• Pre-paying vendors to receive payment discounts
• Minimizing stocking fees
• Utilizing warehouse space
• No elaborate facilities and rent is lower since it is not in a prime location
• No lights on most days to save electricity
Strategy: Cost Control
117
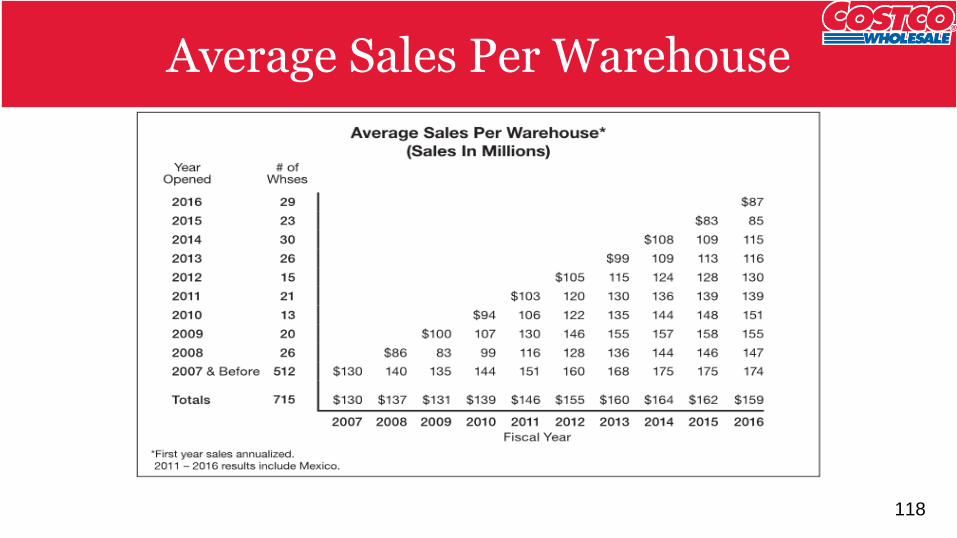
Average Sales Per Warehouse
118
Product Line
• Limiting products to fast selling models, sizes and colors (~4000 items)
• Rapid inventory turnover
• No-name products can be marked by more than 14%; private items 15%
• Volume purchasing
• Purchasing directly from manufacturers
• Pre-paying vendors to receive payment discounts
• Minimizing stocking fees
• Utilizing warehouse space
Product Line
119
Regulatory Environment
• Costco is present in many different countries, all with different regulations and standards
• Proper and accurate accounting information must be filed
• Changes in tax rates in some countries could be an advantage or disadvantage
Regulatory Environment
120
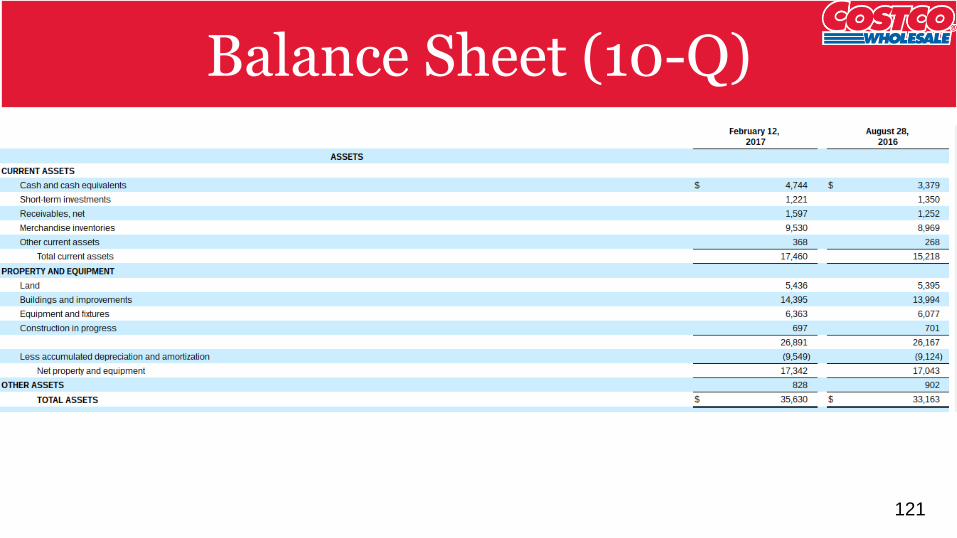
Balance Sheet (10-Q)Balance Sheet (10-Q)
121
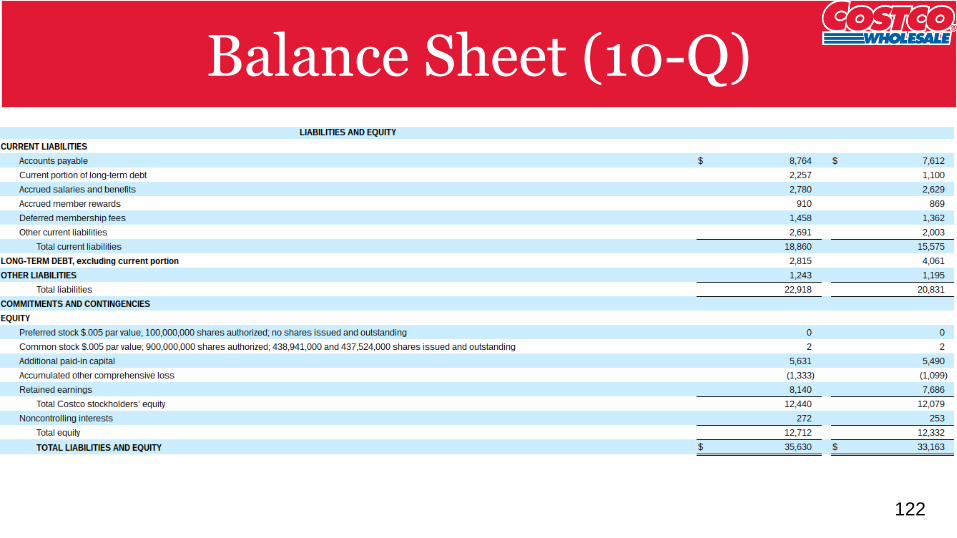
Balance Sheet (10-Q)Balance Sheet (10-Q)
122
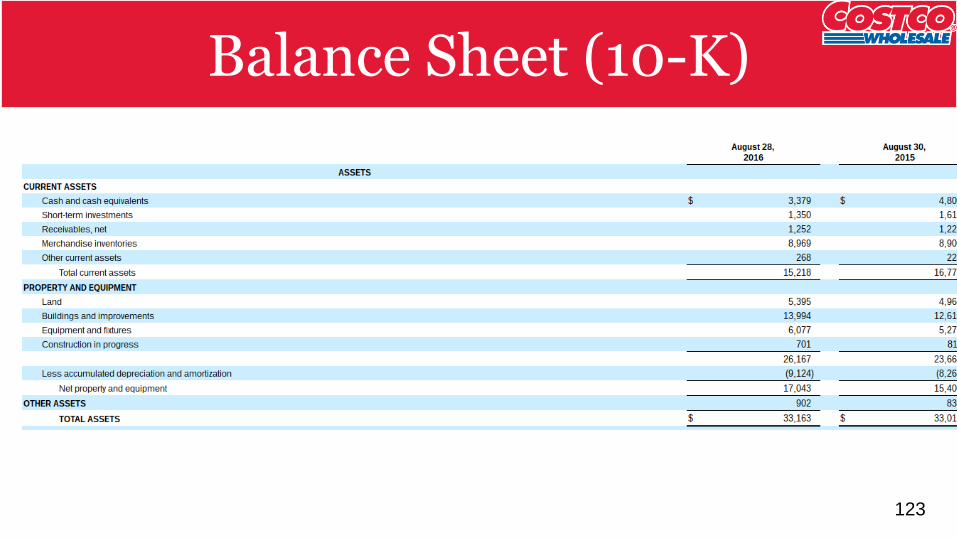
Balance Sheet (10-K)Balance Sheet (10-K)
123
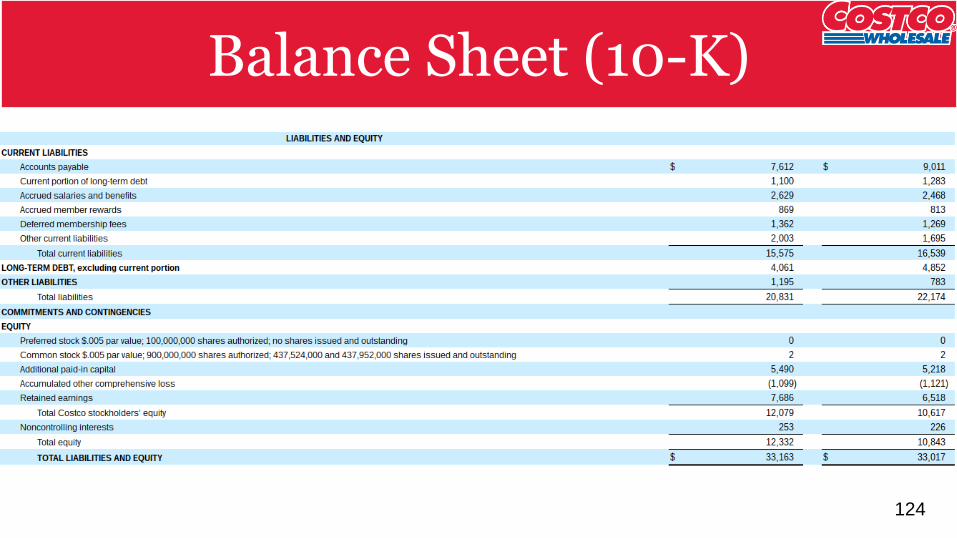
Balance Sheet (10-K)Balance Sheet (10-K)
124
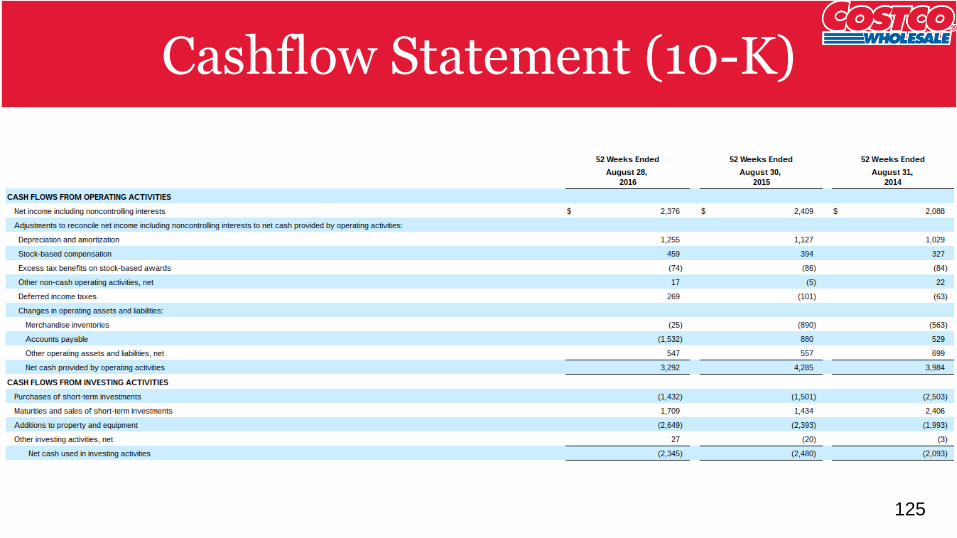
Cash Flow Statement (10-K)Cashflow Statement (10-K)
125
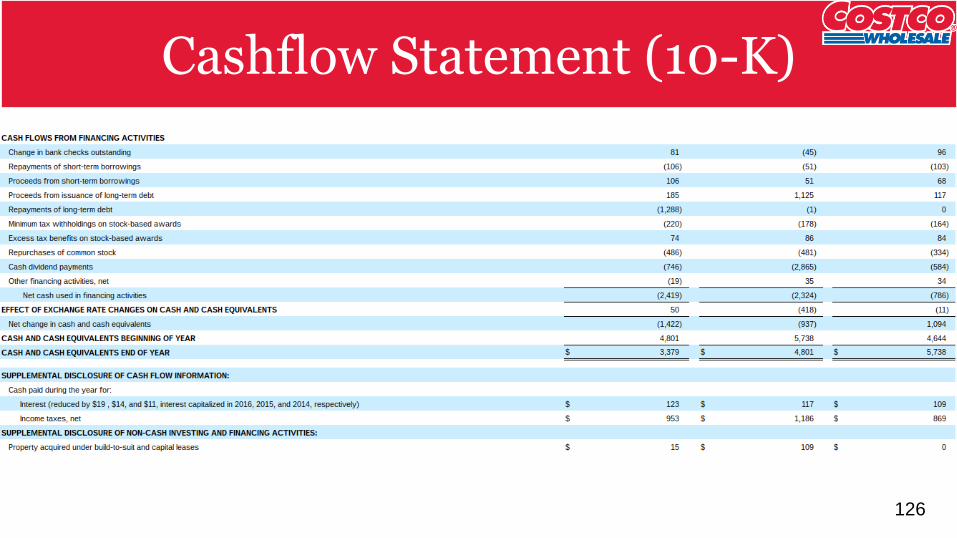
Cash Flow Statement (10-K)Cashflow Statement (10-K)
126
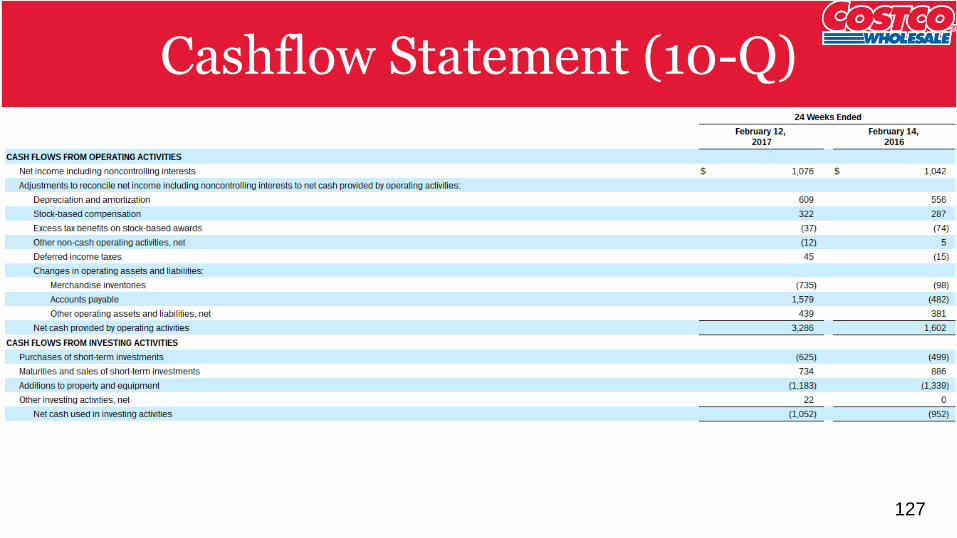
Cash Flow Statement (10-Q) Cashflow Statement (10-Q)
127
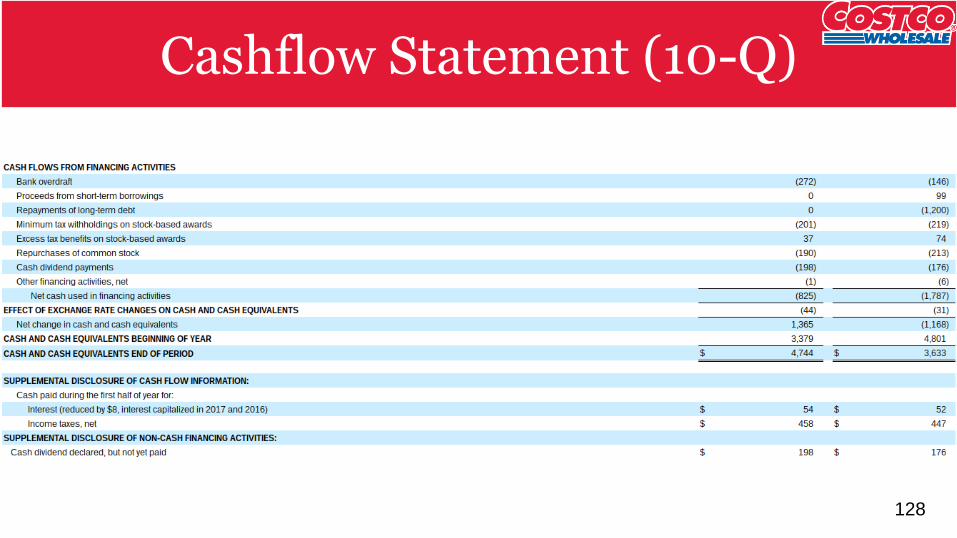
Cash Flow Statement (10-Q)Cashflow Statement (10-Q)
128
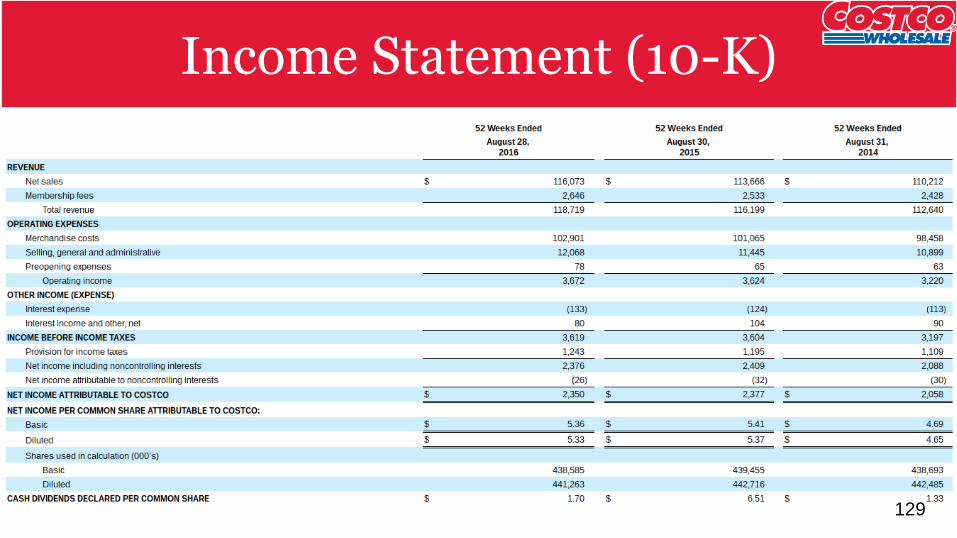
Income Statement (10-K)Income Statement (10-K)
129
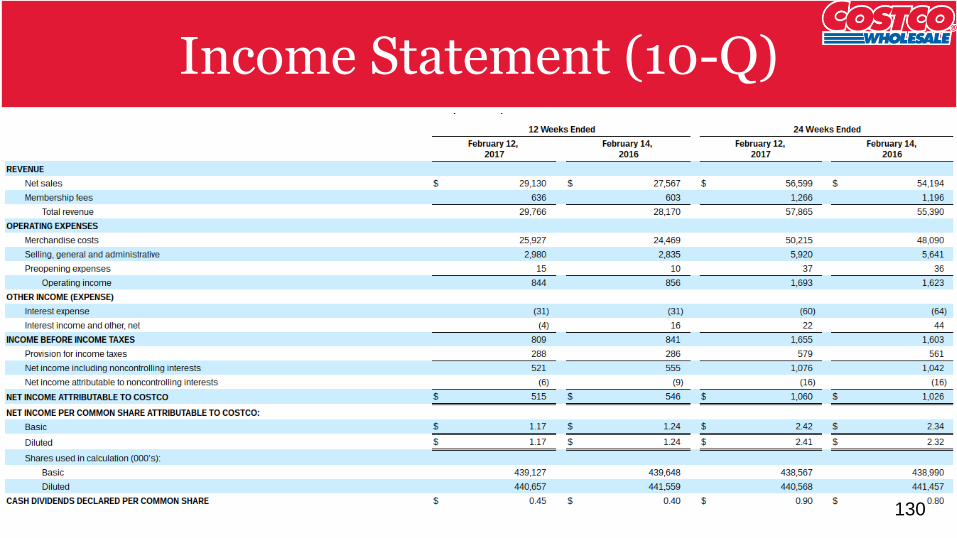
Income Statement (10-Q)Income Statement (10-Q)
130
Value Drivers
• Low cost of goods achieved through distribution and supply chain
• Image of low cost – some products are actually cheaper elsewhere
• Location
• Variety in product line
• Sales per square foot advantage
Value Drivers
131
Sales Per Square Foot
Costco
• 103.2M square feet
• $116, 073M in net sales
• $1,124.74 sales per square foot
Wal-Mart
• 1,135M square feet
• $482,130M in net sales
• $424.78 sales per square foot
Sales Per Square Foot
132
Costco’s Industry
As stated in the 2016 annual report:
• The industry is highly competitive and saturated
• The online retail market has enhanced competition
• Competitors may have more funds, better access to merchandise and greater market penetration than Costco does
• The inability to respond to these pressures could negatively impact financial results
Costco’s Industry
133
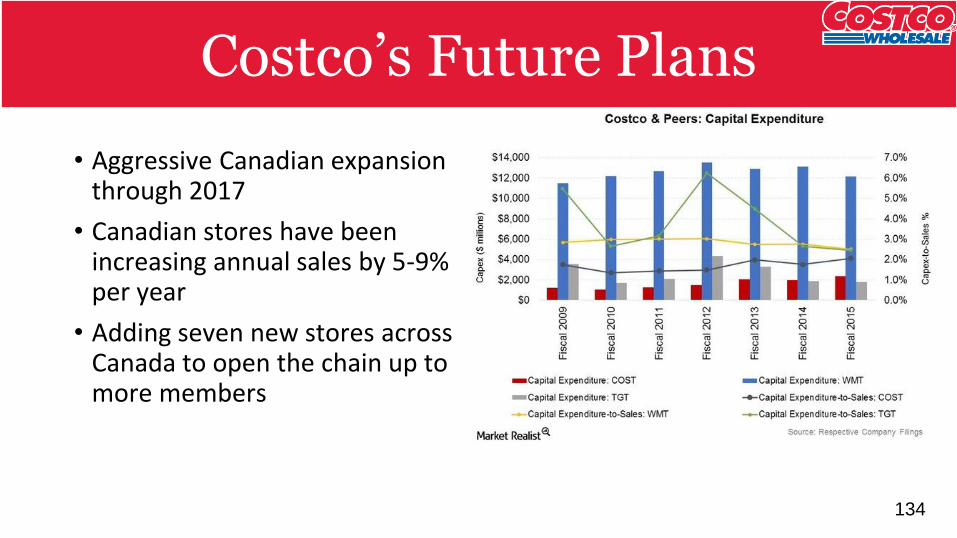
Costco’s Future Plans
• Aggressive Canadian expansion through 2017
• Canadian stores have been increasing annual sales by 5-9% per year
• Adding seven new stores across Canada to open the chain up to more members
Costco’s Future Plans
134
Valuing Costco
Costco
• P/E = 30.78
• P/BV = 5.99
• D/E = 1.75
Industry Average
• P/E = 16.8
• P/BV = 3.2
• D/E = 1.27
This stock may be overvalued.
Valuing Costco
135
Recommendation
BUY• This is overvalued, but is still consistently growing• Large capital expenditure planned for Canadian expansion is planned
for 2017• Costco
• Membership is growing
• Dividends are being paid
Recommendation
136

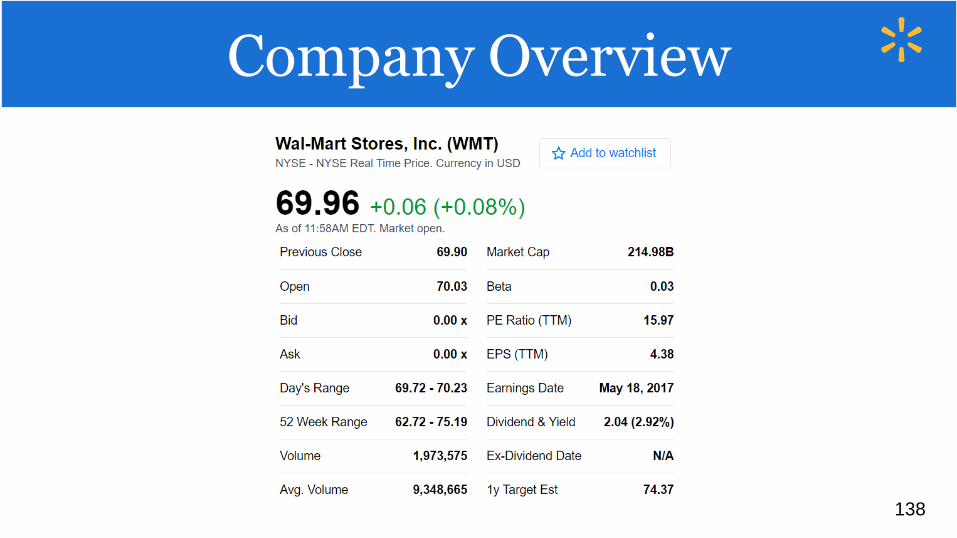
Company Overview
138
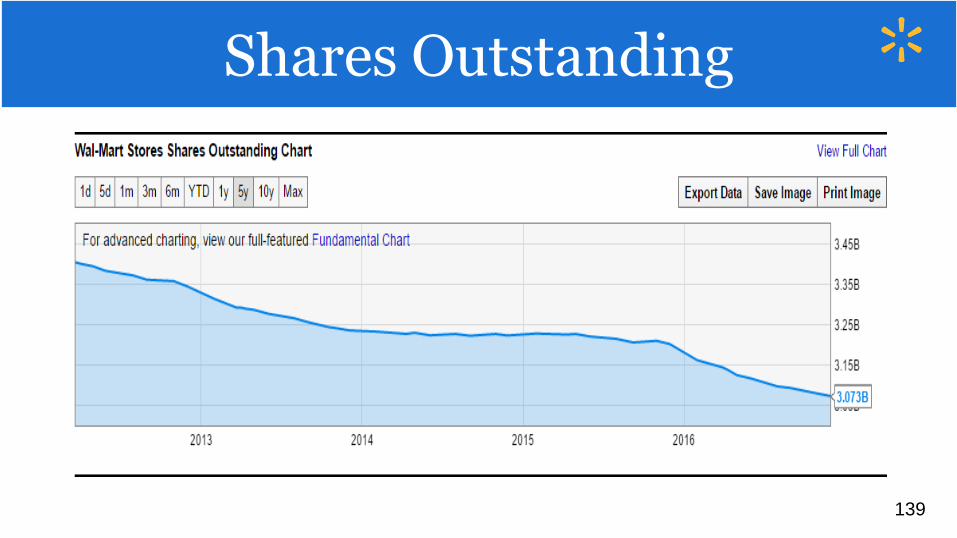
Shares Outstanding
139
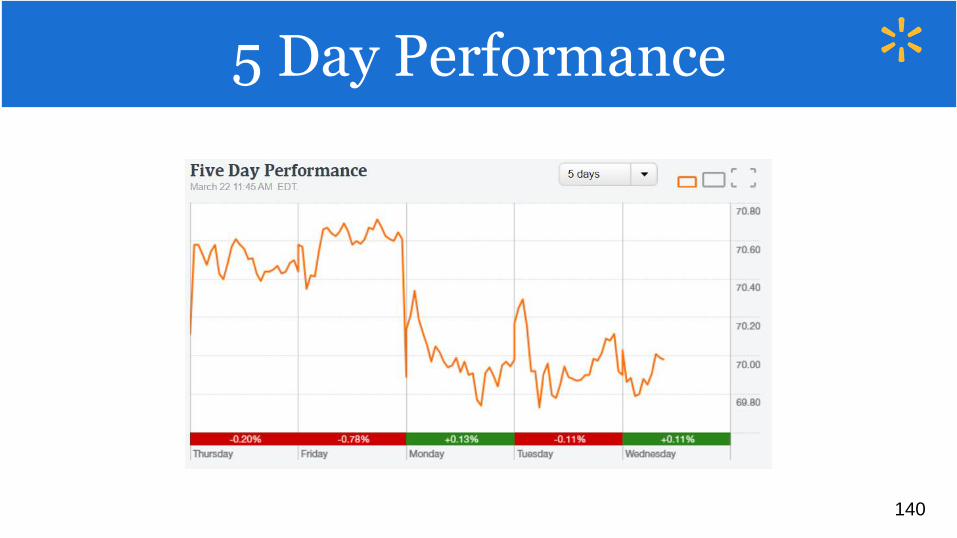
5 Day Performance
140
1 Year Performance
141
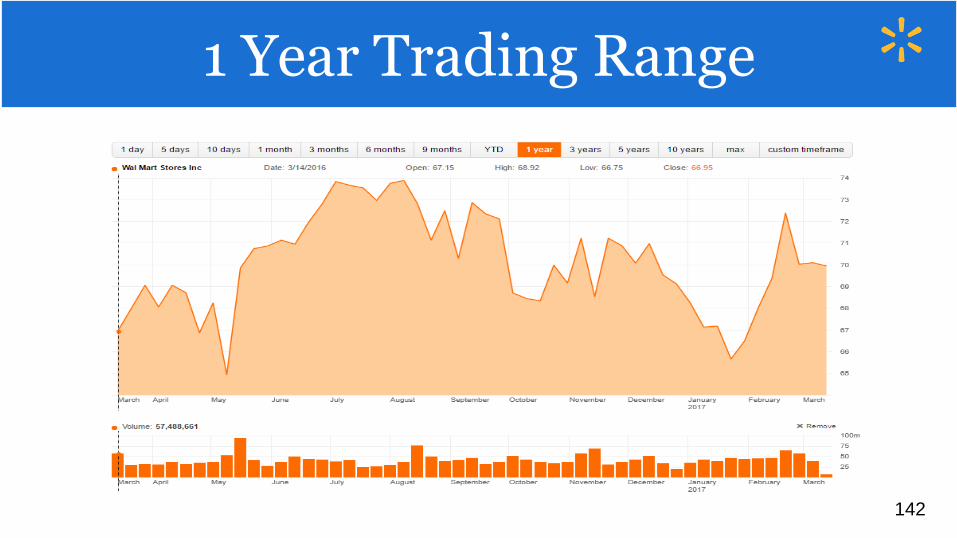
1 Year Trading Range
142
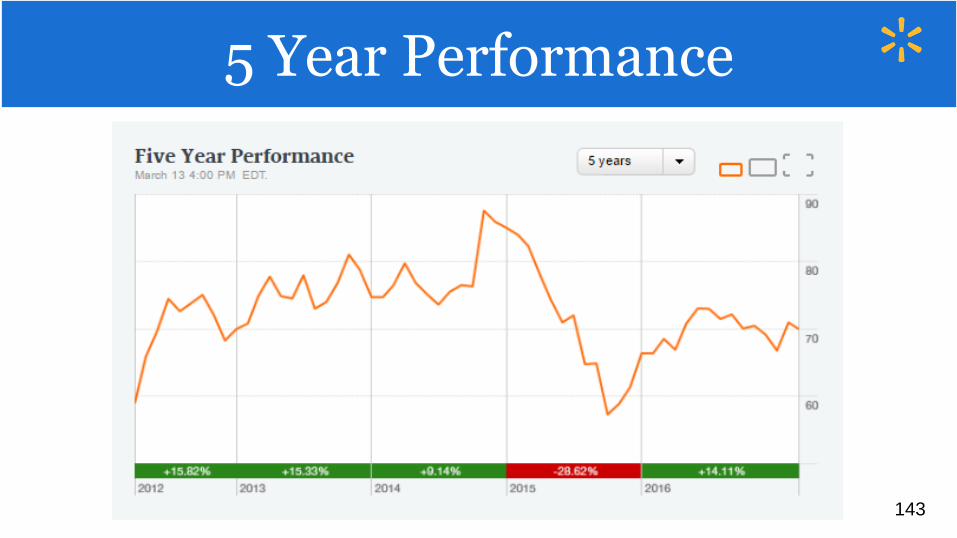
5 Year Performance
143
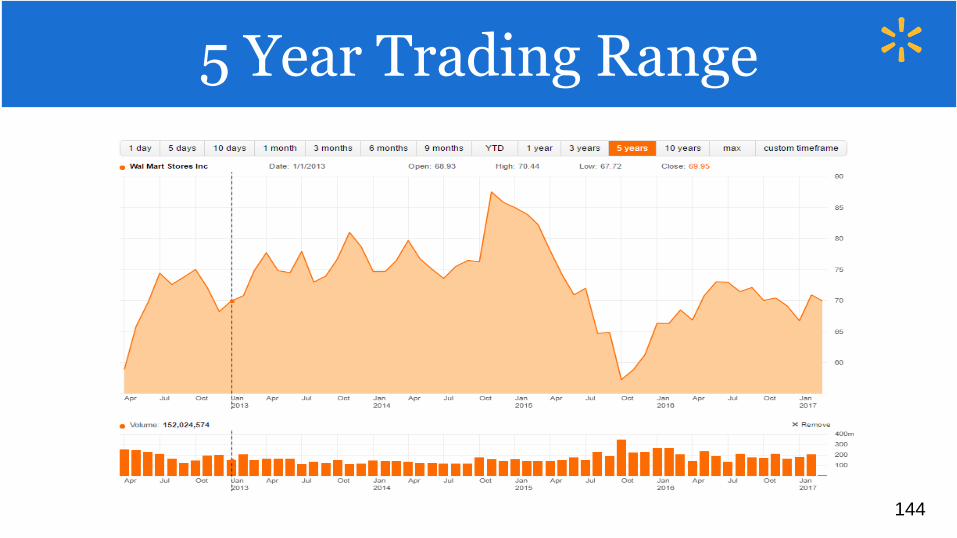
5 Year Trading Range
144
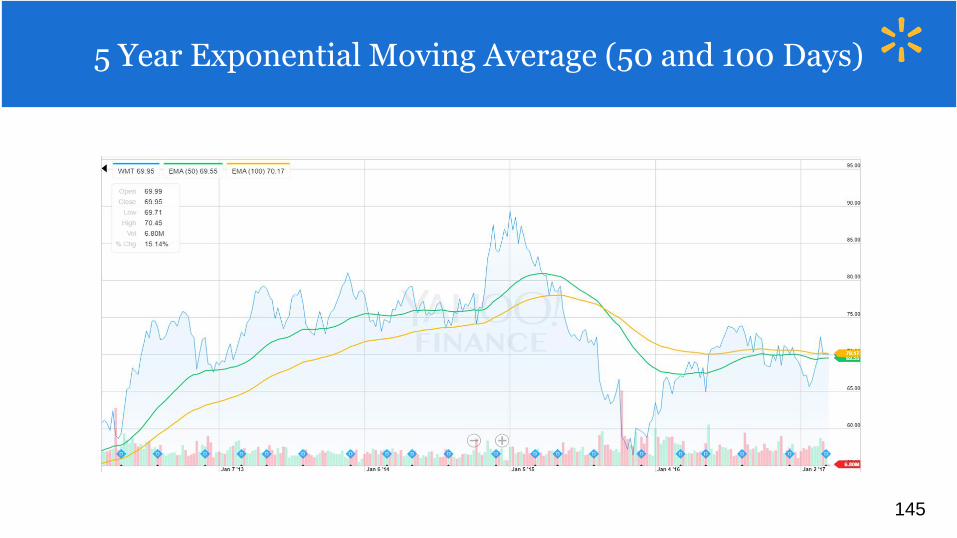
5 Year Exponential Moving Average (50 and 100 Days)
145
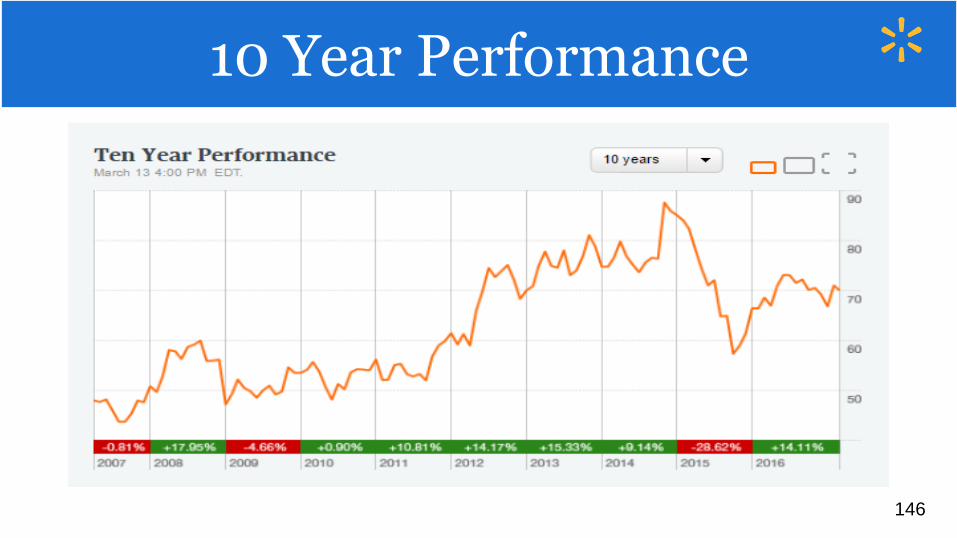
10 Year Performance
146
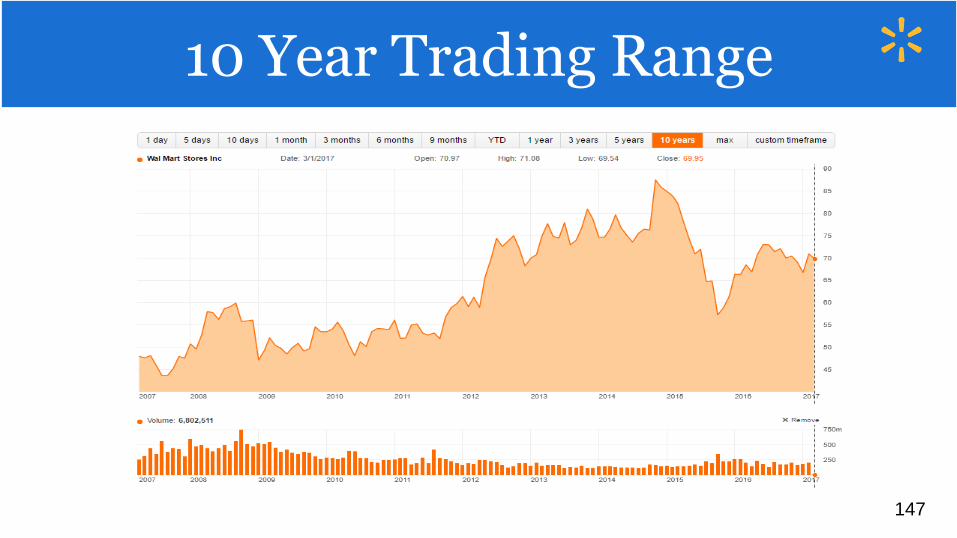
10 Year Trading Range
147
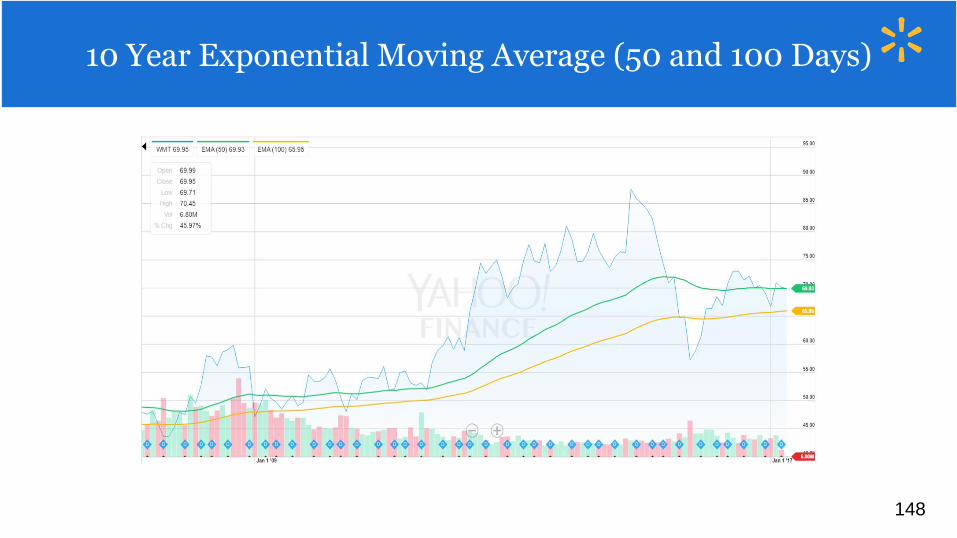
5 year Exponential moving average(50 and 100 days)
10 Year Exponential Moving Average (50 and 100 Days)
148
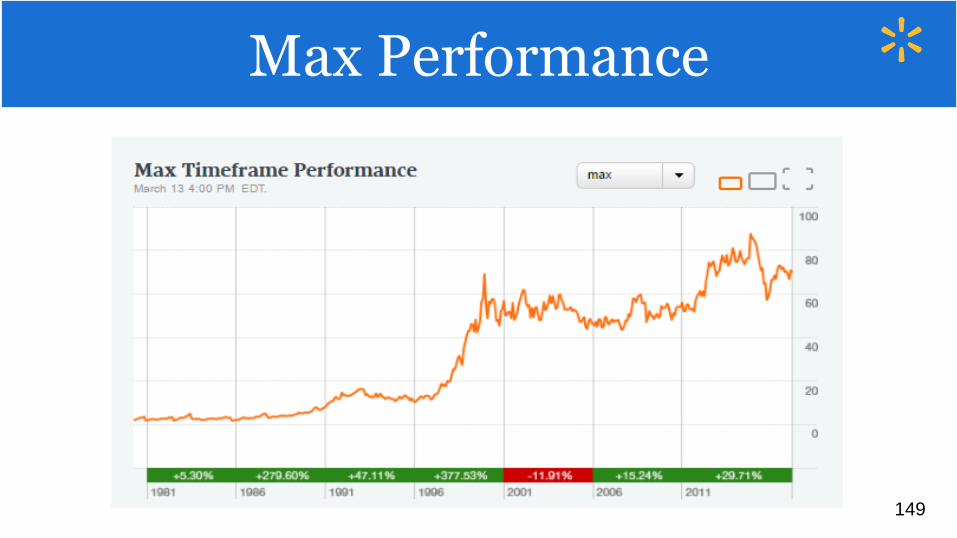
Max Performance
149
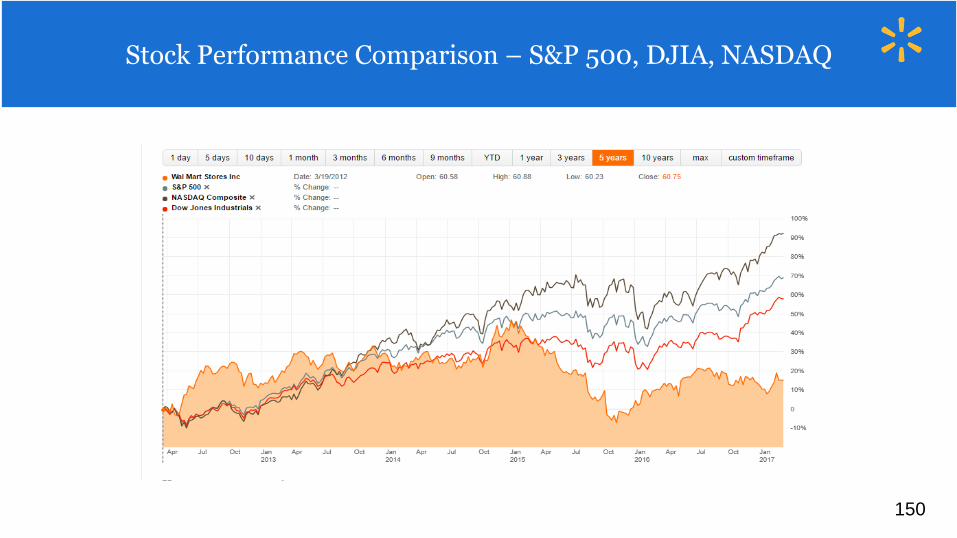
Stock Performance Comparison – S&P 500, DJIA, NASDAQ
150
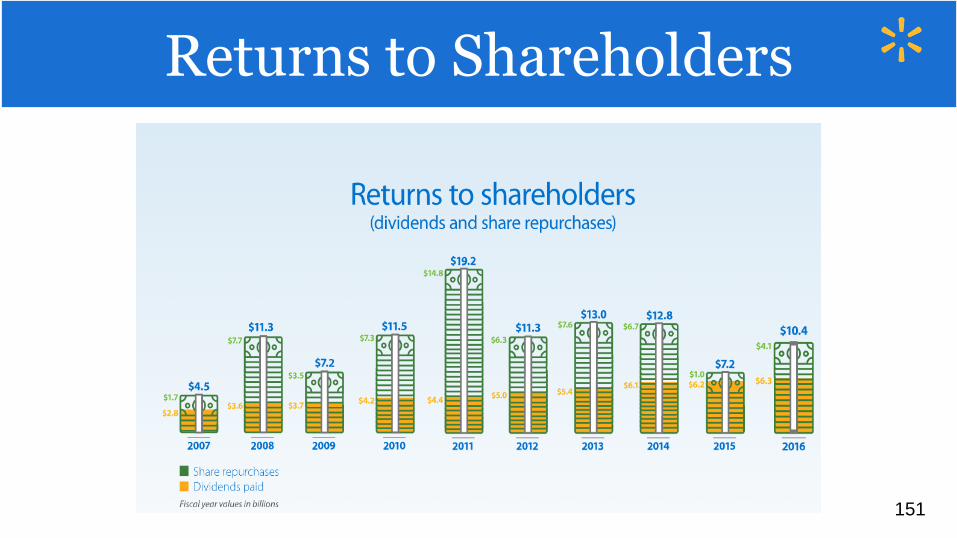
Returns to Shareholders
151
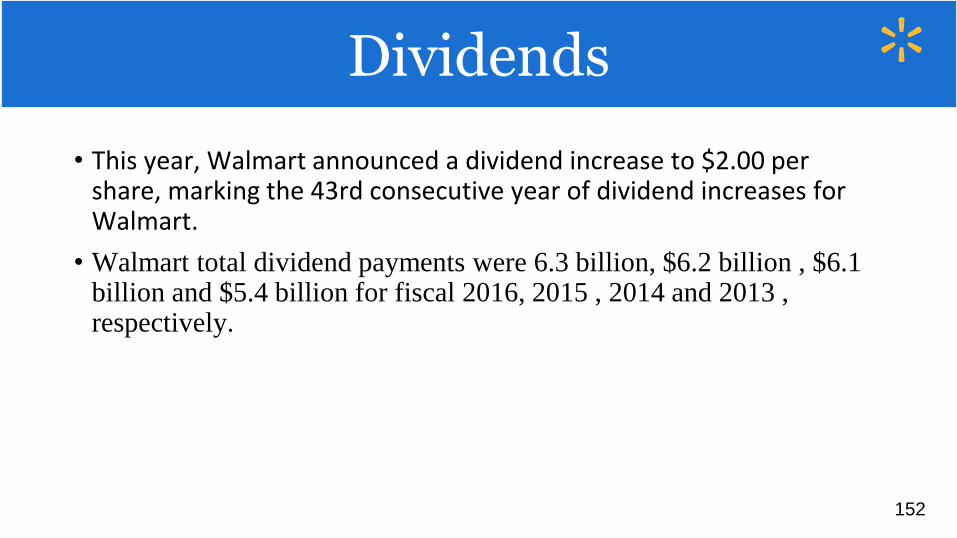
• This year, Walmart announced a dividend increase to $2.00 per share, marking the 43rd consecutive year of dividend increases for Walmart.per
• Walmart total dividend payments were 6.3 billion, $6.2 billion , $6.1 billion and $5.4 billion for fiscal 2016, 2015 , 2014 and 2013 , respectively.
• share.
Dividends Dividends
152
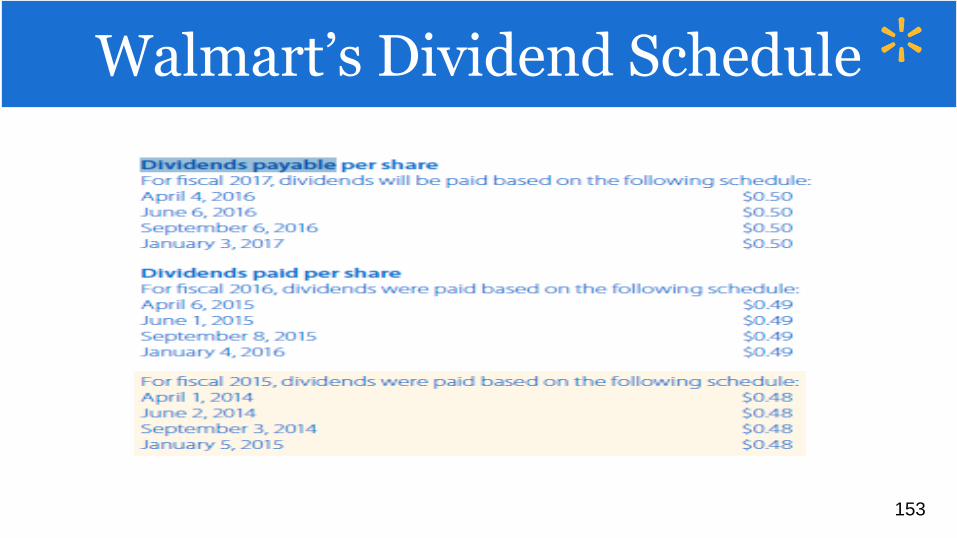
Walmart’s Dividend Schedule
153
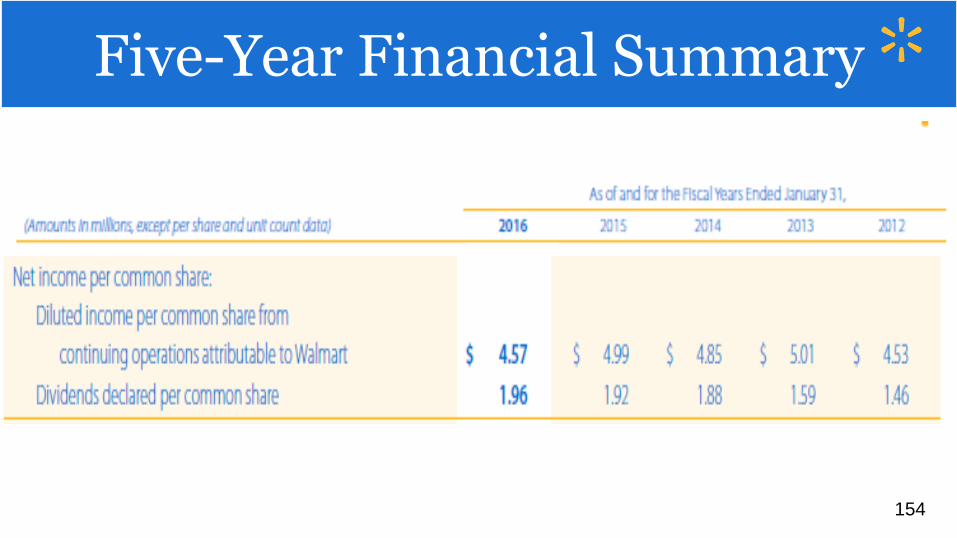
Five-Year Financial Summary
154
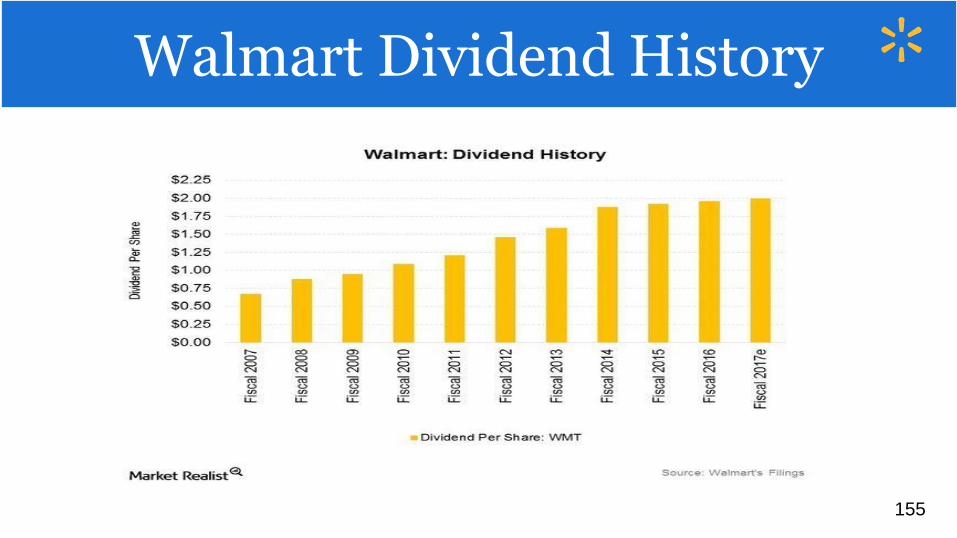
Walmart: Dividend HistoryWalmart Dividend History
155
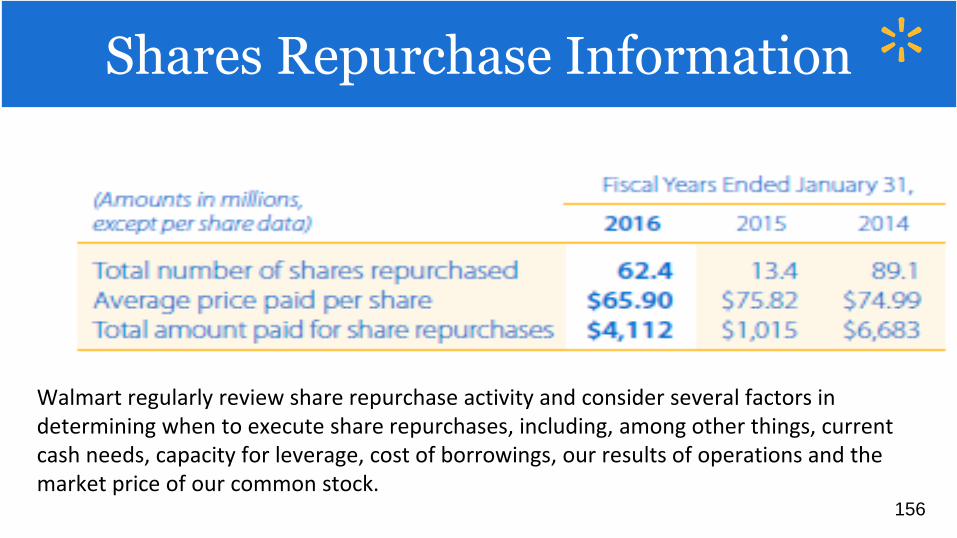
Walmart regularly review share repurchase activity and consider several factors in determining when to execute share repurchases, including, among other things, current cash needs, capacity for leverage, cost of borrowings, our results of operations and the market price of our common stock.
Shares Repurchase Information
156
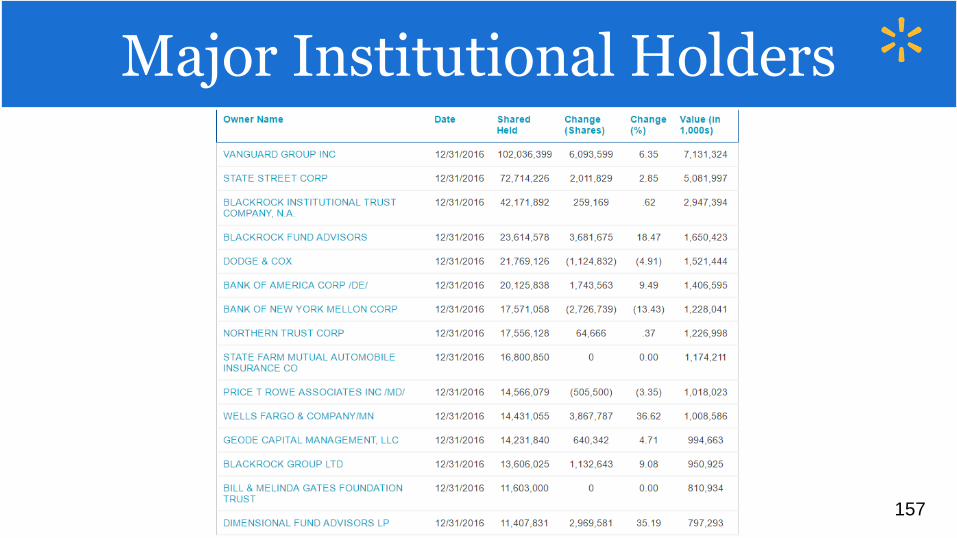
Major Institutional HoldersMajor Institutional Holders
157
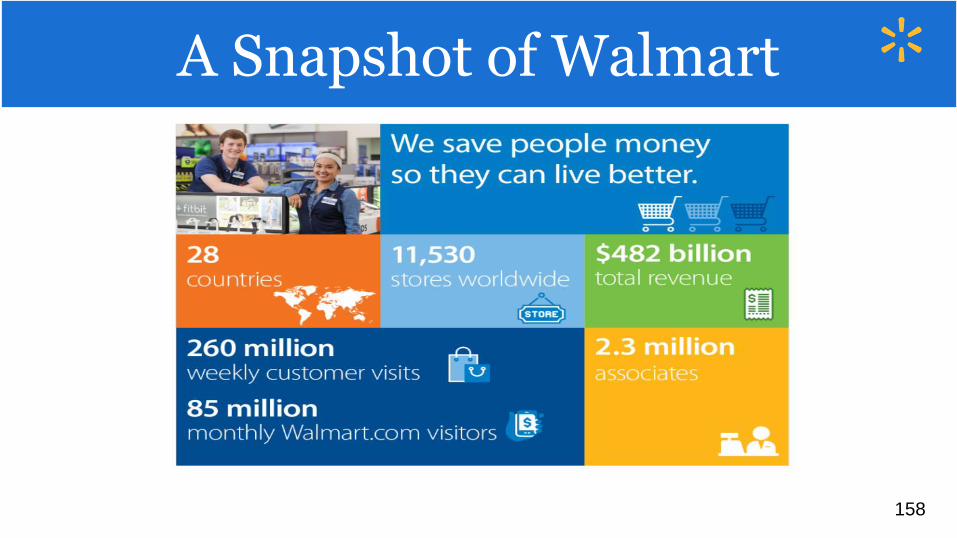
A Snapshot of Walmart
158
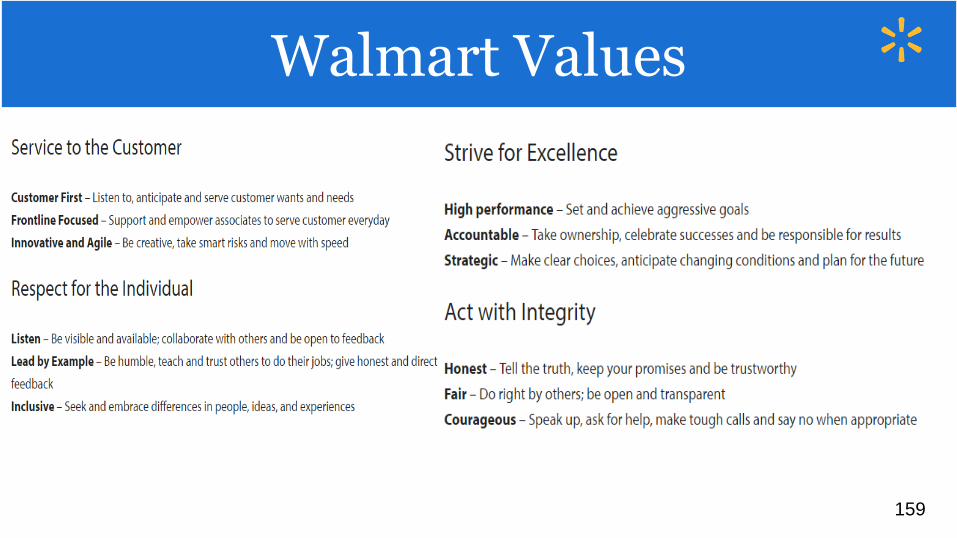
Walmart Values
159
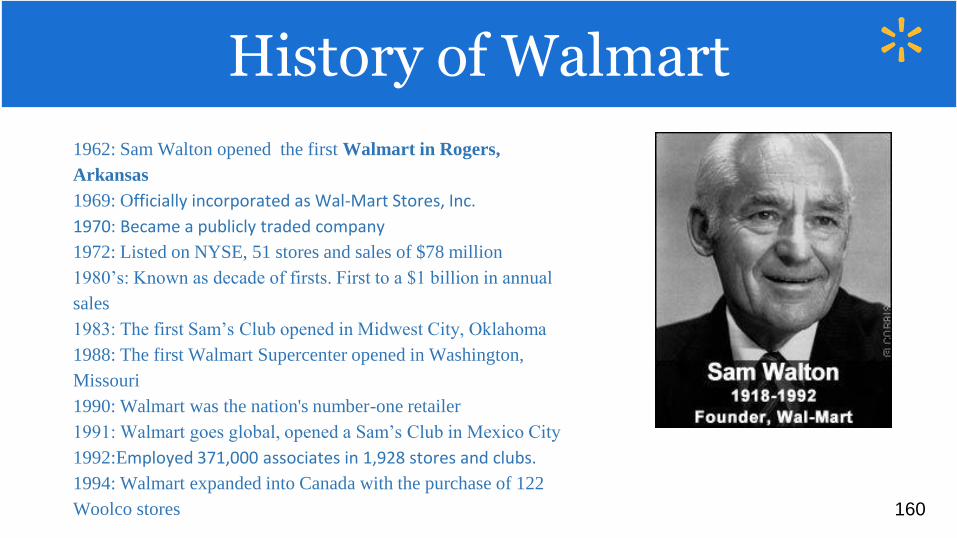
1962: Sam Walton opened the first Walmart in Rogers,
Arkansas
1969: Officially incorporated as Wal-Mart Stores, Inc.
1970: Became a publicly traded company
1972: Listed on NYSE, 51 stores and sales of $78 million
1980’s: Known as decade of firsts. First to a $1 billion in annual
sales
1983: The first Sam’s Club opened in Midwest City, Oklahoma
1988: The first Walmart Supercenter opened in Washington,
Missouri
1990: Walmart was the nation's number-one retailer
1991: Walmart goes global, opened a Sam’s Club in Mexico City
1992:Employed 371,000 associates in 1,928 stores and clubs.
1994: Walmart expanded into Canada with the purchase of 122
Woolco stores
History of Walmart
160
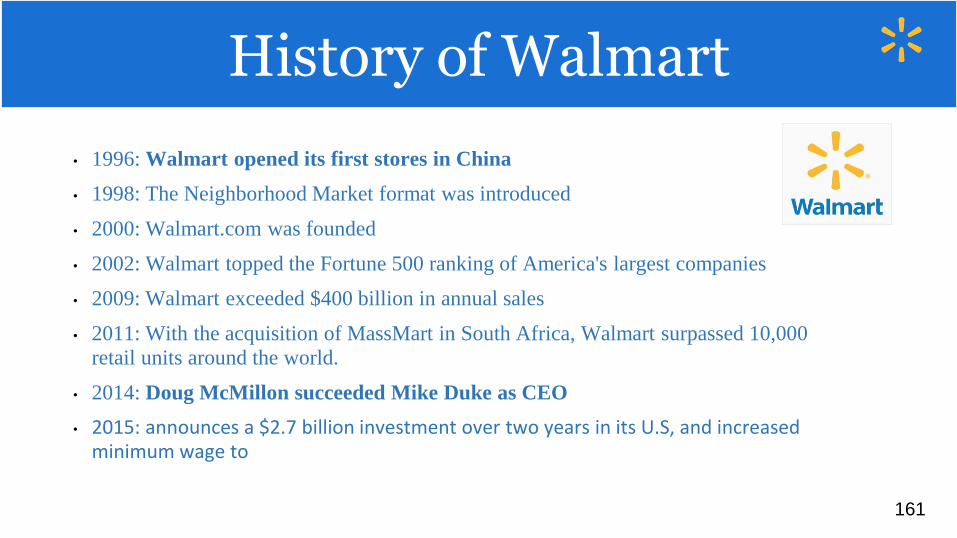
• 1996: Walmart opened its first stores in China
• 1998: The Neighborhood Market format was introduced
• 2000: Walmart.com was founded
• 2002: Walmart topped the Fortune 500 ranking of America's largest companies
• 2009: Walmart exceeded $400 billion in annual sales
• 2011: With the acquisition of MassMart in South Africa, Walmart surpassed 10,000
retail units around the world.
• 2014: Doug McMillon succeeded Mike Duke as CEO
• 2015: announces a $2.7 billion investment over two years in its U.S, and increased minimum wage to
History of Walmart ContinuedHistory of Walmart
161
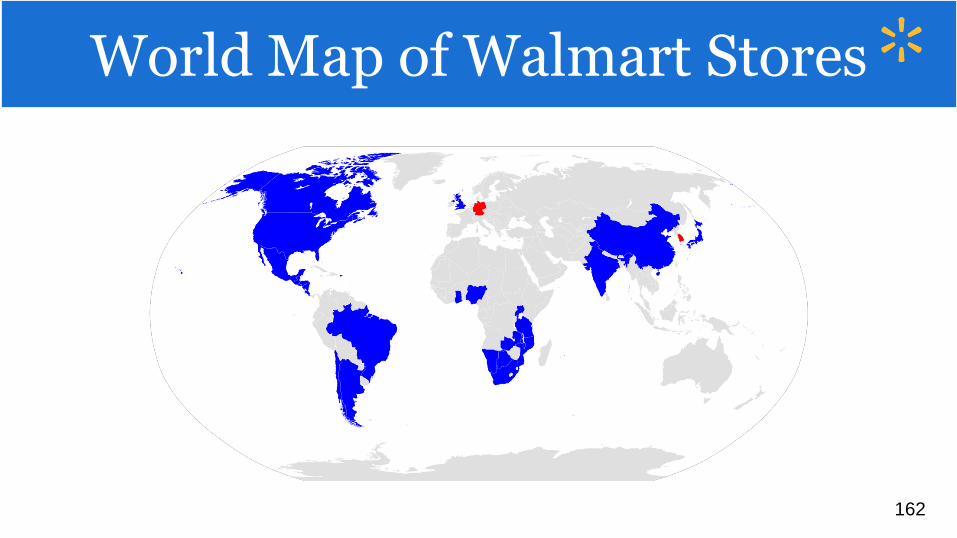
World Map of Walmart storesWorld Map of Walmart Stores
162
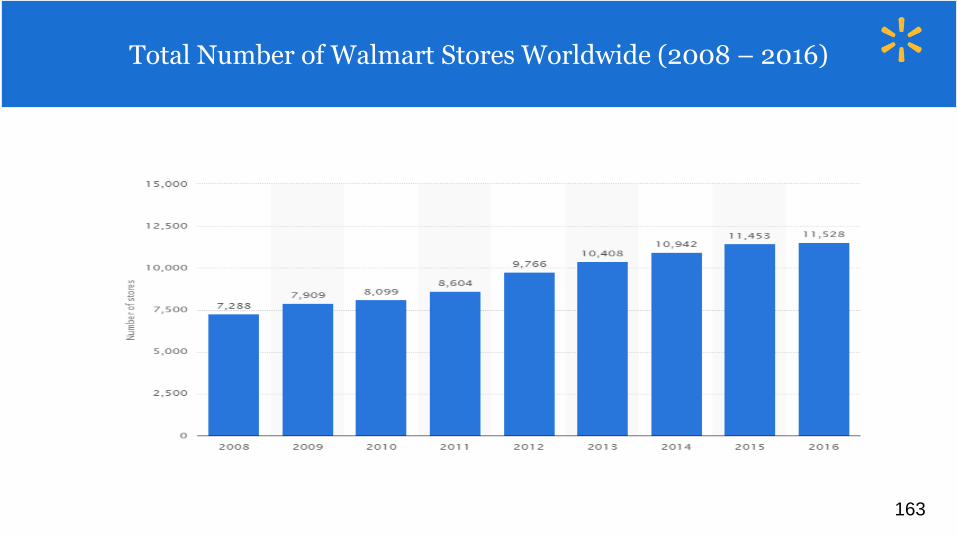
Total number of Walmart stores worldwide from 2008 to 2016
Total Number of Walmart Stores Worldwide (2008 – 2016)
163
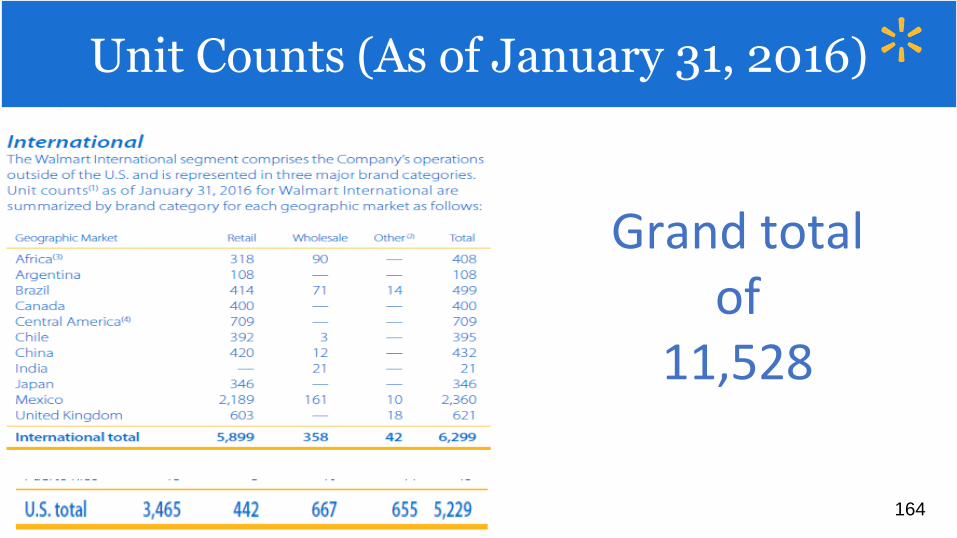
Unit Counts as of January 31, 2016
Grand total of
11,528
Unit Counts (As of January 31, 2016)
164

Net Sales Breakdown
165
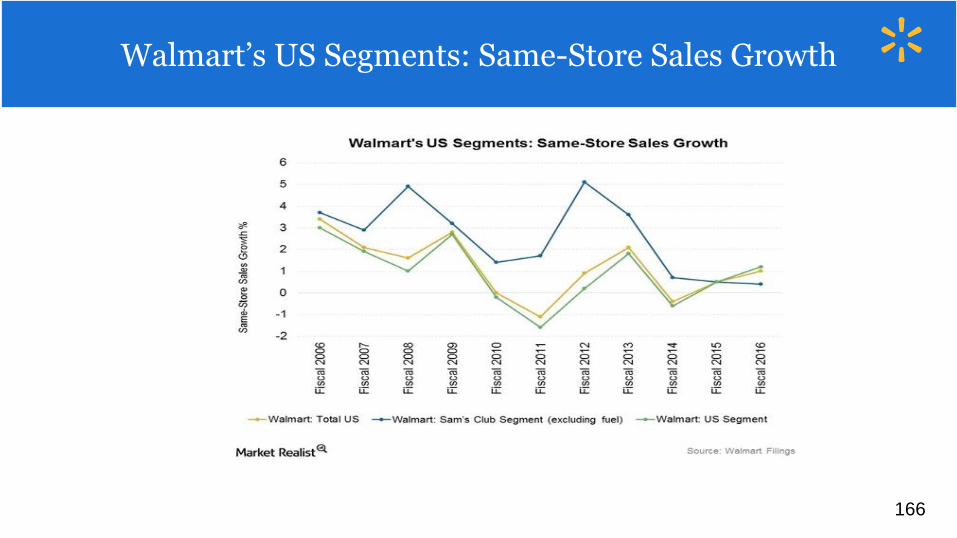
Walmart’s US Segments: Same-Store Sales Growth
166
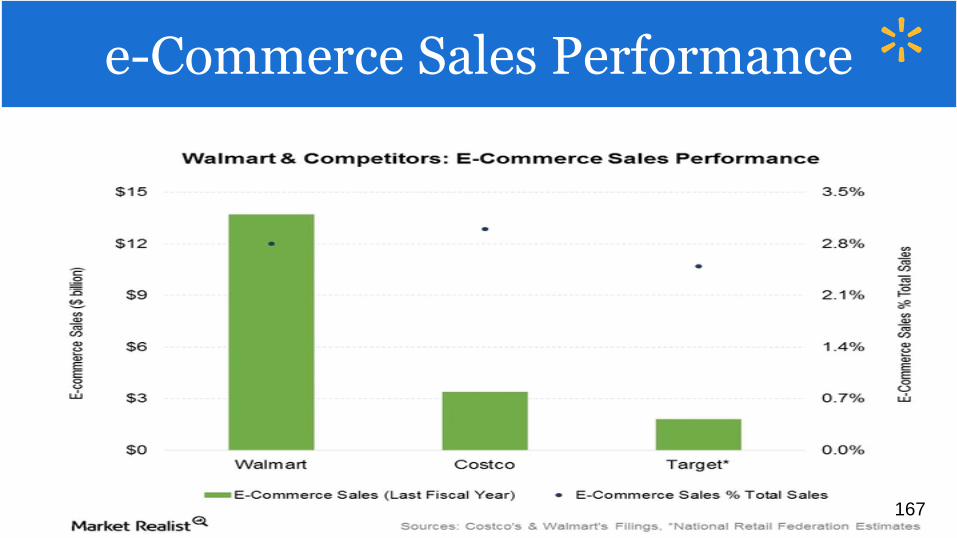
E-commerce Sales Performance vs Competitorse-Commerce Sales Performance
167
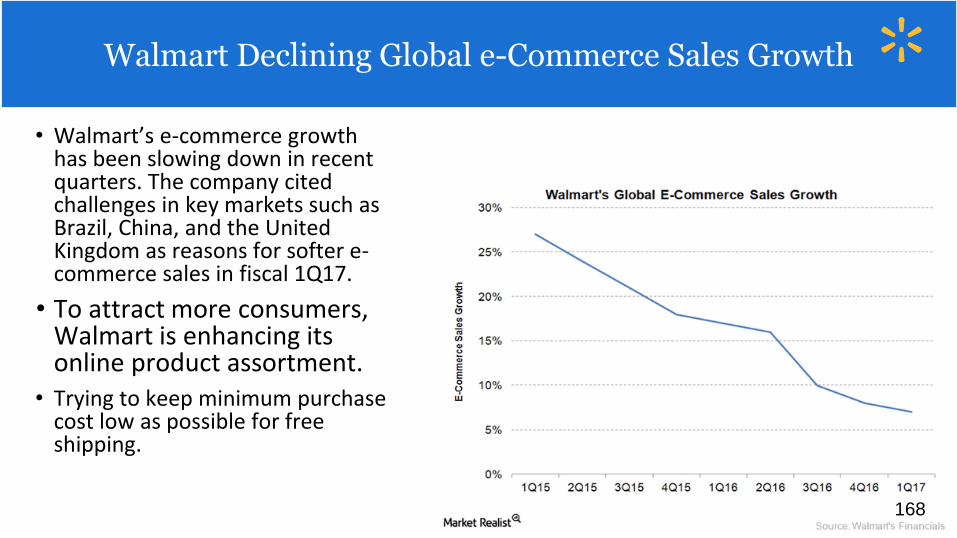
• Walmart’s e-commerce growth has been slowing down in recent quarters. The company cited challenges in key markets such as Brazil, China, and the United Kingdom as reasons for softer e-commerce sales in fiscal 1Q17.
• To attract more consumers, Walmart is enhancing its online product assortment.
• Trying to keep minimum purchase cost low as possible for free shipping.
Walmart’s declining global E-commerce Sales GrowthWalmart Declining Global e-Commerce Sales Growth
168
Acquisition of Jet.com
It’s the largest acquisition in E-commerce history: $3 billion in cash plus up to $300 million in shares. And all for a two-year-old company that’s just getting off the ground.
By purchasing Jet, Walmart’s biggest attempt to stick it to Amazon and take a share of the E-commerce pie, the offline retail giant has cunningly opened up an opportunity to slide in as one of the biggest go-to online retailers for customers and sellers alike.
The promise Jet brings is grounded in its technology specifically, the powerful AI software which Jet’s online platform is built on.
Unique to Jet, the proprietary algorithm pulls data from their vast marketplace of third party sellers, serving their customers with the best products, at the best price, by the best possible means of delivery.
Recent Events
169
Acquisition of Shoebuy.com
And future plans
Wal-Mart is kicking off the
year with the acquisition of
ShoeBuy.com, an online shoe
retailer that competes
with Amazon's Zappos.
The acquisition
reportedly cost $70
million.
Apparel is the largest online
sales category in the United
States. It shouldn't be a huge
surprise that Amazon is the
largest online seller of clothing
in the country.
The ShoeBuy acquisition
is a perfect fit to launch
sales of the "long-tail,
high-margin" categories
Wal-Mart is lacking.
A big budget for improvements and acquisitionsWal-Mart plans on spending $1.1 billion on
its e-commerce operations in fiscal 2018,
up from $900 million this year. But Wal-
Mart developed that plan before it acquired
Jet.com and put Marc Lore in charge of
growing its e-commerce business.
Recent Events
170
Walton FamilyWalton Family
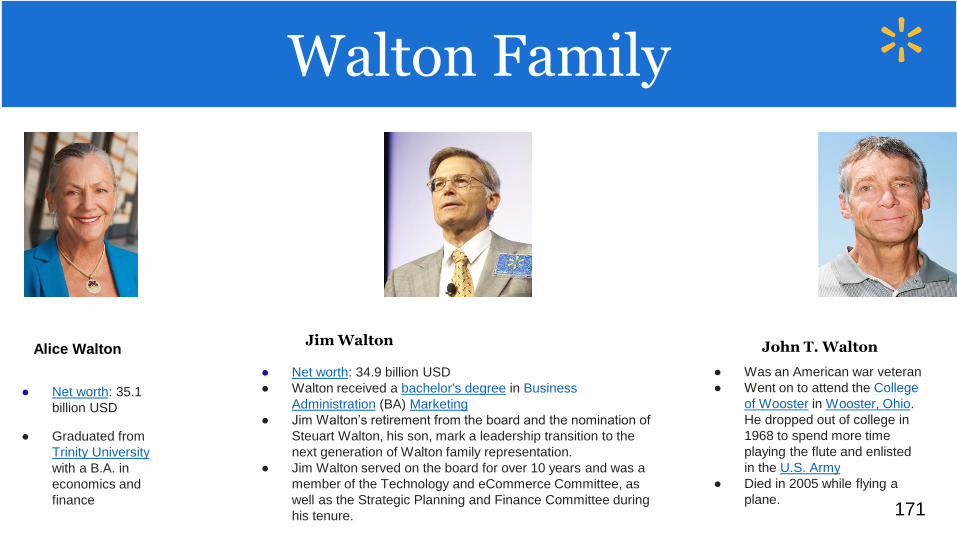
Alice Walton
● Net worth: 35.1
billion USD
● Graduated from
Trinity University
with a B.A. in
economics and
finance
Jim Walton
● Net worth: 34.9 billion USD
● Walton received a bachelor's degree in Business
Administration (BA) Marketing
● Jim Walton’s retirement from the board and the nomination of
Steuart Walton, his son, mark a leadership transition to the
next generation of Walton family representation.
● Jim Walton served on the board for over 10 years and was a
member of the Technology and eCommerce Committee, as
well as the Strategic Planning and Finance Committee during
his tenure.
John T. Walton
● Was an American war veteran
● Went on to attend the College
of Wooster in Wooster, Ohio.
He dropped out of college in
1968 to spend more time
playing the flute and enlisted
in the U.S. Army
● Died in 2005 while flying a
plane. 171
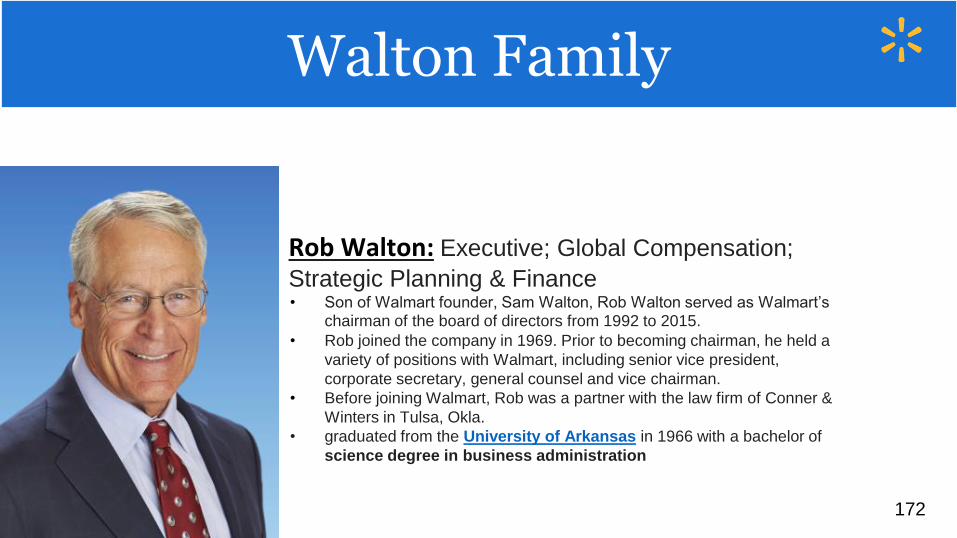
Rob Walton: Executive; Global Compensation;
Strategic Planning & Finance• Son of Walmart founder, Sam Walton, Rob Walton served as Walmart’s
chairman of the board of directors from 1992 to 2015.
• Rob joined the company in 1969. Prior to becoming chairman, he held a
variety of positions with Walmart, including senior vice president,
corporate secretary, general counsel and vice chairman.
• Before joining Walmart, Rob was a partner with the law firm of Conner &
Winters in Tulsa, Okla.
• graduated from the University of Arkansas in 1966 with a bachelor of
science degree in business administration
Walton Family
172
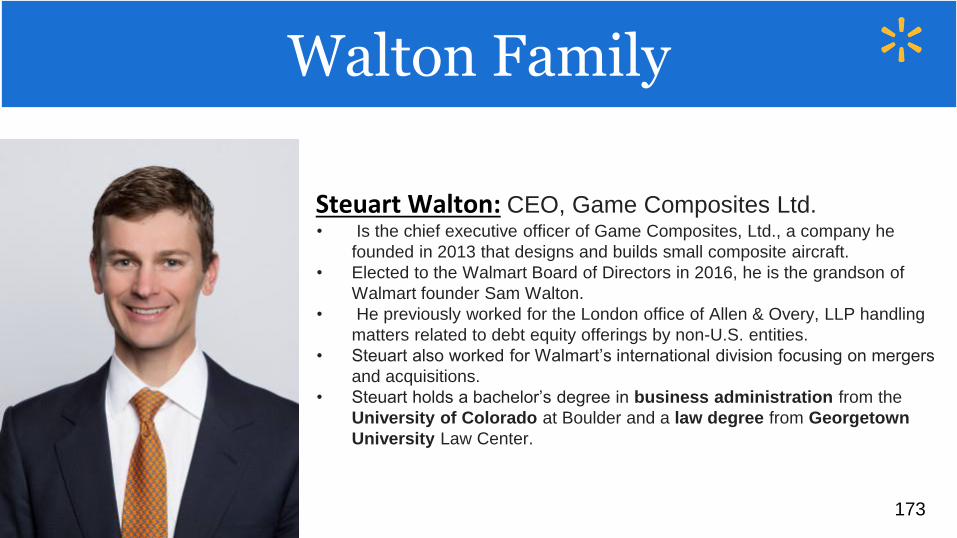
Steuart Walton: CEO, Game Composites Ltd.• Is the chief executive officer of Game Composites, Ltd., a company he
founded in 2013 that designs and builds small composite aircraft.
• Elected to the Walmart Board of Directors in 2016, he is the grandson of
Walmart founder Sam Walton.
• He previously worked for the London office of Allen & Overy, LLP handling
matters related to debt equity offerings by non-U.S. entities.
• Steuart also worked for Walmart’s international division focusing on mergers
and acquisitions.
• Steuart holds a bachelor’s degree in business administration from the
University of Colorado at Boulder and a law degree from Georgetown
University Law Center.
Walton Family
173
Walmart Management
Doug McMillon: CEO and President of Walmart Inc.• As CEO, Doug leads a strong management team that is
working to deliver Walmart’s mission of “saving people money so they can live better.”
• Mr. McMillon has more than 25 years of experience in the retail industry and at our company.
• From February 2009 to February 2014, Doug served as president and chief executive officer of Walmart International, a fast-growing segment of Walmart’s overall operations
• Originally from Jonesboro, Ark., Doug graduated from the University of Arkansas with a bachelor of science in business administration. He earned his MBA in finance from the University of Tulsa.
Management
174
Greg Foran: CEO and president of Walmart U.S.• Greg is responsible for the strategic direction and performance of
more than 4,500 Walmart stores and 1.3 million associates'. • Greg is a 35-year retail veteran with extensive experience in
marketing, operational and executive roles. He most recently served as president and CEO of Walmart Asia and was responsible for the company’s operations in China, Japan and India, as well as business development throughout the continent.
• Prior to Walmart, Greg held a number of roles with Woolworths, the leading retailer in Australia and New Zealand. He served as the managing director of supermarkets, liquor and petrol with responsibility for more than $40 billion in sales at that time.
• Greg attended two advanced management programs at both Harvard University and the University of Virginia. Greg also has a diploma in management from the New Zealand Institute of Management in Auckland, New Zealand.
Management
175
David Cheesewright: CEO and president of Walmart International• David is responsible fast-growing segment of Walmart's overall
operations, with more than 6,300 stores and more than 777,000 associates serving customers in 27 countries
• Dave’s career spans more than 25 years in the international retail and manufacturing sectors. He was appointed president and CEO of Walmart Canada in February 2008.
• Prior to being named to this role, he was president and CEO for Walmart’s EMEA and Canada region since September 2011.
• While in Canada, he led the growth of Walmart’s operations, including bringing the company’s highly successful supercenter format to the Canadian market and expanding its e-commerce capabilities there.
• He holds a first-class honors degree in sports science and mathematics from Loughborough University, U.K.
Management
176
Marc Lore: CEO and President, Walmart eCommerce U.S.• He was appointed in September 2016 to lead U.S. e-
commerce when his company Jet.com was acquired
• In his role, he accelerates Walmart’s U.S. e-commerce
growth and customer reach, leading Walmart.com and
Jet.com.
• Prior to Jet, Marc was the co-founder and CEO of Quidsi,
the parent company of e-commerce websites Diapers.com,
Soap.com, Wag.com and more.
• Marc’s industry accolades include E&Y’s Entrepreneur of the
Year regional winner and Fortune’s “smartest people in
technology.”
• He graduated from Bucknell University, where he received
a B.A. in Business Management and Economics,
graduating cum laude.
Management
177
Claire Babineaux-Fontenot: Executive Vice President and Treasurer for Wal-mart Stores, Inc.• Claire joined the company in 2004 as vice president of audits and
tax policy. In 2007, she was promoted to senior vice president and chief tax officer.
• Prior to Walmart, Claire was partner at the law firm of Adams & Reese, where she was leader of the firm’s tax practice and partner-in-charge of the Baton Rouge office.
• Claire has been recognized throughout her career for her strong commitment to diversity. Won the Dave Jackson Trailblazer Award
• Claire is a graduate of the University of Louisiana at Lafayette and earned her law degree from Southern University Law Center in Baton Rouge. She also holds a master of laws degree in taxation from Southern Methodist University’s Dedman School of Law in Dallas.
Management
178
Brett Biggs: Executive vice president and Chief Financial officer for Walmart• Brett is responsible for accounting and control, corporate strategy
and development, business planning and analysis, internal auditing, treasury, tax, global shared services and several other key areas of the company.
• Before being appointed to his current role, he was executive vice president and chief financial officer for Walmart International, where he was responsible for all global finance activities.
• Prior to joining Walmart in 2000, Brett held various M&A and corporate finance positions with Leggett & Platt, Phillips Petroleum Co. and Price Waterhouse.
• Brett graduated Summa Cum Laude from Harding University with a bachelor’s degree in accounting and later received a MBA with Honors from Oklahoma State University. He serves in various advisory roles at Harding University.
Management
179
Andy Barron: Executive vice president, Softlines and General Merchandise, Walmart U.S.• He is responsible for driving merchandise strategies across every
channel and leading a strong team of merchants focused on Walmart’s home, apparel, electronics and entertainment, toys, seasonal and hardlines categories.
• Andy joined Walmart in 1993 and has served in many merchandising roles, including menswear and intimate apparel, automotive, toys, home entertainment and hardlines.
• He has received the General Merchandise Manager of the Year Award and was the recipient of the Students in Free Enterprise (SIFE) Good Fellow Award.
• Prior to his career at Walmart, he worked in various management roles at Joske’s department stores and County Seat stores. Andy has a bachelor’s degree from Texas Tech University.
Management
180
Walmart
Dan Bartlett: Executive vice president, Corporate Affairs for Walmart • He is responsible for government relations and public policy,
corporate communications, philanthropy, and the company’s social responsibility and sustainability initiatives.
• Before joining Walmart, Dan was president and CEO of the U.S. division of Hill+Knowlton Strategies, where he served as a strategic advisor to business leaders representing key sectors of the American and global economy.
• He served in several high-ranking positions at the White House, completing his service as counselor to President George W. Bush in July 2007.
• Dan is a graduate of the University of Texas at Austin and serves on the advisory board of UT Austin’s College of Communication.
Management
181
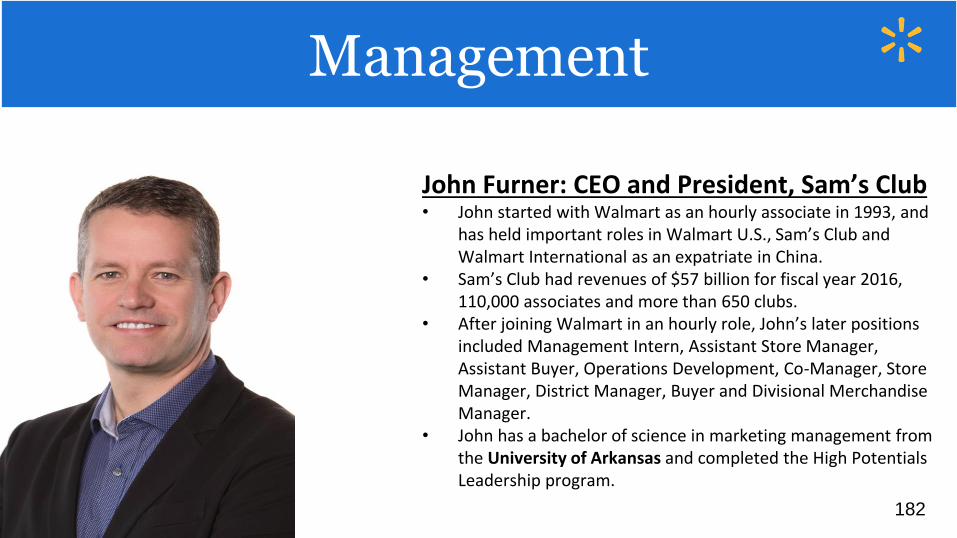
John Furner: CEO and President, Sam’s Club• John started with Walmart as an hourly associate in 1993, and
has held important roles in Walmart U.S., Sam’s Club and Walmart International as an expatriate in China.
• Sam’s Club had revenues of $57 billion for fiscal year 2016, 110,000 associates and more than 650 clubs.
• After joining Walmart in an hourly role, John’s later positions included Management Intern, Assistant Store Manager, Assistant Buyer, Operations Development, Co-Manager, Store Manager, District Manager, Buyer and Divisional Merchandise Manager.
• John has a bachelor of science in marketing management from the University of Arkansas and completed the High Potentials Leadership program.
Management
182
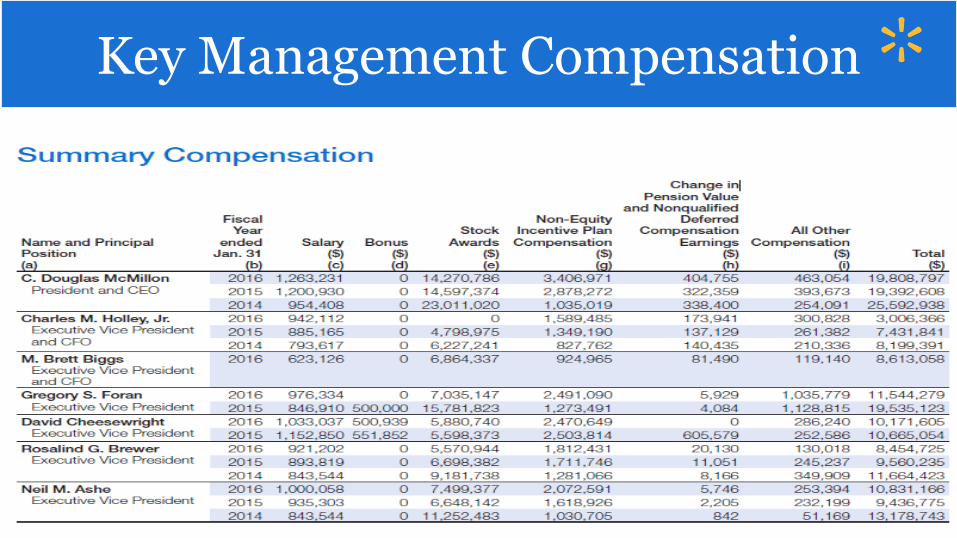
Key Management Compensation
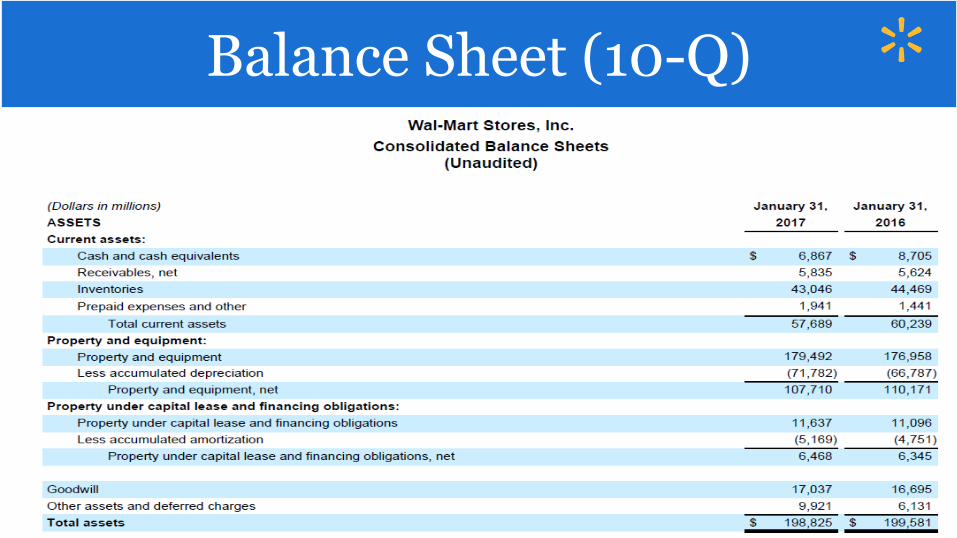
Consolidated Balance sheets 2017 10-Q(Assets)Balance Sheet (10-Q)
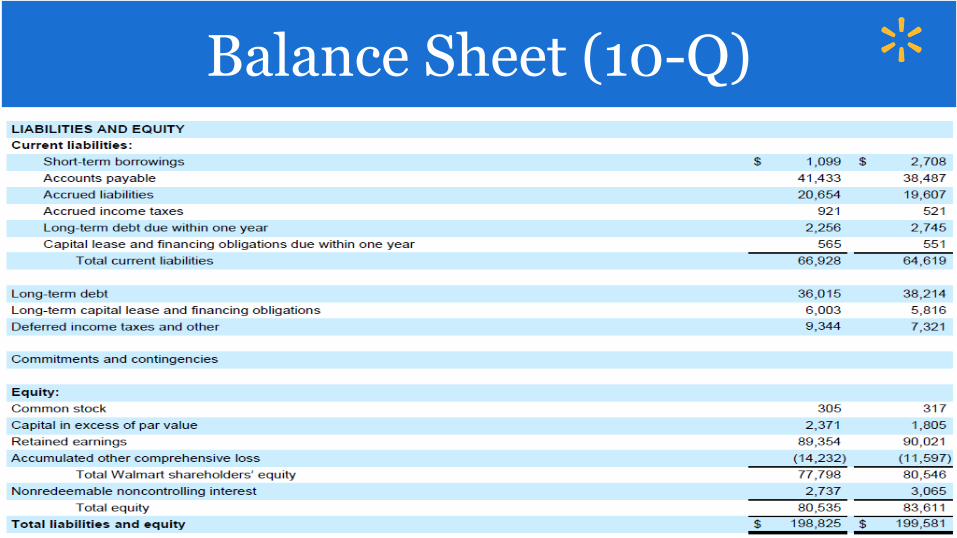
Consolidated Balance sheets 2017 10-Q(Liabilities+Equity)Balance Sheet (10-Q)
188
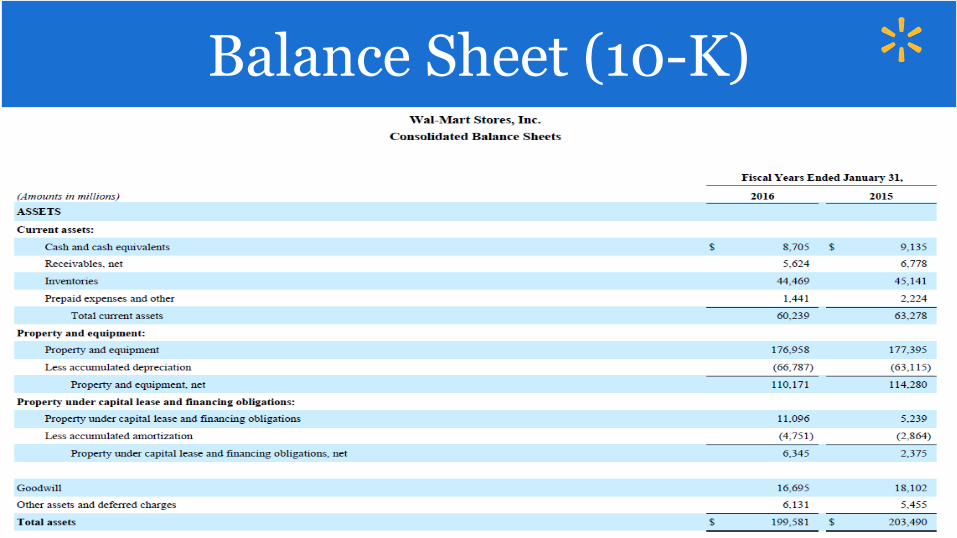
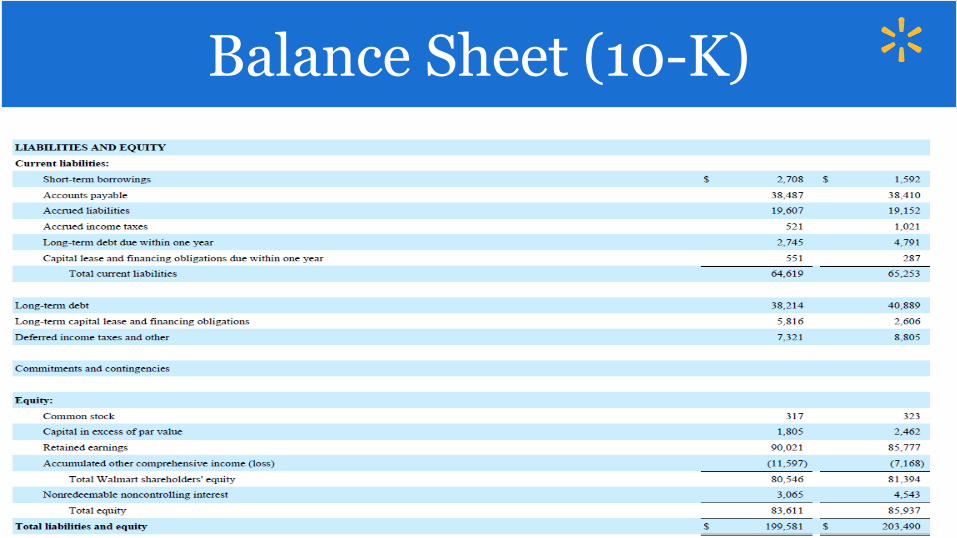
Balance Sheet (10-K)
189
Balance Sheet (10-K)
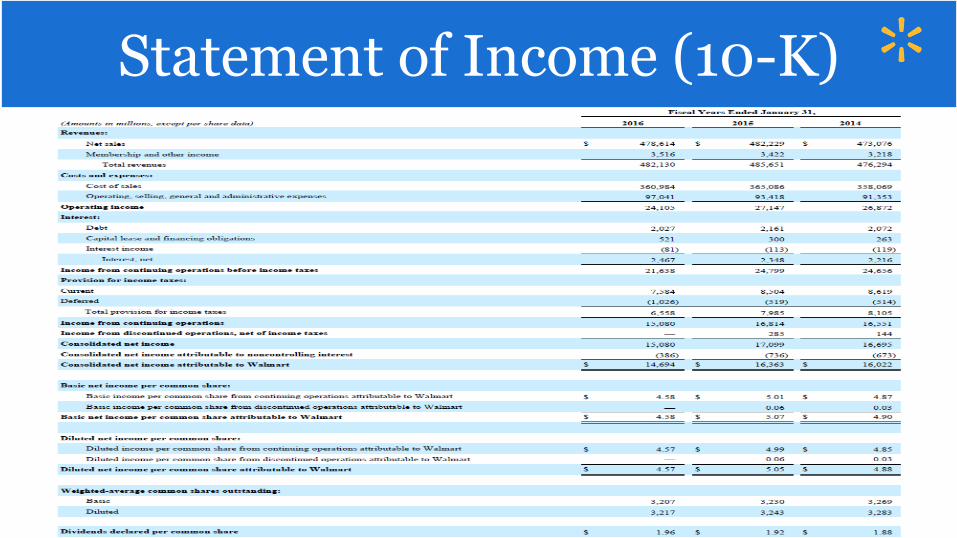
Statement of Income (10-K)
Consolidated Statements of Income 2017 Q4
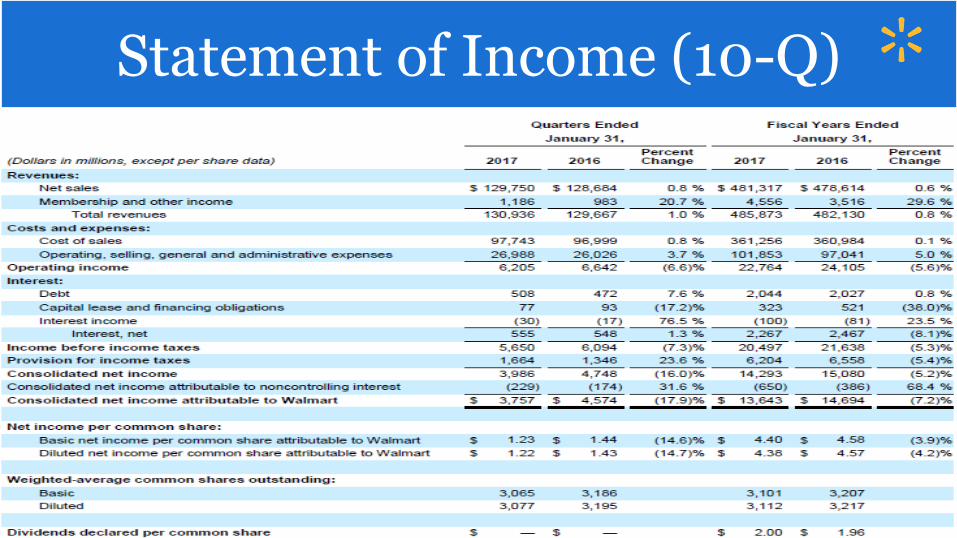
Statement of Income (10-Q)
Statement of Cashflow (10-K)
Statement of Cashflow (10-K)
Consolidated statements of Cash flows 2017 10-QStatement of Cashflow (10-Q)
Consolidated statements of Cash flows 2017 10-QStatement of Cashflow (10-Q)

Recommendation!Recommendation
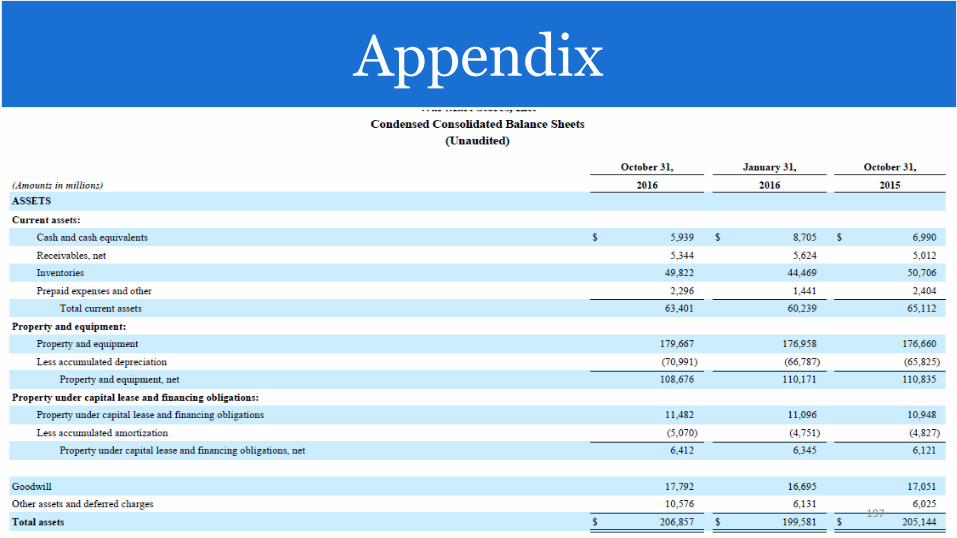
Consolidated Balance sheets 10-Q (Assets)
197
Appendix
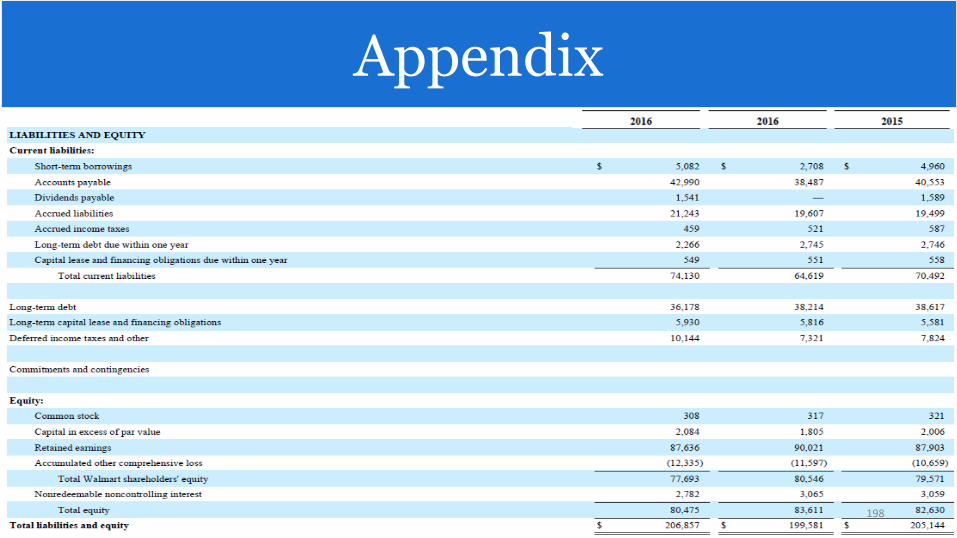
Consolidated Balance sheets 10-Q (Liabilities)
198
Appendix
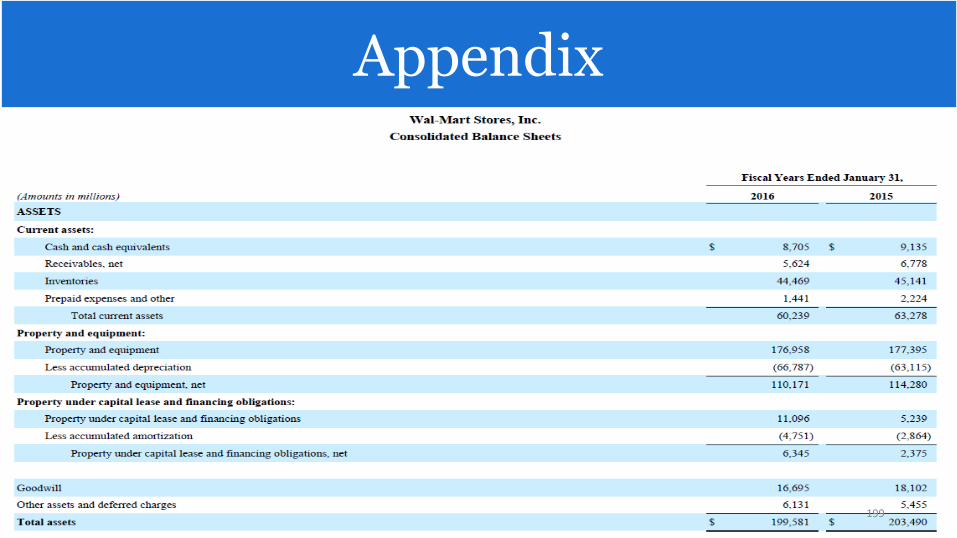
Consolidated Balance sheets 10-K (Assets)
199
Appendix
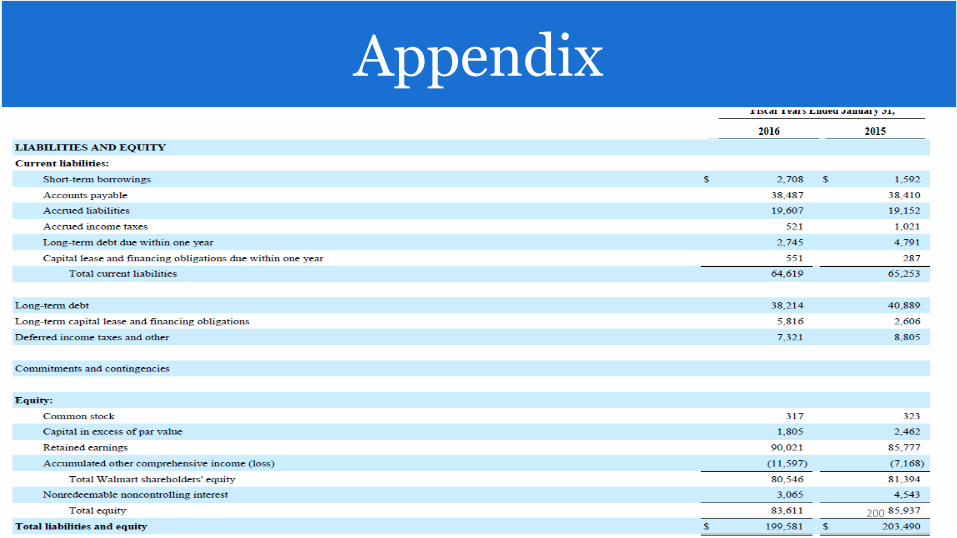
Consolidated Balance sheets 10-K (Liabilities)
200
Appendix
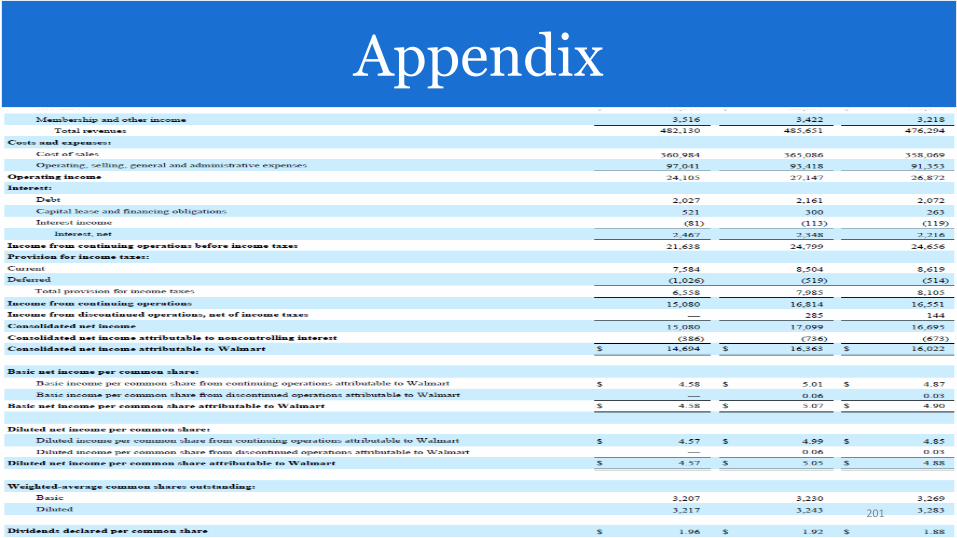
Consolidated Statements of Income 10-K
201
Appendix
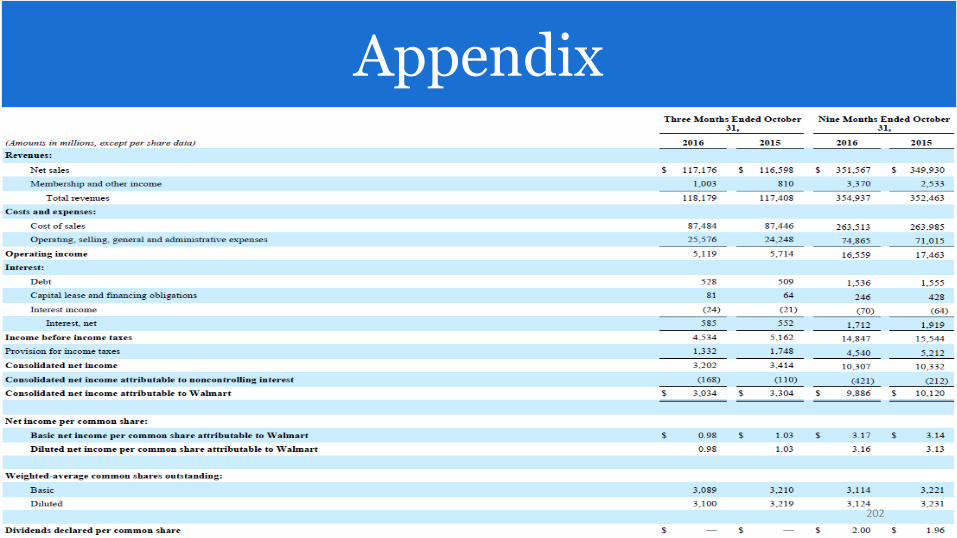
Consolidated Statements of Income 10-Q
202
Appendix
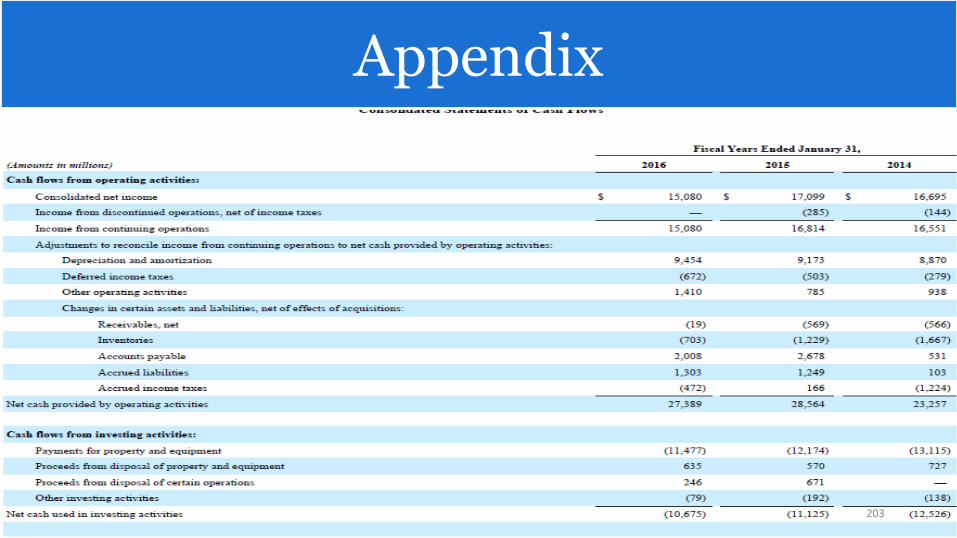
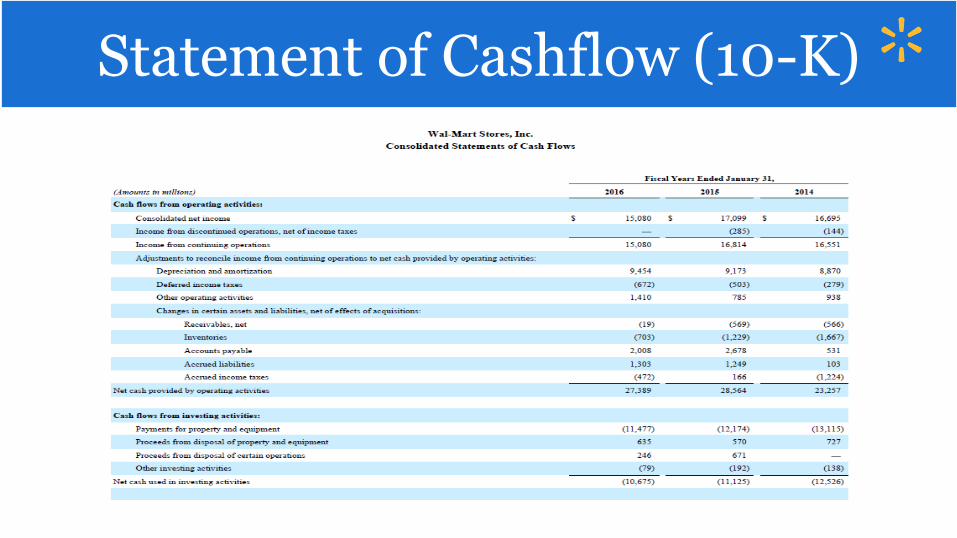
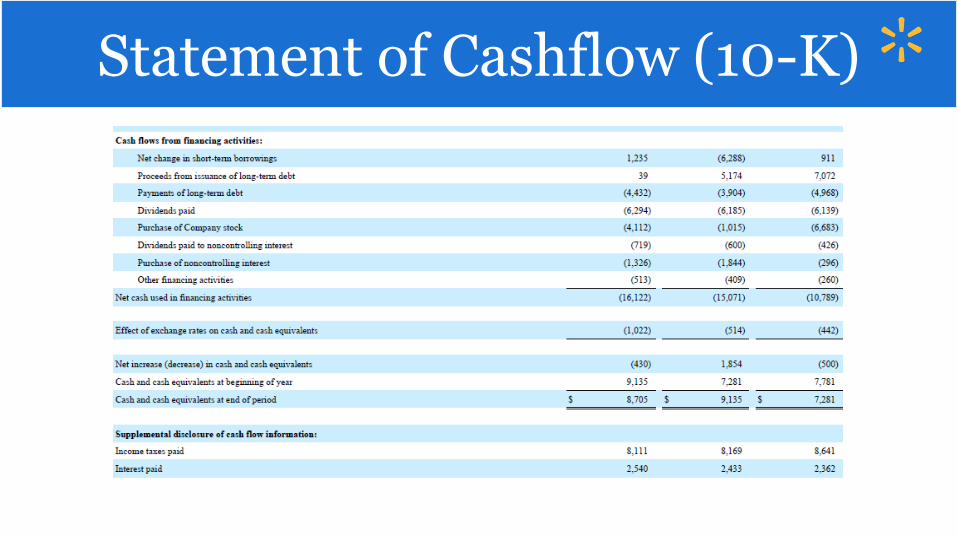
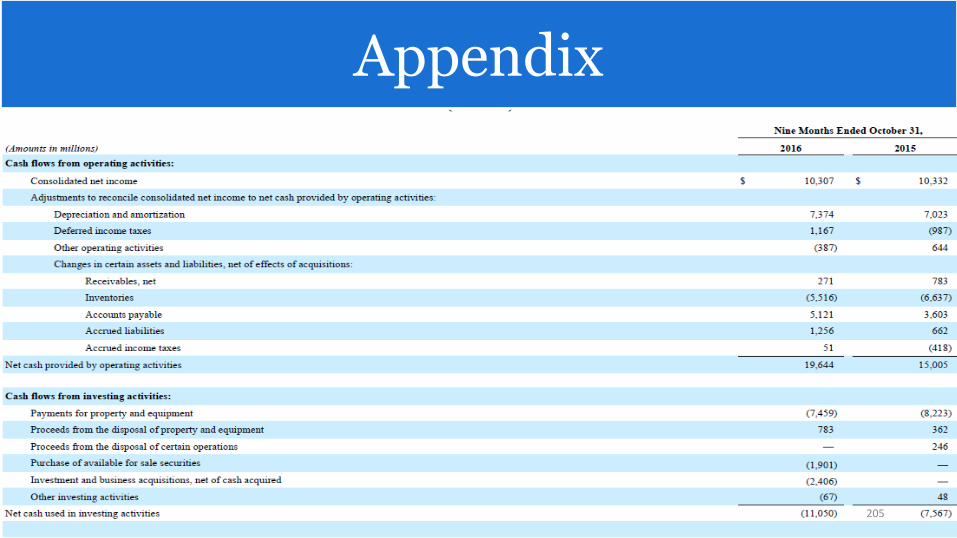
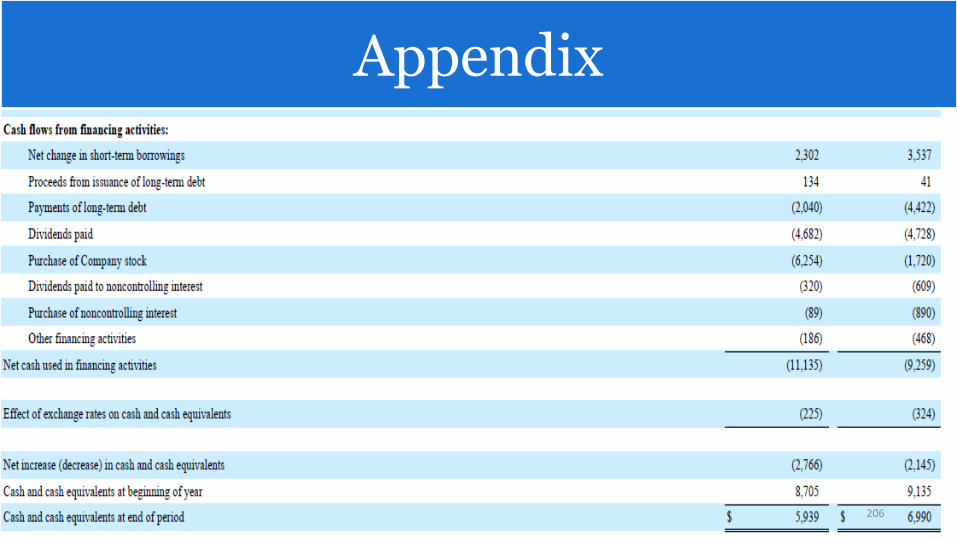
Consolidated statements of Cash flows 10-K
203
Appendix
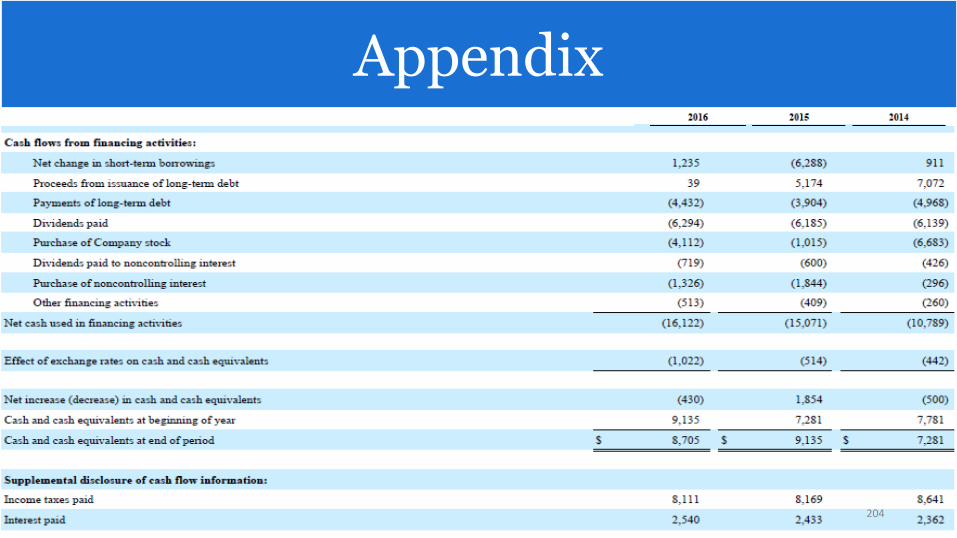
Consolidated statements of Cash flows 10-K
204
Appendix
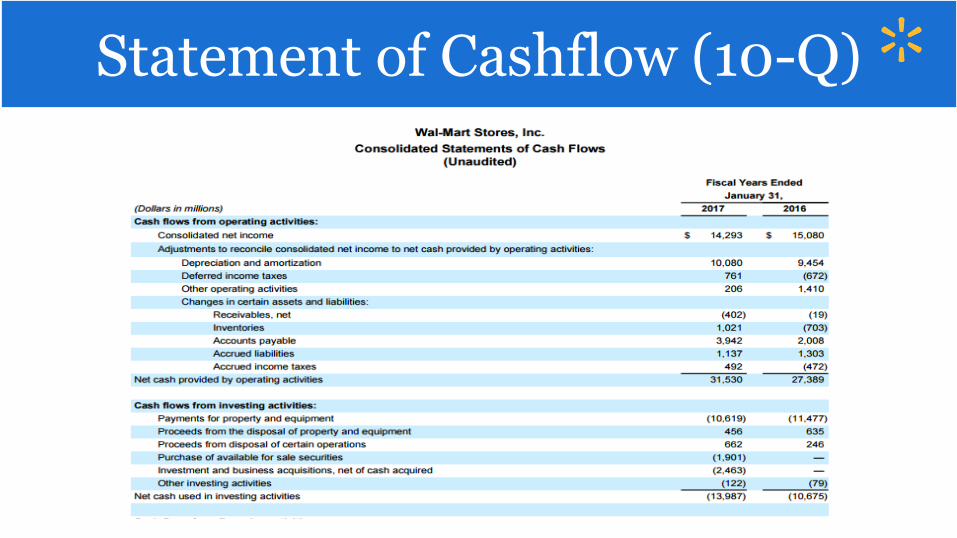
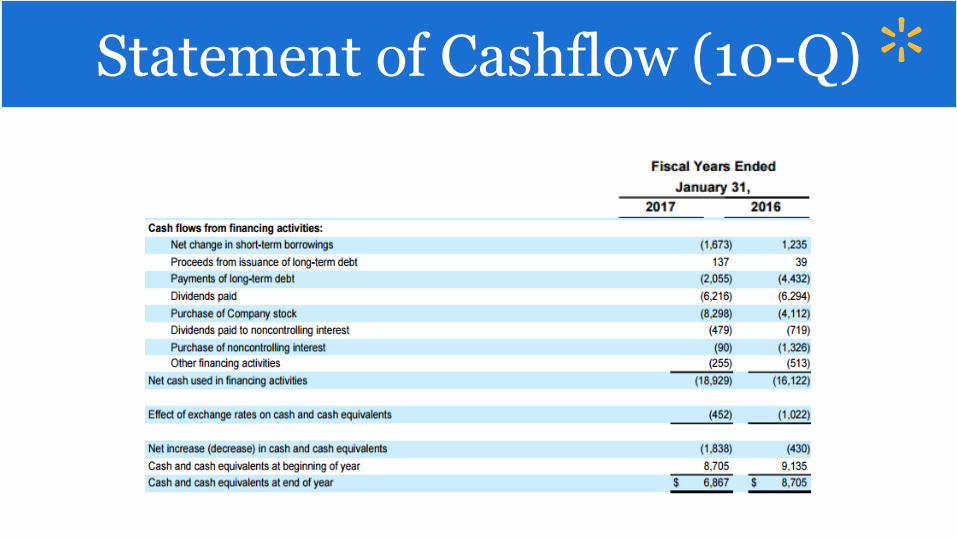
Consolidated statements of Cash flows 10-Q
205
Appendix
Consolidated statements of Cash flows 10-Q
206
Appendix
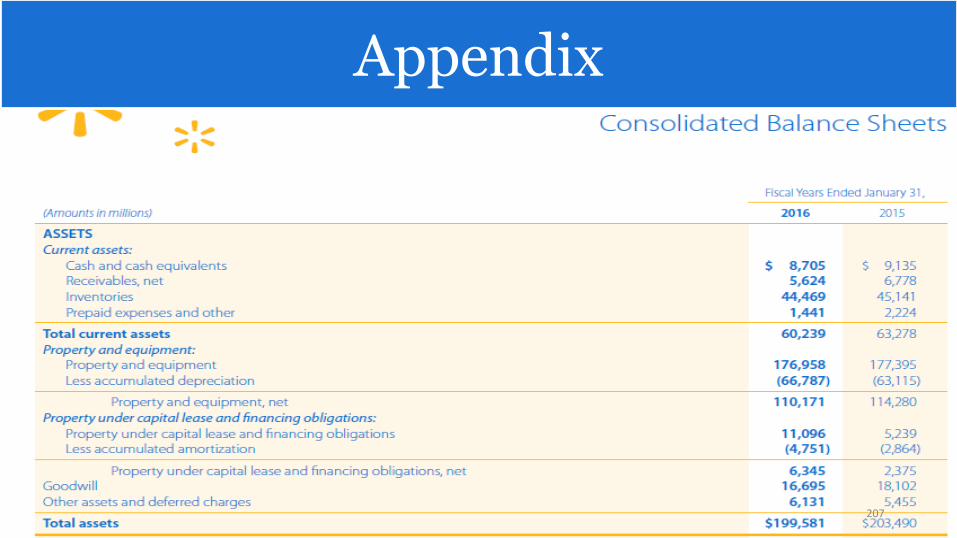
Consolidated Balance sheets 2016-2015 10k (Assets)
207
Appendix

Consolidated Balance sheets 2016-2015 10k (Liabilities+Equity)
208
Appendix
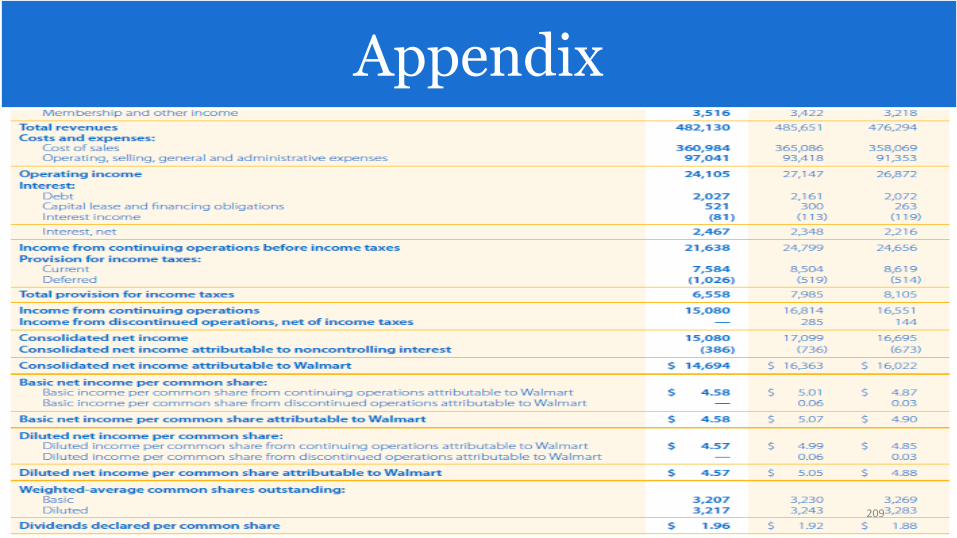
Consolidated Statements of Income 2016-2014 10K
209
Appendix
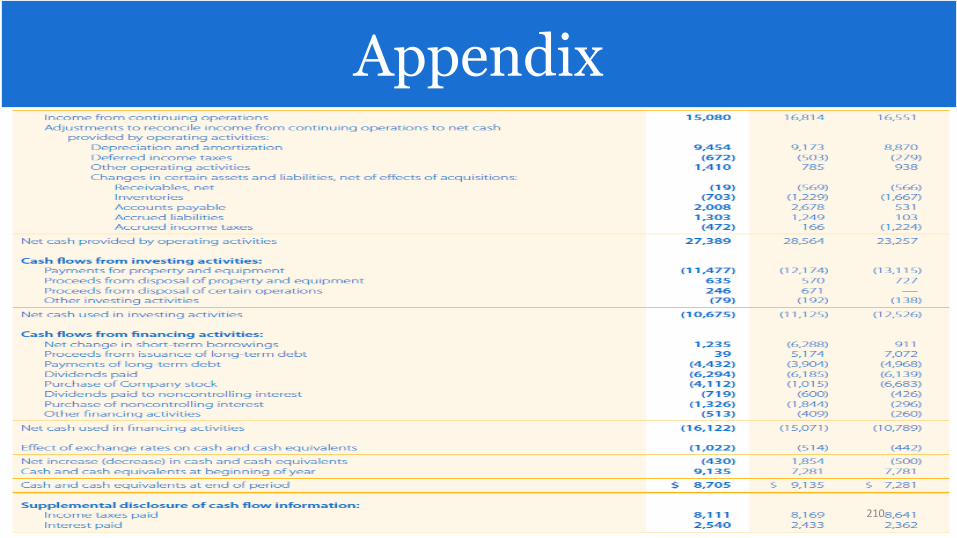
Consolidated statements of Cash flows 2016-2014 10k
210
Appendix
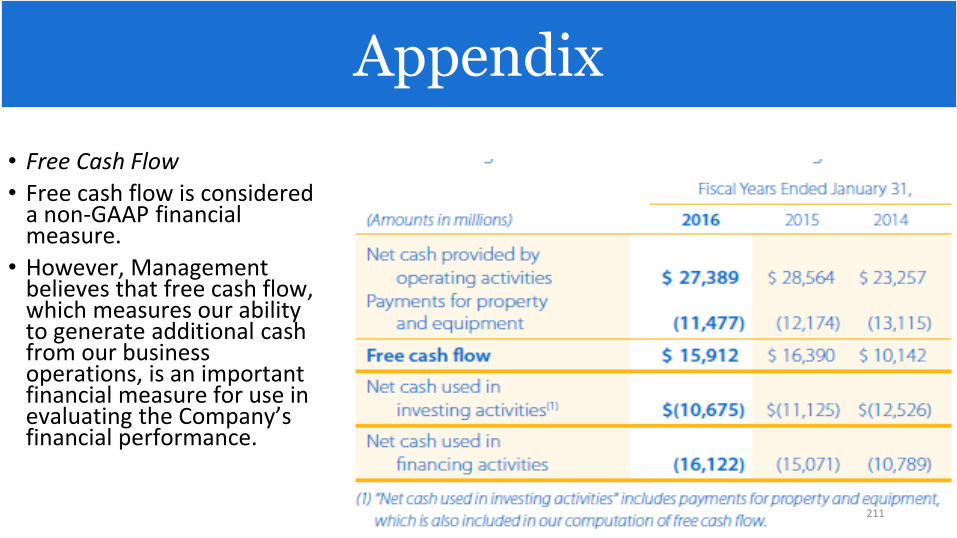
• Free Cash Flow
• Free cash flow is considered a non-GAAP financial measure.
• However, Management believes that free cash flow, which measures our ability to generate additional cash from our business operations, is an important financial measure for use in evaluating the Company’s financial performance.
211
Appendix
212
Appendix
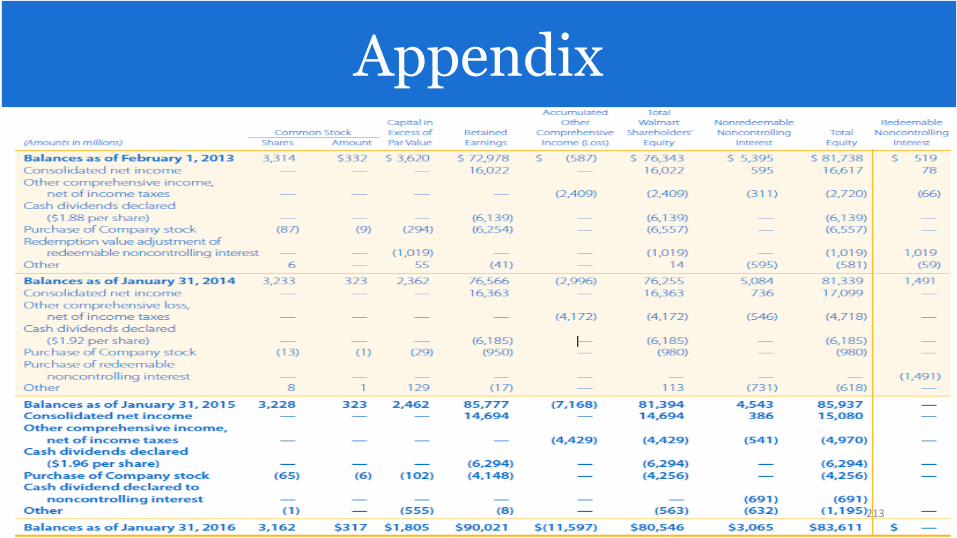
Consolidated statement of Shareholders Equity and redeemable
non-controlling interest 2016(10k)
213
Appendix
![Harmonics Study of Common Low Wattage LED …anale-ing.uem.ro/2017/8.pdfMarket Size, Share, Development, Growth and Demand Forecast to 2020. [4] BIS Research, Global Smart Light Fixture](https://img.pdfslide.net/doc/110x75/5f0a46847e708231d42adcec/harmonics-study-of-common-low-wattage-led-anale-inguemro20178pdf-market-size.jpg)