Embed Size (px)
Citation preview
us2010discover america in a new centuryThis report has been peer-
reviewed by the Advisory Board of the US2010 Project. Views expressed here are those of the authors.
US2010 ProjectJohn R. Logan, DirectorBrian Stults, Associate Director
Advisory BoardMargo Anderson Suzanne Bianchi Barry Bluestone Sheldon Danziger Claude Fischer Daniel Lichter Kenneth Prewitt
SponsorsRussell Sage FoundationAmerican Communities Project of Brown University
Divergent Paths of American Families*
Zhenchao Qian Department of Sociology, The Ohio State University
September 11, 2013
* The author thanks Yue Qian for her research assistance.
1
For a very long time, a typical American family consisted of a working husband, a stay-at-home
wife, and children. This traditional family was portrayed in popular TV dramas and sitcoms
during the 1950s and 1960s, such as Father Knows Best and Leave it to Beaver and represented
what an ideal family looked like. Over time, especially since the 1970s, American families have
been undergoing fundamental changes. The so-called traditional family is now much less
common; the transformation of marriage as a social institution means that young adults today
have many more options about partnering and parenting (Cherlin 2004). Some young Americans
delay marriage and others forgo marriage altogether (Lichter and Qian 2004; McLanahan and
Casper 1995). Unmarried cohabitation, which is typically a short-lived living arrangement, has
emerged to be the initial coresidential choice among most young men and women. Marriage is
no longer “till death do us apart” for all because divorce and separation have become
commonplace. Over the life course, individuals experience more cohabitations, remarriages, and
relationship disruptions (Cherlin 2004).
As a result, marital and cohabiting unions have become transitory in the United States.
Men and women cohabit, marry, separate or divorce, once or even multiple times, a phenomenon
described as “American marriage-go-round” (Cherlin 2009). Family structure has become more
diverse — smaller shares of traditional families and more dual earner families, declining
percentages of married families and more cohabiting or single parent families, multigenerational
families, and same-sex couples (Casper and Bianchi 2002; Ellwood and Jencks 2004; Lichter and
Qian 2004). Consequently, fewer children today live in traditional families with both biological
parents, and more live with single-parents, with step-parents, or with parents and their cohabiting
partners.
2
After documenting rapid changes in American families in the earlier decades, Casper and
Bianchi (2002) noted the “quieting” of family change: a halt in the rise of the single-mother
family and in the decline of the two-parent family in the latter half of the 1990s. If the halt
continues in the 2000s, Casper and Bianchi (2002) posited that the transformation of family
formation and dissolution may be complete and American family structures would then stabilize.
Yet, the halt may have been temporary because of the good economic conditions of the latter half
of the 1990s. Rapid family change has apparently resumed during the first decade of the new
century, especially during the late 2000s “Great Recession,” when unemployment was high,
family incomes stagnated, and housing markets collapsed. In this study, I examine changes in
marriage, cohabitation, divorce, remarriage, and children’s living arrangements to explore
whether the “quieting” of family change continued in the 2000s.
An overall portrait of changes in American families does not provide diverse family
pictures for large segments of average Americans. The reason is simple. Americans differ in
fundamental ways — by race and ethnicity, educational attainment, and nativity. Whites are
more likely to marry, have children while married, and stay married than African Americans
(McLanahan and Casper 1995). Yet, Americans can no longer be viewed in simple black and
white, or even in single race terms (Lee and Bean 2010). Increasing shares of minority
populations, especially Hispanics and Asian Americans, have brought more varieties to
American families. Hispanics, despite similar economic status compared with African
Americans, have higher marriage rates than African Americans (Saenz 2004). Asians, on the
other hand, marry at later ages and tend to have stable families (Xie and Goyette 2004). Clearly,
America’s growing racial and ethnic diversity has added new variation in America’s families
(Oropesa and Gorman 2000; Zhou and Bankston 1998).
3
Meanwhile, continuous improvement in schooling, especially the surpassing of women
over men in education, has a profound impact on American families (Buchmann and DiPrete
2006). It influences how men and women choose spouses by educational attainment. During the
1950s when traditional families were common, marriages typically consisted of couples in which
the husband had more schooling than the wife. In recent decades, educational homogamy
(husbands and wives with same levels of education) increased dramatically, especially among
those at both ends of the education distribution (Schwartz and Mare 2005). Educational
attainment is an important sorting mechanism for marriage (and for cohabitation as well) — men
and women with more schooling are far more likely to marry than those with fewer years of
schooling (Qian 1998). In addition, highly educated men and women are more likely to stay
married than their less educated counterparts (Amato 2010). The impact of educational
attainment on marriage, divorce, and assortative mating undeniably leads to increasing diversity
among American families.
Another dimension of diversity is nativity status. A continuous influx of immigration to
the United States has increased the number and share of racial/ethnic minorities. In 2010,
immigrants accounted for nearly 13 percent of the population and over 85 percent of the
immigrants were racial/ethnic minorities (Grieco et al. 2012). When immigrants and minorities
are small in size, pressure to assimilate into mainstream America is strong. When they grow in
size, cultural differences become more salient, due to increases in ethnic restaurants, churches
and temples, and communities. To be sure, immigrants bring to America more “traditional”
values — high values attached to marriage and greater stigma associated with divorce. It is not a
surprise that immigrants consist of proportionately more married families than the U.S. born
(Clark, Glick, and Bures 2009). The impact of immigration can go beyond immigrants
4
themselves because the rise in inter-nativity interactions may reinforce immigrant and minority
cultures (Lichter, Carmalt, and Qian 2011; Stevens, Ishizawa, and Escandell 2012). To say the
least, immigration contributed to the recent “quieting” of family change in America.
Children are on the frontline of recent changes in American families. While men and
women exercise individual freedom, going through transitory marital and cohabiting unions,
children are often caught in the crossfire. Their wellbeing is at risk. Children living with married
parents perform better at schools and achieve greater socioeconomic status later in life than
children living in single parent, cohabiting, or step families (Cherlin 2004; Manning and Brown
2006). In large part, married couples have high levels of education and are financially stable.
Persistent income and socioeconomic status inequality has created diverse family structures
(McLanahan and Percheski 2008). Children living in female-headed single families or cohabiting
families are more likely to live in poverty than those living in married couple families (Lichter
and Qian 2004; Manning and Smock 1997). The Great Recession presumably has affected family
living arrangements and heightened the prospect of poverty among America’s children.
My intention here is to provide a descriptive portrait of changes in American families. I
address whether the “quieting” of family change continued in the 2000s. I examine this question
by presenting evidence of change in marriage, cohabitation, divorce, remarriage, and children’s
living arrangements during the 2000s. The data present a mixed picture of whether the “quieting”
of the 1990s has continued into the 2000s. I highlight how race/ethnicity, educational attainment,
and nativity contribute to changes and diversity in family structure.
I use Integrated Public Use Microdata Series (IPUMS) data from the 2000 Census and the
pooled sample of 2008-2010 American Community Survey (ACS). Three years of ACS data are
pooled in order to obtain sufficiently large samples for special populations (including, for
5
example, racial and ethnic minorities, immigrants, single parent families). When examining
remarriage, I use the ACS data as well as the IPUMS data from the 1980 census, which is the last
census that includes information on marriage order. I include three main variables in my
analyses, nativity, race/ethnicity, and educational attainment. Nativity is classified as U.S.-born
and immigrants; Race/ethnicity is classified as non-Hispanic whites, non-Hispanic African
Americans, non-Hispanic Asian Americans, non-Hispanic American Indians, and Hispanics
(multiracial individuals are not included in the analysis); and educational attainment is classified
as less than high school, high school, some college, and college and more.
Marriage
Married individuals are happier, healthier, and have better socioeconomic status than their
unmarried counterparts (Waite and Gallagher 2000). Because of these benefits, marriage
promotion was included in the 1996 welfare reform bill — the Personal Responsibility and Work
Opportunity Reconciliation Act — which sought to end dependence of low-income single
mothers on government benefits (Lichter, Graefe, and Brown 2003). Of course, marriage
promotion does not necessarily lead to marriage. More importantly, it is unclear marriage itself
would actually improve wellbeing. Nevertheless, marriage, as a social institution, brings a sense
of permanence. Economies of scale and family and friendship networks are just a few of the
marriage benefits that protect against unexpected events and play a positive role in health
outcomes and socioeconomic wellbeing (Waite 1995).
Marriage has many benefits and an overwhelming majority of Americans expect to marry
(Thornton and Young-DeMarco 2001). Yet marriage rates have declined over recent decades
(Casper and Bianchi 2002; Lichter and Qian 2004; McLanahan and Casper 1995). The reasons
for the decline are multiple, including the weakened connection between marriage and
6
childbearing, the growing popularity of nonmarital cohabitation, the persistent high divorce rates,
and the declining remarriage rates (Amato, Booth, Johnson, and Rogers 2007).
Of course, a decline in marriage rates does not necessarily mean that young Americans
today are not getting married. Continuous improvement in educational attainment indicates that
young Americans spend more years in college and more time pursuing a professional career,
which contributes to delays in marriage. Even among those with no college education, marriage
may be delayed at least in part due to rise in cohabitation; for the majority of young adults today,
first coresidential unions come in the form of cohabitation rather than marriage. Meanwhile,
mate selection patterns have changed over time in response to improvement in educational
attainment. The traditional social norm that the husband marries the wife with less education
than his no longer is the norm. Today, men value women’s educational attainment and labor
market positions as equally as women value men’s (Sweeney and Cancian 2004). This suggests
that highly educated men and women marry each other and they do so after they complete their
educations and launch their careers.
Educational attainment varies significantly among racial/ethnic groups. Part of the
racial/ethnic differences in marriage is attributable to compositional differences in educational
attainment. For example, Asian Americans have the highest percent in college education and also
have the latest age at marriage (U.S. Census Bureau 2010). Of course, other factors may also
play a role in accounting for racial/ethnic differences in marriage. The availabilities of male
partners, especially those with potential economic resources, are much lower for African
American women than for white women (Ellwood and Jencks 2004; Lichter and Qian 2004). The
shortage of marriageable men is especially serious among college-educated African American
women: college-educated African American women outnumber college-educated African
7
American men (Buchmann and DiPrete 2006); and highly educated African American men are
much more likely to form interracial marriage than their female counterparts (Qian and Lichter
2007). Therefore, more African American women forgo marriage and remain single than white
women. On the other hand, Hispanics tend to place strong values to families and exhibit similar
levels of marriage patterns as whites despite Hispanics’ lower levels of educational attainment
(Saenz 2004).
I examine changing marital status using data from the 2000 census and the 2008-2010
ACS. Marital status is classified as never married, currently married, divorced, separated, and
widowed. Ever married includes all but never married. A percentage distribution of men or
women ever married by age is a good indicator of marital prevalence and, at later ages, offers an
estimate of permanent singlehood. Changes in ever marriage in the 2000s provide answers to
whether men and women continue delaying marriage.
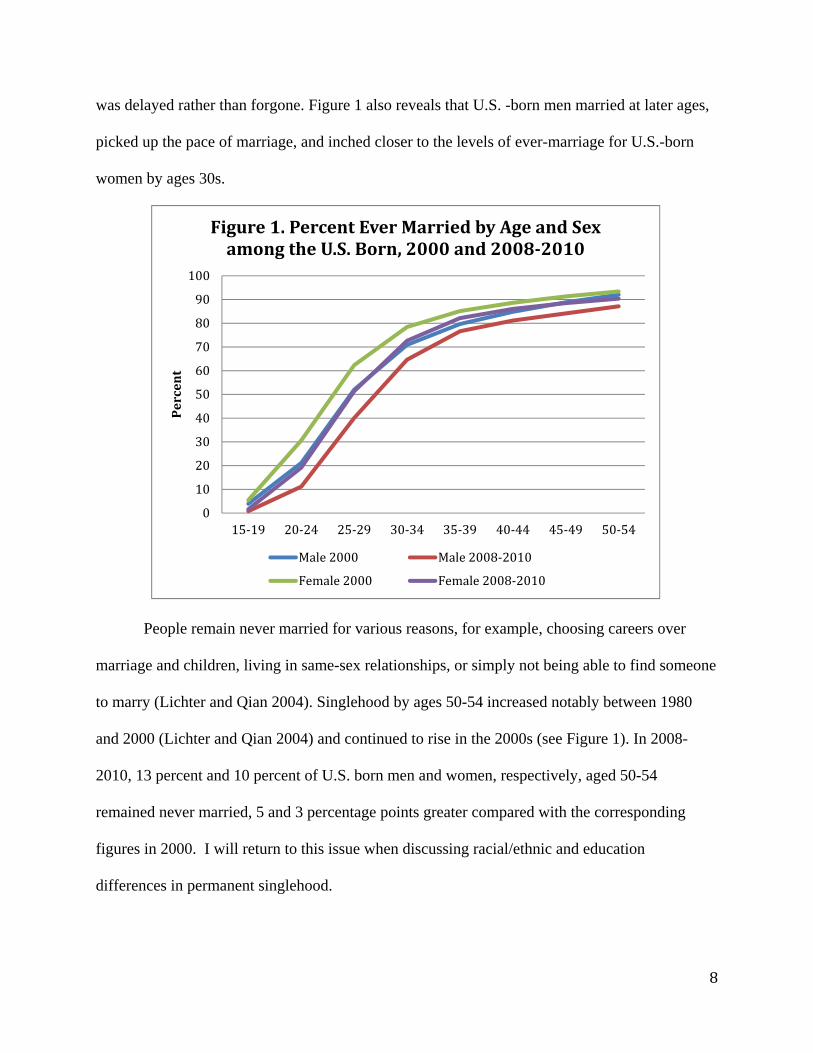
Figure 1 presents percent ever married by sex and nativity in 2000 and 2008-2010. The percent
ever married declined from 21 percent to 11 percent and from 31 percent to 19 percent,
respectively, among U.S.-born men and women aged 20-24. The declines were equally large
among the 25-29 year olds; only two-fifths of U.S.-born men and about half of U.S.-born women
were ever married. The large declines indicate continuing delays in marriage. Most young people
in their 20s attend colleges, explore romantic relationships, pursue jobs and careers, and strive
for independence. Yet, independence may be hard to come by during the Great Recession. For
example, in 2008-2010, 43 percent of 20-24 year olds and 19 percent of 25-29 year olds lived
with their parents, a phenomenon in large part attributable to financial difficulties and/or
relationship instabilities (Qian 2012). The declines in percent ever married over the period were
relatively small among U.S. born men and women over age 30, indicating marriage for many
8
was delayed rather than forgone. Figure 1 also reveals that U.S. -born men married at later ages,
picked up the pace of marriage, and inched closer to the levels of ever-marriage for U.S.-born
women by ages 30s.
People remain never married for various reasons, for example, choosing careers over
marriage and children, living in same-sex relationships, or simply not being able to find someone
to marry (Lichter and Qian 2004). Singlehood by ages 50-54 increased notably between 1980
and 2000 (Lichter and Qian 2004) and continued to rise in the 2000s (see Figure 1). In 2008-
2010, 13 percent and 10 percent of U.S. born men and women, respectively, aged 50-54
remained never married, 5 and 3 percentage points greater compared with the corresponding
figures in 2000. I will return to this issue when discussing racial/ethnic and education
differences in permanent singlehood.
0
10
20
30
40
50
60
70
80
90
100
15‐19 20‐24 25‐29 30‐34 35‐39 40‐44 45‐49 50‐54
Percent
Figure1.PercentEverMarriedbyAgeandSexamongtheU.S.Born,2000and2008‐2010
Male2000 Male2008‐2010
Female2000 Female2008‐2010
9
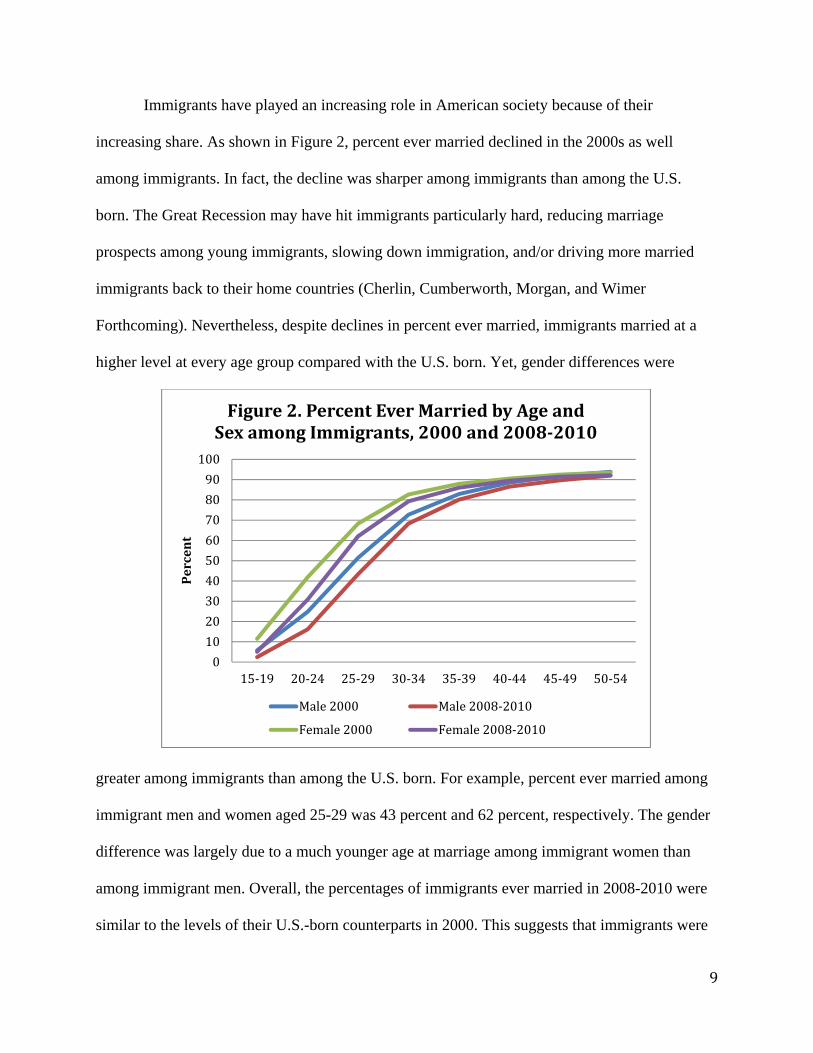
Immigrants have played an increasing role in American society because of their
increasing share. As shown in Figure 2, percent ever married declined in the 2000s as well
among immigrants. In fact, the decline was sharper among immigrants than among the U.S.
born. The Great Recession may have hit immigrants particularly hard, reducing marriage
prospects among young immigrants, slowing down immigration, and/or driving more married
immigrants back to their home countries (Cherlin, Cumberworth, Morgan, and Wimer
Forthcoming). Nevertheless, despite declines in percent ever married, immigrants married at a
higher level at every age group compared with the U.S. born. Yet, gender differences were
greater among immigrants than among the U.S. born. For example, percent ever married among
immigrant men and women aged 25-29 was 43 percent and 62 percent, respectively. The gender
difference was largely due to a much younger age at marriage among immigrant women than
among immigrant men. Overall, the percentages of immigrants ever married in 2008-2010 were
similar to the levels of their U.S.-born counterparts in 2000. This suggests that immigrants were
0
10
20
30
40
50
60
70
80
90
100
15‐19 20‐24 25‐29 30‐34 35‐39 40‐44 45‐49 50‐54
Percent
Figure2.PercentEverMarriedbyAgeandSexamongImmigrants,2000and2008‐2010
Male2000 Male2008‐2010
Female2000 Female2008‐2010
10
about ten years away approaching the U.S. born in percent ever married and helped lesson the
further delay in marriage at the national level.
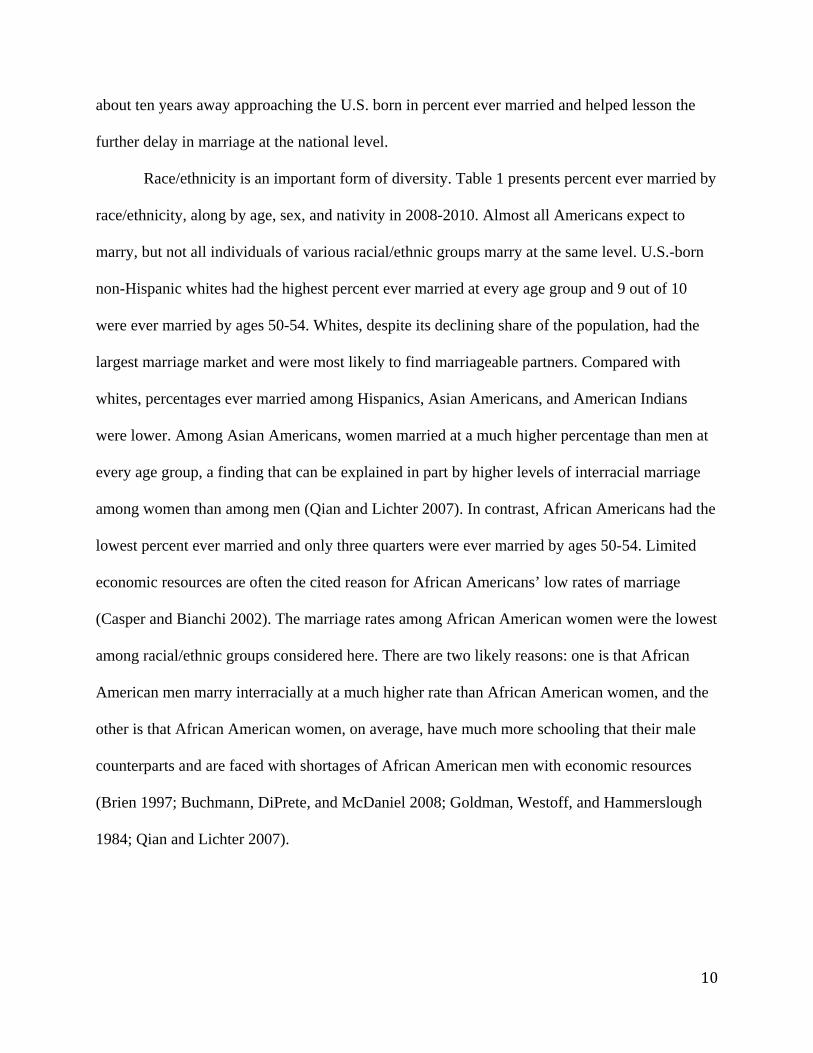
Race/ethnicity is an important form of diversity. Table 1 presents percent ever married by
race/ethnicity, along by age, sex, and nativity in 2008-2010. Almost all Americans expect to
marry, but not all individuals of various racial/ethnic groups marry at the same level. U.S.-born
non-Hispanic whites had the highest percent ever married at every age group and 9 out of 10
were ever married by ages 50-54. Whites, despite its declining share of the population, had the
largest marriage market and were most likely to find marriageable partners. Compared with
whites, percentages ever married among Hispanics, Asian Americans, and American Indians
were lower. Among Asian Americans, women married at a much higher percentage than men at
every age group, a finding that can be explained in part by higher levels of interracial marriage
among women than among men (Qian and Lichter 2007). In contrast, African Americans had the
lowest percent ever married and only three quarters were ever married by ages 50-54. Limited
economic resources are often the cited reason for African Americans’ low rates of marriage
(Casper and Bianchi 2002). The marriage rates among African American women were the lowest
among racial/ethnic groups considered here. There are two likely reasons: one is that African
American men marry interracially at a much higher rate than African American women, and the
other is that African American women, on average, have much more schooling that their male
counterparts and are faced with shortages of African American men with economic resources
(Brien 1997; Buchmann, DiPrete, and McDaniel 2008; Goldman, Westoff, and Hammerslough
1984; Qian and Lichter 2007).
11
U.S. Born U.S. Born U.S. Born U.S. Born U.S. Born ImmigrantMen
15-19 1 1 1 2 1 3 1 1 1 -20-24 12 13 6 9 13 21 4 7 12 -25-29 44 46 23 35 37 47 21 35 34 -30-34 69 72 42 62 59 66 52 73 50 -35-39 80 84 57 76 72 77 66 85 64 -40-44 84 89 64 82 76 85 72 90 72 -45-49 86 91 68 87 80 88 76 92 76 -50-54 89 93 74 89 85 90 79 95 81 -Total 61 73 40 63 40 64 30 70 47 62
Women15-19 2 3 1 2 3 8 1 2 2 -20-24 21 27 8 17 21 39 8 21 20 -25-29 57 66 25 47 50 63 33 62 45 -30-34 78 84 43 67 69 77 63 84 61 -35-39 87 91 56 77 78 84 76 89 72 -40-44 90 93 64 80 83 88 82 92 78 -45-49 91 95 70 83 86 90 84 94 82 -50-54 93 95 75 85 88 91 87 94 85 -Total 68 80 43 65 49 74 36 78 55 77
Table 1. Percent Ever Married by Age, Sex, Race, and Nativity, 2008-2010
Immigrant Immigrant Immigrant ImmigrantWhite Black Hispanic Asian American Indian
Immigrants come from countries in which marriage is more prevalent than in the United
States. Some married before they immigrated to the United States and some others undoubtedly
adopted culture traditional from home by entering marriage in early adulthood. The results in
Table 1 reveal higher levels of marriage among immigrants of various racial/ethnic groups. The
differences were particularly large between U.S.-born and immigrant Asians — the overall
percentages of ever marriage for immigrant men and women were more than two times those for
their U.S.-born counterparts. Another notable finding is that racial/ethnic differences were much
smaller among immigrants, indicating stronger cultural influences from home countries and
weaker associations with marriage market constraints in the United States.
12
U.S. Born Immigrant U.S. Born Immigrant U.S. Born Immigrant U.S. Born ImmigrantMen
15-19 1 2 2 3 1 3 3 1720-24 13 24 13 18 8 9 11 925-29 33 47 40 47 42 41 40 3730-34 50 65 61 67 67 69 70 7335-39 62 75 73 79 79 80 82 8540-44 67 84 79 85 83 87 86 9045-49 72 87 83 89 86 90 88 9250-54 77 90 87 91 88 92 89 94Total 22 60 58 65 60 64 74 78
Women15-19 1 4 3 7 2 4 16 1320-24 26 48 24 36 15 20 17 2325-29 47 65 53 65 55 61 48 5830-34 61 76 71 80 75 79 74 8135-39 70 82 80 86 84 87 84 8840-44 75 86 86 90 87 91 87 9145-49 80 89 89 92 90 92 88 9250-54 84 90 92 93 91 93 89 93Total 23 69 66 76 66 73 74 82
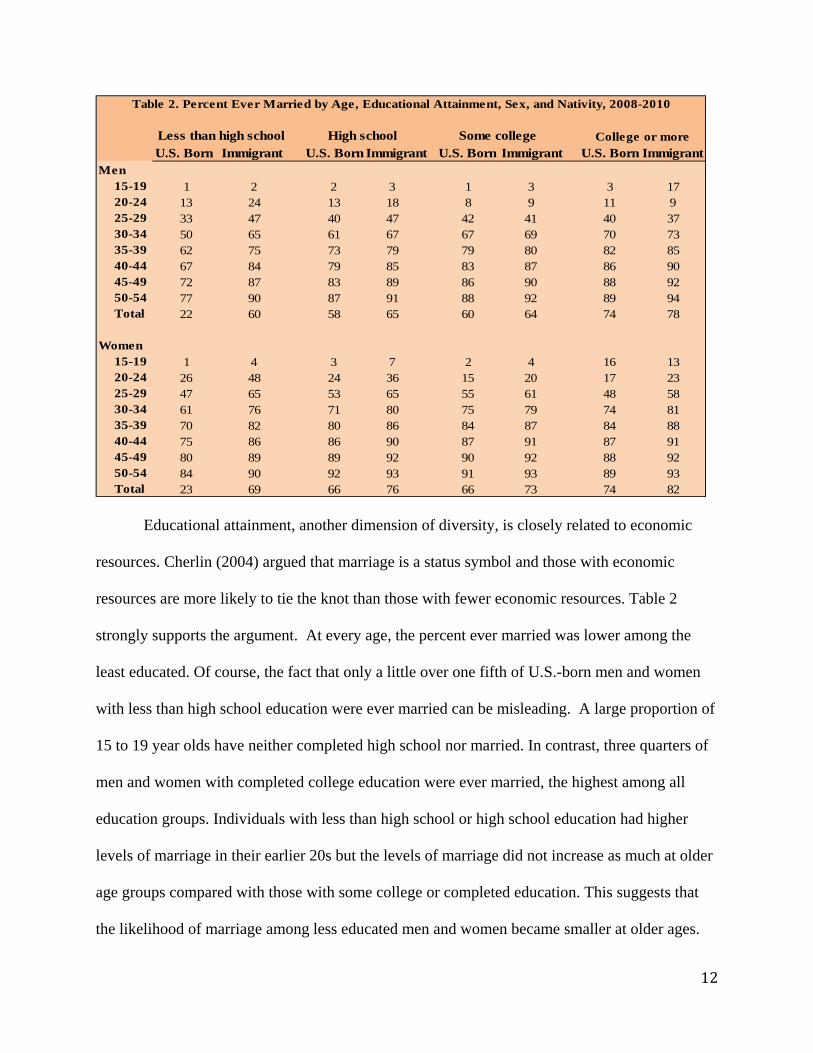
Less than high school High school Some college College or more
Table 2. Percent Ever Married by Age, Educational Attainment, Sex, and Nativity, 2008-2010
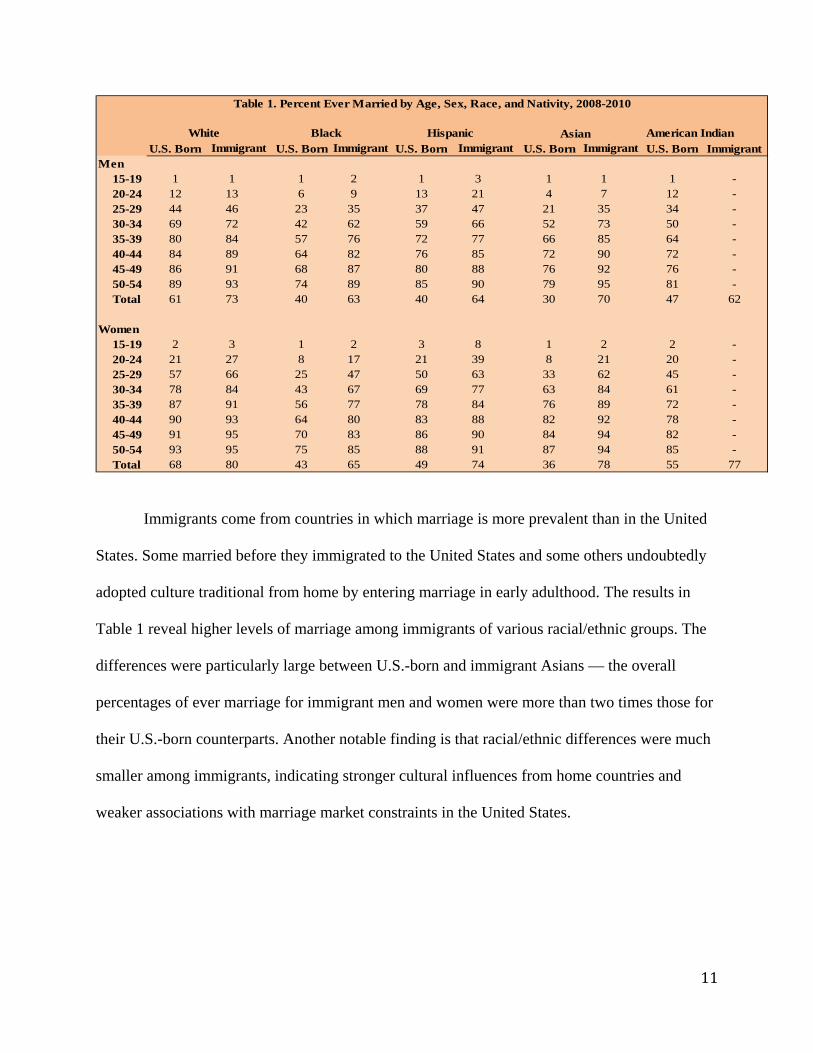
Educational attainment, another dimension of diversity, is closely related to economic
resources. Cherlin (2004) argued that marriage is a status symbol and those with economic
resources are more likely to tie the knot than those with fewer economic resources. Table 2
strongly supports the argument. At every age, the percent ever married was lower among the
least educated. Of course, the fact that only a little over one fifth of U.S.-born men and women
with less than high school education were ever married can be misleading. A large proportion of
15 to 19 year olds have neither completed high school nor married. In contrast, three quarters of
men and women with completed college education were ever married, the highest among all
education groups. Individuals with less than high school or high school education had higher
levels of marriage in their earlier 20s but the levels of marriage did not increase as much at older
age groups compared with those with some college or completed education. This suggests that
the likelihood of marriage among less educated men and women became smaller at older ages.
13
Compared to the nineteenth century when half of all college-educated women never married and
to 1960 when 29 percent of the college-educated women were never married, college education
today increases a woman’s marriage chance. This education profile of marriage is similar for
men. The likelihood of marriage has increased for women with a college degree compared with
women with fewer years of schooling (Isen and Stevenson 2010).
Nativity differences in percent ever married were large by race/ethnicity, but small by
educational attainment, as shown in Table 2. Those with less than high school education are the
exception. The educational gradient of marriage was less prominent among immigrants. Indeed,
less educated immigrants were much closer to those with higher levels of educational attainment
in percent ever married than their U.S.-born counterparts. Clearly, marriage is prevalent and not
seen as a status symbol among immigrants, regardless of race/ethnicity and educational
attainment.
In summary, marriage became increasingly delayed in the 2000s, especially among
young men and women in their 20s. The period marking the “emerging adulthood” has
apparently lengthened in recent decades, providing young people with more opportunities than
ever to attend school, develop their careers, and explore new relationships before settling down
to marry (Arnett 2004). To be sure, the Great Recession toward the end of the 2000s may have
further discouraged them from getting married as more young men and women returned to their
parental homes to weather economic hardship (Qian 2012). Nevertheless, percent ever married
increased rapidly starting age 30s, especially among those with high levels of education, which
suggests that most young adults simply delay their marriages. Nevertheless, a significant
minority (13% of U.S. born men and 10% of U.S. born women) remained never married by ages
50-54.
14
Racial/ethnic and educational differences in marriage support the notion that economic
resource is the key to marriage among the U.S. born. Although White men and women on
average marry at later ages, they have the highest percent ever married. From a demographic
standpoint, balanced sex ratios mean that whites have sufficient opportunities to marry, unlike
African American women, who face large deficits in the supply of men, especially men with jobs
that can support a family. Yet, whites may be more likely to marry because they face fewer
structural barriers than racial/ethnic minorities. To achieve a goal in workplace, racial/ethnic
minorities may have to invest in more time and social and human capital than whites, which may
cut down minorities’ investment in marriage markets. Similarly, men and women with completed
college education are more likely to marry than those with less education. Interestingly, the
economic resource argument does not apply to immigrants — Less educated and racial/ethnic
minorities married at the similar levels as their highly educated and white counterparts.
Immigrants came to United States with their traditional norms which value marriage and
children. They marry regardless of economic resource. Indeed, immigration has helped slow
down the marriage decline in American society.
Cohabitation
Decline in marriage have given rise to more cohabitation. Cohabitation emerged as a new living
arrangement in the 1960s and became prevalent over time (Cherlin 2004). The number of
cohabiting couples grew from 0.4 million in 1960 to 3.8 million in 2000 (U.S. Census Bureau
2003). Different from marriage, cohabitation is a short-lived arrangement, mostly lasting one or
two years (Bumpass and Lu 2000). Many young adults view cohabitation as an added step
between dating and marriage. Nearly 60% of the couples who formed their marriage in the early
1990s cohabited prior to marriage (Bumpass and Lu 2000). Those who have made the transition
15
to marriage tend to be those with economic resources (Lichter, Qian, and Mellott 2006).
Meanwhile, some others consider cohabitation an alternative to marriage, move from one
cohabitation to another, and become serial cohabitors (Lichter and Qian 2008). Working- and
lower-middle-class individuals are likely to be in such relationships (Manning and Smock 2005).
They expect to marry and aspire to have a big wedding but are unable to do so due to limited
financial resources. As a result, they resort to cohabitation as a way of adapting to their economic
hardships (Sassler and McNally 2003).
Marriages are more likely to break up among couples who cohabited than among those
who did not cohabit prior to marriage (Lichter and Qian 2008). Some argue that cohabitors’
learning and experience of alternative intimate relationships outside of marriage raises the risk of
divorce (Axinn and Thornton 1992; Smock 2000). Others posit that married couples with prior
cohabitation experience may be not as committed in relationships in the first place — Not only
are they more likely to cohabit, but also more likely to divorce compared with those without
cohabitation experiences (Thomson and Colella 1992). However, Lu and others (2012) find that
the selection effect of cohabitation on subsequent marital disruption has weakened over time
because cohabitation has become less selective (of “divorce prone” persons), as cohabitation has
become the modal pathway to marriage (also see Manning and Cohen 2012).
Over the life course, many individuals experience singlehood, cohabitation, marriage, and
divorce once or more than once. Even among the elderly, cohabitation has increasingly become
commonplace (Brown, Lee, and Bulanda 2006). Clearly, cohabitation is no longer a living
arrangement only common among never married young men and women. Previously married
individuals often cohabit rather than marry or at least cohabit and then move on to marriage
(Smock 2000).
16
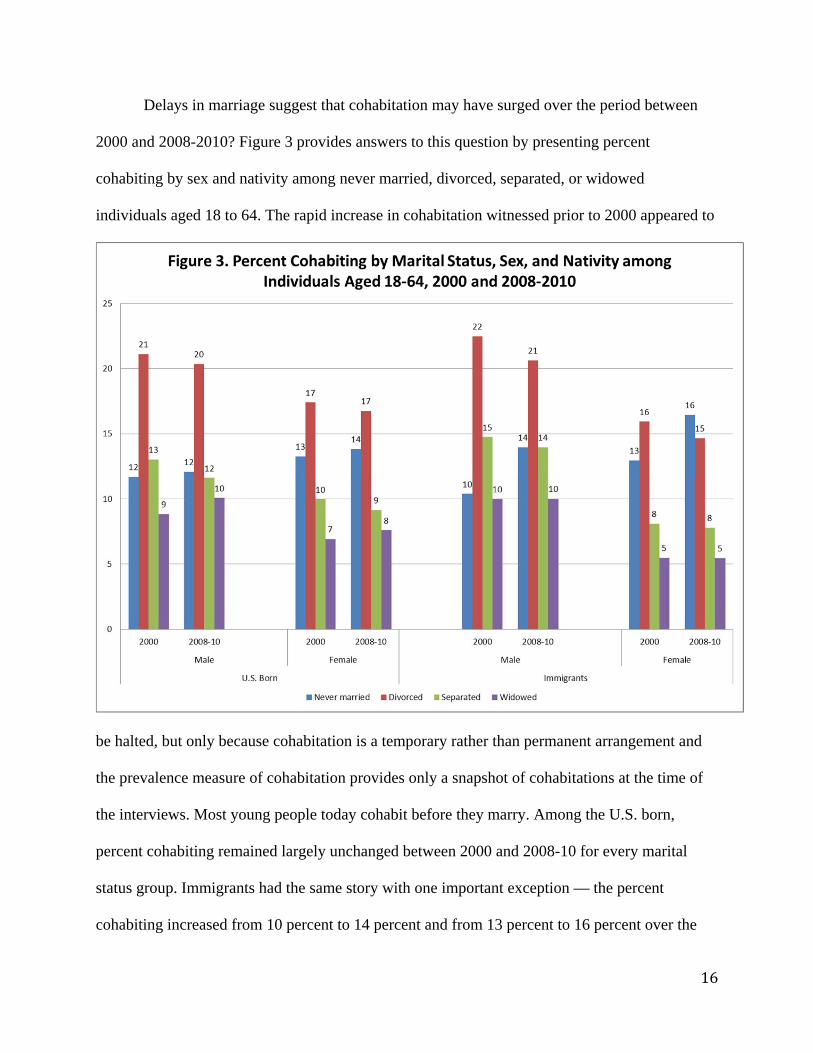
Delays in marriage suggest that cohabitation may have surged over the period between
2000 and 2008-2010? Figure 3 provides answers to this question by presenting percent
cohabiting by sex and nativity among never married, divorced, separated, or widowed
individuals aged 18 to 64. The rapid increase in cohabitation witnessed prior to 2000 appeared to
be halted, but only because cohabitation is a temporary rather than permanent arrangement and
the prevalence measure of cohabitation provides only a snapshot of cohabitations at the time of
the interviews. Most young people today cohabit before they marry. Among the U.S. born,
percent cohabiting remained largely unchanged between 2000 and 2008-10 for every marital
status group. Immigrants had the same story with one important exception — the percent
cohabiting increased from 10 percent to 14 percent and from 13 percent to 16 percent over the
17
period between 2000 and 2008-10 among never married immigrant men and women,
respectively.
Among non-currently-married individuals aged 18 to 64, the divorced had the highest
percent cohabiting while the widowed had the lowest for every gender and nativity group. The
percent cohabiting was lower among the separated than among the divorced because separated
individuals started the divorce process recently and the marriage was not officially over. Gender
differences in cohabitation were evident: never married women had a higher percent cohabiting
than their male counterparts while divorced and separated men had a higher percent cohabiting
than their female counterparts. The reason is simple: custody of children may have discouraged
divorced and separated women from developing intimate relationships, but divorced and
separated men, especially those with economic resources, have more opportunities to form
cohabiting relationships with never married women (Shafer 2012). Nativity differences are
surprisingly small — for each marital status group, the difference in percent cohabiting is within
2 percentage points. As shown below, this is in part due to wide acceptance of cohabitation
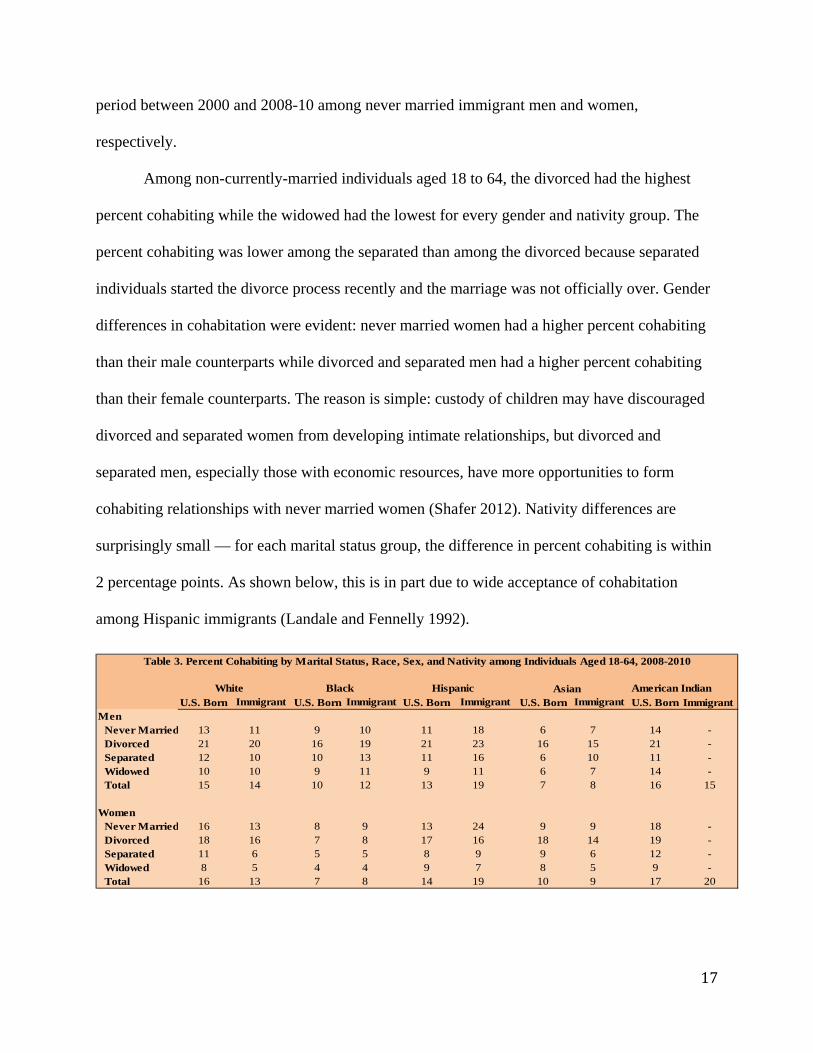
among Hispanic immigrants (Landale and Fennelly 1992).
U.S. Born U.S. Born U.S. Born U.S. Born U.S. Born ImmigrantMen
Never Married 13 11 9 10 11 18 6 7 14 -Divorced 21 20 16 19 21 23 16 15 21 -Separated 12 10 10 13 11 16 6 10 11 -Widowed 10 10 9 11 9 11 6 7 14 -Total 15 14 10 12 13 19 7 8 16 15
WomenNever Married 16 13 8 9 13 24 9 9 18 -Divorced 18 16 7 8 17 16 18 14 19 -Separated 11 6 5 5 8 9 9 6 12 -Widowed 8 5 4 4 9 7 8 5 9 -Total 16 13 7 8 14 19 10 9 17 20
Immigrant Immigrant Immigrant Immigrant
Table 3. Percent Cohabiting by Marital Status, Race, Sex, and Nativity among Individuals Aged 18-64, 2008-2010
White Black Hispanic Asian American Indian
18
Table 3 presents racial/ethnic differences in cohabitation among individuals aged 18 to 64
years old. U.S.-born whites and American Indians had the highest percent of cohabitation and
U.S.-born African and Asian Americans had the lowest. Along with the findings on marriage, it
is clear that U.S.-born Asian Americans married at later ages but did not cohabit as much either.
African Americans, especially African American women, exhibited lowest levels of cohabitation
and marriage. Nativity differences are generally small. Hispanic immigrants were the only
immigrant group that had higher levels of cohabitation compared with their U.S.-born
counterparts because cohabitation is more culturally acceptable and commonly practiced in Latin
America (Landale 1992).
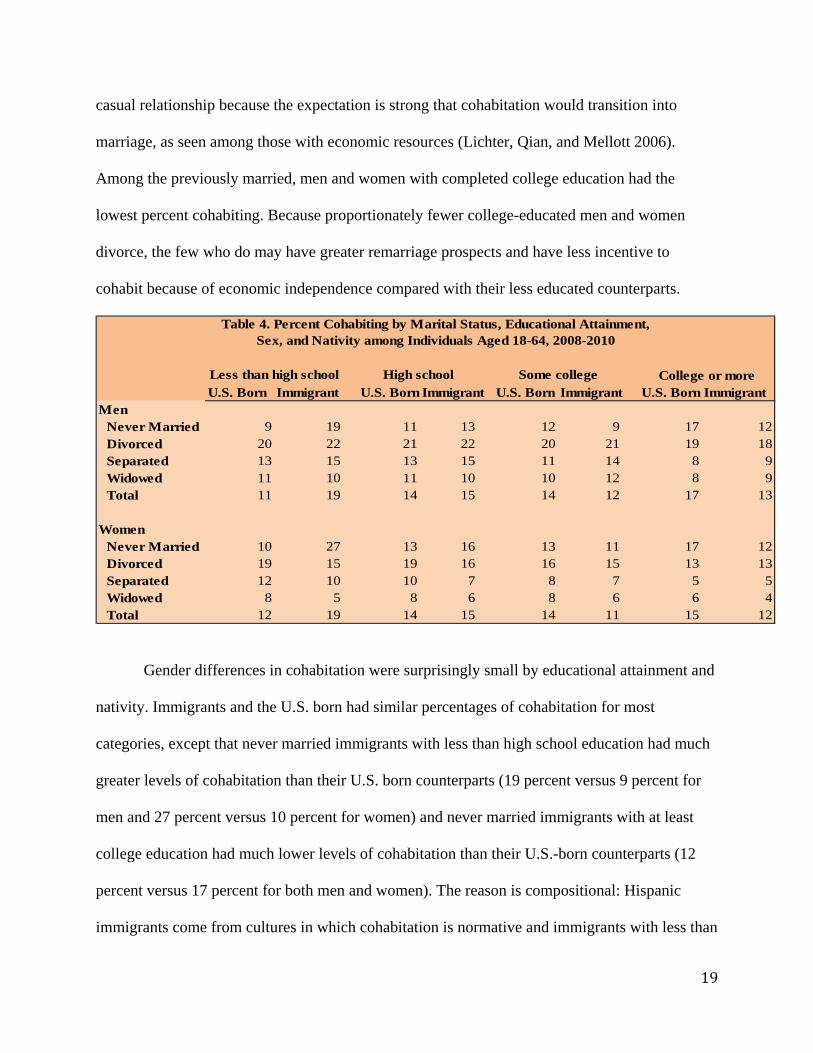
Unlike the past, percent ever married increased with educational attainment. For less
educated individuals, marriage is a status symbol and a wedding has become too expensive
(Cherlin 2004). Do they cohabit more? The answer is no. As revealed in Table 4, never married
individuals with less than high school had the lowest percent of cohabitation. There could be two
possible explanations. One is that the measure used here is based on prevalence. It is possible
that less educated individuals cohabit but their cohabiting relationships have become more
unstable and short-lived during the Great Recession. As a result, the percent cohabiting — a
prevalence rather than incidence measure — captures fewer cohabiting relationships among the
less educated. Another possible explanation is that less educated individuals lack economic
resources, which diminishes not only the prospect of marriage but also cohabitation or the
duration of cohabitation. Earning potential, highly correlated with educational attainment, was
not a strong predictor of entry in cohabitation in the past (Xie, Raymo, Goyette, and Thornton
2003). It is likely to have become a strong predictor of whether one cohabits and/or how long
each cohabitation episode lasts. After all, cohabitation is a more formal living arrangement than a
19
casual relationship because the expectation is strong that cohabitation would transition into
marriage, as seen among those with economic resources (Lichter, Qian, and Mellott 2006).
Among the previously married, men and women with completed college education had the
lowest percent cohabiting. Because proportionately fewer college-educated men and women
divorce, the few who do may have greater remarriage prospects and have less incentive to
cohabit because of economic independence compared with their less educated counterparts.
U.S. Born Immigrant U.S. Born Immigrant U.S. Born Immigrant U.S. Born ImmigrantMen
Never Married 9 19 11 13 12 9 17 12Divorced 20 22 21 22 20 21 19 18Separated 13 15 13 15 11 14 8 9Widowed 11 10 11 10 10 12 8 9Total 11 19 14 15 14 12 17 13
WomenNever Married 10 27 13 16 13 11 17 12Divorced 19 15 19 16 16 15 13 13Separated 12 10 10 7 8 7 5 5Widowed 8 5 8 6 8 6 6 4Total 12 19 14 15 14 11 15 12
Less than high school High school Some college College or more
Table 4. Percent Cohabiting by Marital Status, Educational Attainment, Sex, and Nativity among Individuals Aged 18-64, 2008-2010
Gender differences in cohabitation were surprisingly small by educational attainment and
nativity. Immigrants and the U.S. born had similar percentages of cohabitation for most
categories, except that never married immigrants with less than high school education had much
greater levels of cohabitation than their U.S. born counterparts (19 percent versus 9 percent for
men and 27 percent versus 10 percent for women) and never married immigrants with at least
college education had much lower levels of cohabitation than their U.S.-born counterparts (12
percent versus 17 percent for both men and women). The reason is compositional: Hispanic
immigrants come from cultures in which cohabitation is normative and immigrants with less than
20
high school education are more likely to be Hispanics. In contrast, immigrants with completed
college education are less likely to be Hispanic and, thus, less likely to form cohabiting
relationships.
Bucking the trend in the past, the prevalence of cohabitation among the U.S. born did not
increase in the 2000s, even with increases in the incidence of cohabitation.1 This suggests that
cohabitation is a transitory stage in the life course rather than a permanent living arrangement
that serves as an alternative to marriage. Are changing patterns of cohabitation a part of the
“quieting” of family change documented by Casper and Bianchi (2002)? Or is the Great
Recession the culprit for low levels of cohabitation? After all, cohabitation prevalence is lowest
among those with less than high school education and among racial/ethnic minorities, especially
African Americans. This is a finding that we did not witness in the past. It is possible that these
individuals might not even afford cohabitation or only have unstable cohabiting relationships due
to poor employment opportunities and economic resources. Another possible explanation is that
cohabitation has become so prevalent that it has become a social institution, which comes with
expectations and norms. As a result, some young men and women may be discouraged from
entering cohabiting relationships that have become more institutionalized.
Divorce
The annual divorce rate (the number of divorces per 1000 individuals) rose from 2.2 in 1960 to
5.2 in 1980 and then dropped to 3.6 in 2006 (Amato 2010). The rise in age at marriage
contributes to the decline in the divorce rate because the denominator consists of proportionately
fewer married individuals (Heaton 2002). In other words, the denominator includes fewer
1 Yet, Mogan, Cumberworth, and Wimer (2011) showed that the proportion of people age 16 and older living with unmarried partners based on the estimates of the monthly Current Population Survey continued to increase, by a little over 1 percentage point, during the 2000s.
21
married individuals and fewer individuals at risk of divorce. In addition, marriage has become
selective and those who marry have lower risks of divorce. For example, less educated
individuals or racial/ethnic minorities who tend to have higher divorce rates are now much less
likely to marry than their highly educated counterparts or whites (McLanahan 2004; Sweeney
and Phillips 2004).
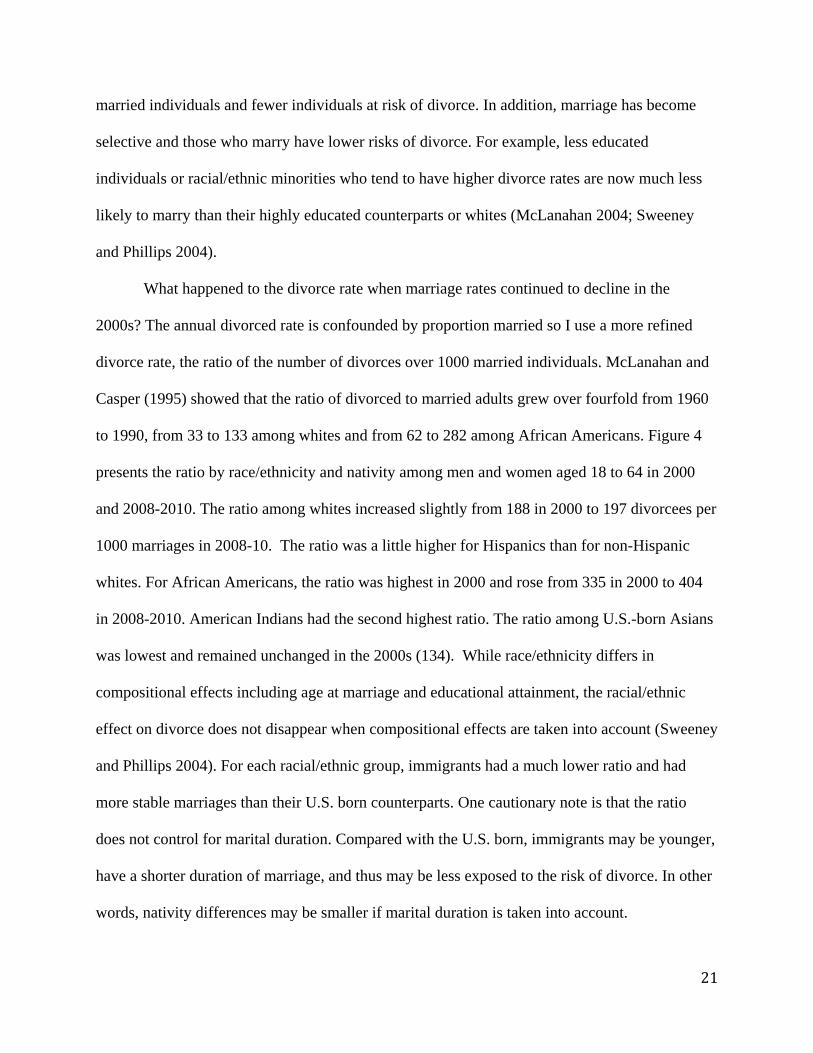
What happened to the divorce rate when marriage rates continued to decline in the
2000s? The annual divorced rate is confounded by proportion married so I use a more refined
divorce rate, the ratio of the number of divorces over 1000 married individuals. McLanahan and
Casper (1995) showed that the ratio of divorced to married adults grew over fourfold from 1960
to 1990, from 33 to 133 among whites and from 62 to 282 among African Americans. Figure 4
presents the ratio by race/ethnicity and nativity among men and women aged 18 to 64 in 2000
and 2008-2010. The ratio among whites increased slightly from 188 in 2000 to 197 divorcees per
1000 marriages in 2008-10. The ratio was a little higher for Hispanics than for non-Hispanic
whites. For African Americans, the ratio was highest in 2000 and rose from 335 in 2000 to 404
in 2008-2010. American Indians had the second highest ratio. The ratio among U.S.-born Asians
was lowest and remained unchanged in the 2000s (134). While race/ethnicity differs in
compositional effects including age at marriage and educational attainment, the racial/ethnic
effect on divorce does not disappear when compositional effects are taken into account (Sweeney
and Phillips 2004). For each racial/ethnic group, immigrants had a much lower ratio and had
more stable marriages than their U.S. born counterparts. One cautionary note is that the ratio
does not control for marital duration. Compared with the U.S. born, immigrants may be younger,
have a shorter duration of marriage, and thus may be less exposed to the risk of divorce. In other
words, nativity differences may be smaller if marital duration is taken into account.
22
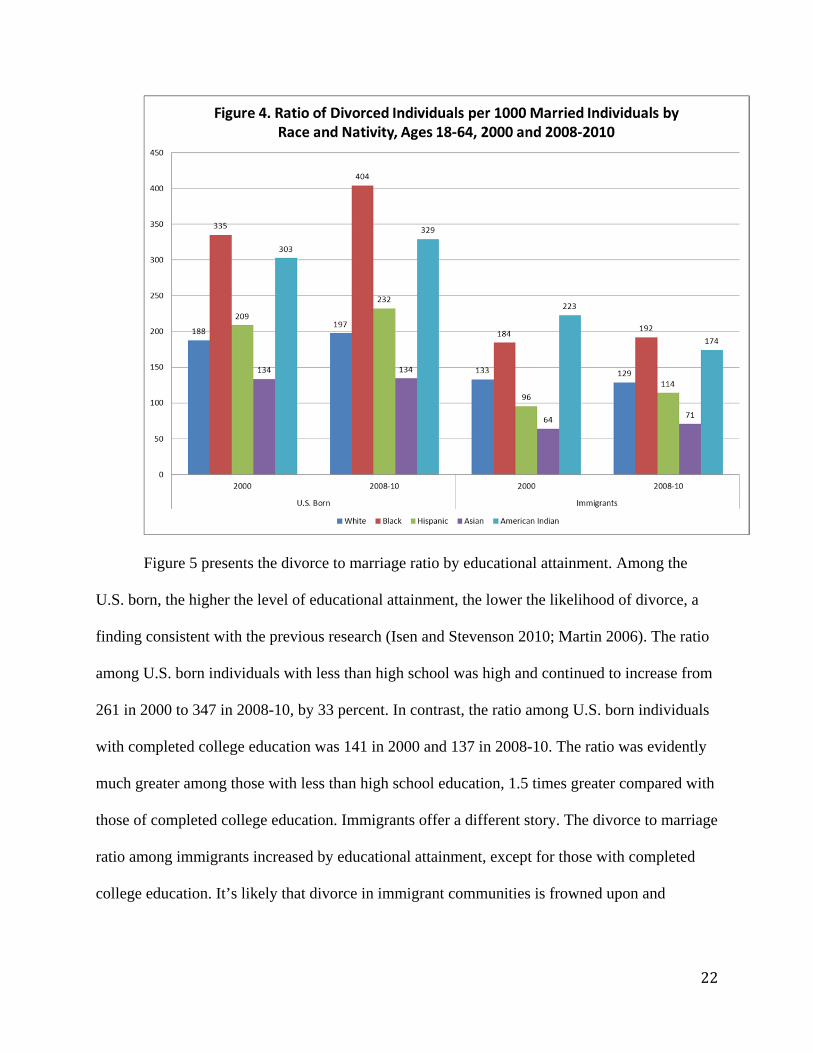
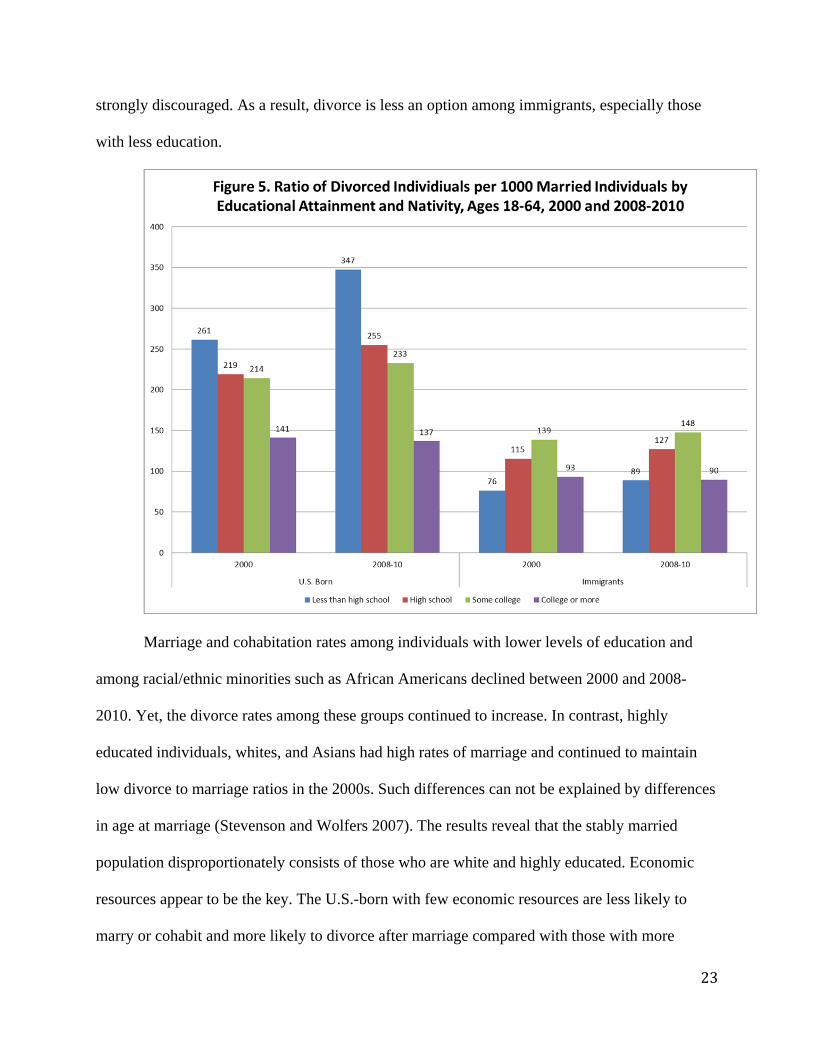
Figure 5 presents the divorce to marriage ratio by educational attainment. Among the
U.S. born, the higher the level of educational attainment, the lower the likelihood of divorce, a
finding consistent with the previous research (Isen and Stevenson 2010; Martin 2006). The ratio
among U.S. born individuals with less than high school was high and continued to increase from
261 in 2000 to 347 in 2008-10, by 33 percent. In contrast, the ratio among U.S. born individuals
with completed college education was 141 in 2000 and 137 in 2008-10. The ratio was evidently
much greater among those with less than high school education, 1.5 times greater compared with
those of completed college education. Immigrants offer a different story. The divorce to marriage
ratio among immigrants increased by educational attainment, except for those with completed
college education. It’s likely that divorce in immigrant communities is frowned upon and
23
strongly discouraged. As a result, divorce is less an option among immigrants, especially those
with less education.
Marriage and cohabitation rates among individuals with lower levels of education and
among racial/ethnic minorities such as African Americans declined between 2000 and 2008-
2010. Yet, the divorce rates among these groups continued to increase. In contrast, highly
educated individuals, whites, and Asians had high rates of marriage and continued to maintain
low divorce to marriage ratios in the 2000s. Such differences can not be explained by differences
in age at marriage (Stevenson and Wolfers 2007). The results reveal that the stably married
population disproportionately consists of those who are white and highly educated. Economic
resources appear to be the key. The U.S.-born with few economic resources are less likely to
marry or cohabit and more likely to divorce after marriage compared with those with more
24
economic resources. The Great Recession in 2008-2010 may have aggregated the situation.
Among immigrants, racial/ethnic differences in divorce to marriage ratio mirror those among the
U.S. born, but immigrants had much lower levels of divorce to marriage ratio. Among
immigrants, educational attainment did not play a role determining the likelihood of marriage
and the effect of educational attainment on divorce shows an inverted U — those with less than
high school education and those with completed college education had the lowest rates of
divorce. The economic resource argument did not play a role in immigrants’ marriage and
divorce.
Remarriage
As early as in 1981, Cherlin (1992) identified an emerging life course pattern — marriage,
divorce, and remarriage. In “Marriage-Go-Round,” Cherlin further draws attention to the unique
American family life that no other countries in the world have experienced: Americans start
relationships at younger ages, experience short-term cohabitations often, divorce quickly after
marriage, and move into other cohabiting or marital relationships (Cherlin 2009). Remarriage is
unique compared with first marriage because remarried individuals are a select group of all first
or previously married individuals, i.e., they have been divorced or widowed. As such, they bring
with them the emotional and financial baggage of failed previous marriage(s). They often have
minor children, which means that they often face the complications associated with child support
and visitation rights, and with step families (Sweeney 1997). Divorced women with economic
resources may have less motivation to remarry because of their ability to support themselves and
their children while those with fewer economics resources may have more motivation in order to
escape from poverty (Sweeney 1997). Most divorced women have physical or legal custody of
their children, which also reduces their attractiveness in the marriage market. On the other hand,
25
divorced men with economic resources remarry at a higher rate. Their pool of the marriageable
women is larger and often includes never married, younger women (Shafer 2012).
To examine whether remarriages have increased over time, I rely on data from the 1980
census and the 2008-2010 American Community Survey. The 1980 census was the latest census
and the 2008 ACS was the first ACS that includes information on marriage order. These two data
sources are not exactly comparable because marriage order for the 1980 census was classified as
married once and married twice or more while marriage order for the 2008-10 ACS had
information on married once, twice, and three times or more, a difference that reflects time
change in prevalence of remarriage.
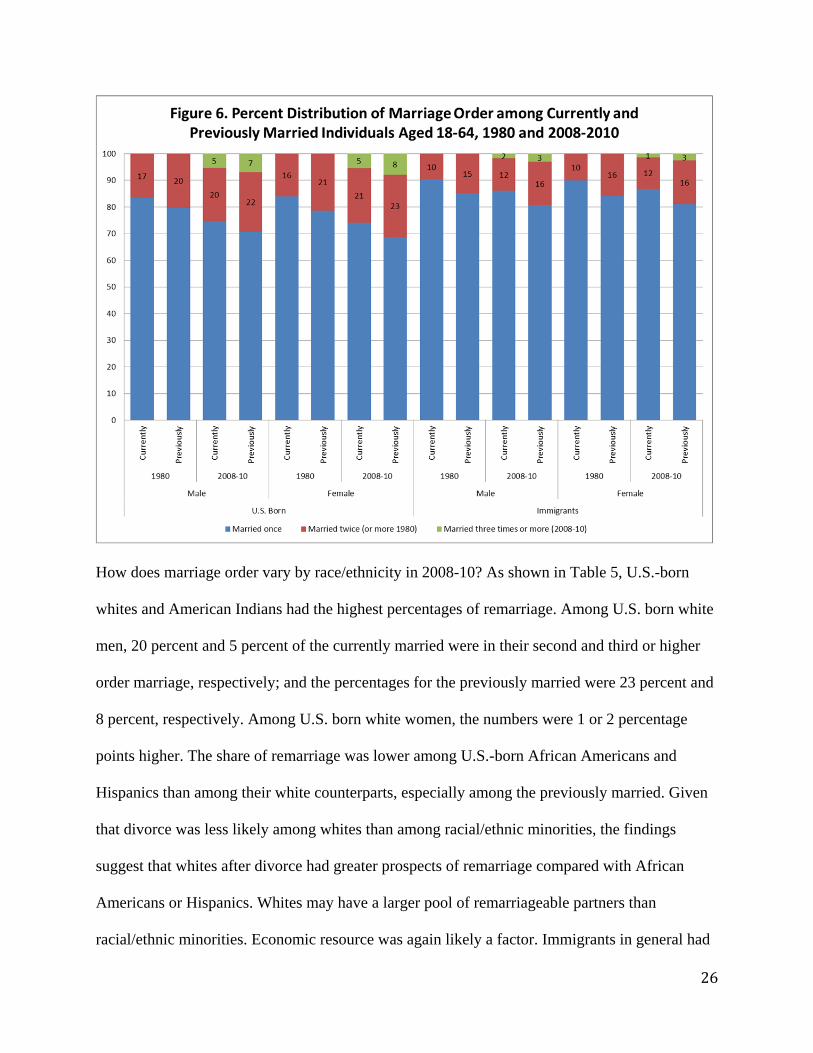
Figure 6 compares marriage order between 1980 and 2008-2010 among current and
previously married individuals aged 18-64. Among currently married men, the share of
remarriage increased from 17 percent in 1980 to 25 percent (20 percent married twice and 5
percent married three times or more) in 2008-2010. Among previously married men, the
corresponding percentages in 1980 and 2008-2010 were 20 and 29 (22 percent married twice and
7 percent married three times or more), respectively. Currently and previously married women
had similar shares of remarriage as their male counterparts. Of course, the previously married
individuals already disrupted their remarriages and experienced more marital transitions than the
currently married. Increases in remarriage reflect the “marriage-go-round”—more individuals are
moving from one marital state to another (marriage, divorce, remarriage, divorce) over the life
course. Again, the share of remarriage was small among immigrants. The nativity differences
were stronger among previously married than among currently married individuals, suggesting
that immigrants experienced fewer marital transitions than their U.S.-born counterparts.
26
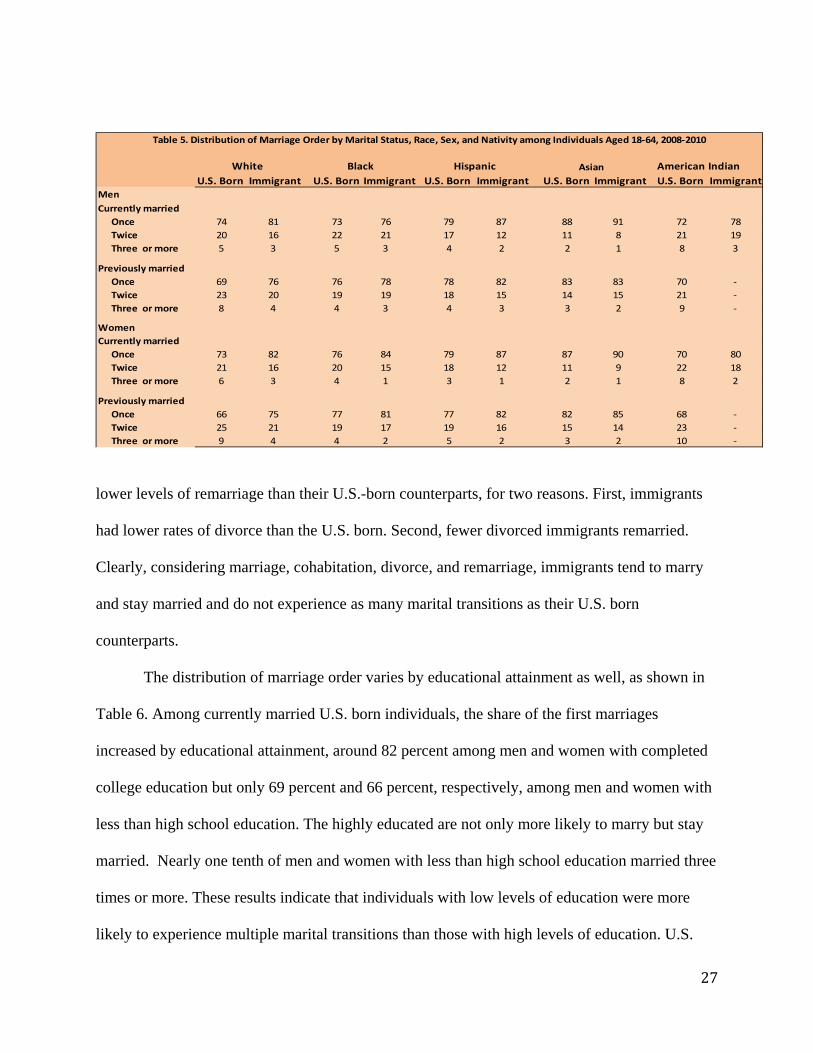
How does marriage order vary by race/ethnicity in 2008-10? As shown in Table 5, U.S.-born
whites and American Indians had the highest percentages of remarriage. Among U.S. born white
men, 20 percent and 5 percent of the currently married were in their second and third or higher
order marriage, respectively; and the percentages for the previously married were 23 percent and
8 percent, respectively. Among U.S. born white women, the numbers were 1 or 2 percentage
points higher. The share of remarriage was lower among U.S.-born African Americans and
Hispanics than among their white counterparts, especially among the previously married. Given
that divorce was less likely among whites than among racial/ethnic minorities, the findings
suggest that whites after divorce had greater prospects of remarriage compared with African
Americans or Hispanics. Whites may have a larger pool of remarriageable partners than
racial/ethnic minorities. Economic resource was again likely a factor. Immigrants in general had
27
U.S. Born Immigrant U.S. Born Immigrant U.S. Born Immigrant U.S. Born Immigrant U.S. Born Immigrant
Men
Currently married
Once 74 81 73 76 79 87 88 91 72 78
Twice 20 16 22 21 17 12 11 8 21 19
Three or more 5 3 5 3 4 2 2 1 8 3
Previously married
Once 69 76 76 78 78 82 83 83 70 ‐
Twice 23 20 19 19 18 15 14 15 21 ‐
Three or more 8 4 4 3 4 3 3 2 9 ‐
Women
Currently married
Once 73 82 76 84 79 87 87 90 70 80
Twice 21 16 20 15 18 12 11 9 22 18
Three or more 6 3 4 1 3 1 2 1 8 2
Previously married
Once 66 75 77 81 77 82 82 85 68 ‐
Twice 25 21 19 17 19 16 15 14 23 ‐
Three or more 9 4 4 2 5 2 3 2 10 ‐
Table 5. Distribution of Marriage Order by Marital Status, Race, Sex, and Nativity among Individuals Aged 18‐64, 2008‐2010
White Black Hispanic Asian American Indian
lower levels of remarriage than their U.S.-born counterparts, for two reasons. First, immigrants
had lower rates of divorce than the U.S. born. Second, fewer divorced immigrants remarried.
Clearly, considering marriage, cohabitation, divorce, and remarriage, immigrants tend to marry
and stay married and do not experience as many marital transitions as their U.S. born
counterparts.
The distribution of marriage order varies by educational attainment as well, as shown in
Table 6. Among currently married U.S. born individuals, the share of the first marriages
increased by educational attainment, around 82 percent among men and women with completed
college education but only 69 percent and 66 percent, respectively, among men and women with
less than high school education. The highly educated are not only more likely to marry but stay
married. Nearly one tenth of men and women with less than high school education married three
times or more. These results indicate that individuals with low levels of education were more
likely to experience multiple marital transitions than those with high levels of education. U.S.
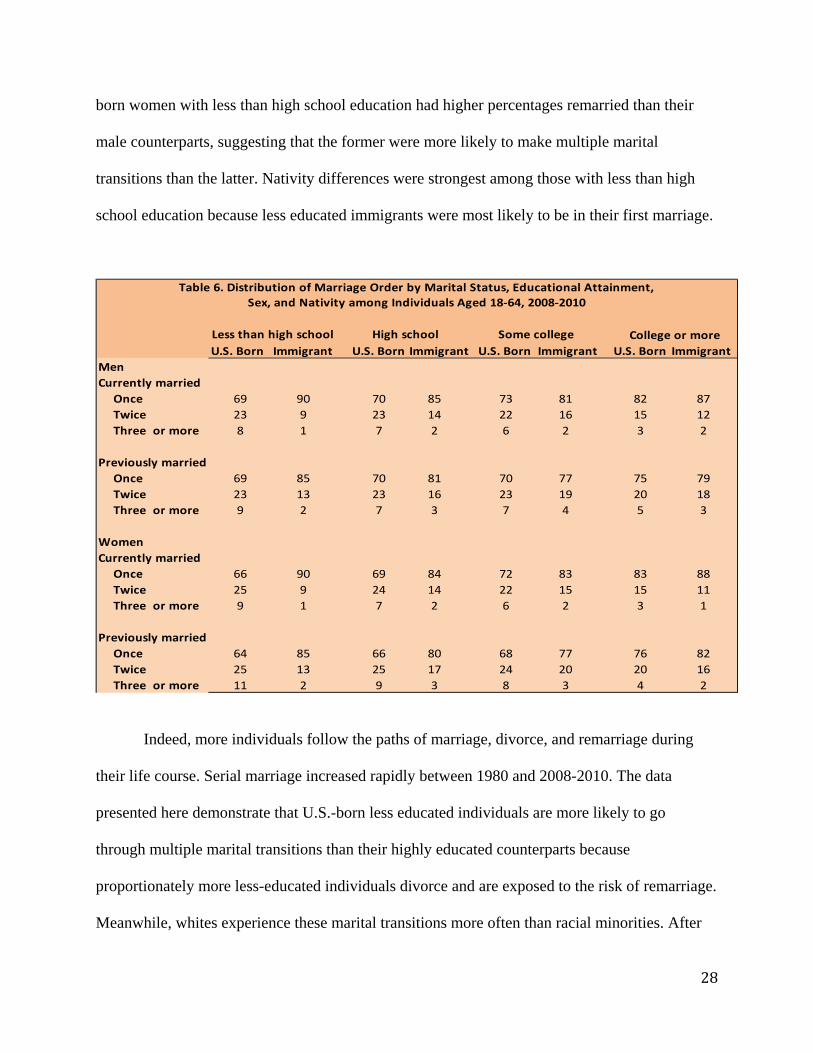
28
born women with less than high school education had higher percentages remarried than their
male counterparts, suggesting that the former were more likely to make multiple marital
transitions than the latter. Nativity differences were strongest among those with less than high
school education because less educated immigrants were most likely to be in their first marriage.
U.S. Born Immigrant U.S. Born Immigrant U.S. Born Immigrant U.S. Born Immigrant
Men
Currently married
Once 69 90 70 85 73 81 82 87
Twice 23 9 23 14 22 16 15 12
Three or more 8 1 7 2 6 2 3 2
Previously married
Once 69 85 70 81 70 77 75 79
Twice 23 13 23 16 23 19 20 18
Three or more 9 2 7 3 7 4 5 3
Women
Currently married
Once 66 90 69 84 72 83 83 88
Twice 25 9 24 14 22 15 15 11
Three or more 9 1 7 2 6 2 3 1
Previously married
Once 64 85 66 80 68 77 76 82
Twice 25 13 25 17 24 20 20 16
Three or more 11 2 9 3 8 3 4 2
Table 6. Distribution of Marriage Order by Marital Status, Educational Attainment,
Sex, and Nativity among Individuals Aged 18‐64, 2008‐2010
Less than high school High school Some college College or more
Indeed, more individuals follow the paths of marriage, divorce, and remarriage during
their life course. Serial marriage increased rapidly between 1980 and 2008-2010. The data
presented here demonstrate that U.S.-born less educated individuals are more likely to go
through multiple marital transitions than their highly educated counterparts because
proportionately more less-educated individuals divorce and are exposed to the risk of remarriage.
Meanwhile, whites experience these marital transitions more often than racial minorities. After
29
all, remarriages are more formal than serial cohabitations and receive better legal protections.
Once again, immigrants differ significantly from their U.S. born counterparts. The explanation is
straightforward: immigrants do not divorce as much as natives, and those who divorce are less
likely to remarry.
Impacts on Children
The family has always been the principal source of support for America’s new generations, and
family change affects children in various ways. On the one hand, delays in marriage, prevalent
cohabitation, relationship instability, and fertility decline increase childlessness, voluntarily or
involuntarily. For example, Pew Research Report (2010) shows that 13 percent of ever-married
women aged 40 to 44 and 56 percent of never married women in the same age group in 2006-
2008 had no children. An increasing proportion of the population with no young children may
lead to a decline in public support for America’s children (Preston 1984). On the other hand,
rapid changes in American families indicate that children are likely to fare differently — some
gain resources and time because of delay in marriage and decline in family size while others go
the other way because of divorce, non-marital childbearing, and transitory unions (Cherlin 2009;
McLanahan 2004).
Marriage and childbearing are less likely today to go hand in hand. Social norms against
unmarried childbearing are weak, “shotgun weddings” are on the decline, and unmarried
childbearing is on the rise. The increase in unmarried childbearing in recent decades is largely
due to the growing proportion of births among cohabitating couples (Raley 2001; Sassler, Miller,
and Favinger 2009). Unfortunately, cohabiting relationships are unstable and have a negative
impact on children (Bulanda and Manning 2008). Children born to cohabiting parents are far
more likely to go through single parenthood or frequent changes of their parent’s live-in
30
boyfriends or girlfriends than those born to married parents. Even if their mothers or fathers later
marry, their academic and economic wellbeing in remarried families pales compared with
children born in two biological parent families (Cherlin 1999).
The relationship between children’s living arrangement and socioeconomic wellbeing is
strong. Children living in married couple families are least likely to live in poverty while
children growing up in female headed single parent families are most likely (Lichter and Qian
2004). Meanwhile, children living in cohabiting families also do poorly, a level that is likely
overstated because only the income of the householder (not the income of the householder’s
cohabiting partner) is used to estimate poverty (Lichter, Qian, and Crowley 2005). In addition,
when parents move from one relationship to another or have difficulties making ends meet, their
children often live with grandparents, a pattern most common among African Americans (Edin
2000).
Family changes such as marriage delay, a growing proportion of children born to
unmarried mothers, prevalent cohabitation, and high levels of divorce influence children’s
wellbeing. Children are often the witness of every relationship breakup their parents experience.
Relationship transitions may be good for their parents, but the children’s wellbeing is often at
risk. I now provide a snapshot of changes in children’s living arrangement by race/ethnicity and
nativity. I include all children aged 0 to 17 in my analysis. Figure 7 presents children’s living
arrangements by nativity. The time period between 2000 and 2008-10 witnessed a period of
relative stability in living arrangement among U.S. born children.
In 2000, children had the highest percent living with two working parents (41 percent),
followed by living with traditional families (working father/non-working mothers, 20 percent).
In 2008-10, the percent of children living with dual earner parents increased by 2 percentage
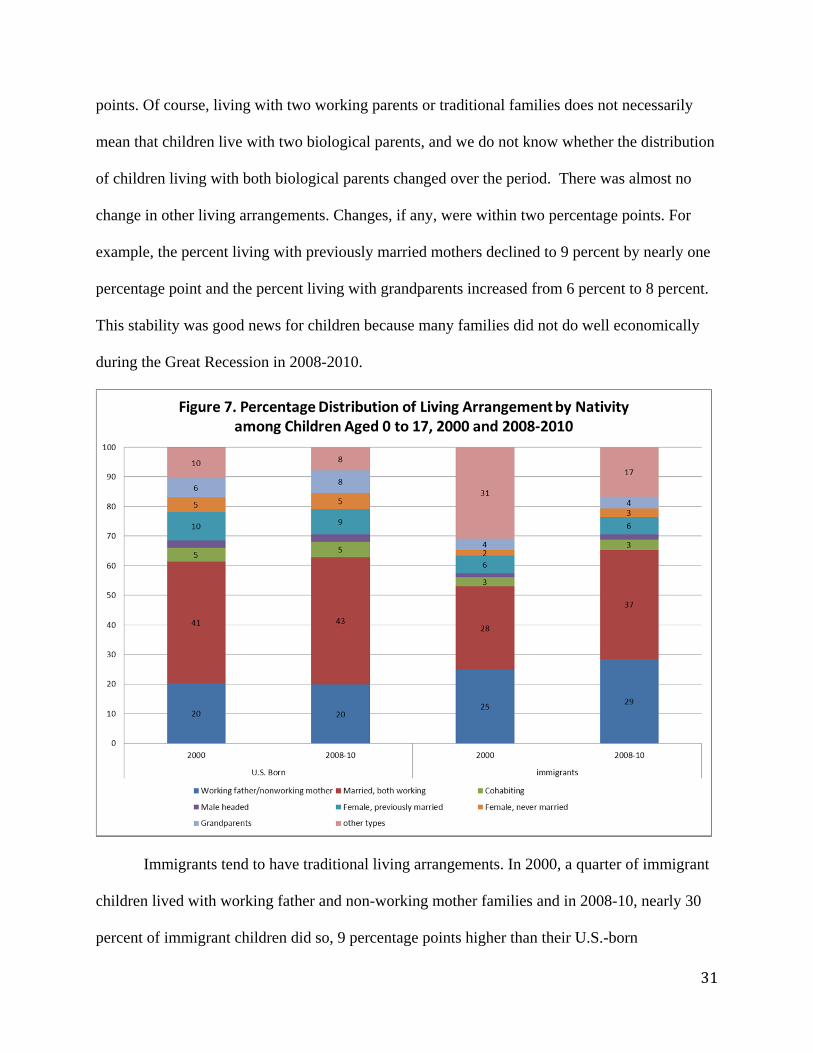
31
points. Of course, living with two working parents or traditional families does not necessarily
mean that children live with two biological parents, and we do not know whether the distribution
of children living with both biological parents changed over the period. There was almost no
change in other living arrangements. Changes, if any, were within two percentage points. For
example, the percent living with previously married mothers declined to 9 percent by nearly one
percentage point and the percent living with grandparents increased from 6 percent to 8 percent.
This stability was good news for children because many families did not do well economically
during the Great Recession in 2008-2010.
Immigrants tend to have traditional living arrangements. In 2000, a quarter of immigrant
children lived with working father and non-working mother families and in 2008-10, nearly 30
percent of immigrant children did so, 9 percentage points higher than their U.S.-born
32
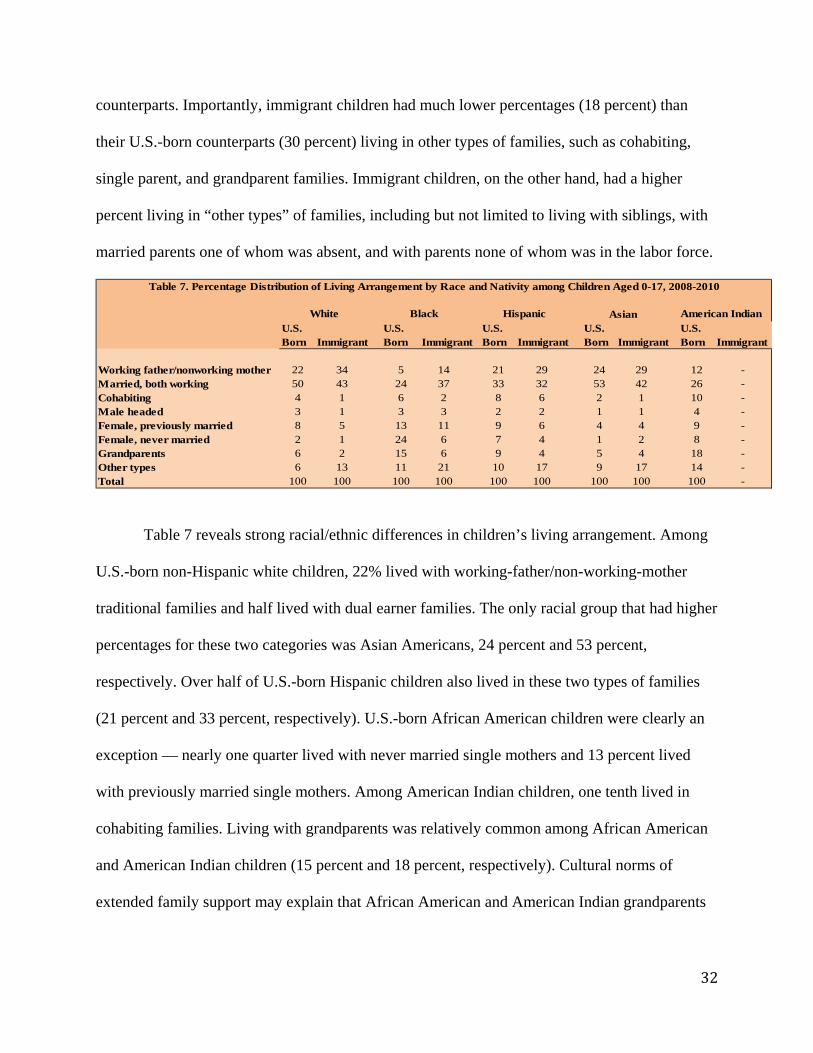
counterparts. Importantly, immigrant children had much lower percentages (18 percent) than
their U.S.-born counterparts (30 percent) living in other types of families, such as cohabiting,
single parent, and grandparent families. Immigrant children, on the other hand, had a higher
percent living in “other types” of families, including but not limited to living with siblings, with
married parents one of whom was absent, and with parents none of whom was in the labor force.
U.S. Born Immigrant
U.S. Born Immigrant
U.S. Born Immigrant
U.S. Born Immigrant
U.S. Born Immigrant
Working father/nonworking mother 22 34 5 14 21 29 24 29 12 -Married, both working 50 43 24 37 33 32 53 42 26 -Cohabiting 4 1 6 2 8 6 2 1 10 -Male headed 3 1 3 3 2 2 1 1 4 -Female, previously married 8 5 13 11 9 6 4 4 9 -Female, never married 2 1 24 6 7 4 1 2 8 -Grandparents 6 2 15 6 9 4 5 4 18 -Other types 6 13 11 21 10 17 9 17 14 -Total 100 100 100 100 100 100 100 100 100 -
Table 7. Percentage Distribution of Living Arrangement by Race and Nativity among Children Aged 0-17, 2008-2010
White Black Hispanic Asian American Indian
Table 7 reveals strong racial/ethnic differences in children’s living arrangement. Among
U.S.-born non-Hispanic white children, 22% lived with working-father/non-working-mother
traditional families and half lived with dual earner families. The only racial group that had higher
percentages for these two categories was Asian Americans, 24 percent and 53 percent,
respectively. Over half of U.S.-born Hispanic children also lived in these two types of families
(21 percent and 33 percent, respectively). U.S.-born African American children were clearly an
exception — nearly one quarter lived with never married single mothers and 13 percent lived
with previously married single mothers. Among American Indian children, one tenth lived in
cohabiting families. Living with grandparents was relatively common among African American
and American Indian children (15 percent and 18 percent, respectively). Cultural norms of
extended family support may explain that African American and American Indian grandparents
33
are more likely to take on a parent role with their grandchildren (Dunifon and Bajracharya 2012;
Luo, LaPierre, Hughes, and Waite 2012).
Immigrant children had lower percentages living with dual earner families but higher
percentages living with working-father/non-working-mother families compared with their U.S.-
born counterparts. Meanwhile, immigrant children had lower percentages living in single
families, cohabiting families, or with grandparents than their U.S.-born counterparts. While black
immigrant children had the similar percent living with previously married single mothers
compared with their U.S.-born counterparts, they had much lower percentages living with never
married mothers or grandparents than African American children.
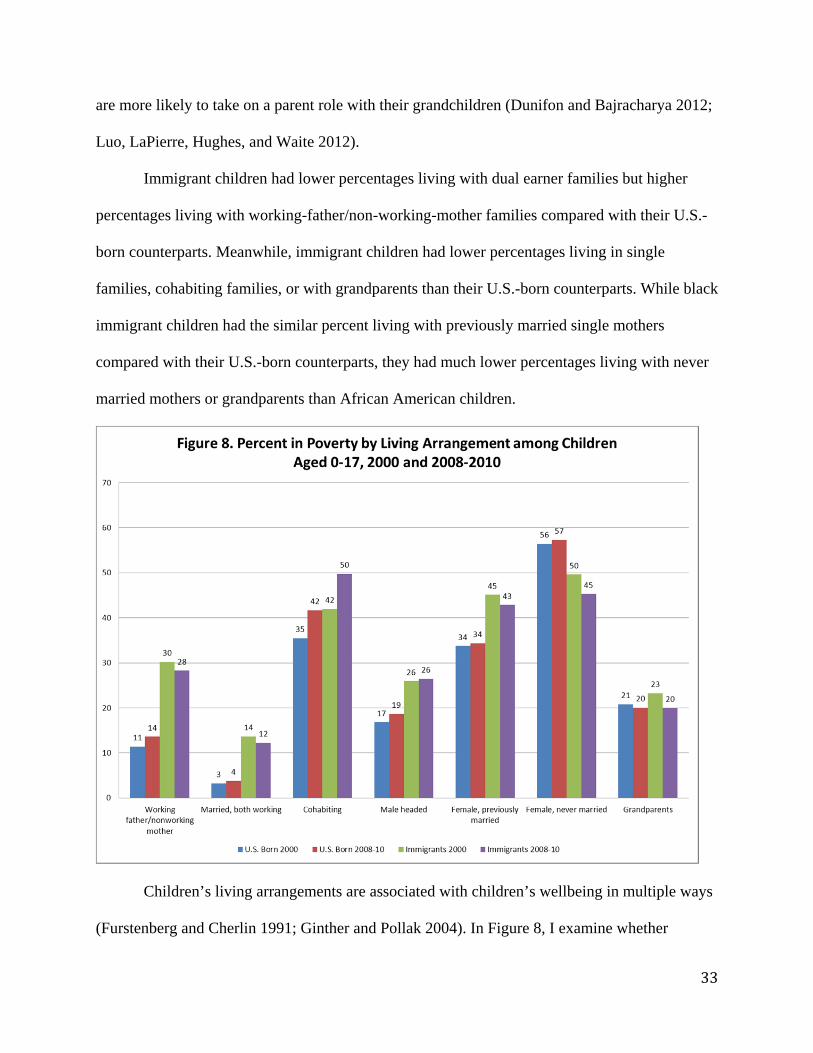
Children’s living arrangements are associated with children’s wellbeing in multiple ways
(Furstenberg and Cherlin 1991; Ginther and Pollak 2004). In Figure 8, I examine whether
34
children aged 0 to 17 lived in poverty by living arrangement in 2000 and 2008-10. In 2000,
percent of children living in poverty was lowest (3 percent) among U.S.-born children living in
dual earner families, followed by 11 percent among those living in working-father/non-working-
mother families, and the highest among those living in never married single-mother families (56
percent). Despite the Great Recession, percent living in poverty only rose slightly in 2008-2010.
One exception is that children living in cohabiting families experienced a large increase living in
poverty, from 35 percent in 2000 to 42 percent in 2008-2010. However, as mentioned earlier,
poverty levels among cohabiting families may be overstated because only the income of the
householder (not the income of the householder’s cohabiting partner) is used to estimate poverty.
Living with grandparents is indeed beneficial to children because alternatives such as living with
single parents would mean a much higher level of children living in poverty.
Immigrant children are more likely to live with married parents who are working poor
than U.S.-born children. Percent in poverty was significantly higher among immigrant working-
father/non-working-mother or dual earner families than among their U.S.-born counterparts (30
percent and 14 respectively among immigrants versus 11 percent and 3 percent among the U.S.
born in 2000). Nativity differences were much smaller among children in other types of living
arrangements but immigrants, in general, had higher levels living in poverty than their U.S. born
counterparts for each type of living arrangements. Despite the Great Recession, the percent in
poverty declined among immigrant children in 2008-10 for most living arrangements, maybe in
part due to sharper declines in immigration among disadvantaged populations and greater levels
of return migration among immigrants who did not do well economically in the United States
(Cherlin, Cumberworth, Morgan, and Wimer Forthcoming).
35
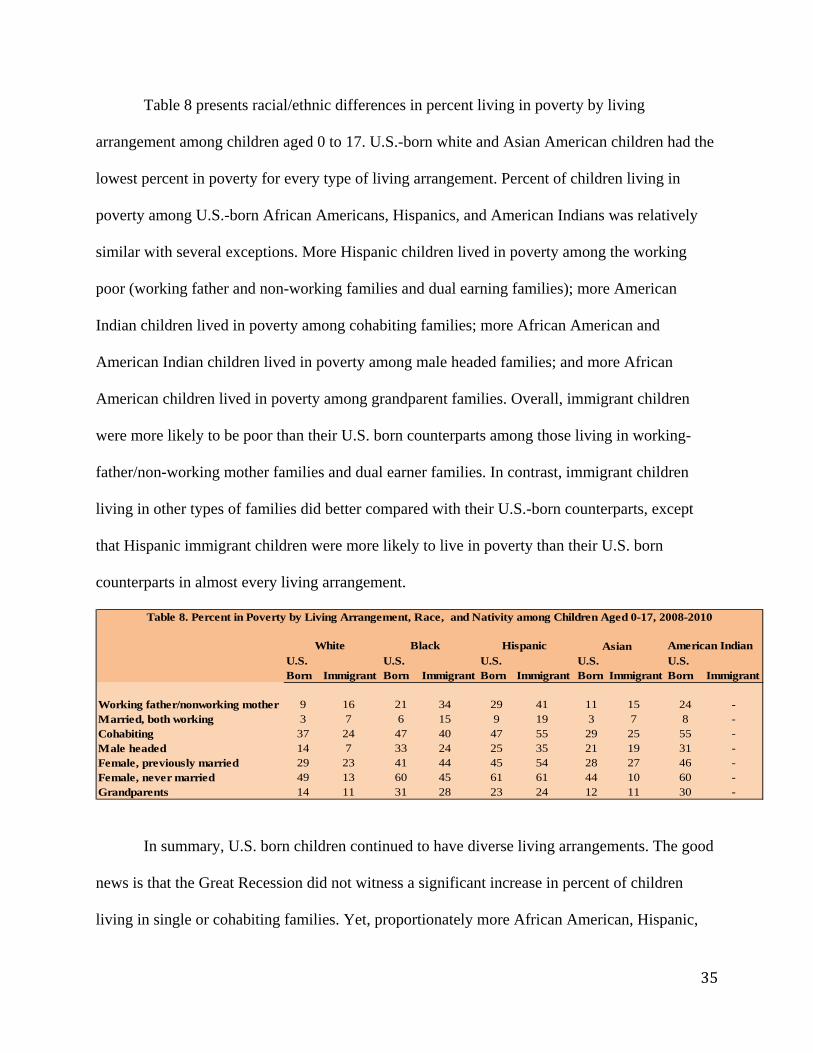
Table 8 presents racial/ethnic differences in percent living in poverty by living
arrangement among children aged 0 to 17. U.S.-born white and Asian American children had the
lowest percent in poverty for every type of living arrangement. Percent of children living in
poverty among U.S.-born African Americans, Hispanics, and American Indians was relatively
similar with several exceptions. More Hispanic children lived in poverty among the working
poor (working father and non-working families and dual earning families); more American
Indian children lived in poverty among cohabiting families; more African American and
American Indian children lived in poverty among male headed families; and more African
American children lived in poverty among grandparent families. Overall, immigrant children
were more likely to be poor than their U.S. born counterparts among those living in working-
father/non-working mother families and dual earner families. In contrast, immigrant children
living in other types of families did better compared with their U.S.-born counterparts, except
that Hispanic immigrant children were more likely to live in poverty than their U.S. born
counterparts in almost every living arrangement.
U.S. Born Immigrant
U.S. Born Immigrant
U.S. Born Immigrant
U.S. Born Immigrant
U.S. Born Immigrant
Working father/nonworking mother 9 16 21 34 29 41 11 15 24 -Married, both working 3 7 6 15 9 19 3 7 8 -Cohabiting 37 24 47 40 47 55 29 25 55 -Male headed 14 7 33 24 25 35 21 19 31 -Female, previously married 29 23 41 44 45 54 28 27 46 -Female, never married 49 13 60 45 61 61 44 10 60 -Grandparents 14 11 31 28 23 24 12 11 30 -
Table 8. Percent in Poverty by Living Arrangement, Race, and Nativity among Children Aged 0-17, 2008-2010
White Black Hispanic Asian American Indian
In summary, U.S. born children continued to have diverse living arrangements. The good
news is that the Great Recession did not witness a significant increase in percent of children
living in single or cohabiting families. Yet, proportionately more African American, Hispanic,
36
and American Indian children lived in single or cohabiting families in which the risk of poverty
is higher, and fewer African American children lived in traditional families or dual earner
families in which the risk is low. For U.S.-born children, living arrangement is a strong indicator
of poverty status. Immigrants are different. Immigrant children had low percentages living in
single or cohabiting families and higher percentages living in traditional or dual earner families,
but the percent living in poverty is relatively high because more immigrant children, especially
those of Hispanics, lived in poverty than their U.S.-born counterparts among traditional and dual
earner families. Overall, the results show that America’s children have strong disparities in
economic resources (McLanahan 2004).
Conclusion
American families have been transformed over the past several decades. Since the 1960s,
delayed marriage, prevalent cohabitation, high divorce, and rising remarriage have dramatically
changed the fabric of American families and influenced children’s wellbeing. In this chapter, I
examined how family change evolved in the 2000s and how American families fared during the
Great Recession. Was there evidence of “quieting” of family change (Casper and Bianchi 2002)?
Or was there evidence of continued marriage decline? The answer is not straightforward. We
witnessed both “quieting” and continued change in America’s families over the 2000s. Yet,
importantly, American families have become Balkanized. Race/ethnicity, educational attainment,
and nativity status are important dimensions of variation and change, which have placed
American families divergent paths.
The evidence is strong that family change continued in the 2000s. Marriage was further
delayed and percent ever married by age 20s reached new lows in 2008-2010. Young men and
women continued to explore schools, jobs, and relationships and the Great Recession appeared to
37
have extended the period of exploration. Permanent singlehood by ages 50-54 also rose over the
period. Although individuals remained single for various reasons, larger shares were racial/ethnic
minorities and less educated individuals with inadequate economic resources. Meanwhile,
divorce and remarriage continued increasing. The continuity of family change suggests that
Americans are experiencing more marital transitions during the life course today than in the past
and marital unions have become more transitory (Cherlin 2004).
Yet, the 2000s also witnessed the halt of family change. Surge in cohabitation seen in the
past decades appeared to have stopped. There may be potential reasons for the halt. The impact
of the Great Recession might be severe enough that fewer men and women could afford
cohabitation, or cohabitation during the Great Recession became so volatile and short-lived that
the prevalence measure of cohabitation missed many short-term cohabitation episodes.
Alternatively, over the years, cohabitation may have emerged from a socially unacceptable living
arrangement to a widely accepted practice and has now become a permanent social institution
with established expectations and social norms, which could discourage people from forming
such relationships. Clearly, more research is needed to understand this new phenomenon. During
the 2000s, we also witnessed some stability of children’s living arrangement, at least as
measured by changing shares of children living in two-parent families. The percent of children
living in poverty also was little changed by type of living arrangement. This is good news
because any stability in children’s living arrangement presumably thwarted even larger increases
in the percent of children living in poverty during the Great Recession, when nearly 22 percent
of children were officially poor (DeNavas-Walt, Proctor, and Smith 2012).
A national portrait of family change misses a picture of growing diversity in American
families. The diversity is strong by race/ethnicity, educational attainment, and nativity status.
38
U.S.-born non-Hispanic whites delayed marriage in a similar way as racial/ethnic minorities but
had higher rates of marriage and cohabitation, low divorce to marriage ratios (second only to
Asian Americans), relatively large shares of remarriage. U.S.-born whites were most likely to be
in relationships, whether they are cohabitation, first marriage, or remarriage. Part of the reason is
that U.S.-born whites were the most numerous racial group. Although interracial marriage
increased rapidly in recent decades, most Americans searched for spouses or partners within their
own racial/ethnic groups (Qian and Lichter 2007). A large marriage market provided white
Americans ample opportunities to find a suitable partner or spouse for cohabitation or marriage
(Lichter, LeClere, and McLaughlin 1991). Of course, the size of a marriage market is only one
sufficient condition. Another reason is that white Americans face fewer structural barriers during
the life course than racial/ethnic minorities, regardless of socioeconomic status, which gives
whites more time to explore relationships and build families. In addition, socioeconomic status
matters. More U.S.-born whites have college education—another factor associated with high
levels of marriage and cohabitation and low levels of divorce. As a result, most white children
lived in working father/non-working mother or dual earner families and the percent of white
children living in poverty was among the lowest across all living arrangements.
At the other end of the spectrum are African Americans, who had the lowest percent ever
married at every age group, highest percent of permanent singlehood by ages 50-54, lower levels
of cohabitation, highest divorce to marriage ratios, and a larger share of remarriages. As a result,
African Americans were least likely to be in formal marital or cohabiting relationships. This is in
large part due to poor economic circumstances of African Americans. Unemployment,
underemployment, and poor economic prospects among African American men have a strong
negative effect on union formation and stability (McLanahan and Percheski 2008).
39
Consequently, African American children had the lowest percent living in working father/non-
working mother or dual earner families and the highest percent living in female-headed single
families. Children in female-headed single families had the highest percent living in poverty and,
unfortunately, such disadvantages are likely to exacerbate further racial/ethnic inequalities
(McLanahan and Percheski 2008).
In the 2000s, American families became more diversified by educational attainment.
Individuals with less education married and cohabited at lower levels and divorced at higher
levels despite low marriage rates. The growing racial/ethnic and educational divide in American
families had a lot to do with economic resources, a factor that was especially important during
the Great Recession. Historically disadvantaged minorities retreated not only from marriage but
also from cohabitation. While America’s retreat from marriage is no longer a surprise, the
slowdown in the prevalence of cohabitation is relatively a new phenomenon. As discussed
above, the Great Recession may have made cohabitation an expensive living arrangement as
more young men and women with poor economic resources returned homes to live with their
parents (Qian 2012).2
Immigrants often come from countries in which marriage and family are highly valued. It
is indeed true that immigrants regardless of educational attainment and race/ethnicity tend to be
married at a higher percent, cohabit at a lower percent (except for Hispanic immigrants), divorce
at a lower percent, and remarry at a lower percent compared with their U.S.-born counterparts.
Thus, immigrants are unlikely to experience multiple marital transitions — An overwhelming
majority married, stayed married, or remained divorced among the few who failed the first
marriage. Clearly, immigrants presented another divergent path of American families— a path 2If young people live with their parents and continue to cohabit, we would miss those cohabitations. Such cohabiting couples would be considered living in subfamilies of their parents’ households. American Community Surveys do not collect information on cohabiting couples living in subfamilies.
40
toward traditional families—and are likely to slow down the retreat from marriage and
cohabitation among blacks and less educated individuals. Yet, although immigrant children have
a much higher percent living in married couple families, the risk of living in poverty is much
greater because more married couple immigrant families are working poor. Due to fewer
economic resources, immigrant children and later generation immigrants are likely to adopt
American ways of marriage and family life, rather quickly, especially those of racial/ethnic
minorities and with less education. As a result, it casts doubt about whether immigrants’ push
towards traditional families is strong. It is likely that the path toward traditional families occurs
only among immigrants and the immigration effect is not long lasting.
The analysis in this chapter sheds light on America’s families in the future. One thing is
clear: American families are diverse and we can no longer describe and document a typical
American family. On the one hand, American families are resilient and strong. Despite poorer
economic conditions for most Americans during the Great Recession, marriage, as a social
institution, remains strong, and children’s living arrangement is stable. On the other hand,
marital unions have become increasingly transitory, with more individuals living in cohabiting
relationships and single families, and the relationship instability often puts children’s wellbeing
at risk. The polarization of American families raises the concern not so much because American
families have become more diverse but more because they are diverse along racial/ethnic and
economic lines. African Americans and individuals with fewer years of schooling are likely to
live in single families and make multiple relationship transitions. Economic inequality is key to
the polarization of American families and the disadvantages of children living in single and
unstable families are likely to reproduce and exacerbate class and racial/ethnic inequalities (Edin
2000; Ellwood and Jencks 2004; McLanahan and Percheski 2008).
41
Family diversity along racial/ethnic and class (as measured by educational attainment)
lines has important implications for America’s children. Marriage is selective of those who are
white and have high levels of education (Blackwell and Lichter 2004; Charles, Hurst, and
Killewald 2013). Married couples who have high levels of educational attainment tend to have
stable marriages. The selection of marriage and marriage itself benefit their children. These
children have financial resources, enjoy time with both parents, reside in comfortable
neighborhoods, attend good schools, enjoy extracurricular activities, and go to colleges and have
successful careers when they grow up (Ginther and Pollak 2004). In contrast, less educated
individuals and African Americans are least likely to marry. Their children tend to live in single
parent families or experience their parents’ multiple transitory marital or cohabiting unions. A
greater share of these children lives in poverty, performs poorly in school, and has difficulties
finding and securing jobs when they grow up (Downey, Ainsworth, and Qian 2009; Ellwood and
Jencks 2004). The contrast between these two groups of children became much sharper today,
possibly as a result of the Great Recession.
There is no doubt that the gap between America’s haves and have-nots grew larger than
ever during the 2000s (Grusky, Western, and Wimer 2011). This gap has shaped American
families in multiple ways. It influences the kind of families we live in and the kind of family
environment we raise our children. As a result, some children excel while others lag behind.
Unfortunately, public support for all America’s children, especially those who lag behind, is
often weak. While marriage promotion may encourage couples to marry and raise a family, it
does not solve the deep-rooted economic hardship of the have-nots. Now may be the time to
have government polices in place to help the needs of children growing up in disadvantaged
families.
42
References
Amato, Paul R. 2010. "Research on Divorce: Continuing Trends and New Developments." Journal of Marriage and Family 72:650-66.
Amato, Paul R., Alan Booth, David R. Johnson, and Stacy J. Rogers. 2007. Alone Together: How Marriage in America Is Changing. Cambridge: Harvard University Press.
Arnett, Jeffrey Jensen. 2004. Emerging Adulthood: The Winding Road from the Late Teens Through the Twenties Oxford University Press.
Axinn, William G. and Arland Thornton. 1992. "The Relationship between Cohabitation and Divorce: Selectivity or Causal Influence?" Demography 29:357-74.
Blackwell, Debra L. and Daniel T. Lichter. 2004. "Homogamy among Dating, Cohabiting, and Married Couples." The Sociological Quarterly 45:719-37.
Brien, Michael J. 1997. "Racial Differences in Marriage and the Role of Marriage Markets." The Journal of Human Resources 32:741-778.
Brown, Susan L. , Gary R. Lee, and Jennifer Roebuck Bulanda. 2006. "Cohabitation Among Older Adults: A National Portrait." Journal of Gerontology: Social Sciences 61:S71-S79.
Buchmann, Claudia and Thomas A. DiPrete. 2006. "The Growing Female Advantage in College Completion: The Role of Parental Resources and Academic Achievement." American Sociological Review 71:515-541.
Buchmann, Claudia, Thomas A. DiPrete, and Anne McDaniel. 2008. "Gender Inequalities in Education." Annual Review of Sociology 34:319-37.
Bulanda, R.E. and Wendy D. Manning. 2008. "Parental Cohabitation Experiences and Adolescent Behavioral Outcomes." Population Research and Policy Review 27:593-618.
Bumpass, Larry L. and Hsien-Hen Lu. 2000. "Trends in Cohabitation and Implications for Children's Family Contexts." Population Studies 54:29-41.
Casper, Lynne M. and Suzanne M. Bianchi. 2002. Continuity and Change in the American Family. Thousand Oaks, CA: Sage Publications.
Charles, K. K., E. Hurst, and A. Killewald. 2013. "Marital sorting and parental wealth." Demography 50:51-70.
Cherlin, Andrew J. 1992. Marriage, Divorce, Remarriage: Revised and Enlarged Edition. Cambridge: Harvard University Press.
—. 1999. "Going to Extremes: Family Structure, Children's Well-Being, and Social Science." Demography 36:421-428.
—. 2004. "The Deinstitutionalization of American Marriage." Journal of Marriage and Family 66:848-861.
—. 2009. The Marriage-Go-Round: The State of Marriage and Family in America Today. New York: Random House.
43
Cherlin, Andrew J., Erin Cumberworth, S. Philip Morgan, and Christopher Wimer. Forthcoming. "The Effects of the Great Recession on Family Life." Annals of the American Academy of Political and Social Science
Clark, Rebecca L., Jennifer E. Glick, and Regina M. Bures. 2009. "Immigrant Families over the Life Course: Research Directions and Needs." Journal of Family Issues 30:852-72.
DeNavas-Walt, Carmen, Bernadette D. Proctor, and Jessica C. Smith. 2012. "Income, Poverty, and Health Insurance Coverage in the United States: 2011." in Current Population Reports: U.S. Census Bureau.
Downey, Douglas B., James W. Ainsworth, and Zhenchao Qian. 2009. "Rethinking the Attitude-Achievement Paradox Among Blacks." Sociology of Education 82:1-19.
Dunifon, Rachel and Ashish Bajracharya. 2012. "The Role of Grantparents in the Lives of Youth." Journal of Family Issues 33:1168-1194.
Edin, Kathryn. 2000. "What Do Low-Income Single Mothers Say About Marriage?" Social Problems 47:112-133.
Ellwood, David T. and Christopher Jencks. 2004. "The Uneven Spread of Single-Parent Families: What Do We Know? Where Do We Look for Answers?" Pp. 3-77 in Social Inequality, edited by K. M. Neckerman. New York: Russell Sage Foundation.
Furstenberg, Frank F.Jr. and Andrew J. Cherlin. 1991. Divided Families: What Happens to Children When Parents Part. Cambridge: Harvard University Press.
Ginther, Donna K. and Robert A. Pollak. 2004. "Family Structure and Children's Educational Outcomes: Blended Families, Stylized Facts, and Descriptive Regressions." Demography 41:671-696.
Goldman, Noreen, Charles Westoff, and Charles Hammerslough. 1984. "Demography of the Marriage Market in the United States." Population Index 50:5-25.
Grieco, Elizabeth M., Yesenia D. Acosta, G. Patricia de la Cruz, Christine Gambino, Thomas Gryn, Luke J. Larsen, Edward N. Trevelyan, and Nathan P. Walters. 2012. "The Foreign-Born Population in the United States: 2010." United States Census Bureau.
Grusky, David B., Bruce Western, and Christopher Wimer. 2011. The Great Recession. New York: Russell Sage Foundation.
Heaton, Tim B. 2002. "Factors Contributing Increasing Marital Instability in the United States." Journal of Family Issues 23:392-409.
Isen, Adam and Betsey Stevenson. 2010. "Women's Education and Family Behavior: Trends in Marriage, Divorce, and Fertility." NBER Working Papers.
Landale, Nancy S. and Katherine Fennelly. 1992. "Informal Unions among Mainland Puerto Ricans: Cohabitation or an Alternative to Legal Marriage?" Journal of Marriage and the Family 54:269-280.
Lee, Jennifer and Frank D. Bean. 2010. The Diversity Paradox: Immigration and the Color Line in Twenty-First Century America. New York: Russell Sage Foundation.
44
Lichter, Daniel T., Julie H. Carmalt, and Zhenchao Qian. 2011. "Immigration and Intermarriage among Hispanics: Crossing Racial and Generational Boundaries." Sociological Forum 26:241-64.
Lichter, Daniel T., Deborah Roempke Graefe, and J. Brian Brown. 2003. "Is Marriage a Panacea? Union Formation Among Economically Disadvantaged Unwed Mothers." Social Problems 50:68-86.
Lichter, Daniel T., Felicia B. LeClere, and Diane K. McLaughlin. 1991. "Local Marriage Markets and Marital Behavior of Black and White Women." American Journal of Sociology 96:843-867.
Lichter, Daniel T. and Zhenchao Qian. 2004. Marriage and Family in a Multiracial Society, Edited by R. Farley and J. Haaga. New York and Washington DC: Russell Sage Foundation and Population Reference Bureau.
—. 2008. "Serial Cohabitation and the Marital Life Course." Journal of Marriage and Family 70:861-78.
Lichter, Daniel T., Zhenchao Qian, and Martha L. Crowley. 2005. "Child Poverty among Racial Minorities and Immigrants: Explaining Trends and Differentials." Social Science Quarterly 86:1037-1059.
Lichter, Daniel T., Zhenchao Qian, and Leanna M. Mellott. 2006. "Marriage or Dissolution? Union Transitions among Poor Cohabiting Women." Demography 43:223-240.
Lu, Bo, Zhenchao Qian, Anna Cunningham, and Chih-Lin Li. 2012. "Estimating the Effect of Premarital Cohabitation on Timing of Marital Disruption: Using Propensity Score Matching in Event History Analysis." Sociological Methods & Research 41:440-46.
Luo, Ye, Tracey A. LaPierre, Mary Elizabeth Hughes, and Linda J. Waite. 2012. "Grandparents Providing Care to Grandchildren: A Population-Based Study of Continuity and Change." Journal of Family Issues 33:1143-1167.
Manning, Wendy D. and Susan Brown. 2006. "Children’s Economic Well-Being in Married and Cohabiting Parent Families." Journal of Marriage and Family 68:345-362.
Manning, Wendy D. and Jessica A. Cohen. 2012. "Premarital Cohabitation and Marital Dissolution: An Examination of Recent Marriages." Journal of Marriage and Family 74:377-387.
Manning, Wendy D. and Pamela J. Smock. 1997. "Children's Living Arrangements in Unmarried-Mother Families." Journal of Family Issues 18:526-544.
—. 2005. "Measuring and Modeling Cohabitation: New Perspectives from Qualitative Data." Journal of Marriage and Family 67:989-1002.
Martin, Steven P. 2006. "Trends in Marital Dissolution by Women's Education in the United States." Demographic Research 15:537-560.
McLanahan, Sara. 2004. "Divergent Destinies: How Children Are Faring Under the Second Demographic Transition." Demography 41:607-627.
45
McLanahan, Sara and Lynn Casper. 1995. "Growing Diversity and Inequality in the American Family." Pp. 1-45 in State of the Union: America in the 1990s, vol. II, edited by R. Farley. New York: Russell Sage Foundation.
McLanahan, Sara and Christine Percheski. 2008. "Family Structure and the Reproduction of Inequalities." Annual Review of Sociology 34.
Morgan, S. Philip, Erin Cumberworth, and Christopher Wimer. 2011. "The Great Recession's Influnece on Fertility, Marriage, Divorce, and Cohabitation." in The Great Recession, edited by D. B. Grusky, B. Western, and C. Wimer. New York: Russell Sage Foundation.
Oropesa, R.S. and Bridget K. Gorman. 2000. "Ethnicity, Immigration, and Beliefs about Marriage as a 'Tie That Binds'." Pp. 188-211 in The Ties that Bind, edited by L. J. Waite. New York: Aldin de Gruyter.
Preston, Samuel H. 1984. "Children and the Elderly: Divergent Paths for America's Dependents." Demography 21:435-457.
Qian, Zhenchao. 1998. "Changes in Assortative Mating: the Impact of Age and Education, 1970-1990." Demography 35:279-292.
—. 2012. "During the Great Recession, More Young Adults Lived with Parents." in Census Brief for Project US 2010 at http://www.s4.brown.edu/us2010.
Qian, Zhenchao and Daniel T. Lichter. 2007. "Social Boundaries and Marital Assimilation: Interpreting Trends in Racial and Ethnic Intermarriage." American Sociological Review 72:68-94.
Raley, R. Kelly. 2001. "Increasing Fertility in Cohabiting Unions: Evidence of the Second Demographic Transition in the United States." Demography 38:59-66.
Saenz, Rogelio. 2004. Latinos and the Changing Face of America, Edited by R. Farley and J. Haaga. New York and Washington DC: Russell Sage Foundation and Population Reference Bureau.
Sassler, Sharon and James McNally. 2003. "Cohabiting Couples' Economic Circumstances and Union Transitions: A Re-Examination Using Multiple Imputation Techniques." Social Science Research 32:553-578.
Sassler, Sharon, Amanda Miller, and Sarah Favinger. 2009. "Planned Parenthood? Fertility Intentions and Experiences among Cohabiting Couples." Journal of Family Issues 30:206-232.
Schwartz, Christine R. and Robert D. Mare. 2005. "Trends in Educational Assortative Marriage From 1940 To 2003." Demography 42:621-646.
Shafer, Kevin. 2012. "Unique Matching Patterns in Remarraige: Educational Assortative Mating among Divorced Men and Women." Journal of Family Issues.
Smock, Pamela J. 2000. "Cohabitation in the United States: An Appraisal of Research Themes, Findings, and Implications." Annual Review of Sociology 26:1-20.
Stevens, Gillian, Hiromi Ishizawa, and Xavier Escandell. 2012. "Marrying Into the American Population: Pathways into Cross-Nativity Marraiges." International Migration Review 46:740-59.
46
Stevenson, Betsey and Justin Wolfers. 2007. "Marriage and Divorce: Changes and their Driving Forces." Journal of Economic Perspectives 21:27-52.
Sweeney, Megan M. 1997. "Remarriage of Women and Men after Divorce: The Role of Socioeconomic Prospects." Journal of Family Issues 18:479-502.
Sweeney, Megan M. and Maria Cancian. 2004. "The Changing Importance of White Women's Economic Prospects for Assortative Mating." Journal of Marriage and Family 66:1015-28.
Sweeney, Megan M. and Julie A. Phillips. 2004. "Understanding Racial Differences in Marital Disruption: Recent Trends and Explanations." Journal of Marriage and Family 66:639-650.
Thomson, Elizabeth and Ugo Colella. 1992. "Cohabitation and Marital Stability: Quality and Commitment?" Journal of Marriage and the Family 54:259-267.
Thornton, Arland and L. Young-DeMarco. 2001. "Four Decades of Trends in Attitudes Toward Family Issues in the United States: the 1960s through the 1990s." Journal of Marriage and Family 63:1009-37.
U.S. Census Bureau. 2003. Statistical Abstract of the United States, 2002. Washington, D.C.: Government Printing Office.
—. 2010. Statistical Abstract of the United States. Washington DC: Government Printing Office.
Waite, Linda J. 1995. "Does Marriage Matter?" Demography 32:483-507.
Waite, Linda J. and Maggie Gallagher. 2000. The Case for Marriage: Why Married People Are Happier, Healthier, and Better Off Financially. New York: Doubleday.
Xie, Yu and Kimberly A. Goyette. 2004. A Demographic Portrait of Asian Americans. New York and Washington DC: Russell Sage Foundation and Population Reference Bureau.
Xie, Yu, James M. Raymo, Kimberly Goyette, and Arland Thornton. 2003. "Economic Potential and Entry into Marriage and Cohabitation." Demography 40:351-367.
Zhou, Min and Carl L. Bankston, III. 1998. Growing Up American: How Vietnamese Children Adapt to Life in the United States. New York: Russell Sage Foundation.