Embed Size (px)
Citation preview
Demographia United States Metropolitan Area
International Migration Report: 2000-2005
March 2006
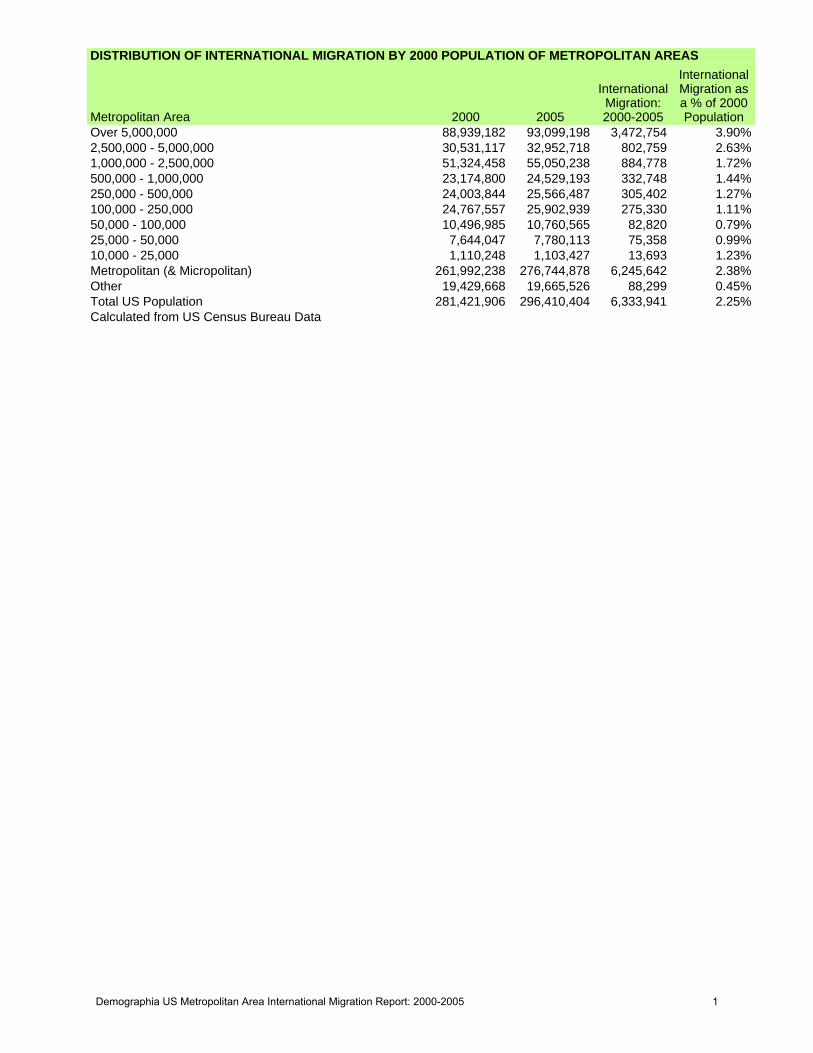
DISTRIBUTION OF INTERNATIONAL MIGRATION BY 2000 POPULATION OF METROPOLITAN AREAS
Metropolitan Area 2000 2005
InternationalMigration:2000-2005
InternationalMigration asa % of 2000Population
Over 5,000,000 88,939,182 93,099,198 3,472,754 3.90%2,500,000 - 5,000,000 30,531,117 32,952,718 802,759 2.63%1,000,000 - 2,500,000 51,324,458 55,050,238 884,778 1.72%500,000 - 1,000,000 23,174,800 24,529,193 332,748 1.44%250,000 - 500,000 24,003,844 25,566,487 305,402 1.27%100,000 - 250,000 24,767,557 25,902,939 275,330 1.11%50,000 - 100,000 10,496,985 10,760,565 82,820 0.79%25,000 - 50,000 7,644,047 7,780,113 75,358 0.99%10,000 - 25,000 1,110,248 1,103,427 13,693 1.23%Metropolitan (& Micropolitan) 261,992,238 276,744,878 6,245,642 2.38%Other 19,429,668 19,665,526 88,299 0.45%Total US Population 281,421,906 296,410,404 6,333,941 2.25%Calculated from US Census Bureau Data
Demographia US Metropolitan Area International Migration Report: 2000-2005 1
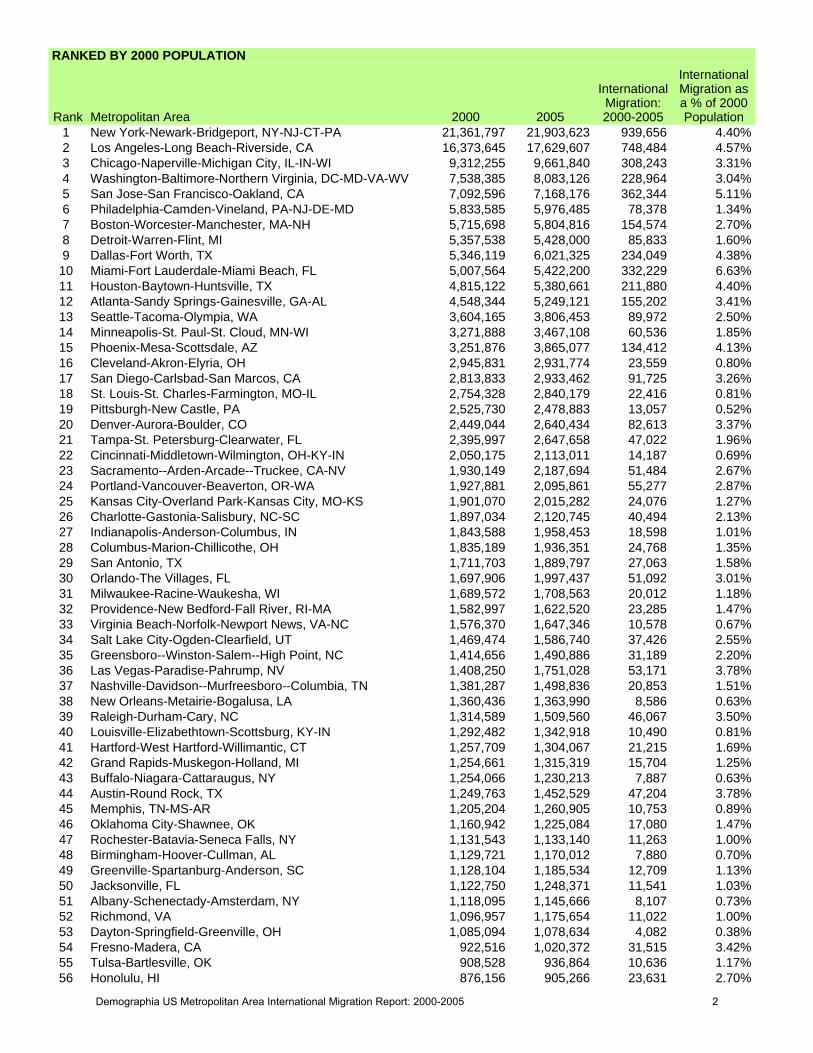
RANKED BY 2000 POPULATION
Rank Metropolitan Area 2000 2005
InternationalMigration:2000-2005
InternationalMigration asa % of 2000Population
1 New York-Newark-Bridgeport, NY-NJ-CT-PA 21,361,797 21,903,623 939,656 4.40%2 Los Angeles-Long Beach-Riverside, CA 16,373,645 17,629,607 748,484 4.57%3 Chicago-Naperville-Michigan City, IL-IN-WI 9,312,255 9,661,840 308,243 3.31%4 Washington-Baltimore-Northern Virginia, DC-MD-VA-WV 7,538,385 8,083,126 228,964 3.04%5 San Jose-San Francisco-Oakland, CA 7,092,596 7,168,176 362,344 5.11%6 Philadelphia-Camden-Vineland, PA-NJ-DE-MD 5,833,585 5,976,485 78,378 1.34%7 Boston-Worcester-Manchester, MA-NH 5,715,698 5,804,816 154,574 2.70%8 Detroit-Warren-Flint, MI 5,357,538 5,428,000 85,833 1.60%9 Dallas-Fort Worth, TX 5,346,119 6,021,325 234,049 4.38%10 Miami-Fort Lauderdale-Miami Beach, FL 5,007,564 5,422,200 332,229 6.63%11 Houston-Baytown-Huntsville, TX 4,815,122 5,380,661 211,880 4.40%12 Atlanta-Sandy Springs-Gainesville, GA-AL 4,548,344 5,249,121 155,202 3.41%13 Seattle-Tacoma-Olympia, WA 3,604,165 3,806,453 89,972 2.50%14 Minneapolis-St. Paul-St. Cloud, MN-WI 3,271,888 3,467,108 60,536 1.85%15 Phoenix-Mesa-Scottsdale, AZ 3,251,876 3,865,077 134,412 4.13%16 Cleveland-Akron-Elyria, OH 2,945,831 2,931,774 23,559 0.80%17 San Diego-Carlsbad-San Marcos, CA 2,813,833 2,933,462 91,725 3.26%18 St. Louis-St. Charles-Farmington, MO-IL 2,754,328 2,840,179 22,416 0.81%19 Pittsburgh-New Castle, PA 2,525,730 2,478,883 13,057 0.52%20 Denver-Aurora-Boulder, CO 2,449,044 2,640,434 82,613 3.37%21 Tampa-St. Petersburg-Clearwater, FL 2,395,997 2,647,658 47,022 1.96%22 Cincinnati-Middletown-Wilmington, OH-KY-IN 2,050,175 2,113,011 14,187 0.69%23 Sacramento--Arden-Arcade--Truckee, CA-NV 1,930,149 2,187,694 51,484 2.67%24 Portland-Vancouver-Beaverton, OR-WA 1,927,881 2,095,861 55,277 2.87%25 Kansas City-Overland Park-Kansas City, MO-KS 1,901,070 2,015,282 24,076 1.27%26 Charlotte-Gastonia-Salisbury, NC-SC 1,897,034 2,120,745 40,494 2.13%27 Indianapolis-Anderson-Columbus, IN 1,843,588 1,958,453 18,598 1.01%28 Columbus-Marion-Chillicothe, OH 1,835,189 1,936,351 24,768 1.35%29 San Antonio, TX 1,711,703 1,889,797 27,063 1.58%30 Orlando-The Villages, FL 1,697,906 1,997,437 51,092 3.01%31 Milwaukee-Racine-Waukesha, WI 1,689,572 1,708,563 20,012 1.18%32 Providence-New Bedford-Fall River, RI-MA 1,582,997 1,622,520 23,285 1.47%33 Virginia Beach-Norfolk-Newport News, VA-NC 1,576,370 1,647,346 10,578 0.67%34 Salt Lake City-Ogden-Clearfield, UT 1,469,474 1,586,740 37,426 2.55%35 Greensboro--Winston-Salem--High Point, NC 1,414,656 1,490,886 31,189 2.20%36 Las Vegas-Paradise-Pahrump, NV 1,408,250 1,751,028 53,171 3.78%37 Nashville-Davidson--Murfreesboro--Columbia, TN 1,381,287 1,498,836 20,853 1.51%38 New Orleans-Metairie-Bogalusa, LA 1,360,436 1,363,990 8,586 0.63%39 Raleigh-Durham-Cary, NC 1,314,589 1,509,560 46,067 3.50%40 Louisville-Elizabethtown-Scottsburg, KY-IN 1,292,482 1,342,918 10,490 0.81%41 Hartford-West Hartford-Willimantic, CT 1,257,709 1,304,067 21,215 1.69%42 Grand Rapids-Muskegon-Holland, MI 1,254,661 1,315,319 15,704 1.25%43 Buffalo-Niagara-Cattaraugus, NY 1,254,066 1,230,213 7,887 0.63%44 Austin-Round Rock, TX 1,249,763 1,452,529 47,204 3.78%45 Memphis, TN-MS-AR 1,205,204 1,260,905 10,753 0.89%46 Oklahoma City-Shawnee, OK 1,160,942 1,225,084 17,080 1.47%47 Rochester-Batavia-Seneca Falls, NY 1,131,543 1,133,140 11,263 1.00%48 Birmingham-Hoover-Cullman, AL 1,129,721 1,170,012 7,880 0.70%49 Greenville-Spartanburg-Anderson, SC 1,128,104 1,185,534 12,709 1.13%50 Jacksonville, FL 1,122,750 1,248,371 11,541 1.03%51 Albany-Schenectady-Amsterdam, NY 1,118,095 1,145,666 8,107 0.73%52 Richmond, VA 1,096,957 1,175,654 11,022 1.00%53 Dayton-Springfield-Greenville, OH 1,085,094 1,078,634 4,082 0.38%54 Fresno-Madera, CA 922,516 1,020,372 31,515 3.42%55 Tulsa-Bartlesville, OK 908,528 936,864 10,636 1.17%56 Honolulu, HI 876,156 905,266 23,631 2.70%
Demographia US Metropolitan Area International Migration Report: 2000-2005 2
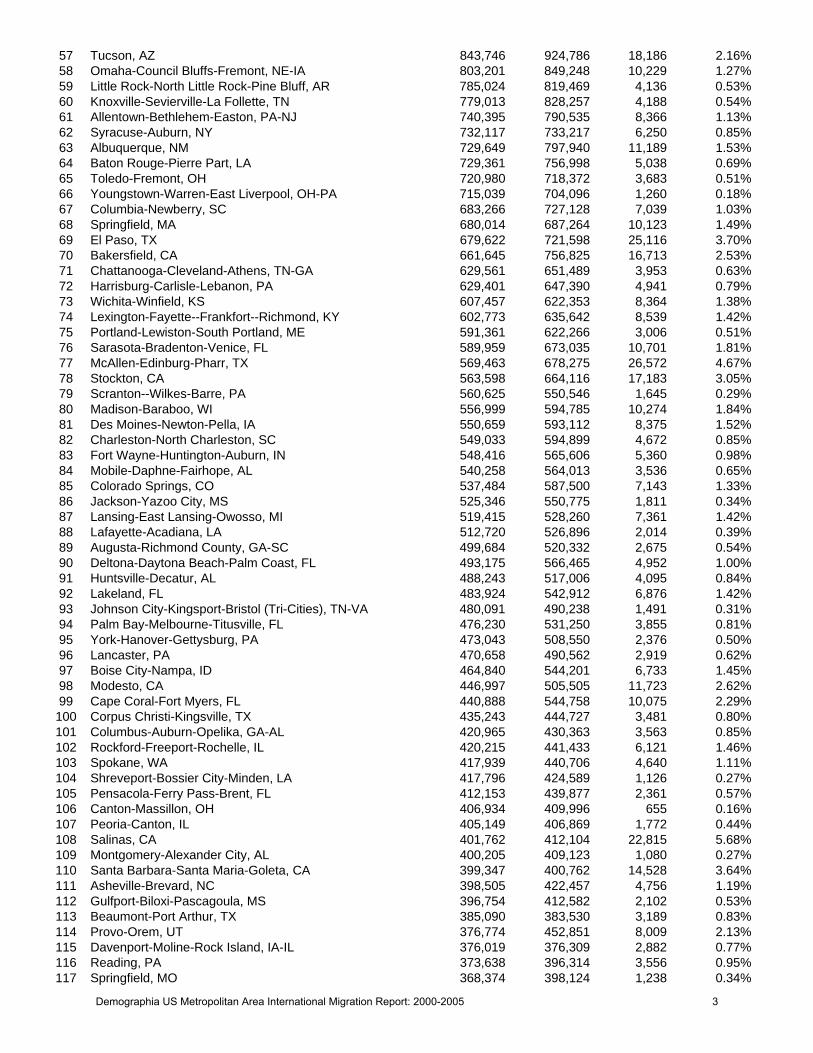
57 Tucson, AZ 843,746 924,786 18,186 2.16%58 Omaha-Council Bluffs-Fremont, NE-IA 803,201 849,248 10,229 1.27%59 Little Rock-North Little Rock-Pine Bluff, AR 785,024 819,469 4,136 0.53%60 Knoxville-Sevierville-La Follette, TN 779,013 828,257 4,188 0.54%61 Allentown-Bethlehem-Easton, PA-NJ 740,395 790,535 8,366 1.13%62 Syracuse-Auburn, NY 732,117 733,217 6,250 0.85%63 Albuquerque, NM 729,649 797,940 11,189 1.53%64 Baton Rouge-Pierre Part, LA 729,361 756,998 5,038 0.69%65 Toledo-Fremont, OH 720,980 718,372 3,683 0.51%66 Youngstown-Warren-East Liverpool, OH-PA 715,039 704,096 1,260 0.18%67 Columbia-Newberry, SC 683,266 727,128 7,039 1.03%68 Springfield, MA 680,014 687,264 10,123 1.49%69 El Paso, TX 679,622 721,598 25,116 3.70%70 Bakersfield, CA 661,645 756,825 16,713 2.53%71 Chattanooga-Cleveland-Athens, TN-GA 629,561 651,489 3,953 0.63%72 Harrisburg-Carlisle-Lebanon, PA 629,401 647,390 4,941 0.79%73 Wichita-Winfield, KS 607,457 622,353 8,364 1.38%74 Lexington-Fayette--Frankfort--Richmond, KY 602,773 635,642 8,539 1.42%75 Portland-Lewiston-South Portland, ME 591,361 622,266 3,006 0.51%76 Sarasota-Bradenton-Venice, FL 589,959 673,035 10,701 1.81%77 McAllen-Edinburg-Pharr, TX 569,463 678,275 26,572 4.67%78 Stockton, CA 563,598 664,116 17,183 3.05%79 Scranton--Wilkes-Barre, PA 560,625 550,546 1,645 0.29%80 Madison-Baraboo, WI 556,999 594,785 10,274 1.84%81 Des Moines-Newton-Pella, IA 550,659 593,112 8,375 1.52%82 Charleston-North Charleston, SC 549,033 594,899 4,672 0.85%83 Fort Wayne-Huntington-Auburn, IN 548,416 565,606 5,360 0.98%84 Mobile-Daphne-Fairhope, AL 540,258 564,013 3,536 0.65%85 Colorado Springs, CO 537,484 587,500 7,143 1.33%86 Jackson-Yazoo City, MS 525,346 550,775 1,811 0.34%87 Lansing-East Lansing-Owosso, MI 519,415 528,260 7,361 1.42%88 Lafayette-Acadiana, LA 512,720 526,896 2,014 0.39%89 Augusta-Richmond County, GA-SC 499,684 520,332 2,675 0.54%90 Deltona-Daytona Beach-Palm Coast, FL 493,175 566,465 4,952 1.00%91 Huntsville-Decatur, AL 488,243 517,006 4,095 0.84%92 Lakeland, FL 483,924 542,912 6,876 1.42%93 Johnson City-Kingsport-Bristol (Tri-Cities), TN-VA 480,091 490,238 1,491 0.31%94 Palm Bay-Melbourne-Titusville, FL 476,230 531,250 3,855 0.81%95 York-Hanover-Gettysburg, PA 473,043 508,550 2,376 0.50%96 Lancaster, PA 470,658 490,562 2,919 0.62%97 Boise City-Nampa, ID 464,840 544,201 6,733 1.45%98 Modesto, CA 446,997 505,505 11,723 2.62%99 Cape Coral-Fort Myers, FL 440,888 544,758 10,075 2.29%100 Corpus Christi-Kingsville, TX 435,243 444,727 3,481 0.80%101 Columbus-Auburn-Opelika, GA-AL 420,965 430,363 3,563 0.85%102 Rockford-Freeport-Rochelle, IL 420,215 441,433 6,121 1.46%103 Spokane, WA 417,939 440,706 4,640 1.11%104 Shreveport-Bossier City-Minden, LA 417,796 424,589 1,126 0.27%105 Pensacola-Ferry Pass-Brent, FL 412,153 439,877 2,361 0.57%106 Canton-Massillon, OH 406,934 409,996 655 0.16%107 Peoria-Canton, IL 405,149 406,869 1,772 0.44%108 Salinas, CA 401,762 412,104 22,815 5.68%109 Montgomery-Alexander City, AL 400,205 409,123 1,080 0.27%110 Santa Barbara-Santa Maria-Goleta, CA 399,347 400,762 14,528 3.64%111 Asheville-Brevard, NC 398,505 422,457 4,756 1.19%112 Gulfport-Biloxi-Pascagoula, MS 396,754 412,582 2,102 0.53%113 Beaumont-Port Arthur, TX 385,090 383,530 3,189 0.83%114 Provo-Orem, UT 376,774 452,851 8,009 2.13%115 Davenport-Moline-Rock Island, IA-IL 376,019 376,309 2,882 0.77%116 Reading, PA 373,638 396,314 3,556 0.95%117 Springfield, MO 368,374 398,124 1,238 0.34%
Demographia US Metropolitan Area International Migration Report: 2000-2005 3
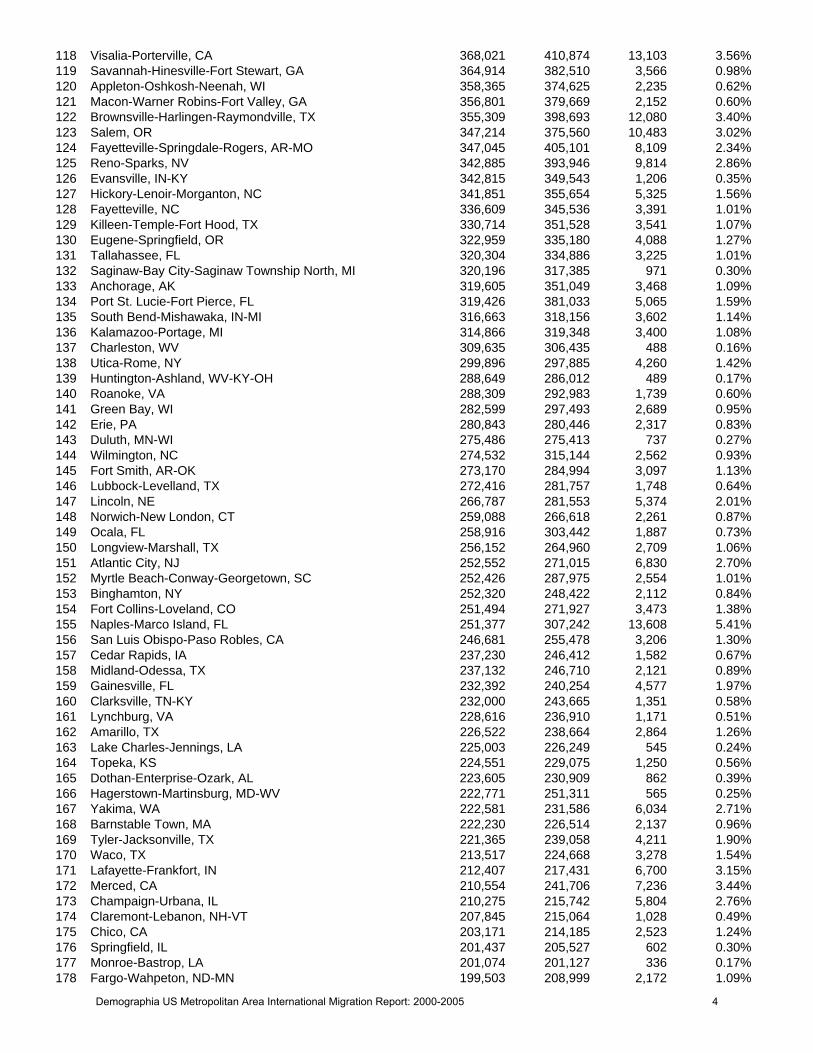
118 Visalia-Porterville, CA 368,021 410,874 13,103 3.56%119 Savannah-Hinesville-Fort Stewart, GA 364,914 382,510 3,566 0.98%120 Appleton-Oshkosh-Neenah, WI 358,365 374,625 2,235 0.62%121 Macon-Warner Robins-Fort Valley, GA 356,801 379,669 2,152 0.60%122 Brownsville-Harlingen-Raymondville, TX 355,309 398,693 12,080 3.40%123 Salem, OR 347,214 375,560 10,483 3.02%124 Fayetteville-Springdale-Rogers, AR-MO 347,045 405,101 8,109 2.34%125 Reno-Sparks, NV 342,885 393,946 9,814 2.86%126 Evansville, IN-KY 342,815 349,543 1,206 0.35%127 Hickory-Lenoir-Morganton, NC 341,851 355,654 5,325 1.56%128 Fayetteville, NC 336,609 345,536 3,391 1.01%129 Killeen-Temple-Fort Hood, TX 330,714 351,528 3,541 1.07%130 Eugene-Springfield, OR 322,959 335,180 4,088 1.27%131 Tallahassee, FL 320,304 334,886 3,225 1.01%132 Saginaw-Bay City-Saginaw Township North, MI 320,196 317,385 971 0.30%133 Anchorage, AK 319,605 351,049 3,468 1.09%134 Port St. Lucie-Fort Pierce, FL 319,426 381,033 5,065 1.59%135 South Bend-Mishawaka, IN-MI 316,663 318,156 3,602 1.14%136 Kalamazoo-Portage, MI 314,866 319,348 3,400 1.08%137 Charleston, WV 309,635 306,435 488 0.16%138 Utica-Rome, NY 299,896 297,885 4,260 1.42%139 Huntington-Ashland, WV-KY-OH 288,649 286,012 489 0.17%140 Roanoke, VA 288,309 292,983 1,739 0.60%141 Green Bay, WI 282,599 297,493 2,689 0.95%142 Erie, PA 280,843 280,446 2,317 0.83%143 Duluth, MN-WI 275,486 275,413 737 0.27%144 Wilmington, NC 274,532 315,144 2,562 0.93%145 Fort Smith, AR-OK 273,170 284,994 3,097 1.13%146 Lubbock-Levelland, TX 272,416 281,757 1,748 0.64%147 Lincoln, NE 266,787 281,553 5,374 2.01%148 Norwich-New London, CT 259,088 266,618 2,261 0.87%149 Ocala, FL 258,916 303,442 1,887 0.73%150 Longview-Marshall, TX 256,152 264,960 2,709 1.06%151 Atlantic City, NJ 252,552 271,015 6,830 2.70%152 Myrtle Beach-Conway-Georgetown, SC 252,426 287,975 2,554 1.01%153 Binghamton, NY 252,320 248,422 2,112 0.84%154 Fort Collins-Loveland, CO 251,494 271,927 3,473 1.38%155 Naples-Marco Island, FL 251,377 307,242 13,608 5.41%156 San Luis Obispo-Paso Robles, CA 246,681 255,478 3,206 1.30%157 Cedar Rapids, IA 237,230 246,412 1,582 0.67%158 Midland-Odessa, TX 237,132 246,710 2,121 0.89%159 Gainesville, FL 232,392 240,254 4,577 1.97%160 Clarksville, TN-KY 232,000 243,665 1,351 0.58%161 Lynchburg, VA 228,616 236,910 1,171 0.51%162 Amarillo, TX 226,522 238,664 2,864 1.26%163 Lake Charles-Jennings, LA 225,003 226,249 545 0.24%164 Topeka, KS 224,551 229,075 1,250 0.56%165 Dothan-Enterprise-Ozark, AL 223,605 230,909 862 0.39%166 Hagerstown-Martinsburg, MD-WV 222,771 251,311 565 0.25%167 Yakima, WA 222,581 231,586 6,034 2.71%168 Barnstable Town, MA 222,230 226,514 2,137 0.96%169 Tyler-Jacksonville, TX 221,365 239,058 4,211 1.90%170 Waco, TX 213,517 224,668 3,278 1.54%171 Lafayette-Frankfort, IN 212,407 217,431 6,700 3.15%172 Merced, CA 210,554 241,706 7,236 3.44%173 Champaign-Urbana, IL 210,275 215,742 5,804 2.76%174 Claremont-Lebanon, NH-VT 207,845 215,064 1,028 0.49%175 Chico, CA 203,171 214,185 2,523 1.24%176 Springfield, IL 201,437 205,527 602 0.30%177 Monroe-Bastrop, LA 201,074 201,127 336 0.17%178 Fargo-Wahpeton, ND-MN 199,503 208,999 2,172 1.09%
Demographia US Metropolitan Area International Migration Report: 2000-2005 4
179 Burlington-South Burlington, VT 198,889 205,230 2,640 1.33%180 Houma-Bayou Cane-Thibodaux, LA 194,477 199,670 624 0.32%181 Florence, SC 193,155 198,443 585 0.30%182 Laredo, TX 193,117 224,695 9,258 4.79%183 Tuscaloosa, AL 192,034 196,885 1,308 0.68%184 Kennewick-Richland-Pasco, WA 191,822 220,961 6,019 3.14%185 Eau Claire-Menomonie, WI 188,195 195,747 642 0.34%186 Sioux Falls, SD 187,093 207,918 2,390 1.28%187 College Station-Bryan, TX 184,885 189,735 6,402 3.46%188 Lima-Van Wert-Wapakoneta, OH 184,743 182,630 321 0.17%189 Fond du Lac-Beaver Dam, WI 183,193 187,440 796 0.43%190 Elkhart-Goshen, IN 182,791 195,362 4,868 2.66%191 Medford, OR 181,269 195,322 1,498 0.83%192 Albany-Corvallis-Lebanon, OR 181,222 187,554 2,522 1.39%193 Greeley, CO 180,936 228,943 5,018 2.77%194 Mansfield-Bucyrus, OH 175,818 173,723 319 0.18%195 Bloomington, IN 175,506 177,709 3,078 1.75%196 Las Cruces, NM 174,682 189,444 4,321 2.47%197 Charlottesville, VA 174,021 188,424 3,197 1.84%198 Sunbury-Lewisburg-Selinsgrove, PA 173,726 173,948 465 0.27%199 Terre Haute, IN 170,943 168,059 778 0.46%200 Fort Walton Beach-Crestview-Destin, FL 170,498 182,172 1,045 0.61%201 Santa Fe-Espanola, NM 170,482 181,683 4,364 2.56%202 Prescott, AZ 167,517 198,701 1,922 1.15%203 Bellingham, WA 166,814 183,471 3,425 2.05%204 Athens-Clarke County, GA 166,079 175,085 4,125 2.48%205 Parkersburg-Marietta, WV-OH 164,624 162,529 164 0.10%206 Waterloo-Cedar Falls, IA 163,706 161,897 2,241 1.37%207 Rochester, MN 163,618 176,984 3,668 2.24%208 Redding, CA 163,256 179,904 665 0.41%209 Niles-Benton Harbor, MI 162,453 162,611 2,299 1.42%210 Abilene, TX 160,245 158,291 942 0.59%211 Yuma, AZ 160,026 181,277 6,151 3.84%212 Lumberton-Laurinburg, NC 159,337 164,766 2,674 1.68%213 Jackson, MI 158,422 163,629 592 0.37%214 Williamsport-Lock Haven, PA 157,958 155,834 219 0.14%215 Albany, GA 157,833 162,842 707 0.45%216 Joplin, MO 157,322 166,178 1,032 0.66%217 Morristown-Newport, TN 156,646 165,504 2,136 1.36%218 Seaford, DE 156,638 176,548 1,867 1.19%219 Sioux City-Vermillion, IA-NE-SD 156,590 155,566 3,242 2.07%220 Salisbury-Ocean Pines, MD 155,934 164,997 1,283 0.82%221 Jackson-Humboldt, TN 155,529 159,005 950 0.61%222 Wausau-Merrill, WI 155,475 159,260 659 0.42%223 Lake Havasu City-Kingman, AZ 155,032 187,200 1,667 1.08%224 Wheeling, WV-OH 153,172 148,677 200 0.13%225 Ottawa-Streator, IL 153,098 154,028 629 0.41%226 Greenville, NC 152,772 162,596 2,163 1.42%227 Johnstown, PA 152,598 148,073 302 0.20%228 Janesville, WI 152,307 157,538 1,517 1.00%229 Wichita Falls, TX 151,524 146,276 1,317 0.87%230 Blacksburg-Christiansburg-Radford, VA 151,272 151,057 2,375 1.57%231 Bloomington-Normal, IL 150,433 159,013 1,698 1.13%232 Jacksonville, NC 150,355 152,440 733 0.49%233 Pottsville, PA 150,336 147,447 137 0.09%234 Fairmont-Clarksburg, WV 148,742 148,645 353 0.24%235 Hilo, HI 148,677 167,293 2,579 1.73%236 Panama City-Lynn Haven, FL 148,217 161,558 699 0.47%237 Columbia, MO 145,666 153,283 2,385 1.64%238 Ithaca-Cortland, NY 145,100 148,640 4,472 3.08%239 Alexandria, LA 145,035 147,965 422 0.29%
Demographia US Metropolitan Area International Migration Report: 2000-2005 5
240 Bangor, ME 144,919 147,068 714 0.49%241 Idaho Falls-Blackfoot, ID 143,412 157,175 1,208 0.84%242 Rocky Mount, NC 143,026 145,507 1,142 0.80%243 Florence-Muscle Shoals, AL 142,950 142,351 362 0.25%244 El Centro, CA 142,361 155,823 6,153 4.32%245 Punta Gorda, FL 141,627 157,536 972 0.69%246 Hilton Head Island-Beaufort, SC 141,615 159,247 3,276 2.31%247 Pueblo, CO 141,472 151,322 975 0.69%248 Jefferson City, MO 140,052 143,867 719 0.51%249 Jamestown-Dunkirk-Fredonia, NY 139,750 136,409 385 0.28%250 Yuba City, CA 139,149 156,029 4,341 3.12%251 Billings, MT 138,904 146,593 178 0.13%252 East Stroudsburg, PA 138,687 163,234 750 0.54%253 Battle Creek, MI 137,985 139,191 903 0.65%254 Kokomo-Peru, IN 137,623 136,982 346 0.25%255 Paducah-Mayfield, KY-IL 135,793 135,708 443 0.33%256 State College, PA 135,758 140,561 3,665 2.70%257 Pittsfield, MA 134,953 131,868 866 0.64%258 Bend-Prineville, OR 134,549 163,449 637 0.47%259 Weirton-Steubenville, WV-OH 132,008 126,464 131 0.10%260 Iowa City, IA 131,676 138,524 3,012 2.29%261 Traverse City, MI 131,342 141,011 501 0.38%262 Cape Girardeau-Sikeston-Jackson, MO-IL 130,734 133,556 409 0.31%263 Findlay-Tiffin, OH 129,978 130,986 547 0.42%264 Texarkana, TX-Texarkana, AR 129,749 133,805 426 0.33%265 Hanford-Corcoran, CA 129,461 143,420 3,230 2.49%266 Chambersburg, PA 129,313 137,409 763 0.59%267 Altoona, PA 129,144 126,795 164 0.13%268 Kahului-Wailuku, HI 128,094 139,884 3,113 2.43%269 La Crosse, WI-MN 126,838 128,899 445 0.35%270 Beckley-Oak Hill, WV 126,799 125,990 299 0.24%271 Dover, DE 126,697 143,968 840 0.66%272 Eureka-Arcata-Fortuna, CA 126,518 128,376 807 0.64%273 Tupelo, MS 125,251 130,360 337 0.27%274 Hattiesburg, MS 123,812 131,871 741 0.60%275 St. Joseph, MO-KS 122,336 121,961 223 0.18%276 Dalton, GA 120,031 131,701 5,391 4.49%277 Valdosta, GA 119,560 124,838 884 0.74%278 Muncie, IN 118,769 116,362 748 0.63%279 Homosassa Springs, FL 118,085 134,370 358 0.30%280 Sierra Vista-Douglas, AZ 117,755 126,106 1,890 1.61%281 Augusta-Waterville, ME 117,114 120,986 245 0.21%282 Flagstaff, AZ 116,320 123,866 1,175 1.01%283 Grand Junction, CO 116,255 129,872 687 0.59%284 Lawton, OK 114,996 112,429 495 0.43%285 New Bern, NC 114,751 113,841 737 0.64%286 Decatur, IL 114,706 110,167 285 0.25%287 Farmington, NM 113,801 126,208 706 0.62%288 Goldsboro, NC 113,329 114,448 1,454 1.28%289 Vero Beach, FL 112,947 128,594 1,645 1.46%290 Rapid City, SD 112,818 118,203 465 0.41%291 Sheboygan, WI 112,646 114,610 954 0.85%292 Anniston-Oxford, AL 112,249 112,141 359 0.32%293 Ogdensburg-Massena, NY 111,931 111,380 598 0.53%294 Watertown-Fort Drum, NY 111,738 116,384 577 0.52%295 Victoria, TX 111,663 113,356 1,094 0.98%296 Wooster, OH 111,564 113,697 506 0.45%297 Morgantown, WV 111,200 114,501 1,282 1.15%298 Sherman-Denison, TX 110,595 116,834 1,254 1.13%299 Danville, VA 110,156 107,997 473 0.43%300 Owensboro, KY 109,875 111,599 253 0.23%
Demographia US Metropolitan Area International Migration Report: 2000-2005 6
301 Manhattan, KS 108,999 106,540 1,809 1.66%302 Staunton-Waynesboro, VA 108,988 114,331 318 0.29%303 Coeur d'Alene, ID 108,685 127,668 278 0.26%304 Harrisonburg, VA 108,193 111,689 2,248 2.08%305 Jonesboro, AR 107,762 112,084 714 0.66%306 Bluefield, WV-VA 107,578 106,384 134 0.12%307 Meridian, MS 106,569 105,134 105 0.10%308 Ames-Boone, IA 106,205 106,554 3,053 2.87%309 San Angelo, TX 105,781 105,367 696 0.66%310 Sumter, SC 104,646 105,517 389 0.37%311 Bowling Green, KY 104,166 110,990 2,000 1.92%312 Gadsden, AL 103,459 103,189 497 0.48%313 Mount Vernon-Anacortes, WA 102,979 113,171 2,230 2.17%314 Logan, UT-ID 102,720 110,426 2,264 2.20%315 Ocean City, NJ 102,326 99,286 305 0.30%316 Cumberland, MD-WV 102,008 100,667 145 0.14%317 Hammond, LA 100,588 106,502 160 0.16%318 Roseburg, OR 100,399 104,202 223 0.22%319 Lawrence, KS 99,962 102,914 2,154 2.15%320 Wenatchee, WA 99,219 104,768 2,463 2.48%321 Adrian, MI 98,890 102,033 292 0.30%322 Corning, NY 98,726 98,632 261 0.26%323 Grand Forks, ND-MN 97,478 97,073 917 0.94%324 Missoula, MT 95,802 100,086 471 0.49%325 Bismarck, ND 94,719 99,346 257 0.27%326 Whitewater, WI 93,759 99,844 1,077 1.15%327 Cookeville, TN 93,417 98,175 827 0.89%328 Brunswick, GA 93,044 98,433 713 0.77%329 Tullahoma, TN 93,024 97,896 489 0.53%330 Longview, WA 92,948 97,325 765 0.82%331 Orangeburg, SC 91,582 92,167 214 0.23%332 Elmira, NY 91,070 89,512 281 0.31%333 New Philadelphia-Dover, OH 90,914 91,944 168 0.18%334 Rome, GA 90,565 94,198 1,324 1.46%335 Meadville, PA 90,366 89,442 74 0.08%336 St. George, UT 90,354 118,885 939 1.04%337 Indiana, PA 89,605 88,703 403 0.45%338 Dubuque, IA 89,143 91,631 651 0.73%339 Corbin-London, KY 88,580 94,367 211 0.24%340 Hot Springs, AR 88,068 93,551 355 0.40%341 Sebring, FL 87,366 95,496 1,915 2.19%342 Ukiah, CA 86,265 88,161 1,853 2.15%343 Mankato-North Mankato, MN 85,712 88,878 792 0.92%344 Fort Polk South-De Ridder, LA 85,517 83,307 426 0.50%345 Zanesville, OH 84,585 85,579 97 0.11%346 Danville, IL 83,919 82,344 279 0.33%347 Columbus-West Point, MS 83,565 81,118 208 0.25%348 DuBois, PA 83,382 82,783 73 0.09%349 Laurel, MS 83,107 84,322 837 1.01%350 Pocatello, ID 83,103 85,908 542 0.65%351 Manitowoc, WI 82,887 81,949 490 0.59%352 Midland, MI 82,874 84,064 810 0.98%353 Fairbanks, AK 82,840 87,560 649 0.78%354 Twin Falls, ID 82,626 89,057 1,492 1.81%355 Bloomsburg-Berwick, PA 82,387 82,971 134 0.16%356 Brainerd, MN 82,249 88,827 103 0.13%357 Albertville, AL 82,231 85,634 1,384 1.68%358 Cheyenne, WY 81,607 85,163 353 0.43%359 Pendleton-Hermiston, OR 81,543 85,544 1,439 1.76%360 Great Falls, MT 80,357 79,569 192 0.24%361 Talladega-Sylacauga, AL 80,321 80,457 113 0.14%
Demographia US Metropolitan Area International Migration Report: 2000-2005 7
362 Lufkin, TX 80,130 81,557 918 1.15%363 Somerset, PA 80,023 78,907 88 0.11%364 Plattsburgh, NY 79,894 82,047 373 0.47%365 Key West-Marathon, FL 79,589 76,329 2,276 2.86%366 Sandusky, OH 79,551 78,665 132 0.17%367 Roanoke Rapids, NC 79,456 77,506 193 0.24%368 Portsmouth, OH 79,195 76,561 131 0.17%369 Quincy, IL-MO 78,771 77,226 135 0.17%370 Grants Pass, OR 75,726 80,761 118 0.16%371 Russellville, AR 75,608 77,971 1,002 1.33%372 Wisconsin Rapids-Marshfield, WI 75,555 75,234 351 0.46%373 Union City-Martin, TN-KY 75,097 73,162 496 0.66%374 Gallup, NM 74,798 71,918 247 0.33%375 Southern Pines-Pinehurst, NC 74,769 81,685 994 1.33%376 Moses Lake, WA 74,698 81,229 3,753 5.02%377 Galesburg, IL 74,571 70,867 215 0.29%378 Kalispell, MT 74,471 83,172 183 0.25%379 Warsaw, IN 74,057 76,072 653 0.88%380 Watertown-Fort Atkinson, WI 74,021 79,328 595 0.80%381 Keene, NH 73,825 77,287 219 0.30%382 Wilson, NC 73,814 76,281 1,422 1.93%383 Marion, IN 73,403 70,557 135 0.18%384 Martinsville, VA 73,346 71,426 1,058 1.44%385 Richmond, IN 71,097 69,192 258 0.36%386 Palatka, FL 70,423 73,568 448 0.64%387 Muskogee, OK 69,451 70,607 384 0.55%388 Marinette, WI-MI 68,710 68,402 115 0.17%389 Centralia, WA 68,600 72,449 644 0.94%390 Branson, MO 68,361 73,916 232 0.34%391 Grand Island, NE 68,305 69,878 1,374 2.01%392 Stillwater, OK 68,190 69,151 1,780 2.61%393 Bozeman, MT 67,831 78,210 453 0.67%394 Minot, ND 67,392 63,700 325 0.48%395 Aberdeen, WA 67,194 70,900 516 0.77%396 Stevens Point, WI 67,182 67,585 330 0.49%397 Casper, WY 66,533 69,799 235 0.35%398 Greenwood, SC 66,271 67,979 872 1.32%399 Helena, MT 65,765 69,619 173 0.26%400 North Wilkesboro, NC 65,632 67,390 914 1.39%401 Hutchinson, KS 64,790 63,558 275 0.42%402 Marquette, MI 64,634 64,760 137 0.21%403 Port Angeles, WA 64,525 69,689 393 0.61%404 Fort Payne, AL 64,452 67,271 958 1.49%405 Charleston-Mattoon, IL 64,449 62,038 219 0.34%406 Klamath Falls, OR 63,775 66,192 395 0.62%407 Rutland, VT 63,400 63,743 82 0.13%408 Mount Pleasant, MI 63,351 65,618 605 0.95%409 Clovis-Portales, NM 63,062 64,084 646 1.02%410 Greenville, MS 62,977 59,220 144 0.23%411 Greeneville, TN 62,909 65,318 277 0.44%412 Forest City, NC 62,899 63,771 150 0.24%413 Coos Bay, OR 62,779 64,711 269 0.43%414 Sayre, PA 62,761 62,537 36 0.06%415 Sturgis, MI 62,422 62,984 691 1.11%416 Alamogordo, NM 62,298 63,538 2,126 3.41%417 Athens, OH 62,223 62,062 1,023 1.64%418 Oneonta, NY 61,676 62,746 104 0.17%419 Roswell, NM 61,382 61,860 878 1.43%420 Marion-Herrin, IL 61,296 63,617 83 0.14%421 Sterling, IL 60,653 59,863 239 0.39%422 Salina, KS 59,760 60,042 532 0.89%
Demographia US Metropolitan Area International Migration Report: 2000-2005 8
423 Kinston, NC 59,648 57,961 438 0.73%424 Carbondale, IL 59,612 57,954 1,644 2.76%425 Norwalk, OH 59,487 60,385 288 0.48%426 Morehead City, NC 59,383 62,525 207 0.35%427 Nacogdoches, TX 59,203 60,468 1,099 1.86%428 Kapaa, HI 58,463 62,640 749 1.28%429 Clearlake, CA 58,309 65,147 561 0.96%430 Barre, VT 58,039 59,478 437 0.75%431 Lewiston, ID-WA 57,961 59,109 169 0.29%432 Ruston, LA 57,906 57,243 295 0.51%433 Enid, OK 57,813 56,958 293 0.51%434 Oil City, PA 57,565 55,928 26 0.05%435 Fergus Falls, MN 57,159 57,658 399 0.70%436 Point Pleasant, WV-OH 57,026 57,123 15 0.03%437 Lake City, FL 56,513 64,040 216 0.38%438 Somerset, KY 56,217 59,200 122 0.22%439 Red Bluff, CA 56,039 61,197 502 0.90%440 Statesboro, GA 55,983 61,454 540 0.96%441 Hobbs, NM 55,511 56,719 518 0.93%442 Walla Walla, WA 55,180 57,558 1,037 1.88%443 Palestine, TX 55,109 56,408 314 0.57%444 Milledgeville, GA 54,776 54,873 120 0.22%445 Natchez, MS-LA 54,587 51,372 60 0.11%446 Phoenix Lake-Cedar Ridge, CA 54,501 59,380 130 0.24%447 Ardmore, OK 54,452 56,251 189 0.35%448 Mason City, IA 54,356 52,413 123 0.23%449 Scottsboro, AL 53,926 53,650 59 0.11%450 Muscatine, IA 53,905 54,598 575 1.07%451 Rio Grande City, TX 53,597 60,941 2,680 5.00%452 Morgan City, LA 53,500 51,416 165 0.31%453 Dublin, GA 53,434 56,434 163 0.31%454 Elizabeth City, NC 53,150 59,317 178 0.33%455 McComb, MS 52,539 52,861 27 0.05%456 Ashland, OH 52,523 54,123 119 0.23%457 Jasper, IN 52,511 53,624 308 0.59%458 Carson City, NV 52,457 56,062 1,094 2.09%459 Ontario, OR-ID 52,193 53,527 690 1.32%460 Blytheville, AR 51,979 47,911 146 0.28%461 Carlsbad-Artesia, NM 51,658 51,437 221 0.43%462 Payson, AZ 51,335 51,663 280 0.55%463 Malone, NY 51,134 51,033 104 0.20%464 Waycross, GA 51,119 51,611 421 0.82%465 Danville, KY 51,058 53,485 305 0.60%466 Burlington, IA-IL 50,564 48,782 127 0.25%467 Clinton, IA 50,149 49,717 178 0.35%468 Winona, MN 49,985 49,276 419 0.84%469 Vicksburg, MS 49,644 49,131 97 0.20%470 Platteville, WI 49,597 49,671 90 0.18%471 Norfolk, NE 49,538 49,622 477 0.96%472 Edwards, CO 49,471 55,268 3,742 7.56%473 Kearney, NE 49,141 50,346 275 0.56%474 Sanford, NC 49,040 55,704 1,715 3.50%475 Greenwood, MS 48,716 46,828 127 0.26%476 Mount Vernon, IL 48,666 48,735 66 0.14%477 Picayune, MS 48,621 52,659 53 0.11%478 Paris, TX 48,499 49,644 385 0.79%479 Ponca City, OK 48,080 46,480 260 0.54%480 Glasgow, KY 48,070 50,270 120 0.25%481 Sidney, OH 47,910 48,736 260 0.54%482 Eagle Pass, TX 47,297 51,181 1,641 3.47%483 Elko, NV 46,942 46,998 848 1.81%
Demographia US Metropolitan Area International Migration Report: 2000-2005 9
484 Crossville, TN 46,802 51,346 53 0.11%485 Rockingham, NC 46,564 46,781 377 0.81%486 Madisonville, KY 46,519 46,705 66 0.14%487 Lewistown, PA 46,486 46,235 23 0.05%488 Selma, AL 46,365 44,366 41 0.09%489 Canon City, CO 46,145 47,766 130 0.28%490 Bellefontaine, OH 46,005 46,580 120 0.26%491 Bradford, PA 45,936 44,370 33 0.07%492 Bedford, IN 45,922 46,403 68 0.15%493 Coldwater, MI 45,787 46,460 437 0.95%494 El Dorado, AR 45,629 44,186 173 0.38%495 Huntingdon, PA 45,586 45,947 75 0.16%496 Keokuk-Fort Madison, IA-MO 45,468 44,028 89 0.20%497 Plymouth, IN 45,128 46,945 731 1.62%498 Corsicana, TX 45,124 48,687 1,362 3.02%499 Douglas, GA 45,022 47,704 983 2.18%500 Cadillac, MI 44,962 47,175 67 0.15%501 Washington, NC 44,958 46,018 368 0.82%502 Del Rio, TX 44,856 47,596 1,256 2.80%503 Calhoun, GA 44,104 50,279 1,115 2.53%504 McAlester, OK 43,953 44,641 101 0.23%505 Durango, CO 43,941 47,452 174 0.40%506 Warren, PA 43,863 42,033 10 0.02%507 St. Marys, GA 43,664 45,759 130 0.30%508 Kerrville, TX 43,653 46,496 472 1.08%509 Duncan, OK 43,182 42,946 12 0.03%510 Henderson, NC 42,954 43,771 604 1.41%511 Starkville, MS 42,902 41,247 766 1.79%512 Thomasville, GA 42,737 44,692 139 0.33%513 Boone, NC 42,695 42,472 314 0.74%514 Harrison, AR 42,556 44,245 48 0.11%515 Tahlequah, OK 42,521 44,671 517 1.22%516 Alma, MI 42,285 42,345 91 0.22%517 Jacksonville, IL 42,153 41,134 102 0.24%518 Moultrie, GA 42,053 43,915 1,213 2.88%519 Safford, AZ 42,036 40,594 122 0.29%520 Centralia, IL 41,691 40,144 20 0.05%521 Burley, ID 41,590 40,338 668 1.61%522 Seymour, IN 41,335 42,237 508 1.23%523 Willmar, MN 41,203 41,199 384 0.93%524 El Campo, TX 41,188 41,554 688 1.67%525 Fort Leonard Wood, MO 41,165 44,187 210 0.51%526 Logansport, IN 40,930 40,130 495 1.21%527 Celina, OH 40,924 41,202 44 0.11%528 Poplar Bluff, MO 40,867 41,338 113 0.28%529 Cambridge, OH 40,792 41,123 24 0.06%530 Pullman, WA 40,740 40,170 1,436 3.52%531 Cleveland, MS 40,633 38,641 31 0.08%532 Big Rapids, MI 40,553 42,391 268 0.66%533 Garden City, KS 40,523 38,988 2,285 5.64%534 Fort Dodge, IA 40,235 39,003 171 0.43%535 Lawrenceburg, TN 39,926 41,101 76 0.19%536 Aberdeen, SD 39,827 38,818 64 0.16%537 Rolla, MO 39,825 42,125 589 1.48%538 Pontiac, IL 39,678 39,186 125 0.32%539 Bemidji, MN 39,650 42,871 187 0.47%540 Rockland, ME 39,618 41,219 80 0.20%541 Berlin, NH-VT 39,570 40,257 78 0.20%542 Defiance, OH 39,500 39,112 82 0.21%543 Sedalia, MO 39,403 40,121 443 1.12%544 Alice, TX 39,326 40,951 81 0.21%
Demographia US Metropolitan Area International Migration Report: 2000-2005 10
545 Marshalltown, IA 39,311 39,418 727 1.85%546 Rexburg, ID 39,286 43,217 425 1.08%547 Vincennes, IN 39,256 38,366 198 0.50%548 Natchitoches, LA 39,080 38,541 185 0.47%549 Emporia, KS 38,965 38,690 1,034 2.65%550 Oxford, MS 38,744 40,842 418 1.08%551 Austin, MN 38,603 38,799 515 1.33%552 Sault Ste. Marie, MI 38,543 38,780 106 0.28%553 Escanaba, MI 38,520 38,347 40 0.10%554 Tifton, GA 38,407 40,793 918 2.39%555 Mountain Home, AR 38,386 40,330 17 0.04%556 Nogales, AZ 38,381 42,009 1,487 3.87%557 Houghton, MI 38,317 37,900 378 0.99%558 McMinnville, TN 38,276 39,753 629 1.64%559 Walterboro, SC 38,264 39,605 135 0.35%560 Pittsburg, KS 38,242 38,222 540 1.41%561 Hastings, NE 38,190 39,803 627 1.64%562 Hannibal, MO 37,915 38,136 58 0.15%563 Scottsbluff, NE 37,770 37,485 326 0.86%564 Brownwood, TX 37,674 38,664 151 0.40%565 Rock Springs, WY 37,613 37,975 210 0.56%566 Shelbyville, TN 37,586 42,204 1,242 3.30%567 Paragould, AR 37,331 39,401 55 0.15%568 Dyersburg, TN 37,279 37,829 204 0.55%569 West Plains, MO 37,238 38,400 123 0.33%570 Bennington, VT 36,994 36,999 182 0.49%571 Americus, GA 36,966 37,034 209 0.57%572 Coshocton, OH 36,655 36,945 130 0.35%573 Plainview, TX 36,602 36,233 475 1.30%574 Durant, OK 36,534 37,815 240 0.66%575 Coffeyville, KS 36,252 34,570 125 0.34%576 Clewiston, FL 36,210 39,561 2,626 7.25%577 Dixon, IL 36,062 35,669 107 0.30%578 Ottumwa, IA 36,051 35,965 175 0.49%579 North Platte, NE 35,939 36,883 105 0.29%580 Okeechobee, FL 35,910 39,836 1,079 3.00%581 Cornelia, GA 35,902 39,603 782 2.18%582 Riverton, WY 35,804 36,491 43 0.12%583 Astoria, OR 35,630 36,798 456 1.28%584 Taylorville, IL 35,372 35,176 101 0.29%585 Ada, OK 35,143 35,346 128 0.36%586 St. Marys, PA 35,112 33,577 33 0.09%587 Wabash, IN 34,960 33,843 (2) -0.01%588 Moscow, ID 34,935 34,714 620 1.77%589 Butte-Silver Bow, MT 34,606 32,982 42 0.12%590 Corinth, MS 34,558 35,306 111 0.32%591 Camden, AR 34,534 32,691 70 0.20%592 Indianola, MS 34,369 32,311 87 0.25%593 Vidalia, GA 34,337 36,183 657 1.91%594 Effingham, IL 34,264 34,581 66 0.19%595 Batesville, AR 34,233 34,737 145 0.42%596 Murray, KY 34,177 35,122 463 1.35%597 Susanville, CA 33,828 34,751 51 0.15%598 Easton, MD 33,812 35,683 165 0.49%599 Cedar City, UT 33,779 38,311 361 1.07%600 Gillette, WY 33,698 37,405 87 0.26%601 Owatonna, MN 33,680 35,755 482 1.43%602 Monroe, WI 33,647 35,165 66 0.20%603 Big Spring, TX 33,627 32,522 295 0.88%604 Hope, AR 33,542 32,933 666 1.99%605 Montrose, CO 33,432 37,482 303 0.91%
Demographia US Metropolitan Area International Migration Report: 2000-2005 11
606 Ellensburg, WA 33,362 36,841 538 1.61%607 Angola, IN 33,214 33,773 129 0.39%608 Miami, OK 33,194 32,866 123 0.37%609 Brookhaven, MS 33,166 33,906 26 0.08%610 Kennett, MO 33,155 32,545 118 0.36%611 Stephenville, TX 33,001 34,076 495 1.50%612 Macomb, IL 32,913 31,966 420 1.28%613 Alexandria, MN 32,821 35,138 15 0.05%614 Albert Lea, MN 32,584 31,946 218 0.67%615 Iron Mountain, MI-WI 32,560 33,006 20 0.06%616 Lebanon, MO 32,513 34,492 39 0.12%617 Dodge City, KS 32,458 33,751 2,294 7.07%618 Beeville, TX 32,359 32,873 35 0.11%619 Arcadia, FL 32,209 35,406 2,550 7.92%620 Laramie, WY 32,014 30,890 402 1.26%621 Sulphur Springs, TX 31,960 33,381 378 1.18%622 Central City, KY 31,839 31,548 10 0.03%623 Madison, IN 31,705 32,430 76 0.24%624 Columbus, NE 31,662 31,262 347 1.10%625 Eufaula, AL-GA 31,636 30,881 229 0.72%626 Watertown, SD 31,437 31,717 88 0.28%627 Alpena, MI 31,314 30,428 66 0.21%628 Lincoln, IL 31,183 30,603 93 0.30%629 Paris, TN 31,115 31,511 71 0.23%630 Silver City, NM 31,002 29,747 66 0.21%631 Maysville, KY 30,892 31,012 74 0.24%632 Dillon, SC 30,722 30,974 111 0.36%633 Juneau, AK 30,711 30,987 265 0.86%634 Cambridge, MD 30,674 31,401 56 0.18%635 Clarksdale, MS 30,622 29,002 64 0.21%636 Brenham, TX 30,373 31,521 363 1.20%637 Las Vegas, NM 30,126 29,530 208 0.69%638 Middlesborough, KY 30,060 29,665 75 0.25%639 Taos, NM 29,979 31,722 336 1.12%640 Kill Devil Hills, NC 29,967 33,903 211 0.70%641 Washington, IN 29,820 30,466 252 0.85%642 Troy, AL 29,605 29,639 271 0.92%643 McPherson, KS 29,554 29,523 26 0.09%644 Forrest City, AR 29,329 27,902 0 0.00%645 Kirksville, MO 29,147 28,817 172 0.59%646 Mountain Home, ID 29,130 28,634 446 1.53%647 Bennettsville, SC 28,818 28,021 18 0.06%648 Altus, OK 28,439 26,518 262 0.92%649 Bainbridge, GA 28,240 28,618 249 0.88%650 Brookings, SD 28,220 28,121 228 0.81%651 Great Bend, KS 28,205 28,105 405 1.44%652 Mount Pleasant, TX 28,118 29,445 1,248 4.44%653 Crescent City, CA 27,507 28,705 342 1.24%653 Hays, KS 27,507 26,767 196 0.71%655 Fitzgerald, GA 27,415 27,409 247 0.90%656 Fort Morgan, CO 27,171 27,995 1,012 3.72%657 Wauchula, FL 26,938 28,286 1,347 5.00%658 New Ulm, MN 26,911 26,534 44 0.16%659 Lewisburg, TN 26,767 28,372 210 0.78%660 Harrisburg, IL 26,733 26,072 47 0.18%661 Jesup, GA 26,565 28,390 109 0.41%662 Sheridan, WY 26,560 27,389 64 0.24%663 Lexington, NE 26,508 26,637 1,082 4.08%664 West Helena, AR 26,445 24,107 27 0.10%665 Uvalde, TX 25,926 26,955 255 0.98%666 Mexico, MO 25,853 25,759 (1) -0.00%
Demographia US Metropolitan Area International Migration Report: 2000-2005 12
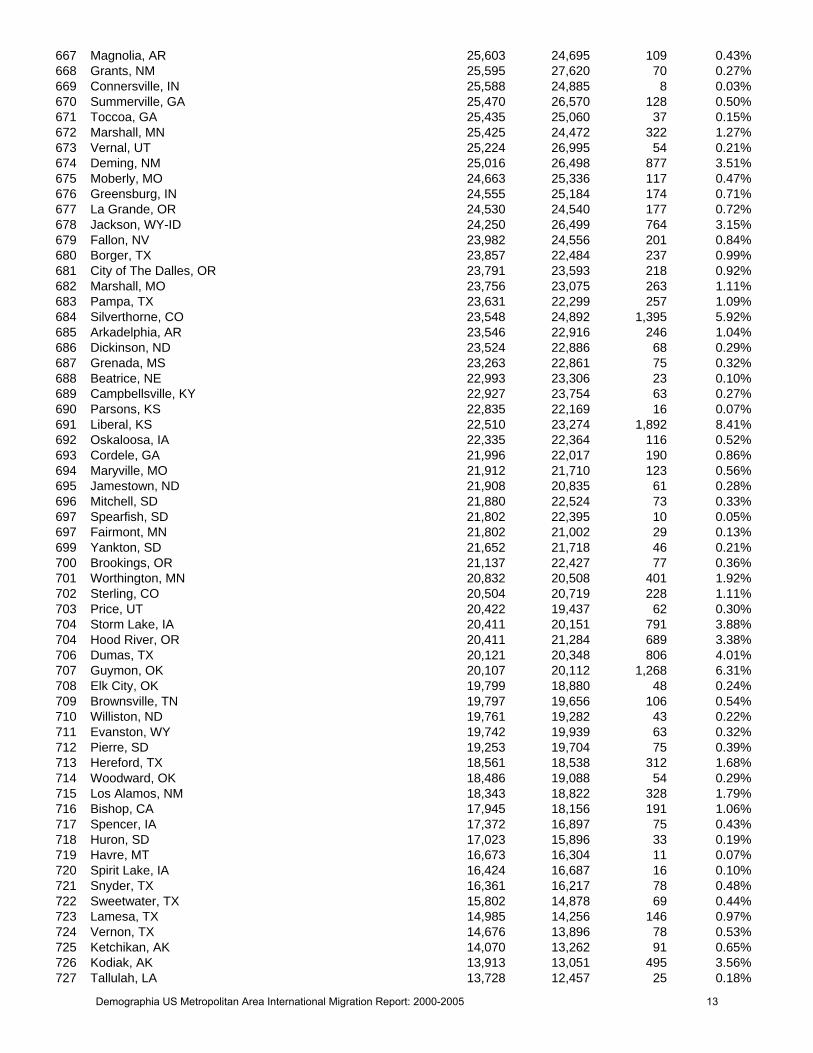
667 Magnolia, AR 25,603 24,695 109 0.43%668 Grants, NM 25,595 27,620 70 0.27%669 Connersville, IN 25,588 24,885 8 0.03%670 Summerville, GA 25,470 26,570 128 0.50%671 Toccoa, GA 25,435 25,060 37 0.15%672 Marshall, MN 25,425 24,472 322 1.27%673 Vernal, UT 25,224 26,995 54 0.21%674 Deming, NM 25,016 26,498 877 3.51%675 Moberly, MO 24,663 25,336 117 0.47%676 Greensburg, IN 24,555 25,184 174 0.71%677 La Grande, OR 24,530 24,540 177 0.72%678 Jackson, WY-ID 24,250 26,499 764 3.15%679 Fallon, NV 23,982 24,556 201 0.84%680 Borger, TX 23,857 22,484 237 0.99%681 City of The Dalles, OR 23,791 23,593 218 0.92%682 Marshall, MO 23,756 23,075 263 1.11%683 Pampa, TX 23,631 22,299 257 1.09%684 Silverthorne, CO 23,548 24,892 1,395 5.92%685 Arkadelphia, AR 23,546 22,916 246 1.04%686 Dickinson, ND 23,524 22,886 68 0.29%687 Grenada, MS 23,263 22,861 75 0.32%688 Beatrice, NE 22,993 23,306 23 0.10%689 Campbellsville, KY 22,927 23,754 63 0.27%690 Parsons, KS 22,835 22,169 16 0.07%691 Liberal, KS 22,510 23,274 1,892 8.41%692 Oskaloosa, IA 22,335 22,364 116 0.52%693 Cordele, GA 21,996 22,017 190 0.86%694 Maryville, MO 21,912 21,710 123 0.56%695 Jamestown, ND 21,908 20,835 61 0.28%696 Mitchell, SD 21,880 22,524 73 0.33%697 Spearfish, SD 21,802 22,395 10 0.05%697 Fairmont, MN 21,802 21,002 29 0.13%699 Yankton, SD 21,652 21,718 46 0.21%700 Brookings, OR 21,137 22,427 77 0.36%701 Worthington, MN 20,832 20,508 401 1.92%702 Sterling, CO 20,504 20,719 228 1.11%703 Price, UT 20,422 19,437 62 0.30%704 Storm Lake, IA 20,411 20,151 791 3.88%704 Hood River, OR 20,411 21,284 689 3.38%706 Dumas, TX 20,121 20,348 806 4.01%707 Guymon, OK 20,107 20,112 1,268 6.31%708 Elk City, OK 19,799 18,880 48 0.24%709 Brownsville, TN 19,797 19,656 106 0.54%710 Williston, ND 19,761 19,282 43 0.22%711 Evanston, WY 19,742 19,939 63 0.32%712 Pierre, SD 19,253 19,704 75 0.39%713 Hereford, TX 18,561 18,538 312 1.68%714 Woodward, OK 18,486 19,088 54 0.29%715 Los Alamos, NM 18,343 18,822 328 1.79%716 Bishop, CA 17,945 18,156 191 1.06%717 Spencer, IA 17,372 16,897 75 0.43%718 Huron, SD 17,023 15,896 33 0.19%719 Havre, MT 16,673 16,304 11 0.07%720 Spirit Lake, IA 16,424 16,687 16 0.10%721 Snyder, TX 16,361 16,217 78 0.48%722 Sweetwater, TX 15,802 14,878 69 0.44%723 Lamesa, TX 14,985 14,256 146 0.97%724 Vernon, TX 14,676 13,896 78 0.53%725 Ketchikan, AK 14,070 13,262 91 0.65%726 Kodiak, AK 13,913 13,051 495 3.56%727 Tallulah, LA 13,728 12,457 25 0.18%
Demographia US Metropolitan Area International Migration Report: 2000-2005 13

728 Pecos, TX 13,137 11,638 124 0.94%729 Andrews, TX 13,004 12,748 76 0.58%
Demographia US Metropolitan Area International Migration Report: 2000-2005 14
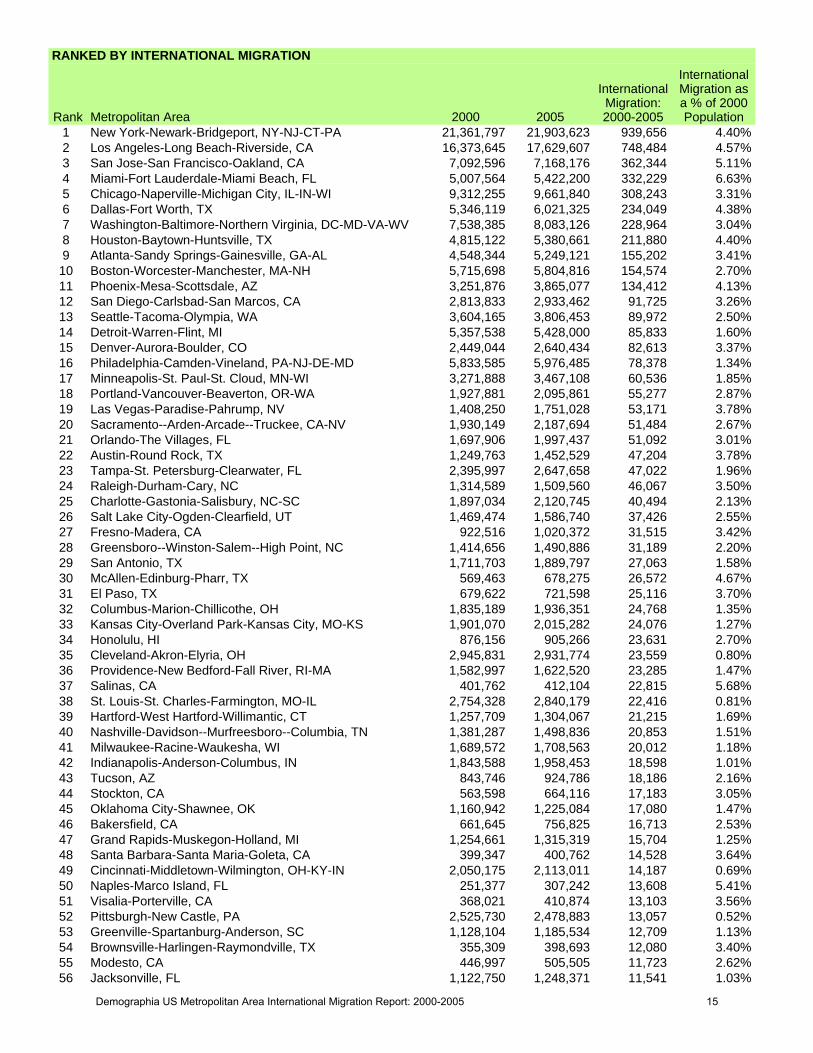
RANKED BY INTERNATIONAL MIGRATION
Rank Metropolitan Area 2000 2005
InternationalMigration:2000-2005
InternationalMigration asa % of 2000Population
1 New York-Newark-Bridgeport, NY-NJ-CT-PA 21,361,797 21,903,623 939,656 4.40%2 Los Angeles-Long Beach-Riverside, CA 16,373,645 17,629,607 748,484 4.57%3 San Jose-San Francisco-Oakland, CA 7,092,596 7,168,176 362,344 5.11%4 Miami-Fort Lauderdale-Miami Beach, FL 5,007,564 5,422,200 332,229 6.63%5 Chicago-Naperville-Michigan City, IL-IN-WI 9,312,255 9,661,840 308,243 3.31%6 Dallas-Fort Worth, TX 5,346,119 6,021,325 234,049 4.38%7 Washington-Baltimore-Northern Virginia, DC-MD-VA-WV 7,538,385 8,083,126 228,964 3.04%8 Houston-Baytown-Huntsville, TX 4,815,122 5,380,661 211,880 4.40%9 Atlanta-Sandy Springs-Gainesville, GA-AL 4,548,344 5,249,121 155,202 3.41%10 Boston-Worcester-Manchester, MA-NH 5,715,698 5,804,816 154,574 2.70%11 Phoenix-Mesa-Scottsdale, AZ 3,251,876 3,865,077 134,412 4.13%12 San Diego-Carlsbad-San Marcos, CA 2,813,833 2,933,462 91,725 3.26%13 Seattle-Tacoma-Olympia, WA 3,604,165 3,806,453 89,972 2.50%14 Detroit-Warren-Flint, MI 5,357,538 5,428,000 85,833 1.60%15 Denver-Aurora-Boulder, CO 2,449,044 2,640,434 82,613 3.37%16 Philadelphia-Camden-Vineland, PA-NJ-DE-MD 5,833,585 5,976,485 78,378 1.34%17 Minneapolis-St. Paul-St. Cloud, MN-WI 3,271,888 3,467,108 60,536 1.85%18 Portland-Vancouver-Beaverton, OR-WA 1,927,881 2,095,861 55,277 2.87%19 Las Vegas-Paradise-Pahrump, NV 1,408,250 1,751,028 53,171 3.78%20 Sacramento--Arden-Arcade--Truckee, CA-NV 1,930,149 2,187,694 51,484 2.67%21 Orlando-The Villages, FL 1,697,906 1,997,437 51,092 3.01%22 Austin-Round Rock, TX 1,249,763 1,452,529 47,204 3.78%23 Tampa-St. Petersburg-Clearwater, FL 2,395,997 2,647,658 47,022 1.96%24 Raleigh-Durham-Cary, NC 1,314,589 1,509,560 46,067 3.50%25 Charlotte-Gastonia-Salisbury, NC-SC 1,897,034 2,120,745 40,494 2.13%26 Salt Lake City-Ogden-Clearfield, UT 1,469,474 1,586,740 37,426 2.55%27 Fresno-Madera, CA 922,516 1,020,372 31,515 3.42%28 Greensboro--Winston-Salem--High Point, NC 1,414,656 1,490,886 31,189 2.20%29 San Antonio, TX 1,711,703 1,889,797 27,063 1.58%30 McAllen-Edinburg-Pharr, TX 569,463 678,275 26,572 4.67%31 El Paso, TX 679,622 721,598 25,116 3.70%32 Columbus-Marion-Chillicothe, OH 1,835,189 1,936,351 24,768 1.35%33 Kansas City-Overland Park-Kansas City, MO-KS 1,901,070 2,015,282 24,076 1.27%34 Honolulu, HI 876,156 905,266 23,631 2.70%35 Cleveland-Akron-Elyria, OH 2,945,831 2,931,774 23,559 0.80%36 Providence-New Bedford-Fall River, RI-MA 1,582,997 1,622,520 23,285 1.47%37 Salinas, CA 401,762 412,104 22,815 5.68%38 St. Louis-St. Charles-Farmington, MO-IL 2,754,328 2,840,179 22,416 0.81%39 Hartford-West Hartford-Willimantic, CT 1,257,709 1,304,067 21,215 1.69%40 Nashville-Davidson--Murfreesboro--Columbia, TN 1,381,287 1,498,836 20,853 1.51%41 Milwaukee-Racine-Waukesha, WI 1,689,572 1,708,563 20,012 1.18%42 Indianapolis-Anderson-Columbus, IN 1,843,588 1,958,453 18,598 1.01%43 Tucson, AZ 843,746 924,786 18,186 2.16%44 Stockton, CA 563,598 664,116 17,183 3.05%45 Oklahoma City-Shawnee, OK 1,160,942 1,225,084 17,080 1.47%46 Bakersfield, CA 661,645 756,825 16,713 2.53%47 Grand Rapids-Muskegon-Holland, MI 1,254,661 1,315,319 15,704 1.25%48 Santa Barbara-Santa Maria-Goleta, CA 399,347 400,762 14,528 3.64%49 Cincinnati-Middletown-Wilmington, OH-KY-IN 2,050,175 2,113,011 14,187 0.69%50 Naples-Marco Island, FL 251,377 307,242 13,608 5.41%51 Visalia-Porterville, CA 368,021 410,874 13,103 3.56%52 Pittsburgh-New Castle, PA 2,525,730 2,478,883 13,057 0.52%53 Greenville-Spartanburg-Anderson, SC 1,128,104 1,185,534 12,709 1.13%54 Brownsville-Harlingen-Raymondville, TX 355,309 398,693 12,080 3.40%55 Modesto, CA 446,997 505,505 11,723 2.62%56 Jacksonville, FL 1,122,750 1,248,371 11,541 1.03%
Demographia US Metropolitan Area International Migration Report: 2000-2005 15
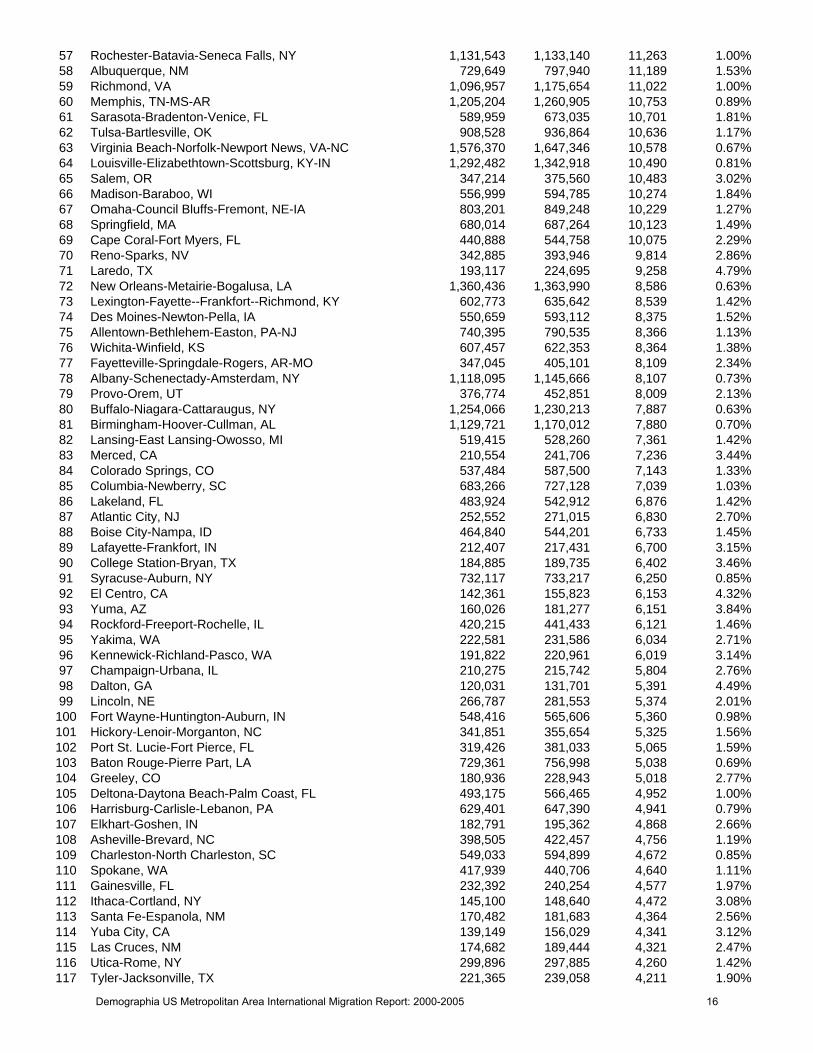
57 Rochester-Batavia-Seneca Falls, NY 1,131,543 1,133,140 11,263 1.00%58 Albuquerque, NM 729,649 797,940 11,189 1.53%59 Richmond, VA 1,096,957 1,175,654 11,022 1.00%60 Memphis, TN-MS-AR 1,205,204 1,260,905 10,753 0.89%61 Sarasota-Bradenton-Venice, FL 589,959 673,035 10,701 1.81%62 Tulsa-Bartlesville, OK 908,528 936,864 10,636 1.17%63 Virginia Beach-Norfolk-Newport News, VA-NC 1,576,370 1,647,346 10,578 0.67%64 Louisville-Elizabethtown-Scottsburg, KY-IN 1,292,482 1,342,918 10,490 0.81%65 Salem, OR 347,214 375,560 10,483 3.02%66 Madison-Baraboo, WI 556,999 594,785 10,274 1.84%67 Omaha-Council Bluffs-Fremont, NE-IA 803,201 849,248 10,229 1.27%68 Springfield, MA 680,014 687,264 10,123 1.49%69 Cape Coral-Fort Myers, FL 440,888 544,758 10,075 2.29%70 Reno-Sparks, NV 342,885 393,946 9,814 2.86%71 Laredo, TX 193,117 224,695 9,258 4.79%72 New Orleans-Metairie-Bogalusa, LA 1,360,436 1,363,990 8,586 0.63%73 Lexington-Fayette--Frankfort--Richmond, KY 602,773 635,642 8,539 1.42%74 Des Moines-Newton-Pella, IA 550,659 593,112 8,375 1.52%75 Allentown-Bethlehem-Easton, PA-NJ 740,395 790,535 8,366 1.13%76 Wichita-Winfield, KS 607,457 622,353 8,364 1.38%77 Fayetteville-Springdale-Rogers, AR-MO 347,045 405,101 8,109 2.34%78 Albany-Schenectady-Amsterdam, NY 1,118,095 1,145,666 8,107 0.73%79 Provo-Orem, UT 376,774 452,851 8,009 2.13%80 Buffalo-Niagara-Cattaraugus, NY 1,254,066 1,230,213 7,887 0.63%81 Birmingham-Hoover-Cullman, AL 1,129,721 1,170,012 7,880 0.70%82 Lansing-East Lansing-Owosso, MI 519,415 528,260 7,361 1.42%83 Merced, CA 210,554 241,706 7,236 3.44%84 Colorado Springs, CO 537,484 587,500 7,143 1.33%85 Columbia-Newberry, SC 683,266 727,128 7,039 1.03%86 Lakeland, FL 483,924 542,912 6,876 1.42%87 Atlantic City, NJ 252,552 271,015 6,830 2.70%88 Boise City-Nampa, ID 464,840 544,201 6,733 1.45%89 Lafayette-Frankfort, IN 212,407 217,431 6,700 3.15%90 College Station-Bryan, TX 184,885 189,735 6,402 3.46%91 Syracuse-Auburn, NY 732,117 733,217 6,250 0.85%92 El Centro, CA 142,361 155,823 6,153 4.32%93 Yuma, AZ 160,026 181,277 6,151 3.84%94 Rockford-Freeport-Rochelle, IL 420,215 441,433 6,121 1.46%95 Yakima, WA 222,581 231,586 6,034 2.71%96 Kennewick-Richland-Pasco, WA 191,822 220,961 6,019 3.14%97 Champaign-Urbana, IL 210,275 215,742 5,804 2.76%98 Dalton, GA 120,031 131,701 5,391 4.49%99 Lincoln, NE 266,787 281,553 5,374 2.01%100 Fort Wayne-Huntington-Auburn, IN 548,416 565,606 5,360 0.98%101 Hickory-Lenoir-Morganton, NC 341,851 355,654 5,325 1.56%102 Port St. Lucie-Fort Pierce, FL 319,426 381,033 5,065 1.59%103 Baton Rouge-Pierre Part, LA 729,361 756,998 5,038 0.69%104 Greeley, CO 180,936 228,943 5,018 2.77%105 Deltona-Daytona Beach-Palm Coast, FL 493,175 566,465 4,952 1.00%106 Harrisburg-Carlisle-Lebanon, PA 629,401 647,390 4,941 0.79%107 Elkhart-Goshen, IN 182,791 195,362 4,868 2.66%108 Asheville-Brevard, NC 398,505 422,457 4,756 1.19%109 Charleston-North Charleston, SC 549,033 594,899 4,672 0.85%110 Spokane, WA 417,939 440,706 4,640 1.11%111 Gainesville, FL 232,392 240,254 4,577 1.97%112 Ithaca-Cortland, NY 145,100 148,640 4,472 3.08%113 Santa Fe-Espanola, NM 170,482 181,683 4,364 2.56%114 Yuba City, CA 139,149 156,029 4,341 3.12%115 Las Cruces, NM 174,682 189,444 4,321 2.47%116 Utica-Rome, NY 299,896 297,885 4,260 1.42%117 Tyler-Jacksonville, TX 221,365 239,058 4,211 1.90%
Demographia US Metropolitan Area International Migration Report: 2000-2005 16
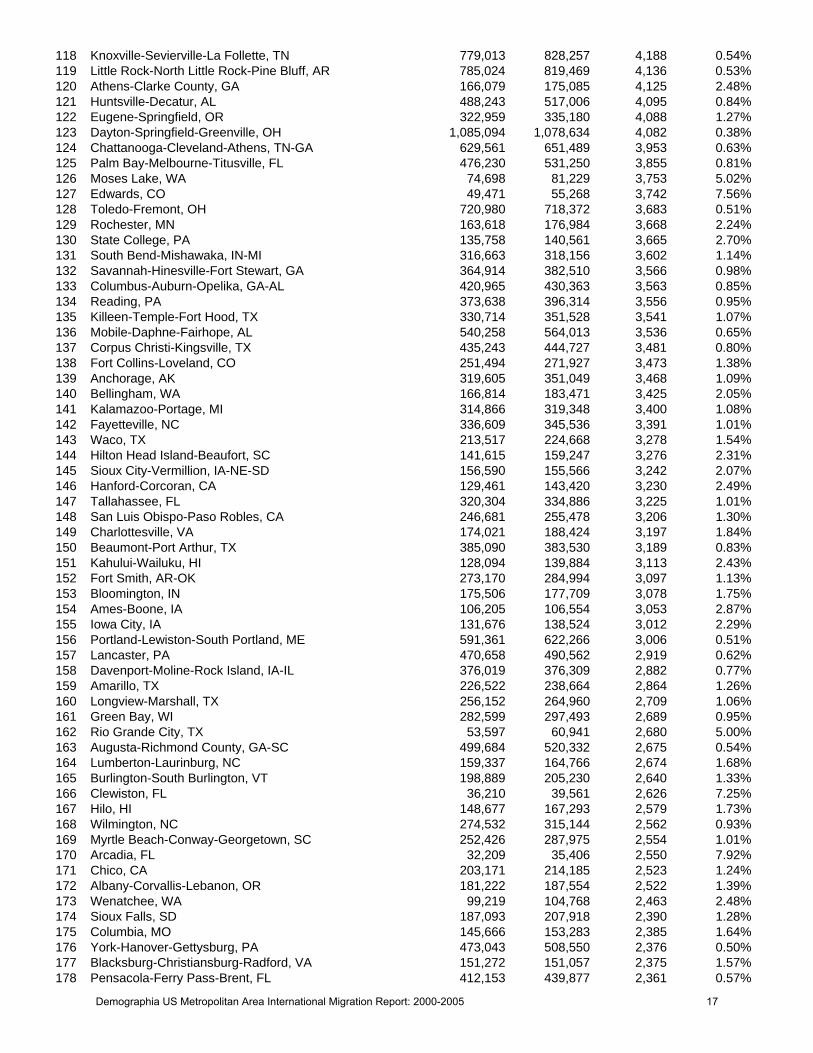
118 Knoxville-Sevierville-La Follette, TN 779,013 828,257 4,188 0.54%119 Little Rock-North Little Rock-Pine Bluff, AR 785,024 819,469 4,136 0.53%120 Athens-Clarke County, GA 166,079 175,085 4,125 2.48%121 Huntsville-Decatur, AL 488,243 517,006 4,095 0.84%122 Eugene-Springfield, OR 322,959 335,180 4,088 1.27%123 Dayton-Springfield-Greenville, OH 1,085,094 1,078,634 4,082 0.38%124 Chattanooga-Cleveland-Athens, TN-GA 629,561 651,489 3,953 0.63%125 Palm Bay-Melbourne-Titusville, FL 476,230 531,250 3,855 0.81%126 Moses Lake, WA 74,698 81,229 3,753 5.02%127 Edwards, CO 49,471 55,268 3,742 7.56%128 Toledo-Fremont, OH 720,980 718,372 3,683 0.51%129 Rochester, MN 163,618 176,984 3,668 2.24%130 State College, PA 135,758 140,561 3,665 2.70%131 South Bend-Mishawaka, IN-MI 316,663 318,156 3,602 1.14%132 Savannah-Hinesville-Fort Stewart, GA 364,914 382,510 3,566 0.98%133 Columbus-Auburn-Opelika, GA-AL 420,965 430,363 3,563 0.85%134 Reading, PA 373,638 396,314 3,556 0.95%135 Killeen-Temple-Fort Hood, TX 330,714 351,528 3,541 1.07%136 Mobile-Daphne-Fairhope, AL 540,258 564,013 3,536 0.65%137 Corpus Christi-Kingsville, TX 435,243 444,727 3,481 0.80%138 Fort Collins-Loveland, CO 251,494 271,927 3,473 1.38%139 Anchorage, AK 319,605 351,049 3,468 1.09%140 Bellingham, WA 166,814 183,471 3,425 2.05%141 Kalamazoo-Portage, MI 314,866 319,348 3,400 1.08%142 Fayetteville, NC 336,609 345,536 3,391 1.01%143 Waco, TX 213,517 224,668 3,278 1.54%144 Hilton Head Island-Beaufort, SC 141,615 159,247 3,276 2.31%145 Sioux City-Vermillion, IA-NE-SD 156,590 155,566 3,242 2.07%146 Hanford-Corcoran, CA 129,461 143,420 3,230 2.49%147 Tallahassee, FL 320,304 334,886 3,225 1.01%148 San Luis Obispo-Paso Robles, CA 246,681 255,478 3,206 1.30%149 Charlottesville, VA 174,021 188,424 3,197 1.84%150 Beaumont-Port Arthur, TX 385,090 383,530 3,189 0.83%151 Kahului-Wailuku, HI 128,094 139,884 3,113 2.43%152 Fort Smith, AR-OK 273,170 284,994 3,097 1.13%153 Bloomington, IN 175,506 177,709 3,078 1.75%154 Ames-Boone, IA 106,205 106,554 3,053 2.87%155 Iowa City, IA 131,676 138,524 3,012 2.29%156 Portland-Lewiston-South Portland, ME 591,361 622,266 3,006 0.51%157 Lancaster, PA 470,658 490,562 2,919 0.62%158 Davenport-Moline-Rock Island, IA-IL 376,019 376,309 2,882 0.77%159 Amarillo, TX 226,522 238,664 2,864 1.26%160 Longview-Marshall, TX 256,152 264,960 2,709 1.06%161 Green Bay, WI 282,599 297,493 2,689 0.95%162 Rio Grande City, TX 53,597 60,941 2,680 5.00%163 Augusta-Richmond County, GA-SC 499,684 520,332 2,675 0.54%164 Lumberton-Laurinburg, NC 159,337 164,766 2,674 1.68%165 Burlington-South Burlington, VT 198,889 205,230 2,640 1.33%166 Clewiston, FL 36,210 39,561 2,626 7.25%167 Hilo, HI 148,677 167,293 2,579 1.73%168 Wilmington, NC 274,532 315,144 2,562 0.93%169 Myrtle Beach-Conway-Georgetown, SC 252,426 287,975 2,554 1.01%170 Arcadia, FL 32,209 35,406 2,550 7.92%171 Chico, CA 203,171 214,185 2,523 1.24%172 Albany-Corvallis-Lebanon, OR 181,222 187,554 2,522 1.39%173 Wenatchee, WA 99,219 104,768 2,463 2.48%174 Sioux Falls, SD 187,093 207,918 2,390 1.28%175 Columbia, MO 145,666 153,283 2,385 1.64%176 York-Hanover-Gettysburg, PA 473,043 508,550 2,376 0.50%177 Blacksburg-Christiansburg-Radford, VA 151,272 151,057 2,375 1.57%178 Pensacola-Ferry Pass-Brent, FL 412,153 439,877 2,361 0.57%
Demographia US Metropolitan Area International Migration Report: 2000-2005 17
179 Erie, PA 280,843 280,446 2,317 0.83%180 Niles-Benton Harbor, MI 162,453 162,611 2,299 1.42%181 Dodge City, KS 32,458 33,751 2,294 7.07%182 Garden City, KS 40,523 38,988 2,285 5.64%183 Key West-Marathon, FL 79,589 76,329 2,276 2.86%184 Logan, UT-ID 102,720 110,426 2,264 2.20%185 Norwich-New London, CT 259,088 266,618 2,261 0.87%186 Harrisonburg, VA 108,193 111,689 2,248 2.08%187 Waterloo-Cedar Falls, IA 163,706 161,897 2,241 1.37%188 Appleton-Oshkosh-Neenah, WI 358,365 374,625 2,235 0.62%189 Mount Vernon-Anacortes, WA 102,979 113,171 2,230 2.17%190 Fargo-Wahpeton, ND-MN 199,503 208,999 2,172 1.09%191 Greenville, NC 152,772 162,596 2,163 1.42%192 Lawrence, KS 99,962 102,914 2,154 2.15%193 Macon-Warner Robins-Fort Valley, GA 356,801 379,669 2,152 0.60%194 Barnstable Town, MA 222,230 226,514 2,137 0.96%195 Morristown-Newport, TN 156,646 165,504 2,136 1.36%196 Alamogordo, NM 62,298 63,538 2,126 3.41%197 Midland-Odessa, TX 237,132 246,710 2,121 0.89%198 Binghamton, NY 252,320 248,422 2,112 0.84%199 Gulfport-Biloxi-Pascagoula, MS 396,754 412,582 2,102 0.53%200 Lafayette-Acadiana, LA 512,720 526,896 2,014 0.39%201 Bowling Green, KY 104,166 110,990 2,000 1.92%202 Prescott, AZ 167,517 198,701 1,922 1.15%203 Sebring, FL 87,366 95,496 1,915 2.19%204 Liberal, KS 22,510 23,274 1,892 8.41%205 Sierra Vista-Douglas, AZ 117,755 126,106 1,890 1.61%206 Ocala, FL 258,916 303,442 1,887 0.73%207 Seaford, DE 156,638 176,548 1,867 1.19%208 Ukiah, CA 86,265 88,161 1,853 2.15%209 Jackson-Yazoo City, MS 525,346 550,775 1,811 0.34%210 Manhattan, KS 108,999 106,540 1,809 1.66%211 Stillwater, OK 68,190 69,151 1,780 2.61%212 Peoria-Canton, IL 405,149 406,869 1,772 0.44%213 Lubbock-Levelland, TX 272,416 281,757 1,748 0.64%214 Roanoke, VA 288,309 292,983 1,739 0.60%215 Sanford, NC 49,040 55,704 1,715 3.50%216 Bloomington-Normal, IL 150,433 159,013 1,698 1.13%217 Lake Havasu City-Kingman, AZ 155,032 187,200 1,667 1.08%218 Scranton--Wilkes-Barre, PA 560,625 550,546 1,645 0.29%218 Vero Beach, FL 112,947 128,594 1,645 1.46%220 Carbondale, IL 59,612 57,954 1,644 2.76%221 Eagle Pass, TX 47,297 51,181 1,641 3.47%222 Cedar Rapids, IA 237,230 246,412 1,582 0.67%223 Janesville, WI 152,307 157,538 1,517 1.00%224 Medford, OR 181,269 195,322 1,498 0.83%225 Twin Falls, ID 82,626 89,057 1,492 1.81%226 Johnson City-Kingsport-Bristol (Tri-Cities), TN-VA 480,091 490,238 1,491 0.31%227 Nogales, AZ 38,381 42,009 1,487 3.87%228 Goldsboro, NC 113,329 114,448 1,454 1.28%229 Pendleton-Hermiston, OR 81,543 85,544 1,439 1.76%230 Pullman, WA 40,740 40,170 1,436 3.52%231 Wilson, NC 73,814 76,281 1,422 1.93%232 Silverthorne, CO 23,548 24,892 1,395 5.92%233 Albertville, AL 82,231 85,634 1,384 1.68%234 Grand Island, NE 68,305 69,878 1,374 2.01%235 Corsicana, TX 45,124 48,687 1,362 3.02%236 Clarksville, TN-KY 232,000 243,665 1,351 0.58%237 Wauchula, FL 26,938 28,286 1,347 5.00%238 Rome, GA 90,565 94,198 1,324 1.46%239 Wichita Falls, TX 151,524 146,276 1,317 0.87%
Demographia US Metropolitan Area International Migration Report: 2000-2005 18
240 Tuscaloosa, AL 192,034 196,885 1,308 0.68%241 Salisbury-Ocean Pines, MD 155,934 164,997 1,283 0.82%242 Morgantown, WV 111,200 114,501 1,282 1.15%243 Guymon, OK 20,107 20,112 1,268 6.31%244 Youngstown-Warren-East Liverpool, OH-PA 715,039 704,096 1,260 0.18%245 Del Rio, TX 44,856 47,596 1,256 2.80%246 Sherman-Denison, TX 110,595 116,834 1,254 1.13%247 Topeka, KS 224,551 229,075 1,250 0.56%248 Mount Pleasant, TX 28,118 29,445 1,248 4.44%249 Shelbyville, TN 37,586 42,204 1,242 3.30%250 Springfield, MO 368,374 398,124 1,238 0.34%251 Moultrie, GA 42,053 43,915 1,213 2.88%252 Idaho Falls-Blackfoot, ID 143,412 157,175 1,208 0.84%253 Evansville, IN-KY 342,815 349,543 1,206 0.35%254 Flagstaff, AZ 116,320 123,866 1,175 1.01%255 Lynchburg, VA 228,616 236,910 1,171 0.51%256 Rocky Mount, NC 143,026 145,507 1,142 0.80%257 Shreveport-Bossier City-Minden, LA 417,796 424,589 1,126 0.27%258 Calhoun, GA 44,104 50,279 1,115 2.53%259 Nacogdoches, TX 59,203 60,468 1,099 1.86%260 Victoria, TX 111,663 113,356 1,094 0.98%260 Carson City, NV 52,457 56,062 1,094 2.09%262 Lexington, NE 26,508 26,637 1,082 4.08%263 Montgomery-Alexander City, AL 400,205 409,123 1,080 0.27%264 Okeechobee, FL 35,910 39,836 1,079 3.00%265 Whitewater, WI 93,759 99,844 1,077 1.15%266 Martinsville, VA 73,346 71,426 1,058 1.44%267 Fort Walton Beach-Crestview-Destin, FL 170,498 182,172 1,045 0.61%268 Walla Walla, WA 55,180 57,558 1,037 1.88%269 Emporia, KS 38,965 38,690 1,034 2.65%270 Joplin, MO 157,322 166,178 1,032 0.66%271 Claremont-Lebanon, NH-VT 207,845 215,064 1,028 0.49%272 Athens, OH 62,223 62,062 1,023 1.64%273 Fort Morgan, CO 27,171 27,995 1,012 3.72%274 Russellville, AR 75,608 77,971 1,002 1.33%275 Southern Pines-Pinehurst, NC 74,769 81,685 994 1.33%276 Douglas, GA 45,022 47,704 983 2.18%277 Pueblo, CO 141,472 151,322 975 0.69%278 Punta Gorda, FL 141,627 157,536 972 0.69%279 Saginaw-Bay City-Saginaw Township North, MI 320,196 317,385 971 0.30%280 Fort Payne, AL 64,452 67,271 958 1.49%281 Sheboygan, WI 112,646 114,610 954 0.85%282 Jackson-Humboldt, TN 155,529 159,005 950 0.61%283 Abilene, TX 160,245 158,291 942 0.59%284 St. George, UT 90,354 118,885 939 1.04%285 Lufkin, TX 80,130 81,557 918 1.15%285 Tifton, GA 38,407 40,793 918 2.39%287 Grand Forks, ND-MN 97,478 97,073 917 0.94%288 North Wilkesboro, NC 65,632 67,390 914 1.39%289 Battle Creek, MI 137,985 139,191 903 0.65%290 Valdosta, GA 119,560 124,838 884 0.74%291 Roswell, NM 61,382 61,860 878 1.43%292 Deming, NM 25,016 26,498 877 3.51%293 Greenwood, SC 66,271 67,979 872 1.32%294 Pittsfield, MA 134,953 131,868 866 0.64%295 Dothan-Enterprise-Ozark, AL 223,605 230,909 862 0.39%296 Elko, NV 46,942 46,998 848 1.81%297 Dover, DE 126,697 143,968 840 0.66%298 Laurel, MS 83,107 84,322 837 1.01%299 Cookeville, TN 93,417 98,175 827 0.89%300 Midland, MI 82,874 84,064 810 0.98%
Demographia US Metropolitan Area International Migration Report: 2000-2005 19
301 Eureka-Arcata-Fortuna, CA 126,518 128,376 807 0.64%302 Dumas, TX 20,121 20,348 806 4.01%303 Fond du Lac-Beaver Dam, WI 183,193 187,440 796 0.43%304 Mankato-North Mankato, MN 85,712 88,878 792 0.92%305 Storm Lake, IA 20,411 20,151 791 3.88%306 Cornelia, GA 35,902 39,603 782 2.18%307 Terre Haute, IN 170,943 168,059 778 0.46%308 Starkville, MS 42,902 41,247 766 1.79%309 Longview, WA 92,948 97,325 765 0.82%310 Jackson, WY-ID 24,250 26,499 764 3.15%311 Chambersburg, PA 129,313 137,409 763 0.59%312 East Stroudsburg, PA 138,687 163,234 750 0.54%313 Kapaa, HI 58,463 62,640 749 1.28%314 Muncie, IN 118,769 116,362 748 0.63%315 Hattiesburg, MS 123,812 131,871 741 0.60%316 New Bern, NC 114,751 113,841 737 0.64%316 Duluth, MN-WI 275,486 275,413 737 0.27%318 Jacksonville, NC 150,355 152,440 733 0.49%319 Plymouth, IN 45,128 46,945 731 1.62%320 Marshalltown, IA 39,311 39,418 727 1.85%321 Jefferson City, MO 140,052 143,867 719 0.51%322 Bangor, ME 144,919 147,068 714 0.49%322 Jonesboro, AR 107,762 112,084 714 0.66%324 Brunswick, GA 93,044 98,433 713 0.77%325 Albany, GA 157,833 162,842 707 0.45%326 Farmington, NM 113,801 126,208 706 0.62%327 Panama City-Lynn Haven, FL 148,217 161,558 699 0.47%328 San Angelo, TX 105,781 105,367 696 0.66%329 Sturgis, MI 62,422 62,984 691 1.11%330 Ontario, OR-ID 52,193 53,527 690 1.32%331 Hood River, OR 20,411 21,284 689 3.38%332 El Campo, TX 41,188 41,554 688 1.67%333 Grand Junction, CO 116,255 129,872 687 0.59%334 Burley, ID 41,590 40,338 668 1.61%335 Hope, AR 33,542 32,933 666 1.99%336 Redding, CA 163,256 179,904 665 0.41%337 Wausau-Merrill, WI 155,475 159,260 659 0.42%338 Vidalia, GA 34,337 36,183 657 1.91%339 Canton-Massillon, OH 406,934 409,996 655 0.16%340 Warsaw, IN 74,057 76,072 653 0.88%341 Dubuque, IA 89,143 91,631 651 0.73%342 Fairbanks, AK 82,840 87,560 649 0.78%343 Clovis-Portales, NM 63,062 64,084 646 1.02%344 Centralia, WA 68,600 72,449 644 0.94%345 Eau Claire-Menomonie, WI 188,195 195,747 642 0.34%346 Bend-Prineville, OR 134,549 163,449 637 0.47%347 Ottawa-Streator, IL 153,098 154,028 629 0.41%347 McMinnville, TN 38,276 39,753 629 1.64%349 Hastings, NE 38,190 39,803 627 1.64%350 Houma-Bayou Cane-Thibodaux, LA 194,477 199,670 624 0.32%351 Moscow, ID 34,935 34,714 620 1.77%352 Mount Pleasant, MI 63,351 65,618 605 0.95%353 Henderson, NC 42,954 43,771 604 1.41%354 Springfield, IL 201,437 205,527 602 0.30%355 Ogdensburg-Massena, NY 111,931 111,380 598 0.53%356 Watertown-Fort Atkinson, WI 74,021 79,328 595 0.80%357 Jackson, MI 158,422 163,629 592 0.37%358 Rolla, MO 39,825 42,125 589 1.48%359 Florence, SC 193,155 198,443 585 0.30%360 Watertown-Fort Drum, NY 111,738 116,384 577 0.52%361 Muscatine, IA 53,905 54,598 575 1.07%
Demographia US Metropolitan Area International Migration Report: 2000-2005 20
362 Hagerstown-Martinsburg, MD-WV 222,771 251,311 565 0.25%363 Clearlake, CA 58,309 65,147 561 0.96%364 Findlay-Tiffin, OH 129,978 130,986 547 0.42%365 Lake Charles-Jennings, LA 225,003 226,249 545 0.24%366 Pocatello, ID 83,103 85,908 542 0.65%367 Statesboro, GA 55,983 61,454 540 0.96%367 Pittsburg, KS 38,242 38,222 540 1.41%369 Ellensburg, WA 33,362 36,841 538 1.61%370 Salina, KS 59,760 60,042 532 0.89%371 Hobbs, NM 55,511 56,719 518 0.93%372 Tahlequah, OK 42,521 44,671 517 1.22%373 Aberdeen, WA 67,194 70,900 516 0.77%374 Austin, MN 38,603 38,799 515 1.33%375 Seymour, IN 41,335 42,237 508 1.23%376 Wooster, OH 111,564 113,697 506 0.45%377 Red Bluff, CA 56,039 61,197 502 0.90%378 Traverse City, MI 131,342 141,011 501 0.38%379 Gadsden, AL 103,459 103,189 497 0.48%380 Union City-Martin, TN-KY 75,097 73,162 496 0.66%381 Logansport, IN 40,930 40,130 495 1.21%381 Stephenville, TX 33,001 34,076 495 1.50%381 Kodiak, AK 13,913 13,051 495 3.56%381 Lawton, OK 114,996 112,429 495 0.43%385 Manitowoc, WI 82,887 81,949 490 0.59%386 Huntington-Ashland, WV-KY-OH 288,649 286,012 489 0.17%386 Tullahoma, TN 93,024 97,896 489 0.53%388 Charleston, WV 309,635 306,435 488 0.16%389 Owatonna, MN 33,680 35,755 482 1.43%390 Norfolk, NE 49,538 49,622 477 0.96%391 Plainview, TX 36,602 36,233 475 1.30%392 Danville, VA 110,156 107,997 473 0.43%393 Kerrville, TX 43,653 46,496 472 1.08%394 Missoula, MT 95,802 100,086 471 0.49%395 Rapid City, SD 112,818 118,203 465 0.41%395 Sunbury-Lewisburg-Selinsgrove, PA 173,726 173,948 465 0.27%397 Murray, KY 34,177 35,122 463 1.35%398 Astoria, OR 35,630 36,798 456 1.28%399 Bozeman, MT 67,831 78,210 453 0.67%400 Palatka, FL 70,423 73,568 448 0.64%401 Mountain Home, ID 29,130 28,634 446 1.53%402 La Crosse, WI-MN 126,838 128,899 445 0.35%403 Sedalia, MO 39,403 40,121 443 1.12%403 Paducah-Mayfield, KY-IL 135,793 135,708 443 0.33%405 Kinston, NC 59,648 57,961 438 0.73%406 Barre, VT 58,039 59,478 437 0.75%406 Coldwater, MI 45,787 46,460 437 0.95%408 Fort Polk South-De Ridder, LA 85,517 83,307 426 0.50%408 Texarkana, TX-Texarkana, AR 129,749 133,805 426 0.33%410 Rexburg, ID 39,286 43,217 425 1.08%411 Alexandria, LA 145,035 147,965 422 0.29%412 Waycross, GA 51,119 51,611 421 0.82%413 Macomb, IL 32,913 31,966 420 1.28%414 Winona, MN 49,985 49,276 419 0.84%415 Oxford, MS 38,744 40,842 418 1.08%416 Cape Girardeau-Sikeston-Jackson, MO-IL 130,734 133,556 409 0.31%417 Great Bend, KS 28,205 28,105 405 1.44%418 Indiana, PA 89,605 88,703 403 0.45%419 Laramie, WY 32,014 30,890 402 1.26%420 Worthington, MN 20,832 20,508 401 1.92%421 Fergus Falls, MN 57,159 57,658 399 0.70%422 Klamath Falls, OR 63,775 66,192 395 0.62%
Demographia US Metropolitan Area International Migration Report: 2000-2005 21
423 Port Angeles, WA 64,525 69,689 393 0.61%424 Sumter, SC 104,646 105,517 389 0.37%425 Paris, TX 48,499 49,644 385 0.79%425 Jamestown-Dunkirk-Fredonia, NY 139,750 136,409 385 0.28%427 Muskogee, OK 69,451 70,607 384 0.55%427 Willmar, MN 41,203 41,199 384 0.93%429 Houghton, MI 38,317 37,900 378 0.99%429 Sulphur Springs, TX 31,960 33,381 378 1.18%431 Rockingham, NC 46,564 46,781 377 0.81%432 Plattsburgh, NY 79,894 82,047 373 0.47%433 Washington, NC 44,958 46,018 368 0.82%434 Brenham, TX 30,373 31,521 363 1.20%435 Florence-Muscle Shoals, AL 142,950 142,351 362 0.25%436 Cedar City, UT 33,779 38,311 361 1.07%437 Anniston-Oxford, AL 112,249 112,141 359 0.32%438 Homosassa Springs, FL 118,085 134,370 358 0.30%439 Hot Springs, AR 88,068 93,551 355 0.40%440 Fairmont-Clarksburg, WV 148,742 148,645 353 0.24%440 Cheyenne, WY 81,607 85,163 353 0.43%442 Wisconsin Rapids-Marshfield, WI 75,555 75,234 351 0.46%443 Columbus, NE 31,662 31,262 347 1.10%444 Kokomo-Peru, IN 137,623 136,982 346 0.25%445 Crescent City, CA 27,507 28,705 342 1.24%446 Tupelo, MS 125,251 130,360 337 0.27%447 Monroe-Bastrop, LA 201,074 201,127 336 0.17%447 Taos, NM 29,979 31,722 336 1.12%449 Stevens Point, WI 67,182 67,585 330 0.49%450 Los Alamos, NM 18,343 18,822 328 1.79%451 Scottsbluff, NE 37,770 37,485 326 0.86%452 Minot, ND 67,392 63,700 325 0.48%453 Marshall, MN 25,425 24,472 322 1.27%454 Lima-Van Wert-Wapakoneta, OH 184,743 182,630 321 0.17%455 Mansfield-Bucyrus, OH 175,818 173,723 319 0.18%456 Staunton-Waynesboro, VA 108,988 114,331 318 0.29%457 Boone, NC 42,695 42,472 314 0.74%457 Palestine, TX 55,109 56,408 314 0.57%459 Hereford, TX 18,561 18,538 312 1.68%460 Jasper, IN 52,511 53,624 308 0.59%461 Danville, KY 51,058 53,485 305 0.60%461 Ocean City, NJ 102,326 99,286 305 0.30%463 Montrose, CO 33,432 37,482 303 0.91%464 Johnstown, PA 152,598 148,073 302 0.20%465 Beckley-Oak Hill, WV 126,799 125,990 299 0.24%466 Big Spring, TX 33,627 32,522 295 0.88%466 Ruston, LA 57,906 57,243 295 0.51%468 Enid, OK 57,813 56,958 293 0.51%469 Adrian, MI 98,890 102,033 292 0.30%470 Norwalk, OH 59,487 60,385 288 0.48%471 Decatur, IL 114,706 110,167 285 0.25%472 Elmira, NY 91,070 89,512 281 0.31%473 Payson, AZ 51,335 51,663 280 0.55%474 Danville, IL 83,919 82,344 279 0.33%475 Coeur d'Alene, ID 108,685 127,668 278 0.26%476 Greeneville, TN 62,909 65,318 277 0.44%477 Kearney, NE 49,141 50,346 275 0.56%477 Hutchinson, KS 64,790 63,558 275 0.42%479 Troy, AL 29,605 29,639 271 0.92%480 Coos Bay, OR 62,779 64,711 269 0.43%481 Big Rapids, MI 40,553 42,391 268 0.66%482 Juneau, AK 30,711 30,987 265 0.86%483 Marshall, MO 23,756 23,075 263 1.11%
Demographia US Metropolitan Area International Migration Report: 2000-2005 22
484 Altus, OK 28,439 26,518 262 0.92%485 Corning, NY 98,726 98,632 261 0.26%486 Sidney, OH 47,910 48,736 260 0.54%486 Ponca City, OK 48,080 46,480 260 0.54%488 Richmond, IN 71,097 69,192 258 0.36%489 Bismarck, ND 94,719 99,346 257 0.27%489 Pampa, TX 23,631 22,299 257 1.09%491 Uvalde, TX 25,926 26,955 255 0.98%492 Owensboro, KY 109,875 111,599 253 0.23%493 Washington, IN 29,820 30,466 252 0.85%494 Bainbridge, GA 28,240 28,618 249 0.88%495 Fitzgerald, GA 27,415 27,409 247 0.90%495 Gallup, NM 74,798 71,918 247 0.33%497 Arkadelphia, AR 23,546 22,916 246 1.04%498 Augusta-Waterville, ME 117,114 120,986 245 0.21%499 Durant, OK 36,534 37,815 240 0.66%500 Sterling, IL 60,653 59,863 239 0.39%501 Borger, TX 23,857 22,484 237 0.99%502 Casper, WY 66,533 69,799 235 0.35%503 Branson, MO 68,361 73,916 232 0.34%504 Eufaula, AL-GA 31,636 30,881 229 0.72%505 Sterling, CO 20,504 20,719 228 1.11%505 Brookings, SD 28,220 28,121 228 0.81%507 St. Joseph, MO-KS 122,336 121,961 223 0.18%507 Roseburg, OR 100,399 104,202 223 0.22%509 Carlsbad-Artesia, NM 51,658 51,437 221 0.43%510 Keene, NH 73,825 77,287 219 0.30%510 Charleston-Mattoon, IL 64,449 62,038 219 0.34%510 Williamsport-Lock Haven, PA 157,958 155,834 219 0.14%513 City of The Dalles, OR 23,791 23,593 218 0.92%513 Albert Lea, MN 32,584 31,946 218 0.67%515 Lake City, FL 56,513 64,040 216 0.38%516 Galesburg, IL 74,571 70,867 215 0.29%517 Orangeburg, SC 91,582 92,167 214 0.23%518 Kill Devil Hills, NC 29,967 33,903 211 0.70%518 Corbin-London, KY 88,580 94,367 211 0.24%520 Fort Leonard Wood, MO 41,165 44,187 210 0.51%520 Lewisburg, TN 26,767 28,372 210 0.78%520 Rock Springs, WY 37,613 37,975 210 0.56%523 Americus, GA 36,966 37,034 209 0.57%524 Columbus-West Point, MS 83,565 81,118 208 0.25%524 Las Vegas, NM 30,126 29,530 208 0.69%526 Morehead City, NC 59,383 62,525 207 0.35%527 Dyersburg, TN 37,279 37,829 204 0.55%528 Fallon, NV 23,982 24,556 201 0.84%529 Wheeling, WV-OH 153,172 148,677 200 0.13%530 Vincennes, IN 39,256 38,366 198 0.50%531 Hays, KS 27,507 26,767 196 0.71%532 Roanoke Rapids, NC 79,456 77,506 193 0.24%533 Great Falls, MT 80,357 79,569 192 0.24%534 Bishop, CA 17,945 18,156 191 1.06%535 Cordele, GA 21,996 22,017 190 0.86%536 Ardmore, OK 54,452 56,251 189 0.35%537 Bemidji, MN 39,650 42,871 187 0.47%538 Natchitoches, LA 39,080 38,541 185 0.47%539 Kalispell, MT 74,471 83,172 183 0.25%540 Bennington, VT 36,994 36,999 182 0.49%541 Billings, MT 138,904 146,593 178 0.13%541 Clinton, IA 50,149 49,717 178 0.35%541 Elizabeth City, NC 53,150 59,317 178 0.33%544 La Grande, OR 24,530 24,540 177 0.72%
Demographia US Metropolitan Area International Migration Report: 2000-2005 23
545 Ottumwa, IA 36,051 35,965 175 0.49%546 Durango, CO 43,941 47,452 174 0.40%546 Greensburg, IN 24,555 25,184 174 0.71%548 Helena, MT 65,765 69,619 173 0.26%548 El Dorado, AR 45,629 44,186 173 0.38%550 Kirksville, MO 29,147 28,817 172 0.59%551 Fort Dodge, IA 40,235 39,003 171 0.43%552 Lewiston, ID-WA 57,961 59,109 169 0.29%553 New Philadelphia-Dover, OH 90,914 91,944 168 0.18%554 Easton, MD 33,812 35,683 165 0.49%554 Morgan City, LA 53,500 51,416 165 0.31%556 Parkersburg-Marietta, WV-OH 164,624 162,529 164 0.10%556 Altoona, PA 129,144 126,795 164 0.13%558 Dublin, GA 53,434 56,434 163 0.31%559 Hammond, LA 100,588 106,502 160 0.16%560 Brownwood, TX 37,674 38,664 151 0.40%561 Forest City, NC 62,899 63,771 150 0.24%562 Lamesa, TX 14,985 14,256 146 0.97%562 Blytheville, AR 51,979 47,911 146 0.28%564 Cumberland, MD-WV 102,008 100,667 145 0.14%564 Batesville, AR 34,233 34,737 145 0.42%566 Greenville, MS 62,977 59,220 144 0.23%567 Thomasville, GA 42,737 44,692 139 0.33%568 Marquette, MI 64,634 64,760 137 0.21%568 Pottsville, PA 150,336 147,447 137 0.09%570 Quincy, IL-MO 78,771 77,226 135 0.17%570 Walterboro, SC 38,264 39,605 135 0.35%570 Marion, IN 73,403 70,557 135 0.18%573 Bluefield, WV-VA 107,578 106,384 134 0.12%573 Bloomsburg-Berwick, PA 82,387 82,971 134 0.16%575 Sandusky, OH 79,551 78,665 132 0.17%576 Weirton-Steubenville, WV-OH 132,008 126,464 131 0.10%576 Portsmouth, OH 79,195 76,561 131 0.17%578 Phoenix Lake-Cedar Ridge, CA 54,501 59,380 130 0.24%578 St. Marys, GA 43,664 45,759 130 0.30%578 Coshocton, OH 36,655 36,945 130 0.35%578 Canon City, CO 46,145 47,766 130 0.28%582 Angola, IN 33,214 33,773 129 0.39%583 Summerville, GA 25,470 26,570 128 0.50%583 Ada, OK 35,143 35,346 128 0.36%585 Burlington, IA-IL 50,564 48,782 127 0.25%585 Greenwood, MS 48,716 46,828 127 0.26%587 Coffeyville, KS 36,252 34,570 125 0.34%587 Pontiac, IL 39,678 39,186 125 0.32%589 Pecos, TX 13,137 11,638 124 0.94%590 Miami, OK 33,194 32,866 123 0.37%590 Mason City, IA 54,356 52,413 123 0.23%590 Maryville, MO 21,912 21,710 123 0.56%590 West Plains, MO 37,238 38,400 123 0.33%594 Safford, AZ 42,036 40,594 122 0.29%594 Somerset, KY 56,217 59,200 122 0.22%596 Bellefontaine, OH 46,005 46,580 120 0.26%596 Milledgeville, GA 54,776 54,873 120 0.22%596 Glasgow, KY 48,070 50,270 120 0.25%599 Ashland, OH 52,523 54,123 119 0.23%600 Grants Pass, OR 75,726 80,761 118 0.16%600 Kennett, MO 33,155 32,545 118 0.36%602 Moberly, MO 24,663 25,336 117 0.47%603 Oskaloosa, IA 22,335 22,364 116 0.52%604 Marinette, WI-MI 68,710 68,402 115 0.17%605 Talladega-Sylacauga, AL 80,321 80,457 113 0.14%
Demographia US Metropolitan Area International Migration Report: 2000-2005 24
605 Poplar Bluff, MO 40,867 41,338 113 0.28%607 Corinth, MS 34,558 35,306 111 0.32%607 Dillon, SC 30,722 30,974 111 0.36%609 Jesup, GA 26,565 28,390 109 0.41%609 Magnolia, AR 25,603 24,695 109 0.43%611 Dixon, IL 36,062 35,669 107 0.30%612 Sault Ste. Marie, MI 38,543 38,780 106 0.28%612 Brownsville, TN 19,797 19,656 106 0.54%614 North Platte, NE 35,939 36,883 105 0.29%614 Meridian, MS 106,569 105,134 105 0.10%616 Oneonta, NY 61,676 62,746 104 0.17%616 Malone, NY 51,134 51,033 104 0.20%618 Brainerd, MN 82,249 88,827 103 0.13%619 Jacksonville, IL 42,153 41,134 102 0.24%620 Taylorville, IL 35,372 35,176 101 0.29%620 McAlester, OK 43,953 44,641 101 0.23%622 Zanesville, OH 84,585 85,579 97 0.11%622 Vicksburg, MS 49,644 49,131 97 0.20%624 Lincoln, IL 31,183 30,603 93 0.30%625 Ketchikan, AK 14,070 13,262 91 0.65%625 Alma, MI 42,285 42,345 91 0.22%627 Platteville, WI 49,597 49,671 90 0.18%628 Keokuk-Fort Madison, IA-MO 45,468 44,028 89 0.20%629 Somerset, PA 80,023 78,907 88 0.11%629 Watertown, SD 31,437 31,717 88 0.28%631 Gillette, WY 33,698 37,405 87 0.26%631 Indianola, MS 34,369 32,311 87 0.25%633 Marion-Herrin, IL 61,296 63,617 83 0.14%634 Defiance, OH 39,500 39,112 82 0.21%634 Rutland, VT 63,400 63,743 82 0.13%636 Alice, TX 39,326 40,951 81 0.21%637 Rockland, ME 39,618 41,219 80 0.20%638 Vernon, TX 14,676 13,896 78 0.53%638 Snyder, TX 16,361 16,217 78 0.48%638 Berlin, NH-VT 39,570 40,257 78 0.20%641 Brookings, OR 21,137 22,427 77 0.36%642 Andrews, TX 13,004 12,748 76 0.58%642 Lawrenceburg, TN 39,926 41,101 76 0.19%642 Madison, IN 31,705 32,430 76 0.24%645 Middlesborough, KY 30,060 29,665 75 0.25%645 Grenada, MS 23,263 22,861 75 0.32%645 Pierre, SD 19,253 19,704 75 0.39%645 Spencer, IA 17,372 16,897 75 0.43%645 Huntingdon, PA 45,586 45,947 75 0.16%650 Maysville, KY 30,892 31,012 74 0.24%650 Meadville, PA 90,366 89,442 74 0.08%652 DuBois, PA 83,382 82,783 73 0.09%652 Mitchell, SD 21,880 22,524 73 0.33%654 Paris, TN 31,115 31,511 71 0.23%655 Camden, AR 34,534 32,691 70 0.20%655 Grants, NM 25,595 27,620 70 0.27%657 Sweetwater, TX 15,802 14,878 69 0.44%658 Bedford, IN 45,922 46,403 68 0.15%658 Dickinson, ND 23,524 22,886 68 0.29%660 Cadillac, MI 44,962 47,175 67 0.15%661 Silver City, NM 31,002 29,747 66 0.21%661 Madisonville, KY 46,519 46,705 66 0.14%661 Mount Vernon, IL 48,666 48,735 66 0.14%661 Alpena, MI 31,314 30,428 66 0.21%661 Monroe, WI 33,647 35,165 66 0.20%661 Effingham, IL 34,264 34,581 66 0.19%
Demographia US Metropolitan Area International Migration Report: 2000-2005 25
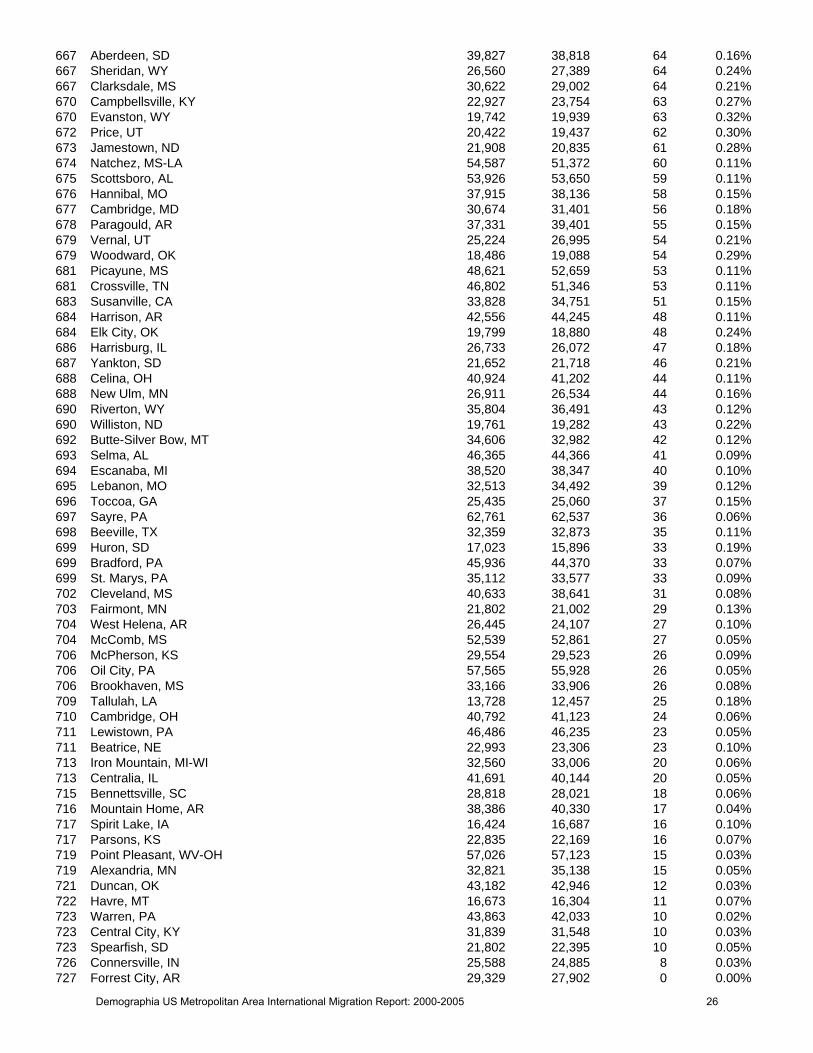
667 Aberdeen, SD 39,827 38,818 64 0.16%667 Sheridan, WY 26,560 27,389 64 0.24%667 Clarksdale, MS 30,622 29,002 64 0.21%670 Campbellsville, KY 22,927 23,754 63 0.27%670 Evanston, WY 19,742 19,939 63 0.32%672 Price, UT 20,422 19,437 62 0.30%673 Jamestown, ND 21,908 20,835 61 0.28%674 Natchez, MS-LA 54,587 51,372 60 0.11%675 Scottsboro, AL 53,926 53,650 59 0.11%676 Hannibal, MO 37,915 38,136 58 0.15%677 Cambridge, MD 30,674 31,401 56 0.18%678 Paragould, AR 37,331 39,401 55 0.15%679 Vernal, UT 25,224 26,995 54 0.21%679 Woodward, OK 18,486 19,088 54 0.29%681 Picayune, MS 48,621 52,659 53 0.11%681 Crossville, TN 46,802 51,346 53 0.11%683 Susanville, CA 33,828 34,751 51 0.15%684 Harrison, AR 42,556 44,245 48 0.11%684 Elk City, OK 19,799 18,880 48 0.24%686 Harrisburg, IL 26,733 26,072 47 0.18%687 Yankton, SD 21,652 21,718 46 0.21%688 Celina, OH 40,924 41,202 44 0.11%688 New Ulm, MN 26,911 26,534 44 0.16%690 Riverton, WY 35,804 36,491 43 0.12%690 Williston, ND 19,761 19,282 43 0.22%692 Butte-Silver Bow, MT 34,606 32,982 42 0.12%693 Selma, AL 46,365 44,366 41 0.09%694 Escanaba, MI 38,520 38,347 40 0.10%695 Lebanon, MO 32,513 34,492 39 0.12%696 Toccoa, GA 25,435 25,060 37 0.15%697 Sayre, PA 62,761 62,537 36 0.06%698 Beeville, TX 32,359 32,873 35 0.11%699 Huron, SD 17,023 15,896 33 0.19%699 Bradford, PA 45,936 44,370 33 0.07%699 St. Marys, PA 35,112 33,577 33 0.09%702 Cleveland, MS 40,633 38,641 31 0.08%703 Fairmont, MN 21,802 21,002 29 0.13%704 West Helena, AR 26,445 24,107 27 0.10%704 McComb, MS 52,539 52,861 27 0.05%706 McPherson, KS 29,554 29,523 26 0.09%706 Oil City, PA 57,565 55,928 26 0.05%706 Brookhaven, MS 33,166 33,906 26 0.08%709 Tallulah, LA 13,728 12,457 25 0.18%710 Cambridge, OH 40,792 41,123 24 0.06%711 Lewistown, PA 46,486 46,235 23 0.05%711 Beatrice, NE 22,993 23,306 23 0.10%713 Iron Mountain, MI-WI 32,560 33,006 20 0.06%713 Centralia, IL 41,691 40,144 20 0.05%715 Bennettsville, SC 28,818 28,021 18 0.06%716 Mountain Home, AR 38,386 40,330 17 0.04%717 Spirit Lake, IA 16,424 16,687 16 0.10%717 Parsons, KS 22,835 22,169 16 0.07%719 Point Pleasant, WV-OH 57,026 57,123 15 0.03%719 Alexandria, MN 32,821 35,138 15 0.05%721 Duncan, OK 43,182 42,946 12 0.03%722 Havre, MT 16,673 16,304 11 0.07%723 Warren, PA 43,863 42,033 10 0.02%723 Central City, KY 31,839 31,548 10 0.03%723 Spearfish, SD 21,802 22,395 10 0.05%726 Connersville, IN 25,588 24,885 8 0.03%727 Forrest City, AR 29,329 27,902 0 0.00%
Demographia US Metropolitan Area International Migration Report: 2000-2005 26

728 Mexico, MO 25,853 25,759 (1) -0.00%729 Wabash, IN 34,960 33,843 (2) -0.01%
Demographia US Metropolitan Area International Migration Report: 2000-2005 27
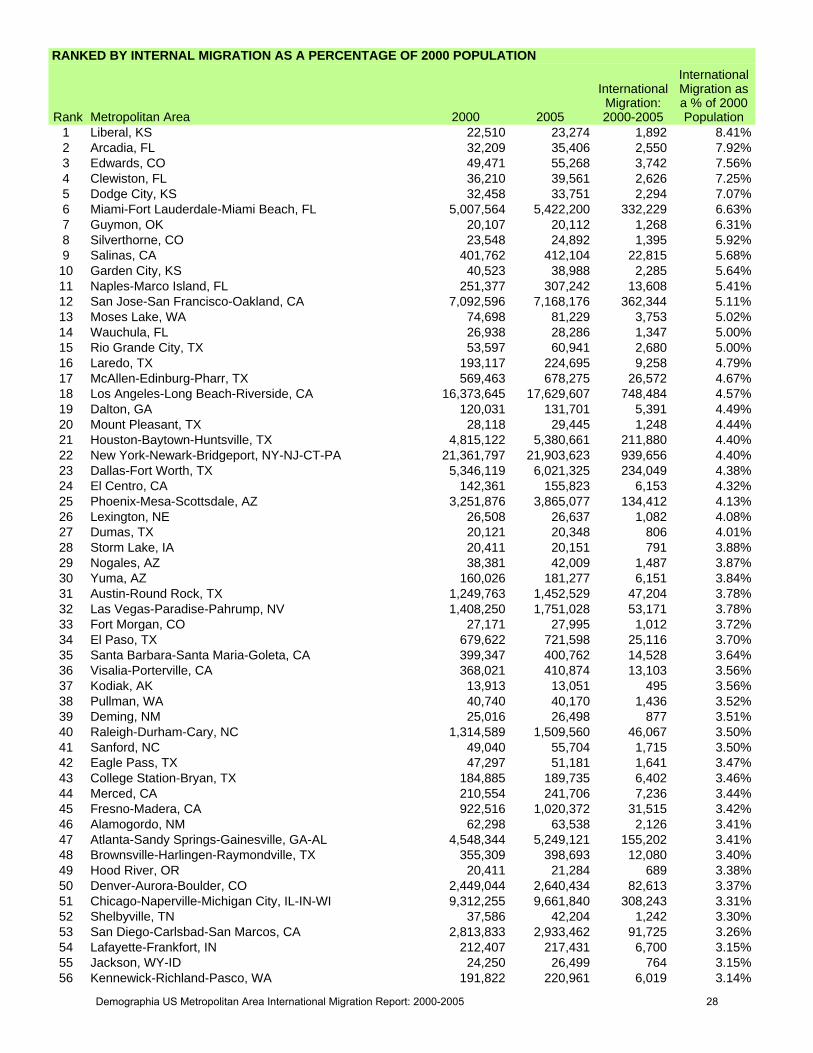
RANKED BY INTERNAL MIGRATION AS A PERCENTAGE OF 2000 POPULATION
Rank Metropolitan Area 2000 2005
InternationalMigration:2000-2005
InternationalMigration asa % of 2000Population
1 Liberal, KS 22,510 23,274 1,892 8.41%2 Arcadia, FL 32,209 35,406 2,550 7.92%3 Edwards, CO 49,471 55,268 3,742 7.56%4 Clewiston, FL 36,210 39,561 2,626 7.25%5 Dodge City, KS 32,458 33,751 2,294 7.07%6 Miami-Fort Lauderdale-Miami Beach, FL 5,007,564 5,422,200 332,229 6.63%7 Guymon, OK 20,107 20,112 1,268 6.31%8 Silverthorne, CO 23,548 24,892 1,395 5.92%9 Salinas, CA 401,762 412,104 22,815 5.68%10 Garden City, KS 40,523 38,988 2,285 5.64%11 Naples-Marco Island, FL 251,377 307,242 13,608 5.41%12 San Jose-San Francisco-Oakland, CA 7,092,596 7,168,176 362,344 5.11%13 Moses Lake, WA 74,698 81,229 3,753 5.02%14 Wauchula, FL 26,938 28,286 1,347 5.00%15 Rio Grande City, TX 53,597 60,941 2,680 5.00%16 Laredo, TX 193,117 224,695 9,258 4.79%17 McAllen-Edinburg-Pharr, TX 569,463 678,275 26,572 4.67%18 Los Angeles-Long Beach-Riverside, CA 16,373,645 17,629,607 748,484 4.57%19 Dalton, GA 120,031 131,701 5,391 4.49%20 Mount Pleasant, TX 28,118 29,445 1,248 4.44%21 Houston-Baytown-Huntsville, TX 4,815,122 5,380,661 211,880 4.40%22 New York-Newark-Bridgeport, NY-NJ-CT-PA 21,361,797 21,903,623 939,656 4.40%23 Dallas-Fort Worth, TX 5,346,119 6,021,325 234,049 4.38%24 El Centro, CA 142,361 155,823 6,153 4.32%25 Phoenix-Mesa-Scottsdale, AZ 3,251,876 3,865,077 134,412 4.13%26 Lexington, NE 26,508 26,637 1,082 4.08%27 Dumas, TX 20,121 20,348 806 4.01%28 Storm Lake, IA 20,411 20,151 791 3.88%29 Nogales, AZ 38,381 42,009 1,487 3.87%30 Yuma, AZ 160,026 181,277 6,151 3.84%31 Austin-Round Rock, TX 1,249,763 1,452,529 47,204 3.78%32 Las Vegas-Paradise-Pahrump, NV 1,408,250 1,751,028 53,171 3.78%33 Fort Morgan, CO 27,171 27,995 1,012 3.72%34 El Paso, TX 679,622 721,598 25,116 3.70%35 Santa Barbara-Santa Maria-Goleta, CA 399,347 400,762 14,528 3.64%36 Visalia-Porterville, CA 368,021 410,874 13,103 3.56%37 Kodiak, AK 13,913 13,051 495 3.56%38 Pullman, WA 40,740 40,170 1,436 3.52%39 Deming, NM 25,016 26,498 877 3.51%40 Raleigh-Durham-Cary, NC 1,314,589 1,509,560 46,067 3.50%41 Sanford, NC 49,040 55,704 1,715 3.50%42 Eagle Pass, TX 47,297 51,181 1,641 3.47%43 College Station-Bryan, TX 184,885 189,735 6,402 3.46%44 Merced, CA 210,554 241,706 7,236 3.44%45 Fresno-Madera, CA 922,516 1,020,372 31,515 3.42%46 Alamogordo, NM 62,298 63,538 2,126 3.41%47 Atlanta-Sandy Springs-Gainesville, GA-AL 4,548,344 5,249,121 155,202 3.41%48 Brownsville-Harlingen-Raymondville, TX 355,309 398,693 12,080 3.40%49 Hood River, OR 20,411 21,284 689 3.38%50 Denver-Aurora-Boulder, CO 2,449,044 2,640,434 82,613 3.37%51 Chicago-Naperville-Michigan City, IL-IN-WI 9,312,255 9,661,840 308,243 3.31%52 Shelbyville, TN 37,586 42,204 1,242 3.30%53 San Diego-Carlsbad-San Marcos, CA 2,813,833 2,933,462 91,725 3.26%54 Lafayette-Frankfort, IN 212,407 217,431 6,700 3.15%55 Jackson, WY-ID 24,250 26,499 764 3.15%56 Kennewick-Richland-Pasco, WA 191,822 220,961 6,019 3.14%
Demographia US Metropolitan Area International Migration Report: 2000-2005 28
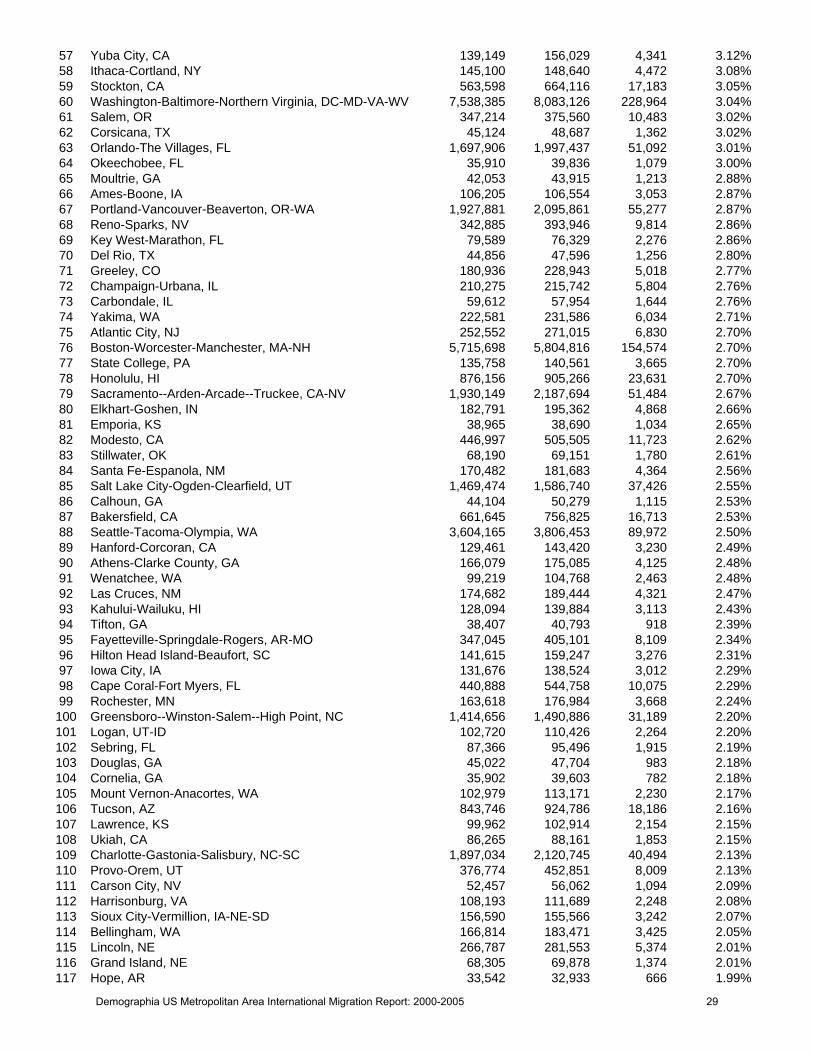
57 Yuba City, CA 139,149 156,029 4,341 3.12%58 Ithaca-Cortland, NY 145,100 148,640 4,472 3.08%59 Stockton, CA 563,598 664,116 17,183 3.05%60 Washington-Baltimore-Northern Virginia, DC-MD-VA-WV 7,538,385 8,083,126 228,964 3.04%61 Salem, OR 347,214 375,560 10,483 3.02%62 Corsicana, TX 45,124 48,687 1,362 3.02%63 Orlando-The Villages, FL 1,697,906 1,997,437 51,092 3.01%64 Okeechobee, FL 35,910 39,836 1,079 3.00%65 Moultrie, GA 42,053 43,915 1,213 2.88%66 Ames-Boone, IA 106,205 106,554 3,053 2.87%67 Portland-Vancouver-Beaverton, OR-WA 1,927,881 2,095,861 55,277 2.87%68 Reno-Sparks, NV 342,885 393,946 9,814 2.86%69 Key West-Marathon, FL 79,589 76,329 2,276 2.86%70 Del Rio, TX 44,856 47,596 1,256 2.80%71 Greeley, CO 180,936 228,943 5,018 2.77%72 Champaign-Urbana, IL 210,275 215,742 5,804 2.76%73 Carbondale, IL 59,612 57,954 1,644 2.76%74 Yakima, WA 222,581 231,586 6,034 2.71%75 Atlantic City, NJ 252,552 271,015 6,830 2.70%76 Boston-Worcester-Manchester, MA-NH 5,715,698 5,804,816 154,574 2.70%77 State College, PA 135,758 140,561 3,665 2.70%78 Honolulu, HI 876,156 905,266 23,631 2.70%79 Sacramento--Arden-Arcade--Truckee, CA-NV 1,930,149 2,187,694 51,484 2.67%80 Elkhart-Goshen, IN 182,791 195,362 4,868 2.66%81 Emporia, KS 38,965 38,690 1,034 2.65%82 Modesto, CA 446,997 505,505 11,723 2.62%83 Stillwater, OK 68,190 69,151 1,780 2.61%84 Santa Fe-Espanola, NM 170,482 181,683 4,364 2.56%85 Salt Lake City-Ogden-Clearfield, UT 1,469,474 1,586,740 37,426 2.55%86 Calhoun, GA 44,104 50,279 1,115 2.53%87 Bakersfield, CA 661,645 756,825 16,713 2.53%88 Seattle-Tacoma-Olympia, WA 3,604,165 3,806,453 89,972 2.50%89 Hanford-Corcoran, CA 129,461 143,420 3,230 2.49%90 Athens-Clarke County, GA 166,079 175,085 4,125 2.48%91 Wenatchee, WA 99,219 104,768 2,463 2.48%92 Las Cruces, NM 174,682 189,444 4,321 2.47%93 Kahului-Wailuku, HI 128,094 139,884 3,113 2.43%94 Tifton, GA 38,407 40,793 918 2.39%95 Fayetteville-Springdale-Rogers, AR-MO 347,045 405,101 8,109 2.34%96 Hilton Head Island-Beaufort, SC 141,615 159,247 3,276 2.31%97 Iowa City, IA 131,676 138,524 3,012 2.29%98 Cape Coral-Fort Myers, FL 440,888 544,758 10,075 2.29%99 Rochester, MN 163,618 176,984 3,668 2.24%100 Greensboro--Winston-Salem--High Point, NC 1,414,656 1,490,886 31,189 2.20%101 Logan, UT-ID 102,720 110,426 2,264 2.20%102 Sebring, FL 87,366 95,496 1,915 2.19%103 Douglas, GA 45,022 47,704 983 2.18%104 Cornelia, GA 35,902 39,603 782 2.18%105 Mount Vernon-Anacortes, WA 102,979 113,171 2,230 2.17%106 Tucson, AZ 843,746 924,786 18,186 2.16%107 Lawrence, KS 99,962 102,914 2,154 2.15%108 Ukiah, CA 86,265 88,161 1,853 2.15%109 Charlotte-Gastonia-Salisbury, NC-SC 1,897,034 2,120,745 40,494 2.13%110 Provo-Orem, UT 376,774 452,851 8,009 2.13%111 Carson City, NV 52,457 56,062 1,094 2.09%112 Harrisonburg, VA 108,193 111,689 2,248 2.08%113 Sioux City-Vermillion, IA-NE-SD 156,590 155,566 3,242 2.07%114 Bellingham, WA 166,814 183,471 3,425 2.05%115 Lincoln, NE 266,787 281,553 5,374 2.01%116 Grand Island, NE 68,305 69,878 1,374 2.01%117 Hope, AR 33,542 32,933 666 1.99%
Demographia US Metropolitan Area International Migration Report: 2000-2005 29
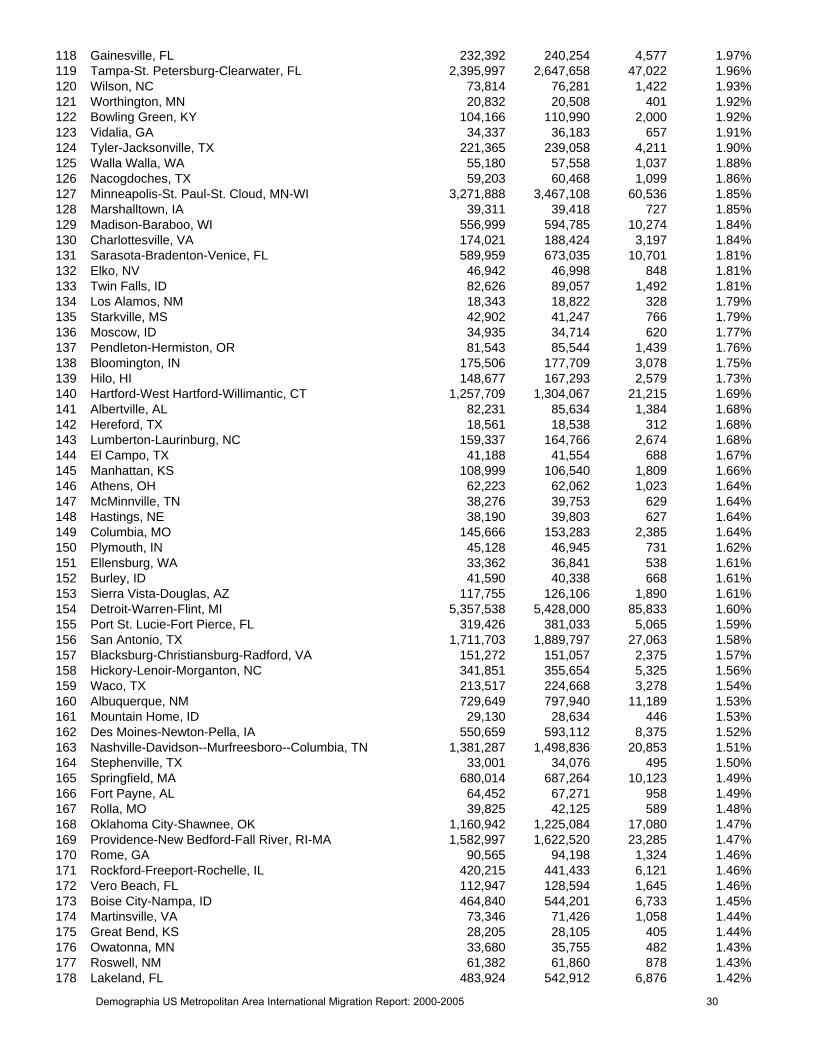
118 Gainesville, FL 232,392 240,254 4,577 1.97%119 Tampa-St. Petersburg-Clearwater, FL 2,395,997 2,647,658 47,022 1.96%120 Wilson, NC 73,814 76,281 1,422 1.93%121 Worthington, MN 20,832 20,508 401 1.92%122 Bowling Green, KY 104,166 110,990 2,000 1.92%123 Vidalia, GA 34,337 36,183 657 1.91%124 Tyler-Jacksonville, TX 221,365 239,058 4,211 1.90%125 Walla Walla, WA 55,180 57,558 1,037 1.88%126 Nacogdoches, TX 59,203 60,468 1,099 1.86%127 Minneapolis-St. Paul-St. Cloud, MN-WI 3,271,888 3,467,108 60,536 1.85%128 Marshalltown, IA 39,311 39,418 727 1.85%129 Madison-Baraboo, WI 556,999 594,785 10,274 1.84%130 Charlottesville, VA 174,021 188,424 3,197 1.84%131 Sarasota-Bradenton-Venice, FL 589,959 673,035 10,701 1.81%132 Elko, NV 46,942 46,998 848 1.81%133 Twin Falls, ID 82,626 89,057 1,492 1.81%134 Los Alamos, NM 18,343 18,822 328 1.79%135 Starkville, MS 42,902 41,247 766 1.79%136 Moscow, ID 34,935 34,714 620 1.77%137 Pendleton-Hermiston, OR 81,543 85,544 1,439 1.76%138 Bloomington, IN 175,506 177,709 3,078 1.75%139 Hilo, HI 148,677 167,293 2,579 1.73%140 Hartford-West Hartford-Willimantic, CT 1,257,709 1,304,067 21,215 1.69%141 Albertville, AL 82,231 85,634 1,384 1.68%142 Hereford, TX 18,561 18,538 312 1.68%143 Lumberton-Laurinburg, NC 159,337 164,766 2,674 1.68%144 El Campo, TX 41,188 41,554 688 1.67%145 Manhattan, KS 108,999 106,540 1,809 1.66%146 Athens, OH 62,223 62,062 1,023 1.64%147 McMinnville, TN 38,276 39,753 629 1.64%148 Hastings, NE 38,190 39,803 627 1.64%149 Columbia, MO 145,666 153,283 2,385 1.64%150 Plymouth, IN 45,128 46,945 731 1.62%151 Ellensburg, WA 33,362 36,841 538 1.61%152 Burley, ID 41,590 40,338 668 1.61%153 Sierra Vista-Douglas, AZ 117,755 126,106 1,890 1.61%154 Detroit-Warren-Flint, MI 5,357,538 5,428,000 85,833 1.60%155 Port St. Lucie-Fort Pierce, FL 319,426 381,033 5,065 1.59%156 San Antonio, TX 1,711,703 1,889,797 27,063 1.58%157 Blacksburg-Christiansburg-Radford, VA 151,272 151,057 2,375 1.57%158 Hickory-Lenoir-Morganton, NC 341,851 355,654 5,325 1.56%159 Waco, TX 213,517 224,668 3,278 1.54%160 Albuquerque, NM 729,649 797,940 11,189 1.53%161 Mountain Home, ID 29,130 28,634 446 1.53%162 Des Moines-Newton-Pella, IA 550,659 593,112 8,375 1.52%163 Nashville-Davidson--Murfreesboro--Columbia, TN 1,381,287 1,498,836 20,853 1.51%164 Stephenville, TX 33,001 34,076 495 1.50%165 Springfield, MA 680,014 687,264 10,123 1.49%166 Fort Payne, AL 64,452 67,271 958 1.49%167 Rolla, MO 39,825 42,125 589 1.48%168 Oklahoma City-Shawnee, OK 1,160,942 1,225,084 17,080 1.47%169 Providence-New Bedford-Fall River, RI-MA 1,582,997 1,622,520 23,285 1.47%170 Rome, GA 90,565 94,198 1,324 1.46%171 Rockford-Freeport-Rochelle, IL 420,215 441,433 6,121 1.46%172 Vero Beach, FL 112,947 128,594 1,645 1.46%173 Boise City-Nampa, ID 464,840 544,201 6,733 1.45%174 Martinsville, VA 73,346 71,426 1,058 1.44%175 Great Bend, KS 28,205 28,105 405 1.44%176 Owatonna, MN 33,680 35,755 482 1.43%177 Roswell, NM 61,382 61,860 878 1.43%178 Lakeland, FL 483,924 542,912 6,876 1.42%
Demographia US Metropolitan Area International Migration Report: 2000-2005 30
179 Utica-Rome, NY 299,896 297,885 4,260 1.42%180 Lansing-East Lansing-Owosso, MI 519,415 528,260 7,361 1.42%181 Lexington-Fayette--Frankfort--Richmond, KY 602,773 635,642 8,539 1.42%182 Greenville, NC 152,772 162,596 2,163 1.42%183 Niles-Benton Harbor, MI 162,453 162,611 2,299 1.42%184 Pittsburg, KS 38,242 38,222 540 1.41%185 Henderson, NC 42,954 43,771 604 1.41%186 North Wilkesboro, NC 65,632 67,390 914 1.39%187 Albany-Corvallis-Lebanon, OR 181,222 187,554 2,522 1.39%188 Fort Collins-Loveland, CO 251,494 271,927 3,473 1.38%189 Wichita-Winfield, KS 607,457 622,353 8,364 1.38%190 Waterloo-Cedar Falls, IA 163,706 161,897 2,241 1.37%191 Morristown-Newport, TN 156,646 165,504 2,136 1.36%192 Murray, KY 34,177 35,122 463 1.35%193 Columbus-Marion-Chillicothe, OH 1,835,189 1,936,351 24,768 1.35%194 Philadelphia-Camden-Vineland, PA-NJ-DE-MD 5,833,585 5,976,485 78,378 1.34%195 Austin, MN 38,603 38,799 515 1.33%196 Southern Pines-Pinehurst, NC 74,769 81,685 994 1.33%197 Colorado Springs, CO 537,484 587,500 7,143 1.33%198 Burlington-South Burlington, VT 198,889 205,230 2,640 1.33%199 Russellville, AR 75,608 77,971 1,002 1.33%200 Ontario, OR-ID 52,193 53,527 690 1.32%201 Greenwood, SC 66,271 67,979 872 1.32%202 San Luis Obispo-Paso Robles, CA 246,681 255,478 3,206 1.30%203 Plainview, TX 36,602 36,233 475 1.30%204 Goldsboro, NC 113,329 114,448 1,454 1.28%205 Kapaa, HI 58,463 62,640 749 1.28%206 Astoria, OR 35,630 36,798 456 1.28%207 Sioux Falls, SD 187,093 207,918 2,390 1.28%208 Macomb, IL 32,913 31,966 420 1.28%209 Omaha-Council Bluffs-Fremont, NE-IA 803,201 849,248 10,229 1.27%210 Marshall, MN 25,425 24,472 322 1.27%211 Kansas City-Overland Park-Kansas City, MO-KS 1,901,070 2,015,282 24,076 1.27%212 Eugene-Springfield, OR 322,959 335,180 4,088 1.27%213 Amarillo, TX 226,522 238,664 2,864 1.26%214 Laramie, WY 32,014 30,890 402 1.26%215 Grand Rapids-Muskegon-Holland, MI 1,254,661 1,315,319 15,704 1.25%216 Crescent City, CA 27,507 28,705 342 1.24%217 Chico, CA 203,171 214,185 2,523 1.24%218 Seymour, IN 41,335 42,237 508 1.23%219 Tahlequah, OK 42,521 44,671 517 1.22%220 Logansport, IN 40,930 40,130 495 1.21%221 Brenham, TX 30,373 31,521 363 1.20%222 Asheville-Brevard, NC 398,505 422,457 4,756 1.19%223 Seaford, DE 156,638 176,548 1,867 1.19%224 Milwaukee-Racine-Waukesha, WI 1,689,572 1,708,563 20,012 1.18%225 Sulphur Springs, TX 31,960 33,381 378 1.18%226 Tulsa-Bartlesville, OK 908,528 936,864 10,636 1.17%227 Morgantown, WV 111,200 114,501 1,282 1.15%228 Whitewater, WI 93,759 99,844 1,077 1.15%229 Prescott, AZ 167,517 198,701 1,922 1.15%230 Lufkin, TX 80,130 81,557 918 1.15%231 South Bend-Mishawaka, IN-MI 316,663 318,156 3,602 1.14%232 Sherman-Denison, TX 110,595 116,834 1,254 1.13%233 Fort Smith, AR-OK 273,170 284,994 3,097 1.13%234 Allentown-Bethlehem-Easton, PA-NJ 740,395 790,535 8,366 1.13%235 Bloomington-Normal, IL 150,433 159,013 1,698 1.13%236 Greenville-Spartanburg-Anderson, SC 1,128,104 1,185,534 12,709 1.13%237 Sedalia, MO 39,403 40,121 443 1.12%238 Taos, NM 29,979 31,722 336 1.12%239 Sterling, CO 20,504 20,719 228 1.11%
Demographia US Metropolitan Area International Migration Report: 2000-2005 31
240 Spokane, WA 417,939 440,706 4,640 1.11%241 Marshall, MO 23,756 23,075 263 1.11%242 Sturgis, MI 62,422 62,984 691 1.11%243 Columbus, NE 31,662 31,262 347 1.10%244 Fargo-Wahpeton, ND-MN 199,503 208,999 2,172 1.09%245 Pampa, TX 23,631 22,299 257 1.09%246 Anchorage, AK 319,605 351,049 3,468 1.09%247 Rexburg, ID 39,286 43,217 425 1.08%248 Kerrville, TX 43,653 46,496 472 1.08%249 Kalamazoo-Portage, MI 314,866 319,348 3,400 1.08%250 Oxford, MS 38,744 40,842 418 1.08%251 Lake Havasu City-Kingman, AZ 155,032 187,200 1,667 1.08%252 Killeen-Temple-Fort Hood, TX 330,714 351,528 3,541 1.07%253 Cedar City, UT 33,779 38,311 361 1.07%254 Muscatine, IA 53,905 54,598 575 1.07%255 Bishop, CA 17,945 18,156 191 1.06%256 Longview-Marshall, TX 256,152 264,960 2,709 1.06%257 Arkadelphia, AR 23,546 22,916 246 1.04%258 St. George, UT 90,354 118,885 939 1.04%259 Columbia-Newberry, SC 683,266 727,128 7,039 1.03%260 Jacksonville, FL 1,122,750 1,248,371 11,541 1.03%261 Clovis-Portales, NM 63,062 64,084 646 1.02%262 Myrtle Beach-Conway-Georgetown, SC 252,426 287,975 2,554 1.01%263 Flagstaff, AZ 116,320 123,866 1,175 1.01%264 Indianapolis-Anderson-Columbus, IN 1,843,588 1,958,453 18,598 1.01%265 Fayetteville, NC 336,609 345,536 3,391 1.01%266 Laurel, MS 83,107 84,322 837 1.01%267 Tallahassee, FL 320,304 334,886 3,225 1.01%268 Richmond, VA 1,096,957 1,175,654 11,022 1.00%269 Deltona-Daytona Beach-Palm Coast, FL 493,175 566,465 4,952 1.00%270 Janesville, WI 152,307 157,538 1,517 1.00%271 Rochester-Batavia-Seneca Falls, NY 1,131,543 1,133,140 11,263 1.00%272 Borger, TX 23,857 22,484 237 0.99%273 Houghton, MI 38,317 37,900 378 0.99%274 Uvalde, TX 25,926 26,955 255 0.98%275 Victoria, TX 111,663 113,356 1,094 0.98%276 Midland, MI 82,874 84,064 810 0.98%277 Fort Wayne-Huntington-Auburn, IN 548,416 565,606 5,360 0.98%278 Savannah-Hinesville-Fort Stewart, GA 364,914 382,510 3,566 0.98%279 Lamesa, TX 14,985 14,256 146 0.97%280 Statesboro, GA 55,983 61,454 540 0.96%281 Norfolk, NE 49,538 49,622 477 0.96%282 Clearlake, CA 58,309 65,147 561 0.96%283 Barnstable Town, MA 222,230 226,514 2,137 0.96%284 Mount Pleasant, MI 63,351 65,618 605 0.95%285 Coldwater, MI 45,787 46,460 437 0.95%286 Reading, PA 373,638 396,314 3,556 0.95%287 Green Bay, WI 282,599 297,493 2,689 0.95%288 Pecos, TX 13,137 11,638 124 0.94%289 Grand Forks, ND-MN 97,478 97,073 917 0.94%290 Centralia, WA 68,600 72,449 644 0.94%291 Wilmington, NC 274,532 315,144 2,562 0.93%292 Hobbs, NM 55,511 56,719 518 0.93%293 Willmar, MN 41,203 41,199 384 0.93%294 Mankato-North Mankato, MN 85,712 88,878 792 0.92%295 Altus, OK 28,439 26,518 262 0.92%296 City of The Dalles, OR 23,791 23,593 218 0.92%297 Troy, AL 29,605 29,639 271 0.92%298 Montrose, CO 33,432 37,482 303 0.91%299 Fitzgerald, GA 27,415 27,409 247 0.90%300 Red Bluff, CA 56,039 61,197 502 0.90%
Demographia US Metropolitan Area International Migration Report: 2000-2005 32
301 Midland-Odessa, TX 237,132 246,710 2,121 0.89%302 Memphis, TN-MS-AR 1,205,204 1,260,905 10,753 0.89%303 Salina, KS 59,760 60,042 532 0.89%304 Cookeville, TN 93,417 98,175 827 0.89%305 Warsaw, IN 74,057 76,072 653 0.88%306 Bainbridge, GA 28,240 28,618 249 0.88%307 Big Spring, TX 33,627 32,522 295 0.88%308 Norwich-New London, CT 259,088 266,618 2,261 0.87%309 Wichita Falls, TX 151,524 146,276 1,317 0.87%310 Cordele, GA 21,996 22,017 190 0.86%311 Scottsbluff, NE 37,770 37,485 326 0.86%312 Juneau, AK 30,711 30,987 265 0.86%313 Syracuse-Auburn, NY 732,117 733,217 6,250 0.85%314 Charleston-North Charleston, SC 549,033 594,899 4,672 0.85%315 Sheboygan, WI 112,646 114,610 954 0.85%316 Columbus-Auburn-Opelika, GA-AL 420,965 430,363 3,563 0.85%317 Washington, IN 29,820 30,466 252 0.85%318 Idaho Falls-Blackfoot, ID 143,412 157,175 1,208 0.84%319 Huntsville-Decatur, AL 488,243 517,006 4,095 0.84%320 Winona, MN 49,985 49,276 419 0.84%321 Fallon, NV 23,982 24,556 201 0.84%322 Binghamton, NY 252,320 248,422 2,112 0.84%323 Beaumont-Port Arthur, TX 385,090 383,530 3,189 0.83%324 Medford, OR 181,269 195,322 1,498 0.83%325 Erie, PA 280,843 280,446 2,317 0.83%326 Waycross, GA 51,119 51,611 421 0.82%327 Longview, WA 92,948 97,325 765 0.82%328 Salisbury-Ocean Pines, MD 155,934 164,997 1,283 0.82%329 Washington, NC 44,958 46,018 368 0.82%330 St. Louis-St. Charles-Farmington, MO-IL 2,754,328 2,840,179 22,416 0.81%331 Louisville-Elizabethtown-Scottsburg, KY-IN 1,292,482 1,342,918 10,490 0.81%332 Rockingham, NC 46,564 46,781 377 0.81%333 Palm Bay-Melbourne-Titusville, FL 476,230 531,250 3,855 0.81%334 Brookings, SD 28,220 28,121 228 0.81%335 Watertown-Fort Atkinson, WI 74,021 79,328 595 0.80%336 Corpus Christi-Kingsville, TX 435,243 444,727 3,481 0.80%337 Cleveland-Akron-Elyria, OH 2,945,831 2,931,774 23,559 0.80%338 Rocky Mount, NC 143,026 145,507 1,142 0.80%339 Paris, TX 48,499 49,644 385 0.79%340 Harrisburg-Carlisle-Lebanon, PA 629,401 647,390 4,941 0.79%341 Lewisburg, TN 26,767 28,372 210 0.78%342 Fairbanks, AK 82,840 87,560 649 0.78%343 Aberdeen, WA 67,194 70,900 516 0.77%344 Davenport-Moline-Rock Island, IA-IL 376,019 376,309 2,882 0.77%345 Brunswick, GA 93,044 98,433 713 0.77%346 Barre, VT 58,039 59,478 437 0.75%347 Valdosta, GA 119,560 124,838 884 0.74%348 Boone, NC 42,695 42,472 314 0.74%349 Kinston, NC 59,648 57,961 438 0.73%350 Dubuque, IA 89,143 91,631 651 0.73%351 Ocala, FL 258,916 303,442 1,887 0.73%352 Albany-Schenectady-Amsterdam, NY 1,118,095 1,145,666 8,107 0.73%353 Eufaula, AL-GA 31,636 30,881 229 0.72%354 La Grande, OR 24,530 24,540 177 0.72%355 Hays, KS 27,507 26,767 196 0.71%356 Greensburg, IN 24,555 25,184 174 0.71%357 Kill Devil Hills, NC 29,967 33,903 211 0.70%358 Fergus Falls, MN 57,159 57,658 399 0.70%359 Birmingham-Hoover-Cullman, AL 1,129,721 1,170,012 7,880 0.70%360 Cincinnati-Middletown-Wilmington, OH-KY-IN 2,050,175 2,113,011 14,187 0.69%361 Baton Rouge-Pierre Part, LA 729,361 756,998 5,038 0.69%
Demographia US Metropolitan Area International Migration Report: 2000-2005 33
362 Las Vegas, NM 30,126 29,530 208 0.69%363 Pueblo, CO 141,472 151,322 975 0.69%364 Punta Gorda, FL 141,627 157,536 972 0.69%365 Tuscaloosa, AL 192,034 196,885 1,308 0.68%366 Virginia Beach-Norfolk-Newport News, VA-NC 1,576,370 1,647,346 10,578 0.67%367 Albert Lea, MN 32,584 31,946 218 0.67%368 Bozeman, MT 67,831 78,210 453 0.67%369 Cedar Rapids, IA 237,230 246,412 1,582 0.67%370 Dover, DE 126,697 143,968 840 0.66%371 Jonesboro, AR 107,762 112,084 714 0.66%372 Big Rapids, MI 40,553 42,391 268 0.66%373 Union City-Martin, TN-KY 75,097 73,162 496 0.66%374 San Angelo, TX 105,781 105,367 696 0.66%375 Durant, OK 36,534 37,815 240 0.66%376 Joplin, MO 157,322 166,178 1,032 0.66%377 Mobile-Daphne-Fairhope, AL 540,258 564,013 3,536 0.65%378 Battle Creek, MI 137,985 139,191 903 0.65%379 Pocatello, ID 83,103 85,908 542 0.65%380 Ketchikan, AK 14,070 13,262 91 0.65%381 New Bern, NC 114,751 113,841 737 0.64%382 Pittsfield, MA 134,953 131,868 866 0.64%383 Lubbock-Levelland, TX 272,416 281,757 1,748 0.64%384 Eureka-Arcata-Fortuna, CA 126,518 128,376 807 0.64%385 Palatka, FL 70,423 73,568 448 0.64%386 New Orleans-Metairie-Bogalusa, LA 1,360,436 1,363,990 8,586 0.63%387 Muncie, IN 118,769 116,362 748 0.63%388 Buffalo-Niagara-Cattaraugus, NY 1,254,066 1,230,213 7,887 0.63%389 Chattanooga-Cleveland-Athens, TN-GA 629,561 651,489 3,953 0.63%390 Appleton-Oshkosh-Neenah, WI 358,365 374,625 2,235 0.62%391 Farmington, NM 113,801 126,208 706 0.62%392 Lancaster, PA 470,658 490,562 2,919 0.62%393 Klamath Falls, OR 63,775 66,192 395 0.62%394 Fort Walton Beach-Crestview-Destin, FL 170,498 182,172 1,045 0.61%395 Jackson-Humboldt, TN 155,529 159,005 950 0.61%396 Port Angeles, WA 64,525 69,689 393 0.61%397 Roanoke, VA 288,309 292,983 1,739 0.60%398 Macon-Warner Robins-Fort Valley, GA 356,801 379,669 2,152 0.60%399 Hattiesburg, MS 123,812 131,871 741 0.60%400 Danville, KY 51,058 53,485 305 0.60%401 Manitowoc, WI 82,887 81,949 490 0.59%402 Grand Junction, CO 116,255 129,872 687 0.59%403 Kirksville, MO 29,147 28,817 172 0.59%404 Chambersburg, PA 129,313 137,409 763 0.59%405 Abilene, TX 160,245 158,291 942 0.59%406 Jasper, IN 52,511 53,624 308 0.59%407 Andrews, TX 13,004 12,748 76 0.58%408 Clarksville, TN-KY 232,000 243,665 1,351 0.58%409 Pensacola-Ferry Pass-Brent, FL 412,153 439,877 2,361 0.57%410 Palestine, TX 55,109 56,408 314 0.57%411 Americus, GA 36,966 37,034 209 0.57%412 Maryville, MO 21,912 21,710 123 0.56%413 Kearney, NE 49,141 50,346 275 0.56%414 Rock Springs, WY 37,613 37,975 210 0.56%415 Topeka, KS 224,551 229,075 1,250 0.56%416 Muskogee, OK 69,451 70,607 384 0.55%417 Dyersburg, TN 37,279 37,829 204 0.55%418 Payson, AZ 51,335 51,663 280 0.55%419 Sidney, OH 47,910 48,736 260 0.54%420 East Stroudsburg, PA 138,687 163,234 750 0.54%421 Ponca City, OK 48,080 46,480 260 0.54%422 Knoxville-Sevierville-La Follette, TN 779,013 828,257 4,188 0.54%
Demographia US Metropolitan Area International Migration Report: 2000-2005 34
423 Brownsville, TN 19,797 19,656 106 0.54%424 Augusta-Richmond County, GA-SC 499,684 520,332 2,675 0.54%425 Ogdensburg-Massena, NY 111,931 111,380 598 0.53%426 Vernon, TX 14,676 13,896 78 0.53%427 Gulfport-Biloxi-Pascagoula, MS 396,754 412,582 2,102 0.53%428 Little Rock-North Little Rock-Pine Bluff, AR 785,024 819,469 4,136 0.53%429 Tullahoma, TN 93,024 97,896 489 0.53%430 Oskaloosa, IA 22,335 22,364 116 0.52%431 Pittsburgh-New Castle, PA 2,525,730 2,478,883 13,057 0.52%432 Watertown-Fort Drum, NY 111,738 116,384 577 0.52%433 Jefferson City, MO 140,052 143,867 719 0.51%434 Lynchburg, VA 228,616 236,910 1,171 0.51%435 Toledo-Fremont, OH 720,980 718,372 3,683 0.51%436 Fort Leonard Wood, MO 41,165 44,187 210 0.51%437 Ruston, LA 57,906 57,243 295 0.51%438 Portland-Lewiston-South Portland, ME 591,361 622,266 3,006 0.51%439 Enid, OK 57,813 56,958 293 0.51%440 Vincennes, IN 39,256 38,366 198 0.50%441 Summerville, GA 25,470 26,570 128 0.50%442 York-Hanover-Gettysburg, PA 473,043 508,550 2,376 0.50%443 Fort Polk South-De Ridder, LA 85,517 83,307 426 0.50%444 Claremont-Lebanon, NH-VT 207,845 215,064 1,028 0.49%445 Bangor, ME 144,919 147,068 714 0.49%446 Bennington, VT 36,994 36,999 182 0.49%447 Missoula, MT 95,802 100,086 471 0.49%448 Stevens Point, WI 67,182 67,585 330 0.49%449 Easton, MD 33,812 35,683 165 0.49%450 Jacksonville, NC 150,355 152,440 733 0.49%451 Ottumwa, IA 36,051 35,965 175 0.49%452 Norwalk, OH 59,487 60,385 288 0.48%453 Minot, ND 67,392 63,700 325 0.48%454 Gadsden, AL 103,459 103,189 497 0.48%455 Snyder, TX 16,361 16,217 78 0.48%456 Moberly, MO 24,663 25,336 117 0.47%457 Bend-Prineville, OR 134,549 163,449 637 0.47%458 Natchitoches, LA 39,080 38,541 185 0.47%459 Bemidji, MN 39,650 42,871 187 0.47%460 Panama City-Lynn Haven, FL 148,217 161,558 699 0.47%461 Plattsburgh, NY 79,894 82,047 373 0.47%462 Wisconsin Rapids-Marshfield, WI 75,555 75,234 351 0.46%463 Terre Haute, IN 170,943 168,059 778 0.46%464 Wooster, OH 111,564 113,697 506 0.45%465 Indiana, PA 89,605 88,703 403 0.45%466 Albany, GA 157,833 162,842 707 0.45%467 Greeneville, TN 62,909 65,318 277 0.44%468 Peoria-Canton, IL 405,149 406,869 1,772 0.44%469 Sweetwater, TX 15,802 14,878 69 0.44%470 Fond du Lac-Beaver Dam, WI 183,193 187,440 796 0.43%471 Cheyenne, WY 81,607 85,163 353 0.43%472 Spencer, IA 17,372 16,897 75 0.43%473 Lawton, OK 114,996 112,429 495 0.43%474 Danville, VA 110,156 107,997 473 0.43%475 Coos Bay, OR 62,779 64,711 269 0.43%476 Carlsbad-Artesia, NM 51,658 51,437 221 0.43%477 Magnolia, AR 25,603 24,695 109 0.43%478 Fort Dodge, IA 40,235 39,003 171 0.43%479 Hutchinson, KS 64,790 63,558 275 0.42%480 Wausau-Merrill, WI 155,475 159,260 659 0.42%481 Batesville, AR 34,233 34,737 145 0.42%482 Findlay-Tiffin, OH 129,978 130,986 547 0.42%483 Rapid City, SD 112,818 118,203 465 0.41%
Demographia US Metropolitan Area International Migration Report: 2000-2005 35
484 Ottawa-Streator, IL 153,098 154,028 629 0.41%485 Jesup, GA 26,565 28,390 109 0.41%486 Redding, CA 163,256 179,904 665 0.41%487 Hot Springs, AR 88,068 93,551 355 0.40%488 Brownwood, TX 37,674 38,664 151 0.40%489 Durango, CO 43,941 47,452 174 0.40%490 Sterling, IL 60,653 59,863 239 0.39%491 Lafayette-Acadiana, LA 512,720 526,896 2,014 0.39%492 Pierre, SD 19,253 19,704 75 0.39%493 Angola, IN 33,214 33,773 129 0.39%494 Dothan-Enterprise-Ozark, AL 223,605 230,909 862 0.39%495 Lake City, FL 56,513 64,040 216 0.38%496 Traverse City, MI 131,342 141,011 501 0.38%497 El Dorado, AR 45,629 44,186 173 0.38%498 Dayton-Springfield-Greenville, OH 1,085,094 1,078,634 4,082 0.38%499 Jackson, MI 158,422 163,629 592 0.37%500 Sumter, SC 104,646 105,517 389 0.37%501 Miami, OK 33,194 32,866 123 0.37%502 Brookings, OR 21,137 22,427 77 0.36%503 Ada, OK 35,143 35,346 128 0.36%504 Richmond, IN 71,097 69,192 258 0.36%505 Dillon, SC 30,722 30,974 111 0.36%506 Kennett, MO 33,155 32,545 118 0.36%507 Clinton, IA 50,149 49,717 178 0.35%508 Coshocton, OH 36,655 36,945 130 0.35%509 Casper, WY 66,533 69,799 235 0.35%510 Walterboro, SC 38,264 39,605 135 0.35%511 Evansville, IN-KY 342,815 349,543 1,206 0.35%512 La Crosse, WI-MN 126,838 128,899 445 0.35%513 Morehead City, NC 59,383 62,525 207 0.35%514 Ardmore, OK 54,452 56,251 189 0.35%515 Coffeyville, KS 36,252 34,570 125 0.34%516 Jackson-Yazoo City, MS 525,346 550,775 1,811 0.34%517 Eau Claire-Menomonie, WI 188,195 195,747 642 0.34%518 Charleston-Mattoon, IL 64,449 62,038 219 0.34%519 Branson, MO 68,361 73,916 232 0.34%520 Springfield, MO 368,374 398,124 1,238 0.34%521 Elizabeth City, NC 53,150 59,317 178 0.33%522 Mitchell, SD 21,880 22,524 73 0.33%523 Danville, IL 83,919 82,344 279 0.33%524 West Plains, MO 37,238 38,400 123 0.33%525 Gallup, NM 74,798 71,918 247 0.33%526 Texarkana, TX-Texarkana, AR 129,749 133,805 426 0.33%527 Paducah-Mayfield, KY-IL 135,793 135,708 443 0.33%528 Thomasville, GA 42,737 44,692 139 0.33%529 Grenada, MS 23,263 22,861 75 0.32%530 Corinth, MS 34,558 35,306 111 0.32%531 Houma-Bayou Cane-Thibodaux, LA 194,477 199,670 624 0.32%532 Anniston-Oxford, AL 112,249 112,141 359 0.32%533 Evanston, WY 19,742 19,939 63 0.32%534 Pontiac, IL 39,678 39,186 125 0.32%535 Cape Girardeau-Sikeston-Jackson, MO-IL 130,734 133,556 409 0.31%536 Johnson City-Kingsport-Bristol (Tri-Cities), TN-VA 480,091 490,238 1,491 0.31%537 Elmira, NY 91,070 89,512 281 0.31%538 Morgan City, LA 53,500 51,416 165 0.31%539 Dublin, GA 53,434 56,434 163 0.31%540 Price, UT 20,422 19,437 62 0.30%541 Saginaw-Bay City-Saginaw Township North, MI 320,196 317,385 971 0.30%542 Homosassa Springs, FL 118,085 134,370 358 0.30%543 Florence, SC 193,155 198,443 585 0.30%544 Springfield, IL 201,437 205,527 602 0.30%
Demographia US Metropolitan Area International Migration Report: 2000-2005 36
545 Lincoln, IL 31,183 30,603 93 0.30%546 Ocean City, NJ 102,326 99,286 305 0.30%547 St. Marys, GA 43,664 45,759 130 0.30%548 Dixon, IL 36,062 35,669 107 0.30%549 Keene, NH 73,825 77,287 219 0.30%550 Adrian, MI 98,890 102,033 292 0.30%551 Scranton--Wilkes-Barre, PA 560,625 550,546 1,645 0.29%552 North Platte, NE 35,939 36,883 105 0.29%553 Woodward, OK 18,486 19,088 54 0.29%554 Staunton-Waynesboro, VA 108,988 114,331 318 0.29%555 Lewiston, ID-WA 57,961 59,109 169 0.29%556 Alexandria, LA 145,035 147,965 422 0.29%557 Safford, AZ 42,036 40,594 122 0.29%558 Dickinson, ND 23,524 22,886 68 0.29%559 Galesburg, IL 74,571 70,867 215 0.29%560 Taylorville, IL 35,372 35,176 101 0.29%561 Canon City, CO 46,145 47,766 130 0.28%562 Blytheville, AR 51,979 47,911 146 0.28%563 Watertown, SD 31,437 31,717 88 0.28%564 Jamestown, ND 21,908 20,835 61 0.28%565 Poplar Bluff, MO 40,867 41,338 113 0.28%566 Jamestown-Dunkirk-Fredonia, NY 139,750 136,409 385 0.28%567 Sault Ste. Marie, MI 38,543 38,780 106 0.28%568 Campbellsville, KY 22,927 23,754 63 0.27%569 Grants, NM 25,595 27,620 70 0.27%570 Bismarck, ND 94,719 99,346 257 0.27%571 Montgomery-Alexander City, AL 400,205 409,123 1,080 0.27%572 Shreveport-Bossier City-Minden, LA 417,796 424,589 1,126 0.27%573 Tupelo, MS 125,251 130,360 337 0.27%574 Sunbury-Lewisburg-Selinsgrove, PA 173,726 173,948 465 0.27%575 Duluth, MN-WI 275,486 275,413 737 0.27%576 Corning, NY 98,726 98,632 261 0.26%577 Helena, MT 65,765 69,619 173 0.26%578 Bellefontaine, OH 46,005 46,580 120 0.26%579 Greenwood, MS 48,716 46,828 127 0.26%580 Gillette, WY 33,698 37,405 87 0.26%581 Coeur d'Alene, ID 108,685 127,668 278 0.26%582 Hagerstown-Martinsburg, MD-WV 222,771 251,311 565 0.25%583 Florence-Muscle Shoals, AL 142,950 142,351 362 0.25%584 Indianola, MS 34,369 32,311 87 0.25%585 Kokomo-Peru, IN 137,623 136,982 346 0.25%586 Burlington, IA-IL 50,564 48,782 127 0.25%587 Glasgow, KY 48,070 50,270 120 0.25%588 Middlesborough, KY 30,060 29,665 75 0.25%589 Columbus-West Point, MS 83,565 81,118 208 0.25%590 Decatur, IL 114,706 110,167 285 0.25%591 Kalispell, MT 74,471 83,172 183 0.25%592 Roanoke Rapids, NC 79,456 77,506 193 0.24%593 Elk City, OK 19,799 18,880 48 0.24%594 Lake Charles-Jennings, LA 225,003 226,249 545 0.24%595 Jacksonville, IL 42,153 41,134 102 0.24%596 Sheridan, WY 26,560 27,389 64 0.24%597 Madison, IN 31,705 32,430 76 0.24%598 Maysville, KY 30,892 31,012 74 0.24%599 Great Falls, MT 80,357 79,569 192 0.24%600 Phoenix Lake-Cedar Ridge, CA 54,501 59,380 130 0.24%601 Forest City, NC 62,899 63,771 150 0.24%602 Corbin-London, KY 88,580 94,367 211 0.24%603 Fairmont-Clarksburg, WV 148,742 148,645 353 0.24%604 Beckley-Oak Hill, WV 126,799 125,990 299 0.24%605 Orangeburg, SC 91,582 92,167 214 0.23%
Demographia US Metropolitan Area International Migration Report: 2000-2005 37
606 Owensboro, KY 109,875 111,599 253 0.23%607 McAlester, OK 43,953 44,641 101 0.23%608 Greenville, MS 62,977 59,220 144 0.23%609 Paris, TN 31,115 31,511 71 0.23%610 Ashland, OH 52,523 54,123 119 0.23%611 Mason City, IA 54,356 52,413 123 0.23%612 Roseburg, OR 100,399 104,202 223 0.22%613 Milledgeville, GA 54,776 54,873 120 0.22%614 Williston, ND 19,761 19,282 43 0.22%615 Somerset, KY 56,217 59,200 122 0.22%616 Alma, MI 42,285 42,345 91 0.22%617 Vernal, UT 25,224 26,995 54 0.21%618 Silver City, NM 31,002 29,747 66 0.21%619 Yankton, SD 21,652 21,718 46 0.21%620 Marquette, MI 64,634 64,760 137 0.21%621 Alpena, MI 31,314 30,428 66 0.21%622 Augusta-Waterville, ME 117,114 120,986 245 0.21%623 Clarksdale, MS 30,622 29,002 64 0.21%624 Defiance, OH 39,500 39,112 82 0.21%625 Alice, TX 39,326 40,951 81 0.21%626 Malone, NY 51,134 51,033 104 0.20%627 Camden, AR 34,534 32,691 70 0.20%628 Rockland, ME 39,618 41,219 80 0.20%629 Johnstown, PA 152,598 148,073 302 0.20%630 Berlin, NH-VT 39,570 40,257 78 0.20%631 Monroe, WI 33,647 35,165 66 0.20%632 Keokuk-Fort Madison, IA-MO 45,468 44,028 89 0.20%633 Vicksburg, MS 49,644 49,131 97 0.20%634 Huron, SD 17,023 15,896 33 0.19%635 Effingham, IL 34,264 34,581 66 0.19%636 Lawrenceburg, TN 39,926 41,101 76 0.19%637 New Philadelphia-Dover, OH 90,914 91,944 168 0.18%638 Marion, IN 73,403 70,557 135 0.18%639 Cambridge, MD 30,674 31,401 56 0.18%640 St. Joseph, MO-KS 122,336 121,961 223 0.18%641 Tallulah, LA 13,728 12,457 25 0.18%642 Platteville, WI 49,597 49,671 90 0.18%643 Mansfield-Bucyrus, OH 175,818 173,723 319 0.18%644 Youngstown-Warren-East Liverpool, OH-PA 715,039 704,096 1,260 0.18%645 Harrisburg, IL 26,733 26,072 47 0.18%646 Lima-Van Wert-Wapakoneta, OH 184,743 182,630 321 0.17%647 Quincy, IL-MO 78,771 77,226 135 0.17%648 Huntington-Ashland, WV-KY-OH 288,649 286,012 489 0.17%649 Oneonta, NY 61,676 62,746 104 0.17%650 Marinette, WI-MI 68,710 68,402 115 0.17%651 Monroe-Bastrop, LA 201,074 201,127 336 0.17%652 Sandusky, OH 79,551 78,665 132 0.17%653 Portsmouth, OH 79,195 76,561 131 0.17%654 Huntingdon, PA 45,586 45,947 75 0.16%655 New Ulm, MN 26,911 26,534 44 0.16%656 Bloomsburg-Berwick, PA 82,387 82,971 134 0.16%657 Canton-Massillon, OH 406,934 409,996 655 0.16%658 Aberdeen, SD 39,827 38,818 64 0.16%659 Hammond, LA 100,588 106,502 160 0.16%660 Charleston, WV 309,635 306,435 488 0.16%661 Grants Pass, OR 75,726 80,761 118 0.16%662 Hannibal, MO 37,915 38,136 58 0.15%663 Susanville, CA 33,828 34,751 51 0.15%664 Cadillac, MI 44,962 47,175 67 0.15%665 Bedford, IN 45,922 46,403 68 0.15%666 Paragould, AR 37,331 39,401 55 0.15%
Demographia US Metropolitan Area International Migration Report: 2000-2005 38
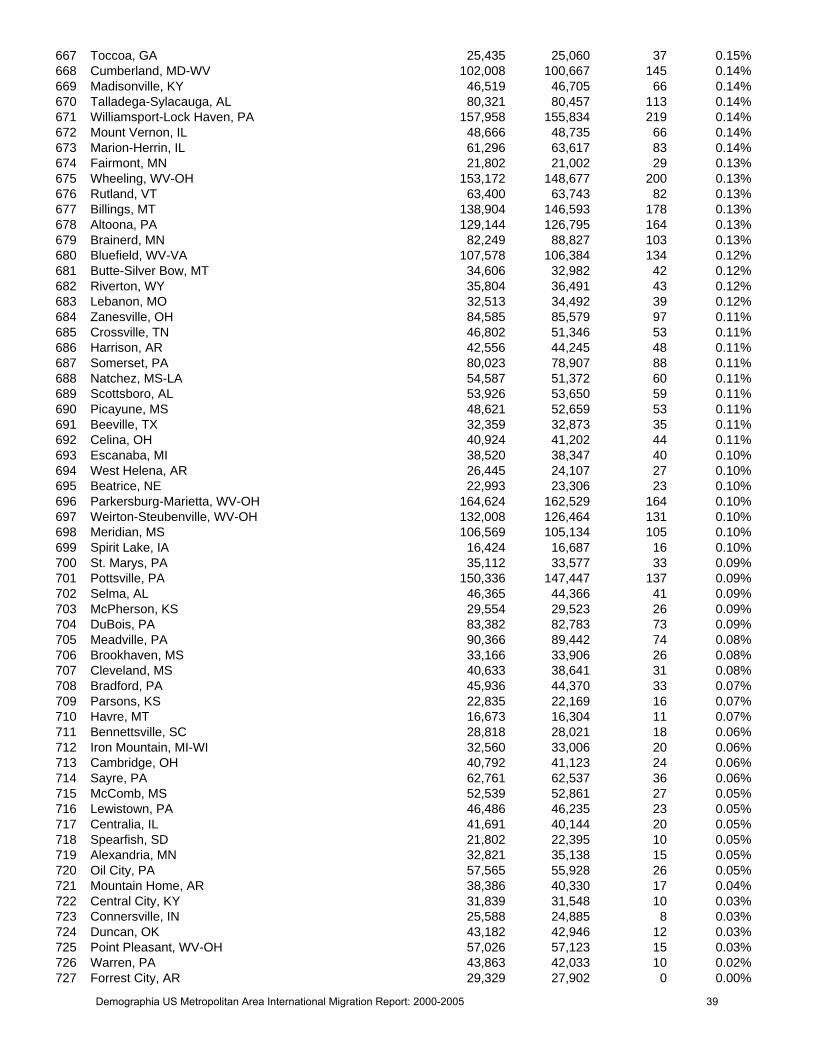
667 Toccoa, GA 25,435 25,060 37 0.15%668 Cumberland, MD-WV 102,008 100,667 145 0.14%669 Madisonville, KY 46,519 46,705 66 0.14%670 Talladega-Sylacauga, AL 80,321 80,457 113 0.14%671 Williamsport-Lock Haven, PA 157,958 155,834 219 0.14%672 Mount Vernon, IL 48,666 48,735 66 0.14%673 Marion-Herrin, IL 61,296 63,617 83 0.14%674 Fairmont, MN 21,802 21,002 29 0.13%675 Wheeling, WV-OH 153,172 148,677 200 0.13%676 Rutland, VT 63,400 63,743 82 0.13%677 Billings, MT 138,904 146,593 178 0.13%678 Altoona, PA 129,144 126,795 164 0.13%679 Brainerd, MN 82,249 88,827 103 0.13%680 Bluefield, WV-VA 107,578 106,384 134 0.12%681 Butte-Silver Bow, MT 34,606 32,982 42 0.12%682 Riverton, WY 35,804 36,491 43 0.12%683 Lebanon, MO 32,513 34,492 39 0.12%684 Zanesville, OH 84,585 85,579 97 0.11%685 Crossville, TN 46,802 51,346 53 0.11%686 Harrison, AR 42,556 44,245 48 0.11%687 Somerset, PA 80,023 78,907 88 0.11%688 Natchez, MS-LA 54,587 51,372 60 0.11%689 Scottsboro, AL 53,926 53,650 59 0.11%690 Picayune, MS 48,621 52,659 53 0.11%691 Beeville, TX 32,359 32,873 35 0.11%692 Celina, OH 40,924 41,202 44 0.11%693 Escanaba, MI 38,520 38,347 40 0.10%694 West Helena, AR 26,445 24,107 27 0.10%695 Beatrice, NE 22,993 23,306 23 0.10%696 Parkersburg-Marietta, WV-OH 164,624 162,529 164 0.10%697 Weirton-Steubenville, WV-OH 132,008 126,464 131 0.10%698 Meridian, MS 106,569 105,134 105 0.10%699 Spirit Lake, IA 16,424 16,687 16 0.10%700 St. Marys, PA 35,112 33,577 33 0.09%701 Pottsville, PA 150,336 147,447 137 0.09%702 Selma, AL 46,365 44,366 41 0.09%703 McPherson, KS 29,554 29,523 26 0.09%704 DuBois, PA 83,382 82,783 73 0.09%705 Meadville, PA 90,366 89,442 74 0.08%706 Brookhaven, MS 33,166 33,906 26 0.08%707 Cleveland, MS 40,633 38,641 31 0.08%708 Bradford, PA 45,936 44,370 33 0.07%709 Parsons, KS 22,835 22,169 16 0.07%710 Havre, MT 16,673 16,304 11 0.07%711 Bennettsville, SC 28,818 28,021 18 0.06%712 Iron Mountain, MI-WI 32,560 33,006 20 0.06%713 Cambridge, OH 40,792 41,123 24 0.06%714 Sayre, PA 62,761 62,537 36 0.06%715 McComb, MS 52,539 52,861 27 0.05%716 Lewistown, PA 46,486 46,235 23 0.05%717 Centralia, IL 41,691 40,144 20 0.05%718 Spearfish, SD 21,802 22,395 10 0.05%719 Alexandria, MN 32,821 35,138 15 0.05%720 Oil City, PA 57,565 55,928 26 0.05%721 Mountain Home, AR 38,386 40,330 17 0.04%722 Central City, KY 31,839 31,548 10 0.03%723 Connersville, IN 25,588 24,885 8 0.03%724 Duncan, OK 43,182 42,946 12 0.03%725 Point Pleasant, WV-OH 57,026 57,123 15 0.03%726 Warren, PA 43,863 42,033 10 0.02%727 Forrest City, AR 29,329 27,902 0 0.00%
Demographia US Metropolitan Area International Migration Report: 2000-2005 39
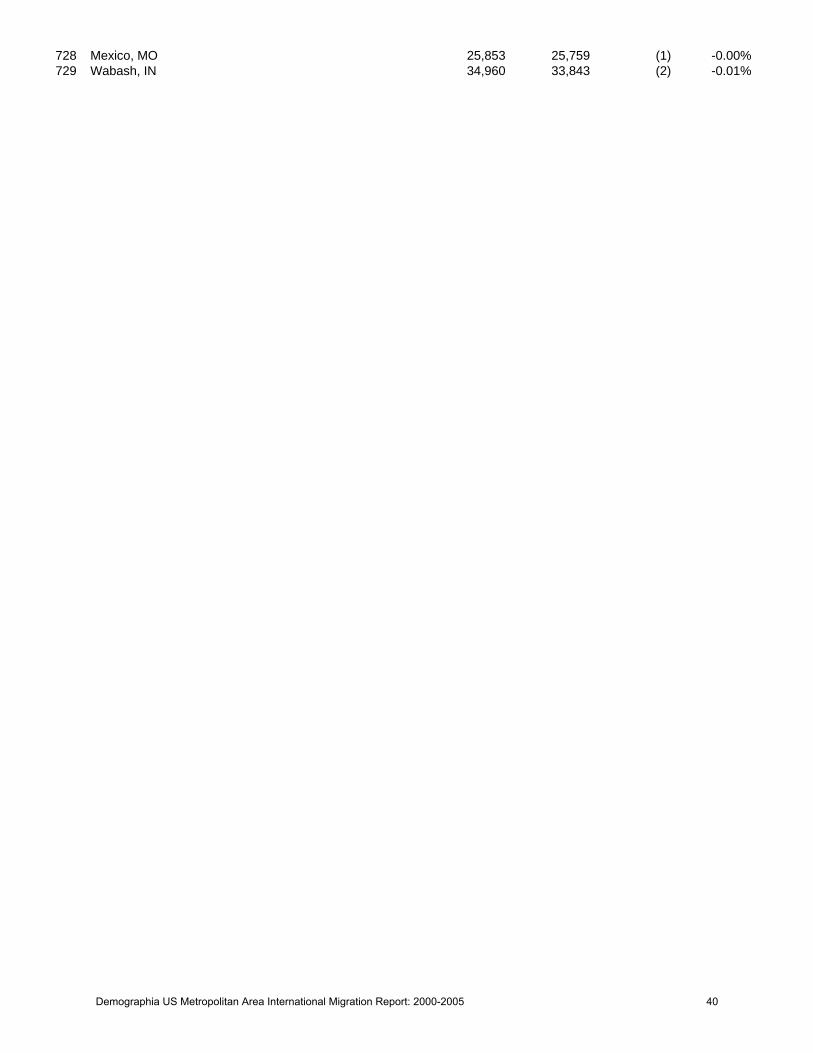
728 Mexico, MO 25,853 25,759 (1) -0.00%729 Wabash, IN 34,960 33,843 (2) -0.01%
Demographia US Metropolitan Area International Migration Report: 2000-2005 40