Embed Size (px)
Citation preview

Usage versus CostAnalytics for Selection Management and Informed Purchase Decisions
MTA Budapest, October 2012

Agenda
• Introduction: Development of Usage statistics
• Price per Use: SwetsWise Selection Support
• New way to journal metrics: Mendeley Institution Edition

Looking back
• 1990‘s - Electronic Journal platforms are being launched by STM publishers
-> For the 1st time usage of article content can be measured
• 1998 - ICOLC Guidelines for usage statistics
• 2002 - COUNTER initiative for standardized usage statistics
• 2004 – MPS develops ScholarlyStats to collect and consolidate usage data
for libraries
• 2005 - NISO defines protocol to exchange standardized usage data
between different systems: SUSHI
• 2007 – ScholarlyStats acquired by Swets
• 2009 – First platform to deliver Price per use analysis:
SwetsWise Selection Support
• 2012 – COUNTER publishes Release 4

Challenges for our library customers
Customer have to download usage statistics per publisher
Time-consuming to retrieve reports and consolidate usage statistics
Usage statistics and price information in separate sources
No industry standard available to calculate price per use
Time consuming and difficult to match those decision parameters manually
Manual manipulation of data required to enable comparison
Situation Impact
No pre-populated solution to maintain usage and price information and to create
tailor-made reports
Difficult process to create reports to support informed collection decision
Usage statistics and price information do not cover all the journals
No other alternatives when usage and price information is missing

Problem
Library
A tool to collect and consolidate usage data
Solution
Dashboard Reports
Consolidated
ReportsLibrary
SwetsWise
Monthly collected, consolidated data
Online usage transparent and comparable
Processing and editing
- COUNTER reports
- Trend information
- Searches / Sessions
- Content with null usage
- Sushi- and Non-Sushi-compliant data
- Automated and/or manually

Usage and cost analytics with SwetsWise Selection Support Unique collection evaluation tool including
usage, price, price per use and impact factor
SwetsWise Selection Support consists of three modules:
1. See what data you have: A clear overview of all the titles and collection platforms maintained in Selection Support
2. Add data where needed: Add and manage your titles, add collection platforms to Selection Support
3. Select and create reports: There are 29 reports to choose from (COUNTER, Dashboard and customized reports)

First Step: See what data you have
The list is pre-populated for SwetsWise titles.
- Browse, search and sort through all your titles, their price for the current year and their full-text usage.
- Click on a title to access details
- All subscribed SwetsWise titles + publisher usage titles automatically shown

Detailed overview for each title
Eight fields to classify a title, including subject (LC) and an “comment” field.
List of the collection platforms on which you have access to this title and price and usage figures.
Expand to see impact factor in both tabulate and chart format when available.

Second step: Adding a title
Enter the details for the title you want to add – or maybe the SwetsWise catalog knows it?
Now indicate on which platform you have access to this title.
1)
2)
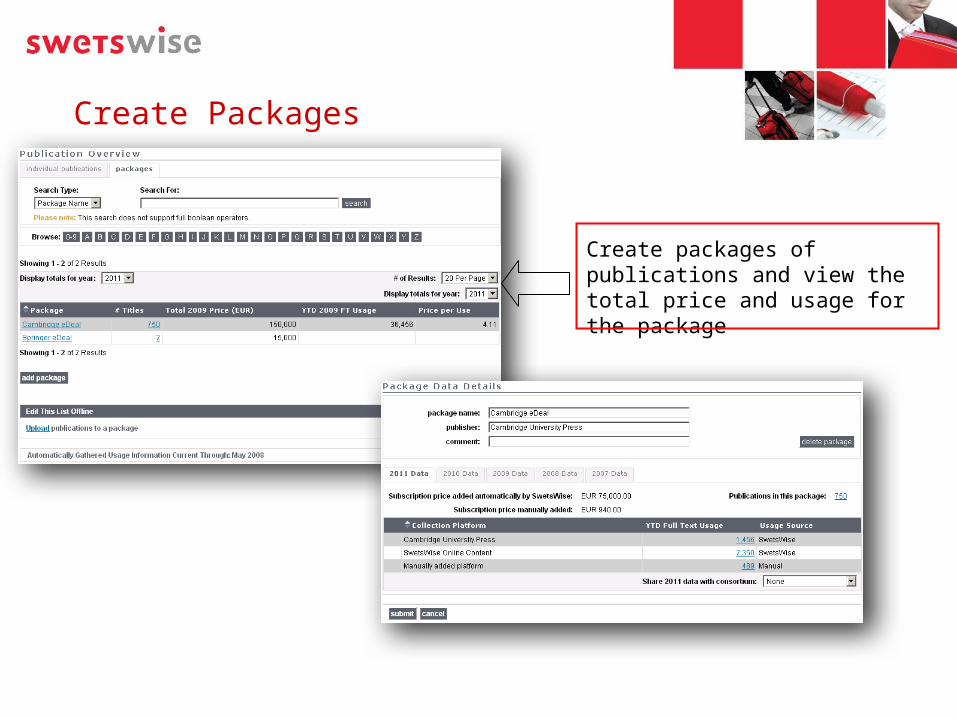
Create Packages
Create packages of publications and view the total price and usage for the package

Data management – Download and Upload

Automated collection platforms
Selection Support supports about 70 automated collection platforms. The usages are delivered twice a month.
Indicator for the availability status of all you automated usage collection by platforms
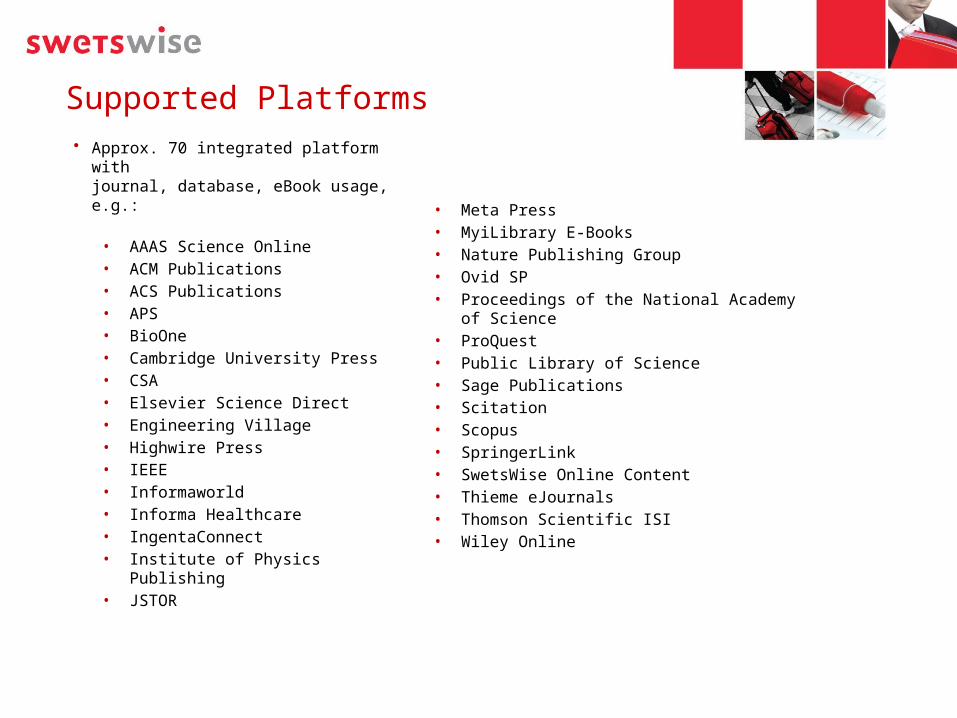
Supported Platforms • Approx. 70 integrated platform with
journal, database, eBook usage, e.g.:
• AAAS Science Online• ACM Publications• ACS Publications• APS• BioOne• Cambridge University Press• CSA• Elsevier Science Direct• Engineering Village• Highwire Press• IEEE• Informaworld• Informa Healthcare• IngentaConnect• Institute of Physics Publishing• JSTOR
• Meta Press• MyiLibrary E-Books• Nature Publishing Group• Ovid SP• Proceedings of the National Academy of
Science• ProQuest• Public Library of Science• Sage Publications• Scitation• Scopus• SpringerLink• SwetsWise Online Content • Thieme eJournals• Thomson Scientific ISI• Wiley Online

Third step: Create reports!
Now you can choose from four different categories of reports – and create your own custom reports!
Check out online charts made with the latest technology, interactive interface and no extra plug-in needed.

Example report: Consolidated Price per use calculation

Online Charts: Usage trends
16

Usage per platform
17

Top 10 publishers
18

Scimago Journal Rank
19

Mendeley - Overview
Mendeley is a next generation work flow tool and social
discovery engine built for the individual researcher to enhance
productivity and facilitate collaboration
The Mendeley Institutional Edition provides librarians a
window into and a platform for supporting the research taking place within their communities
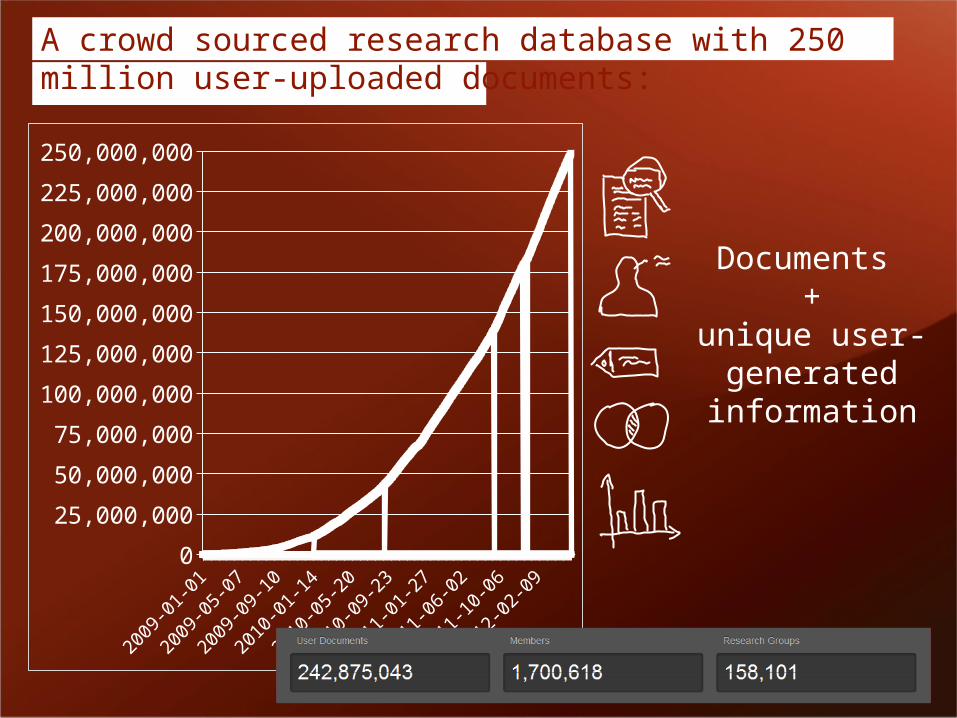
A crowd sourced research database with 250 million user-uploaded documents:
Documents +
unique user-generated information
Janu
ary
2009
May
200
9
Septe
mbe
r 200
9
Janu
ary
2010
May
201
0
Septe
mbe
r 201
0
Janu
ary
2011
May
201
1
Septe
mbe
r 201
1
Janu
ary
2012
May
201
20
25,000,000
50,000,000
75,000,000
100,000,000
125,000,000
150,000,000
175,000,000
200,000,000
225,000,000
250,000,000

Mendeley Institutional Edition - Analytics
What members are reading
Where members are publishing
How publications are accepted

Analyze. Compare. Decide.