Embed Size (px)
Citation preview
Use of Glass in Solar Energy Applications:Now & in the Future:
Corona Solar Group, LLCCanton GA. 30114www.coronasolargroup.com
Discussion Point’s:Market Now
Energy/Markets/Manufacturing/Policy/Trade
Products Nowc-Si/Thin Film/CSP/CPV/BIPV
Industry FutureValue ChainMovements
Future Markets
Future Products c-Si/a-Si/CIGS/Thermal/CSP/BIPV/Hydrogen
Conclusion’s
Current Issues & Topics:
o Is the solar industry going to survive?o Why do you need subsidies?o If Solar is so good why can’t it compete on a level playing
field with current utility power?o What to do about the module dumping issue?o When will we reach grid parity?o Will glass play a major roll in the future of solar?o Is there a cheaper solution other than glass in modules?o What is the best way to keep manufacturing in the United
States?o What new product’s or technologies are in the pipeline?

Market Now
Current Status of the Solar Market:
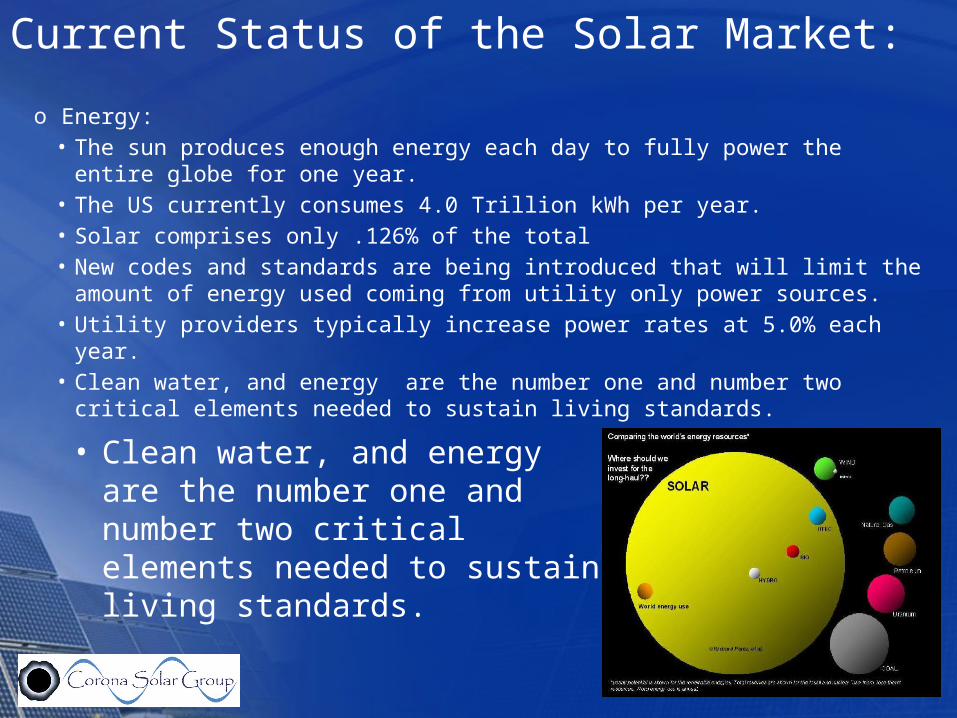
o Energy:• The sun produces enough energy each day to fully power the entire globe
for one year.• The US currently consumes 4.0 Trillion kWh per year.• Solar comprises only .126% of the total• New codes and standards are being introduced that will limit the amount of
energy used coming from utility only power sources.• Utility providers typically increase power rates at 5.0% each year. • Clean water, and energy are the number one and number two critical
elements needed to sustain living standards.• Clean water, and energy are the number one and number two critical elements needed to sustain living standards.
2011 2012 2013 2014 2015 20200.00
500.00
1000.00
1500.00
2000.00
2500.00
3000.00
3500.00
4000.00
4500.00
5000.00
-0.50%
0.00%
0.50%
1.00%
1.50%
2.00%
2.50%
3.00%
3.50%
4.00%
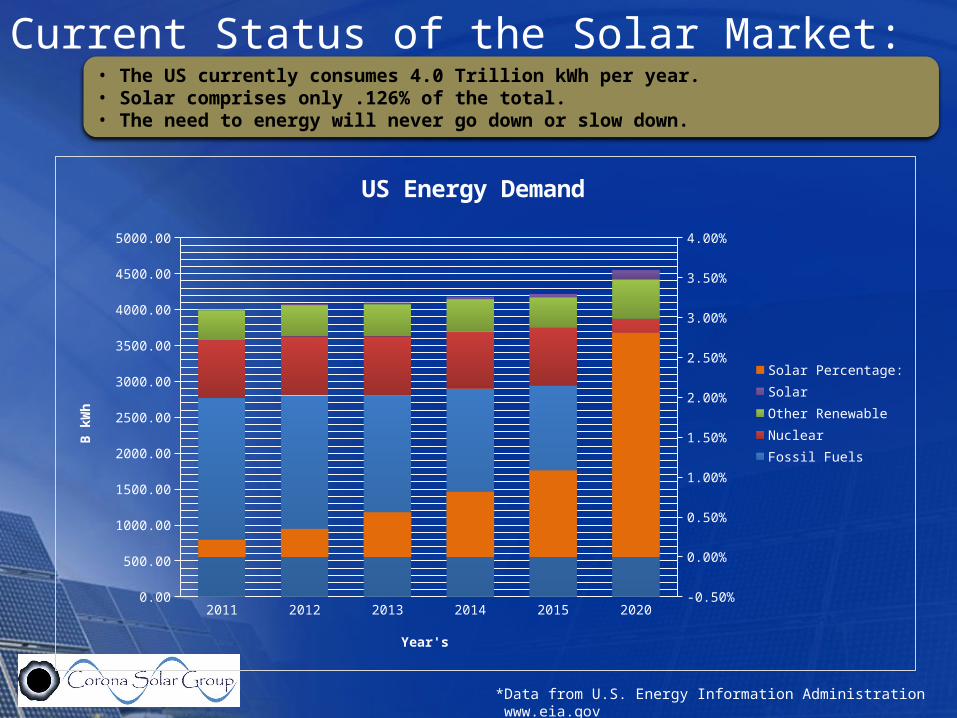
US Energy Demand
Solar Percentage:
Solar
Other Renewable
Nuclear
Fossil Fuels
Year's
B k
Wh
• The US currently consumes 4.0 Trillion kWh per year.• Solar comprises only .126% of the total.• The need to energy will never go down or slow down.
Current Status of the Solar Market:
*Data from U.S. Energy Information Administration www.eia.gov
$0.05
$0.15
$0.25
$0.35
$0.45
$0.55
$0.65
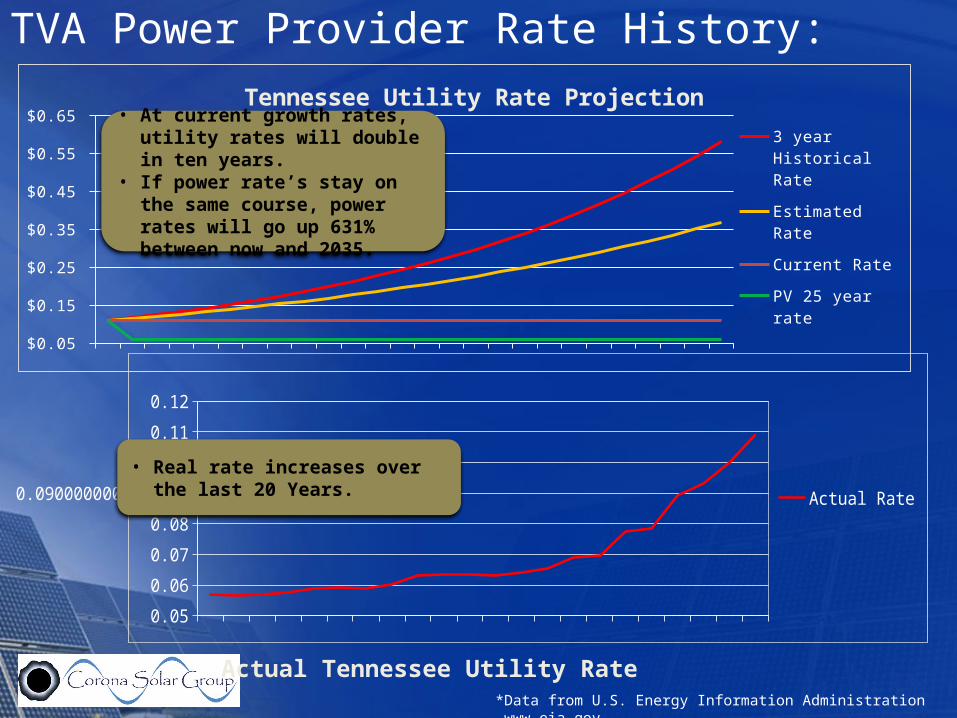
3 year Historical Rate
Estimated Rate
Current Rate
PV 25 year rate
Tennessee Utility Rate Projection
*Data from U.S. Energy Information Administration www.eia.gov
TVA Power Provider Rate History:
0.05
0.06
0.07
0.08
0.0900000000000001
0.1
0.11
0.12
Actual Rate
• At current growth rates, utility rates will double in ten years.
• If power rate’s stay on the same course, power rates will go up 631% between now and 2035.
Actual Tennessee Utility Rate
• Real rate increases over the last 20 Years.
Current Status of the Solar Market:
o Markets:o North American Grid Parity is getting much closer:
o Hawaii, West Coast, North East, Florida, Caribbean…o North America is viewed as the next big solar demand
market by most expert analyst.o South America is relatively untouched, and is poised to be
a great potential solar market.o Current Products are “Engineering Sound”, but not
marketing sound. (Apple II to IPAD theorem). The product need to be made more pleasing to the eye.
o Financial markets are getting better, but financing is still not easy. New models will be coming on the scene.
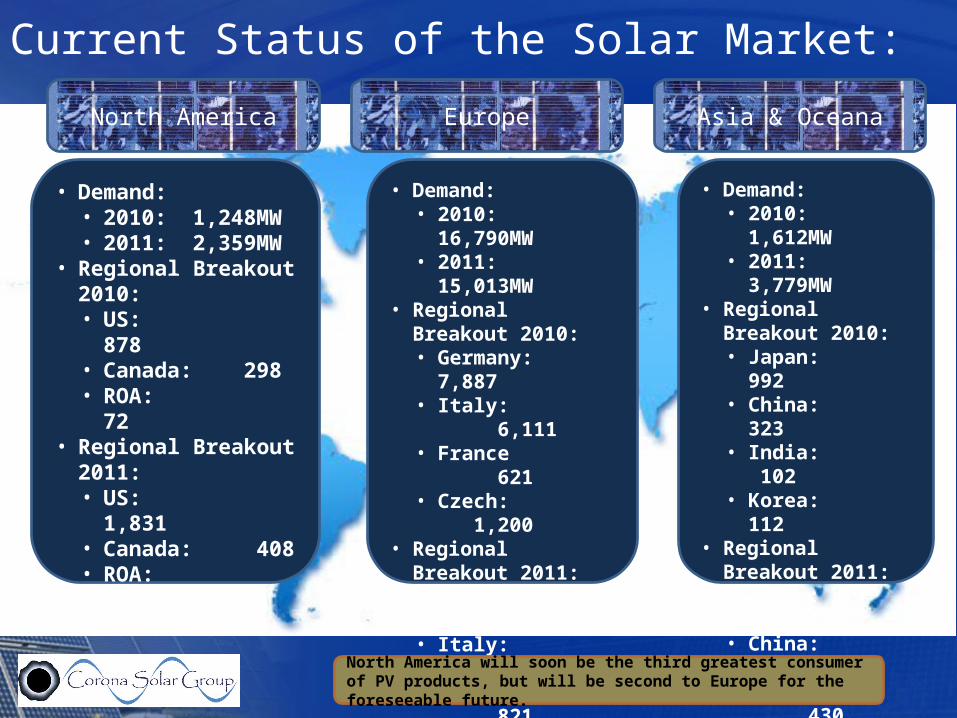
North America Europe Asia & Oceana
• Demand:• 2010: 1,248MW• 2011: 2,359MW
• Regional Breakout 2010:• US: 878• Canada: 298• ROA: 72
• Regional Breakout 2011:• US: 1,831• Canada: 408• ROA: 120
• Demand:• 2010: 16,790MW• 2011: 15,013MW
• Regional Breakout 2010:• Germany: 7,887• Italy: 6,111• France 621 • Czech: 1,200
• Regional Breakout 2011:• Germany: 7,507• Italy: 4,740 • France: 821• Czech: 310
• Demand:• 2010: 1,612MW• 2011: 3,779MW
• Regional Breakout 2010:• Japan: 992• China: 323• India: 102 • Korea: 112
• Regional Breakout 2011:• Japan: 1,488• China: 1,372• India: 430 • Korea: 134
North America will soon be the third greatest consumer of PV products, but will be second to Europe for the foreseeable future.
Current Status of the Solar Market:
Current Status of the Solar Market:o US Market Technology Segments:
o Crystalline Market:o c-Si is still the market leader, and is expected to be for the foreseeable
future.o Enhancements on silicon processing, kerf reduction, thermal wafer lifting,
and other developments drive the continual cost down platform.o Polysilicon is currently $30/kg and expected to go lower in the year. Some
analysis believe the price could go as low as $0/kg.o Thin Film Market:
o CIGS shows positive signs of efficiency, but processing is very difficult, and very costly.
o CdTe is still the Thin Film market leader, but efficiency ceilings are hampering the market.
o a-Si seems to be loosing the battle in the thin film market.o CSP Market:
o The size, cost, and level of bureaucracy is very heavy. CSP projects unless privately funded are very sensitive to governmental actions.
o Cost comparisons to c-Si make CSP LCOE calculations hard.
Current Status of the Solar Market:
o US Market Segments:o Utility:
o Private Equity is hard due to size and cost of projects.o Public projects are fraught with mountains of paperwork and
bureaucracy.o Commercial:
o Companies hoarding cash due to volatility of the political, and economic forecast. They are waiting for concrete signs of the market.
o 2012 is showing signs of life, with Jobs, Capitol.o Residential:
o Loan to value ratio is upside-down in many cases.o New home buyers, and paid off homes are the market of choice.o The residential market will be the last to recover, due to the
foreclosure market.
Current Status of the Solar Market:
o Manufacturing:o EPA & Governmental regulation are forcing manufactures to look in to
low cost alternatives. (low Wage Nations, Nations with less GHG restrictions)
o Greater competition from low cost labor regionso Cost per watt is dropping due to increased capacity, and inventory on
hand.o Currently 10GW of Module Inventory on Marketo 2010 & 2011 saw an increased build out of glass production facilities
in Asia, and India.o The current glass product’s are quickly becoming commoditized.
Differentiation is Key. o Manufacturers have to understand that efficiency of the system is based
upon weakest link. 1.0% increase in module with ARC will be wiped out if the inverter is not efficient. End system power is the name of the game.
Current Status of the Solar Market:
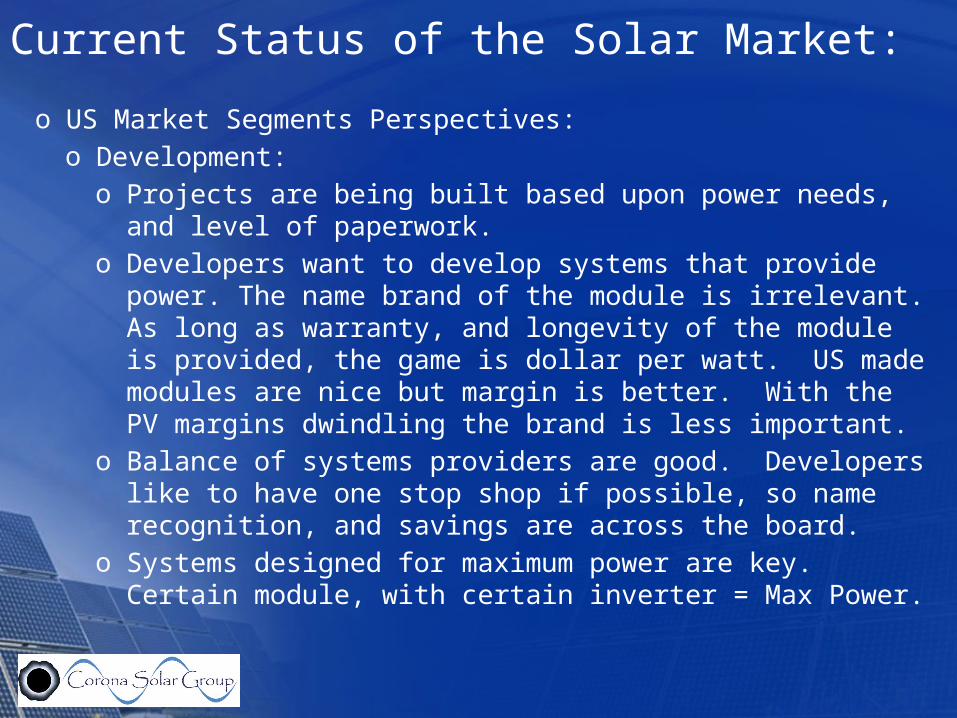
o US Market Segments Perspectives:o Development:
o Projects are being built based upon power needs, and level of paperwork.
o Developers want to develop systems that provide power. The name brand of the module is irrelevant. As long as warranty, and longevity of the module is provided, the game is dollar per watt. US made modules are nice but margin is better. With the PV margins dwindling the brand is less important.
o Balance of systems providers are good. Developers like to have one stop shop if possible, so name recognition, and savings are across the board.
o Systems designed for maximum power are key. Certain module, with certain inverter = Max Power.
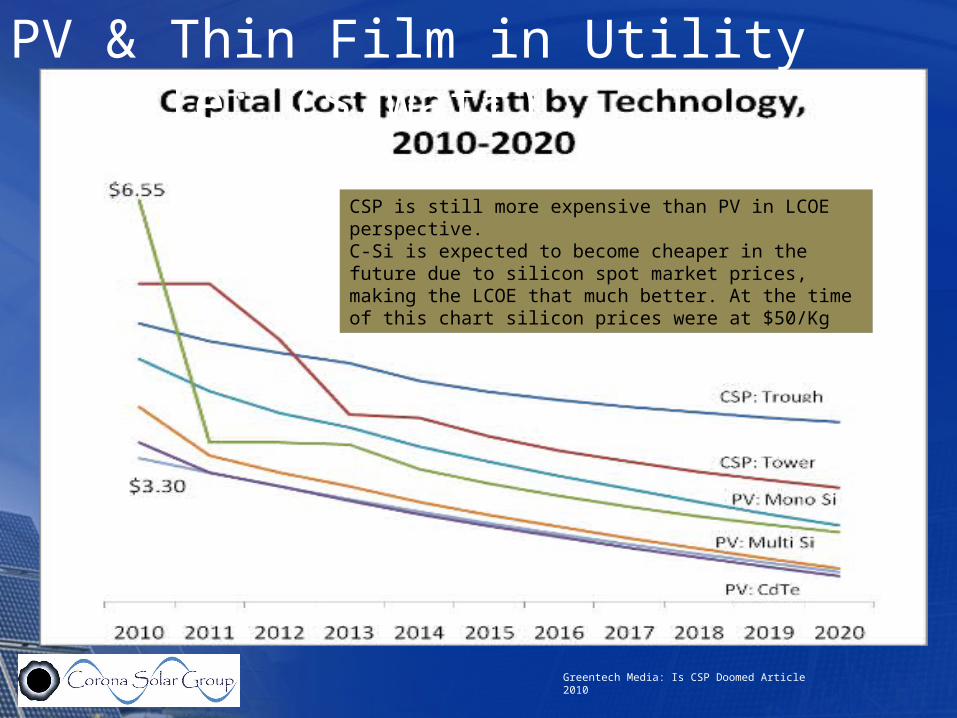
PV & Thin Film in Utility Scale: ($/Watt)
CSP: Dish
Greentech Media: Is CSP Doomed Article 2010
CSP is still more expensive than PV in LCOE perspective.C-Si is expected to become cheaper in the future due to silicon spot market prices, making the LCOE that much better. At the time of this chart silicon prices were at $50/Kg
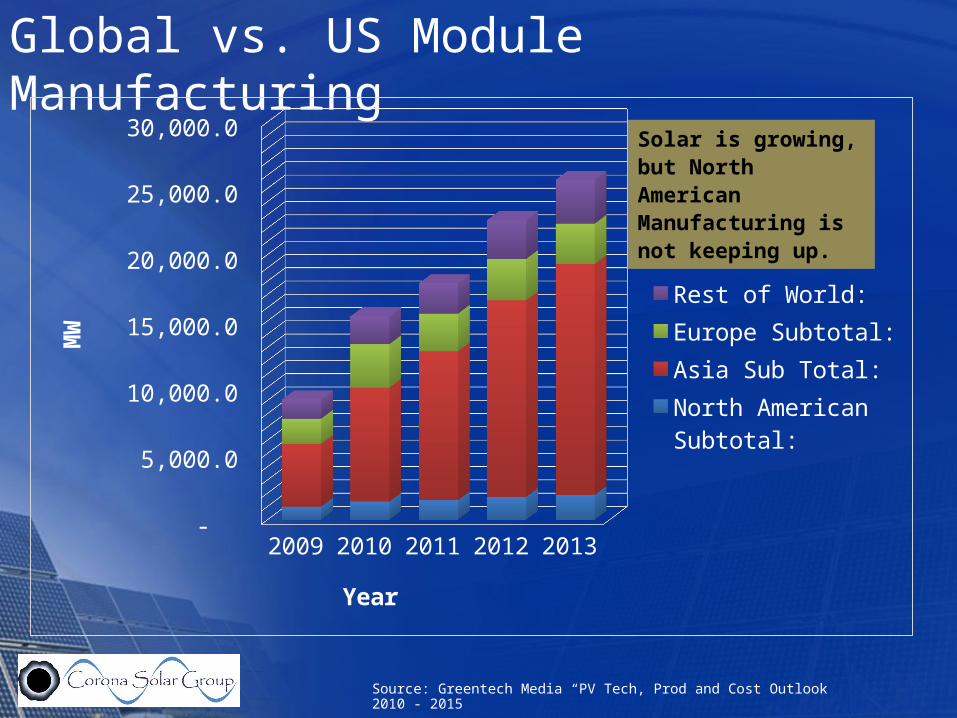
Global vs. US Module Manufacturing
2009 2010 2011 2012 2013 -
5,000.0
10,000.0
15,000.0
20,000.0
25,000.0
30,000.0
Rest of World:Europe Subtotal:Asia Sub Total:North American Subto-tal:
Year
MW
Solar is growing, but North American Manufac-turing is not keeping up.
Source: Greentech Media “PV Tech, Prod and Cost Outlook 2010 - 2015
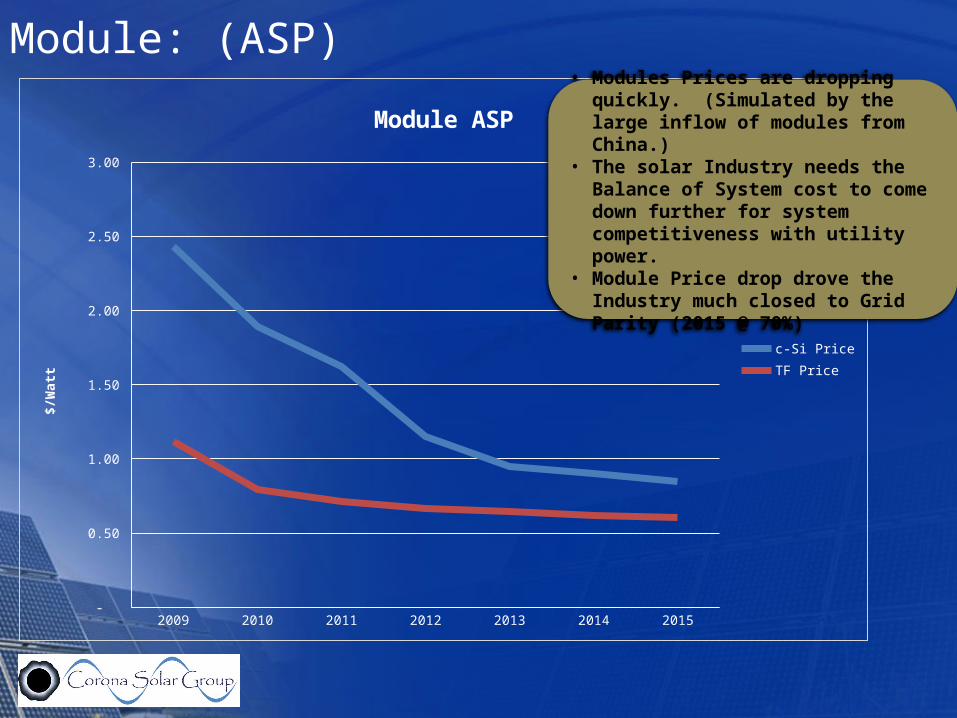
Module: (ASP)
2009 2010 2011 2012 2013 2014 2015 -
0.50
1.00
1.50
2.00
2.50
3.00
Module ASP
c-Si Price
TF Price
$/W
att
• Modules Prices are dropping quickly. (Simulated by the large inflow of modules from China.)
• The solar Industry needs the Balance of System cost to come down further for system competitiveness with utility power.
• Module Price drop drove the Industry much closed to Grid Parity (2015 @ 70%)
Current Status of the Solar Market:
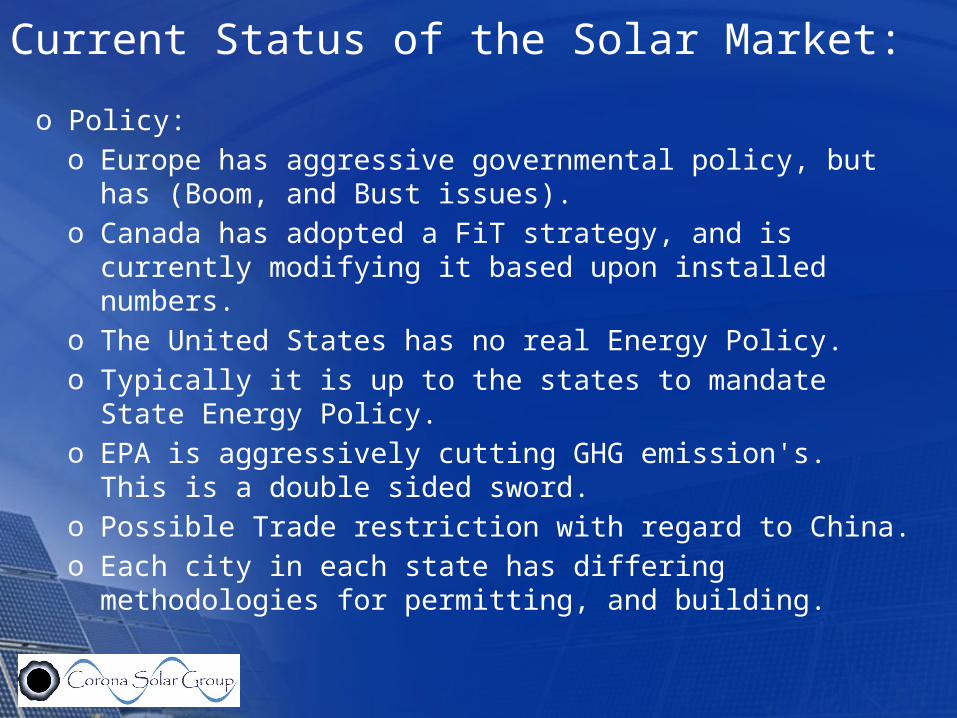
o Policy:o Europe has aggressive governmental policy, but has (Boom,
and Bust issues).o Canada has adopted a FiT strategy, and is currently
modifying it based upon installed numbers.o The United States has no real Energy Policy.o Typically it is up to the states to mandate State Energy Policy.o EPA is aggressively cutting GHG emission's. This is a double
sided sword. o Possible Trade restriction with regard to China.o Each city in each state has differing methodologies for
permitting, and building.
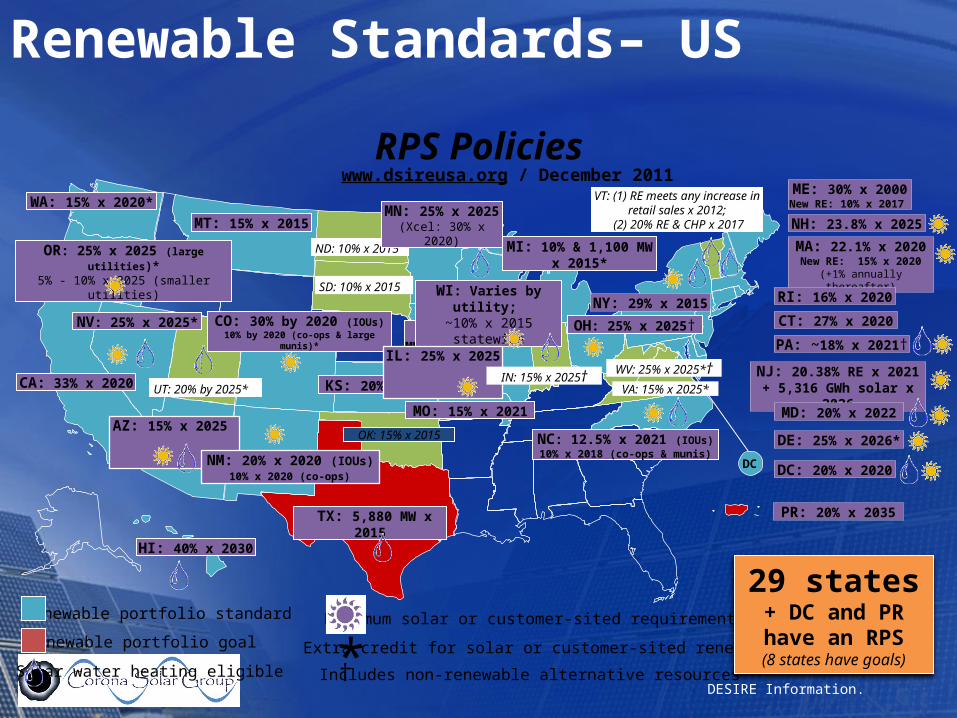
RPS Policies
Renewable portfolio standard
Renewable portfolio goal
www.dsireusa.org / December 2011
Solar water heating eligible *† Extra credit for solar or customer-sited renewables
Includes non-renewable alternative resources
WA: 15% x 2020*
CA: 33% x 2020
NV: 25% x 2025*
AZ: 15% x 2025
NM: 20% x 2020 (IOUs) 10% x 2020 (co-ops)
HI: 40% x 2030
Minimum solar or customer-sited requirement
TX: 5,880 MW x 2015
UT: 20% by 2025*
CO: 30% by 2020 (IOUs)10% by 2020 (co-ops & large
munis)*
MT: 15% x 2015 ND: 10% x
2015
SD: 10% x 2015
IA: 105 MW
MN: 25% x 2025
(Xcel: 30% x 2020)
MO: 15% x 2021
WI: Varies by utility;
~10% x 2015 statewide
MI: 10% & 1,100 MW x 2015*
OH: 25% x 2025†
ME: 30% x 2000New RE: 10% x 2017
NH: 23.8% x 2025
MA: 22.1% x 2020 New RE: 15% x 2020
(+1% annually thereafter)
RI: 16% x 2020
CT: 27% x 2020NY: 29% x 2015
NJ: 20.38% RE x 2021+ 5,316 GWh solar x
2026
PA: ~18% x 2021†
MD: 20% x 2022
DE: 25% x 2026*
DC: 20% x 2020
NC: 12.5% x 2021 (IOUs)10% x 2018 (co-ops & munis)
VT: (1) RE meets any increase in retail sales x
2012; (2) 20% RE & CHP x 2017
KS: 20% x 2020
OR: 25% x 2025 (large utilities)*
5% - 10% x 2025 (smaller utilities)
IL: 25% x 2025
29 states + DC and PR have an RPS(8 states have
goals)
OK: 15% x 2015
PR: 20% x 2035
WV: 25% x 2025*†VA: 15% x 2025*
DC
IN: 15% x 2025†
Renewable Standards– US
DESIRE Information.
Why do you need Subsidy?
o Subsidy:o Tax Credit’s, Grants, Loans, others…o The Oil Industry has been around since 1870 beginning with the
standard oil company.o Oil companies have been receiving governmental subsides since
1916 when federal government instituted income tax incentives to encourage individuals and corporations to drill for oil.
o From the 1950s onward, the federal government financed research into nuclear power.
o More recently, the federal government has provided research funding and other financing to expand the availability of renewable energy sources.
o ALL U.S. Energy Sources receive subsidy’s.
Why do you need subsidy?
o The Oil industry has had 142 years to develop, install, and define their models albeit cost, infrastructure, and development.
o It is naive to think that a new power source will not need help to become a real source of power in the US.
o The renewable industry in its short time period has come down 673% ASP Module.
o The efficiency of modules has risen from 11% in 2004 to 16.0% in 2012 in c-Si average module efficiency.
o Grid Parity where the cost of utility power, and the cost of solar power is equal, is not far away. Some experts believe the 70% on the country will be at grid parity by 2015.
o Do we need Subsidy’s? Yes, at this point it does help out with cost reductions.
o If Solar and all other fuels were to loose the subsidy so that the entire field is flat, solar would not need them.
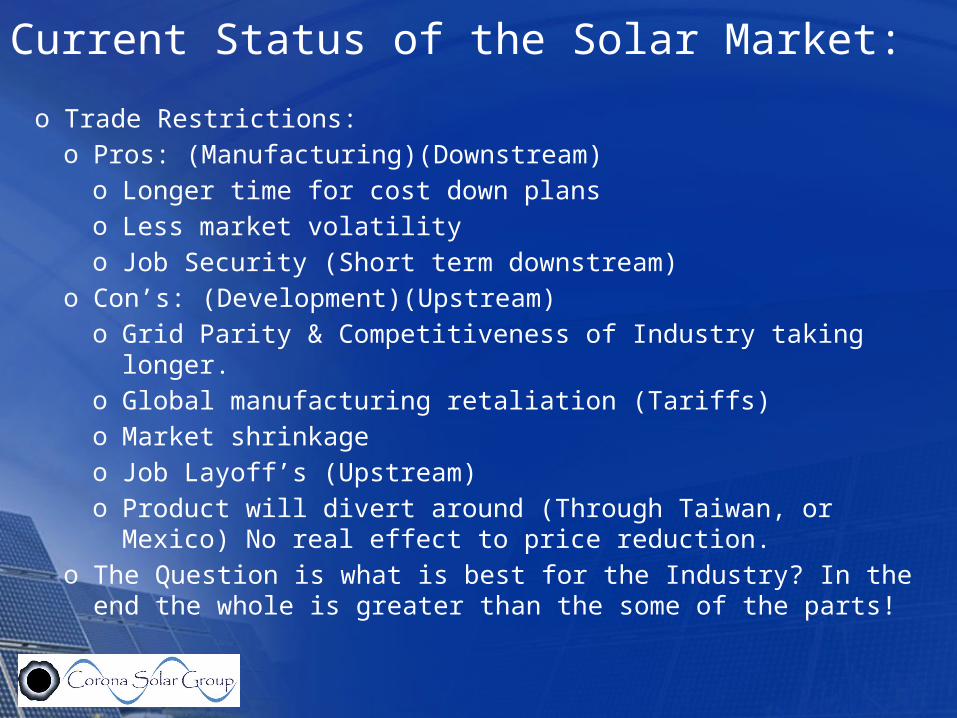
Current Status of the Solar Market:
o Trade Restrictions:o Pros: (Manufacturing)(Downstream)
o Longer time for cost down planso Less market volatilityo Job Security (Short term downstream)
o Con’s: (Development)(Upstream)o Grid Parity & Competitiveness of Industry taking longer.o Global manufacturing retaliation (Tariffs)o Market shrinkageo Job Layoff’s (Upstream)o Product will divert around (Through Taiwan, or Mexico) No real
effect to price reduction.o The Question is what is best for the Industry? In the end the whole is
greater than the some of the parts!
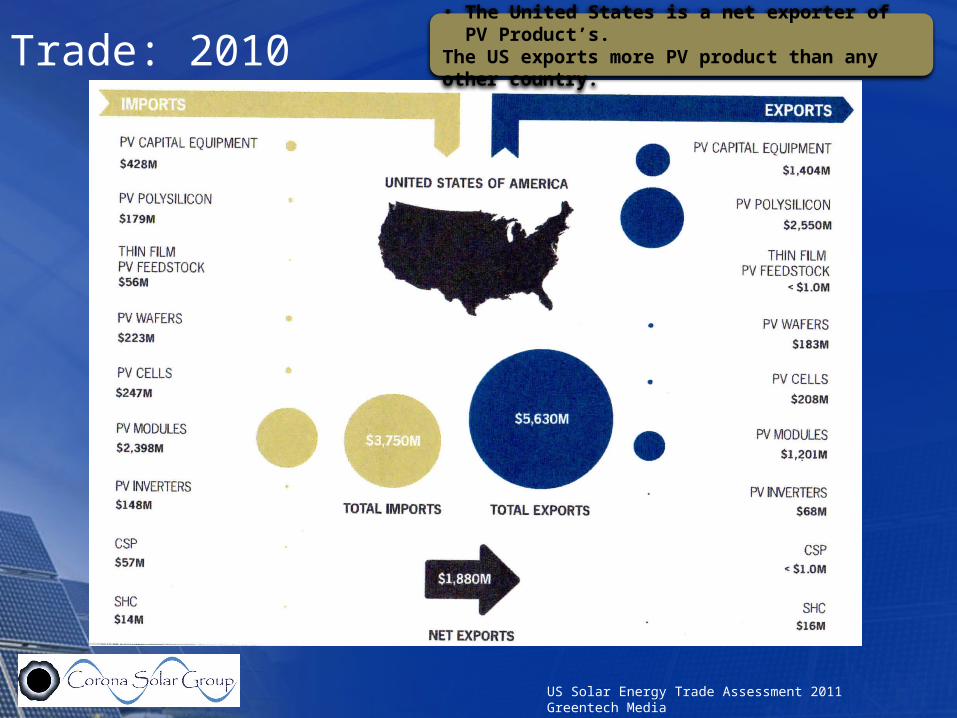
Trade: 2010• The United States is a net exporter of PV
Product’s.The US exports more PV product than any other country.
US Solar Energy Trade Assessment 2011 Greentech Media
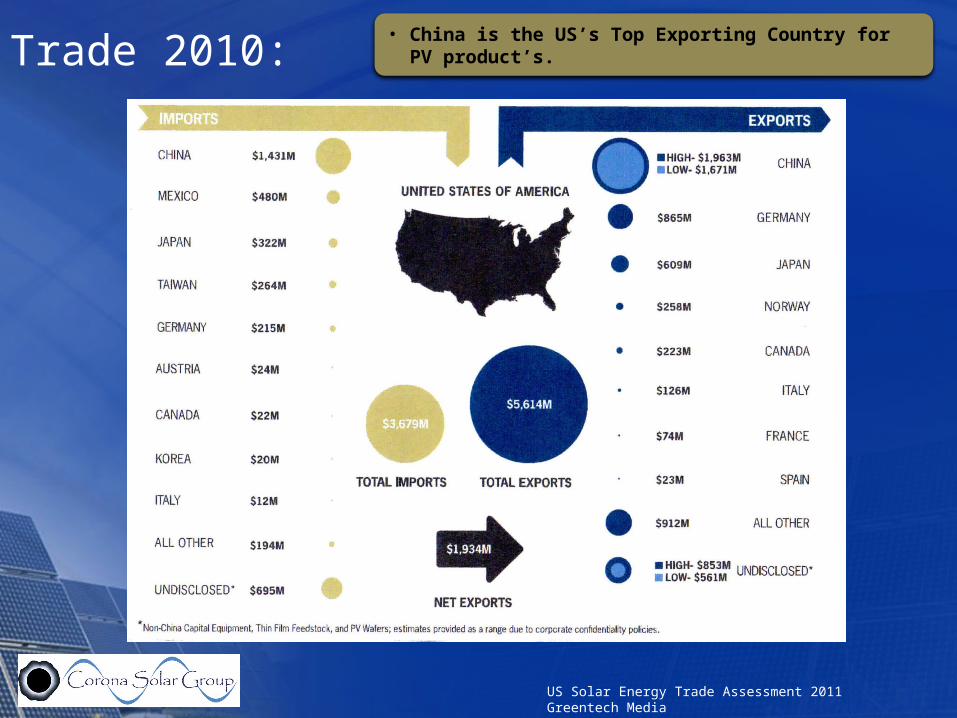
Trade 2010: • China is the US’s Top Exporting Country for PV product’s.
US Solar Energy Trade Assessment 2011 Greentech Media

Products Now
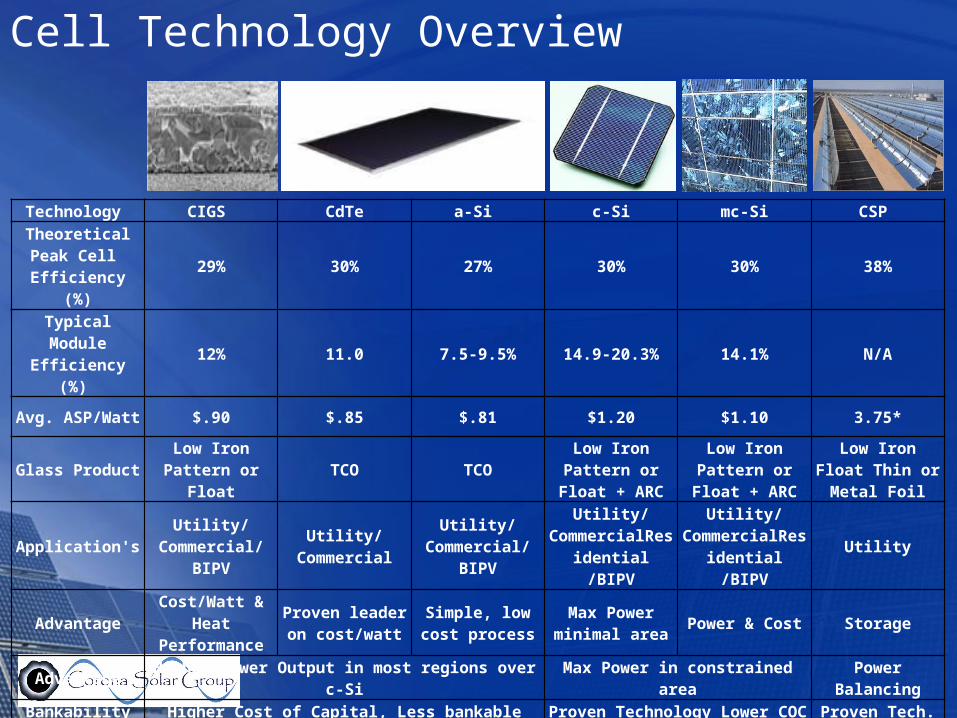
Cell Technology Overview
Technology CIGS CdTe a-Si c-Si mc-Si CSP Theoretical Peak
Cell Efficiency (%) 29% 30% 27% 30% 30% 38%
Typical Module Efficiency (%) 12% 11.0 7.5-9.5% 14.9-20.3% 14.1% N/A
Avg. ASP/Watt $.90 $.85 $.81 $1.20 $1.10 3.75*
Glass Product Low Iron Pattern or Float TCO TCO Low Iron Pattern or
Float + ARCLow Iron Pattern or
Float + ARCLow Iron Float Thin
or Metal Foil
Application's Utility/Commercial/BIPV Utility/Commercial Utility/
Commercial/BIPVUtility/
CommercialResidential /BIPV
Utility/CommercialResiden
tial /BIPVUtility
Advantage Cost/Watt & Heat Performance
Proven leader on cost/watt
Simple, low cost process
Max Power minimal area Power & Cost Storage
Advantage Higher Power Output in most regions over c-Si Max Power in constrained area Power BalancingBankability Higher Cost of Capital, Less bankable Proven Technology Lower COC Proven Tech.
2011 MW Prod NA 24 321 0 1059 5Projected Market
Share 2013 NA 4.00% 14.00% 54.00% 28%
Sustainable Position: Long Term Mid Term Mid Term Long Term Long Term
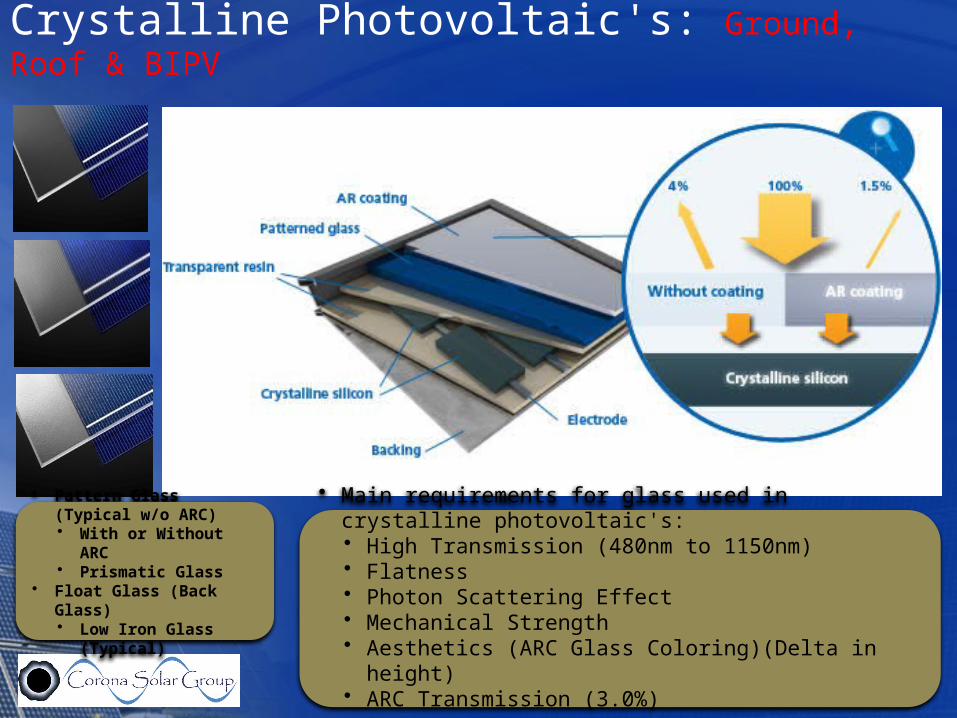
Crystalline Photovoltaic's: Ground, Roof & BIPV
• Main requirements for glass used in crystalline photovoltaic's:• High Transmission (480nm to 1150nm)• Flatness• Photon Scattering Effect• Mechanical Strength• Aesthetics (ARC Glass Coloring)(Delta in height)• ARC Transmission (3.0%)
• Pattern Glass (Typical w/o ARC)• With or Without ARC• Prismatic Glass
• Float Glass (Back Glass)• Low Iron Glass (Typical)
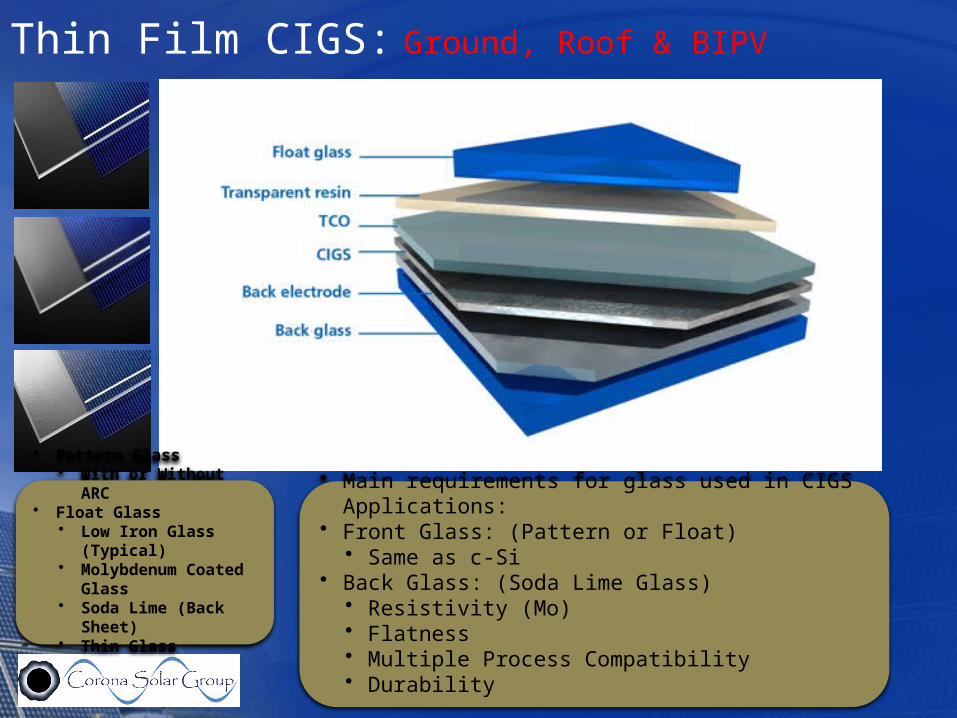
Thin Film CIGS: Ground, Roof & BIPV
• Main requirements for glass used in CIGS Applications:• Front Glass: (Pattern or Float)
• Same as c-Si• Back Glass: (Soda Lime Glass)
• Resistivity (Mo)• Flatness• Multiple Process Compatibility• Durability
• Pattern Glass• With or Without ARC
• Float Glass• Low Iron Glass (Typical)• Molybdenum Coated
Glass• Soda Lime (Back Sheet)• Thin Glass
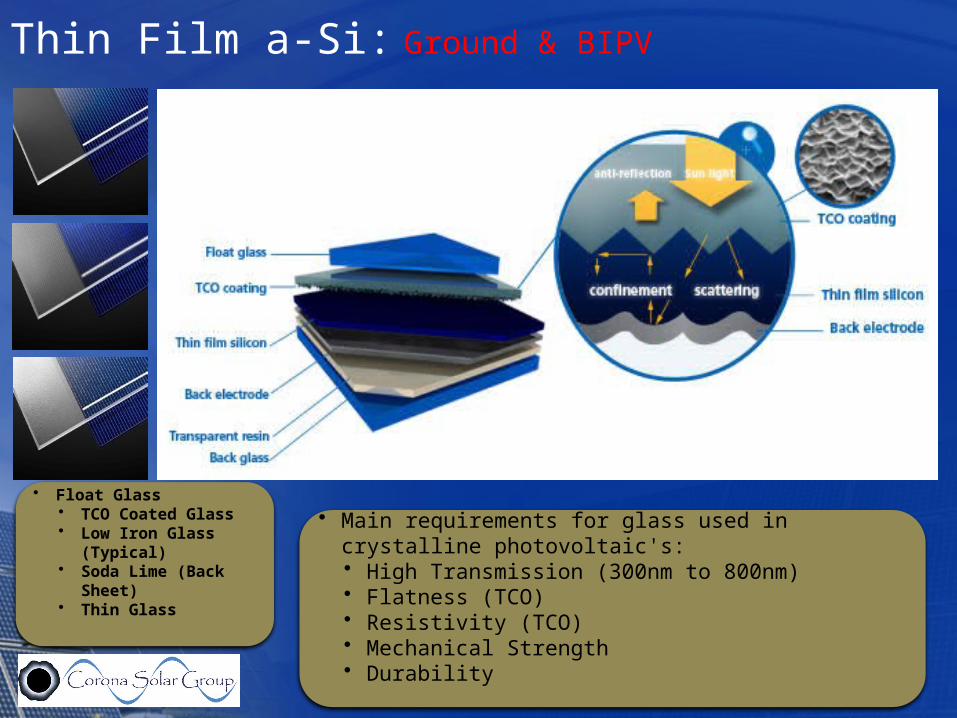
Thin Film a-Si: Ground & BIPV
• Main requirements for glass used in crystalline photovoltaic's:• High Transmission (300nm to 800nm)• Flatness (TCO)• Resistivity (TCO)• Mechanical Strength• Durability
• Float Glass• TCO Coated Glass• Low Iron Glass (Typical)• Soda Lime (Back Sheet)• Thin Glass
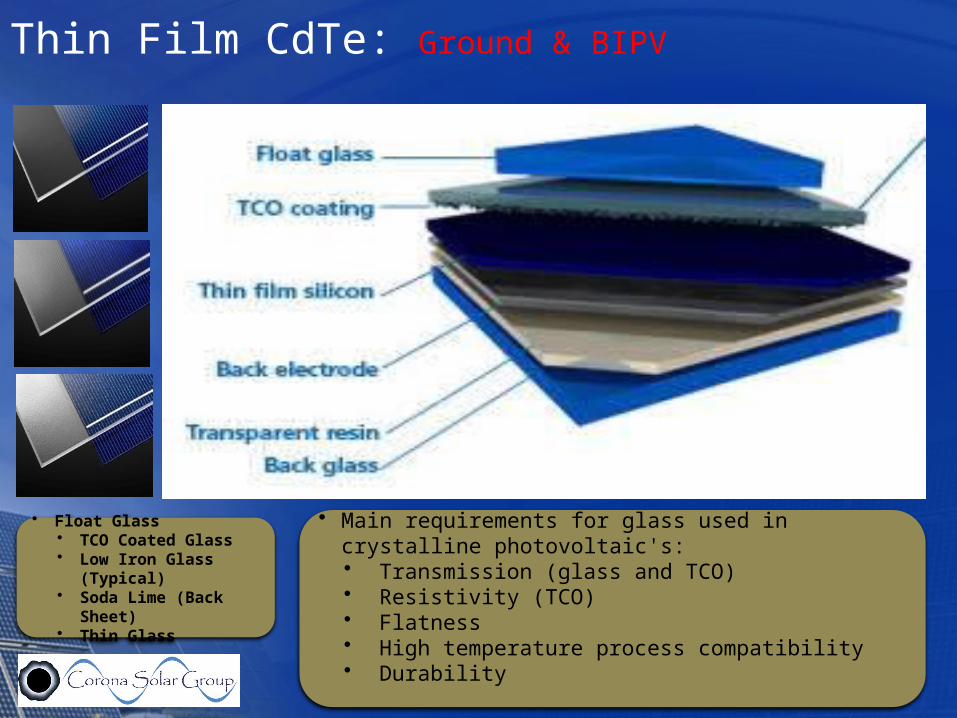
Thin Film CdTe: Ground & BIPV
• Main requirements for glass used in crystalline photovoltaic's:• Transmission (glass and TCO)• Resistivity (TCO)• Flatness• High temperature process compatibility• Durability
• Float Glass• TCO Coated Glass• Low Iron Glass (Typical)• Soda Lime (Back Sheet)• Thin Glass
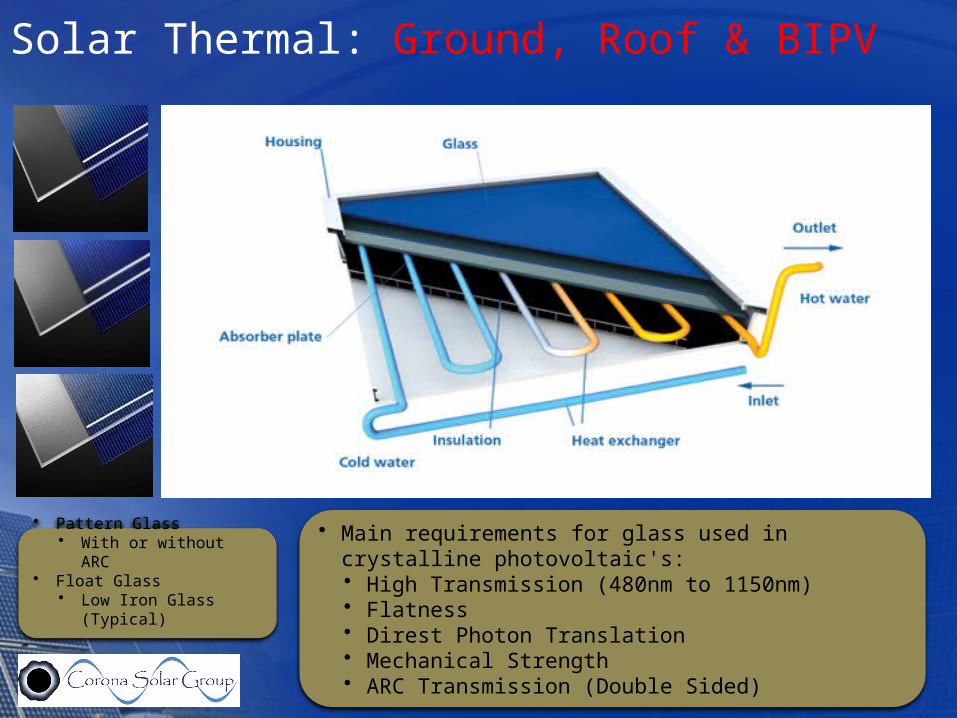
Solar Thermal: Ground, Roof & BIPV
• Main requirements for glass used in crystalline photovoltaic's:• High Transmission (480nm to 1150nm)• Flatness• Direst Photon Translation• Mechanical Strength• ARC Transmission (Double Sided)
• Pattern Glass• With or without ARC
• Float Glass• Low Iron Glass (Typical)
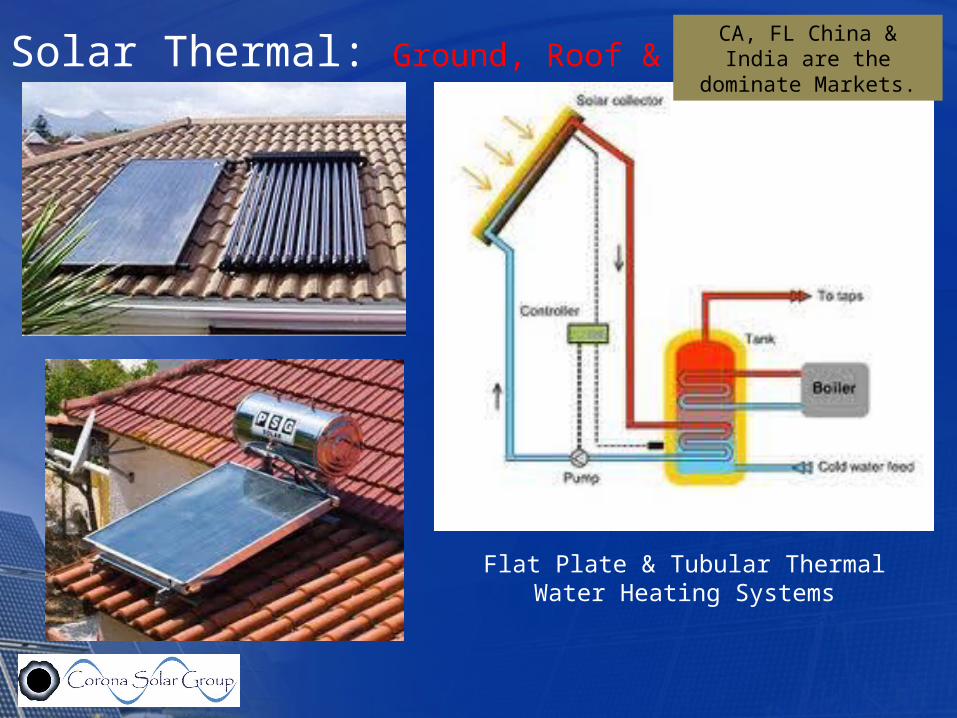
Solar Thermal: Ground, Roof & BIPV
Solatex Solite
Flat Plate & Tubular Thermal Water Heating Systems
CA, FL China & India are the dominate Markets.
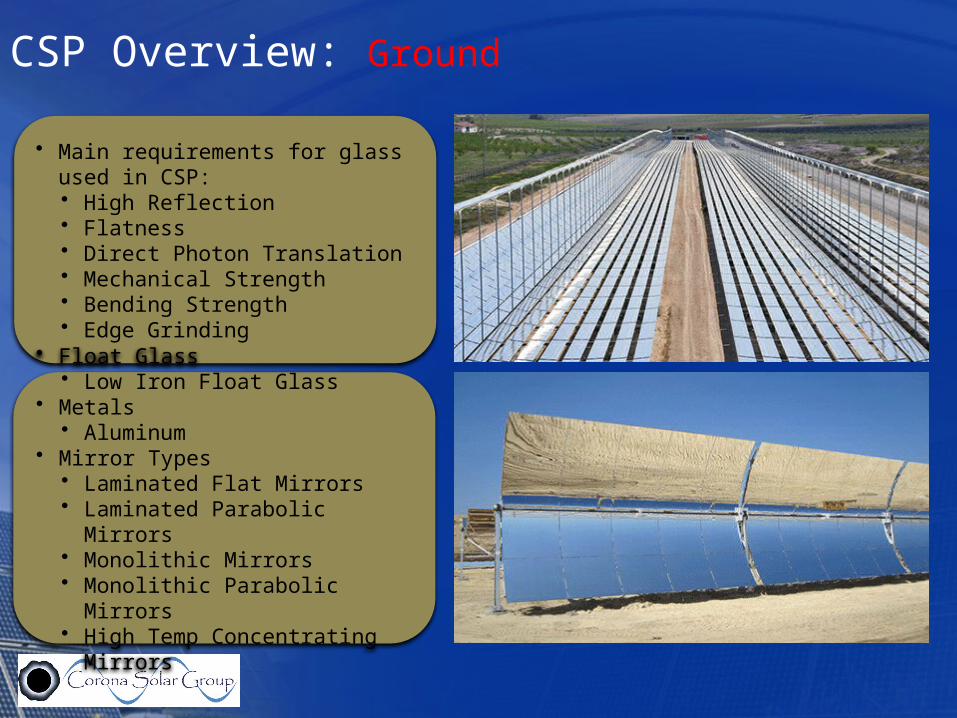
• Main requirements for glass used in CSP:• High Reflection• Flatness• Direct Photon Translation• Mechanical Strength• Bending Strength• Edge Grinding
• Float Glass• Low Iron Float Glass
• Metals• Aluminum
• Mirror Types• Laminated Flat Mirrors• Laminated Parabolic Mirrors• Monolithic Mirrors• Monolithic Parabolic Mirrors• High Temp Concentrating Mirrors
CSP Overview: Ground
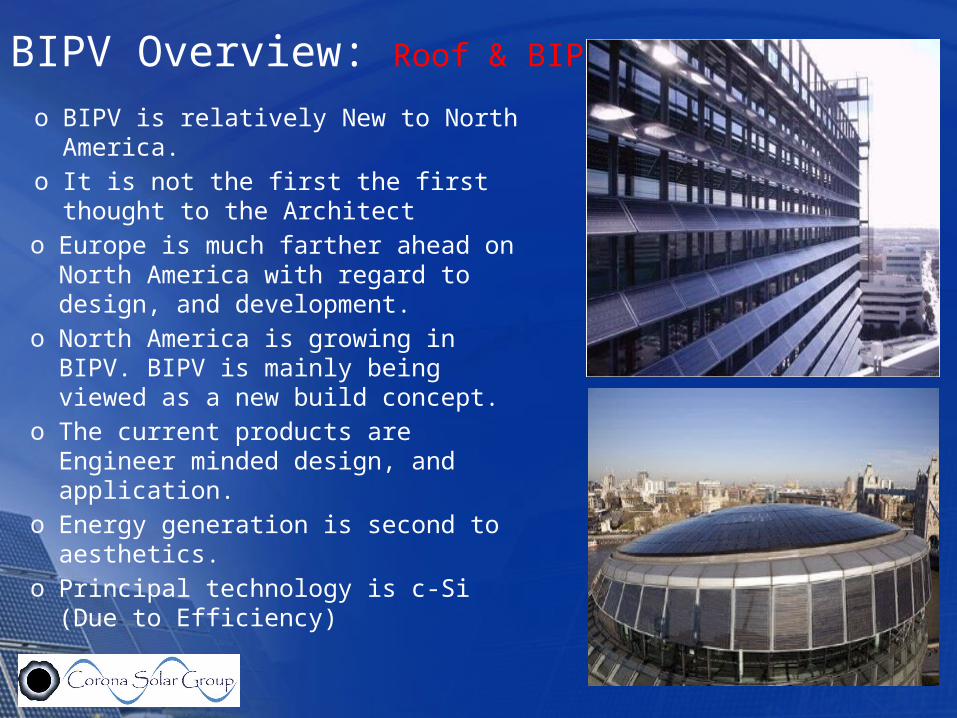
BIPV Overview: Roof & BIPV
o BIPV is relatively New to North America.o It is not the first the first thought to the
Architecto Europe is much farther ahead on North
America with regard to design, and development.
o North America is growing in BIPV. BIPV is mainly being viewed as a new build concept.
o The current products are Engineer minded design, and application.
o Energy generation is second to aesthetics.o Principal technology is c-Si (Due to
Efficiency)
Industry Future
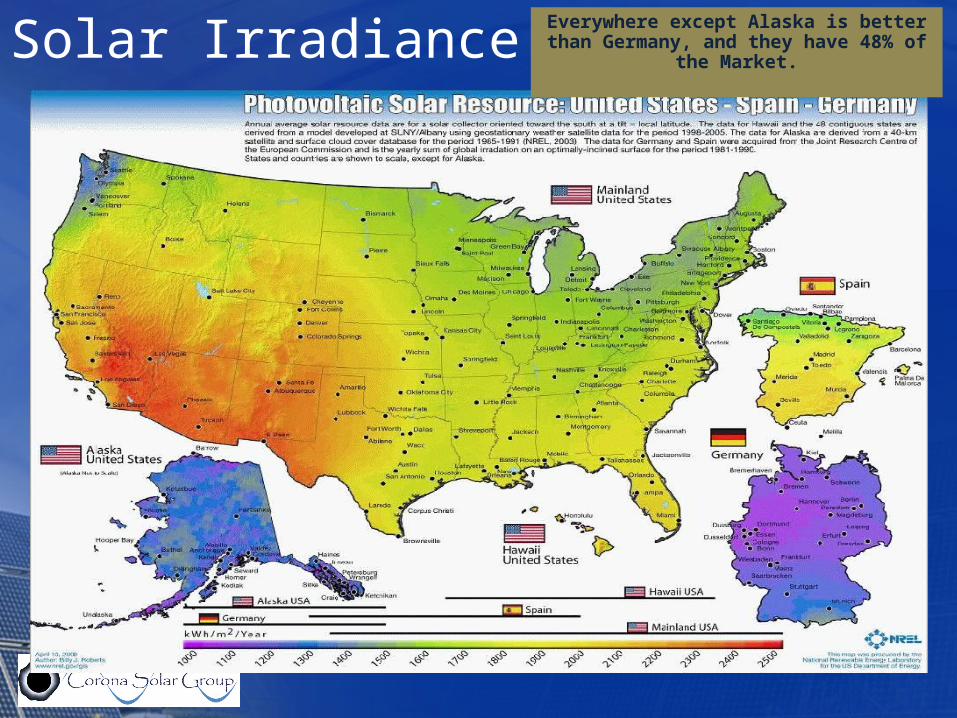
Solar Irradiance Levels: Everywhere except Alaska is better than Germany, and they have 48% of the Market.
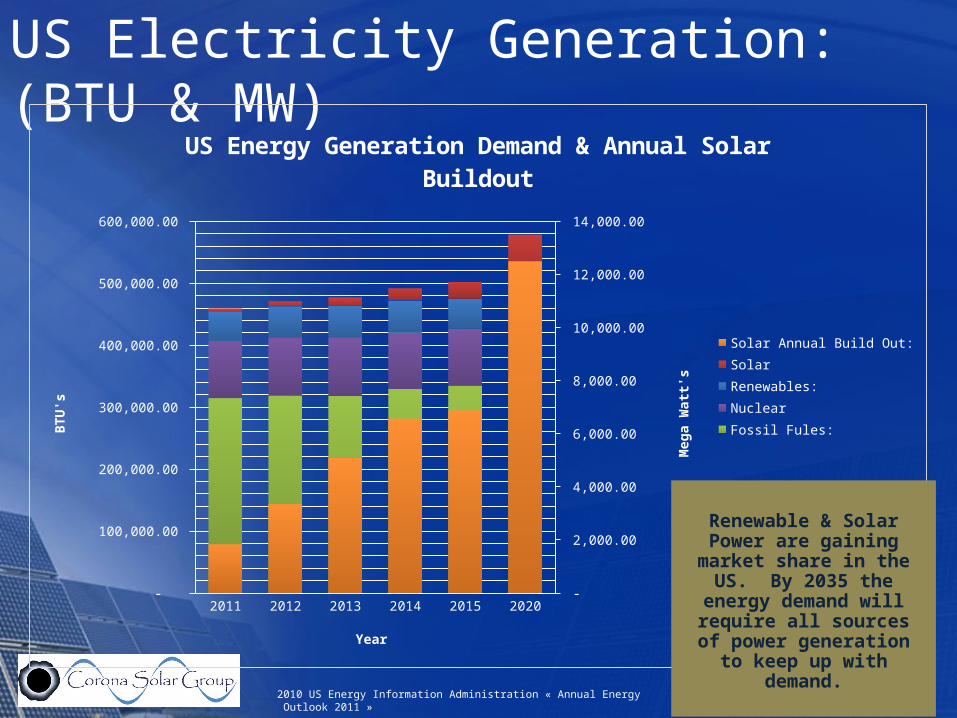
US Electricity Generation: (BTU & MW)
2010 US Energy Information Administration « Annual Energy Outlook 2011 »
2011 2012 2013 2014 2015 2020 -
100,000.00
200,000.00
300,000.00
400,000.00
500,000.00
600,000.00
-
2,000.00
4,000.00
6,000.00
8,000.00
10,000.00
12,000.00
14,000.00
US Energy Generation Demand & Annual Solar Buildout
Solar Annual Build Out:
Solar
Renewables:
Nuclear
Fossil Fules:
Year
BT
U's
Meg
a W
att's
Renewable & Solar Power are gaining market share in the US.
By 2035 the energy demand will require all sources of
power generation to keep up with demand.
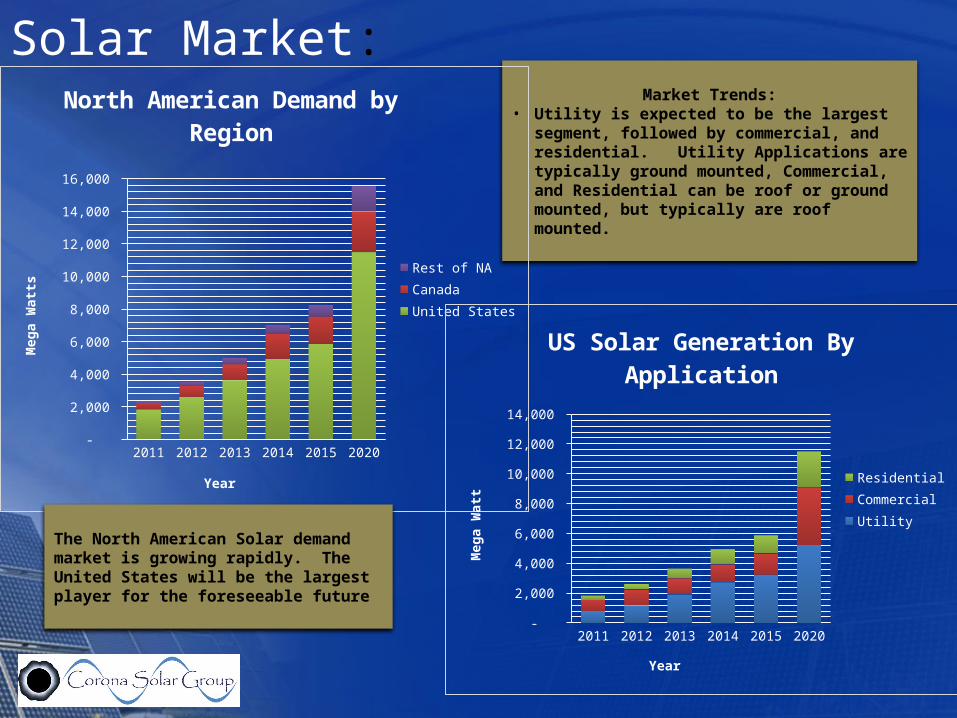
Solar Market:Market Trends:
• Utility is expected to be the largest segment, followed by commercial, and residential. Utility Applications are typically ground mounted, Commercial, and Residential can be roof or ground mounted, but typically are roof mounted.
2011 2012 2013 2014 2015 2020 -
2,000
4,000
6,000
8,000
10,000
12,000
14,000
16,000
North American Demand by Region
Rest of NA
Canada
United States
Year
Meg
a W
atts
2011 2012 2013 2014 2015 2020 -
2,000
4,000
6,000
8,000
10,000
12,000
14,000
US Solar Generation By Applica-tion
Residential
Commercial
Utility
Year
Meg
a W
att
The North American Solar demand market is growing rapidly. The United States will be the largest player for the foreseeable future
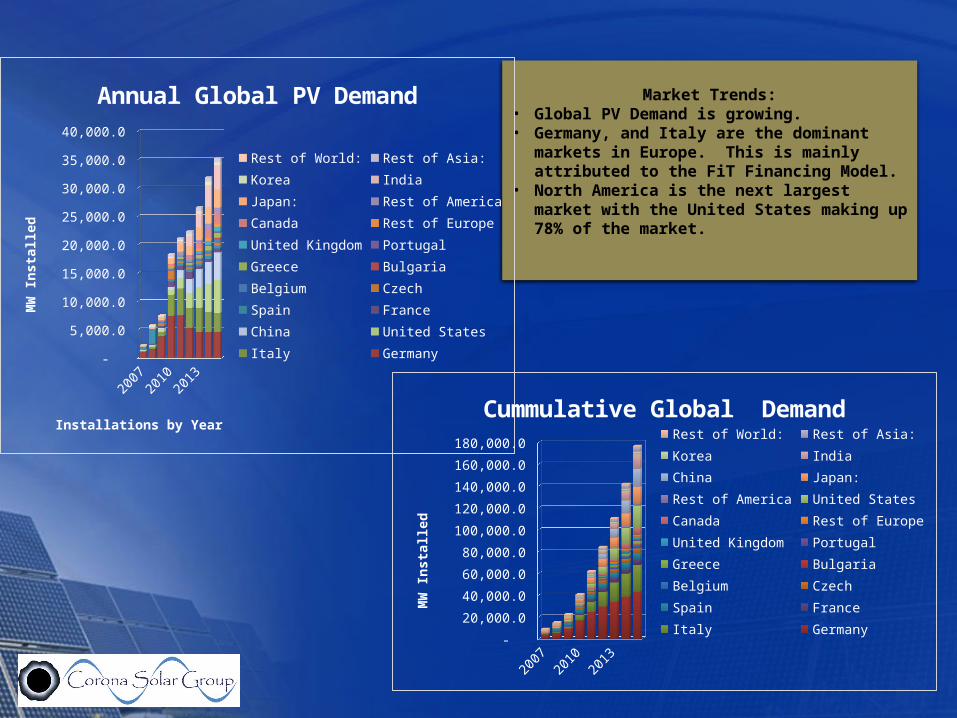
Market Trends:• Global PV Demand is growing. • Germany, and Italy are the dominant markets in
Europe. This is mainly attributed to the FiT Financing Model.
• North America is the next largest market with the United States making up 78% of the market.
2007
2009
2011
2013
2015
-
5,000.0
10,000.0
15,000.0
20,000.0
25,000.0
30,000.0
35,000.0
40,000.0
Annual Global PV Demand
Rest of World: Rest of Asia:
Korea India
Japan: Rest of America
Canada Rest of Europe
United Kingdom Portugal
Greece Bulgaria
Belgium Czech
Spain France
China United States
Italy Germany
Installations by Year
MW
In
stal
led
2007
2009
2011
2013
2015
-
20,000.0
40,000.0
60,000.0
80,000.0
100,000.0
120,000.0
140,000.0
160,000.0
180,000.0
Cummulative Global Demand
Rest of World: Rest of Asia:
Korea India
China Japan:
Rest of America United States
Canada Rest of Europe
United Kingdom Portugal
Greece Bulgaria
Belgium Czech
Spain France
Italy Germany
MW
In
stal
led
Value Chain Movements
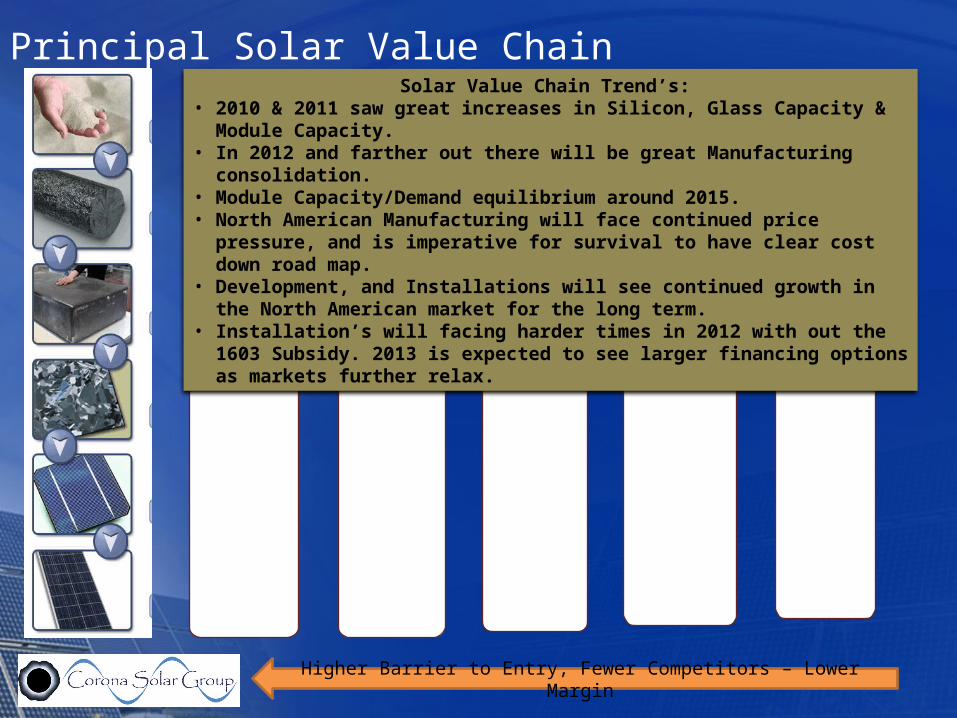
Principal Solar Value Chain
Polysilicon Production & Processing:• Wacker• GCL Silicon• Hemlock• MEMC• REC• M. Setek• Tokuyama• DC Chemical• Deutsche Solar• ErSol• LDK• MEMC• PV Crystalox• Yingli• Others…
Cell & Module Manufacturing • SMA
• PV Powered• Frontious• Blue
• DPW• Cant Sink• Hilti• Raxx• Shoals Tech
• Many Others
Inverter & Framing
• Suniva (Georgia)• Sharp (Tennessee)• ECD (Unisolar)• JA Solar• Kyocera• Motech• Q-Cells• REC• Sanyo• Schott• Sharp• SunPower• Suntech• AGC• PPG• Guardian• Centro Solar• Zero Cote• Honeywell• 3M• DuPont
Design & Development
• PG&E• NV Energy• Cal Edison• Arizona Public• FP&L• Excell• Georgia Power• Duke Energy
• Fortune 50• Farmers• Small Business• Manufacturing• Home Owners• Governments• Islands• Co-Operatives• hundreds more
Utilities & Owners
• Corona Solar• Outpost Solar• Solar City• Conergy• Dependable Solar• Deutsche Solar• Donauer
Solartechnik• GroSolar• Ibersolar Energia• Isofoton• MHH Solartechnik• Phaesun• Phonix Sonnenstrom• REC• SunPower• SunTechnics• Wirsol• Yingli Green Energy
Higher Barrier to Entry, Fewer Competitors – Lower Margin
Solar Value Chain Trend’s: • 2010 & 2011 saw great increases in Silicon, Glass Capacity & Module Capacity. • In 2012 and farther out there will be great Manufacturing consolidation.• Module Capacity/Demand equilibrium around 2015.• North American Manufacturing will face continued price pressure, and is imperative for
survival to have clear cost down road map. • Development, and Installations will see continued growth in the North American market
for the long term. • Installation’s will facing harder times in 2012 with out the 1603 Subsidy. 2013 is expected
to see larger financing options as markets further relax.
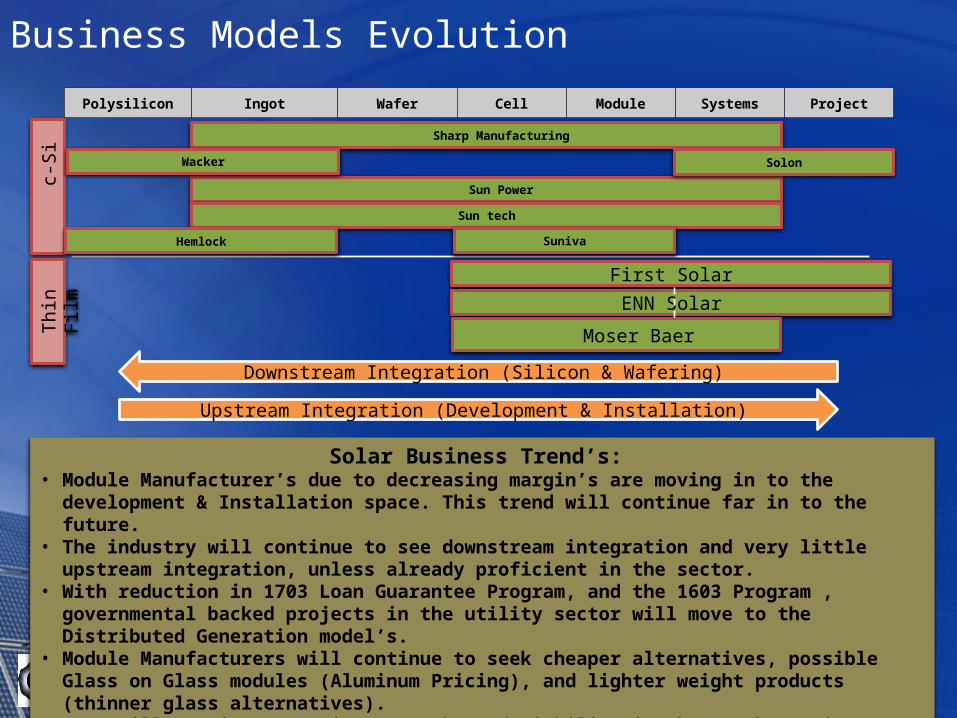
Business Models Evolution
Polysilicon Ingot Wafer Cell Module Systems Project
c
-Si
T
hin
Film
First Solar
ENN Solar
Moser Baer
Sun Power
Sun tech
Sharp Manufacturing
Solon
Solar Business Trend’s: • Module Manufacturer’s due to decreasing margin’s are moving in to the development & Installation space. This
trend will continue far in to the future.• The industry will continue to see downstream integration and very little upstream integration, unless already
proficient in the sector.• With reduction in 1703 Loan Guarantee Program, and the 1603 Program , governmental backed projects in the
utility sector will move to the Distributed Generation model’s.• Module Manufacturers will continue to seek cheaper alternatives, possible Glass on Glass modules (Aluminum
Pricing), and lighter weight products (thinner glass alternatives).• BIPV will continue to gain strength, and viability in the North American market.
Downstream Integration (Silicon & Wafering)
Upstream Integration (Development & Installation)
Wacker
SunivaHemlock
Future Markets
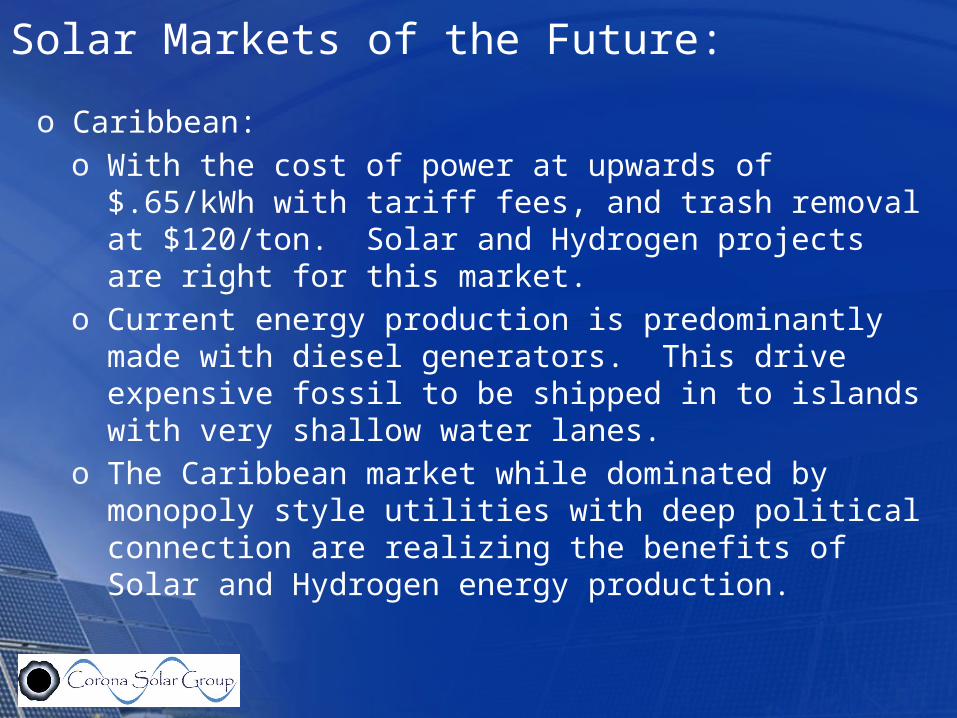
Solar Markets of the Future:
o Caribbean:o With the cost of power at upwards of $.65/kWh with
tariff fees, and trash removal at $120/ton. Solar and Hydrogen projects are right for this market.
o Current energy production is predominantly made with diesel generators. This drive expensive fossil to be shipped in to islands with very shallow water lanes.
o The Caribbean market while dominated by monopoly style utilities with deep political connection are realizing the benefits of Solar and Hydrogen energy production.
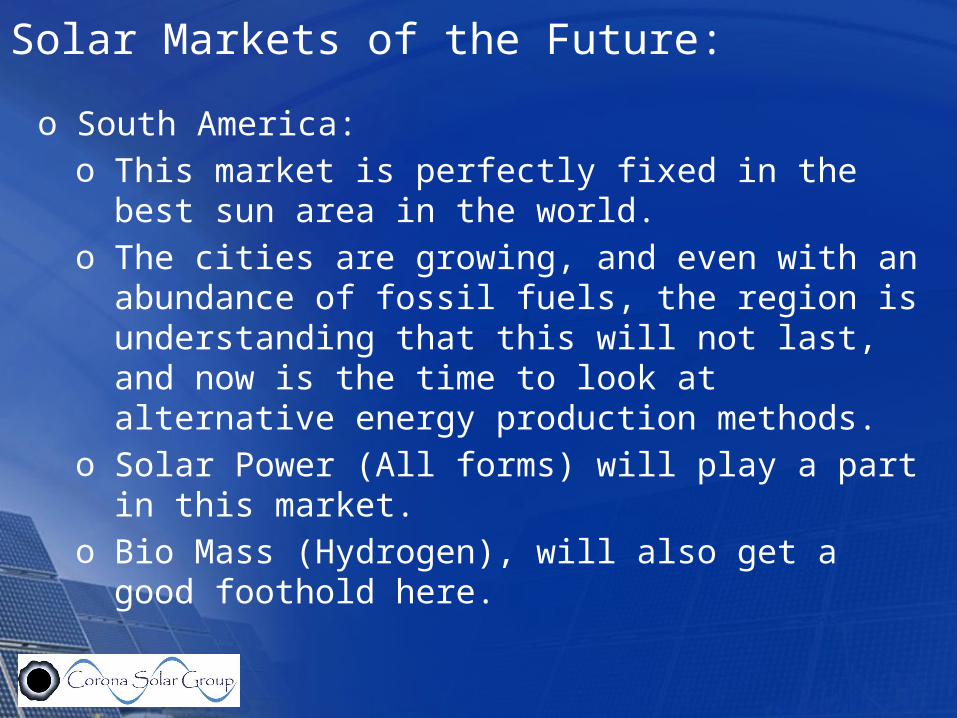
Solar Markets of the Future:
o South America:o This market is perfectly fixed in the best sun area in
the world. o The cities are growing, and even with an abundance
of fossil fuels, the region is understanding that this will not last, and now is the time to look at alternative energy production methods.
o Solar Power (All forms) will play a part in this market.o Bio Mass (Hydrogen), will also get a good foothold
here.
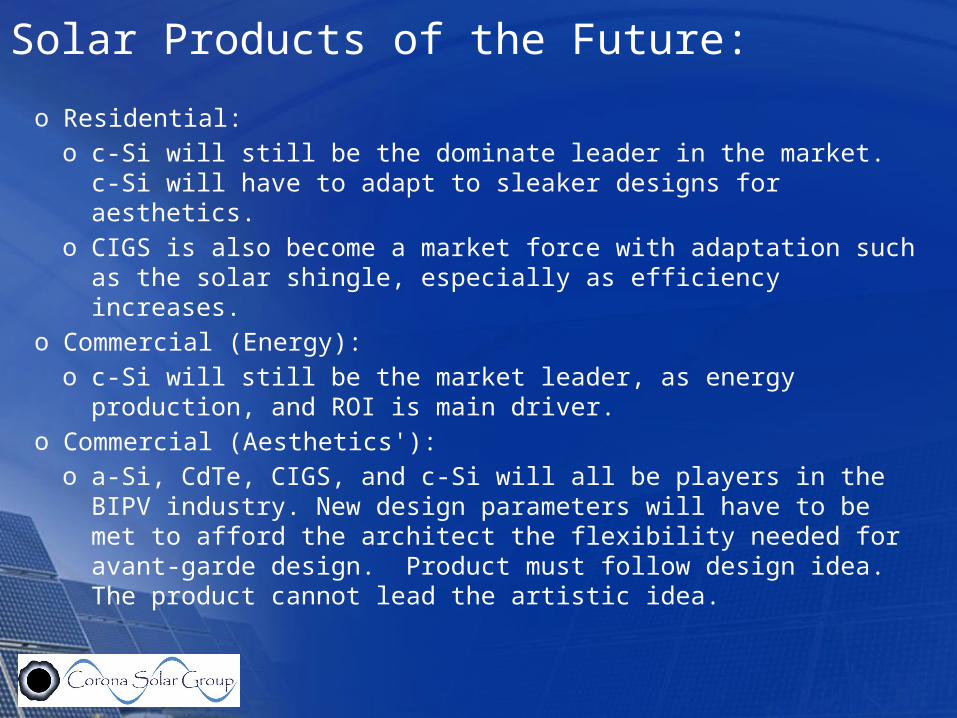
Solar Products of the Future:
o Residential:o c-Si will still be the dominate leader in the market. c-Si will have
to adapt to sleaker designs for aesthetics.o CIGS is also become a market force with adaptation such as the
solar shingle, especially as efficiency increases.o Commercial (Energy):
o c-Si will still be the market leader, as energy production, and ROI is main driver.
o Commercial (Aesthetics'):o a-Si, CdTe, CIGS, and c-Si will all be players in the BIPV industry.
New design parameters will have to be met to afford the architect the flexibility needed for avant-garde design. Product must follow design idea. The product cannot lead the artistic idea.
Solar Products of the Future:
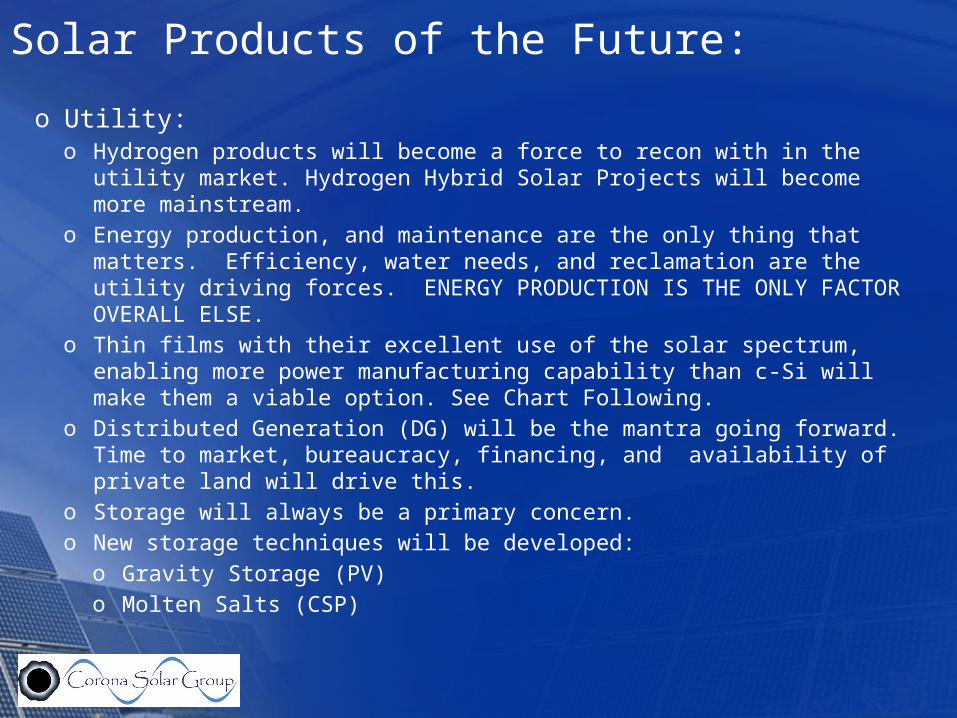
o Utility:o Hydrogen products will become a force to recon with in the utility market.
Hydrogen Hybrid Solar Projects will become more mainstream.o Energy production, and maintenance are the only thing that matters.
Efficiency, water needs, and reclamation are the utility driving forces. ENERGY PRODUCTION IS THE ONLY FACTOR OVERALL ELSE.
o Thin films with their excellent use of the solar spectrum, enabling more power manufacturing capability than c-Si will make them a viable option. See Chart Following.
o Distributed Generation (DG) will be the mantra going forward. Time to market, bureaucracy, financing, and availability of private land will drive this.
o Storage will always be a primary concern.o New storage techniques will be developed:
o Gravity Storage (PV)o Molten Salts (CSP)
Phoenix Sacramento New York Seattle -
500
1,000
1,500
2,000
2,500
3,000
3,500
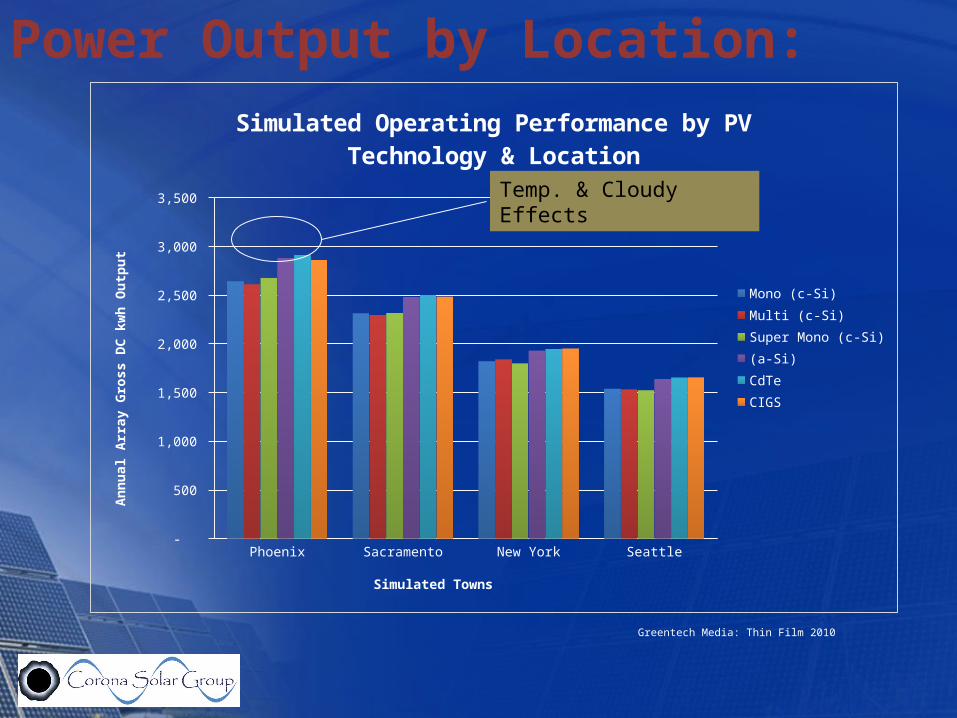
Simulated Operating Performance by PV Technology & Location
Mono (c-Si)
Multi (c-Si)
Super Mono (c-Si)
(a-Si)
CdTe
CIGS
Simulated Towns
An
nu
al A
rray
Gro
ss D
C k
wh
Ou
tpu
t
Greentech Media: Thin Film 2010
Temp. & Cloudy Effects
Power Output by Location:

Future Product’s
Solar Products of the Future:
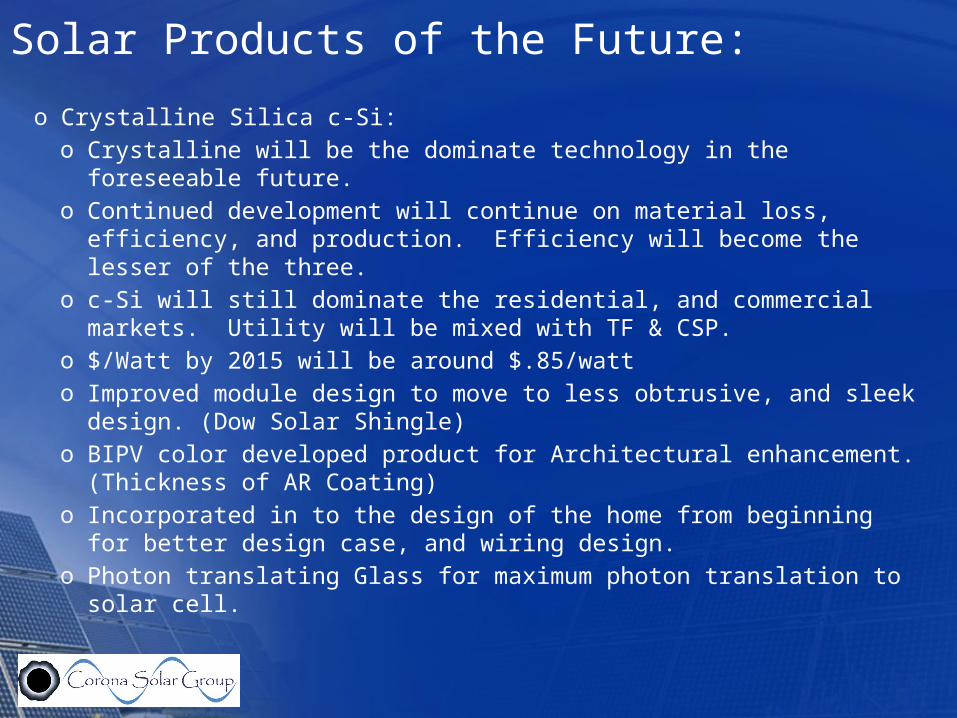
o Crystalline Silica c-Si:o Crystalline will be the dominate technology in the foreseeable future.o Continued development will continue on material loss, efficiency, and
production. Efficiency will become the lesser of the three.o c-Si will still dominate the residential, and commercial markets.
Utility will be mixed with TF & CSP.o $/Watt by 2015 will be around $.85/watto Improved module design to move to less obtrusive, and sleek design.
(Dow Solar Shingle)o BIPV color developed product for Architectural enhancement.
(Thickness of AR Coating)o Incorporated in to the design of the home from beginning for better
design case, and wiring design.o Photon translating Glass for maximum photon translation to solar cell.
Solar Products of the Future:
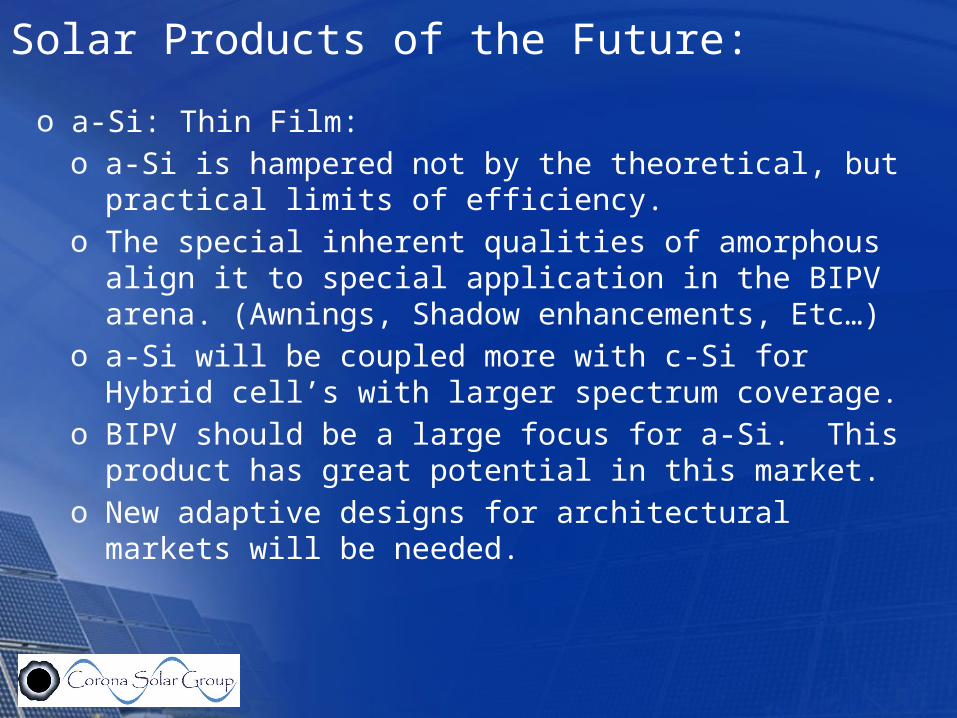
o a-Si: Thin Film:o a-Si is hampered not by the theoretical, but practical
limits of efficiency.o The special inherent qualities of amorphous align it to
special application in the BIPV arena. (Awnings, Shadow enhancements, Etc…)
o a-Si will be coupled more with c-Si for Hybrid cell’s with larger spectrum coverage.
o BIPV should be a large focus for a-Si. This product has great potential in this market.
o New adaptive designs for architectural markets will be needed.
Solar Products of the Future:
o CIGS:o CIGS will be the dominate player with regard to
efficiency, and heat tolerance.o Due to sensitivity and difficulty in taking product to
production level, few manufacturers will stay with product, so manufacturing base will be limited.
o CIGS should always be cost conscience, so Glass/Glass products will be the dominate product.
Solar Products of the Future:
o BIPV:o North America will be come a large market for BIPV.
There is extensive work being done on the standards side, with percentages of building energy derived from renewable resources. DOE is driving for 5% of building energy to come from renewable sources.
o From the Lease and Sell perspective, BIPV building due to the lower cost of energy, and new building techniques with renewable products. The building will have better resale value for a longer period of time.
Solar Products of the Future:
o Thermal:o Thermal will always be a good market. South
America is next large thermal, and Solar Market.o Thermal with adaptive design can greatly benefit the
BIPV market. o CSP:o CSP will play a large role in the future of solar. Some
experts say that as much as 25% will come from CSP. I believe that number to be to high, but CSP will play a large role in Utility level power production. What the number will be is anyone's guess.
Solar Products of the Future:
o New Technologies:o Hydrogen Power:
o Energy derived from hydrogen gas itself, or mixed with a fuel cell.o Hydrogen generation plants that intake biomass, and or garbage, and
output hydrogen gas, and water will be come very predominate in the future.
o The cost of energy production is 1/3 the cost of Solar, and has no storage problems.
o This is an excellent choice for large commercial, and Utility level energy generation.
o This technology will enable Coal fired plant reuse options saving utilities millions of dollars with plant shut downs, and or expensive scrubbing methods.
o Leveraging existing asset base with existing power infrastructure will make old, and obsolete plants back online with minimal investment.
o The energy needs of the future will not cannibalize any product, but will need each one to be able to power the future.
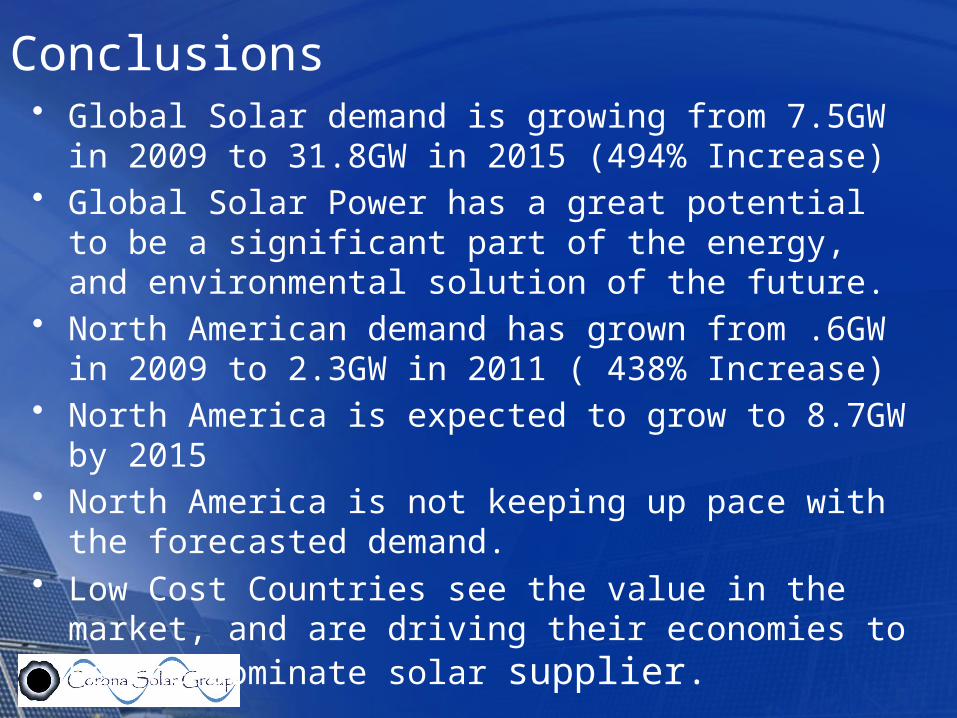
• Global Solar demand is growing from 7.5GW in 2009 to 31.8GW in 2015 (494% Increase)
• Global Solar Power has a great potential to be a significant part of the energy, and environmental solution of the future.
• North American demand has grown from .6GW in 2009 to 2.3GW in 2011 ( 438% Increase)
• North America is expected to grow to 8.7GW by 2015• North America is not keeping up pace with the forecasted
demand.• Low Cost Countries see the value in the market, and are driving
their economies to be the dominate solar supplier.
Conclusions
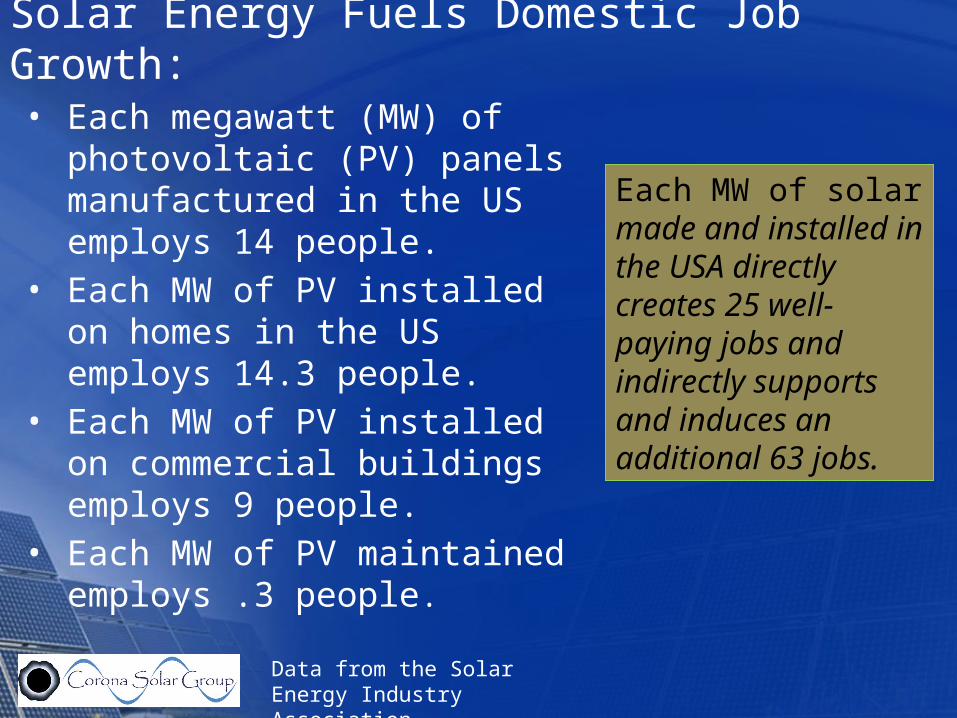
Solar Energy Fuels Domestic Job Growth:• Each megawatt (MW) of
photovoltaic (PV) panels manufactured in the US employs 14 people.
• Each MW of PV installed on homes in the US employs 14.3 people.
• Each MW of PV installed on commercial buildings employs 9 people.
• Each MW of PV maintained employs .3 people.
Each MW of solar made and installed in the USA directly creates 25 well‐paying jobs and indirectly supports and induces an additional 63 jobs.
Data from the Solar Energy Industry Association
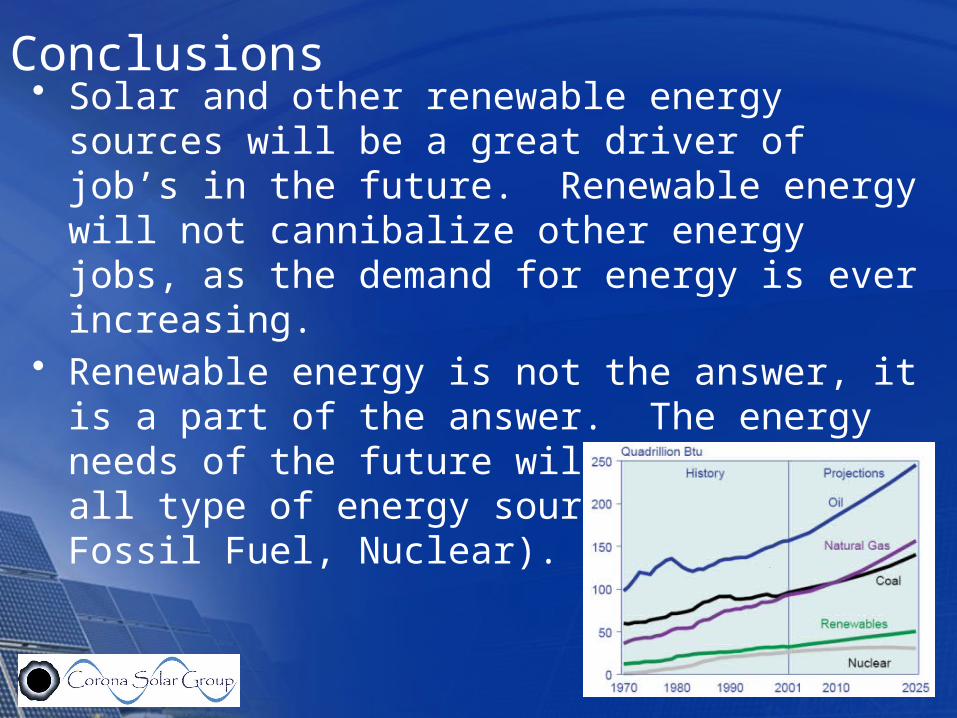
• Solar and other renewable energy sources will be a great driver of job’s in the future. Renewable energy will not cannibalize other energy jobs, as the demand for energy is ever increasing.
• Renewable energy is not the answer, it is a part of the answer. The energy needs of the future will be driven by all type of energy sources (Renewable, Fossil Fuel, Nuclear).
Conclusions
Thank You!
Corona Solar Group, LLCOffice: 770-74-7559Cell: 678-234-8302


![The Canton advocate (Canton, D.T. [S.D.]). (Canton, D.T](https://img.pdfslide.net/doc/110x75/627da8d50d94944094392a89/the-canton-advocate-canton-dt-sd-canton-dt-.jpg)