Embed Size (px)
Citation preview
N A S P I M E E T I N G , M A R C H 2 0 1 4
Use of PMUs for on-line power system security monitoring at ISO-New England
Slava Maslennikov, Eugene Litvinov (ISO-NE) Marianna Vaiman (V&R Energy)

2
New England’s Electric Power Grid at a Glance
• 6.5 million households and businesses; population 14 million
• 350+ generators
• 8,000+ miles of high-voltage transmission lines (115 kV and above)
• 13 interconnections to electricity systems in New York and Canada
• 31,750+ megawatts (MW) of generating capacity and approximately 1,850 MW of demand resources
• 28,130 MW all-time peak demand, set on August 2, 2006
3
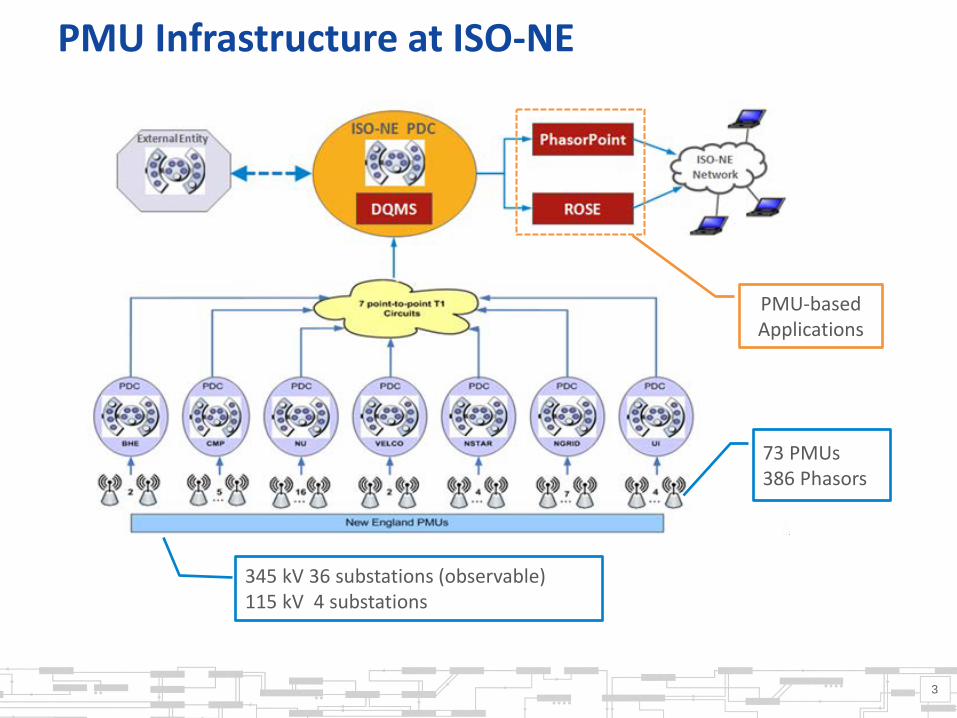
PMU Infrastructure at ISO-NE
PMU-based Applications
345 kV 36 substations (observable) 115 kV 4 substations
73 PMUs 386 Phasors
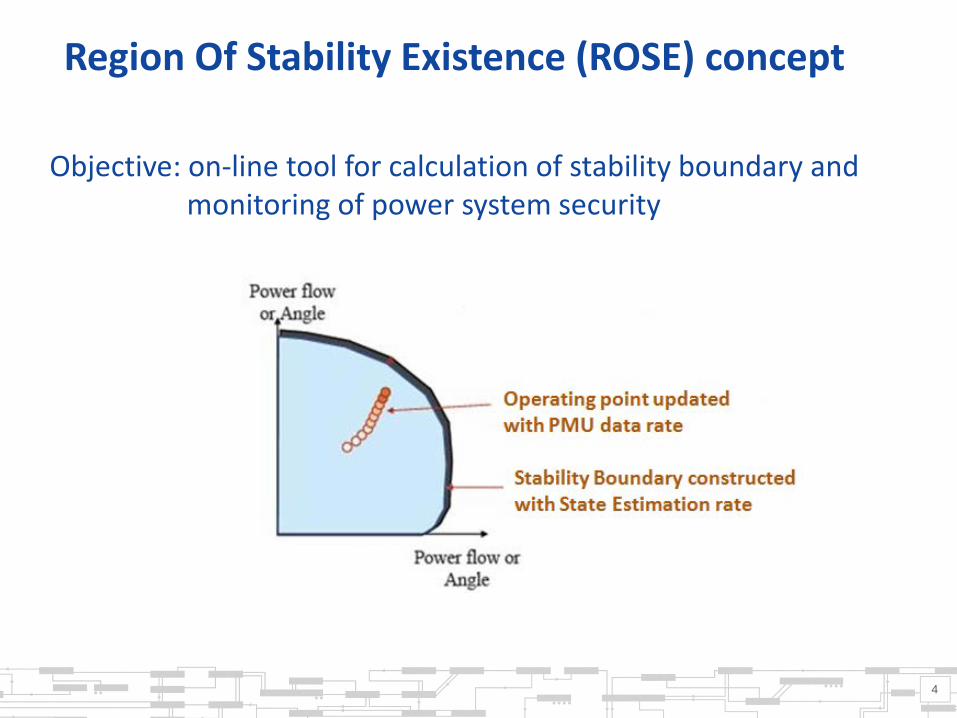
Region Of Stability Existence (ROSE) concept
4
Objective: on-line tool for calculation of stability boundary and monitoring of power system security
Region Of Stability Existence (ROSE)
5
• State Estimation (model) is used to calculate ROSE boundary per N-k security criteria by observing the following criterion Thermal overload Voltage violation Voltage stability
• PMU (measurements) are used to display current operating point and monitor Operational Margin.
• Vendor: V&R Energy System Research.
Application is currently used for engineering analysis and ISO-NE has developed a synchrophasor technology roadmap to migrate the technology into control room
ROSE features
6
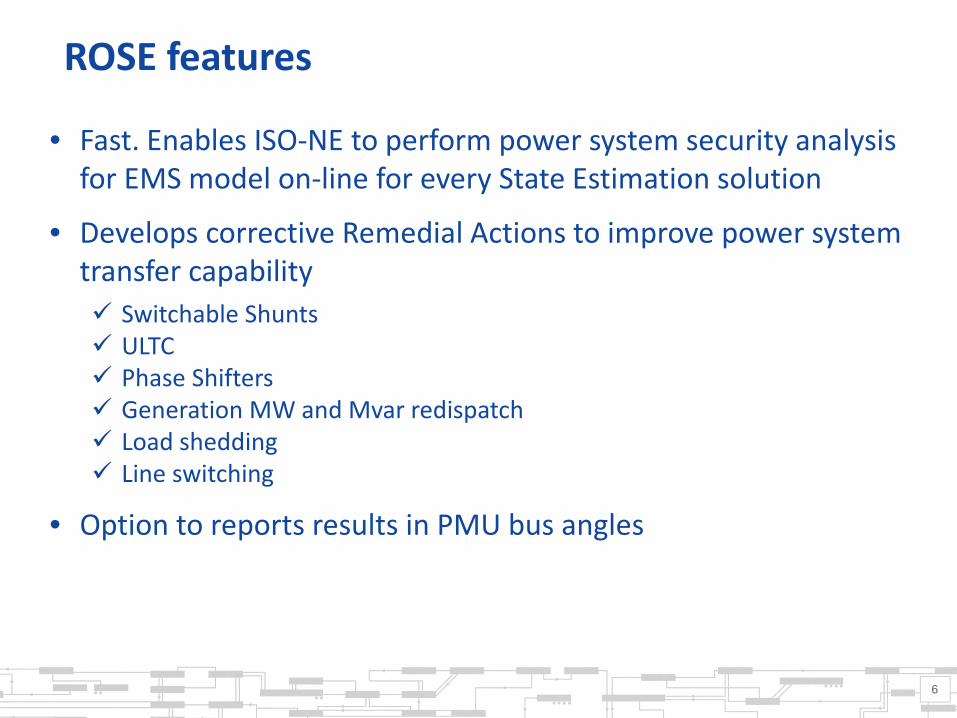
• Fast. Enables ISO-NE to perform power system security analysis for EMS model on-line for every State Estimation solution
• Develops corrective Remedial Actions to improve power system transfer capability Switchable Shunts ULTC Phase Shifters Generation MW and Mvar redispatch Load shedding Line switching
• Option to reports results in PMU bus angles
ROSE features, cont
7
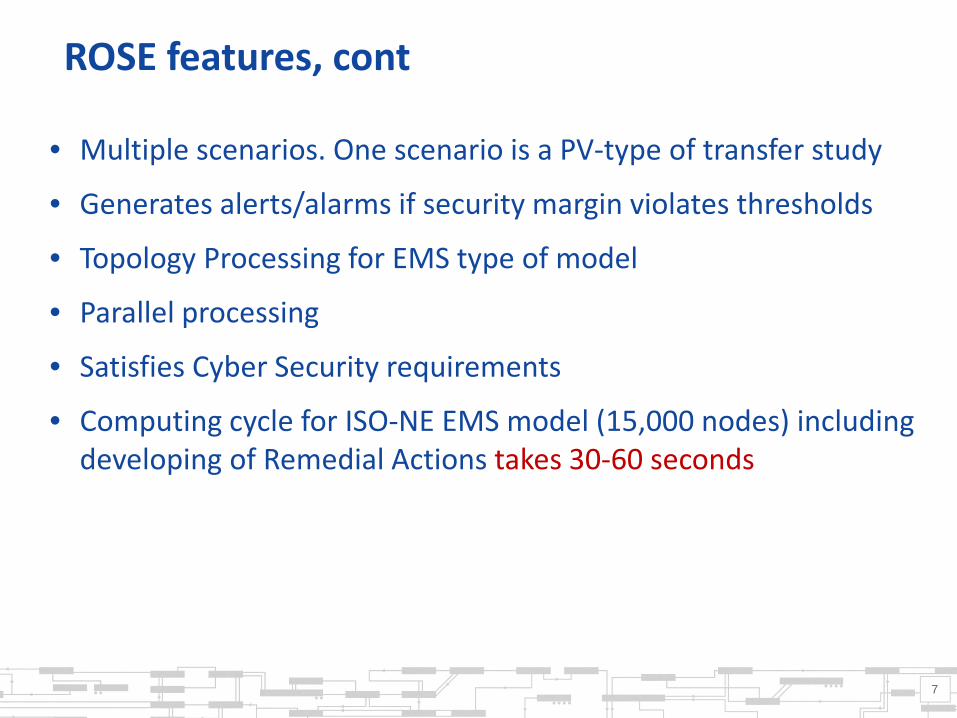
• Multiple scenarios. One scenario is a PV-type of transfer study
• Generates alerts/alarms if security margin violates thresholds
• Topology Processing for EMS type of model
• Parallel processing
• Satisfies Cyber Security requirements
• Computing cycle for ISO-NE EMS model (15,000 nodes) including developing of Remedial Actions takes 30-60 seconds
ROSE Integration: Data Flow Diagram*
8
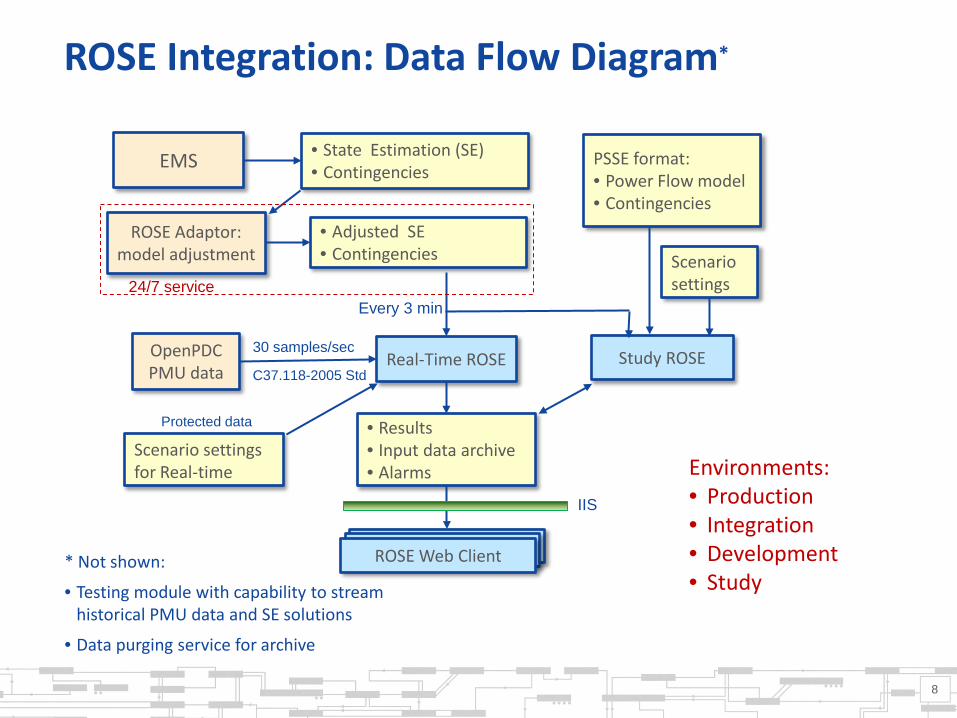
Real-Time ROSE Study ROSE
EMS
OpenPDC PMU data
• State Estimation (SE) • Contingencies
ROSE Adaptor: model adjustment
• Adjusted SE • Contingencies
Scenario settings
PSSE format: • Power Flow model • Contingencies
• Results • Input data archive • Alarms
Scenario settings for Real-time
ROSE Web Client
24/7 service
30 samples/sec
C37.118-2005 Std
Every 3 min
Protected data
IIS
* Not shown:
• Testing module with capability to stream historical PMU data and SE solutions
• Data purging service for archive
Environments: • Production • Integration • Development • Study
User interface to view results
9
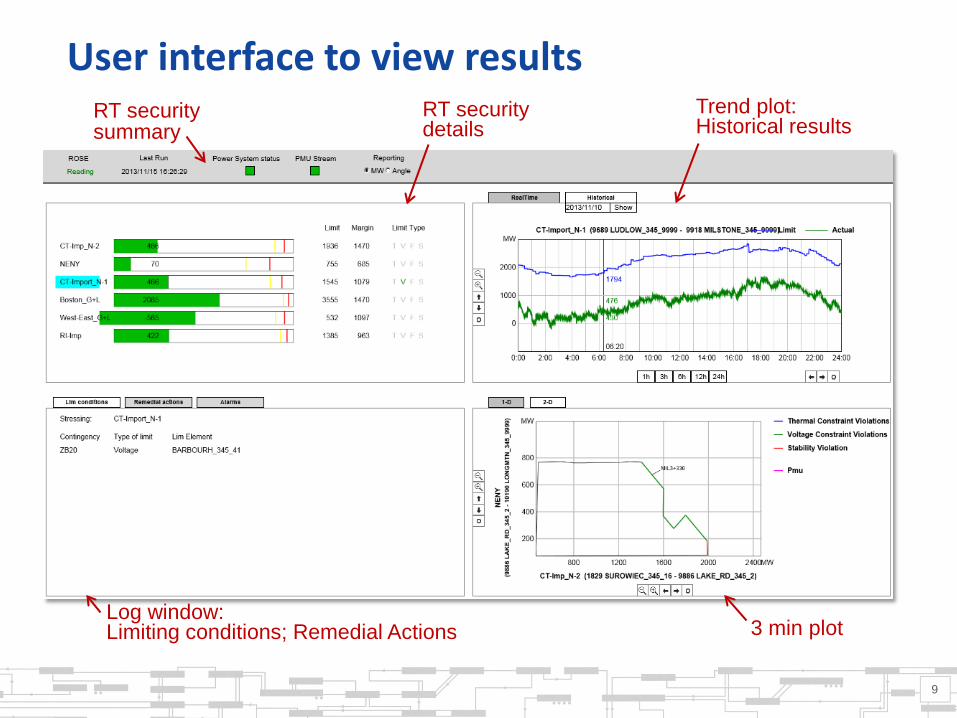
RT security details
RT security summary
Trend plot: Historical results
Log window: Limiting conditions; Remedial Actions 3 min plot
Current use of PMU in ROSE
10
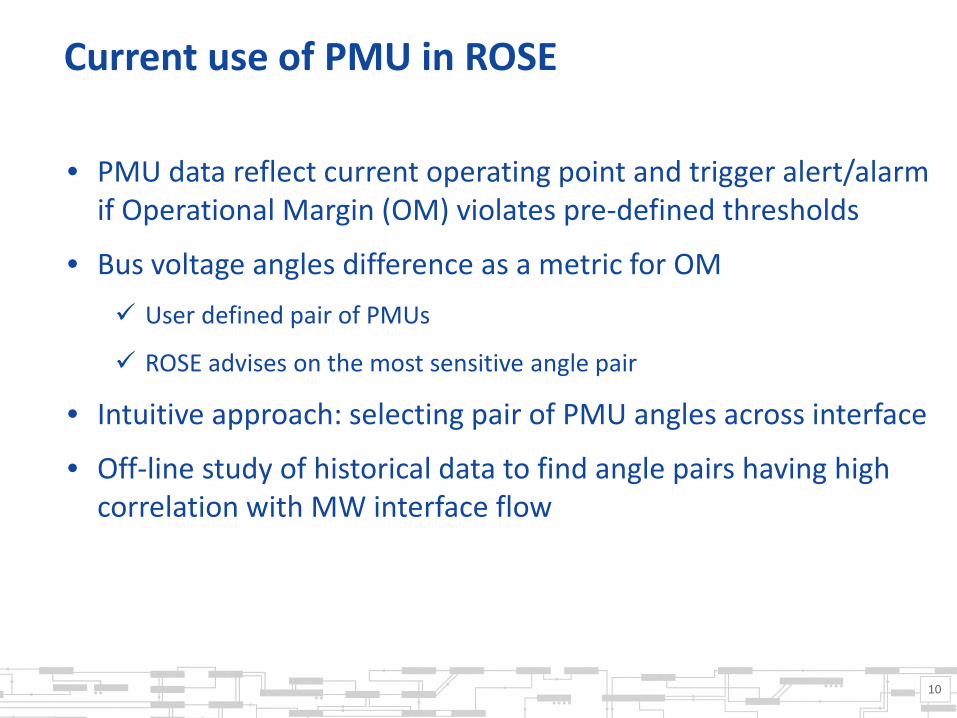
• PMU data reflect current operating point and trigger alert/alarm if Operational Margin (OM) violates pre-defined thresholds
• Bus voltage angles difference as a metric for OM User defined pair of PMUs
ROSE advises on the most sensitive angle pair
• Intuitive approach: selecting pair of PMU angles across interface
• Off-line study of historical data to find angle pairs having high correlation with MW interface flow
Current use of PMU, cont
11
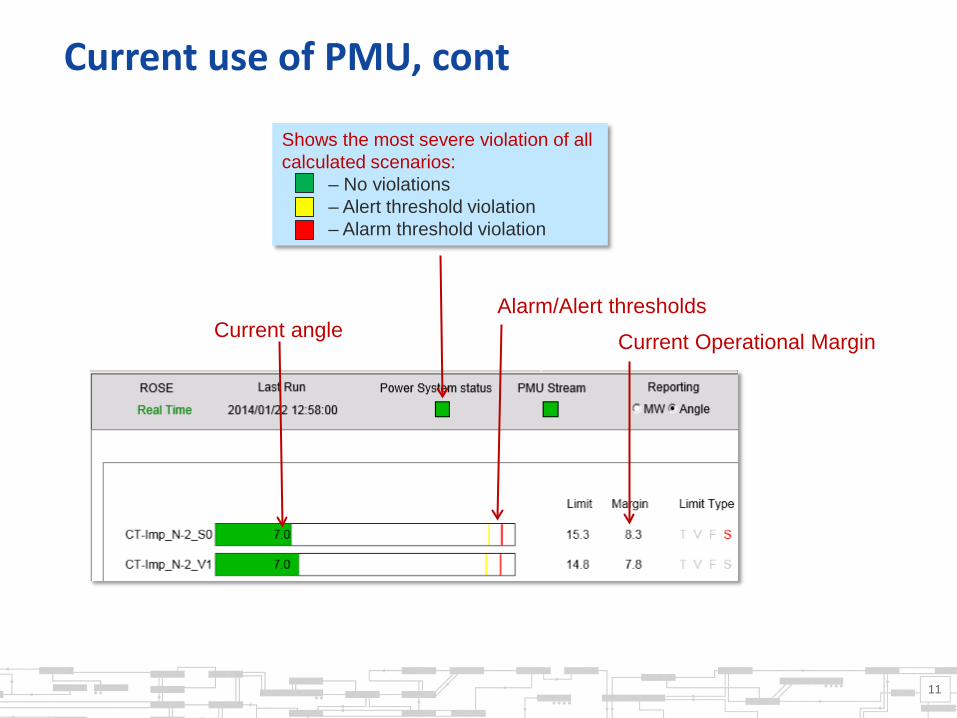
Shows the most severe violation of all calculated scenarios: – No violations – Alert threshold violation – Alarm threshold violation
Current angle Alarm/Alert thresholds
Current Operational Margin
PMU angles to display Limits and current state
12
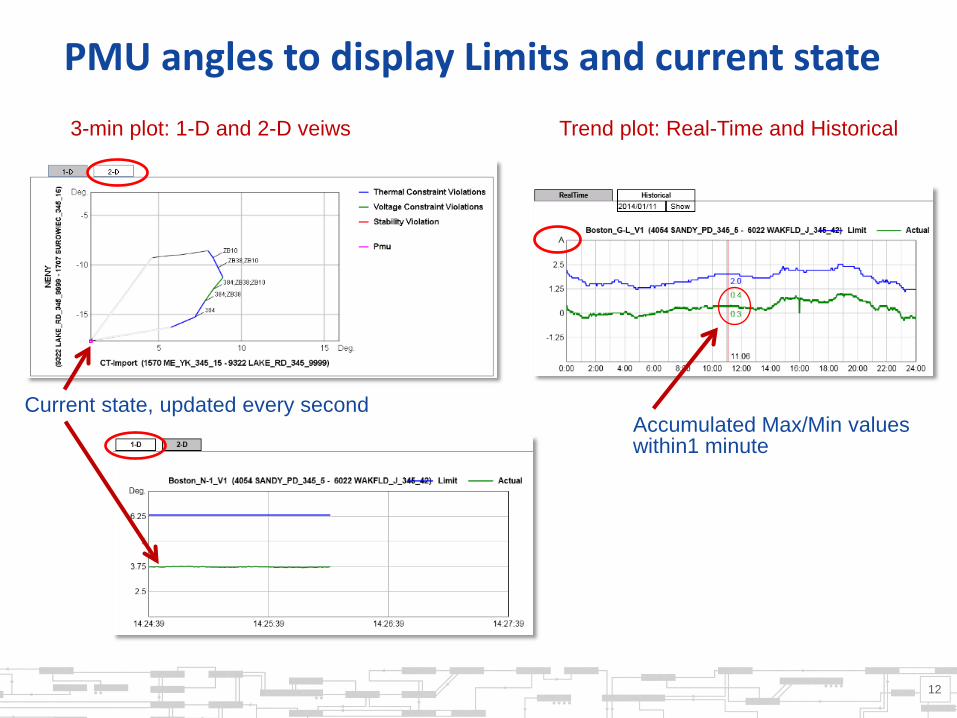
3-min plot: 1-D and 2-D veiws Trend plot: Real-Time and Historical
Accumulated Max/Min values within1 minute
Current state, updated every second
Real-Time event
13
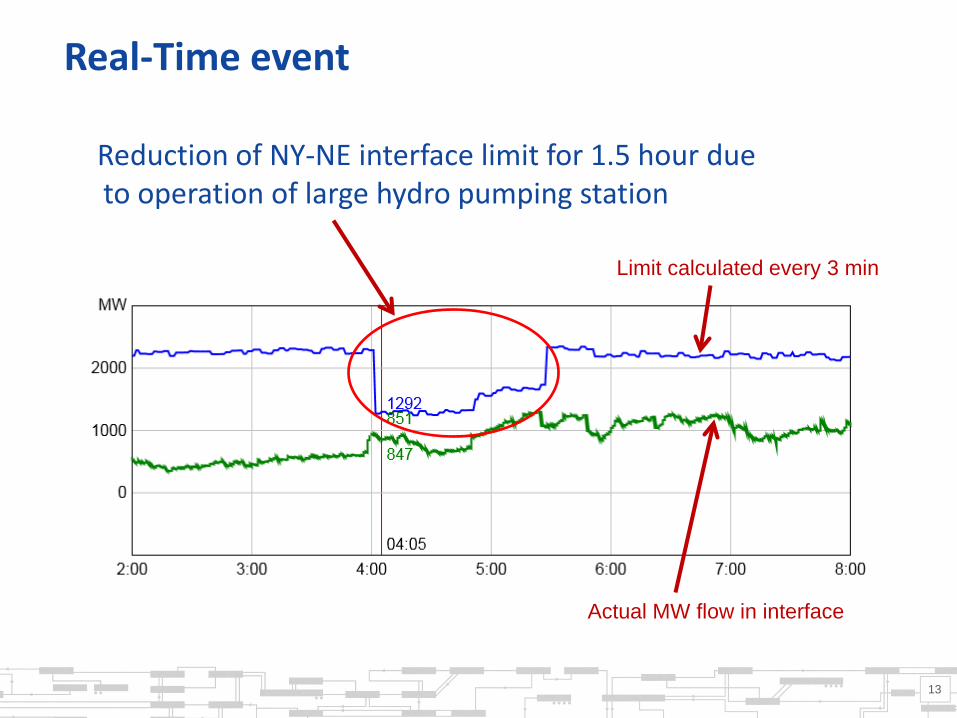
Reduction of NY-NE interface limit for 1.5 hour due to operation of large hydro pumping station
Limit calculated every 3 min
Actual MW flow in interface
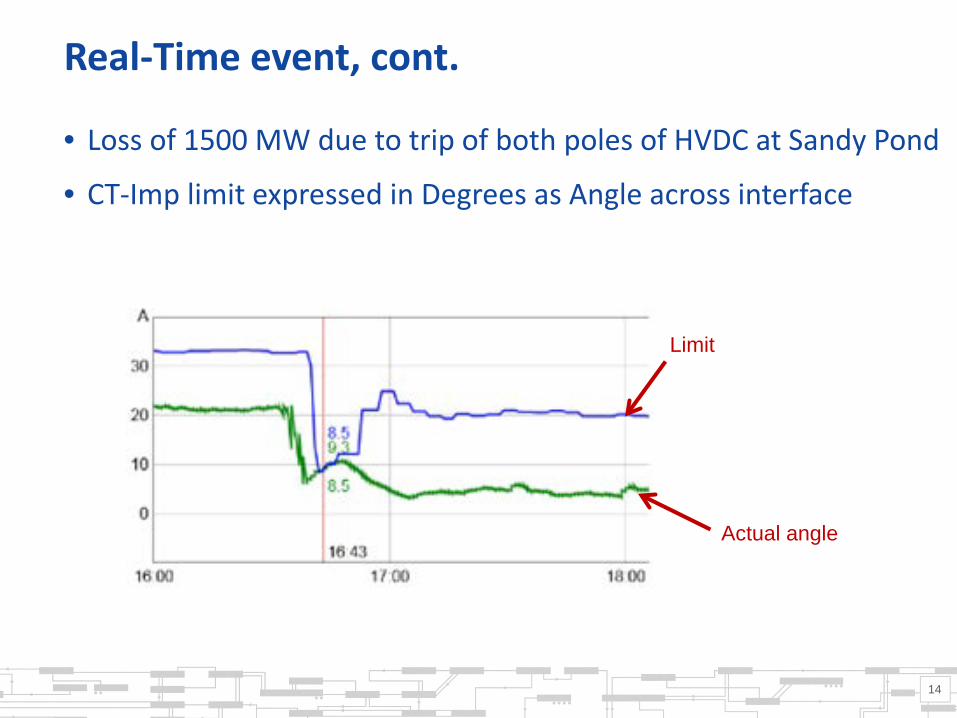
Real-Time event, cont.
14
• Loss of 1500 MW due to trip of both poles of HVDC at Sandy Pond
• CT-Imp limit expressed in Degrees as Angle across interface
Limit
Actual angle
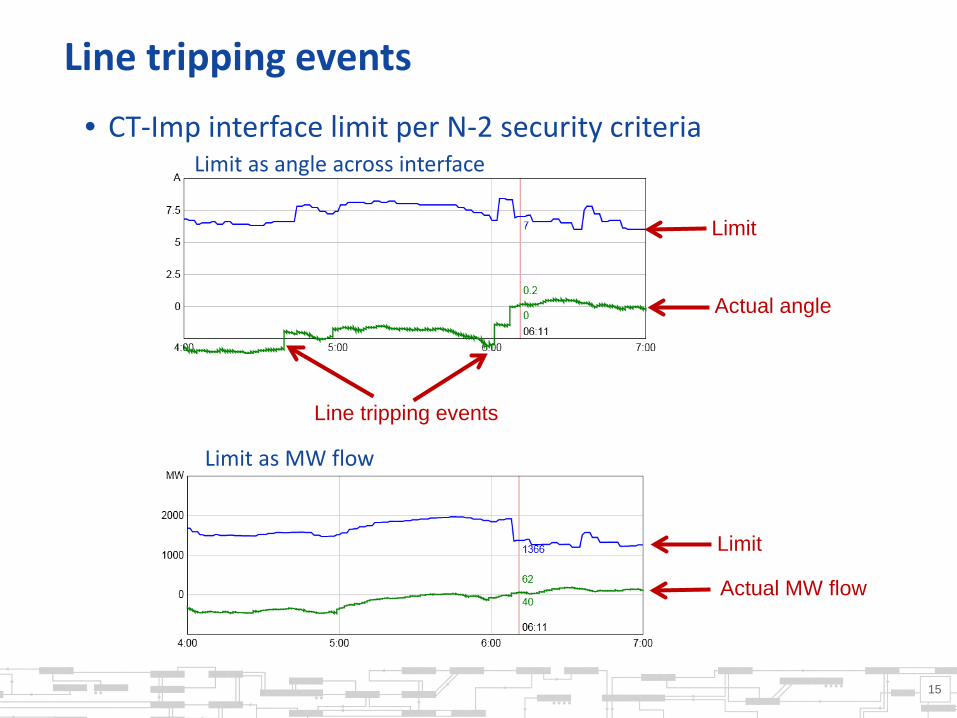
Line tripping events
15
• CT-Imp interface limit per N-2 security criteria
Line tripping events
Limit as MW flow
Limit as angle across interface
Limit
Actual angle
Limit
Actual MW flow
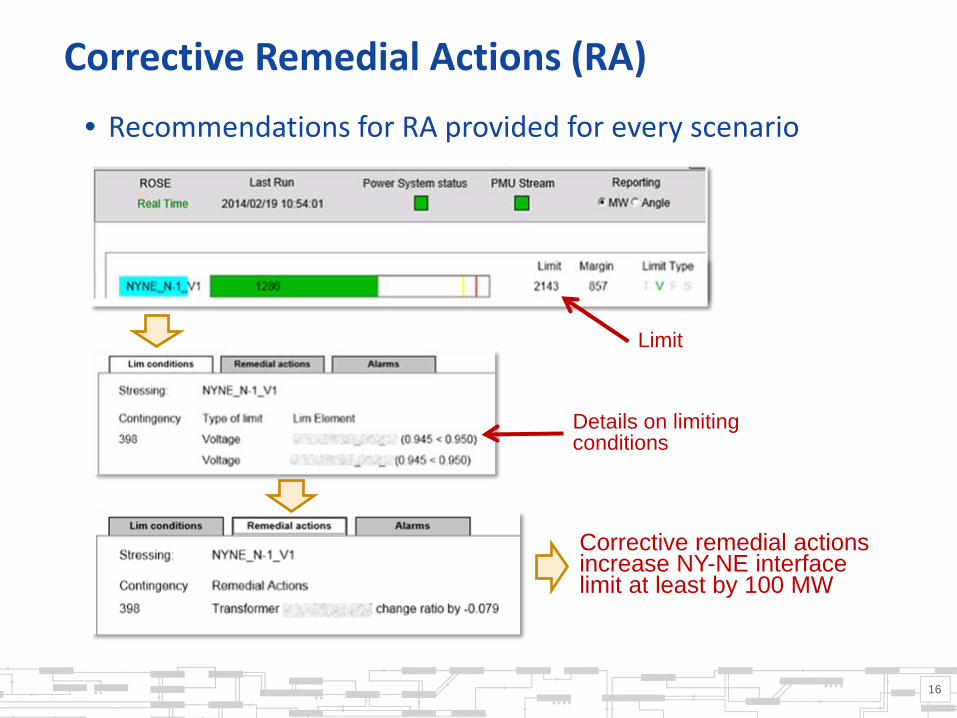
Corrective Remedial Actions (RA)
16
• Recommendations for RA provided for every scenario
Limit
Corrective remedial actions increase NY-NE interface limit at least by 100 MW
Details on limiting conditions
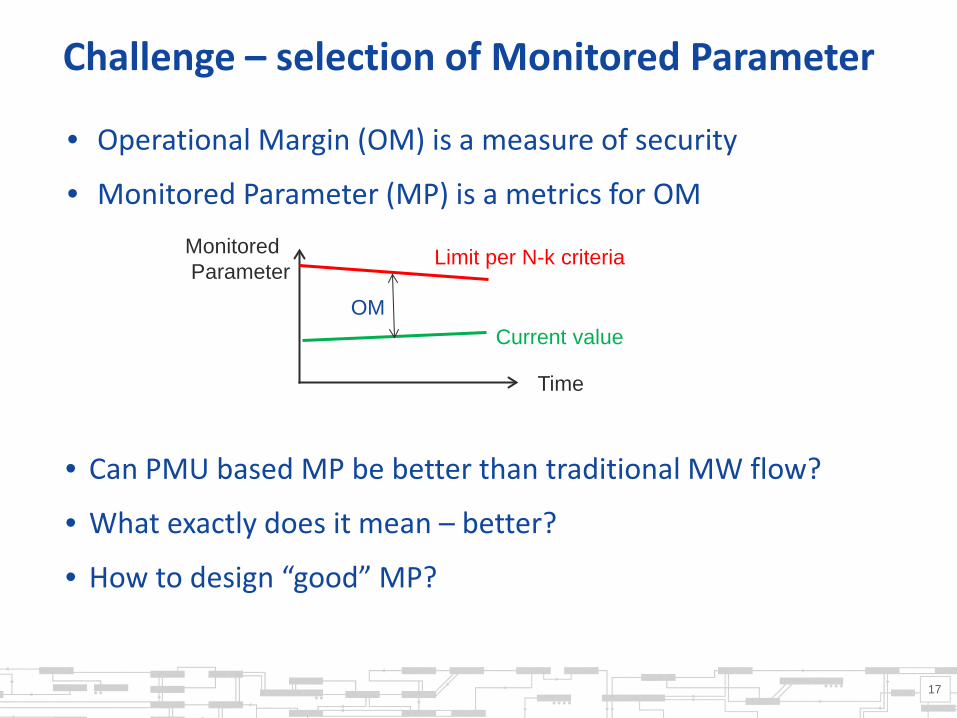
Challenge – selection of Monitored Parameter
17
• Operational Margin (OM) is a measure of security
• Monitored Parameter (MP) is a metrics for OM
Time
Monitored Parameter
OM
Limit per N-k criteria
Current value
• Can PMU based MP be better than traditional MW flow?
• What exactly does it mean – better?
• How to design “good” MP?
Requirements for Monitored Parameter
18
• Convenient for human perception
The same definition of MP over time Traceable; no sudden jumps of MP value at small variation
of operating conditions Minimal OM threshold should be consistent over time
• Should not provide misleading OM value after sudden change of operating state before new limit is calculated
For use by Operators in Control Room
Difficult to satisfy simultaneously all these requirements
0.000.200.400.600.801.00
July
Aug
Sept Oct
Nov
Dec
Jan
Corr
elat
ion
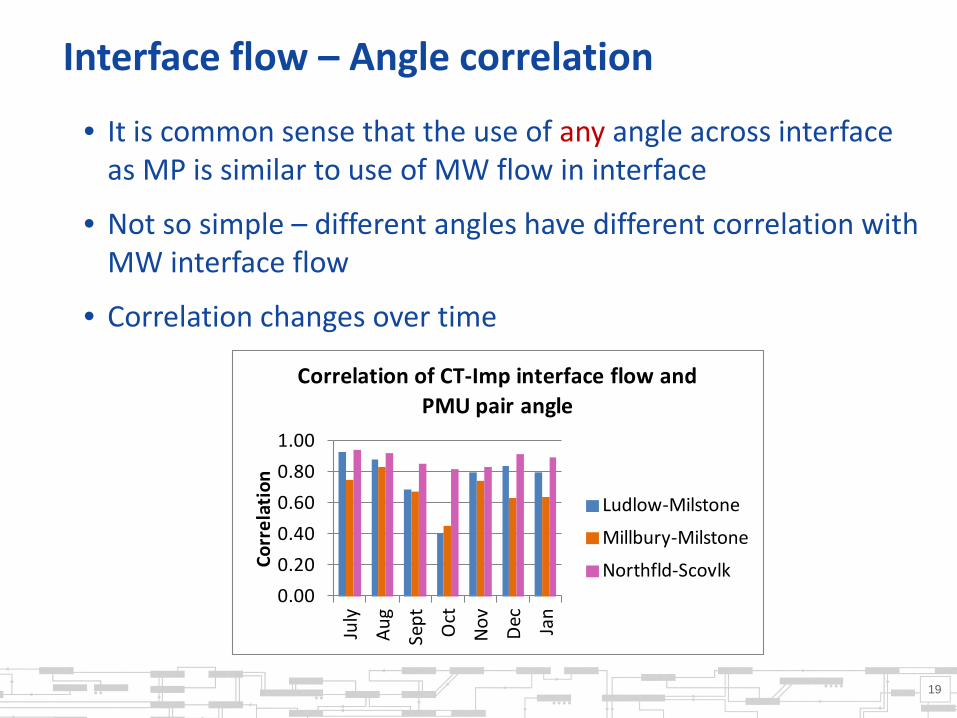
Correlation of CT-Imp interface flow and PMU pair angle
Ludlow-Milstone
Millbury-Milstone
Northfld-Scovlk
Interface flow – Angle correlation
19
• It is common sense that the use of any angle across interface as MP is similar to use of MW flow in interface
• Not so simple – different angles have different correlation with MW interface flow
• Correlation changes over time
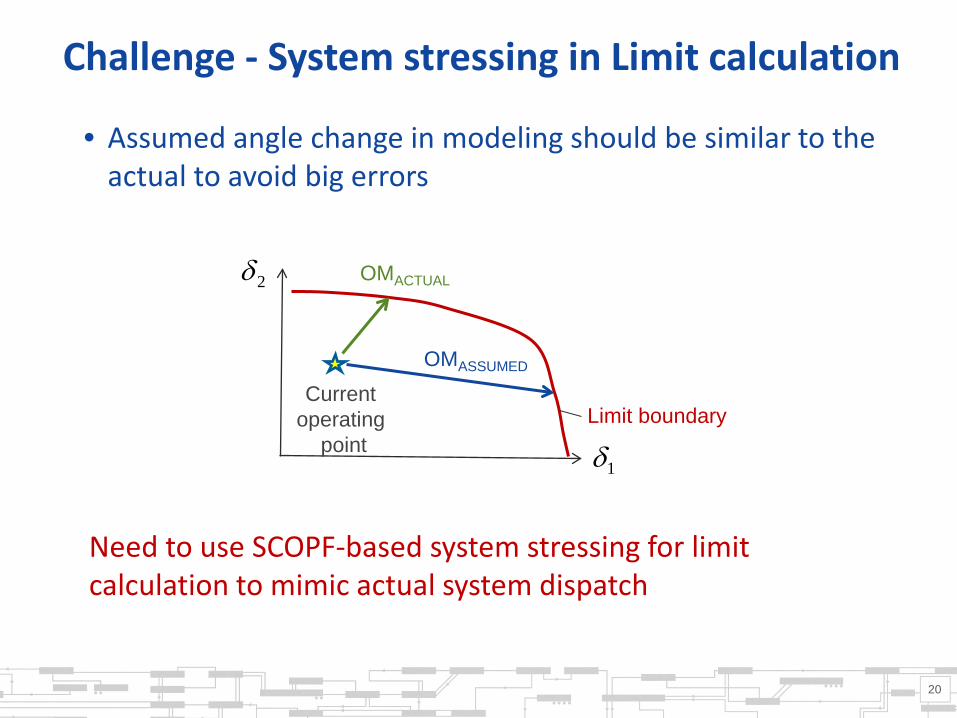
Challenge - System stressing in Limit calculation
20
• Assumed angle change in modeling should be similar to the actual to avoid big errors
Limit boundary
OMASSUMED
1δ
2δ
Current operating
point
OMACTUAL
Need to use SCOPF-based system stressing for limit calculation to mimic actual system dispatch
Conclusions
21
• ROSE application has been successfully deployed at ISO-NE and demonstrated the efficiency for on-line power system security estimation and monitoring
• Use of PMU in ROSE enables fast and accurate tracking of operating point and security margin
• Application is used by engineers today and ISO-NE has developed synchrophasor technology roadmap to migrate the technology into control room

22