Embed Size (px)
Citation preview

Use of Research, Data, and
Evidence in Education Reform
Anna J. EgalitePrepared for the EdChoice Academy
Indianapolis, IN
9:00 – 11:30 AM, October 22, 2019

Roadmap
• Who’s in the room? (10 mins)
• Basics of Research Design (30 mins)
• Small Group Activity (45 mins)
• Group Presentations (40 mins)
• Wrap up (15 mins)
Rapid Fire: Who’s in the Room?
To help us get to know each other a bit
better, please share your
• Name
• Hometown
• Current professional affiliation

Basics of Research Design:How to Spot the Red Flags in a Study
1. There must be two groups: a treatment group and a
comparison group
2. Compare these groups using common, standardized
measures
3. The sampling strategy must be defensible (i.e., How
people are recruited to be in the study)
4. Descriptions of the findings should respect nuances of
the study

Basics of Research Design
1. There Must Be Two Groups

Oversimplified Example: Does Eating
Broccoli Make Children Taller ?
BEFORE 4 YEARS LATER

Education Example: Does Attending a
School of Choice Increase Test Scores?
BEFORE
Choice school
District school
AFTER

Designing a School Choice Evaluation
Examining this hypothetical treatment group alone gives the
impression that student performance increased by 50%

Designing a School Choice Evaluation
Here’s the problem: In the absence of this hypothetical
intervention, student performance would have increased by 30%

Designing a School Choice Evaluation
BEFORE AFTER
Choice school
District school
“Treatment group”
“Comparison group”
We have to define a comparison group against
which we can judge progress

Randomized Control Trials:
The “Gold Standard”
*Josh Goodman’s Twins
Aside from cloning
(the technology for
which unfortunately
still eludes us) or only
studying identical
twins, the next best
way to choose a
comparison group is to
rely on a lottery

Randomized Control Trials:
The “Gold Standard”
Those who lost the lottery form the ideal comparison group because they
are similar to voucher winners in all kinds of observable and un-observable
ways. The researcher can be sure that any difference in outcomes was
caused by the program.

What if a “Gold Standard”
Evaluation isn’t Possible?
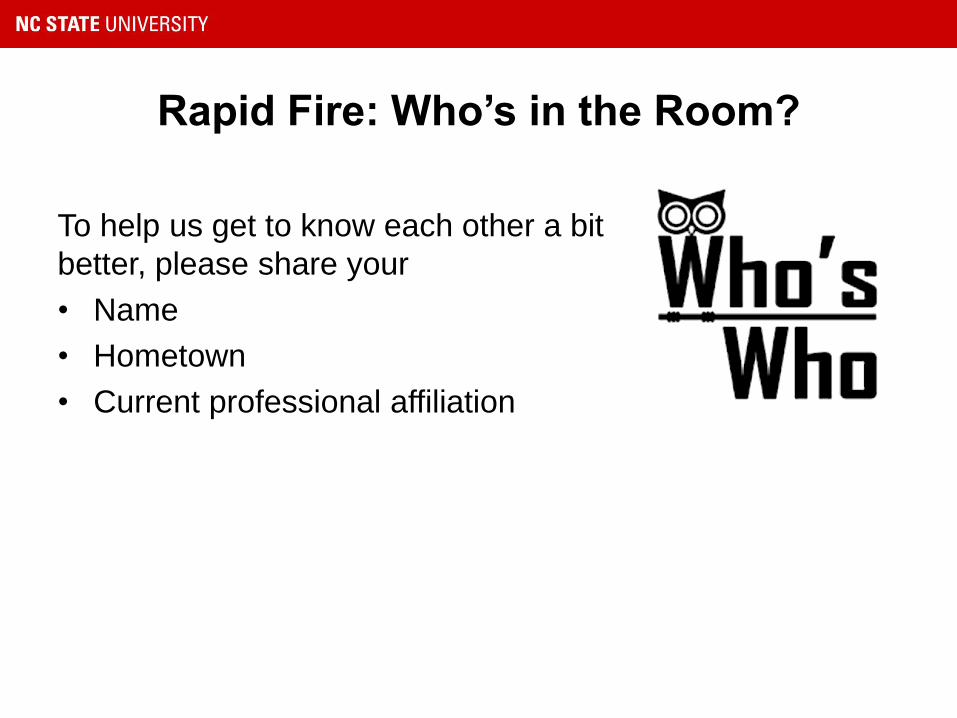
Research Methods that Support Causal
Inference
• Experimental Design
o Randomized control trial (RCT)
• Quasi Experimental Designs:
o Regression discontinuity (RD)
o Instrumental variables estimation (IVE)
• Observational designs:
o Fixed effects
o Propensity score matching

Research Methods that Support Causal
Inference
• Experimental Design
o Randomized control trial (RCT)
• Quasi Experimental Designs:
o Regression discontinuity (RD)
o Instrumental variables estimation (IVE)
• Observational designs:
o Fixed effects
o Propensity score matching
Strongest
internal
validity
Often,
strongest
external
validity

Internal versus External Validity
Refers to the extent to
which the results can be
generalized across
population, time, and
settings
Refers to the integrity of
your research design. Can
you draw a causal link
between X and Y?

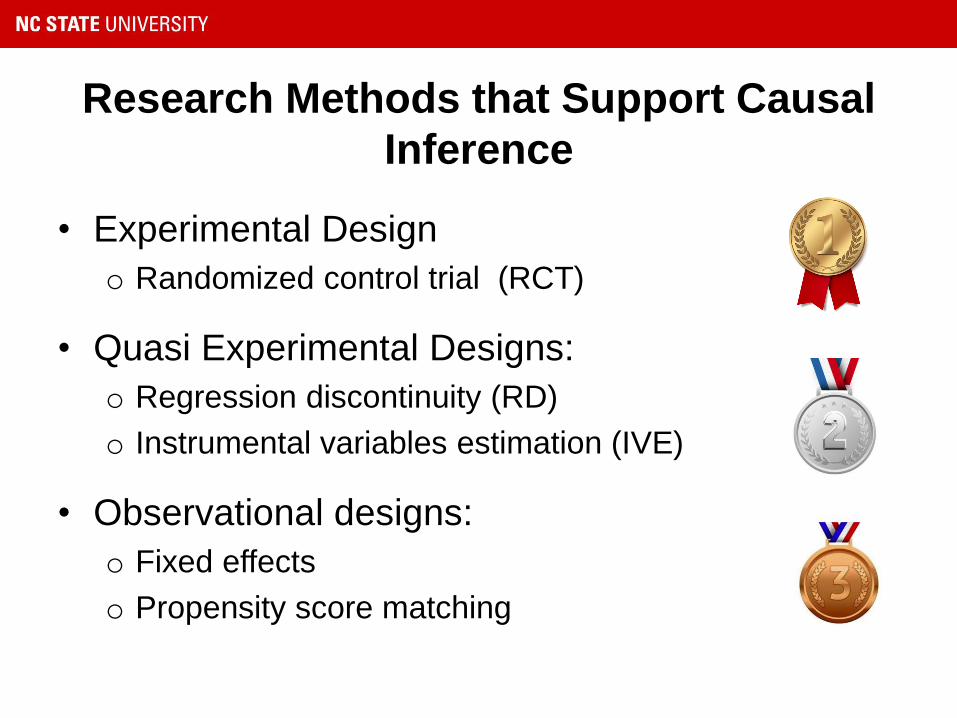
Regression Discontinuity Design
Regression
Discontinuity
Design
A quasi-experimental
design that elicits
the causal effects of an
intervention by
assigning a cutoff
above or below which
an intervention is
assigned

Regression
Discontinuity
Design
The direction and
magnitude of the jump is
a direct measure of the
causal effect of the
treatment for candidates
near the cut-point.

Unfortunately, in data-analysis as in life, you never get something for nothing …
Your estimate of is unbiased in both cases, but RD designs have less power!
“For small effect sizes, the RD design requires 2.73 times as many participants as in a balanced randomized experiment, to reach 0.80 power” (Capelleri et al., 1994; reported in Shadish, Cook & Campbell, 2002, p. 242).
There’s No Free Lunch

Instrumental Variables
• Definition: An analytic strategy for teasing out whatever
part of the observed variability in a treatment variable is
unbiased and using only that part to obtain an unbiased
causal estimate of treatment impact
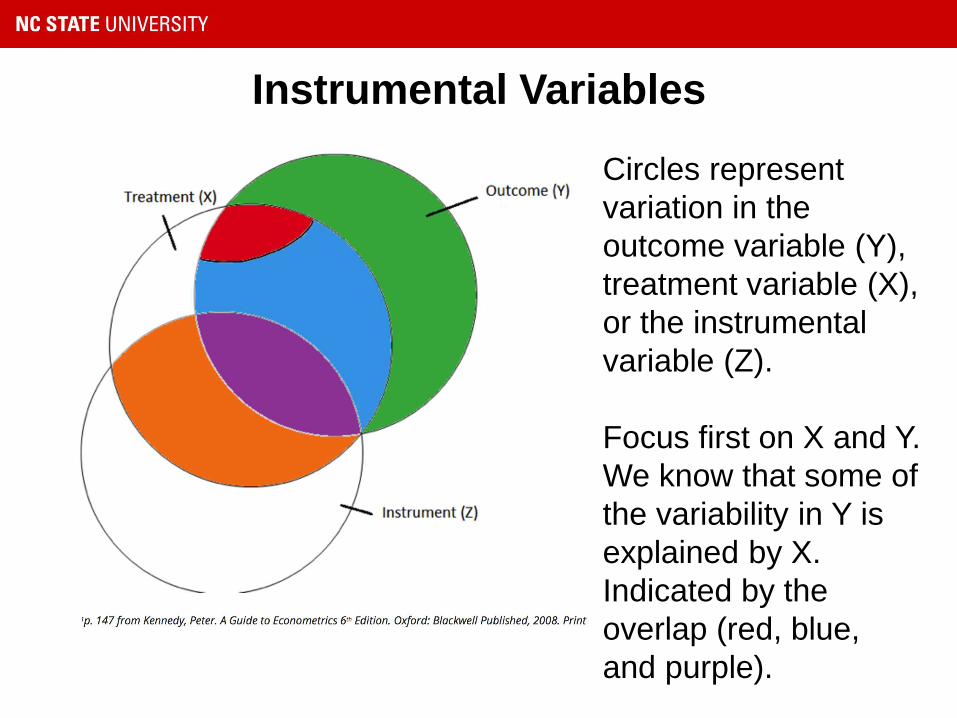
Instrumental Variables
Circles represent
variation in the
outcome variable (Y),
treatment variable (X),
or the instrumental
variable (Z).
Focus first on X and Y.
We know that some of
the variability in Y is
explained by X.
Indicated by the
overlap (red, blue,
and purple).

Instrumental Variables
The remaining green
section of Y
represents
the error obtained with
a statistical model.
However, if there
is selection bias, some
of the green spills
over, creating the red
section. Our results
are now biased.

Instrumental Variables
Enter Z!
First, obtain
the predicted values of
X (orange and purple).
Then use ONLY this info
to get the treatment
effect (purple).
Estimates are unbiased
☺

IV
Example
Example:
Currie & Moretti (2003) use the availability of colleges in the woman’s county in her 17th year as an instrument for subsequent educational attainment when investigating the effect of a mother’s educational attainment on the birth outcomes (birth weight, gestational age) of her child.

BEFORE AFTER
How “Matching” Works
In large datasets, we can identify public school students to serve as the
counterfactual to a charter school student by matching on gender, race, ELL, FRL,
sped status, grade level, and similar score prior test score

Why So Critical of Observational Designs?

Basics of Research Design
2. Compare These Groups Using
Common, Standardized Measures

Common, Standardized Measures
• What I mean by “common”
• Imagine if students in the treatment and control groups took
different tests. You would have no idea if the differences in their
scores reflect differences in how the test is constructed, what it
measures, how it is graded, how the scores are scaled (as
opposed to differences in what the two groups of students have
actually learned!)
• What I mean by “standardized”
• Researchers have the option to report impacts in terms of
percentile differences, scale scores, raw scores, stanines, grade
equivalency scores, etc. It helps us compare across studies if we
all report impacts in standard deviation units

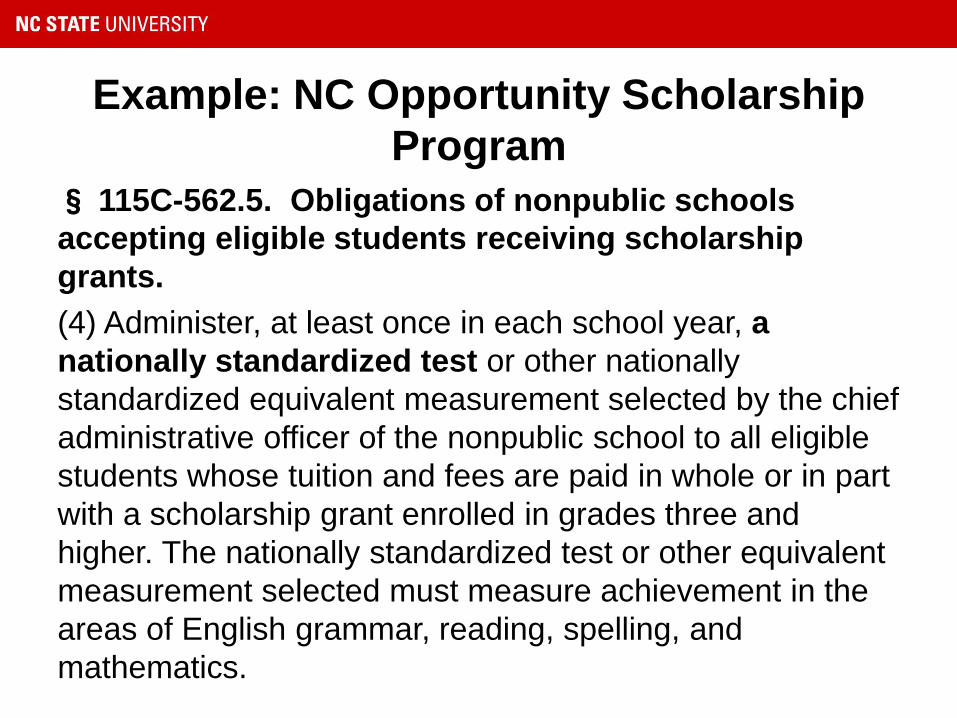
Example: NC Opportunity Scholarship
Program
§ 115C-562.5. Obligations of nonpublic schools
accepting eligible students receiving scholarship
grants.
(4) Administer, at least once in each school year, a
nationally standardized test or other nationally
standardized equivalent measurement selected by the chief
administrative officer of the nonpublic school to all eligible
students whose tuition and fees are paid in whole or in part
with a scholarship grant enrolled in grades three and
higher. The nationally standardized test or other equivalent
measurement selected must measure achievement in the
areas of English grammar, reading, spelling, and
mathematics.
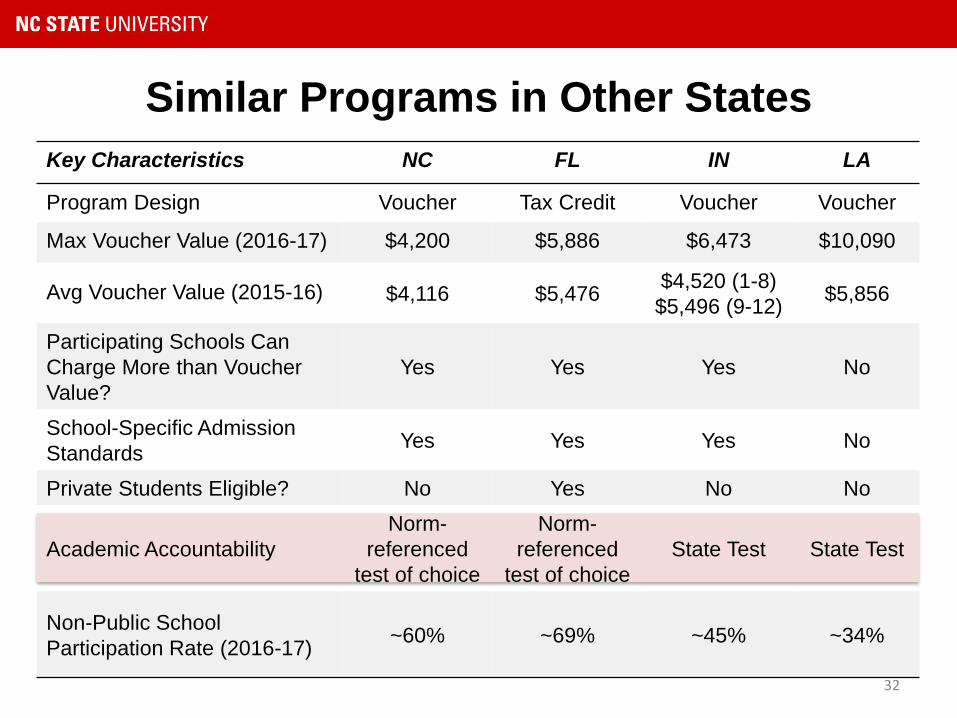
Key Characteristics NC FL IN LA
Program Design Voucher Tax Credit Voucher Voucher
Max Voucher Value (2016-17) $4,200 $5,886 $6,473 $10,090
Avg Voucher Value (2015-16) $4,116 $5,476$4,520 (1-8)
$5,496 (9-12)$5,856
Participating Schools Can
Charge More than Voucher
Value?
Yes Yes Yes No
School-Specific Admission
StandardsYes Yes Yes No
Private Students Eligible? No Yes No No
Academic Accountability
Norm-
referenced
test of choice
Norm-
referenced
test of choice
State Test State Test
Non-Public School
Participation Rate (2016-17)~60% ~69% ~45% ~34%
32
Similar Programs in Other States

Primary Barrier to an Academic
Impact Analysis
No common metric by which to compare
performance
• Private schools can administer any nationally normed
standardized test of their choosing*
• Comparable public school students take the criterion-
referenced state test
*Examples: BASI, BJU Press Assessments, CAT, CTP, ITBS, OLSAT, Sat-9, TN, WJ
33
#1

Basics of Research Design
3. The Sampling Strategy must be
Defensible

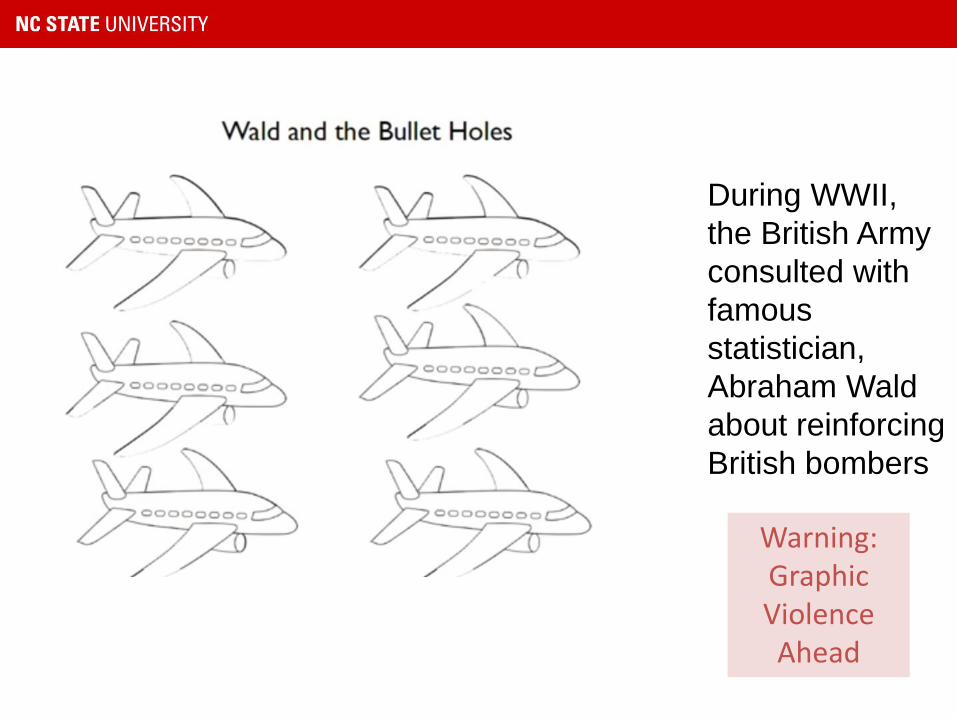
Warning: Graphic Violence Ahead
During WWII,
the British Army
consulted with
famous
statistician,
Abraham Wald
about reinforcing
British bombers

The Planes That Returned From Battle
37

Wald and The Bullet Holes
• Armor is heavy and expensive. Can’t put it everywhere.
• So they asked Wald: Where should we prioritize?
Judging by this sample of damaged planes, what parts of
the plane need the most protection?
What do you think?
38

39

40
A whole unobserved army of Rudolph the red-nosed aircraft
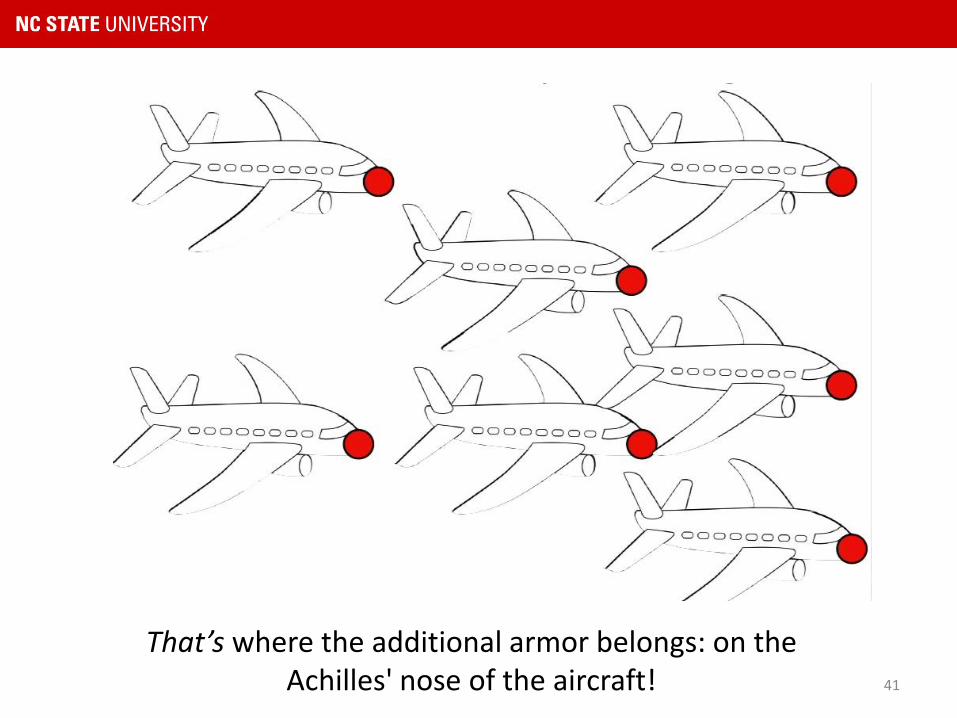
41
That’s where the additional armor belongs: on the Achilles' nose of the aircraft!
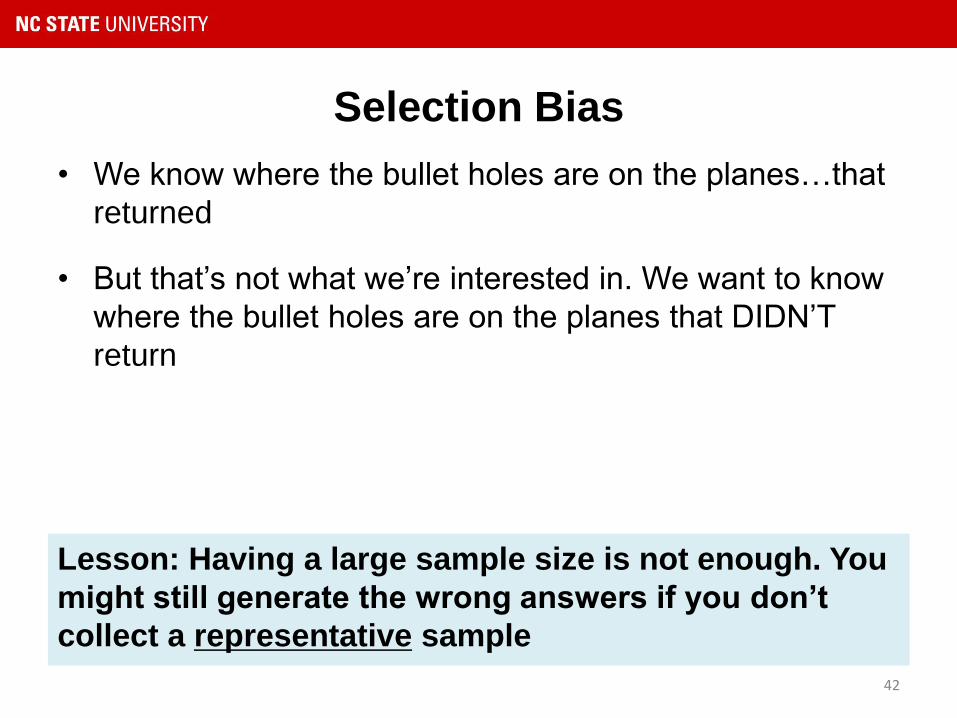
Selection Bias
• We know where the bullet holes are on the planes…that
returned
• But that’s not what we’re interested in. We want to know
where the bullet holes are on the planes that DIDN’T
return
42
Lesson: Having a large sample size is not enough. You
might still generate the wrong answers if you don’t
collect a representative sample

Harry S Truman,
Democrat
President, 1945-53
43
Example of a Violation of this Principle

The Chicago Tribune
November 3, 194844
For the 1948 election
between Thomas
Dewey and Harry
Truman, Gallup
conducted a poll with
a sample size of
about 3,250.
Based on the results
of this poll, Gallup
incorrectly predicted
a victory for Dewey,
the Republican
candidate.

The Chicago Tribune
November 3, 194845
The reason? A non-
random sampling
strategy:
Each interviewer was
free to pick his subjects
any way that he
pleased
This freedom of choice
created selection bias
in favor of Dewey. (At
the time, evidently,
republicans were
slightly easier to find
and interview than
democrats)

Basics of Research Design
4. Descriptions of the Findings Should
Respect Nuances of the Study

http://www.cnn.com/2015/08/12/health/homework-elementary-school-study/
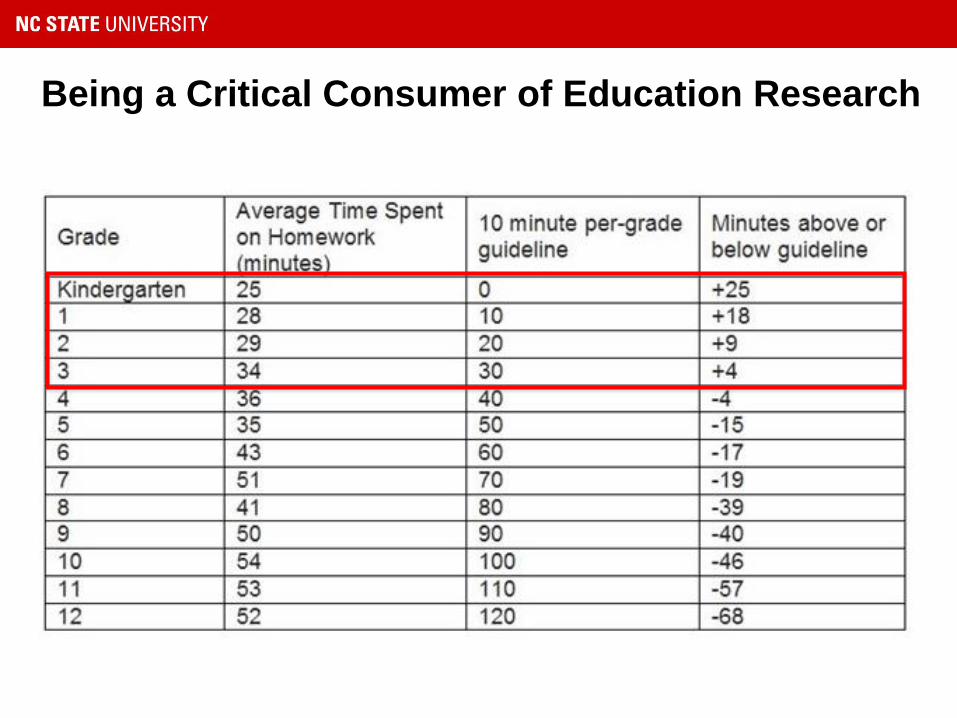
Example

Being a Critical Consumer of Education Research
• Sampling Design:
o Data collected over four months in Providence,
Rhode Island
o About 1,200 parents completed a survey about their
children’s homework while waiting in 27 pediatricians’
offices o Only surveyed parents of sick children
o Unknown how many declined to participate
• Pay Attention to Characteristics of Participants:
o One-third completed survey in Spanish
o Family size larger than average

Being a Critical Consumer of Education Research

Being a Critical Consumer of Education Research

Being a Critical Consumer of Education Research
Being a Critical Consumer of Education Research

Being a Critical Consumer of Education Research

Findings for the higher
grades are actually
consistent with data
from nationally
representative samples
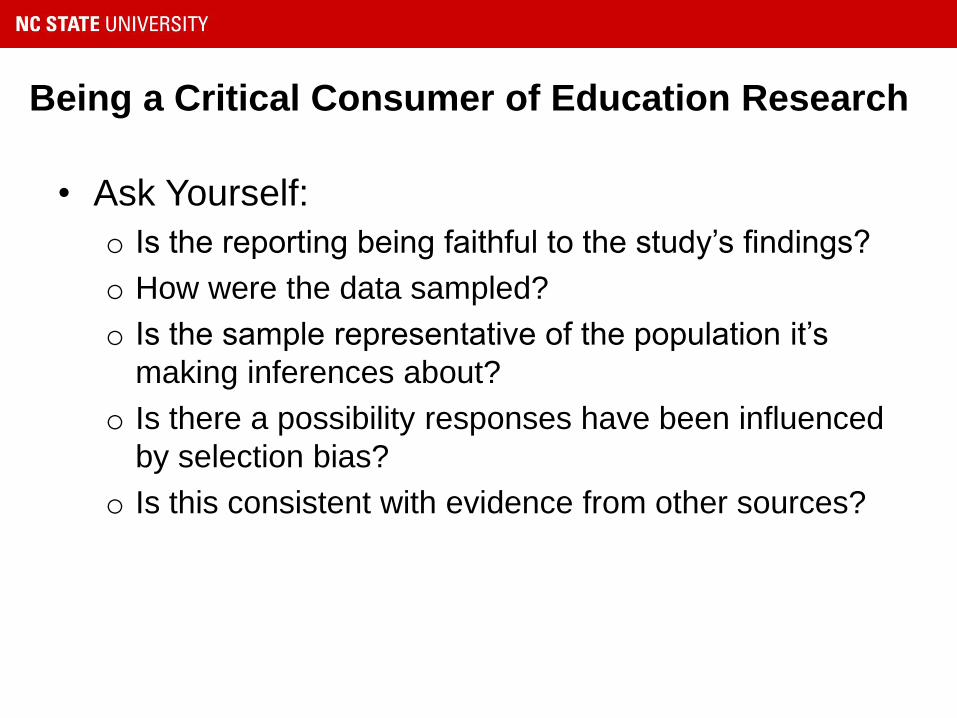
• Ask Yourself:
o Is the reporting being faithful to the study’s findings?
o How were the data sampled?
o Is the sample representative of the population it’s
making inferences about?
o Is there a possibility responses have been influenced
by selection bias?
o Is this consistent with evidence from other sources?
Being a Critical Consumer of Education Research

Final
Considerations

Donald Campbell (1976)

…as applied to educational testing
“Achievement tests may well be valuable indicators of
general school achievement under conditions of normal
teaching aimed at general competence. But when test
scores become the goal of the teaching process, they
both lose their value as indicators of educational status
and distort the educational process in undesirable ways.”
- Donald Campbell (1976)

…in pop culture
Compstat: “NYC cops are
in a fight against their own
police department. They
say it’s under the control of
a broken computer system
that punishes cops who
refuse to engage in racist,
corrupt policing. The story
of their fight, and the story
of the grouchy idealist who
originally built the machine
they’re fighting.”

Small Group Activity
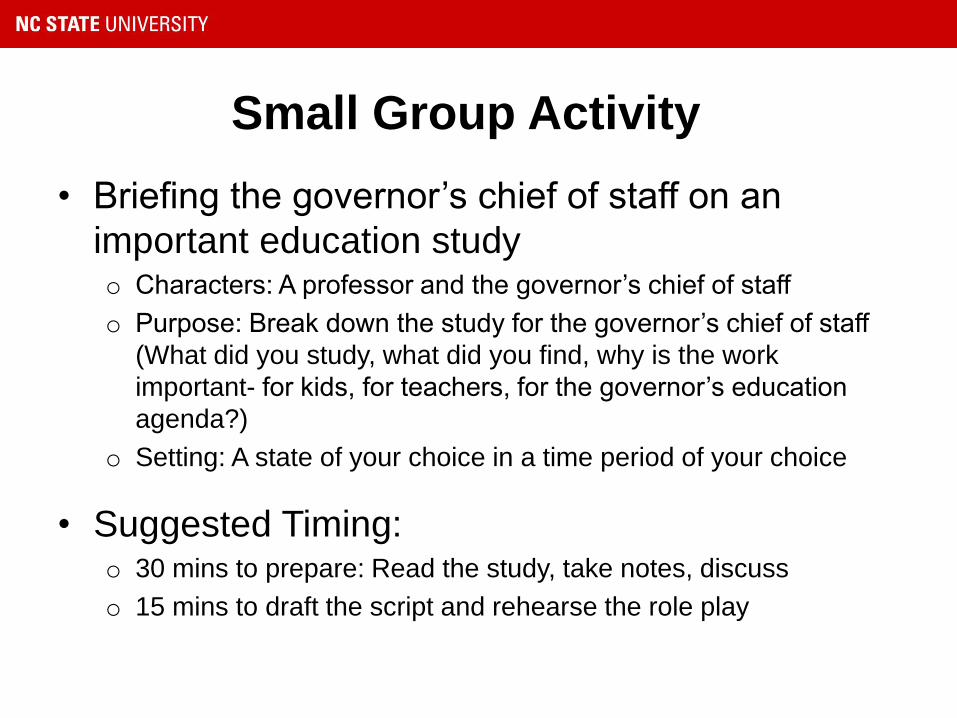
Small Group Activity
• Briefing the governor’s chief of staff on an
important education studyo Characters: A professor and the governor’s chief of staff
o Purpose: Break down the study for the governor’s chief of staff
(What did you study, what did you find, why is the work
important- for kids, for teachers, for the governor’s education
agenda?)
o Setting: A state of your choice in a time period of your choice
• Suggested Timing:o 30 mins to prepare: Read the study, take notes, discuss
o 15 mins to draft the script and rehearse the role play
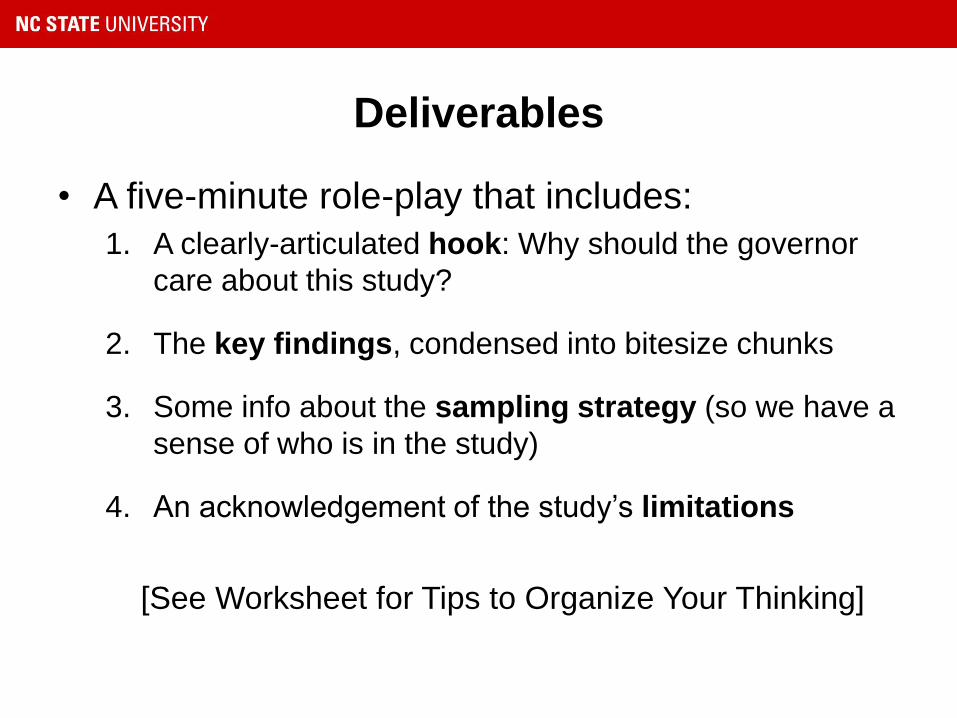
Deliverables
• A five-minute role-play that includes:
1. A clearly-articulated hook: Why should the governor
care about this study?
2. The key findings, condensed into bitesize chunks
3. Some info about the sampling strategy (so we have a
sense of who is in the study)
4. An acknowledgement of the study’s limitations
[See Worksheet for Tips to Organize Your Thinking]

Tips
• Spend time drafting and then rewriting the script together
• Write for real people: Be direct, avoid overly fancy words,
and follow a logical flow to make reading effortless
• Don’t bury the lede!

Group Presentations

The Final Word
• Sweat the small stuff- the details of a study are important; pay
close attention to them. Remember, the footnotes are the best parts!
• As a research consumer: Don’t let a reporter/activist/politician
interpret a study for you. Read the actual study for yourself
• As a research producer: Don’t let a reporter/activist/politician
interpret your study for other people without any input from you.
Write an op-ed, blog post, or executive summary to light the way
• The best studies are the simplest ones. An RCT can yield credible
estimates of program impact by simply comparing two averages.
Researchers are often forced to use fancy econometrics to make up
for weak research design