Embed Size (px)
Citation preview

Use of wavelet analysis techniques with surface EMG and MMG to characterise
motor unit recruitment patterns of shoulder muscles during wheelchair propulsion and
voluntary contraction tasks
Liping Qi
Institute of Orthopaedics and Musculoskeletal Science
University College London
Thesis submitted for the degree of Doctor of Philosophy in the
University College London, October 2009.

2
Declaration
I, Liping Qi, confirm that the work presented in this thesis is my own.
Where information has been derived from other sources, I confirm that
this has been indicated in the thesis.

3
Abstract
The high demand on the upper extremity during manual wheelchair use
contributes to a high prevalence of shoulder pathology in people with spinal
cord injury. The overall purpose of this thesis was to investigate shoulder
muscle recruitment patterns and wheelchair kinetics in able-bodied participants
over a range of daily activities and mobility tasks requiring manual wheelchair
propulsion. With a complete understanding of the muscle recruitment patterns,
physiotherapists and wheelchair users can improve rehabilitation protocols and
wheelchair propulsion performance to prevent shoulder pathology and maintain
comfort during locomotion.
Motor unit recruitment patterns were examined first during isometric and
isotonic contractions to determine if spectral properties from EMG and MMG
could be related to the different motor units in biceps brachii by using wavelet
techniques coupled with principle component analysis. The results indicated
that motor unit recruitment patterns can be indicated by the spectral properties
of the EMG and MMG signals.
EMG activity of 7 shoulder muscles was recorded with surface electrodes on 15
able-bodied participants over a range of manual wheelchair propulsion activities.
Wavelet and principle component analysis was used to simultaneously
decompose the signals into time and frequency domain. There are three main
conclusions that can be drawn: 1) Uphill and faster speed (1.6m/s) propulsion
required higher activity levels in the shoulder muscles and greater resultant joint
force than did slow speed propulsion on the ergometer (0.9m/s), thus potentially
resulting in shoulder pathology. 2) Prolonged wheelchair propulsion and greater
muscle activity may result in fatigue and play a factor in the development of
shoulder pain and pathology over time. 3) The instructed semicircular pattern
has a positive effect on shoulder muscle recruitment patterns. Further
investigations need to focus on a systematic integrated data collection and
analysis of kinematic, kinetic, and electromyography (EMG) data from people
with spinal cord injuries.

4
Preface
This PhD thesis has been accomplished at the University College London, UK,
with enrolment at the Institute of Orthopaedics & Musculoskeletal Science.
Principal supervision was provided by Professor Martin Ferguson-Pell, ASPIRE
Chair at the Institute of Orthopaedics until November 2007 and now Dean of
Rehabilitation Medicine at University of Alberta, Canada.
The experiments presented in Chapter 3 and 4 were conducted at the Institute
of Orthopaedics & Musculoskeletal Science, University College London, UK.
The experiments presented in Chapter 5-8 were conducted at Faculty of
Rehabilitation Medicine, University of Alberta. Canada.
A PhD studentship was provided by a Dorothy Hodgkin Postgraduate Award,
Engineering Physical Sciences Research Council, UK, with support from the
Royal National Orthopaedic Hospital Special Trustees, ASPIRE and a research
assistantship from the University of Alberta.
“Non-invasive methods for assessing upper limb contractions associated with
wheelchair propulsion” was approved by the Joint Research and Ethics
Committee, Royal National Orthopaedic Hospital, UK in July 2007.
“Shoulder muscle endurance and power spectrum analysis during wheelchair
propulsion” Was approved by the health research ethics board, University of
Alberta, Canada in August 2008.

5
Chapters 3 - 8 are based, respectively, on the following manuscripts Qi, L., Wakeling, J. M., Green, A., Lambrecht, K., and Ferguson-Pell, M.
Spectral properties of Electromyographic and Mechanographic signals during
isometric ramp and step contractions in Biceps Brachii.
Qi, L., Wakeling, J. M., Ferguson-Pell, M. Spectral properties of
electromyographic and mechanographic signals during dynamic concentric and
eccentric contractions of the human biceps brachii muscle.
Qi, L., Wakeling, J. M., Ferguson-Pell, M. Shoulder muscle recruitment patterns
during wheelchair propulsion for different propulsion speeds and incline.
Qi, L., Wakeling, J. M., Ferguson-Pell, M. Pushrim kinetics and patterns of
shoulder muscle recruitment on wheelchair propulsion for different propulsion
patterns.
Qi, L., Wakeling, J. M., Ferguson-Pell, M. Changes in surface EMG signals and
kinetics associated with progression of fatigue at two speeds during wheelchair
propulsion.
As this thesis is based on independent manuscripts, there is some repetition,
particular in the methods and introduction sections of these chapters.

6
Acknowledgements
It is a pleasure to thank the many people who made this thesis possible.
Foremost, I would like to express my sincere gratitude to my supervisor Prof.
Martin Ferguson-Pell for the continuous support of my Ph.D study and research,
for his motivation, enthusiasm, and immense knowledge. His guidance helped
me in all the time of research and writing of this thesis. My sincere thanks also
go to Prof. David Marsh for offering valuable suggestions and giving
constructive advice during my study at UCL.
I am deeply grateful to Dr. James Wakeling, for offering me the opportunities in
his group and providing accommodation at his home. With his enthusiasm, his
inspiration, and his great efforts to explain things clearly and simply, he helped
to make signal processing fun for me.
I would like to thank Dr. Artur Bohnet for proof-reading the thesis and thereby
significantly improving my English. Throughout my thesis-writing period, he
provided encouragement, wise advice, good teaching, and lots of good ideas.
My special thanks go to friends and colleagues, Miss Zillah Bloomer and Dr.
Duncan Bain, for having me at their home and caring they provided.
I would also like to acknowledge financial support provided by the Dorothy
Hodgkin Postgraduate Award, Engineering Physical Sciences Research Council,
UK, with support from the Royal National Orthopaedic Hospital Special Trustees,
ASPIRE and a research assistantship from the University of Alberta. Also thank
my fellow students and researchers at the Aspire Centre for Disability Sciences,
UCL and Faculty of Rehabilitation of Sciences, University of Alberta. Especially,
I would like to thank Adam Green, Kirstin Lambrecht, Jutikarn Charoensuk,
Manu Singla , for data collection, valuable discussions, and being volunteered
for this study.
Last but not the least; I owe special gratitude to my parents and brother for
continuous and unconditional support and encouragement to pursue my
interests. To them I dedicate this thesis.

7
List of abbreviations
PCA principal component analysis
MU motor unit
MUAP motor unit action potential
EMG electromyography
MMG mechanomyography
SCI spinal cord injury
RMS root mean square
MVC maximal voluntary contraction
CNS central nervous system
MPF mean power frequency
FFT fast Fourier transform
PC principal component
FES functional electrical stimulation
PDA personal digital assistant
ANCOVA analysis of covariance
ANOVA analysis of variance
SEMG surface electromyography
SD standard deviation
SEM standard error of mean
PCI the first principal component
PCII the second principal component
CV conduction velocity
MF mean/median frequency
GLM general linear model
WCU wheelchair user
AD anterior deltoid
PM pectoralis major
BB biceps brachii
TB triceps brachii
UT upper trapezius
MD middle deltoid
PD posterior deltoid

8
Table of Content
Chapter One: Introduction......................................................................................17
1.1 Literature review..............................................................................................18
1.1.1 Anatomy.......................................................................................................................... 18
1.1.2 The biomechanics of manual wheelchair propulsion ............................................... 19
1.1.3 Shoulder muscle recruitment during wheelchair propulsion ................................... 23
1.1.4 Research technology and wheelchair propulsion ..................................................... 24
1.2 Research Aims ................................................................................................37
1.2.1 The specific aims........................................................................................................... 38
1.2.2 Research protocol ......................................................................................................... 39
1.3 Thesis Structure ..............................................................................................41
Chapter Two: Methods and instruments ..............................................................43
2.1 Wheelchair ergometer .....................................................................................43 2.1.1 Ergometer ....................................................................................................................... 43
2.1.2 Visual Speed feedback system ................................................................................... 44
2.2 EMG data acquisition system..........................................................................50
2.3 MMG data acquisition system.........................................................................51 2.3.1 MMG signal origin ......................................................................................................... 51
2.3.2 Selection of MMG transducers .................................................................................... 54
2.3.3 Piezoelectric sensor signal conditioner ...................................................................... 55
2.4 EMG and MMG measurement ........................................................................56
2.5 Signal processing ............................................................................................58
Chapter Three: Spectral properties of Electromyographic and
Mechanographic signals during isometric ramp and step contractions in
biceps brachii ..........................................................................................................62
3.1 Introduction......................................................................................................62
3.2 Materials and Methods....................................................................................63
3.2.1 Participants..................................................................................................................... 63
3.2.2 Protocol ........................................................................................................................... 63
3.2.3 Signal processing .......................................................................................................... 65
3.2.4 Statistics ......................................................................................................................... 67
3.3 Results.............................................................................................................67
3.3.1 EMG ................................................................................................................................ 67
3.3.2 MMG................................................................................................................................ 69
3.3.3 PCA analysis.................................................................................................................. 71
3.4 Discussion .......................................................................................................73 3.4.1 EMG time-frequency response during isometric ramp and step muscle contractions .............................................................................................................................. 73
3.4.2 MMG time-frequency response during isometric ramp and step muscle contractions .............................................................................................................................. 75
3.4.3 Principal component analysis of EMG and MMG spectra....................................... 76
3.4.4 Ramp vs. step muscle contractions ............................................................................ 78
3.5 Conclusion.......................................................................................................79

9
Chapter Four: Spectral properties of electromyographic and
mechanographic signals during dynamic concentric and eccentric
contractions of biceps brachii muscle .................................................................81
4.1 Introduction......................................................................................................81
4.2 Materials and Methods....................................................................................82 4.2.1 Participants..................................................................................................................... 82
4.2.2 Protocol ........................................................................................................................... 82
4.2.3 Signal processing .......................................................................................................... 84
4.2.4 Principal component analysis ...................................................................................... 84
4.2.5 Statistics ......................................................................................................................... 85
4.3 Results.............................................................................................................86
4.3.1 Changes in EMG and MMG intensity at different elbow angles ............................. 86
4.3.2 Changes in EMG and MMG intensity at different loading ....................................... 88
4.3.3 Changes in EMG and MMG intensity for different contraction types..................... 90
4.3.4 PCA plot of EMG and MMG intensity spectra ........................................................... 90
4.4 Discussion .......................................................................................................93 4.4.1 Changes in EMG and MMG intensity at different loading conditions .................... 93
4.4.2 Changes in elbow angles on EMG and MMG spectra............................................. 95
4.4.3 Changes in EMG and MMG spectra during concentric and eccentric contractions .............................................................................................................................. 96
Chapter Five: Pushrim kinetics and patterns of shoulder muscle
recruitment on wheelchair propulsion for different propulsion patterns ........99
5.1 Introduction......................................................................................................99
5.2 Methods.........................................................................................................100 5.2.1 Participants................................................................................................................... 100
5.2.2 Surface electromyography ......................................................................................... 100
5.2.3 Kinetic system .............................................................................................................. 101
5.2.4 Procedure ..................................................................................................................... 101
5.2.5 Data analysis................................................................................................................ 102
5.2.6 Statistical Analysis ...................................................................................................... 103
5.3 Results...........................................................................................................103 5.3.1 Kinetics variables ........................................................................................................ 103
5.3.2 Muscle activity.............................................................................................................. 104
5.4 Discussion .....................................................................................................105 5.4.1 Wheelchair Kinetics..................................................................................................... 105
5.4.2 Muscle recruitment patterns: self-selected propulsion pattern versus semicircular propulsion pattern ........................................................................................... 107
Chapter Six: Shoulder muscle recruitment patterns during wheelchair
propulsion for different propulsion speeds and incline...................................110
6.1 Introduction....................................................................................................110
6.2 Methods.........................................................................................................112
6.2.1 Participants................................................................................................................... 112
6.2.2 Surface electromyography ......................................................................................... 112
6.2.3 Kinetic ........................................................................................................................... 112
6.2.4 Procedure ..................................................................................................................... 113
6.2.5 Data analysis................................................................................................................ 114

10
6.2.6 Statistical Analysis ...................................................................................................... 115
6.3 Results...........................................................................................................116 6.3.1 Kinetics ......................................................................................................................... 116
6.3.2 EMG activity ................................................................................................................. 116
6.4 Discussion .....................................................................................................122 6.4.1 Motor control strategies between muscles in different propulsion conditions .... 122
6.4.2 Motor unit recruitment patterns within an individual muscle in different propulsion conditions ............................................................................................................ 124
Chapter Seven: Mechanomyographic amplitude and frequency response
during wheelchair propulsion..............................................................................127
7.1 Introduction....................................................................................................127
7.2 Materials and Methods..................................................................................127 7.2.1 Participants................................................................................................................... 127
7.2.2 Surface Mechanomyography..................................................................................... 128
7.2.3 Protocol ......................................................................................................................... 128
7.2.4 MMG signal processing .............................................................................................. 128
7.2.5 Statistical Analysis ...................................................................................................... 129
7.3 Results...........................................................................................................130
7.4 Discussion .....................................................................................................131
7.4.1 MMG intensity, MPF and pattern during two speeds wheelchair propulsion ..... 131
7.4.2 Limitations of the use of MMG during dynamic muscle contractions .................. 132
Chapter Eight: Changes in surface electromygraphic signals and kinetics
associated with progression of fatigue at two speeds during wheelchair
propulsion ..............................................................................................................134
8.1 Introduction....................................................................................................134
8.2 Materials and Methods..................................................................................135 8.2.1 Participants................................................................................................................... 135
8.2.2 Surface electromyography ......................................................................................... 135
8.2.3 Kinetic ........................................................................................................................... 135
8.2.4 Test procedure............................................................................................................. 135
8.2.5 Data analysis................................................................................................................ 136
8.2.6 Statistics ....................................................................................................................... 137
8.3 Results...........................................................................................................137 8.3.1 Propulsion kinetics ...................................................................................................... 137
8.3.2 EMG characteristics .................................................................................................... 137
8.4 Discussion .....................................................................................................142
8.4.1 The effect of muscle fatigue on the motor unit recruitment pattern ..................... 142
8.4.2 The effect of muscle fatigue on wheelchair biomechanics.................................... 144
8.4.3 Limitations .................................................................................................................... 146
Chapter Nine: Conclusions, Limitations, and Recommendations ..................147
1.1 Conclusions ...................................................................................................147
1.2 Limitations .....................................................................................................147
1.3 Recommendations ........................................................................................148

11
List of Tables
Table 2.1. Rotational-Linear Parallels......................................................................48
Table 3.1. Characteristics of the wavelets used for the EMG and MMG wavelet
analysis..............................................................................................................66
Table 5.1. The stroke patterns and propulsion biomechanics. Data were
reported as mean ± SD. ..................................................................................104
Table 5.2. Timing of EMG activity of self-selected stroke pattern vs semicircular
pattern during wheelchair propulsion. Data were reported as mean ± SD. ...104
Table 6.1. Kinetics parameters for 3 conditions of wheelchair propulsion. Data
were reported as mean ± SD. .........................................................................116
Table 6.2. Timing of EMG activity of 3 conditions of wheelchair propulsion. Data
were reported as mean ± SD. .........................................................................117
Table 7.1. Timing of MMG activity of slow speed (0.9m/s) vs fast speed (1.6m/s)
during wheelchair propulsion. Data were reported as mean ± SD.................130

12
List of Figures
Figure 1.1. International Classification of Functioning, Disability and Health (ICF)
concept of wheeled mobility ..............................................................................17
Figure1.2. Shoulder anatomy....................................................................................19
Figure1.3. Wheelchair propulsion movement and technique parameters................20
Figure1. 4. Three dimensional musculoskeletal model of the upper extremity
and trunk............................................................................................................20
Figure 1.5. Stroke pattern classifications during wheelchair propulsion (stylized
illustrations).. .....................................................................................................21
Figure 1.6. Orientation of force and moments. The orientation of pushrim forces
and hub moments are shown............................................................................25
Figure 2.1. Wheelchair dynamometer with the platform removed to display the
rollers and tachometer sensors.........................................................................43
Figure 2.2. Wheelchair with SmartWheel attached to the wheelchair ergometer....43
Figure 2.3. Roller and tachometer connection..........................................................44
Figure 2.4. Diagram of the ergometer and wheelchair. ............................................44
Figure 2.5. D.C.Tachometer and tachometer wheel.................................................45
Figure 2.6. Two magnets are attached on surface of the roller. The distance
between the two magnets is 10cm (left). A pulse is generated when the
magnet is passing by the magnetic field sensor (right). ...................................46
Figure 2.7. The magnetic field sensor is taped on the bar that is mounted flush
against the roller ................................................................................................46
Figure 2.8. Front panel of LabVIEW program used to record the signals from
magnetic field sensor and tachometer. A single ended channel was use,
and the sampling rate was 500Hz per channel. ...............................................47
Figure 2.9. The output voltage signal of the tachometer and the output spike
signal of the magnetic field sensor were recorded simultaneously. .................47
Figure 2.10.The regression line of roller speed and tachometer voltage. Left
roller (left), Right roller (right) ............................................................................48
Figure 2.11. Speed recorded by the tachometer (left) and the SmartWheel
(right). ................................................................................................................49
Figure 2.12. A monitor with the LabVIEW program was set in front of the
wheelchair to provide visual feedback. .............................................................50
Figure 2.13. DE-3.1 EMG Sensor.. ...........................................................................51

13
Figure 2.14. Removing EMG crosstalk: the signals originating from deep
muscles, depicted by location "C" disperse as they travel to the skin
surface and are detected by all sensor contacts. .............................................51
Figure 2.15. Schematic representation of the hypothesized MMG generation
process (Barry and Cole, 1990). .......................................................................52
Figure 2.16. Voluntary isometric effort at 30% MVC. The EMG, force ripple and
accelerometer output. These signals can be considered as the outcomes
of the unfused mechanical activities of the recruited motor units.....................54
Figure 2.17. A Piezoelectric transducer....................................................................55
Figure 2. 18. Voltage mode amplifier circuit. ............................................................56
Figure 2.19. Main equipments for EMG and MMG measurement. .........................57
Figure 2.20. Screen dump of measurement program. Channels 1 - 4 were used
to collect MMG data, Channel 5-12 were used to collect EMG data. ..............58
Figure 3.1. Isometric MVC test setup. Electromyographic (EMG) and
mechanomyographic (MMG) sensor were placed in the middle line of
biceps brachii. A bandage was used to ensure constant pressure of the
sensors over the muscle. ..................................................................................64
Figure 3.2. An example of the Force (A), electromyographic (EMG) (B), and
mechanomyographic (MMG) (C) signals from the biceps brachii during an
isometric ramp contraction for 1 participant. Time-frequency analysis of
EMG (D) and MMG (E) showed the progressive increases in the high
frequency components of the intensities with increases in force (mean
values of each force level from 20 subjects). Increasing intensities are
shown by darker regions ...................................................................................68
Figure 3.3. (A)EMG total intensity vs. force (%MVC) for ramp (solid line) and
step (grey dotted line) contraction for Biceps brachii. (B) EMG Mean
frequency vs. force (%MVC) for ramp (solid line) and step (grey dotted line)
contraction for Biceps brachii. Values are mean±S.E.M ..................................69
Figure 3.4. (A)MMG Total intensity vs. force (%MVC) for ramp (solid line) and
step (grey dotted line) contraction for the biceps brachii. (B) Mean
frequency vs. force (%MVC) for ramp (solid line) and step (grey dotted line)
contraction for Biceps brachii. Values are mean±S.E.M. ................................70
Figure 3.5. Principal Component weightings from the EMG power spectra for
the first two principal components (PC) with the relative proportion of the
total signal that they describe............................................................................71
Figure 3.6. Principal component loading scores from the EMG intensity spectra
for the isometric ramp (open diamonds) and step (solid circles)

14
contractions. The points denote the mean±S.E.M. scores for each force
level for biceps brachii. The numbers denote the % MVC. ..............................72
Figure 3.7. Principal component weightings from the MMG power spectra for the
first two principal components (PC) with the relative proportion of the total
signal that they describe....................................................................................72
Figure 3.8. Principal Component loading scores from the MMG intensity spectra
for the isometric ramp (open diamonds) and step (solid circles)
contractions. The points denote the mean ±S.E.M. scores for each force
level for biceps brachii. The numbers denote the % MVC. ..............................73
Figure 4.1. A eccentric-concentric contraction test. An electronic goniometry
was attached at the fulcrum to measure elbow joint position. A bandage
was used to ensure consistent pressure of the contact sensor. ......................83
Figure 4.2. An example of the angle (A), mechanomyographic (MMG) (B), and
electromyographic(EMG) (C) signals from the biceps brachii during
concentric and eccentric contracions for 1 participant. ..................................83
Figure 4.3. (A)EMG total intensity vs elbow angle at different loadings for
concentric contractions for biceps brachii. (B) EMG total intensity vs elbow
angle at different loadings for eccentric contractions for biceps brachii.
Values are mean±S.E.M ...................................................................................86
Figure 4.4. (A)EMG θ vs elbow angle at different loadings for concentric
contractions for biceps brachii. (B) EMG θ vs elbow angle at different
loadings for eccentric contractions for biceps brachii. Values are mean
±S.E.M ...............................................................................................................87
Figure 4.5. (A)MMG total intensity vs elbow angle at different loadings for
concentric contractions for biceps brachii. (B) MMG total intensity vs elbow
angle at different loadings for eccentric contractions for Biceps
Brachii.Values are mean±S.E.M .......................................................................88
Figure 4.6. (A)EMG θ vs elbow angle at different loadings for concentric
contractions for biceps brachii. (B) EMG θ vs elbow angle at different
loadings for eccentric contractions for biceps brachii.Values are
mean±S.E.M......................................................................................................89
Figure 4.7. Principal component weightings from the EMG power spectra for the
first two principal components (PC) with the relative proportion of the total
signal that they describe....................................................................................90
Figure 4.8. (A) Principal component loading scores from the EMG intensity
spectra for the concentric contractions. (B) principal component loading
15
scores from the EMG intensity spectra for the eccentric contractions. The
points denote the mean±S.E.M. scores for each force level for biceps
brachii. The numbers denote the % MVC.........................................................91
Figure 4.9. Principal component weightings from the MMG power spectra for the
first two principal components with the relative proportion of the total signal
that they describe. .............................................................................................91
Figure 4.10. (A) Principal component loading scores from the MMG intensity
spectra for the concentric contractions. (B) principal component loading
scores from the MMG intensity spectra for the eccentric contractions. ...........92
Figure 5.1. Semicircular hand trajectory. ................................................................102
Figure 5.2. Semi-circular propulsion technique. .....................................................102
Figure 5.3. Pushrim moment (Mz) (A) and tangential force (Ft) (B) for the
semicircular pattern (grey line) and self-selected pattern (black line). Each
trace shows the mean (think line) + S.E.M. (thin line). Time was normalized
to was normalized to 100% of propulsion cycle. Illustration of the definition
of the push phase, recovery phase, negative Mz, and Negative Ft. ...............105
Figure 5.4. EMG intensity for the semicircular pattern (A) and self-selected
pattern (B) from the tested 7 shoulder muscles. Data are the mean from all
trials and all subjects. EMG intensity scales are normalized to the
maximum intensity for each muscle in the range of [0, 1] where the color
map represent the intensity of EMG signal. Time base of propulsion cycle
was normalized to 100% with push phase denoting hand-on-hand-off
moment of the pushrim....................................................................................109
Figure 6.1. Excerps of raw EMG traces from one subject from 2 speeds. Each
panel show 5 seconds of activity. The scale is the same for each muscle
across the three conditions. ............................................................................117
Figure 6.2. Total EMG intensity and pushrim moment during each propulsion
stroke for the different muscles. Each trace shows the mean (think line) +
S.E.M. (thin line). The black dotted line shows data for the trials at 0.9m/s;
the solid black line for 1.6m/s. the grey line shows data from the trials on
the ramp...........................................................................................................120
Figure 6.3. Principal component loading scores for PCI (ordinate) and PCII
(abscissa ) from different shoulder muscles during wheelchair propulsion at
slow speed (open circle), fast speed (solid circle), and at self-selected
speed ramp (grey triangles). There are 20 points on each graph which
represent the 20 time windows within each propulsion cycle.........................121
16
Figure 7.1. Excerpts of raw MMG traces from one subject from 2 speeds. Each
panel show 10 seconds of activity. The scale is the same for each muscle
across the three conditions. ............................................................................129
Figure 7.2. Total MMG intensity during each propulsion stroke for the different
muscles. Each trace shows the mean (think line) + S.E.M. (thin line). The
grey dotted line shows data for the trials at 0.9m/s; the solid black line for
1.6m/s. .............................................................................................................130
Figure 7.3. MMG spectrum for different muscles. Each trace shows the mean
(think line) + S.E.M. (thin line). The grey dotted line shows data for the
trials at 0.9m/s; the solid black line for 1.6m/s................................................131
Figure 8.1. Changes in the pushrim kinetics parameter: speed, peak total force
(peak Ftot), peak tangential force (peak Ft), average total force (Ave Ftot),
push time, push frequency, push length in degree, and mechanical
effectiveness (Ft / Ftot) as a function of time (expressed as a percentage of
the endurance time) during the fast speed (black line) and slow speed
(grey line) wheelchair propulsion. Values reported as mean ± S.E.M. ..........139
Figure 8.2. Changes in the EMG intensity, MPF, and theta as a function of time
(expressed as a percentage of the endurance time) during the fast speed
(black line) and slow speed (grey line). Each point is the average value
(mean±S.E.M., n=14) of the 10 cycles of each time window. ........................140
Figure 8.3. EMG intensity for 7 shoulder muscles obtained at the 20%
endurance time window (black lines) and at the 100% endurance time
window (grey lines) of the two speed wheelchair propulsion. Time zero
indicates the hands on the pushrim. Each profile represents the mean(think
line) ±S.E.M (thin lines) obtained from averaging individual data across 10
consecutive propulsion cycles of each time window.. ....................................141
Figure 9.1 PDA data logger.....................................................................................150
17
Chapter One: Introduction
In the UK, about 2000 people suffer spinal cord injuries (SCI) leading to permanent
paralysis every year (data from website: http://www.spinal-injury.net/). About 37,000
Canadians currently live with spinal cord injuries; each year about 1,000 Canadians
sustain some level of permanent paralysis or neurological deficit following some kind
of injury. In the US there are an estimated 235,000 to 265,000 individuals with spinal
cord injuries and an estimated additional 12,000 new injured people each year
(Curtis et al., 1999) (http://www.fscip.org/facts.htm.)
Most individuals with SCI use wheelchairs for mobility at home, school, work, and
play (Curtis et al., 1999). Wheeled mobility as defined by the WHO (world health
organization) considers mobility from a social context rather than a purely medical
one (WHO, 2001). This concept balances the physical impairments associated with a
person’s spinal cord injury with their goals and aspirations as well as the impact of
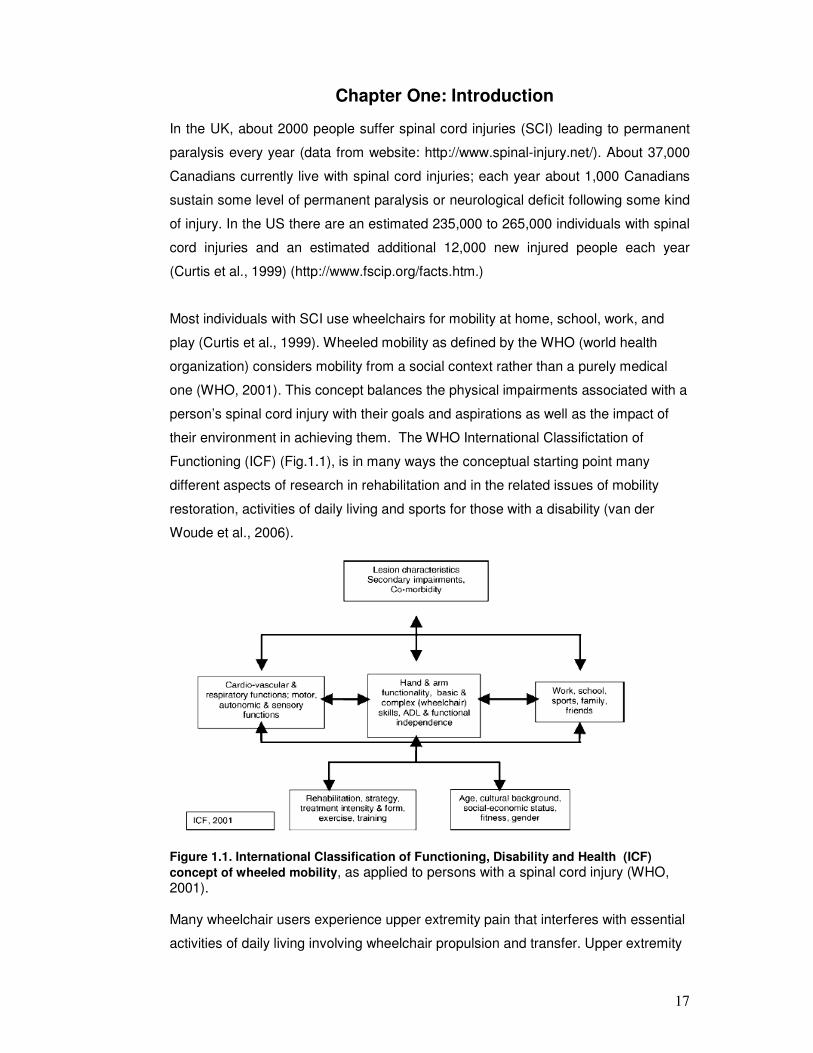
their environment in achieving them. The WHO International Classifictation of
Functioning (ICF) (Fig.1.1), is in many ways the conceptual starting point many
different aspects of research in rehabilitation and in the related issues of mobility
restoration, activities of daily living and sports for those with a disability (van der
Woude et al., 2006).
Figure 1.1. International Classification of Functioning, Disability and Health (ICF)
concept of wheeled mobility, as applied to persons with a spinal cord injury (WHO, 2001). Many wheelchair users experience upper extremity pain that interferes with essential
activities of daily living involving wheelchair propulsion and transfer. Upper extremity

18
weight-bearing activities and chronic overuse associated with mobility have both
been implicated in the development of soft tissue injuries and degenerative changes
in the shoulder joints (Collinger, Boninger et al. 2008). To gain insight into the causes
and consequences of upper extremity pain/injury associated with wheelchair
propulsion, as well as to study propulsion techniques as such, biomechanical
analysis is an important prerequisite (van der Woude et al., 2001).
1.1 Literature review
1.1.1 Anatomy
Shoulder pain is quite common among those who engage in sports activities whether
disabled or not, but it is experienced particularly often by persons in wheelchairs
(Curtis et al., 1999; Fullerton et al., 2003). The main reason for this prevalence stems
from the fact that this population relies entirely on the upper limb for both ambulation
and weight-bearing tasks (Mercer et al., 2006). The shoulder is poorly designed for
this purpose, and thus becomes exposed to excessive, repeated interarticular
pressures in conjunction with a more abnormal distribution of stresses across the
subacromial area.
The high mechanical load on the upper extremity in manual wheelchair propulsion
within the framework of the task (repetitiveness, peak force, limited muscle use,
extreme joint deflections (wrist)) is exacerbated by the complex anatomy of the upper
extremity (Fig.1.2). Discomfort is thought to be related to the necessity to stabilize the
glenohumeral (GH) joint (usually loosely referred to as the shoulder joint) during
wheelchair propulsion (Veeger and van der Helm, 2007). The shoulder joint has a
greater range of motion than any other joint in the body, which comes at the price of
an inherent instability. The radius of curvature of the humeral head is three times that
of the glenoid socket and thus, unlike the hip joint, the shoulder relies on ligamentous
and muscular components for its main constraints (i .e., rotator cuff). A person who
depends exclusively on a wheelchair for ambulation is exposing his/her shoulder to
increased stresses and muscular imbalances, predisposing it to a variety of overuse
injuries (Miyahara et al., 1998). Participants in wheelchair sports, especially those
involved in track events, marathon road racing, basketball, and tennis, subject their
shoulders to even greater stresses, resulting in an even larger abundance of overuse
problems (Burnham et al., 1993). As opposed to the lower limb in the nondisabled
population, the upper limb in both sport and non-sport wheelchair users is the main
weight-bearing limb. As a consequence, many wheelchair users experience upper
extremity pain that interferes with essential activities of daily living involving

19
wheelchair propulsion and transfer (Curtis et al., 1999). Upper extremity weight-
bearing activities and chronic overuse have both been implicated in the development
of soft tissue disorders and degenerative changes in the shoulder joints (Collinger et
al., 2008).
Figure1.2. Shoulder anatomy (from Google images)
1.1.2 The biomechanics of manual wheelchair propulsion
Manual wheelchair propulsion and wheelchair sports have increasingly become the
subject of detailed biomechanical analyses. More recently, biomechanics research
has been geared towards the musculoskeletal problems of long-term wheelchair use
and sports (van der Woude et al., 2001).
The wheelchair propulsion cycle is divided into a propulsion phase and a recovery
phase (Fig.1.3). The propulsive phase is initiated when the hand comes into contact
with the pushrim and continues to the point at which contact is removed at the end of
the stroke. The recovery phase involves the motion that occurs when the hands

20
disengage from the pushrim and lasts until the upper extremities swing back to
contact the pushrim once again.
Figure1.3. Wheelchair propulsion movement and technique parameters. EA = end
angle (°); HC = hand contact; HR = hand release; PA = push angle; SA = start angle.
The propulsion phase begins with maximum shoulder extension and ends with
maximum shoulder flexion (Lin et al., 2004). The recovery phase begins after the end
of the propulsion phase, as the shoulder extends to return the hand to the starting
position of propulsion (Fig. 1.4).
Figure1. 4. Three dimensional musculoskeletal model of the upper extremity and trunk
(Lin et al., 2004).

21
During wheelchair propulsion, the shoulder is maintained at approximately 70°of
abduction. At the onset of the propulsive phase of motion, the shoulder is extended
and internally rotated, and subsequently ends up flexed and externally rotated at the
onset of the recovery phase. Due to these biomechanics, wheelchairs users often
have well-developed shoulder flexors, internal rotators, and adductors, but may have
poorly developed external rotators and thoracoscapular muscles. This muscular
imbalance, plus the repetitive nature of the wheelchair push, predisposes the rotator
cuff to impingement (Burnham et al., 1993).
During the pushing phase, the user’s hands follow the path of the pushrim. However,
during the recovery phase users can choose how they want to move their hands
while preparing for the next push. A variety of different hand trajectory patterns have
been classified during the recovery phase of the propulsion cycle, including semi-
circular, single looping (SLOP), double looping (DLOP), and arcing, illustrated in
Fig.1.5 (Sanderson and Sommer, 1985; Veeger et al., 1989b; Boninger et al., 2002).
Although it is not understood why users implement different strategies during
recovery, there have been several studies investigating the potential advantages of
the various patterns (Richter et al., 2007).
Figure 1.5. Stroke pattern classifications during wheelchair propulsion (stylized

22
illustrations). The hand is constrained to follow the pushrim during the push but the user is free to choose how to follow through between pushes. In the arcing pattern, the user’s hand travels back along the pushrim between pushes(Richter et al., 2007).Abbreviations: ARC, arcing; DLOP, double looping; SC, semi-circular; SLOP, single-looping.
While stroke patterns are varied for level propulsion, arcing is the most popular
pattern for pushing uphill. Based on its popularity alone, it could be hypothesized to
be the most biomechanically efficient (de Groot et al., 2004). However, there may be
reasons other than efficiency that draw users to the arcing pattern for pushing uphill.
When pushing uphill, the user must maintain her/his balance and not tip backward. In
addition, missing a push could mean losing control and rolling backward down the hill.
When propelling uphill the ability to lean forward affects both static and inertially
induce imbalance (instability). For SCI patients with higher level lesions loss of
control of trunk musculature makes prevention of rollback even more difficult. With
the arcing pattern, the user’s hands remain close to the pushrim when coasting,
allowing her/him to make quick corrections. The SLOP pattern was the second most
popular choice for pushing uphill. With the SLOP pattern, the user’s hands are above
the pushrim, which allow her to push down and grip the pushrim relatively quickly if
necessary. Conversely, the DLOP pattern, much like the semi-circular pattern, may
put the user at a disadvantage because her hands are well below the pushrims and
the arms need to be lifted up against gravity to make unexpected corrections.
Based on the results of the study by Boninger et al. (2002) the clinical practice
guidelines for the Preservation of Upper Limb Function Following Spinal Cord Injury
(Boninger et al., 2002) recommend that wheelchair users implement the semi-circular
pattern during everyday propulsion (Boninger et al., 2005). These guidelines are
described as a first step in the ongoing process of developing useful tools for
preserving upper-limb function in people with spinal cord injury. However, the
guidelines did not consider the study by de Groot et al. (de Groot et al., 2004), which
suggests that the arcing pattern may result in greater metabolic efficiency than the
semi-circular pattern.
The study by Boninger et al showed that the semicircular pattern was associated with
a lower cadence and the greatest time spent in propulsion relative to recovery. In
other words, wheelchair users who followed a semicircular pattern hit the pushrim
less frequently and used more of the pushrim to go the same speed. Therefore,
training can be employed, for instance, to assist wheelchair users to reduce the
stress on their arms by using a longer, smoother stroke, reducing their stroke

23
frequency, and minimizing forces. Of course, the propulsion technique is highly
dependent on the type of wheelchair used, as well as the functional capacity of the
user. It should be kept in mind, that almost all available kinetic information is based
on studies focusing on daily use.
1.1.3 Shoulder muscle recruitment during wheelchair propulsion
Since a typical kinesiological EMG represents the activity of multiple motors, EMG
analyses provide insight into muscle recruitment patterns and neuromuscular control
of wheelchair propulsion. Several studies have examined shoulder muscle activity
(EMG) during wheelchair propulsion by individuals with SCI using surface EMG and
wired EMG techniques (Mulroy et al., 1996; van der Helm and Veeger, 1996;
Niemeyer et al., 2004; Bernasconi et al., 2007; Dubowsky et al., 2008; Dubowsky et
al., 2009). Two muscle synergies have been identified during wheelchair propulsion.
The push phase synergy is dominated by anterior deltoid (AD), pectoralis major (PM),
and biceps brachii (BB). These muscles are the prime movers during the push phase.
The recovery synergy is dominated by the middle and the posterior deltoid (MD and
PD). These muscles are responsible for returning the arm during the recovery phase.
After the hand has made contact with the rim, the pull phase starts with an initial
elbow flexion, accompanied by activity of the BB muscle. AD shows high activity at
the beginning of hand contact, whereas PM displays a more constant activity of
longer duration. These two muscles are considered to be the prime movers in
wheelchair propulsion (Mulroy et al., 1996).The push phase muscles were also
activated in the recovery phase to decelerate the back swing of the arm and to
prepare the hand, by increasing the hand speed, for impact on the pushrim (Mulroy
et al., 1996). Veeger et al (Veeger et al., 2002) used a musculoskeletal model to
show that the subscapularis muscle produced the largest force during the push
phase. The other rotator cuff muscles, supraspinatus and infraspinatus, were also
highly active during the push phase while the triceps muscle produced less force
than the biceps muscle during the push phase. In the recovery phase, the posterior
deltoid produced considerably more force than all other muscles (Mulroy et al., 1996).
It has been reported that at the elbow joint, BB was activated in the late recovery
phase and continued its action over a period when elbow flexion torque would
contribute to the propulsion (Lighthall-Haubert et al., 2009). The peak muscular
activity of the BB muscle was found at hand contact. Muscular activity of TB
increased progressively during the push phase, reaching maximal values at hand

24
release (Chow et al., 2009). In addition, synergy was shown between PM, AD and
litissimus dorsi (LD). Muscular activity of these muscles increased from the end of the
recovery phase and reached a maximum during the push phase. PD, MD together
with superior trapezius (ST) were highly active during recovery, which illustrates their
prime mover function.
1.1.4 Research technology and wheelchair propulsion
To study the physiological and mechanical strain of manual wheelchair propulsion
and wheelchair sports performance, specific technologies and protocols of
measurement are required for comprehensive biomechanical assessment.
1.1.4.1 The wheelchair propulsion kinetic system
Task-specific, standardized laboratory experiments are required to analyze
performance capacity in wheelchair users. Often this employs customized equipment,
which requires to be reliable and validitated. Wheelchair tests are generally
performed to investigate physical capacity of wheelchair users, to analyze wheelchair
propulsion technique, to assess different wheelchair designs, or to evaluate load on
the upper extremity joints (van der Woude et al., 2006).
The least standardized but most realistic testing condition is a simple wheelchair
(racing) track (Mattison et al., 1989; Vanlandewijck et al., 1999). It is complicated to
control experimental conditions and procedures, such as velocity and power output.
Since the wheelchair– user combination is non-stationary, physiological measures
and kinematics are complicated to measure, but some important parameters can be
measured with the currently available ambulatory physiological and biomechanical
measurement systems.
Second best in terms of validity of wheelchair exercise testing is a motor-driven
treadmill. This device is widely used for research purposes. It allows valid
physiological exercise testing, and the study of kinematics and muscle activity (van
der Woude et al., 1986; Veeger et al., 1989a). Power output can be determined in the
form of a simple drag test, in which the drag force of a wheelchair–user system can
be determined (van der Woude et al., 1986). Workload can be varied with an
inclination of the belt, or by applying a resistance force on the back of the wheelchair
by means of a pulley system (Veeger et al., 1989a).
The final category of wheelchair ergometers is the wheelchair simulator. Most of
them are computer-controlled devices that accurately simulate wheelchair propulsion

25
with an adjustable propulsion mechanism and/or seat configuration. It essentially
provides a simulation of wheelchair propulsion in terms of friction (rolling resistance,
and sometimes air friction) and slope, and simulation of inertia of the wheelchair–
user system. Most systems enable the measurement of momentary torque and
velocity, and thus power output (Keyser et al., 1999; Rodgers et al., 2000), and
sometimes the measurement of 3D forces applied by the hand on the propulsion
system (Niesing et al., 1990; Keyser et al., 1999; Rodgers et al., 2000).
In this thesis, the SmartWheel was used in all the test sessions for kinetic data
collection. There is a whole range of testing related to the measurement of
physiological parameters, such as energy consumption and metabolic efficiency that
are not considered in detail in this thesis. The SmartWheel is a measurement device
that mounts to most manual wheelchairs and communicates with a computer via Wi-
Fi technology to collect and report propulsion information. The major advantage of an
instrumented wheel will be the analysis of daily activities and wheelchair-related
tasks that cannot be met with stationary ergometry technology. However,
SmartWheel is heavier than a traditional wheelechair wheel and requires the user to
push on the rim. Many users especially higher level SCI push the tyre as they obtain
higher friction against the wheel since they can’t grip the rim.
Figure 1.6. Orientation of force and moments. The orientation of pushrim forces and hub moments are shown. The direction of the arrows indicates the directions of the forces and moments applied by the subject. Ft and Fr were calculated from Fx and Fy and used in the analysis (Boninger et al., 1997).
The SmartWheel measures three-dimensional forces (tangential, radial, and axial)
and moments applied to the pushrim. Its design is based on equations for a 3-beam
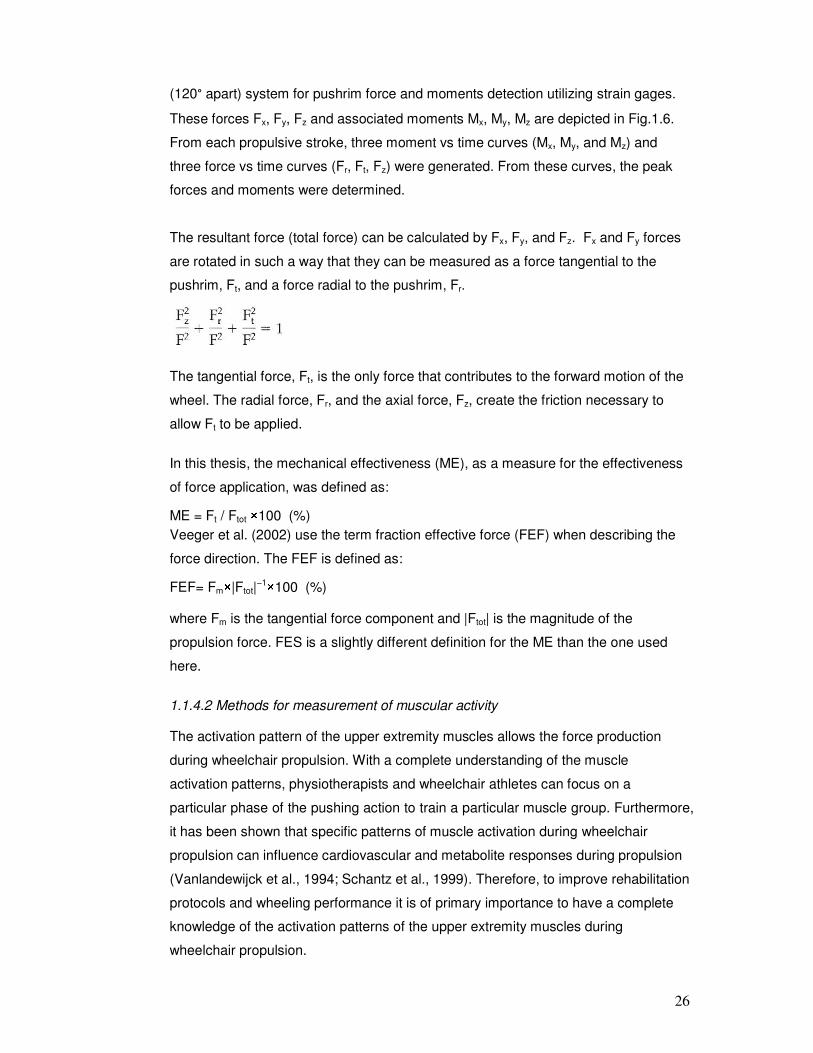
26
(120° apart) system for pushrim force and moments detection utilizing strain gages.
These forces Fx, Fy, Fz and associated moments Mx, My, Mz are depicted in Fig.1.6.
From each propulsive stroke, three moment vs time curves (Mx, My, and Mz) and
three force vs time curves (Fr, Ft, Fz) were generated. From these curves, the peak
forces and moments were determined.
The resultant force (total force) can be calculated by Fx, Fy, and Fz. Fx and Fy forces
are rotated in such a way that they can be measured as a force tangential to the
pushrim, Ft, and a force radial to the pushrim, Fr.
The tangential force, Ft, is the only force that contributes to the forward motion of the
wheel. The radial force, Fr, and the axial force, Fz, create the friction necessary to
allow Ft to be applied.
In this thesis, the mechanical effectiveness (ME), as a measure for the effectiveness
of force application, was defined as:
ME = Ft / Ftot ×100 (%)
Veeger et al. (2002) use the term fraction effective force (FEF) when describing the
force direction. The FEF is defined as:
FEF= Fm×|Ftot|−1×100 (%)
where Fm is the tangential force component and |Ftot| is the magnitude of the
propulsion force. FES is a slightly different definition for the ME than the one used
here.
1.1.4.2 Methods for measurement of muscular activity
The activation pattern of the upper extremity muscles allows the force production
during wheelchair propulsion. With a complete understanding of the muscle
activation patterns, physiotherapists and wheelchair athletes can focus on a
particular phase of the pushing action to train a particular muscle group. Furthermore,
it has been shown that specific patterns of muscle activation during wheelchair
propulsion can influence cardiovascular and metabolite responses during propulsion
(Vanlandewijck et al., 1994; Schantz et al., 1999). Therefore, to improve rehabilitation
protocols and wheeling performance it is of primary importance to have a complete
knowledge of the activation patterns of the upper extremity muscles during
wheelchair propulsion.

27
Several different methods are now used within ergonomic science to measure
muscular activities during a work task. Two of them are electromyography and
mechanomyography. Among other methods available are, e.g., blood flow changes
or tendon forces. These techniques are however not applicable for detection of motor
unit recruiment patterns and will not be further discussed here.
Surface electromyography
The majority of EMG studies concerning wheelchair propulsion have been published
since 1989 (29 out of 129 found in Pubmed with ‘‘wheelchair”and ‘‘EMG”). This can
be explained by recent advances in technology. Indeed, new EMG acquisition
systems permit easy recordings of high quality surface EMG in several muscles (up
to 16) during unrestricted movements, even in natural situations (and with wireless
electrodes for very recent systems). In addition, advances in the development and
application of signal processing technology to the study of the EMG signals emitted
by active muscle now make it possible to determine which types of muscle fibre are
active during locomotion. It is postulated that direct EMG measurements (i.e. direct
biofeedback) would be useful (and easily used by clinicians and wheelchair users) for
improving the activation patterns of the upper extremity muscles and thus, for
improving rehabilitation / training programs (Mulroy et al., 1996).
In 1792, Luigi Galvani published his findings that electricity could initiate muscle
contractions. Since then, physiologists have known and acted on Galvani’s revelation
that skeletal muscles contract when stimulated electrically and, conversely, that an
electric current is detectable when they contract (De Luca, 1997). The extraction of
information from the electrical signal generated by the activated muscles
(electromyography; EMG) has been regarded as an easy way to gain access to
physiological processes that cause the muscle to generate force, produce movement
and accomplish functional tasks. EMG can be recorded invasively, by wires or
needles inserted directly into the muscle, or non-invasively, by recording electrodes
placed over the skin surface overlying the investigated muscle. An indwelling method,
where the EMG signal is obtained by using a monopolar (i.e. only one) intramuscular
electrode with a large contact area and a surface reference electrode, is common for
more deeply located muscles. For the detection of activity in smaller parts of the
muscle, bipolar indwelling configurations are often used. Bipolar configurations with
surface EMG (SEMG) electrodes are used to record the electrical signals from larger

28
parts of superficially situated muscles. Therefore, a surface electrode may be used to
monitor the general picture of muscle activation, as opposed to the activity of only a
few fibres as observed when using an inserted wire. Fine wire EMG recording
provides a more exact representation and finer resolution of the electrical activity of
the muscle fibers than that possible with SEMG. This is because the SEMG signal is
a result of the summation of nonsynchronous action potentials of a large number of
muscle fibers that have been nonlinearly attenuated by body tissue due to the
frequency - dependent electrical properties of the tissues (De Luca, 1997). There are
several pros and cons for selecting SEMG over indwelling electromyography. The
most compelling is the inherent risk and discomfort to the patient associated with an
invasive procedure. Generally these types of procedures are performed in
specialized clinics, hospital centres and experienced / qualified labs. Due to time
constrains, associated risks and inexperience, indwelling electromyography is
seldom used in clinical rehabilitation practice, i,e. by physiotherapists or allied
professionals. In addition, fine wire electrodes measurement for intense functional
activities, such as wheelchair propulsion also carry a significant risk of wire breakage,
a particularly unacceptable risk for disabled participants who rely upon their
shoulders for mobility or activities of daily living. Therefore, SEMG is at present the
most established and suitable technique for recording overall muscle activity during
wheelchair propulsion and was therefore chosen for this thesis.
However, it has many limitations which must be taken into consideration for a proper
interpretation. The main physiological factors that influence the surface EMG are
fibre membrane properties (e.g. muscle fibre conduction velocity) and motor unit
properties (e.g. firing rates). Crosstalk and movement artefacts are considered as
non-physiological factors which can also influence the EMG signal. The movement
artefacts can be reduced by wavelet analysis (wavelet 1and 2, details in Chapter 5)
and by careful anchoring of all the cables. On the other hand, the double differential
electrode configuration can remove the crosstalk originated from deeper muscles.
Recommendations for correct electrode placement over the intended muscle have
been provided by SENIAM concerted action (Hermens et al., 2000).
The pattern of muscle activation during a specific movement, or during rhythmic
movement such as wheelchair propulsion, can be analyzed in terms of activity level
and/or activation timing. With more advanced time-frequency analysis, the spectral
characteristics of the EMG can reflect motor unit recruitment patterns with specific
posture and timing during locomotion.

29
EMG amplitude
It is well established that the amplitude of the EMG signal is stochastic (random) in
nature and can be reasonably represented by a Gaussian distribution function. The
amplitude of the signal can range from 0 to 10 mV (peak-to-peak) or 0 to 1.5 mV
(rms).
It is generally accepted that EMG intensity provides a reliable estimate of the volume
of recruited muscle, if not necessarily of the developed force. Previous studies
reported a strong correlation between EMG and force in human subjects during static
contractions and across locomotion speeds (Kyrolainen et al., 2005; Yokozawa et al.,
2007). The muscle activity level during wheelchair propulsion is generally quantified
with the root mean square value (RMS) of the EMG signals (Mulroy et al., 1996). In
order to compare the muscle activity between different muscles and subjects, many
researchers use and recommend an EMG normalization (Dubowsky et al., 2009). In
most cases, EMG activity recorded during a test situation is expressed relative to one
previously recorded during a brief (i.e. less than 5 s) isometric maximal voluntary
contraction (Mulroy et al., 1996; Dubowsky et al., 2009) . The RMS is used to
determine the activation timing of the muscle under investigation. In general it is
believed that high frequency components predominantly result from high conduction
velocities (Lindstrom and Magnusson, 1977; Solomonow et al., 1990). However, the
amplitude as such does not indicate whether and to what extent it resulted from high
or low frequency components of the EMG.
EMG timing
Muscle activation timing is generally studied from a representative EMG profile
obtained by averaging various consecutive cycles and by smoothing. Timing to
define when a muscle becomes active is important information when studying human
movements. Timing parameters generally determined from this EMG profile include
signal onset and cessation times that identify the duration of EMG bursts (Mulroy et
al., 1996; Dubowsky et al., 2009). Usually, an EMG threshold value (fixed at 15–25%
of the peak EMG recorded during the cycle) is chosen for onset and cessation
detection. Up to this point, timing measurements had not incorporated spectral
information. Therefore, the onset of muscle activation based on the frequency
components had not been discriminated in classical EMG analysis. However,
wavelet-based analysis was able to show that the onset of higher frequency
components occurred at different joint angles during a cycling movement (von

30
Tscharner, 2000). Therefore, in this dissertation, detecting a kinetic signal for contact
with the pushrim synchronized with EMG measurements permits the display EMG
profiles as a function of time expressed in percentage of the total duration of the
complete cycle with respect to the onset of higher frequency components occurred at
different phase. This would help us to investigate the type of muscle fibres recruited
in specific phases of the wheelchair propulsion.
The use of EMG to estimate the timing of muscle contraction is complicated by
electromechanical delay, the time lag between electrical and mechanical activity of a
muscle (Conforto et al., 2006). This delay in electromechanical coupling has been
stated to be between 30 and 100 ms (Cavanagh and Komi, 1979). Gabaldon et al
(2008) measured the relaxation electromechanical delay (r-EMD) in the turkey lateral
gastrocnemius (LG) over a range of running speed (2 - 4 ms-1) and suggested that
for a given muscle EMG timing variables can be constant over a relatively wide range
of activities (Gabaldon et al., 2008).
EMG frequency and conduction velocity
The usable energy of the EMG signal is limited to the 0 to 500 Hz frequency range,
with the dominant energy being in the 50-150 Hz range. Usable signals are those
with energy above the electrical noise level.
Spectral analyses provide information that is closely associated with the conduction
velocity of the muscle fibers and the shape of the motor unit action potential
(Lindstrom and Magnusson, 1977; Masuda et al., 1999; Gerdle et al., 2000). Spectral
analysis of surface EMG signals has been used to study muscle fatigue (Merletti et
al., 1990) and to infer changes in MU recruitment (Solomonow et al., 1990; Bernardi
et al., 1999; Wakeling, 2009b). Time–frequency analysis has been used to identify
exercise-induced changes in the EMG signal (Bonato et al., 2001; Bonato et al.,
2003), as well as to investigate the type of MUs recruited in specific phases of the
movement (Wakeling, 2004, , 2009a). The rationale for these applications is that
muscle fiber diameter, and hence conduction velocities of MUs, vary systematically
with MU type (Lago and Jones, 1977). High - and low-frequency EMG spectra that
have similar spectral power indicate the activity of faster and slower motor units,
respectively.
EMG spectral characteristics and muscle fibre type

31
Recently, advances in the development and application of signal processing
technology to the study of the electrical signals emitted by active muscle now make it
possible to determine which types of muscle fibre are active during locomotion. The
studies by Wakeling et al. (Wakeling et al., 2002; Wakeling and Syme, 2002) have
shown that the spectral properties of EMG signals generated by the contracting
muscle can be used to distinguish the activity of different types of motor units using a
combination of wavelet decomposition and principal component analysis of the
spectra (Wakeling and Rozitis, 2004). Their results have shown that a mechanical
link exists between the contraction speeds of the muscle fibres and recruitment
patterns of those fibres: in particular it has been demonstrated that the preferential
recruitment of faster muscle fibres occurs with faster muscle strain rates when
pedaling on a stationary bicycle (Wakeling et al., 2006). These exercise regimes
could be used to train the faster fibres with high-speed but low intensity exercise and
this may open up opportunities for preventative as well as rehabilitative therapy for
muscle atrophy. Faster muscle fibre types can atrophy during disease and ageing
and lead to loss of muscle quality and performance. The long-term goal of this
research is to identify specific activities that promote the use and development of
faster fibre types in order to prevent and treat such atrophy.
Muscle fatigue
The repetitive nature of manual wheelchair propulsion places muscles that are more
intensely active at a higher risk of fatigue. Muscular fatigue had been defined as the
‘‘failure to maintain the force output, leading to a reduced performance”(Asmussen,
1979). In this view, fatigue occurs suddenly at the point of task failure, but the
maximal force-generating capacity of muscles starts to decline progressively during
exercise so that fatigue really begins before the muscles fail to performed the
required task (Gandevia, 2001). Hence, a more realistic definition of fatigue is ‘‘any
exercise-induced reduction in the ability to exert muscle force or power, regardless of
whether or not the task can be sustained”(Bigland-Ritchie and Woods, 1984). The
evolution of fatigue may be fast or slow, depending on effort, and will lead sooner or
later to mechanically detectable changes of performance. Many factors that
contribute to this evolution affect the surface EMG (SEMG) signal and can be
detected through it.
Undetected fatigue can cause injury - often irreversible - to wheelchair users. The
long-term use of a wheelchair and its consequences on the musculoskeletal system

32
has become an important issue in manual wheelchair research. The consequences
of fatigue occurring during wheelchair propulsion are of particular concern because
propulsion in and of itself is a demanding activity involving repetitive loading of the
upper extremities through a precarious range of motion (Rodgers et al., 1994). The
ability to measure shoulder muscle fatigue can enhance the understanding of
shoulder muscle function and potentially provide a tool for fatigue assessment and
strength training for wheelchair users.
EMG is a useful and reliable method to evaluate muscle fatigue. Changes during
muscle fatigue have been successfully evaluated by EMG parameters such as
median frequency (MDF), mean power frequency (MPF) and root mean square
(RMS)(Petrofsky and Lind, 1980; Stulen and De Luca, 1982), an example being, a
decrease in frequency and MDF as well as an increase in RMS due to low-force load
on the upper trapezius muscle (Mamaghani et al., 2002).
In the recent past, time-scale methods (wavelet transform) have been used for the
analysis of nonstationary signals. The “wavelet function” is both dilated and
translated in time undertaking a two-dimensional cross correlation with the time
domain SEMG signal. This method can be seen as a mathematical microscope that
provides a tool to detect and characterize a short time component within a
nonstationary signal. It is a technique that provides information related to the time-
frequency variation of the signal. In the past, the authors have successfully used
WTs and neural networks to classify the SEMG for fatigue (Kumar and Pah, 2000). In
this thesis, a wavelet analysis that is well-defined in time and frequency resolution,
with the non-linear scaling adjusted to the physiological response time of the muscle,
was used to decompose non-stationary EMG signals during wheelchair propulsion.
Mechanomyography
When a muscle contracts, the skin surface close to the muscle comes into vibration.
It is believed that it is excited by slow bulk movements of the muscle, vibrations at the
muscle’s eigenfrequency (Barry, 1987; Frangioni et al., 1987) and pressure waves
caused by muscle fibre dimensional changes (Orizio 1993). The muscle contraction
can thereby be detected via this vibration by mounting accelerometers or
microphones on the skin surface. This measurement technique is called
mechanomyography (MMG). The MMG is currently not as widely used as EMG in
ergonomic sciences. Recent studies have shown that MMG may be useful as a
complement to EMG for e.g. detection of the mechanical activity of the muscle and

33
muscle fatigue (Madeleine et al. 2001, 2002). Nevertheless, in terms of detecting MU
firing patterns, EMG so far shows an advantage over MMG owing to the relative
simplicity of mounting electrodes intramuscularly and thereby achieving a high spatial
resolution of the signals.
In contrast to the large body of literature devoted to the investigations of EMG
regarding the muscle activation patterns, few studies have been done on the MMG
as a function of muscle activation. With this in mind, one of the purposes of this
thesis was to investigate the muscle activation pattern during wheelchair propulsion
by using MMG.
The muscles of the body are continually contracting and relaxing. During contraction,
they generate sounds. Under ordinary conditions these sounds are not heard, but if
you place both thumbs in your ears and make a fist, you will hear a low rumble. In
1810, the British physicist, physician and chemist, William Hyde Wollaston,
compared the muscle sounds to the distant rumble of carriages over the cobblestone
streets of London. He calculated the muscle sounds to be about 25 Hz, which is at
the lower limit of human hearing (Barry, 1990). However, the exact origin(s) of the
sound was not clearly understood, and research in the area was limited primarily by
the inability to adequately detect the signal and describe its properties (Beck et al.,
2005c). The advent of electronic sensors (hydrophones, condenser microphones,
piezoelectric contact sensors, and accelerometers) and digital computers in the early
1980s greatly improved the ability to record, quantify, and process the muscle sound
signal (Orizio et al., 2003), and a number of studies were conducted to examine the
characteristics of the sound waves produced by different muscles under a variety of
conditions. Piezoeelectric contact sensors (Orizio et al., 1990; Barry, 1991),
condenser microphones (Bolton et al., 1989; Maton et al., 1990; Stokes and Dalton,
1991b), and accelerometers (Barry, 1992; Orizio et al., 1996) have been widely used
to detect MMG. The detection and measurement of the sound waves has been
referred to variously as accerlerometermyography, muscle sound (Oster and Jaffe,
1980), acoustic myography (Barry et al., 1985), soundmyography (Orizio et al., 1989),
vibromyography (Keidel and Keidel, 1989), and phonomyography (Neri, 1955).
Eventually, the term ‘‘mechanomyography’’ (MMG) was adopted to adequately
describe the mechanical nature of muscle sound and avoid confusion regarding the
transducers used to detect it. Although the waveform of the MMG signal is dependent
on the type of sensor used to detect it (Orizio, 1993), Orizio et al (2003) have
suggested that its pattern is similar to the small oscillations in force that occur during

34
an isometric muscle action (Orizio et al., 2003). However, it has been shown that the
characteristics of MMG signals recorded with microphones and accelerometers have
important differences, which should be taken into account when comparing results
from different studies (Barry, 1992; Beck et al., 2006a).
MMG amplitude
Investigations of MMG muscle sounds have shown that the MMG is useful as a
noninvasive technique to quantify muscle force development in humans (Esposito et
al., 1998; Ebersole et al., 1999; Orizio et al., 1999a). A relationship was observed
between muscle force and MMG amplitude during isometric, eccentric, concentric,
and dynamic contractions. MMG amplitude increased from the 20% to 80% of a
maximum voluntary contraction (MVC) during isometric contractions, but decreased
at higher force level due to the fusion of motor units in biceps brachii (BB) (Orizio et
al., 2003; Nonaka et al., 2006; Ryan et al., 2008). MMG amplitude increases with
force production during concentric and eccentric muscle actions (Evetovich et al.,
1998; Madeleine et al., 2001; Coburn et al., 2004a), as well as with increases in
power output during incremental cycle ergometry (Stout et al., 1997; Housh et al.,
2000; Perry et al., 2001a; Perry et al., 2001c; Perry et al., 2001b). These responses
suggest that MMG may provide information regarding the level of muscle activity that
is required to perform an exercise task (Smith et al., 1998).
MMG frequency and motor units firing rate
Muscles that are composed of a large percentage of fast-twitch fibres typically
demonstrate higher values for MMG mean power frequency (MPF) or peak frequency
than those that consist primarily of slow-twitch fibres (Akataki et al., 2002).Orizio
(1993) suggested that recruitment of fast-twitch muscle fibers with short contraction
times could result in ‘‘. . .shorter MUSS [motor unit sound spikes],’’ that would
increase MMG frequency (Orizio, 1993). In addition, several studies have examined
the power spectra of MMG and suggested the MMG power density spectrum may
contain information regarding the global firing rates and contractile properties of the
unfused activated motor units (Orizio et al., 2003; Beck et al., 2006b; Beck et al.,
2007a). Specifically, increases in the firing rates of individual motor units may result
in an increase in the global motor unit firing rate, thereby resulting in a higher
frequency MMG signal (Akataki et al., 2003). Furthermore, increases in the firing
rates of individual motor units may result in an increase in the global motor unit firing
rate, thereby resulting in a higher frequency MMG signal (Akataki et al., 2003).

35
In contrast to the large body of literature devoted to the investigations of EMG
regarding the muscle activation patterns, few studies have been done on the MMG
as a function of muscle activation. With this in mind, one of the purposes of this
thesis was to investigate the muscle activation pattern during wheelchair propulsion
by using MMG.
Simultaneous recording of sEMG and MMG
Simultaneous recording of sEMG and MMG can be aimed at many different
objectives, such as the analysis of the force – EMG / MMG relationship in isometric,
eccentric and concentric contractions (Dalton and Stokes, 1991; Stokes and Dalton,
1991a; Madeleine et al., 2001); the motor unit recruitment patterns during various
contractions (Esposito et al., 1998; Akataki et al., 2004; Kimura et al., 2004; Beck et
al., 2006b; Coburn et al., 2006), identification of muscle degeneration or abnormal
behaviour (Barry et al., 1990; Orizio et al., 1997; Hu et al., 2007), and muscle fatigue
(Orizio et al., 1999b; Weir et al., 2000; Tarata, 2003; Jaskolski et al., 2007;
Kawczynski et al., 2007).
Traditionally, EMG and MMG signals were analyzed by Fourier-based procedures,
which requires stationary (or at least quasi-stationary) signals in order to extract
meaningful frequency information from the power spectrum (Bonato, 2001). In most
of these applications the signal recording conditions can be controlled quite carefully.
An isometric condition is generally required to avoid motion artefacts, to insure that
the recording is made from a pre-defined portion of the muscle and to guarantee that
the signal remain stationary. An isometric ramp muscle action, on the other hand, is a
single, nonstationary linear increase in force over a short period. Isometric step
muscle actions are performed with discrete, stationary contractions held for 4–6 s at
targeted percentages of the MVC. Akataki et al. (2001) and Orizio et al. (2003) have
suggested that ramp muscle actions may provide higher resolution throughout the
force spectrum, require less time for data acquisition, and reduce the susceptibility to
fatigue.
In dynamic contractions, signal properties may change at a much faster rate because
of rapid recruitment and derecruitment of motor units and changes in joint angle.
Measurement of muscle activation patterns during dynamic concentric and eccentric
contractions is important for understanding the basic mechanisms underlying motor

36
control of limb movement, and is very useful for constructing models of the
neuromuscular control systems (Stein et al., 1995; Rosen et al., 1999).
Wavelet analyses allow the components of a non-stationary signal to be analyzed.
A principal component analysis (PCA) analysis can consider the frequency
components (wavelets) as variables, the analysis creates a set of “principal
frequency components” that indicate those features of frequency components that
best explain the experimental responses. It provides a quantitative method for
identifying changes in the spectral properties.
Therefore, the purpose of studying isometric, eccentric, and concentric contractions
in this dissertatin was to:
1) apply wavelet and principal component analysis to quantify the spectral
properties of the surface EMG and MMG signals from biceps brachii isometric
ramp and step muscle contractions. This allows to compare the recruitment
patterns of ramp contractions with those of step contractions.
2) compare the motor unit recruitment patterns during isometric ramp and step
muscle contractions by using EMG and MMG of the biceps brachii;
3) describe and examine the variations in muscle activation throughout a range
of joint motion during eccentric and concentric contractions against constant
external loadings.
These studies would provide support for the more complex wheelchair propulsion
tasks, which involved isometric, eccentric and concentric contractions.
1.1.4.3 Other technologies used in the study of wheelchair propulsion
In this thesis, the focus was on the shoulder muscle recruitment patterns during
wheelchair propulsion examined by EMG and SmartWheel. However, developments
in computer technology human movement sciences, biology, engineering and
electronics have resulted in the interdisciplinary field of biomechanics, which has
advanced the design and availability of precise and fast measurement technologies
in wheelchair propulsion studies (van der Woude et al., 2006).
Several researchers have recorded shoulder movement patterns during propulsion
for various groups of wheelchair users. Many of the earlier studies presented a two-
dimensional (2D) analysis of shoulder kinematics (Sanderson and Sommer, 1985;
Bednarczyk and Sanderson, 1994), whereas more recently, three-dimensional (3D)
analyses have been performed with axial rotation as a third articulation of the

37
humerus (Rao et al., 1996; Boninger et al., 1998; Davis et al., 1998). These studies
have documented that during the propulsion phase of the cycle, the shoulder exhibits
internal rotation, abduction, and flexion and extension. In addition, movement
patterns vary depending on wheelchair type, level of injury, and speed (Newsam et
al., 1999; Morrow et al., 2003). An investigation by Kulig et al., (1998) which focused
on shoulder joint kinetics and kinematics during the push phase of wheelchair
propulsion, concluded that to determine the true demands on the shoulder during
wheelchair propulsion, the effects of kinematics, kinetics, and EMG need to be
considered together. While there have been multiple studies that compare a
combination of participant kinematics, kinetics, and electromyography, all three
parameters together should be combined in the future study.
Apart from the common use of questionnaires for (in-) activity and lifestyle research,
the use of small computer-based activity sensors has recently allowed research to
enter into activity monitoring as well as into the fields of (Steele et al., 2003; Haeuber
et al., 2004). Accelerometer monitoring of home- and community-based ambulatory
activity during and after rehabilitation allow to study quantity of movement (Walker et
al., 1997; Motl et al., 2006; Maccioni et al., 2007; Giansanti et al., 2008; Harris et al.,
2009), thus opening ways to stimulate and advise on activity and lifestyle. Only few
physical activity questionnaires are available for specific use in rehabilitation
populations (van der Ploeg et al., 2004), while the sensor-based techniques require
elaborate validation and reliability research for different subpopulations in
rehabilitation.
Much work still has to be done to further help improve mobility in both sedentary and
athletic lower-limb disabled individuals, but different elements for a research agenda
on rehabilitation technology and patient-related (experimental and prospective)
research are suggested (van der Woude et al., 2006).
1.2 Research Aims
A physically active lifestyle—including sports—during and after rehabilitation is
becoming an increasingly important issue on the rehabilitation research agenda
(Cooper et al., 1999; Rimmer and Braddock, 2002). Understanding the underlying
mechanisms and processes of adaptation and/or the compensation of function and
functioning is the core of rehabilitation research: ‘To restore function and functionality,
and to stimulate optimal activity and participation’, is the multi-causal and multi-
layered rehabilitation paradigm underlying research(van der Woude et al., 2006).

38
Therefore, to improve rehabilitation protocols and wheelchair propulsion performance
it is of primary importance to have a complete knowledge of the activation pattern of
shoulder muscles during wheelchair propulsion. The overall purpose of this thesis
was to investigate the shoulder muscle recruitment patterns and wheelchair kinetics
over a range of daily activities and mobility tasks requiring manual wheelchair
propulsion. With a complete understanding of the muscle recruitment patterns during
wheelchair propulsion and wheelchair biomechanics, physiotherapists and
wheelchair users can improve wheelchair propulsion skills to prevent shoulder
injuries and maintain comfort during locomotion. This information would also be
useful for developing the strength training and rehabilitation programs for wheelchair
users.
1.2.1 The specific aims
1. Isometric, eccentric and concentric contractions
Hypothesis:
if the observation holds true for humans that higher and lower EMG and
MMG frequencies are generated by faster and slower muscle fibre types it
should be expected that the EMG and MMG signals during a ramp and step
isometric and eccentric-concentric contractions would contain sequentially
higher frequency components as the faster motor units become recruited.
EMG and MMG spetrum may contain different information regarding motor
unit recruitment pattern during isometric, eccentric, and concentric
contractions
2. To investigate how the semicircular propulsion pattern affects muscle recruitment
patterns and wheelchair kinetics compared to a self-selected stroke pattern
during the initial learning stage of wheelchair propulsion.
Hypothesis: a short session of instruction in the proper wheelchair propulsion
technique could result in biomechanically more economical wheelchair propulsion
and a better coordinated muscle recruitment pattern of the shoulder muscles.
3. To investigate the shoulder muscle recruitment patterns from unimpaired
individuals during wheelchair propulsion under various propulsion conditions.
Hypothesis: the motor unit recruitment patterns within individual muscles and
between synergistic muscles would change with different propulsion conditions.

39
4. To investigate the effect of mild fatigue on changes in motor unit recruitment
within individual shoulder muscles and in the coordination of shoulder muscles as
well as in wheelchair kinetics.
Hypothesis: the wavelet analysis combined with principal analysis is sensitive to the
muscle fatigue during fatiging wheelchair propulsion.
1.2.2 Research protocol
1.2.2.1 Recruitment of participants
The study of wheelchair propulsion is complicated by the strong variability in
functionality among the disabled population. Attempts to study muscle activation in
wheelchair users would likely result in large inconsistencies in activation patterns.
To initially overcome the inherent problem of the considerable heterogeneity of
wheelchair users, it seems appropriate to study non-wheelchair users first, since they
will be equally well trained or untrained for all tested conditions and obviously will
physically be quite homogeneous(van der Woude et al., 2001). Although the results
may not be completely transferable to people with SCI (Brown et al., 1990; Kamper
et al., 2000; Hintzy et al., 2002), the recruitment of able-bodied participants is a
useful beginning strategy for further clinical study (de Groot et al., 2003; Roux et al.,
2006). The information that can be gathered from this study is a starting point for
developing a future shoulder muscle recruiment pattern for wheelchair users with
spinal cord injury.
In order to ascertain an appropriate sample size for this thesis a power analysis was
performed. This was based on a study conducted by Kabada et al, in which they
looked at the repeatability of electromyographic data from 10 muscles from both the
upper and lower extremity (Kadaba et al. 1989). The mean coefficient of multiple
correlation (0.8448) and standard deviation (0.0645) were used with an anticipated
effect size of 10% (0.76032). To calculate the sample size the comparison of 2
means formula was utilized, with a power of 90% and a significance level of 5%. This
yielded a value of 12.24 and hence 15 participants will be required for the study.
Inclusion criteria:
Participants will be able-bodied participants.
Approximately equal number of male and females participants will be
recruited
The age-range of the participants will be 18-40 years of age
For this study no attempt is made to represent the demographic composition

40
of specific patients groups for which these techniques might be applied in due
course. If these techniques prove effective in the convenience sample
proposed, a more extensive study will be undertaken to include people with
disabilities and over a representative age range.
Exclusion criteria:
Neuromuscular condition e.g. multiple sclerosis, motor neuron disease
Pre-existing injury or pain during exertion in upper extremities by using PAR-
Q questionnair
Prescribed drugs for neuro-musculoskeletal pain or which have related side-
effects
1.2.2.2 Choice of muscle region
The most common shoulder problem after a spinal cord injury is shoulder bursitis,
also known as impingement syndrome. Neer (1972) described the impingement
syndrome as compromise of the space between the humeral head and the
coracoacromial arch (Neer, 1972). In the classic case, the coracoacromial ligament
and the anterior inferior aspect of the acromion are compressed against the bursal
side of the rotator cuff during forward flexion of the shoulder. There have been many
studies aimed at investigating the shoulder muscles, including the rotator cuff, deltoid,
and scapular muscles.
In the present thesis, shoulder muscle activity was documented with surface EMG on
anterior, middle, and posterior portions of the deltoid (AD, MD, PD), the pectoralis
major (PM), upper trapezius (UT), and long heads of biceps brachii (BB) and triceps
brachii (TB).
The rotator cuff muscles are not located superficially, so surface EMG is not suitable
to detect these muscles. Wired EMG on these muscles is recommended in future
studies.
1.2.2.3 Wheelchair protocol and configuration
A rigid-frame, lightweight wheelchair (Quickie GP, Sunrise Medical, Longmont, CO,
USA) was used through all the propulsion trials. The configuration of the wheelchair
(seat cushion, seat height, and axle position, footrest height) was the same for each
participant. The right side of the test wheelchair was instrumented with a SmartWheel.
The resulting moment signals were synchronized with an EMG / MMG data

41
acquisition system and used to identify the timing of the push and recovery phase of
the propulsion cycle (PC). A custom wheelchair ergometer served as the testing
platform. It consisted of a supporting frame, a data acquisition system and split rollers
that obligated the participant to propel each rear wheel separately. The rear wheels
of the wheelchair were positioned on the ergometer’s rollers while the wheelchair
was secured to the supporting frame of the ergometer (details in Chapter 2). Before
data acquisition, participants were allowed to become familiar with the ergometer by
propelling the test wheelchair for several minutes.
Several studies have indicated that wheelchair configuration has a significant effect
on wheelchair propulsion performance (Morrow et al., 2003; Cowan et al., 2009; Lin
et al., 2009). Cowan’ study (2009) showed that the axle position relative to the
shoulder is associated with significant differences in pushrim biomechanics. Hughes
and associates’ (1992) tested the effect of seat position on wheelchair propulsion
biomechanics. They found that biomechanics changed with seat position (Hughes et
al., 1992). Lin et al (2009) found that users could produce greater propulsive moment
at the position they preferred. Since the participants were inexperienced and able-
bodied in the present studies, these parameters were not controlled. In future studies,
we would recommend testing of individuals with SCI in their own wheelchairs.
Wheelchair user characteristics, such as height and years with SCI, or wheelchair
setup would also be of concern. Kinematics should be involved in future studies to
record the movement of the upper extremity.
1.3 Thesis Structure
This thesis comprises research that addresses each of these specific aims. A general
introduction is presented in Chapter 1. Chapter 2 describes the instruments and
methods. After a methodological explanation of EMG and MMG signal acquisition
and processing, the study shows how shoulder muscle activity patterns respond to
the demands of the different propulsion tasks. The specific aims of this thesis were
addressed in Chapter 3-8, respectively. Chapter 3 applies the combined wavelet and
principal component analysis (PCA) to well-controlled static contractions. Chapter 4
applies the combined wavelet and principal component analysis to well-controlled
dynamic eccentric-concentric contractions. Chapter 5 investigates the muscle
recruitment patterns for different propulsion patterns. Chapter 6 applies combined
wavelet and principal component analysis to 3 conditions of wheelchair propulsion: a
slow speed (0.9 m/s), a fast speed (1.6 m/s) and a ramp (7 meters long, self-selected
speed). Chapter 7 investigates the muscle recruitment patterns at two speeds by

42
using MMG. Chapter 8 examines the changes in surface EMG signals and kinetics
associated with progression of mild fatigue at two speeds. The conclusions,
limitations, and recommendations are summarized in Chapter 9.

43
Chapter Two: Methods and instruments
2.1 Wheelchair ergometer
2.1.1 Ergometer
The ergometer used in this study consists of two independent, tubular steel rollers (diameter: 0.16meter; mass: 32.37kg), one for each wheel (Fig.2.1 and Fig.2.2). Two tachometers were mounted on the frame attached to the rollers. Contact between the roller and tachometer was maintained using a spring-loaded mount and a rubber roller (Fig.2.3).
Figure 2.1. Wheelchair dynamometer with the platform removed to display the rollers and tachometer sensors.
Figure 2.2. Wheelchair with SmartWheel attached to the wheelchair ergometer.

44
Figure 2.3. Roller and tachometer connection.
2.1.2 Visual Speed feedback system
In order to provide visual feedback to allow the person to propel the wheelchair at the
required speed during a wheelchair propulsion test (Fig.2.4), an independent visual
speed feedback system was developed and calibrated.
Figure 2.4. Diagram of the ergometer and wheelchair.
2.1.2.1 Speed Sensors
Tachometer
A D.C. tachometer generator, which converts rotational speed into an isolated analog
voltage signal, used to measure the rollers’ rotation speed (Fig. 2.5).
The wheelchair is propelled by the person sitting in it, who applies manual force to
the wheel. Force is then transmitted by the wheel to the roller it sits on. The roller in
turn imparts force to the wheel mounted on the tachometer shaft. The tachometer,
which thus rotates at the same angular velocity as the wheelchair wheel, generates a

45
voltage in direct proportion to that angular velocity. Wheelchair angular speed is
demonstrated in units of voltage.
Figure 2.5. D.C.Tachometer and tachometer wheel.
The wheelchair is propelled by the person sitting in it, who applies manual force to
the wheel. Force is then transmitted by the wheel to the roller it sits on. The roller in
turn imparts force to the wheel mounted on the tachometer shaft. The tachometer,
which thus rotates at the same angular velocity as the wheelchair wheel, generates a
voltage in direct proportion to that angular velocity. Wheelchair angular speed is
demonstrated in units of voltage.
Magnetic field sensor
To measure linear speed and calibrate the reading of the tachometer voltage output,
two magnetic field sources (magnets) were attached near the rim of the roller
(Fig.2.6), so that the resolution could be counted with a magnetic field sensor. The
magnetic field sensor was mounted on a stationary arm close to the rim of the roller
(Fig. 2.7). As the magnets rotate past the sensor, the occurring electric spikes were
recorded. The distance between two magnets is known, and the travel time between
two magnets was calculated by peak to peak pulse with known a sampling rate. So
the linear speed was calculated by:
V = d / t d is the distance between the two magnets t is the travel time between the two magnets.

46
-0.15
-0.1
-0.05
0
0.05
0.1
0.15
0.002 0.042 0.082 0.122 0.162 0.202 0.242 0.282 0.322
Time (Second)
Vo
lta
ge
(V)
Figure 2.6. Two magnets are attached on surface of the roller. The distance between the two magnets is 10cm (left). A pulse is generated when the magnet is passing by the magnetic field sensor (right).
Figure 2.7. The magnetic field sensor is taped on the bar that is mounted flush against the roller
2.1.2.2 Data acquisition
The output wires of the tachometer and magnetic field sensor were connected to a
12-bit Analog to Digital Converter (PCI ST300, Data translation, UK). The data
acquisition was carried out in LabVIEW (National Instruments). The tachometer and
magnet data were sampled at 500 Hz. The configuration of the program is shown in
Fig.2.8.

47
Figure 2.8. Front panel of LabVIEW program used to record the signals from magnetic field sensor and tachometer. A single ended channel was use, and the sampling rate was 500Hz per channel.
2.1.2.3 Protocol
The deceleration or "coast-down" test was done manually accelerating the roll to a
steady-state speed, and then removing the input while recording the speed as a
function of time as the device decelerates to zero. Therefore, the rollers were
animated up to a high velocity and then the system was allowed to decelerate to a
complete standstill. During this period, the output voltage signal of the tachometer
and the output spike signal of the magnetic field sensor were recorded
simultaneously (Fig.2.9).
-0.2
0
0.2
0.4
0.6
0.8
1
1.2
1.4
1 222 443 664 885 1106 1327 1548 1769 1990 2211 2432 2653 2874 3095 3316 3537 3758 3979
Magnetic field sensor tachometer
Figure 2.9. The output voltage signal of the tachometer and the output spike signal of
the magnetic field sensor were recorded simultaneously.
Once the speed at a certain time had been calculated, we found the corresponding
voltage. A linear regression line was calculated on the speed and voltage values (Fig.
2.10).

48
Because of differences between the right and left side of the system, the roller speed
was recorded separately for right and left. The velocity and voltage were used in
conjunction with a linear regression analysis in order to determine the system
parameters for the visual speed feedback.
So the conversion of voltage and speed was based on:
Y = mx + b m – Scale b – Offset
y = 0.8086x + 0.0175
R2 = 0.9968
0
0.2
0.4
0.6
0.8
1
1.2
1.4
1.6
1.8
2
0 0.5 1 1.5 2 2.5
Voltage(V)
Sp
ee
d(m
/s)
Series1
Linear (Series1)
y = 0.7344x + 0.0313
R2 = 0.9982
0
0.2
0.4
0.6
0.8
1
1.2
0 0.5 1 1.5
Voltage(V)
Sp
ee
d(m
/s)
Series1
Linear (Series1)
Figure 2.10.The regression line of roller speed and tachometer voltage. Left roller (left), Right roller (right)
According to rotational theory, if v represents the linear speed of a rotating object, r
its radius and ω its angular velocity in units of radians per unit of time, then
v = rω
The linear speed of the roller is the same as that of the tachometer wheel. Since the
tachometer shaft is attached directly to the tachometer wheel, it rotates exactly as the
tachometer wheel does: every full revolution of the tachometer wheel means a full
revolution of the shaft. Since the output voltage is proportional to the angular speed
of shaft, there also is a linear relationship between the linear speed of roller and the
output voltage (Table 2.1).
Table 2.1. Rotational-Linear Parallels
Linear motion Rotational motion S Arc length
rg Radius of gyration Position x θ Angular position
Velocity v ω = v/rg Angular velocity
Acceleration a or at (tangential acceleration)
α = at/rg Angular acceleration
Motion equations x = vt θ = ϖt Motion equations

49
v = vo+at ω = ωo+ αt
x = vot + ½at2 θ = ωot + ½αt2
v2 = vo2 + 2ax ω
2 = ωo 2+ 2αθ
Mass (linear inertia)
M I Moment of inertia
Newton’s 2nd law F = ma τ = Iα Newton’s 2nd law
Momentum P = mv L = Iω Angular momentum
Work Fd τθ Work
Kinetic energy ½mv2 ½Iω2 Kinetic energy
Power Fv τω Power
The resulting speed, as recorded by the tachometer and then calibrated by linear
regression analysis, was compared with the speed recorded by the SmartWheel to
ensure the two recording systems matched each other (Fig. 2.11). There was a
close match for both measured speeds.
The coefficients used to calculate the visual speed feedback:
Left roller: V * 0.81 + 0.0175
Right roller: V * 0.76 + 0.0201
V - Voltage recorded by the tachometer.
Speed recored by tachometer
0
0.2
0.4
0.6
0.8
1
1.2
1.4
1.6
1 132 263 394 525 656 787 918 1049 1180 1311 1442 1573 1704 1835 1966 2097
Sp
ee
d(m
/s)
Speed recorded by Smartwhell
-0.2
0
0.2
0.4
0.6
0.8
1
1.2
1.4
1.6
1 349 697 1045 1393 1741 2089 2437 2785 3133 3481 3829 4177 4525 4873 5221 5569
Sp
ee
d (
m/s
)
Figure 2.11. Speed recorded by the tachometer (left) and the SmartWheel (right).
Once the calibration coefficients were determined, A LabVIEW program was coded
for providing the visual speed feedback.

50
Figure 2.12. A monitor with the LabVIEW program was set in front of the wheelchair to provide visual feedback.
Braking force of roller at constant velocity with no added resistance F = ma From roller data Regression of speed m/s vs sample number = 0.0014 Left = 0.7m/s/s Regression of speed m/s vs sample number = 0.0006 Right = 0.30m/s/s F = 32.37 x 0.32 = 9.7N (Right) and 22.7N (Left) Total rolling resistance = 32.4N
2.2 EMG data acquisition system
In the study of muscle physiology, neural control of excitable muscle fibres is
explained on the basis of the action potential mechanism. The electrical model for the
motor action potential reveals how EMG signals provide us with a quantitative,
reliable, and objective means of accessing muscular information. There are several
commercially available EMG data acquisition systems. BagnoliTM is one of the widely
used EMG measurement and data acquisition systems.
In order to eliminate the potentially much greater noise signal from power line
sources and crosstalk, double differential detecting surface electrodes were applied
in the present study (BagnoliTM, Delsys Inc., Boston, MA, USA). The Double
Differential Sensor contains three contacts, each separated by a distance of 10 mm.
The sensor performs a two-stage subtraction: the first stage establishes the voltage
between contact “V1” and contact “V2” as well as the voltage between contact “V2”
and contact “V3” (Fig.2.13). The second stage then performs the subtraction
between these differences.

51
Figure 2.13. DE-3.1 EMG Sensor. The DE-3.1 Double Differential Sensor performs a two stage subtraction: the first stage establishes the differential voltages at the input; the second stage removes those components of the signals that are common. Sourced from BagnoliTM, Delsys Inc., http://www.delsys.com/KnowledgeCenter/FAQ.html
The second differential subtraction will remove those signals which are common to all
sensor contacts while propagating those signals that exhibit potential differences
across the contacts. EMG signals originating from muscles that are not immediately
below the surface of the skin will have a larger latency than those immediately below
the surface. They will appear in a similar pattern in all bars, and will thus be
subtracted from the final sensor measurement (Fig. 2.14).
Figure 2.14. Removing EMG crosstalk: the signals originating from deep muscles, depicted by location "C" disperse as they travel to the skin surface and are detected by all sensor contacts. The signals originating from the fibers immediately below the skin surface (depicted by locations "A" and "B"), are only detected by the contact-pair directly above. The signal components originating from location "C" are common to all bars, and are removed in the double differential subtraction, while those components from locations "A" and "B " are preserved. The figure on the right side demonstrates the effectiveness of the DE-3.1 sensor in removing EMG crosstalk from flexor and extensor activity. Sourced from BagnoliTM, Delsys Inc., http://www.delsys.com/KnowledgeCenter/FAQ.html
2.3 MMG data acquisition system
2.3.1 MMG signal origin
Although the physiological mechanism(s) that generate the MMG signal have not yet
been thoroughly identified, the origins of the MMG signals have been suggested by

52
Barry and Cole (1990) and Orizio (1993) as: (a) the gross lateral movement of the
muscle at the initiation of the muscle action (Fig. 2.15), (b) smaller subsequent lateral
oscillations occurring at the resonant frequency of the muscle, and (c) dimensional
changes of the active fibers (Barry and Cole, 1990; Orizio, 1993). It has been widely
reported in the literature that these dimensional changes in the muscle result in not
only a physical displacement of tissue, but also a mechanical oscillation of the
muscle - tendon - adipose - skin complex with subsequent development of pressure
waves from this oscillation (Orizio et al., 1996; Watakabe et al., 1998; Akataki et al.,
2001; Watakabe et al., 2001; Yoshitake et al., 2002; Cescon et al., 2004b).
Figure 2.15. Schematic representation of the hypothesized MMG generation process (Barry and Cole, 1990).
Muscle contraction produces tension at the tendon level because of changes in
muscle fibre geometry related to sarcomere shortening. The dimensional changes of
several active fibres, depending on the number of recruited motor units (MUs), are
transmitted to the connective tissue leading to macroscopic changes in muscle
thickness or muscle surface displacement (Orizio et al., 2003). It has been
demonstrated that during an electrically-stimulated isometric twitch, isolated frog
gastrocnemius muscle oscillates laterally in directions perpendicular to its long axis
(Barry, 1987; Frangioni et al., 1987). The variations of the longitudinal or transverse
dimensions have been sporadically regarded as a motor response of the muscle. The
follow-up research indicated that the first oscillation was usually the largest in
amplitude, followed by progressively smaller oscillations that occurred at the
resonant frequencies of the muscle.
Orizio et al. recorded the MMG and the force signal simultaneously during voluntary
contraction of biceps brachii. The force output presented ripples which reflect the
bulk movement of the muscle during the sustained effort. Allum et al. (1978) and
Homberg et al. (1986) suggested that the asynchronous activities of the recruited
MUs could be summated in the force ripple and that the main information contained

53
in this signal could be related to the overall firing rate of the MUs (Allum et al., 1978;
Homberg et al., 1986). The asynchronous motor unit activities generate pressure
waves that contribute to the muscle surface oscillations underlying the MMG signal. It
has been indeed demonstrated that the second derivative of the ripple of the force
output compared with the MMG shows overlapping time and frequency domain
properties (Fig.2.16). Therefore, this muscle surface ripple, independently from the
transducer used to detect it, is termed as mechanomyography to reflect its
mechanical origin compare to the electrical origin of electromyography.
The surface MMG is generally considered a ‘‘compound’’ signal that is generated by
many motor units. The mechanical activities of individual motor units are summated
at the skin surface over the muscle detectable as MMG (Orizio et al., 1996). Recent
studies demonstrated that individual motor units can be extracted from the MMG
signal recorded during a voluntary isometric muscle action (Petitjean and Maton,
1995; Cescon et al., 2004a). However, the contribution of each motor unit appears to
be influenced by the degree to which its twitches are fused (Bichler, 2000; Bichler
and Celichowski, 2001; Yoshitake et al., 2002). The fusion of motor units reduces the
muscle fibers’ dimensional changes and the pressure waves towards the muscle
surface, and in turn the muscle surface vibrations. It has been reported that no MMG
signal is observed during a fully fused titanic contraction in rat (Bichler, 2000).
Collectively, these findings have indicated that the MMG signal is generated by the
mechanical activities of the unfused, activated motor units during voluntary muscle
contractions, and, therefore, may contain information regarding motor control
strategies (i.e. relative contributions of recruitment and firing rate) (Beck et al.,
2007a).

54
Figure 2.16. Voluntary isometric effort at 30% MVC. The EMG, force ripple and accelerometer output. These signals can be considered as the outcomes of the unfused mechanical activities of the recruited motor units.
2.3.2 Selection of MMG transducers
Piezoeelectric contact sensors (Orizio et al., 1990; Barry, 1991), condenser
microphones (Bolton et al., 1989; Maton et al., 1990; Stokes and Dalton, 1991b), and
accelerometers (Barry, 1992; Orizio et al., 1996) have been widely used to detect
MMG. Condenser microphones acting as displacement meters are more often
applied, but they require a coupling, for example, air or gel between the muscle and
the microphone. The volume of the air chamber influences the amplitude and the
frequency content of the recorded MMG signal (Watakabe et al., 2001).
Accelerometers reflect the acceleration of body surface vibration, but measurement
is complicated by the movement artifacts during dynamic contractions (Watakabe et
al., 1998). Recently, laser displacement sensors have also been used, since they
make it possible to study muscle dimensional changes without additional inertial load
(Orizio et al., 2000; Orizio et al., 2008).
As acknowledged by Orizio (1993), the most important characteristic of the sensor is
its frequency response (Orizio, 1993). Specifically, Orizio recommended that the
"...low frequency cut-off has to be around 1 to 2 Hz," and "the upper cut-off has to be
chosen so that the greater part of the power is well below 100 Hz." Another
important characteristic is the mass of the sensor. Previous studies have indicated

55
that lightweight sensors might be more appropriate for detecting surface MMG. The
light mass (12.5g) of the piezoelectric contact sensor used in the present studies has
provided reliable signals. Several researcher recommended that when the contact
pressure sensor is used to detect the MMG signal, the contact pressure must remain
constant across trails (Bolton et al., 1989; Smith et al., 1997). In the present studies,
a medical bandage was used to ensure consistent contact pressure. Furthermore,
the MMG data have been normalized to allow for comparisons between different
subjects.
Piezo-electric transducers (Fig. 2.17) (23mm diameter, 12.5g weight, frequency
range 2-2kHz, GRASS technologies, Rhode Island, USA,) were used in the present
studies to measure the pressure waves generated during muscle contractions. A
custom-built piezoelectric sensor signal conditioner was developed for signal
detecting and collecting.
Figure 2.17. A Piezoelectric transducer
2.3.3 Piezoelectric sensor signal conditioner
Piezo is from the Greek word piezein, meaning to press or squeeze. Piezoelectricity
refers to the generation of electricity or of electric polarity in dielectric crystals
subjected to mechanical stress and conversely, the generation of stress in such
crystals subjected to an applied voltage. The basic theory behind piezoelectricity is
based on the electrical dipole. At the molecular level, the structure of a piezoelectric
material is typically an ionic bonded crystal. At rest, the dipoles formed by the
positive and negative ions cancel each other due to the symmetry of the crystal
structure, and an electric field is not seen. When stressed, the crystal deforms,
symmetry is lost, and a net dipole moment is created. The dipole moment causes an
electric field to be formed across the crystal. In this manner, the materials generate
an electrical charge that is proportional to the pressure applied.
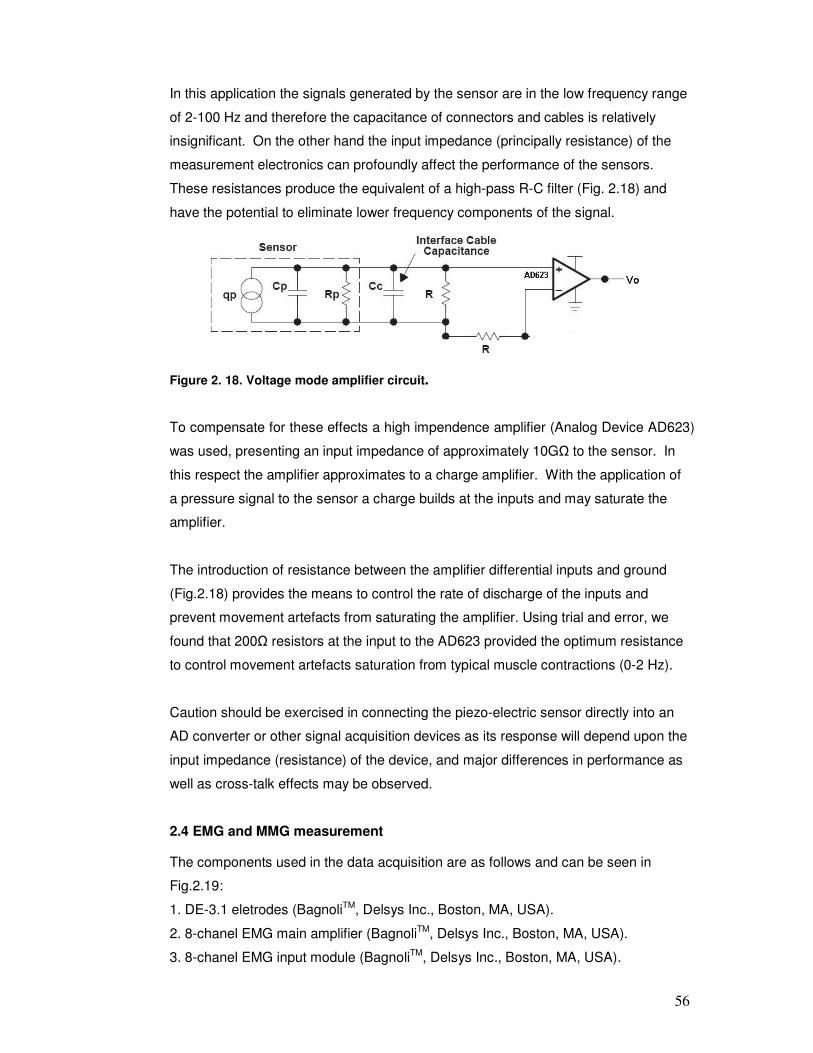
56
In this application the signals generated by the sensor are in the low frequency range
of 2-100 Hz and therefore the capacitance of connectors and cables is relatively
insignificant. On the other hand the input impedance (principally resistance) of the
measurement electronics can profoundly affect the performance of the sensors.
These resistances produce the equivalent of a high-pass R-C filter (Fig. 2.18) and
have the potential to eliminate lower frequency components of the signal.
Figure 2. 18. Voltage mode amplifier circuit.
To compensate for these effects a high impendence amplifier (Analog Device AD623)
was used, presenting an input impedance of approximately 10GΩ to the sensor. In
this respect the amplifier approximates to a charge amplifier. With the application of
a pressure signal to the sensor a charge builds at the inputs and may saturate the
amplifier.
The introduction of resistance between the amplifier differential inputs and ground
(Fig.2.18) provides the means to control the rate of discharge of the inputs and
prevent movement artefacts from saturating the amplifier. Using trial and error, we
found that 200Ω resistors at the input to the AD623 provided the optimum resistance
to control movement artefacts saturation from typical muscle contractions (0-2 Hz).
Caution should be exercised in connecting the piezo-electric sensor directly into an
AD converter or other signal acquisition devices as its response will depend upon the
input impedance (resistance) of the device, and major differences in performance as
well as cross-talk effects may be observed.
2.4 EMG and MMG measurement
The components used in the data acquisition are as follows and can be seen in
Fig.2.19:
1. DE-3.1 eletrodes (BagnoliTM, Delsys Inc., Boston, MA, USA).
2. 8-chanel EMG main amplifier (BagnoliTM, Delsys Inc., Boston, MA, USA).
3. 8-chanel EMG input module (BagnoliTM, Delsys Inc., Boston, MA, USA).

57
4. Input module cable (7.5m long, BagnoliTM, Delsys Inc., Boston, MA, USA)
5. Piezoelectric transducers (GRASS technologies, Rhode Island, USA))
6. 4-channel MMG input module (custom built)
7. Piezoelectric sensor signal conditioner (custom built, details in [Piezoelectric
sensor signal conditioner]
8. BNC Connection box (NI, type BNC-2111)
9. BNC Connecting cables
10. MMG extension cable (7.5m long)
The EMG signal was amplified by an EMG amplifier (Gain 1000), low-pass filtered
(20-500Hz), and sampled with a sampling frequency of 2000 Hz. While the MMG was
amplified by custom-built MMG signal conditioner (Gain 1), and sampled at 2000Hz.
A computer with a NI PCI-6221E 12-bit data acquisition card was use for data
acquisition.
Figure 2.19. Main equipments for EMG and MMG measurement.
In order to collect 16 channels of simultaneous EMGs and MMGs and view them in
real time, a customized labVIEW data acquisition program was designed (Fig.2.20).
This program enabled the continuous recording and visual inspection of each trial
during testing sessions.

58
Figure 2.20. Screen dump of measurement program. Channels 1 - 4 were used to collect MMG data, Channel 5-12 were used to collect EMG data.
2.5 Signal processing
Methods for processing EMG and MMG using time and frequency domain analysis
have been established (De Luca, 1993; Orizio et al., 2003). Both time and frequency
domain approaches (and a combination of the two) have been attempted in the past.
Fourier transform (FFT) and short time Fourier transform (STFT) provide the SEMG
spectrum and information related to muscle fatigue status, size of motor units,
synchronous activity between motor units, and rate of stimulation of the muscle. The
nondeterministic, nonstationary nature of the SEMG and MMG signals provides a
challenge to the consideration of optimized transform domain signal processing. The
STFT, with relatively short time windows can attempt to track spectral variations in
time but it does not adopt an optimal time or frequency resolution for the
nonstationary signal. In addition, the time frequency domain resolution tradeoff of a
window is constrained by the Heisenberg uncertainty principle.
Root mean squared (RMS) values are generally used in the time-domain, while
Fourier-based procedures can be used for determining the frequency characteristics
of EMG and MMG signals (Beck et al., 2005b). The Fourier transform is a powerful
tool for processing stationary signals that are made up of some combination of sine
and cosine signals. One of the limitations of this method is that the signal is assumed
to be continuous with constant amplitude; therefore when these assumptions are not
met there may be errors in the calculation of the frequency content. The Fourier
transform is orthogonal, such that information is either contained in the frequency or

59
the time domain, therefore, when the signal is transformed into frequency domain,
the time information is lost.
The wavelet theory is a relatively recent mathematical development. Its application is
a potentially promising and exciting area of research. Wavelet decomposition
provides separation of time and frequency components. Successively higher-
frequency wavelets span successively smaller portions of the datastream, thus
enabling variable amplification of a particular frequency band along the temporal axis.
The wavelet's time-frequency resolution capability enables analysis of even very
short, nonconstant signals, and is able to resolve discontinuities, spikes, or signals
which vary in time-frequency content.
In the present thesis, the intensity analysis of wavelets was similar but not equal to
the multiresolution wavelet analysis. The wavelets were defined in frequency space,
and wavelets in time space were obtained applying the inverse Fourier transform.
The wavelets were functions of the frequency defined by the parameters, center
frequency fc and scale. The characteristics of Wavelets analysis (von Tscharner,
2000; Beck et al., 2008):
1. Time-resolution was adjusted to a range appropriate to the time period of
events in the EMG and MMG signals.
2. The signal intensity calculated as a function of time closely approximated the
power of the signal within a given frequency band.
3. A Gauss filter with a width sufficiently large to eliminate oscillations presented
in the processing methods but small enough not to alter significantly the time-
resolution used for further filtering.
4. A compromise between time- and frequency-resolution was adopted by using
a fine-tuning with a damping factor
The intensity analysis involved three steps: 1) computing the wavelet-transformed
EMG signal using a filter bank of wavelets that include the intensity and damping
factors, 2) computing the intensity of the wavelet-transformed signal by adding its
square and the square of its time derivative divided by the fc, and 3) applying a
Gaussian filter to the wavelet-transformed signal. These wavelet analysis steps were
presented in detail previously (von Tscharner, 2000; Wakeling et al., 2001; Wakeling
et al., 2002; Beck et al., 2008).
Custom programs (Mathematica 6.0, Wolfram Research, Inc., Champaign, IL, USA)
were written for time-frequency analysis of the EMG and MMG signals to resolve
60
signal intensity into time and frequency space simultaneously. The wavelets were
characterized by their center frequency (frequency where the power spectrum of the
wavelet was maximal), the bandwidth of the filter (the width of the power spectrum of
the wavelet at 1/e of its maximum) and the time resolution (the time of the wavelet’s
intensity to decay to 1/e) (Table 3.1). For EMG signals, a filter bank of 16 non-linearly
scaled wavelets was used, index by k, with center frequency, fc, ranging from 7 Hz
(wavelet 0) to 804 Hz (wavelet 15). For MMG signals, a set of 10 nonlinearly scaled
wavelets were used with center frequency, fc, ranging from 1.7Hz (wavelet 0) to 83Hz
(wavelet 9).
PCA is a powerful statistical method which may reduce the dimensionality of a large
data set to a smaller more manageable form, leading to a better understanding of the
data and drawing attention to important features in the data (Ramsay and Silverman,
1997). A PCA analysis can consider the frequency components (wavelets) as
variables, the analysis creates a set of “principal frequency components” that indicate
those features of frequency components that best explain the experimental
responses. It provides a quantitative method for identifying changes in the spectral
properties. It can generate new hypotheses regarding the relationships between the
variables and identify some variables as being redundant because they contribute
little information, such as movement artifacts. PCA also identifies relationships
between the variables which may help to understand the problem being investigated.
Wavelet techniques combined with principal component analysis has been
successfully applied in a number of studies using of surface EMG collected in
humans during ramp contractions of leg muscles (Wakeling and Rozitis, 2004;
Wakeling et al., 2006), running (Wakeling, 2004), and walking(Wakeling et al., 2007).
Principal component analysis (PCA) followed the techniques previously
reported(Wakeling and Rozitis, 2004). The data set consists of a p x N matrix. Where
p = wavelet domains and N =participants*trials. A PCA was carried out on this
dataset matrix using the customized written program in Mathematica. The principal
components (PCs) were calculated from the covariance matrix of the dataset matrix
with no prior subtraction of the mean data. So The PCs describe the components of
the entire signal (Wakeling and Rozitis, 2004). The first principal component (PCI)
accounts for as much of the variation in the original data as possible. Subsequent
components are derived in decreasing order of importance: the second (PCII)
accounts for as much of the remaining variation as possible and so on for the other
components.

61
The principal component weighting is given by the eigenvector, and can be displayed
graphically as a function of the centre frequencies of the corresponding wavelets.
The principal component loading score is given by the eigenvalue, and is a scalar
value that describes the amount of each eigenvector in each measured spectrum
(Hodson-Tole and Wakeling, 2007). Each spectrum can be reconstructed by a linear
combination of the principal component weightings and their loading scores, and the
relative PCI and PCII loading scores give a measure of the frequency of the signal
(Wakeling and Rozitis, 2004). PCI loading scores provide a good measure of the
signal intensity. The results reported here show that PCI loading scores were highly
correlated with the total intensity of EMG and MMG spectra and explained the
majority of the signal in EMG and MMG. In the present thesis, θ is defined as the
angle between PCI and PCII loading scores. It has been shown that the θ is very
sensitive to the frequency shift that corresponds to spectral difference between types
of MUs in both fine wire (Hodson-Tole and Wakeling, 2007) and surface EMG
(Wakeling, 2004; Wakeling and Rozitis, 2004; Wakeling et al., 2006). It has been
shown that a higher value of θ represents relatively more low frequency signal
content and it can be associated with the recruitment of slower MUs (Wakeling,
2009b). A smaller θ value, associated with relatively more high frequency content,
can be associated with the recruitment of faster MUs.

62
Chapter Three: Spectral properties of Electromyographic and Mechanographic signals during isometric ramp and
step contractions in biceps brachii
3.1 Introduction
Surface mechanomyography (MMG), the recording at the skin surface of the
pressure waves from low frequency oscillations generated by active skeletal muscle
fibers (Orizio, 1993; Orizio et al., 2003), is generally considered to be the
“mechanical counterpart” of motor unit electrical activity measured by the surface
electromyogram (EMG)(Barry and Cole, 1990; Orizio et al., 1999b). MMG has been
used to study the mechanical activity of a contracting muscle, and the time and
frequency domain parameters of the MMG reflect motor unit recruitment and firing
rates, respectively (Orizio et al., 2003; Beck et al., 2005c; Beck et al., 2007a).
Simultaneous measurements of MMG and EMG have been used to characterize the
motor unit recruitment strategies that modulate muscle force production (Madeleine
et al., 2001; Beck et al., 2005b, , 2006b; Shima et al., 2007). Methods for processing
EMG and MMG using time and frequency domain analysis have been established
(De Luca, 1993; Orizio et al., 2003). Root mean squared values are generally used
in the time-domain, while Fourier-based procedures can be used for determining the
frequency characteristics of EMG and MMG signals (Beck et al., 2005b). The
success of these techniques for extracting features during step isometric contractions
provided initial insight into motor unit (MU) recruitment strategy and firing
rate(Matheson et al., 1997; Ebersole et al., 1999; Madeleine et al., 2001; Coburn et
al., 2004b). More recently, “ramp” isometric contractions have been utilized to
investigate motor unit recruitment patterns by gradually increasing force over several
seconds(Akataki et al., 2001, , 2003; Orizio et al., 2003; Akataki et al., 2004; Ryan et
al., 2008). It has been suggested that ramp isometric contractions may follow the
influence of motor unit recruitment strategies better than step contractions and are
less affected by fatigue. However, it has been suggested that EMG and MMG signals
analyzed with a Fourier transform must remain stationary in the time and frequency
domains in order to extract meaningful frequency information from the power
spectrum(Bonato, 2001). Therefore, recent studies have used time-frequency
methods, such as the wavelet transform to examine the frequency properties of non-
stationary EMG and MMG signals from isometric ramp contractions (Karlsson and
Gerdle, 2001; Beck et al., 2005b). Wavelet transformation allows the representation
of general functions in terms of simple blocks at different frequencies and times. In

63
this study, a wavelet analysis that is well-defined in time and frequency resolution,
with the non-linear scaling adjusted to physiological response time of the muscle,
was used to decompose non-stationary EMG and MMG signals from isometric ramp
and step contractions (von Tscharner, 2000). Principal component analysis (PCA) is
a powerful technique that can identify changes in spectral properties (Ramsay and
Silverman, 1997). A PCA analysis can consider the frequency components (wavelets)
as variables, the analysis creates a set of “principal frequency components” that
indicate those features of frequency components that best explain the experimental
responses. It provides a quantitative method for identifying changes in the spectral
properties. Wavelet techniques combined with principal component analysis has
been successfully applied in a number of studies using of surface EMG collected in
humans during ramp contractions of leg muscles(Wakeling and Rozitis, 2004;
Wakeling et al., 2006), running(Wakeling, 2004), and walking(Wakeling et al., 2007).
However, to our knowledge, no previous studies have applied wavelet and principal
component analysis to both ramp and step isometric contractions by using EMG and
MMG simultaneously in biceps brachii. Therefore, the purpose of the present study
was to: 1) apply wavelet and principal component analysis to quantify the spectral
properties of the surface EMG and MMG signals from biceps brachii isometric ramp
and step muscle contractions when it can be assumed that different motor units have
been recruited; 2) compare the motor unit recruitment patterns during isometric ramp
and step muscle contractions by using EMG and MMG of the biceps brachii.
3.2 Materials and Methods
3.2.1 Participants
20 healthy participants (10 males and 10 females with a mean age of 34 ± 10.7) with
no history of any neuromuscular disorder gave informed written consent to participate
in the experiments. The protocol and consent procedures were approved by the
Royal National Orthopedic Hospital NHS Research Ethics Committee (Stanmore,
UK).
3.2.2 Protocol
The participant sat in a chair with the non-dominant arm prepared for measurement.
Before the test, several practice trials were performed so that the participant could
become familiarized with the test procedure, particularly how to maintain the force
level. A mechanical support was developed for the upper limb. This support was
designed to be highly adjustable so that it could be correctly fitted to the dimensions

64
of each subject relative to the right shoulder articulation, when keeping 60 degree
abduction (Fig. 3.1), and the forearm was parallel to the ground. Wrist force was
measured with a force transducer (Model LCCB-1K, OMEGA Engineering, Stamford,
CT, USA) and connected to a laptop computer(Dell Latitude D505, Dell Computers,
Round Rock, USA) via a USB A/D converter sampling at 5kHz using VEE Pro
(Version 6.0, Agilent Technologies, Santa Clara, California, USA). A graphical
visualization of the force signal was provided to the participant as real-time feedback
during the isometric contractions.
Figure 3.1. Isometric MVC test setup. Electromyographic (EMG) and mechanomyographic (MMG) sensor were placed in the middle line of biceps brachii. A bandage was used to ensure constant pressure of the sensors over the muscle.
Following warm-up, participants were asked to maintain maximal effort of isometric
elbow flexion for approximately 3s. Force signals obtained at 100% MVC were used
to normalize the contraction levels. Five different isometric contraction levels in 20%
increments starting in order from 0% to 80% of the MVC level were performed with
an elbow angle of 150° (signals at 0% MVC were used to monitor the EMG and MMG
measurement baseline). Each contraction level was held for 10 s and repeated 3
times. The display generated to provide visual force feedback was marked at
deflection levels corresponding to 80%, 60%, 40%, 20% MVC. 3 minutes of rest was
given between contractions of different force levels. For the ramp isometric
contractions, the participants were asked to gradually increase the force from zero to
maximum (using visual feedback) over 4-s period. Force was expressed as %
maximum voluntary contractions (MVC).

65
Bipolar electromyographic signals (SEMG) (12mm diameter, 18mm inter-electrode
distance, Medical Grade Stainless Steel, Motion Lab Systems, Inc., Los Angeles,
USA) and a piezoelectric transducer (23mm diameter, 12.5g weight, GRASS
technologies, Rhode Island, USA) were recorded on biceps brachii. These two
sensors were as close to the midline and centre of the muscle belly whilst
maintaining zero contact between the two electrodes. Sensors were fixed with
Micropore tape (3M, St Paul, Minnesota, USA), a bandage was used to ensure
consistant contact pressure on sensor.
The raw EMG and MMG signals were amplified using a custom-built instrument
(Department of Medical Physics and Bioengineering, UCL, London, UK) and sampled
at 5 KHz. The EMG, MMG, and force signals were recorded simultaneously with a
12 bit USB analogue to digital converter (DT9002, Data Translation, Malboro,
Massachusetts, USA) during each isometric contraction. For signal recording and
participant feedback, VEE Pro software (Version 6.0, Agilent Technologies, Santa
Clara, California, USA) was used. All data analyses were performed off-line.
3.2.3 Signal processing
3.2.3.1 Wavelet analysis of EMG and MMG signals
All signal processing was performed using custom programs written in Mathematica
(version 6.0, Wolfram Inc., Champaign, IL, USA). The EMG and MMG signals were
resolved into their intensities in time-frequency space using wavelet techniques (von
Tscharner, 2000; Beck et al., 2008). The wavelets were characterized by their center
frequency (frequency where the power spectrum of the wavelet was maximal), the
bandwidth of the filter (the width of the power spectrum of the wavelet at 1/e of its
maximum) and the time resolution (the time of the wavelet’s intensity to decay to 1/e)
(Table 3.1)(von Tscharner, 2002). The method has been described in detail in
previous papers (Wakeling and Syme, 2002; Wakeling and Rozitis, 2004). The
intensity is a close approximation to the power of the signal contained within a given
frequency band, and the intensity spectrum is equivalent to the power spectrum from
the signals. For EMG signals, a filter bank of 16 non-linearly scaled wavelets was
used, index by k, with center frequency, fc, ranging from 7 Hz (wavelet 0) to 804 Hz
(wavelet 15). For MMG signals, a set of 10 nonlinearly scaled wavelets were used
with center frequency, fc, ranging from 1.7Hz (wavelet 0) to 83Hz (wavelet 9). The
mean frequency (MF) was calculated by:

66
∑
∑=
k
k
k
k
c
i
ikf
MF
)(
Total intensity was given by summing the intensities over the selected wavelets.
Total intensity is a measure of the time-varying power within the signal and is
equivalent to twice the square of the root-mean-square. MF and total intensity were
calculated across the frequency band (EMG: 10-350 Hz, k = 1-9; MMG: 3-90Hz, k =
1-9). For step isometric contractions, the total intensity and MF were calculated for a
4-s time period with visual inspection to assure the signal was measured at the stable
and desired force level. For the ramp isometric contractions, for each trial, the
intensity spectra for each sample point were pooled into bins according to the force
level: 0-10, 10-20, 20-30, 30-40, 40-50, 50-60, 60-70, 70-80, 80-90, 90-100% MVC.
The mean intensity for each participant for the 80% step isometric contraction trials
was calculated and used to normalize the spectra for the respective participants (Fig.
3.2).
Table 3.1. Characteristics of the wavelets used for the EMG and MMG wavelet analysis.
(EMG: scale = 0.3, q = 1.45 and r = 1.959; MMG: scale = 1.2, q = 1.45 and r = 1.959)
Wavelet index (k)
Center frequency (Hz)
Time resolution (ms)
Bandwidth(Hz) Product of bandwidth and
time resolution EMG MMG EMG MMG EMG MMG EMG MMG
0 7 2 76 299 10 3 0.75 0.90 1 19 5 59 196 16 4 0.92 0.88 2 38 9 40 171 21 6 0.87 1.11 3 62 16 32 129 27 8 0.86 1.10 4 92 23 26 102 35 10 0.91 1.04 5 128 32 22 86 41 13 0.88 1.03 6 170 43 20 80 47 14 0.91 1.10 7 218 54 16 69 53 16 0.87 1.08 8 271 68 15 60 58 18 0.88 1.08 9 330 83 14 58 66 20 1.90 1.14
3.2.3.2 Principal component analysis
Principal component analysis (PCA) followed the techniques previously
reported(Wakeling and Rozitis, 2004). The data set consists of a p x N matrix. Where
p = wavelet domains and N =participants*trials* *force bins. A PCA was carried out
on this dataset matrix using the customized written program in Mathematica. The
principal components (PCs) were calculated from the covariance matrix of the
dataset matrix with no prior subtraction of the mean data. So The PCs describe the
components of the entire signal(Wakeling and Rozitis, 2004). The first principal
component (PCI) accounts for as much of the variation in the original data as
possible. Subsequent components are derived in decreasing order of importance: the

67
second (PCII) accounts for as much of the remaining variation as possible and so on
for the other components.
The principal component weighting is given by the eigenvector, and can be displayed
graphically as a function of the centre frequencies of the corresponding wavelets (Fig.
3.5, Fig.3.7). The principal component loading score is given by the eigenvalue, and
is a scalar value that describes the amount of each eigenvector in each measured
spectrum (Hodson-Tole and Wakeling, 2007). Each spectrum can be reconstructed
by a linear combination of the principal component weightings and their loading
scores, and the relative PCI and PCII loading scores give a measure of the frequency
of the signal(Wakeling and Rozitis, 2004).
3.2.4 Statistics
Previous studies have examined the relationship between EMG and MMG amplitude
and mean frequency vs. %MVC during ramp and step contractions by using
regression analysis. In the this study, a combination of regression analysis and
analysis of variance (ANOVA), analysis of covariance (ANCOVA) was used to
determine the differences in contraction type from EMG and MMG signals in terms of
total intensity, MF, PCI and PCII loading scores.
Differences between contraction type (ramp or step) for total intensity, MF, PCI, and
PCII were tested using general linear model analysis of covariance (ANCOVA) for
EMG and MMG, respectively, with % MVC as covariates (20%, 40%, 60%, and 80%
MVC were selected from ramp contractions to match the respective step
contractions). Ramp–step was the fixed factor and total intensity, MF, PCI, and PCII
were the dependent variables. The relationship between total intensity and PCI
loading score was analyzed using partial correlation analysis. SPSS software
version 16 (SPSS inc., Chicago, IL, USA) was used for all statistical analyses. All
data are presented as mean ± standard error of the mean (S.E.M) unless otherwise
stated. An alpha level of 0.05 was considered statistically significant for all tests.
3.3 Results
3.3.1 EMG
The EMG activity showed a qualitative increase during isometric ramp contractions.
Time-frequency analysis showed a progressive increase in the high frequency
components of EMG intensity with the increases in force (Fig. 3.2D)

68
Figure 3.2. An example of the Force (A), electromyographic (EMG) (B), and mechanomyographic (MMG) (C) signals from the biceps brachii during an isometric ramp contraction for 1 participant. Time-frequency analysis of EMG (D) and MMG (E) showed the progressive increases in the high frequency components of the intensities with increases in force (mean values of each force level from 20 subjects). Increasing intensities are shown by darker regions
The ANCOVA analysis showed that EMG total intensity, which was calculated across
the power spectra from 19Hz to 395Hz (Fig.3.3A), increased linearly for both ramp
and step contractions(r2=0.336, r2 =0.658, respectively ) with increased force level.
The ANCOVA also showed the EMG total intensity was not significantly different
between ramp and step contractions.

69
0
0.5
1
1.5
2
2.5
0 10 20 30 40 50 60 70 80 90 100
Force (%MVC)
EM
G tota
l in
tensity
ramp
step
60
65
70
75
80
85
0 10 20 30 40 50 60 70 80 90 100
Force (% MVC)
EM
G M
F (
Hz)
ramp
step
Figure 3.3. (A)EMG total intensity vs. force (%MVC) for ramp (solid line) and step (grey dotted line) contraction for Biceps brachii. (B) EMG Mean frequency vs. force (%MVC) for ramp (solid line) and step (grey dotted line) contraction for Biceps brachii. Values are mean±S.E.M
Fig.3.3B shows the EMGMF vs. force (%MVC) for ramp and step contractions. The
EMGMF for ramp contraction increased rapidly from 0 to 40% and plateaued from
40% to 50% and then increased from 50% to 70% and decreased and plateaued
from 70% to 90%. The EMGMF for step contraction slightly increased from 20% to
40% and increased from 40% to 60% and then decreased from 60% to 80%. The
ANCOVA analysis showed that there was no significant difference of the EMG MF
between ramp and step isometric contraction.
3.3.2 MMG
Time-frequency analysis showed a graded increase in high frequency components of
MMG intensity with the increased force (Fig.3.2E). MMG intensity spectra from each
force level (% MVC) of the step (Fig.3.4A) and ramp (Fig. 3.4B) contractions are
shown in Fig.3.4. The MMG total intensity for the step contraction increased from
A
B

70
20% to 60% MVC and decreased from 60 to 80% MVC. The MMG total intensity for
the ramp contraction increased from 0% to 60% and then decreased from 60% to
90% (Fig.3.4A). The ANCOVA analysis showed that MMG total intensity was not
significantly different between ramp and step contractions.
0
0.2
0.4
0.6
0.8
1
1.2
1.4
0 10 20 30 40 50 60 70 80 90 100
Force (% MVC)
MM
G to
tal in
ten
sity
step
ramp
0
5
10
15
20
25
0 10 20 30 40 50 60 70 80 90 100
Force (% MVC)
MM
G M
F(H
z)
step
ramp
Figure 3.4. (A)MMG Total intensity vs. force (%MVC) for ramp (solid line) and step (grey dotted line) contraction for the biceps brachii. (B) Mean frequency vs. force (%MVC) for ramp (solid line) and step (grey dotted line) contraction for Biceps brachii. Values are mean±S.E.M.
The MMG MF for step contraction increased with the increased force from
13.75±0.75Hz (20%MVC) to 16.14±0 .57Hz (80%MVC), whereas the mean
frequency for ramp contractions increased rapidly from 10.70±0.42Hz to
21.00±1.02Hz over the 3-s ramp contraction (Fig. 3.4B). The ANCOVA analysis
showed there was a significant difference in the MMG mean frequency between
ramp and step contractions (P<0.001).
B
A

71
3.3.3 PCA analysis
The principal component analysis showed that over 95% of the spectral properties of
the EMG could be explained by the first two principal components (PCs). The first
principal component was positive for all frequencies with a similar form to the power
spectrum. The second principal component contained negative weightings and
positive weightings, which transitioned at approximately 70Hz (Fig. 3.5). The partial
correlation analysis shows that the principal component scores of the first component
(PCI) are highly correlated with the total intensity (r2=0.945) by controlling the force
level.
-0.4
-0.2
0
0.2
0.4
0.6
0.8
1
0 50 100 150 200 250 300 350
Frequency (Hz)
Pri
ncip
al co
mp
on
en
t w
eig
htin
g
PC I 91.96% signal
PC II 4.64% signal
Figure 3.5. Principal Component weightings from the EMG power spectra for the first two principal components (PC) with the relative proportion of the total signal that they describe.
Each force level was characterized by PCI and PCII loading scores. One was along
the PCI loading score and another along the PCII loading score. This provides a map
of how the force levels relate to each other. The ramp and step contractions showed
similar patterns, with increases in the scores for the higher levels of contraction. PC
loading scores from the same force level ramp and step contraction were located
closely together which shows the similarity in the intensity spectra (Fig. 3.6).
ANCOVA showed significant increases in the PCI and PCII scores as the force level
increased during ramp and step contractions, and there was no significant difference
in PCI and PCI loading scores between ramp and step contraction.

72
90
80
70
6050
403020
10
0
80S
60S
40S
20S0
0.2
0.4
0.6
0.8
1
1.2
-0.02 0 0.02 0.04 0.06 0.08 0.1 0.12 0.14 0.16
PCII loading score
PC
I loadin
g s
core
Figure 3.6. Principal component loading scores from the EMG intensity spectra for the isometric ramp (open diamonds) and step (solid circles) contractions. The points
denote the mean±±±±S.E.M. scores for each force level for biceps brachii. The numbers
denote the % MVC.
The principal component analysis showed that over 84% of the spectral properties of
the MMG could be explained by the first two principal components (PCs). The PCI
weighting was similar in form to an MMG power spectrum, with positive weighting for
all the frequencies. The PCII weightings had negative and positive regions with a
cross over about 14Hz (Fig. 3.7).
-0.6
-0.4
-0.2
0
0.2
0.4
0.6
0.8
0 10 20 30 40 50 60 70 80 90
Frequency (Hz)Princip
al c
om
ponent w
eig
htin
g
PC I 73.19% signal
PC II 11.32% signal
Figure 3.7. Principal component weightings from the MMG power spectra for the first two principal components (PC) with the relative proportion of the total signal that they describe.
The changes in the MMG can be visualized by their PC loading scores during ramp
and step isometric contraction (Fig. 3.8). The PCI loading score progressively

73
increased with the higher levels of contraction from 0% to 60% MVC and then
decreased from 60% to 90% MVC, its trend being similar to that of MMG total
intensity. A correlation analysis showed a strong correlation (r2=0.919) between PCI
and the total intensity. The PCII loading score increased from 20% to 40%MVC, with
negative scores from 0% to 40% and positive scores from 50% to 90%. As for the
step contraction, the PCI loading scores increased from 20% to 60% MVC and then
decreased at 80% MVC, while PCII loading scores were stable from 20% to 60% and
then increased rapidly from 60% to 80% MVC. The ANCOVA analysis showed there
was a significant difference in the MMG PCI loading scores between ramp and step
contractions (P=0.032), while PCII loading scores were not significantly different
between ramp and step contractions.
8090
7050
60
0
2010
3040
20S
40S
60S
80S
-0.1
0.1
0.3
0.5
0.7
-0.1 -0.05 0 0.05 0.1 0.15
PC II loading score
PC
I lo
ad
ing s
core
Figure 3.8. Principal Component loading scores from the MMG intensity spectra for the isometric ramp (open diamonds) and step (solid circles) contractions. The points denote the mean ±S.E.M. scores for each force level for biceps brachii. The numbers denote the % MVC.
3.4 Discussion
3.4.1 EMG time-frequency response during isometric ramp and step muscle contractions
EMG time-frequency response during isometric ramp and step muscle contractions
It is known that the motor unit(MU) activation pattern of the biceps brachii during
increasing isometric force production recruits motor units up to 80% MVC(Orizio et al.,
2003). The slow motor units in biceps brachii are mostly recruited below 25% MVC,
then a rapid recruitment of the fast motor units occurs up to 60%-80% MVC, and
increasing firing rate of active motor units is generally thought to be responsible for
an increase in force beyond this point (Orizio et al., 2003; Ryan et al., 2008).

74
The total intensity values of the EMG are influenced by motor unit recruitment and
firing rate of the active motor units. The intensity increases progressively from low
levels of contraction up to 90% MVC (Fig. 3.3A). The value of the mean frequency is
strongly influenced by the number and the shape (amplitude and duration) of the
single motor unit action potentials (MUAP) (De Luca, 1985; Orizio et al., 2003).
Action potentials of the faster motor units have higher conduction velocities(CV)
(Kakuda et al., 1992; Kupa et al., 1995; Wakeling and Syme, 2002) and would
contribute higher frequency components within the EMG signal. The results show
progressively higher frequencies appearing in the EMG intensity spectra (Fig.3.2D),
which correspond to the progressively faster motor units recruited from low level to
MVC. The EMG mean frequency increased from low levels up to 60% MVC during
both ramp and step muscle contractions, then plateaued and decreased at higher
force levels during the step and ramp muscle contractions (Fig. 3.3B). It should be
noted that there was a rapid increase in the low frequency components (50-100Hz)
for the EMG intensity spectra (Fig. 3.2D) from 60% MVC to 90% MVC, which caused
a local decrease of the mean frequency. The lower frequency components that
appeared in the EMG intensity spectrum from 60% MVC might be associated with
the contribution of newly recruited deep, large, and high CV motor units, which were
attenuated by the low-pass filter effect of body skin and subcutaneous
tissues(Lindstrom and Magnusson, 1977). Another possible explanation for the larger
contribution of low frequency components at higher force levels is the higher firing
rate of the active motor units. At high force levels motor unit firing is more in-phase
and they motor units are more synchronized with each other (Solomonow et al., 1990;
Hermens et al., 1992), hence a decrease in the number of independent impulses and
increase the superposition of action potentials (Yao et al., 2000).
There is abundant literature on the use of surface EMG to examine motor unit
recruitment(De Luca et al., 1982b, 1982a; De Luca, 1985; Solomonow et al., 1990;
Akataki et al., 2004; Wakeling et al., 2006). EMG time-frequency parameters,
amplitude and mean and/or median frequency (MF) are commonly used variables to
investigate motor unit recruitment patterns during isometric contraction with
increasing force. But the results have been often contradictory. Different studies
report that the mean or median frequency increases (Gerdle et al., 1991; Gerdle and
Karlsson, 1994), remains stable(Farina et al., 2002; Coburn et al., 2005) or
decreases(Komi and Vitasalo, 1976; Masuda et al., 1999) with increasing force. The
variation among studies may be due to differences in fiber composition and size,
75
muscle specific relationships (Akasaka et al., 1997), and the techniques to detect
changes in MF (Beck et al., 2005a). Higher values of the median or mean power
frequency of the EMG power spectrum are observed for muscles with a greater
percentage of faster fibers (Solomonow et al., 1990; Wakeling, 2009b) or a greater
relative area of faster fibers. On the other hand, some studies indicate that the MU
activation strategy varies among different muscles in relation to their morphology and
histochemical type (De Luca et al., 1982a; Akasaka et al., 1997; Akataki et al., 2003).
Smaller muscles rely primarily on firing rate and larger muscles rely primarily on
recruitment to modulate their force (De Luca, 1985). For instance, the deltoid
muscles are known to recruit motor units throughout the entire force range while the
firing rate of the active units is continuously increasing (De Luca et al., 1982b, 1982a).
This control strategy should yield a continuous MF increase throughout the force
generation phase. In recent studies, wavelet techniques have been used, which allow
a more detailed analysis and better resolution of the EMG MF changes during
isometric contractions. And the results suggested that the inconsistencies may
associated with the technique used to detect changes in mean frequency (Karlsson
and Gerdle, 2001).
3.4.2 MMG time-frequency response during isometric ramp and step muscle contractions
MMG total intensity increased with increased force to 60% MVC and then decreased
at higher force levels for the biceps brachii during both ramp and step isometric
contractions. These findings are consistent with those of previous studies that have
examined the MMG amplitude during step and ramp isometric contractions for the
biceps brachii(Orizio et al., 2003). Some studies have suggested that fast fibers
produce greater MMG and a higher frequency than slow fibers (Beck et al., 2007b).
Consequently, fast motor unit recruitment causes an increase in the MMG total
intensity and MF between 30 and 60% MVC (Fig.3.4A, Fig. 3.4B). The decrease in
total intensity from 70% to 90% MVC with higher firing rate may be due to fusion of
the MU mechanical activity (Bichler and Celichowski, 2001; Yoshitake et al., 2002;
Orizio et al., 2003; Kimura et al., 2004). As all available motor units are recruited
(near 60–80% MVC), increases in the firing rate are responsible for further increases
in force production. The higher motor unit firing rates may result in a progressive
fusion of motor unit twitches that would increase muscle stiffness and reduce
dimensional change in active muscle fibers. On the other hand, MMG mean
frequency increased from low force levels to high force levels, which may be
associated with an increasing firing rate through the entire force range(Orizio et al.,

76
2003; Akataki et al., 2004; Beck et al., 2006b). MMG intensity spectra showed a
progressive increase of higher frequency components with increased %MVC, which
was attributed to the increased recruitment of motor units and increased firing rates
(Fig. 3.2E). A high intensity contour for low frequencies (5-12Hz) appeared near 60-
70% MVC indicating fusion of motor unit twitches at high firing rates (Fig. 3.2E).
The relationship between MMG amplitude and force level during isometric
contraction has been reported. The results are varied. Some authors report that
MMG amplitude increases with increasing MVC(Stokes and Dalton, 1991a; Coburn
et al., 2004b), while others show that MMG amplitude increases to 50–80% MVC
followed by a plateau or decrease at higher force levels (Matheson et al., 1997;
Orizio et al., 2003; Beck et al., 2004a). For the relationship between MMG mean
frequency and force level, some studies show that the mean frequency increased
linearly when the motor units were orderly recruited (Coburn et al., 2004b; Coburn et
al., 2004a), while others observed mean frequency increases to 60% MVC and is
then followed by a steeper increase at higher forces (Akataki et al., 2001, , 2003;
Orizio et al., 2003; Beck et al., 2004a). The discrepancy may have the same reasons
as those proposed for EMG responses, such as muscle composition (Mealing et al.,
1996), the signal processing techniques used(Beck et al., 2005b), and different motor
unit recruitment strategies(Akataki et al., 2003). Moreover, muscle stiffness and/or
intramuscular fluid pressure could impair the lateral muscle fiber oscillations that
generate the MMG signal(Orizio, 1993; Beck et al., 2004a; Coburn et al., 2004b).
Some authors have also suggested that inter- and intra-subject differences in muscle
morphology may contribute some degree of variability (Ryan et al., 2007).
3.4.3 Principal component analysis of EMG and MMG spectra
The present study showed that the principal components PCI and PCII may be used
to quantify features of muscle activity with increasing force.
It has been shown that the electrical properties of the sarcolemma vary between fast
and slow fiber types within mammals(Luff and Atwood, 1972), and it has been
suggested that faster fibers have faster conduction velocities and hence generate
higher EMG frequencies (Gerdle et al., 1988; Wakeling and Syme, 2002). Studies
have shown that distinct EMG frequency bands can characterize activity from
different types of muscle fibers across a range of species and recording
systems(Wakeling et al., 2002; Wakeling and Syme, 2002; Wakeling and Rozitis,

77
2004). High and low frequency components in the EMG spectra indicate the activity
of faster and slower motor units, respectively(Wakeling et al., 2001; Wakeling, 2004).
The MMG is the summation of the activity of signal motor units. Each motor unit is
related to the pressure waves generated by the active muscle fibers(Orizio et al.,
2003). Orizio suggested that recruitment of fast fibers with short contraction time
could result in “shorter motor unit sound spikes”, which would increase MMG
frequency(Orizio, 1993). Studies recorded MMG from human muscles with known
fiber composition showed that muscles with a large proportion of slow fibers generate
MMG signals which contain an increased percentage of low frequencies as
compared to muscles with a mixed population of fast and slow fibers(Mealing et al.,
1996; Akataki et al., 2003).
For EMG, PCI had a similar form to the EMG power spectrum. PCI loading scores
increased as the force level increased during both the step and ramp isometric
contractions. This shows that as the muscle activation was progressively increased
then increases occurred in the fundamental spectra intensity.
The EMG PCII scores were positive for all force levels, which indicate that the mean
frequency was greater than the transition frequency (Fig.3.5). The PCII scores
increased with increased force level from 0% to 70%. Increases in the positive
frequency bands (greater than 90Hz) of the PCII weighting are reflected in a increase
of PCII loading scores, whereas PCII loading scores decreased from 80% to 90%
MVC, indicating a more rapid increase of the negative frequency bands (less than
90Hz). The frequency shift at higher force level may be attributed to the
synchronization of the motor units because of higher firing rate(Solomonow et al.,
1990) (Fig. 3.6).
For MMG, PCI took a similar shape to the power spectrum and its scores were highly
correlated with the total intensity. MMG PCI scores increased with the force level
from 20% to 60% MVC, and then decreased with higher MU firing rates, due to the
fusion of the MU mechanical activity at higher force levels. PCII had negative and
positive weightings for MMG (Fig. 3.7). The PCII loading scores for lower force levels
were negative, and the associated mean frequencies were lower than 14Hz, which
corresponded to the transition between the negative and positive PCII weightings
(Fig. 3.8). This indicates a proportionally higher amount of low frequency content in

78
the power spectrum at lower force levels. The positive PCII loading scores at higher
force levels indicate a higher distribution of high frequency content.
In this study we applied principal component analysis to identify and quantify
differences in frequency spectra associated with motor unit recruitment patterns
during isometric ramp and step muscle contractions. PCI loading scores have been
shown to correlate with total signal intensity and provide a good measure of EMG
and MMG activity, while PCII loading scores relative to PCI loading score provide a
measure of the relative frequency content within the signal (Wakeling and Rozitis,
2004; Hodson-Tole and Wakeling, 2007). The higher values of PCII are associated
with relatively higher frequency signal components and low values associated with
relatively more low frequency components. The advantage of PCA is that the most
significant, systematic sources of variation are condensed into the first few scores,
while the noise components are relegated to lower scores. So the movement
artifacts(De Luca, 1997), anatomical variations in the soft-tissues, and individual
physiological variation can be separated from the first two PCs. Therefore, the main
PCs contain a significant proportion of the spectra without being skewed by
confounding effects. By contrast, the mean frequency considers all portions of the
spectrum and so the main spectral features will be partly obscured by measurement
noise and physiological variations(Wakeling, 2009b). Additionally, mean frequency
dose not offer a sensitive measure of motor unit recruitment(Farina et al., 2002). It
can be due to an increase of the mean frequency could be caused by an increase in
the number of faster motor unit or may result from de-recruitment of a number of
faster motor units(Hodson-Tole and Wakeling, 2007).
3.4.4 Ramp vs. step muscle contractions
In the present study, the EMG total intensity, mean frequency, PCI and PCII loading
scores show no significant difference between isometric ramp and step contractions.
PC loading scores from the same force level ramp and step contractions were
located together, representing similarities in EMG spectra.
ANOVA analysis shows a significant difference in MMG PCI loading scores and the
mean frequency between isometric ramp and step contractions. The mean values of
PCI loading scores and mean frequency were greater for the ramp than step muscle
actions across the force levels. These findings suggest that motor unit firing rates
may have been higher during the ramp than the step muscle actions.

79
It has been suggested that ramp and step muscle contractions may require different
motor control strategies(De Luca et al., 1982b; De Luca, 1985; Beck et al., 2004a), in
particular, that firing rates generated during linearly increasing isometric contractions
differ from those produced at increasing levels of static force (De Luca et al., 1982a).
It is known that the majority of the power in the surface EMG spectrum lie beyond the
motor unit firing rate range. Under certain conditions analysis of MU firing statistics
show that the dominant firing rate of the MU's can be recognized by a distinct
maximum in the 10-40 Hz frequency range(Van Boxtel and Schomaker, 1983, ,
1984). So the surface EMG time frequency parameters, RMS and mean or median
frequency calculated from EMG power spectra are hardly sensitive to the variation of
firing rate in stimulated and experimental studies(Zhou and Rymer, 2004). In this
study, the PCII loading scores decreased at high force levels, which is caused by the
rapid increase in the contribution of low frequency components, and may be
associated with the increasing MU firing rate. However, we were unable to directly
detect firing rate changes associated with increasing force by using surface EMG in
this study.
Many studies have suggested that the MMG spectrum contains some information
regarding motor unit firing rates(Orizio et al., 2003; Beck et al., 2007a). It has been
proposed that the surface MMG spectrum reflects the global motor unit firing
frequency, rather than the firing rates of a particular group of motor units (Beck et al.,
2007a). The increase in firing rate needed to obtain more force when recruitment had
been completed was shown by decreased PCI loading scores because of the
progressive fusion of muscle twitches, and thereby reduced dimensional change in
active muscle fibers. Meanwhile the increased PCII loading scores indicated a higher
percentage of higher frequency components in the MMG spectra. This may be
associated with the higher initial firing rates of fast motor units (Hannerz, 1974), and
fast motor units may require greater stimulation rates to achieve complete fusion of
motor unit twitches than slow motor units(Bichler and Celichowski, 2001; Beck et al.,
2007a).
3.5 Conclusion
In this study, we applied wavelet analysis coupled with principal component analysis
to determine motor unit recruitment patterns during isometric ramp and step
contractions. Wavelet and principal component analysis offers a quantitative
measure of the contribution of high and low frequency content within the EMG and

80
MMG. Furthermore, the results of this study indicate that EMG total intensity, mean
frequency, PCI and PCIl loading scores from isometric ramp muscle contractions
were not significantly different from isometric step contractions. However, there were
significant differences in MMG mean frequency and PCI loading scores between
ramp and step contractions. MMG spectrum may reflect global motor units firing rate,
which may be related to the different motor unit recruitment strategies applied to
isometric ramp and step contractions in biceps brachii.
The size principle was supported in the isometric contractions in this study. The next
chapter tested this hypothesis in the dynamic eccentric-concentric contractions.

81
Chapter Four: Spectral properties of electromyographic and mechanographic signals during dynamic concentric
and eccentric contractions of biceps brachii muscle
4.1 Introduction
Contraction of skeletal muscle produces low-frequency lateral oscillations of muscle
fibers which can be detected by accelerometers, piezoelectric transducers and
microphones on the surface of the skin (Orizio, 1993; Orizio et al., 2003). This
mechanical oscillation, regardless of which type of transducer is used to detect it,
was termed as surface mechanomyography (MMG) to reflect its mechanical origin
(Orizio et al., 2003). Gordon and Holbourn (1948) suggested that MMG reflect the
mechanical counterpart of the motor unit (MU) electrical activity as measured by
electromyography (EMG) (Gordon and A.H.S., 1948). Simultaneous measurements
of MMG and EMG have been used to examine the force-amplitude relationship and
MU recruitment strategies during ramp and step isometric muscle actions and
concentric and eccentric muscle actions (Dalton and Stokes, 1991; Orizio et al., 2003;
Akataki et al., 2004). During dynamic contractions, the number of active MUs
changes rapidly, which would imply non-stationary spectra. Wavelet analysis with
well-defined time and frequency resolution has been shown to provide a highly
sensitive method of assessing non-stationary EMG and MMG data (Wakeling and
Rozitis, 2004; Hodson-Tole and Wakeling, 2007; Beck et al., 2008).
MUs are recruited in an orderly fashion from slow to fast MUs. Starting with the
smallest MUs, progressively larger units are recruited with increasing strength of
muscle contraction (Mendell, 2005). This size principle was described first by
Hennenman in 1965 (Henneman and Olson, 1965; Henneman et al., 1965a, 1965b)
and it has been shown to be valid in isometric and stimulated contractions
(Henneman et al., 1965a, 1965b). However, selective recruitment of fast MUs during
voluntary isotonic eccentric muscle actions has been reported (Nardone and
Schieppati, 1988; Nardone et al., 1989). More recently, electromyographic studies of
humans running (Wakeling, 2004) and cycling (Wakeling et al., 2006) and running
rats (Hodson-Tole and Wakeling, 2008a, 2008b) have also reported preferential
recruitment of faster MUs. An understanding of which fiber types are activated during
a movement is important due to marked differences in the performance capability
and the adaptability of the different fiber types (Bottinelli and Reggiani, 2000; Pette,
2002).

82
According to the length-tension relationship, the maximum isometric tension
generated by muscle occurs at its resting length when there is optimal overlap of
actin and myosin (Gordon et al., 1966). However, Muscle forces constantly change at
different joint angles throughout the range of motion which results in a torque curve
(Knapik et al., 1983). Within a joints range of motion there is an optimal angle at
which the muscle moment will be greatest (Kawakami et al., 1994; Ettema et al.,
1998; Mohamed et al., 2002).Measurement of muscle activation patterns during
dynamic concentric and eccentric contractions is important for understanding the
basic mechanisms underlying motor control of limb movement, and is very useful for
constructing models of the neuromuscular control systems(Stein et al., 1995; Rosen
et al., 1999).
Therefore, in the present study, we compared the recruitment patterns of MUs in
biceps brachii (BB) during submaximal dynamic concentric and eccentric
contractions by using surface EMG, MMG, and a combination of wavelet analysis
and principal component analysis (PCA) of the EMG and MMG spectra. The purpose
was to describe and examine the variations in muscle activation through a range of
joint motion during eccentric and concentric contractions against constant external
loadings.
4.2 Materials and Methods
4.2.1 Participants
12 participants (6 males and 6 females with a mean age of 30 ± 8.5) with no history
of any neuromuscular disorder gave informed written consent to participate in the
experiments. The protocol and consent procedures were approved by the Royal
National Orthopedic Hospital NHS Research Ethics Committee (Stanmore, UK).
4.2.2 Protocol
The participant sat in a chair with the non-dominant upper limb supported by a
mechanical device. This support was designed to be highly adjustable to enable it to
be correctly fitted to the dimensions of each participant relative to the right shoulder
articulation, when keeping 60 degree abduction (Fig.4.1) and the forearm was in a
neural position. Before the test several practice trials were performed so that the
participant could become familiarized with the test procedure. The elbow angle was
measured with electrogoniometer (clinical goniometer fitted with a rotary optical
encoder, ENA1J-B28-L00128, Bourns, Inc., Riverside, CA, USA). The elbow angle

83
signal was provided to the participant as a real-time feedback during the concentric
and eccentric contractions.
Figure 4.1. A eccentric-concentric contraction test. An electronic goniometry was attached at the fulcrum to measure elbow joint position. A bandage was used to ensure consistent pressure of the contact sensor.
Figure 4.2. An example of the angle (A), mechanomyographic (MMG) (B), and electromyographic(EMG) (C) signals from the biceps brachii during concentric and eccentric contracions for 1 participant.
Maximal voluntary contraction (MVC) was defined as the maximal loading the
participant could overcome while moving through the range of motion. Each dynamic
contraction began at 150° elbow flexion and involved a 3-s concentric contraction
from 150° to 60° (muscle shortening), followed by a 3-s eccentric contraction from
60° to 150° (muscle lengthening)(Fig.4.2). Participants performed a set of three
concentric-eccentric contractions at each loading: 20%, 40%, 60%, and 80%
maximal concentric load at 30° /s. 3 minutes of rest was given between contractions
of different loading. One session of 80% maximum isometric contraction performed at
elbow angle of 150° was recorded to normalize the EMG and MMG signals.
Electronic goniometer

84
Surface electromyographic signals (SEMG) (Bipolar electrode, 12mm diameter,
18mm inter-electrode distance, Medical Grade Stainless Steel, Motion Lab Systems,
Inc., Los Angeles, USA) and mechanomographic signals (piezoelectric transducer,
23mm diameter, 12.5g weight, GRASS technologies, Rhode Island, USA) were
recorded on biceps brachi (BB). These two sensors were as close to the midline and
centre of the muscle belly whilst maintaining zero contact between the two electrodes
(Fig.4.3). Sensors were fixed with Micropore tape (3M, St Paul, Minnesota, USA), a
bandage was used to ensure consistent pressure of the contact sensor. The EMG
and MMG signals were amplified (custom built EMG amplifier: Department of Medical
Physics and Bioengineering, UCL, London, UK) and sampled at 5 KHz. The EMG,
MMG, and goniometry signals were recorded simultaneously with a 12 bit USB
analogue to digital converter (DT9002, Data Translation, Malboro, Massachusetts,
USA) during each concentric and eccentric contraction. For signal recording and
visualizing signals for participant feedback, VEE Pro software (Version 6.0, Agilent
Technologies, Santa Clara, California, USA) was used. All data analyses were
performed off-line.
4.2.3 Signal processing
The EMG and MMG signals were resolved into their intensities in time-frequency
space using wavelet techniques (von Tscharner, 2000). Please see details in
Chapter 3.
The range of motion 60-150° was partitioned into nine 10° sections (145°, 135°, 125°,
115°, 105°, 95°, 85°, 75°, 65°), based on the electric goniometry data. The mean
spectra of EMG and MMG were then calculated for each section. The mean intensity
of the signals for each participant at 80% sustained isometric contraction trials was
calculated and used to normalize the spectra for the respective participant. The first
wavelet of MMG covered a frequency band of 0-3 Hz, which is typically associated
with movement artifacts. We reduced the effects of movement and muscle
dimensional changes due to dynamic contractions by removing first wavelet from
spectra. So the final analysis considered the total frequency band of 3 – 90Hz.
4.2.4 Principal component analysis
Principal component analysis (PCA) employed the techniques previously reported by
Wakeling and Rozitis (Wakeling and Rozitis, 2004) The data set consists of a p x N
matrix. Where p = 9 wavelet domain (the first wavelet may contain movement

85
artifacts, so did not calculated) and N =2608 (subjects*trials*contraction types*elbow
angle bins). A PCA was carried out on this matrix using the customized written
programs in Mathematica. The principal components (PCs) were calculated from the
covariance matrix of the dataset matrix with no prior subtraction of the mean data, so
the PCs describe the components of the entire signal (Wakeling and Rozitis, 2004).
The first principal component accounts for as much of the variation in the original
data as possible. Subsequent components are derived in decreasing order of
importance: the second accounts for as much of the remaining variation as possible
and so on for the other components.
The principal component weighting is given by the eigenvector, and can be displayed
graphically as a function of the centre frequencies of the corresponding wavelets.
The principal component loading score is given by the eigenvalue, and is a scalar
value that describes the amount of each eigenvector in each measured
spectrum(Hodson-Tole and Wakeling, 2007). Each spectrum can be reconstructed
by a linear combination of the principal component weightings and their loading
scores. PCI loading scores have been shown to correlate with total signal intensity,
while PCII loading scores relative to PCI loading scores provide a measure of the
relative frequency content within the signal (Wakeling and Rozitis, 2004; Hodson-
Tole and Wakeling, 2007). A quantitative measure of the contribution of high and low
frequency content within the signal is thus given by the angle θ formed between the
PCI and PCII loading scores (Wakeling, 2004; Wakeling and Rozitis, 2004; Hodson-
Tole and Wakeling, 2007). Large angles of θ represent a relatively large low
frequency signal component, while small angles of θ represent a relatively large high
frequency signal component.
4.2.5 Statistics
Differences in EMG and MMG total intensity, PCI (PCIEMG and PCIMMG), PCII (PCIIEMG
and PCIIMMG), and θ (θEMG and θMMG) for different loads, elbow angles, and
contraction types were analyzed using general linear model ANOVA in SPSS (SPSS
version 16, SPSS Inc. Chicago, USA). Loads, elbow angles, and contraction types
were defined as fixed factors. The relationship between total intensity and PC I
loading score was analyzed using partial correlation analysis, the elbow angles,
contraction type, and loads were controlled. Multiple comparisons between elbow
angles (N=10) and loads (N=4) were made according to Bonferroni’s method with a
significance level of P<0.05. Mean values are presented as mean ± standard error of
sample mean (S.E.M)

86
4.3 Results
4.3.1 Changes in EMG and MMG intensity at different elbow angles
The results indicated that EMG total intensity varied with elbow angles during both
concentric and eccentric contractions. Fig. 4.3 compares the total intensity for
concentric (Fig.4.3A) and eccentric (Fig.4.3B) contractions at different elbow angles
and different intensities. Total intensity increased with increased elbow angle except
in the largest one (145°) for both concentric and eccentric contractions and for the
different loads conditions. The smaller elbow angles (65°, 75°, 85°, 95°, flexed
position) had significantly lower total intensity values than the larger elbow angles
(115°, 125°, 135°,145° extended position) (GLM ANOVA: p<0.001; Bonferroni post
hoc: p<0.001 both cases). There was no significant change in θEMG at different elbow
angles (Fig.4 .4).
0
0.2
0.4
0.6
0.8
1
1.2
1.4
65 75 85 95 105 115 125 135 145
Elbow angles (degree)
EM
G tota
l in
tensity
20% MVC 40% MVC 60% MVC 80% MVC
0
0.1
0.2
0.3
0.4
65 75 85 95 105 115 125 135 145
Elbow angles (Degree)
EM
G tota
l in
tensity
20 40 60 80
Figure 4.3. (A)EMG total intensity vs elbow angle at different loadings for concentric contractions for biceps brachii. (B) EMG total intensity vs elbow angle at different loadings for eccentric contractions for biceps brachii. Values are mean±S.E.M
A
B
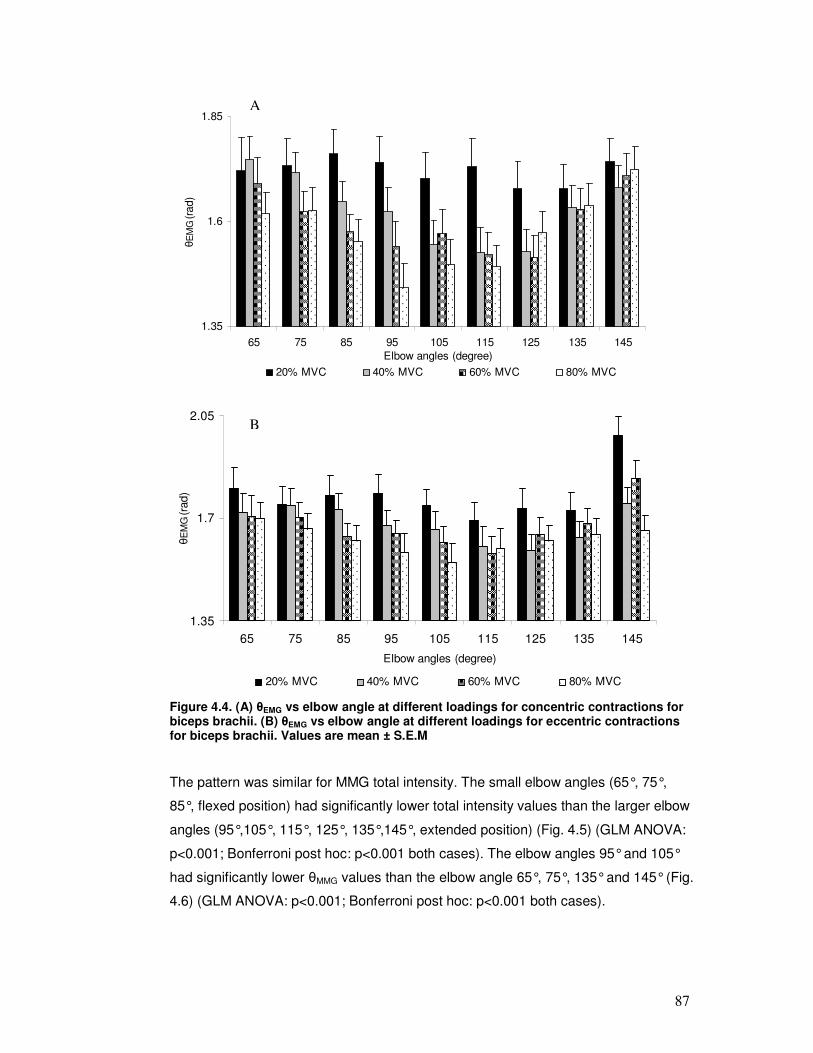
87
1.35
1.6
1.85
65 75 85 95 105 115 125 135 145
Elbow angles (degree)
θE
MG (
rad)
20% MVC 40% MVC 60% MVC 80% MVC
1.35
1.7
2.05
65 75 85 95 105 115 125 135 145
Elbow angles (degree)
θE
MG (
rad)
20% MVC 40% MVC 60% MVC 80% MVC
Figure 4.4. (A) θEMG vs elbow angle at different loadings for concentric contractions for biceps brachii. (B) θEMG vs elbow angle at different loadings for eccentric contractions for biceps brachii. Values are mean ± S.E.M
The pattern was similar for MMG total intensity. The small elbow angles (65°, 75°,
85°, flexed position) had significantly lower total intensity values than the larger elbow
angles (95°,105°, 115°, 125°, 135°,145°, extended position) (Fig. 4.5) (GLM ANOVA:
p<0.001; Bonferroni post hoc: p<0.001 both cases). The elbow angles 95° and 105°
had significantly lower θMMG values than the elbow angle 65°, 75°, 135° and 145° (Fig.
4.6) (GLM ANOVA: p<0.001; Bonferroni post hoc: p<0.001 both cases).
B
A
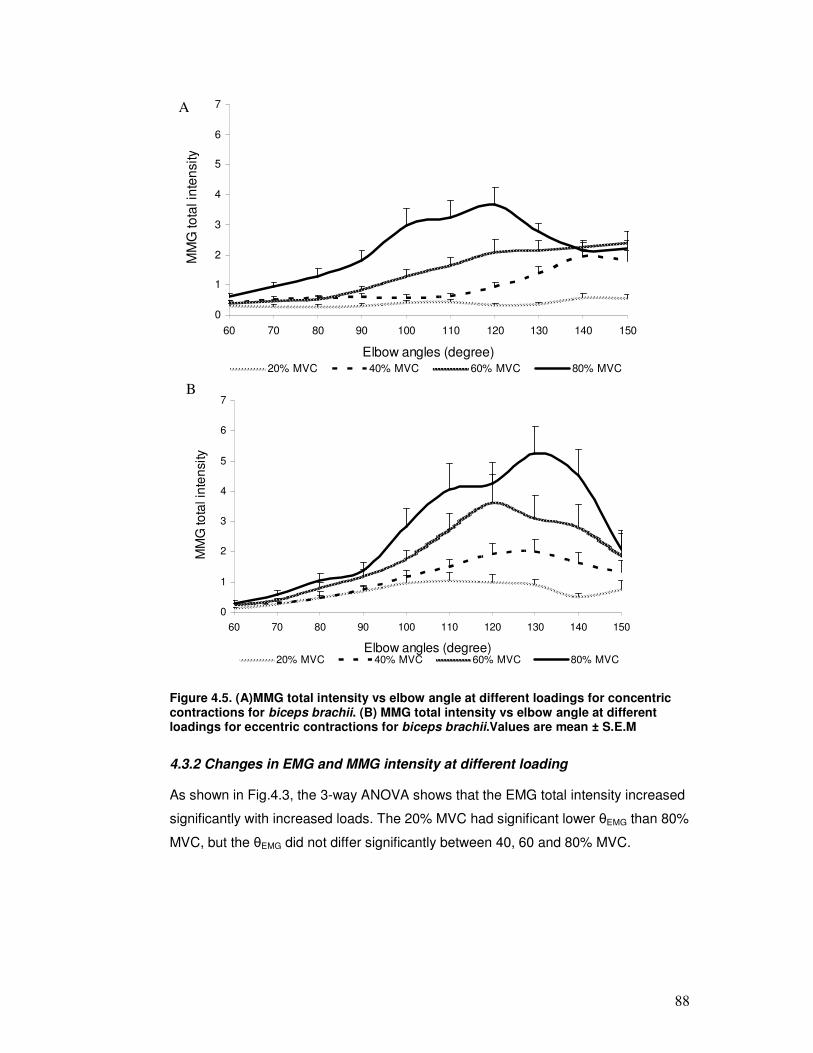
88
0
1
2
3
4
5
6
7
60 70 80 90 100 110 120 130 140 150
Elbow angles (degree)
MM
G to
tal in
ten
sity
20% MVC 40% MVC 60% MVC 80% MVC
0
1
2
3
4
5
6
7
60 70 80 90 100 110 120 130 140 150
Elbow angles (degree)
MM
G to
tal in
ten
sity
20% MVC 40% MVC 60% MVC 80% MVC
Figure 4.5. (A)MMG total intensity vs elbow angle at different loadings for concentric contractions for biceps brachii. (B) MMG total intensity vs elbow angle at different loadings for eccentric contractions for biceps brachii.Values are mean ± S.E.M
4.3.2 Changes in EMG and MMG intensity at different loading
As shown in Fig.4.3, the 3-way ANOVA shows that the EMG total intensity increased
significantly with increased loads. The 20% MVC had significant lower θEMG than 80%
MVC, but the θEMG did not differ significantly between 40, 60 and 80% MVC.
A
B

89
1.35
1.55
1.75
1.95
2.15
2.35
65 75 85 95 105 115 125 135 145
Elbow angle(degree)
θM
MG (
rad)
20% MVC 40% MVC 60% MVC 80% MVC
1.35
1.55
1.75
1.95
2.15
2.35
65 75 85 95 105 115 125 135 145
Elbow angles (degree)
θM
MG
(rad)
20% MVC 40% MVC 60% MVC 80% MVC
Figure 4.6. (A)EMG θ vs elbow angle at different loadings for concentric contractions for biceps brachii. (B) EMG θ vs elbow angle at different loadings for eccentric contractions for biceps brachii.Values are mean ± S.E.M
The MMG total intensity increased significantly with increase loads, which showed
the similar pattern as EMG total intensity (Fig. 4.5). For θMMG comparison between
loading levels, the θMMG in the 20 and 40% MVC were significantly higher than the
values in 60 and 80% MVC, whereas the changes in θMMG were not significant
between 20% and 40 % MVC.
There was a significant interaction between elbow angles and loads on total intensity,
and this interaction was greater for both EMG and MMG total intensity in the larger
elbow angles (145°, 135°, 125°, 115°, 105°, 95°) than smaller elbow angles(Fig.4.3,
Fig.4.5). Total intensity values of smaller elbow angles were lower than the values of
B
A

90
the larger elbow angles for both EMG and MMG. However, there was no significant
interaction between elbow angles and loads for θEMG and θMMG.
4.3.3 Changes in EMG and MMG intensity for different contraction types
EMG total intensity was significantly greater in the concentric than the eccentric
contractions, while θEMG was generally lower in the concentric than the eccentric
contractions (Fig.4.4).
For MMG, the eccentric contractions had higher total intensity than the concentric
contraction, whereas there was no significant difference in θMMG between these two
contractions types (Fig.4.6).
4.3.4 PCA plot of EMG and MMG intensity spectra
The first two PCs of the EMG-intensity spectra describe 95% of the EMG signal (Fig.
4.7). Fig. 4.8 shows a plot of the first principal component (PCI) loading scores
against the second component (PCII) loading scores for EMG intensity-spectra. In
addition there was a significant positive correlation between EMG intensity and the
PC I loading score (p<0.001, r2=0.99). PCI-PCII loading scores for each loading show
a clockwise direction start with elbow angle 145°. The overall pattern has an
underlying curvature with the values of PCI loading scores increasing initially with
high negative scores on PCII and then decreasing at high positive values of PCII
from elbow angle from 145 to 65 degree. The PCI and PCII loading score
progressively increased as the loads increased.
-0.6
-0.4
-0.2
0
0.2
0.4
0.6
0.8
0 50 100 150 200 250 300 350
Frequency (Hz)
Princip
al c
om
ponent W
eig
htin
g
PCI 85% signal
PCII 10% signal
Figure 4.7. Principal component weightings from the EMG power spectra for the first two principal components (PC) with the relative proportion of the total signal that they describe.
A

91
145
135
125
115
105
95
85
75
0
0.6
-0.08 -0.04 0 0.04
PC II loading score
PC
I loadin
g s
core
80% MVC
60% MVC
40% MVC
20% MVC
145
135125
115
105
95
0
0.2
-0.01 0.005
PC II loading score
PC
I loadin
g s
core
20% MVC
40% MVC
60% MVC
80% MVC
Figure 4.8. (A) Principal component loading scores from the EMG intensity spectra for the concentric contractions. (B) Principal component loading scores from the EMG
intensity spectra for the eccentric contractions. The points denote the mean ±±±± S.E.M.
scores for each force level for biceps brachii. The numbers denote the % MVC.
-1
-0.8
-0.6
-0.4
-0.2
0
0.2
0.4
0.6
0.8
0 10 20 30 40 50 60 70 80 90
Frequency(Hz)
Pri
nc
ipa
l co
mp
on
en
t w
eig
htin
g
PC =76% signal
PC=12% signal
Figure 4.9. Principal component weightings from the MMG power spectra for the first two principal components (PC) with the relative proportion of the total signal that they describe.
B

92
Fig.4.10 shows a plot of the PCI loading scores against the PCII loading scores for
MMG intensity-spectra. The first two PCs of the MMG-intensity spectra explain 88%
of the MMG signal (Fig. 4.9). PCI was strongly correlated to MMG total intensity
(p<0.001, r2 = 0.98). In general, the MMG PCI-PCII plane took the similar pattern as
EMG PCI-PCII plane. The PCI-PCII loading scores were similar for all load conditions
at the elbow angles 60°, 70°, 80°, 90°, but for the rest of elbow angles they diverged
with higher load conditions resulting in greater curvatures to their traces. The MMG
PCI loading scores increased with increased loads.
65
75
85
95
105
115
125
135
145
0
1.8
-0.7 -0.4 -0.1 0.2
PC II loading score
PC
I loadin
g s
core
20% MVC
40% MVC
60% MVC
80% MVC
65
75
85
95
105
115
125
135
145
0
3
-0.8 -0.4 0 0.4
PC II loading scores
PC
I loadin
g s
core
s
20% MVC
40% MVC
60% MVC
80% MVC
Figure 4.10. (A) Principal component loading scores from the MMG intensity spectra for the concentric contractions. (B) principal component loading scores from the MMG
intensity spectra for the eccentric contractions. The points denote the mean ±±±± S.E.M.
scores for each force level for biceps brachii.
B
A

93
4.4 Discussion
4.4.1 Changes in EMG and MMG intensity at different loading conditions
PCA is a powerful statistical method which may reduce the dimensionality of a large
data set to a smaller more manageable form, leading to a better understanding of the
data and drawing attention to important features in the data (Ramsay and Silverman,
1997). It can generate new hypotheses regarding the relationships between the
variables and identify some variables as being redundant because they contribute
little information, such as movement artifacts. PCA also identifies relationships
between the variables which may help to understand the problem being investigated.
PCI loading scores provide a good measure of the signal intensity. The results
reported here show that PCI loading scores were highly correlated with the total
intensity of EMG and MMG spectra and explained the majority of the signal in EMG
and MMG. In the present study, θ is defined as the angle between PCI and PCII
loading scores. It has been shown that the θ is very sensitive to the frequency shift
that corresponds to spectral difference between types of MUs in both fine wire
(Hodson-Tole and Wakeling, 2007) and surface EMG (Wakeling, 2004; Wakeling and
Rozitis, 2004; Wakeling et al., 2006). It has been shown that a higher value of θ
represents relatively more low frequency signal content and it can be associated with
the recruitment of slower MUs (Wakeling, 2009b). A smaller θ value, associated with
relatively more high frequency content, can be associated with the recruitment of
faster MUs.
It is known that the electrical properties of the sarcolemma vary between fast and
slow fiber types within mammals (Luff and Atwood, 1972), and it has been suggested
that faster MUs have faster conduction velocities and hence generate higher EMG
frequencies (Gerdle et al., 1988; Gerdle et al., 1991; Wakeling et al., 2002), and a
higher proportion of faster fibers is associated with a greater mean power frequency
(Akasaka et al., 1997). On the other hand, MMG is the summation of the activity of
single MUs. Each active MU generates pressure waves (Orizio et al., 2003). Orizio
suggested that recruitment of fast fibers with short contraction time could result in
“shorter motor unit sound spikes”, which would increase MMG frequency (Orizio,
1993). Moreover, the oscillations from faster MUs may be damped to a lesser degree
by the surrounding tissues than slow MUs (Smith et al., 1997), potentially resulting in
greater total intensity in MMG spectra. Studies recording MMG from human muscles
with known fiber composition have shown that muscles with a higher proportion of
slow fibers generate MMG signals which contain an increased percentage of low

94
frequencies as compared to muscles with a mixed population of fast and slow fibers
(Mealing et al., 1996; Akataki et al., 2003). Therefore, the changes in EMG and MMG
signal frequency component as a result of altered recruitment pattern between
different MUs were quantified by θ in the present study. The value of θ was
significantly higher in the 20%MVC than in 80%MVC for both EMG and MMG, the
high θ values during 20% MVC concentric and eccentric contractions may have been
due to fewer and slower MUs being activated. Fast MUs are more superficially
distributed in BB than slow MUs (Johnson et al., 1973; Kukulka and Clamann, 1981),
as the external loading was increased, additional MUs with faster fibers were
successively recruited, yielding higher frequency contents of EMG and MMG power
spectra and smaller θ values.
For both concentric and eccentric contractions, EMG and MMG total intensity
increased significantly with increased loading. This was consistent with the results of
previous studies of the EMG and MMG during dynamic contractions, which indicated
that EMG and MMG amplitude reflect force changes during both concentric and
eccentric contractions (Dalton and Stokes, 1991; Beck et al., 2004b). The EMG
intensity is dependent on both the MU recruitment and firing rate. The increase of
firing rate may contribute more low frequency components in EMG spectra, which
would increase the θEMG. Our results show that the θEMG , (although not significantly),
decreased from 40 to 80% MVC, which may be associated with the recruitment of
more faster MUs for higher force production. On the other hand, The intensity of the
MMG increases with the number of recruited MUs, whereas it decreases with higher
firing rate due to fusion of the MU mechanical activity (Stokes and Cooper, 1992;
Orizio, 1993; Bichler, 2000). Moreover, the MMG spectral may contain information
about the MU firing rate. The increase of firing rate at the higher force level has been
demonstrated by a steeper increase of MMG mean frequency coupled with a
decrease of MMG amplitude versus %MVC relationship (Diemont et al., 1988; Orizio
et al., 1989). In the present study, the MMG total intensity increased significantly
throughout the entire loading range from 20% to 80% MVC, whereas the θMMG
decreased significantly at higher loadings, which may be attributed to the recruitment
of faster MUs and an increased firing rate. Our findings tentatively suggested that the
increased muscle force during dynamic concentric and eccentric contractions may be
reflected more in recruitment than in MUs firing rate. This would be consistent with
previous studies of dynamic isokinetic muscle actions, which indicate that the MU
recruitment may be the primary MU control strategy for increasing torque (Kossev
and Christova, 1998; Beck et al., 2004a).

95
4.4.2 Changes in elbow angles on EMG and MMG spectra
In this study, the EMG and MMG total intensities of the smaller elbow angles (65°,
75°, 85°, 95°, flexed position) were significantly lower than that of the larger elbow
angles (115°, 125°, 135°, 145°, extended position), and there were no total intensity
differences in the range between 65 and 85 degree for both concentric and eccentric
contractions. Furthermore, in the flexed position, the total intensity was similar in
concentric and eccentric contractions, although the mean total intensity in concentric
contractions was significantly higher than in eccentric contractions throughout the
motion. These results indicate that the activation of BB muscle increased as the
elbow joint was extended; therefore more MUs may have been recruited at extended
elbow angles.
Our results show that values of θ were lower at the elbow angles 105°, 115°, 125°,
135°, which indicate there was a shift to higher EMG and MMG frequencies when the
BB was extended. And this pattern was similar for all the loading conditions, except
20% MVC. Rome et al., suggested that generating mechanical power at a high
efficiency is best achieved by using faster MUs(Rome et al., 1988). It is interesting to
note that the values of θ of elbow angles 145° and 135° were higher than the values
of 105°, 115° during concentric contractions. According to the size principle, slow
MUs are the first to be recruited, followed by faster MUs. So the initiation of the
concentric contractions at elbow angle 145° was developed by recruiting of a high
proportion of slow MUs, which was indicated by the high θ values. It is possible that
once a muscle is initially activated, according to the size principle, modulation of
force production occurs on the basis of the mechanical properties of the respective
MUs. One of the proposed functional advantages of the size principle is that it
provides a strategy by which a smooth increment in force magnitude can be achieved
(Wakeling et al., 2006). Slow MUs which develop relatively low tension may be active
continuously while fast MUs which develop high tensions may only be needed to be
activated for brief periods of exertion according to the mechanical demands on the
muscle. For instance, low intensity contractions, 20% MVC in the present study, use
the slow MUs, so there was little change of θ in both concentric and eccentric
contractions.
Both physiological and mechanical advantages play a role in muscle contraction and
maximum torque generated. The length-tension relationship shows that the
maximum tension generated by the muscle occurs at its resting length when there is

96
the greatest number of cross bridges between myosin and actin. Previous
investigations have also reported that the pattern of motor-unit activity is related to
muscle length (Vander Linden et al., 1991; Christova et al., 1998; Kennedy and
Cresswell, 2001). The results indicated that higher firing rates and increased motor-
unit recruitment occurred when muscle fascicles were shortened (Bigland-Ritchie et
al., 1992). However, the mechanical advantage was found to be affected by the
elbow angle (Akazawa and Okuno, 2006). There are optimal elbow angles at which
the maximum moment of torque can be generated throughout a joint range of motion
(van Zuylen et al., 1988). In the present study, we found that the joint angle had a
significant effect on concentric and eccentric contractions with constant external
loadings, so this suggested that the activation of MUs depends on the mechanical
advantage in such a way that different types of MU are recruited according to the
mechanical demands on the whole muscle.
4.4.3 Changes in EMG and MMG spectra during concentric and eccentric contractions
Previous studies have indicated that the MU activation strategies may be different
during concentric and eccentric contractions. With respect to MU activity during
concentric and eccentric contractions, differences involving recruitment patterns, MU
firing rates, and onset patterns were investigated. Nardone and colleagues reported
that selective recruitment of fast-twitch MUs concurrent with slow-twitch unit de-
recruitment occurred during eccentric contractions (Nardone et al., 1989). The soleus
muscle which has a high proportion of slow fibers was deactivated during eccentric
contraction. Concurrently, the gastrocnemius muscle which contains more fast fibers
was selectively activated when the plantar flexor muscles performed eccentric
contraction but not with concentric contractions at moderate to faster velocities
(Nardone and Schieppati, 1988). Furthermore, some studies have reported that the
firing rates examined by intramuscular EMG during eccentric contractions were
significantly lower than during concentric contractions. Hence, it is possible that the
physiological mechanisms driving muscle contraction during eccentric contraction
differs from that during concentric contractions.
In the present study, the EMG total intensity was greater for concentric than for
eccentric contractions, which is consistent with the results of previous studies of the
BB muscle (Dalton and Stokes, 1991). Del Valle, et al reported that the strongest
eccentric contractions of triceps brachii were far from maximal compared to
maximum isometric and concentric contractions, because lengthened muscle fibers

97
can exert far more force than when they shorten or contracts isometrically. So it is
not necessary to fully activate the muscle to match the maximum force of the
concentric contractions (Del Valle and Thomas, 2005).
On the other hand, our results show that MMG total intensity was greater during
eccentric than during concentric contractions. However, Dolton et al (1991) reported
a lower level of MMG activity recorded during eccentric contraction in BB. This
difference may be due to the higher %MVC levels that were used in the present
study, which may cause muscle tremor. It has been reported that eccentric exercise
increased force fluctuation during isometric contractions (Lavender and Nosaka,
2006; Semmler et al., 2007), which may have been due to greater physiological
tremor and/or increase edema in the muscle fibers (Bajaj et al., 2002). Irregular
spikes in MMG during eccentric contractions were evident in raw MMG signals at
higher %MVC levels in the present study (Fig.4.2B), which may have been attributed
to higher MMG total intensity.
BB muscle is a mixed muscle with 50% slow and 50% fast twitch fiber, and 57.7%
fast twitch fibers are located at the surface. If fast fibers are selectively recruited in
eccentric contractions, lower values of θEMG, which reflect the relative higher
proportion high frequencies, could be expected. Our results demonstrated the θEMG
was lower for concentric than for eccentric contractions in BB. This is similar to other
studies which have reported lower mean power frequencies during eccentric
contractions compared with concentric contractions (Komi et al., 2000; Linnamo et al.,
2001, , 2002). However, McHugh reported that the mean frequency of the SEMG
was higher for eccentric than for concentric contractions for 25, 50, 75% MVC in
hamstring muscles(McHugh et al., 2002). In addition, it has been hypothesized that
preferential recruitment of faster MUs would also result in a relative shift of the MMG
signal to higher frequencies. Our results show that θMMG was similar in both
contractions. Some other studies also found no difference between MMG mean
power frequency when comparing the lengthening and shortening movements
(Dalton and Stokes, 1991; Madeleine et al., 2001). These results, however, are
difficult to interpret because there are multiple factors that can affect the EMG and
MMG frequency contents during movement, and so there is uncertainty regarding the
causes of the changes seen (Chalmers, 2008).
One potential factor that could have influenced the EMG and MMG concentric-
eccentric relationship is selective activation of synergistic muscles and possible

98
differences in the contribution of synergistic muscles at the elbow joint angles
(Nakazawa et al., 1993; Nakazawa et al., 1998; Kasprisin and Grabiner, 2000). In
addition to the BB muscle, which is the main contributor to the elbow flexion torque,
other muscles, such as the flexor brachialis, brachioradialis, and the extensor triceps
brachii also contribute to elbow flexion. Although we cannot rule out the possibility of
a greater contribution of any one of these muscles during concentric and eccentric
contractions, which could have reduced the contribution of the BB, this should have
other minor effect on our results. Indeed, Nakazawa et al found that the EMG activity
in brachioradialis relative to BB during concentric contractions was greater than that
during eccentric contractions at larger elbow angles (Nakazawa et al., 1993).
There remains the interesting question as to how and why different populations of
MUs are used for different movement tasks. It has been proposed that the neural
commands controlling concentric and eccentric contractions are different(Enoka,
1996).Grabiner (2002) investigated the surface EMG muscle activity signal prior to
movement onset and indicated that the initial differences between the EMG of
maximum voluntary concentric and eccentric knee extensor contractions are selected
a priori (Grabiner and Owings, 2002). In addition, it has been demonstrated, by using
EEG, that cortical activity during the planning for concentric and eccentric
contractions differ (Fang et al., 2001). Compared to a concentric maximum voluntary
contraction (MVC), an eccentric MVC is usually associated with a lower activation
level as measured by surface EMG (Del Valle and Thomas, 2005). It has been
suggested that the eccentric contraction may follow the modulation rate of
economical tension in order to use more elastic energy and less MU recruitment
(Enoka, 1996; Chalmers, 2008). However, the underlying neural and mechanical
mechanisms that give rise to activation differences in concentric and eccentric
contractions need to be characterized in future studies.

99
Chapter Five: Pushrim kinetics and patterns of shoulder muscle recruitment on wheelchair propulsion for different
propulsion patterns
5.1 Introduction
Individuals undergoing treatment for a spinal cord injury (SCI) learn to use a
wheelchair as soon as they are stable and able to sit up without complications.
However the use of a wheelchair, which is intended to restore mobility, may not be
without risk. Over time, shoulder joints associated with the upper limbs of manual
wheelchair users (MWU) inevitably deteriorate. A possible link between wheelchair
propulsion and upper limb injuries has been the subject of many studies (Rodgers et
al., 1994; Rodgers et al., 2001; van der Woude et al., 2001; Boninger et al., 2003;
Mercer et al., 2006). Shoulder injuries associated with wheelchair propulsion may be
hastened by the propulsion technique used. In addition, ineffective biomechanics can
decrease the economy of wheelchair operation and lead to excessive metabolic and
cardiopulmonary demand (van der Woude et al., 1998). So far, very little time is
spent on instructing patients on the proper propulsion techniques that would reduce
these risks.
Because upper limbs of wheelchair users are subjected to unnatural loading
conditions and repetitions of use, suitable propulsion mechanics are very important in
preventing injuries and maintaining comfort during locomotion. Previous studies on
able-bodied subjects have showed that wheelchair-practice programs (subjects self-
discovered comfortable and optimal wheelchair propulsion pattern) have a favorable
effect on temporal variables (push frequency, push time, and cycle time) and gross
mechanical efficiency (de Groot et al., 2002; de Groot et al., 2003; de Groot et al.,
2008). Therefore, an improved propulsion technique may help to alleviate the
development of overuse injuries. The propulsion pattern chosen for instruction
sessions is the semicircular pattern, recommended in the clinical practice guidelines
for the Preservation of Upper Limb Function Following Spinal Cord Injury (Boninger
et al., 2005). The semicircular pattern is readily observed with the hands passing
below the pushrim during the recovery phase.
The present study examined the effect of a short propulsion technique instruction
session on wheelchair biomechanics, in particular, shoulder muscle activity. Normal
shoulder function predominantly relies on precise recruitment and muscle
coordination (Veeger and van der Helm, 2007). Electromyography (EMG) has

100
revealed details of the timing and magnitude of muscle activation for the specific
muscles or groups of muscles involved in wheelchair propulsion (Mulroy et al., 1996;
Mulroy et al., 2004; Yang et al., 2006; Dubowsky et al., 2009). Kinetics and
kinematics analysis of propulsion patterns have provided some indications of the
mechanical loads on the shoulder joints (Boninger et al., 2002; Richter et al., 2007).
Monitoring EMG pattern during wheelchair propulsion can be used to determine a
preferred propulsion technique where the subject demonstrates the most appropriate
EMG activation patterns throughout the propulsion cycle. This information will provide
evidence to support instruction sessions for appropriate propulsion techniques
intended to decrease the risk of shoulder injuries in persons with SCI.
Able-bodied subjects were recruited in the current study to provide a homogenous
subject group compare to available wheelchair-dependent participants in the early
stages of rehabilitation (de Groot et al., 2003). Although the results may not be
completely transferable to people with SCI, the information should help in designing a
brief wheelchair propulsion instruction session for newly injured patients. The
purpose of the present study was to determine how the semicircular propulsion
pattern affects muscle recruitment patterns and wheelchair kinetics compare to a
self-selected stroke pattern during the initial learning stage of wheelchair propulsion.
Our hope is that a short session of wheelchair technique instruction in the proper
propulsion technique would result in biomechanically more economical wheelchair
propulsion and a better coordinated muscle recruitment pattern of the shoulder
muscles.
5.2 Methods
5.2.1 Participants
15 able-bodied participants (8 males, 7 females, age: 30±4 years, weight: 65±12 Kg)
volunteered to participate in this study. They all gave their informed consent in
accordance with the procedures approved by the University of Alberta ethics
committee. None reported any previous history of upper extremity pain or any
neuromuscular disorder. None of the subjects had been using a wheelchair in any
prior instance.
5.2.2 Surface electromyography
Surface electromyography (SEMG) activity of upper extremity muscles was recorded
using parallel-bar EMG Sensors (DE-3.1 double differential sensor, 1mm in diameter

101
and separated by 10 mm, BagnoliTM, Delsys Inc., Boston, MA, USA). SEMG signals
were detected on seven muscles: anterior deltoid (AD), middle deltoid (MD), and
posterior deltoid (PD), pectoralis major (PM), upper trapezius (UT), biceps brachii
(BB), and triceps brachii (TB) on the right shoulder after prior removal of the hair and
cleaning with alcohol swipes. Sensor placement was confirmed by testing elevation
(anterior, middle, and posterior deltoid), external rotation (upper trapezius, and
posterior deltoid), internal rotation (pectoralis major), and arm flexion (biceps and
triceps). The EMG signals were amplified and sampled at 2000Hz.
5.2.3 Kinetic system
The SmartWheel (Three Rivers Inc., LLC, Mesa, AZ, USA) was used for the
collection of kinetic data. The SmartWheel is a modified mag-wheel capable of
measuring three-dimensional forces and moments occurring at the pushrim. The
pushrim kinetic data were collected at 240 Hz. The SmartWheel was placed on the
right side of the test wheelchair (Quickie GP, Sunrise Medical, Longmont, CO, USA)
with a standard foam cushion. This test wheelchair was mounted on an ergometer,
which was connected to a LCD display placed in front of the participant to provide
visual speed feedback. Kinetic and EMG recordings and were synchronized.
5.2.4 Procedure
5.2.4.1 Wheelchair propulsion on ergometer
Participants were given several minutes to get used to propelling the wheelchair on
the ergometer and to establish a comfortable propulsion technique. The data were
recorded at the speed of 0.9m/s for 1min as self-selected pattern data. Then the
participants were advised to apply semicircular propulsion pattern (Fig. 5.1). Start
with the arm back a bit so the hand is behind the body (Fig.5.2A), keep the hand on
the pushrim until it is past the body, and don’t let go until the elbow is nearly straight
(Fig.5.2B). The semicircular pattern is recognized by the hands falling below the
pushrim in the recovery phase. Participants were given ample time to become
acclimated to this pattern prior to data collection. Then the data were recorded at the
speed of 0.9m/s for 1min as self-selected pattern data.

102
Figure 5.1. Semicircular hand trajectory. After the user release the pushrim and are
coasting, let the hand drift down between the pushrim and the wheel axle. This is called a “semicircular propulsion pattern.”
Figure 5.2. Semi-circular propulsion technique. (A) pushing start posture, (B) pushing end posture. 5.2.5 Data analysis
5.2.5.1 Kinetic data analysis
Kinetic variables from all the cycles collected at steady state were determined. For
each participant, 10 continuous cycles in the self-selected and semicircular stroke
pattern were used for data analysis. The key kinetic variables calculated were
average resultant force (Ftot), average tangential force (Ft), and average moment (Mz).
The resultant force (Ftot) is the total force applied to the pushrim. The tangential force
(Ft) is the force directed tangential to the pushrim. Mechanical effectiveness (ME)
was calculated by Ft / Ftot. Mz is the moment acting to cause forward motion. Peak
negative Ftot and peak negative Mz are the peak resultant force and propulsive

103
moment to brake the wheelchair. In addition, by using the output of the SmartWheel,
the push frequency (push/second), push length in degree, and push time were
determined.
5.2.5.2 Wavelet analysis of the EMG signal
The method has been described in detail in previous Chapters
5.2.6 Statistical Analysis
Mean values were calculated from each propulsion cycle and each subject. Statistical
analysis was performed using SPSS (SPSS 16, SPSS, Inc., Chicago, IL, USA). The
Shapiro-Wilk statistic was used to determine the normality of the variables. Paired t
tests were conducted to test for the significant differences between the two sessions.
Significant level was set at p< 0.05 for all statistical procedures.
5.3 Results
5.3.1 Kinetics variables
The tangential forces and propulsive moment for the semicircular pattern and self-
selected pattern are presented in Fig.5.3. No significant differences were found in the
pushrim forces and moments (Table 5.1). The normalized push phase and recovery
phase were similar in the two sessions, with the push phase extending to the 40% of
the propulsion cycle and recovery phase to the remaining 60% of the propulsion
cycle (Fig. 5.3). The semicircular pattern did not lead to a change in the mechanical
effectiveness. There were significant differences in push frequency, push length,
push time, and push distance (P<0.01 for all comparisons). The push frequency was
significantly lower in the semicircular pattern than in the self-selected pattern, while
the push length, push time, and push distance were significantly longer in
semicircular than in the self-selected pattern (Table 5.1).

104
Table 5.1. The stroke patterns and propulsion biomechanics. Data were reported as mean ± SD.
Condition / variable Semicircular pattern Self-selected pattern Sig. (2 tailed)
Peak Ftot (N) 49.51±15.10 51.18±13.56 0.66
Ave Ftot (N) 35.56±11.25 37.28±10.84 0.54
Ave Ft (N) 24.72±4.11 25.10±1.06 0.75
Peak negative Ft (N) -5.23±1.29 -6.72±3.08 0.15
Peak negative Mz (N*m) -1.34±0.33 -1.73±0.79 0.15
Mechanical Effectiveness 0.72±0.14 0.70±0.15 0.55
Push frequency (1/s) 0.83±0.11 1.29±0.33 0.00
Push length (degree) 61.50±7.39 43.85±3.20 0.00
Push time (s) 1.23±0.16 0.83±0.25 0.00
Push distance (m) 1.03±0.18 0.71±0.24 0.00
Abbreviation: Peak Ftot, peak total force; Ave Ftot: average total force; Ave Mz: average Mz; Ave Ft, average tangential force; % push
5.3.2 Muscle activity
No significant differences were found in the EMG intensity in the seven muscles
(Table 5.2). The onset, cessation, and duration of EMG activity for AD, PM, BB, and
TB were similar between the two sessions. UT and PD displayed significantly earlier
onset and cessation of EMG activity in the self-selected pattern than in the
semicircular pattern (P<0.05 both cases). MD showed a significantly earlier cessation
and longer duration of EMG activity in the self-selected pattern than in the
semicircular pattern (Table 5.2).
Table 5.2. Timing of EMG activity of self-selected stroke pattern vs semicircular pattern during wheelchair propulsion. Data were reported as mean ± SD.
Onset (SD) % of cycle Cessation(SD)
% of cycle Duration(SD) % of cycle
Muscle
SC SS SC SS SC SS
AD 89(6) 82(14) 28(7) 38(26) 39(10) 46(13) PM 94(8) 83(16) 32(9) 24(17) 37(5) 41(9) BB 80(17) 69(34) 17(8) 37(32) 35(16) 41(9) TB 97(3) 92(14) 42(10) 35(17) 45(8) 42(9) UT 37(15)* 17(12)* 91(12)* 75(12)* 54(10) 58(6) MD 22(11) 13(9) 97(4)* 82(13)* 75(9)* 68(8)* PD 25(10)* 15(9)* 95(5)* 81(14)* 69(8) 65(8)
Abbreviations: AD, anterior deltoid; PM, pectoralis major; BB, biceps brachii; TB, triceps brachii; UT, upper trapezius; MD, middle deltoid; and PD, posterior deltoid. SC, semicircular pattern; SS, self-select pattern *significant difference for P<0.01, group mean data.

105
5.4 Discussion
5.4.1 Wheelchair Kinetics
Although the force and moment variables showed no statistically significant
difference between two sessions, the peak Ftot, average Ftot, and the average Ft were
slightly lower in the semicircular pattern than in the self-selected pattern. The results
were consistent with previous studies showing that the forces generated at the
pushrim do not vary by propulsion pattern, as the propulsion patterns differ from each
other during recovery not during propulsion. It is recommended by the clinical
guideline that the forces should be minimized during wheelchair propulsion (Boninger
et al., 2005). The relationship between high shoulder kinetics and shoulder
pathologies has been reported in several previous studies; individuals who propelled
with higher shoulder forces and moments were more likely to have shoulder injuries
(Boninger et al., 2000; Boninger et al., 2003).
A slight improvement in the negative peak Ft and Mz was found in the semicircular
pattern (Fig.5.3). Negative forces and moments would reduce overall performance
because they imply braking (Veeger et al., 1992). Although no significant decrease
was found in the negative forces and moments after short-term training in the present
study, it has been shown that a longer practice period could bring a significant
improvement in the negative dip before and after the push (de Groot et al., 2002).
-2
10
0 20 40 60 80 100% Cycle
Mo
me
nt
(Ne
wto
n.m
ete
rs)
-10
35
0 20 40 60 80 100
% Cycle
Ft
(Ne
wto
n)
Figure 5.3. Pushrim moment (Mz) (A) and tangential force (Ft) (B) for the semicircular pattern (grey line) and self-selected pattern (black line). Each trace shows the mean (think line) + S.E.M. (thin line). Time was normalized to was normalized to 100% of propulsion cycle. Illustration of the definition of the push phase, recovery phase, negative Mz, and Negative Ft.
In the present study, a slight improvement of the mechanical effectiveness (ME) was
found in the semicircular pattern compared with the self-selected pattern. The
B
Recovery Push phase
Negative Mz Negative Ft
A
Recovery Push phase

106
mechanical effectiveness is given as the ratio between Ft and Ftot. The tangent force
is the only component that contributes directly to the forward motion of the wheel.
The ratio gives an indication of the effectiveness of propulsion from a mechanical
point of view. It has been demonstrated that experienced wheelchair users showed a
higher mechanical efficiency compared with less experienced able-bodied subjects.
In a 3-weeks wheelchair propulsion practice study, there was a significantly increase
of the mechanical efficiency, which indicated that the training / leaning may improve
wheelchair propulsion techniques, so much less energy will be spent (de Groot et al.,
2002). However, Desroches et al (2008) reported that a force simulated tangent to
the wheel yielded major increases in the shoulder kinetics (Desroches et al., 2008).
The authors thus suggested that the small improvement of mechanical effectiveness
could be beneficial for the users, “as it would increase the mechanical performance
of propulsion without exerting a higher demand on his joints”.
The changes in push length, push frequency, push time, and push distance appear to
be linked. The longer push length is attributed to the reduction of push frequency.
The push frequency decreased significantly in the semicircular pattern. De Groot et al
(2002) reported a further reduction of push frequency after 3 weeks practice (de
Groot et al., 2002), whereas an even longer period of practice may not have a
significant effect on the push frequency, which is basically dictated by the mechanical
constraints of the task and the physical characteristics of the musculoskeletal system.
Boninger (1999) stated a relationship between push frequency and impaired median
nerve function, an increased push frequency was significantly related to lower
median amplitude (Boninger et al., 1999). Therefore, it is recommended that the push
frequency should be minimized during wheelchair propulsion(Boninger et al., 1999).
In addition, Goosey et al. (2000) reported that the push frequency had an effect on
pushing economy, with lower push frequency being associated with greater pushing
economy (defined as oxygen uptake at a given propulsion speed) (Goosey et al.,
2000). A high push frequency leads to more shifts in deceleration and acceleration
and inertial moments of the limb segments, thus influencing muscle activity and
coordination and subsequently energy cost and efficiency, whereas a slower push
frequency may provide the wheelchair users with more force on the hand rim with
less muscular effort.
107
5.4.2 Muscle recruitment patterns: self-selected propulsion pattern versus semicircular propulsion pattern
The shoulder muscle complex allows for a large range of motion, with a great
variability in muscle activity (Veeger and van der Helm, 2007). What limits this
variability is the linking of muscles together into a muscle synergy – a temporally
coherent and task-dependent grouping of muscles controlled by the central nervous
system (CNS) as one degree of freedom (Bernstein, 1967; Krstulovic et al., 2006).
Since typical kinesiological EMG represents the activity of multiple motor units it
provides insight into muscle recruitment patterns and neuromuscular control of
wheelchair propulsion. Two muscle synergies have been identified during wheelchair
propulsion, push phase synergy and recovery phase synergy(Mulroy et al., 1996).
The push phase synergy is dominated by the anterior deltoid (AD), pectoralis major
(PM), and biceps brachii (BB) (Mulroy et al., 1996; Mulroy et al., 2004), whereas
upper trapazius (UT), middle deltoid (MD) and posterior deltoid (PD) have their
primary activity during the recovery phase. The push phase muscles are responsible
for generating the propulsive forces required for forward motion in the push phase. In
the propulsion phase the subjects are required to follow the path of the pushrim,
whereas in the recovery phase the subjects can choose among many paths to return
the arms and hands to the initial push position. Therefore, it is expected that the
recruitment patterns of the push phase muscles were similar for both stroke patterns.
However, the recruitment pattern for the recovery synergy was significantly different
between the self-selected and semicircular pattern. The EMG onset of the recovery
muscles, PD, MD, and UT was shift into the push phase in the self-selected pattern.
The activity of these muscles in the push phase would not be useful for improving
propulsive force, because their role may be to stabilize the shoulders during the
wheelchair propulsion. These co-activation patterns may lead to poor functional
locomotion, and at the same time, enhance the rate of fatigue. Whereas in the
semicircular pattern, synergistic muscles were recruited in the distinct phases and
displayed a more specific multimuscle sequencing, this may thereby economize force
production. It has been reported that more skilled control of movement and muscle
activation is characterized by decreased muscle coactivation (Carson and Riek,
2001).
In the present study, the semicircular stroke pattern was adopted as the pattern
taught. This pattern is recommended by clinical practice guidelines based on the
results of the study by Boninger et al (Boninger et al., 2002). These guidelines are
described as a first step in the ongoing process of developing useful tools for

108
preserving upper-limb function in people with spinal cord injury. However, the
guidelines did not consider the study by de Groot et al. (de Groot et al., 2004), which
suggests that the arcing pattern may result in greater metabolic efficiency than the
semi-circular pattern. The semicircular pattern is used widely in experienced
wheelchair users while inexperienced implemented the arcing pattern for everyday
mobility (Sanderson and Sommer, 1985; Veeger et al., 1989b). Our results show a
positive effect of the semicircular pattern on the wheelchair kinetics and shoulder
muscle recruitment patterns in inexperienced able-bodied subjects. However, In the
de Groot study (2004), 24 inexperienced wheelchair users were asked to propel on a
stationary ergometer using each of 3 stroke patterns, arcing, semicircular, and single
looping over propulsion (SLOP). A lower push frequency and a greater push time
were found in the semi-circular pattern compared to the arcing pattern. The arcing
pattern however was found to have less metabolic demand than the semi-circular
pattern, suggesting that reducing push frequency and maximizing metabolic
efficiency may be competing interests. As the semicircular pattern is likely to be more
efficient than the other stroke patterns during level propulsion, subjects tended to
change their stroke pattern for pushing uphill. The semicircular pattern was less
used during uphill wheelchair propulsion, while the majority of the subjects adopted
the arcing pattern (Richter et al., 2007). Of course, the propulsion technique is highly
dependent on the type of wheelchair used, as well as the functional capacity of the
user. Clinical professionals should be aware of the physical environment that the
wheelchair users have to cope with, so the proper propulsion techniques are
recommended according to the mechanical requirements of the propulsion tasks and
specific propulsion environments. In addition, developing a way to monitor the
appropriateness of muscle activation patterns with changes in training sessions may
lead to greater gains in prevention of shoulder pain and injuries.

109
Figure 5.4. EMG intensity for the semicircular pattern (A) and self-selected pattern (B) from the tested 7 shoulder muscles. Data are the mean from all trials and all subjects. EMG intensity scales are normalized to the maximum intensity for each muscle in the range of [0, 1] where the color map represent the intensity of EMG signal. Time base of propulsion cycle was normalized to 100% with push phase denoting hand-on-hand-off moment of the pushrim.
Push phase Recovery phase Push phase Recovery phase
A B
% Cycle % Cycle

110
Chapter Six: Shoulder muscle recruitment patterns during wheelchair propulsion for different propulsion speeds and
incline
6.1 Introduction
People with spinal cord injuries (SCI) usually rely on their ability to propel a manual
wheelchair for independent mobility. Wheelchair propulsion requires a person to
impart a tangential force to the wheelchair pushrim to move forward. As a result, the
joints of the upper limb are subject to repeated loads as the manual wheelchair user
goes about activities of everyday life. A large amount of data now exists from various
epidemiological studies linking manual wheelchair propulsion along with transfers
and lifts to a variety of shoulder problems including soft tissue injuries and
degenerative changes (Gellman et al., 1988b; Burnham et al., 1993; Curtis et al.,
1999; Veeger et al., 2002). Gellman et al have highlighted the fact that the advances
in the treatment and rehabilitation of SCI patients have greatly improved their quality
of life and participated in a wide range of activities that require effective mobility
(Gellman et al., 1988a). A comprehensive investigation into the causes of shoulder
problems along with a look at possible methods of prevention may thus lead to
further improvement, particularly for people with SCI reaching old age when
problems with upper extremity pain can progressively increase dependency.
A non-invasive method for the study of muscle activity is surface electromyography
(SEMG), which is used widely in physiological research. The shoulder muscles are
activated for distinct periods within each propulsion cycle. Two muscle synergies
have been identified during wheelchair propulsion (Mulroy et al., 1996). The push
phase synergy was dominated by the anterior deltoid (AD), pectoralis major (PM),
and biceps brachii (BB) (Mulroy et al., 1996; Mulroy et al., 2004). These muscles
decelerate arm extension in the late recovery phase and then contribute to shoulder
flexion in the push phase(Mulroy et al., 2004). After the follow-through part of the
push phase, the shoulder motions reversed direction in the recovery phase. The
recovery muscles, i.e. middle deltoid (MD), posterior deltoid (MD), and upper
trapezuis (UT), contracted eccentrically first to restrain shoulder flexion and then
contracted concentrically to return the arm to its starting position (Mulroy et al., 1996).
Human muscles contain a mixture of muscle fiber types facilitating effective
movement over a wide range of speeds and loads (Broman et al., 1985; Bottinelli and
Reggiani, 2000). The skeletal muscles generate a range of EMG intensities and

111
frequencies during locomotion (Wakeling, 2004). It has been shown that EMG
response is proportional to demand. The relative intensity of the EMG increases as
the demand torque becomes greater, and then as the demand lessens, the EMG
also diminishes. Additionally, higher-frequency source spectra are generated by
faster motor units due to the faster conduction velocity of their motor unit action
potentials (Wakeling and Rozitis, 2004; Wakeling, 2009b). Today’s advanced signal
processing techniques enable a more detailed analysis of recruitment patterns of
different motor units within a muscle. Wavelet analysis as defined by von Tscharner
(2002) offers possibilities to consciously optimize the analysis with respect to time-
and frequency-resolution respecting the limits given by the uncertainty principal of
signal processing. The changes in EMG spectra were expected to be subtle, and so
principle component analysis was chosen as the method for quantifying the signals.
The combined use of wavelet and principal component analysis has been
successfully applied in a number of reports of surface EMG collected from humans
during a range of tasks (Wakeling et al., 2002; Wakeling, 2004; Wakeling et al., 2006;
Wakeling, 2009b, 2009a). These studies have shown that distinct high and low
frequency components of the EMG signal can be associated with activity in fast and
slow motor units, respectively (Wakeling and Rozitis, 2004).
The shoulder consists of several joints that function optimally when there are precise
recruitment and coordination of the muscles attaching to these joints (An, 2002;
Veeger and van der Helm, 2007). Shoulder joint forces and moments have been
shown to increase at faster speeds (Kulig et al., 1998; Koontz et al., 2002; Mulroy et
al., 2005; Mercer et al., 2006) and when the wheelchair is pushed up a ramp (Cowan
et al., 2008). The changes in the recruitment patterns over the different shoulder
muscles would be expected to match the different mechanical demands for assorted
wheelchair propulsion conditions. Within each of these muscles the changes in force
production throughout the propulsion cycle would require the selective recruitment of
motor units. It has indeed been shown that in synergistic muscles with different
contractile properties, the fast motor units were selectively used for faster and high
level force requirement tasks (Wakeling, 2004; Wakeling et al., 2006). The purpose
of the present study was thus to investigate, using EMG and kinetics, the shoulder
muscle recruitment patterns from unimpaired individuals during wheelchair
propulsion under various propulsion conditions with a view of designing shoulder
muscle stimulations patterns for actual wheelchair users with spinal cord injuries.

112
6.2 Methods
6.2.1 Participants
Fifteen able-bodied participants (8 males, 7 females, age: 30±4 years, weight: 65±12
Kg) volunteered to participate in this study. They all gave their informed consent in
accordance with the procedures approved by the University of Alberta ethics
committee. None reported any previous history of upper extremity pain or any
neuromuscular disorder. Participants were instructed not to perform any exercise 48
h before measurements.
6.2.2 Surface electromyography
Surface electromyography activity of upper extremity muscles was recorded using
parallel-bar EMG Sensors (DE-3.1 double differential sensor, 1mm in diameter and
separated by 10 mm, BagnoliTM, Delsys Inc., Boston, MA, USA). SEMG signals were
detected on seven muscles: anterior deltoid (AD), middle deltoid (MD), and posterior
deltoid (PD), pectoralis major (PM), upper trapezius (UT), biceps brachii (BB), and
triceps brachii (TB) on the right shoulder after prior removal of the hair and cleaning
with alcohol swipes. Sensor placement was confirmed by testing elevation (anterior,
middle, and posterior deltoid), external rotation (upper trapezius, and posterior
deltoid), internal rotation (pectoralis major), and arm flexion (biceps and triceps). The
EMG signals were amplified and sampled at 2000Hz.
6.2.3 Kinetic
The SmartWheel (Three Rivers Inc., LLC, Mesa, AZ, USA) was used for the
collection of kinetic data. The SmartWheel is a modified mag-wheel capable of
measuring three-dimensional forces and moments occurring at the pushrim. The
pushrim kinetic data were collected at 240 Hz.
The SmartWheel was placed on the right side of the test wheelchair (Quickie GP,
Sunrise Medical, Longmont, CO, USA) with a standard foam cushion. This test
wheelchair was mounted on an ergometer, which was connected to a LCD display
placed in front of the participant to provide visual speed feedback. Kinetic and EMG
recordings and were synchronized.

113
6.2.4 Procedure
6.2.4.1 Maximum voluntary Isometric (MVIC) test
To facilitate comparison between studies, the EMG signals were normalized by the
use of a maximum voluntary isometric contraction (MVIC). A force transducer (Model
LCCB-1K, OMEGA Engineering, Stamford, CT, USA) was used to measure the force
generated from isometric contractions. The force signals were sampled at 2K Hz.
After a 2-5min warm up, a total of 4 muscle tests in a seated position were performed
following the methods described by Boettcher (Boettcher et al., 2008) and Kelly
(Kelly et al., 1996). The test order was block randomized. Each contraction was
performed for 8 s with a gradual increase of contraction over 2 s, a sustained
maximum for 5 s, and a gradual release over the final second. Two repetitions of
each test were performed, with a minimum rest interval of 2min between repetitions.
A minimum 5-min rest period preceded each new test position. During the contraction,
participants were provided with visual feedback of their performance on the computer
monitor displaying their force trace and raw EMG. LabVIEW software (Version 8.5,
National Instrument Inc., Austin, Texus, USA) was used for signal recording and
participant feedback.
1. Anterior deltoid, middle deltoid, and posterior deltoid: elevation at 90° of
scapular elevation and -45° of humeral rotation, resistance applied above
the wrist.
2. Upper trapezius: 125° shoulder flexion, resistance applied above the
elbow, the participant sitting in an erect posture with no back support.
3. Pectoralis major: Internal rotation at 0° of scapular elevation and neutral
humeral rotation, 90° elbow flexion, resistance applied against the front of
the wrist with midprone position of forearm.
4. Triceps: shoulder fully adducted against the body, 90° elbow flexion, resistance applied under the wrist with the forearm supinated.
6.2.4.2 Wheelchair propulsion at ergometer and ramp
Wheelchair ergometer: the wheelchair with each participant was aligned and secured
over the rollers of an ergometer. Participants were given several minutes to get used
to propelling the wheelchair and established a comfortable propulsion technique.
The participants were advised to apply semicircular propulsion pattern (Boninger et
al., 2002; Boninger et al., 2005), which is recommended by clinical practice guideline
(Boninger et al., 2005). The semicircular pattern is characterized by the hands falling
below the propulsion pattern during the recovery phase (details in Chapter 5).

114
Participants were given ample time to practice the semicircular pattern. The
participant then performed 2 trials of wheelchair propulsion, one at 0.9 m/s and the
second at 1.6 m/s for 1 min.
Ramp: A wooden ramp of 4° was constructed. It was 4.1m long and 1.3m wide. The
ramp led to a 1.3m*1.2m platform. Each participant performed 2 trials of propulsion
along the ramp at a self-selected speed.
6.2.5 Data analysis
6.2.5.1 Kinetics data analysis
SmartWheel provided forces and moments in 3 global reference planes. A complete
propulsion cycle is defined as palm strike to palm strike. The push phase is defined
as palm strike to palm off, and the recovery phase is defined as palm off to palm
strike at the pushrim for next cycle. For this study, the onset of propulsion was
defined as the point at which a propulsive moment (Mz) was applied to the
SmartWheel, and the end of propulsion was defined as the point at which the
moment returned to zero (Boninger et al., 1997). The recovery phase was defined as
the end of propulsion to the next onset of propulsion, when the SmartWheel moment
was zero.
For each condition, variables from all the cycles were collected at steady state. For
each participant, the average of the 10 continuous cycles at the fast and the slow
speed condition was used for data analysis, while the average of 5 cycles for the
ramp condition was used in subsequent analyse. The key kinetic variables
calculated were average resultant force (Ftot), average tangential force (Ft), and
average moment (Mz). The resultant force (Ftot) is the total force applied to the
pushrim. The tangential force (Ft) is the force directed tangential to the pushrim. Mz
is the moment acting to cause forward motion. In addition, by using the output of the
SmartWheel, the push frequency, push length in degree, and push time were
determined.
6.2.5.2 Wavelet analysis of the EMG signal
All signal processing was performed using custom programs written in Mathematica
(version 6.0, Wolfram Inc., Champaign, IL, USA). EMG data were normalized to
percentage of cycle time and synchronized with kinetic data. The method has been
described in detail in previous chapters (Chapter 3).

115
To determine the onset and cessation of EMG activity, a threshold was computed for
each muscle and each subject. The onset of EMG activity was defined as the time
when the EMG total intensity remained above a threshold. The cessation of the EMG
activity was defined as the time when EMG total activity remained below the
threshold level. The duration of EMG activity was then calculated as the time
difference between the onset and cessation of the EMG activity. The peak EMG
activity was defined as the time then the EMG total intensity was highest. The results
are reported as percentage of cycle.
6.2.5.3 Principal component analysis
The data set consists of a p x N matrix. Where p = 9 wavelet domain and N =5000
(subjects*trials*20 partitioned windows) for each muscle. The principal component
weighting is given by the eigenvector, and can be displayed graphically as a function
of the centre frequencies of the corresponding wavelets. The principal component
loading score is given by the eigenvalue, and is a scalar value that describes the
amount of each eigenvector in each measured spectrum (Hodson-Tole and Wakeling,
2007). PCI loading scores have been shown to correlate with total signal intensity,
while PCII loading scores relative to PCI loading scores provide a measure of the
relative frequency content within the signal (Wakeling and Rozitis, 2004; Hodson-
Tole and Wakeling, 2007). A quantitative measure of the contribution of high and low
frequency content within the signal is thus given by the angle θ formed between the
PCI and PCII loading scores (Wakeling, 2004; Wakeling and Rozitis, 2004; Hodson-
Tole and Wakeling, 2007). Large angles of θ represent a relatively large low
frequency signal component, while small angles of θ represent a relatively large high
frequency signal component. To determine changes in motor unit recruitment over
time course of a propulsion cycle data from each push were partitioned into 20 equal
time windows and mean values calculated for each time window. Principal
component were calculated for each of the 20 partitioned time windows within the
propulsion cycle, enabling the relative signal frequency content to be defined for
different time points within the propulsion cycle.
6.2.6 Statistical Analysis
Mean values were calculated from each propulsion cycle and each subject. Statistical
analysis was performed using SPSS (SPSS 16, SPSS, Inc., Chicago, IL). One-way
ANOVA were conducted to compare kinetic performance, EMG onset, cessation, and

116
duration among the three test conditions. Significant differences in EMG intensity,
PCI loading scores, and θ of each propulsion condition and propulsion time window
were analyzed within each muscle using full- factorial general linear model ANOVA,
with the condition and time windows defined as fixed factors. When a significant
difference was indentified, post hoc Bonferroni tests were applied to identify the
differences. In each statistical analysis results were considered to be significant when
p<0.05.
6.3 Results
6.3.1 Kinetics
The average total force (Ftot), average tangential force (Ft), and average moment (Mz),
push length, push time, push frequency, and mechanical effectiveness from two
testing speeds and the ramp condition are shown in table1. Ftot, Ft, Mz, push length
increased significantly with increased speed and also on the incline (Table 6.1).
There were significant differences in push time and % push phase among the testing
conditions. The ramp condition shows a significantly longer %push cycle than both
the slow and fast speed conditions; the fast speed shows the shortest %push cycle.
No significant differences were found in the mechanical effectiveness among the
three conditions.
Table 6.1. Kinetics parameters for 3 conditions of wheelchair propulsion. Data were reported as mean ± SD.
Speed(m/s) 0.9 m/s 1.6 m/s Ramp (self-selected speed) Ave Ftot (N)* 33.75 (9.94)
§ 45.83 (11.65)
§ 83.35(17.47)
§
Ave Mz (N.m)* 6.21(1.12) § 8.31(1.05)§ 17.47(2.80)
§
Ave Ft (N)* 24.14(4.36) § 32.33(4.10)
§ 67.93(12.17)
§
Push Length (degree) § 60.10(7.32)
§ 64.19(4.92) 67.52(12.17)
§
Push time (s)* 1.10(0.16) § 0.89(0.14)
§ 1.08(0.23)
Push frequency(1/s)* 0.93(0.14) § 1.16(0.17)
§ 0.98(0.19)
Mechanical Effectiveness 0.74(0.11) 0.73(0.13) 0.82(0.10) % push phase* 42.95(6.43) 35.27(6.64) 67.17(6.96)
Abbreviation: Ave Ftot: average total force; Ave Mz: average Mz; Ave Ft, average tangential force; % push phase, percentage of push phase *significant difference for P<0.01 §significant difference for P<0.05
6.3.2 EMG activity
Sample EMG signals and propulsion moment (Mz) from the 7 shoulder muscles for
one subject are shown in Fig.6.1 for the 3 conditions. The timing of EMG activity of 7
muscles during wheelchair propulsion is shown in Table 6.2.

117
Figure 6.1. Excerps of raw EMG traces from one subject from 2 speeds. Each panel show 5 seconds of activity. The scale is the same for each muscle across the three conditions. AD, anterior deltoid; PM, pectoralis major; BB, biceps brachii; TB, triceps brachii; UT, upper trapezius; MD, middle deltoid; and PD, posterior deltoid. Mz, the propulsion moment from z direction.
6.3.2.1 Push muscle activities
Anterior deltoid (AD), pectoralis major (PM), biceps brachii (BB), and triceps brachii
(TB) have their primary activity during the push phase (Fig.6.2). These muscles are
defined as push muscles in the present study. At the fast speed, AD showed a
significantly longer EMG duration than at the slow speed, while no significant speed
related differences in EMG duration were found in any of other push muscles,
including PM, BB, and TB. The timing of EMG onset, cessation and peak were
similar in these push muscles at the two speeds (Table 6.2).
In the ramp condition, the cessation of EMG activities of the push muscles, AD, PM,
BB, TB, occurred significantly later than in either the fast or the slow speed condition.
In addition, AD, PM, BB displayed significantly longer EMG duration in the ramp
condition than in the fast or the slow speed condition. The timing of peak EMG
activity was significantly later in AD and TB for the ramp condition than for the fast
and slow speed condition. TB showed a significantly shift of EMG onset in the ramp
condition (Table 6.2).
BB
AD
UT
MD
PD
PM
TB
Mz
-5
30
-5
30
-5
30
0.9m/s 1.6m/s ramp

118
Table 6.2. Timing of EMG activity of 3 conditions of wheelchair propulsion. Data were reported as mean ± SD.
Onset (SD)
(% of cycle)
Cessation (SD)
(% of cycle)
Duration (SD)
(% of cycle)
Peak (SD)
(% of cycle)
Muscle
0.9
(m/s)
1.6
(m/s) ramp
0.9
(m/s)
1.6
(m/s) ramp
0.9
(m/s)
1.6
(m/s) ramp
0.9
(m/s)
1.6
(m/s) ramp
AD
n=11
89
(8)
80
(6)
90
(13)
28
(6)
31
(11)
56
(13)*
40
(9)*
52
(12)*
69
(10)*
10
(8)
11
(8)
33
(20)*
PM
n=12
86
(8)
85
(7)
91
(10)
31
(10)
34
(9)
58
(15)*
45
(8)
50
(11)
67
(10)*
19
(22)
33
(37)
27
(11)
BB
n=11
84
(14)
78
(17)
88
(12)
18
(7)
18
(7)
35
(15)*
33
(13)
40
(18)
47
(12)*
93
(10)
93
(11)
6
(11)*
TB
n=11
97
(3)
92
(9)
22
(19)*
43
(10)
40
(10)
67
(10)*
45
(8)
48
(12)
45
(15)
22
(13)
14
(7)
50
(11)*
UT
n=12
35
(9)*
27
(7)*
50
(15)*
92
(4)*
87
(7)*
92
(6)
55
(10)
59
(8)
41
(10)*
68
(10)
58
(11)
71
(11)
MD
n=12
26
(5)*
18
(7)*
41
(14)*
92
(4)
88
(5)
96
(8)
66
(8)
70
(10)
54
(10)*
71
(11)*
50
(20)*
71
(8)
PD
n=12
30
(7)*
20
(9)*
46
(15)*
93
(4)
89
(4)
96
(8)
62
(8)
68
(11)
50
(11)*
72
(12)*
54
(18)*
69
(9)
*significant difference for P<0.01, group mean data. Abbreviations: AD, anterior deltoid; PM, pectoralis major; BB, biceps brachii; TB, triceps brachii; UT, upper trapezius; MD, middle deltoid; and PD, posterior deltoid.
On the other hand, for the push muscles, AD and PM, the EMG intensity and PCI
loading scores increased significantly with increased speed and also on the incline
(P<0.01), with greatest EMG intensities and PCI loading scores occurring in the ramp
condition (Fig.6.3. For BB and TB, the slow speed showed significantly lower EMG
intensity and PCI loading scores than the fast speed and the ramp condition, while
there was no significant difference in EMG intensity and PCI loading scores between
the fast speed and the ramp condition. The ramp conditions showed the greatest
EMG intensity and PCI loading scores among the three conditions for all the push
muscles (Fig.6.3). The value of theta was significantly lower in the ramp condition for
AD, PM and BB than in the slow and fast speed condition, whereas there was no
significant difference in theta between fast and slow speed.
6.3.2.2 Recovery muscles activities
The upper trapezius (UT), middle deltoid (MD), and posterior deltoid (PD) were active
mainly during the recovery phase (Fig.6.2). They are defined as recovery muscles in
the present study. There were significant differences in the EMG onset and timing of

119
EMG peak activity among the three conditions in UT, MD, and PD (Table 6.2). The
fast speed exhibited significantly earlier EMG onset and peak activity in these
recovery muscles than the other two conditions, whereas EMG onset and peak
activities occurred significantly later in the ramp condition than at the fast speed. The
ramp condition also showed a significantly shorter EMG duration in UT, MD, and PD
than either the slow speed or the fast speed.
For the EMG intensity and PCI loading scores, the ramp condition showed
significantly lower EMG intensity and PCI loading scores in MD than the slow and
fast speed (Fig.6.3). While the PD had significantly higher EMG total intensity and
PCI in the ramp condition than in the slow speed. The value of theta was significantly
higher in the ramp condition for MD and PD than in the slow and fast speed condition.
No significant differences were found in EMG intensity and theta for UT between
conditions.

120
0
0.3
0.6
0
0.5
1
0
0.4
0.8
0
0.3
0.6
0
0.4
0.8
0
0.9
1.8
0
0.4
0.8
0 10 20 30 40 50 60 70 80 90 100
-5
10
25
0 10 20 30 40 50 60 70 80 90 100
Figure 6.2. Total EMG intensity and pushrim moment during each propulsion stroke for the different muscles. Each trace shows the mean (think line) + S.E.M. (thin line). The black dotted line shows data for the trials at 0.9m/s; the solid black line for 1.6m/s. the grey line shows data from the trials on the ramp. AD, anterior deltoid; PM, pectoralis major; BB, biceps brachii; TB, triceps brachii; UT, upper trapezius; MD, middle deltoid; and PD, posterior deltoid.
MD
Propulsion moment
% cycle
AD
PM
BB
TB
MD
PD
UT
EMG
Intensity

121
0
0.25
-0.04 0 0.04
0
0.3
-0.1 0 0.1
0
0.35
-0.04 -0.02 0 0.02
0
0.16
-0.04 0 0.04
0
0.35
-0.03 0 0.03
0
0.45
-0.04 0 0.04
0
1.2
-0.1 0.4
Figure 6.3. Principal component loading scores for PCI (ordinate) and PCII (abscissa ) from different shoulder muscles during wheelchair propulsion at slow speed (open circle), fast speed (solid circle), and at self-selected speed ramp (grey triangles). There are 20 points on each graph which represent the 20 time windows within each propulsion cycle.
AD PM
BB TB
UT MD
PD

122
6.4 Discussion
6.4.1 Motor control strategies between muscles in different propulsion conditions
The kinetic data showed a significantly shorter %push phase in the fast speed
condition, which was consistent with Koontz et al’s (2002) study of shoulder
kinematics and kinetics during two speeds of wheelchair propulsion (Koontz et al.,
2002). Participants executed the push phase faster to maintain increased speed. As
for the propulsion up a ramp, the participants adapted the forward lean posture to
help prevent backward tipping. They used shorter strokes and moved their hands
back more rapidly to avoid rolling backward between pushes; this action would
explain that the longest % push cycle was found in the ramp condition.
The present study shows the differences in EMG activity patterns of superficial
shoulder muscles at different propulsion condition. There were significant changes in
the EMG timing of shoulder activities during the three propulsion conditions. These
results suggest that there were different muscle activation strategies present in
different wheelchair propulsion conditions. The muscle recruitment patterns can be
altered by propulsion speed change and posture.
The patterns of push phase muscles recruitment were significantly different between
the two propulsion speeds. The EMG activity duration of these muscles were longer
in fast speed than in the slow speed, which is associated with earlier onset and later
cessation. The prolonged EMG activity in the push muscles may go with an effort to
improve velocity. The significantly longer EMG duration of the push muscles in the
ramp condition was coincident with the longer %push phase, which demonstrates an
effective adaptive response of the synergistic muscles to the external requirements.
These results together suggest that the faster and the ramp propulsion condition
require prolonged muscle activity in the push muscles. In addition, EMG intensity
increased with increased speed and on the incline, with the greatest intensities
occurring in the ramp condition. This corresponds with the kinetic data total force
output for the 3 conditions. The findings of this study thus indicate that fast and ramp
wheelchair propulsion places higher load on these push muscles and hence requires
higher muscle activation levels.
After the hand terminates its contact with the pushrim, recovery muscles, UT, MD,
and PD, contribute to the deceleration of the arm during follow-through part of the
push phase and return the arm to its starting position. The recruitment patterns of
these muscles in the recovery phase were remarkably different in the 3 conditions.

123
The onset and peak EMG activities of the recovery muscles were significantly earlier
at fast speed than at slow speed, which is coincident with the significantly shorter
%push phase at the fast speed. The ramp condition showed a significantly shorter
%recovery phase, the EMG duration of the recovery muscles were significantly
shorter than at both fast and slow speed. MD and UT showed significantly lower
EMG intensity in the ramp condition. On the other hand, the EMG intensities of
recovery muscles were significantly higher for fast speed than for slow speed, which
may be associated rapid movement in the recovery phase.
While semicircular pattern is adopted for level propulsion, arcing is the most popular
pattern for pushing uphill (de Groot et al., 2004; Richter et al., 2007). When pushing
uphill, the user must maintain her/his balance and not tip backward. In addition,
missing a push could mean losing control and rolling backward down the hill. With
the arcing pattern, the user’s hands remain close to the pushrim when coasting,
allowing her/him to make quick corrections. The increased EMG intensity of PD for
the ramp condition may be related to the forward lean trunk position.
The push muscles, AD, PM, BB, and TB, the prolonged activities and higher
activation lever contribute more propulsive force on the pushrim to meet the high
mechanical demand for fast speed and inclination. On the other hand, the recovery
muscles, PD, MD, and UT, recruitment patterns differed significantly between
conditions, with an effective effort to stabilize the shoulder joints and adjust posture
for different motor task. These two synergies worked differently between the
conditions and indicate that coordinated motor behavior is precisely regulated to
match the requirement for movement and to allow for highly specialized and flexible
motion. A number of studies have identified altered muscle recruitment patterns are
associated with musculoskeletal disorders. Szeto et al (2005) reported altered neck
and shoulder muscle recruitment patterns in symptomatic and asymptomatic office
workers during computer work (Szeto et al., 2005). Mulroy (2004) el al also reported
that the level of SCI significantly affected the shoulder muscles recruitment patterns
during wheelchair propulsion (Mulroy et al., 2004). Further EMG investigation of the
shoulder muscles during wheelchair propulsion may highlight the influence of
shoulder pain on the muscle recruitment patterns of the manual wheelchair users.
It has been suggested that shoulder joints subjected to intensive repetitive motion are
at high risk for injury (Delgrosso and Boillat, 1991; Hagberg et al., 1992; Loslever and
Ranaivosoa, 1993). Previous studies with different setups have observed increased

124
joint loading at faster propulsion speeds (Kulig et al., 1998; Koontz et al., 2002).
Rotator cuff degeneration injuries are common among wheelchair user with shoulder
pain and injuries (Bayley et al., 1987; Barber et al., 1996; Veeger et al., 2002; Lin et
al., 2004). The insertion of supraspinatus tendon into the humeral head is a critical
zone for rotator cuff injury. This critical zone has found to have smaller veins,
capillaries and arteries. However, when fast propulsion speed requires the production
of rapid and strenuous movements, the muscles can be activated to the extent that
circulation is temporarily rendered ineffective because of pressure of the blood
vessels from contracting muscle fibers. As a result, this critical zone may be at a high
risk of injury during fast speed wheelchair propulsion. In addition, pushing a manual
wheelchair at fast speed not only requires higher propulsion force but also faster
repetition, which makes the shoulder muscles more susceptible to fatigue. Muscle
fatigue could increase the risk of shoulder injury (Koontz et al., 2002). Boninger et al
reported that wheelchair users who push with a faster cadence and load the pushrim
more rapidly have more median nerve damage (Boninger et al., 2005). On the other
hand, during propulsion up a ramp, the necessary downward push to avoid backward
tipping tends to drive the humeral head up into the glenohumeral joint, and is a
probable cause the shoulder impingement (Boninger et al., 2003; Koontz et al., 2006;
Chow et al., 2009).
6.4.2 Motor unit recruitment patterns within an individual muscle in different propulsion conditions
In this study, the EMG signals were decomposed by the wavelet technique and then
quantified by principal component analysis. The relative signal frequency
components were explained by PCI-PCII loading scores, with negative PCII loading
scores indicated a relative high proportion of low frequency components, while
positive PCII loading scores indicated a relative high proportion of high frequency
components. PCI loading scores were highly correlated to the EMG intensity. The
value of θ is defined as the angle between PC I and PC II loading scores. It has been
shown that the angle θ is very sensitive to the frequency shift that corresponds to
spectral difference between types of motor units in both fine wire (Hodson-Tole and
Wakeling, 2007) and surface EMG (Wakeling, 2004; Wakeling and Rozitis, 2004;
Wakeling et al., 2006). This means that a higher value of θ represents relatively more
low frequency signal content and it can be associated with the recruitment of slower
motor units. A smaller θ value, associated with relatively more high frequency content,
can be associated with the recruitment of faster motor units.
125
It has been shown that, as the speed of movement increases, successively faster
muscle fiber types are recruited in addition to (but not at the exclusion of) slower fiber
types in vertebrate locomotion (Armstrong, 1981). Thus, slower muscle fibers are
used to power slow- and medium-speed movements while both slow and faster fibers
are used during rapid movement (Jayne and Lauder, 1994). In the present study, the
faster speed PCI-PCII planes of the 7 muscles were characterized by higher PCI-
PCII loading scores, represented by the smaller theta values. Although the mean θ
value did not differ significantly between the propulsion speeds, the smaller θ values
in some of the windows from the fast propulsion cycle may indicate that a relatively
high proportion of fast MU was recruited to match contractile properties to the
mechanical requirements of the faster motion.
In the ramp condition, the PCI-PCII the patterns of the push muscles, AD, PM, and
BB, were characterized by a higher number of positive PCII loading scores,
represented by the smaller theta values. The significantly lower θ values in the ramp
condition suggested a higher proportion of fast MUs recruited to generate higher
force required for pushing along the ramp. Whereas for TB, larger θ values across all
time windows associated with a negative contribution of the PCII loading scores,
indicating a higher contribution of low frequency content. The selective recruitment of
slow fibers in TB may be associated with its functional role to maintain the postural
task for a longer duration and to overcome gravity on the ramp.
EMG activities of the recovery muscles in the ramp condition were characterized by
relatively more low-frequency content, represented by larger θ values. This reflected
selective recruitment of slower MUs in the ramp condition. The recruitment of slow
motor units may be associated with stabilizing the shoulder joints and maintaining the
forward lean posture for a longer duration. It has been reported that locomotion on a
ramp leads to a significant increase in low frequency components in EMG signal.
Histochemical studies of fiber type composition show that the deltoid muscles and
upper trapezius muscles have a high proportion of slow-oxidative (SO) fibers
(Srinivasan et al., 2007). The posterior deltoid (PD) has the particularly high average
SO proportion of 56%. The high proportion of slow fibers in these muscles may be
associated with the role they play in postural maintenance and the stabilization of the
shoulder joints. In the present study PD displayed a significantly higher EMG
intensity and larger θ in the ramp condition than in slow speed condition, indicating a
relatively high proportion of slow fibers recruited for the ramp condition to maintain

126
the forward lean posture for a longer time and to overcome the backward component
of gravity (Hodson-Tole and Wakeling, 2008b). On the other hand, PD showed a
higher EMG intensity and smaller θ at the fast speed than at the slow speed, which
may be associated with the preferential recruitment of faster MUs for rapid movement.
It is well known that neural factors play an important role in muscle activities (Rosen
et al., 1999). Nevertheless, motor programs and plans at these higher levels have,
ultimately, to become shaped into motor behavior via commands to the final common
path of the motor system: the motoneurons and the muscle motor units. The basic
idea is that of the size principle, according to which the smallest motoneurones are
the first to be recruited, followed by successively larger motoneurones. The size of a
motoneurone is roughly correlated with the types of muscle motor units it innervates;
small motoneurones innervate slow motor units, while large motoneurones innervate
fast motor units. Slow motor units develop relatively little tension and are highly
resistant to fatigue; they can thus keep up a series of repeated contractions with little
loss of force, for example during the maintenance of posture, while fast motor units
which develop large tensions may only be needed to be activated for brief periods of
exertion. In addition, it is known that fast and slow muscle fibers vary in their
energetic properties, and it has been suggested that muscle fiber type distribution
influences energy expenditure and the energetically optimal cadence during pedaling
(Umberger et al., 2006). Most vertebrate muscle contains several different fiber types
that are proposed to allow more effective movement. Faster fibers generate
maximum power output and efficiency at higher shortening velocities than do slow
fibers, while the slow fibers are metabolically economical in the use of posture
maintenance contractions for long time. Thus recruiting the most appropriate motor
unit to maximize power output or contractile efficiency may result in considerable
energetic savings during locomotion.

127
Chapter Seven: Mechanomyographic amplitude and frequency response during wheelchair propulsion
7.1 Introduction
The mechanomyography (MMG) amplitude and frequency response have been
examined extensively during well-controlled isometric-isotonic muscle
contractions(Beck et al., 2004a; Coburn et al., 2004b; Coburn et al., 2004a; Beck et
al., 2005c; Coburn et al., 2005; Esposito et al., 2005). However, the relationship
between force and MMG signal has been less thoroughly studied during dynamic
actions. Several factors can affect the MMG signal during dynamic muscle actions.
They include the movement artefacts(Beck et al., 2005c), the thickness of the tissue
between the muscle and the MMG sensor, the physical configuration of the MMG
sensors (Beck et al., 2006a), and the changes in force production during dynamic
muscle activities(Coburn et al., 2004b). These factors can confound the interpretation
of the motor unit recruitment pattern based on the analysis of amplitude and
frequency analysis of MMG signal. However, several studies have investigated the
MMG amplitude and/or response during cycle ergometry (Shinohara et al., 1997;
Stout et al., 1997; Perry et al., 2001c; Hendrix et al., 2008). The results from these
studies suggested that MMG amplitude increased linearly with increased power
output during incremental cycle ergometry. In addition, no significant change in MMG
mean power frequency for the vastus lateralis muscle was found (Shinohara et al.,
1997).
The previous chapters (Chapter 1 and 2) have documented the MMG time-frequency
responses during isometric, eccentric, and concentric muscle contractions by using
wavelets analysis. The results suggest that MMG can provide information about
motor unit recruitment patterns. The purpose of present study was to investigate the
MMG time-frequency response during dynamic muscle actions. The MMG activity
was recorded in 3 shoulder muscles during two speed wheelchair propulsion.
7.2 Materials and Methods
7.2.1 Participants
15 able-bodied participants (8 males, 7 females, age: 30±4 years, weight: 65±12 Kg)
volunteered to participate in this study. They all gave their informed consent in
accordance with the procedures approved by the University of Alberta ethics

128
committee. None reported any previous history of upper extremity pain or any
neuromuscular disorder.
7.2.2 Surface Mechanomyography
Mechanomyography (MMG) was recorded using piezoelectric transducers (23mm
diameter, 12.5g weight, GRASS technologies, Rhode Island, USA) on anterior deltoid,
upper trapezius, and biceps brachii on the left shoulder. MMG signals were sampled
at 2000Hz. The MMG signals were recorded with a 16 bit analogue to digital
converter (NI PCI 6220, National Instrument Inc., Austin, Texus, USA) during
wheelchair propulsion. MMG signals were normalized by the use of a maximum
voluntary isometric contraction (MVIC).
7.2.3 Protocol
Participants were given ample time to get used to propelling the wheelchair and
established a comfortable propulsion technique. The participants were advised to
apply semicircular propulsion pattern (details in Chapter 5) (Boninger et al., 2002;
Boninger et al., 2005), which is recommended by clinical practice guideline (Boninger
et al., 2005). The semicircular pattern is characterized by the hands falling below the
propulsion pattern during the recovery phase. The participant then performed 2 trials
of wheelchair propulsion, one at 0.9 m/s and the second at 1.6 m/s for 1 min.
7.2.4 MMG signal processing
All signal processing was performed using custom programs written in Mathematica
(version 6.0, Wolfram Inc., Champaign, IL, USA). MMG data were normalized to
percentage of propulsion cycle time and synchronized with kinetic data (Fig.7.1). The
MMG signals were resolved into intensities in time-frequency space using wavelet
techniques (von Tscharner, 2000). The method has been described in detail in
previous chapters. The first two wavelets of MMG covered the frequency bands of 0-
7 Hz, which is typically associated with movement artifacts. We reduced the effects
of movement due to dynamic contractions by removing the first two wavelets from
spectra. Total intensity was given by summing the intensities over the selected
wavelets (7-90 Hz, k = 1-8). Total intensity is a measure of the time-varying power
within the signal and is equivalent to twice the square of the root-mean-square. The
instantaneous mean power frequency (MPF) was calculated by:
∑
∑=
k
k
k
k
c
i
ikf
MPF
)(

129
With fc representing the center frequency of each wavelet and the mean frequency
calculated as the mean of the MPF values taken from whole propulsion cycle.
Figure 7.1. Excerpts of raw MMG traces from one subject from 2 speeds. Each panel show 10 seconds of activity. The scale is the same for each muscle across the three
conditions.
To determine the onset and cessation of MMG activity, a threshold was computed for
each muscle and each subject. The onset of MMG activity was defined as the time
when the EMG total intensity remained above a threshold. The cessation of the MMG
activity was defined as the time when MMG total activity remained below the
threshold level. The duration of MMG activity was then calculated as the time
difference between the onset and cessation of the MMG activity. The peak MMG
activity was defined as the time then the MMG total intensity was highest. The results
are reported as percentage of cycle.
7.2.5 Statistical Analysis
Mean values were calculated from each propulsion cycle and each subject. Statistical
analysis was performed using SPSS (SPSS 16, SPSS, Inc., Chicago, IL). Paired t-
tests were conducted to test for MMG onset, cessation, duration, MMG intensity, and
MFP between the two testing speeds. In all statistical analysis results were
considered to be significant when p<0.05.
0.9m/s 1.6m/s
BB
AD
UT
Propulsion
moment

130
7.3 Results
Anterior deltoid (AD) and biceps brachii (BB) had MMG activity in both push and
recovery phases (Fig.7.2). The MMG pattern of anterior deltoid showed onset in
recovery phase (64±8% cycle, 70±5% cycle, at fast and slow speed, respectively)
and cessation in the late push phase (28±10% cycle, 22±10% cycle, at fast and slow
speed, respectively)(Table 7.1). The MMG onset of biceps brachii was in the late
recovery phase (78±6% cycle, 81±5% cycle, at fast and slow speed, respectively),
and the cession of MMG was in the early recovery phase (48±11% cycle, 39±18%
cycle, for fast and slow speed, respectively). The fast speed had significantly longer
MMG duration than that of slow speed for both anterior deltoid and biceps brachii.
There was significant difference in MMG intensity between the two testing speeds,
whereas the MFP did not differ between the two speeds for both muscles (Fig.7.3).
Table 7.1. Timing of MMG activity of slow speed (0.9m/s) vs fast speed (1.6m/s) during wheelchair propulsion. Data were reported as mean ± SD.
muscle N Onset
%cycle (SD)
Cessation
%cycle(SD)
Duration
%cycle(SD)
speed 0.9(m/s) 1.6(m/s) 0.9(m/s) 1.6(m/s) 0.9(m/s) 1.6(m/s)
AD 9 70(5) 64(8) 22(10) 28(10) 52(12) * 63(8)*
BB 9 81(5) 78(6) 39(18) 48(11) 56(12)* 70(9)*
UT 10 98(18) 91(10) 53(9) 44(9) 53(13) 52(13)
Abbreviations: AD, anterior deltoid; BB, biceps brachii; UT, upper trapezius; *significant difference for P<0.01, group mean data.
0
50
0
5
0
10
0 10 20 30 40 50 60 70 80 90 100
Figure 7.2. Total MMG intensity during each propulsion stroke for the different muscles. Each trace shows the mean (think line) + S.E.M. (thin line). The grey dotted line shows data for the trials at 0.9m/s; the solid black line for 1.6m/s.
AD
BB
UT
MM
G I
nte
nsi
ty
% Cycle

131
Upper trapezius showed primary activity in push phase. The MMG pattern of upper
trapezius extended from early push phase(91±10% cycle, 98±18% cycle, at fast and
slow speed, respectively) to mid recovery phase (53±9% cycle, 44±9% cycle, for fast
and slow speed, respectively) (Fig.7.2). There were no significant differences in, MFP,
MMG onset, cession, and duration between the two testing speeds. However the
MMG intensity was significantly higher at faster speed than at slower speed (Fig.7.3).
Figure 7.3. MMG spectrum for different muscles. Each trace shows the mean (think line) ± S.E.M. (thin line). The grey dotted line shows data for the trials at 0.9m/s; the solid black line for 1.6m/s.
7.4 Discussion
7.4.1 MMG intensity, MPF and pattern during two speeds wheelchair propulsion
Several studies have shown a linear relationship between MMG intensity and torque
during submaximal concentric and eccentric muscle contractions of the BB (Dalton
and Stokes, 1991; Beck et al., 2006b). It has been hypothesized that this linear
relationship is due to an increase in the number of active motor units as torque
increased (Beck et al., 2004b). In the present study, the MMG intensity was
significantly higher at faster speed than at slower speed in AD, BB, and UT muscles.
This indicates that the muscle activation level could be reflected in the MMG intensity.
Beck et al reported MMG MPF did not change significantly across the isokinetic
torque levels (Beck et al., 2004b). It has been suggested that the frequency content
of the MMG signal may reflect the global firing rate of the unfused activated motor
AD BB
UT
Frequency (Hz)
MM
G I
nte
nsi
ty
Frequency (Hz)
Frequency (Hz)

132
units (Beck et al., 2007a). Therefore, the stable MPF during increase concentric
isokinetic muscle contractions indicated that the global motor unit firing rate didn’t
change with increased torque. In the present study, no significant change in MPF
between fast and slow speed was found. Our results were consistent with previous
studies, which suggest that recruitment may be the primary motor control strategies
during low-moderate level dynamic muscle contractions.
Compared to the EMG pattern showed in chapter 6, the MMG duration of AD and BB
was longer than EMG duration of the same muscles. The MMG pattern of UT is
different from the EMG pattern of UT. UT showed EMG activity mainly in the recovery
phase, whereas UT demonstrated MMG activity in both push and recovery phase.
The proposed origins of MMG signal are 1) gross lateral movement of the muscle as
it moves toward, or away from, its line of pull during contraction and relaxation,
respectively, 2) smaller subsequent lateral oscillations of the muscle at its resonant
frequency, and 3) dimensional changes of the active fibres (Beck et al., 2007a).
Therefore, the MMG pattern of these muscles may reflect the body movement and
shoulder displacement during wheelchair propulsion. Further studies could compare
MMG pattern with kinematics data of the shoulder movement and assist in the
interpretation of these signal components.
7.4.2 Limitations of the use of MMG during dynamic muscle contractions
Movement artefacts are often present in EMG signals. For instance, the usable
energy of the EMG signal is limited to the 0 to 500 Hz frequency range, with the
dominant energy being in the 50-150 Hz range (De Luca, 1979). Movement artefacts
are lower than 20 Hz in EMG, so movement artefacts do not have a large influence
on EMG signal. In the case of MMG, lower frequency cutoff is around 2Hz as
suggested by Orizo (Orizio, 1993), with dominant energy being around 5-60Hz. So
the movement artefact may affect the MMG signal during dynamic movement.
Filtering MMG with appropriate cutoff frequencies have been applied to MMG signal
processing. Several studied have used a filter with a 5 Hz high pass cutoff frequency
to attenuate movement artefact in MMG signal (Bajaj et al., 2002). It has been
suggested that 5 Hz high pass filters reduced the influence of body movements and
gross limb displacement. In the present study, the first 2 wavelets, covered the
frequency range 0-7Hz, were removed from the spectra. Further MMG signal process
technique studies may focus on during dynamic movement to filter the movement-
related noise without attenuation of the signal of interest.

133
Although MMG is attracting more attention in fields such as biomechanics, exercise
physiology, and clinical studies, the literature base for MMG is probably 20-25 years
behind that of EMG (Beck et al., 2005c). The dynamic muscle actions are often
avoided in MMG research on the grounds that during these activities, there are too
many confounding factors that could influence the MMG signal and render the
resulting data uninterruptable and unusable (Beck et al., 2005c). However, there is
substantial evident to suggest that MMG signal provides meaningful information
regarding muscle function during dynamic muscle contractions. Thus, it is important
to continually examine the potential uses/ application of MMG in a variety of
experiment situations.

134
Chapter Eight: Changes in surface electromygraphic signals and kinetics associated with progression of fatigue at two speeds during wheelchair propulsion
8.1 Introduction
Manual wheelchair users (MWU) rely on their upper extremities for independent
mobility and other critical functions, and thus shoulder pain can be debilitating.
Estimates of shoulder pain among MWU with paraplegia range from 30% to 73%
(Pentland and Twomey, 1991; Ballinger et al., 2000). The high prevalence of
musculoskeletal disorders of MWU has provoked new emphasis on the study of
shoulder pain with long-term consequences. “Overuse syndrome” has been
described as one potential cause for pain in MWUs (Miyahara et al., 1998; Groah
and Lanig, 2000). To develop effective strategies to minimize the destructive effect of
shoulder pain, it is important to first understand the physiological and mechanical
processes that may expose tissues to the risk of injury. Such insight may lead to
better prevention of pain or overuse of the upper extremities.
It has been suggested that muscle fatigue plays a critical role in musculoskeletal
overuse (Niemeyer et al., 2004). By examining the fatigue condition, it should be
possible to establish a protocol that mimics conditions present with overuse injuries
(Kumar, 2001). Several studies (Rodgers et al., 1994; Rodgers et al., 2003; Rice et
al., 2009) have shown some biomechanical changes occurring during wheelchair
propulsion in a fatigue state. These changes are also reflected in the EMG signals
(Bernasconi et al., 2007). Examination of the change in the electromyographic (EMG)
signal has been widely promoted as a valuable, noninvasive technique by which the
development of local muscle fatigue can be evaluated during static as well as
dynamic contractions (De Luca, 1997; Knaflitz and Bonato, 1999). It is well known
that the myoelectrical manifestations of muscle fatigue cause a decrease in the mean
power frequency (MPF) of the power spectrum. When dynamic contractions are
considered, the spectral estimation technique must be carefully chosen, taking into
account the specific type of non-stationarity exertion affecting the signal of interest.
Wavelet analysis with well-defined time and frequency resolution has been shown to
provide a highly sensitive method of assessing non-stationary EMG (von Tscharner,
2000). The spectrum analysis showed a shift to higher frequencies as faster fibres
being recruited, which indicated recruitment patterns of different types of motor unit
are related to the mechanical requirements of the locomotor task. These methods
make it possible to estimate muscles fibre types and characteristics that are typically
assessed by histochemical means can also be assessed to a certain extent with the

135
wavelet analysis. In addition, It has proposed that during more strenuous activity,
muscles surrounding a joint fatigue at differential rates (Kumar, 2001). Muscle
coordination might change as compensatory mechanisms during fatiguing dynamic
tasks. In deed, Bernatsconi et al reported inefficient muscle coordination occurred
during exhaustive wheelchair propulsion (Bernasconi et al., 2007). Therefore,
changes in the EMG characteristics and the muscle recruitment pattern may occur as
fatigue progresses during a dynamic task. The ability to measure shoulder muscle
fatigue can enhance our understanding of shoulder muscle function and potentially
provide a tool for fatigue assessment.
During occupational and rehabilitation tasks and daily activities the MWU do not
necessarily perform heavy intensity propulsion and may become only mildly fatigued.
In the present study, wheelchair propulsion to a point of mild fatigue was investigated
at two different speeds, slow (0.9m/s) and fast (1.6m/s). Our purpose was to test the
hypothesis that mildly fatigue causes changes in motor unit recruitment within
individual shoulder muscles and in the coordination of shoulder muscles as well as in
wheelchair kinetics. This information would be useful for developing the strength
training and rehabilitation programs for wheelchair users.
8.2 Materials and Methods
8.2.1 Participants
14 able-bodied participants (7 males, 7 females, age: 30±4 years, weight: 65±12 Kg)
volunteered to participate in this study. They all gave their informed consent in
accordance with the procedures approved by the University of Alberta Ethics
Committee. None reported any previous history of upper extremity pain or any
neuromuscular disorder. Participants were instructed not to perform any exercise 48
h before measurements.
8.2.2 Surface electromyography
Please see details in Chapter 5. 8.2.3 Kinetic
Please see details in Chapter 5. 8.2.4 Test procedure
The test wheelchair (Quickie GP, Sunrise Medical, Longmont, CO, USA) was aligned
and secured over the rollers of an ergometer, which connected to a monitor placed in

136
front of the participant to provide visual speed feedback. The SmartWheel was
placed on the right side of the test wheelchair with standard foam cushion.
Participants were given several minutes to get used to propelling the wheelchair and
to establish a comfortable propulsion technique. Then the participants were advised
to apply the semicircular propulsion pattern, which is recommended by clinical
practice guidelines (Boninger et al., 2002; Boninger et al., 2005).
During testing, participants were asked to perform 2 trials of wheelchair propulsion,
the first one at 0.9 m/s, the second one at 1.6 m/s. In each case the participant would
continue pushing at the set speed until they felt it hard to maintain. The slow speed
0.9m/s was selected because it is close to minimally safe speed (1.06 m/s, the speed
required to cross a street with a timed light)(Cowan et al., 2008). The fast speed
1.6m/s was faster than the normal adult walking speed (1.3m/s) to present a
challenging and strenuous situation for the participants.
In the present study, a sufficiently challenging level of exertion was established while
minimizing the risk of injury. To facilitate awareness and rating of signs of fatigue
during testing, participants were given a scale of “Ratings of Perceived Exertion
(RPE)” pertaining to both general tiredness and localized muscle fatigue. Levels 15
to 20 on that scale were deemed to mark the highest level of effort prior to
exhaustion. Participants felt mildly fatigued after testing.
The endurance time thus registered would differ according to each participant's
fitness level and strength. Results were normalized by setting the actual endurance
time in each case as 100% and dividing it into 5 equal windows expressed as %
endurance time. The last 10 propulsion cycles of each of these 5 time windows were
selected for data analysis.
8.2.5 Data analysis
8.2.5.1 Kinetics data analysis
Please see details in Chapter 6. 8.2.5.2 Wavelet analysis of the EMG signal
Please see details in Chapter 6.
8.2.5.3 Principal component analysis
Please see details in Chapter 6.

137
8.2.6 Statistics
Mean values were calculated from each propulsion cycle and each subject. Statistical
analysis was performed using SPSS (SPSS 16, SPSS, Inc., Chicago, IL, USA).
Mixed model analysis of variance (ANOVA) was used for statistical analysis. The
between-subject factor is speed. The within-subject factor is % endurance time.
Repeated measures ANOVAs were used to analyze EMG total intensity, duration,
MPF, θ, and kinetic variables. Significant level was set at p< 0.05 for all statistical
procedures.
8.3 Results
In the present study, the prompt recognition of fatigue, either localized in a particular
muscle or experienced as general tiredness of the whole body, allowed for a
sufficiently challenging level of exertion while minimizing the risk of injury or overuse
syndromes. The highest level of exertion was set at RPE 15 (out of maximum of 20).
The average duration at the fast speed (1.6m/s) was 154±74s; the average number
of push cycles at the fast speed was 172 ±111 cycles. The average propulsion
duration at the slow speed (0.9m/s) was 334 ±139s; the average number of push
cycles for the slow speed was 307±146 cycles. The participants were only mildly
fatigue after the testing.
8.3.1 Propulsion kinetics
Fig.8.1 displays the kinetic mean values calculated at 20%, 40%, 60%, 80%, and
100% of the endurance time during prolonged wheelchair propulsion at the slow and
the fast speed. Peak Ftot, Peak Ft, Ave Ftot, Ave Ft, push time, and push frequency
were significantly different between the two speeds, whereas there is no significant
effect of % endurance time on these kinetic variables for the two propulsion speeds.
Push length at 20% endurance time was significantly longer than at 100% endurance
time for both speeds, while the main effect of % endurance time had no statistically
significant (P = 0.052) effect on push length for either speeds.
8.3.2 EMG characteristics
The EMG intensity, mean power frequency (MPF), and theta (θ) at 20%, 40%, 60%,
80%, and 100% of the endurance time are shown in Fig.8.2. There is a significant
effect of % endurance time on the EMG intensity for the tested muscles (P<0.05),
except BB (P = 0.079), EMG intensity increased continuously throughout the
propulsion duration for both speed conditions. The EMG intensities for AD, PM, BB,

138
and TB were significantly greater at the fast speed than at the slow speed (P<0.05),
while there were no significant differences in EMG intensity for UT, MD, and PD
between the two speeds. Mixed model ANOVA revealed that the EMG MPF
decreased linearly (P<0.05) with %endurance time in all the 7 muscles for both
speed conditions, while there was no significant difference in MPF between the two
speeds. There were no significant differences in θ between the tow speeds.
Significantly differences (P<0.05) did exist in θ along the scale of %endurance time,
showing that θ differed significantly over time for AD (P<0.001), PM (P<0.001), TB
(P=0.002), UT (P<0.001), and MD (P<0.001), except in BB (P=0.160) and PD
(P=0.077).
Although shoulder muscle activity increased significantly during fatigue (Fig.8.3),
there was no significant effect of the % endurance time on the EMG duration in the
present study. The significant differences did however exist between the two speeds,
showing that muscle activity differed significantly at different speed.

139
0.8
1.7
sp
ee
d (
m/s
)
30
60
Pe
ak
Ft
(N)
40
75
Pe
ak
Fto
t (N
)
30
60
Av
e F
tot
(N)
0.7
1.2
pu
sh
tim
e (
s)
0.7
1.5
fre
qu
en
cy
(1
/s)
55
70
20 40 60 80 100
Le
ng
th (
de
gre
e)
0.6
0.8
20 40 60 80 100
ME
Figure 8.1. Changes in the pushrim kinetics parameter: speed, peak total force (peak Ftot), peak tangential force (peak Ft), average total force (Ave Ftot), push time, push frequency, push length in degree, and mechanical effectiveness (Ft / Ftot) as a function of time (expressed as a percentage of the endurance time) during the fast speed (black line) and slow speed (grey line) wheelchair propulsion. Values reported as mean ± S.E.M.
Time (% endurance time) Time (% endurance time)

140
0
0.4
EM
G in
ten
sit
y
85
125
MF (
Hz)
1.2
1.8
theta
(ra
d)
0
0.7
EM
G in
ten
sit
y
70
95
MF
(H
z)
1.2
1.7
theta
(ra
d)
0
0.4
EM
G in
ten
sit
y
85
125
MF
(H
z)
1.7
1.8
the
ta (
rad
)
0
0.4
EM
G in
ten
sit
y
87
102
MF
(H
z)
1.4
1.7
the
ta (
rad
)
0
0.7
EM
G in
ten
sit
y
80
100
MF
(H
z)
1.4
1.7th
eta
(ra
d)
0
0.9
EM
G in
ten
sit
y
85
110
MF
(H
z)
1.3
1.7
theta
(ra
d)
0
1.8
20 40 60 80 100
EM
G in
ten
sit
y
85
110
20 40 60 80 100
MF
(H
z)
1.3
1.6
20 40 60 80 100
the
ta (
rad
)
Figure 8.2. Changes in the EMG intensity, MPF, and theta as a function of time (expressed as a percentage of the endurance time) during the fast speed (black line) and slow speed (grey line). Each point is the average value (mean ± S.E.M., n=14) of the 10 cycles of each time window.
Time (% endurance time) Time (% endurance time) Time (% endurance time)
AD
PM
BB
TB
UT
MD
PD

141
0
0.8
0
0.2
0
1.6
0
0.4
0
1.2
0
0.6
0
0.2
0
1.6
0
1.2
0
1.5
0
1.3
0
2.7
0 10 20 30 40 50 60 70 80 90 100
0
2
0 10 20 30 40 50 60 70 80 90 100
Figure 8.3. EMG intensity for 7 shoulder muscles obtained at the 20% endurance time window (black lines) and at the 100% endurance time window (grey lines) of the two speed wheelchair propulsion. Time zero indicates the hands on the pushrim. Each profile represents the mean(think line) ± S.E.M (thin lines) obtained from averaging individual data across 10 consecutive propulsion cycles of each time window. AD, anterior deltoid; PM, pectoralis major; BB, biceps brachii; TB, triceps brachii; UT, upper trapezius; MD, middle deltoid; and PD, posterior deltoid.
0
0.2
AD
PM
BB
MD
UT
TB
PD
EMG
Intensity
%Cycle %Cycle
Push phase Recovery phase Push phase Recovery phase
1.6m/s 0.9m/s
142
8.4 Discussion
8.4.1 The effect of muscle fatigue on the motor unit recruitment pattern
The term “muscle fatigue” is used to denote a transient decrease in the capacity to
perform physical actions (Enoka and Duchateau, 2008), and it can be measured as a
change in electromyographic activity (Edwards, 1981). In the present study, the EMG
signals were decomposed by the wavelet technique and then quantified by principal
component analysis. Wavelet analysis is a technique that provides information on the
time-frequency variation of the signal so that the amplitude, timing and frequency
content can all be resolved simultaneously. Wavelets in non-linearly scaled time-
frequency windows can provide an optimal time or frequency resolution for the non-
stationary EMG signal during dynamic contractions. When the muscle is fatigued, a
strengthening of low frequency components and a reduction in intensity of high
frequency components modifies the spectrum of the SEMG signal (Singh et al.,
2007). Principal component analysis (PCA) can be applied to quantify spectra shifts.
The relative signal frequency components associated with the contribution of high
and low frequency content within the EMG signal were explained by the angle formed
between the PCI and PCII loading scores(θ). Higher values of θ represent a relatively
large low frequency component, while lower values of θ represent a relatively large
high frequency component (Hodson-Tole and Wakeling, 2008b). It has been shown
that the θ is very sensitive to the frequency shift that corresponds to spectral
differences between types of MUs in both fine wire (Hodson-Tole and Wakeling,
2007) and surface EMG (Wakeling, 2004; Wakeling and Rozitis, 2004; Wakeling et
al., 2006).
In the present study, fatigue-related changes in the EMG data were identified as an
increase of EMG intensity and a decrease of EMG MPF as a function of %endurance
time for the tested muscles (except BB) under both fast and slow speed conditions.
Our findings were in agreement with previous investigations showing that a
compression of the power spectrum to lower frequencies is typically observed during
a fatiguing contraction (Bonato et al., 2001; Dimitrova and Dimitrov, 2003). The
increase in EMG intensity might be due to one or more of several factors including
the recruitment of additional MUs to compensate for the loss of force (Dimitrova and
Dimitrov, 2003), impaired excitation-contraction coupling(Stephenson et al., 1995;
Lamb, 2002), increased firing rate, and/or synchronization of motor unit recruitment
(Freund, 1983; Newham et al., 1983).

143
The angle θ is formed by the first two principal components of the spectra. Principal
component analysis extracts the important features in the signal, so some variables,
such as movement artifacts (De Luca, 1997), were given lower order components
and were excluded. In the present study, the first two principal components (PCI and
PCII), accounting for more than 85% of the EMG signal, were considered. It has
been shown that θ to be very sensitive to the frequency shift that corresponds to
spectral differences between difference types of motor units(Wakeling, 2009b). A
higher value of θ represents relatively more low frequency signal content and it can
be associated with the recruitment of slower motor units. A smaller θ value,
associated with relatively more high frequency content, can be associated with the
recruitment of faster motor units (Hodson-Tole and Wakeling, 2008b).
The time-dependent shift in mean power frequency (MPF) of electromyographic
(EMG) signals to lower frequency components during the fatigue process was
reflected by the changes in θ. Higher-frequency source spectra are generated by
faster motor units due to the faster conduction velocity of their motor unit action
potentials (Wakeling, 2009b), however, faster motor units fatigue more quickly. It is
expected an increase in θ during fatigue, as reflected by the progressive fatigue of
faster motor units being recruited. The θ increased almost linearly with % endurance
time, there was a significant difference between the first and last endurance time
window.
The changes in θ during fatigue may be influenced by the initial increase of motor
unit recruitment and subsequent de-recruitment of later-recruited faster motor units.
The significantly higher θ values in the last endurance time window reflect the
relatively large low frequency content, which is associated with a higher proportion of
slow motor units. Slow motor units are more fatigue resistant and can provide
sufficient force a longer duration. The fatiguing phase correlated with a decrease in
MPF and an increasing degree of fatigue of faster motor units, while the mechanical
endurance time reflected the output level of mainly slower motor units (Gerdle et al.,
1989; Minning et al., 2007).
As shown in the Fig.8.2, the EMG intensity lines become progressively steeper in the
fast speed condition than in slow speed condition as a function of % endurance time,
which indicated the recruitment of additional motor units, particularly the fast motor
units, to generate higher force at the fast speed. The fast speed requires a higher
propulsive force on the pushrim than the slow speed, therefore both the number and

144
size of recruited motor units increased for the higher mechanical requirement within
individual muscles. On the other hand, the increase in θ and decline in MPF were
greater for the fast speed than for the slow speed, which may be due to early de-
recruitment of more fatigable faster MUs, possibly compensated by a firing rate
increase (Freund, 1983) or by synchronization of MUs (Krogh-Lund and Jorgensen,
1993; Holtermann et al., 2009). Faster MUs fatigue more rapidly and so would not be
able to sustain force production over a prolonged period of time. The relation
between size of motor unit and fatigability thus makes functional sense. Slow MUs,
which develop relatively lower tension, are resistant to fatigue, while the fast MUs,
which develop large tension, are fatigued quickly and may be activated for brief
duration.
MPF and θ, determined by time-frequency analysis and PCA in the present study,
showed sensitive and consistent changes in terms of muscle fatigue at low-moderate
levels of wheelchair propulsion. Particularly, changes in θ are associated with
recruitment of different types and size of motor units, suggesting that the θ. has
potential as a fatigue index.
8.4.2 The effect of muscle fatigue on wheelchair biomechanics
Wheelchair propulsion involves 2 phases, the push and the recovery phase (Mulroy
et al., 1996; Boninger et al., 2000). The push phase is initiated when the hand makes
contact with the pushrim and continues until it is remove from the pushrim. Anterior
deltoid (AD), pectoralis major (PM), biceps brachii (BB), and triceps brachii (TB) have
their primary activities during the push phase. After the hand terminates its contact
with the pushrim, the recovery muscles, UT, MD and PD, contribute to the
deceleration of the arm during follow-through part of the push phase and return the
arm to its starting position. In the present study, The EMG intensities for the
propulsive muscles, AD, PM, BB, and TB, were significantly greater at the fast speed
than at the slow speed (P<0.05), while there were no significant differences in EMG
intensity for UT, MD, and PD between two speeds. As the speed increased, the time
for the recovery phase decreased and the propulsive muscles has to push the
recovering upper extremity back to the starting point with a higher force. It has been
reported that force production around the joint become unbalanced in relation to the
fatigue state of each individual muscles during lifting tasks (Kumar, 2001) and cycling
(Kay et al., 2001) .The selective recruitment of the propulsive muscles during more
strenuous wheelchair propulsion may contribute to the muscle imbalances. This
situation has the potential to cause abnormal or unnatural motions of the joints, which

145
may create significant abnormal stress distributions and possibly leading to injury. It
has been reported that long term use of a manual wheelchair leads to muscle
imbalance, overdevelopment, strengthening and shortening of the anterior deltoid
and pectoralis and weakening and lengthening of the opposing muscle groups
(Niemeyer et al., 2004). Therefore, training to improve the flexibility of the anterior
muscles as well as the strength of the posterior muscles and shoulder depressors is
recommended to prevent overuse injuries and pain due to muscle imbalance and
thus to maintain functional independence of the wheelchair user.
Previous studies have investigated changes in wheelchair biomechanics due to
fatigue. Rice (2009) reported an increase in push time during an extended period of
propulsion, while stroke frequency remained static. In the present study, no
significant effects of kinetic variables on the endurance time of wheelchair propulsion
were found. This might be so because the participants in the present study were
able-bodied individuals and they only became mildly fatigue. It has been reported
that experienced MWU compensated for fatigue differently than non-users (Rodgers
et al., 2003). Rodgers (2003) reported a power shift from the shoulder to the elbow
and wrist joints during fatiguing wheelchair propulsion (Rodgers et al., 2003). Our
findings showed that the activity of elbow flexor, BB, decreased in the last endurance
time window at the slow speed (Fig.8.2). The BB muscle was active before the hand
reached top dead center and assisted propulsion during the push phase. During the
recovery phase, BB muscle became active to reverse the extension. Compared to
the increased activities of the other shoulder muscles during fatigue, the decrease in
BB activity during strenuous wheelchair propulsion may be related to reduction of
push length. The initiation of contact angle was closer to the top dead center in the
fatigue stage than in the fresh stage, which reduced the activation level of BB. The
reduction of push length associated with a decrease in the elbow and shoulder range
of motion indicates upper extremity biomechanical adaptations to fatigue, in an effort
to maintain the target velocity.
It has been suggested that muscle coordination is affected by fatigue (Sanderson
and Black, 2003). Bernasconi et al observed an increase of muscle burst duration for
the propulsive muscles (PM, AD, and TB) (Bernasconi et al., 2007). Their finding
supports the assumption that fatigue results in modifications of intersegmental
coordination. Although the EMG duration of the shoulder muscles did not change
significantly during fatigue in the present study, the complete EMG activity patterns
with respect to percentage of cycle showed some indications of changes in

146
propulsion coordination (Fig.8. 3). The propulsive muscles (AD, PM, BB, TB) showed
higher and longer activities in the 100% endurance time window than in the 20%
endurance time window. It is possible that force production around the shoulder joint
become unbalanced as individual muscles become fatigued. Compared to the slow
speed, faster speed propulsion was associated with higher and longer activities of
these shoulder muscles as well. For instance, TB had two burst of activity with one at
the beginning and then one at the end of propulsion cycle at the fast speed, whereas
only one burst of activity of TB was manifest during the slow speed propulsion. It is
evident from this example that changes in muscle’s ability to produce force effectively
may lead to a change in its period of activity within a particular movement. The
recovery muscles (UT, MD, and PD) changed their activation patterns during fatigue
correspondingly. These changes in the activity patterns suggest that some
adjustments are made in the coordination of muscles with the occurrence of fatigue.
8.4.3 Limitations
It should be kept in mind that the given disability as such may mask fatigue and/or
injury symptoms and thereby prevent the realization that an injury is occurring. The
present study investigated the effect of mildly fatiguing wheelchair propulsion on
able-bodied individuals as a pilot study in a simulated environment (static ergometer).
Future studies would have to be conducted with wheelchair users who suffer from
shoulder pain and injuries. The physical condition of the wheelchair users, such as
level of injury, pain history, and fitness level, should also be considered. Prevention is
a key for the treatment of overuse injuries because wheelchair users cannot afford to
lose their independence.

147
Chapter Nine: Conclusions, Limitations, and Recommendations
1.1 Conclusions
The main aim of this thesis was to investigate shoulder muscle recruitment patterns
in association with wheelchair kinetics over a range of daily activities and mobility
tasks requiring manual wheelchair propulsion.
Well-controlled isometric, concentric, and eccentric contractions of biceps brachii
were examined by using surface EMG and MMG. The results show that wavelet and
principal component analysis of EMG and MMG signals provide more detailed
information regarding motor unit recruitment than the traditionally used spectral
variables. The results from dynamic contractions suggest that motor unit recruitment
patterns were generally well-matched to the mechanical requirements of the task.
Shoulder muscle recruitment patterns and wheelchair kinetics across a range of
wheelchair activities were investigated. The results show that both for fast speed
propulsion on an ergometer (1.6m/s) and propulsion ascending a ramp (4°slope, 7
meters long) requires higher activity levels in the shoulder muscles than does slow
speed propulsion on the ergometer (0.9m/s). For each condition the muscles contract
at force levels that are optimized for each motor task through the selective
recruitment of motor units. Prolonged wheelchair propulsion on the ergometer
indicates that there is an association between characteristic changes in the
frequency content of surface EMG data from upper extremity muscles and
biomechanical adaptation to mild fatigue. Able-bodied participants who were
inexperienced wheelchair users were instructed to employ a wheelchair propulsion
technique that was semicircular in pattern during a series of wheelchair propulsion
test sessions. The instructed semicircular pattern has a positive effect on shoulder
muscle recruitment patterns, as demonstrated by more coordinated and balanced
muscle activity around the shoulder. A short session of wheelchair propulsion
instruction would be recommended if these tests were to be employed in studies of
newly injured wheelchair users.
1.2 Limitations
1. The surface electrodes utilized throughout the study were unable to record
activity from deep muscle tissues of upper the extremity and the rotator cuff.
2. MMG technique only assessed the contractile properties of superficial, rather
than the deep muscles

148
3. Repeatability of upper extremity muscle activation patterns
Assessment of intra-session repeatability of muscle activation pattern is of
considerable relevance for research settings, especially when used to determine
the effects of various constraints (e.g. propulsion techniques, fatigue, body
position, level of SCI. etc.). Even if the methodological problems, due to electrode
replacement, are avoided when EMG measurements of a same session are
compared (as is the case found in the major part of studies using EMG in
propulsion), the question of whether a personal muscle strategy can be adopted
and maintained stable throughout the experimental propulsion session still
remains of great importance. Therefore, assessment of reproducibility of upper
extremity muscle activation patterns during wheelchair propulsion should be
investigated in future studies.
4. Several parameters are not controlled in this PhD program
• Compared to able-bodied participants in the present study, manual
wheelchair users may use different compensation strategies for the shoulder
muscles due to impaired upper extremity muscle functions or poor trunk
control. This may affect the shoulder muscle recruitment patterns during
wheelchair propulsion.
• The stationary wheelchair ergometer may alter balance and coordination
compared to natural everyday pushing activities
• The physical configuration of the wheelchair (axle and height of the
wheelchair) is the same for each participant, so sitting posture is not
concerned in this program. Since many spinal cord-injured wheelchair users,
in order to be stable in wheelchair propulsion and other activities, they tend to
sit in a kyphotic posture where the scapula changes its vertical alignment.
The contributory posture of the subject should be evaluated in the future
studies.
1.3 Recommendations
1. Future studies should be conducted with wheelchair users who suffer from
shoulder pain and injuries. The physical condition of the wheelchair users,
such as level of injury, pain history, and fitness level, should also be
considered.
The specific aims should include attempts to answer the following queries:
Is there a specific pattern of pain/injuries development and
EMG/MMG response in shoulder muscles for SCI patients, different

149
from that observed in normal controls and other patient groups with
pain of presumed musculoskeletal origin?
Can the patterns of pain/injuries development and EMG/MMG
responses provide clues as to a possible relationship between muscle
activities and pain development for SCI patients with shoulder
pain/injuries?
2. Further research is also needed to understand kinematics for a range of
wheelchair propulsion situations and including those where fatigue occurs.
The effects of kinematics, kinetics, and EMG/MMG need to be considered
together
3. Future studies need to be conducted to fully establish the relationship
between MMG variables and muscle fibre type
4. MMG is useful in accessing musculoskeletal characteristics during functional
electrical stimulation. MMG signals record and quantify the low-frequency
lateral oscillations of active skeletal muscle fibres, which are not affected by
electrical stimulation. EMG signals on the other hand are swamped by the
electrical fields generated during FES stimulation. MMG has the potential to
be used as a non-invasive method to estimate stimulated muscle activity for
paralysed people.
The understanding of motor unit recruitment patterns during well-controlled isometric,
eccentric, and concentric contractions as investigated by MMG would facilitate further
studies on functional electrical stimulation (FES). MMG provides information on the
recruitment and composition of motor units and is not affected by electrical
stimulation. MMG has the potential to be used during electrical stimulation to provide
feedback information on muscle fiber composition and fatigue. An easy-to-use PDA
(Personal Digital Assistant) MMG data acquisition system is being developed.

150
Figure 9.1 PDA data logger.
A Personal Digital Assistant (PDA) based system, provided with a CF card based
analog-to-digital converter running a PDA module for LabVIEW has been provend to
be effective for MMG measurements (Fig.9.1). The PDA solution would make the
system portable, and thus suitable for unsupervised clinical trials, i.e., trials in which
the patient might take the system home to monitor muscle response during everyday
activities. So far, our lab has developed a 4-channel pocket mechanomyographer
and logger for use in the next phase of clinical measurements.
5. Microphones can be produced in arrays, offering the potential for using signal
analysis techniques to localize the source of the signal in muscle groups at
different depths and highly specific locations.
The low frequency vibration signals generated by skeletal muscles have been known
for more than three centuries. These vibration signals, generated by muscle
contraction, can be detected with a contact sensor or microphone mounted on the
skin surface over an active muscle. Theoretically, two important factors may
influence MMG signal recording. First, the location of the sensor arrangement in
relation to muscle fibre architecture and second, the number of detected motor units
(MUs) contributing to MMG. Microphone arrays allow the collection of monopolar
signals to which deep MUs are also contributing.
Microphone arrays can be formed using several very closely spaced condenser
microphones (2mm diameter each). The use of microphone arrays offers the
151
potential to provide high quality signals which are robust against noise, and
interfering sources.
Principal component analysis (PCA) and independent component analysis (ICA) can
be used for microphone array signal processing. Principle component analysis (PCA)
is a method to classify multidimensional datasets and to detect redundant information.
It is expected that any order of spatially filtering microphones suffers from a biased
choice of the configuration direction relative to the direction of the underlying muscle
fibers. PCA is a useful tool for extracting the physiologically relevant information
independent from the muscle structure. On the other hand, independent component
analysis (ICA) is a powerful technique and is able (in principle) to separate
independent sources linearly mixed in several sensors. When recording MMG on the
muscles, ICA can separate out environmental noise embedded in the data since they
are usually independent of each other.

152
References
Akasaka K, Onishi H, Momose K, Ihashi K, Yagi R, Handa Y, Hoshimiya N (1997) EMG power spectrum and integrated EMG of ankle plantarflexors during stepwise and ramp contractions. Tohoku J Exp Med 182:207-216.
Akataki K, Mita K, Watakabe M (2004) Electromyographic and mechanomyographic estimation of motor unit activation strategy in voluntary force production. Electromyogr Clin Neurophysiol 44:489-496.
Akataki K, Mita K, Watakabe M, Itoh K (2001) Mechanomyogram and force relationship during voluntary isometric ramp contractions of the biceps brachii muscle. Eur J Appl Physiol 84:19-25.
Akataki K, Mita K, Watakabe M, Ito K (2002) Age-related change in motor unit activation strategy in force production: a mechanomyographic investigation. Muscle Nerve 25:505-512.
Akataki K, Mita K, Watakabe M, Itoh K (2003) Mechanomyographic responses during voluntary ramp contractions of the human first dorsal interosseous muscle. Eur J Appl Physiol 89:520-525.
Akazawa K, Okuno R (2006) Estimating torque-angle relations of human elbow joint in isovelocity flexion movements. IEICE TRANS INF & SYST E89-D:2802-2910.
Allum JH, Dietz V, Freund HJ (1978) Neuronal mechanisms underlying physiological tremor. J Neurophysiol 41:557-571.
An KN (2002) Muscle force and its role in joint dynamic stability. Clin Orthop Relat Res:S37-42.
Armstrong R (1981) Recruitment of muscles and fibres within muscles in running animals. Symp Zool Soc Lond 48:289-304.
Asmussen E (1979) Muscle fatigue. Med Sci Sports 11:313-321.
Bajaj P, Madeleine P, Sjogaard G, Arendt-Nielsen L (2002) Assessment of postexercise muscle soreness by electromyography and mechanomyography. J Pain 3:126-136.
Ballinger DA, Rintala DH, Hart KA (2000) The relation of shoulder pain and range-of-motion problems to functional limitations, disability, and perceived health of men with spinal cord injury: a multifaceted longitudinal study. Arch Phys Med Rehabil 81:1575-1581.
Barber DB, Janus RB, Wade WH (1996) Neuroarthropathy: an overuse injury of the shoulder in quadriplegia. J Spinal Cord Med 19:9-11.
Barry DT (1987) Acoustic signals from frog skeletal muscle. Biophys J 51:769-773.
Barry DT (1990) Acoustic Signals From Skeletal Muscles. News in Physiological Sciences 5:17-21.
Barry DT (1991) Muscle sounds from evoked twitches in the hand. Arch Phys Med Rehabil 72:573-575.
153
Barry DT (1992) Vibrations and sounds from evoked muscle twitches. Electromyogr Clin Neurophysiol 32:35-40.
Barry DT, Cole NM (1990) Muscle sounds are emitted at the resonant frequencies of skeletal muscle. IEEE Trans Biomed Eng 37:525-531.
Barry DT, Geiringer SR, Ball RD (1985) Acoustic myography: a noninvasive monitor of motor unit fatigue. Muscle Nerve 8:189-194.
Barry DT, Gordon KE, Hinton GG (1990) Acoustic and surface EMG diagnosis of pediatric muscle disease. Muscle Nerve 13:286-290.
Bayley JC, Cochran TP, Sledge CB (1987) The weight-bearing shoulder. The impingement syndrome in paraplegics. J Bone Joint Surg Am 69:676-678.
Beck TW, Housh TJ, Johnson GO, Weir JP, Cramer JT, Coburn JW, Malek MH (2004a) Mechanomyographic amplitude and mean power frequency versus torque relationships during isokinetic and isometric muscle actions of the biceps brachii. J Electromyogr Kinesiol 14:555-564.
Beck TW, Housh TJ, Johnson GO, Weir JP, Cramer JT, Coburn JW, Malek MH (2004b) Mechanomyographic and electromyographic time and frequency domain responses during submaximal to maximal isokinetic muscle actions of the biceps brachii. Eur J Appl Physiol 92:352-359.
Beck TW, Housh TJ, Johnson GO, Weir JP, Cramer JT, Coburn JW, Malek MH (2005a) Comparison of Fourier and wavelet transform procedures for examining mechanomyographic and electromyographic frequency versus isokinetic torque relationships. Electromyogr Clin Neurophysiol 45:93-103.
Beck TW, Housh TJ, Johnson GO, Weir JP, Cramer JT, Coburn JW, Malek MH (2005b) Comparison of Fourier and wavelet transform procedures for examining the mechanomyographic and electromyographic frequency domain responses during fatiguing isokinetic muscle actions of the biceps brachii. J Electromyogr Kinesiol 15:190-199.
Beck TW, Housh TJ, Johnson GO, Weir JP, Cramer JT, Coburn JW, Malek MH (2006a) Comparison of a piezoelectric contact sensor and an accelerometer for examining mechanomyographic amplitude and mean power frequency versus torque relationships during isokinetic and isometric muscle actions of the biceps brachii. J Electromyogr Kinesiol 16:324-335.
Beck TW, Housh TJ, Johnson GO, Weir JP, Cramer JT, Coburn JW, Malek MH (2006b) Mechanomyographic and electromyographic responses during submaximal to maximal eccentric isokinetic muscle actions of the biceps brachii. J Strength Cond Res 20:184-191.
Beck TW, Housh TJ, Johnson GO, Cramer JT, Weir JP, Coburn JW, Malek MH (2007a) Does the frequency content of the surface mechanomyographic signal reflect motor unit firing rates? A brief review. J Electromyogr Kinesiol 17:1-13.
Beck TW, von Tscharner V, Housh TL, Cramer JT, Weir JP, Malek MH, Mielke M (2008) Time/frequency events of surface mechanomyographic signals resolved by nonlinear scaled wavelets. Biomedical Signal Processing and Control:255-266.

154
Beck TW, Housh TJ, Cramer JT, Weir JP, Johnson GO, Coburn JW, Malek MH, Mielke M (2005c) Mechanomyographic amplitude and frequency responses during dynamic muscle actions: a comprehensive review. Biomed Eng Online 4:67.
Beck TW, Housh TJ, Fry AC, Cramer JT, Weir JP, Schilling BK, Falvo MJ, Moore CA (2007b) The influence of muscle fiber type composition on the patterns of responses for electromyographic and mechanomyographic amplitude and mean power frequency during a fatiguing submaximal isometric muscle action. Electromyogr Clin Neurophysiol 47:221-232.
Bednarczyk JH, Sanderson DJ (1994) Kinematics of wheelchair propulsion in adults and children with spinal cord injury. Arch Phys Med Rehabil 75:1327-1334.
Bernardi M, Felici F, Marchetti M, Montellanico F, Piacentini MF, Solomonow M (1999) Force generation performance and motor unit recruitment strategy in muscles of contralateral limbs. J Electromyogr Kinesiol 9:121-130.
Bernasconi SM, Tordi N, Ruiz J, Parratte B (2007) Changes in oxygen uptake, shoulder muscles activity, and propulsion cycle timing during strenuous wheelchair exercise. Spinal Cord 45:468-474.
Bernstein N (1967) The coordination and regulatin of movements. New York: Pergamon.
Bichler E (2000) Mechanomyograms recorded during evoked contractions of single motor units in the rat medial gastrocnemius muscle. Eur J Appl Physiol 83:310-319.
Bichler E, Celichowski J (2001) Mechanomyographic signals generated during unfused tetani of single motor units in the rat medial gastrocnemius muscle. Eur J Appl Physiol 85:513-520.
Bigland-Ritchie B, Woods JJ (1984) Changes in muscle contractile properties and neural control during human muscular fatigue. Muscle Nerve 7:691-699.
Bigland-Ritchie BR, Furbush FH, Gandevia SC, Thomas CK (1992) Voluntary discharge frequencies of human motoneurons at different muscle lengths. Muscle Nerve 15:130-137.
Boettcher CE, Ginn KA, Cathers I (2008) Standard maximum isometric voluntary contraction tests for normalizing shoulder muscle EMG. J Orthop Res 26:1591-1597.
Bolton CF, Parkes A, Thompson TR, Clark MR, Sterne CJ (1989) Recording sound from human skeletal muscle: technical and physiological aspects. Muscle Nerve 12:126-134.
Bonato P (2001) Recent advancements in the analysis of dynamic EMG data. IEEE Eng Med Biol Mag 20:29, 32.
Bonato P, Roy SH, Knaflitz M, De Luca CJ (2001) Time-frequency parameters of the surface myoelectric signal for assessing muscle fatigue during cyclic dynamic contractions. IEEE Trans Biomed Eng 48:745-753.
Bonato P, Ebenbichler GR, Roy SH, Lehr S, Posch M, Kollmitzer J, Della Croce U (2003) Muscle fatigue and fatigue-related biomechanical changes during a cyclic lifting task. Spine 28:1810-1820.

155
Boninger ML, Cooper RA, Robertson RN, Shimada SD (1997) Three-dimensional pushrim forces during two speeds of wheelchair propulsion. Am J Phys Med Rehabil 76:420-426.
Boninger ML, Cooper RA, Shimada SD, Rudy TE (1998) Shoulder and elbow motion during two speeds of wheelchair propulsion: a description using a local coordinate system. Spinal Cord 36:418-426.
Boninger ML, Cooper RA, Baldwin MA, Shimada SD, Koontz A (1999) Wheelchair pushrim kinetics: body weight and median nerve function. Arch Phys Med Rehabil 80:910-915.
Boninger ML, Baldwin M, Cooper RA, Koontz A, Chan L (2000) Manual wheelchair pushrim biomechanics and axle position. Arch Phys Med Rehabil 81:608-613.
Boninger ML, Souza AL, Cooper RA, Fitzgerald SG, Koontz AM, Fay BT (2002) Propulsion patterns and pushrim biomechanics in manual wheelchair propulsion. Arch Phys Med Rehabil 83:718-723.
Boninger ML, Dicianno BE, Cooper RA, Towers JD, Koontz AM, Souza AL (2003) Shoulder magnetic resonance imaging abnormalities, wheelchair propulsion, and gender. Arch Phys Med Rehabil 84:1615-1620.
Boninger ML, Koontz AM, Sisto SA, Dyson-Hudson TA, Chang M, Price R, Cooper RA (2005) Pushrim biomechanics and injury prevention in spinal cord injury: recommendations based on CULP-SCI investigations. J Rehabil Res Dev 42:9-19.
Bottinelli R, Reggiani C (2000) Human skeletal muscle fibres: molecular and functional diversity. Prog Biophys Mol Biol 73:195-262.
Broman H, De Luca CJ, Mambrito B (1985) Motor unit recruitment and firing rates interaction in the control of human muscles. Brain Res 337:311-319.
Brown DD, Knowlton RG, Hamill J, Schneider TL, Hetzler RK (1990) Physiological and biomechanical differences between wheelchair-dependent and able-bodied subjects during wheelchair ergometry. Eur J Appl Physiol Occup Physiol 60:179-182.
Burnham RS, May L, Nelson E, Steadward R, Reid DC (1993) Shoulder pain in wheelchair athletes. The role of muscle imbalance. Am J Sports Med 21:238-242.
Carson RG, Riek S (2001) Changes in muscle recruitment patterns during skill acquisition. Exp Brain Res 138:71-87.
Cavanagh PR, Komi PV (1979) Electromechanical delay in human skeletal muscle under concentric and eccentric contractions. Eur J Appl Physiol Occup Physiol 42:159-163.
Cescon C, Gazzoni M, Gobbo M, Orizio C, Farina D (2004a) Non-invasive assessment of single motor unit mechanomyographic response and twitch force by spike-triggered averaging. Med Biol Eng Comput 42:496-501.
Cescon C, Farina D, Gobbo M, Merletti R, Orizio C (2004b) Effect of accelerometer location on mechanomyogram variables during voluntary, constant-force contractions in three human muscles. Med Biol Eng Comput 42:121-127.

156
Chalmers GR (2008) Can fast-twitch muscle fibres be selectively recruited during lengthening contractions? Review and applications to sport movements. Sports Biomech 7:137-157.
Chow JW, Millikan TA, Carlton LG, Chae WS, Lim YT, Morse MI (2009) Kinematic and electromyographic analysis of wheelchair propulsion on ramps of different slopes for young men with paraplegia. Arch Phys Med Rehabil 90:271-278.
Christova P, Kossev A, Radicheva N (1998) Discharge rate of selected motor units in human biceps brachii at different muscle lengths. J Electromyogr Kinesiol 8:287-294.
Coburn JW, Housh TJ, Weir JP, Malek MH, Cramer JT, Beck TW, Johnson GO (2004a) Mechanomyographic responses of the vastus medialis to isometric and eccentric muscle actions. Med Sci Sports Exerc 36:1916-1922.
Coburn JW, Housh TJ, Malek MH, Weir JP, Cramer JT, Beck TW, Johnson GO (2006) Mechanomyographic and electromyographic responses to eccentric muscle contractions. Muscle Nerve 33:664-671.
Coburn JW, Housh TJ, Cramer JT, Weir JP, Miller JM, Beck TW, Malek MH, Johnson GO (2004b) Mechanomyographic time and frequency domain responses of the vastus medialis muscle during submaximal to maximal isometric and isokinetic muscle actions. Electromyogr Clin Neurophysiol 44:247-255.
Coburn JW, Housh TJ, Cramer JT, Weir JP, Miller JM, Beck TW, Malek MH, Johnson GO (2005) Mechanomyographic and electromyographic responses of the vastus medialis muscle during isometric and concentric muscle actions. J Strength Cond Res 19:412-420.
Collinger JL, Boninger ML, Koontz AM, Price R, Sisto SA, Tolerico ML, Cooper RA (2008) Shoulder biomechanics during the push phase of wheelchair propulsion: a multisite study of persons with paraplegia. Arch Phys Med Rehabil 89:667-676.
Conforto S, Mathieu P, Schmid M, Bibbo D, Florestal JR, D'Alessio T (2006) How much can we trust the electromechanical delay estimated by using electromyography? Conf Proc IEEE Eng Med Biol Soc 1:1256-1259.
Cooper RA, Quatrano LA, Axelson PW, Harlan W, Stineman M, Franklin B, Krause JS, Bach J, Chambers H, Chao EY, Alexander M, Painter P (1999) Research on physical activity and health among people with disabilities: a consensus statement. J Rehabil Res Dev 36:142-154.
Cowan RE, Boninger ML, Sawatzky BJ, Mazoyer BD, Cooper RA (2008) Preliminary outcomes of the SmartWheel Users' Group database: a proposed framework for clinicians to objectively evaluate manual wheelchair propulsion. Arch Phys Med Rehabil 89:260-268.
Cowan RE, Nash MS, Collinger JL, Koontz AM, Boninger ML (2009) Impact of surface type, wheelchair weight, and axle position on wheelchair propulsion by novice older adults. Arch Phys Med Rehabil 90:1076-1083.
Curtis KA, Drysdale GA, Lanza RD, Kolber M, Vitolo RS, West R (1999) Shoulder pain in wheelchair users with tetraplegia and paraplegia. Arch Phys Med Rehabil 80:453-457.

157
Dalton PA, Stokes MJ (1991) Acoustic myography reflects force changes during dynamic concentric and eccentric contractions of the human biceps brachii muscle. Eur J Appl Physiol Occup Physiol 63:412-416.
Davis JL, Growney ES, Johnson ME, Iuliano BA, An KN (1998) Three-dimensional kinematics of the shoulder complex during wheelchair propulsion: a technical report. J Rehabil Res Dev 35:61-72.
de Groot S, Veeger DH, Hollander AP, Van der Woude LH (2002) Wheelchair propulsion technique and mechanical efficiency after 3 wk of practice. Med Sci Sports Exerc 34:756-766.
de Groot S, Veeger HE, Hollander AP, van der Woude LH (2003) Adaptations in physiology and propulsion techniques during the initial phase of learning manual wheelchair propulsion. Am J Phys Med Rehabil 82:504-510.
de Groot S, Veeger HE, Hollander AP, van der Woude LH (2004) Effect of wheelchair stroke pattern on mechanical efficiency. Am J Phys Med Rehabil 83:640-649.
de Groot S, de Bruin M, Noomen SP, van der Woude LH (2008) Mechanical efficiency and propulsion technique after 7 weeks of low-intensity wheelchair training. Clin Biomech (Bristol, Avon) 23:434-441.
De Luca CJ (1979) Physiology and mathematics of myoelectric signals. IEEE Trans Biomed Eng 26:313-325.
De Luca CJ (1985) Control properties of motor units. J Exp Biol 115:125-136.
De Luca CJ (1993) Use of the surface EMG signal for performance evaluation of back muscles. Muscle Nerve 16:210-216.
De Luca CJ (1997) The use of surface electromyography in biomechanics. J Appl Biomech 13:135-163.
De Luca CJ, LeFever RS, McCue MP, Xenakis AP (1982a) Behaviour of human motor units in different muscles during linearly varying contractions. J Physiol 329:113-128.
De Luca CJ, LeFever RS, McCue MP, Xenakis AP (1982b) Control scheme governing concurrently active human motor units during voluntary contractions. J Physiol 329:129-142.
Del Valle A, Thomas CK (2005) Firing rates of motor units during strong dynamic contractions. Muscle Nerve 32:316-325.
Delgrosso I, Boillat MA (1991) Carpal tunnel syndrome: role of occupation. Int Arch Occup Environ Health 63:267-270.
Desroches G, Aissaoui R, Bourbonnais D (2008) The effect of resultant force at the pushrim on shoulder kinetics during manual wheelchair propulsion: a simulation study. IEEE Trans Biomed Eng 55:1423-1431.
Diemont B, Figini MM, Orizio C, Perini R, Veicsteinas A (1988) Spectral analysis of muscular sound at low and high contraction level. Int J Biomed Comput 23:161-175.

158
Dimitrova NA, Dimitrov GV (2003) Interpretation of EMG changes with fatigue: facts, pitfalls, and fallacies. J Electromyogr Kinesiol 13:13-36.
Dubowsky SR, Sisto SA, Langrana NA (2009) Comparison of kinematics, kinetics, and EMG throughout wheelchair propulsion in able-bodied and persons with paraplegia: an integrative approach. J Biomech Eng 131:021015.
Dubowsky SR, Rasmussen J, Sisto SA, Langrana NA (2008) Validation of a musculoskeletal model of wheelchair propulsion and its application to minimizing shoulder joint forces. J Biomech 41:2981-2988.
Ebersole KT, Housh TJ, Johnson GO, Evetovich TK, Smith DB, Perry SR (1999) MMG and EMG responses of the superficial quadriceps femoris muscles. J Electromyogr Kinesiol 9:219-227.
Edwards RH (1981) Human muscle function and fatigue. Ciba Found Symp 82:1-18.
Enoka RM (1996) Eccentric contractions require unique activation strategies by the nervous system. J Appl Physiol 81:2339-2346.
Enoka RM, Duchateau J (2008) Muscle fatigue: what, why and how it influences muscle function. J Physiol 586:11-23.
Esposito F, Orizio C, Veicsteinas A (1998) Electromyogram and mechanomyogram changes in fresh and fatigued muscle during sustained contraction in men. Eur J Appl Physiol Occup Physiol 78:494-501.
Esposito F, Ce E, Gobbo M, Veicsteinas A, Orizio C (2005) Surface EMG and mechanomyogram disclose isokinetic training effects on quadriceps muscle in elderly people. Eur J Appl Physiol 94:549-557.
Ettema GJC, Styles G, Kippers V (1998) The moment arms of 23 muscle segments of the upper limb with varying elbow and forearm positions: Implications for motor control. Human Movement Science 17:201-220.
Evetovich TK, Housh TJ, Johnson GO, Smith DB, Ebersole KT, Perry SR (1998) Gender comparisons of the mechanomyographic responses to maximal concentric and eccentric isokinetic muscle actions. Med Sci Sports Exerc 30:1697-1702.
Fang Y, Siemionow V, Sahgal V, Xiong F, Yue GH (2001) Greater movement-related cortical potential during human eccentric versus concentric muscle contractions. J Neurophysiol 86:1764-1772.
Farina D, Fosci M, Merletti R (2002) Motor unit recruitment strategies investigated by surface EMG variables. J Appl Physiol 92:235-247.
Frangioni JV, Kwan-Gett TS, Dobrunz LE, McMahon TA (1987) The mechanism of low-frequency sound production in muscle. Biophys J 51:775-783.
Freund HJ (1983) Motor unit and muscle activity in voluntary motor control. Physiol Rev 63:387-436.
Fullerton HD, Borckardt JJ, Alfano AP (2003) Shoulder pain: a comparison of wheelchair athletes and nonathletic wheelchair users. Med Sci Sports Exerc 35:1958-1961.

159
Gabaldon AM, Nelson FE, Roberts TJ (2008) Relative shortening velocity in locomotor muscles: turkey ankle extensors operate at low V/V(max). Am J Physiol Regul Integr Comp Physiol 294:R200-210.
Gandevia SC (2001) Spinal and supraspinal factors in human muscle fatigue. Physiol Rev 81:1725-1789.
Gellman H, Sie I, Waters RL (1988a) Late complications of the weight-bearing upper extremity in the paraplegic patient. Clin Orthop Relat Res:132-135.
Gellman H, Chandler DR, Petrasek J, Sie I, Adkins R, Waters RL (1988b) Carpal tunnel syndrome in paraplegic patients. J Bone Joint Surg Am 70:517-519.
Gerdle B, Karlsson S (1994) The mean frequency of the EMG of the knee extensors is torque dependent both in the unfatigued and the fatigued states. Clin Physiol 14:419-432.
Gerdle B, Wretling ML, Henriksson-Larsen K (1988) Do the fibre-type proportion and the angular velocity influence the mean power frequency of the electromyogram? Acta Physiol Scand 134:341-346.
Gerdle B, Elert J, Henriksson-Larsen K (1989) Muscular fatigue during repeated isokinetic shoulder forward flexions in young females. Eur J Appl Physiol Occup Physiol 58:666-673.
Gerdle B, Henriksson-Larsen K, Lorentzon R, Wretling ML (1991) Dependence of the mean power frequency of the electromyogram on muscle force and fibre type. Acta Physiol Scand 142:457-465.
Gerdle B, Karlsson S, Crenshaw AG, Elert J, Friden J (2000) The influences of muscle fibre proportions and areas upon EMG during maximal dynamic knee extensions. Eur J Appl Physiol 81:2-10.
Giansanti D, Maccioni G, Macellari V, Mattei E, Triventi M, Censi F, Calcagnini G, Bartolini P (2008) A novel, user-friendly step counter for home telemonitoring of physical activity. J Telemed Telecare 14:345-348.
Goosey VL, Campbell IG, Fowler NE (2000) Effect of push frequency on the economy of wheelchair racers. Med Sci Sports Exerc 32:174-181.
Gordon AM, Huxley AF, Julian FJ (1966) The variation in isometric tension with sarcomere length in vertebrate muscle fibres. J Physiol 184:170-192.
Gordon G, A.H.S. H (1948) The sounds from single motor units in a contracting muscle. J Physiol 107:456-464.
Grabiner MD, Owings TM (2002) EMG differences between concentric and eccentric maximum voluntary contractions are evident prior to movement onset. Exp Brain Res 145:505-511.
Groah SL, Lanig IS (2000) Neuromusculoskeletal syndromes in wheelchair athletes. Semin Neurol 20:201-208.
Haeuber E, Shaughnessy M, Forrester LW, Coleman KL, Macko RF (2004) Accelerometer monitoring of home- and community-based ambulatory activity after stroke. Arch Phys Med Rehabil 85:1997-2001.

160
Hagberg M, Morgenstern H, Kelsh M (1992) Impact of occupations and job tasks on the prevalence of carpal tunnel syndrome. Scand J Work Environ Health 18:337-345.
Hannerz J (1974) Discharge properties of motor units in relation to recruitment order in voluntary contraction. Acta Physiol Scand 91:374-385.
Harris TJ, Owen CG, Victor CR, Adams R, Cook DG (2009) What factors are associated with physical activity in older people, assessed objectively by accelerometry? Br J Sports Med 43:442-450.
Hendrix CR, Bull AJ, Housh TJ, Rana SR, Cramer JT, Beck TW, Weir JP, Malek MH, Mielke M (2008) The effect of pedaling cadence and power output on mechanomyographic amplitude and mean power frequency during submaximal cycle ergometry. Electromyogr Clin Neurophysiol 48:195-201.
Henneman E, Olson CB (1965) Relations between Structure and Function in the Design of Skeletal Muscles. J Neurophysiol 28:581-598.
Henneman E, Somjen G, Carpenter DO (1965a) Functional Significance of Cell Size in Spinal Motoneurons. J Neurophysiol 28:560-580.
Henneman E, Somjen G, Carpenter DO (1965b) Excitability and inhibitability of motoneurons of different sizes. J Neurophysiol 28:599-620.
Hermens HJ, Bruggen TAMv, Baten CTM (1992) The median frequency of the surface EMG power spectrum in relation to motor unit firing and action potential properties. Journal of Electromyography and Kinesiology 2:15-25.
Hermens HJ, Freriks B, Disselhorst-Klug C, Rau G (2000) Development of recommendations for SEMG sensors and sensor placement procedures. J Electromyogr Kinesiol 10:361-374.
Hintzy F, Tordi N, Perrey S (2002) Muscular efficiency during arm cranking and wheelchair exercise: a comparison. Int J Sports Med 23:408-414.
Hodson-Tole EF, Wakeling JM (2007) Variations in motor unit recruitment patterns occur within and between muscles in the running rat (Rattus norvegicus). J Exp Biol 210:2333-2345.
Hodson-Tole EF, Wakeling JM (2008a) Motor unit recruitment patterns 2: the influence of myoelectric intensity and muscle fascicle strain rate. J Exp Biol 211:1893-1902.
Hodson-Tole EF, Wakeling JM (2008b) Motor unit recruitment patterns 1: responses to changes in locomotor velocity and incline. J Exp Biol 211:1882-1892.
Holtermann A, Gronlund C, Karlsson JS, Roeleveld K (2009) Motor unit synchronization during fatigue: described with a novel sEMG method based on large motor unit samples. J Electromyogr Kinesiol 19:232-241.
Homberg V, Reiners K, Hefter H, Freund HJ (1986) The muscle activity spectrum: spectral analysis of muscle force as an estimator of overall motor unit activity. Electroencephalogr Clin Neurophysiol 63:209-222.

161
Housh TJ, Perry SR, Bull AJ, Johnson GO, Ebersole KT, Housh DJ, deVries HA (2000) Mechanomyographic and electromyographic responses during submaximal cycle ergometry. Eur J Appl Physiol 83:381-387.
Hu XL, Tong KY, Li L (2007) The mechanomyography of persons after stroke during isometric voluntary contractions. J Electromyogr Kinesiol 17:473-483.
Hughes CJ, Weimar WH, Sheth PN, Brubaker CE (1992) Biomechanics of wheelchair propulsion as a function of seat position and user-to-chair interface. Arch Phys Med Rehabil 73:263-269.
Jaskolski A, Andrzejewska R, Marusiak J, Kisiel-Sajewicz K, Jaskolska A (2007) Similar response of agonist and antagonist muscles after eccentric exercise revealed by electromyography and mechanomyography. J Electromyogr Kinesiol 17:568-577.
Jayne BC, Lauder GV (1994) How swimming fish use slow and fast muscle fibers: implications for models of vertebrate muscle recruitment. J Comp Physiol A 175:123-131.
Johnson MA, Polgar R, Weightman D (1973) Data on the distribution of fibre types in thirty-six human muscles: An auto psy study. J Neurol Sci 173:111-129.
Kakuda N, Nagaoka M, Tanaka R (1992) Conduction velocities of alpha-motor fibers innervating human thenar muscles and order of recruitment upon voluntary contraction. Muscle Nerve 15:332-343.
Kamper D, Barin K, Parnianpour M, Hemami H, Weed H (2000) Simulation of the Seated Postural Stability of Healthy and Spinal Cord-Injured Subjects Using Optimal Feedback Control Methods. Comput Methods Biomech Biomed Engin 3:79-93.
Karlsson S, Gerdle B (2001) Mean frequency and signal amplitude of the surface EMG of the quadriceps muscles increase with increasing torque--a study using the continuous wavelet transform. J Electromyogr Kinesiol 11:131-140.
Kasprisin JE, Grabiner MD (2000) Joint angle-dependence of elbow flexor activation levels during isometric and isokinetic maximum voluntary contractions. Clin Biomech (Bristol, Avon) 15:743-749.
Kawakami Y, Nakazawa K, Fujimoto T, Nozaki D, Miyashita M, Fukunaga T (1994) Specific tension of elbow flexor and extensor muscles based on magnetic resonance imaging. Eur J Appl Physiol Occup Physiol 68:139-147.
Kawczynski A, Nie H, Jaskolska A, Jaskolski A, Arendt-Nielsen L, Madeleine P (2007) Mechanomyography and electromyography during and after fatiguing shoulder eccentric contractions in males and females. Scand J Med Sci Sports 17:172-179.
Kay D, Marino FE, Cannon J, St Clair Gibson A, Lambert MI, Noakes TD (2001) Evidence for neuromuscular fatigue during high-intensity cycling in warm, humid conditions. Eur J Appl Physiol 84:115-121.
Keidel M, Keidel WD (1989) The computer-vibromyography as a biometric progress in studying muscle function. Biomed Tech (Berl) 34:107-116.
Kelly BT, Kadrmas WR, Kirkendall DT, Speer KP (1996) Optimal normalization tests for shoulder muscle activation: an electromyographic study. J Orthop Res 14:647-653.

162
Kennedy PM, Cresswell AG (2001) The effect of muscle length on motor-unit recruitment during isometric plantar flexion in humans. Exp Brain Res 137:58-64.
Keyser RE, Rodgers MM, Gardner ER, Russell PJ (1999) Oxygen uptake during peak graded exercise and single-stage fatigue tests of wheelchair propulsion in manual wheelchair users and the able-bodied. Arch Phys Med Rehabil 80:1288-1292.
Kimura T, Hamada T, Watanabe T, Maeda A, Oya T, Moritani T (2004) Mechanomyographic responses in human biceps brachii and soleus during sustained isometric contraction. Eur J Appl Physiol 92:533-539.
Knaflitz M, Bonato P (1999) Time-frequency methods applied to muscle fatigue assessment during dynamic contractions. J Electromyogr Kinesiol 9:337-350.
Knapik JJ, Wright JE, Mawdsley RH, Braun J (1983) Isometric, isotonic, and isokinetic torque variations in four muscle groups through a range of joint motion. Phys Ther 63:938-947.
Komi PV, Vitasalo JH (1976) Signal characteristics of EMG at different levels of muscle tension. Acta Physiol Scand 96:267-276.
Komi PV, Linnamo V, Silventoinen P, Sillanpaa M (2000) Force and EMG power spectrum during eccentric and concentric actions. Med Sci Sports Exerc 32:1757-1762.
Koontz AM, Cooper RA, Boninger ML, Souza AL, Fay BT (2002) Shoulder kinematics and kinetics during two speeds of wheelchair propulsion. J Rehabil Res Dev 39:635-649.
Koontz AM, Yang Y, Boninger DS, Kanaly J, Cooper RA, Boninger ML, Dieruf K, Ewer L (2006) Investigation of the performance of an ergonomic handrim as a pain-relieving intervention for manual wheelchair users. Assist Technol 18:123-143; quiz 145.
Kossev A, Christova P (1998) Discharge pattern of human motor units during dynamic concentric and eccentric contractions. Electroencephalogr Clin Neurophysiol 109:245-255.
Krogh-Lund C, Jorgensen K (1993) Myo-electric fatigue manifestations revisited: power spectrum, conduction velocity, and amplitude of human elbow flexor muscles during isolated and repetitive endurance contractions at 30% maximal voluntary contraction. Eur J Appl Physiol Occup Physiol 66:161-173.
Krstulovic S, Zuvela F, Katic R (2006) Biomotor systems in elite junior judoists. Coll Antropol 30:845-851.
Kukulka CG, Clamann HP (1981) Comparison of the recruitment and discharge properties of motor units in human brachial biceps and adductor pollicis during isometric contractions. Brain Res 219:45-55.
Kulig K, Rao SS, Mulroy SJ, Newsam CJ, Gronley JK, Bontrager EL, Perry J (1998) Shoulder joint kinetics during the push phase of wheelchair propulsion. Clin Orthop Relat Res:132-143.

163
Kumar DK, Pah ND (2000) Neural networks and wavelet decomposition for classification of surface electromyography. Electromyogr Clin Neurophysiol 40:411-421.
Kumar S (2001) Theories of musculoskeletal injury causation. Ergonomics 44:17-47.
Kupa EJ, Roy SH, Kandarian SC, De Luca CJ (1995) Effects of muscle fiber type and size on EMG median frequency and conduction velocity. J Appl Physiol 79:23-32.
Kyrolainen H, Avela J, Komi PV (2005) Changes in muscle activity with increasing running speed. J Sports Sci 23:1101-1109.
Lago P, Jones NB (1977) Effect of motor-unit firing time statistics on e.m.g. spectra. Med Biol Eng Comput 15:648-655.
Lamb GD (2002) Excitation-contraction coupling and fatigue mechanisms in skeletal muscle: studies with mechanically skinned fibres. J Muscle Res Cell Motil 23:81-91.
Lavender AP, Nosaka K (2006) Changes in fluctuation of isometric force following eccentric and concentric exercise of the elbow flexors. Eur J Appl Physiol 96:235-240.
Lighthall-Haubert L, Requejo PS, Mulroy SJ, Newsam CJ, Bontrager E, Gronley JK, Perry J (2009) Comparison of shoulder muscle electromyographic activity during standard manual wheelchair and push-rim activated power assisted wheelchair propulsion in persons with complete tetraplegia. Arch Phys Med Rehabil 90:1904-1915.
Lin CJ, Lin PC, Su FC (2009) Preferred elbow position in confined wheelchair configuration. J Biomech 42:1005-1009.
Lin HT, Su FC, Wu HW, An KN (2004) Muscle forces analysis in the shoulder mechanism during wheelchair propulsion. Proc Inst Mech Eng H 218:213-221.
Lindstrom LH, Magnusson RI (1977) Interpretation of myoelectric power spectra: a model and its applications. ProcIEEE 65:653-662.
Linnamo V, Strojnik V, Komi PV (2001) EMG power spectrum and maximal M-wave during eccentric and concentric actions at different force levels. Acta Physiol Pharmacol Bulg 26:33-36.
Linnamo V, Strojnik V, Komi PV (2002) EMG power spectrum and features of the superimposed M-wave during voluntary eccentric and concentric actions at different activation levels. Eur J Appl Physiol 86:534-540.
Loslever P, Ranaivosoa A (1993) Biomechanical and epidemiological investigation of carpal tunnel syndrome at workplaces with high risk factors. Ergonomics 36:537-555.
Luff AR, Atwood HL (1972) Membrane properties and contraction of single muscle fibers in the mouse. Am J Physiol 222:1435-1440.
Maccioni G, Macellari V, Giansanti D (2007) Design and construction of step counters for disable people: preliminary experience at the Italian Institute of Health. Conf Proc IEEE Eng Med Biol Soc 2007:4927-4929.

164
Madeleine P, Bajaj P, Sogaard K, Arendt-Nielsen L (2001) Mechanomyography and electromyography force relationships during concentric, isometric and eccentric contractions. J Electromyogr Kinesiol 11:113-121.
Mamaghani NK, Shimomura Y, Iwanaga K, Katsuura T (2002) Mechanomyogram and electromyogram responses of upper limb during sustained isometric fatigue with varying shoulder and elbow postures. J Physiol Anthropol Appl Human Sci 21:29-43.
Masuda K, Masuda T, Sadoyama T, Inaki M, Katsuta S (1999) Changes in surface EMG parameters during static and dynamic fatiguing contractions. J Electromyogr Kinesiol 9:39-46.
Matheson GO, Maffey-Ward L, Mooney M, Ladly K, Fung T, Zhang YT (1997) Vibromyography as a quantitative measure of muscle force production. Scand J Rehabil Med 29:29-35.
Maton B, Petitjean M, Cnockaert JC (1990) Phonomyogram and electromyogram relationships with isometric force reinvestigated in man. Eur J Appl Physiol Occup Physiol 60:194-201.
Mattison PG, Hunter J, Spence S (1989) Development of a realistic method to assess wheelchair propulsion by disabled people. Int J Rehabil Res 12:137-145.
McHugh MP, Tyler TF, Greenberg SC, Gleim GW (2002) Differences in activation patterns between eccentric and concentric quadriceps contractions. J Sports Sci 20:83-91.
Mealing D, Long G, McCarthy PW (1996) Vibromyographic recording from human muscles with known fibre composition differences. Br J Sports Med 30:27-31.
Mendell LM (2005) The size principle: a rule describing the recruitment of motoneurons. J Neurophysiol 93:3024-3026.
Mercer JL, Boninger M, Koontz A, Ren D, Dyson-Hudson T, Cooper R (2006) Shoulder joint kinetics and pathology in manual wheelchair users. Clin Biomech (Bristol, Avon) 21:781-789.
Merletti R, Knaflitz M, De Luca CJ (1990) Myoelectric manifestations of fatigue in voluntary and electrically elicited contractions. J Appl Physiol 69:1810-1820.
Minning S, Eliot CA, Uhl TL, Malone TR (2007) EMG analysis of shoulder muscle fatigue during resisted isometric shoulder elevation. J Electromyogr Kinesiol 17:153-159.
Miyahara M, Sleivert GG, Gerrard DF (1998) The relationship of strength and muscle balance to shoulder pain and impingement syndrome in elite quadriplegic wheelchair rugby players. Int J Sports Med 19:210-214.
Mohamed O, Perry J, Hislop H (2002) Relationship between wire EMG activity, muscle length, and torque of the hamstrings. Clin Biomech (Bristol, Avon) 17:569-579.
Morrow DA, Guo LY, Zhao KD, Su FC, An KN (2003) A 2-D model of wheelchair propulsion. Disabil Rehabil 25:192-196.

165
Motl RW, McAuley E, Snook EM, Scott JA (2006) Validity of physical activity measures in ambulatory individuals with multiple sclerosis. Disabil Rehabil 28:1151-1156.
Mulroy SJ, Gronley JK, Newsam CJ, Perry J (1996) Electromyographic activity of shoulder muscles during wheelchair propulsion by paraplegic persons. Arch Phys Med Rehabil 77:187-193.
Mulroy SJ, Farrokhi S, Newsam CJ, Perry J (2004) Effects of spinal cord injury level on the activity of shoulder muscles during wheelchair propulsion: an electromyographic study. Arch Phys Med Rehabil 85:925-934.
Mulroy SJ, Newsam CJ, Gutierrez DD, Requejo P, Gronley JK, Haubert LL, Perry J (2005) Effect of fore-aft seat position on shoulder demands during wheelchair propulsion: part 1. A kinetic analysis. J Spinal Cord Med 28:214-221.
Nakazawa K, Yano H, Satoh H, Fujisaki I (1998) Differences in stretch reflex responses of elbow flexor muscles during shortening, lengthening and isometric contractions. Eur J Appl Physiol Occup Physiol 77:395-400.
Nakazawa K, Kawakami Y, Fukunaga T, Yano H, Miyashita M (1993) Differences in activation patterns in elbow flexor muscles during isometric, concentric and eccentric contractions. Eur J Appl Physiol Occup Physiol 66:214-220.
Nardone A, Schieppati M (1988) Shift of activity from slow to fast muscle during voluntary lengthening contractions of the triceps surae muscles in humans. J Physiol 395:363-381.
Nardone A, Romano C, Schieppati M (1989) Selective recruitment of high-threshold human motor units during voluntary isotonic lengthening of active muscles. J Physiol 409:451-471.
Neer CS, 2nd (1972) Anterior acromioplasty for the chronic impingement syndrome in the shoulder: a preliminary report. J Bone Joint Surg Am 54:41-50.
Neri V (1955) [Semeiological assay on muscle sounds (phonomyography).]. Rev Neurol (Paris) 93:787-795.
Newham DJ, Mills KR, Quigley BM, Edwards RH (1983) Pain and fatigue after concentric and eccentric muscle contractions. Clin Sci (Lond) 64:55-62.
Newsam CJ, Rao SS, Mulroy SJ, Gronley JK, Bontrager EL, Perry J (1999) Three dimensional upper extremity motion during manual wheelchair propulsion in men with different levels of spinal cord injury. Gait Posture 10:223-232.
Niemeyer LO, Aronow HU, Kasman GS (2004) A pilot study to investigate shoulder muscle fatigue during a sustained isometric wheelchair-propulsion effort using surface EMG. Am J Occup Ther 58:587-593.
Niesing R, Eijskoot F, Kranse R, den Ouden AH, Storm J, Veeger HE, van der Woude LH, Snijders CJ (1990) Computer-controlled wheelchair ergometer. Med Biol Eng Comput 28:329-338.
Nonaka H, Mita K, Akataki K, Watakabe M, Itoh Y (2006) Sex differences in mechanomyographic responses to voluntary isometric contractions. Med Sci Sports Exerc 38:1311-1316.
166
Orizio C (1993) Muscle sound: bases for the introduction of a mechanomyographic signal in muscle studies. Crit Rev Biomed Eng 21:201-243.
Orizio C, Perini R, Veicsteinas A (1989) Muscular sound and force relationship during isometric contraction in man. Eur J Appl Physiol Occup Physiol 58:528-533.
Orizio C, Solomonow M, Diemont B, Gobbo M (2008) Muscle-joint unit transfer function derived from torque and surface mechanomyogram in humans using different stimulation protocols. J Neurosci Methods 173:59-66.
Orizio C, Perini R, Diemont B, Maranzana Figini M, Veicsteinas A (1990) Spectral analysis of muscular sound during isometric contraction of biceps brachii. J Appl Physiol 68:508-512.
Orizio C, Liberati D, Locatelli C, De Grandis D, Veicsteinas A (1996) Surface mechanomyogram reflects muscle fibres twitches summation. J Biomech 29:475-481.
Orizio C, Baratta RV, Zhou BH, Solomonow M, Veicsteinas A (1999a) Force and surface mechanomyogram relationship in cat gastrocnemius. J Electromyogr Kinesiol 9:131-140.
Orizio C, Baratta RV, Zhou BH, Solomonow M, Veicsteinas A (2000) Force and surface mechanomyogram frequency responses in cat gastrocnemius. J Biomech 33:427-433.
Orizio C, Gobbo M, Diemont B, Esposito F, Veicsteinas A (2003) The surface mechanomyogram as a tool to describe the influence of fatigue on biceps brachii motor unit activation strategy. Historical basis and novel evidence. Eur J Appl Physiol 90:326-336.
Orizio C, Esposito F, Sansone V, Parrinello G, Meola G, Veicsteinas A (1997) Muscle surface mechanical and electrical activities in myotonic dystrophy. Electromyogr Clin Neurophysiol 37:231-239.
Orizio C, Diemont B, Esposito F, Alfonsi E, Parrinello G, Moglia A, Veicsteinas A (1999b) Surface mechanomyogram reflects the changes in the mechanical properties of muscle at fatigue. Eur J Appl Physiol Occup Physiol 80:276-284.
Oster G, Jaffe JS (1980) Low frequency sounds from sustained contraction of human skeletal muscle. Biophys J 30:119-127.
Pentland WE, Twomey LT (1991) The weight-bearing upper extremity in women with long term paraplegia. Paraplegia 29:521-530.
Perry SR, Housh TJ, Johnson GO, Ebersole KT, Bull AJ (2001a) Mechanomyographic responses to continuous, constant power output cycle ergometry. Electromyogr Clin Neurophysiol 41:137-144.
Perry SR, Housh TJ, Weir JP, Johnson GO, Bull AJ, Ebersole KT (2001b) Mean power frequency and amplitude of the mechanomyographic and electromyographic signals during incremental cycle ergometry. J Electromyogr Kinesiol 11:299-305.
Perry SR, Housh TJ, Johnson GO, Ebersole KT, Bull AJ, Evetovich TK, Smith DB (2001c) Mechanomyography, electromyography, heart rate, and ratings of perceived exertion during incremental cycle ergometry. J Sports Med Phys Fitness 41:183-188.

167
Petitjean M, Maton B (1995) Phonomyogram from single motor units during voluntary isometric contraction. Eur J Appl Physiol Occup Physiol 71:215-222.
Petrofsky JS, Lind AR (1980) Frequency analysis of the surface electromyogram during sustained isometric contractions. Eur J Appl Physiol Occup Physiol 43:173-182.
Pette D (2002) The adaptive potential of skeletal muscle fibers. Can J Appl Physiol 27:423-448.
Ramsay JO, Silverman BW (1997) Functional data analysis. New York: Springer-Verlag.
Rao SS, Bontrager EL, Gronley JK, Newsam CJ, Perry J (1996) Three-dimensional kinematics of wheelchair propulsion. IEEE Trans Rehabil Eng 4:152-160.
Rice I, Impink B, Niyonkuru C, Boninger M (2009) Manual wheelchair stroke characteristics during an extended period of propulsion. Spinal Cord 47:413-417.
Richter WM, Rodriguez R, Woods KR, Axelson PW (2007) Stroke pattern and handrim biomechanics for level and uphill wheelchair propulsion at self-selected speeds. Arch Phys Med Rehabil 88:81-87.
Rimmer JH, Braddock D (2002) Health promotion for people with physical, cognitive and sensory disabilities: an emerging national priority. Am J Health Promot 16:220-224, ii.
Rodgers MM, Keyser RE, Gardner ER, Russell PJ, Gorman PH (2000) Influence of trunk flexion on biomechanics of wheelchair propulsion. J Rehabil Res Dev 37:283-295.
Rodgers MM, Keyser RE, Rasch EK, Gorman PH, Russell PJ (2001) Influence of training on biomechanics of wheelchair propulsion. J Rehabil Res Dev 38:505-511.
Rodgers MM, McQuade KJ, Rasch EK, Keyser RE, Finley MA (2003) Upper-limb fatigue-related joint power shifts in experienced wheelchair users and nonwheelchair users. J Rehabil Res Dev 40:27-37.
Rodgers MM, Gayle GW, Figoni SF, Kobayashi M, Lieh J, Glaser RM (1994) Biomechanics of wheelchair propulsion during fatigue. Arch Phys Med Rehabil 75:85-93.
Rome LC, Funke RP, Alexander RM, Lutz G, Aldridge H, Scott F, Freadman M (1988) Why animals have different muscle fibre types. Nature 335:824-827.
Rosen J, Fuchs MB, Arcan M (1999) Performances of hill-type and neural network muscle models-toward a myosignal-based exoskeleton. Comput Biomed Res 32:415-439.
Roux L, Hanneton S, Roby-Brami A (2006) Shoulder movements during the initial phase of learning manual wheelchair propulsion in able-bodied subjects. Clin Biomech (Bristol, Avon) 21 Suppl 1:S45-51.
Ryan ED, Cramer JT, Housh TJ, Beck TW, Herda TJ, Hartman MJ, Stout JR (2007) Inter-individual variability among the mechanomyographic and electromyographic

168
amplitude and mean power frequency responses during isometric ramp muscle actions. Electromyogr Clin Neurophysiol 47:161-173.
Ryan ED, Beck TW, Herda TJ, Hartman MJ, Stout JR, Housh TJ, Cramer JT (2008) Mechanomyographic amplitude and mean power frequency responses during isometric ramp vs. step muscle actions. J Neurosci Methods 168:293-305.
Sanderson DJ, Sommer HJ, 3rd (1985) Kinematic features of wheelchair propulsion. J Biomech 18:423-429.
Sanderson DJ, Black A (2003) The effect of prolonged cycling on pedal forces. J Sports Sci 21:191-199.
Schantz P, Bjorkman P, Sandberg M, Andersson E (1999) Movement and muscle activity pattern in wheelchair ambulation by persons with para-and tetraplegia. Scand J Rehabil Med 31:67-76.
Semmler JG, Tucker KJ, Allen TJ, Proske U (2007) Eccentric exercise increases EMG amplitude and force fluctuations during submaximal contractions of elbow flexor muscles. J Appl Physiol 103:979-989.
Shima N, McNeil CJ, Rice CL (2007) Mechanomyographic and electromyographic responses to stimulated and voluntary contractions in the dorsiflexors of young and old men. Muscle Nerve 35:371-378.
Shinohara M, Kouzaki M, Yoshihisa T, Fukunaga T (1997) Mechanomyography of the human quadriceps muscle during incremental cycle ergometry. Eur J Appl Physiol Occup Physiol 76:314-319.
Singh VP, Kumar DK, Polus B, Fraser S (2007) Strategies to identify changes in SEMG due to muscle fatigue during cycling. J Med Eng Technol 31:144-151.
Smith DB, Housh TJ, Stout JR, Johnson GO, Evetovich TK, Ebersole KT (1997) Mechanomyographic responses to maximal eccentric isokinetic muscle actions. J Appl Physiol 82:1003-1007.
Smith DB, Housh TJ, Johnson GO, Evetovich TK, Ebersole KT, Perry SR (1998) Mechanomyographic and electromyographic responses to eccentric and concentric isokinetic muscle actions of the biceps brachii. Muscle Nerve 21:1438-1444.
Solomonow M, Baten C, Smit J, Baratta R, Hermens H, D'Ambrosia R, Shoji H (1990) Electromyogram power spectra frequencies associated with motor unit recruitment strategies. J Appl Physiol 68:1177-1185.
Srinivasan RC, Lungren MP, Langenderfer JE, Hughes RE (2007) Fiber type composition and maximum shortening velocity of muscles crossing the human shoulder. Clin Anat 20:144-149.
Steele BG, Belza B, Cain K, Warms C, Coppersmith J, Howard J (2003) Bodies in motion: monitoring daily activity and exercise with motion sensors in people with chronic pulmonary disease. J Rehabil Res Dev 40:45-58.
Stein RB, Hunter IW, Lafontaine SR, Jones LA (1995) Analysis of short-latency reflexes in human elbow flexor muscles. J Neurophysiol 73:1900-1911.

169
Stephenson DG, Lamb GD, Stephenson GM, Fryer MW (1995) Mechanisms of excitation-contraction coupling relevant to skeletal muscle fatigue. Adv Exp Med Biol 384:45-56.
Stokes MJ, Dalton PA (1991a) Acoustic myographic activity increases linearly up to maximal voluntary isometric force in the human quadriceps muscle. J Neurol Sci 101:163-167.
Stokes MJ, Dalton PA (1991b) Acoustic myography for investigating human skeletal muscle fatigue. J Appl Physiol 71:1422-1426.
Stokes MJ, Cooper RG (1992) Muscle sounds during voluntary and stimulated contractions of the human adductor pollicis muscle. J Appl Physiol 72:1908-1913.
Stout JR, Housh TJ, Johnson GO, Evetovich TK, Smith DB (1997) Mechanomyography and oxygen consumption during incremental cycle ergometry. Eur J Appl Physiol Occup Physiol 76:363-367.
Stulen FB, De Luca CJ (1982) Muscle fatigue monitor: a noninvasive device for observing localized muscular fatigue. IEEE Trans Biomed Eng 29:760-768.
Szeto GP, Straker LM, O'Sullivan PB (2005) A comparison of symptomatic and asymptomatic office workers performing monotonous keyboard work--1: neck and shoulder muscle recruitment patterns. Man Ther 10:270-280.
Tarata MT (2003) Mechanomyography versus electromyography, in monitoring the muscular fatigue. Biomed Eng Online 2:3.
Umberger BR, Gerritsen KG, Martin PE (2006) Muscle fiber type effects on energetically optimal cadences in cycling. J Biomech 39:1472-1479.
Van Boxtel A, Schomaker LR (1983) Motor unit firing rate during static contraction indicated by the surface EMG power spectrum. IEEE Trans Biomed Eng 30:601-609.
van Boxtel A, Schomaker LR (1984) Influence of motor unit firing statistics on the median frequency of the EMG power spectrum. Eur J Appl Physiol Occup Physiol 52:207-213.
van der Helm FC, Veeger HE (1996) Quasi-static analysis of muscle forces in the shoulder mechanism during wheelchair propulsion. J Biomech 29:39-52.
van der Ploeg HP, van der Beek AJ, van der Woude LH, van Mechelen W (2004) Physical activity for people with a disability: a conceptual model. Sports Med 34:639-649.
van der Woude LH, de Groot S, Janssen TW (2006) Manual wheelchairs: Research and innovation in rehabilitation, sports, daily life and health. Med Eng Phys 28:905-915.
van der Woude LH, de Groot G, Hollander AP, van Ingen Schenau GJ, Rozendal RH (1986) Wheelchair ergonomics and physiological testing of prototypes. Ergonomics 29:1561-1573.
van der Woude LH, Bakker WH, Elkhuizen JW, Veeger HE, Gwinn T (1998) Propulsion technique and anaerobic work capacity in elite wheelchair athletes: cross-sectional analysis. Am J Phys Med Rehabil 77:222-234.
170
van der Woude LH, Veeger HE, Dallmeijer AJ, Janssen TW, Rozendaal LA (2001) Biomechanics and physiology in active manual wheelchair propulsion. Med Eng Phys 23:713-733.
van Zuylen EJ, van Velzen A, Denier van der Gon JJ (1988) A biomechanical model for flexion torques of human arm muscles as a function of elbow angle. J Biomech 21:183-190.
Vander Linden DW, Kukulka CG, Soderberg GL (1991) The effect of muscle length on motor unit discharge characteristics in human tibialis anterior muscle. Exp Brain Res 84:210-218.
Vanlandewijck YC, Spaepen AJ, Lysens RJ (1994) Wheelchair propulsion efficiency: movement pattern adaptations to speed changes. Med Sci Sports Exerc 26:1373-1381.
Vanlandewijck YC, Daly DJ, Theisen DM (1999) Field test evaluation of aerobic, anaerobic, and wheelchair basketball skill performances. Int J Sports Med 20:548-554.
Veeger D, van der Woude LH, Rozendal RH (1989a) The effect of rear wheel camber in manual wheelchair propulsion. J Rehabil Res Dev 26:37-46.
Veeger HE, van der Helm FC (2007) Shoulder function: the perfect compromise between mobility and stability. J Biomech 40:2119-2129.
Veeger HE, van der Woude LH, Rozendal RH (1989b) Wheelchair propulsion technique at different speeds. Scand J Rehabil Med 21:197-203.
Veeger HE, van der Woude LH, Rozendal RH (1992) Effect of handrim velocity on mechanical efficiency in wheelchair propulsion. Med Sci Sports Exerc 24:100-107.
Veeger HE, Rozendaal LA, van der Helm FC (2002) Load on the shoulder in low intensity wheelchair propulsion. Clin Biomech (Bristol, Avon) 17:211-218.
von Tscharner V (2000) Intensity analysis in time-frequency space of surface myoelectric signals by wavelets of specified resolution. J Electromyogr Kinesiol 10:433-445.
von Tscharner V (2002) Time-frequency and principal-component methods for the analysis of EMGs recorded during a mildly fatiguing exercise on a cycle ergometer. J Electromyogr Kinesiol 12:479-492.
Wakeling J, Delaney R, Dudkiewicz I (2007) A method for quantifying dynamic muscle dysfunction in children and young adults with cerebral palsy. Gait Posture 25:580-589.
Wakeling JM (2004) Motor units are recruited in a task-dependent fashion during locomotion. J Exp Biol 207:3883-3890.
Wakeling JM (2009a) The recruitment of different compartments within a muscle depends on the mechanics of the movement. Biol Lett 5:30-34.
Wakeling JM (2009b) Patterns of motor recruitment can be determined using surface EMG. J Electromyogr Kinesiol 19:199-207.

171
Wakeling JM, Syme DA (2002) Wave properties of action potentials from fast and slow motor units of rats. Muscle Nerve 26:659-668.
Wakeling JM, Rozitis AI (2004) Spectral properties of myoelectric signals from different motor units in the leg extensor muscles. J Exp Biol 207:2519-2528.
Wakeling JM, Uehli K, Rozitis AI (2006) Muscle fibre recruitment can respond to the mechanics of the muscle contraction. J R Soc Interface 3:533-544.
Wakeling JM, Pascual SA, Nigg BM, von Tscharner V (2001) Surface EMG shows distinct populations of muscle activity when measured during sustained sub-maximal exercise. Eur J Appl Physiol 86:40-47.
Wakeling JM, Kaya M, Temple GK, Johnston IA, Herzog W (2002) Determining patterns of motor recruitment during locomotion. J Exp Biol 205:359-369.
Walker DJ, Heslop PS, Plummer CJ, Essex T, Chandler S (1997) A continuous patient activity monitor: validation and relation to disability. Physiol Meas 18:49-59.
Watakabe M, Itoh Y, Mita K, Akataki K (1998) Technical aspects of mechnomyography recording with piezoelectric contact sensor. Med Biol Eng Comput 36:557-561.
Watakabe M, Mita K, Akataki K, Itoh Y (2001) Mechanical behaviour of condenser microphone in mechanomyography. Med Biol Eng Comput 39:195-201.
Weir JP, Ayers KM, Lacefield JF, Walsh KL (2000) Mechanomyographic and electromyographic responses during fatigue in humans: influence of muscle length. Eur J Appl Physiol 81:352-359.
WHO (2001) International classification of functioning, disability and health. In. Geneva: World Health Organisation.
Yang YS, Koontz AM, Triolo RJ, Mercer JL, Boninger ML (2006) Surface electromyography activity of trunk muscles during wheelchair propulsion. Clin Biomech (Bristol, Avon) 21:1032-1041.
Yao W, Fuglevand RJ, Enoka RM (2000) Motor-unit synchronization increases EMG amplitude and decreases force steadiness of simulated contractions. J Neurophysiol 83:441-452.
Yokozawa T, Fujii N, Ae M (2007) Muscle activities of the lower limb during level and uphill running. J Biomech 40:3467-3475.
Yoshitake Y, Shinohara M, Ue H, Moritani T (2002) Characteristics of surface mechanomyogram are dependent on development of fusion of motor units in humans. J Appl Physiol 93:1744-1752.
Zhou P, Rymer WZ (2004) Can standard surface EMG processing parameters be used to estimate motor unit global firing rate? J Neural Eng 1:99-110.