Embed Size (px)
Citation preview
9240.1-05-01PB 94-963502
EPA 540/R-94/013February 1994
USEPA CONTRACT LABORATORY PROGRAMNATIONAL FUNCTIONAL GUIDELINES
FORINORGANIC DATA REVIEW
Office of Emergency and Remedial ResponseU.S. Environmental Protection Agency
Washington, DC 20460
NOTICE
The polices and procedures set forth here are intended as guidance to the Agencyand other governmental employees. They do not constitute rulemaking by theagency, and may not be relied on to create a substantive or procedural rightenforceable by any other person. The Government may take action that is atvariance with the policies and procedures in this manual.
Additional copies of this document can be obtained from:
National Technical Information Service (NTIS)U.S. Department of Commerce5285 Port Royal RoadSpringfield, VA 22161(703) 487-4650Document Number PB 94-963502
ii
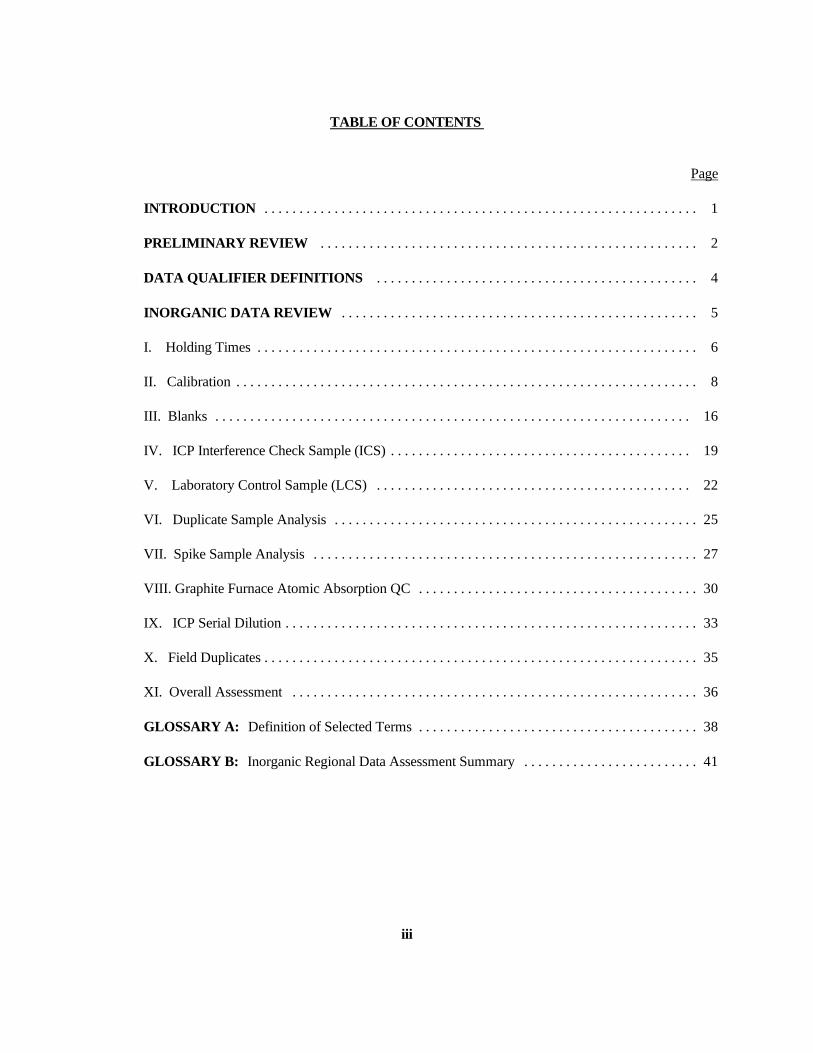
TABLE OF CONTENTS
Page
INTRODUCTION . . . . . . . . . . . . . . . . . . . . . . . . . . . . . . . . . . . . . . . . . . . . . . . . . . . . . . . . . . . . . . 1
PRELIMINARY REVIEW . . . . . . . . . . . . . . . . . . . . . . . . . . . . . . . . . . . . . . . . . . . . . . . . . . . . . . 2
DATA QUALIFIER DEFINITIONS . . . . . . . . . . . . . . . . . . . . . . . . . . . . . . . . . . . . . . . . . . . . . . 4
INORGANIC DATA REVIEW . . . . . . . . . . . . . . . . . . . . . . . . . . . . . . . . . . . . . . . . . . . . . . . . . . . 5
I. Holding Times . . . . . . . . . . . . . . . . . . . . . . . . . . . . . . . . . . . . . . . . . . . . . . . . . . . . . . . . . . . . . . . 6
II. Calibration . . . . . . . . . . . . . . . . . . . . . . . . . . . . . . . . . . . . . . . . . . . . . . . . . . . . . . . . . . . . . . . . . . 8
III. Blanks . . . . . . . . . . . . . . . . . . . . . . . . . . . . . . . . . . . . . . . . . . . . . . . . . . . . . . . . . . . . . . . . . . . . 16
IV. ICP Interference Check Sample (ICS) . . . . . . . . . . . . . . . . . . . . . . . . . . . . . . . . . . . . . . . . . . . 19
V. Laboratory Control Sample (LCS) . . . . . . . . . . . . . . . . . . . . . . . . . . . . . . . . . . . . . . . . . . . . . 22
VI. Duplicate Sample Analysis . . . . . . . . . . . . . . . . . . . . . . . . . . . . . . . . . . . . . . . . . . . . . . . . . . . . 25
VII. Spike Sample Analysis . . . . . . . . . . . . . . . . . . . . . . . . . . . . . . . . . . . . . . . . . . . . . . . . . . . . . . . 27
VIII. Graphite Furnace Atomic Absorption QC . . . . . . . . . . . . . . . . . . . . . . . . . . . . . . . . . . . . . . . . 30
IX. ICP Serial Dilution . . . . . . . . . . . . . . . . . . . . . . . . . . . . . . . . . . . . . . . . . . . . . . . . . . . . . . . . . . . 33
X. Field Duplicates . . . . . . . . . . . . . . . . . . . . . . . . . . . . . . . . . . . . . . . . . . . . . . . . . . . . . . . . . . . . . . 35
XI. Overall Assessment . . . . . . . . . . . . . . . . . . . . . . . . . . . . . . . . . . . . . . . . . . . . . . . . . . . . . . . . . . 36
GLOSSARY A: Definition of Selected Terms . . . . . . . . . . . . . . . . . . . . . . . . . . . . . . . . . . . . . . . . 38
GLOSSARY B: Inorganic Regional Data Assessment Summary . . . . . . . . . . . . . . . . . . . . . . . . . 41
iii
1
INTRODUCTION
This document is designed to offer guidance on EPA Contract Laboratory Program (CLP) inorganicanalytical data evaluation and review. In some applications it may be used as a Standard OperatingProcedure (SOP). In other, more subjective areas, only general guidance is offered due to the complexitiesand uniqueness of data relative to specific samples. Those areas where specific SOPs are possible areprimarily areas in which definitive performance requirements are established. These requirements areconcerned with specifications that are not sample dependent; they specify certain performance requirementson matters that should be fully under a laboratory's control. These specific areas include blanks, calibrationstandards, calibration verification standards, laboratory control standards, and interference check standards. In particular, mistakes such as calculation and transcription errors must be rectified by resubmission ofcorrected data sheets.
These Guidelines include the requirements for the Inorganic Analysis Multi-media Multi-Concentration method.
This document is intended to assist in the technical review of analytical data generated through theCLP. Determining contract compliance is not the intended objective of these guidelines. The data reviewprocess provides information on analytical limitations of data based on specific quality control (QC) criteria. In order to provide more specific usability statements, the reviewer must have a complete understanding ofthe intended use of the data. For this reason, it is recommended that whenever possible the reviewer obtainusability issues from the user prior to reviewing the data. When this is not possible, the user should beencouraged to communicate any questions to the reviewer.
At times, there may be a need to use data which do not meet all contract requirements and technicalcriteria. Use of these data does not constitute either a new requirement standard or full acceptance of thedata. Any decision to utilize data for which performance criteria have not been met is strictly to facilitate theprogress of projects requiring the availability of the data. A contract laboratory submitting data which are outof specification may be required to rerun or resubmit data, even if the previously submitted data have beenutilized due to program needs. Data which do not meet specified requirements are never fully acceptable. The only exception to this requirement is in the area of requirements for individual sample analysis; if thenature of the sample itself limits the attainment of specifications, appropriate allowances must be made.
All data reviews must have, as a cover sheet, the Inorganic Regional Data Assessment (IRDA) form(a copy is attached at the end of this document). If actions are required, they should be specifically noted onthis form. In addition, this form is to be used to summarize overall deficiencies requiring attention, as well asgeneral laboratory performance and any discernible trends in the quality of the data. (This form is not areplacement for the data review.) Sufficient supplementary documentation must accompany the form toclearly identify the problems associated with a case. The form and any attachments must be submitted to theAnalytical Operations Branch Contract Laboratory Program Quality Assurance Coordinator (CLP QAC), theRegional Technical Project Officer (TPO).
2
PRELIMINARY REVIEW
In order to use this document effectively, the reviewer should have a general overview of the sampledelivery group (SDG) or sample case at hand. The exact number of samples, their assigned numbers, theirmatrix, and the number of laboratories involved in their analysis are essential information. Backgroundinformation on the site is helpful but often this information is very difficult to locate. The site manager is thebest source for answers or further direction.
Sample cases (SDGs) routinely have unique samples which require special attention by the reviewer. These include field blanks, field duplicates, and performance audit samples which need to be identified. Thesampling records should identify:
1. The Project Officer for site.2. The Complete list of samples with notations on:
a) sample matrix,b) blanks*,c) field duplicates*,d) field spikes*,e) QC audit sample*,f) shipping dates,g) preservatives, andh) labs involved
* If applicable
The chain-of-custody record includes sample descriptions and date(s) of sampling. The reviewermust take into account lag times between sampling and start of analysis when assessing technical sampleholding times.
The laboratory's SDG Narrative is another source of general information. Notable problems withmatrices, insufficient sample volume for analysis or reanalysis, samples received in broken containers,preservation, and unusual events should be found in the SDG Narrative.
The SDG Narrative for the sample data package must include a Laboratory Certification Statement(exactly as written in the method), signed by the laboratory manager or his designee. This statementauthorizes the validation and release of the sample data results. In addition, the laboratory must also providecomments in the SDG narrative describing in detail any problems encountered in processing the samples inthe data package.
For every data package, the reviewer must verify that the laboratory certification statement is present,exactly stated as in the method (i.e., verbatim to the statement in the method), and signed by the LaboratoryManager or designee. The reviewer must further verify that the data package is consistent with thelaboratory's certified narrative. Also, the reviewer should check the comments provided in the narrative todetermine if they are sufficient to describe and explain any associated problem(s).
3
The data review should include comments that clearly identify the problems associated with a case orSample Delivery Group (SDG) and to state the limitations of the data. Documentation should include thesample number, analytical method, extent of the problem, and assigned qualifiers.
A data review narrative generally accompanies the laboratory data forwarded to the intended datarecipient (client) or user to promote communications. A copy of the data review narrative should besubmitted to the Regional CLP Technical Project Officer (TPO) assigned oversight responsibility for thelaboratory producing the data.
It is a responsibility to notify the appropriate Regional CLP TPO concerning problems anddeficiencies with regard to laboratory data. If there is an urgent requirement, the TPO may be contacted bytelephone to expedite corrective action. It is recommended that all items for TPO action be presented at onetime.

4
DATA QUALIFIER DEFINITIONS
The following definitions provide brief explanations of the national qualifiers assigned to results inthe data review process. If the Regions choose to use additional qualifiers, a complete explanation of thosequalifiers should accompany the data review.
U - The material was analyzed for, but was not detected above the level ofthe associated value. The associated value is either the samplequantitation limit or the sample detection limit.
J - The associated value is an estimated quantity.
R - The data are unusable. (Note: Analyte may or may not be present.)
UJ - The material was analyzed for, but was not detected. The associatedvalue is an estimate and may be inaccurate or imprecise.
5
INORGANIC DATA REVIEW
The inorganic data requirements to be checked during validation are listed below:
I. Holding Times (Method Holding Times)
II. Calibration
Initial
Initial and Continuing Calibration Verification
III. Blanks
IV. ICP Interference Check Sample
V. Laboratory Control Sample
VI. Duplicate Sample
VII. Spike Sample Analysis
VIII. Graphite Furnace Atomic Absorption QC
IX. ICP Serial Dilution
X. Field Duplicates
XI. Overall Assessment
6
I. HOLDING TIMES
A. Review Items: Form I-IN, Form XIII-IN, EPA Sample Traffic Report and/or chain-of-custody, rawdata, and SDG Narrative.
B. Objective:
The objective is to ascertain the validity of results based on the holding time of the sample from thetime of collection to the time of analysis.
C. Criteria:
Technical requirements for sample holding times have only been established for water matrices. Theaddition of Nitric Acid or Sodium Hydroxide to adjust the pH is only required for aqueous samples.
The technical holding time criteria for water samples are as follows:
METALS: 180 days; preserved (with Nitric Acid) to pH < 2
MERCURY: 28 days; preserved (with Nitric Acid) to pH < 2
CYANIDE: 14 days; cooled @ 4 C + 2 C, preserved (with Sodium Hydroxide) to pH > 12
The preservation for soil/sediment samples is maintenance at 4 C + 2 C until analysis.
NOTE: The technical holding time is based on the date of collection, rather than validated time ofsample receipt (VTSR), and date of analysis. The method maximum holding times may differ fromthe technical holding times.
D. Evaluation:
Technical holding times are established by comparing the sampling date(s) on the EPA SampleTraffic Report with the dates of analysis found on FORM 1-IN, and in the laboratory raw data(instrument run logs). Information contained in the complete SDG file should also be considered inthe determination of holding times. Verify that the analysis dates on the Form Is and the rawdata/SDG file are identical. Review the SDG narrative to determine if the samples were properlypreserved. If there is no indication in the SDG narrative or the sample records that there was aproblem with the samples, then the integrity of samples can be assumed to be good. If it is indicatedthat there were problems with the samples, then the integrity of the sample may have beencompromised and professional judgement should be used to evaluate the effect of the problem on thesample results.
E. Action:
7
1. If technical holding times and preservation requirements are not met, qualify all resultsgreater than the Instrument Detection Limit (IDL) as estimated (J), and results less than theIDL as estimated (UJ).
2. If holding times are exceeded, the reviewer must use professional judgement to determine thereliability of the data and the effects of additional storage on the sample results. Theexpected bias would be low and the reviewer may determine that results <IDL are unusable(R).
3. Due to limited information concerning holding times for soil samples, it is left to thediscretion of the data reviewer whether to apply water holding time criteria to soil samples. If the data are qualified when water holding time criteria are applied to soil samples, it mustbe clearly documented in the data review narrative.
4. When the holding times are exceeded, the reviewer should comment in the data reviewnarrative on any possible consequences for the analytical results.
5. If the holding times are grossly exceeded, it should be noted for TPO action.
8
II. CALIBRATION
A. Review Items: Form II-IN (Part A & B), Form XIII-IN, preparation logs, calibration standard logs,instrument logs, instrument printouts, and raw data.
B. Objective:
Method requirements for satisfactory instrument calibration are established to ensure that theinstrument is capable of producing acceptable quantitative data for the metals and cyanide on theInorganic Target Analyte List (TAL). Initial calibration demonstrates that the instrument is capableof acceptable performance at the beginning of the analytical run. Continuing calibration verificationestablishes that the initial calibration is still valid by checking the performance of the instrument on acontinual basis.
C. Criteria:
1. Initial Calibration
The instruments must be successfully calibrated daily or once every 24 hours, and each timethe instrument is set up. The calibration date and time are to be included in the raw data.
a. Inductively Coupled Plasma (ICP) Analysis
1) A blank and at least one calibration standard must be used in establishingeach analytical curve. All measurements must be within the instrumentlinear working range where the interelement correction factors are valid. Aminimum of two replicate exposures are required for standardization and allQC and sample analyses. The average result of the multiple exposures forthe standardization, QC, and sample analyses must be used.
2) The instrumental calibration near the Contract Required Detection Limit(CRDL) must be verified for each analyte. An ICP standard solution (CRI)shall be prepared at two times the CRDL, or two times the InstrumentDetection Limit (IDL), whichever is greater. The CRI shall be analyzed atthe beginning and end of each sample analysis run, or at a minimum oftwice per 8 hour working shift, whichever is more frequent, but not beforeInitial Calibration Verification.
3) The CRI shall be run by ICP for every wavelength used for analysis, exceptthose for Al, Ba, Ca, Fe, Mg, Na, and K. If the results for the CRI did notfall within the fixed acceptance limits, the analysis should have beenterminated, the problem corrected, the instrument recalibrated, and the newcalibration then reverified.
b. Graphite Furnace Atomic Absorption Analysis (GFAA)
9
1) Calibration standards are to be prepared fresh daily, or each time ananalysis is to be made, and discarded after use. The date and time ofstandard preparation and analysis are to be recorded in the raw data.
2) A blank and at least three calibration standards must be used in establishingeach analytical curve, with the blank being analyzed first. One of thecalibration standards must be run at the CRDL.
3) The linearity of the analytical curve must be verified near the CRDL forGraphite Furnace AA (GFAA). A standard solution (CRA) shall beprepared at the CRDL or at the IDL, whichever is greater. The CRA shallbe analyzed at the beginning of each sample analysis run, but not before theInitial Calibration Verification.
4) All results and percent recoveries (%R) for the CRA are to be reported onForm II (Part 2)-IN. If the results for the CRA did not fall within the fixedacceptance limits, the analysis should have been terminated, the problemcorrected, the instrument recalibrated, and the new calibration thenreverified.
c. Cold Vapor Mercury Analysis
1) A blank and from five to eight calibration standards (depending on thespecific method being used) must be employed in establishing the analyticalcurve, with the blank being analyzed first. One of the calibration standardsmust be at the CRDL.
2) The linearity of the analytical curve must be verified near the CRDL. Astandard solution (CRA) shall be prepared at the CRDL or at the IDL,whichever is greater. The CRA shall be analyzed at the beginning of eachsample analysis run, but not before the Initial Calibration Verification.
3) Analysis of the CRA standard for mercury is required for both the manualand automated cold vapor methods, and the results and %R are to bereported on Form II(Part 2)-IN. However, no specific acceptance criteriahas been established by the EPA for mercury at this time.
Note: The calibration curves for the AA metals (and Hg) should possess a correlationcoefficient of >0.995, in order to ensure the linearity over the calibrated range.
d. Cyanide Analysis
1) A blank and at least three calibration standards, one of which must be at the
10
CRDL, must be used in establishing the analytical curve.
2) The standard curve must bracket the concentration of the samples.
3) At least one calibration standard (mid-level) must be distilled and comparedto similar values on the curve to ensure that the distillation technique isreliable. The distilled standard must agree within +15% of the undistilledstandard.
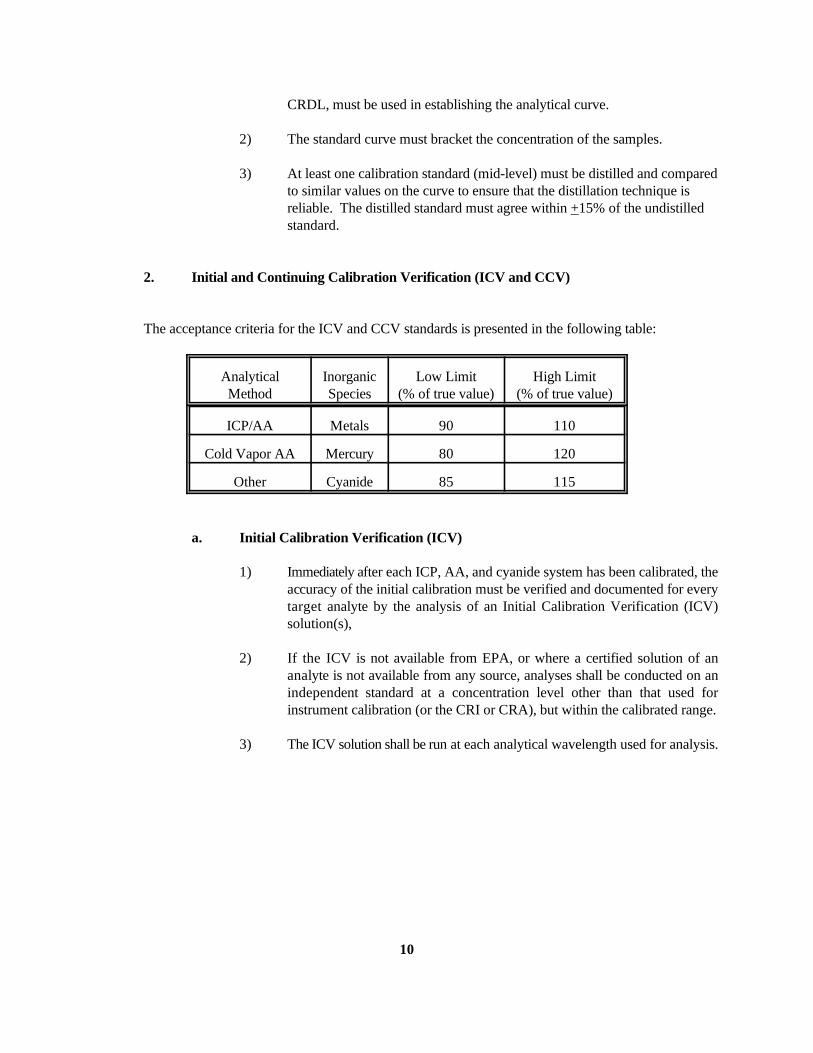
2. Initial and Continuing Calibration Verification (ICV and CCV)
The acceptance criteria for the ICV and CCV standards is presented in the following table:
Analytical Inorganic Low Limit High LimitMethod Species (% of true value) (% of true value)
ICP/AA Metals 90 110
Cold Vapor AA Mercury 80 120
Other Cyanide 85 115
a. Initial Calibration Verification (ICV)
1) Immediately after each ICP, AA, and cyanide system has been calibrated, theaccuracy of the initial calibration must be verified and documented for everytarget analyte by the analysis of an Initial Calibration Verification (ICV)solution(s),
2) If the ICV is not available from EPA, or where a certified solution of ananalyte is not available from any source, analyses shall be conducted on anindependent standard at a concentration level other than that used forinstrument calibration (or the CRI or CRA), but within the calibrated range.
3) The ICV solution shall be run at each analytical wavelength used for analysis.
11
4) For cyanide analysis, the ICV standard solution shall be distilled with eachbatch of samples analyzed. An ICV distilled with a particular set of samplesmust be analyzed only with that sample set. Additionally, for aqueous samplesthe ICV for cyanide can also be used as the Laboratory Control Sample (LCS).However, a separate ICV is required for soil cyanide samples.
b. Continuing Calibration Verification (CCV)
1) To ensure the accuracy during the course of each analytical run, the CCV shallbe analyzed and reported for each wavelength used for the analysis of eachanalyte.
2) The CCV standard must be analyzed at a frequency of 10% or every two hoursduring an analytical run, whichever is more frequent. The CCV standard shallalso be analyzed at the beginning of the run and after the last analyticalsample.
3) The analyte concentration(s) in the CCV standard(s) shall be different than theconcentration used for the initial calibration verification (ICV), and shall beone of the following solutions at or near the mid-range levels of the calibrationcurve:
a. EPA Solutions.b. NIST Standards.c. A Laboratory-prepared standard solution (self-prepared or
commercially available).
4) The same CCV standard solution shall be used throughout the analysis runsfor a case of samples received.
5) The CCV shall be analyzed in the same fashion as an actual sample.Operations such as the number of replicate analysis, the number and durationof the instrument rinses, etc., affect the measured CCV result and are not to beapplied to the CCV in a greater extent than they are applied to the associatedanalytical samples.
12
D. Evaluation:
a. ICP Analysis
1) Verify that the instrument was calibrated daily and each time the instrument was set-up,utilizing a blank and at least one calibration standard.
2) Confirm that the measurements were within the documented linear working range, andare the average result of at least two replicate exposures.
3) Evaluate the reported CRI standard to confirm that it analyzed at the properconcentration, frequency, and location within the analytical run sequence. Verify thatacceptable %R results were obtained.
4) Verify that the ICV and CCV standards were analyzed for each analyte at the properfrequency and at the appropriate concentration. Verify that acceptable %R results wereobtained.
5) Recalculate one or more of the ICV and CCV %R using the following equation andverify that the recalculated value agrees with the laboratory reported values on FormIIA. Due to possible rounding discrepancies, allow results to fall within 1% of thecontract windows (e.g., for ICP 89-111%).
%R = Found x 100True
Where: Found = Concentration (in ug/L) of each analyte measured in the analysis ofthe ICV or CCV solution.
True = Concentration (in ug/L) of each analyte in the ICV or CCVsource.
b. Atomic Absorption (AA) and Cold Vapor Mercury Analysis
1) Verify the date and time the various calibration standards were prepared, and theiranalytical use.
2) Verify that the instrument was calibrated daily for each analyte. For each time that theinstrument was set-up, confirm that a blank and the proper concentration and numberof calibration standards were utilized depending on the actual method employed for theanalysis (e.g., for AA a blank and at least three standards, and for Hg a blank and fromfive to eight calibration standards, depending on the method). Confirm that one of thecalibration standards was analyzed at the CRDL.
13
3) Evaluate the reported CRA standard to confirm that it analyzed at the proper frequency,concentration, and location within the analytical run sequence. Verify that for AA CRAanalysis, acceptable %R results were obtained.
4) Verify that the ICV and CCV standards were analyzed for each analyte at the properfrequency and at the appropriate concentration. Verify that acceptable %R results wereobtained.
5) Recalculate one or more of the ICV and CCV %R using the following equation andverify that the recalculated value agrees with the laboratory reported values on FormIIA. Due to possible rounding discrepancies, allow results to fall within 1% of thecontract windows (e.g., for AA 89-111%, and for Hg 79-121%).
%R = Found x 100True
Where: Found = Concentration (in ug/L) of each analyte measured in the analysis of the ICVor CCV solution.
True = Concentration (in ug/L) of each analyte in the ICV or CCV source.
c. Cyanide Analysis
1) Verify that the instrument was calibrated daily and each time the instrument was set-up,utilizing a blank and at least three calibration standards. Confirm that one of thecalibration standards was analyzed at the CRDL.
2) Check the distillation log and verify that the mid-level CN standard was distilled andanalyzed. Verify that the distilled mid-level CN standard agrees within +15% of theundistilled standard.
3) Verify that the ICV and CCV standards were analyzed at the proper frequency and atthe appropriate concentrations. Verify that acceptable %R results were obtained.
14
4) Recalculate one or more of the ICV and CCV %R using the following equation andverify that the recalculated value agrees with the laboratory reported values on FormIIA. Due to possible rounding discrepancies, allow results to fall within 1% of thecontract windows (e.g., for Cyanide 84-116%).
%R = Found x 100True
Where: Found = Concentration (in ug/L) of each analyte measured in the analysis ofthe ICV or CCV solution.
True = Concentration (in ug/L) of each analyte in the ICV or CCVsource.
E. Action:
1. If the minimum number of standards as defined in INORG Section II.B.1. above were not usedfor initial calibration, or if the instrument was not calibrated daily and each time the instrumentwas set up, qualify the data as unusable (R).
2. If the correlation coefficient is <0.995 (AA and Cold Vapor Hg), qualify results greater than theIDL as estimated (J), and results less than the IDL as estimated (UJ). Depending on the degreeof the deviation from linearity, further qualification of the data may be required depending onthe professional judgement of the reviewer (e.g, unusable data (R)).
3. If one of the midrange CN standards was not distilled, analyzed, and shown to be in agreementwith the un-distilled standard, then qualify all associated sample results as estimated (J).
4. If any CRA or CRI standards are outside the listed acceptance criteria:
a. Utilizing professional judgement, any potential effects on the data should be notedin the data review narrative.
b. Extreme or repetitive failure should be noted for TPO action.
c. Professional judgement shall be used to determine if it is necessary to qualify thedata for any analyte.
15
5. If the ICV or CCV %R falls outside the acceptance windows, use professional judgement toqualify all associated data. If possible, indicate the bias in the review. The following guidelinesare recommended:
a. If the ICV or CCV %R falls outside the acceptance windows but within theranges of 75-89% or 111-125% (CN, 70-84% or 116-130%; Hg, 65-79% or121-135%), qualify results > IDL as estimated (J).
b. If the ICV or CCV %R is within the range of 111-125% (CN, 116-130%; Hg,121-135%), results < IDL are acceptable.
c. If the ICV or CCV %R is 75-89% (CN, 70-84%; Hg, 65-79%), qualify results< IDL as estimated (UJ).
d. If the ICV or CCV %R is <75%, (CN, <70%; Hg, <65%), qualify all positiveresults as unusable (R).
e. If the ICV or CCV %R is >125%, (CN > 130%; Hg >135%), qualify results>IDL as unusable (R); results < IDL are acceptable.
6. If the laboratory has failed to provide adequate calibration information, the designatedrepresentative should contact the laboratory and request the necessary information. If theinformation is not available, the reviewer must then use professional judgement to assess thedata.
7. Whenever possible, the potential effects on the reported data due to exceeding the calibrationcriteria should be noted in the data review narrative.
8. If calibration criteria are grossly exceeded, the specifics should be noted for TPO action.
Note: For truly critical samples, a further in-depth evaluation of the calibration curve may be warrantedto determine if additional qualification is necessary.
16
III. BLANKS
A. Review Items: Form I-IN, Form III-IN, Form XIII-IN, Form XIV-IN, preparation logs, calibrationstandard logs, instrument logs, and raw data.
B. Objective:
The assessment of blank analysis results is to determine the existence and magnitude of contaminationresulting from laboratory (or field) activities. The criteria for evaluation of blanks applies to any blankassociated with the samples (e.g., method blanks, calibration blanks, field blanks, etc.). If problems withany blank exist, all associated data must be carefully evaluated to determine whether or not there is aninherent variability in the data, or if the problem is an isolated occurrence not affecting other data.
C. Criteria:
1. No contaminants should be found in the blank(s).
2. The initial calibration blank (ICB) is analyzed after the analytical standards, but not beforeanalysis of the ICV, during the initial calibration of the instrument. (see INORG Section II.C.1.above).
3. A continuing calibration blank (CCB) must be analyzed at each wavelength used for theanalysis, immediately after every initial and continuing calibration verification. The CCB shallbe analyzed at a frequency of 10% or every two hours during the run, whichever is morefrequent. The CCB shall be analyzed at the beginning of the run, and after the last CCV thatwas analyzed after the last analytical sample of the run. The CCB result (absolute value) mustnot exceed the CRDL, for each analyte analyzed for.
4. At least one preparation blank (PB), must be prepared and analyzed for each matrix, with everySDG, or with each batch of samples digested, whichever is more frequent. The preparationblank consists of deionized distilled water processed through the appropriate sample preparationand analysis procedure.
5. If any analyte concentration in the PB is above the CRDL, the lowest concentration of thatanalyte in the associated samples must be 10 times the PB concentration. Otherwise, allsamples associated with that PB with the analyte's concentration less than 10 times the PBconcentration, and above the CRDL, should have been re-digested and re-analyzed for thatanalyte (except for an identified aqueous soil field blank). The sample concentration is not tobe corrected for the blank value.
6. If the concentration of the PB for a certain analyte is below the negative CRDL, then all samplesreported below 10 times the CRDL (associated with that analyte in that blank), should havebeen re-digested and re-analyzed.
D. Evaluation:
17
1. Verify that an ICB was analyzed after the calibration, and that the CCB was analyzed at theproper frequency and location during the run. PB's were prepared and analyzed as appropriatefor the SDG (e.g., total number of samples, various types of matrices present, number ofdigestion batches, etc.).
2. Review the results reported on the Blank Summary (Form III-IN), as well as the raw data (e.g.,ICP printouts, strip charts, printer tapes, bench sheets, etc.), for all blanks and verify that theresults were accurately reported.
3. Evaluate all of the associated blanks for the presence of target analytes.
E. Action:
1. If the appropriate blanks were not analyzed with the correct frequency, then the data reviewershould use professional judgement to determine if the associated sample data should bequalified. The reviewer may need to obtain additional information from the laboratory. Thesituation should then be recorded in the review narrative, and noted for TPO action.
2. Action regarding unsuitable blank results depends on the circumstances and origin of the blank.The reviewer should note that in instances where more than one blank is associated with a givensample, qualification should be based upon a comparison with the associated blank having thehighest concentration of a contaminant. The results must not be corrected by subtracting anyblank value.
3. Some general "technical" review actions are as follows:
a. Actions in the case of unusable blank results depends on the circumstances and originof the blank in question. Sample results greater than the IDL but less than 5 times theamount found in any blank should be qualified as (U).
b. Any blank reported with a negative result whose absolute value is greater than the IDLmust be carefully evaluated to determine its effect on the sample data. The reviewershall then use professional judgement to asses the data.
c. The blank analyses may not involve the same weights, volumes, or dilution factors asthe associated samples. In particular, soil sample results reported on Form I-IN willnot be on the same basis (units, dilution) as the calibration blank data reported on FormIII-IN. The reviewer may find it easier to work from the raw data when applying the5X criteria to soil sample data, or calibration blank data.
18
4. Specific "method" actions are as follows:
a. If the magnitude (absolute value) of the CCB result exceeds the IDL, the result shallbe reported in ug/L on Form III-IN, otherwise report as "IDL-U".
b. If the absolute value of the CCB result exceeds the CRDL, the analysis should havebeen terminated. This situation should be noted for TPO action, and recorded in thedata review narrative. The reviewer shall then use professional judgement to asses thedata.
c. If the absolute value of the concentration of the PB is less than or equal to the CRDL,no correction of the sample results is performed.
d. If any analyte concentration in the PB is above the CRDL, the lowest concentration ofthat analyte in the associated samples must be 10 times the PB concentration.Otherwise, all samples associated with that blank should have been redigested andreanalyzed. This situation should be noted for TPO action, and recorded in the datareview narrative. The reviewer shall then use professional judgement to asses the data.The sample concentration is not to be corrected for the blank value.
19
IV. ICP INTERFERENCE CHECK SAMPLE (ICS)
A. Review Items: Form IV-IN, Form XIV-IN, instrument printouts, raw data.
B. Objective:
The ICP Interference Check Sample (ICS) verifies the contract laboratory's interelement and backgroundcorrection factors.
C. Criteria:
1. The ICS consists of two solutions: Solution A and Solution AB. Solution A consists of theinterferents, and solution AB consists of the analytes mixed with the interferents. An ICSanalysis consists of analyzing both solutions consecutively, starting with solution A, for allwavelengths used for each analyte reported by ICP.
2. An ICS must be run at the beginning and end of each sample analysis run (or a minimum oftwice per 8 hour working shift), whichever is more frequent. The ICS is not to be run prior tothe initial calibration verification.
3. Results for the ICP analysis of the ICS solution AB must fall within the control limits of + 20%of the true value for the analytes included in the solution. If true values for the analytes are notsupplied with the ICS, the mean shall be determined by initially analyzing the ICS at least fivetimes repetitively for the particular analytes. This mean determination shall be made during ananalytical run where the results for the previously supplied EPA ICS solution met all contractspecifications. Additionally, the results of this initial mean determination shall be used as thetrue value until the solution is exhausted.
4. The ICS should be obtained from EPA (EMSL-LV) if available and analyzed according to theinstructions supplied with the solutions. If the ICS is not available from EPA, then anindependent ICS solution shall be prepared with the interferant and analyte concentrations atthe levels specified in the method. The mean and standard deviation of the prepared solutionshall be established by initially analyzing the ICS at least five times repetitively for eachparameter on Form IV-IN. The mean and standard deviation shall be reported in the raw data.
D. Evaluation:
1. Verify from the raw data (ICP instrumental printout) that the ICS was analyzed at the properfrequency and location during the analytical run.
2. Evaluate the ICS raw data for results with an absolute value greater than the IDL for thoseanalytes which are not present in the ICS solution.
20
3. If an ICS solution not obtained from EPA was used, investigate the raw data for the fiverepetitive analyses. Check the calculations of the mean and standard deviation for the ICSanalytes.
4. Recalculate from the raw data one or more of the analyte percent recoveries (%R) using thefollowing equation, and verify that the recalculated value agrees with the laboratory reportedvalues on Form IV-IN.
ICS %R = Found Solution AB x 100True Solution AB
Where:
Found Solution AB = concentration (in ug/L) of each analyte measured in the analysisof solution AB.
True Solution AB = concentration (in ug/L) of each analyte in solution AB.
E. Action:
1. For samples with concentrations of A1, Ca, Fe, and Mg which are comparable to or greater thantheir respective levels in the Interference Check Sample:
a. If the ICS recovery for an element is >120% and the sample results are < IDL, this datais acceptable for use.
b. If the ICS recovery for an element is >120% and the sample results are > IDL, qualifythe affected data as estimated (J).
c. If the ICS recovery for an element falls between 50 and 79% and the sample results are> IDL, qualify the affected data as estimated (J).
d. If sample results are < IDL, and the ICS recovery for that analyte falls within the rangeof 50-79%, the possibility of false negatives may exist. Qualify the data for thesesamples as estimated (UJ).
e. If ICS recovery results for an element fall <50%, qualify the affected data as unusable(R).
Note: If possible, indicate the bias for the estimated results in the data review narrative.
2. If results > IDL are observed for elements which are not present in the ICS solution, thepossibility of false positives exists. An evaluation of the associated sample data for the affectedelements should be made. For samples with comparable or higher levels of interferents and withanalyte concentrations that approximate those levels found in the ICS (false positives), qualifysample results > IDL as estimated (J).
21
3. If negative results are observed for elements that are not present in the ICS solution, and theirabsolute value is > IDL, the possibility of false negatives in the samples may exist. If theabsolute value of the negative results is > IDL, an evaluation of the associated sample datashould be made. For samples with comparable or higher levels of interferents, qualify resultsfor the affected analytes < IDL as estimated (UJ).
4. In general, the sample data can be accepted if the concentrations of A1, Ca, Fe and Mg in thesample are found to be less than or equal to their respective concentrations in the ICS. If theseelements are present at concentrations greater than the level in the ICS, or other elements arepresent in the sample at >10 mg/L, the reviewer should investigate the possibility of otherinterference effects as given in the ICP method. These analyte concentration equivalentspresented in the method should be considered only as estimated values, since the exact value ofany analytical system is instrument specific. Therefore, estimate the concentration produced byan interfering element. If the estimate is greater than 2X CRDL and also greater than 10% ofthe reported concentration of the affected element, qualify the affected results as estimated (J).
5. Actions regarding the interpretation and/or the subsequent qualification of ICP data due to theICS analytical results can be extremely complex. The data reviewer should use professionaljudgement to determine the need for the associated sample data to be qualified. The reviewermay need to obtain additional information from the laboratory. All interpretive situationsshould then be recorded in the data review narrative.
6. If the ICS acceptance criteria are grossly exceeded, the specifics should be noted for TPO action.
22
V. LABORATORY CONTROL SAMPLE (LCS)
A. Review Items: COVER PAGE-IN, Form VII-IN, Form XIII-IN, Form XIV-IN, preparation logs,instrument printouts, raw data.
B. Objective:
The Laboratory Control Sample (LCS) serves as a monitor of the overall performance of each stepduring the analysis, including the sample preparation.
C. Criteria:
1. Aqueous and solid Laboratory Control Samples shall be analyzed for each analyte utilizing thesame sample preparations, analytical methods, and QA/QC procedures as employed for thesamples. The aqueous LCS solution shall be obtained from EPA. However, if the LCS isunavailable from EPA, the Initial Calibration Solutions may be used.
2. One aqueous LCS must be prepared and analyzed for every group of aqueous samples in anSDG, or with each batch of aqueous samples digested, whichever is more frequent.
Note: An aqueous LCS is not required for mercury. For cyanide, a distilled ICV is used as theLCS (see INORG Section II.C.2.a.4. above).
3. All aqueous LCS results must fall within the control limits of 80-120%R, except for Sb and Agwhich have no fixed control limits. If the %R for the aqueous LCS falls outside of the fixedcontrol limits (except for Ag and Sb), the analyses should have been terminated, the problemcorrected, and the samples associated with that LCS redigested and reanalyzed.
4. An EPA provided solid LCS shall be prepared and analyzed utilizing each of the preparationand analytical procedures applied to the soil/sediment samples received, with one exception: Thepercent solids determination is not required for the LCS. If the EPA solid LCS is not available,other EPA Quality Assurance Check samples or other certified materials may be used.
5. One solid LCS shall be prepared and analyzed for every group of soil/sediment samples in anSDG, or for each batch of samples digested and/or distilled, whichever is more frequent.
6. All solid LCS results must fall within the control limits established by EPA-EMSL/LV. If theresults for the solid LCS fall outside of the control limits, the analyses should have beenterminated, the problem corrected, and the samples associated with that LCS redigested andreanalyzed.
23
D. Evaluation:
1. Verify from the COVERPAGE-IN, Form XIII-IN, and the raw data that the appropriate numberof required Laboratory Control Samples were prepared and analyzed for the SDG.
2. Evaluate Form VII-IN and verify that all results, for each analyte, fall within the establishedcontrol limits.
Note: Certain elements have only advisory limits for the LCS. Professional judgement shouldbe used when evaluating these elements.
3. Check the raw data (ICP printouts, strip charts, bench sheets) to verify that the reported percentrecoveries (%R) on Form VII-IN were accurately transcribed. Recalculate one or more of thereported recoveries (%R) using the following equation:
LCS%R = LCS Found x 100LCS True
Where:
LCS Found = concentration (in ug/L for aqueous; mg/kg for solid) of each analyte measured inthe analysis of LCS solution.
LCS True = concentration (in ug/L for aqueous; mg/kg for solid) of each analyte in the LCSsource.
E. Action:
If the LCS criteria are not met, then the laboratory performance and method accuracy are in question.Professional judgement should be used to determine if the data should be qualified or rejected. Thefollowing guidance is suggested for qualifying sample data for which the associated LCS does not meetthe required criteria.
1. Aqueous LCS:
a. If the LCS recovery for any analyte falls within the range of 50% - 79% or >120%,qualify results > IDL as estimated (J).
b. If the results are < IDL and the LCS recovery is greater than 120%, the data areacceptable.
24
c. If the results are < IDL and the LCS recovery falls within the range of 50-79%, qualifythe data for the affected analytes as estimated (UJ).
d. If LCS recovery results are <50%, qualify the data for these samples as unusable (R).
2. Solid LCS:
a. If the solid LCS recovery for any analyte falls outside the EPA control limits, qualifyall sample results > IDL as estimated (J).
b. If the LCS results are higher than the control limits, and the sample results are < IDL,the data are acceptable.
c. If the LCS results are lower than the control limits, then qualify all sample results <IDL as estimated (UJ).
3. It should be noted for TPO action if a laboratory fails to analyze an LCS with each SDG, or ifa laboratory consistently fails to generate acceptable LCS recoveries.
4. Whenever possible, the potential effects on the data due to out-of-control LCS results shouldbe noted in the data review narrative.
25
VI. DUPLICATE SAMPLE ANALYSIS
A. Review Items: Form I-IN, Form VI-IN, instrument printouts, raw data.
B. Objective:
Duplicate sample determinations are used to demonstrate acceptable method precision by the laboratoryat the time of analysis. Duplicate analyses are also performed to generate data in order to determine thelong-term precision of the analytical method on various matrices.
C. Criteria:
1. Samples identified as field blanks cannot be used for duplicate sample analysis.
2. One duplicate sample must be prepared and analyzed from each group of samples with a similarmatrix type (e.g., water, soil) and concentration (e.g., low, medium), or for each SDG.Duplicates cannot be averaged for reporting on Form I-IN.
Note: Additional duplicate sample analyses may be required through Regional EPA or ProjectOfficer request. Alternately, EPA may require that a specific sample be used for the duplicatesample analysis.
3. Duplicate sample analyses are required for percent solids determination.
4. If two analytical methods are used to obtain the reported values for the same element within aSDG (e.g., ICP and GFAA, or a soil and a water method), duplicate samples must be run byeach method used.
5. A control limit of + 20% for the Relative Percent Difference (RPD) shall be used for originaland duplicate sample values greater than or equal to 5x the CRDL. The absolute value of thecontrol limit (CRDL) shall be entered in the "Control Limit" column on Form VI-IN.
6. A control limit of + the CRDL shall be used if either the sample or duplicate value is less than5x CRDL. In the case where only one result is above the 5x the CRDL level and the other isbelow, the + the CRDL criteria applies. If both samples values are less than the IDL, the RPDis not calculated of Form VI-IN
Note: The control limits as specified above (+20% RPD and + the CRDL) are methodrequirements for duplicate samples, regardless of the sample matrix type. However, it shouldbe noted that laboratory variability arising from the sub-sampling of non-homogeneous soilsamples is a common occurrence. Therefore, for technical review purposes only , Regionalpolicy may allow the use of less restrictive criteria (e.g., + 35% RPD, + 2x the CRDL) to beassessed against duplicate soil samples.
26
D. Evaluation:
1. Verify from the COVERPAGE-IN, Form VI-IN, and the raw data that the appropriate numberof required duplicate samples were prepared and analyzed for the SDG.
2. Evaluate Form VI-IN and the raw data to verify that all duplicate results, for each analyte andmethod, fall within the established control limits.
3. Verify that the field blank was not used for duplicate analysis.
4. Check the raw data and recalculate one or more of the RPD values using the following equationto verify that the results have been correctly reported on Form VI-IN.
RPD = |S-D| x 100(S+D)/2
Where:
RPD = Relative Percent DifferenceS = First Sample Value (original sample)D = Second Sample Value (duplicate)
E. Action:
1. If the appropriate number of duplicate samples were not analyzed for each matrix, with thecorrect frequency, then the data reviewer should use professional judgement to determine if theassociated sample data should be qualified. The reviewer may need to obtain additionalinformation from the laboratory. The situation should then be recorded in the data reviewnarrative, and noted for TPO action.
2. If the results from a duplicate analysis for a particular analyte fall outside the appropriate fixedcontrol windows, qualify the results for that analyte in all associated samples of the same matrixas estimated (J).
3. It should be noted for TPO action if a laboratory uses a field blank for the duplicate sampleanalysis. All of the other QC data must then be carefully checked, and professional judgementexercised by the data reviewer when evaluating the data.
Note: This information must be included on the IRDA form.
4. Whenever possible, the potential effects on the data due to out-of-control duplicate samplesresults should be noted in the data review narrative.
27
VII. SPIKE SAMPLE ANALYSIS
A. Review Items: Form I-IN, Form V-IN (Part A & B), instrument printouts, raw data.
B. Objective:
The spiked sample analysis is designed to provide information about the effect of each sample matrixon the sample preparation procedures and the measurement methodology. If the spike is added to thesample prior to any distillation steps (cyanide), or before the digestion (e.g., prior to the addition of otherreagents), it is then referred to as a spiked sample, a pre-digestion/pre-distillation spike, or a matrixspike. If the spike is added to the sample after the completion of the distillation or digestion procedures,it is then referred to as a post-digestion/post-distillation spike, or an analytical spike.
C. Criteria:
1. Samples identified as field blanks cannot be used for spiked sample analysis.
2. At least one spiked sample (pre-distillation/pre-digestion) must be prepared and analyzed fromeach group of samples with a similar matrix type (e.g., water, soil) and concentration (e.g., low,medium), or for each SDG.
3. For Flame AA, ICP, and CN analysis, when the pre-distillation/pre-digestion spike recoveryfalls outside of the control limits and the sample result does not exceed 4x the spike added, apost-digestion/post-distillation spike shall be performed for those elements that do not meet thespecified criteria. Spike an aliquot of the remaining unspiked sample at 2x the indigenous level,or 2x the CRDL, whichever is greater.
Note: Post-digestion spikes are not required for Ag and Hg. Additional spiked sample analysesmay be required through Regional EPA or Project Officer request. Alternately, EPA mayrequire that a specific sample be used for the spiked sample analysis.
4. If two analytical methods are used to obtain the reported values for the same element within aSDG (e.g., ICP and GFAA, or a soil and a water method), spiked samples must be run by eachmethod used.
5. The spike percent recovery (%R) must be within the established acceptance limits. However,spike recovery limits do not apply when sample concentration exceeds the spike concentrationby a factor of 4 or greater. In such an event, the data shall be reported unflagged even if thepercent recovery does not meet the acceptance criteria.
28
6. If the spiked sample analysis was performed on the same sample that was chosen for theduplicate sample analysis, spike calculations shall be performed using the results of the sampledesignated as the "original sample". The average of the duplicate results cannot be used for thepurpose of determining percent recovery.
Note: The final spike concentrations required for the various target analytes are presented inthe actual analytical methodologies.
D. Evaluation:
1. Verify from the COVERPAGE-IN, Form V-IN, and the raw data that the appropriate numberof required spiked samples were prepared and analyzed for the SDG.
2. Verify that the field blank was not used for the spiked sample analysis.
3. Evaluate Form V-IN and the raw data to verify that all pre-distillation/pre-digestion spikedsample results, for each analyte and method, fall within the established control limits. If not,verify that a post-digestion/post-distillation spike was prepared and analyzed (see INORGSection VII.C.3. above).
4. Recalculate from the raw data one or more of the spiked sample percent recoveries (%R) usingthe following equation, and verify that the recalculated value agrees with the laboratory reportedvalues on Form V-IN.
%R = (SSR-SR) x 100 SA
Where:
SSR = Spiked Sample ResultSR = Sample ResultSA = Spike Added
Note: When the sample concentration is less than the instrument detection level (IDL), useSR=0 only for the purposes of calculating the %R. The actual spiked sample results, sampleresults, and %R (positive or negative) still shall be reported on Form V-IN for ICP, AA, andCyanide analyses.
E. Action:
1. It should be noted for TPO action if a laboratory uses a field blank for the spiked sampleanalysis. All of the other QC data must then be carefully checked, and professional judgementexercised by the data reviewer when evaluating the data.
Note: This information must be included on the IRDA report form.
29
2. In the instance where there is more than one spiked sample result per matrix and concentration,per analytical method per SDG, if one spiked sample recovery is not within contract criteria, flagall of the samples of the same matrix, level, and method in the SDG.
3. If the pre-distillation/pre-digestion spike recovery does not meet criteria, a post-distillation/post-digestion spike is required for all analytes (except Ag and Hg), and is required for all methods(except furnace). The data from the post-spikes is not to be used to qualify sample results.
Note: This information must be included in the IRDA report form.
4. If the spike recovery is >125% and the reported sample results are < IDL, the data is acceptablefor use.
5. If the spike recovery is >125% or <75% and the sample results are > IDL, qualify the data forthese samples as estimated (J).
6. If the spike recovery falls within the range of 30-74% and the sample results are < IDL, qualifythe data for these samples as estimated (UJ).
7. If spike recovery results fall <30% and the sample results are < IDL, qualify the data for thesesamples as unusable (R).
8. Whenever possible, the potential effects on the data due to out-of-control spiked sample resultsshould be noted in the data review narrative.
30
VIII. GRAPHITE FURNACE ATOMIC ABSORPTION QC
A. Review Items: Form I-IN, Form V-IN, Form VIII-IN, instrumental printouts, raw data.
B. Objective:
Because of the nature of the Graphite Furnace Atomic Absorption (GFAA) technique, special analyticalprocedures are required for the quantitation of samples. The special QA/QC furnace procedures areoutlined in the method. Duplicate injections and multiple level furnace post digestion spikes are usedto establish the precision and accuracy of the individual analytical determinations.
C. Criteria:
1. All GFAA analyses shall fall within the calibration range. In addition, all GFAA analyses,except during full Methods of Standard Additions (MSA), require duplicate injections. Averageconcentration values are used for reporting purposes.
2. The Furnace Atomic Absorption Analysis Scheme ("MSA Tree") must be followed as describedin the method.
3. A maximum of 10 full sample analyses to a maximum 20 injections may be performed betweeneach consecutive continuing calibration verification (CCV) and blank analysis.
4. For sample concentrations greater than the CRDL, the duplicate injection readings must agreewithin 20% Relative Standard Deviation (RSD), or Coefficient of Variation (CV), otherwise theanalytical sample must be rerun once (e.g., at least two additional injections).
5. The post-digestion (analytical) spike concentration must be at 2x the CRDL (except for leadwhich must be at 20 ug/L). This requirement for an analytical spike will include the LCS andthe Preparation Blank (PB).
Note: The LCS shall be quantitated from the calibration curve and corrective action, if needed,shall be taken accordingly. MSA is not to be performed on the LCS or the PB, regardless ofspike recovery results.
6. The analytical spike of a sample must be run immediately after that sample.
7. The spike percent recovery must be within the established acceptance limits of the method, inorder for the sample to be quantitated directly from the analytical calibration curve.
31
8. If the spiked sample's percent recovery is outside of the method acceptance limit criteria,quantitation by MSA is then required.
9. The correlation coefficient for any MSA analysis shall be greater than or equal to 0.995. If thecorrelation coefficient for a specific MSA is less than 0.995, then that MSA shall be repeatedat least once prior to reporting.
D. Evaluation:
1. Review the Furnace AA raw data to verify that the Furnace Atomic Absorption Scheme hasbeen followed.
2. Check the raw data and verify that duplicate injections agree within +20% RSD (or CV) forsample concentrations reported greater than the CRDL.
3. Recalculate the spike recovery results for the LCS and/or the PB. Verify that the spike recoveryresults are within the established method acceptance window.
4. Recalculate from the raw data one or more of the MSA results (if MSA was performed), andverify that the recalculated value(s) agrees with the laboratory reported value(s) on Form VIII-IN.
5. Confirm that the MSA spikes have been performed at the appropriate concentration levels.
E. Action:
1. If duplicate injections are outside the +20% RSD (or CV) acceptance limit and the sample hasnot been rerun once as required, qualify the associated data as estimated (J).
2. If the rerun sample results do not agree within +20% RSD (or CV), qualify the data as estimated(J).
3. If the post-digestion spike recovery is:
a. Less than 40%, qualify results greater than the IDL as estimated (J).
b. Less than or equal to 10%, but <40%, qualify results less than the IDL as estimated(UJ).
c. Less than 10%, qualify results less than the IDL as unusable (R).

32
4. If sample absorbance is <50% of the post digestion spike absorbance then:
a. If the furnace post digestion spike recovery is not within the established methodacceptance limits, then qualify the sample results greater than the IDL as estimated (J).
b. If the furnace post digestion spike recovery is not within the established methodacceptance limits, qualify the sample results less than the IDL as estimated (UJ).
5. If Method of Standard Additions (MSA) is required but has not been done, qualify the data asestimated (J).
6. If any of the samples run by MSA have not been spiked at the appropriate levels, qualify thedata as estimated (J).
7. If the MSA correlation coefficient is less than 0.995, qualify the data as estimated (J).
8. Whenever possible, the potential effects on the reported data due to out-of-control spiked PrepBlanks, spiked LCS, or MSAs should be noted in the data review narrative. Professionaljudgement shall be exercised by the data reviewer when evaluating the data.
33
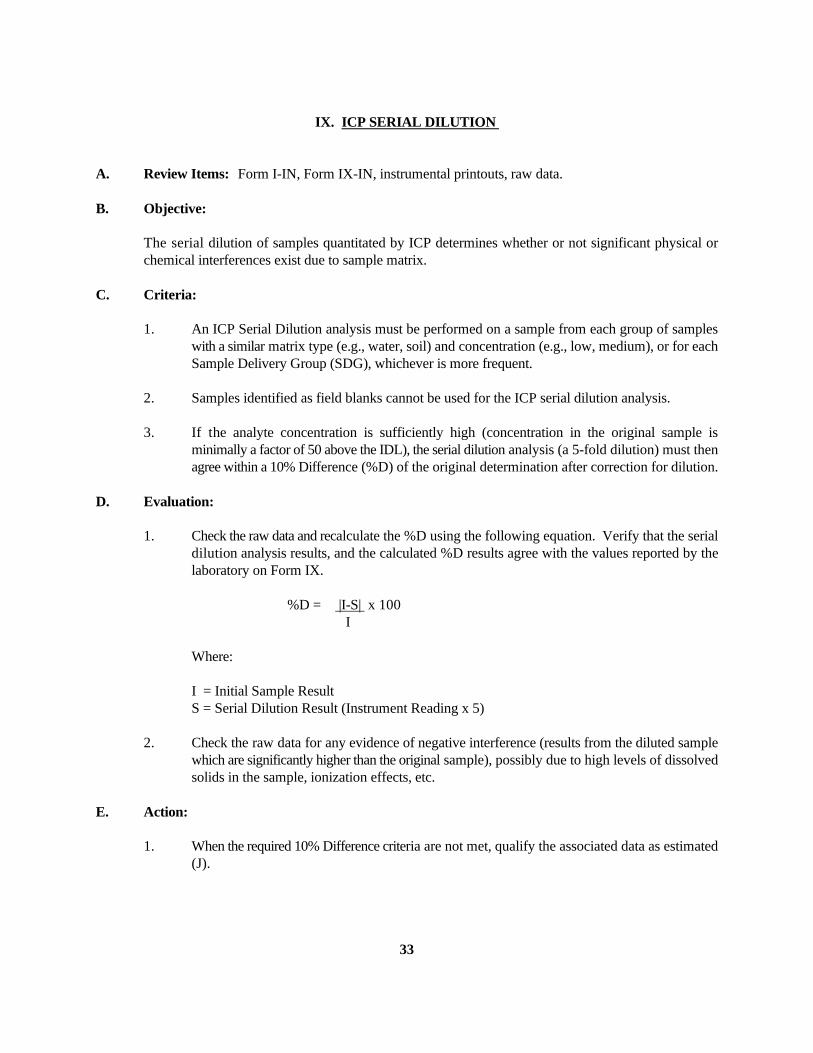
IX. ICP SERIAL DILUTION
A. Review Items: Form I-IN, Form IX-IN, instrumental printouts, raw data.
B. Objective:
The serial dilution of samples quantitated by ICP determines whether or not significant physical orchemical interferences exist due to sample matrix.
C. Criteria:
1. An ICP Serial Dilution analysis must be performed on a sample from each group of sampleswith a similar matrix type (e.g., water, soil) and concentration (e.g., low, medium), or for eachSample Delivery Group (SDG), whichever is more frequent.
2. Samples identified as field blanks cannot be used for the ICP serial dilution analysis.
3. If the analyte concentration is sufficiently high (concentration in the original sample isminimally a factor of 50 above the IDL), the serial dilution analysis (a 5-fold dilution) must thenagree within a 10% Difference (%D) of the original determination after correction for dilution.
D. Evaluation:
1. Check the raw data and recalculate the %D using the following equation. Verify that the serialdilution analysis results, and the calculated %D results agree with the values reported by thelaboratory on Form IX.
%D = |I-S| x 100 I
Where:
I = Initial Sample ResultS = Serial Dilution Result (Instrument Reading x 5)
2. Check the raw data for any evidence of negative interference (results from the diluted samplewhich are significantly higher than the original sample), possibly due to high levels of dissolvedsolids in the sample, ionization effects, etc.
E. Action:
1. When the required 10% Difference criteria are not met, qualify the associated data as estimated(J).
34
2. If evidence of negative interference is found, professional judgement must be used to qualify theassociated sample data. The potential effects on the reported data should be noted in the datareview narrative.
35
X. FIELD DUPLICATES
A. Review Items: Form I-IN, Instrumental printouts, raw data.
B. Objective:
Field duplicate samples may be taken and analyzed as an indication of overall precision. These analysesmeasure both field and lab precision; therefore, the results may have more variability than lab duplicateswhich measure only lab performance. It is also expected that soil duplicate results will have a greatervariance than water matrices due to difficulties associated with collecting identical field samples.
C. Criteria:
There are no "required" review criteria for field duplicate analyses comparability.
D. Evaluation:
Samples which are field duplicates should be identified using EPA Sample Traffic Reports or samplefield sheets. The reviewer should compare the results reported for each sample and calculate the RelativePercent Difference (RPD), if appropriate.
E. Action:
Any evaluation of the field duplicates should be provided within the data reviewer's narrative comments.
36
XI. OVERALL ASSESSMENT
A. Review Items: Entire data package, data review results, preparation logs, calibration standard logs,instrument logs, instrumental printouts, and raw data.
B. Objective:
The objective is to ensure that the reported sample quantitation results are accurate. It is appropriate forthe data reviewer to make professional judgements and express concerns, as well as to comment on thevalidity of the overall data for a Case. This is particularly appropriate when there are several QC criteriaout of specification. The additive nature of QC factors out of specification is difficult to assess in anobjective manner, but the reviewer has a responsibility to inform the user concerning data quality anddata limitations in order to assist that user in avoiding inappropriate use of the data, while not precludingany consideration of the data at all. If qualifiers other than those used in this document are necessaryto describe or qualify the data, it is necessary to thoroughly document/explain the additional qualifiersused. The data reviewer would be greatly assisted in this endeavor if the data quality objectives wereprovided. The cover form and supplementary documentation must be included with the review.
C. Criteria:
Assess the overall quality of the data.
Review all available materials to assess the overall quality of the data, keeping in mind the additivenature of analytical problems.
Reported analyte concentrations must have been quantitated according to the appropriate analyticalmethod, as listed in the method.
D. Evaluation:
The raw data should be examined to verify that the correct calculation of the sample results was reportedby the laboratory. Digestion and distillation logs, instrument printouts, strip charts, etc. should becompared to the reported sample results recorded on the Inorganic Forms.
1. Evaluate any technical problems not previously addressed.
2. Examine the raw data for any anomalies (i.e., baseline shifts, negative absorbance, omissions,legibility, etc.).
3. Verify that there are no transcription or reduction errors (e.g., dilutions, percent solids, sampleweights) on one or more samples.
4. Verify that results fall within the linear range of the ICP (Form XIII) and within the calibratedrange for the non-ICP parameters.
5. When the laboratory provides both ICP and furnace results for an analyte in a sample and the
37
concentration is > ICP IDL, the results can assist in identifying quantitation problems.
6. If appropriate information is available, the reviewer may assess the useability of the data toassist the data user in avoiding inappropriate use of the data. Review all available information,including the QAPjP (specifically the Data Quality Objectives), SAP, and communication withdata user that concerns the intended use and desired quality of these data.
E. Action
1. Use professional judgement to determine if there is any need to qualify data which were notqualified based on the QC criteria previously discussed.
2. Write a brief narrative to give the user an indication of the analytical limitations of the data.Any inconsistency of the data with the SDG narrative should be noted for TPO action. Ifsufficient information on the intended use and required quality of the data are available, thereviewer should include his/her assessment of the useability of the data within the given context.
3. If there are any discrepancies found, the laboratory may be contacted by the designatedrepresentative to obtain additional information that could resolve any differences. If adiscrepancy remains unresolved, the reviewer may determine qualification of the data iswarranted.
38
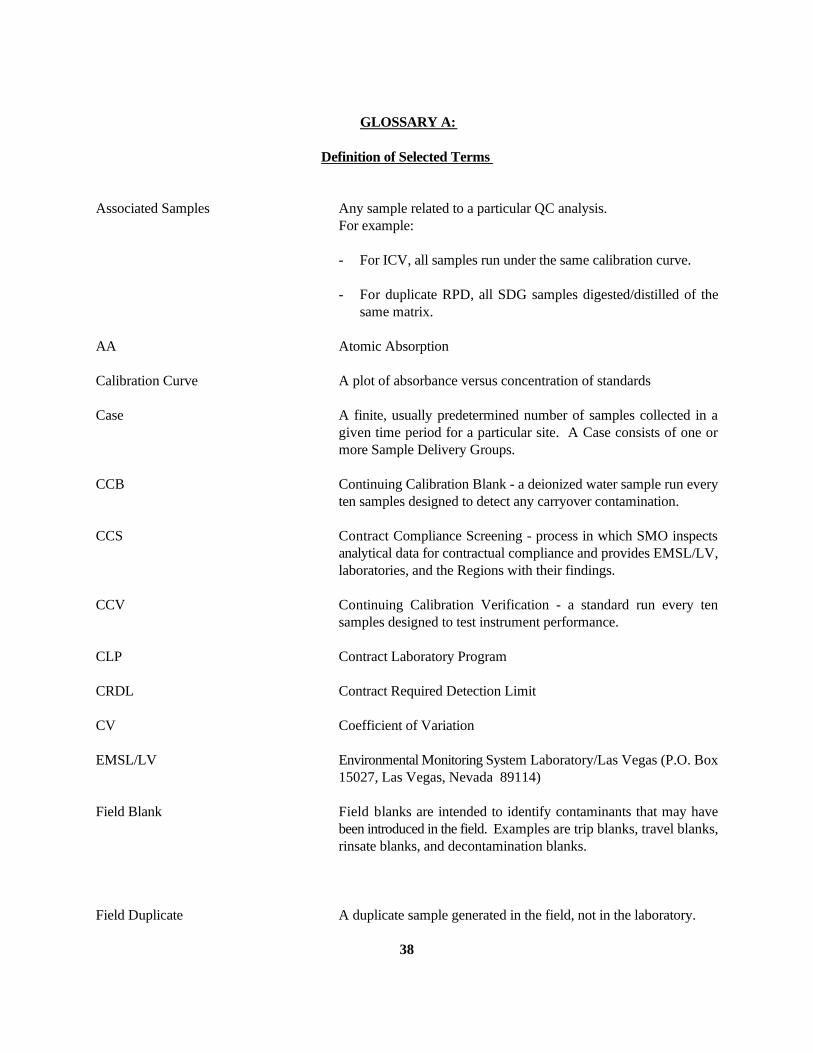
GLOSSARY A:
Definition of Selected Terms
Associated Samples Any sample related to a particular QC analysis. For example:
- For ICV, all samples run under the same calibration curve.
- For duplicate RPD, all SDG samples digested/distilled of thesame matrix.
AA Atomic Absorption
Calibration Curve A plot of absorbance versus concentration of standards
Case A finite, usually predetermined number of samples collected in agiven time period for a particular site. A Case consists of one ormore Sample Delivery Groups.
CCB Continuing Calibration Blank - a deionized water sample run everyten samples designed to detect any carryover contamination.
CCS Contract Compliance Screening - process in which SMO inspectsanalytical data for contractual compliance and provides EMSL/LV,laboratories, and the Regions with their findings.
CCV Continuing Calibration Verification - a standard run every tensamples designed to test instrument performance.
CLP Contract Laboratory Program
CRDL Contract Required Detection Limit
CV Coefficient of Variation
EMSL/LV Environmental Monitoring System Laboratory/Las Vegas (P.O. Box15027, Las Vegas, Nevada 89114)
Field Blank Field blanks are intended to identify contaminants that may havebeen introduced in the field. Examples are trip blanks, travel blanks,rinsate blanks, and decontamination blanks.
Field Duplicate A duplicate sample generated in the field, not in the laboratory.
39
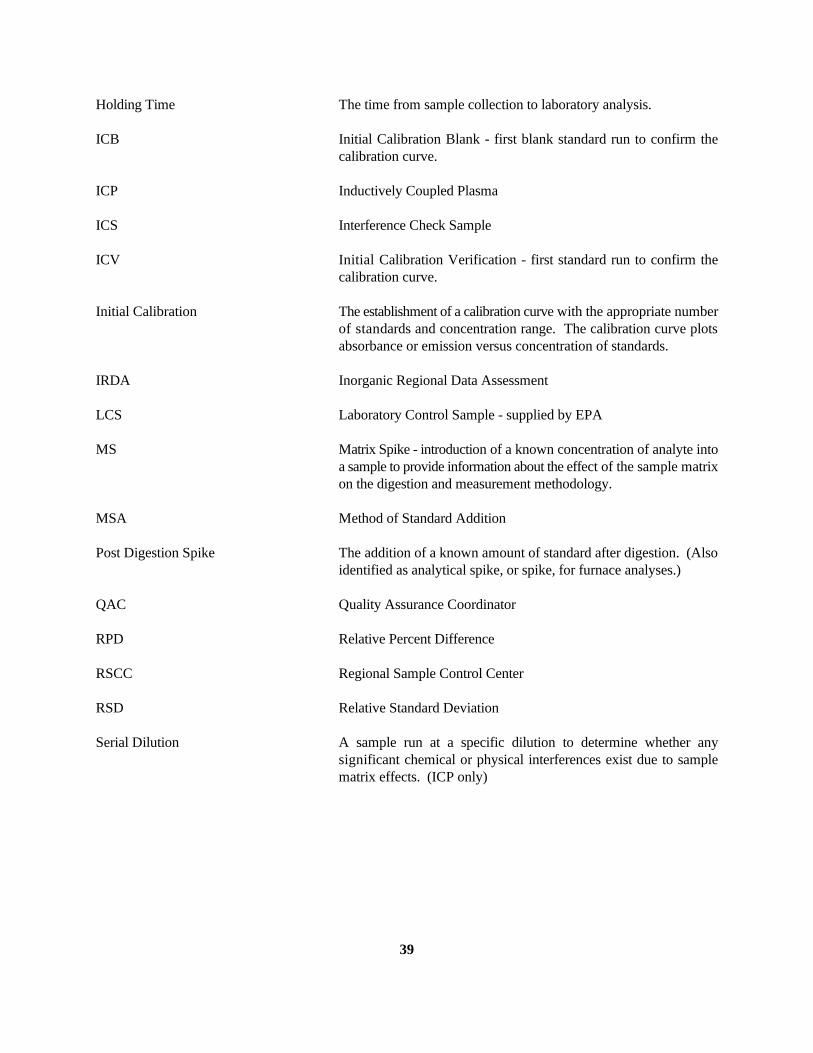
Holding Time The time from sample collection to laboratory analysis.
ICB Initial Calibration Blank - first blank standard run to confirm thecalibration curve.
ICP Inductively Coupled Plasma
ICS Interference Check Sample
ICV Initial Calibration Verification - first standard run to confirm thecalibration curve.
Initial Calibration The establishment of a calibration curve with the appropriate numberof standards and concentration range. The calibration curve plotsabsorbance or emission versus concentration of standards.
IRDA Inorganic Regional Data Assessment
LCS Laboratory Control Sample - supplied by EPA
MS Matrix Spike - introduction of a known concentration of analyte intoa sample to provide information about the effect of the sample matrixon the digestion and measurement methodology.
MSA Method of Standard Addition
Post Digestion Spike The addition of a known amount of standard after digestion. (Alsoidentified as analytical spike, or spike, for furnace analyses.)
QAC Quality Assurance Coordinator
RPD Relative Percent Difference
RSCC Regional Sample Control Center
RSD Relative Standard Deviation
Serial Dilution A sample run at a specific dilution to determine whether anysignificant chemical or physical interferences exist due to samplematrix effects. (ICP only)
40
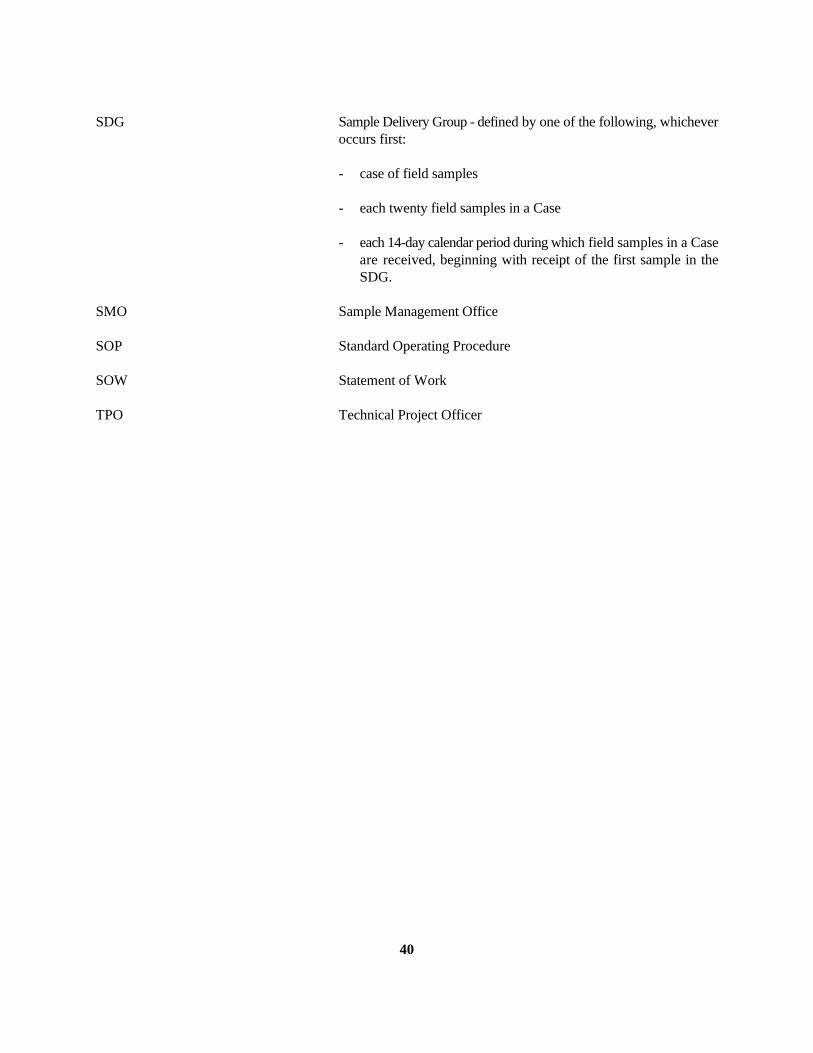
SDG Sample Delivery Group - defined by one of the following, whicheveroccurs first:
- case of field samples
- each twenty field samples in a Case
- each 14-day calendar period during which field samples in a Caseare received, beginning with receipt of the first sample in theSDG.
SMO Sample Management Office
SOP Standard Operating Procedure
SOW Statement of Work
TPO Technical Project Officer
41
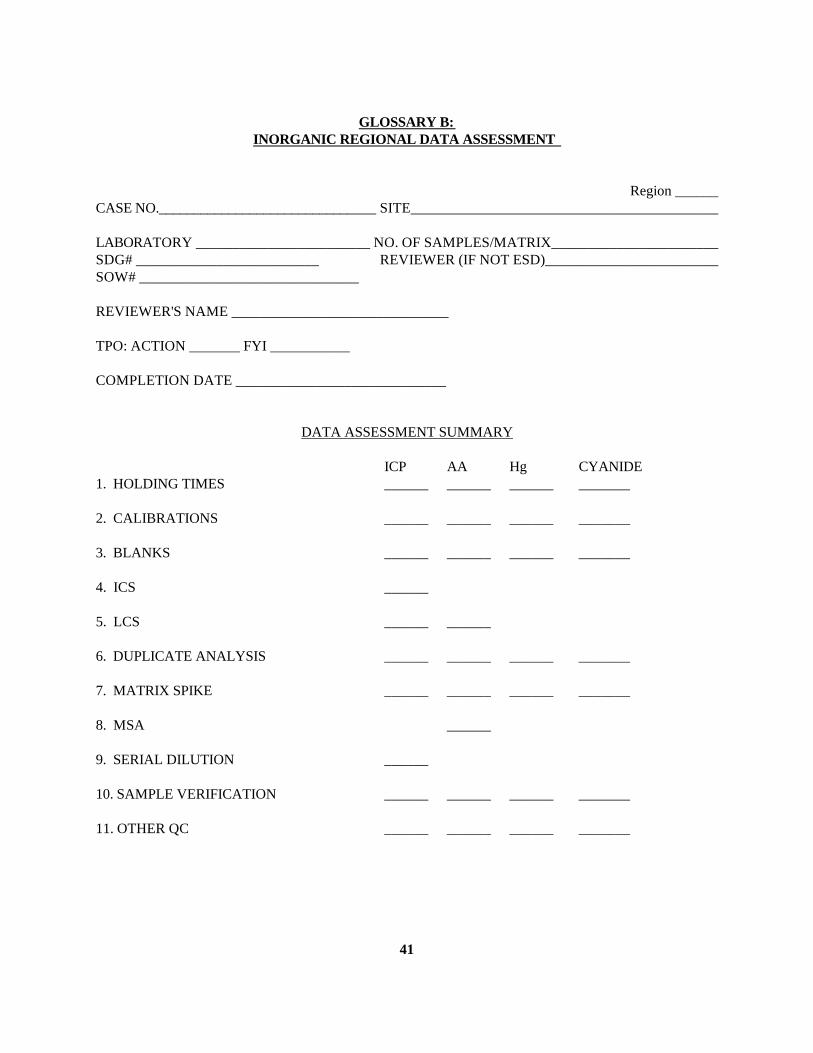
GLOSSARY B:INORGANIC REGIONAL DATA ASSESSMENT
Region ______CASE NO._______________________________ SITE__________________________________________
LABORATORY ________________________ NO. OF SAMPLES/MATRIX_______________________SDG# _________________________ REVIEWER (IF NOT ESD)________________________SOW# ______________________________
REVIEWER'S NAME ______________________________
TPO: ACTION _______ FYI ___________
COMPLETION DATE _____________________________
DATA ASSESSMENT SUMMARY
ICP AA Hg CYANIDE1. HOLDING TIMES ______ ______ ______ _______
2. CALIBRATIONS ______ ______ ______ _______
3. BLANKS ______ ______ ______ _______
4. ICS ______
5. LCS ______ ______
6. DUPLICATE ANALYSIS ______ ______ ______ _______
7. MATRIX SPIKE ______ ______ ______ _______
8. MSA ______
9. SERIAL DILUTION ______
10. SAMPLE VERIFICATION ______ ______ ______ _______
11. OTHER QC ______ ______ ______ _______
42
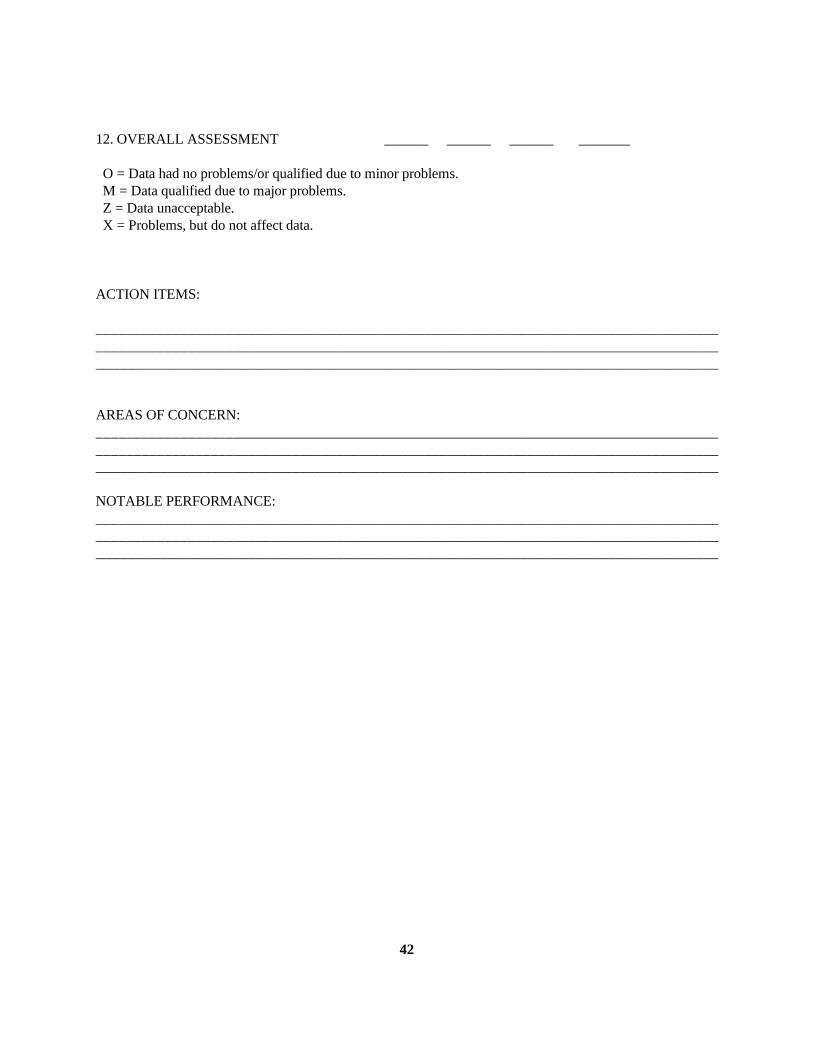
12. OVERALL ASSESSMENT ______ ______ ______ _______
O = Data had no problems/or qualified due to minor problems. M = Data qualified due to major problems. Z = Data unacceptable. X = Problems, but do not affect data.
ACTION ITEMS:
_____________________________________________________________________________________________________________________________________________________________________________________________________________________________________________________________
AREAS OF CONCERN:_____________________________________________________________________________________________________________________________________________________________________________________________________________________________________________________________
NOTABLE PERFORMANCE:_____________________________________________________________________________________________________________________________________________________________________________________________________________________________________________________________