Embed Size (px)
Citation preview
9240.1-05-01 PB 94-963502
February 1994 EPA 540/R-94/0 13
USEPA CONTRACT LABORATORY PROGRAM NATIONAL FUNCTIONAL GUIDELINES
FOR INORGANIC DATA REVIEW
Office of Emergency and Remedial Response U.S. Environmental Protection Agency
Washington, DC 20460
ADMlN RECORD
NOTICE
The polices and procedures set forth here are intended as guidance to the Agency and other governmental employees. They do not constitute rulemaking by the agency, and may not be relied on to create a substantive or procedural right enforceable by any other person. The Government may take action that is at
Additional copies of this document can be obtained from:
National Technical Infomation Service (NTIS) U.S. Department of Commerce 5285 Port Royal Road Springfield, VA 22 16 1 (703) 487-4650 D o c m a t Number PB 94-963502
ii
c
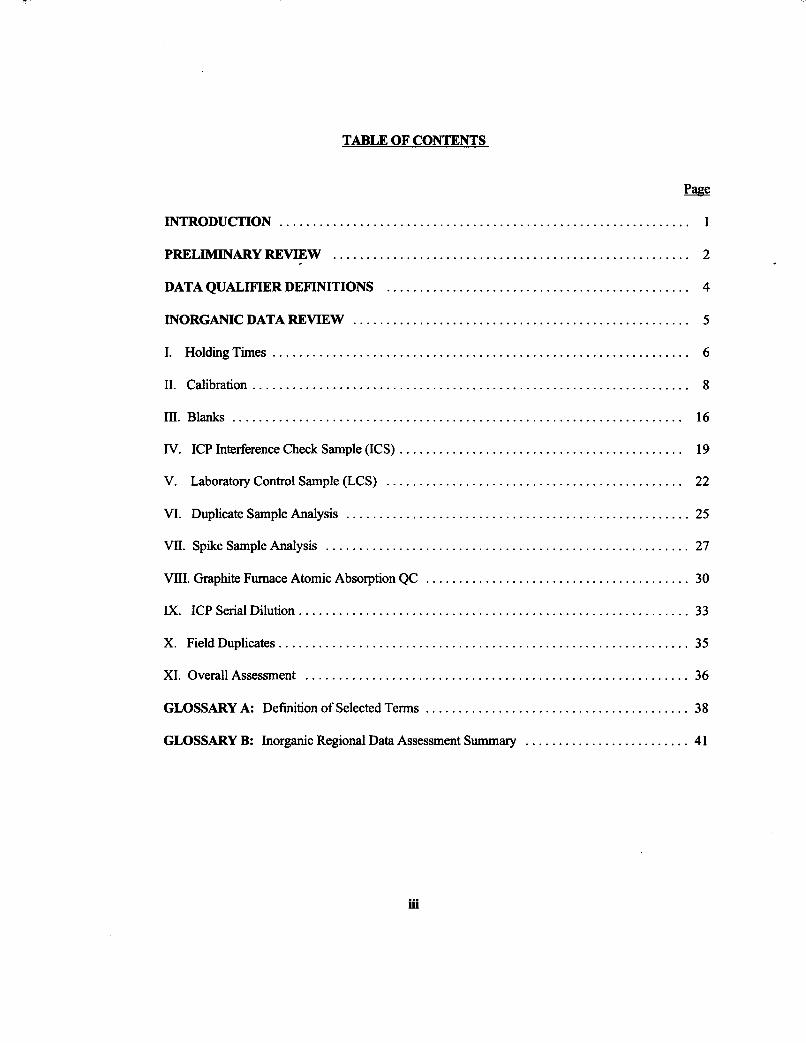
TABLE OF CONTENTS
INTRODUCTION .............................................................. 1
PRELIMINARYREVIEW ...................................................... 2
DATA QUALIFIER DEFINITIONS .............................................. 4
INORGANICDATAREVIEW ................................................... 5
I . HoldingTimes ............................................................... 6
I1 . Calibration .................................................................. 8
III . Blanks .................................................................... 16
IV . ICP Interference Check Sample (ICs) ........................................... 19
V . Laboratory Control Sample (LCS) ............................................. 22
VI . Duplicate Sample Analysis .................................................... 25
VI1 . Spike Sample Analysis ....................................................... 27
VIII . Graphite Furnace Atomic Absorption QC ........................................ 30
IX . ICP Serial Dilution ........................................................... 33
X . FieldDuplicates .............................................................. 35
XI . OverallAssessment .......................................................... 36
GLOSSARY A: Definition of Selected Terms ........................................ 38
GLOSSARY B: Inorganic Regional Data Assessment Summary ......................... 41
iii
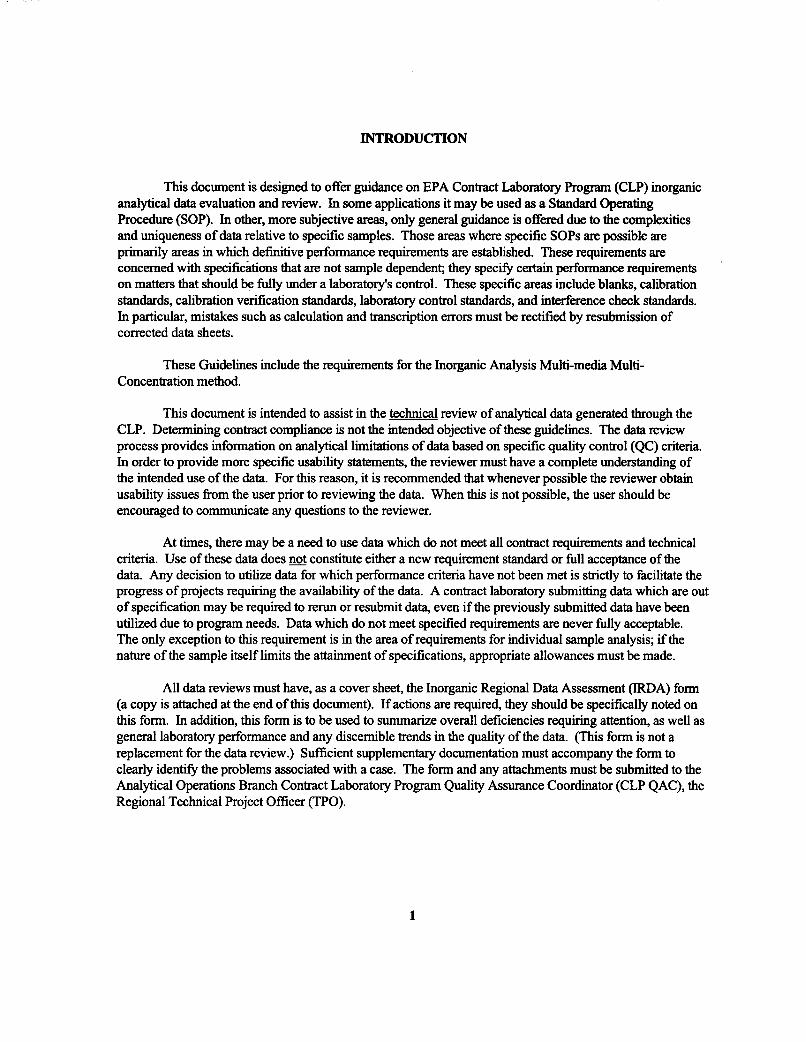
INTRODUCTION
This document is designed to offer guidance on EPA Contract Laboratory Program (CLP) inorganic analytical data evaluation and review. In some applications it may be used as a Standard Operating Procedure (SOP). In other, more subjective areas, only general guidance is offered due to the complexities and uniqueness of data relative to specific samples. Those areas where specific SOPS are possible are primarily areas in which definitive performance requirements are established. These requirements are concerned with specifications that are not sample dependent; they specify certain performance requirements on matters that should be fully under a laboratory's control. These specific areas include blanks, caliiration standards, calibration verification standards, laboratory control standards, and interkrence check standards. In particular, mistakes such as calculation and transcription errors must be rectified by resubmission of corrected data sheets.
These Guidelines include the requirements for the Inorganic Analysis Multi-media Multi- Concentration method.
This document is intended to assist in the technical review of analyhcal data generated through the CLP. Determining contract compliance is not the intended objective of these guidelines. The data review process provides information on analytical limitations of data based on specific quality control (QC) criteria. In order to provide more specific usability statements, the reviewer must have a complete understanding of the intended use of the data. For this reason, it is recommended that whenever possible the reviewer obtain usability issues from the user prior to reviewing the data. When this is not possible, the user should be encouraged to communicate any questions to the reviewer.
At times, there may be a need to use data which do not meet all contract requirements and technical criteria. Use of these data does not constitute either a new requirement standard or full acceptance of the data. Any decision to utilize data for which performance criteria have not been met is strictly to facilitate the progress of projects requiring the availability of the data. A contract laboratory submitting data which are out of specification may be required to rerun or resubmit data, even if the previously submitted data have been utilized due to program needs. Data which do not meet specified requirements are never fully acceptable. The only exception to this requirement is in the area of requirements for individual sample analysis; if the nature of the sample itself limits the attainment of specifications, appropriate allowances must be made.
All data reviews must have, as a cover sheet, the Inorganic Regional Data Assessment (IRDA) form (a copy is attached at the end of this document). If actions are required, they should be specifically noted on this form. In addition, this form is to be used to summarize overall deficiencies requiring attention, as well as general laboratory performance and any discernible trends in the quality of the data. (This form is not a replacement for the data review.) Sufficient supplementary documentation must accompany the form to clearly identify the problems associated with a case. The form and any attachments must be submitted to the Analyhcal Operations Branch Contract Laboratory Program Quality Assurance Coordinator (CLP QAC), the Regional Technical Project Officer (TPO).
1
PRELIMINARY REVIEW
In order to use this document effectively, the reviewer should have a general overview of the sample delivery group (SDG) or sample case at hand. The exact number of samples, their assigned numbers, their matrix, and the number of laboratories involved in their analysis are essential information. Background information on the site is helpful but often this information is very difficult to locate. The site manager is the best source for answers or further direction.
Sample cases (SDGs) routinely have unique samples which require special attention by the reviewer. These include field blanks, field duplicates, and pedormance audit samples which need to be identified. The sampling records should identify:
1. 2.
The Project Officer for site. The Complete list of samples with notations on:
sample matrix, blanks*, field duplicates*, field spikes*, QC audit sample*, shipping dates, preservatives, and labs involved
* If applicable
The chain-ofcustody record includes sample descriptions and date@) of sampling. The reviewer must take into account lag times between sampling and start of analysis when assessing technical sample holding times.
The laboratory's SDG Narrative is another source of general information. Notable problems with matrices, insufficient sample volume for analysis or reanalysis, samples received in broken containers, preservation, and unusual events should be found in the SDG Narrative.
The SDG Narrative for the sample data package must include a Laboratory Certification Statement (exactly as written in the method), signed by the laboratory manager or his designee. This statement authorizes the validation and release of the sample data results. In addition, the laboratory must also provide comments in the SDG narrative describing in detail any problems encountered in processing the samples in the data package.
For every data package, the reviewer must verify that the laboratory certification statement is present, exactly stated as in the method (i.e., verbatim to the statement in the method), and signed by the Laboratory Manager or designee. The reviewer must further verify that the data package is consistent with the laboratory's certified narrative. Also, the reviewer should check the comments provided in the narrative to determine if they are sufficient to describe and explain any associated problem@).
2
The data review should include comments that clearly idenm the problems associated with a case or Sample Delivery Group (SDG) and to state the limitations of the data. Documentation should include the sample number, analytical method, extent of the problem, and assigned qualifiers.
A data review narrative generally accompanies the laboratory data forwarded to the intended data recipient (client) or user to promote communications. A copy of the data review narrative should be submitted to the Regional CLP Technical Project Officer (TPO) assigned oversight responsibility for the laboratory producing the data.
It is a responsibility to noti@ the appropriate Regional CLP TPO concerning problems and deficiencies with regard to laboratory data. If there is an urgent requirement, the TPO may be contacted by telephone to expedite corrective action. It is recommended that all items for TPO action be presented at one time.
3
DATA QUALIFIER DEFINITIONS
The following definitions provide brief explanations of the national qualifiers assigned to results in the data review process. If the Regions choose to use additional qualifiers, a complete explanation of those qualifiers should accompany the data review.
U - The material was analyzed for, but was not detected above the level of the associated value. The associated value is either the sample quantitation limit or the sample detection limit.
J - The associated value is an estimated quantity.
R - The data are unusable. (Note: Analyte may or may not be present.)
UJ - The material was analyzed for, but was not detected. The associated value is an estimate and may be inaccurate or imprecise.
4
INORGANIC DATA REVIEW
The inorganic data requirements to be checked during validation are listed below:
I.
n.
III.
Iv. V.
VI.
VII.
WI.
M.
X.
XI.
Holding Times (Method Holding Times)
Calibration
0 Initial
0
Blanks
ICP Interfdence Check Sample
Laboratory Control Sample
Duplicate Sample
Spike Sample Analysis
Graphite Furnace Atomic Absorption QC
ICP Serial Dilution
Field Duplicates
Overall Assessment
Initial and Continuing Calibration Verification
5
I. HOLDINGTIMES
A. Review Items: Form I-IN, Form XIII-M, EPA Sample Traffic Report andor chain-of-custody, raw data, and SDG Narrative.
B. Objective:
The objective is to ascertain the validity of results based on the holding time of the sample from the time of collection to the time of analysis.
C. Criteria:
Technical requirements for sample holding times have only been established for water matrices. The addition of Nitric Acid or Sodium Hydroxide to adjust the pH is only required for aqueous samples.
The technical holding time criteria for water samples are as follows:
METALS: 180 days; preserved (with Nitric Acid) to pH < 2
MERCURY 28 days; preserved (with Nitric Acid) to pH < 2
CYANIDE: 14 days; cooled @ 4°C 2 2"C, preserved (with Sodium Hydroxide) to pH > 12
The preservation for soillsediment samples is maintenance at 4 O C i 2 O C until analysis.
NOTE: The technical holding time is based on the date of collection, rather than validated time of sample receipt (VTSR), and date of analysis. The method maximum holding times may differ from the technical holding times.
D. Evaluation:
Technical holding times are established by comparing the sampling date@) on the EPA Sample Traffic Report with the dates of analysis found on FORM 1-IN, and in the laboratory raw data (instrument run logs). Information contained in the complete SDG file should also be considered in the determination of holding times. Verify that the analysis dates on the Form Is and the raw data/SDG file are identical. Review the SDG narrative to determine if the samples were properly preserved. If there is no indication in the SDG narrative or the sample records that there was a problem with the samples, then the integrity of samples can be assumed to be good. If it is indicated that there were problems with the samples, then the integrity of the sample may have been compromised and professional judgement should be used to evaluate the effect of the problem on the sample results.
E. Action:
6
1. If technical holding times and preservation requirements are not met, qualify all results greater than the Instrument Detection Limit (IDL) as estimated (J), and results less than the IDL as estimated (VJ).
2. If holding times are exceeded, the reviewer must use professional judgement to determine the reliability of the data and the effects of additional storage on the sample results. The expected bias would be low and the reviewer may determine that results <IDL are unusable 0-9
3. Due to limited information concerning holding times for soil samples, it is left to the discretion of the data reviewer whether to apply water holding time criteria to soil samples. If the data are qualified when water holding time criteria are applied to soil samples, it must be clearly documented in the data review narrative.
4. When the holding times are exceeded, the reviewer should comment in the data review narrative on any possible consequences for the analytical results.
5. If the holding times are grossly exceeded, it should be noted for TPO action.
7
11. CALIBRATION
A. Review Items: Form 11-IN (Part A & B), Form XIII-IN, preparation logs, calibration standard logs, instrument logs, instrument printouts, and raw data.
B. Objective:
Method requirements for satisfactory instrument calibration are established to ensure that the instrument is capable of producing acceptable quantitative data for the metals and cyanide on the Inorganic Target Analyte List (TAL). Initial calibration demonstrates that the instrument is capable of acceptable performance at the beginning of the analytical run. Continuing calibration verification establishes that the initial calibration is still valid by checking the performance of the instrument on a continual basis.
C. Criteria:
1. Initial Calibration
The instruments must be successfully calibrated daily or once every 24 hours, and each time the instrument is set up. The calibration date and time are to be included in the raw data.
a. Inductively Coupled Plasma (ICP) Analysis
1) A blank and at least one calibration standard must be used in establishing each analytical curve. All measurements must be within the instrument linear working range where the interelement correction factors are valid. A minimum of two replicate exposures are required for standardization and all QC and sample analyses. The average result of the multiple exposures for the standardization, QC, and sample analyses must be used.
2) The instrumental calibration near the Contract Required Detection Limit (CRDL) must be verified for each analyte. An ICP standard solution (CRI) shall be prepared at two times the CRDL, or two times the Instrument Detection Limit (IDL), whichever is greater. The CRI shall be analyzed at the beginning and end of each sample analysis run, or at a minimum of twice per 8 hour working shift, whichever is more frequent, but not before Initial Calibration Verification.
3) The CRI shall be run by ICP for every wavelength used for analysis, except those for Al, Ba, Ca, Fe, Mg, Na, and K. If the results for the CRI did not fall within the fixed acceptance limits, the analysis should have been terminated, the problem corrected, the instrument recalibrated, and the new calibration then reverified.
b. Graphite Furnace Atomic Absorption Analysis (GFAA)
8
1) Calibration standards are to be prepared fresh daily, or each time an analysis is to be made, and discarded after use. The date and time of standard preparation and analysis are to be recorded in the raw data.
2) A blank and at least three calibration standards must be used in establishing each analykal curve, with the blank being analyzed first. One of the calibration standards must be run at the CRDL.
3, The linearity of the analytxal curve must be verified near the CRDL for Graphite Furnace AA (GFAA). A standard solution (CRA) shall be prepared at the CRDL or at the IDL, whichever is greater. The CRA shall be analyzed at the beginning of each sample analysis run, but not before the Initial Calibration Verification.
4) All results and percent recoveries (%R) for the CRA are to be reported on Form I1 (Part 2)-IN. If the results for the CRA did not fall within the fixed acceptance limits, the analysis should have been terminated, the problem corrected, the instrument recalibrated, and the new calibration then reverified.
C. Cold Vapor Mercury Analysis
1) A blank and from five to eight calibration standards (depending on the specific method being used) must be employed in establishing the analytical curve, with the blank being analyzed first. One of the calibration standards must be at the CRDL.
2) The linearity of the analytical curve must be verified near the CRDL. A standard solution (CRA) shall be prepared at the CRDL or at the IDL, whichever is greater. The CRA shall be analyzed at the beginning of each sample analysis run, but not before the Initial Calibration Verification.
3) Analysis of the CRA standard for mercury is required for both the manual and automated cold vapor methods, and the results and %R are to be reported on Form II(Part 2)-IN. However, no mcific accmtance criteria has been established bv the EPA for mercury at this time.
Note: The calibration curves for the AA metals (and Hg) should possess a correlation coefficient of 3 . 9 9 5 , in order to ensure the linearity over the calibrated range.
d. Cyanide Analysis
1) A blank and at least three calibration standards, one of which must be at the
9
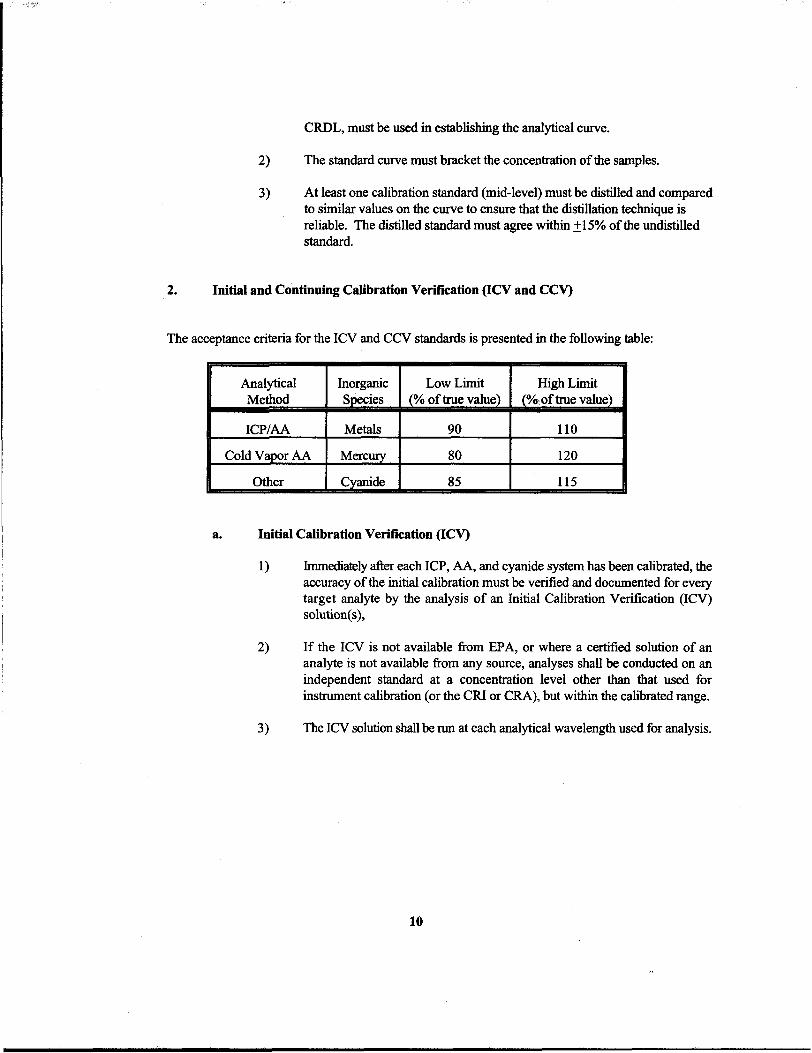
CRDL, must be used in establishing the analytical curve.
2) The standard curve must bracket the concentration of the samples.
3) At least one calibration standard (mid-level) must be distilled and compared to similar values on the curve to ensure that the distillation technique is reliable. The distilled standard must agree within *15% of the undistilled standard.
2. Initial and Continuing Calibration Verification (ICV and CCV)
The acceptance criteria for the ICV and CCV standards is presented in the following table:
a. Initial Calibration Verification (ICV)
1) Immediately after each ICP, AA, and cyanide system has been calibrated, the accuracy of the initial calibration must be verified and documented for every target analyte by the analysis of an Initial Calibration Verification (ICV) solution(s),
2) If the ICV is not available from EPA, or where a certified solution of an analyte is not available from any source, analyses shall be conducted on an independent standard at a concentration level other than that used for instrument calibration (or the CRI or CRA), but within the calibrated range.
3) The ICV solution shall be m at each analytical wavelength used for analysis.
10
4) For cyanide analysis, the ICV standard solution shall be distilled with each batch of samples analyzed. An ICV distilled with a particular set of samples must be analyzed only with that sample set. Additionally, for aaueous samdes the ICV for cyanide can also be used as the Laboratory Control Sample (LCS). However, a separate ICV is required for soil cyanide samules.
b. Continuing Calibration Verification (CCV)
1) To ensure the accuracy during the course of each analytical run, the CCV shall be analyzed and reported for each wavelength used for the analysis of each analyte.
2) The CCV standad must be analyzed at a frequency of 10% or every two hours during an analyt~cal run, whichever is more frequent. The CCV standard shall also be analyzed at the beginning of the rn and after the last analytical sample.
3) The analyte concentmtion(s) in the CCV standard@) shall be different than the concentration used for the initial calibration verification (ICV), and shall be one of the following solutions at or near the mid-range levels of the calibration curve:
a. EPA Solutions. b. NIST Standards. C. A Laboratory-prepared standard solution (self-prepared or
commercially available).
4) The same CCV standard solution shall be used throughout the analysis runs for a case of samples received.
5 ) The CCV shall be analyzed in the same fashion as an actual sample. Operations such as the number of replicate analysis, the number and duration of the instrument rinses, etc., affect the measured CCV result and are not to be applied to the CCV in a greater extent than they are applied to the associated analytical samples.
11
D. Evaluation:
a. ICPAnalysis
1) Venfy that the instrument was calibrated daily and each time the instrument was set-up, utilizing a blank and at least one calibration standard.
2) Confirm that the measurements were within the documented linear working range, and are the average result of at least two replicate exposures.
3) Evaluate the reported CRI standard to coniirm that it analyzed at the proper concentration, frequency, and location within the analytical run sequence. Verify that acceptable %R results were obtained.
4) Veri@ that the ICV and CCV standards were analyzed for each analyte at the proper fkquency and at the appropriate concentration. Verify that acceptable %R results were obtained.
5 ) Recalculate one or more of the ICV and CCV %R using the following equation and verify that the recalculated value agrees with the laboratory reported values on Form IIA. Due to possible rounding discrepancies, allow results to fall within 1% of the contract windows (e.g., for ICP 89-1 11%).
%R = Found x 100 True
Where: Found = Concentration (in ug/L) of each analyte measured in the analysis of the ICV or CCV solution.
True = Concentration (in ug/L) of each analyte in the ICV or CCV source.
b. Atomic Absorption (AA) and Cold Vapor Mercury Analysis
1) Verify the date and time the various calibration standards were prepared, and their analytical use.
2) Venfy that the instrument was calibrated daily for each analyte. For each time that the instrument was set-up, confirm that a blank and the proper concentration and number of calibration standards were utilized depending on the actual method employed for the analysis (e.g., for AA a blank and at least three standards, and for Hg a blank and from five to eight calibration standards, depending on the method). Confirm that one of the calibration standards was analyzed at the CRDL.
12
3) Evaluate the repod CRA standard to confirm that it analyzed at the proper fiequency, concentration, and location within the analytical run sequence. VerifL that for AA CRA analysis, acceptable %R results were obtained.
4) Verify that the ICV and CCV standards were analyzed for each analyte at the proper &equency and at the appropriate concentration. Verify that acceptable %R results were obtained.
5 ) Recalculate one or more of the ICV and CCV %R using the following equation and venfy that the recalculated value agrees with the laboratory reported values on Form IIA. Due to possible rounding discrepancies, allow results to fall within 1% of the contract windows (e.g., for AA 89-1 11%, and for Hg 79-121%).
?'OR = Found x 100 True
Where: Found = Concentration (in ug/L) of each analyte measured in the analysis of the ICV or CCV solution.
True = Concentration (in ug/L) of each analyte in the ICV or CCV source.
C. Cyanide Analysis
1) VerifL that the instrument was calibrated daily and each time the instrument was set-up, utilizing a blank and at least three calibration standards. Confirm that one of the calibration standards was analyzed at the CRDL.
2) Check the distillation log and verify that the mid-level CN standard was distilled and analyzed. Verify that the distilled mid-level CN standard agrees within i15% of the undistilled standard.
3) VenfL that the ICV and CCV standards were analyzed at the proper fiequency and at the appropriate concentrations. Verify that acceptable %R results were obtained.
13
E. Action:
4) Recalculate one or more of the ICV and CCV %R using the following equation and verify that the recalculated value agrees with the laboratory reported values on Form IIA. Due to possible rounding discrepancies, allow results to fall within 1% of the contract windows (e.g., for Cyanide 84-1 16%).
%R = Found x 100 True
Where: Found = Concentration (in ugL) of each analyte measured in the analysis of the ICV or CCV solution.
True = Concentration (in ug/L) of each analyte in the ICV or CCV source.
1. If the minimum number of standards as defined in INORG Section II.B. 1. above were not used for initial calibration, or ifthe instrument was not calibrated daily and each time the instrument was set up, qualify the data as unusable (R).
2. Ifthe correlation coefficient is -4.995 (AA and Cold Vapor Hg), qualify results greater than the IDL as estimated (0, and results less than the IDL as estimated (UJ). Depending on the degree of the deviation from linearity, further qualification of the data may be required depending on the professional judgement of the reviewer (e.g, unusable data (R)).
3. If one of the midrange CN standards was not distilled, analyzed, and shown to be in agreement with the un-distilled standard, then qualify all associated sample results as estimated (J).
4. If any CRA or CRI standards are outside the listed acceptance criteria:
a. Utilizing professional judgement, any potential effects on the data should be noted in the data review narrative.
b. Extreme or repetitive failure should be noted for TPO action.
c. Professional judgement shall be used to determine if it is necessary to qualify the data for any analyte.
14
I *-
5. If the ICV or CCV %R falls outside the acceptance windows, use professional judgement to qual@ all associated data. Ifpossible, indicate the bias in the review. The following guidelines are recommended
a. If the ICV or CCV %R falls outside the acceptance windows but within the ranges of 75-89% or 11 1-125% (CN, 70-84% or 116-130%; Hg, 65-79% or 12 1 - 135%), qualify results > IDL as estimated (J).
b. IftheICVorCCV%Riswithintherange of 111-125% (CN, 116-130%; Hg, 12 1 - 135%), results < IDL are acceptable.
C. Ifthe ICV or CCV %R is 75-89% (CN, 7044%; Hg, 65-79%), qualify results < IDL as estimated (UJ).
d. Ifthe ICV or CCV %R is (75%, ( 0 4 , (70%; Hg, <65%), qualify all positive results as unusable (R).
e. Ifthe ICV or CCV %R is >125%, (CN > 130%; Hg >135%), qualify results >IDL as unusable (R); results < IDL are acceptable.
6. If the laboratory has failed to provide adequate calibration information, the designated representative should contact the laboratory and request the necessary information. If the information is not available, the reviewer must then use professional judgement to assess the data.
7. Whenever possible, the potential effects on the reported data due to exceeding the calibration criteria should be noted in the data review narrative.
8. If calibration criteria are grossly exceeded, the specifics should be noted for TPO action.
Note: For truly critical samples, a further indepth evaluation of the calibration curve may be warranted to determine if additional qualification is necessary.
15
III. BLANKS
A. Review Items: Form I-IN, Form 111-IN, Form XIII-IN, Form XIV-IN, preparation logs, calibration standard logs, instrument logs, and raw data.
B. Objective:
The assessment of blank analysis results is to determine the existence and magnitude of contamination resulting fkom laboratory (or field) ktivities. The criteria for evaluation of blanks applies to any blank associated with the samples (e.g., method blanks, calibration blanks, field blanks, etc.). If problems with g g blank exist, all associated data must be carefully evaluated to determine whether or not there is an inherent variability in the data, or if the problem is an isolated occurrence not affecting other data.
C. Criteria:
1. No contaminants should be found in the blank(s).
2. The initial calibration blank (ICB) is analyzed after the analytical standards, but not before analysis of the ICV, during the initial calibration of the instrument. (see INORG Section II.C. 1. above).
3. A continuing calibration blank (CCB) must be analyzed at each wavelength used for the analysis, immediately after every initial and continuing calibration verification. The CCB shall be analyzed at a frequency of 10% or every two hours during the run, whichever is more frequent. The CCB shall be analyzed at the beginning of the run, and after the last CCV that was analyzed after the last analytical sample of the run. The CCB result (absolute value) must not exceed the CRDL, for each analyte analyzed for.
4. At least one preparation blank (PB), must be prepared and analyzed for each matrix, with every SDG, or with each batch of samples digested, whichever is more fkequent. The preparation blank consists of deionkd distilled water processed through the appropriate sample preparation and analysis procedure.
5 . If any analyte concentration in the PB is above the CRDL, the lowest concentration of that analyte in the associated samples must be 10 times the PB concentration. Otherwise, all samples associated with that PB with the analyte’s concentration less than 10 times the PB concentration, and above the CRDL, should have been redigested and re-analyzed for that analyte (except for an identified aqueous soil field blank). The sample concentration is not to be corrected for the blank value.
6. If the conmhation of the PB for a certain analyte is below the negative CRDL, then all samples reported below 10 times the CRDL (associated with that analyte in that blank), should have been re-digested and re-analyzed.
D. Evaluation:
16
1. Verify that an ICB was analyzed after the calibration, and that the CCB was analyzed at the proper fkquency and location during the run. PB's were prepared and analyzed as appropriate for the SDG (e.g., total number of samples, various types of matrices present, number of digestion batches, etc.).
2. Review the results qmrted on the Blank Summary (Form 111-IN), as well as the raw data (e.g., ICP printouts, strip charts, printer tapes, bench sheets, etc.), for all blanks and verify that the results were accurately reported.
3. Evaluate all of the associated blanks for the presence of target analytes.
E. Action:
1. Ifthe appropriate blanks were not analyzed with the correct frequency, then the data reviewer should use professional judgement to determine if the associated sample data should be qualified. The reviewer may need to obtain additional information from the laboratory. The situation should then be recorded in the review narrative, and noted for TPO action.
2. Action regarding unsuitable blank results depends on the circumstances and origin of the blank. The reviewer should note that in instances where more than one blank is associated with a given sample, qualification should be based upon a comparison with the associated blank having the highest concentration of a contaminant. The results must not be corrected by subtracting any blank value.
3. Some general "technical" review actions are as follows:
a. Actions in the case of unusable blank results depends on the circumstances and origin of the blank in question. Sample results greater than the IDL but less than 5 times the amount found in any blank should be qualified as (U).
b. Any blank reported with a negative result whose absolute value is greater than the IDL must be carefully evaluated to determine its effect on the sample data. The reviewer shall then use professional judgement to asses the data.
C. The blank analyses may not involve the same weights, volumes, or dilution factors as the associated samples. In particular, soil sample results reported on Form I-IN will not be on the same basis (units, dilution) as the calibration blank data reported on Form 111-IN. The reviewer may find it easier to work from the raw data when applying the 5X criteria to soil sample data, or calibration blank data.
17
4. Specific "method" actions are as follows:
a. If the magnitude (absolute value) of the CCB result exceeds the IDL, the result shall be reported in ug/L on Form 111-IN, otherwise report as "IDL-U".
b. If the absolute value of the CCB result exceeds the CRDL, the analysis should have been terminated. This situation should be noted for TPO action, and recorded in the data review narrative. The reviewer shall then use professional judgement to asses the data.
C. If the absolute value of the concentration of the PB is less than or equal to the CRDL, no correction of the sample results is performed.
d. If any analyte concentration in the PB is above the CRDL, the lowest concentration of that analyte in the associated samples must be 10 times the PB concentration. Otherwise, all samples associated with that blank should have been redigested and reanalyzed. This situation should be noted for TPO action, and recorded in the data review narrative. The reviewer shall then use professional judgement to asses the data. The sample concentration is not to be corrected for the blank value.
18
IV. ICP INTERFERENCE CHECK SAMPLE (ICs)
A. Review Items: Form IV-IN, Form XIV-IN, instrument printouts, raw data.
B. Objective:
The ICP Inkrfemnce Check Sample (ICs) verities the contract laboratory's interelement and background correction factors.
C. Criteria:
1 . The ICs consists of two solutions: Solution A and Solution AB. Solution A consists of the interferents, and solution AB consists of the analytes mixed with the interfiits. An ICs analysis consists of analyzing both solutions consecutively, starting with solution A, for all wavelengths used for each analyte reported by ICP.
2. An ICs must be run at the beginning and end of each sample analysis run (or a minimum of twice per 8 hour working shift), whichever is more frequent. The ICs is not to be run prior to the initial calibration verification.
3. Results for the ICP analysis of the ICs solution AB must fall within the control limits of i 20% of the true value for the d y t e s included in the solution. If true values for the analytes are not supplied with the ICs, the mean shall be determined by initially analyzing the ICs at least five times repetitively for the particular analytes. This mean determination shall be made during an d y h c a l run where the results for the previously supplied EPA ICs solution met all contract specifications. Additionally, the results of this initial mean determination shall be used as the true value until the solution is exhausted.
4. The ICs should be obtained from EPA (EMSL-LV) if available and analyzed according to the instructions supplied with the solutions. If the ICs is not available from EPA, then an independent ICs solution shall be prepared with the interferant and analyte concentrations at the levels specified in the method. The mean and standard deviation of the prepared solution shall be established by initially analyzing the ICs at least five times repetitively for each parameter on Form IV-IN. The mean and standard deviation shall be reported in the raw data.
D. Evaluation:
1. Verify from the raw data (ICP instrumental printout) that the ICs was analyzed at the proper frequency and location during the analyhcal run.
2. Evaluate the ICs raw data for results with an absolute value greater than the IDL for those analytes which are not present in the ICs solution.
19
3. If an ICs solution not obtained fiom EPA was used, investigate the raw data for the five repetitive analyses. Check the calculations of the mean and standard deviation for the ICs analytes.
4. Recalculate from the raw data one or more of the analyte percent recoveries (%R) using the following equation, and verify that the recalculated value agrees with the laboratory reported values on Form IV-IN.
ICs YOR = Found Solution AB x 100 True Solution AB
Where:
Found Solution AB = concentration (in ug/L) of each analyte measured in the analysis of solution AB.
True Solution AB = concentration (in u a ) of each analyte in solution AB.
E. Action:
1 . For samples with concentrations of A1 , Ca, Fe, and Mg which are comparable to or greater than their respective levels in the Interference Check Sample:
a. If the ICs recovery for an element is >120% and the sample results are < IDL, this data is acceptable for use.
b. Ifthe ICs recovery for an element is >120% and the sample results are > IDL, qual@ the affected data as estimated (9.
C. Ifthe ICs recovery for an element falls between 50 and 79% and the sample results are > IDL, qualify the affected data as estimated (J).
d. If sample results are < IDL, and the ICs recovery for that analyte falls within the m g e of 50-79%, the possibility of false negatives may exist. Qualify the data for these samples as estimated (UJ).
e. If ICs recovery results for an element fall <50%, qualify the affected data as unusable (R).
Note: If possible, indicate the bias for the estimated results in the data review narrative.
2. If results > IDL are observed for elements which are not present in the ICs solution, the possibility of false positives exists. An evaluation of the associated sample data for the affected elements should be made. For samples with comparable or higher levels of interferents and with analyte concentrations that approximate those levels found in the ICs (false positives), qualify sample results > IDL as estimated (9.
20
: d
3. Ifnegative results are observed for elements that are not present in the ICs solution, and their absolute value is > IDL, the possibility of false negatives in the samples may exist. If the absolute value of the negative results is > IDL, an evaluation of the associated sample data should be made. For samples with comparable or higher levels of interfxents, qualify results for the affected analytes IDL as estimated (UJ).
4. In general, the sample data can be accepted if the concentrations of Al, Ca, Fe and Mg in the sample are found to be less than or equal to their respective concentrations in the ICs. If these elements are present at concentrations greater than the level in the ICs, or other elements are present in the sample at >10 m a , the reviewer should investigate the possibility of other interference effects as given in the ICP method. These analyte concentration equivalents presented in the method should be considered only as estimated values, since the exact value of any analyt~cal system is instrument specific. Therefore, estimate the concentration produced by an interfering element. If the estimate is greater than 2X CRDL and also greater than 10% of the reported concentration of the affected element, qualify the affected results as estimated (J).
5. Actions regarding the interpretation and/or the subsequent qualification of ICP data due to the ICs analytical results can be extremely complex. The data reviewer should use professional judgement to determine the need for the associated sample data to be qualified. The reviewer may need to obtain additional information from the laboratory. All interpretive situations should then be recorded in the data review narrative.
6. Ifthe ICs acceptance criteria are grossly exceeded, the specifics should be noted for TPO action.
21
V. LABORATORY CONTROL SAMPLE (LCS)
A. Review Items: COVER PAGE-IN, Form W-IN, Form XIII-IN, Form XIV-M, preparation logs, instrument printouts, raw data.
B. Objective:
The Laboratory Control Sample (LCS) serves as a monitor of the overall performance of each step during the analysis, including the sample preparation.
C. Criteria:
1 . Aqueous and solid Laboratory Control Samples shall be analyzed for each analyte utilizing the same sample preparations, analflcal methods, and QNQC procedures as employed for the samples. The aqueous LCS solution shall be obtained from EPA. However, if the LCS is unavailable from EPA, the Initial Calibration Solutions may be used.
2. One aqueous LCS must be prepared and analyzed for every group of aqueous samples in an SDG, or with each batch of aqueous samples digested, whichever is more frequent.
Note: An aqueous LCS is not required for mercury. For cyanide, a distilled ICV is used as the LCS (see INORG Section II.C.2.a.4. above).
3. All aqueous LCS results must f d within the control limits of 80- 120%R, except for Sb and Ag which have no fmed control limits. If the %R for the aqueous LCS falls outside of the fixed control limits (except for Ag and Sb), the analyses should have been terminated, the problem corrected, and the samples associated with that LCS redigested and reanalyzed.
4. An EPA provided solid LCS shall be prepared and analyzed utilizing each of the preparation and analytical procedures applied to the soWsediment samples received, with one exception: The percent solids determination is not required for the LCS. If the EPA solid LCS is not available, other EPA Quality Assurance Check samples or other certified materials may be used.
5. One solid LCS shall be prepared and analyzed for every group of soilhediment samples in an SDG, or for each batch of samples digested and/or distilled, whichever is more frequent.
6. All solid LCS results must fall within the control limits established by EPA-EMSLLV. If the results for the solid LCS fall outside of the control limits, the analyses should have been terminated, the problem corrected, and the samples associated with that LCS redigested and reanalyzed.
22
D. Evaluation:
1. VerifL fiom the COVERPAGE-IN, Form XIII-IN, and the raw data that the appropriate number of required Laboratory Control Samples were prepared and analyzed for the SDG.
2. Evaluate Form VII-IN and verify that all results, for each analyte, fall within the established control limits.
Note: Certain elements have only advisory limits for the LCS. Professional judgement should be used when evaluating these elements.
3. Check the raw data (ICP printouts, strip charts, bench sheets) to verify that the reported percent recoveries (%R) on Form VII-IN were accurately transcribed. Recalculate one or more of the reported recoveries (%R) using the following equation:
LCSYoR = LCS Found x 100 LCS True
Where:
LCS Found = concalmtion (in ugiL for aqueous; mg/kg for solid) of each analyte measured in the analysis of LCS solution.
LCS True = concentration (in ugh, for aqueous; mg/kg for solid) of each analyte in the LCS source.
E. Action:
If the LCS criteria are not met, then the laboratory performance and method accuracy are in question. Professional judgement should be used to determine if the data should be qualified or rejected. The following guidance is suggested for qualifying sample data for which the associated LCS does not meet the required criteria.
1. Aqueous LCS:
a. If the LCS recovery for any analyte falls within the range of 50% - 79% or >120%, qualify results > IDL as estimated (0.
b. If the results are < IDL and the LCS recovery is greater than 120%, the data are acceptable.
23
c. Ifthe results are < IDL and the LCS recovery falls within the range of 50-79%, qualify the data for the affected analytes as estimated (UJ).
d. If LCS recovery results are <50%, qualify the data for these samples as unusable (R).
2. Solid LCS:
a. If the solid LCS recovery for any analyte falls outside the EPA control limits, qualify all sample results > IDL as estimated (J).
b. Ifthe LCS results are higher than the control limits, and the sample results are < IDL, the data are acceptable.
c. If the LCS results are lower than the control limits, then qualify all sample results < IDL as estimated (UJ).
3. It should be noted for TPO action if a laboratory fails to analyze an LCS with each SDG, or if a laboratory consistently fails to generate acceptable LCS recoveries.
4. Whenever possible, the potential effects on the data due to out-of-control LCS results should be noted in the data review narrative.
24
VI. DUPLICATE SAMPLE ANALYSIS
A. Review Items: Form I-IN, Form VI-IN, instrument printouts, raw data.
B. Objective:
Duplicate sample detennm * tions are used to demonstrate acceptable method precision by the laboratory at the time of analysis. Duplicate analyses are also performed to generate data in order to determine the long-term precision of the analytical method on various matrices.
C. Criteria:
1. Samples identified as field blanks cannot be used for duplicate sample analysis.
2. One duplicate sample must be prepared and analyzed fbm each group of samples with a similar matrix type (e.g., water, soil) and concentration (e.g., low, medium), or for each SDG. Duplicates cannot be averaged for reporting on Form I-IN.
Note: Additional duplicate sample analyses may be required through Regional EPA or Project Officer request Alternately, EPA may require that a specific sample be used for the duplicate sample analysis.
3. Duplicate sample analyses are required for percent solids determination.
4. Iftwo analytical methods are used to obtain the reported values for the same element within a SDG (e.g., ICP and GFAA, or a soil and a water method), duplicate samples must be run by each method used.
5. A control limit of 2 20% for the Relative Percent Difference (RPD) shall be used for original and duplicate sample values greater than or equal to 5x the CRDL. The absolute value of the control limit (CRDL) shall be entered in the "Control Limit" column on Form VI-lN.
6. A control limit o f t the CRDL shall be used if either the sample or duplicate value is less than 5x CRDL. In the case where only one result is above the 5x the CRDL level and the other is below, the _+ the CRDL criteria applies. If both samples values are less than the IDL, the RPD is not calculated of Form VI-IN
- Note: The control limits as specified above (520% RPD and 2 the CRDL) are method requirements for duplicate samples, regardless of the sample matrix type. However, it should be noted that laboratory variability arising from the sub-sampling of non-homogeneous soil samples is a common occurrence. Therefore, for technical review purposes only, Regional policy may allow the use of less restrictive criteria (e.g., 2 35% RPD, _+ 2x the CRDL) to be assessed against duplicate soil samples.
25
D. Evaluation:
1. V@ fbm the COVERPAGE-IN, Form VI-IN, and the raw data that the appropriate number of required duplicate samples were prepared and analyzed for the SDG.
2. Evaluate Form VI-IN and the raw data to verify that all duplicate results, for each analyte and method, fall within the established control limits.
3. Verify that the field blank was not used for duplicate analysis.
4. Check the raw data and recalculate one or more of the RPD values using the following equation to verify that the results have been correctly reported on Form VI-IN.
RPD= IS-DI x 100 (S+D)/2
Where:
RPD = Relative Percent Difference S - - First Sample Value (original sample) D - Second Sample Value (duplicate) -
E. Action:
1. If the appropriate number of duplicate samples were not analyzed for each matrix, with the correct hquency, then the data reviewer should use professional judgement to determine if the associated sample data should be qualified. The reviewer may need to obtain additional information fi-om the laboratory. The situation should then be recorded in the data review narrative, and noted for TPO action.
2. If the results flom a duplicate analysis for a particular analyte fall outside the appropriate fixed control windows, qual* the results for that analyte in all associated samples of the same matrix as estimated (9.
3. It should be noted for TPO action if a laboratory uses a field blank for the duplicate sample analysis. All of the other QC data must then be carefully checked, and professional judgement exercised by the data reviewer when evaluating the data.
Note: This information must be included on the IRDA form.
4. Whenever possible, the potential effects on the data due to out-of-control duplicate samples results should be noted in the data review narrative.
26
VII. SPIKE SAMPLE ANALYSIS
A. Review Items: Form I-IN, Form V-IN (Part A & B), instrument printouts, raw data.
B. Objective:
The spiked sample analysis is designed to provide information about the effect of each sample matrix on the sample preparation procedures and the measurement methodology. If the spike is added to the sample prior to any distillation steps (cyanide), or before the digestion (e.g., prior to the addition of other reagents), it is then referred to as a spiked sample, a pre-digestiodpre-distillation spike, or a matrix spike. Ifthe spike is added to the sample after the completion of the distillation or digestion procedures, it is then referred to as a post-digestiodpost-distillation spike, or an analytical spike.
C. Criteria:
1. Samples identified as field blanks cannot be used for spiked sample analysis.
2. At least one spiked sample (pre-distillatiodpre-digestion) must be prepared and analyzed from each group of samples with a similar matrix type (e.g., water, soil) and concentration (e.g., low, medium), or for each SDG.
3. For Flame AA, ICP, and CN analysis, when the pre-distillatiodpre-digestion spike recovery falls outside of the control limits and the sample result does not exceed 4x the spike added, a post-digestion/post-distillation spike shall be performed for those elements that do not meet the specified criteria. Spike an aliquot of the remaining unspiked sample at 2x the indigenous level, or 2x the CRDL, whichever is greater.
Note: Post-digestion spikes are not required for Ag and Hg. Additional spiked sample analyses may be required through Regional EPA or Project Oficer request. Alternately, EPA may require that a specific sample be used for the spiked sample analysis.
4. If two analflcal methods are used to obtain the reported values for the same element within a SDG (e.g., ICP and GFAA, or a soil and a water method), spiked samples must be run by each method used.
5. The spdce percent recovery (%R) must be within the established acceptance limits. However, splke recovery limits do not apply when sample concentration exceeds the spike concentration by a factor of 4 or greater. In such an event, the data shall be reported unflagged even if the percent recovery does not meet the acceptance criteria.
27
6. If the spiked sample analysis was performed on the same sample that was chosen for the duplicate sample analysis, spike calculations shall be performed using the results of the sample designated as the "original sample". The average of the duplicate results cannot be used for the purpose of determining percent recovery.
Note: The final spike concentrations required for the various target analytes are presented in the actual analytical methodologies.
D. Evaluation:
1. VerifL h m the COVERPAGE-IN, Form V-IN, and the raw data that the appropriate number of required spiked samples were prepared and analyzed for the SDG.
2. Verify that the field blank was not used for the spiked sample analysis.
3. Evaluate Form V-IN and the raw data to verify that all pre-distillatiodpre-digestion spiked sample results, for each analyte and method, fall within the established control limits. If not, verify that a post-digestiodpost-distillation spike was prepared and analyzed (see INORG Section VII.C.3. above).
4. Recalculate h m the raw data one or more of the spiked sample percent recoveries (%R) using the following equation, and venfL that the recalculated value agrees with the laboratory reported values on Form V-IN.
E. Action:
%R = [SSR-SR) x 100 SA
Where:
SSR = Spiked Sample Result SR = SampleResult SA = SpikeAdded
Note: When the sample concentration is less than the instrument detection level (IDL), use SR=O only for the purposes of calculating the %R. The actual spiked sample results, sample results, and %R (positive or negative) still shall be reported on Form V-IN for ICP, AA, and Cyanide analyses.
1. It should be noted for TPO action if a laboratory uses a field blank for the spiked sample analysis. All of the other QC data must then be careklly checked, and professional judgement exercised by the data reviewer when evaluating the data.
Note: This information must be included on the IRDA report form.
28
2. In the instance where t h e ~ is more than one spiked sample result per matrix and concentration, per analytical method per SDG, if one spiked sample recovery is not within contract criteria, flag all of the samples of the same matrix, level, and method in the SDG.
3. If the pre-distiUation/pre-digestion spike recovery does not meet criteria, a post-distillatiodpost- digestion spike is required for all analytes (except Ag and Hg), and is required for all methods (except furnace). The data from the post-spikes is not to be used to qualify sample results.
Note: This information must be included in the IRDA report form.
4. If the spike recovery is >125% and the q.wrted sample results are < IDL, the data is acceptable for use.
5. If the spike recovery is >125% or <75% and the sample results are > IDL, qual@ the data for these samples as estimated (9.
6. Ifthe spike recovery falls withm the range of 30-74% and the sample results are < IDL, qualifL the data for these samples as estimated (UJ).
7. If spike recovery results fall <30% and the sample results are < IDL, qualify the data for these samples as unusable (R).
8. Whenever possible, the potential effects on the data due to out-of-control spiked sample results should be noted in the data review narrative.
29
VIII. GRAPHITE FURNACE ATOMIC ABSORPTION OC
A. Review Items: Form I-IN, Form V-IN, Form VIII-IN, instrumental printouts, raw data.
B. Objective:
Because of the nature of the Graphite Furnace Atomic Absorption (GFAA) technique, special analytical procedures are required for the quantitation of samples. The special QNQC furnace procedures are outlined in the method. Duplicate injections and multiple level furnace post digestion spikes are used to establish the precision and accuracy of the individual analytical determinations.
C. Criteria:
1. All GFAA analyses shall fall within the calibration range. In addition, all GFAA analyses, except during 111 Methods of Standard Additions (MSA), require duplicate injections. Average concentration values are used for reporting purposes.
2. The Furnace Atomic Absorption Analysis Scheme ("MSA Tree") must be followed as described in the method.
3. A maximum of 10 Ml sample analyses to a maximum 20 injections may be performed between each consecutive continuing calibration verification (CCV) and blank analysis.
For sample concentrations greater than the CRDL, the duplicate injection readings must agree within 20% Relative Standard Deviation (RSD), or Coefficient of Variation (CV), otherwise the analytical sample must be rerun once (e.g., at least two additional injections).
4.
5 . The post-digestion (analyhcal) spike concentration must be at 2x the CRDL (except for lead which must be at 20 ug/L). This requirement for an analyhcal spike will include the LCS and the Preparation Blank (PB).
Note: The LCS shall be quantitated from the calibration curve and corrective action, if needed, shall be taken accordingly. MSA is not to be performed on the LCS or the PB, regardless of spike recovery results.
6. The analytical spike of a sample must be run immediately after that sample.
7. The spike percent recovery must be within the established acceptance limits of the method, in order for the sample to be quantitated directly from the analytical calibration curve.
30
8. If the spiked sample's percent recovery is outside of the method acceptance limit criteria, quantitation by MSA is then required.
9. The COlTelation coefficient for any MSA analysis shall be greater than or equal to 0.995. If the correlation coefficient for a specific MSA is less than 0.995, then that MSA shall be repeated at least once prior to reporting.
D. Evaluation:
1. Review the Furnace AA raw data to verify that the Furnace Atomic Absorption Scheme has been followed.
2. Check the raw data and venfL that duplicate injections agree within +20% RSD (or CV) for sample concentrations reported greater than the CRDL.
3. Recalculate the spike recovery results for the LCS and/or the PB. Verify that the spike recovery results are within the established method acceptance window.
4. Recalculate from the raw data one or more of the MSA results (if MSA was performed), and venfL that the recalculated value@) agrees with the laboratory reported value@) on Form VIII- IN.
5. Confirm that the MSA spikes have been performed at the appropriate concentration levels.
E. Action:
1. If duplicate injections are outside the 220% RSD (or CV) acceptance limit and the sample has not been rerun once as required, qualify the associated data as estimated (J).
2. Ifthe rerun sample results do not agree within +20% RSD (or CV), qualify the data as estimated 0.
3. If the post-digestion spike recovery is:
a. Less than 40%, qualify results greater than the IDL as estimated (9.
b. Less than or equal to lo%, but <40%, qualify results less than the IDL as estimated w9.
C. Less than lo%, qualify results less than the IDL as unusable (R).
31
4. If sample absorbance is <50% of the post digestion spike absorbance then:
a. If the furnace post digestion spike recovery is not within the established method acceptance limits, then qualifj the sample results greater than the IDL as estimated (J).
b. If the furnace post digestion spike recovery is not within the established method acceptance limits, qualifi the sample results less than the IDL as estimated (UJ).
5. If Method of Standard Additions (MSA) is required but has not been done, qualify the data as estimated (9.
6. If any of the samples run by MSA have not been spiked at the appropriate levels, quallfy the data as estimated (J).
7. If the MSA correlation coefficient is less than 0.995, qualify the data as estimated (J).
8. Whenever possible, the potential effects on the reported data due to out-of-control spiked Prep Blanks, spiked LCS, or MSAs should be noted in the data review narrative. Professional judgement shall be exercised by the data reviewer when evaluating the data.
32
IX. ICP SERIAL DILUTION
A.
B.
C.
D.
E.
Review Items: Form I-IN, Form IX-IN, instrumental printouts, raw data.
Objective:
The serial dilution of samples quantitated by ICP determines whether or not significant physical or chemical interferences exist due to sample matrix.
Criteria:
1. An ICP Serial Dilution analysis must be pedormed on a sample fiom each group of samples with a similar matrix type (e.g., water, soil) and concentration (e.g., low, medium), or for each Sample Delivery Group (SDG), whichever is more kquent.
2. Samples identified as field blanks cannot be used for the ICP serial dilution analysis.
3. If the analyte concentration is sufficiently high (concentration in the on@ sample is m h h d y a fhctor of 50 above the DL), the d d dilution analysis (a 5-fold dilution) must then agree within a 100? Difference (%D) of the original determination after correction for dilution.
Evaluation:
1. Check the raw data and recalculate the %D using the following equation. VenfL that the serial dilution analysis results, and the calculated %D results agree with the values reported by the laboratory on Form IX.
%D= u x 1 0 0 I
Where:
I = Initial Sample Result S = Serial Dilution Result (Instrument Reading x 5)
2. Check the raw data for any evidence of negative interference (results fiom the diluted sample which are sigtllficantly higher than the on@ sample), possibly due to high levels of dissolved solids in the sample, ionization effects, etc.
Action:
1. When the required 10% Difference criteria are not met, qualifL the associated data as estimated (J).
33
2. If evidence of negative inkrference is found, professional judgement must be used to qualifL the associated sample data. The potential effects on the reported data should be noted in the data review narrative.
34
M FIELDDUPLICATES
A. Review Items: Form I-IN, Instrumental printouts, raw data.
B. Objective:
Field duplicate samples may be taken and analyzed as an indication of overall precision. These analyses measure both field and lab precision; therefore, the results may have more variability than lab duplicates which measure only lab performance. It is also expected that soil duplicate results will have a greater variance than water matrices due to difficulties associated with collecting identical field samples.
C. Criteria:
There are no "required" review criteria for field duplicate analyses comparability.
D. Evaluation:
Samples which are field duplicates should be identified using EPA Sample Traffic Reports or sample field sheets. The reviewer should compare the results reported for each sample and calculate the Relative Percent Difference (RPD), if appropriate.
E. Action:
Any evaluation of the field duplicates should be provided within the data reviewer's narrative comments.
35
XI. O V E U L ASSESSMENT
A. Review Items: Entire data package, data review results, preparation logs, calibration standard logs, instrument logs, instrumental printouts, and raw data.
B. Objective:
The objective is to ensure that the reported sample quantitation results are accurate. It is appropriate for the data reviewer to make professional judgements and express concerns, as well as to comment on the validity of the overall data for a Case. This is particularly appropriate when there are several QC criteria out of specification. The additive nature of QC factors out of specification is difficult to assess in an objective manner, but the reviewer has a responsibility to inform the user concerning data quality and data limitations in order to assist that user in avoiding inappropriate use of the data, while not precluding any consideration of the data at all. If qualifiem other than those used in this document are necessary to describe or qual@ the data, it is necessary to thoroughly document/explain the additional qualifiers used. The data reviewer would be greatly assisted in this endeavor ifthe data quality objectives were provided. The cover form and supplementary documentation must be included with the review.
C. Criteria:
Assess the overall quality of the data.
Review all available materials to assess the overall quality of the data, keeping in mind the additive nature of analytical problems.
Reported analyte concentrations must have been quantitated according to the appropriate analyhcal method, as listed in the method.
D. Evaluation:
The raw data should be examined to verify that the correct calculation of the sample results was reported by the laboratory. Digestion and distillation logs, instrument printouts, strip charts, etc. should be compared to the reported sample results recorded on the Inorganic Forms.
1. Evaluate any technical problems not previously addressed.
2. Examine the raw data for any anomalies (i.e., baseline shifts, negative absorbance, omissions, legibility, etc.).
3. V e that there are no transcription or reduction errors (e.g., dilutions, percent solids, sample weights) on one or more samples.
4. VenfL that results fall within the linear range of the ICP (Form XIII) and within the calibrated range for the non-ICP parameters.
5. When the laboratory provides both ICP and furnace results for an analyte in a sample and the
36
concentration is > ICP IDL, the results can assist in idenhfjmg quantitation problems.
6. If appropriate information is available, the reviewer may assess the useability of the data to assist the data user in avoiding inappropriate use of the data. Review all available information, including the QAPJP (specifically the Data Quality Objectives), SAP, and communication with data user that concerns the intended use and desired quality of these data.
E. Action
1. Use professional judgement to determine if there is any need to qual@ data which were not qualified based on the QC criteria previously discussed.
2. Write a brief narrative to give the user an indication of the analytical limitations of the data. Any inconsistency of the data with the SDG narrative should be noted for P O action. If sufficient information on the intended use and required quality of the data are available, the reviewer should include hidher assessment of the useability of the data within the given context.
3. If there are any discrepancies found, the laboratory may be contacted by the designated representative to obtain additional information that could resolve any differences. If a discrepancy remains unresolved, the reviewer may determine qualification of the data is warranted.
37
Associated Samples
AA
Calibration Curve
Case
CCB
ccs
ccv
CLP
CRDL
cv
E M S U V
Field Blank
Field Duplicate
GLOSSARY A.
Definition of Selected Terms
Any sample related to a particular QC analysis. For example:
- For ICV, all samples run under the same calibration curve.
- For duplicate RPD, all SDG samples digesteddistilled of the same matrix.
Atomic Absorption
A plot of absorbance versus concentration of standards
A finite, usually predetermined number of samples collected in a given time period for a particular site. A Case consists of one or more Sample Delivery Groups.
Continuing Calibration Blank - a deionized water sample run every ten samples designed to detect any carryover contamination.
Contract Compliance Screening - process in which SMO inspects analytical data for contractual compliance and provides EMSLLV, laboratories, and the Regions with their findings.
Continuing Calibration Verification - a standard run every ten samples designed to test instrument performance.
Contract Laboratory Program
Contract Required Detection Limit
Coefficient of Variation
Environmental Monitoring System LaboratoryLas Vegas (P.O. Box 15027, Las Vegas, Nevada 891 14)
Field blanks are intended to idenw contaminants that may have been introduced in the field Examples are trip blanks, travel blanks, rinsate blanks, and decontamination blanks.
A duplicate sample generated in the field, not in the laboratory.
38
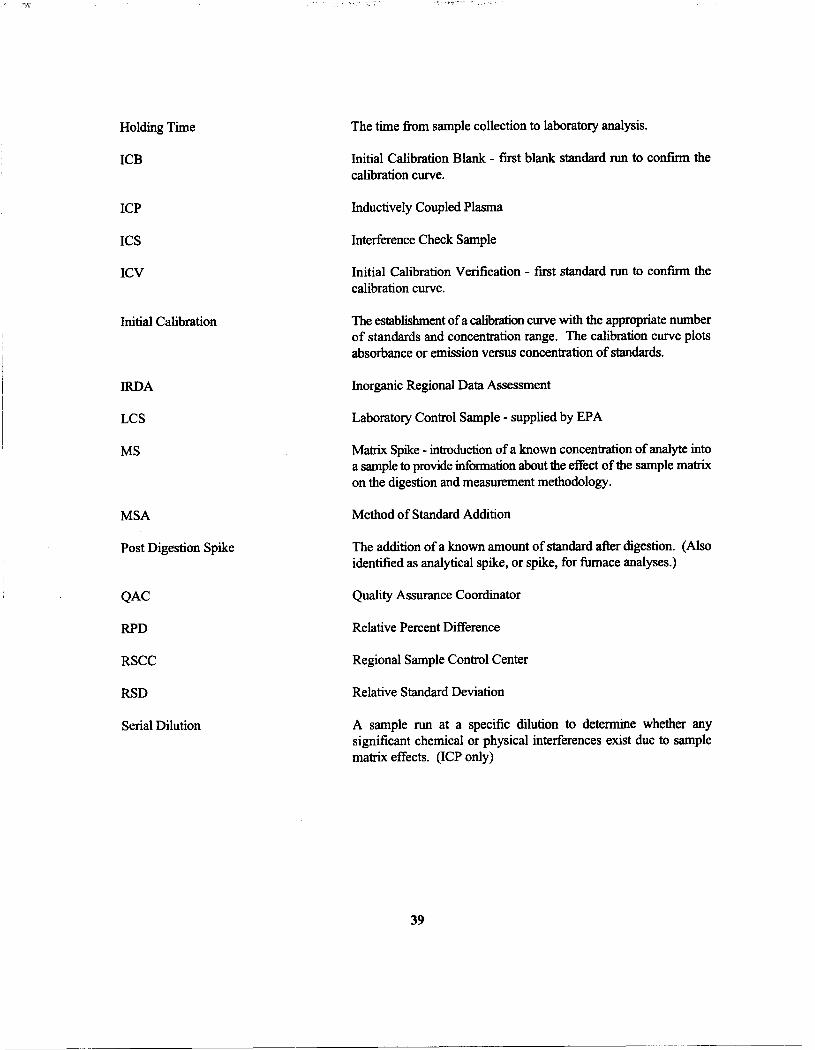
Holding Time
ICB
ICP
ICs
ICV
Initial Calibration
IRDA
LCS
MS
MSA
Post Digestion Spike
QAC
RPD
RSCC
RSD
Serial Dilution
The time from sample collection to laboratory analysis.
Initial Calibration Blank - first blank standard run to confirm the calibration curve.
Inductively Coupled Plasma
Interference Check Sample
Initial Calibration Verification - first standard run to confirm the calibration curve.
The establishment of a calibration curve with the appropriate number of standards and concentration range. The calibration curve plots absorbance or emission versus concentration of standards.
Inorganic Regional Data Assessment
Laboratory Control Sample - supplied by EPA
Matrix Spike - introduction of a known concentration of analyte into a sample to provide idormation about the effect of the sample matrix on the digestion and measurement methodology.
Method of Standard Addition
The addition of a known amount of standard after digestion. (Also identified as analytical spike, or spike, for furnace analyses.)
Quality Assurance Coordinator
Relative Percent Difference
Regional Sample Control Center
Relative Standard Deviation
A sample run at a specific dilution to determine whether any significant chemical or physical interferences exist due to sample matrix effects. (ICP only)
39
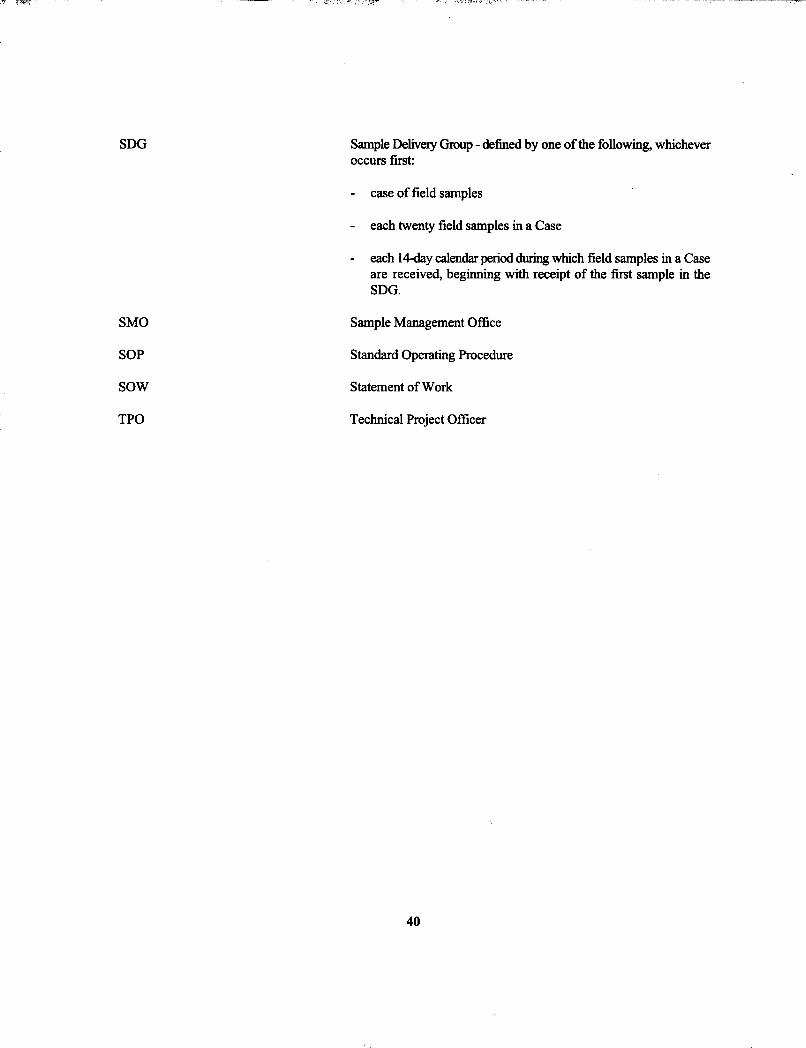
SDG
SMO
SOP
sow TPO
Sample Delivery Group - defined by one of the following, whichever occurs first:
- case of field samples
- each twenty field samples in a Case
- each 14-day calendar period during which field samples in a Case are received, beginning with receipt of the first sample in the SDG.
Sample Management Office
Standard Operating Procedure
Statement of Work
Technical Project Oficer
40
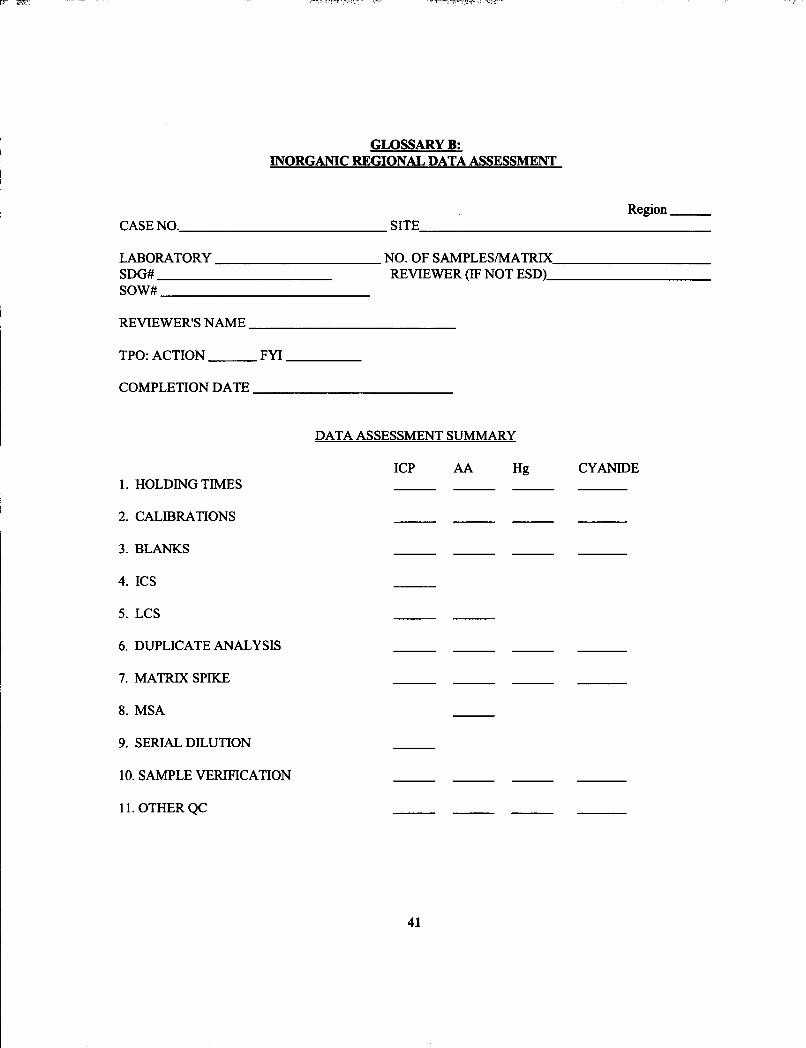
GLOSSARY B INORGANIC REGIONAL DATA ASSESSMENT
Region CASE NO. SITE
LABORATORY NO. OF SAMPLESMATRIX SDG# REVIEWER (IF NOT ESD) SOW#
REVIEWER‘S NAME
TPO: ACTION FYI
COMPLETION DATE
DATA ASSESSMENT SUMMARY
1 . HOLDING TIMES
2. CALIBRATIONS
3. BLANKS
4. ICs
5. LCS
6. DUPLICATE ANALYSIS
7. MATRIXSPIKE
8. MSA
9. SERIAL DILUTION
10. SAMPLE VERIFICATION
11.OTHERQC
ICP Ai4
41
CYANIDE
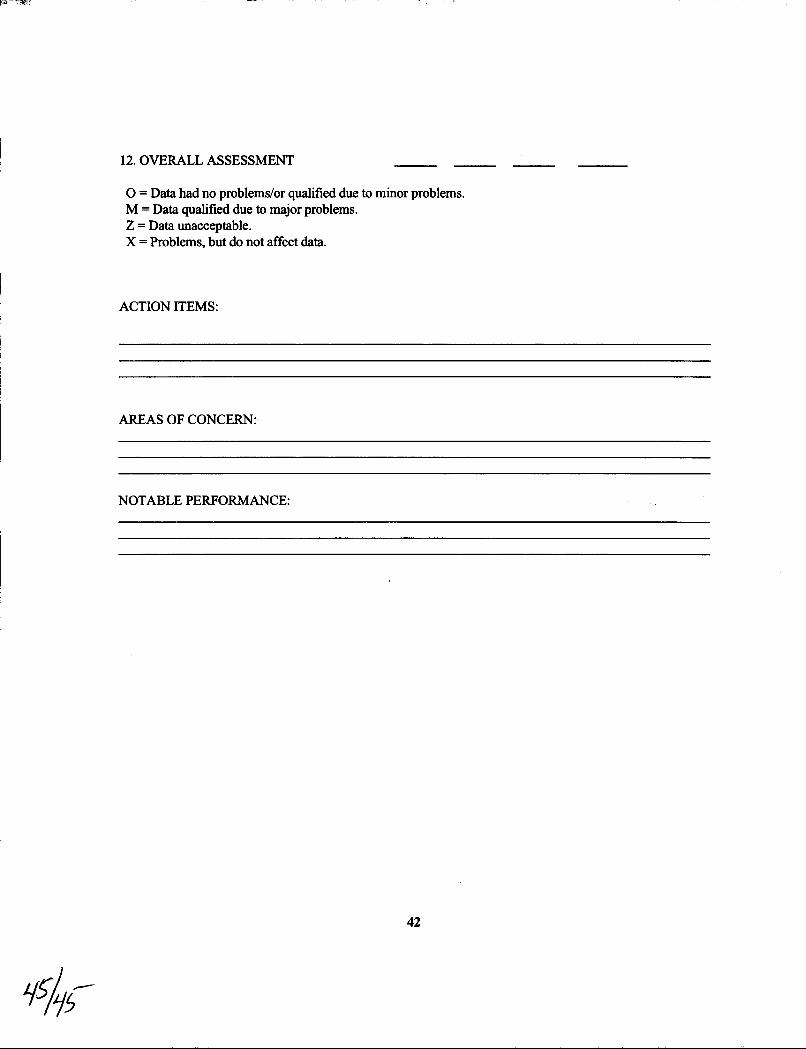
12. OVERALL ASSESSMENT
0 = Data had no problemdor qualified due to minor problems. M = Data qualified due to major problems. Z = Data unacceptable. X = Problems, but do not affect data.
ACTION ITEMS:
AREAS OF CONCERN:
NOTABLE PERFORMANCE:
42


![1 3 4 Reference: ZDHC wastewater guidelines, Pg. 9 ......2370-65-7 76057-124] 877-11-2 RepŒti 2B: 8260B, Dich ISO losn usEPA ISO 1 USEPA USEPA 1 "4 g. usEPA usEPA usEPA usEPA usEPA](https://img.pdfslide.net/doc/110x75/610e853285f7f7713133afc2/1-3-4-reference-zdhc-wastewater-guidelines-pg-9-2370-65-7-76057-124.jpg)