Embed Size (px)
Citation preview

Cloud Eye
User Guide
Issue 05
Date 2016-12-30

Contents
1 Introduction.................................................................................................................................... 11.1 What Is Cloud Eye?........................................................................................................................................................11.2 Functions........................................................................................................................................................................ 21.3 Application Scenarios.....................................................................................................................................................31.4 Related Services............................................................................................................................................................. 4
2 Getting Started............................................................................................................................. 12
3 Operation Guide..........................................................................................................................163.1 Dashboard.....................................................................................................................................................................163.2 Instance Monitoring......................................................................................................................................................183.3 Alarm Rule Management..............................................................................................................................................19
4 FAQs...............................................................................................................................................284.1 What Is Cloud Eye?......................................................................................................................................................284.2 Is CES Charged?...........................................................................................................................................................294.3 Which Metrics Can Be Monitored by CES?................................................................................................................ 304.4 What Alarm Status Does CES Support?.......................................................................................................................304.5 What Is an Alarm Notification? How Many Types of Alarm Notifications Exist? How Can I Configure Them?......314.6 How to Add Customized Monitoring Metrics?............................................................................................................ 314.7 Why Are the Network Traffic Metrics in CES Different from Those in ECS Detected by the Tool?......................... 314.8 What Is Rollup?............................................................................................................................................................ 314.9 How Long Is Metric Data Retained?............................................................................................................................324.10 What Are the Effects on ECS Monitoring Metrics If OTC Tools Is Not Installed on ECSs?....................................324.11 How Can I Export Monitoring Data?......................................................................................................................... 324.12 How Many Rollup Methods Does CES Support?...................................................................................................... 33
A Change History........................................................................................................................... 34
B Glossary........................................................................................................................................ 35
Cloud EyeUser Guide Contents
Issue 05 (2016-12-30) ii

1 Introduction
1.1 What Is Cloud Eye?Cloud Eye (CES) is an open monitoring platform that provides monitoring, alarm reporting,and alarm notification for your resources near real time. CES monitors metrics of ElasticCloud Server (ECS), Elastic Volume Service (EVS), Virtual Private Cloud (VPC), ElasticLoad Balance (ELB), Auto Scaling (AS), and Relational Database Service (RDS). You canadd alarm rules and configure alarm notification policies to learn the running status andperformance of the monitored objects in a timely manner.
Table 1-1 describes the functions provided by CES.
Cloud EyeUser Guide 1 Introduction
Issue 05 (2016-12-30) 1

Table 1-1 CES functions
Function Description
Dashboard Displays the number of metrics of each service monitored by CES. Youcan follow the metrics you are concerned about or stop followingindividual metrics by deleting them.The service metrics to choose from are as follows:l ECS: CPU Usage, Disks Read Rate, Disks Read Requests, Disk
Usage, Disks Write Rate, Disks Write Requests, Memory Usage,Inband Incoming Rate, Inband Outgoing Rate, Outband IncomingRate, and Outband Outgoing Rate
l EVS: Disks Read Rate, Disks Write Rate, Disks Read Requests, andDisks Write Requests
l AS: CPU Usage, Memory Usage, Instance Qty., Inbound Rate, andOutbound Rate
l ELB: cps, Active Connections, Inactive Connections, New cps,Inbound Packets, Outbound Packets, Inbound Rate, Outbound Rate,Abnormal Hosts, and Normal Hosts
l VPC: Upstream Bandwidth and Downstream Bandwidthl RDS: Disk Usage, CPU Usage, Memory Usage, Input/output
operations per second (IOPS), Network Input Throughput, NetworkOutput Throughput, Total Connections, Active Connections, QueryPer Second (QPS), transactions per second (TPS), Buffer PoolUsage, Buffer Pool Hit Rate, Buffer Pool Dirty Block Rate, InnoDBRead Throughput, InnoDB Write Throughput, File Read Speed, FileWrite Speed, Log Write Request Speed, Log Physical Write Speed,Log fsync() Write Speed, Temporary Tables Qty, Key Buffer Usage,Key Buffer Write Hit Rate, Key Buffer Read Hit Rate, MyISAMDisk Write Speed, MyISAM Disk Read Speed, MyISAM BufferPool Write Speed, MyISAM Buffer Pool Read Speed, DeleteExecute Speed, Insert Execute Speed, Insert_Select Execute Speed,Replace Execute Speed, Replace_Select Execute Speed, SelectExecute Speed, Update Execute Speed, Row Delete Speed, RowInsert Speed, Row Read Speed, Row Update Speed, TransactionLogs Usage, Replication Slot Usage, Database Connections,Maximum Used Transaction Ids, Transaction Logs Generations,Oldest Replication Slot Lag, and Replication Lag
Instancemonitoring
Shows the status of service instances. If you have signed up for one ormore of the following services: ECS, EVS, VPC, ELB, AS, and RDS,you can use CES to view the status of service instances withoutinstalling additional plug-ins.
Alarm Adds, views, modifies, deletes, enables, or disables alarm rules.
1.2 FunctionsCES provides the following functions:
Cloud EyeUser Guide 1 Introduction
Issue 05 (2016-12-30) 2

l Automatic monitoring: Monitoring starts automatically after ECSs or scaling groups arecreated. No human intervention or additional plug-ins is required.
After you have obtained resources, you can view monitoring data of instances inInstance Monitoring on the CES console in 5 to 10 minutes, which are required for dataobtaining and rollup.
l Flexible alarm configuration: You can configure alarm rules and thresholds for specificmetrics. You can also disable or enable alarm rules as required.
– When you add an alarm rule, you can select multiple monitored objects for a singlemetric.
– Parameter values configured in an alarm rule can be modified at any time. The newparameter values take effect from the next monitoring interval.
– If the monitored object is not used, you can disable the alarm rule configured for theobject. If the object is used again, you can then enable the alarm rule.
– If the monitored object is not used any longer or has been deleted, you canmanually delete the alarm rule configured for the object.
l Real-time notification: You can enable the alarm notification function to receivenotification short messages and emails, or enable CES to send messages to the server.
– If an alarm is generated, the available data is insufficient for requirements, or analarm is cleared, CES sends notifications to your registered mobile phone or emailbox.
– CES sends only one notification for an alarm even if the alarm is active for a longperiod of time.
l Following Metrics: On the Dashboard page, you can follow metrics. This allows you toview detailed monitoring statistics displayed in charts. You can also stop followingmetrics by deleting them.
l Historical alarms: You can enable the alarm notification function and view historicalalarms in the notification emails or short messages.
1.3 Application Scenarios
Routine Management
CES provides all-around monitoring for your resources, including CPUs, disk I/O, andnetwork traffic, ensuring end-to-end delivery of your services.
Problem Notification
If an alarm is generated, the available data is insufficient for requirements, or an alarm iscleared, CES sends notifications to your registered mobile phone or email box.
Capacity Adjustment
After you configure alarm rules for resource-related metrics, you can obtain information aboutthe running status of monitored objects in a timely manner, and scale up resources if receivingnotifications indicating resource insufficiency.
Cloud EyeUser Guide 1 Introduction
Issue 05 (2016-12-30) 3
1.4 Related Servicesl CES generates alarms that can trigger scaling actions implemented by the AS service.
– The alarm rules configured during AS group creation are synchronized to the CESservice. Then, the CES service generates alarms and sends the alarms to AS forimplementing scaling actions.
– You can create monitoring tasks for metrics of ECS instances providing similarfunctions to enable centralized monitoring of and alarm reporting for the instances.
l You can directly switch to the CES console from the ECS console to view monitoredinformation about specific ECSs.– If an ECS instance stops, becomes faulty, or is deleted, the monitoring data of this
instance cannot be queried on the CES console. If the instance is started again orrecovers, you can view the monitoring data of it again.
– Twenty-four hours after an instance stops or becomes faulty, the CES considers thatthe instance does not exist and no longer monitors the instance. You need tomanually delete the alarm rules configured for the instance.
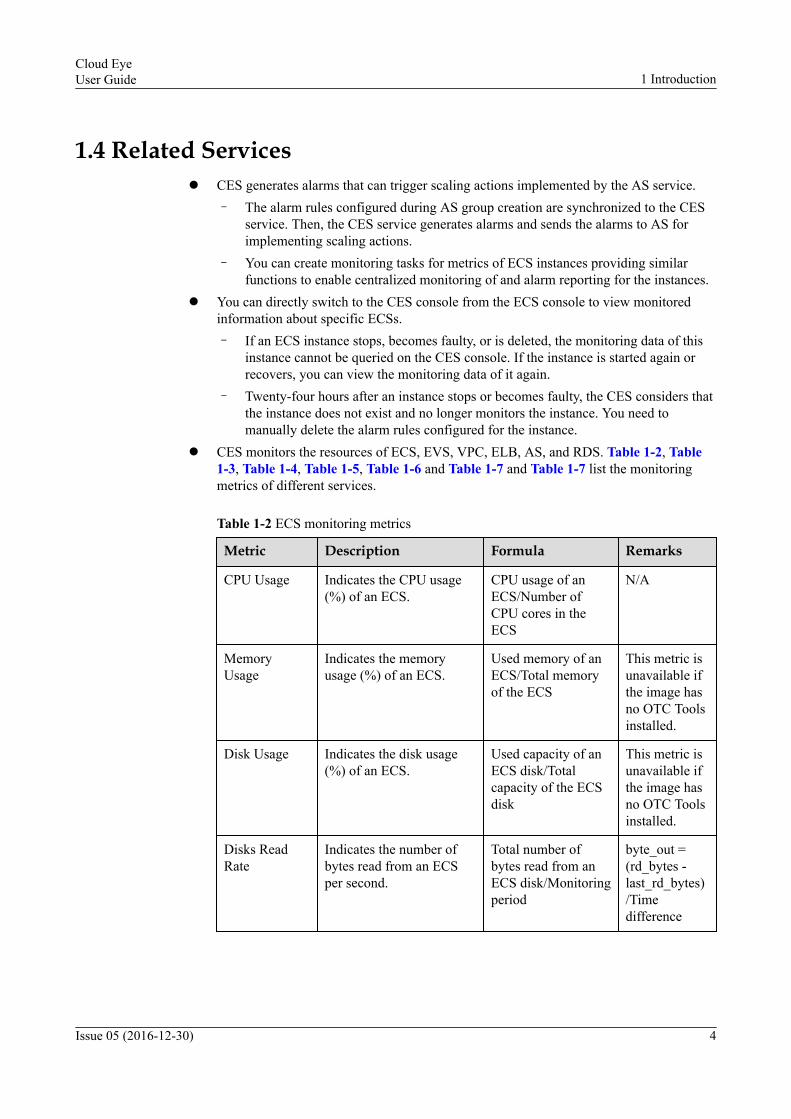
l CES monitors the resources of ECS, EVS, VPC, ELB, AS, and RDS. Table 1-2, Table1-3, Table 1-4, Table 1-5, Table 1-6 and Table 1-7 and Table 1-7 list the monitoringmetrics of different services.
Table 1-2 ECS monitoring metrics
Metric Description Formula Remarks
CPU Usage Indicates the CPU usage(%) of an ECS.
CPU usage of anECS/Number ofCPU cores in theECS
N/A
MemoryUsage
Indicates the memoryusage (%) of an ECS.
Used memory of anECS/Total memoryof the ECS
This metric isunavailable ifthe image hasno OTC Toolsinstalled.
Disk Usage Indicates the disk usage(%) of an ECS.
Used capacity of anECS disk/Totalcapacity of the ECSdisk
This metric isunavailable ifthe image hasno OTC Toolsinstalled.
Disks ReadRate
Indicates the number ofbytes read from an ECSper second.
Total number ofbytes read from anECS disk/Monitoringperiod
byte_out =(rd_bytes -last_rd_bytes)/Timedifference
Cloud EyeUser Guide 1 Introduction
Issue 05 (2016-12-30) 4

Metric Description Formula Remarks
Disks WriteRate
Indicates the number ofbytes written to an ECSper second.
Total number ofbytes written to anECS disk/Monitoringperiod
N/A
Disks ReadRequests
Indicates the number ofread requests sent to anECS per second.
Total number of readrequests sent to anECS disk/Monitoringperiod
req_out =(rd_req -last_rd_req)/Timedifference
Disks WriteRequests
Indicates the number ofwrite requests sent to anECS per second.
Total number ofwrite requests sent toan ECS disk/Monitoring period
req_in =(wr_req -last_wr_req)/Timedifference
InbandIncoming Rate
Indicates the number ofincoming bytes on an ECSper second.
Total number ofinband incomingbytes on an ECS/Monitoring period
N/A
InbandOutgoing Rate
Indicates the number ofoutgoing bytes on an ECSper second.
Total number ofinband outgoingbytes on an ECS/Monitoring period
N/A
OutbandIncoming Rate
Indicates the number ofincoming bytes on an ECSper second at thevirtualization layer.
Total number ofoutband incomingbytes on an ECS/Monitoring period
This metric isunavailable ifSR-IOV isenabled.
OutbandOutgoing Rate
Indicates the number ofoutgoing bytes on an ECSper second at thevirtualization layer.
Total number ofoutband outgoingbytes on an ECS/Monitoring period
This metric isunavailable ifSR-IOV isenabled.
Table 1-3 EVS monitoring metrics
Metric Definition Monitored Object
Formula
Disk ReadRate
This metric is used to show thenumber of bytes read from themonitored object per second(bytes/second).
EVS disks Total number of bytesread from an EVS diskattached to the ECS/Monitoring period
Disk WriteRate
This metric is used to show thenumber of bytes written to themonitored object per second(bytes/second).
EVS disks Total number of byteswritten to an EVS diskattached to the ECS/Monitoring period
Cloud EyeUser Guide 1 Introduction
Issue 05 (2016-12-30) 5

Metric Definition Monitored Object
Formula
Disk ReadRequests
This metric is used to show thenumber of read requests sent tothe monitored object persecond (requests/second).
EVS disks Total number of readrequests sent to an EVSdisk attached to theECS/Monitoring period
Disk WriteRequests
This metric is used to show thenumber of write requests sentto the monitored object persecond (requests/second).
EVS disks Total number of writerequests sent to an EVSdisk attached to theECS/Monitoring period
Table 1-4 VPC monitoring metrics
Metric Definition ValueRange
Monitored Object
Upstreambandwidth
Specifies the outboundnetwork rate of themonitored object.
≥ 0 bit/s Bandwidth or EIP
Downstreambandwidth
Specifies inbound networkrate of the monitored object.
≥ 0 bit/s Bandwidth or EIP
Table 1-5 ELB monitoring metrics
Metric Description
cps This metric is used to show the number of concurrentconnections processed by the monitored object per second(connections/second).
Active Connections This metric is used to show the number of active connectionsprocessed by the monitored object per second (connections/second).
InactiveConnections
This metric is used to show the number of inactive connectionsprocessed by the monitored object per second (connections/second).
New cps This metric is used to show the number of new connectionsprocessed by the monitored object per second (connections/second).
Incoming Packets This metric is used to show the number of incoming packets onthe monitored object per second (packets/second).
Outgoing Packets This metric is used to show the number of outgoing packets onthe monitored object per second (packets/second).
Cloud EyeUser Guide 1 Introduction
Issue 05 (2016-12-30) 6

Metric Description
Inbound Rate This metric is used to show the number of incoming bytes persecond (bytes/second) on the monitored object.
Outbound Rate This metric is used to show the number of outgoing bytes persecond (bytes/second) on the monitored object.
Abnormal Hosts This metric is used to show the number of abnormal backendhosts.
Normal Hosts This metric is used to show the number of normal backendhosts.
Table 1-6 AS monitoring metrics
Metric Description MonitoredObject
Formula
CPU Usage This metric is used toshow CPU usages (%) ofmonitored objects.
AS group CPU usage of all ECSinstances in an ASgroup/Number of CPUcores of all ECSinstances in the ASgroup
MemoryUsage
This metric is used toshow memory usages(%) of monitoredobjects.
AS group Memory usage of allECS instances in an ASgroup/Total memory sizeof all ECS instances inthe AS group
Instance Qty. This metric is used toshow the number ofmonitored objects(count).
ECS instancesin an ASgroup
Total number of ECSinstances in an AS group
Inbound Rate This metric is used toshow the number ofincoming bytes persecond on the monitoredobject. The unit is bytes/second.
AS group (Total incoming bytes ofall ECS instances in anAS group/Total numberof ECS instances in theAS group)/Monitoringperiod
OutboundRate
This metric is used toshow the number ofoutgoing bytes persecond on the monitoredobject. The unit is bytes/second.
AS group (Total outgoing bytes ofall ECS instances in anAS group/Total numberof ECS instances in theAS group)/Monitoringperiod
Cloud EyeUser Guide 1 Introduction
Issue 05 (2016-12-30) 7

Table 1-7 RDS monitoring metrics
Metric Description Value Range MonitoredObject
CPU Usage Measures CPU usages (%) ofmonitored objects.
0 to 100% ECS
MemoryUsage
Measures memory usages (%) ofmonitored objects.
0 to 100% ECS
IOPS Measures the number of I/Ooperations per second on themonitored object. The unit is aninteger.
≥ 0 ECS
NetworkInputThroughput
Measures the number of incomingbytes per second on the monitoredobject. The unit is bytes/second.
≥ 0 bytes/s ECS
NetworkOutputThroughput
Measures the number of outgoingbytes per second on the monitoredobject. The unit is bytes/second.
≥ 0 bytes/s ECS
TotalConnections
Measures the total number ofconnection attempts to theMySQL server. The value is aninteger.
≥ 0 Database
ActiveConnections
Measures the number of activeconnections. The value is aninteger.
≥ 0 Database
QPS Measures the number of SQLstatement queries (including thestorage process) per second.
≥ 0/s Database
TPS Measures the number oftransaction executions (includingtransaction submitting androllback) per second.
≥ 0/s Database
Buffer PoolUsage
Measures the ratio (%) of dirtydata among all data in the InnoDBbuffer.
0 to 100% Database
Buffer PoolHit Rate
Measures the ratio (%) of read hitsto read requests(Innodb_buffer_pool_readsindicates the number of times thatdisks are read).
0 to 100% Database
Buffer PoolDirty BlockRate
Measures the ratio (%) of dirtypages among all pages in thebuffer pool.
0 to 100% Database
Cloud EyeUser Guide 1 Introduction
Issue 05 (2016-12-30) 8

Metric Description Value Range MonitoredObject
InnoDB ReadThroughput
Measures the average number ofread bytes per second for theInnoDB buffer.
≥ 0 bytes/s Database
InnoDBWriteThroughput
Measures the number of writebytes per second for the InnoDBbuffer.
≥ 0 bytes/s Database
File ReadSpeed
Measures the average number oftimes that InnoDB reads files persecond.
≥ 0/s Database
File WriteSpeed
Measures the average number oftimes that InnoDB writes files persecond.
≥ 0/s Database
Log WriteRequestSpeed
Measures the average number oflog write requests per second.
≥ 0/s Database
Log PhysicalWrite Speed
Measures the average number ofphysical writes for log files persecond.
≥ 0/s Database
Log fsync()Write Speed
Measures the average number offsync write requests on log filesper second.
≥ 0/s Database
TemporaryTables Qty
Measures the number oftemporary tables automaticallycreated on hard disks whenMySQL statements are executed.
≥ 0 Database
Key BufferUsage
Measures the MyISAM key bufferusage (%).
0 to 100% Database
Key BufferWrite HitRate
Measures the key buffer write hitusage (%) of MyISAM.
0 to 100% Database
Key BufferRead Hit Rate
Measures the key buffer read hitusage (%) of MyISAM.
0 to 100% Database
MyISAMDisk WriteSpeed
Measures the average number oftimes that indexes are written intodisks per second.
≥ 0/s Database
MyISAMDisk ReadSpeed
Measures the average number oftimes that indexes are read fromdisks per second.
≥ 0/s Database
Cloud EyeUser Guide 1 Introduction
Issue 05 (2016-12-30) 9

Metric Description Value Range MonitoredObject
MyISAMBuffer PoolWrite Speed
Measures the average number ofrequests to write indexes intocache per second.
≥ 0/s Database
MyISAMBuffer PoolRead Speed
Measures the average number ofrequests to read indexes fromcache per second.
≥ 0/s Database
DeleteExecuteSpeed
Measures the average number ofDelete executions per second.
≥ 0/s Database
InsertExecuteSpeed
Measures the average number ofInsert executions per second.
≥ 0/s Database
Insert_SelectExecuteSpeed
Measures the average number ofInsert_Select executions persecond.
≥ 0/s Database
ReplaceExecuteSpeed
Measures the average number ofReplace executions per second.
≥ 0/s Database
Replace_Select ExecuteSpeed
Measures the average number ofReplace_Select executions persecond.
≥ 0/s Database
SelectExecuteSpeed
Measures the average number ofSelect executions per second.
≥ 0/s Database
UpdateExecuteSpeed
Measures the average number ofUpdate executions per second.
≥ 0/s Database
Row DeleteSpeed
Measures the average number ofrows that are deleted from theInnoDB table per second.
≥ 0/s Database
Row InsertSpeed
Measures the average number ofrows that are inserted to theInnoDB table per second.
≥ 0/s Database
Row ReadSpeed
Measures the average number ofrows that are read from theInnoDB table per second.
≥ 0/s Database
Row UpdateSpeed
Measures the number of updatedrows in the InnoDB table persecond.
≥ 0/s Database
Cloud EyeUser Guide 1 Introduction
Issue 05 (2016-12-30) 10

Metric Description Value Range MonitoredObject
Disk Usage Measures the disk usage (%) ofthe monitored object.
0 to 100% ECS
TransactionLogs Usage
Measures the disk capacity usedby transaction logs.
≥ 0 MB Database
ReplicationSlot Usage
Measures the disk capacity usedby replication slot files.
≥ 0 MB Database
DatabaseConnections
Measures the number of databaseconnections in use.
≥ 0 counts Database
MaximumUsedTransactionIDs
Measures the maximumtransaction ID that has been used.
≥ 0 counts Database
TransactionLogsGenerations
Measures the size of transactionlogs generated per second.
≥ 0 MB/s Database
OldestReplicationSlot Lag
Measures the lagging size of themost lagging replica is in terms ofWAL data received.
≥ 0 MB Database
ReplicationLag
Measures the replication lag delay. ≥ 0 ms Database
Cloud EyeUser Guide 1 Introduction
Issue 05 (2016-12-30) 11

2 Getting Started
Adding an Alarm Rule1. Log in to the management console.2. Under Mgmt&Deployment, click Cloud Eye.3. On the Alarm > Alarm Rule page, click Add Alarm Rule.4. On the Add Alarm Rule page, set parameters as prompted, as shown in Table 2-1.
Table 2-1 Parameters
Parameter Description ExampleValue
Name Specifies the name of the alarm rule. Thesystem generates a name randomly and youcan change it.
alarm-b6al
Threshold Specifies the condition for generating thealarm. The threshold consists of rollupmethods (raw datamaximum, minimum,average, and deviation), identificationconditions (>, ≥, <, ≤, and =), and criticalvalue. For example, average value greaterthan 80 is a condition for generating analarm.
80
Description Provides description of the alarm rule. Thisparameter is optional.
N/A
Occurrences Specifies the times for an event. Forexample, if the configured value is n, thesampling points of the alarm rule aresampling points in n consecutive periods.Only when all the sampling points meetalarm conditions configured in the threshold,alarms can be generated.
3
Service Specifies the name of the service for whichan alarm rule is configured.
Elastic CloudServer
Cloud EyeUser Guide 2 Getting Started
Issue 05 (2016-12-30) 12

Parameter Description ExampleValue
Monitoring Interval Specifies the interval at which the alarmstatus is updated based on the alarm rule.
5minutes
Metric Examples are as follows:l CPU Usage
This metric is used to show CPU usages(%) of monitored objects.
l Memory UsageThis metric is used to show memoryusages (%) of monitored objects.
l Disk UsageThis metric is used to show disk usages(%) of monitored objects.
l Disks Read RateThis metric is used to show the numberof bytes read from the monitored objectper second (bytes/second).
l Disks Write RateThis metric is used to show the numberof bytes written to the monitored objectper second (bytes/second).
l Disks Read RequestsThis metric is used to show the numberof read requests sent to the monitoredobject per second (requests/second).
l Disks Write RequestsThis metric is used to show the numberof write requests sent to the monitoredobject per second (requests/second).
l Inband Incoming RateThis metric is used to show the numberof incoming bytes per second (bytes/second) on the monitored object.
l Inband Outcoming RateThis metric is used to show the numberof outgoing bytes per second (bytes/second) on the monitored object.
l Outband Incoming RateThis metric is used to show the numberof incoming bytes per second (bytes/second) in the hypervisor.
l Outband Outcoming RateThis metric is used to show the numberof outgoing bytes per second (bytes/second) in the hypervisor.
N/A
Cloud EyeUser Guide 2 Getting Started
Issue 05 (2016-12-30) 13

Parameter Description ExampleValue
Send Notification Specifies whether to send notification emailsor short messages to users. If you select No,no emails or short messages will be sent tousers. If you select Yes, you need to select orcreate a group. For details, see 5.The system does not support historical alarmquery. Therefore, you are advised to selectYes so that you can query historical alarmsin emails or short messages if necessary. Ifyou select No, you cannot query historicalalarms.
Yes
Dimension Specifies the dimension of monitoringmetrics for the alarm rule.
ECS
Monitored Object Specifies the instance of the alarm rule. Youcan specify one or more monitored objects.
N/A
Trigger Condition Specifies the conditions for triggeringalarms. You can select one or more from thefollowing: Generated alarm, Clearedalarm, and Insufficient data.
N/A
5. Select or create a group.
– Selecting a groupOn the Add Alarm Rule page, select a created group in the Select Group area.
– Create a group.On the Add Alarm Rule page, click Create Group and configure parameters listedin Table 2-2.
Table 2-2 Parameters
Parameter Description Example Value
Name Specifies the name of the created group. N/A
Description Provides description of the created group.This parameter is optional.
N/A
Cloud EyeUser Guide 2 Getting Started
Issue 05 (2016-12-30) 14

Parameter Description Example Value
Send To Specifies the notification destinations. Thevalue can be Email address or Phonenumber.l Email address
You can add multiple email addresses asrequired or delete email addresses notused any longer.If you select Email address, enter theemail address to be used by the group tobe created for notifying users.
l Phone numberYou can add multiple phone numbers asrequired or delete phone numbers notused any longer.If you select Phone number, enter thephone number to be used by the groupto be created for notifying users.
N/A
– Click OK.
– Click following Create Group to modify group configuration. Table 2-3 liststhe parameters on the group management page.
Table 2-3 Managing parameters
Parameter Description Example Value
Name Specifies the name of thecreated group.
N/A
Description Provides description ofthe name of the createdgroup.
N/A
Operation l Modify– Modify
configuration ofexisting groups.
l Delete– Delete existing
groups.
N/A
– On the Add Alarm Rule page, click Notification.
6. Click OK.
Cloud EyeUser Guide 2 Getting Started
Issue 05 (2016-12-30) 15
3 Operation Guide
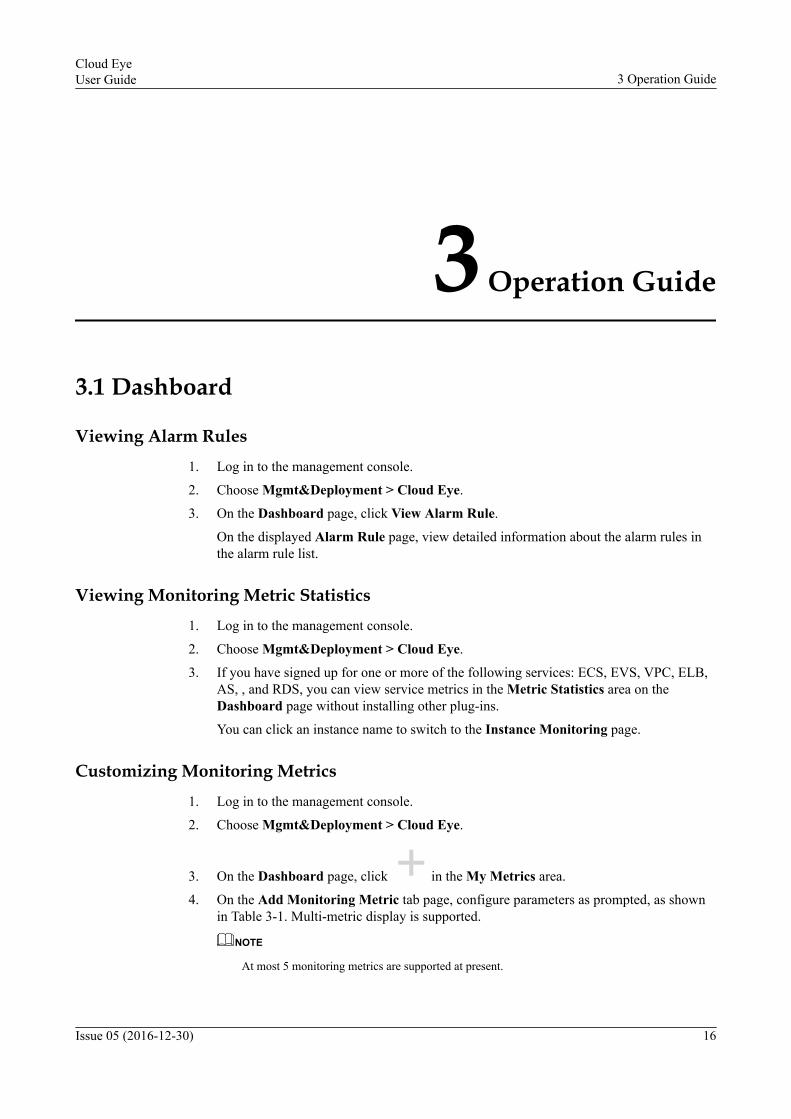
3.1 Dashboard
Viewing Alarm Rules1. Log in to the management console.
2. Choose Mgmt&Deployment > Cloud Eye.
3. On the Dashboard page, click View Alarm Rule.
On the displayed Alarm Rule page, view detailed information about the alarm rules inthe alarm rule list.
Viewing Monitoring Metric Statistics1. Log in to the management console.
2. Choose Mgmt&Deployment > Cloud Eye.
3. If you have signed up for one or more of the following services: ECS, EVS, VPC, ELB,AS, , and RDS, you can view service metrics in the Metric Statistics area on theDashboard page without installing other plug-ins.
You can click an instance name to switch to the Instance Monitoring page.
Customizing Monitoring Metrics1. Log in to the management console.
2. Choose Mgmt&Deployment > Cloud Eye.
3. On the Dashboard page, click in the My Metrics area.
4. On the Add Monitoring Metric tab page, configure parameters as prompted, as shownin Table 3-1. Multi-metric display is supported.
NOTE
At most 5 monitoring metrics are supported at present.
Cloud EyeUser Guide 3 Operation Guide
Issue 05 (2016-12-30) 16

Table 3-1 Parameters
Parameter Description Example Value
Title Specifies the title of thecustomized followedmetric. The name can onlycontain letters, digits,underscores (_), andhyphens (-).
N/A
Service Specifies the service nameof the monitoring metrics.
N/A
Dimension Specifies the dimension ofmonitoring metrics.
N/A
Monitored Object Specifies the monitoredobject of monitoringmetrics.
N/A
Metric Specifies the name ofmonitoring metrics.
N/A
5. Click OK.
After successfully adding the monitoring metrics, you can view corresponding instance
information in the My Metrics area. Click to enlarge the window for viewingdetailed monitoring data.
Viewing Monitoring Metrics in an Enlarged Window
In the My Metrics area, click to view the detailed data and trends of multiple metrics.
On the displayed page, select a time range from the fixed time ranges provided on the page ormanually specify a time range for instance monitoring.
The service allows you to select a fixed time range or customize the time range.
l The fixed time range can be Last 1 hour, Last 3 hours, Last 12 hours, Last 24 hours,Last 7 days, or Last 30 days.– When you select Last 1 hour, the raw metric data is displayed by default.– When you select Last 3 hours, Last 12 hours, Last 24 hours, Last 7 days, or Last
30 days, the rollup metric data is displayed by default.l The customized time range can be any time within the last week.
On the displayed page, monitoring results of followed metrics are displayed in a list bydefault. You can click a monitoring metric to hide its monitoring trend, or click themonitoring metric again to display its monitoring trend.
Modifying Monitoring Metrics
In the My Metrics area, click . On the displayed page, you can modify the title of afollowed metric, delete the original monitoring metric, or select a new one to be viewed.
Cloud EyeUser Guide 3 Operation Guide
Issue 05 (2016-12-30) 17

Deleting Monitoring Metrics
In My Metrics, click and click OK. Then you can delete the custom followed metric.
3.2 Instance MonitoringAfter you have enabled the ECS, EVS, VPC, ELB, AS,, or RDS service, you can viewhistorical performance data of monitored objects of the service on the Instance Monitoringpage. The data is displayed in line charts. The CES service automatically detects and monitorsresources you have obtained. You are not required to install additional plug-ins.
Exporting Monitoring Data1. Log in to the management console.2. Choose Mgmt&Deployment > Cloud Eye.3. Under Instance Monitoring, click Instance Service. On the page displayed, click
Export Monitoring Data.4. On the Export Monitoring Data page shown in Table 3-2, set parameters as prompted.
Table 3-2 Parameters
Parameter Description Example Value
Service Specifies the service namethat corresponds tomonitoring metrics.
Elastic Cloud Server
Dimension Specifies the dimension ofmonitoring metrics.
ECS
Monitored Object Specifies the monitoredobject of monitoringmetrics.
None
Metric Specifies the name ofmonitoring metrics.
Outband Outcoming Rate
5. Click Export.
NOTE
If the lines and columns of the exported monitoring data file exceed the Excel threshold, you areadvised to open it as text.
View the Running Status of a Monitored Object1. Log in to the management console.2. Choose Mgmt&Deployment > Cloud Eye.
3. Under Instance Monitoring, click Instance Service, click in the row that containsthe instance.
Cloud EyeUser Guide 3 Operation Guide
Issue 05 (2016-12-30) 18

4. In the monitoring area, select a time range from the provided ones or manually specify atime range.The service allows you to seclect a fixed time range or customize the time range.– The fixed time range can be Last 1 hour, Last 3 hours, Last 12 hours, Last 24
hours, Last 7 days, or Last 30 days.n When you select Last 1 hour, the raw metric data is displayed by default.n When you select Last 3 hours, Last 12 hours, Last 24 hours, Last 7 days, or
Last 30 days, the rollup metric data is displayed by default.– The customized time range can be any time within the last week.
5. Click in the monitoring area and configure Enable rollup, Period, and Statistic.– Enable rollup indicates the type of the metric data displayed. When you select it,
rolled up data is displayed. When you deselect it, raw data is displayed.– Periodindicates the duration during which raw sample data is collected for rollup.
The value can be 5 minutes, 20 minutes, 1 hour, 4 hours, or 1 day. The Perioddrop-down list provides several recommended values based on the monitoringperiod you have configured.
– Statistic indicates the dimension for data rollup, including the maximum value,minimum value, average value, and variance.
6. On the instance monitoring area, select the monitoring metric to be viewed from thedrop-down list. You can select at most 5 monitoring metrics to view their trends. Underthe instance monitoring area, the details of the selected monitoring metrics are displayedsynchronously in the format of label. You can choose to close the trend of certainmonitoring metrics as required.
3.3 Alarm Rule Management
Adding an Alarm Rule1. Log in to the management console.2. Under Mgmt&Deployment, click Cloud Eye.3. On the Alarm > Alarm Rule page, click Add Alarm Rule.4. On the Add Alarm Rule page, set parameters as prompted, as shown in Table 3-3.
Table 3-3 Parameters
Parameter Description ExampleValue
Name Specifies the name of the alarm rule. Thesystem generates a name randomly and youcan change it.
alarm-b6al
Cloud EyeUser Guide 3 Operation Guide
Issue 05 (2016-12-30) 19

Parameter Description ExampleValue
Threshold Specifies the condition for generating thealarm. The threshold consists of rollupmethods (raw datamaximum, minimum,average, and deviation), identificationconditions (>, ≥, <, ≤, and =), and criticalvalue. For example, average value greaterthan 80 is a condition for generating analarm.
80
Description Provides description of the alarm rule. Thisparameter is optional.
N/A
Occurrences Specifies the times for an event. Forexample, if the configured value is n, thesampling points of the alarm rule aresampling points in n consecutive periods.Only when all the sampling points meetalarm conditions configured in the threshold,alarms can be generated.
3
Service Specifies the name of the service for whichan alarm rule is configured.
Elastic CloudServer
Monitoring Interval Specifies the interval at which the alarmstatus is updated based on the alarm rule.
5minutes
Cloud EyeUser Guide 3 Operation Guide
Issue 05 (2016-12-30) 20

Parameter Description ExampleValue
Metric Examples are as follows:l CPU Usage
This metric is used to show CPU usages(%) of monitored objects.
l Memory UsageThis metric is used to show memoryusages (%) of monitored objects.
l Disk UsageThis metric is used to show disk usages(%) of monitored objects.
l Disks Read RateThis metric is used to show the numberof bytes read from the monitored objectper second (bytes/second).
l Disks Write RateThis metric is used to show the numberof bytes written to the monitored objectper second (bytes/second).
l Disks Read RequestsThis metric is used to show the numberof read requests sent to the monitoredobject per second (requests/second).
l Disks Write RequestsThis metric is used to show the numberof write requests sent to the monitoredobject per second (requests/second).
l Inband Incoming RateThis metric is used to show the numberof incoming bytes per second (bytes/second) on the monitored object.
l Inband Outcoming RateThis metric is used to show the numberof outgoing bytes per second (bytes/second) on the monitored object.
l Outband Incoming RateThis metric is used to show the numberof incoming bytes per second (bytes/second) in the hypervisor.
l Outband Outcoming RateThis metric is used to show the numberof outgoing bytes per second (bytes/second) in the hypervisor.
N/A
Cloud EyeUser Guide 3 Operation Guide
Issue 05 (2016-12-30) 21
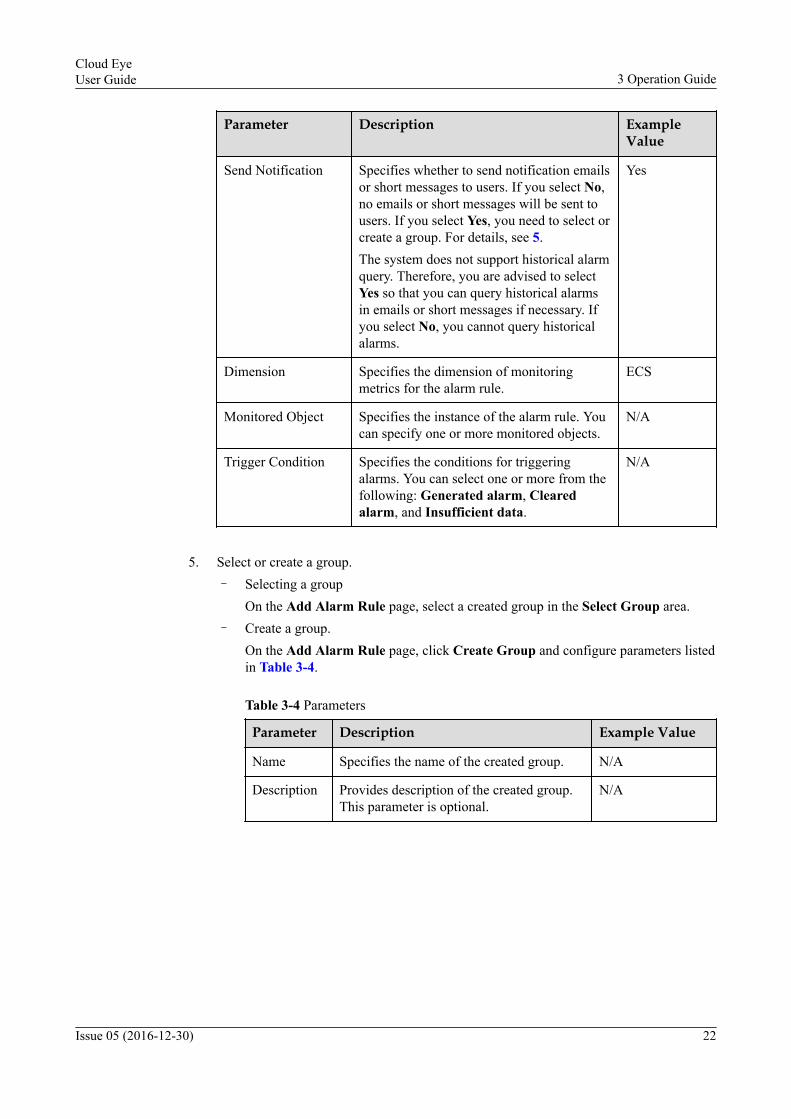
Parameter Description ExampleValue
Send Notification Specifies whether to send notification emailsor short messages to users. If you select No,no emails or short messages will be sent tousers. If you select Yes, you need to select orcreate a group. For details, see 5.The system does not support historical alarmquery. Therefore, you are advised to selectYes so that you can query historical alarmsin emails or short messages if necessary. Ifyou select No, you cannot query historicalalarms.
Yes
Dimension Specifies the dimension of monitoringmetrics for the alarm rule.
ECS
Monitored Object Specifies the instance of the alarm rule. Youcan specify one or more monitored objects.
N/A
Trigger Condition Specifies the conditions for triggeringalarms. You can select one or more from thefollowing: Generated alarm, Clearedalarm, and Insufficient data.
N/A
5. Select or create a group.
– Selecting a groupOn the Add Alarm Rule page, select a created group in the Select Group area.
– Create a group.On the Add Alarm Rule page, click Create Group and configure parameters listedin Table 3-4.
Table 3-4 Parameters
Parameter Description Example Value
Name Specifies the name of the created group. N/A
Description Provides description of the created group.This parameter is optional.
N/A
Cloud EyeUser Guide 3 Operation Guide
Issue 05 (2016-12-30) 22

Parameter Description Example Value
Send To Specifies the notification destinations. Thevalue can be Email address or Phonenumber.l Email address
You can add multiple email addresses asrequired or delete email addresses notused any longer.If you select Email address, enter theemail address to be used by the group tobe created for notifying users.
l Phone numberYou can add multiple phone numbers asrequired or delete phone numbers notused any longer.If you select Phone number, enter thephone number to be used by the groupto be created for notifying users.
N/A
– Click OK.
– Click following Create Group to modify group configuration. Table 3-5 liststhe parameters on the group management page.
Table 3-5 Managing parameters
Parameter Description Example Value
Name Specifies the name of thecreated group.
N/A
Description Provides description ofthe name of the createdgroup.
N/A
Operation l Modify– Modify
configuration ofexisting groups.
l Delete– Delete existing
groups.
N/A
– On the Add Alarm Rule page, click Notification.
6. Click OK.
Disabling an Alarm RuleOn the Alarm Rule page, locate the row that contains the alarm rule and click Disable in theOperation column. Then click OK.
Cloud EyeUser Guide 3 Operation Guide
Issue 05 (2016-12-30) 23

Enabling an Alarm RuleOn the Alarm Rule page, locate the row that contains the alarm rule and click Enable in theOperation column. Then click OK.
Alarm rules are enabled by default after they are added.
Modifying an Alarm Rule1. On the Alarm Rule page, click the name of the rule to be modified. On the Basic Info
page displayed, click Modify.2. In the Modify Alarm Rule dialog box, modify the parameters of the alarm rule, as listed
in Table 3-6.
Table 3-6 Parameters
Parameter Description ExampleValue
Name Specifies the name of the alarm rule. Thesystem generates a name randomly and you canchange it.
alarm-b6al
Threshold Specifies the condition for generating thealarm. The threshold consists of rollup methods(maximum, minimum, average, and deviation),identification conditions (>, ≥, <, ≤, and =), andcritical value. For example, average valuegreater than 80 is a condition for generating analarm.
80
Description Provides description of the alarm rule. Thisparameter is optional.
N/A
Occurrences Specifies the times for an event. For example,if the configured value is n, the sampling pointsof the alarm rule are sampling points in nconsecutive periods. Only when all thesampling points meet alarm conditionsconfigured in the threshold, alarms can begenerated.
3
Service Specifies the name of the service for which analarm rule is configured.
Elastic CloudServer
Monitoring Interval Specifies the interval at which the alarm statusis updated based on the alarm rule.
5minutes
Cloud EyeUser Guide 3 Operation Guide
Issue 05 (2016-12-30) 24

Parameter Description ExampleValue
Metric Examples are as follows:l CPU Usage
This metric is used to show CPU usages (%)of monitored objects.
l Memory UsageThis metric is used to show memory usages(%) of monitored objects.
l Disk UsageThis metric is used to show disk usages (%)of monitored objects.
l Disks Read RateThis metric is used to show the number ofbytes read from the monitored object persecond (bytes/second).
l Disks Write RateThis metric is used to show the number ofbytes written to the monitored object persecond (bytes/second).
l Disks Read RequestsThis metric is used to show the number ofread requests sent to the monitored objectper second (requests/second).
l Disks Write RequestsThis metric is used to show the number ofwrite requests sent to the monitored objectper second (requests/second).
l Inband Incoming RateThis metric is used to show the number ofincoming bytes per second (bytes/second)on the monitored object.
l Inband Outcoming RateThis metric is used to show the number ofoutgoing bytes per second (bytes/second) onthe monitored object.
l Outband Incoming RateThis metric is used to show the number ofincoming bytes per second (bytes/second) inthe hypervisor.
l Outband Outcoming RateThis metric is used to show the number ofoutgoing bytes per second (bytes/second) inthe hypervisor.
N/A
Send Notification Specifies whether to notify users by emails orshort messages. Select No.
N/A
Cloud EyeUser Guide 3 Operation Guide
Issue 05 (2016-12-30) 25

Parameter Description ExampleValue
Dimension Specifies the dimension of monitoring metricsfor the alarm rule.
ECS
Monitored Object Specifies the instance of the alarm rule. Youcan specify one or more monitored objects.
N/A
3. Click OK.
Deleting an Alarm Rule1. On the Alarm Rule, locate the row that contains the alarm rule to be deleted and click
Delete.2. Click OK.
Viewing Historical AlarmsTo view historical alarms, perform the following operations:
1. On the Alarm Rule page, click the name of the target alarm rule to view the AlarmHistory information.
2. You can view the historical alarms within the latest seven days. On the Alarm Historypage, select the time range as required.
3. On the right of the time range area, select All statuses, Alarm, OK and Insufficientdata to view the alarms in each status.
Modifying an Alarm Group
1. On the Add Alarm Rule page, click Yes following Send Notification. Click following Create Group. In the Operation column on the displayed GroupManagement page, click Modify.
2. On the Modify Group page shown in Table 3-7, set parameters as prompted.3. Click OK.
Table 3-7 Parameters
Parameter Description Example Value
Name Specifies the name of the created group. N/A
Description Provides description of the created group.This parameter is optional.
N/A
Cloud EyeUser Guide 3 Operation Guide
Issue 05 (2016-12-30) 26

Parameter Description Example Value
Send To Specifies the notification destinations. Thevalue can be Email address or Phonenumber.l Email address
You can add multiple email addresses asrequired or delete email addresses not usedany longer.If you select Email address, enter theemail address to be used by the group to becreated for notifying users.
l Phone numberYou can add multiple phone numbers asrequired or delete phone numbers not usedany longer.If you select Phone number, enter thephone number to be used by the group tobe created for notifying users.
N/A
Delete an Alarm Group
1. On the Add Alarm Rule page, click Yes following Send Notification. Click following Create Group. In the Operation column on the displayed GroupManagement page, click Delete.
2. Click OK.
Cloud EyeUser Guide 3 Operation Guide
Issue 05 (2016-12-30) 27

4 FAQs
4.1 What Is Cloud Eye?Cloud Eye (CES) is an open monitoring platform that provides monitoring, alarm reporting,and alarm notification for your resources near real time. CES monitors metrics of ElasticCloud Server (ECS), Elastic Volume Service (EVS), Virtual Private Cloud (VPC), ElasticLoad Balance (ELB), Auto Scaling (AS), and Relational Database Service (RDS). You canadd alarm rules and configure alarm notification policies to learn the running status andperformance of the monitored objects in a timely manner.
Table 4-1 describes the functions provided by CES.
Cloud EyeUser Guide 4 FAQs
Issue 05 (2016-12-30) 28

Table 4-1 CES functions
Function Description
Dashboard Displays the number of metrics of each service monitored by CES. Youcan follow the metrics you are concerned about or stop followingindividual metrics by deleting them.The service metrics to choose from are as follows:l ECS: CPU Usage, Disks Read Rate, Disks Read Requests, Disk
Usage, Disks Write Rate, Disks Write Requests, Memory Usage,Inband Incoming Rate, Inband Outgoing Rate, Outband IncomingRate, and Outband Outgoing Rate
l EVS: Disks Read Rate, Disks Write Rate, Disks Read Requests, andDisks Write Requests
l AS: CPU Usage, Memory Usage, Instance Qty., Inbound Rate, andOutbound Rate
l ELB: cps, Active Connections, Inactive Connections, New cps,Inbound Packets, Outbound Packets, Inbound Rate, Outbound Rate,Abnormal Hosts, and Normal Hosts
l VPC: Upstream Bandwidth and Downstream Bandwidthl RDS: Disk Usage, CPU Usage, Memory Usage, Input/output
operations per second (IOPS), Network Input Throughput, NetworkOutput Throughput, Total Connections, Active Connections, QueryPer Second (QPS), transactions per second (TPS), Buffer PoolUsage, Buffer Pool Hit Rate, Buffer Pool Dirty Block Rate, InnoDBRead Throughput, InnoDB Write Throughput, File Read Speed, FileWrite Speed, Log Write Request Speed, Log Physical Write Speed,Log fsync() Write Speed, Temporary Tables Qty, Key Buffer Usage,Key Buffer Write Hit Rate, Key Buffer Read Hit Rate, MyISAMDisk Write Speed, MyISAM Disk Read Speed, MyISAM BufferPool Write Speed, MyISAM Buffer Pool Read Speed, DeleteExecute Speed, Insert Execute Speed, Insert_Select Execute Speed,Replace Execute Speed, Replace_Select Execute Speed, SelectExecute Speed, Update Execute Speed, Row Delete Speed, RowInsert Speed, Row Read Speed, Row Update Speed, TransactionLogs Usage, Replication Slot Usage, Database Connections,Maximum Used Transaction Ids, Transaction Logs Generations,Oldest Replication Slot Lag, and Replication Lag
Instancemonitoring
Shows the status of service instances. If you have signed up for one ormore of the following services: ECS, EVS, VPC, ELB, AS, and RDS,you can use CES to view the status of service instances withoutinstalling additional plug-ins.
Alarm Adds, views, modifies, deletes, enables, or disables alarm rules.
4.2 Is CES Charged?CES is currently free of charge.
Cloud EyeUser Guide 4 FAQs
Issue 05 (2016-12-30) 29

4.3 Which Metrics Can Be Monitored by CES?Table 4-2 lists the monitoring metrics supported by CES.
Table 4-2 Monitoring metrics
Service Monitoring Metrics
Metric Name
ECS 11 CPU Usage, Disks Read Rate, Disks Read Requests, DiskUsage, Disks Write Rate, Disks Write Requests, MemoryUsage, Inband Incoming Rate, Inband Outgoing Rate,Outband Incoming Rate, and Outband Outgoing Rate
EVS 4 Disks Read Rate, Disks Write Rate, Disks ReadRequests, and Disks Write Requests
AS 5 CPU Usage, Memory Usage, Instance Qty., InboundRate, and Outbound Rate
ELB 10 cps, Active Connections, Inactive Connections, New cps,Inbound Packets, Outbound Packets, Inbound Rate,Outbound Rate, Abnormal Hosts, and Normal Hosts
VPC 2 Upstream Bandwidth and Downstream Bandwidth
RDS 46 Disk Usage, CPU Usage, Memory Usage, IOPS, NetworkInput Throughput, Network Output Throughput, TotalConnections, Active Connections, QPS, TPS, Buffer PoolUsage, Buffer Pool Hit Rate, Buffer Pool Dirty BlockRate, InnoDB Read Throughput, InnoDB WriteThroughput, File Read Speed, File Write Speed, LogWrite Request Speed, Log Physical Write Speed, Logfsync() Write Speed, Temporary Tables Qty., Key BufferUsage, Key Buffer Write Hit Rate, Key Buffer Read HitRate, MyISAM Disk Write Speed, MyISAM Disk ReadSpeed, MyISAM Buffer Pool Write Speed, MyISAMBuffer Pool Read Speed, Delete Execute Speed, InsertExecute Speed, Insert_Select Execute Speed, ReplaceExecute Speed, Replace_Select Execute Speed, SelectExecute Speed, Update Execute Speed, Row DeleteSpeed, Row Insert Speed, Row Read Speed, and RowUpdate Speed Transaction Logs Usage, Replication SlotUsage, Database Connections, Maximum UsedTransaction Ids, Transaction Logs Generations, OldestReplication Slot Lag, and Replication Lag
4.4 What Alarm Status Does CES Support?CES supports three alarm status: Alarm, OK, and Insufficient data.
Cloud EyeUser Guide 4 FAQs
Issue 05 (2016-12-30) 30

l If an alarm rule is disabled, its alarm status is considered as invalid, and two dashes (--)are displayed.
l Insufficient data is typically caused by ECS stopping or deletion.
4.5 What Is an Alarm Notification? How Many Types ofAlarm Notifications Exist? How Can I Configure Them?
Alarm notifications are actions that the system takes when the alarm status of an alarm rule ischanged. You can configure alarm notifications when creating or modifying an alarm rule.You can also disable alarm notifications.
CES supports the following two alarm notification types:
l Sends notification emails or short messages to users.l Triggers automatic capacity expansion and reduction by interworking with the AS
service.
4.6 How to Add Customized Monitoring Metrics?
On the Dashboard page, click in the My Metrics area. On the Add MonitoringMetric page, select the followed metrics as prompted.
4.7 Why Are the Network Traffic Metrics in CES Differentfrom Those in ECS Detected by the Tool?
The sample data collection interval in the CES is different from that used by the metricmonitoring tool in the ECS.
The CES collects ECS and EVS data at a 4-minute interval. However, the metric monitoringtool in the ECS collects the data at a 1-second interval.
A longer data collection interval causes distortion of data generated during a short period oftime. Therefore, CES is suitable for long-term website monitoring and monitoring ofapplications running on ECSs.
Furthermore, you can configure alarm thresholds so that alarms can be generated in the eventof resource exceptions or insufficiency, improving resource reliability.
4.8 What Is Rollup?Rollup is the process by which CES calculates the average, maximum, minimum, andvariance values based on sample raw data collected in different periods. The calculationperiod is called a rollup period.
Rollup is a smooth calculation process. The longer the rollup interval, the more smoothlyprocessing will be implemented, and the more accurate the generated data for trend predictionand statistics will be. The shorter the rollup interval is, the more accurate the generated datafor alarm reporting will be.
Cloud EyeUser Guide 4 FAQs
Issue 05 (2016-12-30) 31
The rollup period can be 5 minutes, 20 minutes, 1 hour, 4 hours, and 1 day.
The methods CES uses to process collected data vary depending on the data type:
l If the data is an integer, the data will be rounded.l If the data is a decimal fraction, two decimal places will be retained. Any further decimal
places will be rounded.
For example, the instance quantity in AS is an integer. If the rollup interval is 5 minutes, andthe values of the collected metrics data are 1 and 4, respectively, the average value is[(1+4)/2] = 2, rather than 2.5.
You can choose the CES mode based on the characteristics of the rollup to meet your servicerequirements.
4.9 How Long Is Metric Data Retained?Metric data includes original metric data and rollup metric data.
l Original metric data is sample raw data and is generally retained for two days.l Rollup metric data is data aggregated based on original metric data. The retention
durations for rollup metric data vary depending on the rollup period.– Metric data whose rollup period is 5 minutes is retained for 10 days.– Metric data whose rollup period is 20 minutes is retained for 20 days.– Metric data whose rollup period is 1 hour is retained for 155 days.– Metric data whose rollup period is 4 hours is retained for 300 days.– Metric data whose rollup period is 1 day is retained for 5 years.
If a resource instance is stopped, closed, or deleted, an original metric will be deleted onehour after its original data is not reported for one hour. After the metric data report resumes,the historical data of the metric is available.
4.10 What Are the Effects on ECS Monitoring Metrics IfOTC Tools Is Not Installed on ECSs?
If OTC tools is not installed on ECSs, CES can monitor the outband incoming rate andoutband outgoing rate. However, it cannot monitor the memory usage, disk usage, inbandincoming rate, and inband outgoing rate metrics, which reduces data accuracy of CPU usage.
For details about ECS monitoring metrics supported by CES, see ECS monitoring metrics.
4.11 How Can I Export Monitoring Data?On the CES dashboard page, choose Instance Monitoring and click Export MonitoringData. Select Service, Monitored Object, and Metric as prompted. Click Export.
l The first row of the report indicates the metric collection time expressed in Unixtimestamp, and the second row indicates the metric data.
l If you need to convert the time in Unix timestamp to the time of the target time zone,perform the following steps:
Cloud EyeUser Guide 4 FAQs
Issue 05 (2016-12-30) 32

a. Use Excel to open a .csv file.b. Use the following formula to convert the time:
Target time = (Unix timestamp/1000 + (target time zone)*3600)/86400 + 70*365+ 19
c. Set the cell format to Date.For example, the Unix timestamp is 1475918112000 and the target time is Beijingtime. Beijing is located in the UTC+8 time zone. Therefore, the target time =(1475918112000/1000 + (+8)*3600)/86400 + 70*365 + 19. Set the cell format todate and select such format as 2016/3/14 13:30. Then, the final time is obtained,that is 2016/10/8 17:15.
4.12 How Many Rollup Methods Does CES Support?CES supports the following four rollup methods:
l AverageAverage value of metric data within a rollup period
l MaximumMaximum value of metric data within a rollup period
l MinimumMinimum value of metric data within a rollup period
l VarianceDeviation value of metric data within a rollup period
Cloud EyeUser Guide 4 FAQs
Issue 05 (2016-12-30) 33

A Change History
Released On Description
2016-12-30 This issue is the fifth official release, whichincorporates the following change:Added the monitoring metricscustomization function.
2016-11-24 This issue is the fourth official release,which incorporates the following change:Added the historical alarm viewingfunction.
2016-10-19 This issue is the third official release, whichincorporates the following change:Deleted RTS monitoring metrics.
2016-07-15 This issue is the second official release,which incorporates the following change:Added RDS monitoring metrics.
2016-03-14 This issue is the first official release.
Cloud EyeUser Guide A Change History
Issue 05 (2016-12-30) 34

B Glossary
For details about the terms involved in this document, see Glossary.
Cloud EyeUser Guide B Glossary
Issue 05 (2016-12-30) 35