Embed Size (px)
Citation preview

FluoroPlex 1
User's Guide
FluoroPlex

2 FluoroPlex
Copyright 2012 IonOptix, all rights reserved.
FluoroPlex is a trademark of IonOptix.
Manual Revision 8
February 4, 2012
address: IonOptix
309 Hillside Street
Milton, MA 02186
phone:
fax:
email:
web:
617-696-7335
617-698-3553
www.ionoptix.com

FluoroPlex 3
Contents
Introduction 4
Overview ................................................................................................................................... 4 FluoroPlex Components ............................................................................................................ 5
Hardware 6
Hardware Overview ................................................................................................................... 6 Hardware Operation ................................................................................................................... 9
Software 16
Software Overview .................................................................................................................. 16 Software Operation .................................................................................................................. 18
Appendix 23
Application Notes 24
Hardware Adjustments ............................................................................................................ 24 Background Subtraction .......................................................................................................... 27

4 FluoroPlex
Introduction
Overview For many years, a vast number of tissue and whole organ experiments have been
done in water-jacketed tissue chambers. These experiments can be as simple as the
measurement of force generated by smooth or striated muscle tissue or as elaborate
as monitoring the EKG and chamber pressures from a beating heart. Multiple
preparations are often examined simultaneously and it is not uncommon to arrange
arrays of 4 or even 8 tissue chambers to increase data throughput. With the
introduction of the IonOptix FluoroPlex, it is now possible to add fluorescence ion
recording to tissue bath experiments in parallel with force, pressure, or other
measurements. The ability to monitor regulatory intracellular ion levels promises to
advance the insights revealed by this workhorse methodology.
The FluoroPlex epifluorescence illumination and detection assembly lies at the heart
of the complete FluoroPlex Tissue Bath Fluorometry System. The system includes
not only the FluoroPlex but also a suite of force transducer/ amplifier combinations
and specially-designed tissue baths built by Radnoti Glass Technologies Inc. to
accommodate the solution-resistant tip of our liquid light guides. The complete
system also includes an optional light-tight enclosure to house the Radnoti baths and
stand, as well as an optional Radnoti thermo circulator. Data is handled by the
optional ADInstruments PowerLab interface and LabChart and Scope software. The
FluoroPlex System allows fast fluorescence recordings from multiple tissue baths
with simultaneous force measurements. Sampling occurs via two modes: burst and
continuous. Burst mode sampling occurs at 1000 Hz with single wavelength
excitation and 250 Hz with dual excitation. Continuous mode ratiometric sampling
occurs at up to 14 Hz for four baths. Sampling modes, frequencies, duration and
associated tasks such as signal averaging and background collection are programmed
within a simple user interface.

FluoroPlex 5
FluoroPlex Components
FluoroPlex base unit
The FluoroPlex base unit consists of an LED based light source, a light-multiplexing
assembly, the MultiPlexer, and a photodiode based light detector. Excitation light
emerges from the MultiPlexer through one of up to eight quartz liquid light guides
(LLGs). Fluorescence emission light is collected through the LLGs and
subsequently steered and filtered before collection by the photodiode sub-system.
FluoroPlex Controller
The control unit coordinates the excitation light, tissue bath path selection, and data
collection. The stand-alone controller features a digital interface for programming
collection. Outputs include a digital TTL sync, two raw analog channels and eight
analog data channels.
Optics
Emission filters and dichroic mirrors are included with each system. The
specification of these is dependent on the fluorophore to be interrogated.
Liquid Light Guides
The LLG fits into the Radnoti Quick Disconnect fittings to insure a convenient, leak-
resistant connection.
Radnoti and ADI Components
The FluoroPlex System includes Radnoti force transducer and amplifier
combinations as well as tissue baths that have been specially adapted for use with
this system. Radnoti also produces the optional light tight enclosure and
thermocirculator. The complete system with data recording also includes
ADInstruments PowerLab USB interface and LabChart and Scope software. Please
see the appropriate manufacturer’s documentation accompanying the system for
proper use of this equipment.

6 FluoroPlex
Hardware
Hardware Overview
Light Paths: -- Path 1 -- Path 2 -- Path 1 or 2 – Emission
Excitation Source (top)
Bath Multiplexer
To Tissue Baths 5-8
Tissue Baths 1-4
Emission Filter Block (side)
Sensor

FluoroPlex 7
Excitation Source Overview
Two LEDs selected for their wavelengths are mounted underneath the FluoroPlex
lid. A dichroic mirror steers the light from both LEDs into the MultiPlexer by a
vertically reflecting dichroic.
MultiPlexer Overview
The MultiPlexer consists of a mirror mounted on a micro-stepping motor. The
mirror steers focused light into one of up to eight available light guides. Excitation
light emerging from the light guide directly illuminates the sample. Light is then
collected through the same light guide and reflected by the MultiPlexer mirror back
into the FluoroPlex.
Emission Filter Block (side)
Light Paths: -- Path 1 -- Path 2 -- Path 1 or 2 – Emission

8 FluoroPlex
Emission Overview
Emission light passes through the vertically reflecting dichroic and is steered through
an emission filter before encountering the photodiode. The photodiode’s output is
sent to and processed by the FluoroPlex Controller.
Processing and Analog Output Overview
The FluoroPlex controller collects and integrates the photodiode output for a
millisecond, performs desired calculations, and outputs analog voltages to be
recorded by any analog data collection system.
CE and ROHS
This device has been designed and manufactured to be ROHS compliant and meet
CE requirements.
Emission Filter Block (side)
Light Paths: -- Path 1 -- Path 2 -- Path 1 or 2 – Emission

FluoroPlex 9
Hardware Operation Most aspects of the FluoroPlex hardware operation are controlled through the
software that has been loaded onto the FluoroPlex Controller. Please refer to the
Software Operation section for proper operation of the FluoroPlex hardware.
FluoroPlex Controller
The controller box has a simple LCD display and knob which turns to scroll and
clicks to select. It has one digital TTL output, 2 raw analog outputs, and 8 analog
data outputs. It also has a 25 pin connector to be used with the custom FPX cable for
bringing power and communication to the Optics Box.
FluoroPlex Control Box
Digital Output
A TTL pulse output allows synchronization with external hardware. The TTL rising
edge is hardware-locked in both Continuous and Burst modes. A TTL output can be
coordinated with one of four hardware events: (1) at the beginning of an experiment
protocol, (2) at the beginning of an acquisition cycle when the MultiPlexer is
positioned at the first bath, (3) accompanying each move to a new bank, or (4)
accompanying the output of each new data point. The nature of the investigation and
capability of available external hardware to receive TTL pulses will dictate the user’s
choice of the above options.

10 FluoroPlex
Control Box Back Panel
Analog Outputs
There are 10 analog output BNCs on the back of the FluoroPlex Control Box. The
12-bit analog outputs are single ended with a range of 0 to +5V. Eight are the Bath
Outputs. The numbers correlate to the MultiPlexer positions the baths are connected
to. (Bath 1 correlates with the white triangle on the MultiPlexer and the bath number
increases by adjacent positions of the MultiPlexer). Excitation type, background
subtraction, output configuration and averaging all affect the calculated data
emerging from these 8 BNCs. This voltage range is mapped to a default ratio range
of 0-10 in the case of the data outputs for dual excitation. There are two Raw
outputs. Num/Sing is the output correlating with the Path 1 LED, which is the signal
pathway for single excitation experiments and the numerator value for dual
excitation experiments. Den correlates with the Path 2 LED, which is inactive for
single excitation experiments and the denominator value for dual excitation
experiments. Background subtraction, output configuration and averaging do NOT
affect the raw data emerging from these 2 BNCs. The bank these signals correlate to
is set by the Lock Raw line on the Run Menu (See Software).
Optics Box Connection
A custom 25 pin D-Sub cable carries power and communication signals between the
Control Box and Optics Box.
Power Entry
The Control Box is compatible with both 120V/60Hz and 240V/50Hz AC standards.
Fuses are accessible with the use of a small flat head screwdriver in the power entry
unit. Fuses should be replaced with 5X20mm, 3A, slow blow fuses if necessary.

FluoroPlex 11
FluoroPlex Optics Box
There are four lockable dials on the FluoroPlex Optics Box that are available for the
adjustment of the LEDs’ brightness and the photodiode’s gain and offset. All other
hardware control is handled through the FluoroPlex Controller interface. Please see
the section on the Hardware Control Menu to learn about gaining direct access to
LED and bank control and the photodiode readout. See the Edit Protocol Menu
section to learn about setting up the run time protocol.
Power should be applied to the Optics box at least ten minutes before data collection
begins to allow the output of the sensor electronics to warm up and stabilize.
Optics Box
To FluoroPlex Controller
Only the IonOptix custom cable that is shipped with the system should be used to
connect the FluoroPlex Optics Box to the Controller.
To Optical MultiPlexer
The MultiPlexer 9-pin cable should be plugged into this connector.

12 FluoroPlex
Excitation Intensity Control
Excitation Intensity Control Dials
The dial labeled “Path 1” controls the LED used to create the numerator in
ratiometric measurements and the output signal in single excitation measurements.
“Path 2” is unused in single excitation experiments and creates the denominator
value in dual excitation experiments. See the Hardware Adjustments App Note for
further discussion.
Sensor Control
Sensor Gain and Offset Control Dials
The photodiode “Gain” knob controls the amplification of the signal produced by the
photodiode. There are some cases when the background signal from auto fluorescent
tissue components is expected to be high relative to the signal. There is also a small
dark signal produced by the hardware itself. The “Offset” adjustment is intended to
allow the user to subtract off this baseline in order to focus in on the region of
interest. See the Hardware Adjustments App Note for further discussion.

FluoroPlex 13
Emissions Optics
Emissions Optics
The emissions optics come assembLED onto a 2X4 inch plate that is labeled with the
intended dye and mounted onto the side of the Optics Box.
Excitation Source
Excitation Source and Optics
The LEDs and excitation optics are mounted onto the lid, which is labeled with the
intended dye. The 5 pins on the lid’s wiring harnesses should be plugged into Optics
Box wires of the matching color (Red = 12V, Green = GND, Blue = Path 1 signal,
Gray = Path 2 signal) that are thread into the upper compartment of the Optics Box.

14 FluoroPlex
Optical MultiPlexer
MultiPlexer
The set screws securing the light guides are only accessible when the MultiPlexer is
removed from the lid. A white triangle marks bank position #1. Insert the light
guides with their spacers into the available spots, starting with position 1 and secure
them with set screws using a .050 hex driver. Secure blockers into any remaining
positions to minimize unwanted background noise.
The MultiPlexer should then be inserted into the MultiPlexer mounting block on the
lid, plugged into the Optics Box connector labeled “To Optical MultiPlexer”, and
then secured by tightening the set screw on the side of the mounting block using a
5/64 hex driver.
It will zero automatically when the Control Box is powered on.

FluoroPlex 15
Liquid Light Guides
The light guide tip should be positioned such that it abuts the specimen under
investigation. A black threaded collar screws onto the bath’s FluoroPort to affix and
seal the septum. A set screw fastens the collar and locks the position of the light
guide.
Radnoti bath with FluoroPort and LLG (The collar and fastening screw are
highlighted.)
The LLG’s accompanying the FluoroPlex system are designed to withstand saline
solution. Care should be taken to clean the tip to remove salt and protein at the end
of data collection. Please rinse the tip with DI water several times, followed by 70%
ethanol. Dry the tip carefully with objective lens paper to prevent scratching the
quartz.

16 FluoroPlex
Software
Software Overview The FluoroPlex’s intelligent control provides a simple means to execute
experimental programs as well as background collection and signal averaging tasks.
Continuous Mode
Continuous Mode will constantly monitor fluorescence from multiple baths, ideal for
high-throughput calcium recordings of multiple smooth muscle baths. In the
Continuous Mode, data will be collected at a certain bank for a user-specified time
(milliseconds). This data is averaged and output as a single data point before the
FluoroPlex switches to the next bank. Signal averaging is an effective means of
reducing signal noise when fluorescence changes are slow enough to allow it. It
takes approximately 70 ms to complete ratiometric data collection from 4 banks if
only 1ms of data is collected per bank; i.e., no averaging. A 10Hz data rate allows 4
averaged points per bank for a 4-bank system. It is also possible to select slower
data rates if minimizing bleaching is necessary. Analog data will be updated
immediately at the end of the data collection at that bank, and the value will be held
until the new data for that particular bank is ready.
Analog output for bank 1
Analog output for bank 2
Analog output for bank 3
Analog output for bank 4
shows sampling of 5 data points to be averaged
(DR 12.9 Hz)
78 msec period
Gate End of Cycle
Continuous Mode

FluoroPlex 17
Burst Mode
Burst Mode is ideally suited for monitoring fast changes in fluorescence, such as
calcium transients in striated muscle. In Burst Mode, data is collected at each bank
for a specified number of seconds. Each data point taken is immediately available on
the analog output for that bank allowing data collection at 250 Hz for dual excitation
or 1000 Hz for single excitation. Banks that are not currently collecting data will
have their outputs set to the lowest value to make differentiating the active bank
from inactive banks easier.
Background Collection
Prior to data collection, background signals should be collected for each tissue bank.
64 data points will be collected and averaged to calculate Numerator and
Denominator values for each bank. These values will be stored and subtracted from
the signal values prior to ratio calculation (Dual excitation mode) or conversion to
analog representation (Single excitation mode). See the Background Collection App
Note for further discussion.
Analog output for bank 1
Analog output for bank 2
(DR 250 Hz)
5 sec Aq Time
Gate Start of Bank
Burst Mode
18 FluoroPlex
Software Operation
There are several options/controls available to the user through the interface.
Turning the knob performs scrolling and adjustment functions and pushing in the
knob (“clicking”) performs a select/confirm function. There is the Main Menu and
four submenus: the Run Menu, the Edit Menu, the Background Menu and the
Hardware Menu.
Main Menu
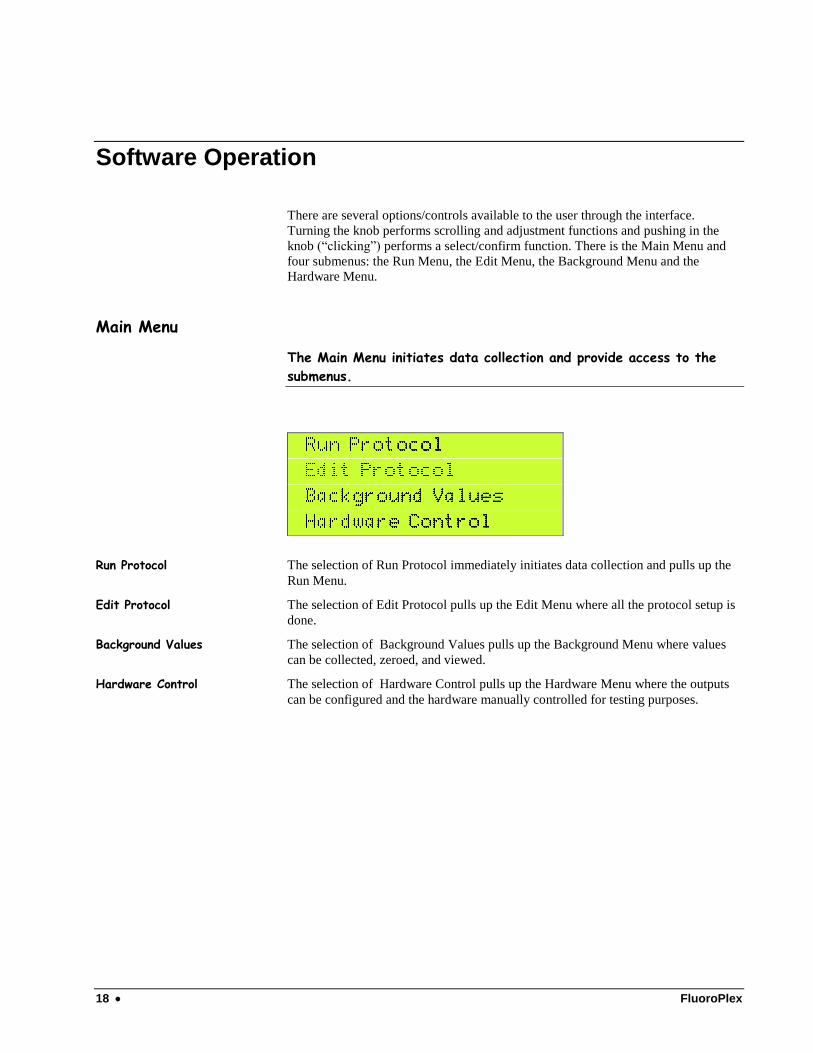
The Main Menu initiates data collection and provide access to the
submenus.
Run Protocol The selection of Run Protocol immediately initiates data collection and pulls up the
Run Menu.
Edit Protocol The selection of Edit Protocol pulls up the Edit Menu where all the protocol setup is
done.
Background Values The selection of Background Values pulls up the Background Menu where values
can be collected, zeroed, and viewed.
Hardware Control The selection of Hardware Control pulls up the Hardware Menu where the outputs
can be configured and the hardware manually controlled for testing purposes.

FluoroPlex 19
Run Menu
While data is being collected, the Run Menu will be displayed.
Stop Protocol The selection of Stop Protocol immediately stops data collection and returns the user
to the Main Menu.
Lock Raw Adjust this value to select the bank or banks reflected in the analog signals on the
Raw Output Num and Den BNCs.
Data Rate This read only line displays the rate at which new data is available. The data rate can
be adjusted in the Edit Menu.
Edit Menu
The Edit Menu allows access to all user programmable features. All
values are saved immediately upon adjustment.
Number of Banks Adjust this value to set the number of banks to collect from. Eight banks are
available unless Dual Excitation and Output Raw are selected, in which case only 4
are available.
Excitation Type This option selects for use with a dual excitation or single excitation dye. If single
excitation is selected, the fluorescence light source will stay in the numerator path
(Path 1).
Protocol Type Continuous Mode and Burst Mode protocols are available. In Burst Mode, the
option has the form “Burst Mode ### sec”. The number of seconds selects the length
of time collection occurs at a bank before switching to the next bank.
Data Rate The frequency on this line reflects the rate at which new data is available at the
outputs. In continuous mode, the rate reflects the rate at which new data is available

20 FluoroPlex
for all banks. In burst mode, the rate reflects that of the stream of data being output
by the currently active bank. Decreasing the data rate creates a delay during which
either the LEDs will be turned off to reduce bleaching or additional data points can
be collected and averaged together. The maximum rate is affected by excitation
method (single or dual), protocol type (Burst mode or Continuous mode), acquisition
time and number of banks.
Averaging “Ave Pts ### of ###” describes the number data points being averaged out of the
maximum available. The maximum number is affected by the number of banks,
excitation type, protocol type and data rate. Decreasing the data rate will make more
data points available for averaging. Data will be collected at each wavelength for the
specified number of data points. This data will then be averaged to create one output
data point. While averaging data points together provides an effective means of
diminishing signal noise, care should be taken not to reduce the data rate and
subsequent temporal resolution too severely. Care should also be taken to minimize
photobleaching and phototoxicity. Averaging data points will increase the amount of
time that tissue and fluorophore are exposed to illumination.
Gate These options coordinate a TTL output pulse on the BNC labeled “Gate” on the front
panel with one of four hardware events: (1) at the beginning of an experiment
protocol, (2) at the beginning of an acquisition cycle when the MultiPlexer is
positioned at the first bath, (3) accompanying each move to a new bank, or (4)
accompanying the output of each new data point.
Exit Selecting “Exit” returns to the Main Menu.
Background Menu
One of two possible menus will be displayed depending on the
“Output” setting in the Hardware Control Menu.
If “Output Raw” is selected, no background subtraction will occur and so the display
will temporarily show the above message.
If “Output Ratio” is selected, background subtraction will occur and the following
menu options will be displayed.
FluoroPlex 21
Set Background Values Three options are available on this line.
Use Current Values does nothing.
Collect Background initiates the collection of new values. Collect Background
should be selected when it is appropriate to do so; most often, when the tissue to be
investigated is mounted in the chamber but not yet loaded with fluorophore. The
FluoroPlex will initiate interrogation of the tissue at all banks. Background values
reflect the endogenous fluorescence of the tissue as well as other sources of stray
light. These values will be automatically subtracted from the recorded photodiode
values, reflecting only the values originating from the fluorophore. No adjustement
of LED intensity or sensor gain should be made after background collection.
Zero Background sets all background values to zero.
Show Values Selecting “Show Values” pulls up a screen that will cycle through the current values
and return the user to the background menu. The values screen is not manually
editable and the user will be locked out of the controls until all banks have been
displayed.
Exit “Exit” returns the user to the Main Menu.
Hardware Control Menu
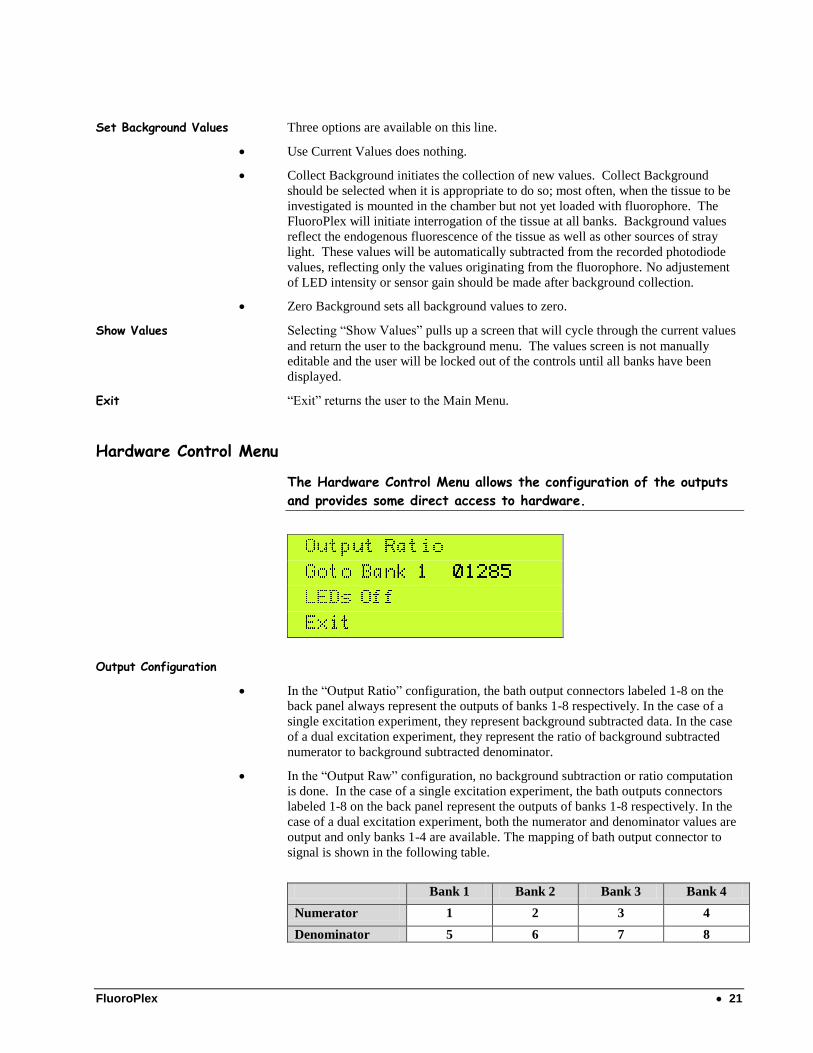
The Hardware Control Menu allows the configuration of the outputs
and provides some direct access to hardware.
Output Configuration
In the “Output Ratio” configuration, the bath output connectors labeled 1-8 on the
back panel always represent the outputs of banks 1-8 respectively. In the case of a
single excitation experiment, they represent background subtracted data. In the case
of a dual excitation experiment, they represent the ratio of background subtracted
numerator to background subtracted denominator.
In the “Output Raw” configuration, no background subtraction or ratio computation
is done. In the case of a single excitation experiment, the bath outputs connectors
labeled 1-8 on the back panel represent the outputs of banks 1-8 respectively. In the
case of a dual excitation experiment, both the numerator and denominator values are
output and only banks 1-4 are available. The mapping of bath output connector to
signal is shown in the following table.
Bank 1 Bank 2 Bank 3 Bank 4
Numerator 1 2 3 4
Denominator 5 6 7 8

22 FluoroPlex
MultiPlexer and Photodiode Line 2 of the Hardware control menu allows the user to move the MultiPlexer
between banks while watching the output of the photodiode either on the display or
by way of Bath Output 1. The output of the photodiode is displayed as a number
between 0-4096 (or slightly higher). A display reading of 0 correlates with an analog
output on the Bath Output connector of 0 V and a display reading of 4096 correlates
with 5V viewed.
LED and Photodiode Line 3 of the Hardware control menu allows the user to turn the LEDs on and off
while watching the output of the photodiode either on the display or by way of Bath
Output 1. Only one LED is turned on at a time, so the options are LEDs Off,
Denominator, and Numerator. The output of the photodiode is displayed as a
number between 0-4096 (or slightly higher). A display reading of 0 correlates with
an analog output on the Bath Output connector of 0 V and a display reading of 4096
correlates with 5 V. An unchanging reading of over 4000 means that the signal from
the photodiode circuit is saturated. Turning down the LED brightness, the
photodiode gain or the photodiode offset are all effective at lowering the value. An
unchanging reading of 00001 means that the photodiode circuit is in negative range.
The photodiode offset should be turned down until the signal is in range.
Exit The MultiPlexer will move back to bank 1 and both LEDs will turn off. The user is
then returned to the Main Menu.

FluoroPlex 23
Appendix
24 FluoroPlex
Application Notes
Hardware Adjustments
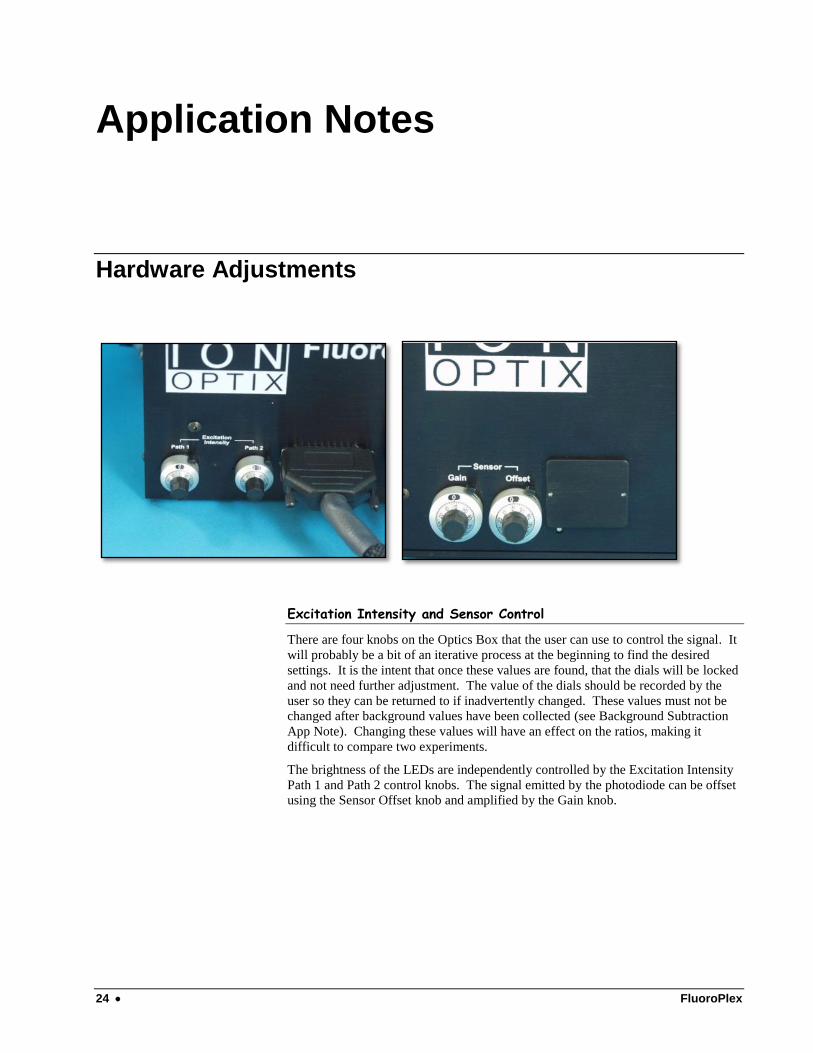
Excitation Intensity and Sensor Control
There are four knobs on the Optics Box that the user can use to control the signal. It
will probably be a bit of an iterative process at the beginning to find the desired
settings. It is the intent that once these values are found, that the dials will be locked
and not need further adjustment. The value of the dials should be recorded by the
user so they can be returned to if inadvertently changed. These values must not be
changed after background values have been collected (see Background Subtraction
App Note). Changing these values will have an effect on the ratios, making it
difficult to compare two experiments.
The brightness of the LEDs are independently controlled by the Excitation Intensity
Path 1 and Path 2 control knobs. The signal emitted by the photodiode can be offset
using the Sensor Offset knob and amplified by the Gain knob.

FluoroPlex 25
Hardware Control
The easiest way to see the effects of your adjustments is by going into the Hardware
Control Menu by selecting “Hardware Control” from the main menu. The third line
will default to LEDs off. Scrolling to that line will allow you to select “Path 1 ON”
or “Path 2 ON”. That selection will turn that LED on (the other will be turned off)
and will display the readout from the Sensor. The full range of numbers is zero to
slightly over 4000. Concurrently, a voltage representation will be sent on the Raw
Num output with its range of 0-5V.
The Goal and Factors to Consider
The goal is to record the complete signal with as good signal to noise and as little
bleaching as possible. There are several factors.
Signal Amplitude Turning the LED intensity up and turning the Sensor gain up will both result in
signal increase. There are some differences to understand.
The sensor gain will amplify the signal from both Path 1 and Path 2
equally. Adjusting the sensor gain will have some effect on ratio, but not
much. The LED intensity adjustment is independent. Adjusting one LED
without the other will have a huge effect on the ratio.
The sensor gain amplifies noise along with the signal. Turning the gain
down and turning the excitation intensity up will increase your signal to
noise.
Light bleaches the dye and creates phototoxins. The less light, the better
for your tissue preparation.
The denominator (Path 2) value will go down with the influx of Calcium. The
nominator value (Path 1) will either stay the about the same (if the isosbestic
wavelength of the dye is being used) or will increase. At rest, a ratio of about 1 is
usually chosen. Adjusting the hardware so that resting tissue gives values about
halfway into the range of FluoroPlex (about 2000 on the Hardware Control Menu
display or 2.5V on the output BNC) will start you with a ratio of one and give both
signals space to move.
Signal Offset The goal of the offset is to eliminate signal that comes from anything besides your
dye. The hardware itself produces some small signal and some tissue components
are auto-fluorescent. Subtracting this signal off will make your ratio changes larger
and truer. There are two methods to do this, the “Sensor Offset” knob and software
background subtraction (see the Background Subtraction app note). The intent is
that software background subtraction will be done for every single experiment
because this offset will be slightly different for different pieces of tissue. The intent
of the knob is to subtract off the offset that you can count on to be there every
experiment so that the range of the device can be put to use focusing on the signal. If

26 FluoroPlex
you have a small signal on top of a large offset, you may saturate the signal before
you can increase the gain of the sensor as much as you would like. By using the
“Sensor Offset” knob to decrease the offset, you will be able to turn the gain up
higher and stay in range. If you see a sensor readout of 00001, it means that the
signal has become negative and you need to turn this knob down. If you are still
seeing 00001 when the knob has been turned all the way down and the device has
warmed up at least 10 minutes, call our technical support.
Suggested Pathway
Block all MultiPlexer paths except bank 1. Set up your bank in a relatively
light tight enclosure.
Turn the device on and let warm up at least 10 minutes.
Start with a non-loaded tissue sample in your bank.
Turn the sensor gain all the way up.
Turn the LEDs up to 4.
Adjust the offset knob such that the signal is about 100 counts.
Load your tissue with dye.
Adjust the LEDs until the counts are about 2000.
Exit from the Hardware Menu and try running an experiment. You will
want to record both the output from bank 1 and the Numerator and
Denominator outputs. Make adjustments such that all three signals stay in
range.
PRACTICE, PLAY AND REPEAT before you try to collect data. Dye
loading will almost certainly present a very steep learning curve. It can be
difficult to get dye into the cells at all. Dye can get trapped in areas of the
cell that are not excitable. Too much dye can disrupt the normal Calcium
flow. Timing, concentration of dye and temperature all have an effect. Feel
free to adjust the hardware knobs all you want at this point to get the best
looking data you can.
TRY IT OUT. Once you have a loading procedure down, try locking down
the knobs and seeing if they work for a number of tissue samples. Adjust as
needed.
RECORD SETTINGS AND LET IT BE. Ideally, you will want to leave the
knobs alone so that you can most accurately compare the results of your
experiments.

FluoroPlex 27
Background Subtraction
Background subtraction is a crucial part of ratio and ion calculation. Unfortunately it
can be a very confusing subject. This section of the manual will attempt to clear up
this issue.
What is background?
Background is the signal reported by the instrumentation in absence of indicator
fluorescence. Background can be caused by stray light, internal reflections,
electrical noise and auto-fluorescence. The amount of background is an indicator of
how much noise there is in a system.
A fluorescence recording is the sum of the background emission and the emission of
the indicator substance. Ratios calculated from non-background subtracted signals
can be quite different from ratios calculated from corrected signals. This is because
small changes in the denominator will have a greater change than small changes in
the numerator. This will not be a baseline change from which the relative signal
changes will still be informative. These are non-linear errors that will lead to false
ratios from which no real information can be extracted. For this reason it is
imperative to use background subtracted data to perform ratios.
Due to changes in auto-fluorescent components of tissues, electronics characteristics,
power supply voltages, and filter performance it is necessary to get background
values on a regular basis. Additionally, the background values are a loose indicator
of overall system performance. Very large backgrounds may be indicative of failed
filters, failed diachronic mirrors or stray light leaks.
Background Subtraction Options
If the loading protocol allows it, it is easiest to acquire the background value first,
before any fluorescent dye is loaded into the tissue. First, scroll to the FluoroPlex’s
“Hardware Control” option on the Main Menu. Make sure the first line is set to
“Output Ratio”. Exit to return to the Main Menu and select the “Background
Values” option. Select “Collect Background” to automatically record, average and
save a background value for each wavelenth from each bank. You can view these
values by selecting “Show Values”. These background values will be automatically
subtracted before the ratio is calculated. The analog value on the “Bath Output”
BNCs will reflect the true ratio stemming from the fluorescent dye.
Loading protocols may make it impossible to collect background data before loading
the fluorescent dye. In this case, manganese is used at the end of the experiment to
quench the dye and background subtraction has to be done as a step in the analysis of
the data. This means that the user must acquire both the numerator and denominator
values. Scroll to the FluoroPlex’s “Hardware Control” option on the Main Menu.
Make sure the first line is set to “Output Raw”. This will cause the FluoroPlex to
send non-background subtracted, raw numerator and denominator signals to its
Output Bath BNCs. (See the Hardware Control Menu section for more details.) The
user should run the experiment, recording both numerator and denominator traces,
and then record data after the dye has been quenched to get background traces.
Average a background trace over a few seconds to get a single background value for
that bank and wavelength. Now subtract that value from the data trace collected
from that bank and wavelength. Repeat for all wavelengths and banks. Now divide
the numerator trace by the denominator trace to obtain your ratio.